the Creative Commons Attribution 4.0 License.
the Creative Commons Attribution 4.0 License.
 | 19 Sep 2022
Chemical characteristics and sources of PM2.5 in Hohhot, a semi-arid city in northern China: insight from the COVID-19 lockdown
Haijun Zhou
Tao Liu
Bing Sun
Yongli Tian
Xingjun Zhou
Feng Hao
Xi Chun
Zhiqiang Wan
Peng Liu
Jingwen Wang
Dagula Du
A knowledge gap exists concerning how chemical composition and sources respond to implemented policy control measures for aerosols, particularly in a semi-arid region. To address this, a single year's offline measurement was conducted in Hohhot, a semi-arid city in northern China, to reveal the driving factors of severe air pollution in a semi-arid region and assess the impact of the COVID-19 lockdown measures on chemical characteristics and sources of PM2.5. Organic matter, mineral dust, sulfate and nitrate accounted for 31.5 %, 14.2 %, 13.4 % and 12.3 % of the total PM2.5 mass, respectively. Coal combustion, vehicular emission, crustal source and secondary inorganic aerosols were the main sources of PM2.5 in Hohhot, at 38.3 %, 35.0 %, 13.5 %, and 11.4 %, respectively. Due to the coupling effect of emission reduction and improved atmospheric conditions, the concentration of secondary inorganic components, organic matter and elemental carbon declined substantially from the pre-lockdown (pre-LD) period to the lockdown (LD) and post-lockdown (post-LD) periods. The source contribution of secondary inorganic aerosols increased (from 21.1 % to 37.8 %), whereas the contribution of vehicular emission reduced (from 35.5 % to 4.4 %) due to lockdown measures. The rapid generation of secondary inorganic components caused by unfavorable meteorological conditions during lockdown led to serious pollution. This study elucidates the complex relationship between air quality and environmental policy.
- Article
(6254 KB) - Full-text XML
-
Supplement
(826 KB) - BibTeX
- EndNote


With the rapid development of industrialization and urbanization, many developing countries, such as China and India, have suffered severe air pollution, especially from fine particulate matter (PM2.5, aerodynamic diameter ≤2.5 µm) (Huang et al., 2019). To improve air quality, China has implemented various clean air policies (Zhang et al., 2019). As a result, the annual mean PM2.5 concentration in China decreased from 50 µg m−3 in 2015 (MEEC, 2015) to 33 µg m−3 in 2020 (MEEC, 2020). However, the mean level of PM2.5 is still much higher than the new guideline of the World Health Organization (5 µg m−3; WHO, 2021). It is a challenge to decrease the level of PM2.5 to such a low level in China, especially in northern China, which consumes the majority of coal for winter heating (Huang et al., 2019; Feng et al., 2022b). Insufficient understanding of the complex relationship between air quality and environmental policy limits the effectiveness of our control measures to improve air quality.
To limit the spread of the COVID-19 pandemic, most cities around the world implemented strict lockdown (LD) measures, and the anthropogenic emission of air pollutants was reduced substantially, which in turn has caused considerable changes in the chemical composition and sources of PM2.5 (Le et al., 2020; Ma et al., 2021; Chen et al., 2020). The lockdown provided a good opportunity to study the effect of emission reduction on air quality. In addition, this scenario can be used by policymakers to formulate effective policies to prevent atmospheric pollution. Stringent traffic restrictions during the COVID-19 lockdown led to important reductions in the concentrations of elemental carbon, metals and nitrate at an urban site of the western Mediterranean (Clemente et al., 2022). The substantial reduction in nitrate in the Beijing–Tianjin–Hebei region during the LD period was attributed to the drastic reduction in vehicular movement and the suspension of public transport (Sulaymon et al., 2021). Primary pollutants were reported to have decreased dramatically due to the lockdown measures, while secondary pollutants were reported to have increased (Chang et al., 2020; Huang et al., 2021; Zheng et al., 2020). Secondary pollutants like PM2.5 and O3 depend more strongly on weather conditions and show a limited response to emission changes in single sectors (Gao et al., 2021a; Matthias et al., 2021).
Extensive studies have been conducted to investigate the responses of atmospheric pollutants to emission reduction during the COVID-19 lockdown measures (Adam et al., 2021; Rodríguez-Urrego and Rodríguez-Urrego, 2020). However, most of the previous studies are based on online observation and/or satellite-derived data and have focused on the changes in atmospheric pollutants, influence of meteorological conditions and emission reduction (Li et al., 2021; Srivastava, 2021). Relatively few studies have focused on the chemical composition and sources of PM2.5 in semi-arid regions, especially using offline measurement. Source apportionment using an online dataset is impeded by the missing information on Si and Al (Gao et al., 2016), resulting in considerable uncertainty in the estimation of dust sources. Mineral dust is considered to be one of the main components of aerosols in semi-arid regions (Kumar and Sarin, 2009; Wang et al., 2016). As a typical semi-arid city of northern China, Hohhot suffers frequent air pollution in spring and winter (Huang et al., 2013b). The chemical characteristics, sources and their response to implemented control measures in this region are still unclear.
In response to the substantial reduction in anthropogenic emission, the concentrations of PM2.5 in most of the European cities (Tobías et al., 2020; Collivignarelli et al., 2020; Gualtieri et al., 2020; Gkatzelis et al., 2021; Matthias et al., 2021), Latin American cities (Mendez-Espinosa et al., 2020; Nakada and Urban, 2020; Hernández-Paniagua et al., 2021), US cities (Pata, 2020), Indian cities (Sharma et al., 2020), Chinese cities (Bao and Zhang, 2020) and the southeast Asia region (Kanniah et al., 2020) have decreased substantially, compared to pre-LD periods and/or previous years. However, compared with the decreasing trends of most of the cities in the world, the concentrations of PM2.5 in some cities of the North China Plain have increased unexpectedly. An increase (<0.01) in PM2.5 was found in Hohhot during the LD period (Fig. S1 in the Supplement), whereas a considerable improvement was reported in most of the cities globally. The anomalously enhanced nitrate in Tianjin during the LD period is a response to the abnormal increase in relative humidity (Ding et al., 2021). The abnormal increase in PM2.5 in northern China during the LD period was probably caused by uninterrupted emissions from power plants and petrochemical facilities, as well as the influence of adverse weather conditions (Gao et al., 2021a). The extreme reduction in anthropogenic emissions did not address the occurrences of severe haze events in northern China because of unfavorable meteorological events (Le et al., 2020; Shi et al., 2021), increased atmospheric oxidizing capacity (Wang et al., 2020), enhanced secondary formation (Chang et al., 2020; Huang et al., 2021) and regional transport (Shen et al., 2021; Lv et al., 2020; Zhang et al., 2021). There is no consensus on the reasons for the unexpected increase in PM2.5 during the LD period. It is therefore essential to conduct a comprehensive study on the chemical composition and sources of PM2.5 in this region, especially during the LD period.
The main objectives of this study were to (1) identify the chemical characteristics and sources of PM2.5 in a semi-arid city, (2) investigate the impact of COVID-19 lockdown measures on the chemical composition and sources, (3) reveal the causes of the rapid increase in PM2.5 during different heavy-pollution episodes. The results of this study will provide a more comprehensive understanding of PM2.5 pollution control in semi-arid regions.
2.1 Study area and sampling
Hohhot (– N, – E) is located in the northern part of the North China Plain and the central part of the Inner Mongolia Autonomous Region. It is a core city of the Hohhot–Baotou–Ordos urban agglomeration, with an area of 17 224 km2 and 3 496 000 inhabitants (http://www.tjcn.org/tjgb/05nmg/37047.html, last access: 1 April 2022). Topographically, it is in the alluvial lake basin between the Yinshan Mountains and the Yellow River, with the Daqing Mountains in the north and Manhan Mountain in the southeast. Hohhot has a typical semi-arid climate, with a mean annual precipitation of 335.2–534.6 mm, which occurs mainly in summer (Xie et al., 2021). Due to the minimal precipitation and dry continental terrain, frequent dust storms occur in spring (Gao et al., 2021b). It has a coal-fired-heating period of 6 months (15 October–15 April the next year; Xie et al., 2021). The sampling site was located on the rooftop (approximately 50 m above the ground) of the main building of the Ecological and Environmental Department of the Inner Mongolia Autonomous Region (Fig. 1) and represents a typical semi-arid urban environment. The sampling site is surrounded by residential areas without industrial sources nearby. There is one main road named Tengfei Road 50 m to the east.
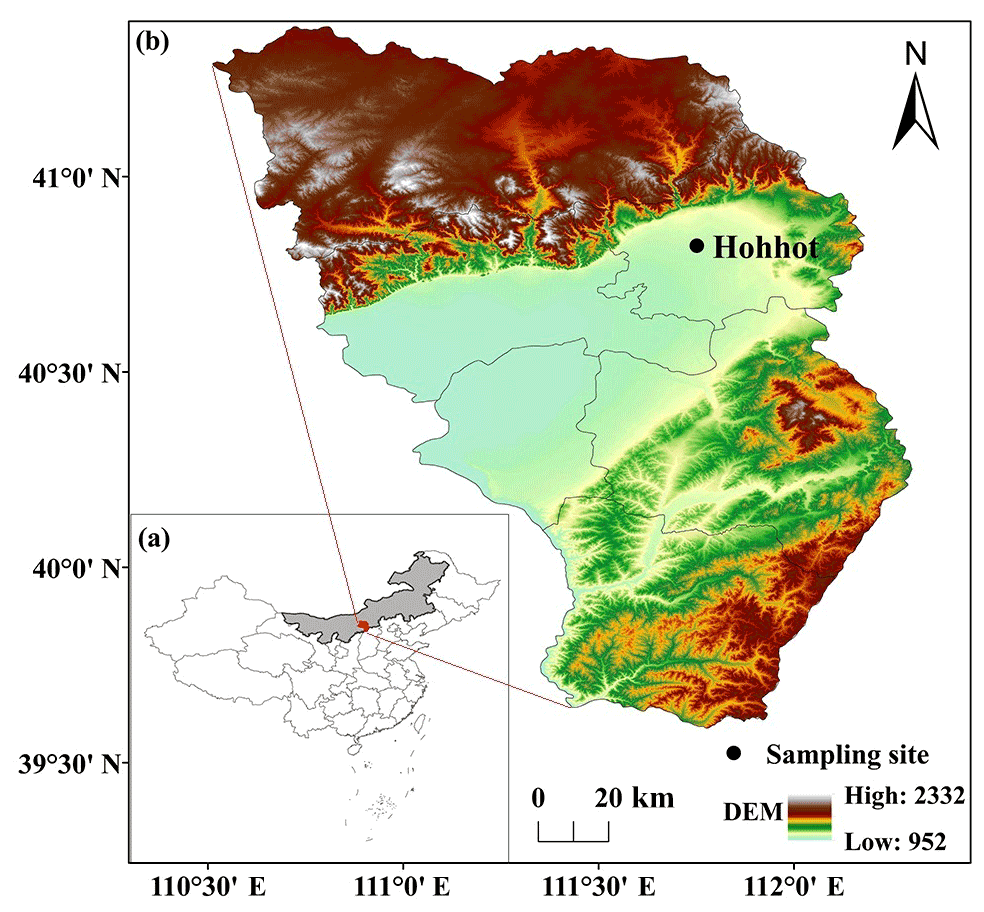
Figure 1Location of (a) Hohhot in China and (b) the sampling site in Hohhot
The 23 h (10:00 to 09:00 UTC+8 the next day) PM2.5 samples were collected in parallel on quartz filters (Pallflex Tissuquartz™, 90 mm, USA) and polypropylene filters (Beijing Safelab Technology Ltd., 90 mm, China) using medium volume air samplers (Model 2050, Qingdao Laoshan Applied Technology Research Institute, China) with a flow rate of 100 L min−1. The quartz filters were used for the analysis of water-soluble ions (WSIs), organic carbon (OC) and elemental carbon (EC), while polypropylene filters were used for inorganic elements. A total of 722 PM2.5 samples (361 quartz and 361 polypropylene filters) were collected from 8 October 2019 to 7 October 2020. Before and after sampling, the quartz filters and polypropylene filters were conditioned for at least 24 h at a stable temperature ( and relative humidity (50±5 %) and then weighed using a microbalance (CP225D, Sartorius, Germany), with a sensitivity of ±0.01 mg. After weighing, every filter was stored in a preservation box separately at −18 ∘C until analysis. The hourly concentrations of SO2, NO2, CO and O3 were measured using T100, T200U-NOy, T300 and T400 sensors produced by Automated Precision Inc. (USA), respectively. In addition, the hourly meteorological variables, including relative humidity (RH), wind speed (WS), wind direction (WD), ambient temperature (T) and atmospheric pressure (P), were observed synchronously using an automatic weather station (WS500-UMB, Lufft, Germany).
2.2 Chemical analysis
The WSIs (including SO42−, NO3−, NH4+, Cl−, F−, K+, Ca2+, Na+ and Mg2+) were determined using ion chromatography (Metrohm 881Compact IC Pro, Switzerland). The OC and EC were analyzed using a thermal–optical carbon analyzer (DRI Model 2001, Atmoslytic Inc., USA) following the IMPROVE_A protocol (Chow et al., 2007; Cao et al., 2005). The detailed descriptions of the procedures for WSIs and carbonaceous aerosols can be found in our previous studies (Zhou et al., 2018, 2016). The inorganic elements, including Si, Al, S, Cl, K, Ca, Ti, V, Cr, Mn, Fe, Cu, Zn, Co and Pb, were analyzed by energy dispersive X-ray fluorescence spectroscopy (Epsilon5, PANalytical B.V., Netherlands) according to the National Environmental Protection standard method of China (HJ 829-2017) and previous studies (Dao et al., 2022, 2021; Chiari et al., 2018). Field blank and replicate analyses were carried out once per 10 samples. The concentrations of field blanks were all lower than the method detection limits, and the relative deviations of replicate analyses were %. All the analytical procedures were strictly controlled according to the referred methods to reduce artificial interference.
2.3 Data analysis
The organic matter (OM) and mineral dust (MD) were calculated using Eqs. (1)–(2) (Xie et al., 2019; Liu et al., 2021). To estimate the secondary formation of inorganic and organic aerosols, the sulfur oxidation ratio (SOR), nitrogen oxidation ratio (NOR), and secondary organic carbon (SOC) were calculated using Eqs. (3)–(5) (Castro et al., 1999; Fu et al., 2022; Yang et al., 2018):
2.4 Source apportionment
Positive matrix factorization (PMF; version 5.0) was used to estimate source contributions of PM2.5 in Hohhot according to the user guide of the United States Environmental Protection Agency (Norris et al., 2014) and a previous study (Paatero and Tapper, 1994). A total of 15 dominant species (SO42−, NO3−, NH4+, K+, Na+, Ca2+, Mg2+, OC, EC, Si, Cl, Ti, Fe, Zn and Pb) were used as input files for the PMF modeling. The displacement (DISP) and bootstrap (BS) methods were conducted to estimate the uncertainty and rotational ambiguity of PMF solutions (Paatero et al., 2014). According to the changes in an output parameter ( and estimation diagnostics analysis (Ulbrich et al., 2009; Liu et al., 2021; Tian et al., 2020), six-factor solutions were selected. All of the factors showed a BS mapping above 80 %. The decreased Q values were lower than 0.1 %, and no factor swap occurred. The results indicate that the BS uncertainties can be fully interpreted, and the selected solutions were sufficiently robust (Tian et al., 2020; Wang et al., 2021). The summary of error estimation diagnostics from BS and DISP is shown in Tables S1–S8 in the Supplement. The source profiles of PMF are shown in Figs. S2–S9.
3.1 Temporal variation in PM2.5 and chemical composition
Hohhot initiated a Level I public health emergency response control action on 25 January 2020 (https://www.nmg.gov.cn/zwyw/tpxw/202001/t20200125_256791.html, last access: 11 February 2022) and downgraded it to a Level III response on 25 February 2020 (https://www.nmg.gov.cn/zwyw/tzgg/202002/t20200225_258821.html, last access: 11 February 2022). During this period, complete lockdown measures were taken to prevent the transmission of the SARS-CoV-2. In order to estimate the impacts of lockdown measures on the air quality, we compared the atmospheric pollutants during the pre-LD period (25 December 2019 to 24 January 2020), LD period (25 January to 24 February 2020) and post-LD period (25 February to 24 March 2020). The daily concentration of PM2.5 varied from 4.0 to 293.8 µg m−3, with an annual mean concentration (± standard deviation) of 42.6±40.2 µg m−3, which is higher than the annual mean concentration limits (35 µg m−3) of the National Ambient Air Quality Standards (NAAQS; GB 3095-2012). There were 51 daily PM2.5 concentrations higher than the 24 h average concentration limit (75 µg m−3) of NAAQS, accounting for 14.1 % of the total number of sampling days. Furthermore, most of them occurred in the heating period, particularly with a predominant wind direction from the southeast. The high intensity of coal combustion for heating discharges a large number of gaseous pollutants (SO2, NO2 and CO), which, coupled with unfavorable meteorological conditions (high RH and low WS; Fig. 2a and b), leads to the rapid accumulation of air pollutants (Fig. 2c–e).
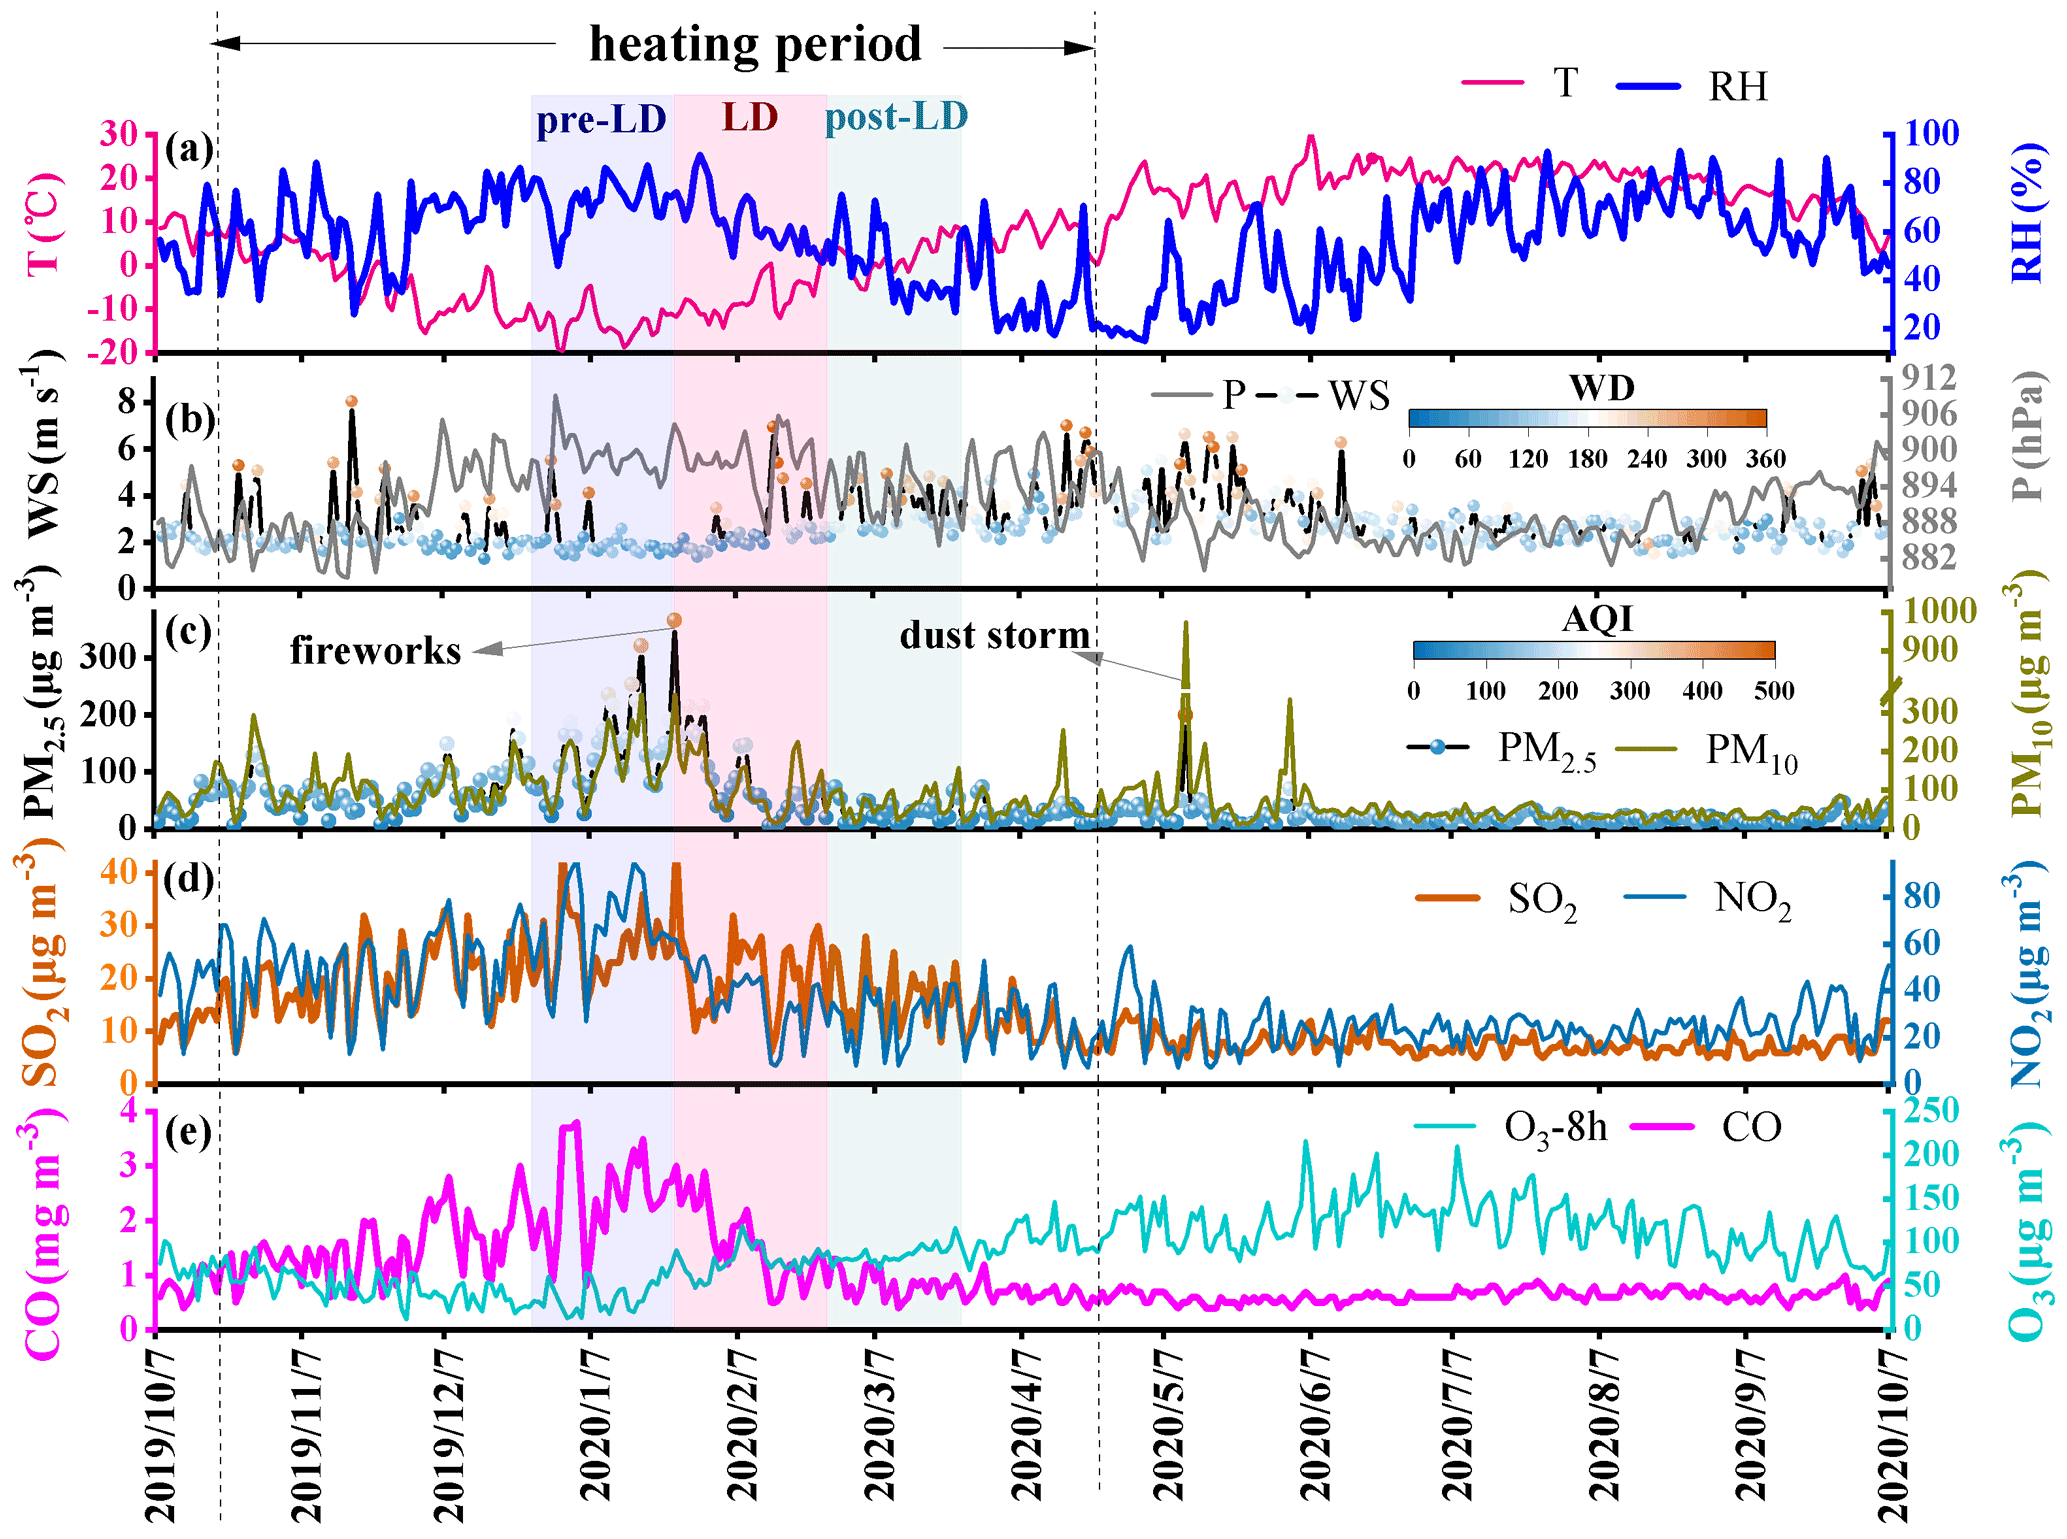
Figure 2Daily variations in atmospheric pollutants and meteorological variables in Hohhot during the sampling period from 8 October 2019 to 7 October 2020. The blue, red and green backgrounds represent the pre-lockdown, lockdown and post-lockdown periods, respectively. T, RH, WS, WD, P and AQI represent the ambient temperature, relative humidity, wind speed, wind direction, atmospheric pressure and air quality index, respectively.
During haze episodes, a substantial increase in secondary inorganic components (sulfate, nitrate and ammonium: SNA) was observed (Fig. 3a–c). The rapid increase in SNA was the main driving factor behind the increase in PM2.5. High RH is conducive to the secondary formation of sulfate and nitrate, presenting higher SOR and NOR in these pollution periods (Fig. 3a and b). In the heating period, in addition to the contribution of SNA to PM2.5, the primary pollutants such as Cl− (p<0.001) and EC (p<0.001) were higher than those in the non-heating period (Fig. 3d and e). Hohhot is an inland city, basically unaffected by sea salt. Furthermore, a higher average ClNa+ ratio (3.43 for January) suggests the presence of non-marine anthropogenic sources of chloride. In conclusion, chloride is mainly emitted from coal combustion facilities in Hohhot, especially during the heating period. It can be used as an auxiliary marker of coal combustion in Hohhot. Higher SOR was observed in winter and summer in Hohhot (Fig. 3a). High SOR in winter is mainly caused by heterogeneous processes under high-RH conditions, while that in summer is caused by homogeneous gas-phase oxidation reactions under high temperatures and O3 concentrations (Zhang et al., 2018; Li et al., 2017a). NOR was higher in winter, whereas it was lower in summer (Fig. 3b). The higher NOR in winter can be ascribed to the rapid formation of nitrate under high RH (Fu et al., 2022; Ren et al., 2022). The lower NOR in summer may be related to the high temperature, which is favorable for nitrate volatilization (Daher et al., 2012). The higher SOR and NOR in winter indicate the higher secondary formation of sulfate and nitrate that resulted in the heavy-pollution episodes in pre-LD and LD periods.
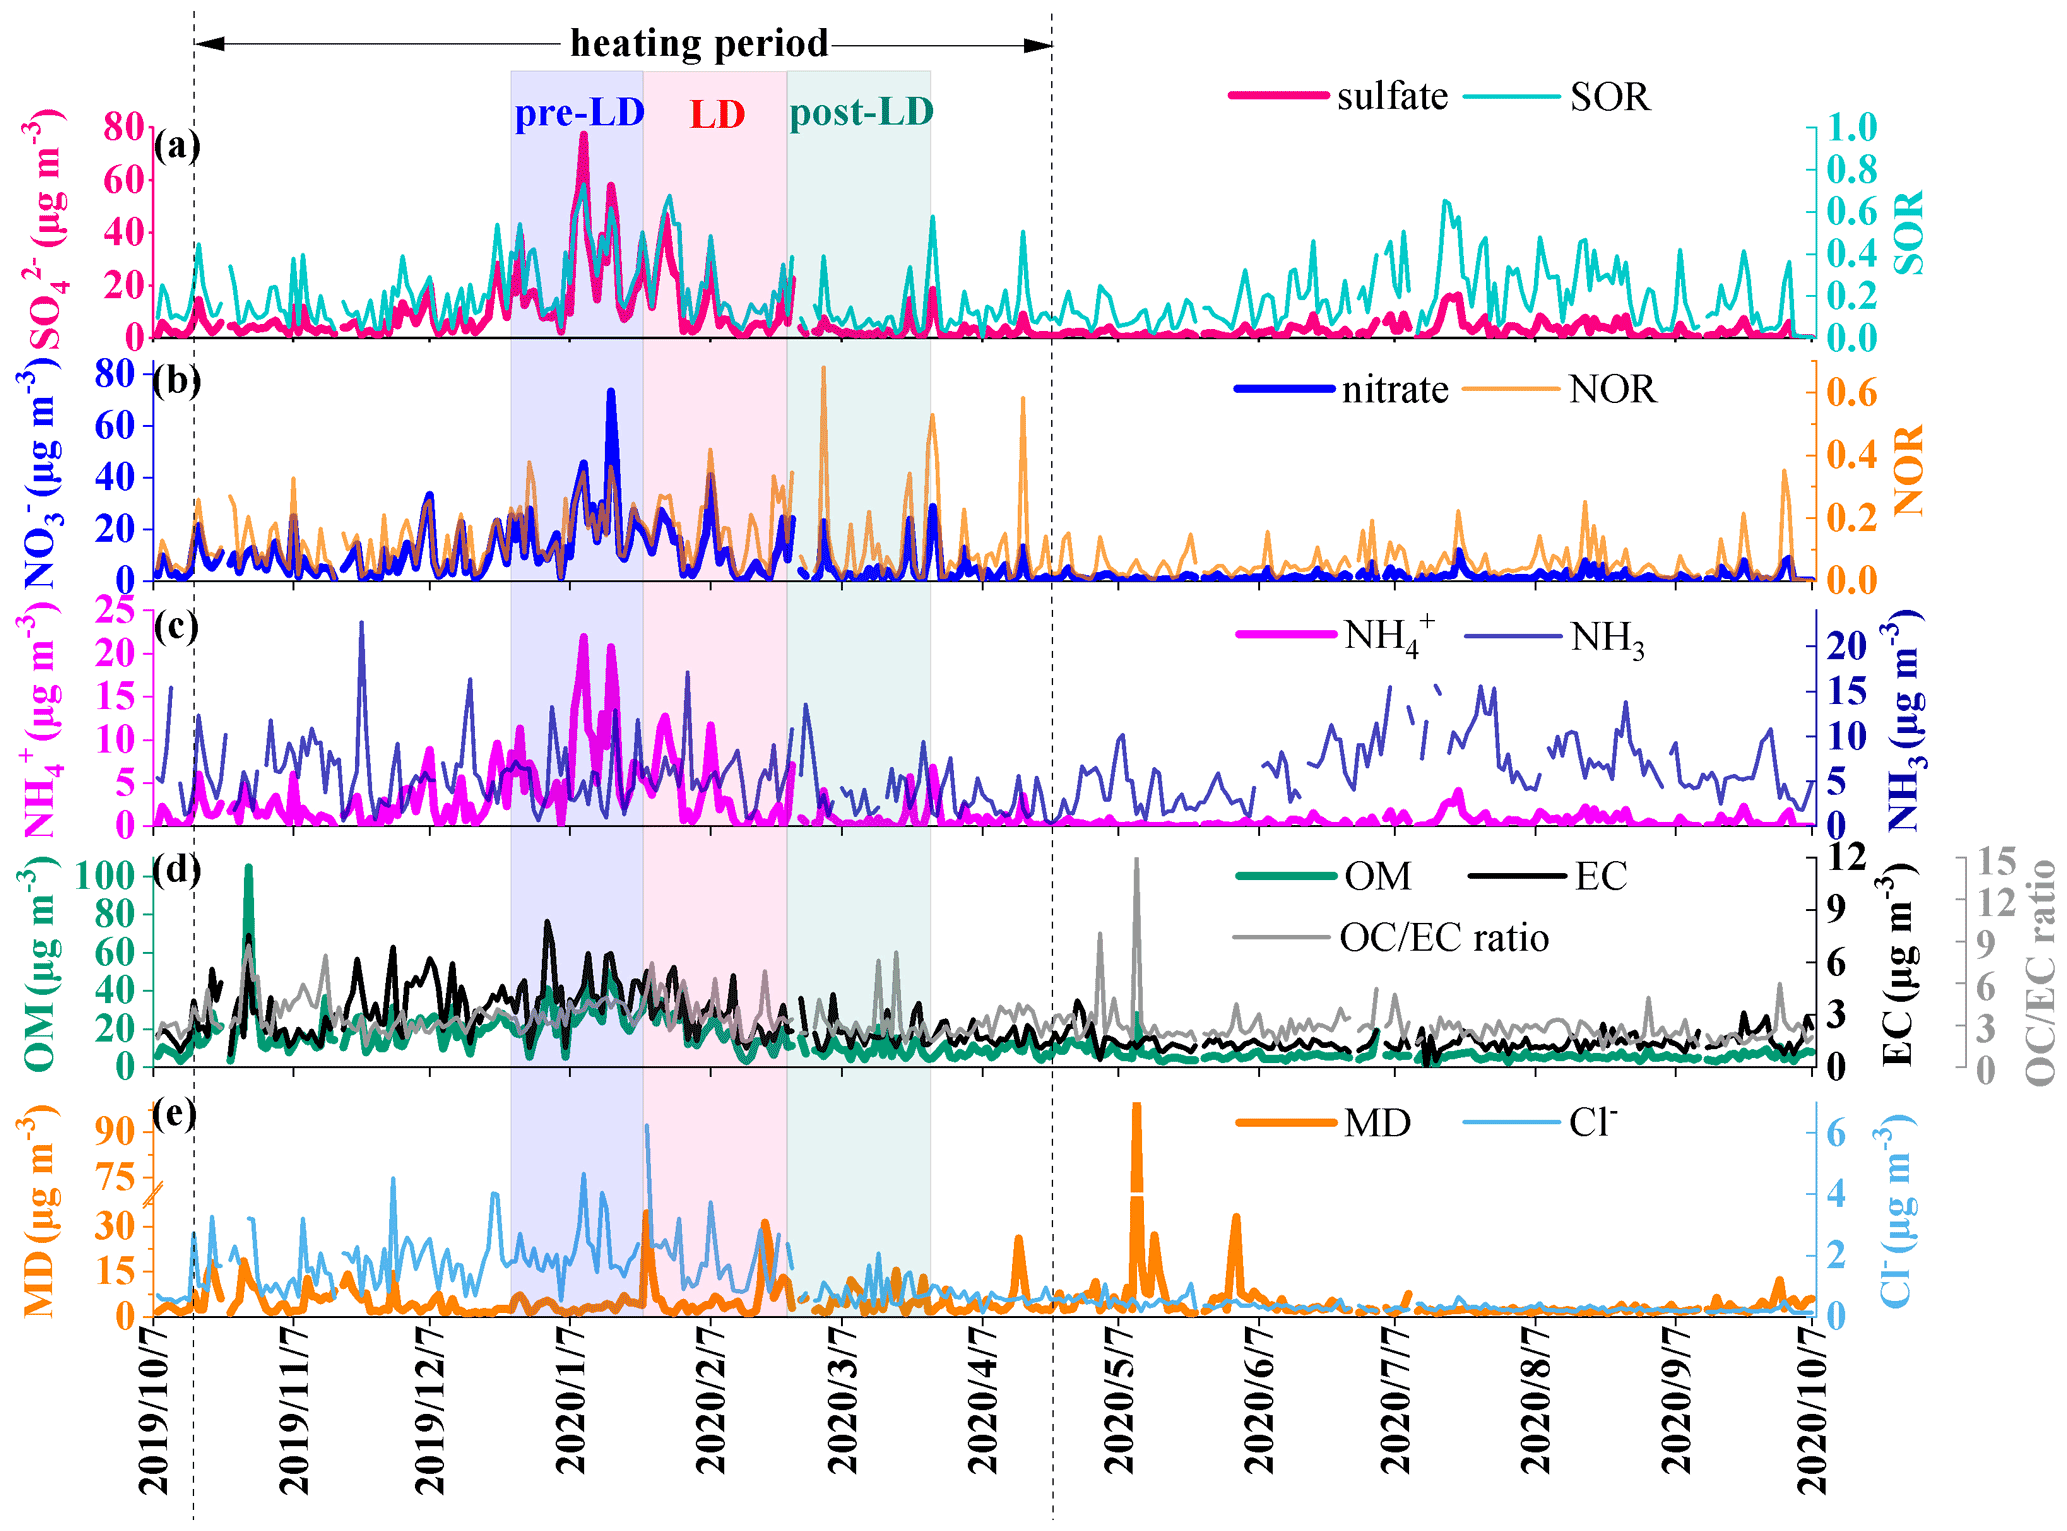
Figure 3Daily variations in chemical composition of PM2.5, SOR, NOR, NH3 and ratio in Hohhot during the sampling period. The blue, red and green background represent the pre-lockdown, lockdown and post-lockdown periods, respectively. OM, MD, SOR and NOR represent the organic matter, mineral dust, sulfur oxidation ratio and nitrogen oxidation ratio, respectively.
The comparison of atmospheric pollutants (PM2.5, PM10, SO2, NO2, O3 and CO) between the LD period and the same period in 2017–2019 is shown in Fig. S1 in the Supplement. The average concentrations of PM2.5, PM10, O3 and CO increased by 77.8 % (p<0.01), 34.6 % (p<0.05), 14.5 % (p<0.001) and 5.9 % (p<0.001), respectively, whereas the average concentrations of SO2 and NO2 decreased by 43.2 % (p<0.05) and 8.6 % (p<0.001), respectively.
The annual mean concentrations of OM, SO42−, NO3−, MD, EC, NH4+ and Cl− were 12.1, 6.6, 6.4, 4.9, 2.2, 2.0 and 1.1 µg m−3 (Fig. 4a), accounting for 31.5 %, 13.4 %, 12.3 %, 14.2 %, 6.6 %, 3.3 % and 2.5 % of PM2.5, respectively (Fig. 4b). Compared with the results of Hohhot in 2014–2015 (Wang et al., 2019), the annual mean concentration of NO3− increased, whereas the concentrations of the other species decreased (Fig. S10a). Due to the implemented measures, a sharp decrease in OM and MD was observed, resulting in a considerable decrease in PM2.5 (decreased from 66 µg m−3 in 2014–2015 to 42.6 µg m−3 in 2019–2020). The proportion of SO42−, NO3− and OM increased considerably, whereas the proportion of MD showed a substantial decrease (Fig. S10b). The result suggests that the contribution of chemical composition related to secondary formation has increased in recent years. However, the proportion of MD was still substantially higher than those of other cities in South China (Huang et al., 2013a); southwest China (Feng et al., 2021); southeast China (Li et al., 2017b); and the Central Plains Urban Agglomeration (Liu et al., 2019), which is close to the cities in northern China (Liu et al., 2021; Xie et al., 2019) and northwest China (Zhou et al., 2021). The lower RH, higher WS and larger area of uncovered surface soil lead to frequent dust storms in semi-arid regions, resulting in a higher contribution of MD than in the humid area (Liang et al., 2019). The result indicates that the cities in arid or semi-arid regions (such as in northern China and northwest China) are more susceptible to mineral dust sources. The monthly average concentrations of SNA and OM during the heating period (15 October to 15 April next year), especially in January, were higher than those of other non-heating months (Fig. 4a), which were related to the coupled effect of a large number of atmospheric precursors (SO2, NO2 and volatile organic compounds) and unfavorable meteorological conditions (high RH and low WS; Fig. S11). Due to the frequent dust storms, the average concentration of MD in May (9.4 µg m−3) was considerably higher than that of other months, accounting for 21.8 % of PM2.5 mass. The relatively high proportion of sulfates in August may be caused by its higher SOR, which is enhanced by photochemistry under high-T, strong-solar-radiation and high-RH conditions.
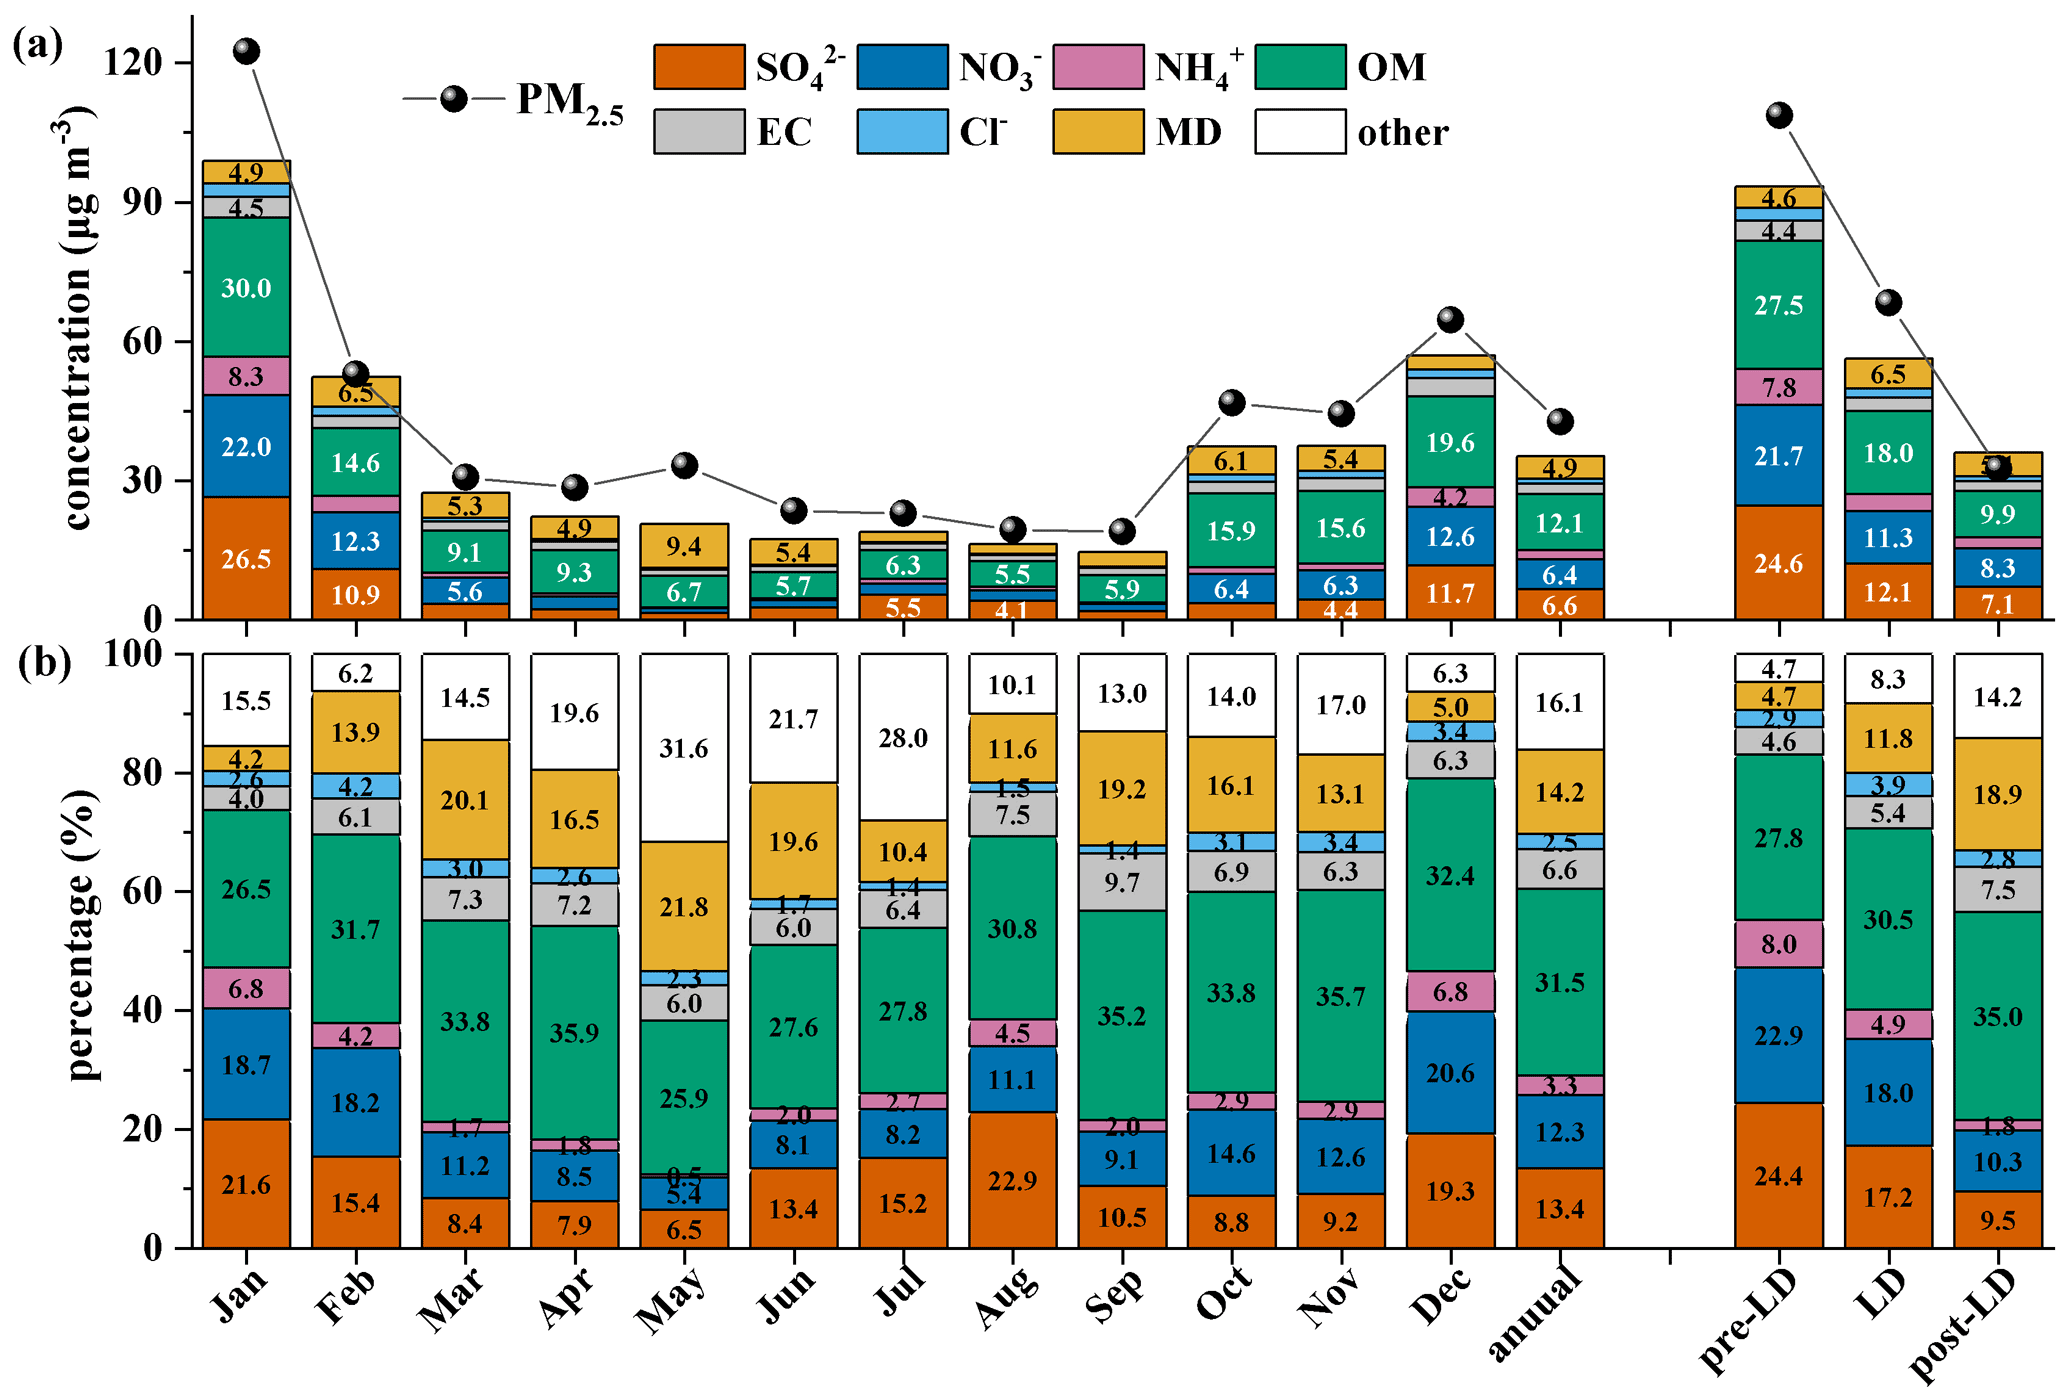
Figure 4Monthly variation in (a) concentrations and (b) percentages of chemical components of PM2.5 in Hohhot during the sampling period. Pre-LD, LD and post-LD represent the pre-lockdown, lockdown and post-lockdown periods, respectively. OM and MD represent organic matter and mineral dust, respectively.
The OM, sulfate, nitrate and ammonium were the predominant components of PM2.5 during the pre-LD period, accounting for 27.8 %, 24.4 %, 22.9 % and 8.0 % of PM2.5 mass, respectively (Fig. 4). During this period, the SNA contributed 55.3 % to the total PM2.5, slightly higher than those of the cities in northern China such as Xi'an (50.0 %; Tian et al., 2021) and Beijing (48.5 %; Ren et al., 2021) and lower than the cities in southern China such as Guangzhou (78.7 %; Wang et al., 2021), Nanjing (68.2 %; Ren et al., 2021) and Shanghai (75.4 %; Chen et al., 2020). Sulfate was the predominant component of SNA in Hohhot during this period, whereas nitrite was the main contributor to SNA in Guangzhou, Nanjing and Shanghai. The result indicated that higher SNA contributions in megacities of southern China are mainly related to vehicular emission. The higher contribution of sulfate in Hohhot is mainly related to coal combustion for winter heating. OM contributed 27.8 % to the total PM2.5, lower than that of Xi'an (42.0 %; Tian et al., 2021) and higher than that of the other cities listed in Table S9. The contribution of EC is higher than all of the cities listed in Table S9. The higher contribution of sulfate, OM and EC in Hohhot indicated that coal combustion may have been a predominant source of PM2.5 during the pre-LD period. Most studies listed in Table S9 used online data, from which it is not possible to calculate the contribution of MD. However, our offline data showed that MD contributed 11.8 % and 14.2 % to the total PM2.5 during the LD period and for the whole sampling year, respectively, indicating that MD is one of the main contributors of PM2.5 that has been neglected in previous studies. The proportion of chemical species ranked as pre-LD is as follows: OM (27.8 %) > SO42− (24.4 %) > NO3− (22.9 %) > NH4+ (8.0 %) > MD (4.7 %) > EC (4.6 %) > Cl− (2.9 %); LD: OM (30.5 %) > NO3− (18.0 %) > SO42− (17.2 %) > MD (11.8 %) > EC (5.4 %) > NH4+ (4.9 %) > Cl− (3.9 %); and post-LD: OM (35.0 %) > MD (18.9 %) > NO3− (10.3 %) > SO42− (9.5 %) > EC (7.5 %) > Cl− (2.8 %) > NH4+ (1.8 %). Compared with the pre-LD period, the concentration of sulfate (p<0.01), nitrate (p<0.01), ammonium (p<0.01), OM (p<0.001) and EC (p<0.001) decreased substantially due to the decline in the emission intensity under the strict control measures during the LD period (Fig. 4a, Table S10). The percentage of sulfate (not significant for LD and p<0.01 for post-LD), nitrate (not significant for LD and p<0.05 for post-LD) and ammonium (p<0.05 for LD and p<0.01 for post-LD) decreased continuously during LD and post-LD, while the MD (p<0.01 for LD and p<0.001 for post-LD), OM (not significant for both periods), and EC (not significant for LD and p<0.01 for post-LD) increased (Table S10). The mean value of RH declined continuously from pre-LD to LD and post-LD, while the mean value of WS showed an opposite trend (Fig. S11). The lower RH and higher WS were not conducive to the secondary formation and accumulation of SNA. Therefore, due to the emission reduction and improved atmospheric conditions, the proportion of SNA decreased sufficiently (from 55.3 % in pre-LD to 40.1 % in LD and 21.6 % in post-LD). The atmospheric-diffusion conditions improved during the post-LD period, and the concentrations of OM, SNA, EC and Cl− decreased substantially. These results suggest that the substantial changes that occurred in source contributors after the COVID-19 outbreak resulted in dramatic changes to aerosol composition.
To elucidate the rapid increase in PM2.5, the sampling days were divided into four categories according to the daily concentration of PM2.5: clean (CP; PM2.5<35 µg m−3), slightly polluted (SP; 35≤ PM2.5<75 µg m−3), moderately polluted (MP; 75≤ PM2.5<150 µg m−3) and heavily polluted (HP; 150 µg m−3 ≤ PM2.5). The values of 24 January 2020 (Chinese New Year's Eve) and 11 May 2020 (a dust storm day) were excluded from the HP analysis. These 2 heavy-pollution days were analyzed separately as two types, namely fireworks and dust storm. The meteorological conditions, gaseous precursors and chemical composition of different pollution levels and types are shown in Fig. 5. The concentrations of OM, sulfate, nitrate and ammonium were in the order of CP < SP < MP < HP.
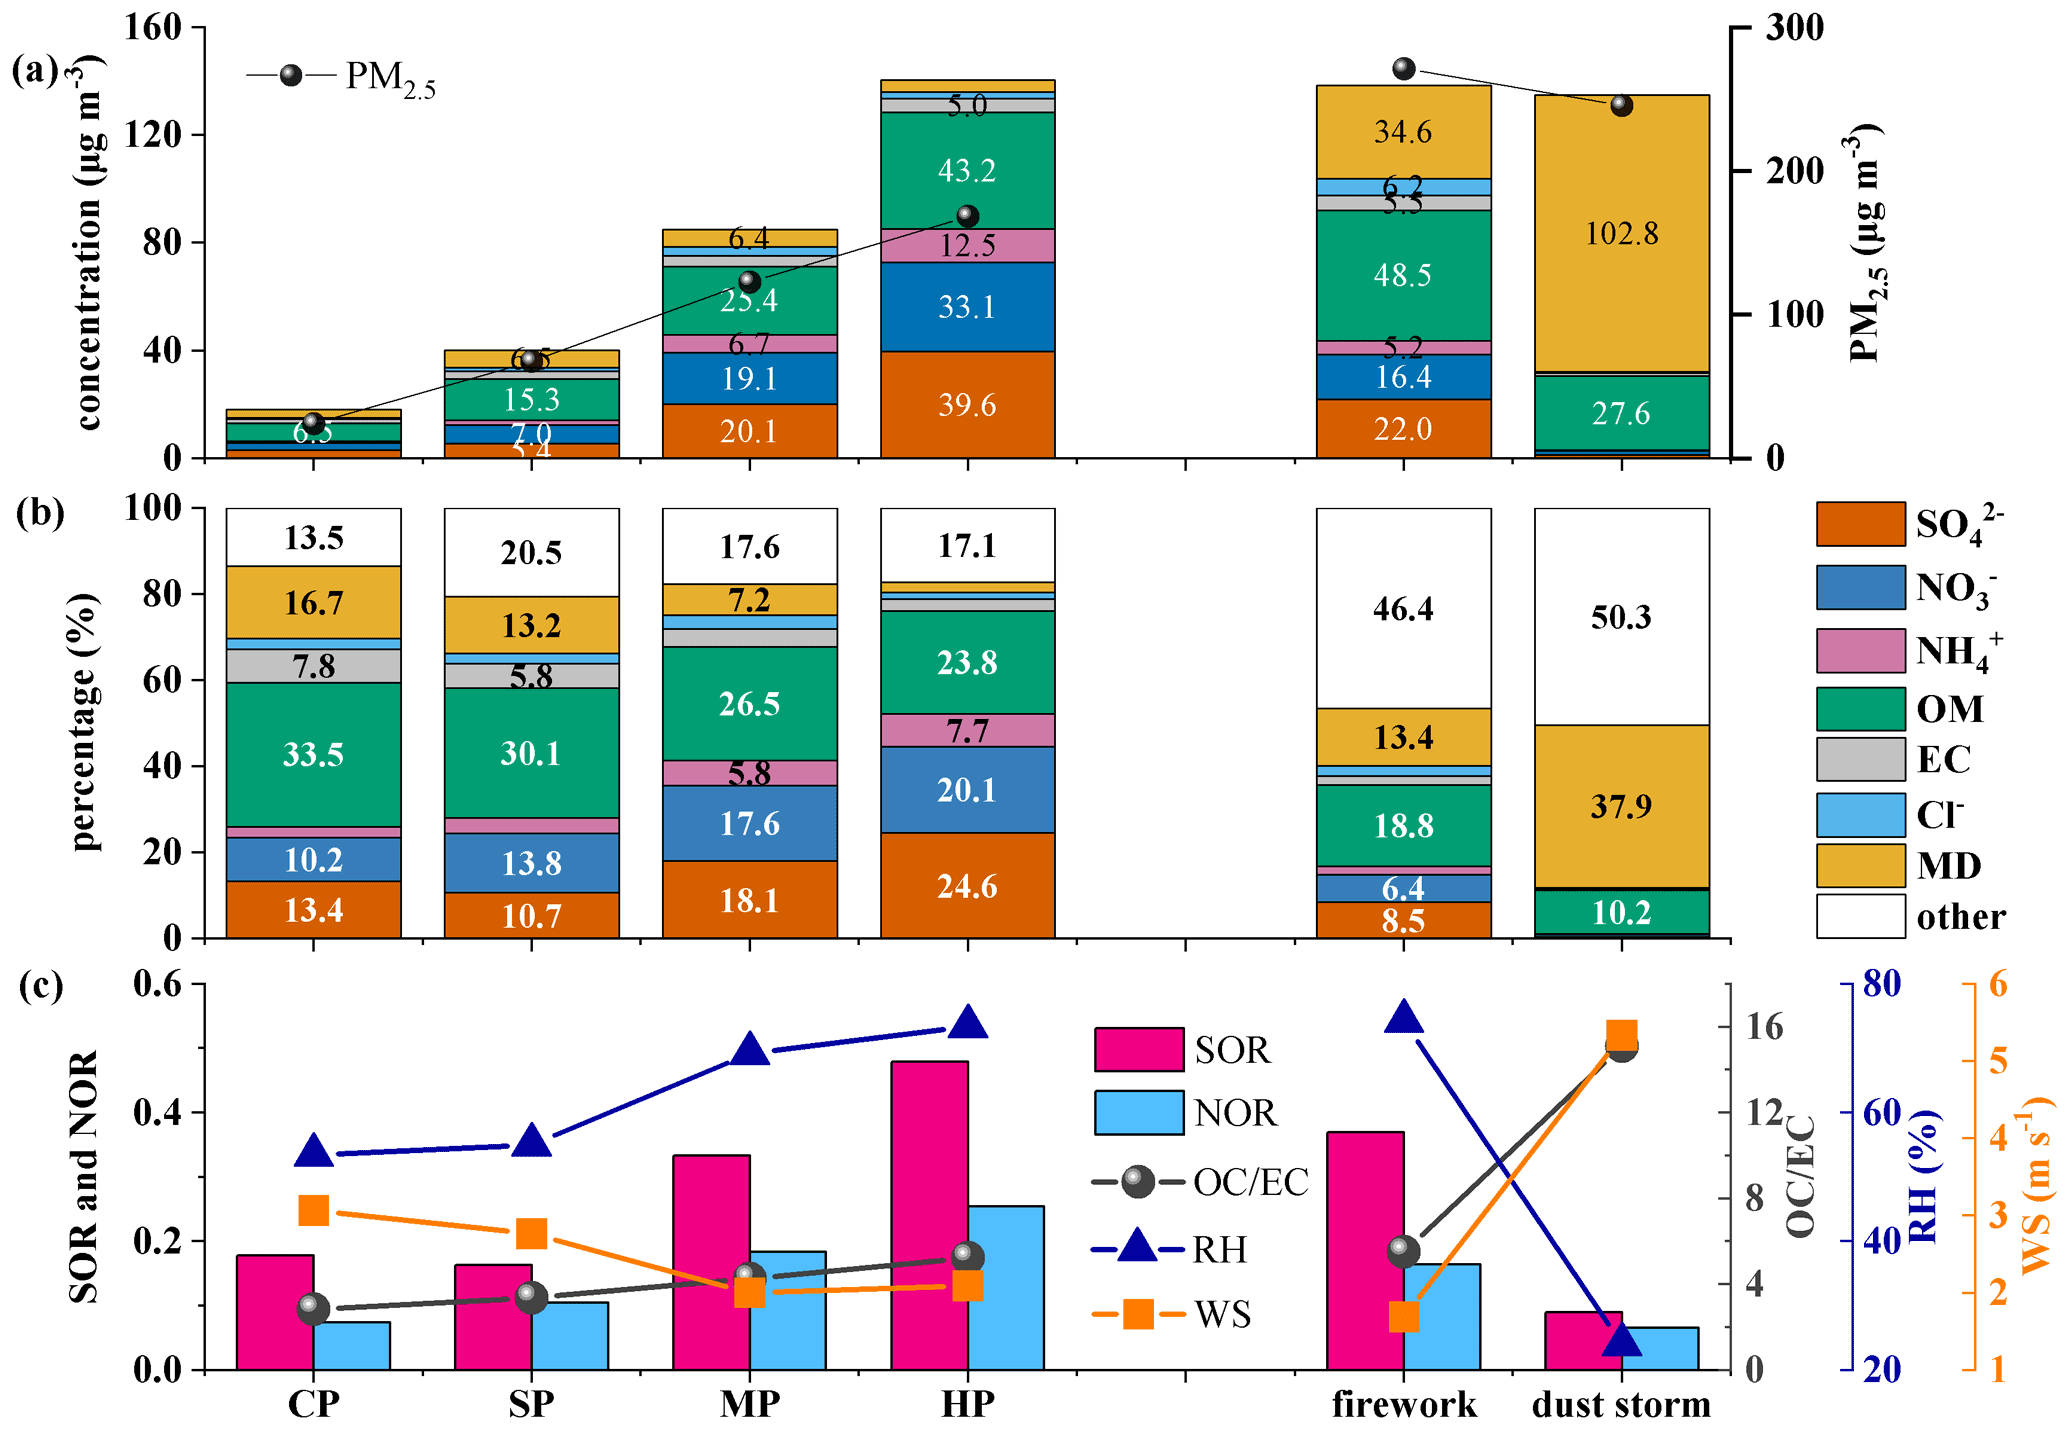
Figure 5(a) Concentrations and (b) percentages of chemical components in PM2.5; (c) meteorological conditions, SOR, NOR and at different pollution levels and during different types of pollution events. CP, SP, MP and HP represent the clean (PM2.5<35 µg m−3), slightly polluted (35≤ PM2.5<75 µg m−3), moderately polluted (75≤ PM2.5<150 µg m−3) and heavily polluted periods (PM2.5≥150 µg m−3 ), respectively.
From CP to HP, the percentages of SNA increased (from 26.1 % to 52.4 %), whereas the percentages of OM and MD decreased (from 33.5 % to 23.8 % and from 16.7 % to 2.4 %, respectively). This response is related to the adverse meteorological conditions characterized by high RH and low WS, leading to the enhanced formation of SNA (higher SOR and NOR). The values of SOR increased from 0.18 during CP to 0.48 during HP. The values of NOR increased from 0.07 during CP to 0.25 during HP. The results suggest enhanced SNA formation during heavy-pollution episodes. The coupled effects of high RH and low WS promoted the rapid increase in fine particulate matter on haze days in Hohhot. The high WS is beneficial for the elimination of atmospheric pollutants, resulting in low concentrations of SO2 and NO2 on dust storm days. Furthermore, the low RH is detrimental to the secondary formation of SNA (lower SOR and NOR), resulting in a lower SNA content on dust storm days. MD and OM contribute 102.8 and 27.6 µg m−3 to PM2.5 during dust storm days, accounting for 37.9 % and 10.2 % of PM2.5, respectively. The proportion of MD was highest on dust storm days, mainly because of the relatively high WS and low RH that were conducive to the re-suspension of crustal dust. During Lunar New Year, fireworks discharge a large number of gaseous pollutants; coupled with low WS and high RH, the concentrations of SNA, OM and EC increased rapidly, resulting in serious pollution.
3.2 Factors influencing PM2.5
The correlations between the chemical composition of PM2.5, meteorological variables and air pollutants are shown in Fig. 6. PM2.5 was negatively correlated with O3, T and WS at p<0.001, indicating that high WS was beneficial for the elimination of fine particulate matter, while O3 and T were mainly related to seasonal variation in sources and meteorological conditions. PM2.5 was positively correlated with most of the aerosol components and gaseous pollutants, indicating that the sources of PM2.5 were very complex and influenced by a variety of factors. The SNA in PM2.5 was positively correlated with RH (p<0.001), indicating that high RH promotes heterogeneous formation of SNA.
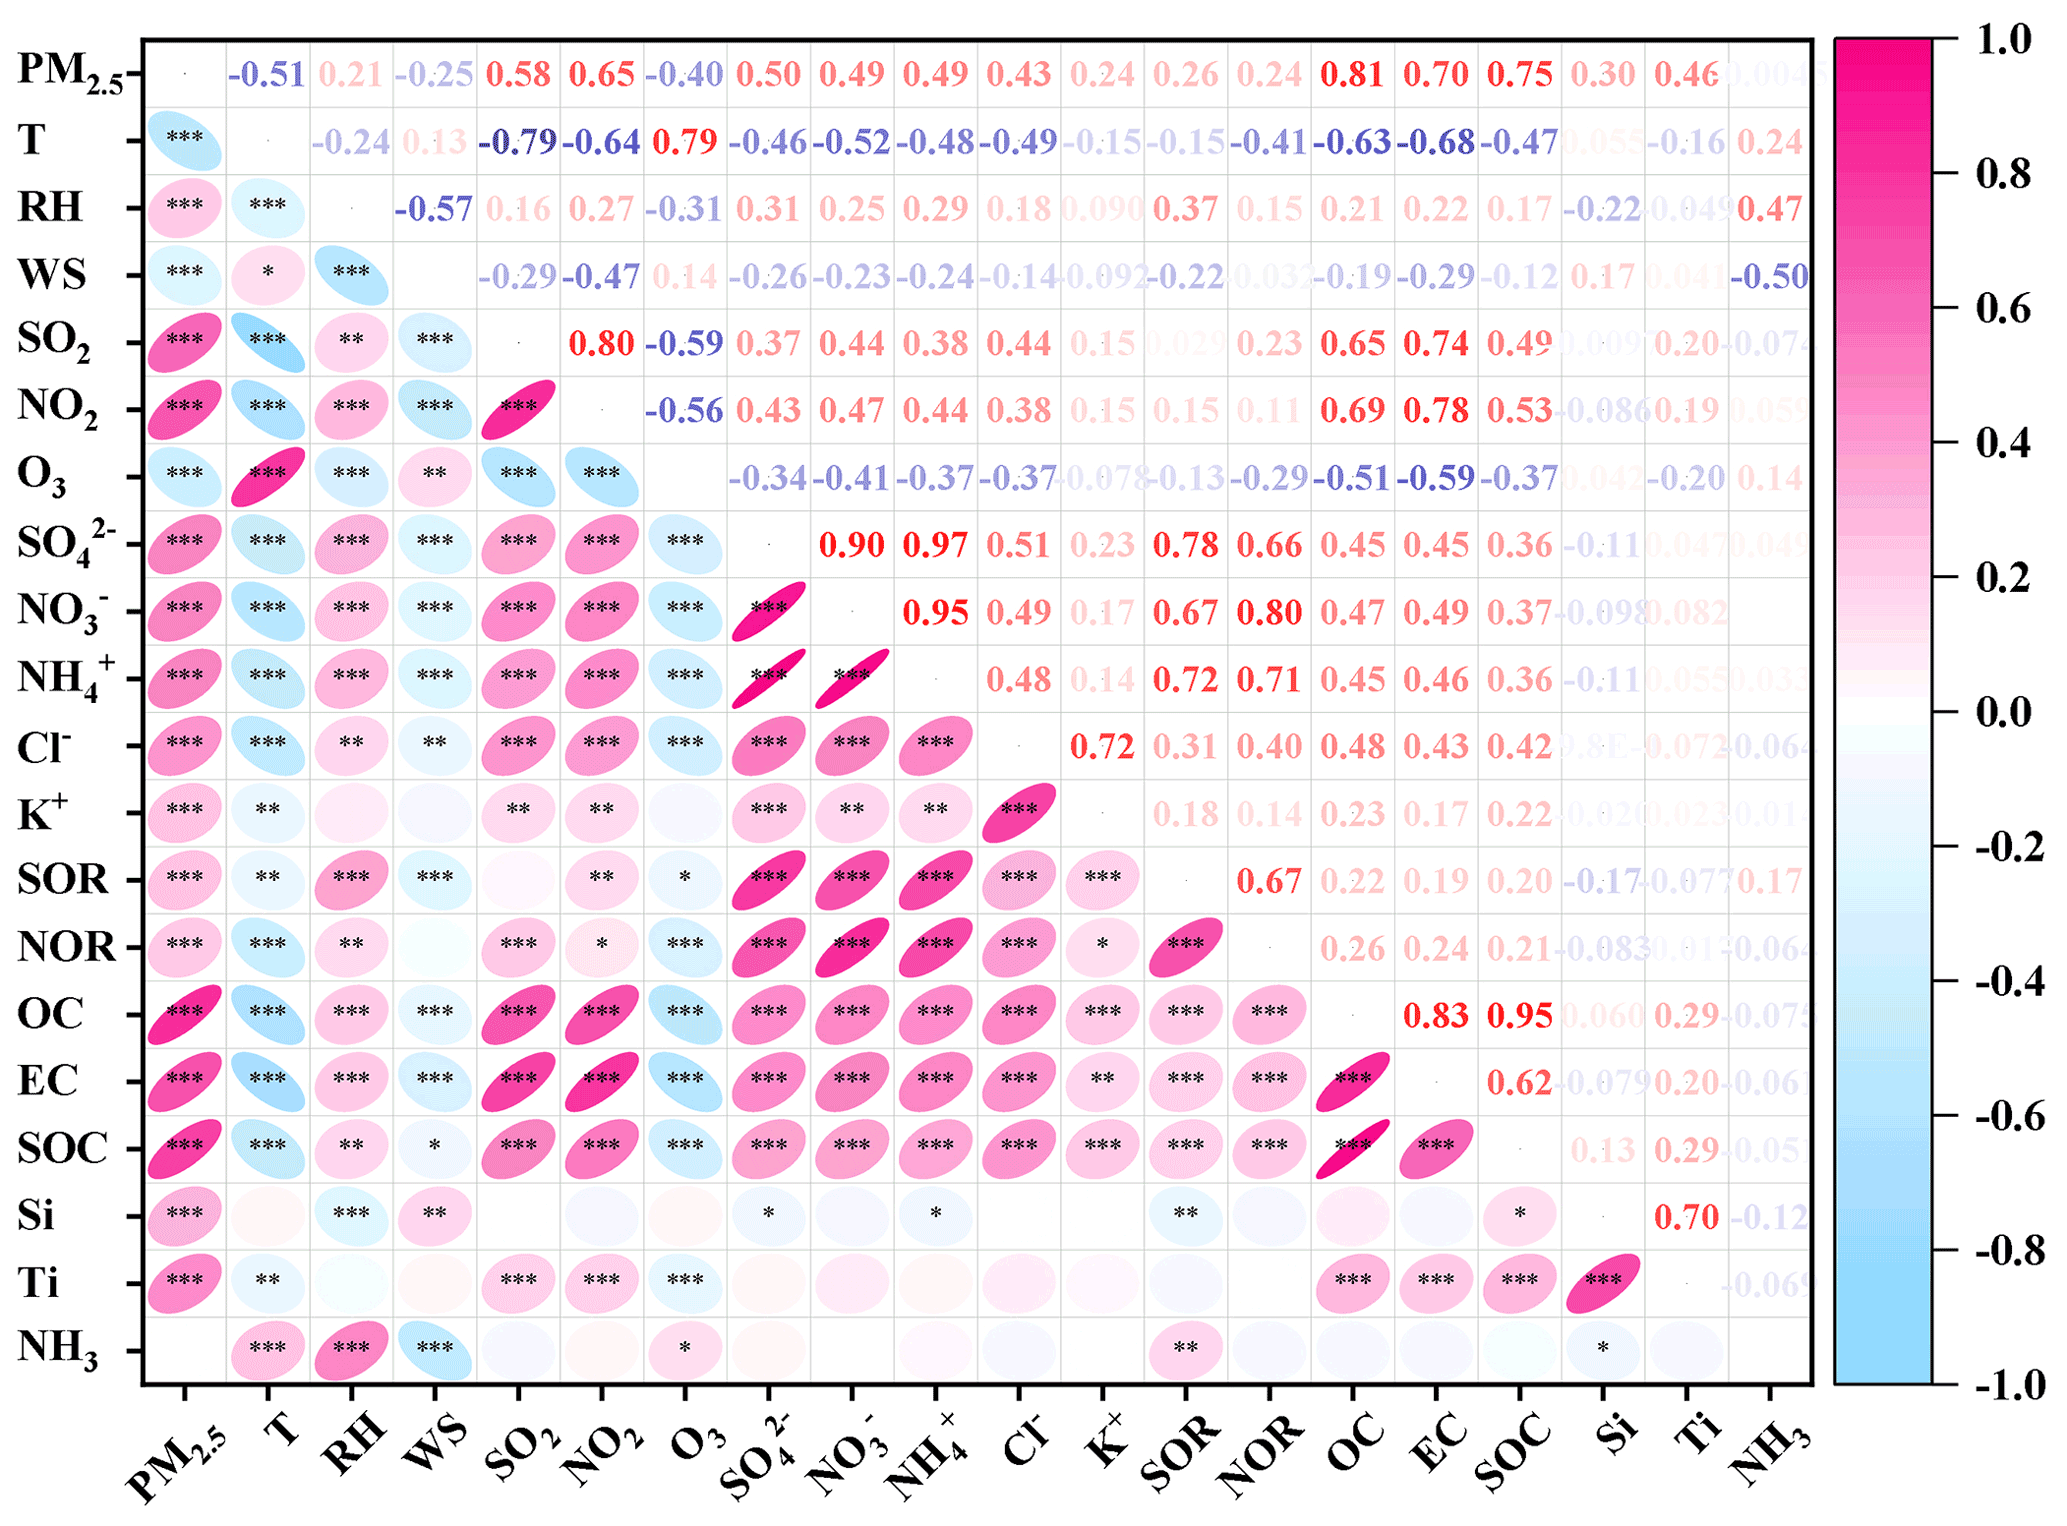
Figure 6Correlation between chemical components of PM2.5, meteorological variables, SOR, NOR and air pollutants in Hohhot during the sampling period (, , ).
The results suggest that RH played a vital role in the formation of haze by accelerating the conversion of SO2 to SO42− and NO2 to NO3−, deteriorating the air quality. NOR was negatively correlated with T at p<0.001, which may be related to the volatility of NH4NO3. The higher T is favorable for nitrate volatilization, resulting in lower NOR (He et al., 2012). SOR and NOR were positively correlated with RH at p<0.001 and p<0.05, respectively, suggesting that both SOR and NOR were influenced by RH. SNA was negatively correlated with WS (p<0.001), indicating that high WS was conducive to the rapid elimination of SNA. SNA and its gaseous precursors (SO2 and NO2) were positively correlated (p<0.001) but not related to NH3, indicating that the formation of SNA was mainly controlled by SO2 and NO2 rather than NH3. The carbonaceous aerosols (OC, EC and SOC) were positively correlated with Cl−, SNA, SO2 and NO2 (p<0.001), which are mainly affected by their common source in coal, used in heating. Silicon was positively correlated with WS (p<0.01), indicating that high WS is beneficial to the re-suspension of soil or dust, resulting in an increase in Si in PM2.5. Silicon was negatively correlated with RH (p<0.001), which was related to high WS and low RH on dust storm days.
3.3 Source apportionment of PM2.5
The sources of PM2.5 were apportioned using the PMF model (EPA PMF 5.0). The results of the source apportionment during different sampling periods are shown in Fig. 7 and summarized in Table S11. The PM2.5 concentrations in spring, summer, autumn, winter and annually were 32.4, 24.3, 37.0, 80.8 and 42.6 µg m−3, respectively. Coal combustion (CC), vehicular exhaust (VE), crustal sources (CS) and secondary inorganic aerosols (SIAs) were the main contributors to PM2.5 over the sampling year, contributing 38.3 %, 35.0 %, 13.5 % and 11.4 % to PM2.5, respectively. The contribution of primary sources such as CC, VE and dust source (refer to the sum of construction dust and crustal sources in this study) in Hohhot was higher than the megacities such as Beijing (Zíková et al., 2016), Tianjin (Tian et al., 2021) and Shanghai (Feng et al., 2022a), whereas the SIAs and biomass burning (BB) contributions were lower than in these cities (Table S11). The result indicates that the contribution of secondary aerosols is predominant in megacities, while the primary source is predominant in semi-arid regions. Therefore, the control of primary sources is an effective way to reduce the concentration of PM2.5 in Hohhot.
The CC contribution to PM2.5 in spring, summer, autumn and winter was 14.6, 5.7, 12.4 and 41.3 µg m−3, with a contribution percentage of 56.1 %, 24.0 %, 38.9 % and 65.4 %, respectively. Coal combustion was the main contributor to PM2.5 in Hohhot, especially during the heating period. Summer is the only season for completely no coal-fired heating; a relatively low contribution of CC was observed in summer. The VE contribution concentrations in spring, summer, autumn and winter were 4.4, 11.5, 10.7 and 9.0 µg m−3, contributing 17.0 %, 48.4 %, 33.8 % and 14.3 % to PM2.5, respectively. The peak seasonal contribution percentage of VE was observed in summer. This is mainly attributable to a substantial decline in the contribution of other sources, increasing the proportion of VE. The contribution concentration of SIAs followed the order of winter (6.6 µg m−3) > autumn (3.5 µg m−3) > summer (1.2 µg m−3) > spring (1.1 µg m−3), with a contribution percentage of 10.5 %, 11.1 %, 5.3 % and 4.2 %, respectively. The higher contribution of SIAs can be attributed to the large amount of gaseous precursors emitted by CC in winter, whereas the higher SIA contribution in autumn was related to the high oxidation rate. A relatively low contribution was observed in spring. The lower contribution of SIAs in spring may be related to the high WS and low RH, which is unfavorable for SNA formation and accumulation.
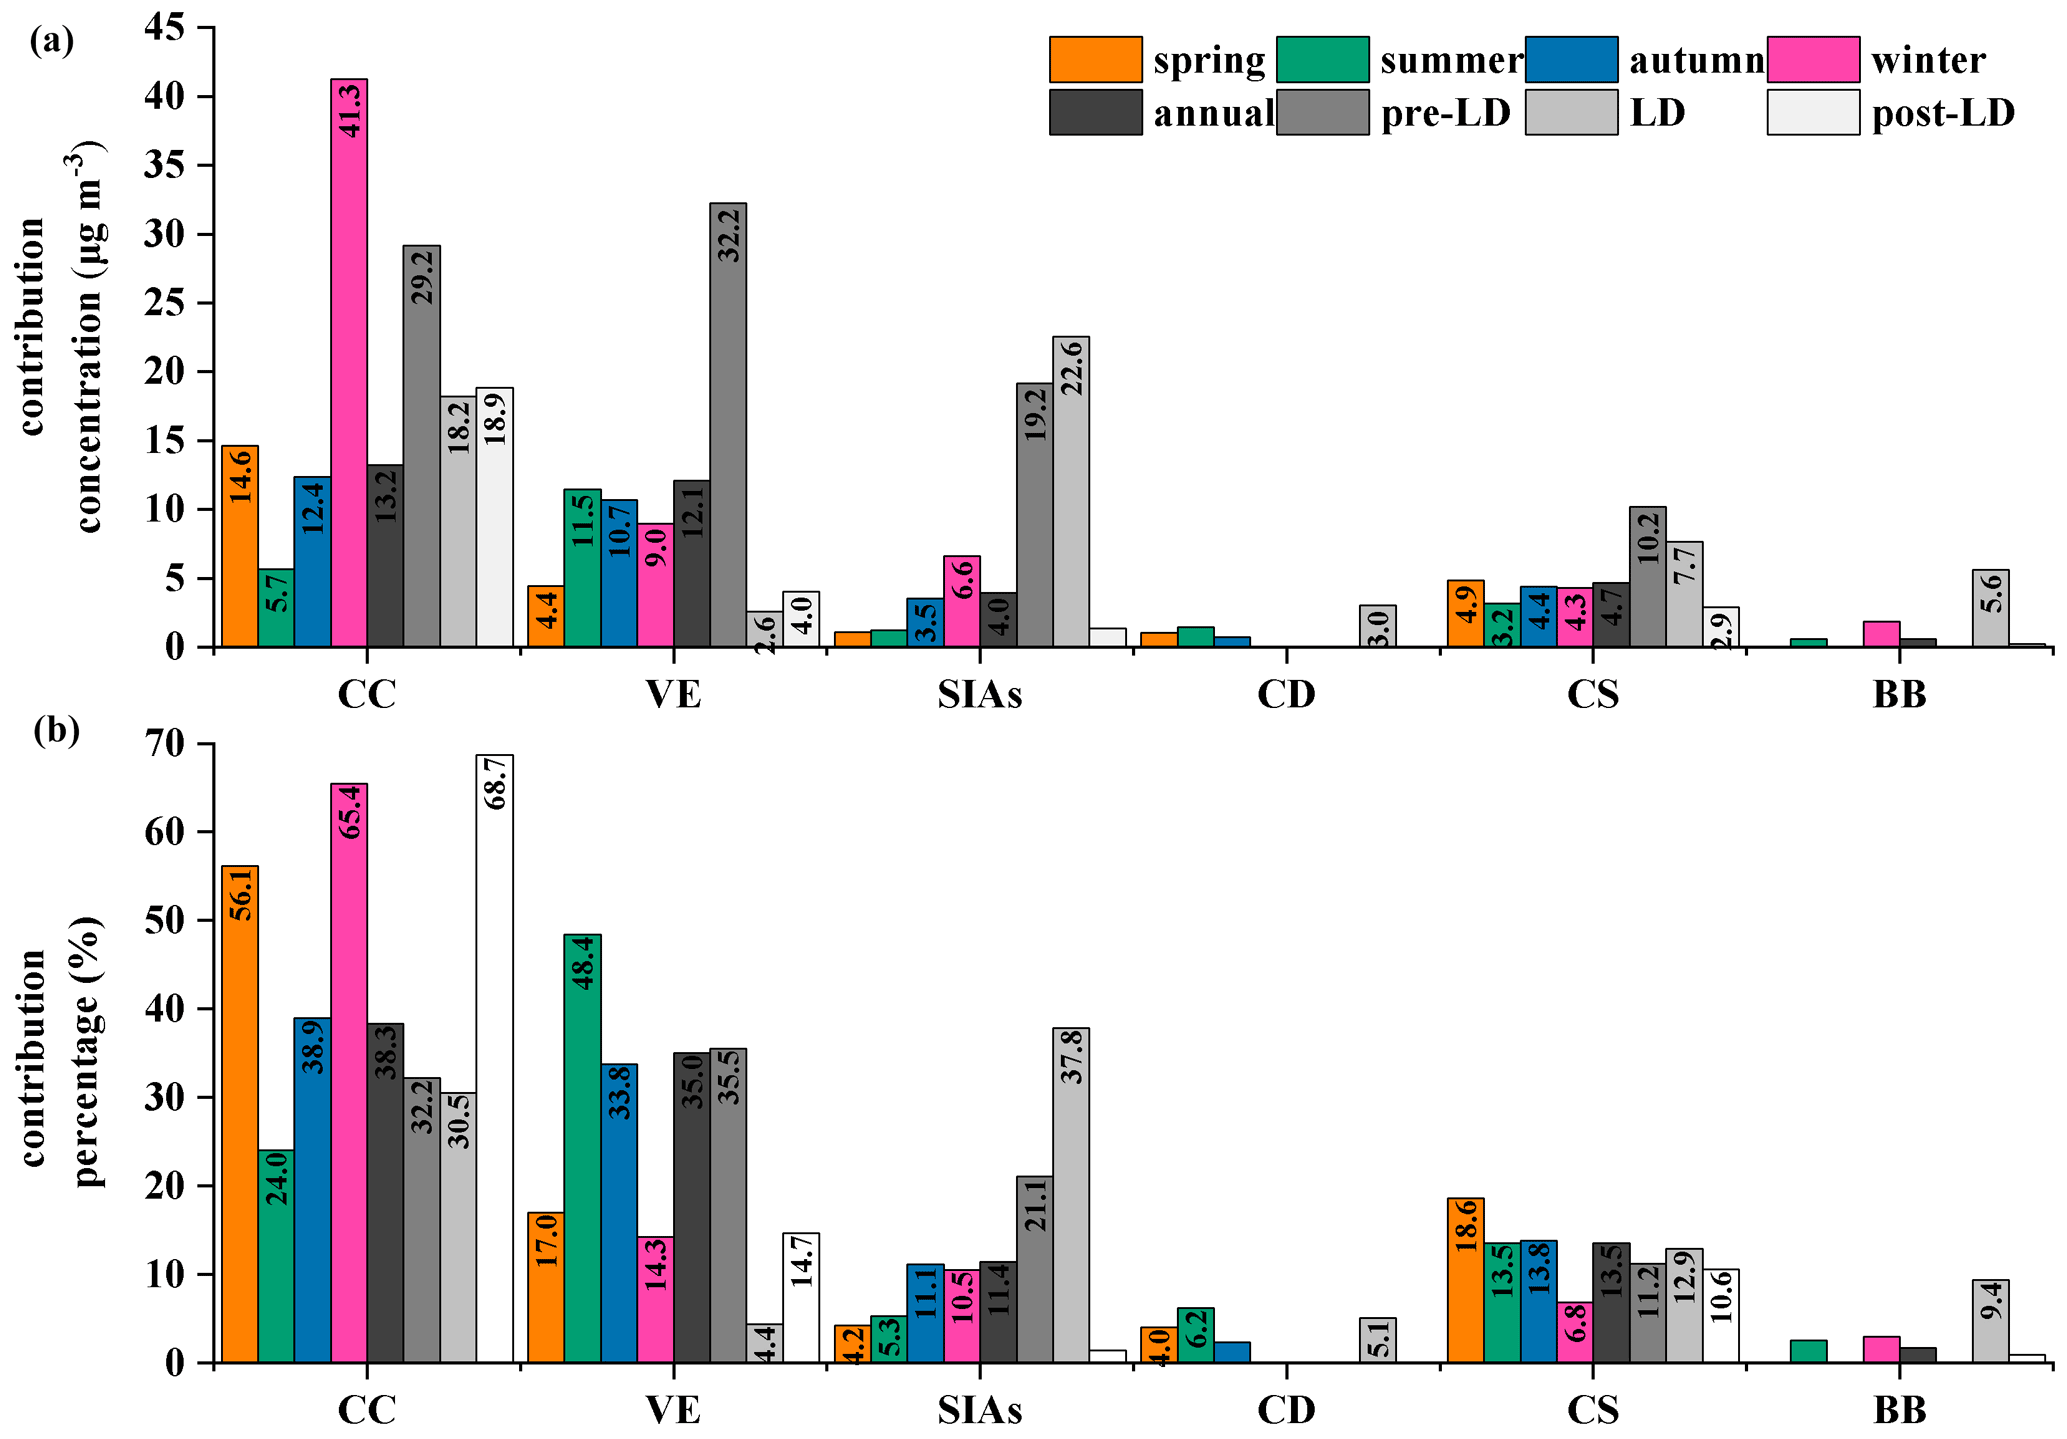
Figure 7(a) Concentration and (b) percentage of source contribution to PM2.5 in Hohhot in spring, summer, autumn and winter over the sampling year, pre-lockdown, lockdown and post-lockdown periods. CC, VE, SIA, CD, CS and BB represent coal combustion, vehicular emission, secondary inorganic aerosol, construction dust, crustal sources and biomass burning, respectively.
The contributions' concentrations of CS followed the order of spring (4.9 µg m−3) > autumn (4.4 µg m−3) > winter (4.3 µg m−3) > summer (3.2 µg m−3), with a contribution percentage of 18.6 %, 13.8 %, 6.8 % and 13.5 %, respectively. A relatively high contribution of CS to PM2.5 was observed in spring, which is associated with the increased long-range transportation of crustal sources due to dry and windy weather in Hohhot. The higher contribution of dust sources to PM2.5 has been reported in some other semi-arid regions, such as Guanzhong basin (Li et al., 2022) and Lanzhou (Liang et al., 2019), indicating that the semi-arid regions are more susceptible to dust sources. The source apportionment results indicate that primary sources such as CC, VE and dust sources in Hohhot were predominant, which is different from cities with high secondary pollution.
During the LD period, the contribution of SIAs, CC, CS, BB, CD and VE was 22.6, 18.2, 7.7, 5.6, 3.0 and 2.6 µg m−3 to PM2.5, respectively, accounting for 37.8 %, 30.5 %, 12.9 %, 9.4 %, 5.1 %, and 4.4 % of the total PM2.5 mass (Fig. 7). The contribution of CC and dust source (the sum of CS and CD) during the LD period in Hohhot was much higher than those of Tangshan (Wang et al., 2021), Taiyuan (Wang et al., 2022) and Xiamen (Hong et al., 2021; Table S11). The contribution of SIAs was lower than Tangshan and Taiyuan, while it was higher than Xiamen. Hohhot, Tangshan and Taiyuan are located in northern China and consume a large amount of coal for winter heating. The high intensity of gaseous precursors emitted from coal combustion is reasonable for a high contribution of SIAs. The contribution of VE in Hohhot was lower than Xiamen and Taiyuan. The contribution of VE decreased from 35.5 % to 4.4 %, whereas the SIAs increased from 21.1 % to 37.8 %. The substantial reduction in VE was associated with the strict traffic restrictions during the LD period, which is consistent with the findings in Taiyuan (Wang et al., 2022). Compared with the LD period, the contribution of VE increased from 4.4 % to 14.7 % during the post-LD period, which can be ascribed to the canceled traffic restrictions. The contribution of CC increased from 30.5 % during the LD period to 68.7 % during the post-LD period, while the concentration decreased from 29.2 to 18.2 µg m−3. The contribution of SIAs decreased from 37.8 % during the LD period to 5.0 % during the post-LD period, which can be attributed to the improved atmospheric conditions.
A single year's offline measurement was conducted in Hohhot to reveal the chemical characteristics and sources of PM2.5 in a semi-arid region. Organic matter, mineral dust, sulfate and nitrite were the predominant components of PM2.5 in Hohhot, and coal combustion, vehicular emission, crustal sources and secondary inorganic aerosols were the main contributors to PM2.5. The high proportion of mineral dust composition and higher contribution of crustal sources to PM2.5 indicated that cities in semi-arid regions are more susceptible to dust sources. The heavy pollution in winter can be attributed to the rapid increase in SNA under high-RH and low-WS conditions, while the heavy pollution in spring was associated with long-range transmission of crustal sources due to the dry and windy weather. Compared with the pre-LD period, the concentration of SNA, OM and EC decreased substantially during the LD and post-LD periods due to the lockdown measures. The source contribution of secondary inorganic aerosols and vehicular emission decreased during the lockdown period, whereas coal combustion increased. The substantial reduction in the contribution of vehicular emission was associated with the strict traffic restrictions during the lockdown period; the increase in vehicular emission contributions during the post-lockdown period can be attributed to the canceled traffic restrictions.
A relatively high contribution of primary sources, such as coal combustion and dust source, was observed in Hohhot. Therefore, the control of primary sources, such as increasing the proportion of clean energy to reduce coal consumption, could be an effective way to reduce the concentration of PM2.5 in Hohhot. The unfavorable meteorological conditions played an integral role during winter and promoted SNA formation and accumulation, causing frequent heavy-pollution events. The reduction in anthropogenic activities and the important role of meteorology in the formation of air pollutants should be considered in aerosol quality and policy measures. The emission reduction in gaseous precursors (SO2 and NOx) under adverse meteorological conditions can prevent heavy-pollution events driven by SNA. The control of coal combustion sources and accurate ambient air quality forecasting techniques will do much good to reduce annual concentrations of PM2.5 and the occurrence of heavy-pollution days, respectively. This study provides new insight for the formulation of effective policies to improve aerosol pollution in semi-arid regions.
Data are available from the corresponding author upon request (hjzhou@imnu.edu.cn).
The supplement related to this article is available online at: https://doi.org/10.5194/acp-22-12153-2022-supplement.
HZ designed the study and prepared the paper with input from all the co-authors. Data analysis and source apportionment were done by HZ and TL. PL, JW and DD carried out the experiments. YT provided the air quality data. FH, BS and XZ participated in the field campaign and data analysis. XC and ZW supervised the study.
The contact author has declared that none of the authors has any competing interests.
Publisher's note: Copernicus Publications remains neutral with regard to jurisdictional claims in published maps and institutional affiliations.
The authors gratefully acknowledge the Environmental Monitoring Center Station of Inner Mongolia for providing the atmospheric pollutant and meteorological data.
This research has been supported by the National Natural Science Foundation of China (grant no. 42167015); Natural Science Foundation of Inner Mongolia (grant no. 2018MS02001); Scientific Research Foundation for the High-level Talents of Inner Mongolia (grant no. 24); Scientific Research Foundation for the High-level Talents of Inner Mongolia Normal University (grant no. 2018YJRC005); and Science and Technology Project of Inner Mongolia Autonomous Region (grant no. 2021GG0406).
This paper was edited by Luis A. Ladino and reviewed by two anonymous referees.
Adam, M. G., Tran, P. T. M., and Balasubramanian, R.: Air quality changes in cities during the COVID-19 lockdown: A critical review, Atmos. Res., 264, 105823, https://doi.org/10.1016/j.atmosres.2021.105823, 2021.
Bao, R. and Zhang, A.: Does lockdown reduce air pollution? Evidence from 44 cities in northern China, Sci. Total Environ., 731, 139052, https://doi.org/10.1016/j.scitotenv.2020.139052, 2020.
Cao, J. J., Wu, F., Chow, J. C., Lee, S. C., Li, Y., Chen, S. W., An, Z. S., Fung, K. K., Watson, J. G., Zhu, C. S., and Liu, S. X.: Characterization and source apportionment of atmospheric organic and elemental carbon during fall and winter of 2003 in Xi'an, China, Atmos. Chem. Phys., 5, 3127–3137, https://doi.org/10.5194/acp-5-3127-2005, 2005.
Castro, L. M., Pio, C. A., Harrison, R. M., and Smith, D. J. T.: Carbonaceous aerosol in urban and rural European atmospheres: estimation of secondary organic carbon concentrations, Atmos. Environ., 33, 2771–2781, https://doi.org/10.1016/S1352-2310(98)00331-8, 1999.
Chang, Y., Huang, R.-J., Ge, X., Huang, X., Hu, J., Duan, Y., Zou, Z., Liu, X., and Lehmann, M. F.: Puzzling haze events in China during the Coronavirus (COVID-19) shutdown, Geophys. Res. Lett., 47, e2020GL088533, https://doi.org/10.1029/2020GL088533, 2020.
Chen, H., Huo, J., Fu, Q., Duan, Y., Xiao, H., and Chen, J.: Impact of quarantine measures on chemical compositions of PM2.5 during the COVID-19 epidemic in Shanghai, China, Sci. Total Environ., 743, 140758, https://doi.org/10.1016/j.scitotenv.2020.140758, 2020.
Chiari, M., Yubero, E., Calzolai, G., Lucarelli, F., Crespo, J., Galindo, N., Nicolás, J. F., Giannoni, M., and Nava, S.: Comparison of PIXE and XRF analysis of airborne particulate matter samples collected on Teflon and quartz fibre filters, Nucl. Instrum. Meth. B, 417, 128–132, https://doi.org/10.1016/j.nimb.2017.07.031, 2018.
Chow, J. C., Watson, J. G., Chen, L. W. A., Chang, M. C. O., Robinson, N. F., Trimble, D., and Kohl, S.: The IMPROVE_A temperature protocol for thermal/optical carbon analysis: Maintaining consistency with a long-term database, J. Air Waste Manage., 57, 1014–1023, https://doi.org/10.3155/1047-3289.57.9.1014, 2007.
Clemente, Á., Yubero, E., Nicolás, J. F., Caballero, S., Crespo, J., and Galindo, N.: Changes in the concentration and composition of urban aerosols during the COVID-19 lockdown, Environ. Res., 203, 111788, https://doi.org/10.1016/j.envres.2021.111788, 2022.
Collivignarelli, M. C., Abbà, A., Bertanza, G., Pedrazzani, R., Ricciardi, P., and Carnevale Miino, M.: Lockdown for CoViD-2019 in Milan: What are the effects on air quality?, Sci. Total Environ., 732, 139280, https://doi.org/10.1016/j.scitotenv.2020.139280, 2020.
Daher, N., Ruprecht, A., Invernizzi, G., De Marco, C., Miller-Schulze, J., Heo, J. B., Shafer, M. M., Shelton, B. R., Schauer, J. J., and Sioutas, C.: Characterization, sources and redox activity of fine and coarse particulate matter in Milan, Italy, Atmos. Environ., 49, 130–141, https://doi.org/10.1016/j.atmosenv.2011.12.011, 2012.
Dao, X., Ji, D., Zhang, X., He, J., Meng, X., Wang, Z., Liu, Y., Xu, X., Tang, G., and Wang, Y.: Characteristics, sources and health risk assessment of PM2.5 in China's coal and coking heartland: Insights gained from the regional observations during the heating season, Atmos. Pollut. Res., 12, 101237, https://doi.org/10.1016/j.apr.2021.101237, 2021.
Dao, X., Di, S., Zhang, X., Gao, P., Wang, L., Yan, L., Tang, G., He, L., Krafft, T., and Zhang, F.: Composition and sources of particulate matter in the Beijing-Tianjin-Hebei region and its surrounding areas during the heating season, Chemosphere, 291, 132779, https://doi.org/10.1016/j.chemosphere.2021.132779, 2022.
Ding, J., Dai, Q., Li, Y., Han, S., Zhang, Y., and Feng, Y.: Impact of meteorological condition changes on air quality and particulate chemical composition during the COVID-19 lockdown, J. Environ. Sci.-China, 109, 45–56, https://doi.org/10.1016/j.jes.2021.02.022, 2021.
Feng, X., Tian, Y., Xue, Q., Song, D., Huang, F., and Feng, Y.: Measurement report: Spatiotemporal and policy-related variations of PM2.5 composition and sources during 2015–2019 at multiple sites in a Chinese megacity, Atmos. Chem. Phys., 21, 16219–16235, https://doi.org/10.5194/acp-21-16219-2021, 2021.
Feng, X., Feng, Y., Chen, Y., Cai, J., Li, Q., and Chen, J.: Source apportionment of PM2.5 during haze episodes in Shanghai by the PMF model with PAHs, J. Clean. Prod., 330, 129850, https://doi.org/10.1016/j.jclepro.2021.129850, 2022a.
Feng, Z., Zheng, F., Liu, Y., Fan, X., Yan, C., Zhang, Y., Daellenbach, K. R., Bianchi, F., Petäjä, T., Kulmala, M., and Bao, X.: Evolution of organic carbon during COVID-19 lockdown period: Possible contribution of nocturnal chemistry, Sci. Total Environ., 808, 152191, https://doi.org/10.1016/j.scitotenv.2021.152191, 2022b.
Fu, Z., Cheng, L., Ye, X., Ma, Z., Wang, R., Duan, Y., Juntao, H., and Chen, J.: Characteristics of aerosol chemistry and acidity in Shanghai after PM2.5 satisfied national guideline: Insight into future emission control, Sci. Total Environ., 827, 154319, https://doi.org/10.1016/j.scitotenv.2022.154319, 2022.
Gao, C., Li, S., Liu, M., Zhang, F., Achal, V., Tu, Y., Zhang, S., and Cai, C.: Impact of the COVID-19 pandemic on air pollution in Chinese megacities from the perspective of traffic volume and meteorological factors, Sci. Total Environ., 773, 145545, https://doi.org/10.1016/j.scitotenv.2021.145545, 2021a.
Gao, J., Peng, X., Chen, G., Xu, J., Shi, G.-L., Zhang, Y.-C., and Feng, Y.-C.: Insights into the chemical characterization and sources of PM2.5 in Beijing at a 1-h time resolution, Sci. Total Environ., 542, 162–171, https://doi.org/10.1016/j.scitotenv.2015.10.082, 2016.
Gao, W., Zhu, L., Ma, Z., Gao, Q., Yu, X., Wu, S., and Gu, Y.: Particulate matter trends and quantification of the spring sand-dust contribution in Hohhot, Inner Mongolia, from 2013 to 2017, Atmos. Ocean. Sci. Lett., 14, 100036, https://doi.org/10.1016/j.aosl.2021.100036, 2021b.
Gkatzelis, G. I., Gilman, J. B., Brown, S. S., Eskes, H., Gomes, A. R., Lange, A. C., McDonald, B. C., Peischl, J., Petzold, A., Thompson, C. R., and Kiendler-Scharr, A.: The global impacts of COVID-19 lockdowns on urban air pollution: A critical review and recommendations, Elementa-Sci. Anthrop., 9, 00176, https://doi.org/10.1525/elementa.2021.00176, 2021.
Gualtieri, G., Brilli, L., Carotenuto, F., Vagnoli, C., Zaldei, A., and Gioli, B.: Quantifying road traffic impact on air quality in urban areas: A Covid19-induced lockdown analysis in Italy, Environ. Pollut., 267, 115682, https://doi.org/10.1016/j.envpol.2020.115682, 2020.
He, K., Zhao, Q., Ma, Y., Duan, F., Yang, F., Shi, Z., and Chen, G.: Spatial and seasonal variability of PM2.5 acidity at two Chinese megacities: insights into the formation of secondary inorganic aerosols, Atmos. Chem. Phys., 12, 1377–1395, https://doi.org/10.5194/acp-12-1377-2012, 2012.
Hernández-Paniagua, I. Y., Valdez, S. I., Almanza, V., Rivera-Cárdenas, C., Grutter, M., Stremme, W., García-Reynoso, A., and Ruiz-Suárez, L. G.: Impact of the COVID-19 Lockdown on Air Quality and Resulting Public Health Benefits in the Mexico City Metropolitan Area, Front. Public Health, 9, 642630, https://doi.org/10.3389/fpubh.2021.642630, 2021.
Hong, Y., Xu, X., Liao, D., Zheng, R., Ji, X., Chen, Y., Xu, L., Li, M., Wang, H., Xiao, H., Choi, S.-D., and Chen, J.: Source apportionment of PM2.5 and sulfate formation during the COVID-19 lockdown in a coastal city of southeast China, Environ. Pollut., 286, 117577, https://doi.org/10.1016/j.envpol.2021.117577, 2021.
Huang, B., Liu, M., Ren, Z., Bi, X., Zhang, G., Sheng, G., and Fu, J.: Chemical composition, diurnal variation and sources of PM2.5 at two industrial sites of South China, Atmos. Pollut. Res., 4, 298–305, https://doi.org/10.5094/APR.2013.033, 2013a.
Huang, R.-J., Wang, Y., Cao, J., Lin, C., Duan, J., Chen, Q., Li, Y., Gu, Y., Yan, J., Xu, W., Fröhlich, R., Canonaco, F., Bozzetti, C., Ovadnevaite, J., Ceburnis, D., Canagaratna, M. R., Jayne, J., Worsnop, D. R., El-Haddad, I., Prévôt, A. S. H., and O'Dowd, C. D.: Primary emissions versus secondary formation of fine particulate matter in the most polluted city (Shijiazhuang) in North China, Atmos. Chem. Phys., 19, 2283–2298, https://doi.org/10.5194/acp-19-2283-2019, 2019.
Huang, X., Ding, A., Gao, J., Zheng, B., Zhou, D., Qi, X., Tang, R., Wang, J., Ren, C., Nie, W., Chi, X., Xu, Z., Chen, L., Li, Y., Che, F., Pang, N., Wang, H., Tong, D., Qin, W., Cheng, W., Liu, W., Fu, Q., Liu, B., Chai, F., Davis, S. J., Zhang, Q., and He, K.: Enhanced secondary pollution offset reduction of primary emissions during COVID-19 lockdown in China, Natl. Sci. Rev., 8, nwaa137, https://doi.org/10.1093/nsr/nwaa137, 2021.
Huang, Y.-K., Luvsan, M.-E., Gombojav, E., Ochir, C., Bulgan, J., and Chan, C.-C.: Land use patterns and SO2 and NO2 pollution in Ulaanbaatar, Mongolia, Environ. Res., 124, 1–6, https://doi.org/10.1016/j.envres.2013.02.006, 2013b.
Kanniah, K. D., Kamarul Zaman, N. A. F., Kaskaoutis, D. G., and Latif, M. T.: COVID-19's impact on the atmospheric environment in the Southeast Asia region, Sci. Total Environ., 736, 139658, https://doi.org/10.1016/j.scitotenv.2020.139658, 2020.
Kumar, A. and Sarin, M. M.: Mineral aerosols from western India: Temporal variability of coarse and fine atmospheric dust and elemental characteristics, Atmos. Environ., 43, 4005–4013, https://doi.org/10.1016/j.atmosenv.2009.05.014, 2009.
Le, T., Wang, Y., Liu, L., Yang, J., Yung Yuk, L., Li, G., and Seinfeld John, H.: Unexpected air pollution with marked emission reductions during the COVID-19 outbreak in China, Science, 369, 702–706, https://doi.org/10.1126/science.abb7431, 2020.
Li, J., Li, J., Wang, G., Ho, K. F., Han, J., Dai, W., Wu, C., Cao, C., and Liu, L.: In-vitro oxidative potential and inflammatory response of ambient PM2.5 in a rural region of Northwest China: Association with chemical compositions and source contribution, Environ. Res., 205, 112466, https://doi.org/10.1016/j.envres.2021.112466, 2022.
Li, L., Tan, Q., Zhang, Y., Feng, M., Qu, Y., An, J., and Liu, X.: Characteristics and source apportionment of PM2.5 during persistent extreme haze events in Chengdu, southwest China, Environ. Pollut., 230, 718–729, https://doi.org/10.1016/j.envpol.2017.07.029, 2017a.
Li, M., Hu, M., Du, B., Guo, Q., Tan, T., Zheng, J., Huang, X., He, L., Wu, Z., and Guo, S.: Temporal and spatial distribution of PM2.5 chemical composition in a coastal city of Southeast China, Sci. Total Environ., 605–606, 337–346, https://doi.org/10.1016/j.scitotenv.2017.03.260, 2017b.
Li, R., Zhao, Y., Fu, H., Chen, J., Peng, M., and Wang, C.: Substantial changes in gaseous pollutants and chemical compositions in fine particles in the North China Plain during the COVID-19 lockdown period: anthropogenic vs. meteorological influences, Atmos. Chem. Phys., 21, 8677–8692, https://doi.org/10.5194/acp-21-8677-2021, 2021.
Liang, X., Huang, T., Lin, S., Wang, J., Mo, J., Gao, H., Wang, Z., Li, J., Lian, L., and Ma, J.: Chemical composition and source apportionment of PM1 and PM2.5 in a national coal chemical industrial base of the Golden Energy Triangle, Northwest China, Sci. Total Environ., 659, 188–199, https://doi.org/10.1016/j.scitotenv.2018.12.335, 2019.
Liu, H., Tian, H., Zhang, K., Liu, S., Cheng, K., Yin, S., Liu, Y., Liu, X., Wu, Y., Liu, W., Bai, X., Wang, Y., Shao, P., Luo, L., Lin, S., Chen, J., and Liu, X.: Seasonal variation, formation mechanisms and potential sources of PM2.5 in two typical cities in the Central Plains Urban Agglomeration, China, Sci. Total Environ., 657, 657–670, https://doi.org/10.1016/j.scitotenv.2018.12.068, 2019.
Liu, Y., Li, C., Zhang, C., Liu, X., Qu, Y., An, J., Ma, D., Feng, M., and Tan, Q.: Chemical characteristics, source apportionment, and regional contribution of PM2.5 in Zhangjiakou, Northern China: A multiple sampling sites observation and modeling perspective, Environ. Adv., 3, 100034, https://doi.org/10.1016/j.envadv.2021.100034, 2021.
Lv, Z., Wang, X., Deng, F., Ying, Q., Archibald, A. T., Jones, R. L., Ding, Y., Cheng, Y., Fu, M., Liu, Y., Man, H., Xue, Z., He, K., Hao, J., and Liu, H.: Source–receptor relationship revealed by the halted traffic and aggravated haze in Beijing during the COVID-19 lockdown, Environ. Sci. Technol., 54, 15660–15670, https://doi.org/10.1021/acs.est.0c04941, 2020.
Ma, J., Shen, J., Wang, P., Zhu, S., Wang, Y., Wang, P., Wang, G., Chen, J., and Zhang, H.: Modeled changes in source contributions of particulate matter during the COVID-19 pandemic in the Yangtze River Delta, China, Atmos. Chem. Phys., 21, 7343–7355, https://doi.org/10.5194/acp-21-7343-2021, 2021.
Matthias, V., Quante, M., Arndt, J. A., Badeke, R., Fink, L., Petrik, R., Feldner, J., Schwarzkopf, D., Link, E.-M., Ramacher, M. O. P., and Wedemann, R.: The role of emission reductions and the meteorological situation for air quality improvements during the COVID-19 lockdown period in central Europe, Atmos. Chem. Phys., 21, 13931–13971, https://doi.org/10.5194/acp-21-13931-2021, 2021.
MEEC: Bulletin of Ecology and Environment Status of China in 2015, Ministry of Ecology and Environment of China, Beijing, http://www.cnemc.cn/jcbg/zghjzkgb/201706/t20170605_646746.shtml (last access: 11 February 2022), 2015 (in Chinese).
MEEC: Bulletin of Ecology and Environment Status of China in 2020, Ministry of Ecology and Environment of China, Beijing, http://www.cnemc.cn/jcbg/zghjzkgb/202105/t20210527_835035.shtml (last access: 11 February 2022), 2020 (in Chinese).
Mendez-Espinosa, J. F., Rojas, N. Y., Vargas, J., Pachón, J. E., Belalcazar, L. C., and Ramírez, O.: Air quality variations in Northern South America during the COVID-19 lockdown, Sci. Total Environ., 749, 141621, https://doi.org/10.1016/j.scitotenv.2020.141621, 2020.
Nakada, L. Y. K. and Urban, R. C.: COVID-19 pandemic: Impacts on the air quality during the partial lockdown in São Paulo state, Brazil, Sci. Total Environ., 730, 139087, https://doi.org/10.1016/j.scitotenv.2020.139087, 2020.
Norris, G., Duvall, R., Brown, S., and Bai, S.: EPA positive matrix factorization (PMF) 5.0 fundamentals and user guide, US Environmental Protection Agency, Washington, DC, https://www.epa.gov/air-research/epa-positive-matrix-factorization-50-fundamentals-and-user-guide (last access: 23 September 2021), 2014.
Paatero, P. and Tapper, U.: Positive matrix factorization: A non-negative factor model with optimal utilization of error estimates of data values, Environmetrics, 5, 111–126, https://doi.org/10.1002/env.3170050203, 1994.
Paatero, P., Eberly, S., Brown, S. G., and Norris, G. A.: Methods for estimating uncertainty in factor analytic solutions, Atmos. Meas. Tech., 7, 781–797, https://doi.org/10.5194/amt-7-781-2014, 2014.
Pata, U. K.: How is COVID-19 affecting environmental pollution in US cities? Evidence from asymmetric Fourier causality test, Air Qual. Atmos. Health, 13, 1149–1155, https://doi.org/10.1007/s11869-020-00877-9, 2020.
Ren, C., Huang, X., Wang, Z., Sun, P., Chi, X., Ma, Y., Zhou, D., Huang, J., Xie, Y., Gao, J., and Ding, A.: Nonlinear response of nitrate to NOx reduction in China during the COVID-19 pandemic, Atmos. Environ., 264, 118715, https://doi.org/10.1016/j.atmosenv.2021.118715, 2021.
Ren, X., Tian, Y., Xin, J., Ren, Y., Wang, P., Hao, F., Ma, Y., Ma, Y., Wu, L., Pan, X., and Wang, Z.: Meteorological and chemical causes of heavy pollution in winter in Hohhot, Inner Mongolia Plateau, Atmos. Res., 275, 106243, https://doi.org/10.1016/j.atmosres.2022.106243, 2022.
Rodríguez-Urrego, D. and Rodríguez-Urrego, L.: Air quality during the COVID-19: PM2.5 analysis in the 50 most polluted capital cities in the world, Environ. Pollut., 266, 115042, https://doi.org/10.1016/j.envpol.2020.115042, 2020.
Sharma, S., Zhang, M., Anshika, Gao, J., Zhang, H., and Kota, S. H.: Effect of restricted emissions during COVID-19 on air quality in India, Sci. Total Environ., 728, 138878, https://doi.org/10.1016/j.scitotenv.2020.138878, 2020.
Shen, L., Zhao, T., Wang, H., Liu, J., Bai, Y., Kong, S., Zheng, H., Zhu, Y., and Shu, Z.: Importance of meteorology in air pollution events during the city lockdown for COVID-19 in Hubei Province, Central China, Sci. Total Environ., 754, 142227, https://doi.org/10.1016/j.scitotenv.2020.142227, 2021.
Shi, Z., Song, C., Liu, B., Lu, G., Xu, J., Van Vu, T., Elliott Robert, J. R., Li, W., Bloss William, J., and Harrison Roy, M.: Abrupt but smaller than expected changes in surface air quality attributable to COVID-19 lockdowns, Sci. Adv., 7, eabd6696, https://doi.org/10.1126/sciadv.abd6696, 2021.
Srivastava, A.: COVID-19 and air pollution and meteorology-an intricate relationship: A review, Chemosphere, 263, 128297, https://doi.org/10.1016/j.chemosphere.2020.128297, 2021.
Sulaymon, I. D., Zhang, Y., Hopke, P. K., Hu, J., Zhang, Y., Li, L., Mei, X., Gong, K., Shi, Z., Zhao, B., and Zhao, F.: Persistent high PM2.5 pollution driven by unfavorable meteorological conditions during the COVID-19 lockdown period in the Beijing-Tianjin-Hebei region, China, Environ. Res., 198, 111186, https://doi.org/10.1016/j.envres.2021.111186, 2021.
Tian, J., Wang, Q., Zhang, Y., Yan, M., Liu, H., Zhang, N., Ran, W., and Cao, J.: Impacts of primary emissions and secondary aerosol formation on air pollution in an urban area of China during the COVID-19 lockdown, Environ. Int., 150, 106426, https://doi.org/10.1016/j.envint.2021.106426, 2021.
Tian, Y., Zhang, Y., Liang, Y., Niu, Z., Xue, Q., and Feng, Y.: PM2.5 source apportionment during severe haze episodes in a Chinese megacity based on a 5-month period by using hourly species measurements: Explore how to better conduct PMF during haze episodes, Atmos. Environ., 224, 117364, https://doi.org/10.1016/j.atmosenv.2020.117364, 2020.
Tobías, A., Carnerero, C., Reche, C., Massagué, J., Via, M., Minguillón, M. C., Alastuey, A., and Querol, X.: Changes in air quality during the lockdown in Barcelona (Spain) one month into the SARS-CoV-2 epidemic, Sci. Total Environ., 726, 138540, https://doi.org/10.1016/j.scitotenv.2020.138540, 2020.
Ulbrich, I. M., Canagaratna, M. R., Zhang, Q., Worsnop, D. R., and Jimenez, J. L.: Interpretation of organic components from Positive Matrix Factorization of aerosol mass spectrometric data, Atmos. Chem. Phys., 9, 2891–2918, https://doi.org/10.5194/acp-9-2891-2009, 2009.
Wang, H., Ding, J., Xu, J., Wen, J., Han, J., Wang, K., Shi, G., Feng, Y., Ivey, C. E., Wang, Y., Nenes, A., Zhao, Q., and Russell, A. G.: Aerosols in an arid environment: The role of aerosol water content, particulate acidity, precursors, and relative humidity on secondary inorganic aerosols, Sci. Total Environ., 646, 564–572, https://doi.org/10.1016/j.scitotenv.2018.07.321, 2019.
Wang, N., Xu, J., Pei, C., Tang, R., Zhou, D., Chen, Y., Li, M., Deng, X., Deng, T., Huang, X., and Ding, A.: Air quality during COVID-19 lockdown in the Yangtze River Delta and the Pearl River Delta: Two different responsive mechanisms to emission reductions in China, Environ. Sci. Technol., 55, 5721–5730, https://doi.org/10.1021/acs.est.0c08383, 2021.
Wang, Y., Jia, C., Tao, J., Zhang, L., Liang, X., Ma, J., Gao, H., Huang, T., and Zhang, K.: Chemical characterization and source apportionment of PM2.5 in a semi-arid and petrochemical-industrialized city, Northwest China, Sci. Total Environ., 573, 1031–1040, https://doi.org/10.1016/j.scitotenv.2016.08.179, 2016.
Wang, Y., Wen, Y., Wang, Y., Zhang, S., Zhang, K. M., Zheng, H., Xing, J., Wu, Y., and Hao, J.: Four-month changes in air quality during and after the COVID-19 lockdown in six megacities in China, Environ. Sci. Technol. Lett., 7, 802–808, https://doi.org/10.1021/acs.estlett.0c00605, 2020.
Wang, Y., Wen, Y., Cui, Y., Guo, L., He, Q., Li, H., and Wang, X.: Substantial changes of chemical composition and sources of fine particles during the period of COVID-19 pandemic in Taiyuan, Northern China, Air Qual. Atmos. Health, 15, 4–58, https://doi.org/10.1007/s11869-021-01082-y, 2022.
WHO: WHO global air quality guidelines: Particulate matter (PM2.5 and PM10), ozone, nitrogen dioxide, sulfur dioxide and carbon monoxide, World Health Organization, Geneva, https://www.who.int/publications-detail-redirect/9789240034228 (last access: 11 February 2022), 2021.
Xie, F., Zhou, X., Wang, H., Gao, J., Hao, F., He, J., and Lü, C.: Heating events drive the seasonal patterns of volatile organic compounds in a typical semi-arid city, Sci. Total Environ., 788, 147781, https://doi.org/10.1016/j.scitotenv.2021.147781, 2021.
Xie, Y., Liu, Z., Wen, T., Huang, X., Liu, J., Tang, G., Yang, Y., Li, X., Shen, R., Hu, B., and Wang, Y.: Characteristics of chemical composition and seasonal variations of PM2.5 in Shijiazhuang, China: Impact of primary emissions and secondary formation, Sci. Total Environ., 677, 215–229, https://doi.org/10.1016/j.scitotenv.2019.04.300, 2019.
Yang, S., Ma, Y. L., Duan, F. K., He, K. B., Wang, L. T., Wei, Z., Zhu, L. D., Ma, T., Li, H., and Ye, S. Q.: Characteristics and formation of typical winter haze in Handan, one of the most polluted cities in China, Sci. Total Environ., 613–614, 1367–1375, https://doi.org/10.1016/j.scitotenv.2017.08.033, 2018.
Zhang, Q., Zheng, Y., Tong, D., Shao, M., Wang, S., Zhang, Y., Xu, X., Wang, J., He, H., Liu, W., Ding, Y., Lei, Y., Li, J., Wang, Z., Zhang, X., Wang, Y., Cheng, J., Liu, Y., Shi, Q., Yan, L., Geng, G., Hong, C., Li, M., Liu, F., Zheng, B., Cao, J., Ding, A., Gao, J., Fu, Q., Huo, J., Liu, B., Liu, Z., Yang, F., He, K., and Hao, J.: Drivers of improved PM2.5 air quality in China from 2013 to 2017, P. Natl. Acad. Sci. USA, 116, 24463, https://doi.org/10.1073/pnas.1907956116, 2019.
Zhang, Q., Pan, Y., He, Y., Walters, W. W., Ni, Q., Liu, X., Xu, G., Shao, J., and Jiang, C.: Substantial nitrogen oxides emission reduction from China due to COVID-19 and its impact on surface ozone and aerosol pollution, Sci. Total Environ., 753, 142238, https://doi.org/10.1016/j.scitotenv.2020.142238, 2021.
Zhang, R., Sun, X., Shi, A., Huang, Y., Yan, J., Nie, T., Yan, X., and Li, X.: Secondary inorganic aerosols formation during haze episodes at an urban site in Beijing, China, Atmos. Environ., 177, 275–282, https://doi.org/10.1016/j.atmosenv.2017.12.031, 2018.
Zheng, H., Kong, S., Chen, N., Yan, Y., Liu, D., Zhu, B., Xu, K., Cao, W., Ding, Q., Lan, B., Zhang, Z., Zheng, M., Fan, Z., Cheng, Y., Zheng, S., Yao, L., Bai, Y., Zhao, T., and Qi, S.: Significant changes in the chemical compositions and sources of PM2.5 in Wuhan since the city lockdown as COVID-19, Sci. Total Environ., 739, 140000, https://doi.org/10.1016/j.scitotenv.2020.140000, 2020.
Zhou, H., He, J., Zhao, B., Zhang, L., Fan, Q., Lü, C., Dudagula, Liu, T., and Yuan, Y.: The distribution of PM10 and PM2.5 carbonaceous aerosol in Baotou, China, Atmos. Res., 178–179, 102–113, https://doi.org/10.1016/j.atmosres.2016.03.019, 2016.
Zhou, H., Lü, C., He, J., Gao, M., Zhao, B., Ren, L., Zhang, L., Fan, Q., Liu, T., He, Z., Dudagula, Zhou, B., Liu, H., and Zhang, Y.: Stoichiometry of water-soluble ions in PM2.5: Application in source apportionment for a typical industrial city in semi-arid region, Northwest China, Atmos. Res., 204, 149–160, https://doi.org/10.1016/j.atmosres.2018.01.017, 2018.
Zhou, X., Li, Z., Zhang, T., Wang, F., Tao, Y., Zhang, X., Wang, F., Huang, J., Cheng, T., Jiang, H., Zheng, C., and Liu, F.: Chemical nature and predominant sources of PM10 and PM2.5 from multiple sites on the Silk Road, Northwest China, Atmos. Pollut. Res., 12, 425–436, https://doi.org/10.1016/j.apr.2020.10.001, 2021.
Zíková, N., Wang, Y., Yang, F., Li, X., Tian, M., and Hopke, P. K.: On the source contribution to Beijing PM2.5 concentrations, Atmos. Environ., 134, 84–95, https://doi.org/10.1016/j.atmosenv.2016.03.047, 2016.