the Creative Commons Attribution 4.0 License.
the Creative Commons Attribution 4.0 License.
 | 19 Sep 2022
An improved representation of fire non-methane organic gases (NMOGs) in models: emissions to reactivity
Jesse H. Kroll
Eric C. Apel
Donald Blake
Matthew Coggon
Achim Edtbauer
Georgios Gkatzelis
Rebecca S. Hornbrook
Jeff Peischl
Eva Y. Pfannerstill
Felix Piel
Nina G. Reijrink
Akima Ringsdorf
Carsten Warneke
Jonathan Williams
Armin Wisthaler
Fires emit a substantial amount of non-methane organic gases (NMOGs), the atmospheric oxidation of which can contribute to ozone and secondary particulate matter formation. However, the abundance and reactivity of these fire NMOGs are uncertain and historically not well constrained. In this work, we expand the representation of fire NMOGs in a global chemical transport model, GEOS-Chem. We update emission factors to Andreae (2019) and the chemical mechanism to include recent aromatic and ethene and ethyne model improvements (Bates et al., 2021; Kwon et al., 2021). We expand the representation of NMOGs by adding lumped furans to the model (including their fire emission and oxidation chemistry) and by adding fire emissions of nine species already included in the model, prioritized for their reactivity using data from the Fire Influence on Regional to Global Environments (FIREX) laboratory studies. Based on quantified emissions factors, we estimate that our improved representation captures 72 % of emitted, identified NMOG carbon mass and 49 % of OH reactivity from savanna and temperate forest fires, a substantial increase from the standard model (49 % of mass, 28 % of OH reactivity). We evaluate fire NMOGs in our model with observations from the Amazon Tall Tower Observatory (ATTO) in Brazil, Fire Influence on Regional to Global Environments and Air Quality (FIREX-AQ) and DC3 in the US, and Arctic Research of the Composition of the Troposphere from Aircraft and Satellites (ARCTAS) in boreal Canada. We show that NMOGs, including furan, are well simulated in the eastern US with some underestimates in the western US and that adding fire emissions improves our ability to simulate ethene in boreal Canada. We estimate that fires provide 15 % of annual mean simulated surface OH reactivity globally, as well as more than 75 % over fire source regions. Over continental regions about half of this simulated fire reactivity comes from NMOG species. We find that furans and ethene are important globally for reactivity, while phenol is more important at a local level in the boreal regions. This is the first global estimate of the impact of fire on atmospheric reactivity.
- Article
(7055 KB) - Full-text XML
-
Supplement
(6605 KB) - BibTeX
- EndNote


Biomass burning (both wildfires and prescribed and agricultural burns) is a large source of non-methane organic gases (NMOGs) (e.g., Akagi et al., 2011; Koss et al., 2018; Coggon et al., 2019; Kumar et al., 2018). Goldstein and Galbally (2007) suggest that, while tens of thousands of organic compounds have been detected in the atmosphere, this may represent only a small subset of the species present in the atmosphere. Only ∼100 compounds have typically been measured during field campaigns, but recent advances in mass spectrometry have enabled the online characterization of an expanding suite of organic compounds in the atmosphere, including those from fires (e.g., Koss et al., 2018). Because many NMOGs are quite reactive, they impact tropospheric and stratospheric (Bernath et al., 2022) chemistry and composition. Many NMOGs are toxic themselves (Naeher et al., 2007), and they can also react to form two major air pollutants that are also harmful to human health, ozone (O3) and particulate matter smaller than 2.5 µm (PM2.5) (e.g., Hobbs et al., 2003; Yokelson et al., 2009; Jaffe et al., 2008, 2013, 2018; Xu et al., 2021). NMOGs also modulate oxidant concentrations, which affect the climate through the methane lifetime (Voulgarakis et al., 2013). The importance of fires to the budget of global NMOGs and to the impacts discussed above is not well understood, as suggested by a recent study (Bourgeois et al., 2021).
Various terms have been used in the literature to describe reactive carbon-containing trace gases, including one of the first, non-methane hydrocarbons (NMHCs), which excludes species with oxygen or other heteroatoms. The term volatile organic compound (VOC) encompasses this broader set of compounds, although there is no agreed upon, quantitative definition for VOCs or their surrogate, non-methane organic compounds (NMOCs). The European Union defines VOC as any organic compound having an initial boiling point less than or equal to 250 ∘C measured at a standard atmospheric pressure of 101.3 kPa (European Union, 1999). The US EPA defines VOCs as any compound that participates in atmospheric photochemical reactions except for those that they designate as having minimal reactivity. The term oxygenated VOC (OVOC) (Goldstein and Galbally, 2007; Kwan et al., 2006) has further blurred these definitions, with colloquial usage sometimes being ambiguous as to whether OVOCs are a subset of VOCs or whether VOCs represent the unoxygenated (i.e., non-methane hydrocarbon, NMHC) suite of compounds. Volatility-based nomenclature separates VOCs from semi-volatile OC (SVOC) and intermediate-volatility OC (IVOC) species (Robinson et al., 2007). For this study, we use NMOGs, which encompasses all gas-phase organic compounds (excluding methane), regardless of volatility, degree of oxygenation, or other chemical properties.
While fires emit a significant amount of NMOGs (∼100–200 Tg yr−1) (Akagi et al., 2011; Yokelson et al., 2008; Andreae and Merlet, 2001), second only to biogenic sources globally (∼1000 Tg yr−1) (Guenther et al., 2012), modeling efforts, particularly at the global scale, have historically represented only a modest subset of these emissions and their reactivity. This is in part because a large number of reactive fire NMOGs remain unidentified (Kumar et al., 2018; Hayden et al., 2022; Akagi et al., 2011). While progress has been made on measuring emissions of many fire NMOGs, these measurements have not yet been incorporated into models with global coverage. Given the significant but insufficiently characterized variability in emission with both fuel and fire characteristics, this challenges integration into fire emission inventories. To represent emitted species, fire emissions inventories generally apply emission factors (EFs) to estimates of dry matter (DM) burned. Variation among fire inventories is generally driven by differences in DM rather than EFs (Carter et al., 2020), although NMOG EFs often have greater variability amongst inventories than those for other types of species. Akagi et al. (2011) estimated both species-specific NMOC EFs and the EF for the total of identified plus unidentified NMOC mass for various ecosystems (e.g., for savannas, the fraction of NMOC emitted mass that is unidentified is ∼50 % – this number is typical across the other ecosystems). They also identify unknown NMOCs as one of the largest sources of biomass burning (BB) emissions uncertainties. The Global Fire Emissions Database version 4 with small fires (GFED4s) inventory (van der Werf et al., 2017) includes the Akagi et al. (2011) NMOG EFs. GFED4s includes six land use types (savanna, boreal forest, temperate forest, tropical forest, peat, and agriculture). The Fire Inventory from National Center for Atmospheric Research (NCAR; FINN) v1.5 also uses the Akagi et al. (2011) species-specific EFs, as well as total NMOC and total non-methane hydrocarbon (NMHC) EFs (Wiedinmyer et al., 2011). Both the Quick Fire Emissions Dataset (QFED) (Darmenov and da Silva, 2015) and Global Fire Assimilation System (GFAS) (Kaiser et al., 2012) rely mostly on an older EF compilation (Andreae and Merlet, 2001) with a few small updates.
Several recent scientific advances, including a new fire EF compilation, improved instrumentation, and fire-focused field campaigns, provide opportunities to enhance our understanding of NMOGs from fires. Andreae (2019) updated the EFs compiled by Akagi et al. (2011) and Andreae and Merlet (2001) and added 28 more chemical species, including many fire NMOGs. Recent improvements in instrumentation, especially proton-transfer-reaction time-of-flight mass spectrometry (PTR-ToF-MS) and gas chromatography (GC), enable high-resolution NMOG measurements, providing the exact molecular formulas and isomer distributions of detected NMOGs (Hatch et al., 2015; Gilman et al., 2015) and quantification of a substantial portion of the total carbon mass (Koss et al., 2018). Because OH is generally the dominant oxidant of most fire NMOGs, the inverse of the OH lifetime (or the OH reactivity, OHR) can be a useful metric to understand the reactivity of fires, in which a gap between summed observed OHR and calculated OHR based on OH lifetimes can point to unidentified NMOGs or oxidation products (Yang et al., 2016). Lab studies have shown that furans, oxygenated aromatics, and aliphatic hydrocarbons (e.g., monoterpenes) contribute substantially to both calculated and measured OHR from fires and that furans and phenolic compounds are among the most reactive (Coggon et al., 2019; Hatch et al., 2015). The contribution of fires to global OHR has not been quantified. The growing interest in the impacts of fires on tropospheric composition has motivated recent fire campaigns in regions with large and growing fire emissions.
These advances suggest that there are opportunities to improve the modeling of NMOGs from fires and their impacts. In this work, we use the GEOS-Chem chemical transport model (CTM) and recent lab and field observations to investigate and improve our simulation of fire NMOGs. We then use this model to characterize the importance of fires to atmospheric reactivity (through their contribution to total NMOG concentrations and OHR) both globally and regionally.
The GEOS-Chem model
We use GEOS-Chem (https://geos-chem.org, last access: 15 January 2021), a global CTM, to explore fire NMOGs globally and in specific large fire regions and outflow regions, such as the US, boreal Canada, the Amazon, and Africa. GEOS-Chem is driven by assimilated meteorology from the Modern-Era Retrospective analysis for Research and Applications, Version 2 (MERRA-2), from the NASA Global Modeling and Assimilation Office (GMAO). We use version 13.0.0 (https://doi.org/10.5281/zenodo.4618180; The International GEOS-Chem User Community, 2021) of GEOS-Chem with a horizontal resolution of 2∘ × 2.5∘ and 47 vertical levels with a chemical time step of 20 min and a transport time step of 10 min as recommended by Philip et al. (2016). We perform 12-month spin-up simulations prior to the time periods of interest, June–July 2008, May–June 2012, April–August 2016, January–December 2017, October 2018, and January–December 2019. We also perform nested simulations over North America at 0.5∘ × 0.625∘ (with boundary conditions from the global simulation and time steps of 10 and 5 min for chemistry and transport) for comparison against Deep Convective Clouds and Chemistry (DC3), Fire Influence on Regional to Global Environments and Air Quality (FIREX-AQ), and Arctic Research of the Composition of the Troposphere from Aircraft and Satellites (ARCTAS) observations (see Sect. 4) with chemistry and transport time steps of 10 and 5 min, respectively.
GEOS-Chem includes SO–NO–NH thermodynamics (Fountoukis and Nenes, 2007) coupled to an O3–VOC–NOx–oxidant chemical mechanism (Chan Miller et al., 2017; Mao et al., 2013; Travis et al., 2016) with integrated Cl–Br–I chemistry (Sherwen et al., 2016). We add aromatic oxidation updates (with benzene, toluene, and xylene (C8 aromatic compounds including o-, m-, p-xylenes and ethylbenzene) emissions) as per Bates et al. (2021) and ethene and ethyne chemistry updates as per Kwon et al. (2021); both were developed in GEOS-Chem but not yet implemented in the standard model. These aromatic and ethene and ethyne chemistry updates modify oxidant levels, particularly NO3, which overall decreases NMOG lifetimes. Bates et al. (2021) estimate an annual global mean increase of +22 % for NO3. In general, species not directly involved in the new chemistry are modestly impacted by these changes, while, for example, species like glyoxal and glycolaldehyde, which are important products of the ethene and ethyne chemistry, undergo large increases.
Baseline fire emissions are from GFED4s (van der Werf et al., 2017) and are specified on a daily timescale. Additional details on fire NMOG emissions are provided in Sect. 3. A sensitivity analysis, described in Sect. 4, uses FINNv1.5. Anthropogenic emissions (including fossil and biofuel sources) follow the year-specific Community Emissions Data System (CEDS) global inventory (Hoesly et al., 2018). Trash burning emissions are from Wiedinmyer et al. (2014). Aircraft emissions are from the Aviation Emissions Inventory Code (AEIC) inventory (Stettler et al., 2011; Simone et al., 2013). Biogenic emissions are calculated online from the Model of Emissions of Gases and Aerosols from Nature version 2.1 (MEGANv2.1) emissions framework (Guenther et al., 2012).
A typical source-attribution method in models zeroes out a specific source and differences that simulation from the baseline. This brute force method is ideal for linear systems, but for nonlinear chemistry, large perturbations to emissions will feed back onto the chemistry (and thus impact lifetimes). For example, zeroing out fire emissions increases OH concentrations because the OH sink has been decreased, thereby increasing the rate of oxidation of other species, such as from biogenic sources. Such a depression in isoprene concentrations, for example, may then increase or decrease ozone concentrations, depending on the chemical regime. The Hemispheric Transport of Air Pollution (HTAP) modeling experiments, which were focused on O3, address this issue with 20 % emission perturbation sensitivity studies – a number chosen to produce a discernable (larger than numerical noise) and realistic impact while minimizing nonlinearities (Huang et al., 2017). To isolate the influence of fires in our model and minimize these nonlinearities, we run emissions sensitivity simulations with 5 % more and fewer fire emissions (0.95 and 1.05 times fire emissions) and scale up the difference to equate to a 100 % perturbation. We compare these runs with the more typical noFires brute force simulation in the Supplement (see Figs. S1, S2, and S3) and show, for example, that the O3, OH, and isoprene differences are minimized with the emissions sensitivity approach (Fig. S1). We use this fire sensitivity source-attribution approach throughout this study.
To translate the concentrations of reactive compounds to calculated OHR (cOHR) at atmospheric ambient conditions, we define cOHR as the sum of the pressure- and temperature-dependent OH rate constant of a species (from the GEOS-Chem mechanism) multiplied with its concentration as follows:
where i indicates various NMOG species.
We update and expand the fire NMOGs in GEOS-Chem by updating existing EFs and then considering additional emissions and chemistry. First, we update our EFs from Akagi et al. (2011) to the newer Andreae (2019) compilation. Total NMOG emissions do not change substantially between the two inventories – in 2019, they decrease by 3.4 % from Akagi et al. (2011) to Andreae (2019). There is, however, more variation across the different species with, for example, Akagi et al. (2011) providing larger savanna EFs for glycolaldehyde (0.25 g kg−1 DM vs. 0.13 g kg−1 DM) and glyoxal, while Andreae (2019) specifies higher values for benzene (0.33 vs. 0.20 g kg DM), toluene, and xylenes (see Fig. S4 in the Supplement).
The standard GEOS-Chem model includes fire emissions of 15 NMOG species. The number of possible additional NMOGs from fires is quite large (Akagi et al., 2011). We focus on the feasibility and utility of adding fire NMOGs that Coggon et al. (2019) (building on Koss et al., 2018) identify as accounting for 95 % of fire OHR. We first identify the fire NMOGs already represented in GEOS-Chem (black circles in Fig. 1), then those additional species for which EFs are available from the recently updated compilation by Andreae (2019) in blue, and finally those species for which EFs are only available for western US fuel types as measured during the FIREX lab study (Koss et al., 2018) in red (we note that these fuel types include shrub, grasses, and temperate forests representative of the western US only). We size the symbols in Fig. 1a by their EFs for savanna (while EFs for other fuel types can vary substantially in magnitude by a factor of 2–3, they generally provide a similar relative ranking) to identify the largest NMOG emissions. We order the species in Fig. 1a by their decreasing lifetime against OH with values ranging from 1 h for sesquiterpenes to over a month for ethane. We use an assumed OH concentration of 1×10⁶ molec. cm−3; local values likely are within a factor of 5 of this value, given the simulated variability and estimated plume-averaged OH concentrations in fire plumes (Liao et al., 2021). For context, we provide the same plot by their lifetimes against two other important oxidants, O3 and NO3, in the Supplement (Fig. S5). To explore how chemical lifetimes of these fire NMOGs compare with their physical lifetime in a model grid box, we estimate the approximate lifetime of transport out of a global 2∘ × 2.5∘ grid box (∼20 h) and for a nested grid box at 0.5∘ × 0.625∘ (∼5 h) using 3 m s−1 as the surface wind speed (shown as the grey shaded region). The timescales for regional (∼7 d), continental (∼18 d), and hemispheric (∼1 year) transport may also be relevant.
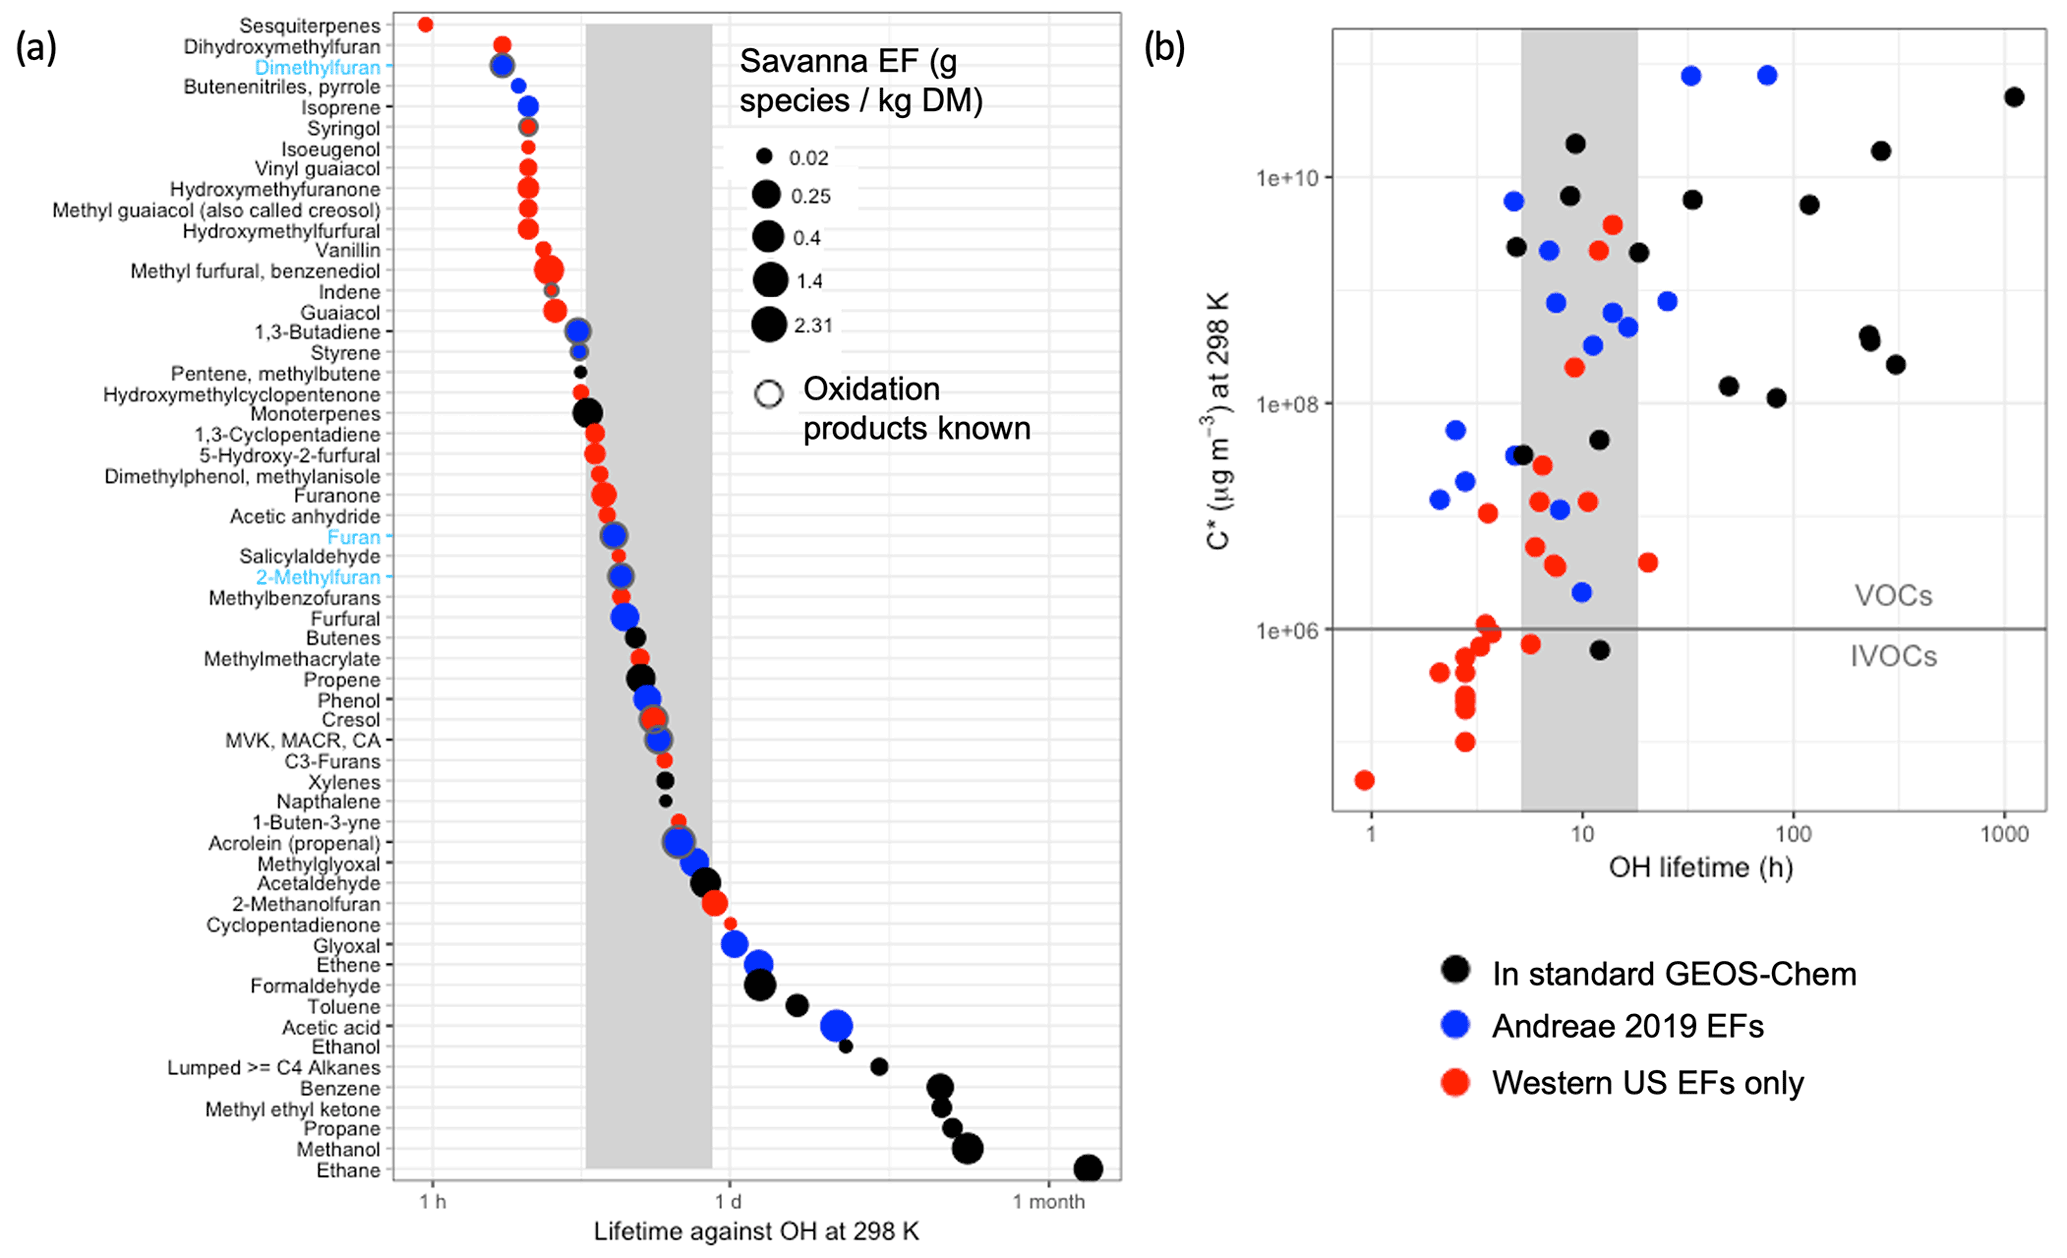
Figure 1(a) NMOGs emitted from fires, shown in descending order of chemical lifetime due to oxidation by OH (at 298 K with an assumed concentration of 1×10⁶ molec. cm−3). Only the species responsible for 95 % of OHR from fires are shown (following Coggon et al., 2019). Fire NMOGs included in the standard GEOS-Chem model are in black, species for which fire emissions are not included in the standard GEOS-Chem model but for which emissions factors are available in Andreae (2019) are in blue, and species that are only available for western US fuel types from Koss et al. (2018) are in red. The y-axis tick marks are in black for fire NMOGs added to GEOS-Chem in this study and in blue (with blue labels) when both the fire NMOG and its oxidation chemistry were added. The points are sized by their relative savanna and grassland (labeled “savanna”) emission factor in gram species per kilogram DM burned. The grey vertical box represents an approximate physical lifetime against transport out of a nested 0.5∘ × 0.625∘ grid box (∼5 h) and a 2∘ × 2.5∘ grid box (∼20 h). CA stands for crotonaldehyde. (b) Plot of volatility (C*) against OH lifetime for the species shown in (a) using the same color conventions. The horizontal line separates VOCs from IVOCs based on their C*.
In Fig. 1 most species with chemical lifetimes that exceed the transport timescale out of a model grid box are already included in the model. Using Andreae's (2019) EFs, we add fire emissions of eight species already included in the model for which fire emissions were previously neglected: phenol, methyl vinyl ketone (MVK), ethene, isoprene, acetic acid, methylglyoxal, glyoxal, and lumped aldehydes with three or more carbon atoms (RCHO), which does not include furfural. See Table S1 for the definitions of chemical species used here. We also add fire emissions of 1,3-butadiene to the tracer representing alkenes with three carbons or more (PRPE). Furans from fires are important for atmospheric reactivity (Koss et al., 2018; Coggon et al., 2019). We add a new lumped furan tracer, called FURA, that combines the pyrogenic emissions of furan, 2-methylfuran, and 2,5-dimethylfuran and uses the OH rate constant of furan ( (furan and 2-methylfuran dominate emissions and have very similar lifetimes against OH). In the model, the oxidation of FURA with OH produces butenedial following Bierbach et al. (1995), who show that furan forms butenedial with an estimated carbon balance of 100 % C. Thus, we add fire emissions for almost all the species for which we have Andreae's (2019) EFs (12 species) to GEOS-Chem. For 2019, these added global fire emissions (19.6 Tg C) are roughly equivalent to the fire NMOG emissions already in the model (21.8 Tg C). The only species with Andreae (2019) EFs that we do not add to GEOS-Chem are (1) butenenitriles, which have a very small EF and a short lifetime against OH, (2) styrene, which also has a chemical lifetime less than the grid box physical transport time, and (3) furfural. There is a wide spectrum of less-abundant furans (+ furfural) (Zhao and Wang, 2017) that contributes to furan reactivity; therefore, the representation in this model constitutes a lower bound on furan contributions to total reactivity. We do not include species for which EFs are only available for western US fuel types from Koss et al. (2018). Figure 1a suggests that nearly all these species are very reactive and short-lived as evidenced by the red circles being within or below the physical transport time of the grid box.
Figure 1b shows the volatility of these same NMOG species. The species for which we have global EFs available are almost entirely very volatile and above a commonly held cutoff threshold for intermediate volatility compounds (IVOCs) vs. VOCs (C* µg m−3; Ahern et al., 2019, and references therein). This suggests that both the standard model and our expanded treatment of NMOGs neglect many NMOG precursors for secondary organic aerosol. This study focuses on the OHR of NMOG from fires; further work is needed to constrain the EFs (Fig. 1b suggests that global EFs are not available for most IVOCs) and oxidation chemistry of NMOG species relevant to secondary organic aerosol (SOA) formation from fires.
Species whose chemical lifetimes are shorter than the physical transport lifetimes (Fig. 1a) contribute strongly to near-field reactivity but are likely not exported from the grid box of emission. For these species, oxidation rapidly converts emitted species into secondary products, and it is these products that are exported away from the fire source. However, a detailed knowledge of the oxidative chemistry of many of these species is lacking (as evidenced by the small number of black-circled species, indicating “oxidation products known” in Fig. 1a). In particular, we note that we do not include several very reactive species (e.g., furfurals, guaiacol) (Coggon et al., 2019). A lumped highly reactive VOC may provide a means of describing this near-field reactivity in the model (though the oxidation products and their reactivity would be poorly described by such an approach). However, given that EFs for these highly reactive species are not globally characterized, there is currently no meaningful way to estimate the emissions of such a lumped VOC. Hence our model represents a lower limit of reactivity from fires despite our inclusion of longer-lived NMOG.
To illustrate the amount of carbon mass and reactivity represented in our current model and the potential shortfall in NMOG emissions, we use the EFs from Fig. 1 as proxies for emissions. We are unable to perform a global NMOG carbon accounting given that many EFs (shown in red in Fig. 1) are only available for a subset of ecosystems (here primarily the western US fuels that map most closely to savanna and temperate forest). We calculate the total carbon mass based on the sum of the savanna and temperate forest EFs in Fig. 1, and we compare that number to the sum of the savanna and temperate forest EFs for different subsets (standard GEOS-Chem and updated GEOS-Chem) of species included in Fig. 1. We note that here and throughout the article NMOG percentage values refer to percentage by carbon mass. We find that the standard GEOS-Chem model represents 49 % of the total carbon mass emissions potential of NMOGs suggested in Fig. 1. Our additions to the model increase this to 72 %. We then multiply these EFs by the rate constants with OH at 298 K to represent a proxy for reactivity. From this, we calculate that the standard model includes 28 % of the potential emitted reactivity of savanna and temperate forest fuel type emissions; our model updates add an additional 21 % (for a total of 49 % of the potential reactivity). This suggests that the sum of these fast-reacting species, for which global EFs are not defined and which we therefore do not include in our model, contributes over half of the emitted reactivity from fires from savanna and temperate forests. We note that these fractions are relative to speciated NMOGs identified in Coggon et al. (2019); unspeciated or unidentified NMOGs (which Coggon et al., 2019, estimate contributes ∼25 % of calculated primary OH reactivity) would increase our model shortfall.
We use the Andreae (2019) EFs applied to the GFED4s DM and the chemistry updates noted here for the rest of this analysis unless specifically noted.
There are limited observational constraints on fire-influenced NMOGs and OHR. We use observations of OHR made at the Amazon Tall Tower Observatory (ATTO) and of VOCs from the FIREX-AQ and ARCTAS campaigns in addition to measurements of both VOCs and OHR from the DC3 campaign. Previous work has shown that the plume-chasing sampling strategy of the WE-CAN 2018 field campaign limits the suitability of this dataset for 3D model evaluation (Carter et al., 2021). While the Korea–United States Air Quality (KORUS-AQ) campaign included airborne OHR measurements and some fire influence (median concentration of acetonitrile, a biomass burning tracer (Lobert et al., 1990), of ∼165 ppt, parts per trillion; Fig. S6), the campaign is dominated by anthropogenic sources, which recent work shows may confound the acetonitrile signal (Huangfu et al., 2021); and therefore we do not include this campaign in our analysis. We explore observations of OHR taken during Atmospheric Tomography Mission 1 (ATom-1) off the coast of western Africa, during which Strode et al. (2018) identified the fire influence. However, the aircraft sampled air masses more than 3000 km away from the continental fire source. As a result, most short-lived NMOGs had reacted away, and the modeled cOHR is low and dominated by CO (Fig. S7). Thus, ATom-1 is not a good constraint on fire cOHR and the impact of NMOGs. There are no other airborne campaigns that we are aware of that have deployed OHR instrumentation in fire-influenced environments.
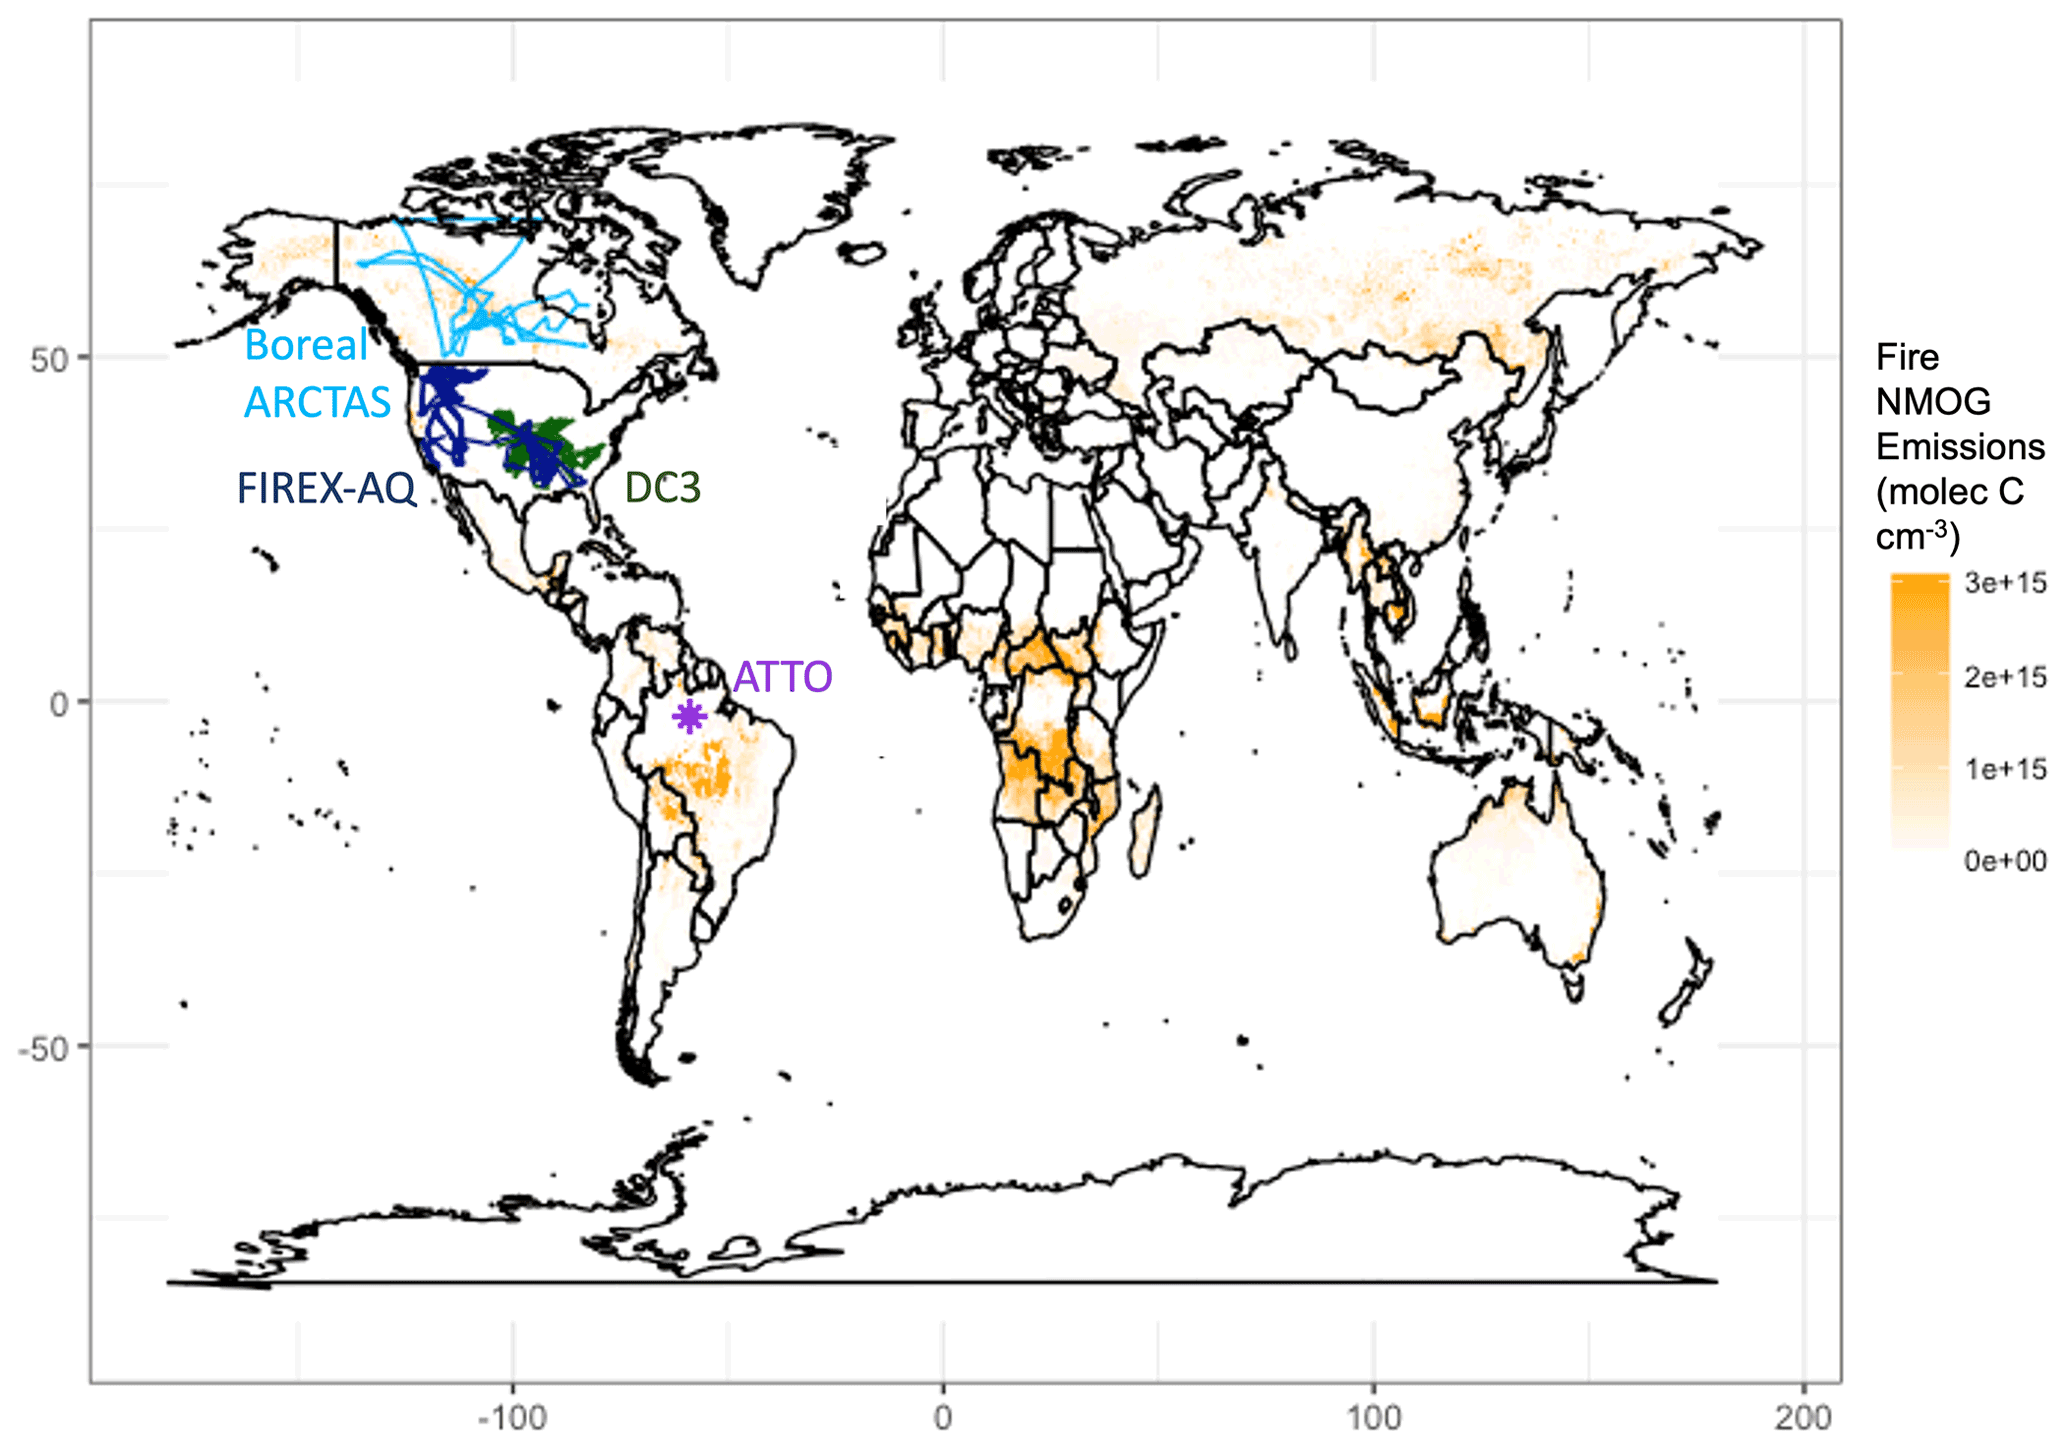
Figure 2Measurement locations of campaigns used in this analysis overlaid on annual mean NMOG emissions from fires across 1997–2019 from GFED4s. Boreal ARCTAS is in light blue, FIREX-AQ in dark blue, DC3 in dark green, and ATTO in purple.
We use observations from campaigns that sampled fire-influenced air masses in different regions around the world (Fig. 2). For tower and aircraft campaigns, the model is sampled to the nearest grid box of the measurements both temporally and spatially using the entire 1 min merge of observational data. We then average both the model and the observations to the model grid box.
To evaluate our simulation of NMOGs in the US, we explore observations from the NASA DC-8 during the FIREX-AQ campaign, which was deployed in the western and eastern US from 15 July through 5 September 2019 with a large suite of NMOG instrumentation aboard. The campaign investigated the chemistry and transport of smoke from both wildfires and prescribed burns in the western and eastern US with flights originating from both Boise, ID, and Salina, KS. CO was measured using a modified commercial off-axis ICOS instrument (Los Gatos Research (LGR) N2O/CO-30-EP; Baer et al., 2002) at ∼4.6 µm. Precision was estimated to be 0.4 ppb, and uncertainty for the dry air mole fraction of CO for mixing ratios below 1 ppm was ± (2.0 ppb + 2 %). More details are available from Bourgeois et al. (2022). MVK, furan, 2-methylfuran, and 2,5-dimethylfuran were measured using the NCAR trace organic gas analyzer with a time-of-flight MS (TOGA-ToF) (Apel et al., 2015; Wang et al., 2021). The TOGA-ToF measurements are reported with a detection limit of 0.5 ppt and an uncertainty (accuracy and precision) of 20 %. Phenol was measured using the NOAA PTR time-of-flight MS (PTR-ToF-MS) with an accuracy of 25 % (Müller et al., 2014; de Gouw and Warneke, 2007) and by the California Institute of Technology chemical ionization mass spectrometer (CIT-CIMS) with an accuracy of 30 % (Xu et al., 2021). During the western part of the campaign, the phenol measurements by PTR were affected by a contamination issue above 8 km, so those data have been removed. Generally, the model captures the differing fire influence in the eastern and the western US. For example, in the eastern US, the model captures vertical profiles of CO well (Fig. 3), while in the western US, the model matches the general shape but underestimates the magnitude of the observations and likely the influence of more sporadic fires in the region. Recent papers have also shown that GEOS-Chem struggles to fully capture large wildfires in the western US (e.g., Carter et al., 2021; O'Dell et al., 2019; Zhang et al., 2014) in part because the DM estimates may be underestimated (Carter et al., 2020) and because GEOS-Chem and other air quality models with a fairly coarse resolution have trouble resolving sub-grid processes (Eastham and Jacob, 2017; Rastigejev et al., 2010), including those involved in fire plumes (Wang et al., 2021; Stockwell et al., 2022).
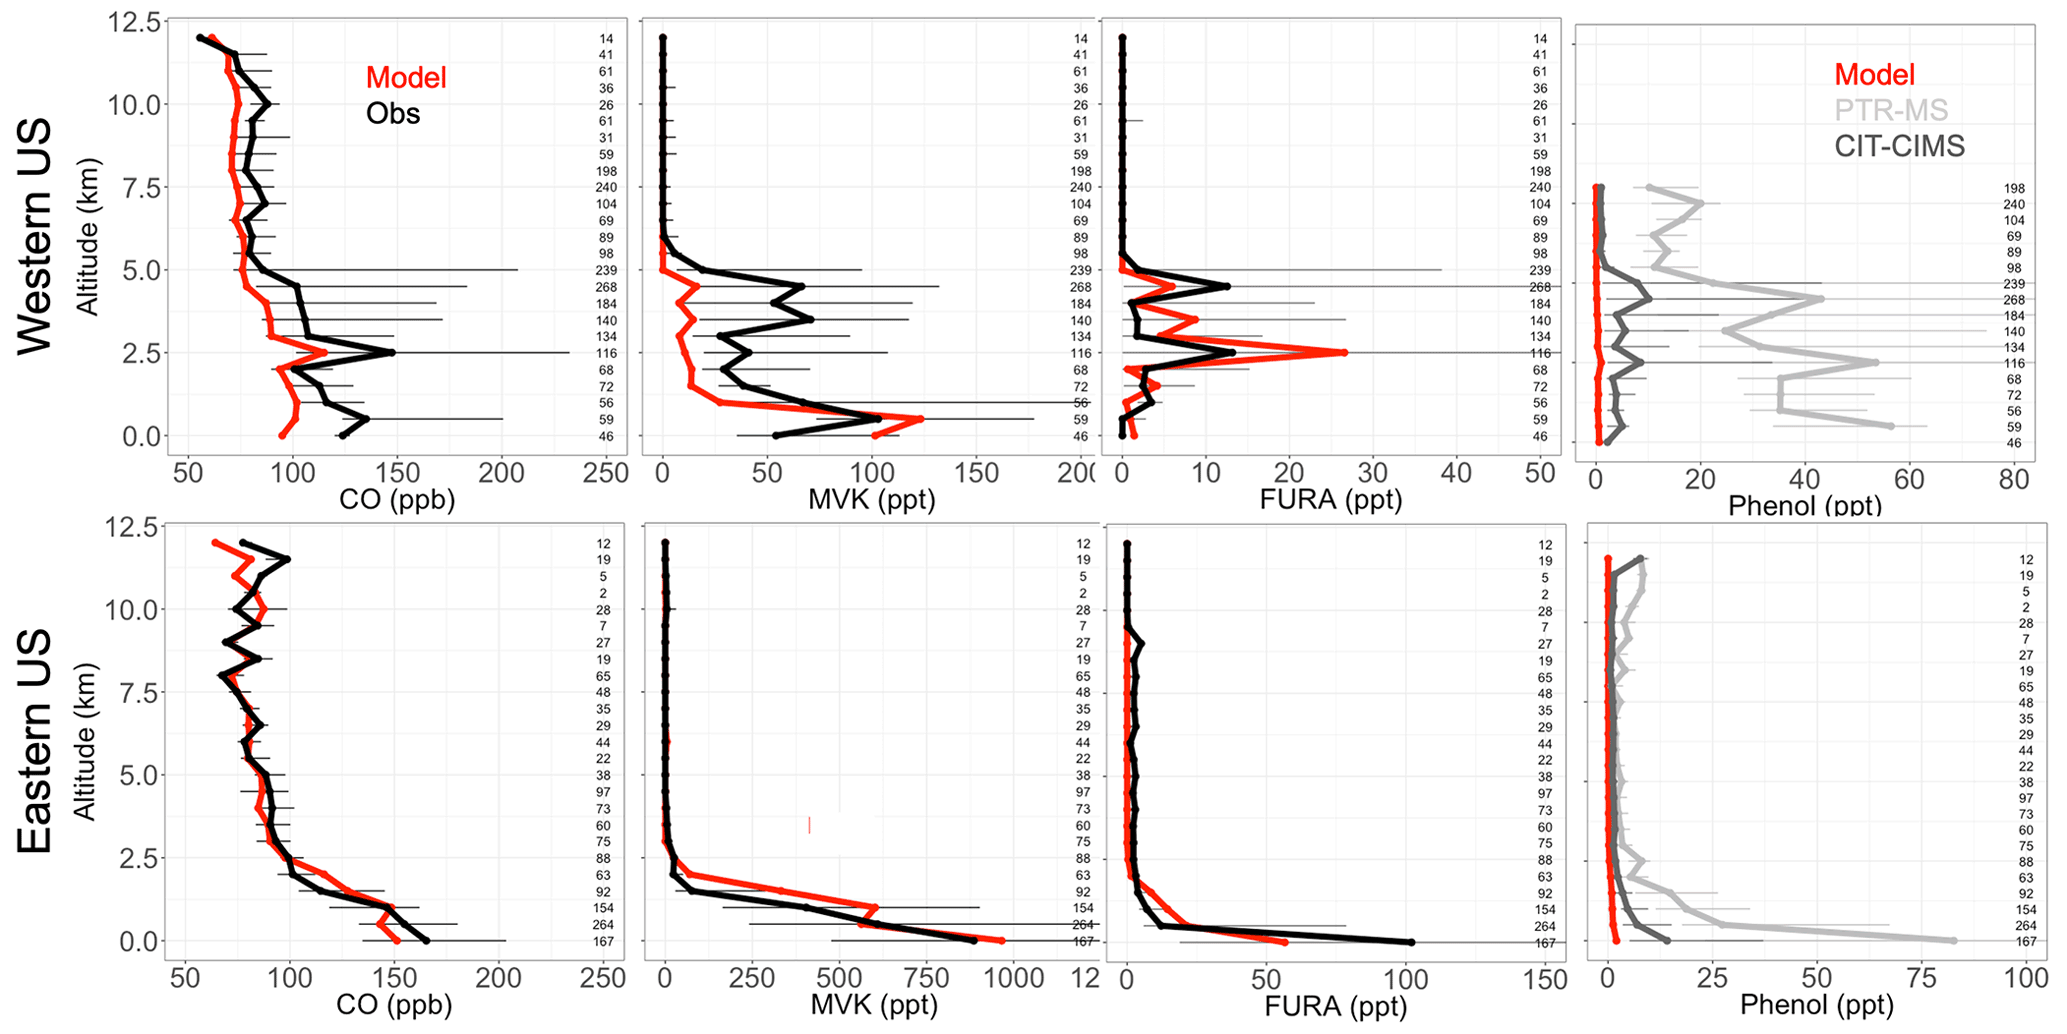
Figure 3Binned observed (black) and simulated (red) median vertical profiles of CO, MVK, lumped furan species (FURA = furan + 2-methylfuran + 2,5-dimethylfuran), and phenol concentrations from the FIREX-AQ campaign. For phenol, observations using the PTR-MS are in light grey and those from the CIT-CIMS in dark grey. Horizontal bars show the 25th–75th percentile range of measurements in each vertical 0.5 km bin. The number of observations in each bin is shown on the right side of each panel.
The FIREX-AQ measurements can also be used to evaluate some of our model updates. Figure 3 shows that MVK, an example NMOG for which we added fire emissions in the model, follows a similar model performance to CO. We note that more than 80 % of simulated MVK during FIREX-AQ comes from fires. The FIREX-AQ summed observations of the same three furan species suggest that our new lumped “furan” (FURA) tracer with only fire sources performs well in the eastern and western US (Fig. 4). This suggests that the furan EFs for US fires like those sampled are accurately captured in the Andreae (2019) compilation, although they may also be overestimated and are thus compensating for an underestimate in the DM burned in GFED4s. Figure 3 shows that our addition of fire emissions of phenol still underestimates observed concentrations across all altitudes in the western US and at the surface in the eastern US. Phenol observations from the CIT-CIMS (dark grey) are a factor of 3 lower than those from the PTR-MS (light grey). The model underestimates the lower phenol concentration (CIT-CIMS) by a factor of 8 in the eastern US and 15 in the western US. Given that both instruments were calibrated for phenol, the difference between two measurements is not yet accounted for. The measurements of phenol and other less-studied compounds have substantial uncertainties as indicated by these instrument differences, and more work is needed to understand these uncertainties. However, Taraborrelli et al. (2021) suggest that anthropogenic and fire sources contribute roughly equally to phenol emissions at the global scale. Therefore, both higher phenol emission factors from fires and emissions from anthropogenic sources in the US are likely needed to help resolve the discrepancy seen in Fig. 3.
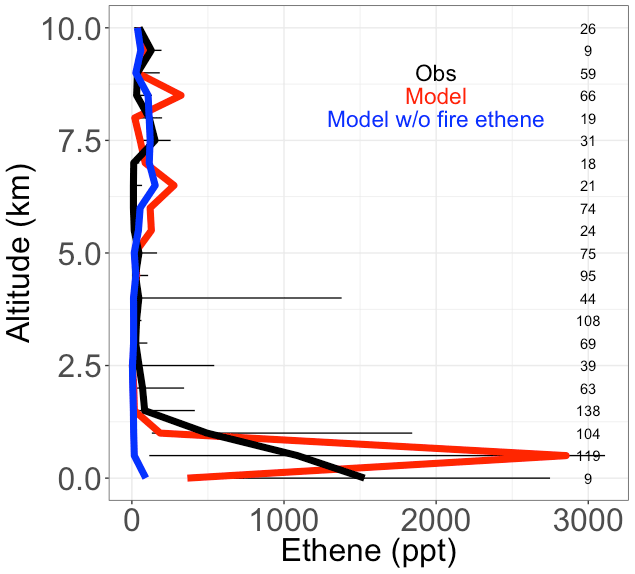
Figure 4Median vertical profiles of binned ethene mixing ratios, including observed (black), simulated (red), and simulated in a sensitivity model run without fire ethene emissions (blue) during the boreal part of the ARCTAS campaign. Horizontal bars show the 25th–75th percentile range of measurements in each vertical 0.5 km bin. The number of observations in each vertical bin is shown on the right side of each panel.
In this study, we add fire emissions of ethene to the model, which may be important in certain regions. We turn to the boreal component of the ARCTAS campaign to test the fidelity of this addition because the boreal EFs for ethene are high (1.54 g kg−1 DM, compared to 0.83 g kg−1 DM for savanna), and there is less anthropogenic influence in the boreal regions to confound a fire-focused model evaluation. The ARCTAS campaign sampled the Arctic region with an emphasis on forest fire smoke plumes using the NASA DC-8 aircraft from 18 June to 13 July 2008 (Jacob et al., 2010). We use observations of ethene from the UC Irvine whole air sampler (WAS). This measurement has a limit of detection of 3 ppt, 3 % precision, and 5 % accuracy. See Simpson et al. (2011) and Colman et al. (2001) for more details. We show that the model (in red), filtered to remove the least fire-influenced points, captures the observed vertical profile of ethene concentrations well, including the large enhancement at the surface (Fig. 4). This is an improvement over a simulation without fire emissions of ethene (shown in blue), which shows negligible ethene throughout the vertical profile.
Figure 5 compares OHR measurements made at the ATTO site during the fire seasons in October 2018 and September 2019 (Pfannerstill et al., 2021) with the updated GEOS-Chem model simulation. ATTO is situated ∼150 km northeast of Manaus, Brazil. We use total OHR measurements taken at 80, 150, and 320 m on the tower during two intensive observation periods in October 2018 and September 2019 using the comparative reactivity method (CRM; Sinha et al., 2008), which is described in more detail by Pfannerstill et al. (2021). We confirm that simulated OHR is mostly driven by isoprene during this campaign, as Pfannerstill et al. (2021) show for the observations, and find that the model (in red; median = 21.5 s−1) captures the overall observed (in black; median = 22.4 s−1) cOHR (Fig. 5a). Pfannerstill et al. (2021) assessed that fires contribute 17 % of their OHR measurements (shown in black in Fig. 5b). Our updated simulation with the Andreae (2019) EFs and new chemistry (red in Fig. 5b) underestimates this fire contribution by a factor of ∼5. Reddington et al. (2016, 2019) suggested that the FINN1 and FINN1.5 and GFED3 and GFED4s fire inventories underestimate fire emissions by a factor of 2–3 in parts of the Amazon, with FINN emissions generally less biased than GFED. Following their analysis, we perform a sensitivity simulation for which we use FINN1.5 instead for fire emissions and scale up the emissions to match what was used in the Reddington et al. (2016, 2019) studies. This simulation (purple) greatly improves model–observation agreement with a mean fire cOHR contribution of 17 % (Fig. 5b) while leading to a slight overestimate of observed total cOHR. Excluding our additions to the NMOG model description (purple and white hatching) does not substantially degrade the agreement with observed OHR from fires, suggesting that underlying biomass burned may be a more important uncertainty in fire NMOG OHR than missing reactive species in this region. Because the ATTO site is downwind of fires (one estimate for a different fire season suggested smoke was ∼2–3 d old when it was measured; Pöhlker et al., 2018), it is also possible that fast-reacting species are no longer present in the air sampled at ATTO.
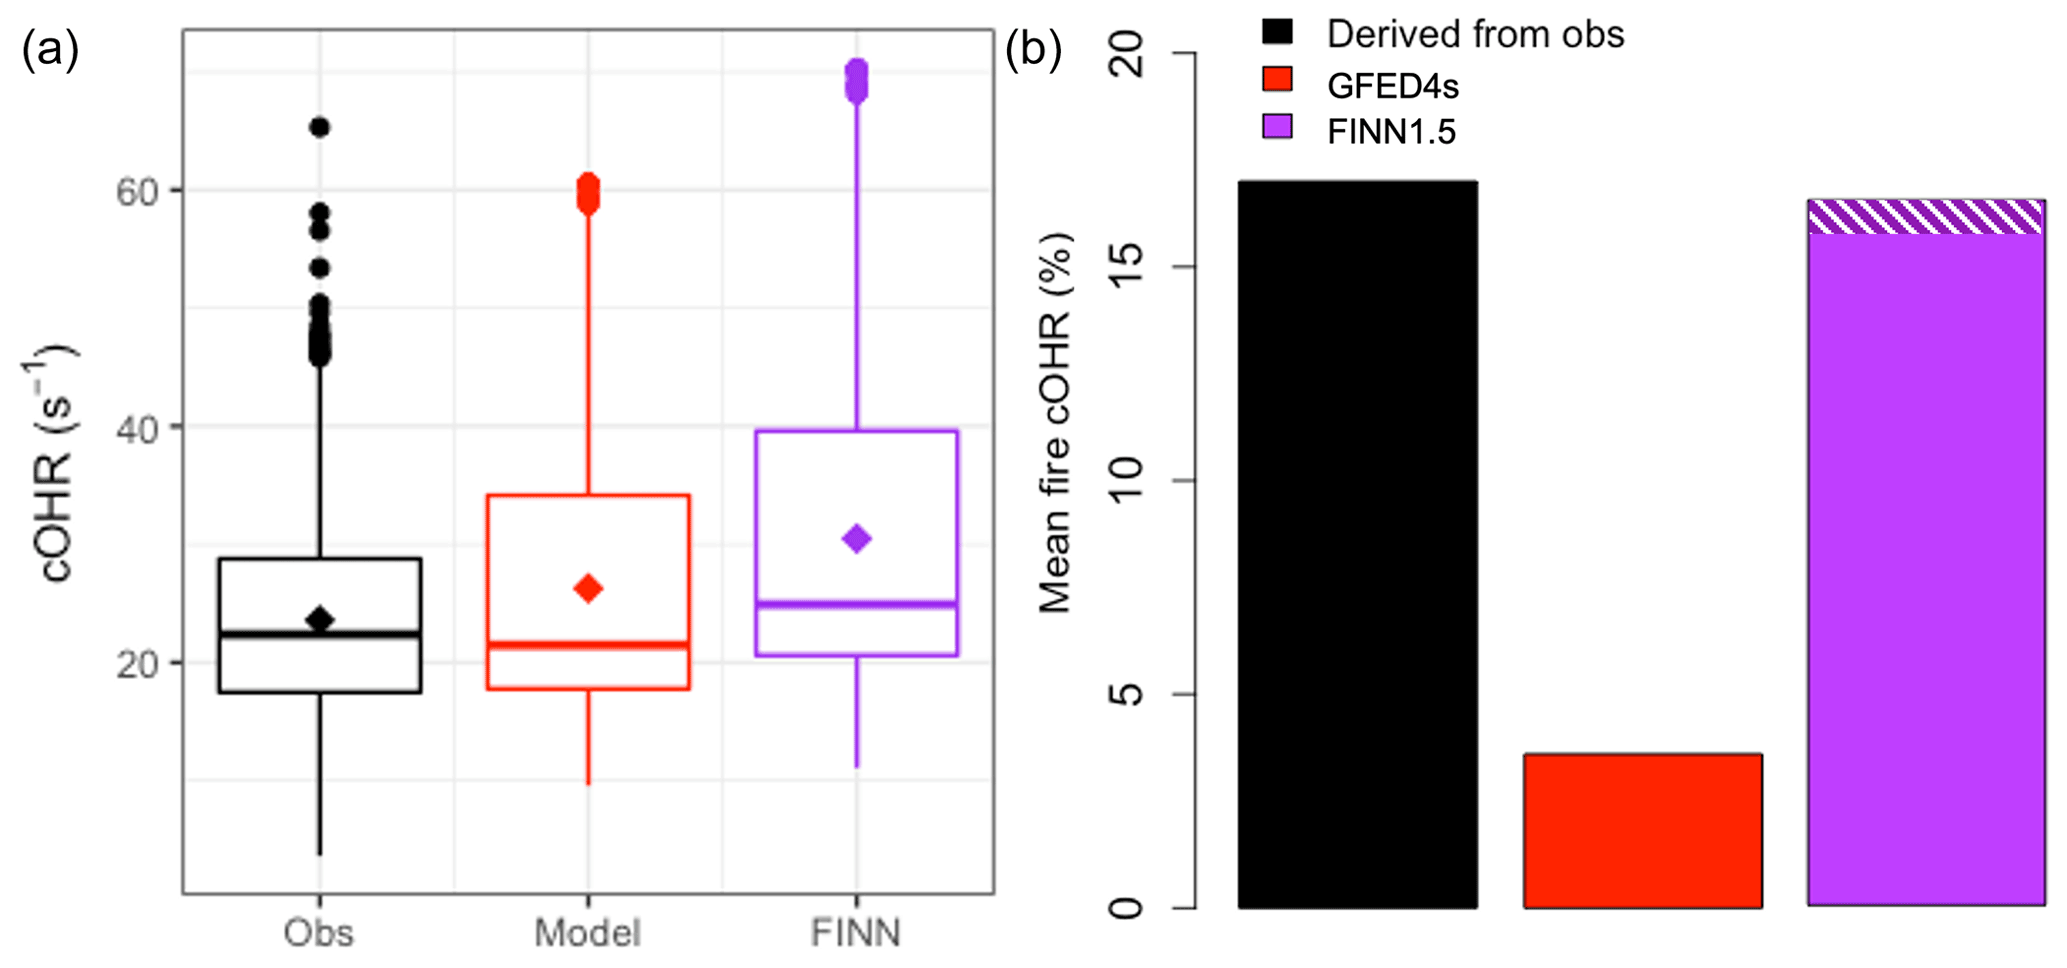
Figure 5(a) Boxplots of cOHR during the October 2018 and September 2019 measurement periods at ATTO with observations in black and the model in red with medians shown as a horizontal line and means as diamonds. (b) The mean percentage contribution from fires during the same time period to cOHR with that derived from observations in black, the model with GFED4s in red, and a simulation using scaled-up FINN1.5 in purple. The white hatching on the FINN1.5 simulation indicates the increase in percentage contribution due to new EFs and chemistry.
We also compare observations of NMOGs and OHR during the DC3 campaign, which sampled in the southeastern and south central US in 18 May–22 June 2012 (Barth et al., 2015). Acetonitrile was measured using a PTR-MS (Hansel et al., 1995; Wisthaler et al., 2002). The OHR measurement is described in detail in Brune et al. (2018) and Mao et al. (2009) with a limit of detection for 20 s measurements estimated to be ∼0.6 s−1. This campaign was influenced by numerous sources, including fires. Here we explore how well GEOS-Chem captures observed OHR as a function of fire influence. Figure 6 shows the model skill in reproducing OHR (model minus observations) against CO and acetonitrile. We find that model skill degrades generally monotonically with increasing acetonitrile and CO concentrations. No similar trend is observed with anthropogenic tracers such as benzene, suggesting that the model underestimates fire sources of reactivity. This confirms that we are likely missing emitted fire NMOGs and/or secondary products during this campaign beyond what is currently represented in the model, as suggested in Sect. 3. Thus, while previous comparisons shown in Sect. 4 indicate that the additions we have made to the model have improved our simulation of fire NMOGs, Fig. 6 confirms further work is needed to fully capture the impact of fires on OH reactivity.

Figure 6Boxplots of the model minus observed OHR or OHR difference during the DC3 campaign against binned CO (a) and acetonitrile (b) observations. The number of observations in each bin is shown at the bottom of the panel.
The first estimates of global simulated cOHR highlight the strong gradients in reactivity from source regions to background (Safieddine et al., 2017; Lelieveld et al., 2016). To date, there has been no effort to attribute simulated cOHR to sources. Here we use the source-attribution approach described in Sect. 2.1 to assess the contribution of fire emissions to global NMOGs and cOHR. We note that, given the discussion of Sect. 3, this global simulation should be taken as a lower limit for fire NMOGs and cOHR, particularly in fire source regions.
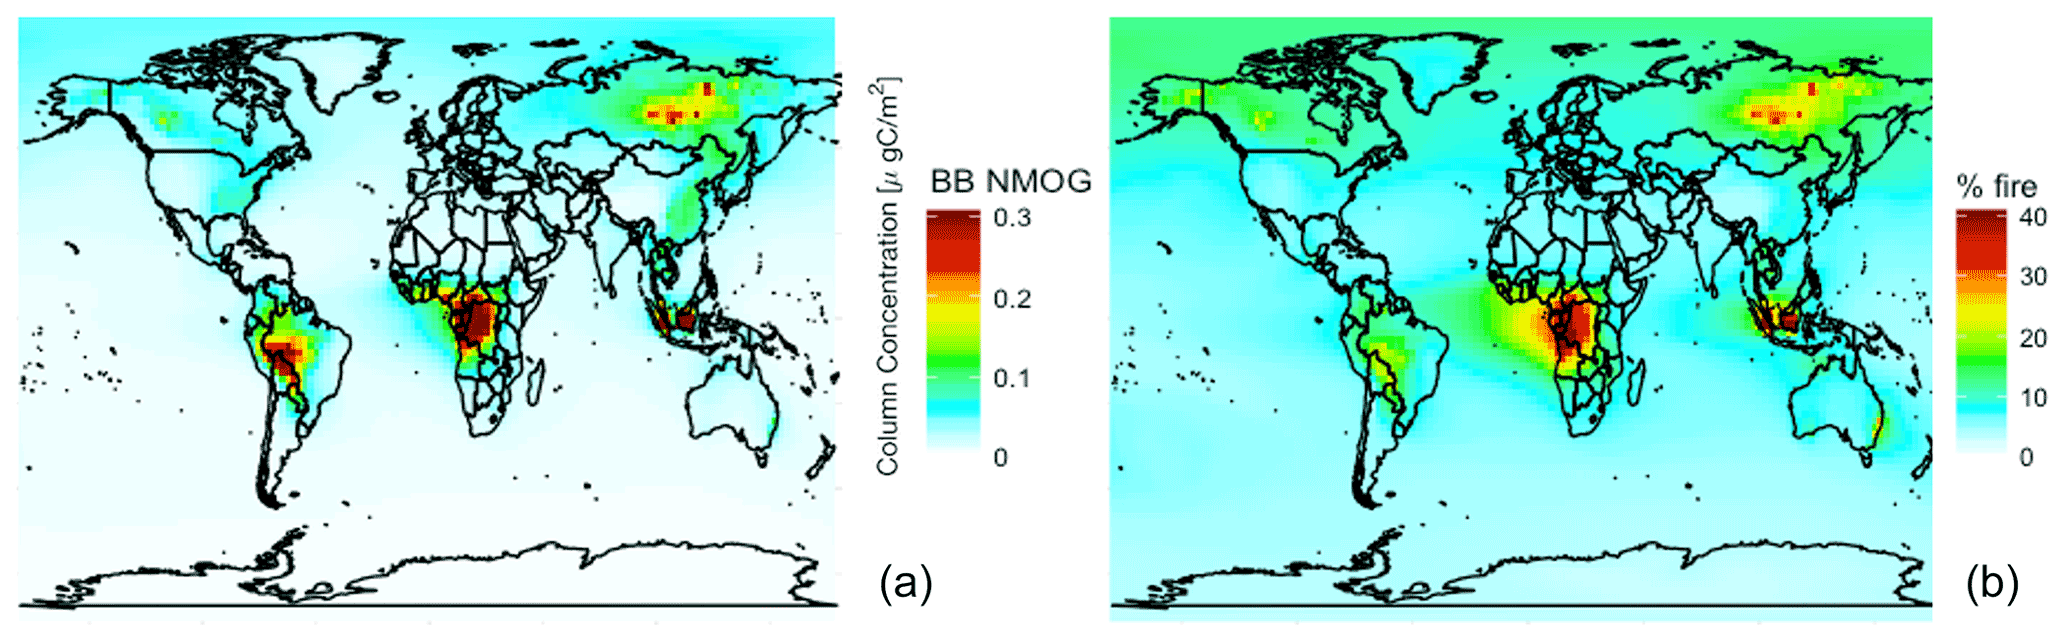
Figure 72019 annual mean simulated (a) NMOG total column concentrations from fires and (b) percent contribution of NMOG total column concentrations from fires.
Figure 7 shows simulated annual mean 2019 NMOG total column concentrations and percent contribution from fires. Fires exceed 40 % of NMOG annually, not just in the fire seasons, in several fire source regions (e.g., Siberia, central Africa, and Southeast Asia) with elevated levels (∼25 %) across large parts of the Northern Hemisphere downwind of sources. Fires also contribute more than 5 % of NMOGs nearly everywhere globally, including the remote ocean, driven by RCHO, acetaldehyde, ethene, propene, and dimethyl sulfide (DMS).
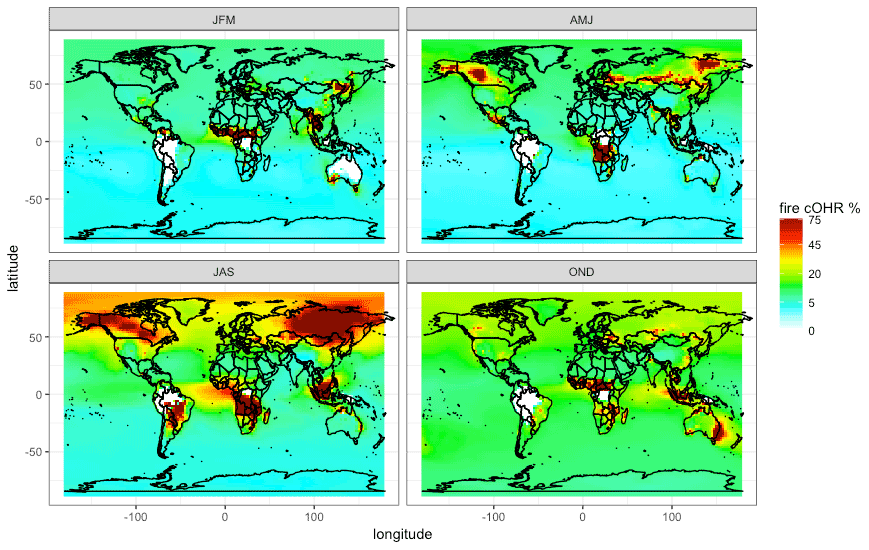
Figure 8The percent of surface cOHR seasonally from fires in 2019 from the updated GEOS-Chem simulation (see Sect. 3) using GFED4s DM with Andreae (2019) emission factors. JFM is January, February, and March; AMJ is April, May, and June; JAS is July, August, and September; and OND is October, November, and December.
Figure 8 shows that the contribution of fires to seasonal surface cOHR in 2019 is substantial, exceeding 75 % in large fire source regions. The large fire contribution in July, August, and September (JAS) and, to a lesser extent, in other seasons contributes to cOHR beyond the immediate fire emission region. We note that these values are year dependent, and, for example, 2019 was a low fire year in the western US where we might expect a larger fire contribution in other years (see Fig. 12 for more discussion on interannual variability). Longer-lived fire species (particularly CO) contribute 10 %–25 % of the background cOHR, peaking in October, November, and December (OND). Globally in 2019, the annual average simulated fraction of surface reactivity from fires is 15 %. The relative export of OH reactivity from a fire source region is expected to vary with the mix of emissions (i.e., chemical reactivity) and the oxidative environment. This can be explored in fire-dominated regions with strong zonal winds, which produce a clear fire plume. Figure S8 suggests that the cOHR from fires decays more slowly in plumes from boreal source regions (Canada and Siberia) compared to the tropics (Central Africa), likely reflecting differences in the oxidative loss. Further exploration within a Lagrangian framework may provide more insight into the evolution of OHR downwind of fires.
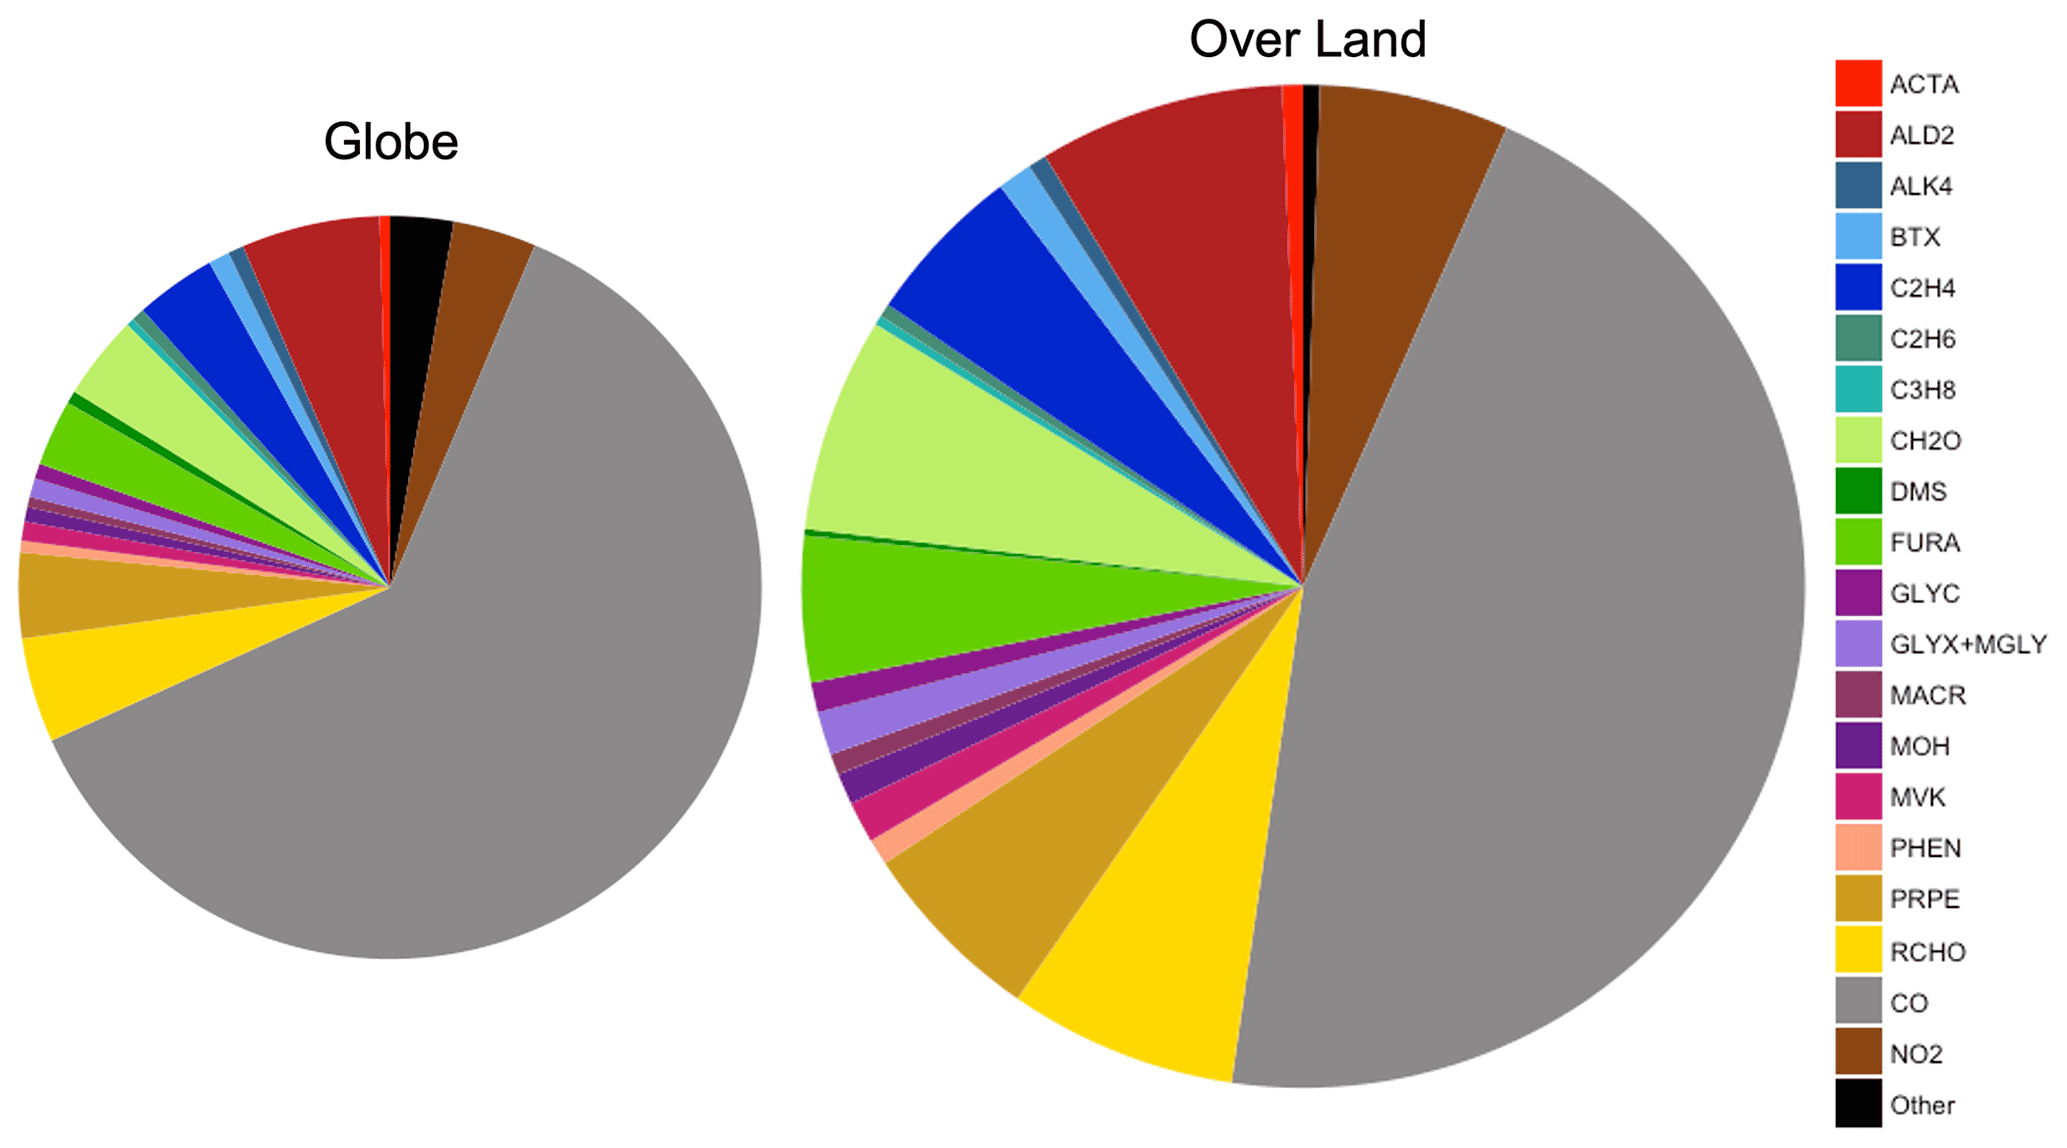
Figure 9Average global annual mean contribution of chemical species and species groups to simulated surface fire cOHR in 2019 using GFED4s DM for the entire globe and over land only. The two pie charts are approximately sized by their relative fire cOHR (0.16 s−1 globally and 0.29 s−1 over land). BTX is benzene, toluene, and xylenes. Other (n=56) includes species whose annual mean fire cOHR is equal to or less than 0.0004, which includes ozone.
Figure 9 shows that NMOGs make up 48 % of the annual mean surface fire cOHR over land (and 33 % over the whole globe), with CO and NO2 providing the bulk of the remaining cOHR. Of the non-CO annual mean surface fire cOHR, NMOGs make up roughly 90 % (colors in Fig. 9). Particularly important NMOG contributors to fire reactivity include acetaldehyde (ALD2 in dark red; 15 % of non-CO fire cOHR), formaldehyde (CH2O in light green; 13 % of non-CO fire cOHR), and fire emissions of several NMOG species added in this work – lumped furan (FURA in lime green; 9 % of non-CO fire cOHR), ethene (C2H4 in royal blue; 10 % of non-CO fire cOHR), propene and higher-carbon alkenes (PRPE in tan; 11 % of non-CO fire cOHR), and lumped aldehydes with three or more carbon atoms (RCHO in yellow; 14 % of non-CO fire cOHR).
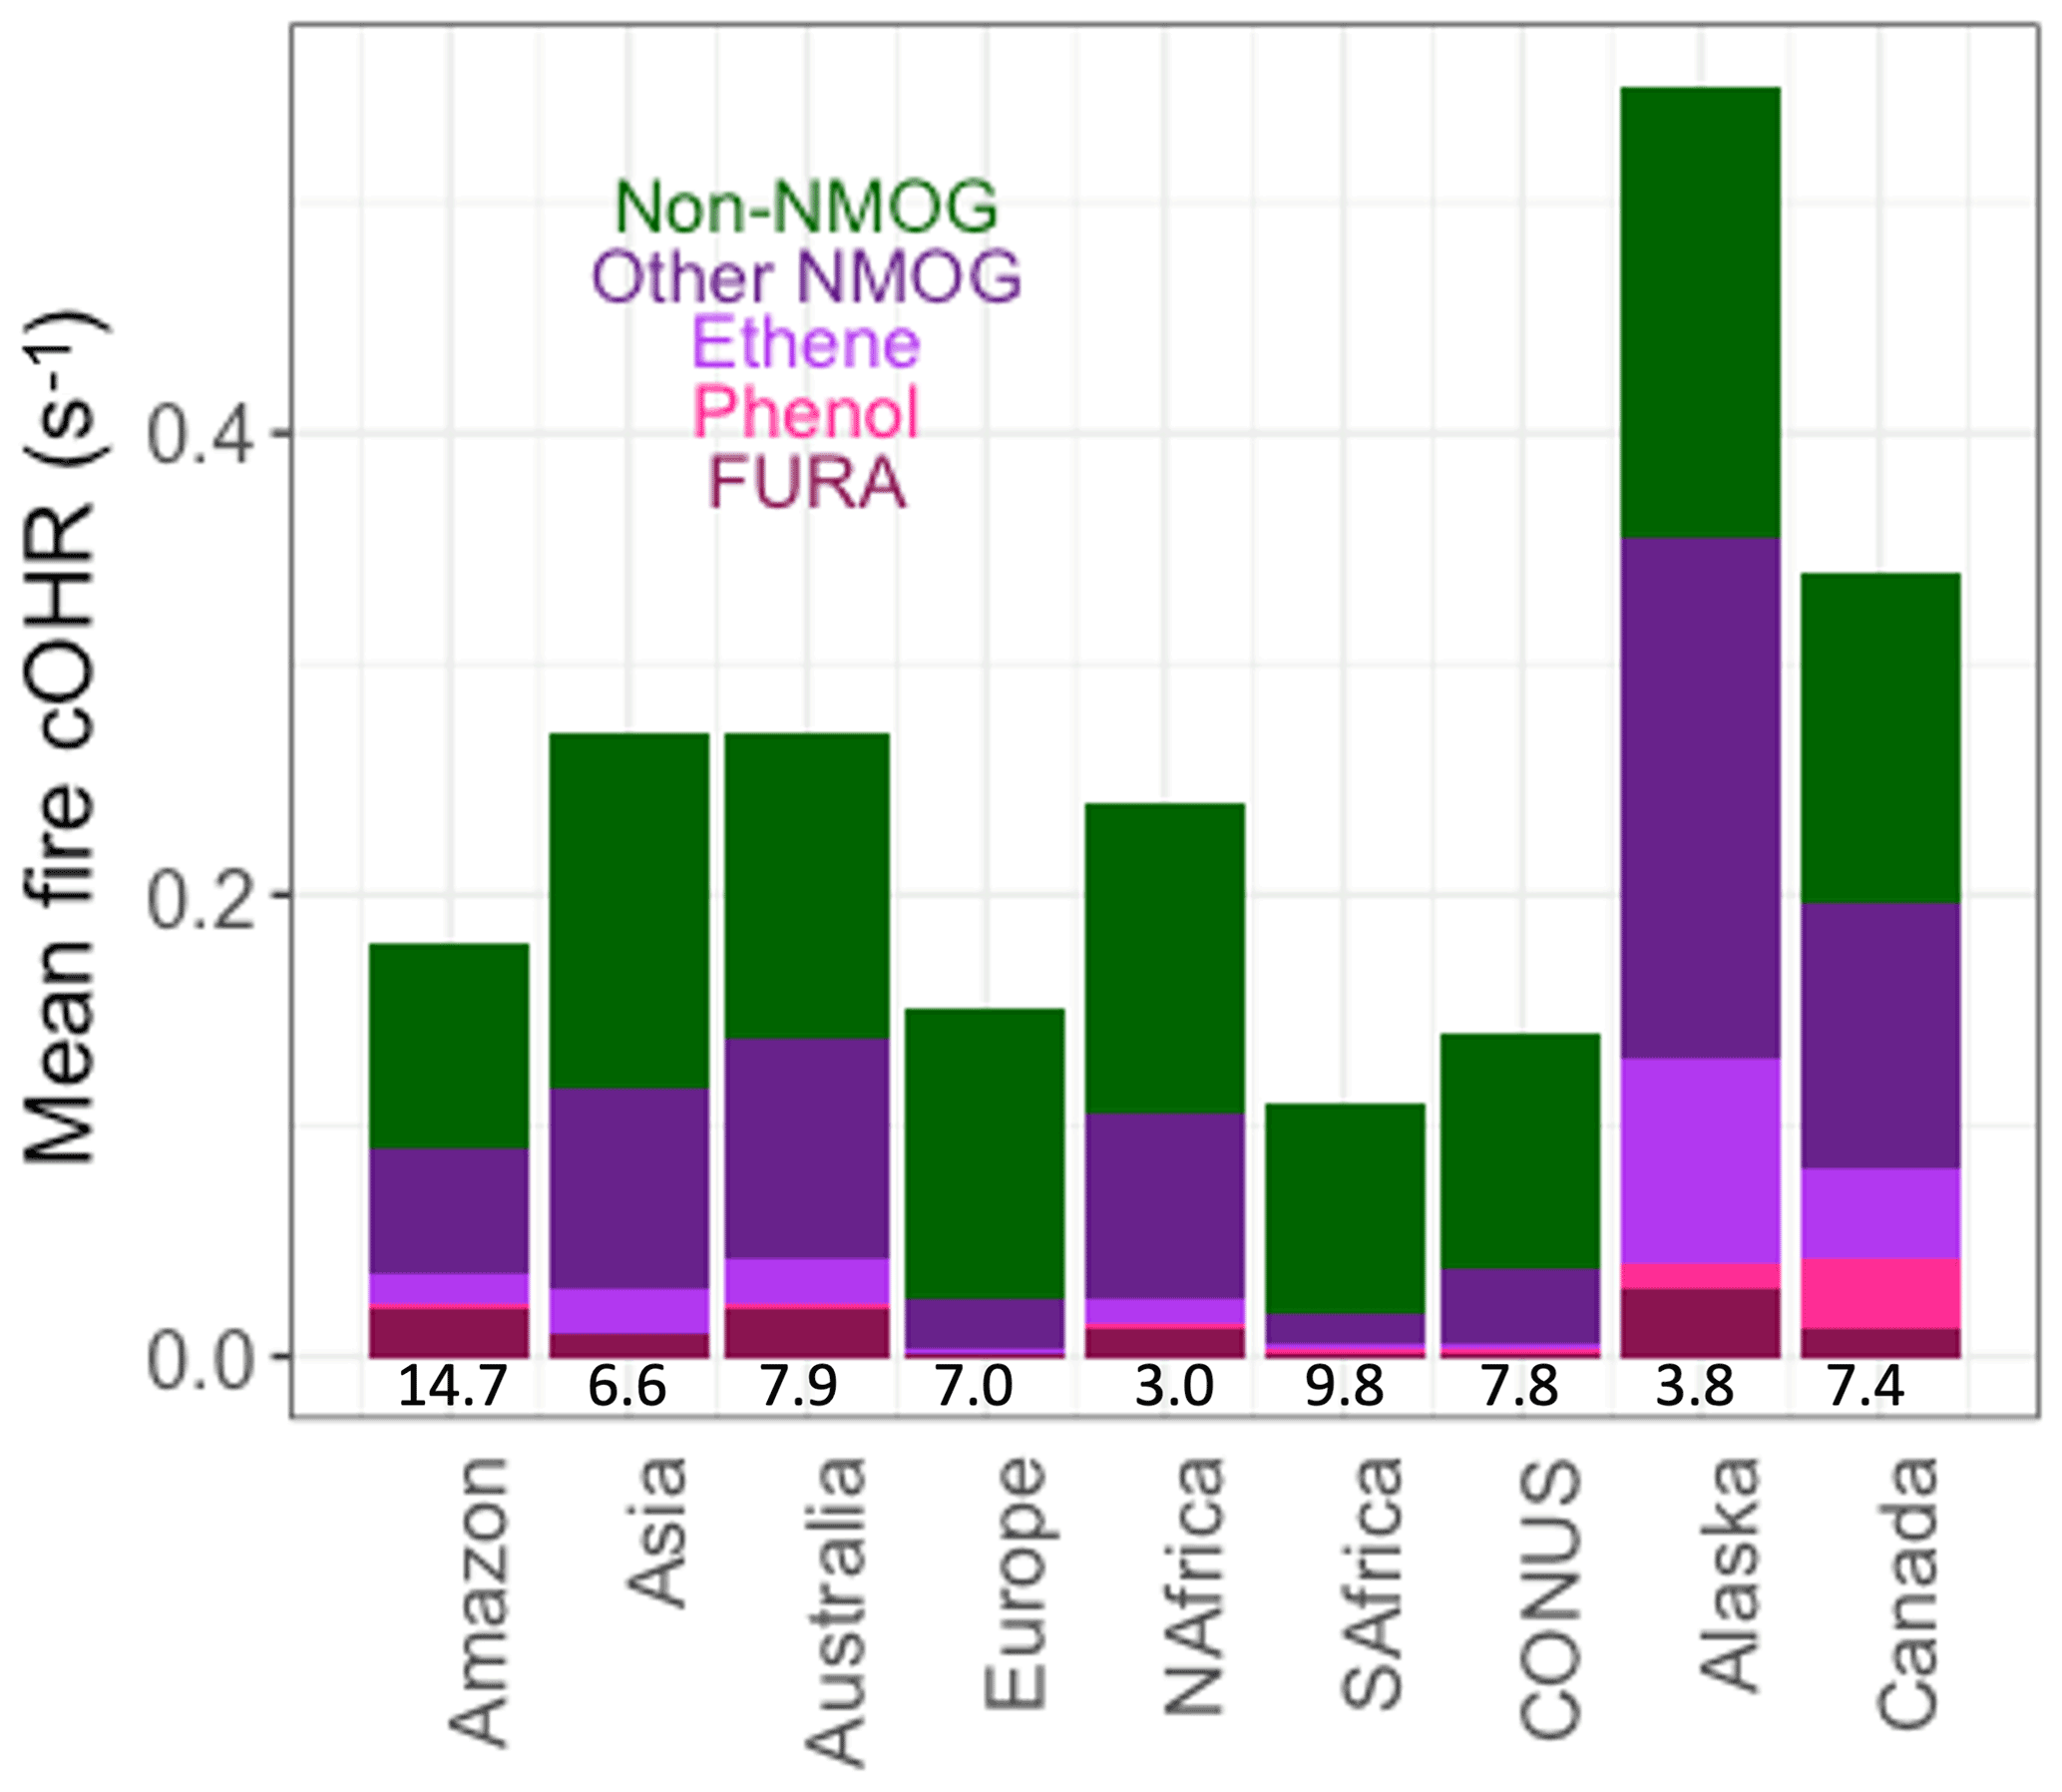
Figure 10Mean simulated surface fire cOHR in 2019 using GFED4s DM regionally for the Amazon, Asia, Australia, Europe, northern hemispheric Africa (NAfrica), southern hemispheric Africa (SAfrica), the contiguous US (CONUS), Alaska, and Canada. Numbers at the bottom of each bar are the 1997–2016 area-averaged burned area (in millions of square kilometers) from van der Werf et al. (2017). See Fig. S9 for the same analysis with the standard model.
Because fires and fuel types differ regionally, Fig. 10 shows the simulated annual mean fire cOHR in several large fire regions. The addition of fire emissions of lumped furans, phenol, and ethene contributes significantly to fire cOHR depending on region, consistent with their EFs. Lumped furans, “FURA” (dark red), contribute the most in the Amazon (11 %), Australia (7 %), and Alaska (5 %) and the least in Europe (1 %), southern Africa (2 %), and contiguous US (CONUS; 2 %). The boreal regions (Alaska and Canada) show larger contributions from phenol (bright pink) (2 % and 9 %, respectively) and ethene (light purple) (16 % and 12 %, respectively), consistent with high boreal EFs. Other NMOGs (dark purple) also contribute substantial cOHR in most regions except Europe, southern Africa, and CONUS where the contribution from CO is dominant. We show the average burned area in each region at the bottom of Fig. 10 to give an idea of the potency of fires in each region because some regions, like southern hemispheric Africa (SAfrica), may be showing a lower-magnitude cOHR signal, since so much area is burned. We note that given our observational analysis for the Amazon (Fig. 5), fire emissions, and thus the fire cOHR, in this region, and possibly other tropical regions, are likely drastically underestimated in our simulation. We do not adjust regional fire emissions here given that large uncertainties remain on fire emissions in the Amazon and tropics more generally; therefore, the values shown in Fig. 10 should certainly be considered a lower estimate (in the Amazon by more than a factor of 3, following Fig. 5).
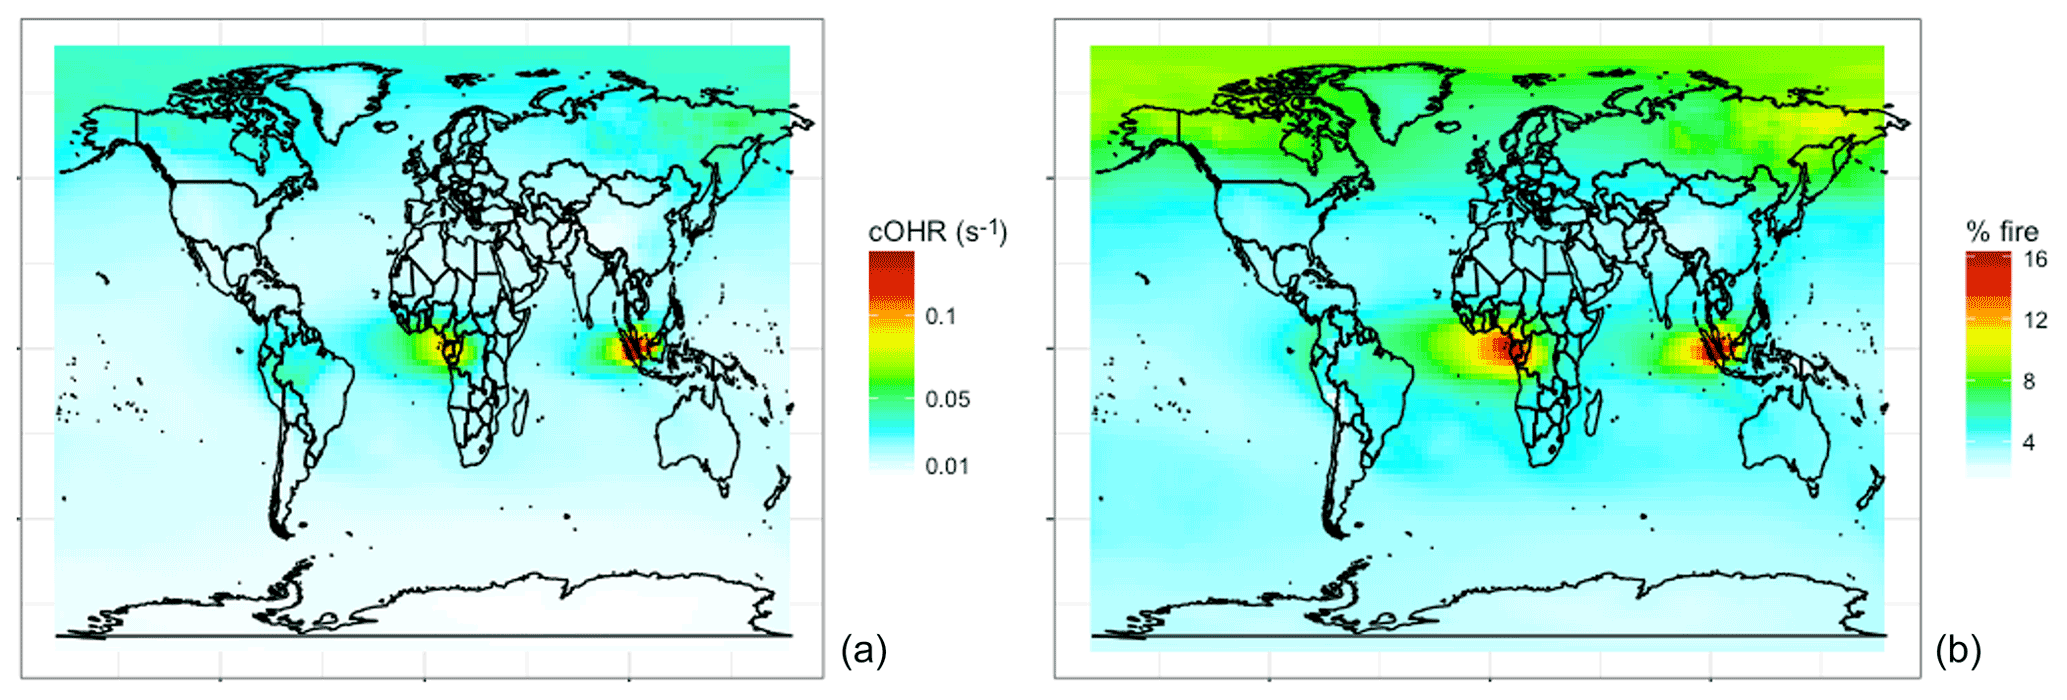
Figure 11Annual mean simulated (a) fire cOHR and (b) percent of cOHR from fires using GFED4s DM in 2019 at 500 hPa.
NMOGs and associated reactivity in the free troposphere are relevant to the global oxidative capacity, long-range transport, and climate. Figure 11 shows that the simulated contribution of fires in the mid troposphere (500 hPa) to cOHR is 5 % globally but reaches ∼15 % in the tropics. Fires also contribute more reactivity (∼10 % annually) in the boreal region. We undertake a similar analysis for 2017 (not shown) in which the magnitudes and spatial trends discussed in Figs. 7–11 are similar.
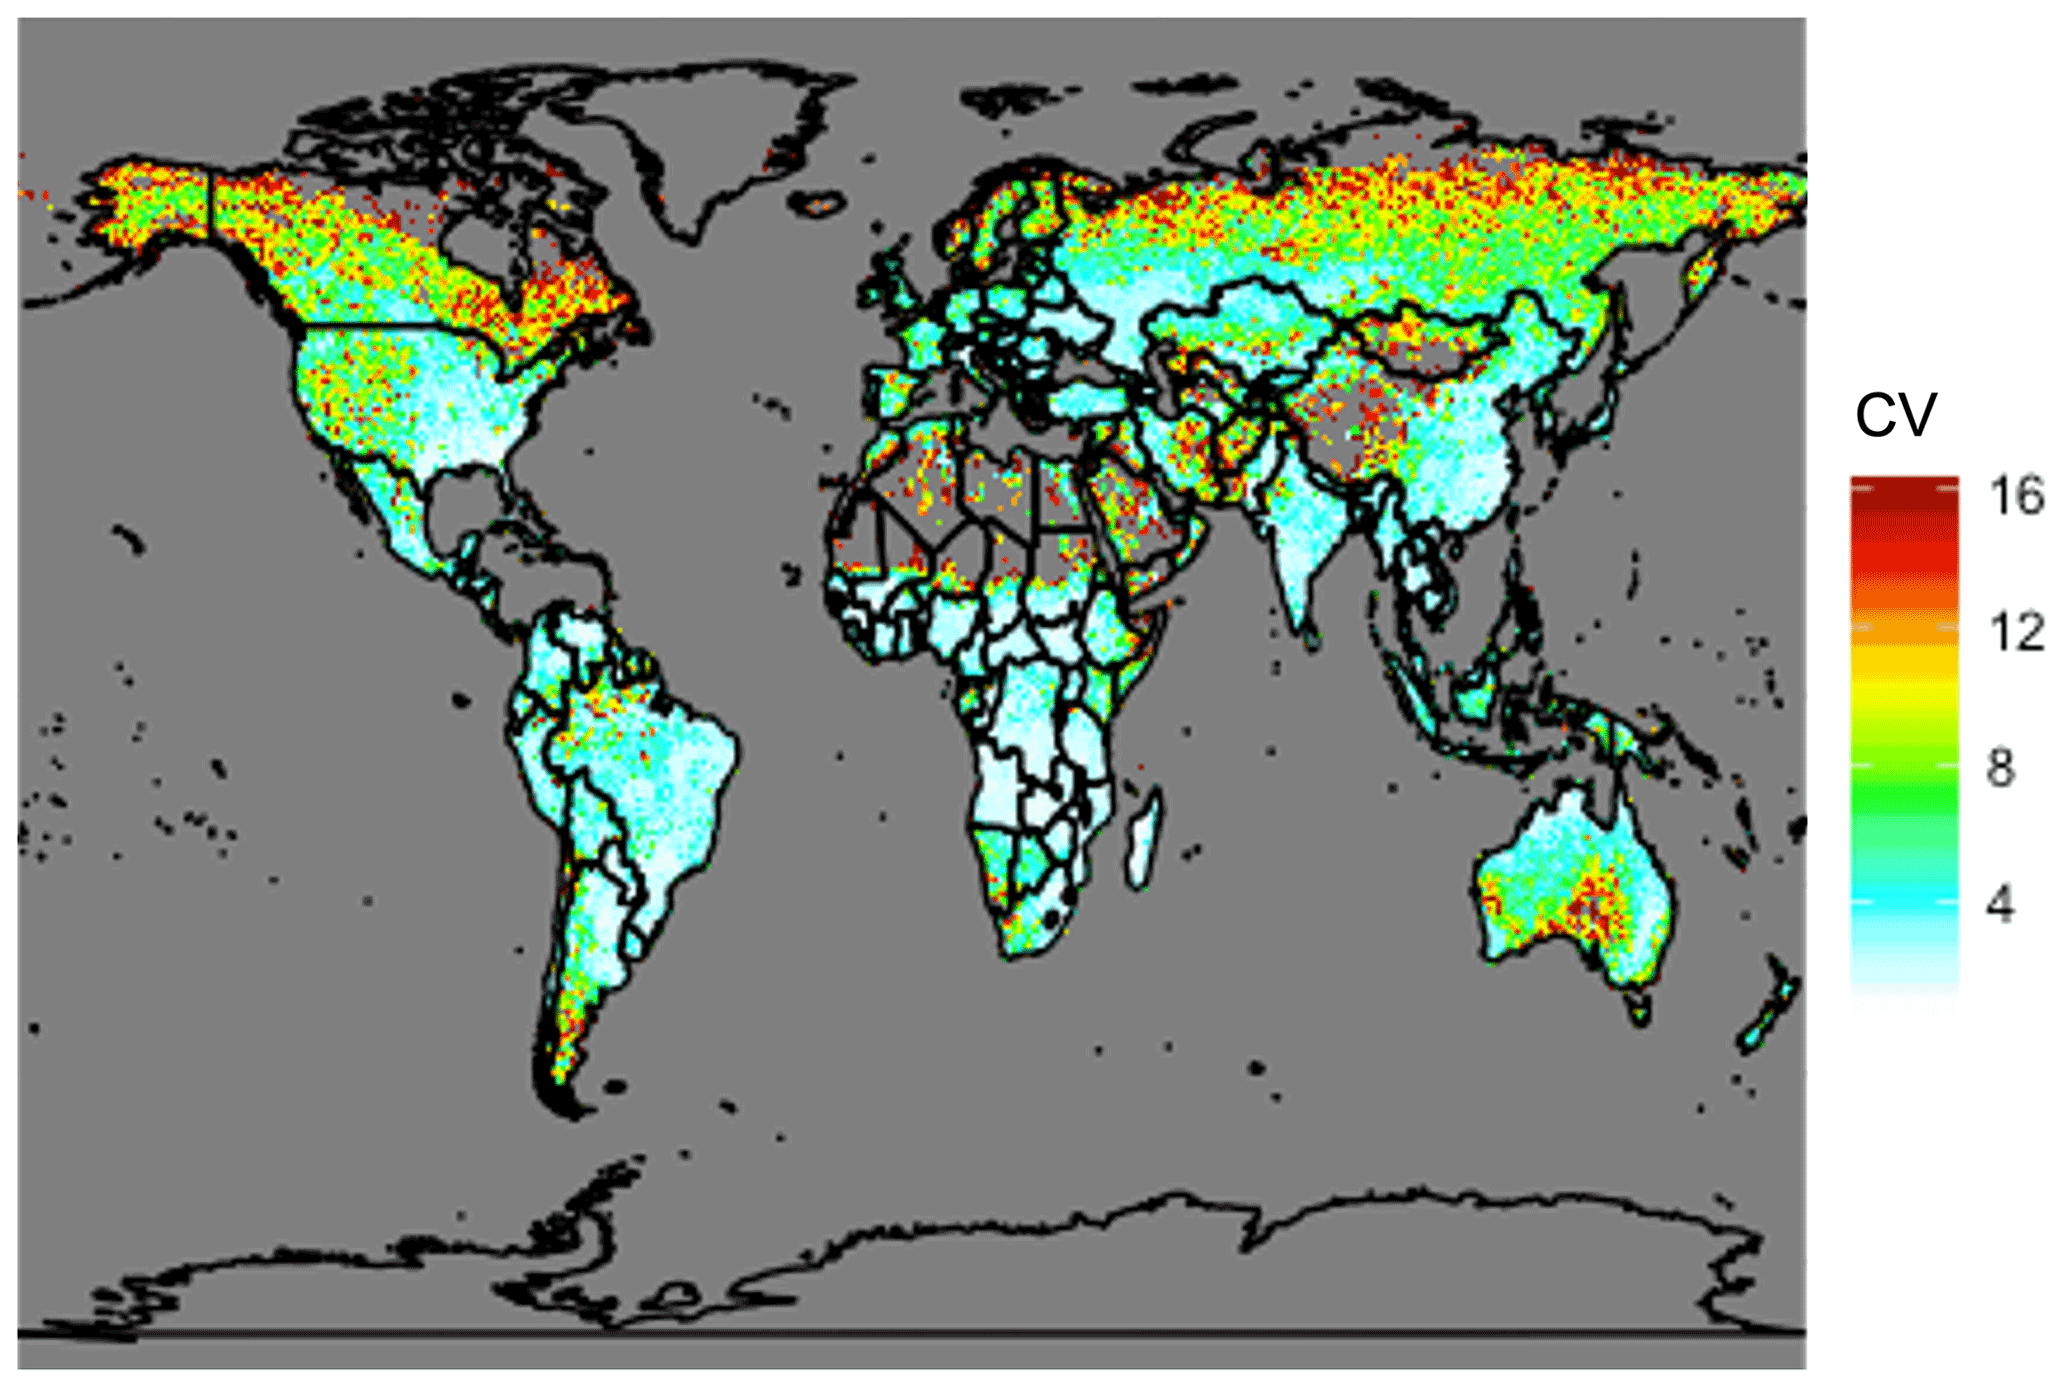
Figure 12Coefficient of variation (CV) of total annual carbon emissions from fires from 1997 to 2019 using GFED4s DM. Coefficient of variation is defined as the standard deviation of a quantity divided by the mean, which is a statistical measure of the relative dispersion of the dataset about the mean.
The analysis presented above is for a single year (2019). Fire location and magnitudes vary substantially year to year. The global total carbon emissions of NMOGs from the GFED4s inventory from 1997 to 2019 range from 27 to 48 Tg C yr−1 with 41 Tg C emitted in 2019. This suggests that our estimates of fire's contribution in the preceding analysis is representative of average conditions at the global scale but may increase or decrease by roughly a third in different years. Therefore, across years, the annual global average fraction of surface reactivity due to fires likely ranges from ∼10 %–20 % with large uncertainties due to the magnitudes of other anthropogenic and biogenic emissions in any given fire region. We note that the global total NMOG emissions estimated by GFED4s (27 to 48 Tg C yr−1) are smaller than the simple calculations in the literature (100–200 Tg) (Akagi et al., 2011; Andreae and Merlet, 2001) likely because we are not representing all possible species and because GFED4s is known to underestimate emissions from small fires (van der Werf et al., 2017; Randerson et al., 2012). To understand interannual variability at a more local scale, Fig. 12 shows the coefficient of variation, a statistical measure of the relative dispersion of the data about the mean, for total carbon emissions from fires across the same years. Given their propensity for large wildfires, the boreal regions, the western US, and Australia show greater year to year variability, which would translate to high variability in fire contributions to surface cOHR. Conversely, Africa shows very little variation, consistent with human-ignited savanna and agricultural burning each year, suggesting that our single year estimates of fire contributions to cOHR are potentially robust in this region.
Recent work has suggested that NMOGs from fires may be a large source but noted that we did not yet have a framework in our models to fully characterize them and their reactivity (Akagi et al., 2011). Our work provides a first estimate of fire NMOGs globally and regionally and their contribution to reactivity. We updated fire NMOG EFs to Andreae (2019) from Akagi et al. (2011). We also expanded the model representation by adding new fire NMOGs (e.g., lumped furans, phenol, ethene), prioritized for their reactivity using data from the FIREX lab studies and their chemistry. We used a suite of recent observations from the lab (FIREX) to towers (ATTO) to aircraft campaigns (FIREX-AQ, ARCTAS, DC3) to constrain and test our model representation. We show that observations support the additions made to the model.
Our model suggests that fires are a major contributor to NMOG concentrations, especially near fire source regions and downwind of them. We show that fires provide more than 75 % of cOHR in large parts of the Northern Hemisphere and that fires contribute to a high background (∼25 %) reactivity beyond their source regions, mostly driven by CO and other long-lived species. We also show that 90 % of non-CO annual surface OHR is from NMOGs and that FURA (furan, 2-methylfuran, and 2,5-dimethylfuran) and ethene are important globally for reactivity with phenol important in the boreal regions. Future work should explore the missing phenol in our comparison with US aircraft measurements and its importance in other regions. To our knowledge, this is the first quantification and characterization of the impact and importance of fire for atmospheric reactivity and the first representation of both lumped furans and phenol from fires in GEOS-Chem. However, our analysis is almost certainly a lower limit on the magnitude of reactivity from fire NMOGs because we do not comprehensively include all species emitted from fires, given that for many of these their global EFs and product formation are not well understood. To further improve the representation of fire NMOGs in models, more measurements of speciated NMOG and total OHR are needed to help constrain both the total emissions and reactivity of NMOGs, particularly during field campaigns with fire influence. Further development of oxidative chemical mechanisms for highly reactive NMOGs are also needed to ensure that models better capture the exported reactivity from fires. Finally, while we substantially increase the mass and reactivity from fire NMOGs represented in our model, more work is needed to constrain low-volatility NMOGs that are precursors to SOA.
As fires become more intense in the western US and in other temperate and boreal regions due to climate change (e.g., Westerling, 2016; Westerling et al., 2006; Abatzoglou and Williams, 2016; Senande-Rivera et al., 2022) and as human forcing leads to different burned area trends globally (Andela et al., 2017), it is becoming ever more important to improve our understanding of fire emissions, their reactivity, and their impact globally. Our work shows that NMOGs from fires contribute substantially to atmospheric reactivity, both locally and globally, highlighting the urgent need to further constrain the sources and transformations of these species.
The GEOS-Chem model is publicly available at https://doi.org/10.5281/zenodo.4618180 (The International GEOS-Chem User Community, 2021). The DC3 campaign data are available at https://www.eol.ucar.edu/field_projects/dc3 (last access: 18 February 2018), and the ARCTAS campaign data are available at https://www-air.larc.nasa.gov/cgi-bin/ArcView/arctas (last access: 18 February 2018). ATTO data are available at https://attodata.org/ (last access: 4 June 2021). FIREX-AQ data are available at https://www-air.larc.nasa.gov/cgi-bin/ArcView/firexaq (last access: 16 April 2022).
The supplement related to this article is available online at: https://doi.org/10.5194/acp-22-12093-2022-supplement.
CLH and TSC formulated the research question and wrote the paper with input from JHK. TSC performed the modeling and analysis. ECA, DB, MC, AE, GG, RSH, FP, JP, EYP, NGR, AR, CW, AW, JW, and LX measured CO, VOCs, and OHR during ARCTAS, FIREX-AQ, and ATTO and provided input on the manuscript.
The contact author has declared that none of the authors has any competing interests.
Publisher's note: Copernicus Publications remains neutral with regard to jurisdictional claims in published maps and institutional affiliations.
We thank Kelvin Bates for advice on implementing the aromatic hydrocarbon updates and ethene and ethyne chemistry that were not yet available in the standard GEOS-Chem model. We also thank Mat Evans for discussing source-attribution approaches. We acknowledge Tom Ryerson for making measurements of CO during FIREX-AQ and William Brune for OHR measurements and Teresa Campos for CO measurements during DC3.
This research has been supported by the Division of Atmospheric and Geospace Sciences (NSF AGS grant no. 1936642 and cooperative agreement no. 1852977), the National Aeronautics and Space Administration (grant no. 80NSSC18K0633), the National Oceanic and Atmospheric Administration (grant no. NA17OAR4320101), and the Austrian Federal Ministry of Economy, Family and Youth (BMVIT, FFG, ASAP).
This paper was edited by Arthur Chan and reviewed by two anonymous referees.
Abatzoglou, J. T. and Williams, A. P.: Impact of anthropogenic climate change on wildfire across western US forests, P. Natl. Acad. Sci. USA, 113, 11770–11775, https://doi.org/10.1073/pnas.1607171113, 2016.
Ahern, A. T., Robinson, E. S., Tkacik, D. S., Saleh, R., Hatch, L. E., Barsanti, K. C., Stockwell, C. E., Yokelson, R. J., Presto, A. A., Robinson, A. L., Sullivan, R. C., and Donahue, N. M.: Production of Secondary Organic Aerosol During Aging of Biomass Burning Smoke From Fresh Fuels and Its Relationship to VOC Precursors, J. Geophys. Res.-Atmos., 124, 3583–3606, https://doi.org/10.1029/2018JD029068, 2019.
Akagi, S. K., Yokelson, R. J., Wiedinmyer, C., Alvarado, M. J., Reid, J. S., Karl, T., Crounse, J. D., and Wennberg, P. O.: Emission factors for open and domestic biomass burning for use in atmospheric models, Atmos. Chem. Phys., 11, 4039–4072, https://doi.org/10.5194/acp-11-4039-2011, 2011.
Andela, N., Morton, D. C., Giglio, L., Chen, Y., Werf, G. R. van der, Kasibhatla, P. S., DeFries, R. S., Collatz, G. J., Hantson, S., Kloster, S., Bachelet, D., Forrest, M., Lasslop, G., Li, F., Mangeon, S., Melton, J. R., Yue, C., and Randerson, J. T.: A human-driven decline in global burned area, Science, 356, 1356–1362, https://doi.org/10.1126/science.aal4108, 2017.
Andreae, M. O.: Emission of trace gases and aerosols from biomass burning – an updated assessment, Atmos. Chem. Phys., 19, 8523–8546, https://doi.org/10.5194/acp-19-8523-2019, 2019.
Andreae, M. O. and Merlet, P.: Emission of trace gases and aerosols from biomass burning, Global Biogeochem. Cycles, 15, 955–966, https://doi.org/10.1029/2000GB001382, 2001.
Apel, E. C., Hornbrook, R. S., Hills, A. J., Blake, N. J., Barth, M. C., Weinheimer, A., Cantrell, C., Rutledge, S. A., Basarab, B., Crawford, J., Diskin, G., Homeyer, C. R., Campos, T., Flocke, F., Fried, A., Blake, D. R., Brune, W., Pollack, I., Peischl, J., Ryerson, T., Wennberg, P. O., Crounse, J. D., Wisthaler, A., Mikoviny, T., Huey, G., Heikes, B., O'Sullivan, D., and Riemer, D. D.: Upper tropospheric ozone production from lightning NOx-impacted convection: Smoke ingestion case study from the DC3 campaign, J. Geophys. Res.-Atmos., 120, 2505–2523, https://doi.org/10.1002/2014JD022121, 2015.
Baer, D. S., Paul, J. B., Gupta, M., and O'Keefe, A.: Sensitive absorption measurements in the near-infrared region using off-axis integrated-cavity-output spectroscopy, Appl. Phys. B, 75, 261–265, https://doi.org/10.1007/s00340-002-0971-z, 2002.
Barth, M. C., Cantrell, C. A., Brune, W. H., Rutledge, S. A., Crawford, J. H., Huntrieser, H., Carey, L. D., MacGorman, D., Weisman, M., Pickering, K. E., Bruning, E., Anderson, B., Apel, E., Biggerstaff, M., Campos, T., Campuzano-Jost, P., Cohen, R., Crounse, J., Day, D. A., Diskin, G., Flocke, F., Fried, A., Garland, C., Heikes, B., Honomichl, S., Hornbrook, R., Huey, L. G., Jimenez, J. L., Lang, T., Lichtenstern, M., Mikoviny, T., Nault, B., O'Sullivan, D., Pan, L. L., Peischl, J., Pollack, I., Richter, D., Riemer, D., Ryerson, T., Schlager, H., St. Clair, J., Walega, J., Weibring, P., Weinheimer, A., Wennberg, P., Wisthaler, A., Wooldridge, P. J., and Ziegler, C.: The Deep Convective Clouds and Chemistry (DC3) Field Campaign, B. Am. Meteorol. Soc., 96, 1281–1309, https://doi.org/10.1175/BAMS-D-13-00290.1, 2015.
Bates, K. H., Jacob, D. J., Li, K., Ivatt, P. D., Evans, M. J., Yan, Y., and Lin, J.: Development and evaluation of a new compact mechanism for aromatic oxidation in atmospheric models, Atmos. Chem. Phys., 21, 18351–18374, https://doi.org/10.5194/acp-21-18351-2021, 2021.
Bernath, P., Boone, C., and Crouse, J.: Wildfire smoke destroys stratospheric ozone, Science, 375, 1292–1295, https://doi.org/10.1126/science.abm5611, 2022.
Bierbach, A., Barnes, I., and Becker, K. H.: Product and kinetic study of the oh-initiated gas-phase oxidation of Furan, 2-methylfuran and furanaldehydes at ≈300 K, Atmos. Environ., 29, 2651–2660, 1995.
Bourgeois, I., Peischl, J., Neuman, J. A., Brown, S. S., Thompson, C. R., Aikin, K. C., Allen, H. M., Angot, H., Apel, E. C., Baublitz, C. B., Brewer, J. F., Campuzano-Jost, P., Commane, R., Crounse, J. D., Daube, B. C., DiGangi, J. P., Diskin, G. S., Emmons, L. K., Fiore, A. M., Gkatzelis, G. I., Hills, A., Hornbrook, R. S., Huey, L. G., Jimenez, J. L., Kim, M., Lacey, F., McKain, K., Murray, L. T., Nault, B. A., Parrish, D. D., Ray, E., Sweeney, C., Tanner, D., Wofsy, S. C., and Ryerson, T. B.: Large contribution of biomass burning emissions to ozone throughout the global remote troposphere, P. Natl. Acad. Sci. USA, 118, e2109628118, https://doi.org/10.1073/pnas.2109628118, 2021.
Bourgeois, I., Peischl, J., Neuman, J. A., Brown, S. S., Allen, H. M., Campuzano-Jost, P., Coggon, M. M., DiGangi, J. P., Diskin, G. S., Gilman, J. B., Gkatzelis, G. I., Guo, H., Halliday, H. A., Hanisco, T. F., Holmes, C. D., Huey, L. G., Jimenez, J. L., Lamplugh, A. D., Lee, Y. R., Lindaas, J., Moore, R. H., Nault, B. A., Nowak, J. B., Pagonis, D., Rickly, P. S., Robinson, M. A., Rollins, A. W., Selimovic, V., St. Clair, J. M., Tanner, D., Vasquez, K. T., Veres, P. R., Warneke, C., Wennberg, P. O., Washenfelder, R. A., Wiggins, E. B., Womack, C. C., Xu, L., Zarzana, K. J., and Ryerson, T. B.: Comparison of airborne measurements of NO, NO2, HONO, NOy, and CO during FIREX-AQ, Atmos. Meas. Tech., 15, 4901–4930, https://doi.org/10.5194/amt-15-4901-2022, 2022.
Brune, W. H., Ren, X., Zhang, L., Mao, J., Miller, D. O., Anderson, B. E., Blake, D. R., Cohen, R. C., Diskin, G. S., Hall, S. R., Hanisco, T. F., Huey, L. G., Nault, B. A., Peischl, J., Pollack, I., Ryerson, T. B., Shingler, T., Sorooshian, A., Ullmann, K., Wisthaler, A., and Wooldridge, P. J.: Atmospheric oxidation in the presence of clouds during the Deep Convective Clouds and Chemistry (DC3) study, Atmos. Chem. Phys., 18, 14493–14510, https://doi.org/10.5194/acp-18-14493-2018, 2018.
Carter, T. S., Heald, C. L., Jimenez, J. L., Campuzano-Jost, P., Kondo, Y., Moteki, N., Schwarz, J. P., Wiedinmyer, C., Darmenov, A. S., da Silva, A. M., and Kaiser, J. W.: How emissions uncertainty influences the distribution and radiative impacts of smoke from fires in North America, Atmos. Chem. Phys., 20, 2073–2097, https://doi.org/10.5194/acp-20-2073-2020, 2020.
Carter, T. S., Heald, C. L., Cappa, C. D., Kroll, J. H., Campos, T. L., Coe, H., Cotterell, M. I., Davies, N. W., Farmer, D. K., Fox, C., Garofalo, L. A., Hu, L., Langridge, J. M., Levin, E. J. T., Murphy, S. M., Pokhrel, R. P., Shen, Y., Szpek, K., Taylor, J. W., and Wu, H.: Investigating Carbonaceous Aerosol and Its Absorption Properties From Fires in the Western United States (WE-CAN) and Southern Africa (ORACLES and CLARIFY), J. Geophys. Res.-Atmos., 126, e2021JD034984, https://doi.org/10.1029/2021JD034984, 2021.
Chan Miller, C., Jacob, D. J., Marais, E. A., Yu, K., Travis, K. R., Kim, P. S., Fisher, J. A., Zhu, L., Wolfe, G. M., Hanisco, T. F., Keutsch, F. N., Kaiser, J., Min, K.-E., Brown, S. S., Washenfelder, R. A., González Abad, G., and Chance, K.: Glyoxal yield from isoprene oxidation and relation to formaldehyde: chemical mechanism, constraints from SENEX aircraft observations, and interpretation of OMI satellite data, Atmos. Chem. Phys., 17, 8725–8738, https://doi.org/10.5194/acp-17-8725-2017, 2017.
Coggon, M. M., Lim, C. Y., Koss, A. R., Sekimoto, K., Yuan, B., Gilman, J. B., Hagan, D. H., Selimovic, V., Zarzana, K. J., Brown, S. S., Roberts, J. M., Müller, M., Yokelson, R., Wisthaler, A., Krechmer, J. E., Jimenez, J. L., Cappa, C., Kroll, J. H., de Gouw, J., and Warneke, C.: OH chemistry of non-methane organic gases (NMOGs) emitted from laboratory and ambient biomass burning smoke: evaluating the influence of furans and oxygenated aromatics on ozone and secondary NMOG formation, Atmos. Chem. Phys., 19, 14875–14899, https://doi.org/10.5194/acp-19-14875-2019, 2019.
Colman, J. J., Swanson, A. L., Meinardi, S., Sive, B. C., Blake, D. R., and Rowland, F. S.: Description of the Analysis of a Wide Range of Volatile Organic Compounds in Whole Air Samples Collected during PEM-Tropics A and B, Anal. Chem., 73, 3723–3731, https://doi.org/10.1021/ac010027g, 2001.
Darmenov, A. and da Silva, A. M.: The Quick Fire Emissions Dataset (QFED) – Documentation of versions 2.1, 2.2 and 2.4, in: NASA Technical Report Series on Global Modeling and Data Assimilation, NASA/TM-2015-104606, http://gmao.gsfc.nasa.gov/pubs/tm/ (last access: 20 February 2020), 2015.
de Gouw, J. and Warneke, C.: Measurements of volatile organic compounds in the earth's atmosphere using proton-transfer-reaction mass spectrometry, Mass. Spectrom. Rev., 26, 223–257, https://doi.org/10.1002/mas.20119, 2007.
Eastham, S. D. and Jacob, D. J.: Limits on the ability of global Eulerian models to resolve intercontinental transport of chemical plumes, Atmos. Chem. Phys., 17, 2543–2553, https://doi.org/10.5194/acp-17-2543-2017, 2017.
European Union: Council Directive 1999/13/EC of 11 March 1999 on the limitation of emissions of volatile organic compounds due to the use of organic solvents in certain activities and installations, OJ L, 085, 1999.
Fountoukis, C. and Nenes, A.: ISORROPIA II: a computationally efficient thermodynamic equilibrium model for K+–Ca2+–Mg2+–NH–Na+–SO–NO–Cl−–H2O aerosols, Atmos. Chem. Phys., 7, 4639–4659, https://doi.org/10.5194/acp-7-4639-2007, 2007.
Gilman, J. B., Lerner, B. M., Kuster, W. C., Goldan, P. D., Warneke, C., Veres, P. R., Roberts, J. M., de Gouw, J. A., Burling, I. R., and Yokelson, R. J.: Biomass burning emissions and potential air quality impacts of volatile organic compounds and other trace gases from fuels common in the US, Atmos. Chem. Phys., 15, 13915–13938, https://doi.org/10.5194/acp-15-13915-2015, 2015.
Goldstein, A. H. and Galbally, I. E.: Known and unknown organic constituents in the Earth's atmosphere, Environ. Sci. Technol., 41, 1514–1521, 2007. 2007.
Guenther, A. B., Jiang, X., Heald, C. L., Sakulyanontvittaya, T., Duhl, T., Emmons, L. K., and Wang, X.: The Model of Emissions of Gases and Aerosols from Nature version 2.1 (MEGAN2.1): an extended and updated framework for modeling biogenic emissions, Geosci. Model Dev., 5, 1471–1492, https://doi.org/10.5194/gmd-5-1471-2012, 2012.
Hansel, A., Jordan, A., Holzinger, R., Prazeller, P., Vogel, W., and Lindinger, W.: Proton transfer reaction mass spectrometry: on-line trace gas analysis at the ppb level, Int. J. Mass Spectrom. Ion Process., 149–150, 609–619, https://doi.org/10.1016/0168-1176(95)04294-U, 1995.
Hatch, L. E., Luo, W., Pankow, J. F., Yokelson, R. J., Stockwell, C. E., and Barsanti, K. C.: Identification and quantification of gaseous organic compounds emitted from biomass burning using two-dimensional gas chromatography–time-of-flight mass spectrometry, Atmos. Chem. Phys., 15, 1865–1899, https://doi.org/10.5194/acp-15-1865-2015, 2015.
Hayden, K., Li, S.-M., Liggio, J., Wheeler, M., Wentzell, J., Leithead, A., Brickell, P., Mittermeier, R., Oldham, Z., Mihele, C., Staebler, R., Moussa, S., Darlington, A., Steffen, A., Wolde, M., Thompson, D., Chen, J., Griffin, D., Eckert, E., Ditto, J., He, M., and Gentner, D.: Reconciling the total carbon budget for boreal forest wildfire emissions using airborne observations, Atmos. Chem. Phys. Discuss. [preprint], https://doi.org/10.5194/acp-2022-245, in review, 2022.
Hobbs, P. V., Sinha, P., Yokelson, R. J., Christian, T. J., Blake, D. R., Gao, S., Kirchstetter, T. W., Novakov, T., and Pilewskie, P.: Evolution of gases and particles from a savanna fire in South Africa, J. Geophys. Res.-Atmos., 108, 2156–2202, https://doi.org/10.1029/2002JD002352, 2003.
Hoesly, R. M., Smith, S. J., Feng, L., Klimont, Z., Janssens-Maenhout, G., Pitkanen, T., Seibert, J. J., Vu, L., Andres, R. J., Bolt, R. M., Bond, T. C., Dawidowski, L., Kholod, N., Kurokawa, J.-I., Li, M., Liu, L., Lu, Z., Moura, M. C. P., O'Rourke, P. R., and Zhang, Q.: Historical (1750–2014) anthropogenic emissions of reactive gases and aerosols from the Community Emissions Data System (CEDS), Geosci. Model Dev., 11, 369–408, https://doi.org/10.5194/gmd-11-369-2018, 2018.
Huang, M., Carmichael, G. R., Pierce, R. B., Jo, D. S., Park, R. J., Flemming, J., Emmons, L. K., Bowman, K. W., Henze, D. K., Davila, Y., Sudo, K., Jonson, J. E., Tronstad Lund, M., Janssens-Maenhout, G., Dentener, F. J., Keating, T. J., Oetjen, H., and Payne, V. H.: Impact of intercontinental pollution transport on North American ozone air pollution: an HTAP phase 2 multi-model study, Atmos. Chem. Phys., 17, 5721–5750, https://doi.org/10.5194/acp-17-5721-2017, 2017.
Huangfu, Y., Yuan, B., Wang, S., Wu, C., He, X., Qi, J., de Gouw, J., Warneke, C., Gilman, J. B., Wisthaler, A., Karl, T., Graus, M., Jobson, B. T., and Shao, M.: Revisiting Acetonitrile as Tracer of Biomass Burning in Anthropogenic-Influenced Environments, Geophys. Res. Lett., 48, e2020GL092322, https://doi.org/10.1029/2020GL092322, 2021.
Jacob, D. J., Crawford, J. H., Maring, H., Clarke, A. D., Dibb, J. E., Emmons, L. K., Ferrare, R. A., Hostetler, C. A., Russell, P. B., Singh, H. B., Thompson, A. M., Shaw, G. E., McCauley, E., Pederson, J. R., and Fisher, J. A.: The Arctic Research of the Composition of the Troposphere from Aircraft and Satellites (ARCTAS) mission: design, execution, and first results, Atmos. Chem. Phys., 10, 5191–5212, https://doi.org/10.5194/acp-10-5191-2010, 2010.
Jaffe, D., Chand, D., Hafner, W., Westerling, A., and Spracklen, D.: Influence of Fires on O3 Concentrations in the Western U.S., Environ. Sci. Technol., 42, 5885–5891, https://doi.org/10.1021/es800084k, 2008.
Jaffe, D. A., Wigder, N., Downey, N., Pfister, G., Boynard, A., and Reid, S. B.: Impact of Wildfires on Ozone Exceptional Events in the Western U.S., Environ. Sci. Technol., 47, 11065–11072, https://doi.org/10.1021/es402164f, 2013.
Jaffe, D. A., Cooper, O. R., Fiore, A. M., Henderson, B. H., Tonnesen, G. S., Russell, A. G., Henze, D. K., Langford, A. O., Lin, M., and Moore, T.: Scientific assessment of background ozone over the U.S.: Implications for air quality management, Elementa: Science of the Anthropocene, 6, 56, https://doi.org/10.1525/elementa.309, 2018.
Kaiser, J. W., Heil, A., Andreae, M. O., Benedetti, A., Chubarova, N., Jones, L., Morcrette, J.-J., Razinger, M., Schultz, M. G., Suttie, M., and van der Werf, G. R.: Biomass burning emissions estimated with a global fire assimilation system based on observed fire radiative power, Biogeosciences, 9, 527–554, https://doi.org/10.5194/bg-9-527-2012, 2012.
Koss, A. R., Sekimoto, K., Gilman, J. B., Selimovic, V., Coggon, M. M., Zarzana, K. J., Yuan, B., Lerner, B. M., Brown, S. S., Jimenez, J. L., Krechmer, J., Roberts, J. M., Warneke, C., Yokelson, R. J., and de Gouw, J.: Non-methane organic gas emissions from biomass burning: identification, quantification, and emission factors from PTR-ToF during the FIREX 2016 laboratory experiment, Atmos. Chem. Phys., 18, 3299–3319, https://doi.org/10.5194/acp-18-3299-2018, 2018.
Kumar, V., Chandra, B. P., and Sinha, V.: Large unexplained suite of chemically reactive compounds present in ambient air due to biomass fires, Sci. Rep.-UK, 8, 626, https://doi.org/10.1038/s41598-017-19139-3, 2018.
Kwan, A. J., Crounse, J. D., Clarke, A. D., Shinozuka, Y., Anderson, B. E., Crawford, J. H., Avery, M. A., McNaughton, C. S., Brune, W. H., Singh, H. B., and Wennberg, P. O.: On the flux of oxygenated volatile organic compounds from organic aerosol oxidation, Geophys. Res. Lett., 33, L15815, https://doi.org/10.1029/2006GL026144, 2006.
Kwon, H.-A., Park, R. J., Oak, Y. J., Nowlan, C. R., Janz, S. J., Kowalewski, M. G., Fried, A., Walega, J., Bates, K. H., Choi, J., Blake, D. R., Wisthaler, A., and Woo, J.-H.: Top-down estimates of anthropogenic VOC emissions in South Korea using formaldehyde vertical column densities from aircraft during the KORUS-AQ campaign, Elementa: Science of the Anthropocene, 9, 00109, https://doi.org/10.1525/elementa.2021.00109, 2021.
Lelieveld, J., Gromov, S., Pozzer, A., and Taraborrelli, D.: Global tropospheric hydroxyl distribution, budget and reactivity, Atmos. Chem. Phys., 16, 12477–12493, https://doi.org/10.5194/acp-16-12477-2016, 2016.
Liao, J., Wolfe, G. M., Hannun, R. A., St. Clair, J. M., Hanisco, T. F., Gilman, J. B., Lamplugh, A., Selimovic, V., Diskin, G. S., Nowak, J. B., Halliday, H. S., DiGangi, J. P., Hall, S. R., Ullmann, K., Holmes, C. D., Fite, C. H., Agastra, A., Ryerson, T. B., Peischl, J., Bourgeois, I., Warneke, C., Coggon, M. M., Gkatzelis, G. I., Sekimoto, K., Fried, A., Richter, D., Weibring, P., Apel, E. C., Hornbrook, R. S., Brown, S. S., Womack, C. C., Robinson, M. A., Washenfelder, R. A., Veres, P. R., and Neuman, J. A.: Formaldehyde evolution in US wildfire plumes during the Fire Influence on Regional to Global Environments and Air Quality experiment (FIREX-AQ), Atmos. Chem. Phys., 21, 18319–18331, https://doi.org/10.5194/acp-21-18319-2021, 2021.
Lobert, J. M., Scharffe, D. H., Hao, W. M., and Crutzen, P. J.: Importance of biomass burning in the atmospheric budgets of nitrogen-containing gases, Nature, 346, 552–554, https://doi.org/10.1038/346552a0, 1990.
Mao, J., Ren, X., Brune, W. H., Olson, J. R., Crawford, J. H., Fried, A., Huey, L. G., Cohen, R. C., Heikes, B., Singh, H. B., Blake, D. R., Sachse, G. W., Diskin, G. S., Hall, S. R., and Shetter, R. E.: Airborne measurement of OH reactivity during INTEX-B, Atmos. Chem. Phys., 9, 163–173, https://doi.org/10.5194/acp-9-163-2009, 2009.
Mao, J., Paulot, F., Jacob, D. J., Cohen, R. C., Crounse, J. D., Wennberg, P. O., Keller, C. A., Hudman, R. C., Barkley, M. P., and Horowitz, L. W.: Ozone and organic nitrates over the eastern United States: Sensitivity to isoprene chemistry, J. Geophys. Res.-Atmos., 118, 11256–11268, https://doi.org/10.1002/jgrd.50817, 2013.
Müller, M., Mikoviny, T., Feil, S., Haidacher, S., Hanel, G., Hartungen, E., Jordan, A., Märk, L., Mutschlechner, P., Schottkowsky, R., Sulzer, P., Crawford, J. H., and Wisthaler, A.: A compact PTR-ToF-MS instrument for airborne measurements of volatile organic compounds at high spatiotemporal resolution, Atmos. Meas. Tech., 7, 3763–3772, https://doi.org/10.5194/amt-7-3763-2014, 2014.
Naeher, L. P., Brauer, M., Lipsett, M., Zelikoff, J. T., Simpson, C. D., Koenig, J. Q., and Smith, K. R.: Woodsmoke Health Effects: A Review, Inhal. Toxicol., 19, 67–106, https://doi.org/10.1080/08958370600985875, 2007.
O'Dell, K., Ford, B., Fischer, E. V., and Pierce, J. R.: Contribution of Wildland-Fire Smoke to US PM2.5 and Its Influence on Recent Trends, Environ. Sci. Technol., 53, 1797–1804, https://doi.org/10.1021/acs.est.8b05430, 2019.
Pfannerstill, E. Y., Reijrink, N. G., Edtbauer, A., Ringsdorf, A., Zannoni, N., Araújo, A., Ditas, F., Holanda, B. A., Sá, M. O., Tsokankunku, A., Walter, D., Wolff, S., Lavrič, J. V., Pöhlker, C., Sörgel, M., and Williams, J.: Total OH reactivity over the Amazon rainforest: variability with temperature, wind, rain, altitude, time of day, season, and an overall budget closure, Atmos. Chem. Phys., 21, 6231–6256, https://doi.org/10.5194/acp-21-6231-2021, 2021.
Philip, S., Martin, R. V., and Keller, C. A.: Sensitivity of chemistry-transport model simulations to the duration of chemical and transport operators: a case study with GEOS-Chem v10-01, Geosci. Model Dev., 9, 1683–1695, https://doi.org/10.5194/gmd-9-1683-2016, 2016.
Pöhlker, M. L., Ditas, F., Saturno, J., Klimach, T., Hrabě de Angelis, I., Araùjo, A. C., Brito, J., Carbone, S., Cheng, Y., Chi, X., Ditz, R., Gunthe, S. S., Holanda, B. A., Kandler, K., Kesselmeier, J., Könemann, T., Krüger, O. O., Lavrič, J. V., Martin, S. T., Mikhailov, E., Moran-Zuloaga, D., Rizzo, L. V., Rose, D., Su, H., Thalman, R., Walter, D., Wang, J., Wolff, S., Barbosa, H. M. J., Artaxo, P., Andreae, M. O., Pöschl, U., and Pöhlker, C.: Long-term observations of cloud condensation nuclei over the Amazon rain forest – Part 2: Variability and characteristics of biomass burning, long-range transport, and pristine rain forest aerosols, Atmos. Chem. Phys., 18, 10289–10331, https://doi.org/10.5194/acp-18-10289-2018, 2018.
Randerson, J. T., Chen, Y., van der Werf, G. R., Rogers, B. M., and Morton, D. C.: Global burned area and biomass burning emissions from small fires, J. Geophys. Res.-Biogeo., 117, G4, https://doi.org/10.1029/2012JG002128, 2012.
Rastigejev, Y., Park, R., Brenner, M. P., and Jacob, D. J.: Resolving intercontinental pollution plumes in global models of atmospheric transport, J. Geophys. Res.-Atmos., 115, D2, https://doi.org/10.1029/2009JD012568, 2010.
Reddington, C. L., Spracklen, D. V., Artaxo, P., Ridley, D. A., Rizzo, L. V., and Arana, A.: Analysis of particulate emissions from tropical biomass burning using a global aerosol model and long-term surface observations, Atmos. Chem. Phys., 16, 11083–11106, https://doi.org/10.5194/acp-16-11083-2016, 2016.
Reddington, C. L., Morgan, W. T., Darbyshire, E., Brito, J., Coe, H., Artaxo, P., Scott, C. E., Marsham, J., and Spracklen, D. V.: Biomass burning aerosol over the Amazon: analysis of aircraft, surface and satellite observations using a global aerosol model, Atmos. Chem. Phys., 19, 9125–9152, https://doi.org/10.5194/acp-19-9125-2019, 2019.
Robinson, A. L., Donahue, N. M., Shrivastava, M. K., Weitkamp, E. A., Sage, A. M., Grieshop, A. P., Lane, T. E., Pierce, J. R., and Pandis, S. N.: Rethinking Organic Aerosols: Semivolatile Emissions and Photochemical Aging, Science, 315, 1259–1262, https://doi.org/10.1126/science.1133061, 2007.
Safieddine, S. A., Heald, C. L., and Henderson, B. H.: The global nonmethane reactive organic carbon budget: A modeling perspective, Geophys. Res. Lett., 44, 3897–3906, https://doi.org/10.1002/2017GL072602, 2017.
Senande-Rivera, M., Insua-Costa, D., and Miguez-Macho, G.: Spatial and temporal expansion of global wildland fire activity in response to climate change, Nat. Commun., 13, 1208, https://doi.org/10.1038/s41467-022-28835-2, 2022.
Sherwen, T., Schmidt, J. A., Evans, M. J., Carpenter, L. J., Großmann, K., Eastham, S. D., Jacob, D. J., Dix, B., Koenig, T. K., Sinreich, R., Ortega, I., Volkamer, R., Saiz-Lopez, A., Prados-Roman, C., Mahajan, A. S., and Ordóñez, C.: Global impacts of tropospheric halogens (Cl, Br, I) on oxidants and composition in GEOS-Chem, Atmos. Chem. Phys., 16, 12239–12271, https://doi.org/10.5194/acp-16-12239-2016, 2016.
Simone, N. W., Stettler, M. E. J., and Barrett, S. R. H.: Rapid estimation of global civil aviation emissions with uncertainty quantification, Transport. Res. D-Tr. E., 25, 33–41, https://doi.org/10.1016/j.trd.2013.07.001, 2013.
Simpson, I. J., Akagi, S. K., Barletta, B., Blake, N. J., Choi, Y., Diskin, G. S., Fried, A., Fuelberg, H. E., Meinardi, S., Rowland, F. S., Vay, S. A., Weinheimer, A. J., Wennberg, P. O., Wiebring, P., Wisthaler, A., Yang, M., Yokelson, R. J., and Blake, D. R.: Boreal forest fire emissions in fresh Canadian smoke plumes: C1-C10 volatile organic compounds (VOCs), CO2, CO, NO2, NO, HCN and CH3CN, Atmos. Chem. Phys., 11, 6445–6463, https://doi.org/10.5194/acp-11-6445-2011, 2011.
Sinha, V., Williams, J., Crowley, J. N., and Lelieveld, J.: The Comparative Reactivity Method – a new tool to measure total OH Reactivity in ambient air, Atmos. Chem. Phys., 8, 2213–2227, https://doi.org/10.5194/acp-8-2213-2008, 2008.
Stettler, M. E. J., Eastham, S., and Barrett, S. R. H.: Air quality and public health impacts of UK airports. Part I: Emissions, Atmos. Environ., 45, 5415–5424, https://doi.org/10.1016/j.atmosenv.2011.07.012, 2011.
Stockwell, C. E., Bela, M. M., Coggon, M. M., Gkatzelis, G. I., Wiggins, E., Gargulinski, E. M., Shingler, T., Fenn, M., Griffin, D., Holmes, C. D., Ye, X., Saide, P. E., Bourgeois, I., Peischl, J., Womack, C. C., Washenfelder, R. A., Veres, P. R., Neuman, J. A., Gilman, J. B., Lamplugh, A., Schwantes, R. H., McKeen, S. A., Wisthaler, A., Piel, F., Guo, H., Campuzano-Jost, P., Jimenez, J. L., Fried, A., Hanisco, T. F., Huey, L. G., Perring, A., Katich, J. M., Diskin, G. S., Nowak, J. B., Bui, T. P., Halliday, H. S., DiGangi, J. P., Pereira, G., James, E. P., Ahmadov, R., McLinden, C. A., Soja, A. J., Moore, R. H., Hair, J. W., and Warneke, C.: Airborne Emission Rate Measurements Validate Remote Sensing Observations and Emission Inventories of Western U.S. Wildfires, Environ. Sci. Technol., 56, 7564–7577, https://doi.org/10.1021/acs.est.1c07121, 2022.
Strode, S. A., Liu, J., Lait, L., Commane, R., Daube, B., Wofsy, S., Conaty, A., Newman, P., and Prather, M.: Forecasting carbon monoxide on a global scale for the ATom-1 aircraft mission: insights from airborne and satellite observations and modeling, Atmos. Chem. Phys., 18, 10955–10971, https://doi.org/10.5194/acp-18-10955-2018, 2018.
Taraborrelli, D., Cabrera-Perez, D., Bacer, S., Gromov, S., Lelieveld, J., Sander, R., and Pozzer, A.: Influence of aromatics on tropospheric gas-phase composition, Atmos. Chem. Phys., 21, 2615–2636, https://doi.org/10.5194/acp-21-2615-2021, 2021.
The International GEOS-Chem User Community: geoschem/GCClassic: GEOS-Chem 13.0.0 (13.0.0), Zenodo [data set], https://doi.org/10.5281/zenodo.4618180, 2021.
Travis, K. R., Jacob, D. J., Fisher, J. A., Kim, P. S., Marais, E. A., Zhu, L., Yu, K., Miller, C. C., Yantosca, R. M., Sulprizio, M. P., Thompson, A. M., Wennberg, P. O., Crounse, J. D., St. Clair, J. M., Cohen, R. C., Laughner, J. L., Dibb, J. E., Hall, S. R., Ullmann, K., Wolfe, G. M., Pollack, I. B., Peischl, J., Neuman, J. A., and Zhou, X.: Why do models overestimate surface ozone in the Southeast United States?, Atmos. Chem. Phys., 16, 13561–13577, https://doi.org/10.5194/acp-16-13561-2016, 2016.
van der Werf, G. R., Randerson, J. T., Giglio, L., van Leeuwen, T. T., Chen, Y., Rogers, B. M., Mu, M., van Marle, M. J. E., Morton, D. C., Collatz, G. J., Yokelson, R. J., and Kasibhatla, P. S.: Global fire emissions estimates during 1997–2016, Earth Syst. Sci. Data, 9, 697–720, https://doi.org/10.5194/essd-9-697-2017, 2017.
Voulgarakis, A., Naik, V., Lamarque, J.-F., Shindell, D. T., Young, P. J., Prather, M. J., Wild, O., Field, R. D., Bergmann, D., Cameron-Smith, P., Cionni, I., Collins, W. J., Dalsøren, S. B., Doherty, R. M., Eyring, V., Faluvegi, G., Folberth, G. A., Horowitz, L. W., Josse, B., MacKenzie, I. A., Nagashima, T., Plummer, D. A., Righi, M., Rumbold, S. T., Stevenson, D. S., Strode, S. A., Sudo, K., Szopa, S., and Zeng, G.: Analysis of present day and future OH and methane lifetime in the ACCMIP simulations, Atmos. Chem. Phys., 13, 2563–2587, https://doi.org/10.5194/acp-13-2563-2013, 2013.
Wang, S., Coggon, M. M., Gkatzelis, G. I., Warneke, C., Bourgeois, I., Ryerson, T., Peischl, J., Veres, P. R., Neuman, J. A., Hair, J., Shingler, T., Fenn, M., Diskin, G., Huey, L. G., Lee, Y. R., Apel, E. C., Hornbrook, R. S., Hills, A. J., Hall, S. R., Ullmann, K., Bela, M. M., Trainer, M. K., Kumar, R., Orlando, J. J., Flocke, F. M., and Emmons, L. K.: Chemical Tomography in a Fresh Wildland Fire Plume: A Large Eddy Simulation (LES) Study, J. Geophys. Res.-Atmos., 126, 18, https://doi.org/10.1029/2021JD035203, 2021.
Westerling, A. L.: Increasing western US forest wildfire activity: sensitivity to changes in the timing of spring, Phil. Trans. R. Soc. B, 371, 20150178, https://doi.org/10.1098/rstb.2015.0178, 2016.
Westerling, A. L., Hidalgo, H. G., Cayan, D. R., and Swetnam, T. W.: Warming and Earlier Spring Increase Western U.S. Forest Wildfire Activity, Science, 313, 940–943, https://doi.org/10.1126/science.1128834, 2006.
Wiedinmyer, C., Akagi, S. K., Yokelson, R. J., Emmons, L. K., Al-Saadi, J. A., Orlando, J. J., and Soja, A. J.: The Fire INventory from NCAR (FINN): a high resolution global model to estimate the emissions from open burning, Geosci. Model Dev., 4, 625–641, https://doi.org/10.5194/gmd-4-625-2011, 2011.
Wiedinmyer, C., Yokelson, R. J., and Gullett, B. K.: Global Emissions of Trace Gases, Particulate Matter, and Hazardous Air Pollutants from Open Burning of Domestic Waste, Environ. Sci. Technol., 48, 9523–9530, https://doi.org/10.1021/es502250z, 2014.
Wisthaler, A., Hansel, A., Dickerson, R. R., and Crutzen, P. J.: Organic trace gas measurements by PTR-MS during INDOEX 1999, J. Geophys. Res.-Atmos., 107, INX2 23-1–INX2 23-11, https://doi.org/10.1029/2001JD000576, 2002.
Xu, L., Crounse, J. D., Vasquez, K. T., Allen, H., Wennberg, P. O., Bourgeois, I., Brown, S. S., Campuzano-Jost, P., Coggon, M. M., Crawford, J. H., DiGangi, J. P., Diskin, G. S., Fried, A., Gargulinski, E. M., Gilman, J. B., Gkatzelis, G. I., Guo, H., Hair, J. W., Hall, S. R., Halliday, H. A., Hanisco, T. F., Hannun, R. A., Holmes, C. D., Huey, L. G., Jimenez, J. L., Lamplugh, A., Lee, Y. R., Liao, J., Lindaas, J., Neuman, J. A., Nowak, J. B., Peischl, J., Peterson, D. A., Piel, F., Richter, D., Rickly, P. S., Robinson, M. A., Rollins, A. W., Ryerson, T. B., Sekimoto, K., Selimovic, V., Shingler, T., Soja, A. J., Clair, J. M. S., Tanner, D. J., Ullmann, K., Veres, P. R., Walega, J., Warneke, C., Washenfelder, R. A., Weibring, P., Wisthaler, A., Wolfe, G. M., Womack, C. C., and Yokelson, R. J.: Ozone chemistry in western U.S. wildfire plumes, Sci. Adv., 7, 50, https://doi.org/10.1126/sciadv.abl3648, 2021.
Yang, Y., Shao, M., Wang, X., Nölscher, A. C., Kessel, S., Guenther, A., and Williams, J.: Towards a quantitative understanding of total OH reactivity: A review, Atmos. Environ., 134, 147–161, https://doi.org/10.1016/j.atmosenv.2016.03.010, 2016.
Yokelson, R. J., Christian, T. J., Karl, T. G., and Guenther, A.: The tropical forest and fire emissions experiment: laboratory fire measurements and synthesis of campaign data, Atmos. Chem. Phys., 8, 3509–3527, https://doi.org/10.5194/acp-8-3509-2008, 2008.
Yokelson, R. J., Crounse, J. D., DeCarlo, P. F., Karl, T., Urbanski, S., Atlas, E., Campos, T., Shinozuka, Y., Kapustin, V., Clarke, A. D., Weinheimer, A., Knapp, D. J., Montzka, D. D., Holloway, J., Weibring, P., Flocke, F., Zheng, W., Toohey, D., Wennberg, P. O., Wiedinmyer, C., Mauldin, L., Fried, A., Richter, D., Walega, J., Jimenez, J. L., Adachi, K., Buseck, P. R., Hall, S. R., and Shetter, R.: Emissions from biomass burning in the Yucatan, Atmos. Chem. Phys., 9, 5785–5812, https://doi.org/10.5194/acp-9-5785-2009, 2009.
Zhang, L., Jacob, D. J., Yue, X., Downey, N. V., Wood, D. A., and Blewitt, D.: Sources contributing to background surface ozone in the US Intermountain West, Atmos. Chem. Phys., 14, 5295–5309, https://doi.org/10.5194/acp-14-5295-2014, 2014.
Zhao, X. and Wang, L.: Atmospheric Oxidation Mechanism of Furfural Initiated by Hydroxyl Radicals, J. Phys. Chem. A, 121, 3247–3253, https://doi.org/10.1021/acs.jpca.7b00506, 2017.
- Abstract
- Introduction
- Model description
- Updating and expanding fire NMOGs in GEOS-Chem
- Exploring observational constraints on fire NMOGs
- Characterizing fire contribution to global NMOGs and atmospheric reactivity
- Conclusions
- Data availability
- Author contributions
- Competing interests
- Disclaimer
- Acknowledgements
- Financial support
- Review statement
- References
- Supplement