the Creative Commons Attribution 4.0 License.
the Creative Commons Attribution 4.0 License.
 | 14 Sep 2022
Newly identified climatically and environmentally significant high-latitude dust sources
Pavla Dagsson-Waldhauserova
Pavel Amosov
Elena Aseyeva
Cliff Atkins
Alexander Baklanov
Clarissa Baldo
Sarah L. Barr
Barbara Barzycka
Liane G. Benning
Bojan Cvetkovic
Polina Enchilik
Denis Frolov
Santiago Gassó
Konrad Kandler
Nikolay Kasimov
Jan Kavan
James King
Tatyana Koroleva
Viktoria Krupskaya
Markku Kulmala
Monika Kusiak
Hanna K. Lappalainen
Michał Laska
Jerome Lasne
Marek Lewandowski
Bartłomiej Luks
James B. McQuaid
Beatrice Moroni
Benjamin Murray
Ottmar Möhler
Adam Nawrot
Slobodan Nickovic
Norman T. O’Neill
Goran Pejanovic
Olga Popovicheva
Keyvan Ranjbar
Manolis Romanias
Olga Samonova
Alberto Sanchez-Marroquin
Kerstin Schepanski
Ivan Semenkov
Anna Sharapova
Elena Shevnina
Zongbo Shi
Mikhail Sofiev
Frédéric Thevenet
Throstur Thorsteinsson
Mikhail Timofeev
Nsikanabasi Silas Umo
Andreas Uppstu
Darya Urupina
György Varga
Tomasz Werner
Olafur Arnalds
Ana Vukovic Vimic
Dust particles from high latitudes have a potentially large local, regional, and global significance to climate and the environment as short-lived climate forcers, air pollutants, and nutrient sources. Identifying the locations of local dust sources and their emission, transport, and deposition processes is important for understanding the multiple impacts of high-latitude dust (HLD) on the Earth's systems. Here, we identify, describe, and quantify the source intensity (SI) values, which show the potential of soil surfaces for dust emission scaled to values 0 to 1 concerning globally best productive sources, using the Global Sand and Dust Storms Source Base Map (G-SDS-SBM). This includes 64 HLD sources in our collection for the northern (Alaska, Canada, Denmark, Greenland, Iceland, Svalbard, Sweden, and Russia) and southern (Antarctica and Patagonia) high latitudes. Activity from most of these HLD sources shows seasonal character. It is estimated that high-latitude land areas with higher (SI ≥0.5), very high (SI ≥0.7), and the highest potential (SI ≥0.9) for dust emission cover >1 670 000 km2, >560 000 km2, and >240 000 km2, respectively. In the Arctic HLD region (≥60∘ N), land area with SI ≥0.5 is 5.5 % (1 035 059 km2), area with SI ≥0.7 is 2.3 % (440 804 km2), and area with SI ≥0.9 is 1.1 % (208 701 km2). Minimum SI values in the northern HLD region are about 3 orders of magnitude smaller, indicating that the dust sources of this region greatly depend on weather conditions. Our spatial dust source distribution analysis modeling results showed evidence supporting a northern HLD belt, defined as the area north of 50∘ N, with a “transitional HLD-source area” extending at latitudes 50–58∘ N in Eurasia and 50–55∘ N in Canada and a “cold HLD-source area” including areas north of 60∘ N in Eurasia and north of 58∘ N in Canada, with currently “no dust source” area between the HLD and low-latitude dust (LLD) dust belt, except for British Columbia. Using the global atmospheric transport model SILAM, we estimated that 1.0 % of the global dust emission originated from the high-latitude regions. About 57 % of the dust deposition in snow- and ice-covered Arctic regions was from HLD sources. In the southern HLD region, soil surface conditions are favorable for dust emission during the whole year. Climate change can cause a decrease in the duration of snow cover, retreat of glaciers, and an increase in drought, heatwave intensity, and frequency, leading to the increasing frequency of topsoil conditions favorable for dust emission, which increases the probability of dust storms. Our study provides a step forward to improve the representation of HLD in models and to monitor, quantify, and assess the environmental and climate significance of HLD.
- Article
(11957 KB) - Full-text XML
-
Supplement
(1744 KB) - BibTeX
- EndNote


Mineral dust is an essential and relevant climate and environmental variable with multiple socioeconomic effects on, e.g., weather and air quality, marine life, climate, and health (Creamean et al., 2013; Terradellas et al., 2015; Shepherd et al., 2016; Querol et al., 2019; Nemuc et al., 2020). Mineral dust is transported from local sources of high-latitude dust (HLD, ≥50∘ N and ≥40∘ S, Bullard et al., 2016), low-latitude dust (LLD, mostly 0–35∘ N), and the so-called “global dust belt” (GDB, Prospero et al., 2002), defined as extending into the Northern Hemisphere from the western coast of northern Africa over the Middle East (western Asia), central, and East Asia and southwestern North America (Ginoux et al., 2012), with only minor sources in the Southern Hemisphere (Prospero et al., 2002; Ginoux et al., 2012; Bullard et al., 2016; Terradellas et al., 2017). Dust is often associated with hot, subtropical deserts, but the importance of dust sources at the cold, high latitudes has recently increased (Arnalds et al., 2016; Bullard et al., 2016; Groot Zwaafting et al., 2016, 2017; Kavan et al., 2018, 2020a, b; Boy et al., 2019; Gassó and Torres, 2019; IPCC, 2019; Tobo et al., 2019; Bachelder et al., 2020; Cosentino et al., 2020; Ranjbar et al., 2021; Sanchez-Marroqin et al., 2020). Dust produced at high latitudes and in cold climates (Iceland, Greenland, Svalbard, Alaska, Canada, Antarctica, New Zealand, and Patagonia) can have regional and global significance (Bullard et al., 2016). Local HLD emissions are increasingly being recognized as driving the local climate, biological productivity, and air quality (Groot Zwaafting et al., 2016, 2017; Moroni et al., 2018; Crocchianti et al., 2021; Varga et al., 2021). HLD can induce significant direct (blocking sunlight) and indirect (clouds and cryosphere) radiative forcing (Kylling et al., 2018) on solar radiation fluxes and snow optical characteristics, strongly impacting Arctic amplification, including glacier melt (Boy et al., 2019).
HLD aerosols consist of a variety of different dust particle types with various particle sizes and shape distributions as well as physical, chemical, and optical properties that differ from the crustal dust of the Sahara or American deserts (Shepherd et al., 2016; Arnalds et al., 2016; Bachelder et al., 2020; Baldo et al., 2020; Crusius, 2021). Therefore, impacts on climate, environment, and human health can differ from those of LLD. For example, Icelandic dust is of volcanic desert origin, often dark, and has higher proportions of heavy metals than crustal dust (Arnalds et al., 2016). The IPCC special report (IPCC, 2019) recognizes dark dust aerosols as a short-lived climate forcer (SLCF) and light-absorbing aerosols connected to cryospheric changes. Light-absorbing HLD particles can induce direct effects on solar radiation fluxes as SLCF and snow optical characteristics impacting cryosphere melt via radiative feedback (Peltoniemi et al., 2015; Boy et al., 2019; Dagsson-Waldhauserová and Meinander, 2019, 2020; IPCC, 2019; Kylling et al., 2018). HLD significantly affects the formation and properties of clouds (Abbatt et al., 2019; Sanchez-Marroquin et al., 2020; Murray et al., 2021).
Dust is connected to climate change: historical dust (paleo dust) is not only a contributor to climate change, but is also a record of previous dust and climate conditions (Lamy et al., 2014; Lewandowski et al., 2020). Dust can significantly contribute to air pollution mortalities (Terradellas et al., 2015; Nemuc et al., 2020). Deposition at high latitudes can provide nutrients to the marine system; mineral and organic matter on glaciers, including natural and anthropogenic dust, can form cryoconite granules. Cryoconite, dust, and ice algae can reduce surface albedo and accelerate the melting of glaciers (Lutz et al., 2016; McCutcheon et al., 2021). Monitoring dust in remote, high-latitude areas has crucial value for climate change assessment and understanding the impacts of global warming on natural systems and socioeconomic sectors. Bullard et al. (2016) summarized natural HLD sources as covering over 500 000 km2 and producing particulate matter of ca. 100 Mt dust per year.
Dust emissions respond to changes in wind speed, soil moisture, and other parameters affected by climate change; changes in land cover and surface properties by human activities can affect dust emissions (Kylling et al., 2018). The fundamental processes controlling aeolian dust emissions at high latitudes are essentially the same as in temperate regions. However, there are other processes specific to or enhanced in cold regions. Low temperatures, humidity, strong winds, permafrost, and niveo-aeolian processes, which can affect the efficiency of dust emission and distribution of sediments, were listed in Bullard et al. (2016).
The modeling of emissions, transport, and deposition complemented with available observations can provide essential information related to dust's impact on the climate and environment at the high latitudes (IPCC, 2019). The locations and characteristics of local dust sources are two of the major observations documented for inputting information into numerical models to predict or simulate the HLD process from its emission to downwind deposition. In some cases, model results can indicate possible but not yet identified dust sources in the HLD regions. A general lack of observational and long-range transport modeling studies results in poor HLD monitoring and predicting. Models have predictive capacity and, without the observations, can constitute a source of information and indicate where more direct observations are needed. The first long-range transport modeling studies show that the main transport pathways from HLD sources clearly affect the High Arctic (>80∘ N) and European mainland (Baddock et al., 2017; Beckett et al., 2017; Đorđević et al., 2019; Groot Zwaafting et al., 2016, 2017; Moroni et al., 2018). The World Meteorological Organization Sand and Dust Storm Warning Advisory and Assessment System (WMO SDS-WAS) monitors and predicts dust storms from the world's major deserts (https://community.wmo.int/activity-areas/gaw-sand-and-dust-storm-warning-advisory-and- assessment-system-sds-was, last access: 17 August 2022), where HLD sources have recently been included in the SDS-WAS dust forecasts. Europe's largest desert is at a high latitude in Iceland (Arnalds et al., 2016), with dust transport observed over the North Atlantic to European countries (Ovadnevaite et al., 2009; Prospero et al., 2012; Beckett et al., 2017; Đorđević et al., 2019).
HLD is a short-lived climate forcer, air pollutant, and nutrient source, showing the need to identify the geographical extent and dust activity of the HLD sources (Arnalds et al., 2014, 2016; Dagsson-Waldhauserová et al., 2014, 2015; Terradellas et al., 2015; USGCRP, 2018; IPCC, 2019). Bullard et al. (2016) designed the first HLD map based on visibility and dust observations, combined with field and satellite observations of HLD storms, resulting in 129 locations described in 39 papers. Here, we compile and describe 64 HLD sources at the northern and southern high latitudes. This work's main aim is to
- i.
identify new and previously unpublished HLD sources,
- ii.
estimate the high-latitude land area with potential dust activity and calculate the source intensity (SI) for the identified sources,
- iii.
provide model results on HLD emission, long-range transport, and deposition at various scales of time and space, and
- iv.
specify key climatic and environmental impacts of HLD and related research questions, which could improve our understanding of HLD sources, with the help of literature surveys on clouds and climate feedback, atmospheric chemistry, marine environment, cryosphere, and cryosphere–atmosphere feedbacks.
We focus on high latitudes with natural dust sources and include some anthropogenic dust sources, such as road dust, when unpaved roads serve as a significant dust source. Direct emissions of volcanic eruptions and road dust formed via abrasion and wear of pavement or traction control materials are excluded. Identifying dust sources is the first step to understanding the HLD life cycle (dust emission, transport, and deposition). After that, impacts and feedback mechanisms can be identified and quantified as physical, chemical, and optical properties of dust from these source areas. Their properties during emission, transport, and deposition are needed to be characterized to allow a holistic understanding.
2.1 Identification and characteristics of dust sources
Three topical workshops in Russia, Finland, and Iceland (Meinander et al., 2019a, b) on HLD were organized in 2019 to identify, describe, and assess new HLD sources (≥50∘ N and ≥40∘ S, according to Bullard et al., 2016, and including the Arctic as a subregion at ≥60∘ N). The HLD source map and observations on dust properties provided here are based on
- i.
new field and satellite observations not described in published academic papers,
- ii.
newly identified HLD source locations reported in the recent literature but not included in previous collections, and
- iii.
updated observations on previously documented sources.
Each location was assessed to classify each source: category 1 refers to an active dust source with high ecological significance, category 2 to a semi-active source with moderate ecological significance, and category 3 to new sources with unknown activity and importance. Moreover, SI values for each HLD location at the northern and southern (Antarctica and Patagonia) high latitudes were quantified, and the potential land surface area for dust emissions in the northern, Arctic, and southern HLD regions was calculated (Sect. 2.2).
2.2 HLD from the UNCCD G-SDS-SBM
The Global Sand and Dust Storms Source Base Map (G-SDS-SBM), developed by the United Nations Convention to Combat Desertification (UNCCD) in collaboration with the United Nations Environment Programme (UNEP) and World Meteorological Organization (https://maps.unccd.int/sds/, last access: 17 August 2022; Vukovic, 2019, 2021), represents gridded values of SDS SI (values 0 to 1) at a resolution of 30 arcsec. The Source Base Map was developed by including the information on soil texture, bare land fraction, and NASA satellite Moderate-resolution Imaging Spectroradiometer Enhanced Vegetation Index, MODIS EVI, as well as the data on land cover, topsoil moisture, and temperature. Values of SI represent topsoil's potential to emit soil particles under windy conditions, assigning the highest values of SI to the most productive surfaces. SI values are derived under the assumption that they are exposed to the same velocity of surface wind. Input data, which change depending on the weather (and possibly human activities) for bare land fraction, moisture, and temperature data, are defined for 4 months (January, April, July, October – each month representing one season) by using extreme values. This was observed from 2014 to 2018, providing favorable conditions for surfaces to act as sources. Thus, sources that may appear during heat waves and drier conditions (or drought), when the surface at high latitude is unfrozen, snow-free, and more susceptible to wind erosion, are included in this map. Such weather extremes under climate change are becoming more frequent and are projected to increase (IPCC, 2013), justifying the source mapping approach using the information on extreme topsoil conditions. Using the maps produced for the four seasons, maximum and minimum values are determined for each grid point to explore the potential of high-latitude land surfaces to act as dust sources and their seasonality and to compare values of SI with marked locations of HLD sources.
2.3 Methods used to identify and study the dust sources
Various methods identified the HLD sources (Table 1), including direct observations and measurements, satellite data, emission, long-range transport, and deposition modeling and media, social media, and literature sources (e.g., web pages, conference abstracts). More details and literature references can be found in each source section. Dust emission, long-range transport, and deposition modeling calculations were made to study whether the HLD sources have local, regional, or global significance. Two well-established dust atmospheric models – SILAM and DREAM – were used to simulate the atmospheric dust process over high latitudes. Both models have been thoroughly evaluated for other deserts, where the accuracy of their results has been verified.
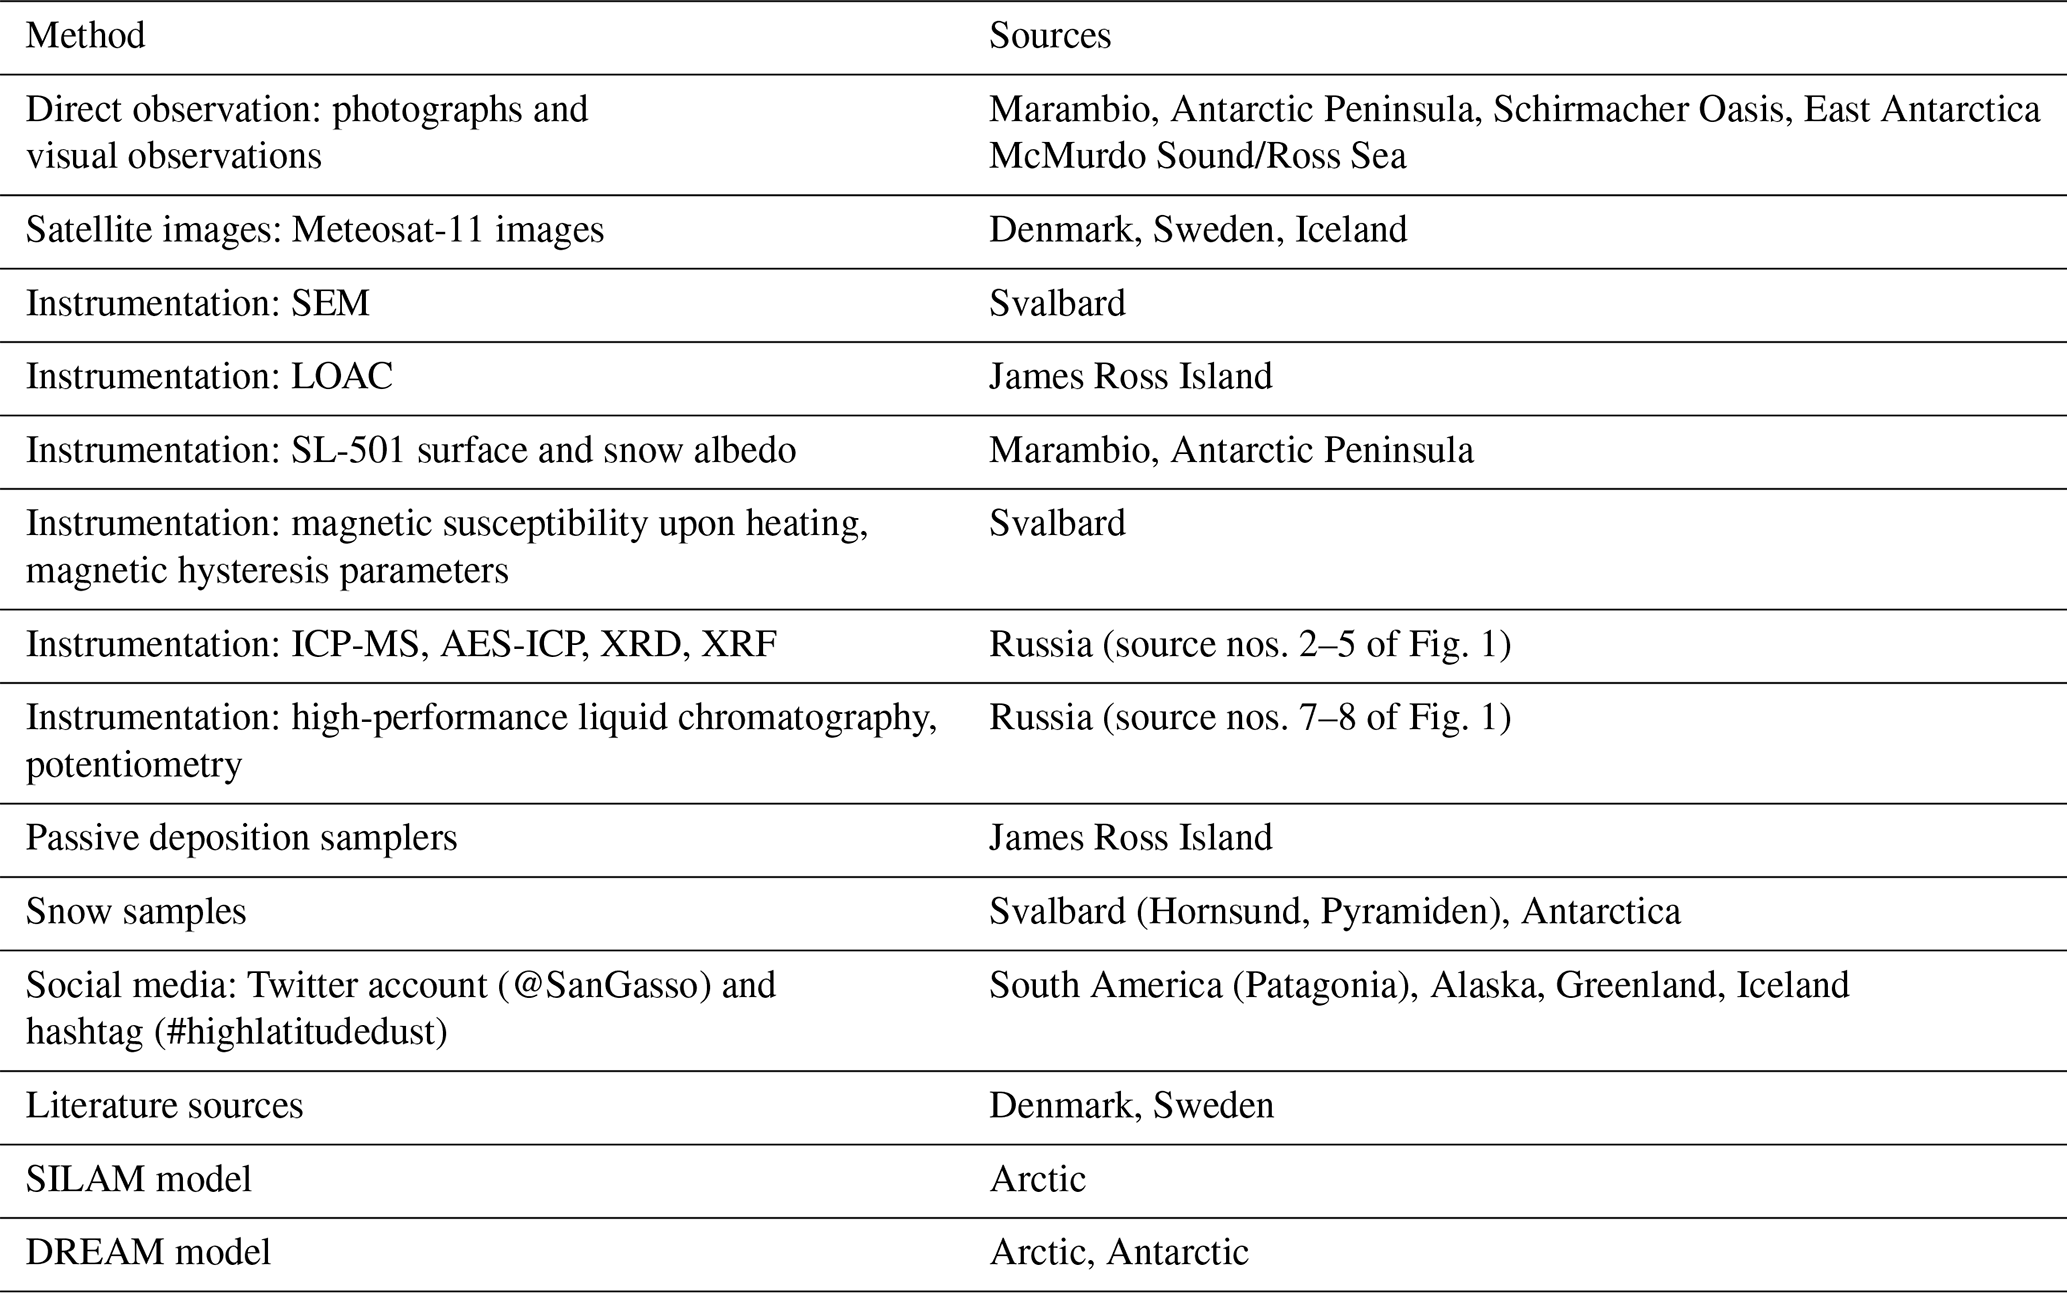
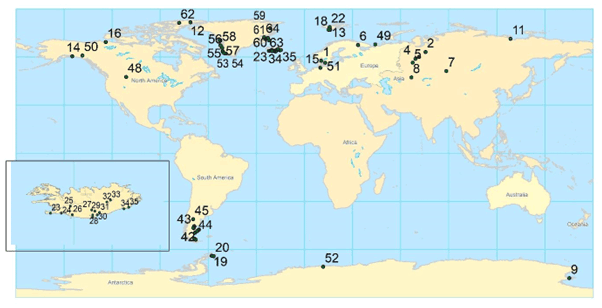
Figure 1Map of the locations of the northern (north of 50∘ N) and southern (south of 40∘ S) high-latitude dust (HLD) sources identified and included in this study. The numbers are the identified 64 dust sources, as shown in Fig. 1.
Estimates of the emission and deposition of global and Arctic dust were computed separately to assess Arctic dust's global impact using the SILAM model (Sofiev et al., 2015) – a global- to meso-scale atmospheric dispersion and chemistry model – applied for air quality and atmospheric composition modeling. The dust emission estimate is driven by the European Centre for Medium-Range Weather Forecasts (ECMWF) IFS meteorological model at a resolution of 0.1×0.1∘. The computations were performed using ECMWF ERA5 meteorological reanalysis data for 2017 at a resolution of 0.5×0.5∘. The dust emission model was validated against AERONET (AErosol RObotic NETwork, https://www.aeronet.com/, last access: 17 August 2022) aerosol optical density (AOD) data and provided unbiased results for the main dust emission areas. For Arctic areas, where dust does not contribute to the AOD as much, the simulated AOD from all aerosols is unbiased concerning the measurements. While the simulation's relatively coarse resolution cannot capture the smaller point-like dust sources, it is still expected to give a good approximation of the overall patterns and magnitudes of dust emission and deposition. The SILAM results are presented in Sect. 3.3 (Fig. 4) and 3.4 (Figs. 12 and 15).
DREAM is a fully dynamic numerical prediction model for atmospheric dust dispersion originating from soil. The dust component of this system (Pejanovic et al., 2011; Nickovic et al., 2016) is online and driven by the atmospheric model Nonhydrostatic Mesoscale Model on E-Grid (Arakawa E-grid) (NMME) (Janjic et al., 2001). Dust concentration in the model is described with eight particle bins, with radii ranging from 0.18 to 9 µm. DREAM-ICELAND is the model version to predict dust transport emitted from Iceland's largest European dust sources (Cvetkovic et al., 2021). The size distribution of particles in the model is specified according to in situ measurements in the Icelandic hotspots. The model horizontal resolution of ∼3.5 km is sufficiently fine to resolve the Icelandic dust sources' rather heterogeneous and small-scale character. As the first operational numerical HLD model in the international community, DREAM-ICELAND is used daily, having predicted Icelandic dust since April 2018. DREAM results are included in Sect. 3.4 (Figs. 8 and 11) and 3.6 (Fig. 16) and as a supplementary animation (available through a link in the Supplement).
3.1 Locations of the HLD sources
Sixty-four HLD sources at northern and southern high latitudes (Fig. 1) were identified. In the northern HLD region are 49 locations (47 locations ≥50∘ N and 2 >47∘ N) in Alaska, Canada, Denmark, Greenland, Iceland, Svalbard, Sweden, and Russia, of which 35 are in the Arctic HLD subregion (≥60∘ N). In the southern HLD region (≥40∘ S), 15 sources were identified in Antarctica and Patagonia, South America. The sources included the boreal, remote, rural, mountain, marine and coastal Arctic and Antarctic, river sediments, mining, unpaved roads, soils (Podzols, Retisols, Gleysols, Phaeozems, and Stagnosols; USS Working Group WRB, 2015), and glacial dust. The observational periods for these locations varied from days or weeks to multiple years and included data from ground-based measurements, remote sensing data, and modeling results. Results on the calculated SI and areas of high-latitude surface land with higher (SI ≥0.5), very high (SI ≥0.7), and the highest (SI ≥0.9) potentials for dust emission are shown in Sect. 3.2. Observations and characteristics of the identified dust sources in our collection (Fig. 1) are presented in Sect. 3.4 and Tables S1–S7 in the Supplement (including the contemporary classification for each source into categories 1–3, based on the currently available observations, in Table S1, satellite observations on new HLD sources in Iceland in Table S2, observations on new HLD sources in Greenland and Canada in Table S3, SI values for each source in Tables S4 and S5, including latitude and longitude, and results from Russian HLD sources in Tables S6–S7).
3.2 SI from UNCCD G-SDS-SBM
Figure 2 presents the G-SDS-SBM SI values (maximum and minimum) for the northern HLD region. The northern HLD region includes the area north of latitude 50∘ N and the Arctic region (as a subregion of the HLD region) north of 60∘ N. HLD sources show extreme seasonal characteristics, with some exceptions. The sources appear and disappear (or change SI values) seasonally or appear (or increase SI values) only during favorable extreme weather conditions. Figure 3 shows G-SDS-SBM SI values for the southern HLD region (south of 40∘ S) without values for Antarctica since G-SDS-SBM does not include areas south of 60∘ S. Tables S4 and S5 give the values of SI for specific locations marked in Fig. 1. Further analysis consists of assessing the areal coverage of sources, with different thresholds for SI values in absolute values (km2) and the percentage they occupy concerning the total land surface area in the defined HLD regions.
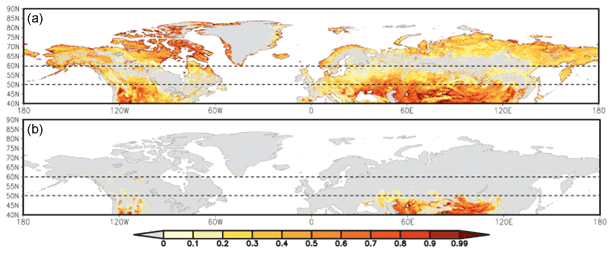
Figure 2UNCCD Global Sand and Dust Storms Source Base Map (G-SDS-SBM) for annual maximum (a) and minimum (b) SI for the northern HLD region and Arctic subregion (north of 50 and 60∘ N, respectively, marked with dashed lines).
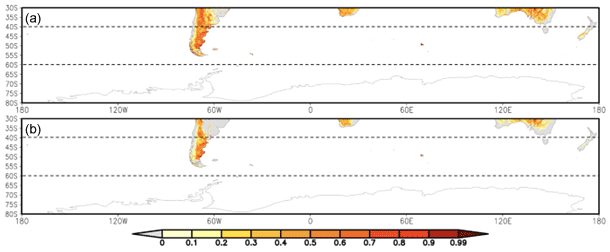
Figure 3UNCCD G-SDS-SBM for annual maximum (a) and minimum (b) SI for the southern HLD region (south of 40∘ S) without Antarctica (south of 60∘ S), marked with dashed lines.
The total surface area of dust sources with a higher potential for dust emission (SI ≥0.5) over the northern HLD region (north of 50∘ N) is 3.9 % of the total land surface (1 364 799 km2). The area with a very high potential for dust emission (SI ≥0.7) is 1.5 % (509 965 km2). The area with the highest dust emission potential (SI ≥0.9) is 0.7 % of the total land area (233 336 km2) (Table 2). In the Arctic region (north of 60∘ N) – the subregion of the northern HLD area – dust sources with a higher potential for dust emission (SI ≥0.5) are 5.5 % of the total land surface (1 035 059 km2). The area with a very high potential for dust emission (SI ≥0.7) is 2.3 % (440 804 km2). The area with the highest dust emission potential (SI ≥0.9) is 1.1 % (208 701 km2). The surface of dust-productive areas with minimum seasonal SI values in the northern HLD region is about 3 orders of magnitude smaller than the maximum, meaning the northern HLD sources greatly depend on weather conditions. Maximum surfaces contain dust-productive regions that are defined under the most favorable weather conditions for soil exposure to wind erosion (including extreme weather). All sources defined here are not necessarily active every year or in the same period, meaning these surfaces can seasonally or occasionally (under severe weather) appear as dust sources.
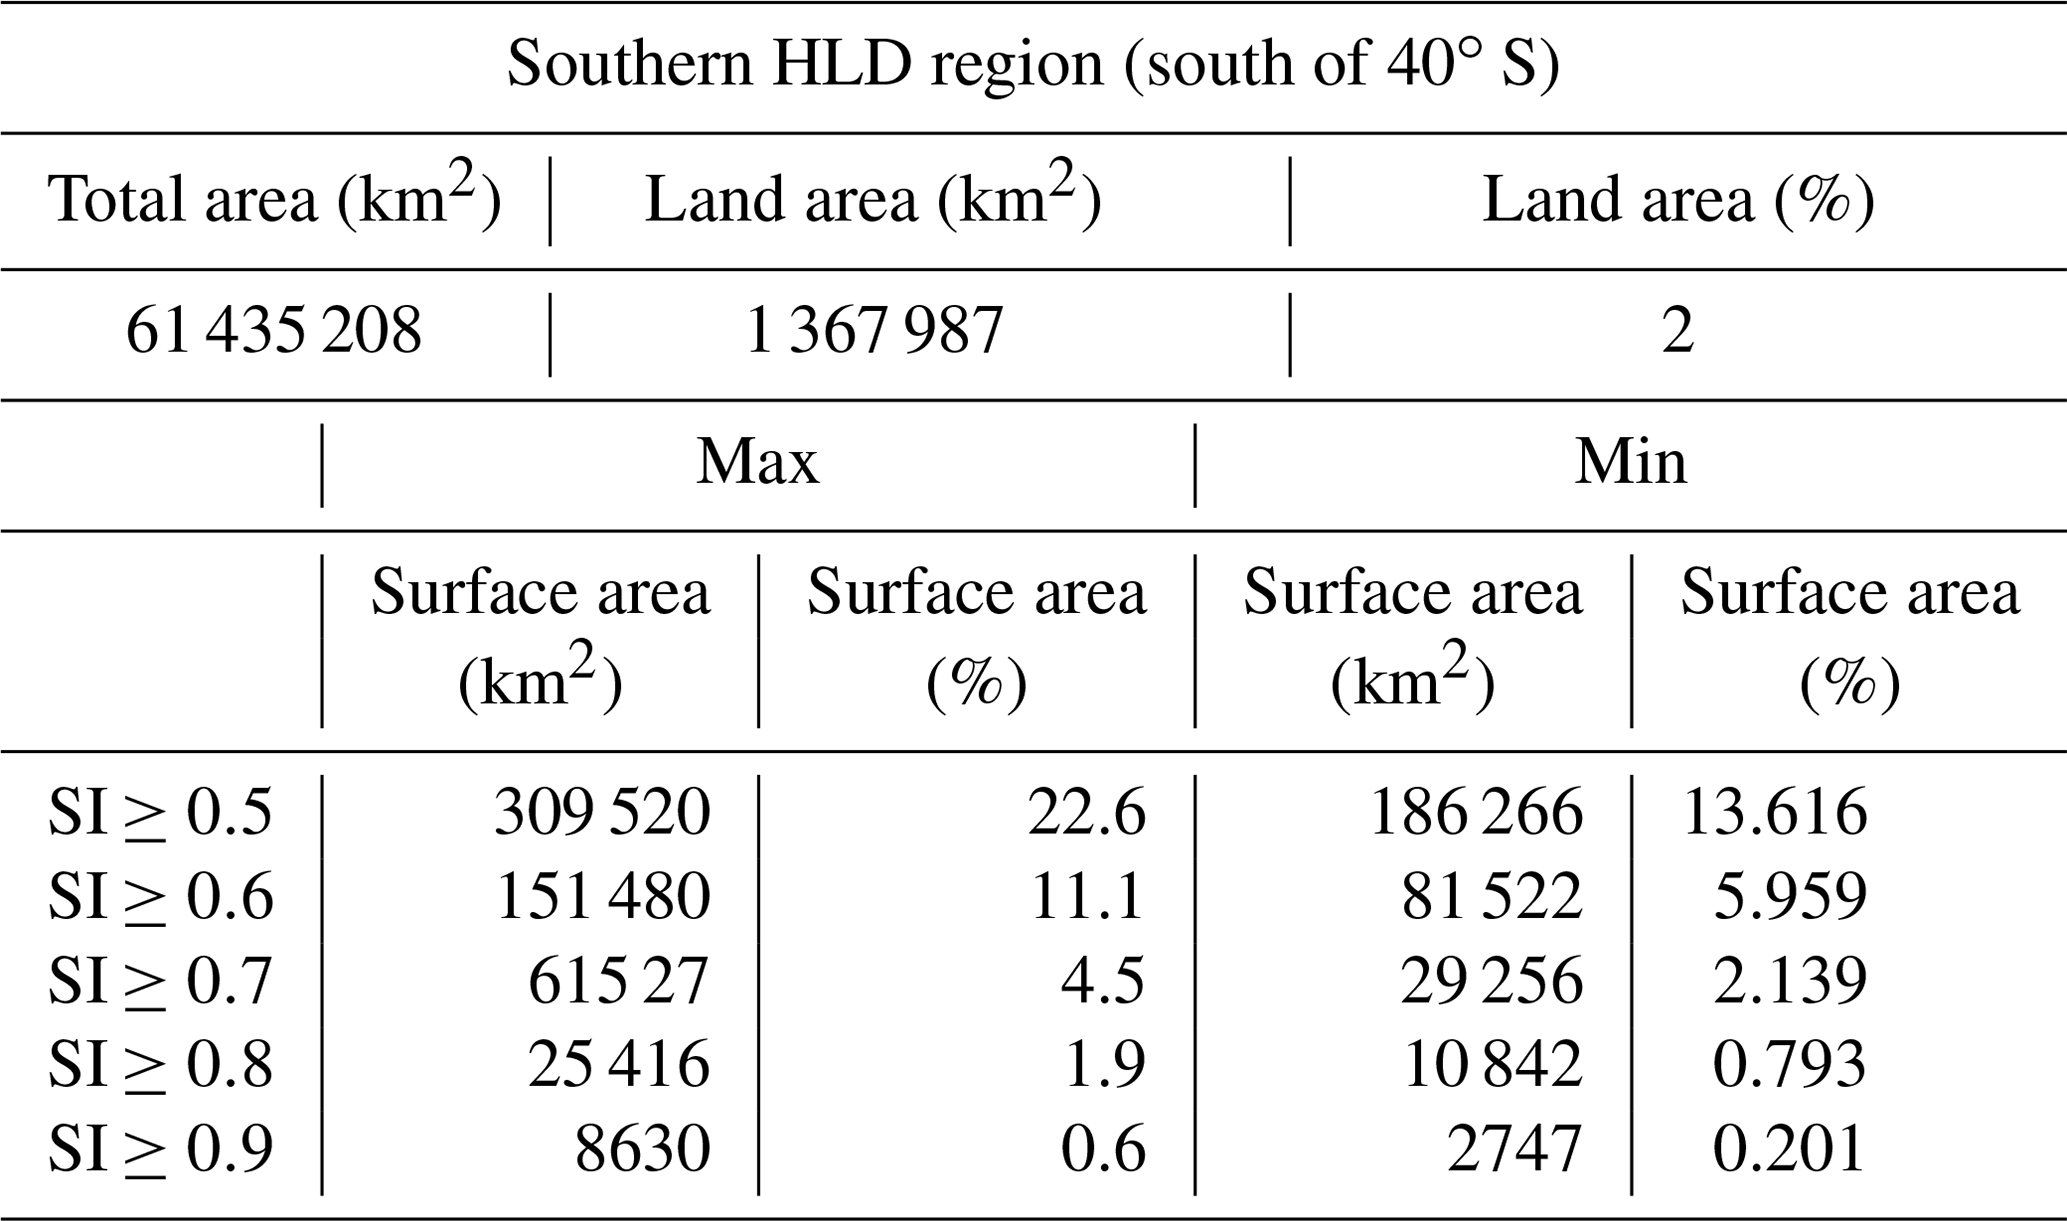
For the southern HLD region (40–60∘ S, area without Antarctica), the land surface is only 2 % of the total surface area (Table 3). The surface area of dust sources with SI ≥0.5 is 22.6 % of the total land surface (309 520 km2). The area with SI ≥0.7 is 4.5 % (61 527 km2). The area with the highest dust emission potential (SI ≥0.9) is 0.6 % (8630 km2). The surface areas for minimum SI values above these thresholds are 2 to 3 times smaller than the surfaces for maximum SI values compared to the difference in the northern HLD region. This means that soil surface conditions in the southern HLD region are favorable for dust emission over the whole year. Especially in locations of HLD markers, SI maximum and minimum values do not change over most locations or decrease by 0.1 or 0.2, except for one location (no. 38), which has SI values changing from 0.9 to 0 at the location of an HLD marker.
Table 2Relevant surfaces for the northern HLD and Arctic regions: surface of total area of the region, surface of land area within the region (km2 and % of the total surface), and total surface (km2 and % of the land surface) of areas with SI values above thresholds (0.5 for surfaces with at least “higher” dust emission potential, 0.7 for surfaces with at least “high” dust emission potential, and 0.9 for surfaces with the “highest” dust emission potential) in maximum (max) and minimum (min) seasonal values; values are derived from UNCCD G-SDS-SBM.
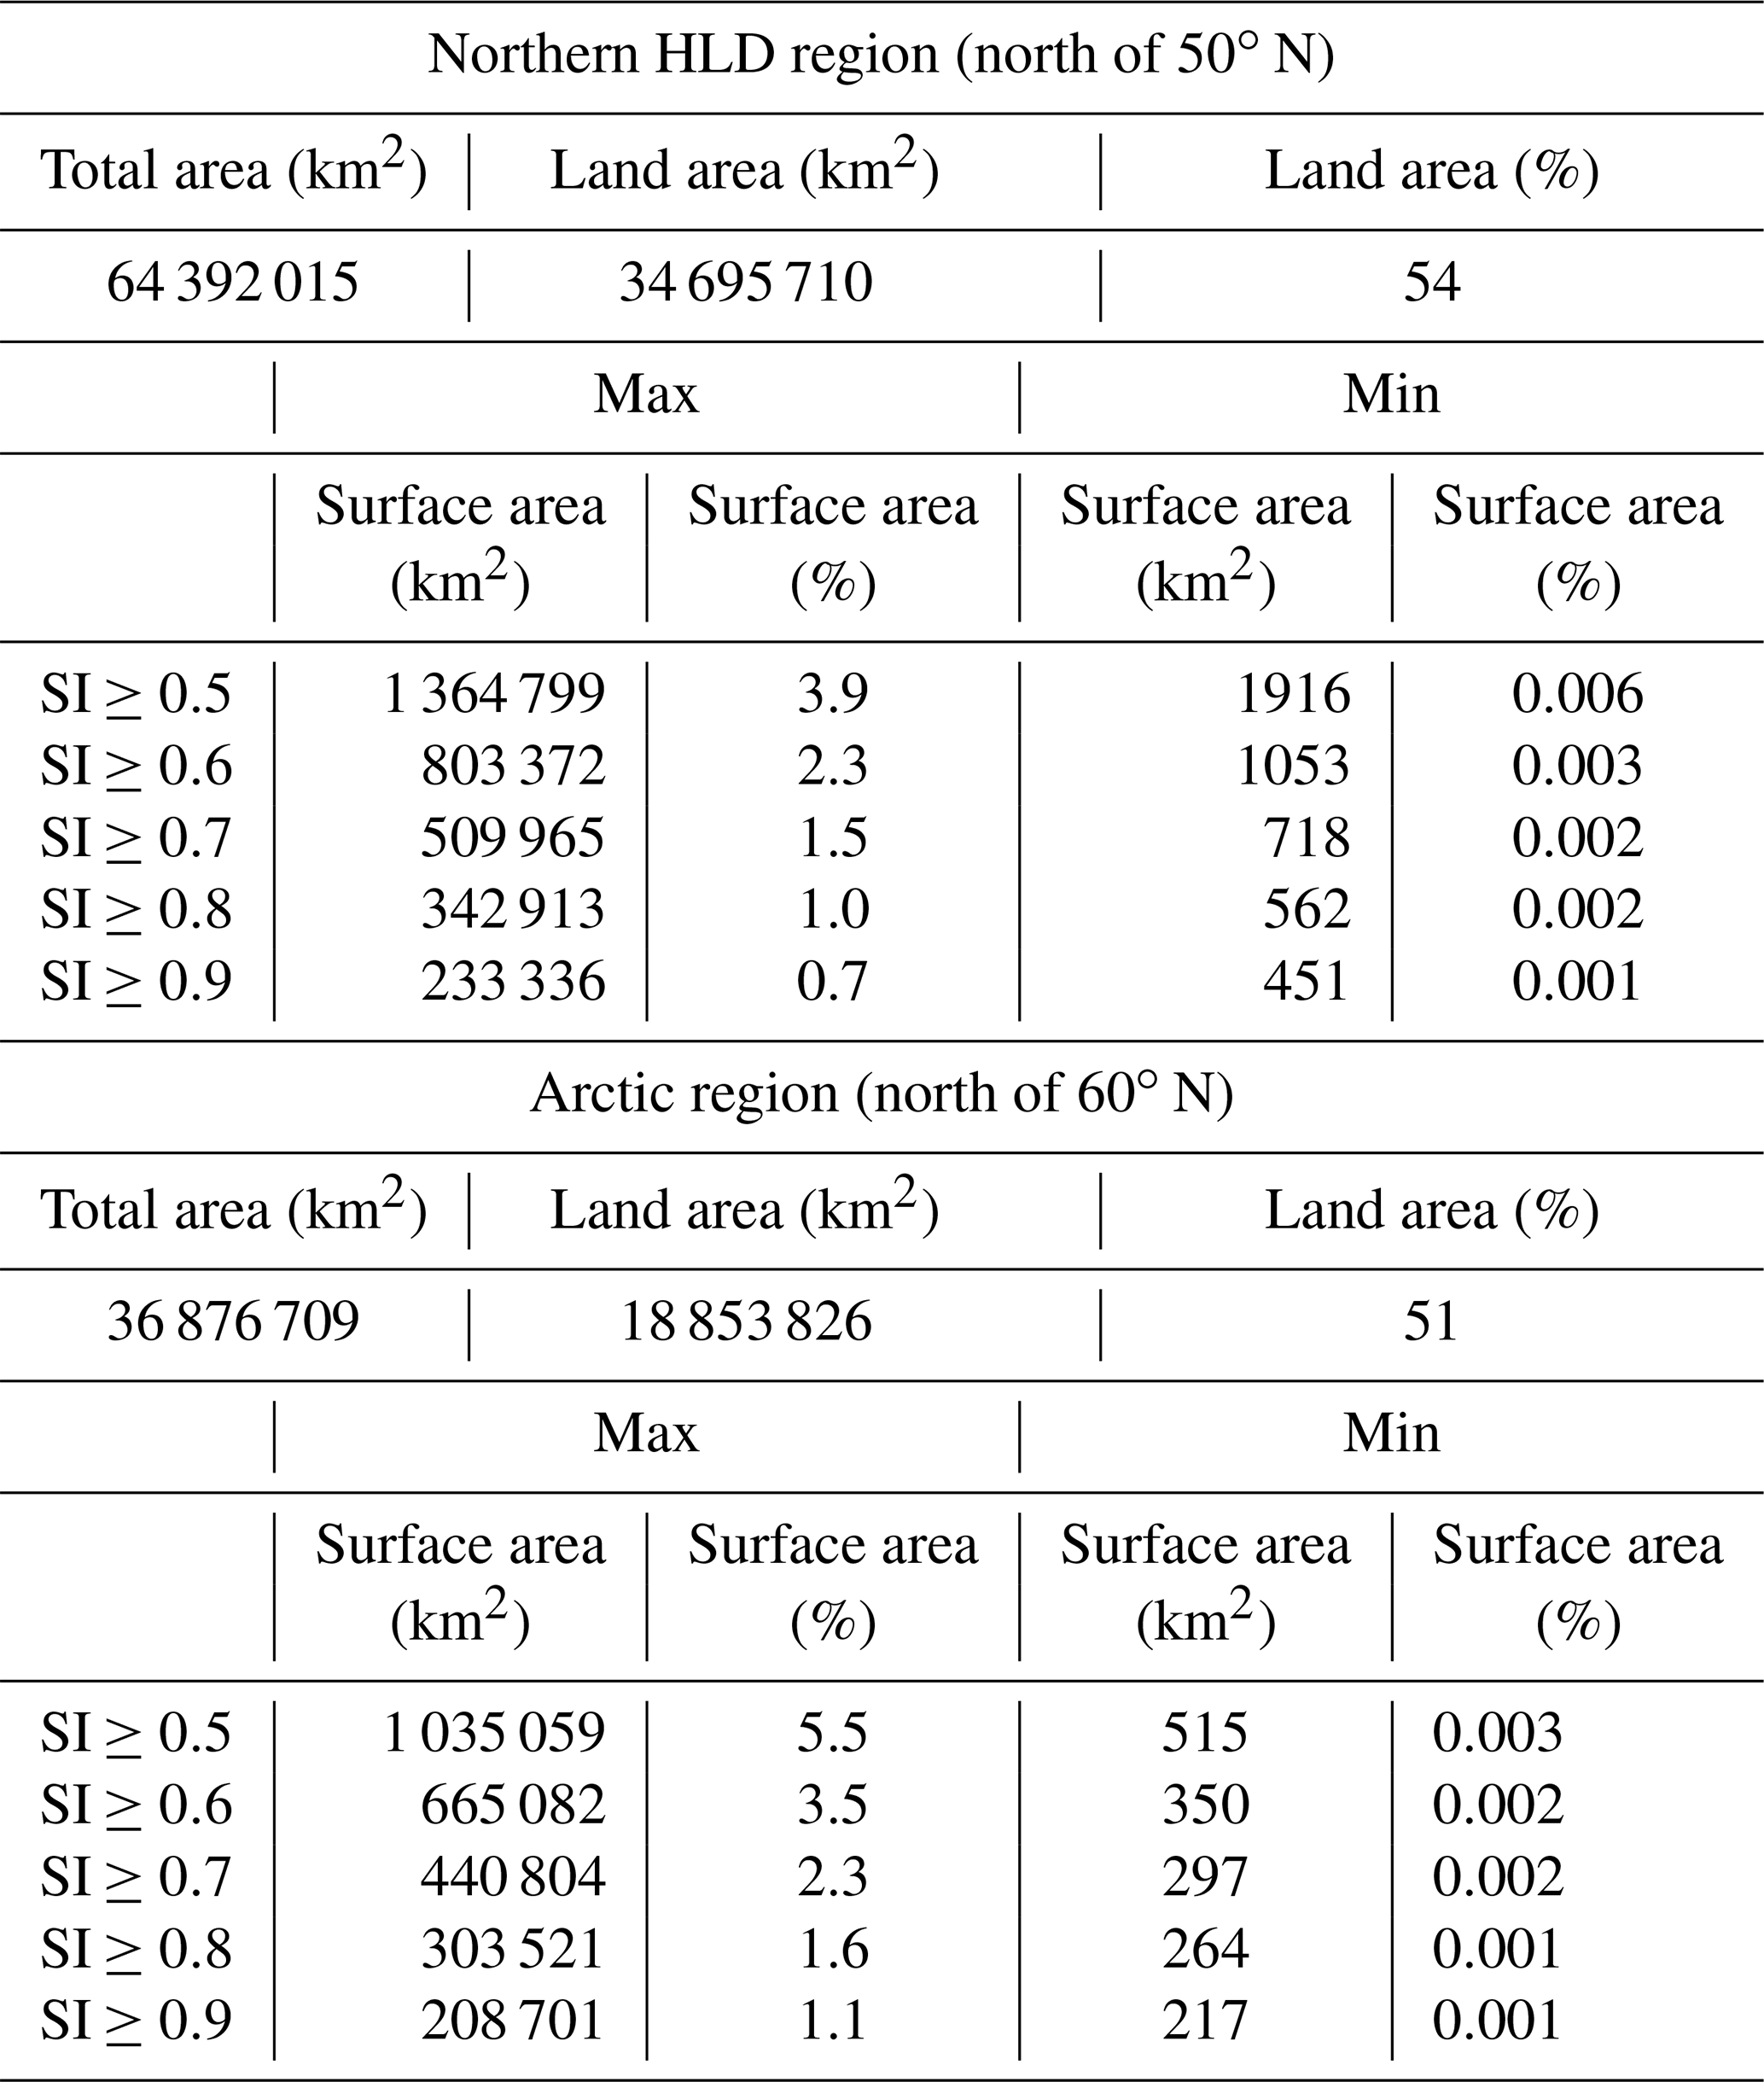
Table 3Relevant surfaces for the southern HLD region: surface of the total area of the region, surface of land area within the region (km2 and % of the total surface), and total surface (km2 and % of the land surface) of areas with SI values above thresholds (0.5 for surfaces with at least “higher” dust emission potential, 0.7 for surfaces with at least “high” dust emission potential, and 0.9 for surfaces with the “highest” dust emission potential) in maximum (max) and minimum (min) seasonal values; values are derived from UNCCD G-SDS-SBM.
3.3 Emission and deposition of global and Arctic dust
The SILAM model estimated the total emission of annual dust and its deposition (data for 2017) onto snow-covered land, frozen sea, and total sea surfaces (frozen and non-frozen) (Fig. 4). The computations were also performed for Arctic dust and total global dust, with results for overall dust (diameter less than 30 µm) and fine dust (diameter less than 2.5 µm) separately (Fig. 15 of Sect. 3.5). Based on the model, the total emission of Arctic dust equals approximately 1.0 % of the globe's total dust emission. The deposition of Arctic dust onto snow- and ice-covered surfaces equals about 19 % of the total dust deposition onto these areas and about 57 % of the deposition onto the areas explicitly located in the Arctic region. For fine dust, the corresponding figures are 7 % and 22 %. Compared to the deposition of black carbon (anthropogenic sources and wildfires combined; Fig. 15 of Sect. 3.5) onto snow and ice, the deposition of fine Arctic dust is about 70 % higher globally and around 580 % higher in the Arctic regions. While these figures provide a general quantification of the deposited amounts, detailed calculations of the thermal and optical properties of dust and black carbon deposited on snow would be required to compare the deposited substances' net impacts on the climate.
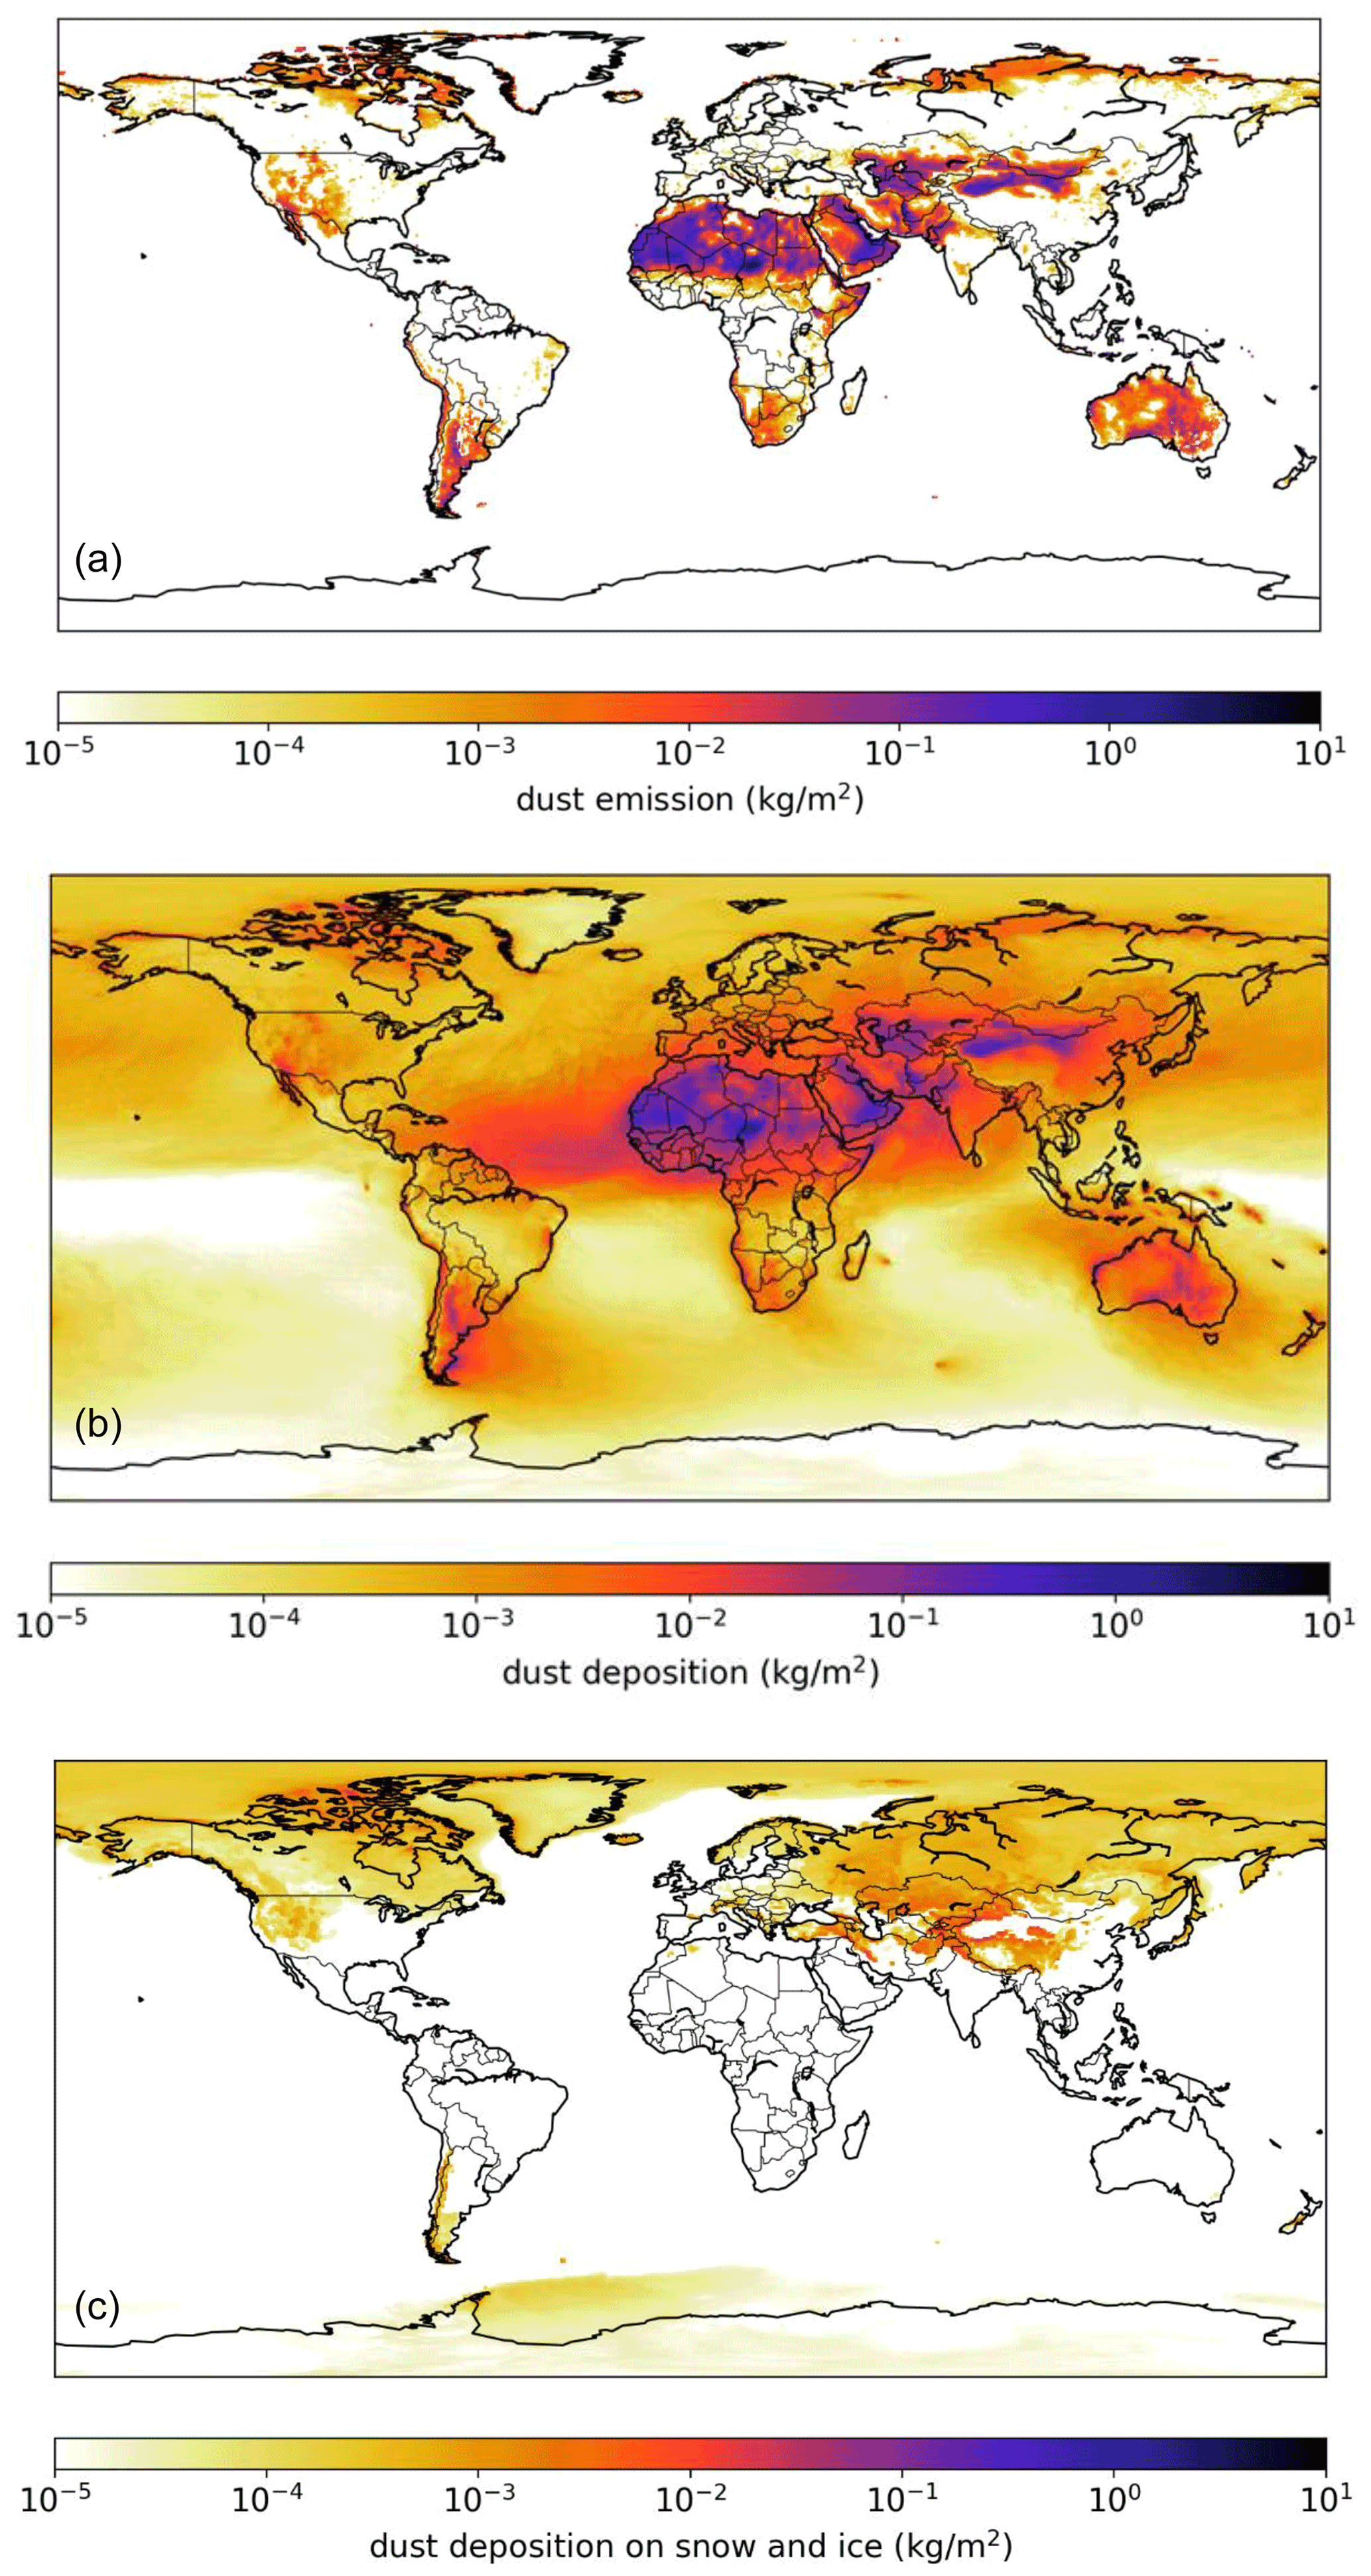
Figure 4SILAM emission and deposition modeling results of dust emission (a), dust deposition (b), and dust deposition on snow and ice (c) (kg per m2).
3.4 The identified dust sources
Observations of the identified 64 dust sources in our collection (Fig. 1) are presented and discussed in alphabetical order as follows: (1) Alaska (source nos. 14 and 50 in Fig. 1); (2) Antarctica (nos. 9, 19, 20, and 52); (3) Canada (no. 2, 16, 48, and 62); (4) Denmark and Sweden (nos. 1, 15, and 51); (5) Greenland (nos. 53–61 and 64); (6) Iceland (nos. 23–45); (7) Russia (nos. 2–11); (8) South America and Patagonia (nos. 17, 21, 46, 47, 49, 52, and 63); (9) Svalbard (no. 13, 18, and 22). Dust events originating simultaneously from Greenland, Iceland, and North America are demonstrated as a supplementary animation (available through a link in the Supplement). The numbers are the identified 64 dust sources shown in Fig. 1. Additional information, including latitude, longitude, and SI values, can be found in the Supplement (Tables S1–S4).
3.4.1 Alaska, Copper River Valley, USA
Alaskan dust sources were identified over a century ago (Tarr and Martin, 1913). However, limited satellite detection due to abundant cloud cover and an isolated location resulted in sparse information on this region (Crusius et al., 2011). The main identified sources are piedmont glaciers (Malaspina, Bering), resuspension of ash from past eruptions (Hadley et al., 2004), and major rivers carrying glacial sediment (Copper, Yukon, Tanana, and Alsek) (Gassó, 2020a, b; 2021a, b). Resuspension of glacial dust transported by these rivers can be abundant, often triggering air quality alerts by the Alaska Department of the Environment (USGCRP, 2018). The largest and most active of such dust sources is the Copper River (Fig. 5), estimated to transport 69 Mt of suspended sediment annually (Brabets, 1997). Transported sediment is deposited on the Copper River Delta, an alluvial floodplain covering an area of 2800 km2. When conditions allow, sediment is resuspended, resulting in dust plumes that can extend hundreds of kilometers over the Gulf of Alaska. Dust events, often lasting several days or weeks (Schroth et al., 2017), are most common in late summer and fall, when the river discharge and snow cover are at their minimum and high wind speeds are commonplace (Crusius, 2021). However, these occurrences have been observed year-round (Gassó, 2021a; January 2021). Dust reaches the open waters beyond the continental shelf and the influence of coastal sediments (Crusius et al., 2017). Thus, it has been proposed that dust from coastal sources such as the Copper River Delta can be an important source of bioavailable iron in the Gulf of Alaska (Crusius et al., 2011; Crusius, 2021; Schroth et al., 2017). Further work is also needed to investigate the relative importance of dust emissions from Alaska and East Asia (Bishop et al., 2002) in other areas. Also, dust from this region may initiate ice production in supercooled clouds, which is crucial for climate feedback (Murray et al., 2021). Regarding the magnitude and seasonal variability of emissions of sources in southern Alaska, a few dedicated studies have focused on dust from the Copper River Delta (Crusius et al., 2017; Schroth et al., 2017; Crusius, 2021). However, to our knowledge, no dust activity and source characterization have been carried out along the coast of the Gulf of Alaska. Moreover, resuspended road dust is a major air quality issue throughout Alaska.
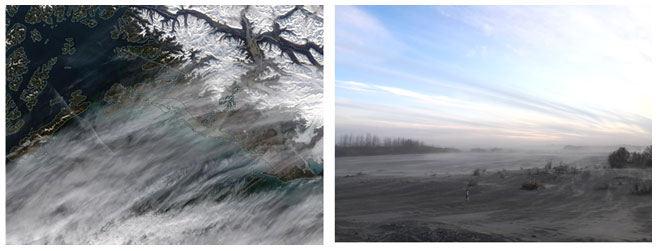
Figure 5Satellite image (left) of the Copper River region and photo (right) taken at the Copper River Delta on the same day (14 October 2019). The common occurrence of clouds prevents direct viewing of the dust in suspension, illustrating the difficulty in observing dust activity from space. (Satellite image from NASA Worldview; photo by Sarah Barr.)
3.4.2 Antarctica
James Ross Island, Ulu Peninsula
The northern part of James Ross Island – Ulu Peninsula – represents one of Antarctica's largest ice-free areas (312 km2). Its bare surface, consisting mainly of weathered sedimentary rocks, is an active HLD source (Kavan et al., 2018). Suspended sediments originate from outside the local fluvial systems based on the elemental ratios of and (Kavan et al., 2017). The wind speed threshold of 10 m s−1 is needed for activating local dust sources, with most of the particles captured (by mass) in size bins between 2.5 and 10 µm. Mean (median) mass concentrations of the PM10 were 6.4±1.4 (3.9±1) µg m−3, while the PM2.5 was 3.1±1 (2.3±0.9) µg m−3 for the whole measurement period from January to March 2018. Mean PM10 values are comparable to background stations in northern Europe. The highest daily aerosol concentration was 57 µg m−3 for PM10, with hourly PM10 with >100 µg m−3. Higher aerosol concentration occurs in late austral summer, when the soil water content in the upper soil layer is significantly lower than in early summer. Long-range transport of dust originating in Patagonia was observed during aerosol measurements (Kavan et al., 2018). A higher proportion of long-range-transported dust was found in snow pits on higher elevated glaciers compared to a higher proportion of locally transported dust in lower elevated glaciers (Kavan et al., 2020b). Kňažková et al. (2020) identified a redistribution of mineral material within the HLD source area in Abernethy Flats, impacting the local microtopography.
Marambio, Antarctic Peninsula
Marambio Base (64∘14′ S, 56∘37′ W; 198 m a.s.l.) on Marambio island, Graham Land, Antarctic Peninsula, is a member of the Global Atmosphere Watch (GAW) program of the WMO, with personnel available year-round. This region has ice-free areas and cold desert soils (Cryosols) that can be seasonally susceptible to wind erosion and weathering. The removal of fine materials occurs mainly by wind action. The Finnish–Argentinian co-operative research in Marambio includes measurements of ozone, solar irradiance, aerosols, and ultraviolet (UV) albedo (Aun et al., 2020). The UV Biometer Model 501 from Solar Light Co. (SL501) UV albedo data of 2013–2017 in Marambio were used to analyze the effects of local HLD on measured snow UV albedo and solar UV irradiance and differences in simulated UV irradiances (Meinander et al., 2018; data not presented here). For validating the UV albedo data, surface photos were taken regularly. The surface photos and UV albedo measurements show that local dust can be detected on the snow and ice. Also, the optical dome of the SL-501 sensor was found to be sandblasted by the windblown dust when returning to Finland for maintenance. These findings suggest that, in Marambio, local dust can decrease surface snow/ice albedo, possibly enhance the cryosphere melt, and contribute to warming in the Antarctic Peninsula due to the ice-albedo feedback mechanism.
McMurdo Sound, Antarctica
The McMurdo Sound area of the Ross Sea region is widely recognized as the dustiest place in Antarctica, where locally sourced aeolian accumulation is up to 2 to 3 orders of magnitude above global background and dust fallout rates for the continent (Chewings et al., 2014; Winton et al., 2014). The area includes the McMurdo Dry Valleys (MDVs), the largest ice-free area (4800 km2) in Antarctica. The MDVs have high but extremely variable fluxes of locally derived aeolian sand (e.g., Speirs et al., 2008; Lancaster et al., 2010; Gillies et al., 2013; Diaz et al., 2020) and common aeolian landforms. This has led to the assumption that the MDVs are a significant regional dust source (e.g., Bullard, 2016). Some modeling studies suggest the MDVs could supply large volumes of dust to a wide area of the Southern Ocean (e.g., Bhattachan et al., 2015). However, field-based observations show that very little sediment is transported out of the MDVs (Ayling and McGowan, 2006; Atkins and Dunbar, 2009; Chewings et al., 2014; Murray et al., 2013) because the valleys have already been extensively winnowed into a well-developed deflation surface and large coastal piedmont glaciers form a topographic barrier, preventing aeolian sediment from escaping. The dominant source of aeolian sediment in the McMurdo Sound area is the debris-covered surface of the McMurdo Ice Shelf (1500 km2), with minor contributions from local ice-free headlands. This ice shelf is unusual because it has high surface ablation and a continuously replenishing supply of fine-grained sediment advected from the seafloor. The sediment is blown off the ice shelf by frequent intense southerly wind events, forming a visible sediment plume onto coastal sea ice. Within a few kilometers of the ice shelf, accumulation rates on sea ice are up to 55 g m−2 yr−1, reducing rapidly downwind to an average of 1.14 g m−2 yr−1, equating to 0.6 kt yr−1 of aeolian sediment entering McMurdo Sound annually (Atkins and Dunbar, 2009; Chewings et al., 2014). Some sediment is transported at least 120 km from the source and could travel much farther, contributing iron-rich dust to the Ross Sea (Winton et al., 2014). Coastal areas and lowland parts of the MDVs are on the threshold of climatically driven change with observed increases in ablation and seasonal meltwater flow incising into permafrost (Fountain et al., 2014), suggesting that the dust potential of McMurdo Sound and the MDVs could rapidly change. The MDVs (4800 km2) are estimated to best fit Category 3 (source with unknown activity, Table S1). The McMurdo Ice Shelf “debris bands” are estimated to best fit Category 2 (moderately active source).
Schirmacher Oasis, East Antarctica
Schirmacher Oasis (70∘45′30” S, 11∘38′40” E) is approximately 80 km from the coast of the Lazarev Sea, Queen Maud Land, East Antarctica. The oasis is an ice-free area of over 35 km2 with typically hillocky relief. The oasis and surrounding area have been explored since the early 1960s. However, no systematic studies of dust on local ice and snow have been done. Most of this region's dust is assumed to be formed with the soils blown in the air because of strong winds. Human activity produces some of the dust in this region: the oasis shelters four bases, which use diesel oil and petrol to supply heat and transport operations. Two airports are nearby, which operate during the summer – lasting from late November to late February. In December 2019, we collected the snow samples on 11 sites near the local ice roads, bases, and airports. These data will contribute to our future study.
3.4.3 Canada
Lake Hazen, Ellesmere Island
Evidence of dust activity in Canada has been reported, e.g., in the prairie, crater lake, and river valley environments (e.g., Wheaton and Chakravarti, 1990; Neuman, 1990; Wheaton, 1992; Hugenholtz and Wolfe, 2010; Fox et al., 2012). Satellite observations of HLD events over water are relatively common (see, for example, Bullard et al., 2016). Whether directly concerning explicit plume remote sensing or indirectly regarding plume deposition, the detection of such events has remained largely unreported. Ranjbar et al. (2021) recently reported detecting a drainage-flow-induced dust plume over (frozen) Lake Hazen, Nunavut, Canada, using a variety of remote sensing techniques (Lake Hazen is the Arctic's largest lake, by volume, at 81.8∘ N latitude in the northernmost portion of Ellesmere Island). Figure 6 shows a true-color georeferenced RGB MODIS-Terra image acquired on 19 May 2014 at 19:50 UT (15:50 EDT) over Lake Hazen. The authors employed MISR stereoscopy, CALIOP, and CloudSat vertical profiling as well as MODIS thermal IR techniques to identify and characterize the plume as it crossed over a complex springtime terrain of snow, ice, and embedded dust. While limited by the lack of dedicated dust remote sensing algorithms over snow and ice terrain, the plume characterization boded well for developing systematic, satellite-based, HLD detection approaches using current and future generations of aerosol and cloud remote sensing platforms.
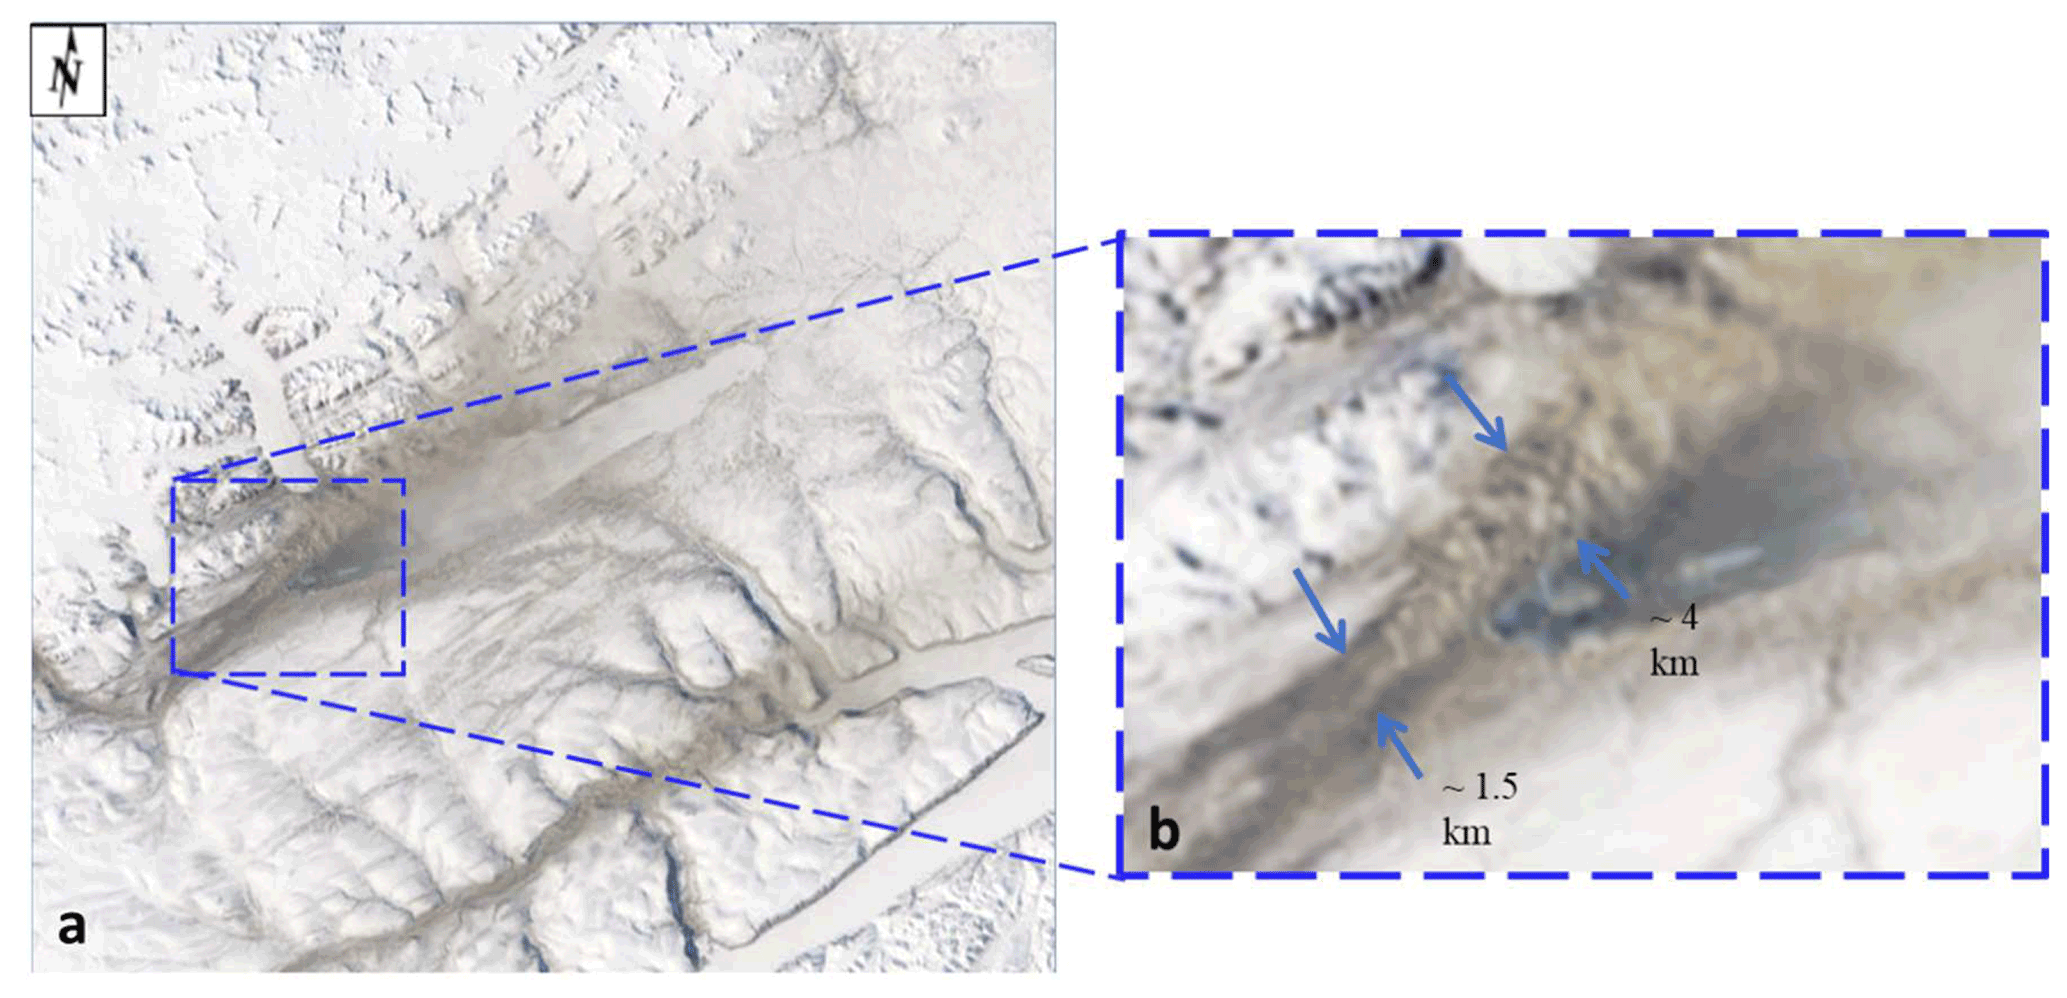
Figure 6MODIS Terra satellite image on 19 May 2014 at 19:50 UTC (a). True-color image: MODIS channels 1 (620–670 nm), 3 (459–479 nm), and 4 (545–565 nm) were loaded into the RGB channels of the display. (b) The sub-image is a zoom of the most discernible part of the plume (outlined by the blue broken-line square).
Kluane Lake, Yukon
Within the St. Elias mountain range at the northern end of the Pacific Coast Range on the continental side of the Yukon Territory lies the Kluane Lake
region (KLR), which contains Łhù'ààn Mân' (Kluane Lake)
(no. 50 in Fig. 1). The lake is fed primarily from the meltwater of the
Kaskawulsh glacier down the ![]() (formally the
Slims River) and snowmelt from the surrounding regions in the springtime.
This seasonal discharge has, in recent history, been known to be highly
variable as the glacier terminates at the fork of two distinct
watersheds – one draining into the Bering Strait through the Yukon River and
the other into the Gulf of Alaska – supplying the two watersheds' inconstant
ratios. In 2016, most of the glacier's discharge was diverted to the Gulf of
Alaska in an intense discharge event, dramatically decreasing the Łhù'aÌaÌn Mân's water levels and increasing the dust emission
potential from the
(formally the
Slims River) and snowmelt from the surrounding regions in the springtime.
This seasonal discharge has, in recent history, been known to be highly
variable as the glacier terminates at the fork of two distinct
watersheds – one draining into the Bering Strait through the Yukon River and
the other into the Gulf of Alaska – supplying the two watersheds' inconstant
ratios. In 2016, most of the glacier's discharge was diverted to the Gulf of
Alaska in an intense discharge event, dramatically decreasing the Łhù'aÌaÌn Mân's water levels and increasing the dust emission
potential from the ![]() (Shugar et al., 2017).
This drastic change makes the KLR an excellent natural laboratory for
investigating the impact of proglacial hydrology on dust emission potential under past and future climates. Research was conducted in the early 1970s in
this same valley as a comprehensive set of dust flux measurements as part of
several publications (Nickling, 1978; Nickling and Brazel, 1985). Nickling
(1978) concluded that there is a dynamic relationship between soil moisture
(driven by precipitation and nighttime radiation insolation) and wind,
resulting in periodicity of dust emissions from the valley in all but the
mornings throughout the snow-free seasons. Within a more recent study by
Bachelder et al. (2020), soil and aerosol samples were collected within the
(Shugar et al., 2017).
This drastic change makes the KLR an excellent natural laboratory for
investigating the impact of proglacial hydrology on dust emission potential under past and future climates. Research was conducted in the early 1970s in
this same valley as a comprehensive set of dust flux measurements as part of
several publications (Nickling, 1978; Nickling and Brazel, 1985). Nickling
(1978) concluded that there is a dynamic relationship between soil moisture
(driven by precipitation and nighttime radiation insolation) and wind,
resulting in periodicity of dust emissions from the valley in all but the
mornings throughout the snow-free seasons. Within a more recent study by
Bachelder et al. (2020), soil and aerosol samples were collected within the
![]() delta, where air quality thresholds were exceeded,
indicating a negative impact on local air quality throughout May. Notably,
daily particle size distributions of PM10 were very fine (mode of 3.25 µm) compared to those measured at more well-characterized,
LLD sources. Moreover, mineralogy and elemental composition of ambient PM10 were found to be enriched in trace elements (e.g., As and Pb) compared to dust deposition, bulk soil samples, and fine soil fractions (d<53 µm). Finally, through a comparison of the elemental
composition of PM10, dust deposition, and fine and bulk soil fractions as well as meteorological factors measured, Bachelder et al. (2020) propose that the primary mechanisms for dust emissions from
delta, where air quality thresholds were exceeded,
indicating a negative impact on local air quality throughout May. Notably,
daily particle size distributions of PM10 were very fine (mode of 3.25 µm) compared to those measured at more well-characterized,
LLD sources. Moreover, mineralogy and elemental composition of ambient PM10 were found to be enriched in trace elements (e.g., As and Pb) compared to dust deposition, bulk soil samples, and fine soil fractions (d<53 µm). Finally, through a comparison of the elemental
composition of PM10, dust deposition, and fine and bulk soil fractions as well as meteorological factors measured, Bachelder et al. (2020) propose that the primary mechanisms for dust emissions from ![]() are the rupture of clay coatings on particles and the release of resident
fine particulate matter.
are the rupture of clay coatings on particles and the release of resident
fine particulate matter.
3.4.4 Denmark and Sweden
In Denmark, large areas with severe wind erosion have been documented (Kuhlman, 1960). Published literature on the activity of dust sources in Denmark is rare; some documentation is only in Danish. On 23 April 2019, a dust plume from Denmark's western coast, with dust plumes from Sweden's 12 km-long Mellbystrand around the mouth of the Lagan River (no. 51 in Fig. 1) and Poland could be observed in Meteosat-11 Dust RGB and Natural Colour images: 23 April 12:30 UTC. These dust plumes were observed to travel to the North Sea (Kerkmann et al., 2019). The source in Denmark appears to be from Holmsland Dunes (no. 15 in Fig. 1). Other potential dust sources in Denmark include, e.g., Råbjerg Mile (no. 1 in Fig. 1), the largest moving dune in northern Europe with an area of around 2 km2 (Doody et al., 2004), located between Skagen and Frederikshavn. Råbjerg Mile moves at approximately 15 m yr−1 due to wind and has moved around 1.5 km further east in the last 110 years. The drifting sand is not considered to be transported very far. In general, dust storms in Denmark are considered small, and locally based dust storms can be expected when farmers prepare the arable soils in spring, creating dust in case of a very dry month of April. In Tilviden, flying sand took over (after Frederik II cut the oak trees for building ships in 1600). Also, a regional soil and sand event in Denmark, reportedly common in April, was recently documented between Mejrup and Holtebro on 6 April 2021 (Television Midtvest, 2021; not identified in Fig. 1; coordinates are estimated as 56∘23′ N, 8∘41′ E). This location between Mejrup and Holtebro remains to be marked as a potential dust source for future observations. The event was observed over roadways in several parts of the region, reducing visibility due to a long period without rain and with strong winds for >24 h, causing the soil to blow off the harrowed fields.
3.4.5 Greenland
Greenland's ice-free areas have long been identified as locally important dust sources (Hobbs, 1942), with dust storms described as reaching >100 m high (Dijkmans and Törnqvist, 1991). These storms can cause the darkening of the Greenland Ice Sheet by deposition, which may affect albedo and rates of ice melt (Wientjes et al., 2011; McCutcheon et al., 2021). Potential dust source areas in Greenland are mapped in the recently issued global dust atlas by Vukovic (2021) (UNCCD, 2021). Dust input to soils and lakes may also have substantial ecological impacts (Anderson et al., 2017). Bullard and Mockford (2018) investigated the seasonal and decadal variability of dust emissions in southwestern Greenland and presented the first long-term assessment of dust emissions. Dust emissions occur all year but peak in spring and early fall. The evidence linking increased dust emissions to preceding jökulhlaup (a type of glacial outburst flood) events is inconclusive, requiring further exploration. The decadal record confirmed that dust-storm magnitude may have increased from 1985 to the 1990s (Bullard and Mockford, 2018). Amino et al. (2020) also showed that dust deposition on the southeastern dome in Greenland has increased in recent decades. They link this increase to dust emissions in coastal Greenland, where snow cover is decreasing. However, further work is needed to characterize the magnitude of dust events at the source and how their emissions are changing. Bullard and Mockford (2018) also presented preferential dust-event pathways from Kangerlussuaq, indicating that most events travel toward the Davis Strait and the Labrador Sea, where the dust might impact the boundary layer of mixed-phase clouds (Murray et al., 2021).
Modern satellite remote sensing methods can detect dust storm events in Greenland's different valleys and coastal areas. The new HLD sources identified in this study based on satellite observations are in Table S3. Figure 7 illustrates one such dust storm episode on the Nuussuaq Peninsula, Greenland, on 1 October 2020 (Markuse, 2020, containing modified Copernicus Sentinel data (2020), originally posted to Flickr by Pierre Markuse at https://flickr.com/photos/24998770@N07/50447335522, reviewed on: 25 October 2020 by FlickreviewR 2, and licensed under the terms of the cc-by-2.0.2020). One example of DREAM regional-scale modeling of atmospheric transport of dust from Greenland potential dust sources is demonstrated in Fig. 8 (supplementary animation available through a link in the Supplement), where the DREAM circumpolar prediction experiment example shows the predicted surface dust concentration for 4 November 2013 and Icelandic volcanic desert dust reaching Greenland, as discussed, e.g., in Meinander et al. (2016).
Figure 7HLD storm on the Nuussuaq Peninsula, Greenland – 1 October 2020 (Markuse, 2020).
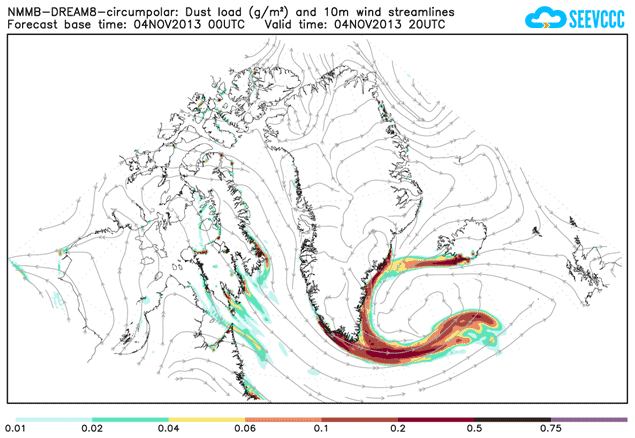
Figure 8DREAM model-predicted dust load for 4 November 2013 (supplementary animation available through a link in the Supplement).
3.4.6 Iceland
Iceland has been recognized for a while as a potentially important dust source. In our collection, 13 new sources in Iceland were included (Table S2) compared to previous sources, in which eight Icelandic dust hotspots were identified (Arnalds et al., 2016). Sandkluftavatn, Kleifarvatn, Skafta jökulhlaup deposits, and other areas have also been found to produce large amounts of dust (Dagsson-Waldhauserová et al., 2019). In recent years, increased dust activity has been reported in Flosaskard and Vonaskard (Gunnarsson et al., 2021). These dust hotspots cover almost 500 km2, while deserts are over 45 000 km2 (Arnalds et al., 2016). Most of the dust hotspots are near glaciers: glacial floodplains, old lakes, jökulhlaup deposit areas, or sandy beaches. Glaciofluvial plains receive a massive amount of unconsolidated silty material during the melting of nearby glacial regions.
New dust sources with the number of events are identified here and presented based on satellite image observations from 2002 to 2011 (Table S2), suggesting that Iceland's entire southern coast could be considered one source. However, previous results on Icelandic dust suggest that nearby locations may have different particle characteristics (Fig. 9). Therefore, each source must be studied independently. For example, the grain size distribution curves of the samples from Dyngjusandur, Hagavatn, Landeyjarsandur, Maelifellsandur, Myrdahlsandur, and Sandkluftavatn showed generally unimodal distributions with a rather diverse character (average diameters ranging from 19.8 to 97.7 µm, Fig. 9). Richards-Thomas et al. (2021) identified a range in particle diameter between 0.4 and 89 µm, with the medians (d50) of the distributions from 12 to 25 µm. Some hotspot particles are bimodal with peaks at 2 and 30 µm and a more significant proportion of the sample within the silt-size range.
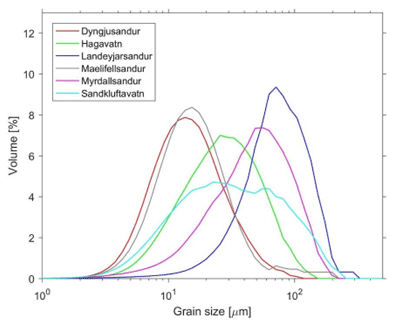
Figure 9Grain size distributions of samples from Icelandic source areas (redrawn from Varga et al., 2021).
Icelandic dust particles have different shapes, lower densities, higher porosity, increased roughness, and darker colors than other desert dust (Butwin et al., 2020; Richards-Thomas et al., 2021). Those greater than 20 µm retain the volcanic morphological properties of fresh volcanic ash. Dust and fresh volcanic ash particles less than 20 µm are crystalline and blocky. Icelandic dust particles contain amorphous glass, large internal voids, and copious dust coats comprised of nano-scale flakes. The amorphous basaltic material is mostly aluminosilicate glass ranging from 8 wt % (Hagavatn hotspot) to 60 wt %–90 wt %, with relatively high total Fe with a higher Fe solubility and magnetite fraction than LLD (10 wt %–13 wt %, Baldo et al., 2020). PM10 concentrations measured during severe Icelandic dust storms well exceeded 7000 µg m−3 (Dagsson-Waldhauserová et al., 2014, 2015; Mockford et al., 2018). Submicron particles contribute with high proportions (>50 %) to PM10 mass concentrations and number concentrations (Dagsson-Waldhauserová et al., 2014, 2016, 2019). Aeolian transport of 11 t of dust over a 1 m transect was measured during the severe dust/ash storm in 2010, when grains >2 mm were uplifted (Arnalds et al., 2013).
As well as differences in Icelandic dust sources, the chemical composition of the aircraft-collected Icelandic dust particles has a different chemical signature than, e.g., airborne Saharan dust particles transported to Barbados (Sanchez-Marroquin et al., 2020). This difference can be observed in Fig. 10a and b, where the chemical composition of most Icelandic dust particles falls in a different area of the chemical composition ternary diagram than the Saharan dust particles from Barbados. One of the most prominent differences between these types of dust is Ti's presence in ∼30 % of the Icelandic dust particles, while this element is almost absent in the Saharan dust particles and dust collected elsewhere and shown in Fig. 10c. Furthermore, the chemical composition of the aircraft-collected Icelandic dust is consistent with surface scooped samples of dust or volcanic ash from Iceland. Moreover, a droplet freezing-based assay confirmed that the sampled Icelandic dust has a high ice nucleation ability and can influence the radiative and lifetime properties of clouds containing water and ice.
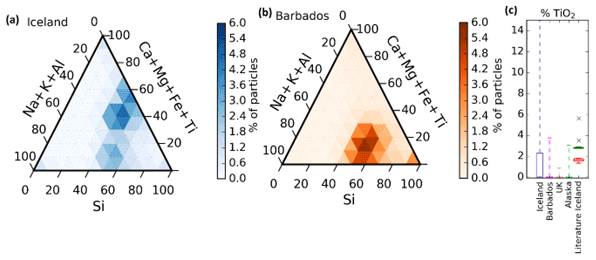
Figure 10Ternary graphs of the chemical composition of Icelandic dust particles (a) and Saharan dust particles collected in Barbados (b). Each graph contains a heat map with the percentage of dust particles in each sample compositional bin. The chemical composition of each aerosol has been recalculated from the weight percentages given by the SEM software, excluding elements that are not Si, Al, Fe, Mg, Ca, Na, K, Ti, Mn, and P. (c) The box represents particles in the Q3 percentile of the percentage of the composition of Ti in all the dust particles in each sample (Icelandic dust, Saharan dust collected in Barbados, dust collected in the UK, and dust collected in Alaska). The whiskers represent the composition of all particles between the median plus and minus 2 standard deviations. The data have been compared to the Ti weight percentage of different Icelandic dust and ash samples from the literature. (Figure extracted from the Supplement of Sanchez-Marroquin et al., 2020.)
No direct observations or measurements of the new sources were available. Instead, two model computations are presented for Iceland because of the lack of observations and complexity of the AOD interpretation in polar and subpolar regions. Without high uncertainty of direct measurements, the importance of the HLD modeling rises; models validated over better-observed regions may become an important or primary source of information. Results using the DREAM model, with a horizontal resolution of ∼3.5 km, were used here to resolve the heterogeneous and small-scale character of the Icelandic dust sources (Fig. 11). As the first operational numerical HLD model, DREAM-ICELAND predicted the Icelandic dust for the example case of 18 September 2020 (Fig. 11).
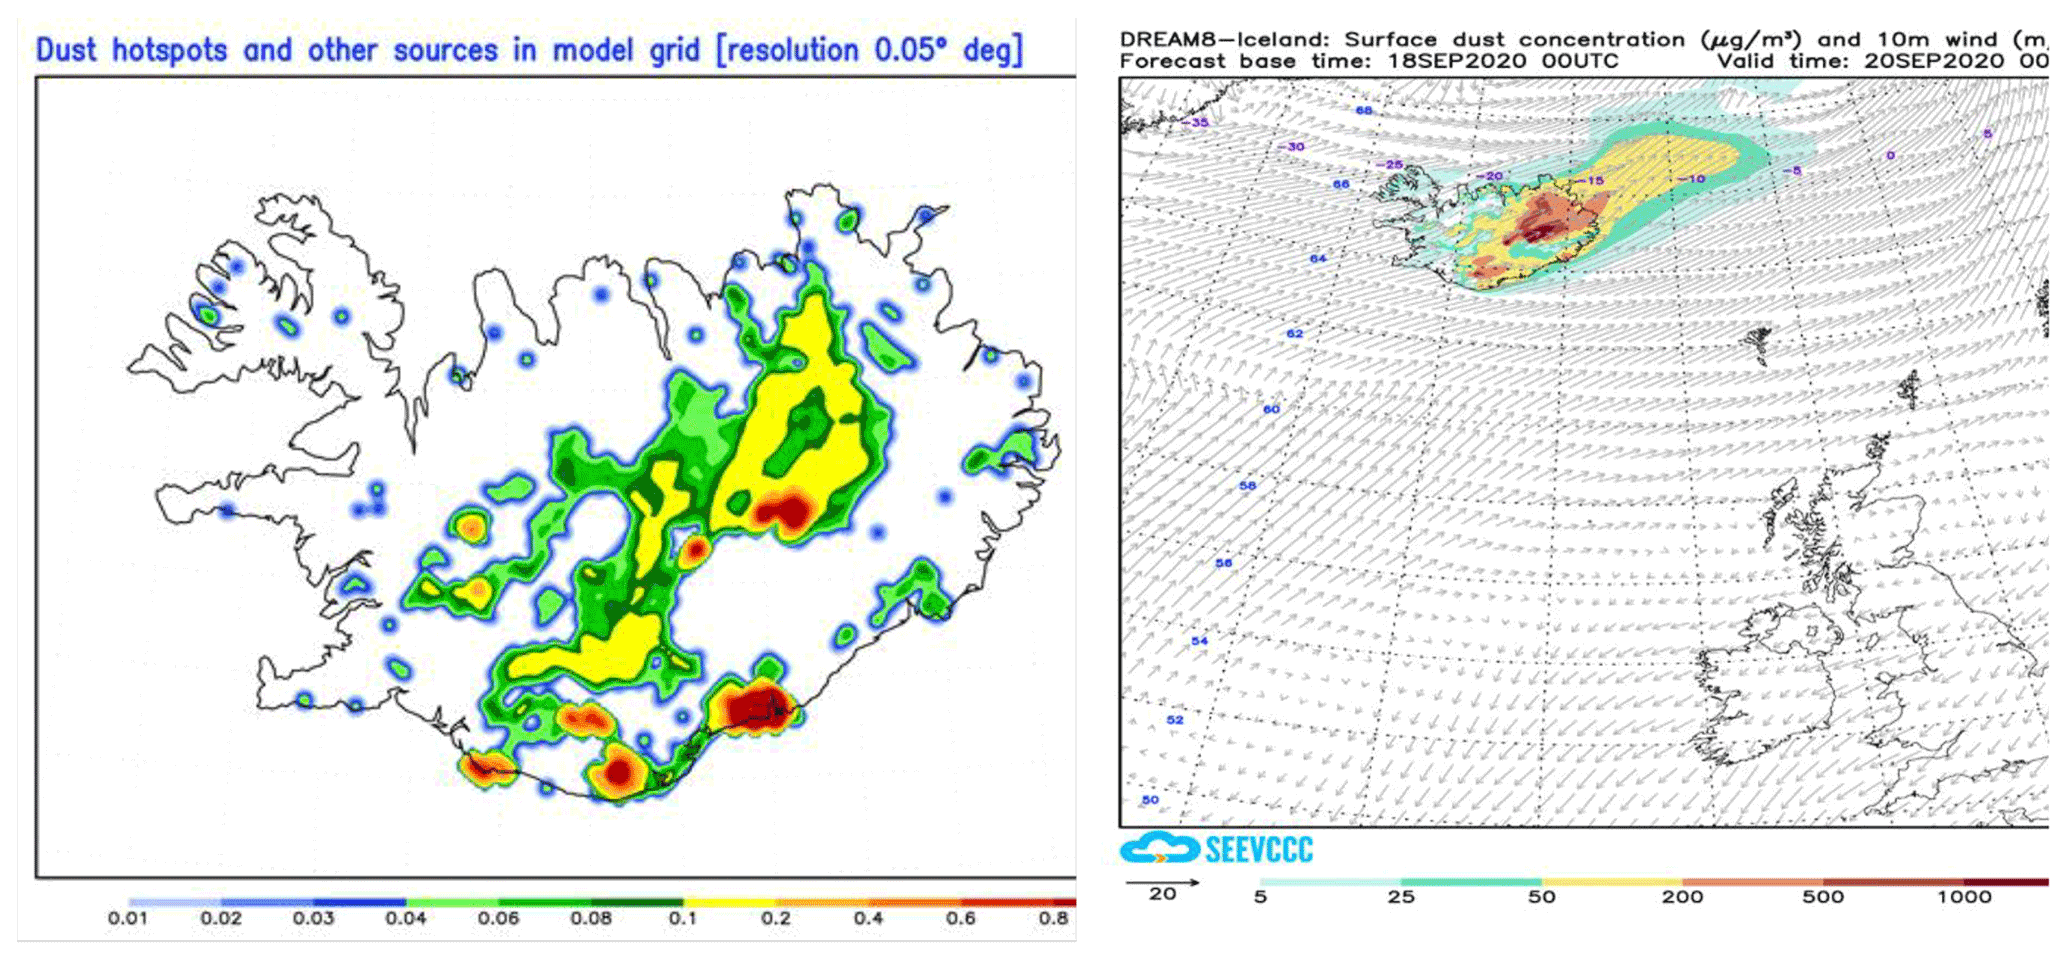
Figure 11Left panel: dust sources in the DREAM-ICELAND model grid with areas vulnerable to erosion and containing hotspots (Arnalds et al., 2016). Right panel: an example of the operational Icelandic dust surface concentration forecast for 18 September 2020 (available at the Republic Hydrometeorological Service of Serbia site, http://www.seevccc.rs/?p=8, last access: 17 August 2022).
In Fig. 12, dust emissions in Iceland are presented in 3-month periods for March 2020–August 2021. The modeled results clearly show the seasonal nature of the dust sources. The summer season (June–August) appears to be the strongest dust season. However, there are also dust emissions in wintertime with snow-covered land surfaces, according to observations of dust events during snowfall (e.g., Dagsson-Waldhauserová et al., 2015). The 2021 summer season in these modeled emission results appears in the same locations as summer 2020 but with more severe emissions in the highlands in 2021, agreeing with the field observations in Vatnajökull National Park during the HiLDA measurement campaign in the 2021 season (https://gomera.geo.tu-darmstadt.de/wordpress/, last access: 17 August 2022), where the most severe dust events were measured.
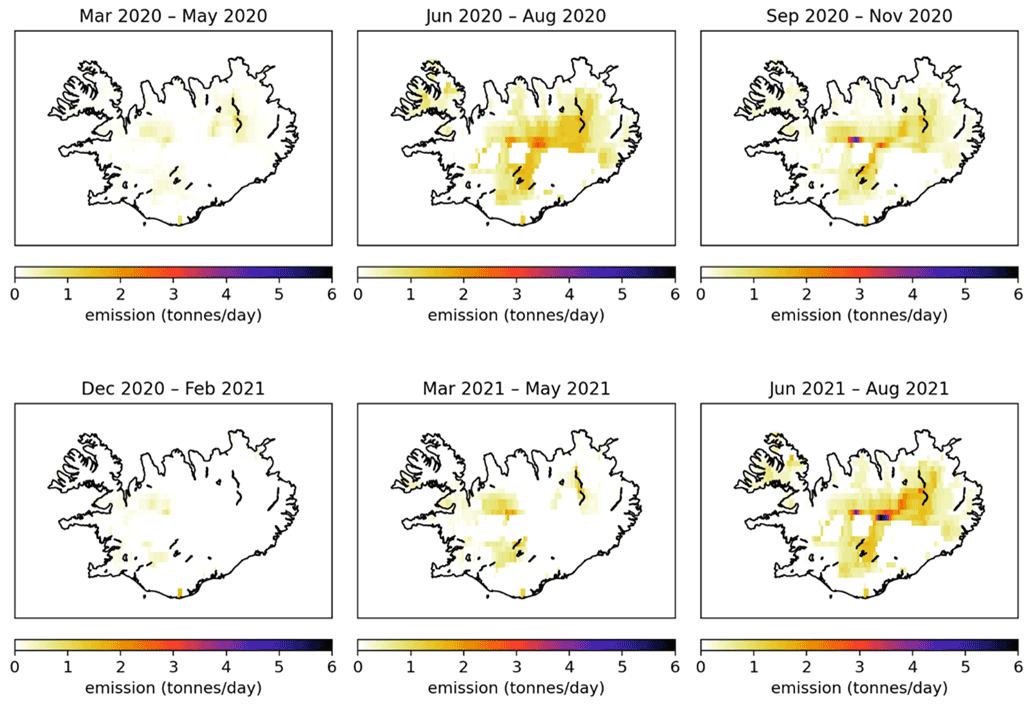
Figure 12SILAM-modeled dust emissions (tonnes per day) in Iceland for 3-month periods in March 2020–August 2021.
3.4.7 Russia
The Russian Arctic and sub-Arctic are the most relevant regions connected to the HLD sources. In these territories, atmospheric dust is produced due to burning gas (Novy Urengoy is called the gas capital of Russia) and forest fires (especially in Siberia; see MODIS or Sentinel images for Novy Urengoy on 3–8 August 2021) and dusting of abandoned and non-reclaimed heaps. Wind erosion is followed by vegetation destruction from gas and oil extraction, especially in Western Siberia. Some Russian sources included in our collection (e.g., nos. 7 and 8 of Fig. 1) could be identified as dust sources on the periphery of HLD and LLD source regions. Source no. 7 of Fig. 1 is the Altai Mountains. Some parts of these territories are covered by permafrost, where winter lasts for 5–6 months. From October, in lower mountains (less than 1000 m a.s.l.), and from September, in higher mountains (more than 1500 m a.s.l.), a stable snow cover persists. The mean daily air temperature during winter within the lower, middle, and higher mountains is −21, −29, and below −30 ∘C, respectively. Source no. 8 is in Central Kazakhstan. From late December to early March, a stable snow cover from 5 to 30 cm occurs within plains and up to 50 cm within hollows. Periods of snow cover and thaw correspond to transitions of the mean daily temperature of air through 0 ∘C, which, on average, are 7 November and 23 March ± 10–12 d. From early January to late February, the air's mean daily temperature can be as low as −20 ∘C. The Soil Atlas of the Northern Circumpolar Region (https://esdac.jrc.ec.europa.eu/content/soilatlas-northern-circumpolar-region, last access: 30 May 2022) covers all land surfaces in Eurasia and North America above the latitude of 50∘ N. Thus, these territories are considered high latitude.
Western Siberia, Altai Mountains, and Central Kazakhstan
In the most widespread undisturbed soils (Gleysols, Phaeozems, Podzols, Retisols, and Stagnosols) in Western Siberia (Semenkov et al., 2015a, b) – the largest plain in the world – mineralogical and elemental composition (Table S6) were studied using X-ray diffractometry, X-ray fluorescence spectrometry, ICP-MS, ICP-AES, and content of total organic carbon (TOC), as reported in detail in Semenkov et al. (2019), Semenkov and Koroleva (2019), and Semenkov and Yakushev (2019). At location nos. 7 and 8 of Fig. 1 (Table 4), the concentrations of N-containing substances, pH values, dust content, and dust deposition rate were measured in snow in winter from 2009 to 2019 (Koroleva et al., 2016, 2017; Semenkov et al., 2021; Sharapova et al., 2020).
Table 4Major ions (mg L−1), pH value, dust content (mg m−2 in snow), and deposition rate (mg m−2 d−1) during winter at HLD source nos. 7 and 8 in Fig. 1.
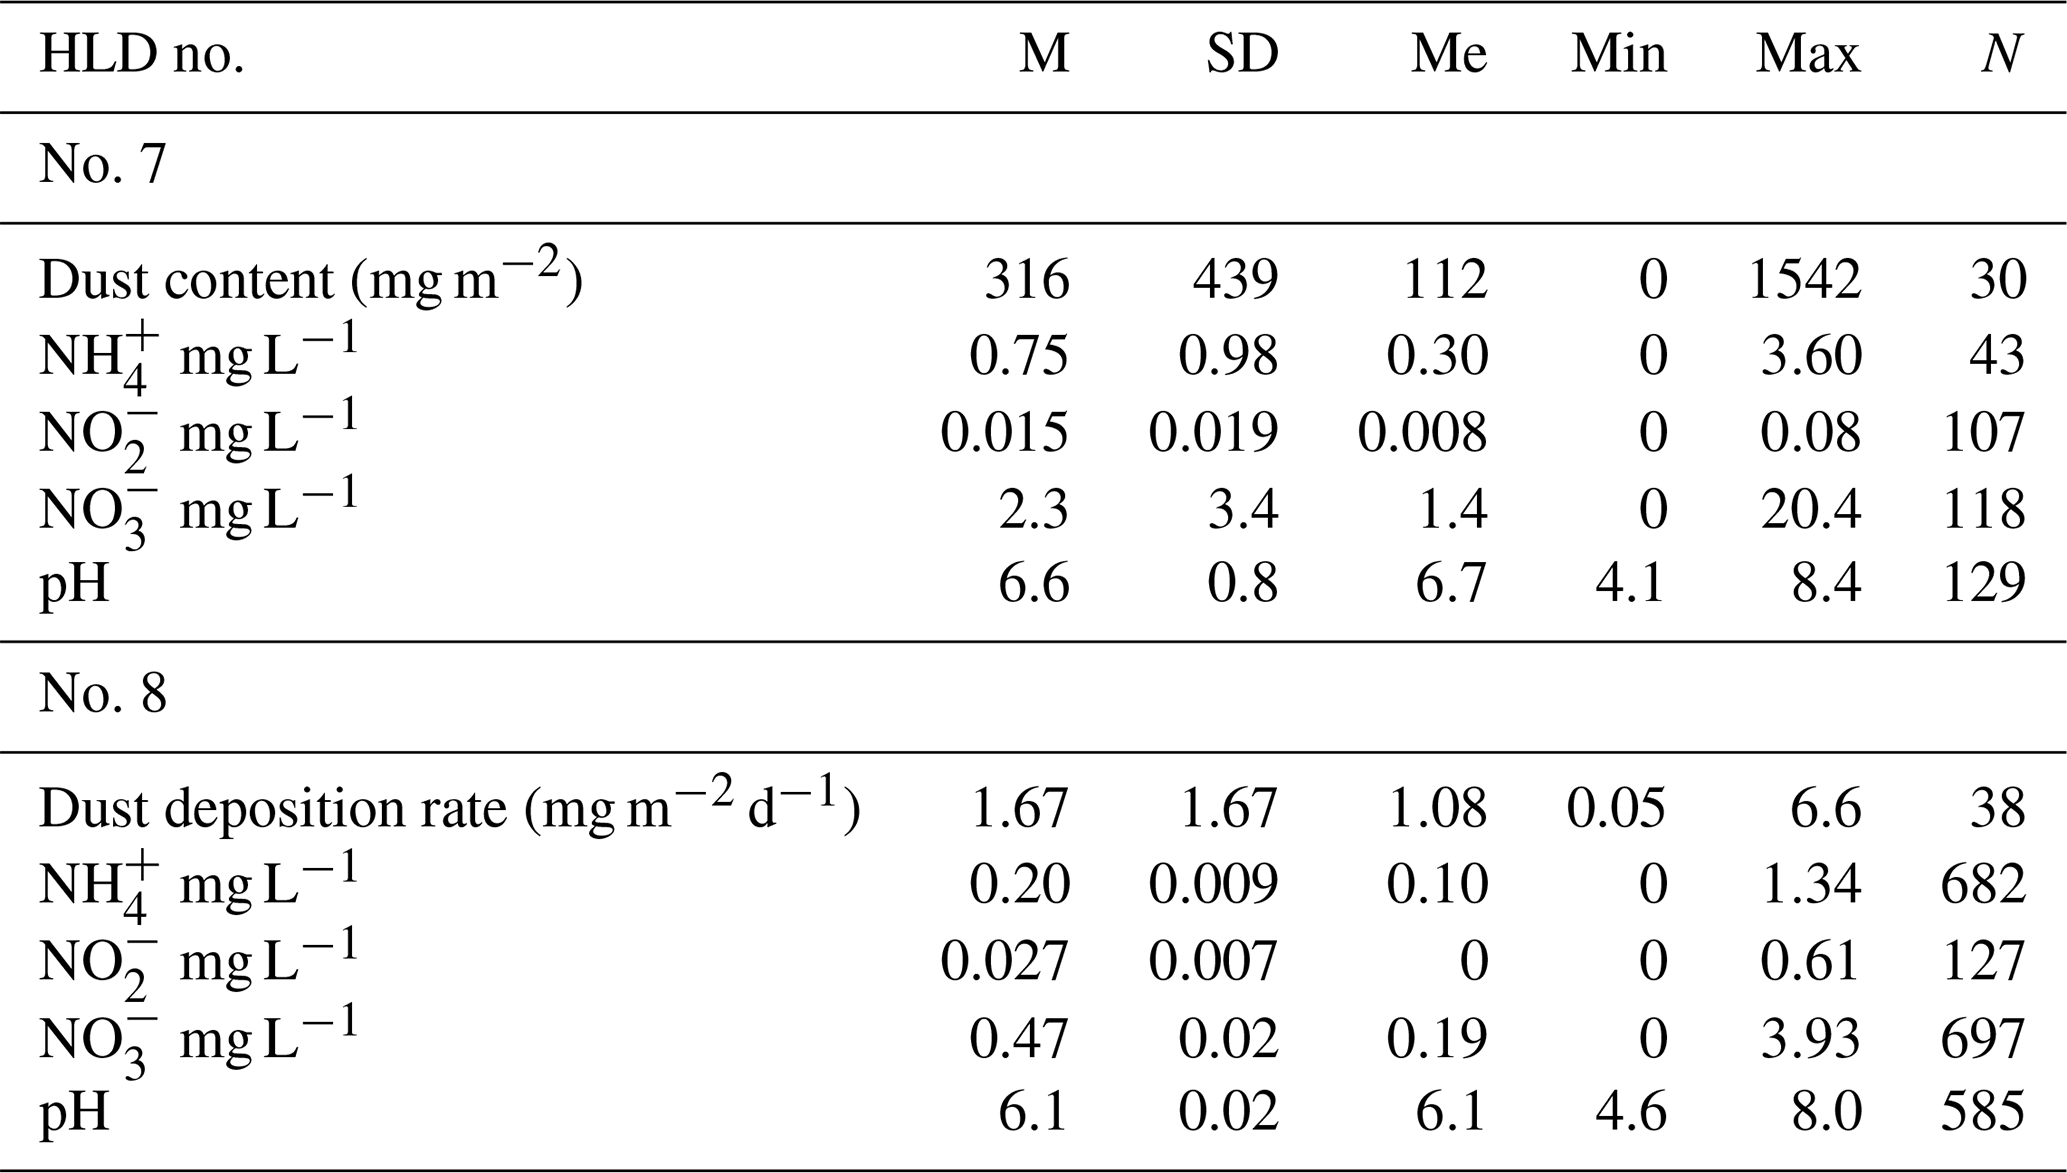
M – mean, Max – maximum, Me – median, Min – minimum, N – number of observations, SD – standard deviation.
Murmansk region: Apatity, Kirovsk, Kovdor
Large amounts of displaced rock have been breaking the balance of geological emissions of gas and dust from mining, dumps, and tailing pits (e.g., Csavina et al., 2012). Over 150 Mt of industrial wastes are disposed of in the Murmansk region annually, reaching about 8 Gt (Table S7). The dusting of processing tailing is one of the main sources of air pollution resulting from suspended matters near the mining enterprises. About 30 % of all suspended matter is released from the mining enterprises into the atmosphere due to wind-induced dusting of beaches and slopes of tailing dumps. Elevated concentrations of suspended matter are registered every summer in Apatity's atmosphere. Dust storms from technogenic dust sources of the mining industry on the Kola Peninsula are presented, e.g., in Baklanov and Rigina (1998), Baklanov et al. (2012), and Amosov and Baklanov (2015).
Tiksi
Aerosol characterization was performed at the Hydrometeorological Observatory (HMO) Tiksi (71.36∘ N, 128.53∘ E) on the coast of the Laptev Sea in Northern Siberia from 2014 to 2016 (Popovicheva et al., 2019). FTIR analyses of functionalities and ionic and elemental components provided insight into the dust-source-influenced and season-dependent composition of Eastern Siberian Arctic aerosols. Analysis of wind and aerosol pollutant roses, with long-range transport analysis, helped identify the dust sources at Tiksi, demonstrating impacts from lower latitudes or local emissions from the adjacent urban Tiksi area. In warm periods, Na+, Cl−, K+, and Mg2+ are found to be the major ions in the sea-salt aerosols, which are ubiquitous in the marine boundary layer, significantly impacting the dust concentrations in the coastal region. However, Cl− and K+ could also originate from biomass burning during the warm period. Ammonium is mainly produced by the soil and emissions from biota and the ocean, commonly found in the form of (NH4)2SO4 and NH4Cl. Like sulfates, ammonium is influenced by regional sources of secondary aerosol formation and transport. Bands of CO (at 871 cm−1) and NH (3247 cm−1) indicate the dominance of dust carbonates in the natural inorganic aerosol. Also, S, Fe, Na, Al, Si, Ca, Cl, K, Ti, Mn, Co, Cu, Zn, Ga, Sr, Ba, Hg, and Pb were detected in the background dust, with sulfur displaying the highest concentration, followed by Fe, Na, and Al.
According to individual particle analyses by scanning electron microscopy (SEM) with energy-dispersive X-ray analysis (EDX), SEM-EDX, during the summer and fall, when the wind comes from the southwest and air masses arrive from the ocean, aerosol particles demonstrate a large variability in shapes, sizes, and composition (Fig. 13.1). Elemental composition is characterized by a dominant weight percentage of C, K, Na, Cl, O, and Fe. The distribution of elements over particles is heterogeneous, with greater amounts of Cl, K, and Na than C and O in around 50 % of particles, indicating that background aerosols contain soil, salts, minerals, and carbonaceous compounds. Group Na-rich with dominant Na and Cl is the most abundant at 32.5 %, originating from sea spray near the ocean (Fig. 13.2). The other particles contain small amounts of K, Ca, and Mg, from seawater impurities, as well as S, gained through acid displacement.
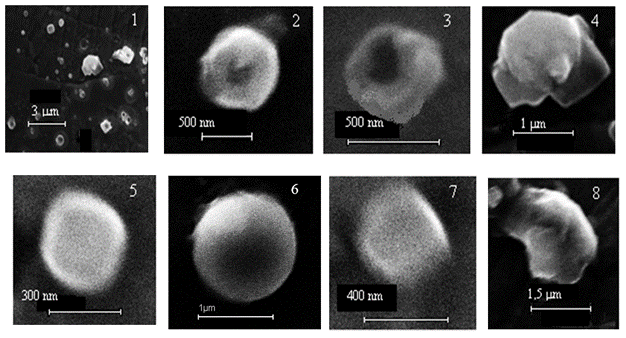
Figure 13(1) Panorama and representative micrographs of natural background aerosols at HMO Tiksi; (2) reacted sea salt NaCl in Group Na-rich; (3) reacted sylvite KCl and (4) sylvinite (nNaCl+mKCl) in Group K-rich; (5) an organic particle in Group Organic; (6) Fe and Ca aluminosilicate in Groups Al and Si-rich; (7) particle in Group Fe-rich and (8) CaCO3 in Group Ca-rich of natural aerosols on 27 September 2014. New unpublished results of the Popovicheva et al. (2019) investigation.
The second-most abundant group of individual particles is Group K-rich at 28.8 %, dominated by K and Cl, which are not of marine origin because the concentration of non-sea-salt (NSS) K+ ions significantly exceeds K's possible concentration in sea-salt aerosol (SSA). Instead, Group K-rich particles are of natural mineral sylvite (KCl), transformed from genuine ones because the average weight ratio of was found to be equal to 3.3 – significantly higher than 1.1 – in sylvite (Fig. 13.3). KCl is water-soluble and may react in a polluted atmosphere. The variation of wt % of K versus Cl shows the lack of Cl compared to genuine sylvite and the formation of complex chemical compounds KxCly with various K and Cl atomic ratios. A representative micrograph of particles in Group K-rich demonstrates the reacted sylvite in Fig. 13.3, with slight damage by an electronic beam that can prove the presence of nitrates that were easily evaporated during EDX analyses. Parts of Groups Na-rich and K-rich, 20 % and 5 %, respectively, contain Na, Cl, and K and are assumed to be particles comprised of natural sylvite from alternative layers of halite and sylvite (nNaCl+mKCl) (Fig. 13.4). They have distinctive mineral shapes and are stable regarding evaporation by an electron beam. About 14.8 % of individual particles composed of Group Organic are made up almost exclusively of C and O. These particles are roughly spherical- or liquid-like-shaped (Fig. 13.5): around half contain only C and O, probably secondary organic aerosol from the biogenic source; the other half come from the seawater of the Arctic Ocean, as demonstrated by trace amounts of Na, Cl, and Mg. The oxidation of volatile organic compounds, humic-like substances (HULIS) in the marine environment, perhaps contributes to observed organic matter.
Finally, a few biogenic particles such as pollen, spores, algae, bacteria, and plant or insect remnants are found in natural aerosols, indicated by the specific shape and presence of K, S, Si, and Cl with C. The remaining groups – Fe-rich (14.4 %), Ca-rich (6.4 %), and Al-, Si-rich (3 %) – are representative of atmospheric dust derived from the Earth's crustal surface. Dust particles have solid irregular shapes of round and euhedral morphology. Analyses of the soil sample taken near the CAF showed stony material with minimal fertile ground cover. EDX analyses demonstrated 27.7 and 9.8 wt % of Si and Al, 46 and 10.6 wt % of O and Fe, respectively, and 3.5 wt % of K in various Fe, K aluminosilicates containing small additives (less than 1.7 wt %) of Na and Mg. Since the tiny dust of stony soil may be easily dispersed into the atmosphere by wind, we assume that Group Al, which is Si-rich, and around half of Group Fe-rich, are composed of Fe, K aluminosilicates (Fig. 13.6). Group Fe-rich containing Fe, Ni, Ca, and Si is composed of soil particles of iron–nickel ore (Fig. 13.7). Finally, Ca carbonates and sulfates with Ca, C, S, and O are found in Group Ca-rich (Fig. 13.8) according to the observations of Ca2+, CO, and SO ions described above. With aluminosilicates, they are most likely windblown dust.
3.4.8 South America and Patagonia
Extending from 39 to 54∘ S, with an area of 600 000 km2, dust activity (Fig. 14) from this large desert remains largely unknown. Some basic facts must be formally assessed, such as the locations of sources and geomorphological features associated with dust as well as the seasonality and frequency of the dust's activity. At present, limited surveys of dust activity (Crespi-Abril et al., 2017; Gaiero et al., 2003; Gassó and Torres, 2019) and case studies of individual sources exist (Gassó et al., 2010; Gassó and Stein, 2007; Johnson et al., 2011). Recently, a list of dust activities and sources in Tierra del Fuego (Cosentino et al., 2020) was published. Generally, dust sources in Patagonia are at topographic lows, and the river valleys (e.g., the Deseado and Santa Cruz rivers) (Coronato et al., 2017; Hernández et al., 2008) are associated with the late Holocene para-glacial environments. The most active modern source of dust is the drying of Colhué Huapi Lake (CHL) in central Patagonia (45.5∘ S, 68∘ W) (Montes et al., 2017) – a shallow lake with variable water levels exposed to intense evapotranspiration. An anthropogenic component appears to be linked to intense farming, oil prospection, and water supply to urban centers (Gaitán et al., 2009; Hernández et al., 2008; Mazzonia and Vazquez, 2009; Del Valle et al., 1998). CHL has been steadily shrinking (Llanos et al., 2016) and was dried up by the summer of 2020. Consequently, dust activity originating in CHL has increased with frequent blowouts large enough to be easily detected from space (Gassó and Torres, 2019).

Figure 14A dust event spanning the northern and central sections of the Patagonian Desert (+1000 km) on 28 March 2009. Events this large occur about once every 1 to 3 years. This event is typical in that it was triggered by the passage of a powerful low-pressure center commonly found at these high latitudes. Also, this event is singular in that a large portion of it is cloudless, enabling a direct view from space (most dust activity in Patagonia occurs under cloudy conditions). The thick dust cloud in the upper right corner is from an area used for cattle farming, which was undergoing a drought, whereas the active sources further south can be considered more naturally occurring with less anthropogenic interference. Source: NASA's Worldview interface image processed with Google Earth.
Overall, satellite detection in the Patagonia region remains challenging. There are several difficulties in surveying dust activity in the area: obstructed views from space because of cloudiness, nighttime dust activity, and sparse population. Also, except for a few sources, the lack of recurrence in dust emission is a general feature of the desert: sources that were active during one season do not reactivate until two or three seasons later. A comprehensive and dedicated survey combining surface and space-based detection networks is needed for a better understanding.
3.4.9 Svalbard
Evidence of the presence and activity of dust sources in Svalbard is only recent and quite rare. However, for example, dust storms in Longyearbyen are reported as a regular feature in fall. Dörnbrack et al. (2010) documented and characterized a strong dust storm in the Adventdalen valley – the center of Spitsbergen – in May 2004, using airborne lidar observations and mesoscale numerical modeling. In the same area, near Longyearbyen, dust emissions from an active coal mine were documented by Khan et al. (2017). Kandler et al. (2020) also reported Svalbard measurements in Longyearbyen in September 2017, with high iron and chlorite-like contributions in dust.
The accelerated ablation of Svalbard's glaciers (Schuler et al., 2020) and the increasing melt rate of permafrost are causing accelerated growth in periglacial and proglacial areas. The significance of the morphogenetic processes of deflation, denudation, and sediment transport on slopes and in river channels in glaciers' marginal zones is increasing (Zwoliński et al., 2013). Thus, these areas have become potential sources of dust and, as such, have been investigated for the physical and chemical properties of their sediments, regardless of the documented occurrences of the dust events these areas have experienced.
Fluvial, glaciofluvial, and weathering deposits at five different sites on the coastal plains near the Ny-Ålesund research station (78.92481∘ N, 11.92474∘ E), northwestern Spitsbergen, were investigated (Moroni et al., 2018). The mineralogical assemblage is characterized by dolomite, calcite, quartz, albite, and sheet silicates (vermiculite, muscovite, clinochlore) in variable amounts along with monazite, zircon, apatite, barite, iron sulfate, Fe, Ti, Cu, and Zn ores as accessory minerals. With a weight fraction of 4 % to 53 % of particles smaller than 100 µm, these deposits should be considered a valid dust source. However, the contribution is influenced by the modest extension of bare soils (less than 4 km2) and the brief duration of the area's driest summer. The composition of the aerosols collected at the Gruvebadet lab near Ny-Ålesund during the summer–fall period reveals the presence of such a local dust component (Moroni et al., 2016, 2018). Further evidence of local dust sources in the Ny-Ålesund area and Brøgger Peninsula also results from the annual snowpack's chemical composition (Gallet et al., 2018; Jacobi et al., 2019). The contribution of local dust sources at this site is of secondary importance compared to that of long-range transport (Moroni et al., 2015, 2016, 2018; Conca et al., 2019).
A similar study was conducted on the loose sediment deposits in the neighborhood of the Polish Polar Station Hornsund (77.00180∘ N, 15.54057∘ E), southwestern Spitsbergen, where a belt of nearshore plains consisting of marine terraces and nival moraine bars, with bare surfaces available for mineral dust uplift from late spring, widely outcrop (Zwolinski et al., 2013). The mineralogical assemblage consists of quartz, alkali feldspar, plagioclase, dark mica, and chlorite, with zircon, apatite, monazite, iron sulfide, and iron ore as accessory minerals. The same assemblage was found in the aerosols and snow cover collected at the base station and the surrounding glaciers in the same period. This fact, along with the significant proportion of particles smaller than 50 µm in the loose sediment deposits, supports the prevalence of the local dust source in the melting season. Further evaluation of the impact of local dust sources was obtained from analyzing shallow and deep cores from different glaciers in the Hornsund area (Lewandowski et al., 2020; Spolaor et al., 2021). The results suggest that, for Spitsbergen glaciers with the summit close to (Ny-Ålesund) or below (Hornsund) the equilibrium line, the summer dust deposition from the local sources is predominant, affecting the glacier ice's chemical composition. However, the dating of monazite grains and the presence of magnetite and iron sulfide (magnetic susceptibility and SEM data, Lewandowski et al., 2020) also suggest the existence of regional wind transport from Nordaustlandet and Edgeøya, respectively. Further, a long-range component from northern Europe, Siberia, and, to a limited extent, Greenland, Iceland, and Alaska was also evident (Moroni et al., 2018; Crocchianti et al., 2021).
Recent estimations of dust load in central and southern Svalbard from different sources range from 4 g up to 4–5 kg m−2 (Rymer, 2018; Rymer et al., 2022), with the highest values in the Ebba Valley due to frequent dust storms in this area (Strzelecki and Long, 2020). Kavan et al. (2020a) found a negative correlation between deposition rate and altitude at Pyramiden (78.71060∘ N, 16.46059∘ E; western coast of Petuniabukta) and Ariekammen (77.00035∘ N, 15.53674∘ E; Hornsund area). The pattern was clear up to the altitude of approximately 300 m a.s.l., suggesting the influence of local sources in the lower levels of the atmosphere and long-range transport at higher altitudes. The lower values of the deposition rates found at Ariekammen were ascribed to the more maritime climate of the Hornsund region.
3.5 Climatic and environmental impacts of HLD
Climatic and environmental impacts of HLD on clouds and climate feedback, atmospheric chemistry, the marine environment, and cryosphere–atmosphere feedback (Fig. 15) were investigated with the help of topical literature surveys (Sect. 3.5.1–3.5.4). Direct radiative forcing of HLD (blocking sunlight) and comparison of dust and black carbon as SLCF in the cryosphere are included in the cryosphere–atmosphere feedback section.
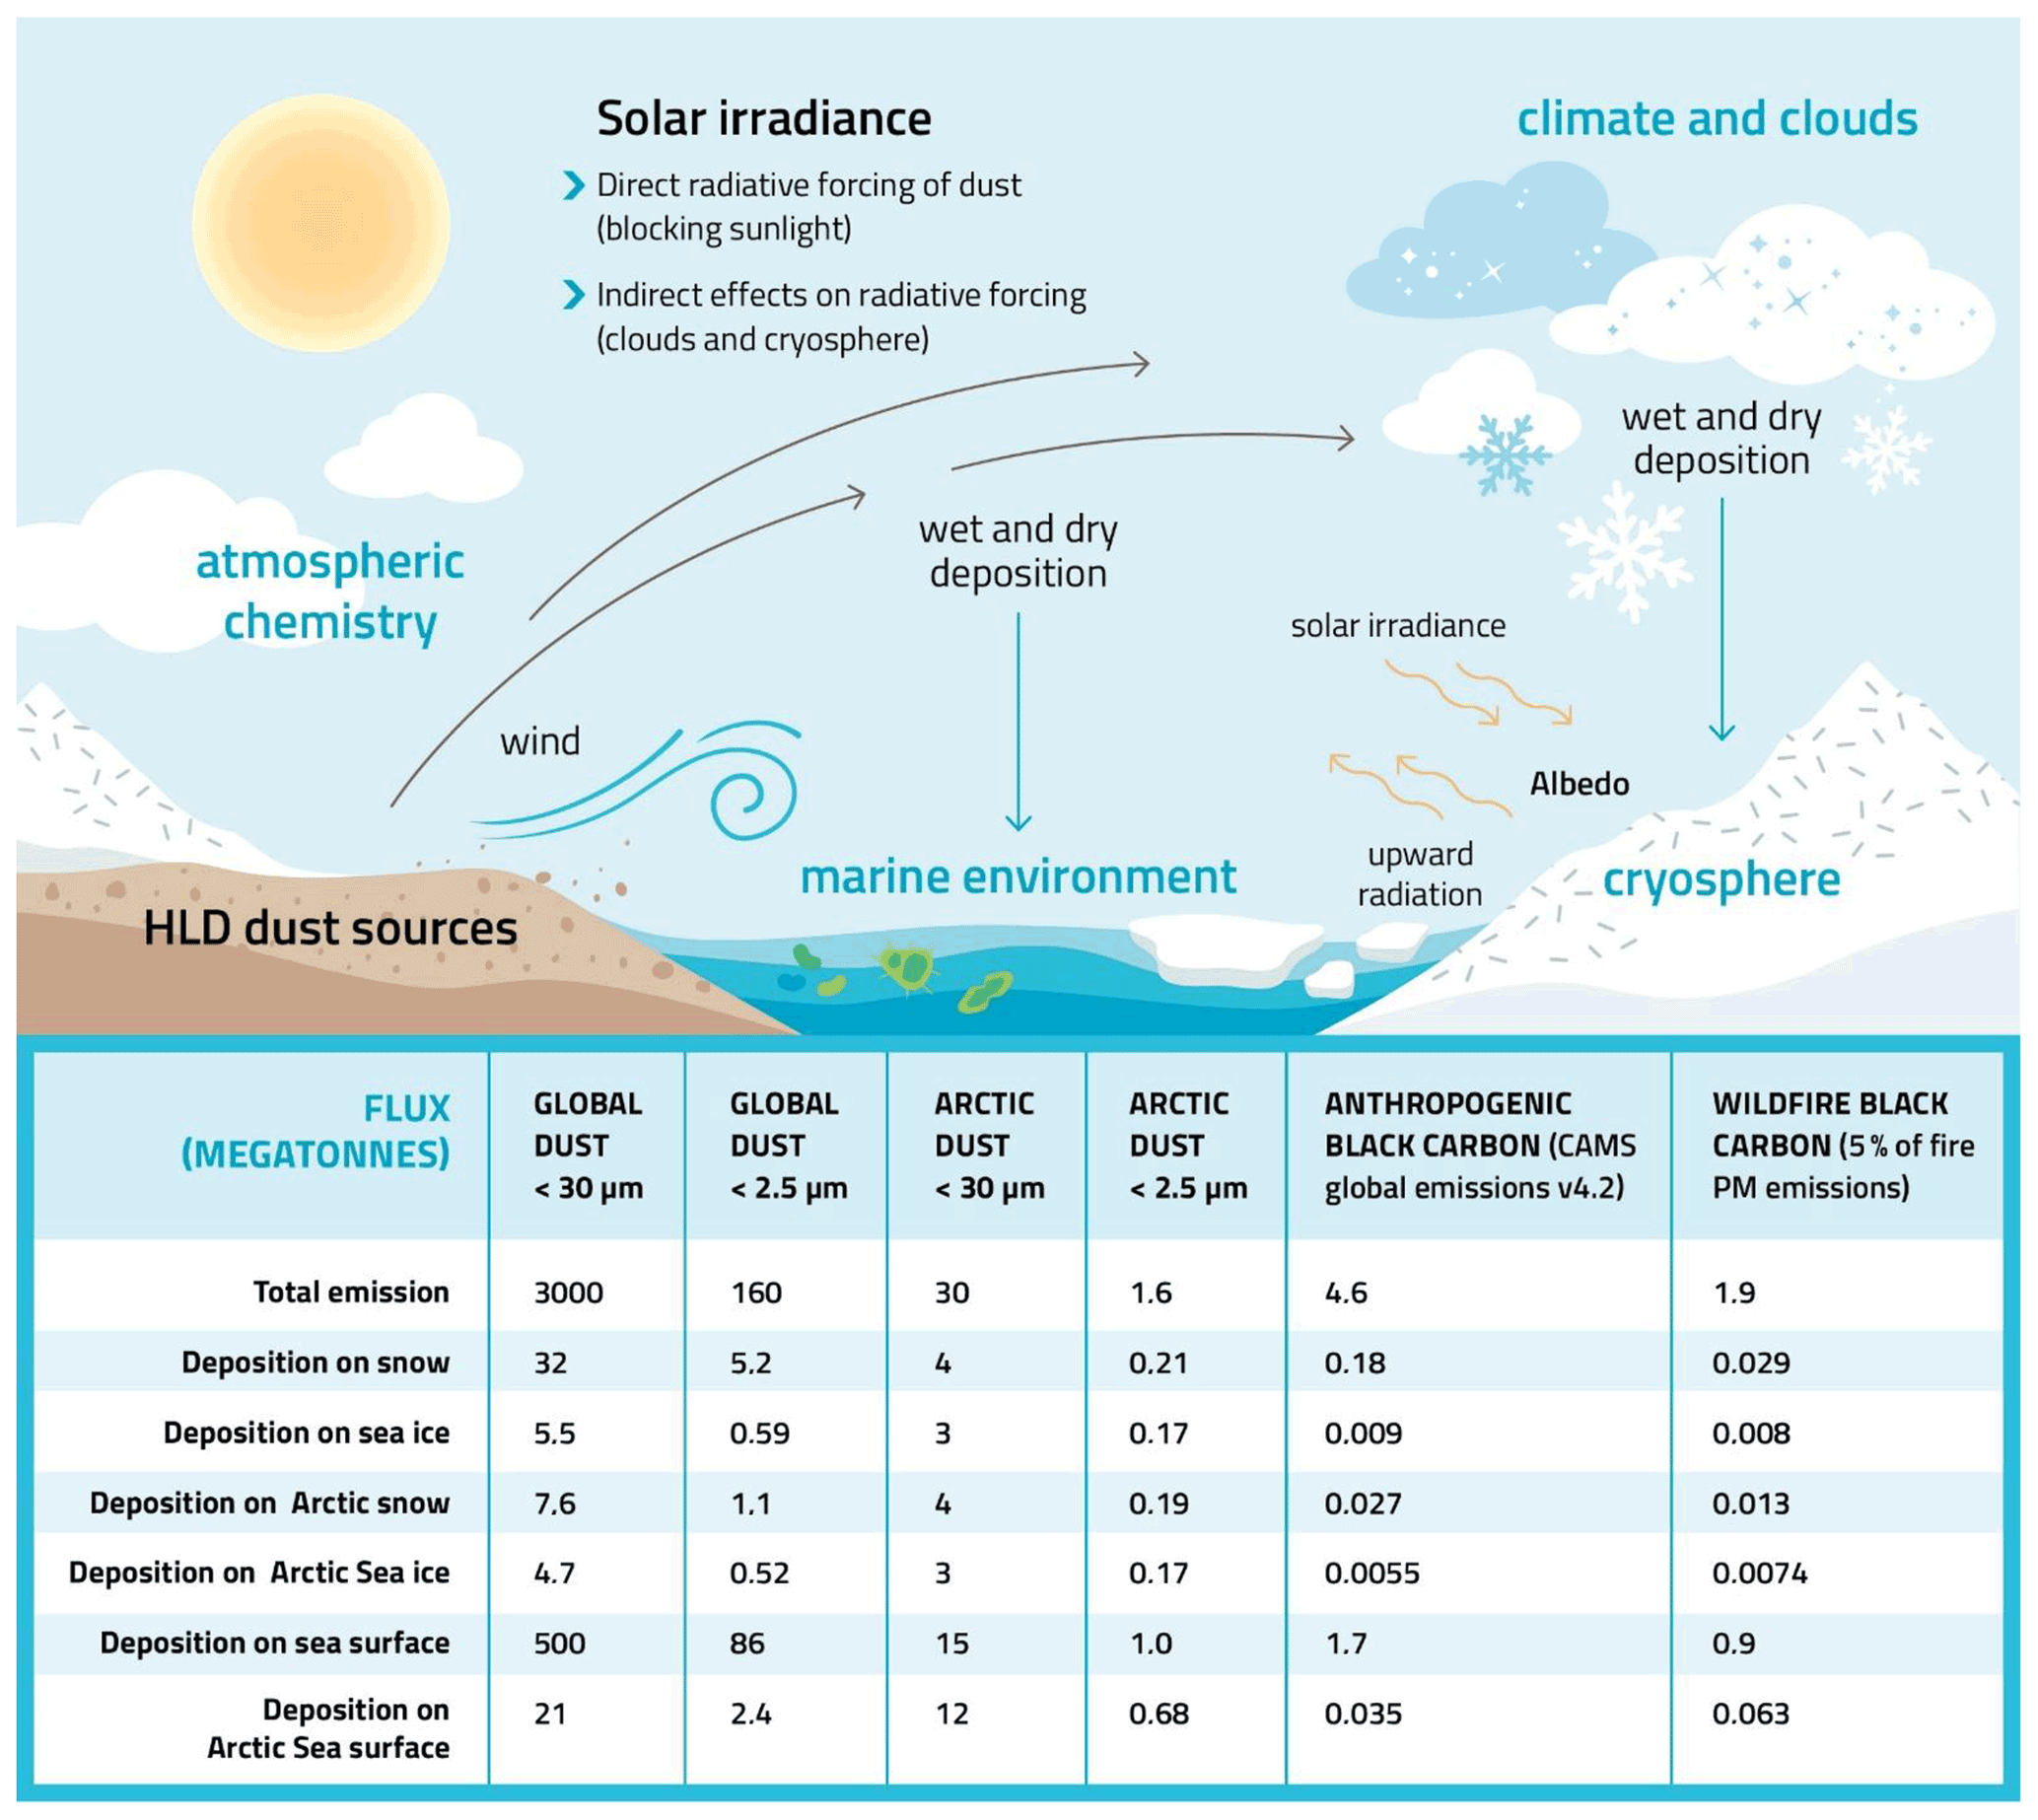
Figure 15Climatic and environmental impacts of HLD include direct radiative forcing (blocking sunlight), indirect radiative forcing (clouds and cryosphere), as well as effects on atmospheric chemistry and the marine environment. The amounts of dust emission and deposition (Mt) of global and Arctic dust, as compared to black carbon, were estimated using the SILAM model (Sofiev et al., 2015). The black carbon emissions are based on the CAMS global anthropogenic emission dataset v4.2, and the wildfire black carbon emissions are based on the IS4FIRES fire emission model, equaling 5 % of the total primary fire PM emissions of the model.
The amounts of dust emission and deposition (Mt) of annual global and Arctic dust (data for 2017), as compared to anthropogenic and wildfire black carbon (Fig. 15), were studied using the SILAM model (Sofiev et al., 2015). The results of black carbon emissions presented in Fig. 15 were based on the Copernicus Atmosphere Monitoring Service (CAMS) global emission inventory version 4.2 and black carbon originating from wildfires from the SILAM IS4FIRES fire emission model, equaling 5 % of the total primary fire particulate matter (PM) emissions of the model. The IS4FIRES model is based on fires observed by the MODIS instrument on board the Terra and Aqua satellites.
3.5.1 Impacts of HLD on atmospheric chemistry
Icelandic dust, a specific HLD of volcanic origin, is constantly resuspended from the deserts. Regarding atmospheric chemistry, the most substantial impact comes from the particles in the 0.002 to 10 µm range, as they can be carried over more considerable distances (Finlayson-Pitts and Pitts, 1999). The Icelandic dust in the troposphere is not as addressed as the impact of desert dust. This HLD is very likely a long-range transporting carrier for many species adsorbed on its surface, which can act as a sink of trace gases and a subsequent platform for transferring taken-up species. Along with transport, adsorbed species may undergo different heterogeneous reactions that can lead to secondary compound formation. Such processes can influence the reactivity and balance of atmospheric species. Optical, hygroscopic, and, more generally, physicochemical properties of the HLD can change due to surface processes, implying atmospheric trace gases due to heterogeneous interactions (Usher et al., 2003). The consequences can be starkly different depending on the nature of atmospheric trace gases interacting with HLD. This section aims to illustrate the diversity of interactions between HLD and atmospheric trace gases to emphasize the various impacts of these aerosols on atmospheric physics and chemistry. In the case of ozone, if the direct heterogeneous interaction with dust does not play a major role in the atmospheric concentration decrease in the primary compound, surface processes are triggered, affecting the atmospheric budget of ozone. In the case of NO2, heterogeneous processes on dust can significantly lead to HONO species forming, with direct impacts on gas-phase atmospheric reactivity. In the case of SO2, beyond a complex reaction pathway, the heterogeneous process dually affects the budget of the taken-up species and the chemical and physical properties of the dust surface.
If the heterogeneous reaction of NO2 with various types of atmospheric particles, e.g., salts, soot, mineral dust, and proxies, was addressed in the literature (George et al., 2015), the interaction of NO2 with volcanic particles, typical HLD desert dust, under atmospheric conditions, has only been studied by Romanias et al. (2020). They explore the possible formation of a short-lifetime key atmospheric species, considered a trigger of numerous atmospheric processes: HONO, a precursor of OH radicals in the atmosphere. To that end, NO2 uptake on Icelandic HLD is explored under various and contrasting atmospheric conditions. Despite the relatively close volcanic regions where the selected samples originate, uptake coefficients of NO2 contrasted significantly with the dust location due to magmatic and morphological differences among samples. This point confirms that, concerning heterogeneous atmospheric chemistry, sample behavior can dramatically deviate from one class of dust to another, with physical and chemical characterizations of the samples remaining key intrinsic descriptors. Nonetheless, volcanic dust appears as effective NO2 scavengers from the atmosphere. The interaction of NO2 with HLD is evidenced as a source of NO and, more interestingly, HONO, with kinetics and formation yields highly dependent on relative humidity. Higher HONO formation yields on volcanic samples are observed for relative humidity (RH) values exceeding 30 % RH. Heterogeneous construction of HONO from NO2 interaction with Icelandic dust is estimated as atmospherically significant under volcanic eruptions or, more frequently in Iceland, during typical volcanic dust storms. This leads to HONO formation rates of up to 10 pptV h−1, which can significantly influence the regional atmosphere's oxidative capacity. The experimental determination of NO2 uptake coefficient γ allows inclusion of such processes in atmospheric modeling, improving their representativeness.
A transient uptake of SO2 – an initially important uptake of SO2 that is progressively reduced – leads to low steady-state uptake coefficients of SO2 after several hours of exposure in the ranges of 10–9 to 10–8. The surface coverages were in the range of 1014–1016 molec. cm−2 using the total surface area or the geometric surface area of aerosols, respectively (Urupina et al., 2019). Zhu et al. (2020) estimated that around 43 % more volcanic sulfur is removed from the stratosphere within months due to SO2 heterogeneous chemistry on volcanic particles than without. Concomitantly with SO2 uptake, sulfites and sulfates are monitored on the surface of volcanic dust, with sulfates being the final oxidation product, attesting to SO2 surface reaction. Through surface hydroxyl groups, the dust surface's chemical composition plays a crucial role in converting SO2 to sulfites, as evidenced experimentally using lab-scale but atmospherically relevant experimental setups (Urupina et al., 2019). This provides original insights into the kinetics and mechanism of SO2 uptake and the transformation on volcanic material under simulated atmospheric conditions, bringing an accurate perspective on SO2 heterogeneous sinks in the atmosphere on the HLD surface. The model simulations of Zhu et al. (2020) suggested that the transformation of SO2 on such particles plays a key role in the stratosphere's sulfate content. Interestingly, this transformation and accumulation of sulfates on the surface of particles could turn the unreactive ozone material reactive, especially in the stratosphere, where volcanic particles have longevity.
The case of SO2 uptake points to the aging of the HLD surface with subsequent impacts on its chemical (e.g., hygroscopicity) and physical (e.g., optical) properties. Changes in hygroscopic properties can correlate with HLD's erratic behavior to act as cloud- or ice-nucleating particles, depending on their interactions with atmospheric gases. Similarly, sulfate and sulfuric acid's high surface coverage for volcanic dust, as reported by Urupina et al. (2019), questions the variability of the HLD refractive index and the impact on remote sensing of fresh versus aged dust.
3.5.2 Impacts of HLD on clouds and cloud-climate feedback
Clouds across the mid and high latitudes are of first-order importance. Climate and HLDs may play a first-order but highly uncertain role in defining their properties through the initiation of ice formation. Clouds frequently persist in a supercooled state. However, even a few droplets converting to ice crystals through heterogeneous freezing can lead to microphysical processes that dramatically reduce a cloud's liquid water content, reducing its albedo and exposing the surface underneath (Murray et al., 2021; Tan and Storelvmo, 2019). Only a small subset of atmospheric aerosol can nucleate ice; concentrations of around only one ice-nucleating particle (INP) per liter of air active at the cloud temperature can dramatically alter cloud albedo. In contrast, the concentrations of aerosol particles capable of serving as cloud condensation nuclei (CCN) are orders of magnitude larger. Hence, dust particles at the high latitudes will rarely exist in high enough concentrations to dramatically impact cloud droplet numbers by providing additional CCN. However, HLD has been shown to serve as an effective INP in sufficient concentrations to potentially impact mixed-phase clouds (Sanchez-Marroquin et al., 2020). Ice formation's role in climate projections depends on the clouds' locations. In the following paragraphs, we discuss two distinct classes of clouds that may be influenced by HLD particles serving as INPs.
For boundary layer clouds over oceans between approximately 45 and 70∘, the amount of ice versus supercooled water, as well as albedo, is critical for the global climate (Vergara-Temprado et al., 2018; Bodas-Salcedo et al., 2014). These clouds are where substantial solar insolation exists, and the contrast between a high-albedo cloud and a dark ocean surface is significant. Hence, these clouds are implicated in the cloud-phase feedback, where water replaces ice, increasing their albedo as the world warms with increased carbon dioxide (Storelvmo et al., 2015). This feedback's uncertainty is very high, with the temperature rise associated with a doubling of carbon dioxide, rising from around 4 K to well above 5 K simply by increasing the amount of supercooled water in clouds in the current climate (Frey and Kay, 2018). Hence, understanding the sources of INPs at the high latitudes, including HLDs, is critical to understanding these climate-relevant issues (Murray et al., 2021).
The second group of clouds is those occurring at high latitudes. For example, in the central Arctic, mixed-phase clouds play a critical role in the local Arctic climate and the phenomenon of Arctic amplification. In a corollary to the cloud-phase feedback, water replacing ice leads to more downward longwave radiation, resulting in positive feedback (i.e., amplification) (Tan et al., 2016). Hence, the phase of clouds and therefore the INP population in clouds in the present Arctic atmosphere are key to defining this feedback's strength. Moreover, any changes in the INP population with a changing climate may also provide feedback on cloud properties (Murray et al., 2021).
Given the apparent importance of INPs in defining cloud properties and climate feedback, surprisingly little is known about the ice-nucleating properties of HLDs. Mineral dust from low-latitude sources is one of the most important types of atmospheric INPs in clouds below approximately −15 ∘C around the globe because of its relatively high ice-nucleating activity and abundance in the atmosphere (Murray et al., 2012). A handful of papers have also identified HLDs as significant contributors to the Arctic's INP population (Irish et al., 2019; Sanchez-Marroquin et al., 2020; Tobo et al., 2019; Šantl-Temkiv et al., 2019). HLDs may differ in their ice-nucleating ability from LLDs for several reasons. Firstly, the HLDs from glacial valleys, for example, are often richer in primary minerals (olivines, pyroxenes, feldspars, and amphiboles) and less rich in clays compared to LLDs. This is crucial because K-rich feldspars are known for their exceptional ice-nucleating ability, whereas clays are much less active (Harrison et al., 2019; Atkinson et al., 2013). Secondly, the most prominent LLD sources, like those in Africa, are abiotic (Price et al., 2018), whereas it has been found that HLDs can be associated with highly effective biogenic ice-nucleating material (Tobo et al., 2019; Šantl-Temkiv et al., 2019). The inclusion of biological ice-nucleating material, which can be ice-active at temperatures much higher than −15 ∘C, may mean that these dust sources have a disproportionately greater impact on cloud glaciation and climate than their low-latitude counterparts. Much more research is needed to define and understand the ice-nucleating ability of these HLD sources.
3.5.3 Impacts of HLD on the marine environment
Mineral dust particles are a source of essential nutrients such as P and Fe to the ocean ecosystems (e.g., Jickells et al., 2005; Mahowald et al., 2005; Stockdale et al., 2016). Dust deposition onto the ocean's surface can stimulate primary productivity and enhance carbon uptake, indirectly affecting the climate (e.g., Jickells and Moore, 2015; Mahowald, 2011). The extent of these impacts primarily depends on the dust deposition fluxes, their chemical properties, and the nutrients of (co)limitation patterns in the ocean waters (e.g., Boyd et al., 2007, 2010; Kanakidou et al., 2018; Mills et al., 2004; Moore et al., 2013; Shi et al., 2012; Stockdale et al., 2016). The Arctic Ocean is often nitrogen-limited (von Friesen and Riemann, 2020).
The aerosol fractional Fe solubility (%) is defined as the ratio of dissolved Fe (in the filtrate, which has passed through 0.2 or 0.45 µm pore size filters) to the total Fe in the bulk aerosol (e.g., Meskhidze et al., 2019; Shi et al., 2012). This is typically used to indicate the fraction of Fe, which is likely to be bio-accessible for marine ecosystems (Meskhidze et al., 2019).
Sub-Arctic oceans are Fe-limited or seasonally Fe-limited. Fe limits primary productivity in the sub-Arctic Pacific Ocean (Martin and Fitzwater, 1988). The atmospheric Fe deposition in the Gulf of Alaska is dominated by dust transported from glacial sediments from the Gulf of Alaska coastline (Crusius et al., 2011), with relatively high fractional Fe solubility – around 1.4 % (Schroth et al., 2017). Although the upwelling of deep water is the major source of dissolved Fe, the atmospheric flux of dissolved Fe to the Gulf of Alaska's surface water is comparable to the Fe flux from eddies of coastal origin (Crusius et al., 2011). The magnitude of glacial dust's deposition to the Gulf of Alaska varies significantly depending on the regional weather conditions. However, the extent of its impacts is still unclear (Schroth et al., 2017). Currently, the spatial resolution of global dust models is too low to accurately reproduce Alaskan dust flux, generated by anomalous offshore winds and channeled through mountains (Crusius, 2021). Recently, Crusius (2021) determined dissolved Fe inventories based on time series of dissolved Fe and particulate Fe concentrations from Ocean Station Papa in the central Gulf of Alaska, including measurements from September 1997 to February 1999. The analysis showed 33 %–70 % increases in dissolved Fe inventories between September and February of successive years. These increases were possibly linked to dust fluxes from the Alaskan coastline – known to occur mostly in fall (Crusius et al., 2011; Schroth et al., 2017). These new results support the importance of atmospheric Fe's contribution, although more work is needed to confirm the sources of dissolved Fe in the Gulf of Alaska.
The sub-Arctic North Atlantic Ocean is seasonally Fe-limited (Nielsdóttir et al., 2009; Ryan-Keogh et al., 2013). Natural dust from Iceland largely contributes to the atmospheric dust deposition in the North Atlantic Ocean (Bullard, 2016). Icelandic dust originates from volcanic sediments and has a relatively high total Fe content – about 10 % (e.g., Arnalds et al., 2014; Baldo et al., 2020). The estimated total Fe deposition from Icelandic dust to the ocean's surface is 0.56–1.38 Mt yr−1 (Arnalds et al., 2014). The initial Fe solubility observed in dust samples from Icelandic dust hotspots ranges from 0.08 % to 0.6 % – comparable to that of mineral dust from low-latitude regions such as northern Africa, while the fractional Fe solubility at low pH (i.e., 2) is significantly higher than typical LLD (up to 30 %) (Baldo et al., 2020). Achterberg et al. (2018) argued that deepwater mixing is the dominant source of Fe in the sub-Arctic North Atlantic Ocean's surface water, which is up to 10 times higher than the Fe supply by atmospheric Fe deposition. However, during the 2010 eruption of the Icelandic volcano Eyjafjallajökull, Achterberg et al. (2013) observed elevated dissolved Fe concentration and nitrate depletion in the Iceland Basin, followed by an early spring bloom. They measured an initial fractional Fe solubility of 0.04 %–0.14 % for Icelandic ash, which is below or towards the lower end of the range of values estimated for Icelandic dust (0.08 %–0.6 %) (Baldo et al., 2020). High deposition flux (Arnalds et al., 2016) and higher Fe solubility of Icelandic dust (Baldo et al., 2020) suggest that they may impact Fe biogeochemistry and primary productivity in the surface ocean. However, more research is needed to confirm this.
The Southern Ocean is known to be Fe-limited (Moore et al., 2013). Major atmospheric dust sources include, for example, Australia, southern South America, and southern Africa (e.g., Ito and Kok, 2017). Contribution from local sources in Antarctica is also observed (e.g., Chewings et al., 2014; Winton et al., 2014, 2016b). Winton et al. (2016a) reported a background fractional Fe solubility from Antarctic dust sources of 0.7 % – similar to the upper limit of Fe solubilities observed in Icelandic dust (Baldo et al., 2020). However, mineral dust originating from glacial sediments from the Gulf of Alaska coastline showed higher Fe solubilities (1.4 %) (Schroth et al., 2017) – likely due to the different mineralogy and Fe speciation in the samples. The various methods used to determine the fractional Fe solubility in these studies may also contribute to this difference (Perron et al., 2020).
Although the upwelling of deep water is a major source of dissolved Fe, the atmospheric deposition of dissolved Fe can locally contribute to the phytoplankton bloom (Winton et al., 2014). However, evidence exists that increased dust flux enhanced primary production in the Southern Ocean in the last glacial age (Martínez-García et al., 2014). The Ross Sea is a continental shelf region around Antarctica and a highly biologically productive area in the Southern Ocean, which has important implications for global carbon sequestration (e.g., Arrigo et al., 2008; Arrigo and Van Dijken, 2007). In the Ross Sea, an additional Fe supply is required to sustain the intense phytoplankton bloom during the austral summer (Tagliabue and Arrigo, 2005). Measurements conducted on snow pits and surface snow samples showed that local Antarctic dust contributes to Fe deposition. However, this contribution is only a minor component of the total Fe supply to the Ross Sea, with most being supplied by the upwelling of deep water (Winton et al., 2014, 2016a, b).
In the polar regions, atmospheric dust is mostly delivered to the sea ice, where melting and freezing cycles (ice processing) can enhance the formation of relatively more soluble phases of Fe oxide–hydroxide minerals such as ferrihydrite. This formation can increase the flux of atmospheric dissolved Fe to the ocean (Raiswell et al., 2016).
3.5.4 HLD impacts on the cryosphere and cryosphere–atmosphere feedback
The cryosphere is the frozen water part of the Earth system, including sea, lake, and river ice, snow cover, glaciers, ice caps, and ice sheets, and permafrost and frozen ground. These components play a crucial role in the Earth's climate (IPCC, 2019). Temperatures in fragile areas, such as the pristine polar regions, have been increasing at twice the global average; the highest increase in the temperature on the coldest days – up to 3 times the rate of global warming – is projected for the Arctic (IPCC, 2021). Warming in vulnerable cold climate land areas causes glacier retreat, permafrost thaw, and a decrease in snow cover extent (IPCC, 2019). Consequently, potential HLD sources, such as glacial sediments, can increase (e.g., Nagatsuka et al., 2021). When dust is long-range-transported and wet- or dry-deposited or windblown from local dust sources, the ice and snow albedo decreases and influences glacier melt (e.g., Boy et al., 2019) via the positive ice-albedo feedback mechanism (AMAP, 2015; Flanner et al., 2007; Gardner and Sharp, 2010; IPCC, 2019). Cryospheric melt processes are controlled by many environmental factors (IPCC, 2019), such as solar irradiance, ambient temperature, and precipitation (e.g., Meinander et al., 2013, 2014; Mori et al., 2019). Kylling et al. (2018) used dust load estimates from Groot Zwaaftink et al. (2016) (using an LLD complex refractive index for HLD) to quantify the mineral dust instantaneous radiative forcing (IRF) in the Arctic for 2012. They found that the annual-mean top-of-the-atmosphere IRF (0.225 W m−2) had the largest contributions from dust transported from Asia south of 60∘ N and Africa; HLD (>60∘ N) sources contributed about 39 % to the top-of-the-atmosphere IRF. However, HLD had a larger impact (1 to 2 orders of magnitude) on IRF per emitted kilogram of dust than low-latitude sources. They also reported that mineral dust deposited on snow accounted for nearly all the bottom-of-the-atmosphere IRF (0.135 W m−2), with over half caused by dust from high-latitude sources north of 60∘ N.
For snow and ice (glacier) surface radiation balance, the net energy flux EN is due to differences between downward (↓) and upward (↑) non-thermal shortwave (SW) and thermal longwave (LW) radiative fluxes. This is most critically influenced by the surface characteristics of the bi-hemispherical reflectance (BHR), i.e., albedo (Manninen et al., 2021). Therefore, melt is also controlled by dark impurities in snow and ice (IPCC, 2019). Black carbon (BC) is, climactically, the most significant and best-studied dark light-absorbing aerosol particle in snow (e.g., Bond et al., 2013; Dang et al., 2017; Evangeliou et al., 2018; Flanner et al., 2007; Forsström et al., 2013; Mori et al., 2019; Meinander et al., 2020a, b). Radiation-transfer (RT) calculations indicate that seemingly small amounts of BC in snow, on the order of 10–100 parts per billion by mass (ppb), decrease its albedo by 1 %–5 % (Hadley and Kirchtetter, 2012). BC has been shown to enhance snowmelt (AMAP, 2015; Bond et al., 2013; IPCC, 2019). Other light-absorbing particles include organic carbon (OC, including brown carbon – BrC) and dust. Also, blooms of pigmented glacier ice algae can lower ice albedo and accelerate surface melting (McCutcheon et al., 2021), showing a direct link between mineral phosphorus in surface ice and glacier ice algal biomass. This indicates that nutrients from mineral dust likely drive glacier ice algal growth, identifying mineral dust as a secondary control on ice sheet melting. Some Icelandic dust sources have particles almost as black as black carbon by the reflectivity properties when measured as bulk material or on snow and ice surfaces (Peltoniemi et al., 2015). Unlike BC, Icelandic dust has been shown to melt snow quicker in small amounts and to insulate and prevent melt in larger amounts (e.g., Dragosics et al., 2015; Möller et al., 2016; Boy et al., 2019). Changes related to permafrost thaw and snowmelt and ice melt, including disappearing glaciers, rising sea levels, and drinking water shortages, are among the most serious global threats (IPCC, 2019). Water availability is vital in regions where crops depend most on snowmelt water resources (Qin et al., 2020). Snow is also essential in the catchment areas (i.e., areas supplying watercourses) and for many snow-dependent organisms, including plants, animals, and microbes (Zhu et al., 2019). Melt can also run hydroelectric power plants that supply electricity (e.g., Lappalainen et al., 2022). This all highlights the importance of investigations and continuous assessment of the temporal and spatial significance and contribution of different light-absorbing impurities in enhancing or initiating cryospheric melt in the changing climate.
3.6 Understanding the HLD sources
The HLD results are further discussed from the perspective of HLD SI values, comparison to available HLD information on the various regions, geological perspective on sources, focusing on a gap identified in HLD observations for the central part of the East European Plain and dust particle properties, and local HLD sources and long-range transport of dust with the focus on results from the observations in Svalbard and Antarctica.
3.6.1 SI values
Most of the HLD study sites agree with UNCCD G-SDS-SBM SI values of the highest dust-productive areas, identifying an environment from a given location within a distance of ≤0.1∘. Surfaces with higher maximum SI include a significant portion of the land surface in HLD regions. In the southern HLD region, an annual change in SI exists. However, approximately half the dust-productive surface stays exposed to wind erosion during the year. In the northern HLD region, SI intensity varies significantly with the weather. High values of SI may not always coincide with high surface winds, meaning high values may exist but not necessarily result in a dust storm. In case emissions occur, dust may remain undetected because of the absence of ground observations over most of the HLD region and frequent cloud cover over airborne dust, obscuring remotely sensed imagery.
Based on the SI values, the East Greenland sources in this study (nos. 58–64 in Fig. 1) are seasonal, meaning their SI minimum value is zero. Conversely, the West Greenland sources are not necessarily seasonal since their SI minimum values are somewhat reduced (but not to zero). However, the term “seasonal” regarding the SI values means that the soil surface conditions are suitable for dust emissions, although that does not mean emissions will happen. Similarly, the seasonality of all sources in this collection can be further studied.
When the newly identified sources are close together, this might indicate that they are part of the larger dust source area, like South Iceland, West Greenland, or East Greenland. The discovered sources could be considered to represent the hotspot locations, i.e., the most emissive or active locations, of those dust-productive areas. Simultaneously, however, the land surface and soil composition can be very complex and spatially variable and the identification of single sources justified until the source characteristics and particle properties have been characterized in more detail. For example, Icelandic sources have shown that each source, even proximate ones, may have different particle size distributions and optical properties. The results (Fig. 2) suggest two northern HLD belts. The first HLD belt would extend at 50–58∘ N in Eurasia and 50–55∘ N in Canada and the second dust belt at >60∘ N in Eurasia and >58∘ N in Canada, with a “no-dust” belt between the HLD and LLD belts (except for British Columbia).
Uncertainties about the detected locations of the HLD sources and G-SDS-SBM SI values arise from the methodology for determining HLD source locations. These locations are ad hoc location sources from satellite images of dust plumes; other kinds of airborne dust observations may introduce some errors in location estimation compared to on-site land surface monitoring and the precision of available data locations. The resolution of G-SDS-SBM may be too coarse for small-scale source areas (in this case, the representative grid point value shows a reduced SI value since it represents the whole grid box). However, the in-point (at location) values are also given maximum values in the area around the given location (one point distance: 30 arcsec, 0.1∘, 0.5∘, and 1∘ distance). Values of SI above 0.9 have topsoil potential for SDS production in the top 10 % of grid boxes, with some emission potential in G-SDS-SBM (or in the top 10 % of most dust-productive surfaces globally in case of favorable weather conditions), above 0.8 in the top 20 %, above 0.7 in the top 30 %, and so forth. Factors reducing source function value or topsoil dust productivity are sparse vegetation, coarser soil texture, higher moisture, and temperatures near the freezing point. Uncertainties in the methodology for deriving G-SDS-SBM arise from the quality and resolution of available global datasets and the determination of thresholds for EVI in defining bare land fraction (primarily for brown grassland, which may appear as potential dust sources but with lower productivity). Surfaces with low SI values in favorable conditions for dust emission, in case of high winds, may produce some blowing dust events; sources with higher values of SI may generate dust storms. Real dust production from sources depends on high winds occurring while SI is high.
Forty-nine locations were in the northern HLD region (47 according to the HLD definition by Bullard et al., 2016, except for 2: nos. 8 and 48, with latitudes 47.7 and 47.6∘ N, respectively), while 15 were in the southern HLD region, including 4 south of 60∘ S, where the values of SI are not provided. In the northern HLD region, higher dust-productive potential (SI 0.5) has 17 of 49 marked locations at the HLD source marking the exact location. Also, 38 sites are where a distance from a mark point (D) is equal to or less than 0.1∘ (Supplement Table S4). Very high dust productivity, with SI 0.7, has 33 locations within D 0.1∘ and 42 and 46 within 0.5 and 1∘, respectively. The highest dust-productive potential, with SI 0.9∘, has 27 locations within D 0.1∘ and 39 and 44 within 0.5 and 1∘, respectively. One point has the highest SI value with less than 0.5∘ and five less than 0.9∘ away when considering the largest environment of the HLD source mark. Three HLD source region marks are in the sea, so their source values are marked as −99 (undefined). In the southern HLD region, 11 locations are considered (situated between 40 and 60∘ S). Seven sources have very high dust productivity with SI 0.7 where the HLD source marker is; three more have SI 0.7∘ in the area of the source marker with D 0.1∘. The highest dust-productive potential, with SI 0.9∘, has seven sources in the area with the source marker with D 0.1∘ and three more in the area with D 0.5∘. The source maximum and minimum intensities in these southern HLD regions differ much less than in the northern HLD region.
As a summary, our modeling results on the spatial distribution of the dust sources (Fig. 2) showed evidence supporting a northern HLD belt, defined as the area north of 50∘ N, where we distinguish the following HLD-source areas: (a) “transitional HLD-source area”, which extends at latitudes 50–58∘ N in Eurasia and 50–55∘ N in Canada, and (b) “cold HLD-source area”, which includes areas north of 60∘ N in Eurasia and north of 58∘ N in Canada, with currently a “no-dust source” area between the HLD and LLD belts (except for British Columbia).
3.6.2 Comparison of various regions
For the HLD sources identified and included in our collection, the available information varied from detailed characterizations to the first satellite observations, waiting to be complemented with measurement data. Model output of dust transport can provide valuable additional information. The sources are at the northern and southern high latitudes and include a variety of environments. Particle properties, such as particle size distributions, have been determined for only some of the identified HLD sources. For example, our study's many Iceland southern coast sources have not had any characterization done. Previous results on the known sources in Iceland's southern coast region show that the particle size distributions vary substantially from location to location. No assumptions can be made based on characterization in one place.
For Iceland seasonality, the correlation of SILAM modeled and measured PM10 and PM2.5 total aerosol concentration in Iceland is low, especially in 2018, which can mainly be explained by the measurement locations being far from the source locations and showing the effects of road dust rather than long-range-transported dust. Also, the Reykjavik and Akureyri dust inventories are unrepresentative due to the challenge of fitting the modeled long-range-transported dust emissions 695 to the measurement data within the 0.1∘ model resolution. Near Reykjavik, dust emissions, e.g., from Landeyjasandur, may contribute to the measured dust concentrations. However, the 0.1∘ resolution of the model is too scarce to simulate them.
The ends of summer and fall (October) are the seasons for dust activity in Greenland. For example, on 19 October 2021, there was significant dust activity in West Greenland: several glacial valleys emitted dust along the 700 km-long coast. During that dust event was a good Sentinel overpass showing a long narrow valley with a great deal of haze (dust) suspended (appearing as fuzziness in the image) (Gassó, 2021b). As far as we know, no previous observations for this source exist. Greenland's HLD sources (nos. 53–58 of Fig. 1) from its western coast are considered new and identified here using satellite observations. Currently, further knowledge on the recurrence and area of the emission source is lacking. It is probable that these Greenland HLD sources from the western coast have been unidentified due to frequent cloudy conditions. The representation of dust sources in modeling approaches requires information on the location, soil characteristics, and temporal changes. A detailed specification of the geographic distribution of potential dust sources and their physical (e.g., particle size distribution, optics) and mineralogical/chemical (e.g., mineral fractions, chemical composition) properties is critical to accurately parameterize dust emission's potential in numerical dust models. Various methods exist to detect new sources; remote sensing is one of the most powerful tools, as demonstrated on Iceland's southern coast and Greenland's western and eastern coasts.
The central part of the East European Plain, with the wide occurrence of silty soils derived from loess-like sediments and reduced natural vegetation, is a potential aeolian dust source (Bullard et al., 2011; Sweeney and Manson, 2013). However, this region currently lacks observations on dust lifting and transport. Therefore, this region was not included in our collection of HLD sources. The gap for observations in the central part of the East European Plain for potential HLD source updates is filled here with new data in Figs. S1–S4 on the partitioning of elements among the five particle size fractions separated from the natural soils of a rural area 100 km southwest of Moscow (Fig. S1). The study area (55∘12′–55∘13′ N, 36∘21′–36∘22′ E) belongs to the southeastern part of the Smolensk–Moscow Upland (314 m a.s.l.), representing a marginal area of the Middle Pleistocene (MIS 6) glaciation with moraine topography modified by post-glacial erosional and fluvial processes. The major soil reference group is Retisol (IUSS Working Group WRB, 2015), developed on the loess-like loam. About 50 % of the soils in the interfluve area were subjected to arable farming. A new and unpublished independent dataset on 33 elements in topsoil horizons was obtained with a higher-accuracy ICP-MS/AES analysis (compared to the DC-ARC-AES dataset of Samonova and Aseyeva, 2020).
Additional dust sources with massive dust storms causing severe traffic disruption have been documented outside the dust belt at higher latitudes. These sources were mainly arable fields, such as those in Germany and Poland, as well as Montana and Washington State (in the US) (Hojan et al., 2019).
3.6.3 A geological perspective on HLD sources and particle properties
Dust sources involve very different formations and geological environments, each leaving its own imprint on the sediments. Thus, the geomorphological, sedimentological, petrological, and geochemical study of the loose sedimentary formations in the source areas provides information on the origin and provenance of dust when it is transported out or far away. These types of studies – quite typical for Saharan dust – are not so well-established in the case of HLD sources. These territories are not all easily accessible. Even when they are, the time may not coincide with the dust production and/or dust emission period, which may be one reason for this missing source area characterization.
Geomorphological studies cover a wide range of subjects and topics, from characterizing specific dust sources (e.g., Arnalds et al., 2016; Bullard and Mockford, 2018; Bertran et al., 2021) to analyzing processes (e.g., Bullard and Austin, 2011; Hedding et al., 2015; Wolfe, 2020) to landform evolution (Heindel et al., 2017). Sedimentological studies on dust sources focus on the particles' morphological characteristics and textural details of the loose sediment formations. The size, shape, and surface characteristics of the particles result from morphogenetic processes. As such, these particles say a great deal about the source areas. Furthermore, the particles' size and shape influence their lifting and transport capacity and, finally, the distance they can reach from their site of origin. This applies to the studies of the properties of volcaniclastic dust sources in Iceland (e.g., Butwin et al., 2020; Richards-Thomas et al., 2021). From the petrological and geochemical perspective, the panorama is even wider and more varied. Save a few (e.g., Baratoux et al., 2011; Moroni et al., 2018), most studies are not aimed at studying dust sources but comprise different targets involving the parental soils (e.g., Antcibor et al., 2014; Brédoire et al., 2016). While providing information on the (possible) source areas for dust, these latter studies are not explicitly aimed at studying dust sources, so they are not functional for that purpose. Specific survey and sampling activities by a team of experts would be required to address all aspects of dust sources and properties adequately. Thus, obtaining a database as rich and articulated as possible on the particles' physicochemical properties within dust would be feasible, providing the ability to predict dust behavior within the aerosols and understand medium- and long-range transport phenomena present. A further aspect regarding dust sources and properties is the evolution of the particles' physicochemical properties due to the lifting and transport mechanisms. The aerosols must be sampled in different places at different distances from the source. However, this approach is complicated by the air masses mixing during transport, requiring a deep investigation of air mass back-trajectories. Conversely, treating the soils in the lab by re-suspending and sampling them using impactors at well-defined cut-off size ranges can be very advantageous. Such work has been carried out on Australian soils and southern African soils (Gili et al., 2021) to study the dust sources in Antarctica, which is now underway in Iceland (Beatrice Moroni, personal communication, 2021).
3.6.4 Local HLD sources versus long-range-transported dust: discussing Svalbard and Antarctica
The same areas of dust lifting can also be deposition sites when particles leaving their respective source regions are deposited there after prolonged transport pathways. The extent of the contribution of local and long-range sources may vary during the year depending on the type of atmospheric circulation and state of the exposed surfaces, particularly the presence of bare deglaciated soils. Such is the case of Svalbard, where the local dust sources prevail over the long-range ones, especially in summer; the contrary occurs in the rest of the year (Moroni et al., 2016; Spolaor et al., 2021). Conversely, and always in Spitsbergen, the types of contributions – local and long-range – may also depend on the altitude due to the stratified structure of the lower atmosphere frequently found at high latitudes (e.g., Moroni et al., 2015; Kavan et al., 2020a).
Investigating the physicochemical properties, and possibly estimating their contributions at different times of the year, is key to identifying the source regions of dust. For example, in Spitsbergen's case, the potential source contribution function (PSCF) analysis of aerosol samples taken in Ny-Ålesund clearly identified four different HLD sources in Eurasia, Greenland, Arctic–Alaska, and Iceland (Crocchianti et al., 2021). Conversely, chemical–mineralogical investigation and single-particle analysis recognized and estimated Icelandic dust's contribution to Ny-Ålesund (Moroni et al., 2018).
Kandler et al. (2020) collected dry dust deposition near sources in northwestern Africa and central Asia, on Svalbard, and at three locations of the African outflow region and studied particle sizes and composition. Their results showed low temporal variation in estimated optical properties for each site but considerable differences among the African, central Asian, and Arctic regions. An insignificant difference was found between the K-feldspar relative abundances, indicating comparable ice nucleation abilities. The mixing state between calcium and iron compounds differed for near-source and transport regimes, potentially and partially due to size-sorting effects. Thus, in certain situations (high acid availability, limited time), atmospheric processing of the dust is expected to lead to less iron solubility for near-source dust (for central Asian ones) than for transported ones (particularly those of Sahelian origin).
In the southern part, under certain meteorological conditions, dust from lower latitudes can be transported far toward polar regions. Such was the case when a massive dust storm formed over Australia on 22 January 2020. Two days later, dust moved southward, covering a large part of Antarctica's eastern coast. The RHMSS global version of the DREAM model with incorporated ice nucleation parameterization due to dust (Nickovic et al., 2016) predicted the formation of cold clouds over the Antarctic. This ice cloud phase was also documented by NASA satellite observations (Fig. 16). The simulation was part of a WMO SDS-WAS initiative to include dust impacts on high latitudes in its agenda to better understand the role of mineral dust as a climate factor at high latitudes.
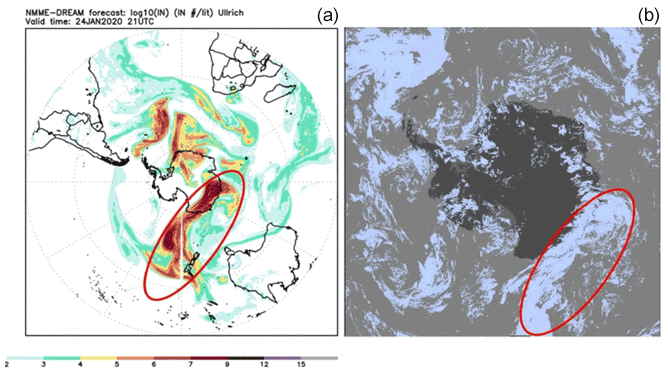
Figure 16Global NMMB DREAM model experiments over Australia and the South Pole. Model dust load for 22 January 2020 (a). NASA MODIS ice cloud phase for 24 January 2020 (b).
The MDVs were previously assumed to be a significant regional source of dust (e.g., Bullard, 2016). New observations show otherwise. Instead, the McMurdo Ice Shelf's (sometimes called the McMurdo debris bands) debris-covered surface is the major dust source. In this study, more details are provided to underline the importance and estimates of the size of the areas. The MDVs (4800 km2) were estimated to fit Category 3 best. Despite active local aeolian sediment transport with many annual occurrences, they are an insignificant source or exporter of dust regionally, thus having only a small but poorly known climatic or environmental significance. The MDVs are changing quickly with increased ablation, meltwater, and permafrost incision, so their importance regarding dust generation may change in the near future. The McMurdo Ice Shelf “debris bands” fit Category 2 best. Although it is only about 1500 km2, the McMurdo Ice Shelf is clearly the region's largest and most important dust source – active with a continuous supply of new sediment for export and exposed to frequent strong winds (with many events during the year), although few have been documented. The aeolian sediment impacts sea ice albedo (not directly measured) and marine sedimentation, contributing enough dissolved Fe to potentially support up to 15 % of primary productivity in the southwestern Ross Sea (Winton et al., 2014).
Ice core studies from Antarctica ice sheets show that Antarctica receives long-range dust transport from Australia, South America, southern Africa, and New Zealand (e.g., Bullard, 2016). However, several studies around coastal areas have shown that, locally, Antarctic-sourced dust accumulation rates are at least 2 orders of magnitude higher than that recorded from the polar plateau or global dust models (Chewings et al., 2014; Winton et al., 2014).
This study aimed to identify new HLD sources with the focus on their potential climatic and environmental impacts. A literature survey on impacts and model calculations on emission, transport, and deposition were made to investigate the local, regional, and global significance of the HLD sources. We identified 64 new HLD sources. We estimated that, at the high latitudes, the land area with higher (SI ≥0.5), very high (SI ≥0.7), and the highest potential (SI ≥0.9) for dust emission covers >1 670 000, >560 000, and >240 000 km2, respectively. These estimations agree with the first HLD sources' estimate of an area of >500 000 km2 by Bullard et al. (2016), which mainly included the sources with a very high potential for dust emission, as classified in this study. Our study shows that active sources cover a significantly larger area, confirmed by over 60 new HLD sources with evidence of their dust activity, which is not limited to dry areas. The potential HLD emission areas need proof of observed and identified HLD emission sources.
Our modeling results on spatial distribution of the dust sources showed evidence supporting a northern high-latitude dust (HLD) belt, defined as the area north of 50∘ N, with a “transitional HLD-source area”, extending at latitudes 50–58∘ N in Eurasia and 50–55∘ N in Canada, and a “cold HLD-source area”, including areas north of 60∘ N in Eurasia and north of 58∘ N in Canada, with currently a “no-dust source” area between the HLD and LLD belt, except for British Columbia. Using the SILAM global atmospheric transport model, we estimated that 1.0 % of the global dust emission originated from the high-latitude regions. About 57 % of the dust deposition on snow and the ice-covered Arctic regions came from HLD sources.
Our update provides crucial information on the extent of active HLD sources and their locations. Active HLD sources as essential sources of aerosols that directly and indirectly affect climate and the environment in remote regions are often poorly understood and predicted. HLD is likely a significant source of atmospheric iron deposition in the Southern Ocean encircling Antarctica. More research is needed to quantify the deposition flux of HLD and nutrient (Fe, P, and trace metals such as Co) content and solubility, which can then be fed to ocean biogeochemical models to quantify their impact on ocean biogeochemistry. HLD is also an active INP, changing cloud properties, and HLD has severe consequences when deposited within the cryosphere. However, more studies are needed for HLD from different regions. For example, northern Asian HLD sources are assumed to be numerous but are difficult to access and gain information from. This points to the following main action items for monitoring dust at high latitudes.
-
Firstly, the work on HLD sources needs a multidisciplinary combination of field, laboratory, and experimental work, remote sensing, and emission, transport, and deposition modeling. An increase in observational and modeling studies improves HLD monitoring and predicting.
-
Secondly, the activity of the currently identified active sources should be followed and reevaluated in the coming years and decades.
-
Thirdly, research gaps and future research directions essentially include finding, identifying, and characterizing new dust sources. As soon as there is evidence of finding a new HLD source, it should be included in the list of dust sources and be subject to further study.
-
Fourthly, the role of different types of road dust in the Arctic could be separately assessed using a standard methodology.
In Arctic communities, road dust as a signature of non-exhaust traffic dust formed via the abrasion and wearing down of pavement, traction control materials, vehicle brakes, and tires is a common concern (e.g., Kupiainen et al., 2016; Nordic Council of Ministers, 2017). This paper excluded this type of road dust and only included significant anthropogenic road dust sources where unpaved roads are a substantial dust source. Unpaved areas of parking lots, storage areas, road shoulders, roadside lawn dust, and winter's effects could be considered too. During winter's cold and wet conditions, dust accumulates in snow and ice and the humid road surface texture. As snow and ice melt and street surfaces dry up in spring, high amounts of dust become available for suspension. For example, in Finland, north of 60∘ N, a major anthropogenic dust source comes from sand and gravel uptake for building purposes from ridges formed during the Ice Age. These nonrenewable ridges cover 1.5 million hectares. Since 1960, it has been estimated that approximately 40 million t yr−1 has been utilized (Fig. 211 of Wahlström et al., 1996). These open-sand areas are visible in aircraft photos and satellite images. In Finland, long-range-transported LLD contributes to the dust amounts too (e.g., Meinander et al., 2021). Another health-significant anthropogenic springtime dust source is wintertime pavement traction sanding (Kuhns et al., 2010; Kupiainen, 2007; Stojiljkovic et al., 2019). These springtime dust events are annual but local throughout the country. In comparison, the Moscow metropolitan area (55∘45′ N, 37∘37′ E) is one of the most significant sources of dust at latitudes above 50∘ N, where dust's impact can extend over several hundred kilometers (Adzhiev et al., 2017). Moscow's road dust is mainly generated on paved roads, but roadside soils also contribute (Kasimov et al., 2020). Most often, unsealed soils are covered with lawns and are widespread in parks and recreational and industrial zones characterized by heavy pollution, a mixed upper horizon, and a high degree of soil cover heterogeneity.
This paper aimed to contribute beyond the state of the art of HLD sources by focusing on collecting and providing information on the geographical distribution of dust-productive soils and potential dust sources. This is some of the most important information that is currently lacking but that is necessary to perform successful long-range transport and deposition modeling. The information on the geographical distribution of dust-productive soils needs evidence and verification of detected dust events and is insufficient alone. Therefore, the paper focused on identifying new dust sources, clarifying their climatic and environmental importance, and using emission, long-range transport, and deposition modeling to study where the potential impact areas of the HLD sources are. Our results suggest that future HLD studies should include and update sources within the HLD belt defined here, i.e., at 50–58∘ N in Eurasia and 50–55∘ N in Canada and at >60∘ N in Eurasia and >58∘ N in Canada, as well as sources on the periphery of these regions, especially if sources are highly elevated (Wang et al., 2016).
Icelandic sources have shown that each source, even if nearby, may have different particle size distributions and optical properties. A detailed specification of the geographic distribution of potential dust-productive soils, verified dust sources, and their physical (e.g., particle size distribution, optics) and mineralogical/chemical (e.g., mineral fractions, chemical composition) properties can contribute to the various topics: predicting dust forecasts (e.g., health protection warnings during extreme events); long-range emission, transport, and deposition modeling; dust monitoring control; understanding extreme and rare events; Arctic protection; aviation control; health; tourist boards; assessing climate, environment, and air quality (e.g., Arctic Council Arctic Monitoring and Assessment Programme, AMAP, and Intergovernmental Panel on Climate Change, IPCC, reports); implementing HLD in calculations on direct and indirect radiative forcing, including cloud formation, cryospheric effects, and modeling the impacts. The new observations in this study improved the representation of HLD sources for various approaches and applications related to the observed current, previous, and future environmental changes at high latitudes.
In summary, establishing continuous monitoring of HLD sources and their future changes is key to understanding the climatic and environmental effects at high latitudes, especially in the Arctic. Climate change causes permafrost thaw, decreases snow cover duration, and increases drought, glacial melt, and heatwave intensity and frequency – all leading to increasing the frequency of topsoil conditions favorable for dust emission (increasing soil's exposure to wind erosion) and the probability of dust storms. Although dust originates from natural soils, dust sources are also influenced by human activities, e.g., when deforestation and land management in cold regions lead to ecosystem collapse and desertification (Prospero et al., 2012; Arnalds, 2015). Dust storms from agricultural fields (as reported, e.g., in Poland) can reach distances of over 300 km, drastically reducing visibility and resulting in hundreds of car accidents and fatalities (Hojan et al., 2019). Whether natural or anthropogenic, wildfires can result from new dust sources also (Miller et al., 2012). Hence, human actions can positively and negatively influence HLD and its effects. To understand and assess the temporal activity changes in HLD sources and the multiple impacts of HLD on the Earth systems over time, continuous monitoring and regular updates on locations, particle properties, and activities of current and new HLD sources are needed.
Data are mostly included in this article or are available on request via personal communication.
The supplement related to this article is available online at: https://doi.org/10.5194/acp-22-11889-2022-supplement.
The paper was initiated and led by OuM. PDW co-coordinated and edited it. HLD SI and area calculations were by AVV and BC. New HLD sources were identified as follows: Alaska, Canada: SB, PDW, SG, JK, BJM, JBM, NTO'N, KR. Antarctica: PDW, JK, MiL, OuM, ES. Denmark and Sweden: OuM. Greenland: AB, LGB, PDW, SG. Iceland: TT. Russia: PA, AB, PE, TK, VK, OP, AS, IS, MT. Svalbard: BB, MK, MiL, MaL, BL, AN, TW, KK, NSU, BJM, JBM, ASM, OtM. South America, Argentina, and Patagonia: SG. DREAM model: BC, SN. SILAM model: AU, MS. NK, EA, and OS contributed a Supplement on the central part of European Russia (potential dust source). Dust and clouds: BJM, ASM. Dust and ocean biogeochemistry: ZS, CB. Dust and atmospheric chemistry: FT, MNR, JL, DU. Dust and cryosphere: OuM. All the authors contributed significantly to preparing the manuscript.
The contact author has declared that none of the authors has any competing interests.
Publisher’s note: Copernicus Publications remains neutral with regard to jurisdictional claims in published maps and institutional affiliations.
This article is part of the special issue “Arctic climate, air quality, and health impacts from short-lived climate forcers (SLCFs): contributions from the AMAP Expert Group (ACP/BG inter-journal SI)”. It is not associated with a conference.
This paper was developed as part of the Arctic Monitoring and Assessment Programme (AMAP), AMAP 2021 assessment: Arctic climate, air quality, and health impacts from short-lived climate forcers (SLCFs). We are grateful to the anonymous referees whose comments have been most valuable and have greatly improved our paper. Kaarle Kupiainen, Johanna Ikävalko, and Terhikki Manninen are gratefully thanked. The staff's help regarding the stations is greatly appreciated.
This research was supported by the Ministry for Foreign Affairs of Finland (IBA project no. PC0TQ4BT-25). The study of dust composition in Moscow and Tiksi was supported by the Russian Science Foundation (grant no. 19-77-30004). Firn core collection on southern Spitsbergen, Svalbard, was co-funded by the Research Council of Norway, Arctic Field Grant 2018 (grant no. 282538), funds of the Leading National Research Centre (KNOW) received by the Centre for Polar Studies of the University of Silesia, and statutory activities 3841/E–41/S/2018 of the Ministry of Science and Higher Education of Poland. Czech Science Foundation projects 20-06168Y and GA20-20240S and Ministry of Education, Youth and Sports of the Czech Republic projects (nos. LM2015078 and CZ.02.1.01/0.0/0.0/16_013/0001708) were funders. The support of the EPOS-PL project (no. POIR.04.02.00-14-A003/16), co-financed by the European Union from the funds of the European Regional Development Fund (ERDF) to the laboratory facilities at IG PAS used in the study, is also appreciated. European Union COST Action InDust was also involved in funding. The preparation of this paper was partially funded by Icelandic Research Fund (Rannis) grant no. 207057-051. Outi Meinander wwas funded by the Academy of Finland (ACCC Flagship grant no. 337552 and BBrCAC no. 341271), H2020 EU-Interact (no. 730938), the International Arctic Science Committee (IASC Cross-Cutting grant), and the Ministry for Foreign Affairs of Finland (IBA project no. PC0TQ4BT-20). Denis Frolov was funded by the Lomonosov Moscow State University (state topic “Danger and risk of natural processes and phenomena” no. 121051300175-4 and “Evolution of the cryosphere under climate change and anthropogenic impact” no. 121051100164-0). Konrad Kandler was funded by the Deutsche Forschungsgemeinschaft (DFG, German Research Foundation; grant nos. 264912134, 416816480, and 417012665). Nikolay Kasimov and Elena Aseyeva were funded by the Russian Science Foundation (No. 19-77-30004). Jame King was supported by NSERC Discovery 2016-05417, CFI 36564, and CMN RES00044975. Benjamin Murray, Alberto Sanchez-Marroquin, and Sarah Barr were supported by the European Research Council (648661 MarineIce) and the Natural Environment Research Council (NE/T00648X/1; NE/R006687/1). Ottmar Möhler and Nsikanabasi Silas Umo were funded by the Helmholtz Association of German Research Centres through its “Changing Earth – Sustaining our Future” program. Markku Kulmala, Nikolay Kasimov, and Olga Popovicheva were funded by the Russian Ministry of Education and Science (grant no. 075-15-2021-574). Keyvan Ranjbar and Norman T. O'Neill were funded by the PAHA project (NSERC-CCAR program; RGPCC-433842-2012), the SACIA project (CSA-ESSDA program; 16UASACIA), and the NSERC DG grant of O'Neill (grant no. RGPIN-05002-2014). Ivan Semenkov, Olga Popovicheva, and Nikolay Kasimov were funded by Lomonosov Moscow State University (Interdisciplinary Scientific and Educational School “Future Planet and Global Environmental Change” and project no. 121051400083-1). Zongbo Shi and Clarissa Baldo were funded by the UK Natural Environment Research Council (grant nos. NE/L002493/1 and NE/S00579X).
Publisher’s note: the article processing charges for this publication were not paid by a Russian or Belarusian institution.
This paper was edited by Susannah Burrows and reviewed by Douglas Hamilton and one anonymous referee.
Abbatt, J. P. D., Leaitch, W. R., Aliabadi, A. A., Bertram, A. K., Blanchet, J.-P., Boivin-Rioux, A., Bozem, H., Burkart, J., Chang, R. Y. W., Charette, J., Chaubey, J. P., Christensen, R. J., Cirisan, A., Collins, D. B., Croft, B., Dionne, J., Evans, G. J., Fletcher, C. G., Galí, M., Ghahremaninezhad, R., Girard, E., Gong, W., Gosselin, M., Gourdal, M., Hanna, S. J., Hayashida, H., Herber, A. B., Hesaraki, S., Hoor, P., Huang, L., Hussherr, R., Irish, V. E., Keita, S. A., Kodros, J. K., Köllner, F., Kolonjari, F., Kunkel, D., Ladino, L. A., Law, K., Levasseur, M., Libois, Q., Liggio, J., Lizotte, M., Macdonald, K. M., Mahmood, R., Martin, R. V., Mason, R. H., Miller, L. A., Moravek, A., Mortenson, E., Mungall, E. L., Murphy, J. G., Namazi, M., Norman, A.-L., O'Neill, N. T., Pierce, J. R., Russell, L. M., Schneider, J., Schulz, H., Sharma, S., Si, M., Staebler, R. M., Steiner, N. S., Thomas, J. L., von Salzen, K., Wentzell, J. J. B., Willis, M. D., Wentworth, G. R., Xu, J.-W., and Yakobi-Hancock, J. D.: Overview paper: New insights into aerosol and climate in the Arctic, Atmos. Chem. Phys., 19, 2527–2560, https://doi.org/10.5194/acp-19-2527-2019, 2019.
Achterberg, E. P., Moore, C. M., Henson, S. A., Steigenberger, S., Stohl, A., Eckhardt, S., Avendano, L. C., Cassidy, M., Hembury, D., Klar, J. K., Lucas, M. I., Macey, A. I., Marsay, C. M., and Ryan-Keogh, T. J.: Natural iron fertilization by the Eyjafjallajokull volcanic eruption, Geophys. Res. Lett., 40, 921–926, https://doi.org/10.1002/grl.50221, 2013.
Achterberg, E. P., Steigenberger, S., Marsay, C. M., LeMoigne, F. A. C., Painter, S. C., Baker, A. R., Connelly, D. P., Moore, C. M., Tagliabue, A., and Tanhua, T.: Iron Biogeochemistry in the High Latitude North Atlantic Ocean, Scientific Reports, 8, 1283, https://doi.org/10.1038/s41598-018-19472-1, 2018.
AMAP: Black Carbon and Ozone as Arctic Climate Forcers, Arctic Monitoring and Assessment Programme (AMAP), Oslo, 116 pp., ISBN 978-82-7971-092-9, 2015.
Amino, T., Iizuka, Y., Matoba, S., Shimada, R., Oshima, N., Suzuki, T., Ando, T., Aoki, T., and Fujita, K.: Increasing dust emission from ice free terrain in southeastern Greenland since 2000, Polar Sci., 27, 100599, https://doi.org/10.1016/j.polar.2020.100599, 2020.
Amosov, P. V. and Baklanov, A. A.: Assessment of dusting intensity on ANOF-2 tailing by using a Westphal D.L. dependency, in: Proceedings of the X International Symposium on Recycling Technologies and Sustainable Development, Bor, Serbia, 4–7 November 2015, Technical Faculty, University of Belgrade, Bor, 39–43, 2015.
Anderson, N. J., Saros, J. E., Bullard, J. E., Cahoon, S. M. P., McGowan, S., Bagshaw, E. A., Barry, C. D., Bindler, R., Burpee, B. T., Carrivick, J. L., Fowler, R. A., Fox, A. D., Fritz, S. C., Giles, M. E., Hamerlik, L., Ingeman-Nielsen, T., Law, A. C., Mernild, S. H., Northington, R. M., Osburn, C. L., Pla-Rabès, S., Post, E., Telling, J., Stroud, D. A., Whiteford, E. J., Yallop, M. L., and Yde, J. C.: The Arctic in the twenty-first century: Changing biogeochemical linkages across a paraglacial landscape of Greenland, BioScience, 67, 118–133, https://doi.org/10.1093/biosci/biw158, 2017.
Antcibor, I., Eschenbach, A., Zubrzycki, S., Kutzbach, L., Bolshiyanov, D., and Pfeiffer, E.-M.: Trace metal distribution in pristine permafrost-affected soils of the Lena River delta and its hinterland, northern Siberia, Russia, Biogeosciences, 11, 1–15, https://doi.org/10.5194/bg-11-1-2014, 2014.
Arnalds, O.: The Soils of Iceland. World Soils Book Series, Springer, Dordrecht, The Netherlands, ISBN-13:9̇78-9401796200, 2015.
Arnalds, O., Thorarinsdottir, E. F., Thorsson, J., Dagsson-Waldhauserova, P., and Agustsdottir, A. M.: An extreme wind erosion event of the fresh Eyjafjallajokull 2010 volcanic ash, Scientific Reports, 3, 1257, https://doi.org/10.1038/srep01257, 2013.
Arnalds, O., Olafsson, H., and Dagsson-Waldhauserova, P.: Quantification of iron-rich volcanogenic dust emissions and deposition over the ocean from Icelandic dust sources, Biogeosciences, 11, 6623–6632, https://doi.org/10.5194/bg-11-6623-2014, 2014.
Arnalds, O., Dagsson-Waldhauserová, P., and Olafsson, H.: The Icelandic volcanic aeolian environment: Processes and impacts – A review, Aeolian Res., 20, 176–195, https://doi.org/10.1016/j.aeolia.2016.01.004, 2016.
Arrigo, K. R. and Van Dijken, G. L.: Interannual variation in air-sea CO2 flux in the Ross Sea, Antarctica: A model analysis, J. Geophys. Res., 112, C03020, https://doi.org/10.1029/2006jc003492, 2007.
Arrigo, K. R., van Dijken, G., and Long, M.: Coastal Southern Ocean: A strong anthropogenic CO2 sink, Geophys. Res. Lett., 35, L21602, https://doi.org/10.1029/2008gl035624, 2008.
Atkins, C. B. and Dunbar, G. B. Aeolian sediment flux from sea ice into Southern McMurdo Sound, Antarctica, Global Planet. Change, 69, 133–141, 2009.
Atkinson, J. D., Murray, B. J., Woodhouse, M. T., Whale, T. F., Baustian, K. J., Carslaw, K. S., Dobbie, S., O'Sullivan, D., and Malkin, T. L.: The importance of feldspar for ice nucleation by mineral dust in mixed-phase clouds, Nature, 498, 355–358, https://doi.org/10.1038/nature12278, 2013.
Aun, M., Lakkala, K., Sanchez, R., Asmi, E., Nollas, F., Meinander, O., Sogacheva, L., De Bock, V., Arola, A., de Leeuw, G., Aaltonen, V., Bolsée, D., Cizkova, K., Mangold, A., Metelka, L., Jakobson, E., Svendby, T., Gillotay, D., and Van Opstal, B.: Solar UV radiation measurements in Marambio, Antarctica, during years 2017–2019, Atmos. Chem. Phys., 20, 6037–6054, https://doi.org/10.5194/acp-20-6037-2020, 2020.
Ayling, B. F. and McGowan, H. A.: Niveo-eolian sediment deposits in coastal South Victoria Land, Antarctica: Indicators of regional variability in weather and climate, Arc. Antarct. Alp. Res., 38, 313–324, 2006.
Bachelder, J., Cadieux, M., Liu-Kang, C., Lambert, P., Filoche, A., Aparecida Galhardi, J., Hadioui, M., Chaput, A., Bastien-Thibault, M.-P., Wilkinson, K. J., King, J., and Hayes, P. J.: Chemical and microphysical properties of wind-blown dust near an actively retreating glacier in Yukon, Canada, Aerosol Sci. Tech., 54, 2–20, https://doi.org/10.1080/02786826.2019.1676394, 2020.
Baddock, M., Mockford, T., Bullard, J .E., and Thorsteinsson, Th.: Pathways of high-latitude dust in the North Atlantic, Earth Planet. Sc. Lett., 459, 170–182, https://doi.org/10.1016/j.epsl.2016.11.034, 2017.
Baklanov, A. and Rigina, O.: Environmental modeling of dusting from the mining and concentration sites in the Kola Peninsula, Northwest Russia, The XI World Clear Air and Environment Congress, Durban, South Africa, 14–18 September 1998, IUAPPA-NACA, Durban, v. 1, 4F-3, 1–18, 1998.
Baklanov, A., Mahura, A., Nazarenko, L., Tausnev, N., Kuchin, A., and Rigina, O.: Modelling of atmospheric Pollution and Climate Change in Northern Latitudes, Russian Academy of Sciences, Apatity, Russia, 106 pp., https://search.rsl.ru/ru/record/01006534167 (last access: 17 August 2022), 2012 (in Russian).
Baldo, C., Formenti, P., Nowak, S., Chevaillier, S., Cazaunau, M., Pangui, E., Di Biagio, C., Doussin, J.-F., Ignatyev, K., Dagsson-Waldhauserova, P., Arnalds, O., MacKenzie, A. R., and Shi, Z.: Distinct chemical and mineralogical composition of Icelandic dust compared to northern African and Asian dust, Atmos. Chem. Phys., 20, 13521–13539, https://doi.org/10.5194/acp-20-13521-2020, 2020.
Baratoux, D., Mangold, N., Arnalds, O., Bardintzeff, J.-M., Platevoët, B., Grégoire, M., and Pinet, P.: Volcanic sands of Iceland - Diverse origins of aeolian sand deposits revealed at Dyngjusandur and Lambahraun, Earth Surf. Proc. Land., 36, 1789–1808, https://doi.org/10.1002/esp.2201, 2011.
Beckett, F., Kylling, A., Sigurðardóttir, G., von Löwis, S., and Witham, C.: Quantifying the mass loading of particles in an ash cloud remobilized from tephra deposits on Iceland, Atmos. Chem. Phys., 17, 4401–4418, https://doi.org/10.5194/acp-17-4401-2017, 2017.
Bertran, P., Bosq, M., Borderie, Q., Coussot, C., Coutard, S., Deschodt, L., Franc, O., Gardère, P., Liard, M., and Wuscher, P.: Revised map of European aeolian deposits derived from soil texture data, Quaternary Sci. Rev., 266, 107085, https://doi.org/10.1016/j.quascirev.2021.107085, 2021.
Bhattachan, A., Wang, L., Miller, M. F., Licht, K. J., and D'Odorico, P.: Antarctica's Dry Valleys: A potential source of soluble iron to the Southern Ocean?, Geophys. Res. Lett., 42, 1912–1918, https://doi.org/10.1002/2015GL063419, 2015.
Bishop, J. K. B., Davis, R. E., and Sherman, J. T.: Robotic observations of dust storm enhancement of carbon biomass in the North Pacific, Science, 298, 817–821, https://doi.org/10.1126/science.1074961, 2002.
Bodas-Salcedo, A., Williams, K. D., Ringer, M. A., Beau, I., Cole, J. N. S., Dufresne, J. L., Koshiro, T., Stevens, B., Wang, Z., and Yokohata, T.: Origins of the Solar Radiation Biases over the Southern Ocean in CFMIP2 Models, J. Climate, 27, 41–56, https://doi.org/10.1175/jcli-d-13-00169.1, 2014.
Bond, T. C., Doherty, S. J., Fahey, D. W., Forster, P. M., Berntsen, T., DeAngelo, B. J., Flanner, M. G., Ghan, S., Kärcher, B., Koch, D., Kinne, S., Kondo, Y., Quinn, P. K., Sarofim, M. C., Schultz, M. G., Schulz, M., Venkataraman, C., Zhang, H., Zhang, S., Bellouin, N., Guttikunda, S. K., Hopke, P. K., Jacobson, M. Z., Kaiser, J. W., Klimont, Z., Lohmann, U., Schwarz, J. P., Shindell, D., Storelvmo, T., Warren, S. G., and Zender, C. S.: Bounding the role of black carbon in the climate system: a scientific assessment. J. Geophys. Res.-Atmos. 188, 5380–5552, https://doi.org/10.1002/jgrd.50171, 2013.
Boy, M., Thomson, E. S., Acosta Navarro, J.-C., Arnalds, O., Batchvarova, E., Bäck, J., Berninger, F., Bilde, M., Brasseur, Z., Dagsson-Waldhauserova, P., Castarède, D., Dalirian, M., de Leeuw, G., Dragosics, M., Duplissy, E.-M., Duplissy, J., Ekman, A. M. L., Fang, K., Gallet, J.-C., Glasius, M., Gryning, S.-E., Grythe, H., Hansson, H.-C., Hansson, M., Isaksson, E., Iversen, T., Jonsdottir, I., Kasurinen, V., Kirkevåg, A., Korhola, A., Krejci, R., Kristjansson, J. E., Lappalainen, H. K., Lauri, A., Leppäranta, M., Lihavainen, H., Makkonen, R., Massling, A., Meinander, O., Nilsson, E. D., Olafsson, H., Pettersson, J. B. C., Prisle, N. L., Riipinen, I., Roldin, P., Ruppel, M., Salter, M., Sand, M., Seland, Ø., Seppä, H., Skov, H., Soares, J., Stohl, A., Ström, J., Svensson, J., Swietlicki, E., Tabakova, K., Thorsteinsson, T., Virkkula, A., Weyhenmeyer, G. A., Wu, Y., Zieger, P., and Kulmala, M.: Interactions between the atmosphere, cryosphere, and ecosystems at northern high latitudes, Atmos. Chem. Phys., 19, 2015–2061, https://doi.org/10.5194/acp-19-2015-2019, 2019.
Boyd, P. W., Jickells, T., Law, C. S., Blain, S., Boyle, E. A., Buesseler, K. O., Coale, K. H., Cullen, J. J., de Baar, H. J. W., Follows, M., Harvey, M., Lancelot, C., Levasseur, M., Owens, N. P. J., Pollard, R., Rivkin, R. B., Sarmiento, J., Schoemann, V., Smetacek, V., Takeda, S., Tsuda, A., Turner, S., and Watson, A. J.: Mesoscale Iron Enrichment Experiments 1993–2005: Synthesis and Future Directions, Science, 315, 612–617, https://doi.org/10.1126/science.1131669, 2007.
Boyd, P. W., Mackie, D. S., and Hunter, K. A.: Aerosol iron deposition to the surface ocean – Modes of iron supply and biological responses, Mar. Chem., 120, 128–143, https://doi.org/10.1016/j.marchem.2009.01.008, 2010.
Brabets, T. P.: Geomorphology of the lower Copper River, Alaska, U.S. Geological Survey Professional Paper 1581, https://pubs.usgs.gov/pp/1581/report.pdf (last access: 17 August 2022), 1997.
Brédoire, F., Bakker, M. R., Augusto, L., Barsukov, P. A., Derrien, D., Nikitich, P., Rusalimova, O., Zeller, B., and Achat, D. L.: What is the P value of Siberian soils? Soil phosphorus status in south-western Siberia and comparison with a global data set, Biogeosciences, 13, 2493–2509, https://doi.org/10.5194/bg-13-2493-2016, 2016.
Bullard, J. E.: The distribution and biogeochemical importance of high-latitude dust in the Arctic and Southern Ocean-Antarctic regions, J. Geophys. Res.-Atmos., 122, 3098–3103, https://doi.org/10.1002/2016jd026363, 2016.
Bullard, J. E. and Austin, M. J.: Dust generation on a proglacial floodplain, West Greenland, Aeolian Res., 3, 43–54, https://doi.org/10.1016/j.aeolia.2011.01.002, 2011.
Bullard, J. E. and Mockford, T.: Seasonal and decadal variability of dust observations in the Kangerlussuaq area, west Greenland, Arct. Antarct. Alp. Res., 50, S100011, https://doi.org/10.1080/15230430.2017.1415854, 2018.
Bullard, J. E., Harrison, S. P., Baddock, M. C., Drake, N., Gill, T. E., McTainsh, G. and Sun, Y.: Preferential dust sources: A geomorphological classification designed for use in global dust-cycle models, J. Geophys. Res., 116, F04034, https://doi.org/10.1029/2011JF002061, 2011.
Bullard, J. E., Baddock, M., Bradwell, T., Crusius, J., Darlington, E., Gaiero, D., Gassó, S., Gisladottir, G., Hodgkins, R., McCulloch, R., McKenna-Neuman, C., Mockford, T., Stewart, H., and Thorsteinsson, T.: High-latitude dust in the Earth system, Rev. Geophys., 54, 447–485, 2016.
Butwin, M. K., Pfeffer, M. A., von Löwis, S., Støren, E. W. N., Bali, E., and Thorsteinsson, T.: Properties of dust source material and volcanic ash in Iceland, Sedimentology, 67, 3067–3087, https://doi.org/10.1111/sed.12734, 2020.
Chewings, J., Atkins, C, Dunbar, G., and Golledge, N.: Aeolian sediment transport and deposition in a modern high latitude glacial marine environment, Sedimentology, 61, 1485–1882, https://doi.org/10.1111/sed.12108, 2014.
Conca, E., Abollino, O., Giacomino, A., Buoso, S., Traversi, R., Becagli, S., Grotti, M., and Malandrino, M.: Source identification and temporal evolution of trace elements in PM10 collected near to Ny-Ålesund (Norwegian Arctic), Atmos. Environ., 203, 153–165, https://doi.org/10.1016/j.atmosenv.2019.02.001, 2019.
Coronato, A., Mazzoni, E., Vázquez, M., and Coronato, F.: PATAGONIA Una síntesis de su Geografía Física (Ediciones), Río Gallegos, Universidad Nacional de la Patagonia Austral, Argentina, http://www.unpa.edu.ar/sites/default/files/publicaciones_adjuntos/PATAGONIA_una_sintesis_de_su_geografia_fisica_web_0.pdf (last access: 17 August 2022), 2017.
Cosentino, N. J., Ruiz-Etcheverry, L. A., Bia, G. L., Simonella, L. E., Coppo, R., Torre, G., Saraceno, M., Tur, V. M., and Gaiero, D. M.: Does Satellite Chlorophyll-a Respond to Southernmost Patagonian Dust? A Multi-year, Event-Based Approach, J. Geophys. Res.-Biogeo., 125, e2020JG006073, https://doi.org/10.1029/2020JG006073, 2020.
Creamean, J. M., Suski, K. J., Rosenfeld, D., Cazorla, A., DeMott, P. J., Sullivan, R. C., White, A. B., Ralph, F. M., Minnis, P., Comstock, J. M., Tomlinson, J. M., and Prather, K. A.: Dust and biological aerosols from the Sahara and Asia influence precipitation in the Western U.S., Science, 339, 1572–1578, https://doi.org/10.1126/science.1227279, 2013.
Crespi-Abril, A. C., Soria, G., De Cian, A., and López-Moreno, C.: Roaring forties: An analysis of a decadal series of data of dust in Northern Patagonia, Atmos. Environ., 177, 111–119, https://doi.org/10.1016/j.atmosenv.2017.11.019, 2017.
Crocchianti, S., Moroni, B., Waldhauserová, P. D., Becagli, S., Severi, M., Traversi, R., and Cappelletti, D.: Potential Source Contribution Function Analysis of High Latitude Dust Sources over the Arctic: Preliminary Results and Prospects, Atmosphere, 12, 347, https://doi.org/10.3390/atmos12030347, 2021.
Crusius, J.: Dissolved Fe Supply to the Central Gulf of Alaska Is Inferred to Be Derived From Alaskan Glacial Dust That Is Not Resolved by Dust Transport Models, J. Geophys. Res.-Biogeo., 126, e2021JG006323, https://doi.org/10.1029/2021JG006323, 2021.
Crusius, J., Schroth, A. W., Gassó, S., Moy, C. M., Levy, R. C., and Gatica, M.: Glacial flour dust storms in the Gulf of Alaska: Hydrologic and meteorological controls and their importance as a source of bioavailable iron, Geophys. Res. Lett., 38, 942–960, https://doi.org/10.1029/2010gl046573, 2011.
Crusius, J., Schroth, A. W., Resing, J. A., Cullen, J., and Campbell, R. W.: Seasonal and spatial variabilities in northern Gulf of Alaska surface water iron concentrations driven by shelf sediment resuspension, glacial meltwater, a Yakutat eddy, and dust, Global Biogeochem. Cy., 31, 942–960, https://doi.org/10.1002/2016GB005493, 2017.
Csavina, J., Field, J., Taylor, M. P., Gao, S., Landázuri, A., Betterton, E. A., and Sáez, A. E.: A review on the importance of metals and metalloids in atmospheric dust and aerosol from mining operations, Sci. Total Environ., 433, 58–73, https://doi.org/10.1016/j.scitotenv.2012.06.013, 2012.
Cvetkovic, B., Dagsson-Waldhauserova, P., Petkovic, S., Arnalds, Ó., Madonna, F.,; Proestakis, E., Gkikas, A., Vukovic Vimic, A., Pejanovic, G., Rosoldi, M., Ceburnis, D., Amiridis, V., Lisá, L., Nickovic, S., and Nikolic, J.: Fully Dynamic High–Resolution Model for Dispersion of Icelandic Airborne Mineral Dust, Atmosphere, 13, accepted, 2022.
Dagsson-Waldhauserová, P. and Meinander, O.: Editorial: Atmosphere–cryosphere interaction in the Arctic, at high latitudes and mountains with focus on transport, deposition and effects of dust, black carbon, and other aerosols, Front. Earth Sci., 7, 337, https://doi.org/10.3389/feart.2019.00337, 2019.
Dagsson-Waldhauserová, P. and Meinander, O. (Eds.): Atmosphere–Cryosphere Interaction in the Arctic, at High Latitudes and Mountains With Focus on Transport, Deposition and Effects of Dust, Black Carbon, and Other Aerosols, Frontiers Media SA, Lausanne, e-book, ISSN 1664-8714, ISBN 978-2-88963-504-7, https://doi.org/10.3389/978-2-88963-504-7, 2020.
Dagsson-Waldhauserová, P., Arnalds, O., Ólafsson, H., Skrabalova, L., Sigurðardóttir, G., Branis, M., Hladil, J., Skala, R., Navratil, T., Chadimova, L., Löwis, S., Thorsteinsson, T. Carlsen, H., and Jónsdóttir, I.: Physical properties of suspended dust during moist and low wind conditions in Iceland, Iceland. Agr. Sci., 27, 25–39, 2014.
Dagsson-Waldhauserová, P., O. Arnalds, H. Olafsson, J. Hladil, R. Skala, T. Navratil, L. Chadimova, O. Meinander: Snow–Dust Storm: Unique case study from Iceland, March 6–7, 2013, Aeolian Res., 16, 69–74, 2015.
Dagsson-Waldhauserova, P., Magnusdottir, A. Ö., Olafsson, H., and Arnalds, O.: The spatial variation of dust particulate matter concentrations during two Icelandic dust storms in 2015, Atmosphere, 7, 77, https://doi.org/10.3390/atmos7060077, 2016.
Dagsson-Waldhauserová, P., Renard, J.-B., Olafsson, H., Vignelles, D., Berthet, G., Verdier, N., and Duverger, V.: Vertical distribution of aerosols in dust storms during the Arctic winter, Scientific Reports, 6, 1–11, 2019.
Dang, C., Warren, S. G., Fu, Q., Doherty, S. J., Sturm, M., and Su, J.: Measurements of light-absorbing particles in snow across the Arctic, North America, and China: Effects on surface albedo, J. Geophys. Res.-Atmos., 122, 10149–10168, https://doi.org/10.1002/2017JD027070, 2017.
Del Valle, H. F., Elissalde, N. O., Gagliardini, D. A., and Milovich, J.: Status of desertification in the Patagonian region: Assessment and mapping from satellite imagery, Arid Soil Res. Rehab., 12, 95–121, https://doi.org/10.1080/15324989809381502, 1998.
Diaz, M. A., Welch, S. A., Sheets, J. M., Welch, K. A., Khan, A. L., Adams, B. J., McKnight, D. M., Cary, S. C., and Lyons, W. B.: Geochemistry of aeolian material from the McMurdo Dry Valleys, Antarctica: Insights into Southern Hemisphere dust sources. Earth Planet. Sc. Lett., 547, 116460, https://doi.org/10.1016/j.epsl.2020.116460, 2020.
Dijkmans, J. W. A. and Törnqvist, T. E.: Modern periglacial eolian deposits and landforms in the Søndre Strømfjord area, West Greenland and their palaeoenvironmental implications, Meddelelser Om Grønland, Geoscience, 25, 3–39, 1991.
Doody, J. P., Ferreira, M., Lombardo, S., Lucius, I., Misdorp, R., Niesing, H., Salman, A., and Smallegange, M. (Eds): Living with coastal erosion in Europe – sediment and space for sustainability, Results from the EUROSION study, European Commission, Office for Official Publications of the European Communities, http://www.eurosion.org/project/eurosion_en.pdf (last access: 19 November 2021), 2004.
Đorđević, D., Tošić, I., Sakan, S., Petrović, S., Đuričić-Milanković, J., Finger, D. C., and Dagsson-Waldhauserová, P.: Can Volcanic Dust Suspended From Surface Soil and Deserts of Iceland Be Transferred to Central Balkan Similarly to African Dust (Sahara)?, Frontiers in Earth Science, 7, 142, https://doi.org/10.3389/feart.2019.00142, 2019.
Dörnbrack, A., Stachlewska, I. S., Ritter, C., and Neuber, R.: Aerosol distribution around Svalbard during intense easterly winds, Atmos. Chem. Phys., 10, 1473–1490, https://doi.org/10.5194/acp-10-1473-2010, 2010.
Dragosics, M., Meinander, O., Jónsdóttír, T., Dürig, T., De Leeuw, G., Pálsson, F., Dagsson-Waldhauserová, P., and Thorsteinsson, T.: Insulation effects of Icelandic dust and volcanic ash on snow and ice, Arab. J. Geosci., 9, 126, https://doi.org/10.1007/s12517-015-2224-6, 2016.
Evangeliou, N., Shevchenko, V. P., Yttri, K. E., Eckhardt, S., Sollum, E., Pokrovsky, O. S., Kobelev, V. O., Korobov, V. B., Lobanov, A. A., Starodymova, D. P., Vorobiev, S. N., Thompson, R. L., and Stohl, A.: Origin of elemental carbon in snow from western Siberia and northwestern European Russia during winter–spring 2014, 2015 and 2016, Atmos. Chem. Phys., 18, 963–977, https://doi.org/10.5194/acp-18-963-2018, 2018.
Finlayson-Pitts, B. J. and Pitts Jr, J. N.: Chemistry of the upper and lower atmosphere: theory, experiments, and applications, Elsevier, 969 pp., ISBN 978-0122570605 1999.
Flanner, M. G., Zender, C. S., Randerson, J. T., and Rasch, P. T.: Present day climate forcing and response from black carbon in snow, J. Geophys. Res., 112, D11202, https://doi.org/10.1029/2006JD008003, 2007.
Forsström, S., Isaksson, E., Skeie, R. B., Ström, J., Pedersen, C. A., Hudson, S. R., Berntsen, T. K., Lihavainen, H., Godtliebsen, F., and Gerland, S.: Elemental carbon measurements in European Arctic snow packs, J. Geophys. Res.-Atmos., 118, 13614–13627, 2013.
Fountain, A. G., Levy, J. S., Gooseff, M. N., and Van Horn, D.: The McMurdo Dry Valleys: A landscape on the threshold of change, Geomorphology, 225, 25–35, https://doi.org/10.1016/j.geomorph.2014.03.044, 2014.
Fox, T. A., Barchyn, T. E., and Hugenholtz, C. H.: Successes of soil conservation in the Canadian Prairies highlighted by a historical decline in blowing dust, Environ. Res. Lett., 7, 014008, https://doi.org/10.1088/1748-9326/7/1/014008, 2012.
Frey, W. R. and Kay, J. E.: The influence of extratropical cloud phase and amount feedbacks on climate sensitivity, Clim. Dynam., 50, 3097–3116, https://doi.org/10.1007/s00382-017-3796-5, 2018.
Gaiero, D. M., Probst, J.-L., Depetris, P. J., Bidart, S. M., and Leleyter, L.: Iron and other transition metals in Patagonian riverborne and windborne materials: geochemical control and transport to the southern South Atlantic Ocean, Geochim. Cosmochim. Ac., 67, 3603–3623, https://doi.org/10.1016/S0016-7037(03)00211-4, 2003.
Gaitán, J. J., López, C. R., and Bran, D.: Efectos del pastoreo sobre el suelo y la vegetación en la estepa patagónica, Ci. Suelo (Argentina), 27, 261–270, 2009 (in Spanish).
Gallet, J.-C., Björkman, M. P., Larose, C., Luks, B., Martma, T., and Zdanowicz, C.: Protocols and recommendations for the measurement of snow physical properties, and sampling of snow for black carbon, water isotopes, major ions and microorganisms, Norsk Polarinstitutt, 27 pp., ISBN 978-82-7666-415-7, 2018.
Gardner, A. S. and Sharp, M. J.: A review of snow and ice albedo and the development of a new physically based broadband albedo parameterization, J. Geophys. Res., 115, F01009, https://doi.org/10.1029/2009JF001444, 2010.
Gassó, S. [SanGasso]: Sunrise in Alaska and more #highlatitudedust is visible in Larsen Bay, just downwind from the Ten Thousand Smokes Valley in @KatmaiNPS, visible in webcams and early GOES17 image, Twitter, https://twitter.com/SanGasso/status/1323716227793997824 (last access: 17 August 2022), posted: 8:58, 3 November 2020a.
Gassó, S. [SanGasso]: More #highlatitudedust today in #Alaska, 3 active sources identified in #NOAA20. Surface webcams confirm dust presence, Twitter, https://twitter.com/SanGasso/status/1323384615344640000 (last access: 17 August 2022), posted: 11:00, 2 November 2020b.
Gassó, S. [SanGasso]: #highlatitudedust in SE Alaska yesterday several plumes are visible in the spots where there is little snow, Twitter, https://twitter.com/SanGasso/status/1354548215186644993 (last access: 17 August 2022), posted: 2021a.
Gassó, S. [SanGasso]: A very nice example of #highlatitudedust activity in western #Greenland yesterday with at least 4 active sources visible from satellite extending along the ∼700 km coastline, Twitter, https://twitter.com/SanGasso/status/1450468551379329029 (last access: 17 August 2022), posted: 4:27, 19 October 2021b.
Gassó, S. and Stein, A. F.: Does dust from Patagonia reach the sub-Antarctic Atlantic Ocean?, Geophys. Res. Lett., 34, L01801, https://doi.org/10.1029/2006GL027693, 2007.
Gassó, S. and Torres, O.: Temporal Characterization of Dust Activity in the Central Patagonia Desert (Years 1964–2017), J. Geophys. Res.-Atmos., 124, 3417–3434, https://doi.org/10.1029/2018JD030209, 2019.
Gassó, S., Stein, A., Marino, F., Castellano, E., Udisti, R., and Ceratto, J.: A combined observational and modeling approach to study modern dust transport from the Patagonia desert to East Antarctica, Atmos. Chem. Phys., 10, 8287–8303, https://doi.org/10.5194/acp-10-8287-2010, 2010.
George, C., Ammann, M., D'Anna, B., Donaldson, D. J., and Nizkorodov, S. A.: Heterogeneous Photochemistry in the Atmosphere, Chem. Rev., 115, 4218–4258, https://doi.org/10.1021/cr500648z, 2015.
Gili, S., Vanderstraeten, A., Chaput, A., King, J., Gaiero, D., Delmonte, B., Vallelonga, P., Formenti, P., Di Biagio, C., Cazanau, M., and Pangui, E.: Southern Africa: The Missing Piece To The Dust Provenance Puzzle of East Antarctica? Communications Earth & Environment [preprint], https://doi.org/10.21203/rs.3.rs-923449/v1, 2021.
Gillies, J. A., Nickling, W. G., and Tilson, M.: Frequency, magnitude and characteristics of aeolian sediment transport: McMurdo Dry Valleys, Antarctica, J. Geophys. Res.-Earth, 118, 461–479, https://doi.org/10.1002/jgrf.20007, 2013.
Ginoux, P., Prospero, J. M., Gill, T. E., Hsu, N. C., and Zhao, M.: Global-scale attribution of anthropogenic and natural dust sources and their emission rates based on MODIS Deep Blue aerosol products, Rev. Geophys., 50, RG3005, https://doi.org/10.1029/2012RG000388, 2012.
Groot Zwaaftink, C. D., Grythe, H., Skov, H., and Stohl, A.: Substantial contribution of northern high-latitude sources to mineral dust in the Arctic, J. Geophys. Res.-Atmos., 121, 13678–13697, https://doi.org/10.1002/2016jd025482, 2016.
Groot Zwaaftink, C. D., Arnalds, Ó., Dagsson-Waldhauserova, P., Eckhardt, S., Prospero, J. M., and Stohl, A.: Temporal and spatial variability of Icelandic dust emissions and atmospheric transport, Atmos. Chem. Phys., 17, 10865–10878, https://doi.org/10.5194/acp-17-10865-2017, 2017.
Gunnarsson, A., Gardarsson, S. M., Pálsson, F., Jóhannesson, T., and Sveinsson, Ó. G. B.: Annual and inter-annual variability and trends of albedo of Icelandic glaciers, The Cryosphere, 15, 547–570, https://doi.org/10.5194/tc-15-547-2021, 2021.
Hadley, D., Hufford, G. L., and Simpson, J. J.: Resuspension of relic volcanic ash and dust from Katmai: Still an aviation hazard, Weather Forecast., 19, 829–840, https://doi.org/10.1175/1520-0434(2004)019<0829:RORVAA>2.0.CO;2, 2004.
Hadley, O. and Kirchstetter, T.: Black-Carbon reduction of snow albedo, Nat. Clim. Change, 2, 437–440, https://doi.org/10.1038/nclimate1433, 2012.
Harrison, A. D., Lever, K., Sanchez-Marroquin, A., Holden, M. A., Whale, T. F., Tarn, M. D., McQuaid, J. B., and Murray, B. J.: The ice-nucleating ability of quartz immersed in water and its atmospheric importance compared to K-feldspar, Atmos. Chem. Phys., 19, 11343–11361, https://doi.org/10.5194/acp-19-11343-2019, 2019.
Hedding, D. W., Nel, W., and Anderson, R. L.: Aeolian processes and landforms in the sub-Antarctic: preliminary observations from Marion Island, Polar Res., 34, 26365, https://doi.org/10.3402/polar.v34.26365, 2015.
Heindel, R. C., Culler, L. E., and Virginia, R. A.: Rates and processes of aeolian soil erosion in West Greenland, The Holocene, 27, 1281–1290, https://doi.org/10.1177/0959683616687381, 2017.
Hernández, M. A., González, N., and Hernández, L.: Late Cenozoic Geohydrology of Extra-Andean Patagonia, Argentina, Developments in Quaternary Sciences, 11, 497–509, https://doi.org/10.1016/S1571-0866(07)10024-5, 2008.
Hobbs, W. H.: Wind: The dominant transportation agent within extramarginal zones to continental glaciers, J. Geol., 50, 556–59, https://doi.org/10.1086/625072, 1942.
Hojan, M., Rurek, M., Więcław, M., and Krupa, A.: Effects of Extreme Dust Storm in Agricultural Areas (Poland, the Greater Lowland), Geosciences, 9, 106, https://doi.org/10.3390/geosciences9030106, 2019.
Hugenholtz, C. H. and Wolfe, S. A.: Rates and environmental controls of aeolian dust accumulation, Athabasca River Valley, Canadian Rocky Mountains, Geomorphology, 121, 274–282, https://doi.org/10.1016/j.geomorph.2010.04.024, 2010.
IPCC: Climate Change 2013: The Physical Science Basis. Contribution of Working Group I to the Fifth Assessment Report of the Intergovernmental Panel on Climate Change, edited by: Stocker, T. F., Qin, D., Plattner, G.-K., Tignor, M., Allen, S. K., Boschung, J., Nauels, A., Xia, Y., Bex, V., and Midgley, P. M., Cambridge University Press, Cambridge, United Kingdom and New York, NY, USA, 1535 pp., ISBN 978-1-107-05799-1, 2013.
IPCC: IPCC Special Report on the Ocean and Cryosphere in a Changing Climate, edited by: Pörtner, H.-O., Roberts, D. C., Masson-Delmotte, V., Zhai, P., Tignor, M., Poloczanska, E., Mintenbeck, K., Alegría, A., Nicolai, M., Okem, A., Petzold, J., Rama, B., and Weyer, N. M., Cambridge University Press, Cambridge, UK and New York, NY, USA, 755 pp., https://doi.org/10.1017/9781009157964, 2019.
IPCC: Climate Change 2021: The Physical Science Basis. Contribution of Working Group I to the Sixth Assessment Report of the Intergovernmental Panel on Climate Change, edited by: Masson-Delmotte, V., Zhai, P., Pirani, A., Connors, S. L., Péan, C., Berger, S., Caud, N., Chen, Y., Goldfarb, L., Gomis, M. I., Huang, M., Leitzell, K., Lonnoy, E., Matthews, J. B. R., Maycock, T. K., Waterfield, T., Yelekçi, O., Yu, R., and Zhou, B., Cambridge University Press, Cambridge, United Kingdom and New York, NY, USA, in press, https://doi.org/10.1017/9781009157896, 2021.
Irish, V. E., Hanna, S. J., Willis, M. D., China, S., Thomas, J. L., Wentzell, J. J. B., Cirisan, A., Si, M., Leaitch, W. R., Murphy, J. G., Abbatt, J. P. D., Laskin, A., Girard, E., and Bertram, A. K.: Ice nucleating particles in the marine boundary layer in the Canadian Arctic during summer 2014, Atmos. Chem. Phys., 19, 1027–1039, https://doi.org/10.5194/acp-19-1027-2019, 2019.
Ito, A. and Kok, J. F.: Do dust emissions from sparsely vegetated regions dominate atmospheric iron supply to the Southern Ocean?, J. Geophys. Res.-Atmos., 122, 3987-4002, https://doi.org/10.1002/2016jd025939, 2017.
IUSS Working Group WRB: World Reference Base for Soil Resources 2014, update 2015 International soil classification system for naming soils and creating legends for soil maps, FAO, Rome, World Soil Resources Reports No. 106., ISBN 978-92-5-108369-7, 2015.
Jacobi, H.-W., Obleitner, F., Da Costa, S., Ginot, P., Eleftheriadis, K., Aas, W., and Zanatta, M.: Deposition of ionic species and black carbon to the Arctic snowpack: combining snow pit observations with modeling, Atmos. Chem. Phys., 19, 10361–10377, https://doi.org/10.5194/acp-19-10361-2019, 2019.
Janjic, Z. I., Gerrity Jr, J. P., and Nickovic, S.: An Alternative Approach to Nonhydrostatic Modeling, Mon. Weather Rev., 129, 1164–1178, 2001.
Jickells, T. and Moore, C. M.: The importance of Atmospheric Deposition for Ocean Productivity, Annu. Rev. Ecol. Evol. S, 46, 481–501, https://doi.org/10.1146/annurev-ecolsys-112414-054118, 2015.
Jickells, T. D., An, Z. S., Andersen, K. K., Baker, A. R., Bergametti, G., Brooks, N., Cao, J. J., Boyd, P. W., Duce, R. A., Hunter, K. A., Kawahata, H., Kubilay, N., laRoche, J., Liss, P. S., Mahowald, N., Prospero, J. M., Ridgwell, A. J., Tegen, I., and Torres, R.: Global iron connections between desert dust, ocean biogeochemistry, and climate, Science, 308, 67–71, https://doi.org/10.1126/science.1105959, 2005.
Johnson, M. S., Meskhidze, N., Kiliyanpilakkil, V. P., and Gassó, S.: Understanding the transport of Patagonian dust and its influence on marine biological activity in the South Atlantic Ocean, Atmos. Chem. Phys., 11, 2487–2502, https://doi.org/10.5194/acp-11-2487-2011, 2011.
Kanakidou, M., Myriokefalitakis, S., and Tsigaridis, K.: Aerosols in atmospheric chemistry and biogeochemical cycles of nutrients, Environ. Res. Lett., 13, 063004, https://doi.org/10.1088/1748-9326/aabcdb, 2018.
Kandler, K., Schneiders, K., Heuser, J., Waza, A., Aryasree, S., Althausen, D., Hofer, J., Abdullaev, S. F., and Makhmudov, A. N.: Differences and Similarities of Central Asian, African, and Arctic Dust Composition from a Single Particle Perspective, Atmosphere, 11, 269, https://doi.org/10.3390/atmos11030269, 2020.
Kasimov, N. S. (Ed.): Ecological Atlas of Russia, Feoriia, Moscow, 509 pp., ISBN 9785917960340, 2017.
Kasimov, N. S., Vlasov, D. V., and Kosheleva, N. E.: Enrichment of road dust particles and adjacent environments with metals and metalloids in eastern Moscow, Urban Climate, 32, 100638, https://doi.org/10.1016/j.uclim.2020.100638, 2020.
Kavan, J., Ondruch, J., Nývlt, D., Hrbáček, F., Carrivick, J. L., and Láska, K.: Seasonal hydrological and suspended sediment transport dynamics in proglacial streams, James Ross Island, Antarctica, Geogr. Ann. A, 99, 38–55, https://doi.org/10.1080/04353676.2016.1257914, 2017.
Kavan, J., Dagsson-Waldhauserova, P., Renard, J. B., Láska, K., and Ambrožová, K.: Aerosol concentrations in relationship to local atmospheric conditions on James Ross Island, Antarctica, Front. Earth Sci., 6, 207, https://doi.org/10.3389/feart.2018.00207, 2018.
Kavan, J., Láska, K., Nawrot, A., and Wawrzyniak, T.: High Latitude Dust Transport Altitude Pattern Revealed from Deposition on Snow, Svalbard, Atmosphere, 11, 1318, https://doi.org/10.3390/atmos11121318, 2020a.
Kavan, J., Nývlt, D., Láska, K., Engel, Z., and Kňažková, M.: High latitude dust deposition in snow on glaciers of James Ross Island, Antarctica, Earth Surf. Proc. Land., 45, 1569–1578, https://doi.org/10.1002/esp.4831, 2020b.
Kerkmann, J., Nietosvaara, V., Smiljanicv, I., Zablocka, I., and Fromm, M.: Meteosat: Two dust clouds, one from northern Africa and one from Central Europe, travelled north towards Iceland and Greenland in late April 2019, in: Dust over Europe, 22 April 2019 12:00 UTC, 23 April 06:00–12:30 UTC, 24 April 06:00 UTC, EUMETSAT, https://www.eumetsat.int/dust-over-europe (last access: 17 August 2022), 2019.
Khan, A. L., Dierssen, H., Schwarz, J. P., Schmitt, C., Chlus, A., Hermanson, M., Painter, T. H., and McKnight, D. M.: Impacts of coal dust from an active mine on the spectral reflectance of Arctic surface snow in Svalbard, Norway, J. Geophys. Res., 122, 1767–1778, https://doi.org/10.1002/2016jd025757, 2017.
Kňažková, M., Hrbáček, F., Kavan, J., and Nývlt, D.: Effect of hyaloclastite breccia boulders on meso-scale periglacial-aeolian landsystem in semi-arid Antarctic environment, James Ross Island, Antarctic Peninsula, Cuadernos de Investigación Geográfica, 46, 7–31, https://doi.org/10.18172/cig.3800, 2020.
Koroleva, T. V., Krechetov, P. P., Semenkov, I. N., Sharapova, A. V., and Kondrat'ev, A. D.: Transformation of chemical composition of snow in the impact areas of the first stage of the expandable launch system Proton in Central Kazakhstan, Russ. Meteorol. Hydrol., 41, 585–591, https://doi.org/10.3103/S1068373916080094, 2016.
Koroleva, T. V., Sharapova, A. V., and Krechetov, P. P.: A chemical composition of snow on areas exposed to space-rocket activities pollution (Altai republic), Gig. i Sanit., 96, 432–437, https://doi.org/10.18821/0016-9900-2017-96-5-432-437, 2017.
Kuhlman, H.: Den potentielle jordfygning på danske marker. Teoretiske beregninger vedrørende jordmaterialets vindbevægelighed, Geografisk Tidsskrift – Danish Journal of Geography, Bind 59, https://tidsskrift.dk/geografisktidsskrift/article/view/46533 (last access: 17 August 2022), 1960.
Kuhns, H., Gillies, J., Etyemezian, V., Nikolich, G., King, J., Zhu, D., Uppapalli, S., Engelbrecht, J., and Kohl, S.: Effect of Soil Type and Momentum on Unpaved Road Particulate Matter Emissions from Wheeled and Tracked Vehicles, Aerosol Sci. Tech., 44, 187–196, https://doi.org/10.1080/02786820903516844, 2010.
Kupiainen K.: Road dust from pavement wear and traction sanding, Monographs of the Boreal Environment Research, No. 26, Finnish Environment Institute, Finland, Helsinki, 2007.
Kupiainen, K., Ritola, R., Stojiljkovic, A., Pirjola, L., Malinen, A., and Niemi, J.: Contribution of mineral dust sources to street side ambient and suspension PM10 samples, Atmos. Environ., 147, 178–189, https://doi.org/10.1016/j.atmosenv.2016.09.059, 2016.
Kylling, A., Groot Zwaaftink, C. D., and Stohl, A.: Mineral dust instantaneous radiative forcing in the Arctic, Geophys. Res. Lett., 45, 4290–4298, https://doi.org/10.1029/2018GL077346, 2018.
Lamy, F., Gersonde, R., Winckler, G., Esper, O., Jaeschke, A., Kuhn, G., Ullermann, J., Martinez-Garcia, A., Lambert, F., and Kilian, R.: Increased dust deposition in the Pacific Southern Ocean during glacial periods, Science, 343, 403–407, 2014.
Lancaster, N., Nickling, W. G., and Gillies, J. A.: Sand transport by wind on complex surfaces: field studies in the McMurdo Dry Valleys, Antarctica, J. Geophys. Res., 115, F03027, https://doi.org/10.1029/2009JF001408., 2010.
Lappalainen, H. K., Petäjä, T., Vihma, T., Räisänen, J., Baklanov, A., Chalov, S., Esau, I., Ezhova, E., Leppäranta, M., Pozdnyakov, D., Pumpanen, J., Andreae, M. O., Arshinov, M., Asmi, E., Bai, J., Bashmachnikov, I., Belan, B., Bianchi, F., Biskaborn, B., Boy, M., Bäck, J., Cheng, B., Chubarova, N., Duplissy, J., Dyukarev, E., Eleftheriadis, K., Forsius, M., Heimann, M., Juhola, S., Konovalov, V., Konovalov, I., Konstantinov, P., Köster, K., Lapshina, E., Lintunen, A., Mahura, A., Makkonen, R., Malkhazova, S., Mammarella, I., Mammola, S., Buenrostro Mazon, S., Meinander, O., Mikhailov, E., Miles, V., Myslenkov, S., Orlov, D., Paris, J.-D., Pirazzini, R., Popovicheva, O., Pulliainen, J., Rautiainen, K., Sachs, T., Shevchenko, V., Skorokhod, A., Stohl, A., Suhonen, E., Thomson, E. S., Tsidilina, M., Tynkkynen, V.-P., Uotila, P., Virkkula, A., Voropay, N., Wolf, T., Yasunaka, S., Zhang, J., Qiu, Y., Ding, A., Guo, H., Bondur, V., Kasimov, N., Zilitinkevich, S., Kerminen, V.-M., and Kulmala, M.: Overview: Recent advances in the understanding of the northern Eurasian environments and of the urban air quality in China – a Pan-Eurasian Experiment (PEEX) programme perspective, Atmos. Chem. Phys., 22, 4413–4469, https://doi.org/10.5194/acp-22-4413-2022, 2022.
Lewandowski, M., Kusiak, M. A., Werner, T., Nawrot, A., Barzycka, B., Laska, M., and Luks, B.: Seeking the Sources of Dust: Geochemical and Magnetic Studies on “Cryodust” in Glacial Cores from Southern Spitsbergen (Svalbard, Norway), Atmosphere, 11, 1325, https://doi.org/10.3390/atmos11121325, 2020.
Llanos, M. E., Behr, S. J., Gonzalez, J. H., Colombani, E. N., Buono, G. G., and Escobar, J. M.: Informe de las Variaciones del Lago Colhue Huapi mediante sensores remotos y su relación con las precipitaciones, https://inta.gob.ar/documentos/informe-de-las-variaciones-del-lago-colhue-huapi-mediante-sensores- remotos-y-su-relacion-con-las-precipitaciones (last access: 17 August 2022), 2016.
Lutz, S., Anesio, A., Raiswell, R., Edwards, A., Newton, R. J., Gill, F., and Benning, L. G.: The biogeography of red snow microbiomes and their role in melting Arctic glaciers, Nat. Commun., 7, 11968, https://doi.org/10.1038/ncomms11968, 2016.
Mahowald, N.: Aerosol Indirect Effect on Biogeochemical Cycles and Climate, Science, 334, 794–796, https://doi.org/10.1126/science.1207374, 2011.
Mahowald, N. M., Baker, A. R., Bergametti, G., Brooks, N., Duce, R. A., Jickells, T. D., Kubilay, N., Prospero, J. M., and Tegen, I.: Atmospheric global dust cycle and iron inputs to the ocean, Global Biogeochem. Cy., 19, GB4025, https://doi.org/10.1029/2004gb002402, 2005.
Manninen, T., Anttila, K., Jääskeläinen, E., Riihelä, A., Peltoniemi, J., Räisänen, P., Lahtinen, P., Siljamo, N., Thölix, L., Meinander, O., Kontu, A., Suokanerva, H., Pirazzini, R., Suomalainen, J., Hakala, T., Kaasalainen, S., Kaartinen, H., Kukko, A., Hautecoeur, O., and Roujean, J.-L.: Effect of small-scale snow surface roughness on snow albedo and reflectance, The Cryosphere, 15, 793–820, https://doi.org/10.5194/tc-15-793-2021, 2021.
Markuse, P.: High latitude dust storm (silt), Nuussuaq Peninsula, Greenland – October 1st, 2020, https://www.flickr.com/photos/pierre_markuse/50447335522/ (last access: 17 August 2022), 2020.
Martin, J. H. and Fitzwater, S. E.: Iron deficiency limits phytoplankton growth in the north-east Pacific sub Arctic, Nature, 331, 341–343, 1988.
Martínez-García, A., Sigman, D. M., Ren, H., Anderson, R. F., Straub, M., Hodell, D. A., Jaccard, S. L., Eglinton, T. I., and Haug, G. H.: Iron fertilization of the Sub-Antarctic Ocean during the last ice age, Science, 343, 1347–1350, 2014.
Mazzonia, E. and Vazquez, M.: Desertification in Patagonia, in: Natural Hazards and Human-Exacerbated Disasters in Latin America, edited by: Latrubesse, E. M., Elsevier, 13, 351–377, https://doi.org/10.1016/S0928-2025(08)10017-7, 2009.
McCutcheon, J., Lutz, S., Williamson, C., Cook, J. M., Tedstone, A. J., Vanderstraeten, A., Wilson, S. A., Stockdale, A., Bonneville, S., Anesio, A. M., Yallop, M. L., McQuaid, J. B., Tranter, M., and Benning, L. G.: Mineral phosphorus drives glacier algal blooms on the Greenland Ice Sheet, Nat. Commun., 12, 570, https://doi.org/10.1038/s41467-020-20627-w, 2021.
Meinander, O., Kazadzis, S., Arola, A., Riihelä, A., Räisänen, P., Kivi, R., Kontu, A., Kouznetsov, R., Sofiev, M., Svensson, J., Suokanerva, H., Aaltonen, V., Manninen, T., Roujean, J.-L., and Hautecoeur, O.: Spectral albedo of seasonal snow during intensive melt period at Sodankylä, beyond the Arctic Circle, Atmos. Chem. Phys., 13, 3793–3810, https://doi.org/10.5194/acp-13-3793-2013, 2013.
Meinander, O., Kontu, A., Virkkula, A., Arola, A., Backman, L., Dagsson-Waldhauserová, P., Järvinen, O., Manninen, T., Svensson, J., de Leeuw, G., and Leppäranta, M.: Brief communication: Light-absorbing impurities can reduce the density of melting snow, The Cryosphere, 8, 991–995, https://doi.org/10.5194/tc-8-991-2014, 2014.
Meinander, O., Dagsson-Waldhauserová, P., and Arnalds, O.: Icelandic volcanic dust can have a significant influence on the cryosphere in Greenland and elsewhere, Polar Res., 35, 31313, https://doi.org/10.3402/polar.v35.31313, 2016.
Meinander, O., Backman, L., Saranko, O., Asmi, E., Rodriguez, E., and Sanchez, R.: Effects of high latitude dust on snow UV albedo and solar UV irradiance measured at Marambio during 2013–2017 with comparison to simulated UV irradiances, EGU General Assembly, Vienna, Austria, 8–13 April 2018, EGU2018-2007, https://meetingorganizer.copernicus.org/EGU2018/EGU2018-2007.pdf (last access: 17 August 2022), 2018.
Meinander, O., Chalov, S., Lappalainen, H. Ekman, J. Eleftheriadis, K. Frolov, D. Hyvärinen, A. Ivanov, V. Karvosenoja, N. Kupiainen, K. Popovicheva, O. Semenkov, I. Sogacheva, L., and The MSU Workshop Participants: About Black Carbon in the Arctic and Significance Compared to Hight-Latitude Dust Sources (Finnish-Russian Workshop at the Lomonosov Moscow State University, 17–18 September 2019, in: Proceedings of The Center of Excellence in Atmospheric Science (CoE ATM) Annual Seminar 2019, Report series in aerosol science, edited by: Laurila, T., Lintunen, A., and Kulmala, M., in Co-operation with MSU, INAR, PEEX, MFA/IBA and FMI), Report Series in Aerosol Science No. 226, 457–465, ISBN 978-952-7276-34-1, http://www.faar.fi/wp-content/uploads/2019/11/CoE_proceedings_2019-compressed.pdf (last access: 17 August 2022), 2019a.
Meinander, O., Dagsson-Waldhauserová, P., Björnsson, H., Petersen, G. N., Moore, K., Larsen, J. N., and Heininen, L.: Report of the IASC Workshop on Effects and Extremes of High Latitude Dust, Reykjavik, Iceland, 13–14 February 2019, in co-operation with the IceDust Aerosol Association, IBA-FIN-BCDUST-project of MFA of Finland and EU COST InDust Action, https://iasc.info/news/iasc-news/472-workshop-report-iasc-workshop-on-effects-and-extremes- of-high-latitude-dust (last access: 3 June 2021), 2019b.
Meinander, O., Heikkinen, E., Aurela, M., and Hyvärinen, A.: Sampling, Filtering, and Analysis Protocols to Detect Black Carbon, Organic Carbon, and Total Carbon in Seasonal Surface Snow in an Urban Background and Arctic Finland (>60∘ N), Atmosphere, 11, 923, https://doi.org/10.3390/atmos11090923, 2020a.
Meinander, O., Kontu, A., Kouznetsov, R., and Sofiev, M.: Snow Samples Combined With Long-Range Transport Modeling to Reveal the Origin and Temporal Variability of Black Carbon in Seasonal Snow in Sodankylä (67∘ N), Front. Earth Sci., 8, 153, https://doi.org/10.3389/feart.2020.00153, 2020b.
Meinander, O., Piedehierro, A., Welti, A., Kouznetsov, R., Heinonen, A., Viisanen, Y., and Laaksonen, A.: Saharan dust transported and deposited in Finland on February 23rd, 2021, EAC 2021, 30 August–3 Septembre 2021, Abstract AAS 19-2 Paper ID 399, https://eac2021.co.uk/book-of-abstracts (last access: 17 August 2022), 2021.
Meskhidze, N., Volker, C., Al-Abadleh, H. A., Barbeau, K., Bressac, M., Buck, C., Bundy, R. M., Croot, P., Feng, Y., Ito, A., Johansen, A. M., Landing, W. M., Mao, J. Q., Myriokefalitakis, S., Ohnemus, D., Pasquier, B., and Ye, Y.: Perspective on identifying and characterizing the processes controlling iron speciation and residence time at the atmosphere-ocean interface, Mar. Chem., 217, 103704, https://doi.org/10.1016/j.marchem.2019.103704, 2019.
Miller, M. E., Bowker, M. A., Reynolds, R. L., and Goldstein, H. L.: Post-fire land treatments and wind erosion – lessons from the Milford Flat Fire, UT, USA, Aeolian Res., 7, 29–44, 2012.
Mills, M. M., Ridame, C., Davey, M., La Roche, J., and Geider, R. J.: Iron and phosphorus co-limit nitrogen fixation in the eastern tropical North Atlantic, Nature, 429, 292–294, https://doi.org/10.1038/nature02550, 2004.
Mockford, T., Bullard, J., and Thorsteinsson, T.: The dynamic effects of sediment availability on the relationship between wind speed and dust concentration, Earth Surf. Proc. Land., 43, 2484–2492, 2018.
Möller, R., Möller, M., Kukla, P. A., and Schneider, C.: Impact of supraglacial deposits of tephra from Grimsvötn volcano, Iceland, on glacier ablation, J. Glaciol., 62, 933–943, https://doi.org/10.1017/jog.2016.82, 2016.
Montes, A., Rodríguez, S. S., and Domínguez, C. E.: Geomorphology context and characterization of dunefields developed by the southern westerlies at drying Colhué Huapi shallow lake, Patagonia Argentina, Aeolian Res., 28, 58–70, https://doi.org/10.1016/j.aeolia.2017.08.001, 2017.
Moore, C. M., Mills, M. M., Arrigo, K. R., Berman-Frank, I., Bopp, L., Boyd, P. W., Galbraith, E. D., Geider, R. J., Guieu, C., Jaccard, S. L., Jickells, T. D., La Roche, J., Lenton, T. M., Mahowald, N. M., Maranon, E., Marinov, I., Moore, J. K., Nakatsuka, T., Oschlies, A., Saito, M. A., Thingstad, T. F., Tsuda, A., and Ulloa, O.: Processes and patterns of oceanic nutrient limitation, Nat. Geosci., 6, 701–710, https://doi.org/10.1038/ngeo1765, 2013.
Mori, T., Goto-Azuma, K., Kondo, Y., Ogawa-Tsukagawa, Y., Miura, K., Hirabayashi, M., Oshima, N., Koike, M., Kupiainen, K., Moteki, N., Ohata, S., Sinha, P. R., Sugiura, K., Aoki, T., Schneebeli, M., Steffen, K., Sato, A., Tsushima, A., Makarov, V., and Nagatsuka, N.: Black Carbon and Inorganic Aerosols in Arctic Snowpack, J. Geophys. Res.-Atmos., 124, 13325–13356, https://doi.org/10.1029/2019JD030623, 2019.
Moroni, B., Becagli, S., Bolzacchini, E., Busetto, M., Cappelletti, D., Crocchianti, S., Ferrero, L., Frosini, D., Lanconelli, C., Lupi, A., Maturilli, M., Mazzola, M., Perrone, G., Sangiorgi, G., Traversi, R., Udisti, R., Viola, A., and Vitale, V.: Vertical profiles and chemical properties of aerosol particles upon Ny-Ålesund (Svalbard Islands), Adv. Meteorol., 2015, 292081, https://doi.org/10.1155/2015/292081, 2015.
Moroni, B., Cappelletti, D., Ferrero, L., Crocchianti, S., Busetto, M., Mazzola, M., Becagli, S., Traversi, R., and Udisti, R.: Local vs. long-range sources of aerosol particles upon Ny-Ålesund (Svalbard Islands): mineral chemistry and geochemical records, Rend. Lincei-Sci. Fis., 27, 115–127, https://doi.org/10.1007/s12210-016-0533-7, 2016.
Moroni, B., Arnalds, O., Dagsson-Waldhauserová, P., Crocchianti, S., Vivani, R., and Cappelletti, D.: Mineralogical and Chemical Records of Icelandic Dust Sources Upon Ny-Ålesund (Svalbard Islands), Front. Earth Sci., 6, 187, https://doi.org/10.3389/feart.2018.00187, 2018.
Murray, B. J., O'Sullivan, D., Atkinson, J. D., and Webb, M. E.: Ice nucleation by particles immersed in supercooled cloud droplets, Chem. Soc. Rev., 41, 6519–6554, https://doi.org/10.1039/c2cs35200a, 2012.
Murray, K. T., Miller, M. F., and Bowser, S. S.: Depositional processes beneath coastal multi-year sea ice, Sedimentology, 60, 391–410, 2013.
Murray, B. J., Carslaw, K. S., and Field, P. R.: Opinion: Cloud-phase climate feedback and the importance of ice-nucleating particles, Atmos. Chem. Phys., 21, 665–679, https://doi.org/10.5194/acp-21-665-2021, 2021.
Nagatsuka, N., Goto-Azuma, K., Tsushima, A., Fujita, K., Matoba, S., Onuma, Y., Dallmayr, R., Kadota, M., Hirabayashi, M., Ogata, J., Ogawa-Tsukagawa, Y., Kitamura, K., Minowa, M., Komuro, Y., Motoyama, H., and Aoki, T.: Variations in mineralogy of dust in an ice core obtained from northwestern Greenland over the past 100 years, Clim. Past, 17, 1341–1362, https://doi.org/10.5194/cp-17-1341-2021, 2021.
Nemuc, A., Basart, S., Tobias, A., Nickovic, S., Barnaba, F., Kazadzis, S., Mona, L., Amiridis, V., Vukovic, A., Christel, I., Dagsson-Waldhauserová, P., and Monteiro, A.: International Network to Encourage the Use of Monitoring and Forecasting Dust Products (InDust), Eur. Rev., 29, 45–59, https://doi.org/10.1017/S1062798720000733, 2020.
Neuman, C. M.: Observations of winter aeolian transport and niveo-aeolian deposition at crater lake, pangnirtung pass, N.W.T., Canada, Permafrost Periglac., 1, 235–247, https://doi.org/10.1002/ppp.3430010304, 1990.
Nickling, W.: Eolian sediment transport during dust storms: Slims River valley, Yukon Territory, Can. J. Earth Sci., 15, 1069–1084, 1978.
Nickling, W. G. and Brazel, A. J.: Surface wind characteristics along the icefield ranges, Yukon Territory, Canada, Arctic Alpine Res., 17, 125–134, https://doi.org/10.2307/1550842, 1985.
Nickovic, S., Cvetkovic, B., Madonna, F., Rosoldi, M., Pejanovic, G., Petkovic, S., and Nikolic, J.: Cloud ice caused by atmospheric mineral dust – Part 1: Parameterization of ice nuclei concentration in the NMME-DREAM model, Atmos. Chem. Phys., 16, 11367–11378, https://doi.org/10.5194/acp-16-11367-2016, 2016.
Nielsdóttir, M. C., Moore, C. M., Sanders, R., Hinz, D. J., and Achterberg, E. P.: Iron limitation of the postbloom phytoplankton communities in the Iceland Basin, Global Biogeochem. Cy., 23, GB3001, https://doi.org/10.1029/2008gb003410, 2009.
Nordic Council of Ministers: Road dust and PM10 in the Nordic countries. Measures to Reduce Road Dust Emissions from Traffic, Publication number 2016:790, https://www.norden.org/en/publication/road-dust-and-pm10-nordic-countries (last access: 4 November 2021), 2017.
Ovadnevaite, J., Ceburnis, D., Plauskaite-Sukiene, K., Modini, R., Dupuy, R., Rimselyte, I., Ramonet, R., Kvietkus, K., Ristovski, Z., Berresheim, H., and O'Dowd, C. D.: Volcanic sulphate and Arctic dust plumes over the North Atlantic Ocean, Atmos. Environ., 43, 4968–4974, 2009.
Pejanovic, G., Nickovic, S., Vujadinovic, M., Vukovic, A., Djurdjevic, V., and Dacic, M.: Atmospheric deposition of minerals in dust over the open ocean and possible consequences on climate, WCRP OSC Climate Research in Service to Society, Denver, CO, USA, 24–28 October 2011.
Peltoniemi, J. I., Gritsevich, M., Hakala, T., Dagsson-Waldhauserová, P., Arnalds, Ó., Anttila, K., Hannula, H.-R., Kivekäs, N., Lihavainen, H., Meinander, O., Svensson, J., Virkkula, A., and de Leeuw, G.: Soot on Snow experiment: bidirectional reflectance factor measurements of contaminated snow, The Cryosphere, 9, 2323–2337, https://doi.org/10.5194/tc-9-2323-2015, 2015.
Perron, M. M. G., Strzelec, M., Gault-Ringold, M., Proernse, B. C., Boyd, P. W., and Bowie, A. R.: Assessment of leaching protocols to determine the solubility of trace metals in aerosols, Talanta, 208, 120377, https://doi.org/10.1016/j.talanta.2019.120377, 2020.
Popovicheva, O., Diapouli, E., Makshtas, A., Shonija, N., Manousakas, M., Saraga, D., Uttal, T., and Eleftheriadis, K.: East Siberian Arctic background and black carbon polluted aerosols at HMO Tiksi, Sci. Total Environ., 655, 924–938, https://doi.org/10.1016/j.scitotenv.2018.11.165, 2019.
Price, H. C., Baustian, K. J., McQuaid, J. B., Blyth, A., Bower, K. N., Choularton, T., Cotton, R. J., Cui, Z., Field, P. R., Gallagher, M., Hawker, R., Merrington, A., Miltenberger, A., Neely III, R. R., Parker, S. T., Rosenberg, P. D., Taylor, J. W., Trembath, J., Vergara-Temprado, J., Whale, T. F., Wilson, T. W., Young, G., and Murray, B. J.: Atmospheric Ice-Nucleating Particles in the Dusty Tropical Atlantic, J. Geophys. Res.-Atmos., 123, 2175–2193, https://doi.org/10.1002/2017JD027560, 2018.
Prospero, J. M., Ginoux, P., Torres, O., Nicholson, S. E., and Gill, T. E.: Environmental characterization of global sources of atmospheric soil dust identified with the Nimbus 7 Total Ozone Mapping Spectrometer (TOMS) absorbing aerosol product, Rev. Geophys., 40, 1002, https://doi.org/10.1029/2000RG000095, 2002.
Prospero, J. M., Bullard, J. E., and Hodgkins, R.: High-latitude dust over the North Atlantic: inputs from Icelandic proglacial dust storms, Science, 335, 1078–1082, 2012.
Qin, Y., Abatzoglou, J. T., Siebert, S., Huning, L. S., AghaKouchak, A., Mankin, J. S., Hong, C., Tong, D., Davis, S. J., and Mueller, N. D.: Agricultural risks from changing snowmelt, Nat. Clim. Change, 10, 459–465, https://doi.org/10.1038/s41558-020-0746-8, 2020.
Querol, X., Tobías, A., Pérez, N., Karanasiou, A., Amato, F., Stafoggia, M., García-Pando, C. P., Ginoux, P., Forastiere, F., Gumy, S., and Mudu, P.: Monitoring the impact of desert dust outbreaks for air quality for health studies, Environ. Int., 130, 104867, https://doi.org/10.1016/j.envint.2019.05.061, 2019.
Raiswell, R., Hawkings, J. R., Benning, L. G., Baker, A. R., Death, R., Albani, S., Mahowald, N., Krom, M. D., Poulton, S. W., Wadham, J., and Tranter, M.: Potentially bioavailable iron delivery by iceberg-hosted sediments and atmospheric dust to the polar oceans, Biogeosciences, 13, 3887–3900, https://doi.org/10.5194/bg-13-3887-2016, 2016.
Ranjbar, K., O'Neill, N. T., Ivanescu, L., King, J., and Hayes, P. L.: Remote sensing of a high- Arctic, local dust event over Lake Hazen (Ellesmere Island, Nunavut, Canada), Atmos. Environ., 246, 118102, https://doi.org/10.1016/j.atmosenv.2020.118102, 2021.
Richards-Thomas, T., McKenna-Neuman, C., and Power, I. M.: Particle-scale characterization of volcaniclastic dust sources within Iceland, Sedimentology, 68, 1137–1158, https://doi.org/10.1111/sed.12821, 2021.
Romanias, M. N., Ren, Y., Grosselin, B., Daele, V., Mellouki, A., Dagsson-Waldhauserová, P., and Thevenet, F.: Reactive uptake of NO2 on volcanic particles: A possible source of HONO in the atmosphere, J. Environ. Sci., 95, 155–164, https://doi.org/10.1016/j.jes.2020.03.042, 2020.
Ryan-Keogh, T. J., Macey, A. I., Nielsdottir, M. C., Lucas, M. I., Steigenberger, S. S., Stinchcombe, M. C., Achterberg, E. P., Bibby, T. S., and Moore, C. M.: Spatial and temporal development of phytoplankton iron stress in relation to bloom dynamics in the high-latitude North Atlantic Ocean, Limnol. Oceanogr., 58, 533–545, https://doi.org/10.4319/lo.2013.58.2.0533, 2013.
Rymer, K.: Aeolian activity in central Spitsbergen (Ebba Valley) in the years 2012–2017, in: Proceedings of the XXXVII Polar Symposium “Polar Change–Global Change”, Poznan, Poland, 7–10 June 2018, p. 61, 2018.
Rymer, K. G., Rachlewicz, G., Buchwal, A., Temme, A. J. A. M., Reimann, T., and van der Meij, W. M.: Contemporary and past aeolian deposition rates in periglacial conditions (Ebba Valley, central Spitsbergen), Catena, 211, 105974, https://doi.org/10.1016/j.catena.2021.105974, 2022.
Samonova, O. A. and Aseyeva, E. N.: Particle size partitioning of metals in humus horizons of two small erosional landforms in the middle Protva basin – a comparative study, Geography, Environment, Sustainabilty, 13, 260–271, https://doi.org/10.24057/2071-9388-2019-116, 2020.
Sanchez-Marroquin, A., Arnalds, O., Baustian-Dorsi, K. J., Browse, J., Dagsson-Waldhauserová, P., Harrison, A. D., Maters, E. C., Pringle, K. J., Vergara-Temprado, J., Burke, I. T., McQuaid, J. B., Carslaw, K. S., and Murray, B. J.: Iceland is an episodic source of atmospheric ice-nucleating particles relevant for mixed-phase clouds, Science Advances, 6, eaba8137, https://doi.org/10.1126/sciadv.aba8137, 2020.
Šantl-Temkiv, T., Lange, R., Beddows, D., Rauter, U., Pilgaard, S., Dall'Osto, M., Gunde-Cimerman, N., Massling, A., and Wex, H.: Biogenic Sources of Ice Nucleating Particles at the High Arctic Site Villum Research Station, Environ. Sci. Technol., 53, 10580–10590, https://doi.org/10.1021/acs.est.9b00991, 2019.
Schroth, A. W., Crusius, J., Sholkovitz, E. R., and Bostick, B. C.: Iron solubility driven by speciation in dust sources to the ocean, Nat. Geosci., 2, 337–340, https://doi.org/10.1038/ngeo501, 2009.
Schroth, A. W., Crusius, J., Gassó, S., Moy, C. M., Buck, N. J., Resing, J. A., and Campbell, R. W.: Atmospheric deposition of glacial iron in the Gulf of Alaska impacted by the position of the Aleutian Low, Geophys. Res. Lett., 44, 5053–5061, https://doi.org/10.1002/2017gl073565, 2017.
Schuler, T. V., Kohler, J., Elagina, N., Hagen, J. O. M., Hodson, A. J., Jania, J. A., Kääb, A. M., Luks, B., Małecki, J., Moholdt, G., Pohjola, V. A., Sobota, I., and Van Pelt, W. J. J.: Reconciling Svalbard Glacier Mass Balance, Front. Earth Sci., 8, 156, https://doi.org/10.3389/feart.2020.00156, 2020.
Semenkov, I. N. and Koroleva, T. V.: The spatial distribution of fractions and the total content of 24 chemical elements in soil catenas within a small gully's catchment area in the Trans Urals, Russia, Appl. Geochem., 106, 1–6, https://doi.org/10.1016/j.apgeochem.2019.04.010, 2019.
Semenkov, I. and Yakushev, A.: Dataset on heavy metal content in background soils of the three gully catchments at Western Siberia, Data in Brief, 26, 104496, https://doi.org/10.1016/j.dib.2019.104496, 2019.
Semenkov, I. N., Usacheva, A. A., and Miroshnikov, A. Y.: Distribution of global fallouts cesium-137 in taiga and tundra catenae at the Ob River basin, Geol. Ore Deposit., 57, 138–155, https://doi.org/10.1134/S1075701515010055, 2015a.
Semenkov, I. N., Miroshnikov, A. Y., Asadulin, E. E., Usacheva, A. A., Velichkin, V. I., and Laverov, N. P.: The Ob river basin as a source of Kara Sea contamination with global fallout of Cesium-137, Dokl. Earth Sci., 463, 704–706, https://doi.org/10.1134/S1028334X1507003X, 2015b.
Semenkov, I. N., Krupskaya, V., and Klink, G.: Data on the concentration of fractions and the total content of chemical elements in catenae within a small catchment area in the Trans Urals, Russia, Data in Brief, 25, 104224, https://doi.org/10.1016/j.dib.2019.104224, 2019.
Semenkov, I. N., Sharapova, A. V., Koroleva, T. V., Klink, G. V., Krechetov, P. P., and Lednev, S. A.: Nitrogen-containing substances in the snow of the fall areas of the Proton launch vehicle stages in 2009 – 2019, Led i sneg, 61, 301–310, https://doi.org/10.31857/S2076673421020090, 2021.
Sharapova, A. V., Semenkov, I. N., Koroleva, T. V., Krechetov, P. P., Lednev, S. A., and Smolenkov, A. D.: Snow pollution by nitrogen-containing substances as a consequence of rocket launches from the Baikonur Cosmodrome, Sci. Total Environ., 709, 136072, https://doi.org/10.1016/j.scitotenv.2019.136072, 2020.
Shepherd, G., Terradellas, E., Baklanov, A., Kang, A., Sprigg, W., Nickovic, S., Darvishi Boloorani, A., Al-Dousari, A., Basart, S., Benedetti, A., Sealy, A., Tong, D., Zhang, X., Shumake-Guillemot, J., Kebin, Z., Knippertz, P., Mohammed, A. A. A., Al-Dabbas, M., Cheng, L., Otani, S., Wang, F., Zhang, Ch., Boom Ryoo, S., and Cha, J.: Global assessment of sand and dust storms, UNEP, WMO, UNCCD; United Nations Environment Programme, 123 pp., http://apps.unep.org/publications/pmtdocuments/Global_assessment_of_sand_and_dust_storms-2016.pdf (last access: 17 August 2022), 2016.
Shi, Z., Krom, M. D., Jickells, T. D., Bonneville, S., Carslaw, K. S., Mihalopoulos, N., Baker, A. R., and Benning, L. G.: Impacts on iron solubility in the mineral dust by processes in the source region and the atmosphere: A review, Aeolian Res., 5, 21–42, https://doi.org/10.1016/j.aeolia.2012.03.001, 2012.
Shugar, D. H., Clague, J. J., Best, J. L., Schoof, C., Willis, M. J., Copland, L., and Roe, G. H.: River piracy and drainage basin reorganization led by climate-driven glacier retreat, Nat. Geosci., 10, 370–375, 2017.
Sofiev, M., Vira, J., Kouznetsov, R., Prank, M., Soares, J., and Genikhovich, E.: Construction of the SILAM Eulerian atmospheric dispersion model based on the advection algorithm of Michael Galperin, Geosci. Model Dev., 8, 3497–3522, https://doi.org/10.5194/gmd-8-3497-2015, 2015.
Speirs, J. C., McGowan, H. A., and Neil, D. T.: Meteorological controls on sand transport and dune morphology in a polar-desert: Victoria Valley, Antarctica, Earth Surf. Proc. Land., 33, 1875–1891, 2008.
Spolaor A., Moroni, B., Luks, B., Nawrot, A., Roman, M., Larose, C., Stachnik, Ł., Bruschi, F., Kozioł, K., Pawlak, F., Turetta, C., Barbaro, E., Gallet, J.-C., and Cappelletti, D.: Investigation on the Sources and Impact of Trace Elements in the Annual Snowpack and the Firn in the Hansbreen (Southwest Spitsbergen), Front. Earth Sci., 8, 536036, https://doi.org/10.3389/feart.2020.536036, 2021.
Stockdale, A., Krom, M. D., Mortimer, R. J., Benning, L. G., Carslaw, K. S., Herbert, R. J., Shi, Z., Myriokefalitakis, S., Kanakidou, M., and Nenes, A.: Understanding the nature of atmospheric acid processing of mineral dusts in supplying bioavailable phosphorus to the oceans, P. Natl. Acad. Sci. USA, 113, 14639–14644, https://doi.org/10.1073/pnas.1608136113, 2016.
Stojiljkovic, A., Kauhaniemi, M., Kukkonen, J., Kupiainen, K., Karppinen, A., Denby, B. R., Kousa, A., Niemi, J. V., and Ketzel, M.: The impact of measures to reduce ambient air PM10 concentrations originating from road dust, evaluated for a street canyon in Helsinki, Atmos. Chem. Phys., 19, 11199–11212, https://doi.org/10.5194/acp-19-11199-2019, 2019.
Storelvmo, T., Tan, I., and Korolev, A. V.: Cloud Phase Changes Induced by CO2 Warming – a Powerful yet Poorly Constrained Cloud-Climate Feedback, Current Climate Change Reports, 1, 288–296, https://doi.org/10.1007/s40641-015-0026-2, 2015.
Strzelecki, M. C. and Long, A. J.: Tales from an Arctic Beach, Little Shells and Return to the Past – Petuniabukta 2010 Fieldwork, Billefjorden, Svalbard, J. Coastal Res., 101(sp1), 339–345, https://doi.org/10.2112/JCR-SI101-061.1, 2020.
Sweeney, M. and Mason, J. A.: Mechanisms of dust emission from Pleistocene loess deposits, Nebraska, USA, J. Geophys. Res., 118, 1460–1471, https://doi.org/10.1002/jgrf.20101, 2013.
Tagliabue, A., and Arrigo, K. R.: Iron in the Ross Sea: 1. Impact on CO2 fluxes via variation in phytoplankton functional group and non-Redfield stoichiometry, J. Geophys. Res., 110, C03009, https://doi.org/10.1029/2004JC002531, 2005.
Tan, I. and Storelvmo, T.: Evidence of Strong Contributions From Mixed-Phase Clouds to Arctic Climate Change, Geophys. Res. Lett., 46, 2894–2902, https://doi.org/10.1029/2018GL081871, 2019.
Tan, I., Storelvmo, T., and Zelinka, M. D.: Observational constraints on mixed-phase clouds imply higher climate sensitivity, Science, 352, 6282, https://doi.org/10.1126/science.aad5300, 2016.
Tarr, R. S. and Martin, L.: Glacier deposits of the continental type in Alaska, Geology, 21, 289–300, https://doi.org/10.1086/622063, 1913.
Television Midtvest: https://www.tvmidtvest.dk/midt-og-vestjylland/se-videoen-kraftig-blaest-faar- biler-til-at-forsvinde-i-stoevsky (last access: 17 August 2022), 2021.
Terradellas, E., Nickovic, S., and Zhang, X. Y.: Airborne dust: a hazard to human health, environment and society, WMO Bull, 64, 42–46, 2015.
Terradellas, E., Zhang, X. Y., Farrel, D., Nickovic, S., and Baklanov, A.: Airborne dust: Overview of atmospheric dust content in 2016, WMO Airborne Dust Bull, 1, 1–3, 2017.
Tobo, Y., Adachi, K., DeMott, P. J., Hill, T. C. J., Hamilton, D. S., Mahowald, N. M., Nagatsuka, N., Ohata, S., Uetake, J., Kondo, Y., and Koike, M.: Glacially sourced dust as a potentially significant source of ice nucleating particles, Nat. Geosci., 12, 253–258, https://doi.org/10.1038/s41561-019-0314-x, 2019.
Urupina, D., Lasne, J., Romanias, M., Thiery, V., Dagsson-Waldhauserová, P., and Thevenet, F.: Uptake and surface chemistry of SO2 on natural volcanic dusts, Atmos. Environ., 217, 116942, https://doi.org/10.1016/j.atmosenv.2019.116942, 2019.
UNCCD: Sand and Dust Storms Source Base-map, Visualization Tool, https://maps.unccd.int/sds/ (last access: 17 August 2022), 2021.
USGCRP: Impacts, Risks, and Adaptation in the United States: The Fourth National Climate Assessment, Volume II, edited by: Reidmiller, D. R., Avery, C. W., Easterling, D. R., Kunkel, K. E., Lewis, K. L. M., Maycock, T. K., and Stewart, B. C., U.S. Global Change Research Program, Washington, DC, 1515 pp., https://doi.org/10.7930/NCA4.2018, 2018.
Usher, C. R., Michel, A. E., and Grassian, V. H.: Reactions on Mineral Dust, Chem. Rev., 103, 4883–4940, https://doi.org/10.1021/cr020657y, 2003.
Varga, G., Dagsson-Waldhauserová, P., Gresina, F., and Helgadottir, A.: Saharan dust and giant quartz particle transport towards Iceland, Scientific Reports, 11, 11891, https://doi.org/10.1038/s41598-021-91481-z, 2021.
Vergara-Temprado, J., Miltenberger, A. K., Furtado, K., Grosvenor, D. P., Shipway, B. J., Hill, A. A., Wilkinson, J. M., Field, P. R., Murray, B. J., and Carslaw, K. S.: Strong control of Southern Ocean cloud reflectivity by ice-nucleating particles, P. Natl. Acad. Sci. USA, 115, 2687–2692, https://doi.org/10.1073/pnas.1721627115, 2018.
von Friesen, L. W. and Riemann, L.: Nitrogen Fixation in a Changing Arctic Ocean: An Overlooked Source of Nitrogen?, Front. Microbiol., 11, 596426, https://doi.org/10.3389/fmicb.2020.596426, 2020.
Vukovic, A.: Report on consultancy to develop Global Sand and Dust Source Base Map, no. CCD/18/ERPA/21, United Nations Convention to Combat Desertification, UNCCD, 2019.
Vukovic, A.: Sand and Dust Storms Source Base-map, YouTube, https://youtu.be/4tsbspJvuAs (last access: 19 August 2022), 2021.
Vukovic, A.: Global high-resolution dust source map, InDust webinar, https://cost-indust.eu/events/indust-events (last access: 17 August 2022), 21 April 2021.
Wahlström, E., Reinikainen, T., and Hallanaro, E.-L.: Ympäristön tila Suomessa, Gaudeamus, 364 pp., ISBN 951-662-523-1, 1996.
Wang, Q., Fan, X., and Wang, M.: Evidence of high-elevation amplification versus Arctic amplification, Scientific Reports, 6, 19219, https://doi.org/10.1038/srep19219, 2016.
Wheaton, E. E.: Prairie dust storms – A neglected hazard, Nat. Hazards, 5, 53–63, https://doi.org/10.1007/BF00127139, 1992.
Wheaton, E. E. and Chakravarti, A. K.: Dust storms in the Canadian Prairies, Int. J. Climatol., 10, 829–837, https://doi.org/10.1002/joc.3370100805, 1990.
Wientjes, I. G. M., Van de Wal, R. S. W., Reichart, G. J., Sluijs, A., and Oerlemans, J.: Dust from the dark region in the western ablation zone of the Greenland ice sheet, The Cryosphere, 5, 589–601, https://doi.org/10.5194/tc-5-589-2011, 2011.
Winton, V. H. L., Dunbar, G. B., Bertler, N. A. N., Millet, M. A., Delmonte, B., Atkins, C. B., Chewings, J. M., and Andersson, P.: The contribution of aeolian sand and dust to iron fertilization of phytoplankton blooms in southwestern Ross Sea, Antarctica, Global Biogeochem. Cy., 28, 423–436, https://doi.org/10.1002/2013gb004574, 2014.
Winton, V. H. L., Dunbar, G. B., Atkins, C. B., Bertler, N. A. N., Delmonte, B., Andersson, P., Bowie, A., and Edwards, R.: The origin of lithogenic sediment in the south-western Ross Sea and implications for iron fertilization, Antarct. Sci., 28, 250–260, https://doi.org/10.1017/S095410201600002X, 2016a.
Winton, V. H. L., Edwards, R., Delmonte, B., Ellis, A., Andersson, P. S., Bowie, A., Bertler, N. A. N., Neff, P., and Tuohy, A.: Multiple sources of soluble atmospheric iron to Antarctic waters, Global Biogeochem. Cy., 30, 421–437, https://doi.org/10.1002/2015gb005265, 2016b.
Wolfe, S. A.: Cold-Climate Aeolian Environments, Reference Module in Earth Systems and Environmental Sciences, https://doi.org/10.1016/B978-0-12-818234-5.00036-5, 2020.
Zhu, L., Ives, A., Zhang, C., Guo, Y., and Radeloff, V.: Climate change causes functionally colder winters for snow cover-dependent organisms, Nat. Clim. Change, 9, 886–893, https://doi.org/10.1038/s41558-019-0588-4, 2019.
Zhu, Y., Toon, O. B., Jensen, E. J., Bardeen, C. G., Mills, M. J., Tolbert, M. A., Yu, P., and Woods, S.: Persisting volcanic ash particles impact stratospheric SO2 lifetime and aerosol optical properties, Nat. Commun., 11, 4526, https://doi.org/10.1038/s41467-020-18352-5, 2020.
Zwoliński, Z., Kostrzewski, A., and Pulina, M. (Eds.): Dawne i współczesne geoekosystemy Spitsbergenu, Polskie badania geomorfologiczne/Ancient and modern geoecosystems of Spitsberegen, Polish geomorphological research, Bogucki Wydawnictwo Naukowe, Poznań, 456 pp., ISBN 978-83-63400-54-5, 2013.