the Creative Commons Attribution 4.0 License.
the Creative Commons Attribution 4.0 License.
 | 12 Sep 2022
The impact of atmospheric motions on source-specific black carbon and the induced direct radiative effects over a river-valley region
Huikun Liu
Qiyuan Wang
Suixin Liu
Bianhong Zhou
Yao Qu
Jie Tian
Ting Zhang
Yongming Han
Junji Cao
Black carbon (BC) is one of the most important short-lived climate forcers, and atmospheric motions play an important role in determining its mass concentrations of pollutants. Here an intensive observation was launched in a typical river-valley city to investigate relationships between atmospheric motions and BC aerosols. Equivalent BC (eBC) source apportionment was based on an aethalometer model with the site-dependent absorption Ångström exponents (AAEs) and the mass absorption cross sections (MACs) retrieved using a positive matrix factorization (PMF) model based on observed chemical components (i.e., EC, POC, K+, Mg, Al, Si, S, Cl, Ca, V, Mn, Fe, Ni, Cu, As, Se, Br, Sr, Pb, Ga, and Zn) and primary absorption coefficients at selected wavelengths from λ=370 to 880 nm. The derived AAEs from 370 to 880 nm were 1.07 for diesel vehicular emissions, 2.13 for biomass burning, 1.74 for coal combustion, and 1.78 for mineral dust. The mean values for eBCfossil and eBCbiomass were 2.46 and 1.17 µg m−3, respectively. Wind run distances and the vector displacements of the wind in 24 h were used to construct a self-organizing map, from which four atmospheric motion categories were identified (local-scale dominant, local-scale strong and regional-scale weak, local-scale weak and regional-scale strong, and regional-scale dominant). BC pollution was found to be more likely when the influence of local-scale motions outweighed that of regional-scale motions. Cluster analysis for the back-trajectories of air mass calculated by the Hybrid Single-Particle Lagrangian Integrated Trajectory model at the study site indicated that the directions of air flow can have different impacts for different scales of motion. The direct radiative effects (DREs) of source-specific eBC were lower when the influence of regional-scale motions outweighed that of the local ones. However, due to chemical aging of the particles during transport – the DRE efficiencies under regional-scale motions were ∼ 1.5 times higher than those under more local influences. The finding that the DRE efficiency of BC increased during the regional transport suggested significant consequences in regions downwind of pollution sources and emphasizes the importance of regionally transported BC for potential climatic effects.
- Article
(1821 KB) - Full-text XML
-
Supplement
(4449 KB) - BibTeX
- EndNote


Black carbon (BC) is produced by the incomplete combustion of biomass and fossil fuels. The BC aerosol has a strong light-absorbing capacity and can cause heating of the atmosphere. In fact, BC is widely recognized as one of the most important short-lived climate forcers (IPCC, 2021). Due to this high light-absorbing ability, BC has the potential to perturb the radiative balance between the Earth and the atmosphere and in so doing cause the climate to change and drive ecosystems away from their natural states (Schroter et al., 2005). Those changes ultimately will affect biodiversity and could threaten humans' food security (Ochoa-Hueso et al., 2017; Shindell et al., 2012). Besides heating the atmosphere directly, BC is also important for nucleating clouds, and that is another way in which the particles can cause indirect climatic effects (Jacobson, 2002). As BC is heterogeneously distributed in the atmosphere, its climatic effects are highly variable and dependent on its distribution in the atmosphere, both horizontally and vertically, its radiative properties and how they are affected by chemical processing, and its lifetime (IPCC, 2021).
The radiative efficiency of BC can vary due to differences in emission sources and atmospheric aging processes (Bond et al., 2013; He et al., 2015; Cappa et al., 2012). Indeed, BC from different sources can vary in light-absorbing abilities (Cheng et al., 2011), which can affect the radiative forcing of climate. In addition to the effects of the sources, regional transport can impact the light-absorbing ability through chemical processing or aging (Zhang et al., 2019). After BC particles are emitted, they can stay in the atmosphere for days or a few weeks (IPCC, 2021). During transport, fresh BC can experience a series of physical and chemical changes, for instance, mixing with other substances that can alter its microphysical and optical properties (Kahnert and Kanngießer, 2020). The aging processes can be even faster in polluted regions (Peng et al., 2016), and as a result, the light-absorbing ability of BC can be strongly affected. Indeed, the light-absorbing ability of BC after aging can be as much as 2.4 times that of fresh particles (Peng et al., 2016).
The concentrations of BC are controlled by local emissions and regional transport, but meteorological conditions are also important because they affect both transport and removal. Normally, local emissions in urban areas are predictable to some degree because those emission sources are mainly anthropogenic and the concentrations of pollutants follow the diurnal patterns driven by anthropogenic activities. By contrast, meteorological conditions and regional transport are governed by multiple scales of motion which result in distinct meteorological impacts on ambient pollutant levels (Levy et al., 2010; Dutton, 1976). A commonly accepted classification of the scale of motion is based on horizontal distance and timescales. Typically, the timescale of local-scale motions varies from hours to days, and the spatial scale ranges from 102 to 105 m (Oke, 2002; Seinfeld and Pandis, 2006). The local scales of motion are mainly controlled by local factors such as the roughness of the Earth's surface, orography, or land breeze/sea breeze circulation (Hewitson and Crane, 2006; IPCC, 2021). Larger scales of motions are associated with mesoscale or synoptic-scale weather systems, which on the one hand can transport pollutants but on the other hand can disperse them (Kalthoff et al., 2000; Zhang et al., 2012).
The relationships between atmospheric motions and pollutant concentrations are complex. Atmospheric motions determine where and how extensive the pollution impacts are, but of course the rates of pollutant emissions, especially local ones, are important too (Dutton, 1976). Liao et al. (2020) found that synoptic-scale flow led to an enhanced PM2.5 in a coastal area of the Pearl River Delta, while meso-/local-scale motions led to PM2.5 pollution in an inland area. Levy et al. (2010) showed that the concentrations of NOx and SO2 were higher under the dominance of smaller-scale motions than under larger-scale motions. However, few studies have touched on the impacts of different scales of motion on BC and their effects on radiative efficiency even though the effects could cause rapid climatic effects due to the patchy and constantly changing distributions (IPCC, 2021).
Topography also plays an important role in air pollution (Zhao et al., 2015). River-valley topography is complicated, and it can have a considerable influence on air pollution and synoptic patterns of flow (Green et al., 2016; Carvalho et al., 2006). The pollution levels in cities in river valleys are not only influenced by general atmospheric dynamics, but are also strongly impacted by the local scale of dynamics (Brulfert et al., 2006). Surface albedo and surface roughness are affected by the complex topography of river-valley regions, and those physical factors can affect circulation, causing changes in pollutant mass concentrations (Wei et al., 2020). Mountains also significantly affect pollution, and once pollutants are generated or transported into the river-valley regions, their dispersal can be impeded by the blocking effect of the mountains. Instead of being dispersed, they can be carried by the air flows over the mountains to converge at the bottom of the valley and increase the pollutants along the river (Zhao et al., 2015). In this way, pollutants can accumulate in valleys and spread throughout the area, thereby aggravating pollution. In addition, temperature inversions commonly form in river valleys during the winter, and that, too, can aggravate pollution problems (Glojek et al., 2022; Bei et al., 2016).
Thus, we focused our study on the impacts of different scales of motion on source-specific equivalent BC (eBC), and we evaluated radiative effects of eBC over a river-valley city. The primary objectives of this study were (1) to quantify the contributions of fossil fuel combustion and biomass burning to eBC concentrations, (2) to investigate the impacts of different scales of motion on the source-specific eBC, and (3) to estimate the radiative effects and the radiative efficiency of the source-specific eBC under different atmospheric motion scenarios. The study provides insights into the influence of the specified atmospheric motions on BC and highlights the effects of those motions on the radiative efficiency and potential climatic effects of the regionally transported BC.
2.1 Research site
Baoji is a typical river-valley city, located at the westernmost point of the Guanzhong Plain at an altitude from 450 to 800 m a.s.l. (Fig. S1 in the Supplement). Baoji has a complex topography and often suffers from severe pollution in winter. It is surrounded by mountains to the south, west, and north, with the Weihe River as the central axis extending eastward. The shape can be viewed as a funnel, with a large opening to the east. The Qinling peaks and the flat Weihe Plain are the main landforms of Baoji. The main peak of the Qinling Mountains is 3767 m a.s.l., and it is the highest mountain in the eastern part of mainland China. This terrain causes divergent flow at local scales, which can impact pollution levels (Wei et al., 2020). Baoji is also an important railway intersection in China, connecting six railways to northwestern and southwestern China. Pollutant levels can be high, and pollutants are not easy to disperse in the city due to its special topographic conditions, dense population (total population of 0.341 million, with 63.5 % of the population living in the downtown area) with a population density of 6003 people per square kilometer in 2019 (http://tjj.shaanxi.gov.cn/upload/2021/zk/indexch.htm, last access: 10 July 2022 and https://data.chinabaogao.com/hgshj/2021/042053X932021.html, last access: 10 July 2022), and impacts from major highway and railway networks.
The sampling site was on the rooftop of a building at Baoji University of Arts and Sciences (34∘21′16.8" N, 107∘12′59.6" E; 569 m a.s.l.) surrounded by commercial and residential buildings, highways, and a river, and there were no major industrial emission sources nearby. The main sources of BC in Baoji were the domestic fuel (coal and biomass) burning as well as the motor vehicle emissions (Zhou et al., 2018; Xiao et al., 2014). Open fire can also be sources of BC, but there were limited fires found scattered around the site (Fig. S2). The meteorological conditions at Baoji for the four seasons are listed in Table S1 in the Supplement, and the wind roses for the different seasons are shown in Fig. S3 (data are from the Meteorological Institute of Shaanxi Province).
2.2 Sampling and laboratory measurements
eBC and the absorption coefficients (babs) at 370, 470, 520, 590, 660, 880, and 950 nm wavelengths were measured using an AE33 aethalometer (Magee Scientific, Berkeley, CA, USA) equipped with a PM2.5 cut-off inlet (SCC 1.829, BGI Inc., USA) that had a time resolution of 1 min. A Nafion® dryer (MD-700-24S-3; Perma Pure, Inc., Lakewood, NJ, USA) with a flow rate of 5 L min−1 was used to dry the PM2.5 before the measurement. Briefly, the particles were dried by the Nafion® dryer before being measured with the AE33 aethalometer, and the deposited particles were irradiated by light-emitting diodes at seven wavelengths (λ= 370, 470, 520, 590, 660, 880, and 950 nm), and the light attenuation was detected. The nonlinear loading issue for filter-based absorption measurement was accounted for in the AE33 by a technique called dual-spot compensation. The quartz filter (PN8060) matrix scattering effect was corrected by using a factor of 1.39. More details on AE33 measurement techniques can be found in Drinovec et al. (2015).
The scattering coefficient (bscat) at a single 525 nm wavelength was measured with the use of a nephelometer (Aurora-1000, Ecotech, USA) that had a time resolution of 5 min. The nephelometer and aethalometer operated simultaneously and used the same PM2.5 cyclone and Nafion® dryer. The calibration was conducted based on the user guide with a calibration gas R-134. Zero calibrations were conducted every other day by using clean air without particles. The ambient air was drawn in through a heated inlet with a flow rate of 5 L min−1. The relative humidity remained lower than 60 %.
PM2.5 samples were collected every 24 h from 10:00 local time to 10:00 the next day from 16 November to 21 December 2018 with two sets of mini-volume samplers (Airmetrics, USA), one using quartz fiber filters (QM/A; Whatman, Middlesex, UK) and the other with Teflon® filters (Pall Corporation, USA), both with a flow rate of 5 L min−1. The samples were kept in a refrigerator at 4 ∘C before analysis. The mass concentration of K+ in the PM2.5 quartz sample was extracted in a separate 15 mL vial containing 10 mL of distilled deionized water (18.2 MΩ resistivity). The vials were placed in an ultrasonic water bath and shaken with a mechanical shaker for 1 h to extract the ions, which were determined by a Metrohm 940 Professional IC Vario (Metrohm AG, Herisau, Switzerland) with a Metrosep C6-150/4.0 column (1.7 mmol L−1 nitric acid + 1.7 mmol L−1 dipicolinic acid as the eluent) for cation analysis. A group of elements (i.e., Mg, Al, Si, S, Cl, Ca, V, Mn, Fe, Ni, Cu, As, Se, Br, Sr, Pb, Ga, and Zn) on the Teflon® filters was determined by energy-dispersive X-ray fluorescence (ED-XRF) spectrometry (Epsilon 4 ED-XRF, PANalytical B.V., Netherlands). The X-rays were generated from a gadolinium anode on a side-window X-ray tube. A spectrum of the ratio of X-ray and photon energy was obtained after 24 min of analysis for each sample with each energy peak characteristic of a specific element, and the peak areas were proportional to the concentrations of the elements. Quality control was conducted on a daily basis with a test standard sample.
Organic carbon (OC) and elemental carbon (EC) in each sample were determined with the use of a DRI Model 2001 Thermal/Optical Carbon Analyzer (Atmoslytic Inc., Calabasas, CA, USA). The thermal/optical reflectance (TOR) method and IMPROVE_A protocol were used for analysis. A punch of a quartz filter sample was heated at specific temperatures to obtain data for four OC fractions and three EC fractions. Total OC was calculated by summing all OC fractions and the pyrolytic carbon (PC). Total EC was calculated by summing all EC fractions minus the PC. Detailed methods and quality assurance/quality control processes were described in Cao et al. (2003). Primary organic carbon (POC) was estimated by using the minimum R-squared (MRS) method, which is based on using eBC as a tracer (Text S1 in the Supplement). The method uses the minimum R2 between OC and eBC to indicate the ratio for which secondary OC and eBC are independent. A detailed description of the MRS method can be found in Wu et al. (2016).
Concentrations of NOx, wind speed, and direction at 12 ground monitoring sites were downloaded from http://sthjt.shaanxi.gov.cn/hx_html/zdjkqy/index.html (last access: 10 July 2022). The wind data at 100 m a.g.l. and the planetary boundary layer height were downloaded from https://rda.ucar.edu/datasets/ds633.0 (last access: 10 July 2022). The data used for the Hybrid Single-Particle Lagrangian Integrated Trajectory (HYSPLIT) model were downloaded from the Global Data Assimilation System, and they had a resolution of 1∘ × 1∘ (GDAS, https://www.ready.noaa.gov/gdas1.php, last access: 4 January 2022). The data and the main parameters used in the trajectory model are listed in Table S2.
2.3 Optical source apportionment
The positive matrix factorization (PMF) model was used for the optical source apportionment in this study. PMF solves chemical mass balance by decomposing the observational data into different source profiles and contribution matrices as follows:
where Xij denotes the input data matrix, p is the number of sources selected in the model, gik denotes the contribution of the kth factor to the ith input data, fkj represents the kth factor's profile of the jth species, and eij represents the residual. Both gik and fkj are non-negative. The uncertainties of each species and babs(λ) were calculated by the equation recommended in the EPA PMF5.0 user guideline (Norris et al., 2014) as follows:
where MDL is the minimum detection limit of the method. When the concentration of a species was higher than the MDL, then Eq. (2) was used; otherwise, Eq. (3) was used. In Eq. (2), to calculate the uncertainty of a chemical species, the error fraction was multiplied by the concentration of the species. To calculate the uncertainty of optical data, the error fractions were multiplied by the light-absorbing coefficients.
Chemical species data (EC, POC, K+, Mg, Al, Si, S, Cl, Ca, V, Mn, Fe, Ni, Cu, As, Se, Br, Sr, Pb, Ga, and Zn) and the primary absorption coefficients (Pabs) data at λ= 370, 470, 520, 660, and 880 nm were used for PMF analysis. The error fraction of the offline measured data was the difference between multiple measurements of the same sample. The error fraction used for optical data was 10 % based on Rajesh and Ramachandran (2018). PMF solves Eq. (1) by minimizing the Q value, which is the sum of the normalized residuals' squares, as follows:
where uij represents the uncertainties of each Xij and was used as the indicator for the factor number determination.
2.4 eBC source apportionment
The quantities of eBC generated from biomass burning versus fossil fuel combustion were deconvolved by an aethalometer model which uses the Beer–Lambert law to write the absorption coefficient equations, wavelengths, and absorption Ångström exponents (AAEs) for the two different BC emission sources (Sandradewi et al., 2008). This approach is widely used for separating BC from two different sources based on optical data (Rajesh and Ramachandran, 2018; Kant et al., 2019; Panicker et al., 2010). However, the traditional aethalometer model could be affected by the light-absorbing substances at lower wavelengths such as dust and secondary aerosol. An improvement to the traditional aethalometer model was made by explicitly considering the interference of the babs at a lower wavelength (370 nm) caused by dust and secondary OC. Thus, the calculation of the absorption and source apportionment was based on the following equations (Wang et al., 2020):
where AAEfossil and AAEbiomass are the AAEs for fossil fuel combustion and biomass burning. These were derived from the optical source apportionment by using PMF as discussed in Sect. 3.1. Further, babs(370) and babs(880) are the total babs measured by the AE33 at the wavelengths of 370 and 880 nm, respectively, babs(370)fossil and babs(880)fossil are the babs caused by emissions from fossil fuel combustion at those two wavelengths, babs(370)biomass and babs(880)biomass are the babs caused by emissions from biomass burning at those two wavelengths, babs(370)dust refers to the babs contributed by mineral dust at the wavelength of 370 nm, which was derived from the result of optical source apportionment, babs(370)secondary refers to the babs caused by the secondary aerosols at the wavelength of 370 nm, which was calculated by the minimum R-squared approach with eBC as a tracer (Text S1, Wang et al., 2019), eBCfossil and eBCbiomass are the eBC from fossil fuel combustion and biomass burning, and MACBC(880)fossil and MACBC(880)biomass are the mass absorption cross sections of eBCfossil and the mass absorption cross section of eBCbiomass at the wavelength of 880 nm, respectively, which were based on the PMF results for the optical source apportionments.
2.5 Indicators for the different scales of motion
The mathematical definitions of air flow conditions proposed by Allwine and Whiteman (1994) were used in this study. The definitions quantify the flow features integrally at individual stations. Three variables were quantified, namely, the actual wind run distance (S) which is the scalar displacement of the wind in 24 h (i.e., the accumulated distance of the wind), the resultant transport distance (L) which is the vector displacement of the wind in 24 h (i.e., the straight line from the starting point to the end point), and the recirculation factor (R) based on the ratio of L and S which indicates the frequency of the wind veering in 24 h. The influences of different scales of atmospheric motions were assessed based on the method proposed by Levy et al. (2010), and for this, we used wind data at 100 m above the sampling site and the wind data from 12 monitoring stations at ground level (∼ 15 m) to indicate the different scales of motions. The winds at the surface monitoring stations were expected to be more sensitive to local-scale turbulence and convection than the winds at 100 m. With less influence from the surface forces, the indicators at 100 m would be more sensitive to larger scales of motion. The equations used are as follows:
where T is the interval of the data (i.e., 60 min), i is the ith ending timestep data, τ is the integration time period of the wind run (24 h), represents the data at the start time, and n is the number of monitoring stations (a total of 12 in this study). The quantities u and v are the wind vectors. Using the wind data from the 12 monitoring stations covering Baoji, the L and S values at the 12 different sites at ground level were calculated. Lnτ and Snτ represent the resultant transport distance and the actual wind run distance at the nth (n=1 to 12) monitoring station at ground level. Rnτ is the recirculation factor at the nth monitoring station which is calculated based on Lnτ and Snτ. Lbj and Sbj are the resultant transport distance and the actual wind run distance at 100 m height above the ground. These represent the flow characteristics in the higher atmosphere at the study site, and they were calculated by using the wind data at 100 m height. The recirculation factor (Rbj) was calculated for a height of 100 m.
As explained in Levy et al. (2010), if local-scale motions are strong and regional-scale motions are weak, the variations in winds at each station would not be likely to be uniform due to differences in local factors, and that would result in relatively large standard deviations (Rstd) for Rnτ. By contrast, if the local-scale motions are weak and the regional-scale motions are strong, the wind direction would be likely to be more uniform over a large area, and the Rbj and Rstd should be relatively smaller.
2.6 Self-organizing map
A self-organizing map (SOM) developed by Kohonen (1990) is a type of artificial neural network that is widely used for categorizing high-dimensional data into a few major features (Stauffer et al., 2016, and Pearce et al., 2014). In particular, this approach is widely used for categorizing different meteorological patterns (Liao et al., 2020; Han et al., 2020; Jiang et al., 2017). Unlike traditional dimension reduction methods (e.g., principal component analysis), SOM projects high-dimensional input data by nonlinear projection into user-designed lower dimensions, which are typically two-dimensional arrays of nodes (Hewitson and Crane, 2006). The performance of SOMs in classifying climatological data has been shown to be robust (Reusch et al., 2005). Competitive learning algorithms are used to train SOMs, and the architecture of SOMs consists of two layers: one is called the input layer, and it contains the high-dimensional input data. The other layer is the output layer in which the node number is the output cluster number. The working principle of SOMs is to convert high-dimensional data with complex correlations into lower dimensions via geometrical relationships (Ramachandran et al., 2019). After the initial random weights are generated, the input data are compared with each weight, and the best match is defined as winning. The winning node and the neighboring nodes close to the winning node will learn from the same inputs, and the associated weights are updated. After multiple iterations, the network settles into stable zones of features and the weights. More detailed working principles of SOMs can be found in Kangas and Kohonen (1996) and Kohonen et al. (1996).
Comparison between the input data and each weight is made by applying Euclidean distances; the best match is defined by the following equation:
where x is the input data, mc is the best-matched weight, and mi are the weights connected with the ith node.
The weights are updated by the following equation:
where mi(t+1) is the ith weight at the t+1 time, mi(t) is the ith weight at the t time, hci(t) is the neighborhood kernel defined over the lattice points at the t time, and c is the winning node location.
An SOM was used to categorize the daily atmospheric motions during the study period and to explore the influences of different scales of motion on source-specific eBC. Hourly averages of three sets of data (Rstd, Lbj, and Sbj) were input into the SOM. Determining the size of the output map is crucial for the SOM (Chang et al., 2020; Liu et al., 2021). To reduce the subjectivity, the K-means cluster method was used for the decision-making regarding size. The similarity of each item of the input data relative to the node was measured using a Euclidean distance. The iteration number was set to 2000. For each input data item, the node closest to it would “win out”. The reference vectors of the winning node and their neighborhood nodes were updated and adjusted towards the data. The Kohonen package in the R language (Wehrens and Kruisselbrink, 2019) was used to develop the SOM model in this study.
2.7 Estimations of direct radiative effects and heating rate
The Santa Barbara DISORT Atmospheric Radiative Transfer (SBDART) model was used to estimate the direct radiative effects (DREs) induced by source-specific eBC. The model has been used in many studies to calculate the DREs caused by aerosols and BC (Pathak et al., 2010; Rajesh and Ramachandran, 2018; Zhao et al., 2019). SBDART calculated DREs based on several well-tested physical models. Details regarding the model were presented in Ricchiazzi et al. (1998). The important input data included aerosol parameters, including aerosol optical depth (AOD), single scattering albedo (SSA), asymmetric factor (AF) and extinction efficiency, surface albedo, and atmospheric profiles.
The aerosol parameters used in this study were derived by the Optical Property of Aerosol and Cloud (OPAC) model (Hess et al., 1998) based on the number concentrations of aerosol components. As the study was conducted in an urban region, the urban aerosol profile was used in OPAC, and it included soot (eBC), water-soluble matter (WS), and water-insoluble matter (WIS). The number concentrations of soot were derived from the mass concentrations of eBC with the default ratio (5.99 × 10⁻⁵ µg m particle cm−3) in OPAC. The number concentrations of WS and WIS were adjusted until the modeled SSA and babs at 500 nm in OPAC were close (± 5 %; see Fig. S4) to those values calculated with data from the nephelometer and AE33 (bext(520) =bscat(525) + babs(520), SSA =bscat(525) (520)). The DREs of source-specific eBC at the top of atmosphere (TOA) and surface atmosphere (SUF) were calculated from the differences between the DREs with or without the number concentrations of the source-specific eBC under clear-sky conditions.
where DREeBC is the DRE of source-specific eBC, F↓ and F↑ are the downward and upward fluxes, and DREeBC, ATM is the DRE of the source-specific eBC for the atmospheric column, that is, the DRE at the top of the atmosphere (DREeBC,TOA) minus that at the surface (DREeBC,SUF).
3.1 Calculation of eBCfossil and eBCbiomass
The PMF model was used for the optical source apportionment, and those results were used to obtain the site-specific AAEs and MACs, which in turn were used to calculate the source-specific eBC with the improved aethalometer model. For every solution, PMF was run 20 times. The ratios from the two- to seven-factor solutions were examined, and the values of a four-factor solution were found to be most stable compared with others because the values did not drop appreciably after the addition of one more factor (Fig. S5). Based on these results, the four-factor solution was determined to be the most interpretable. Two diagnostic methods, bootstrap (BS) and displacement (DISP) (Norris et al., 2014; Brown et al., 2015), were used to validate the robustness and stability of the results. The BS method was used to assess the random errors and partially assess the effects of rotational ambiguity, while DISP was used to evaluate rotational ambiguity errors. The results of the BS and DISP analyses showed that there was no swap for the four-factor solution (Table S3). The modeled primary babs(λ) were well correlated (r= 0.95–0.96, slope = 0.90 ∼ 0.95, p<0.01; Fig. S6) with their observed counterparts, which suggested that the modeling performance of PMF5.0 was good. The factor profiles obtained from the PMF are shown in Fig. 1.
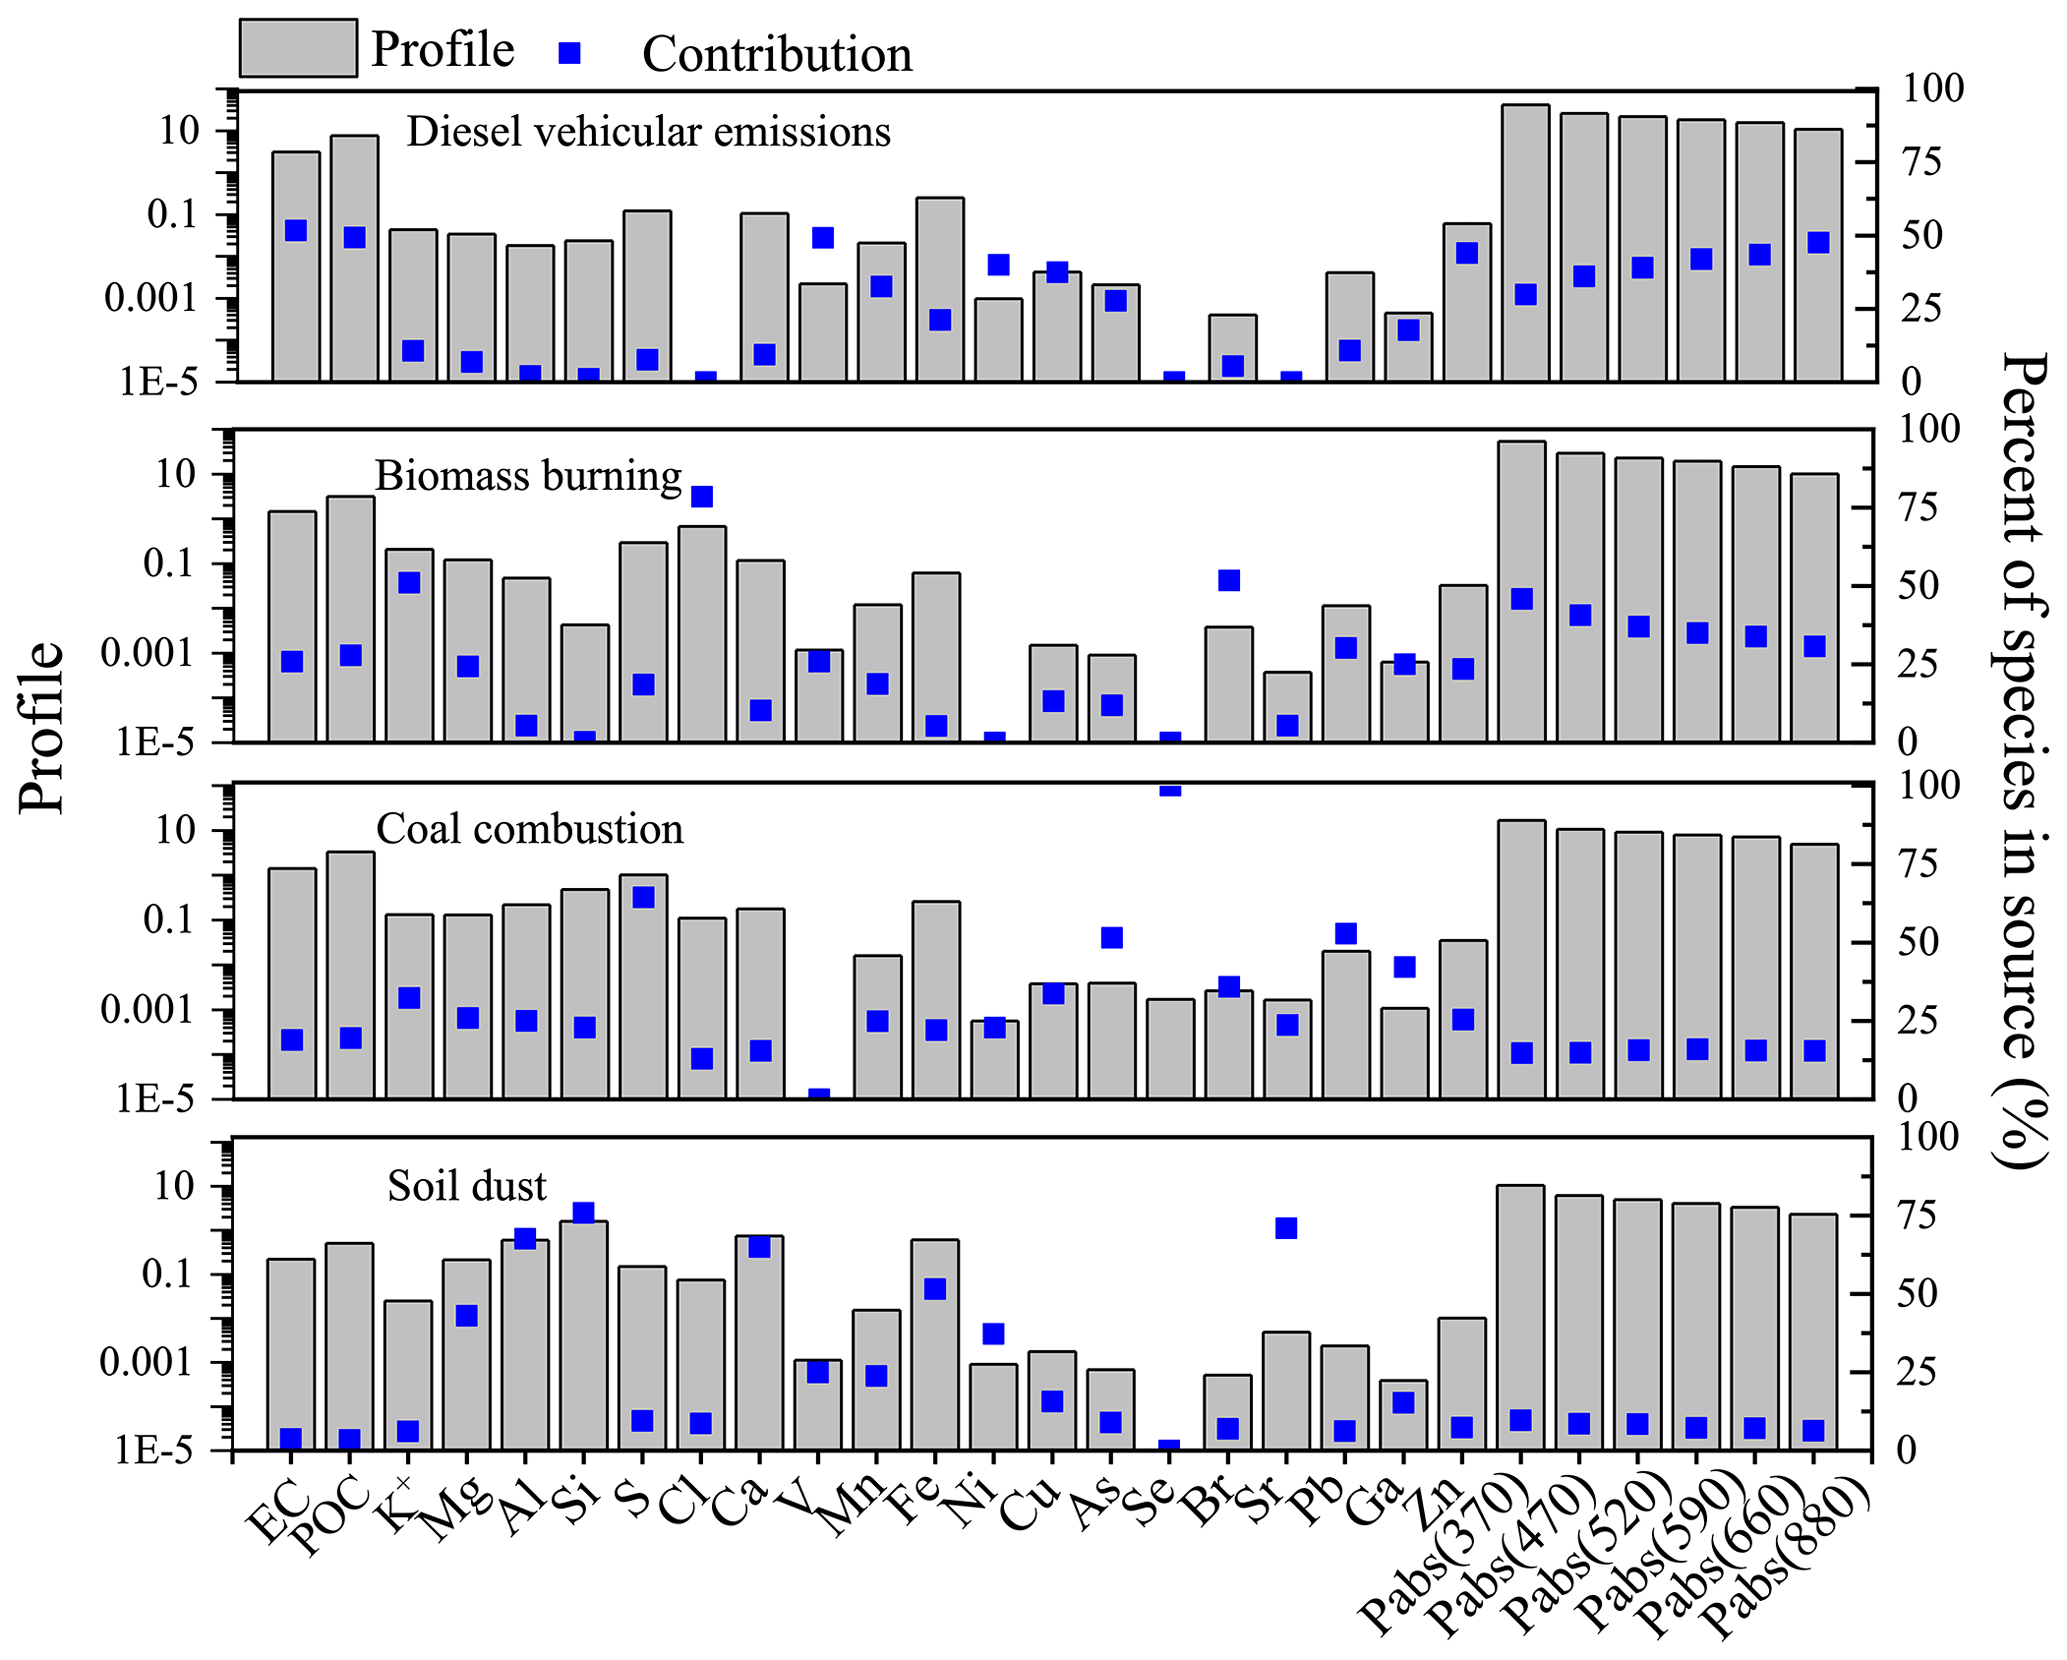
Figure 1Four factors identified by source apportionment. Concentration (µg m−3) of the chemical species and primary absorption coefficients (pabs) (λ) at six wavelengths (λ= 370, 470, 520, 590, 660, or 880 nm) (M m−1) for each source are shown in grey. The blue square represents the contribution of each chemical species to the four different factors.
The first factor (PC1) that was featured had high loadings of EC (52 %), POC (49 %), and V (49 %) and moderate loadings of Mn (33 %), Ni (40 %), Cu (37 %), and Zn (44 %). This factor source contributed 27 % to 44 % of the primary babs(λ). Of the species with high loadings on PC1, EC has been found to be associated with vehicular emissions due to incomplete fuel combustion (Cao et al., 2013). V and Ni are commonly detected in the particles emitted by diesel-powered vehicles (Lin et al., 2015; Zhao et al., 2021). Mn compounds are commonly used as an antiknock additive for unleaded gasoline to raise octane numbers and protect the engine (Lewis et al., 2003; Geivanidis et al., 2003), and Cu and Zn are emitted by the combustion of lubricating oils and from the wear of motor vehicle parts (i.e., brakes and tires) (Thorpe and Harrison, 2008; Song et al., 2006). In addition, the EC associated with this factor was found to be well correlated (r=0.83, p<0.01; Fig. S7) with the daily-averaged NOx, which is a commonly used tracer of vehicular emissions in the urban areas (Zotter et al., 2017). Recent research on the source contributions of BC emissions has shown that most of the BC associated with transportation was emitted by on-road diesel vehicles in China (Xu et al., 2021). From these results, PC1 was identified as diesel vehicular emissions. The MAC of this factor (MAC (880)diesel) was 6.7 m2 g−1. The estimated AAE of this factor (AAEdiesel) was 1.07 (Fig. S8), which is comparable with the AAE values of vehicle emissions (0.8 ∼ 1.1) reported in previous studies (Zotter et al., 2017; Kirchstetter et al., 2004).
The second factor (PC2) was characterized by the high loadings of K+ (51 %), Cl (79 %), and Br (52 %) and moderate amounts of EC (26 %), POC (28 %), and Pb (30 %). Of these, K+ is a widely recognized tracer for the biomass burning emissions (Urban et al., 2012; Zhang et al., 2015), and high loadings of Cl can also be taken as a signal of biomass burning (Yao et al., 2002; Manousakas et al., 2017). Previous studies showed that a large quantity of Br found in biomass burning aerosols was caused by emissions of CH3Br emissions during combustion (Manö and Andreae, 1994; Artaxo et al., 1998). Particulate matter emitted from biomass burning typically has substantial amounts of OC and EC (Song et al., 2006), and Pb has also been observed in biomass burning aerosols (Amato et al., 2016). Thus, PC2 was identified as emissions from biomass burning. The contribution of this factor to primary babs(370) was as high as 50 % but only 33 % to primary babs(880), and that was likely caused by the brown carbon which is typically found in biomass burning aerosols (Washenfelder et al., 2015; Yan et al., 2015). The MAC of this factor (MAC(880)biomass) was 9.5 m2 g−1. The AAE of this factor (AAEbiomass) was 2.13 (Fig. S8), which is consistent with the wide range of AAEs reported for biomass burning (1.2 ∼ 3.5) (Sandradewi et al., 2008; Helin et al., 2018; Zotter et al., 2017).
The third factor (PC3) had significant loadings of S (64 %), Se (98 %), As (51 %), and Pb (53 %) and moderate loadings of Ga (42 %) – all of these elements are commonly associated with coal combustion (Hsu et al., 2016; Tan et al., 2017). For instance, coal combustion has gradually become the main source of Pb in PM2.5 after China began to phase out Pb-containing gasoline (Xu et al., 2012). Thus, PC3 was assigned to coal combustion. The MAC of this factor (MAC (880)coal) was 7.5 m2 g−1. This factor contributed 17 %–19 % of primary babs(λ), and its derived AAEcoal was 1.74 (Fig. S8), which is close to the AAE found for coal chunks (Sun et al., 2017).
The last factor (PC4) was most heavily loaded with Al (68 %), Si (76 %), Ca (65 %), Fe (51 %), and Sr (71 %). These elements are typical crustal elements, and they are abundant in mineral dust (Tao et al., 2016, 2017). Minor amounts of EC in crustal dust could be from other EC that had deposited on the ground and was later resuspended together with the dust by natural or artificial disturbances (e.g., wind and traffic flow). This factor only contributed ∼ 4 % of the primary babs(λ). The estimated AAEdust was 1.78 (Fig. S8), which is close to the AAE of mineral dust reported in previous studies (AAE 1.82, Yang et al., 2009).
As elaborated above, the PM2.5 EC over Baoji was mainly from diesel vehicular emissions, biomass burning, and coal combustion. The emissions can be further grouped into those from biomass burning and fossil fuel combustion (the sum of diesel vehicular emissions and coal combustion). Thus, the AAEfossil (1.26) and MAC (880)fossil (7.1 m2 g−1) were calculated as the mass-weighted averages (relative to the total EC) of AAEcoal (MAC (880)coal) and AAEdiesel (MAC (880)diesel) (Table S4). The hourly mass concentrations of eBCfossil and eBCbiomass were then calculated using the aethalometer model (Eqs. 5–10). The results showed that eBCfossil and eBCbiomass were only weakly correlated (r=0.3, Fig. S9), indicating a reasonably good separation, and, furthermore, their diel variations showed different patterns (Fig. 2).
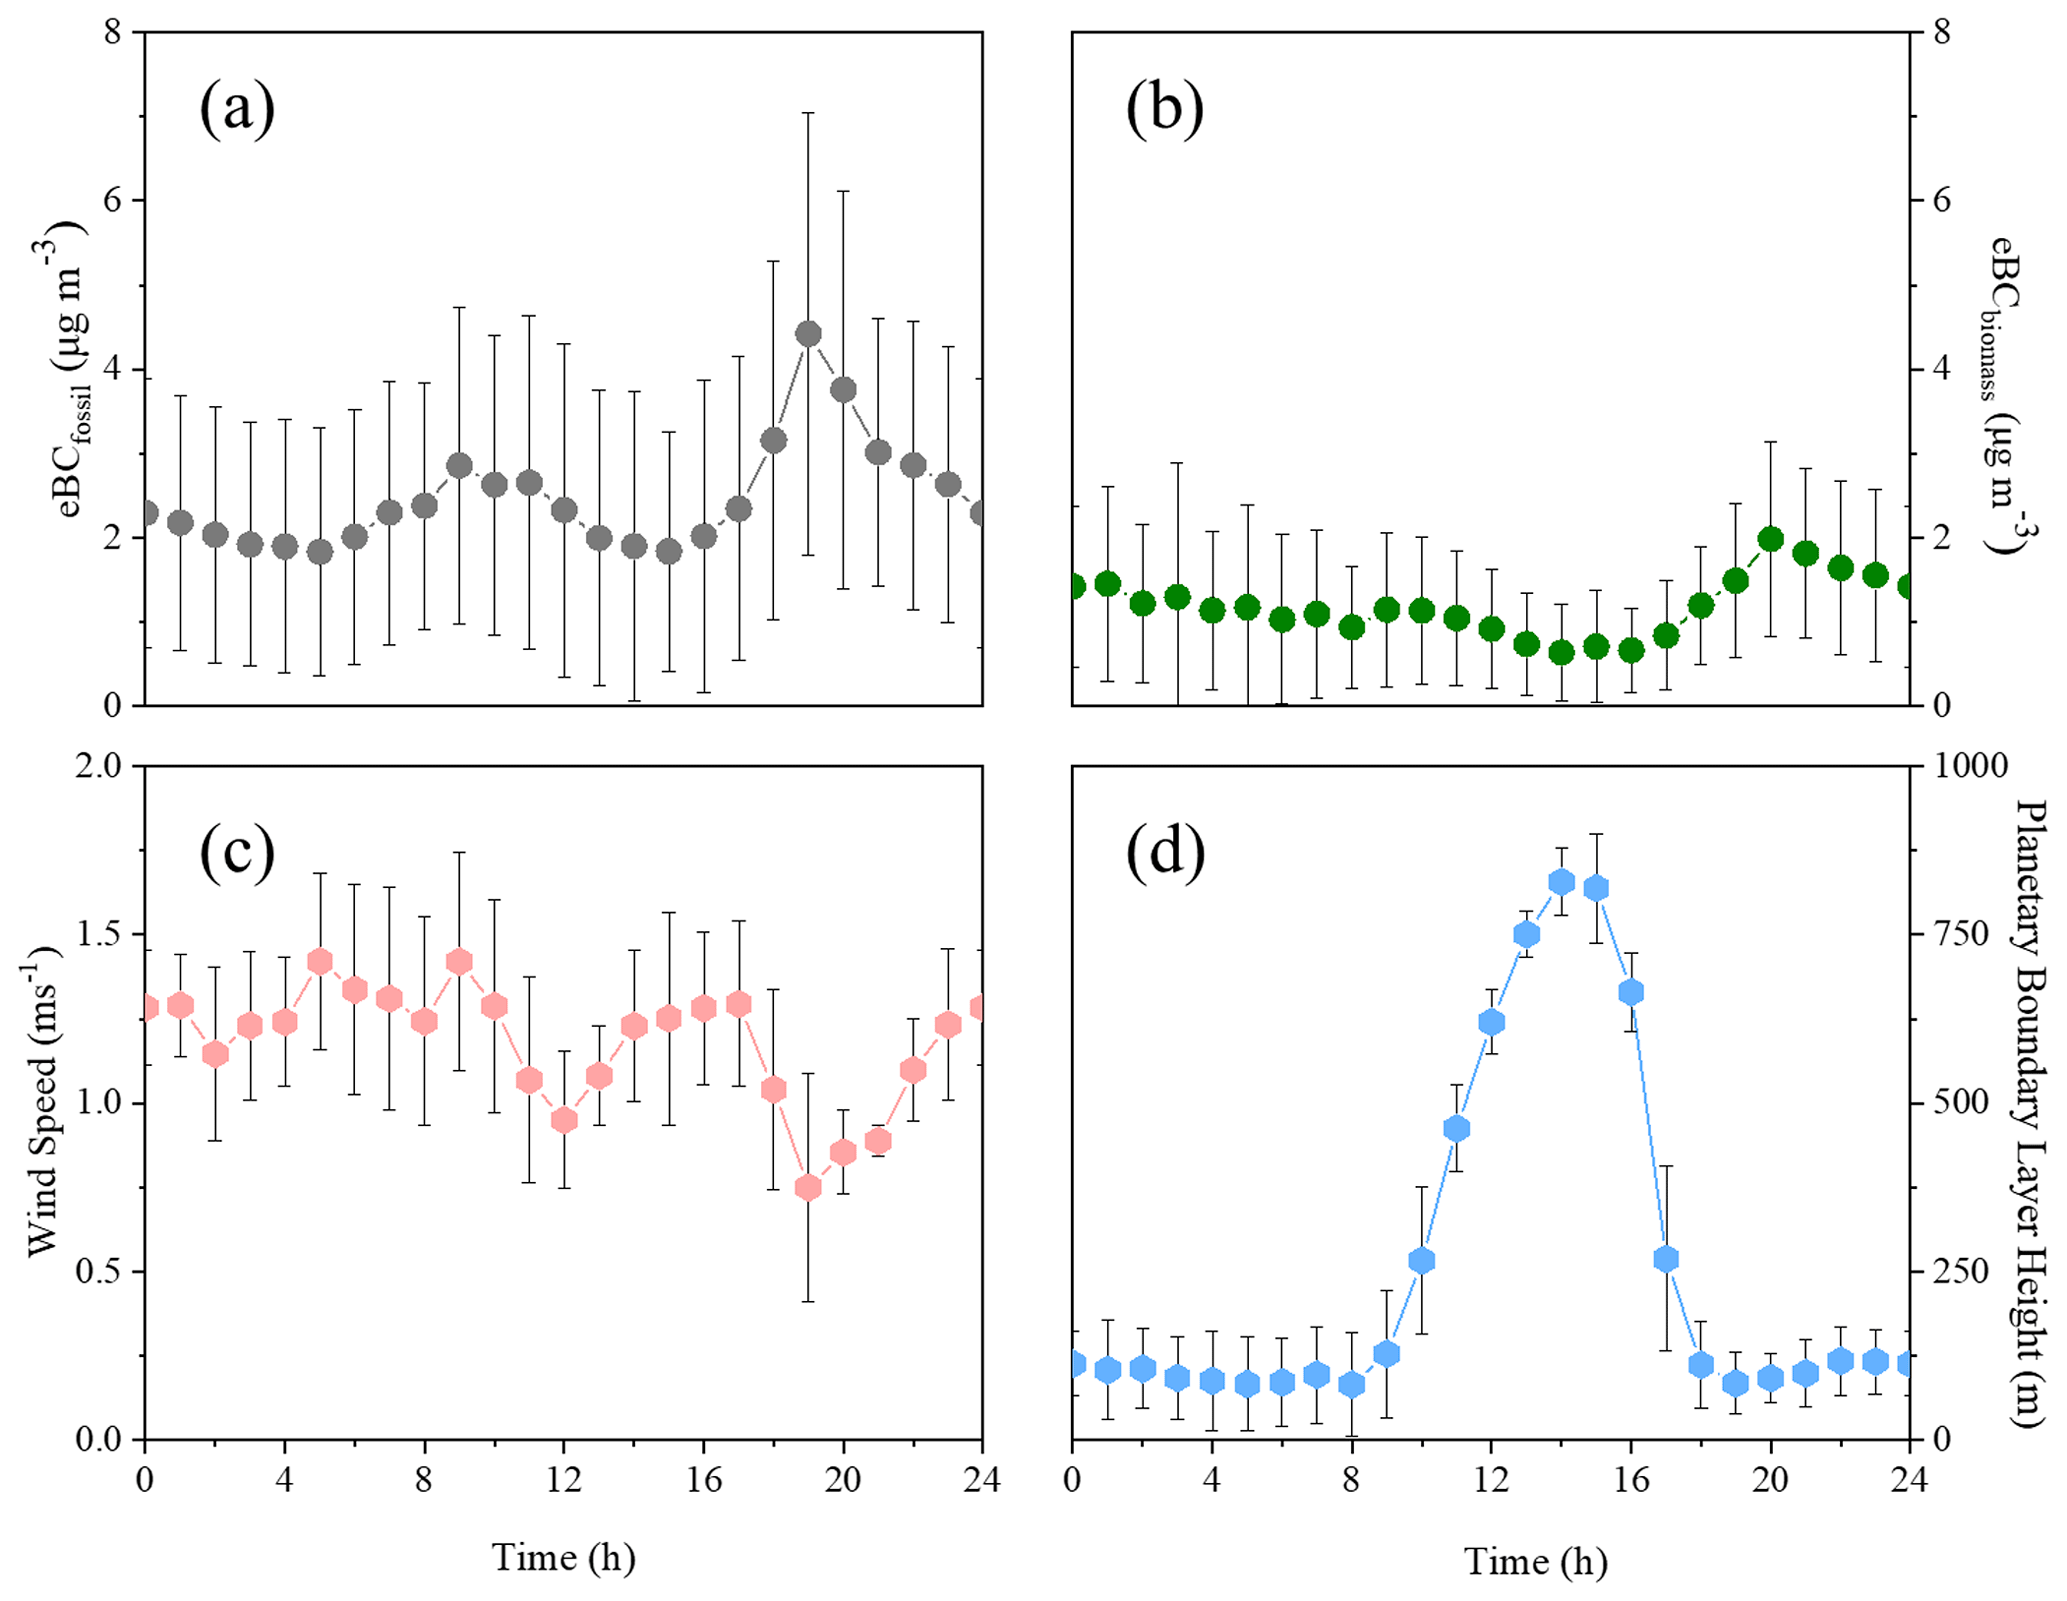
Figure 2(a) Diel variations of the eBC from fossil fuel combustion (eBCfossil) and (b) the eBC from biomass burning (eBCbiomass), (c) wind speed (m s−1), and (d) planetary boundary layer height (m). The black bars of each hourly-averaged point show the standard deviation.
The mean values of eBCfossil and eBCbiomass were 2.46 µg m−3 and 1.17 µg m−3, respectively. The averaged total eBC mass concentration (± standard deviation) was 3.63 ± 2.73 µg m−3, and the eBC ranged from 0.39 to 12.73 µg m−3 during the study period. The averaged mass concentration was comparable with that in Lanzhou, another river-valley city in China that was sampled in the same season (5.1 ± 2.1, Zhao et al., 2019). The lowest value is comparable with other river-valley regions such as in Retje in India (Glojek et al., 2022) or in the Urumqi River valley in China (Zhang et al., 2020); however, even the highest concentration was much lower than that in other urban regions (Table S5).
The diel variations of eBCfossil (Fig. 2a) showed a bimodal pattern with two peaks at 09:00 and 19:00 local time, which are typical peak commuting hours, indicating that there were strong influences from traffic emissions. Due to the reduced traffic flow from 01:00 to 05:00, eBCfossil decreased slowly. After 05:00 passenger vehicles were allowed on the highways in and near Baoji, and eBCfossil started to rise, probably in response to the increased traffic emissions. As the morning commuter traffic increased, eBCfossil reached its first peak at 09:00. From then until 11:00, eBCfossil declined only slightly because the wind speeds decreased (Fig. 2c), which offset the effects of the decreases in traffic. From 11:00 to 15:00, the increases in the height of the planetary boundary layer (PBLH) (Fig. 2d) led to a rapid decrease in eBCfossil. Later the PBLH decreased rapidly, resulting in conditions unfavorable for dispersion, and then eBCfossil rose quickly to the second peak at 19:00. After passing the evening peak in traffic, the eBCfossil decreased dramatically.
In contrast, the diel variation of eBCbiomass (Fig. 2b) showed greater influences from meteorological conditions during the daytime, and eBCbiomass showed lower concentrations during the day compared with the night. After 18:00, increased biomass burning from cooking and residential heating led to the emission of more eBCbiomass, and the stable PBLH hindered the dispersion of eBCbiomass. These two factors caused the eBCbiomass to reach its peak at 20:00. At night, the downslope winds from the mountains converged in the valley at nighttime (Oke, 2002) and turned easterly, where the land altitude is lower than at Baoji (Zhao et al., 2015). This led to relatively strong winds (Fig. 2c), favored dispersion, and caused the measured eBCbiomass pollutant levels to decrease.
3.2 The influence of regional and local atmospheric motion on eBCfossil and eBCbiomass
The K-means results showed that the four-category solution was appropriate for interpretation, as explained above (see also Fig. S10). Thus a 2 × 2 map size was used for the SOM. The four featured atmospheric motion categories given by the SOM (Fig. S11) were identified as follows (feature values are in Table 1).
-
Local-scale dominance (LD). This category featured high Rbj and Rstd. As described in Sect. 2.5, high Rstd indicates greater divergence of R at the 12 stations due to the strong influence of local-scale turbulence and convection. Lbj and Sbj were shorter than 130 km, implying stagnation (Allwine and Whiteman, 1994).
-
Local-scale strong and regional-scale weak (LSRW). For this group, Lbj and Sbj were longer than those for LD, and Rstd was slightly lower than that in LD.
-
Local-scale weak and regional-scale strong (LWRS). As the values suggest, both Rbj and Rstd were lower than those in LD and LSRW, especially Rbj. This suggests the winds veered less frequently and the differences in R found in 12 stations were smaller than in the two situations above. This situation shows that the influence of the regional-scale motion was greater than that for the previous two categories.
-
Regional-scale dominance (RD). In this category, wind direction at the study site was nearly uniform (extremely low Rbj), suggesting good ventilation (Allwine and Whiteman, 1994). The differences among R found at the 12 stations were even smaller than for the LWRS group, implying a strong increased influence of regional-scale motions. Indeed, the influence of regional-scale motions far outweighed the local ones for this category, and therefore this group was considered to be dominated by strong regional-scale motions.
Table 1The mass concentration of eBC from fossil fuel combustion (eBCfossil) and eBC from biomass burning (eBCbiomass) associated with different clusters under four featured atmospheric motions.
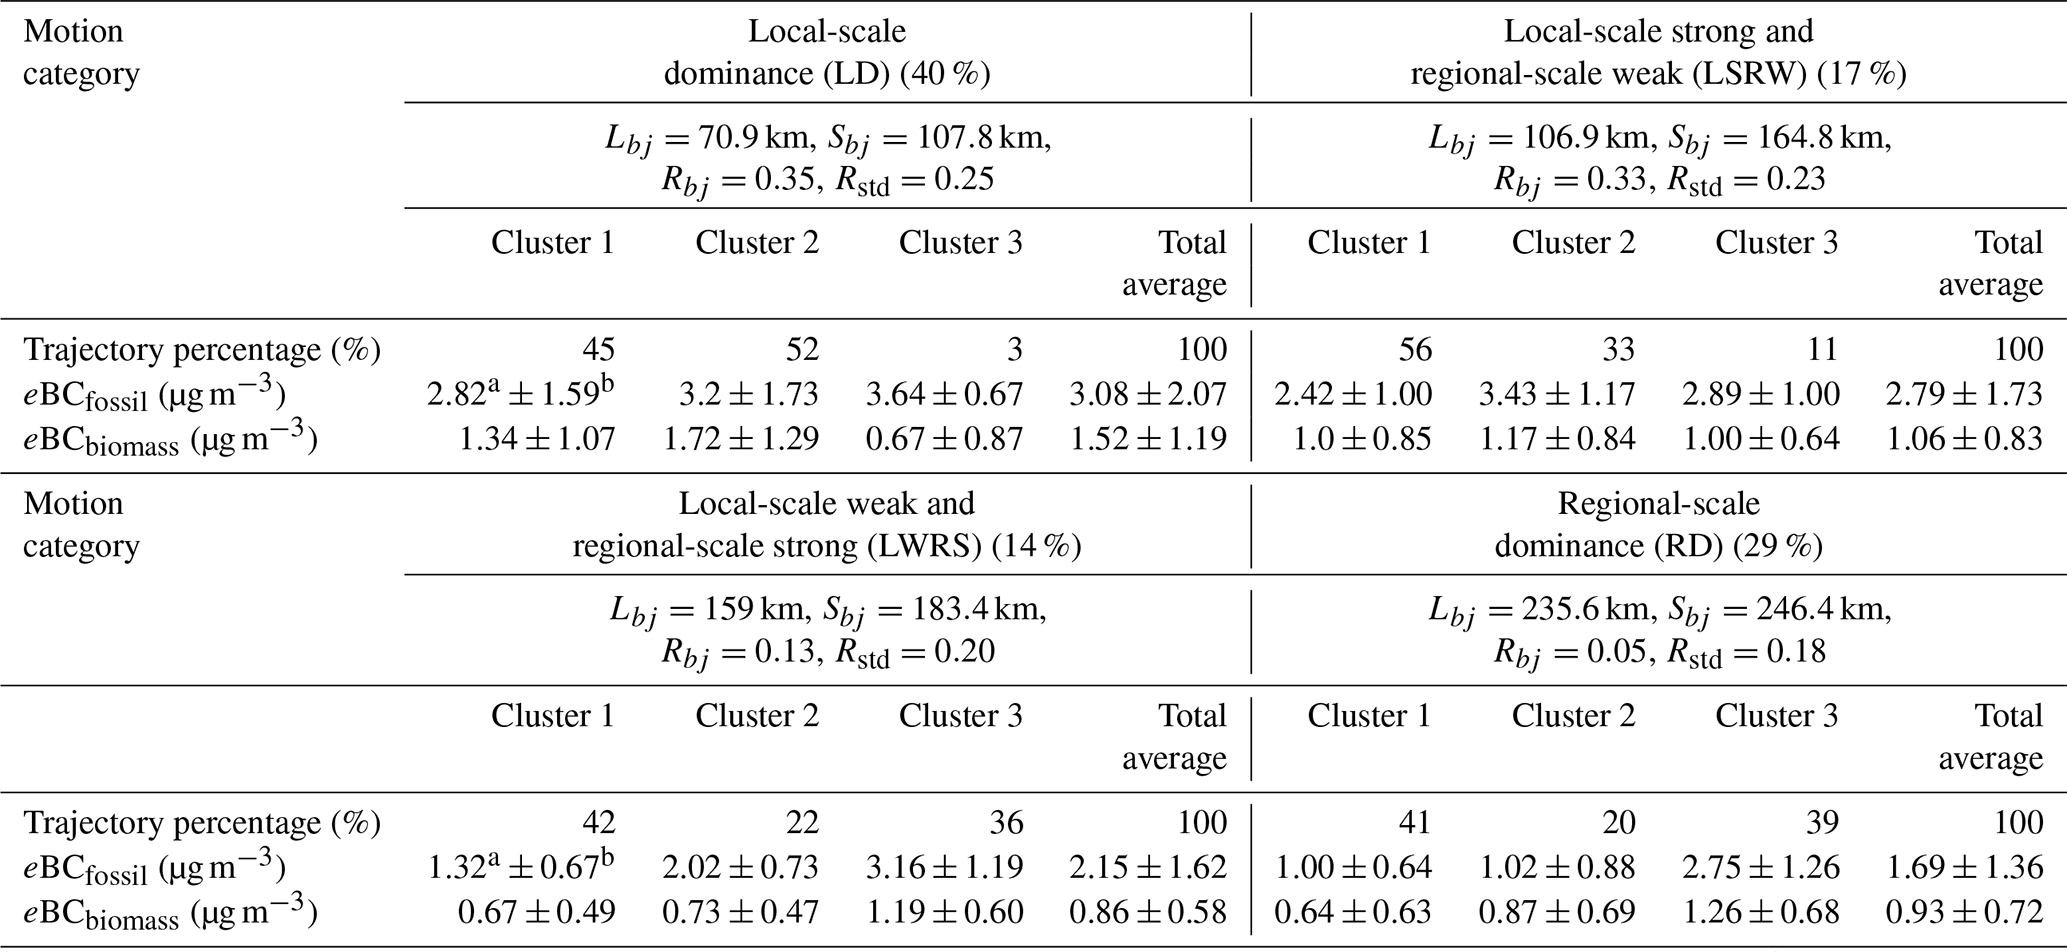
Lbj: resultant transport distance. Sbj: actual wind run distance at 100 m. Rbj: recirculation factor at 100 m. Rstd: standard deviation for the recirculation factor. a and b: mean ± standard deviation.
As shown in Table 1, the SOM classified 40 % of cases classified as LD, 29 % were classified into RD, and 17 % and 14 % were assigned to LSRW and LWRS, respectively. These results indicate that most winter days in Baoji were strongly influenced by local-scale motions. Under LD, the average mass concentrations of eBCfossil (3.08 ± 2.07 µg m−3) and eBCbiomass (1.52 ± 1.19 µg m−3) were the highest among all four of the atmospheric categories noted above, and over half (60 % for eBCbiomass and 55 % for eBCfossil) of the high values (75th to 100th percentiles) were found in this category (Fig. 3). In addition, as shown in Fig. 3, the vast majority of the high values are located in the zone indicating air stagnation (Sbj≤ 130 km, shaded yellow). One difference, that the 75th to 100th percentile eBCbiomass tended to cluster at Rbj≤ 0.2, indicates that, under LD circumstances, pollutants were likely coming from the same directions as where the main pollution sources were agglomerated, but eBCfossil, in contrast, evidently originated from more scattered locations (Rbj ≥ 0.4). Under LSRW, the averaged mass concentrations of eBCfossil and eBCbiomass were 2.79 ± 1.73 and 1.06 ± 0.83 µg m−3, respectively (Table 1), which were both lower than those for the LD situation. When the regional scale of motion became stronger (i.e., LWRS and RD), the average mass concentrations of eBCfossil (2.15 ± 1.62 and 1.69 ± 1.36 µg m−3) and eBCbiomass (0.86 ± 1.58 and 0.93 ± 0.72 µg m−3) were lower, presumably because strong winds cause the pollutants to mix with cleaner air. Interestingly, 19 % of the total 75th to 100th percentile eBCbiomass was found under RD, and 55 % of that was when ventilation was good (Sbj≥ 250 km, Rbj≤ 0.2, Fig. 3, shaded grey). These findings imply that the high mass concentrations of eBCbiomass were carried by regional-scale air flow to the site.
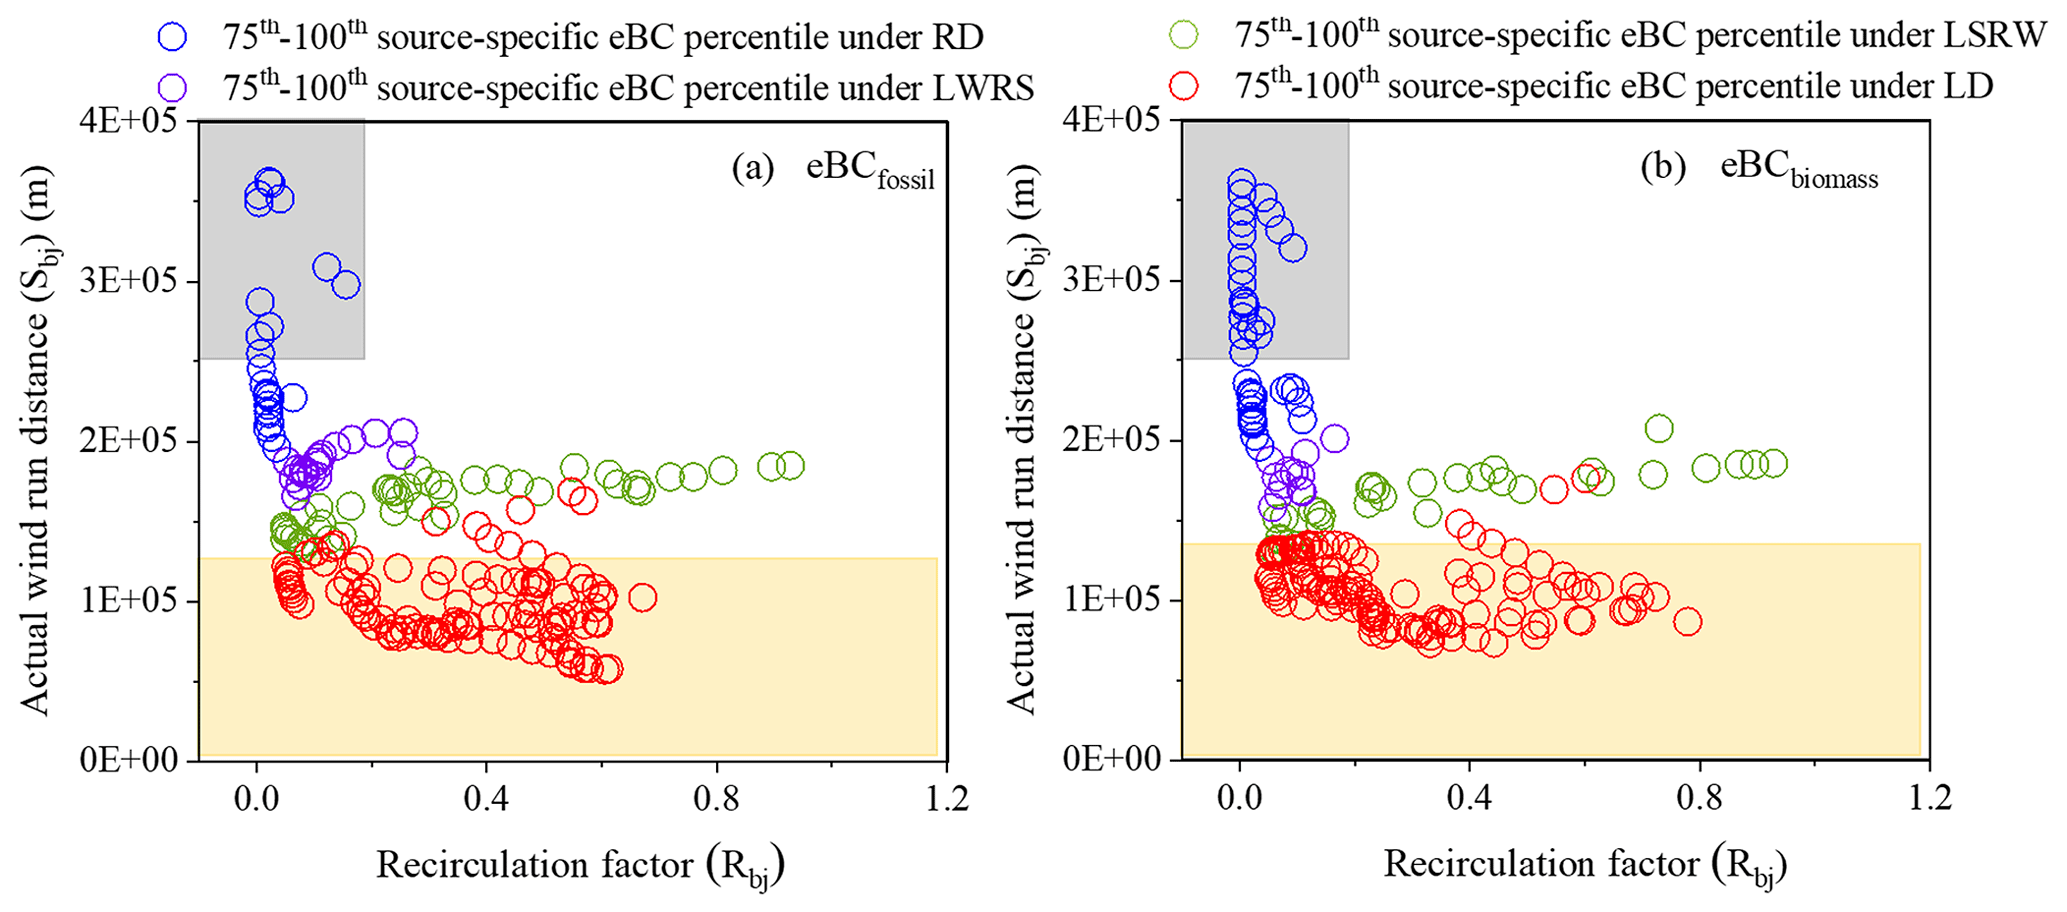
Figure 3(a) The 75th–100th percentile mass concentrations of the eBC from fossil fuel combustion (eBCfossil) and (b) the eBC from biomass burning (eBCbiomass) under local-scale dominance (LD, red circle), local-scale strong and regional-scale weak (LSRW, green circle), local-scale weak and regional-scale strong (LWRS, purple circle), and regional-scale dominance (RD, blue circle). Sbj is actual wind run distance at 100 m height, Rbj is the recirculation factor, the grey area indicates good ventilation (Sbj≥ 250 km, Rbj ≤ 0.2), and the yellow area indicates air stagnation (Sbj≤ 130 km).
Figure 4 portrays the mass concentrations of eBCfossil and eBCbiomass during the daytime and nighttime, respectively, under the four atmospheric motion categories specified earlier. As shown in Fig. 4a and c, the mean values of both types of source-specific eBC during the daytime were the highest (3.02 ± 2.12 µg m−3 and 1.15 ± 0.8 µg m−3) under LD and the lowest (1.36 ± 1.00 and 0.58 ± 0.53 µg m−3) under RD. Meanwhile, the average mass concentrations of both types of eBC decreased when the influences of the regional scale of atmospheric motion were getting stronger. This suggests that eBC pollution was apt to accumulate under the dominance of local-scale motions and dispersed under the dominance of regional-scale motions during the daytime. Similarly to the variations in the daytime, the mean values of eBCfossil (3.00 ± 2.04 µg m−3) and eBCbiomass (1.76 ± 1.33 µg m−3) under LD were also the highest during the night. However, unlike eBCfossil, the mass concentrations of eBCbiomass did not decrease when the influence of regional-scale atmospheric motions was stronger (Fig. S12). The mean value of eBCbiomass under RD was the second highest (1.17 ± 0.73 µg m−3). The nocturnal PBLH was higher than 100 m (Fig. S13) for the RD group, and therefore the high nocturnal eBCbiomass may have been caused by the eBCbiomass transported to the site from upwind regions.
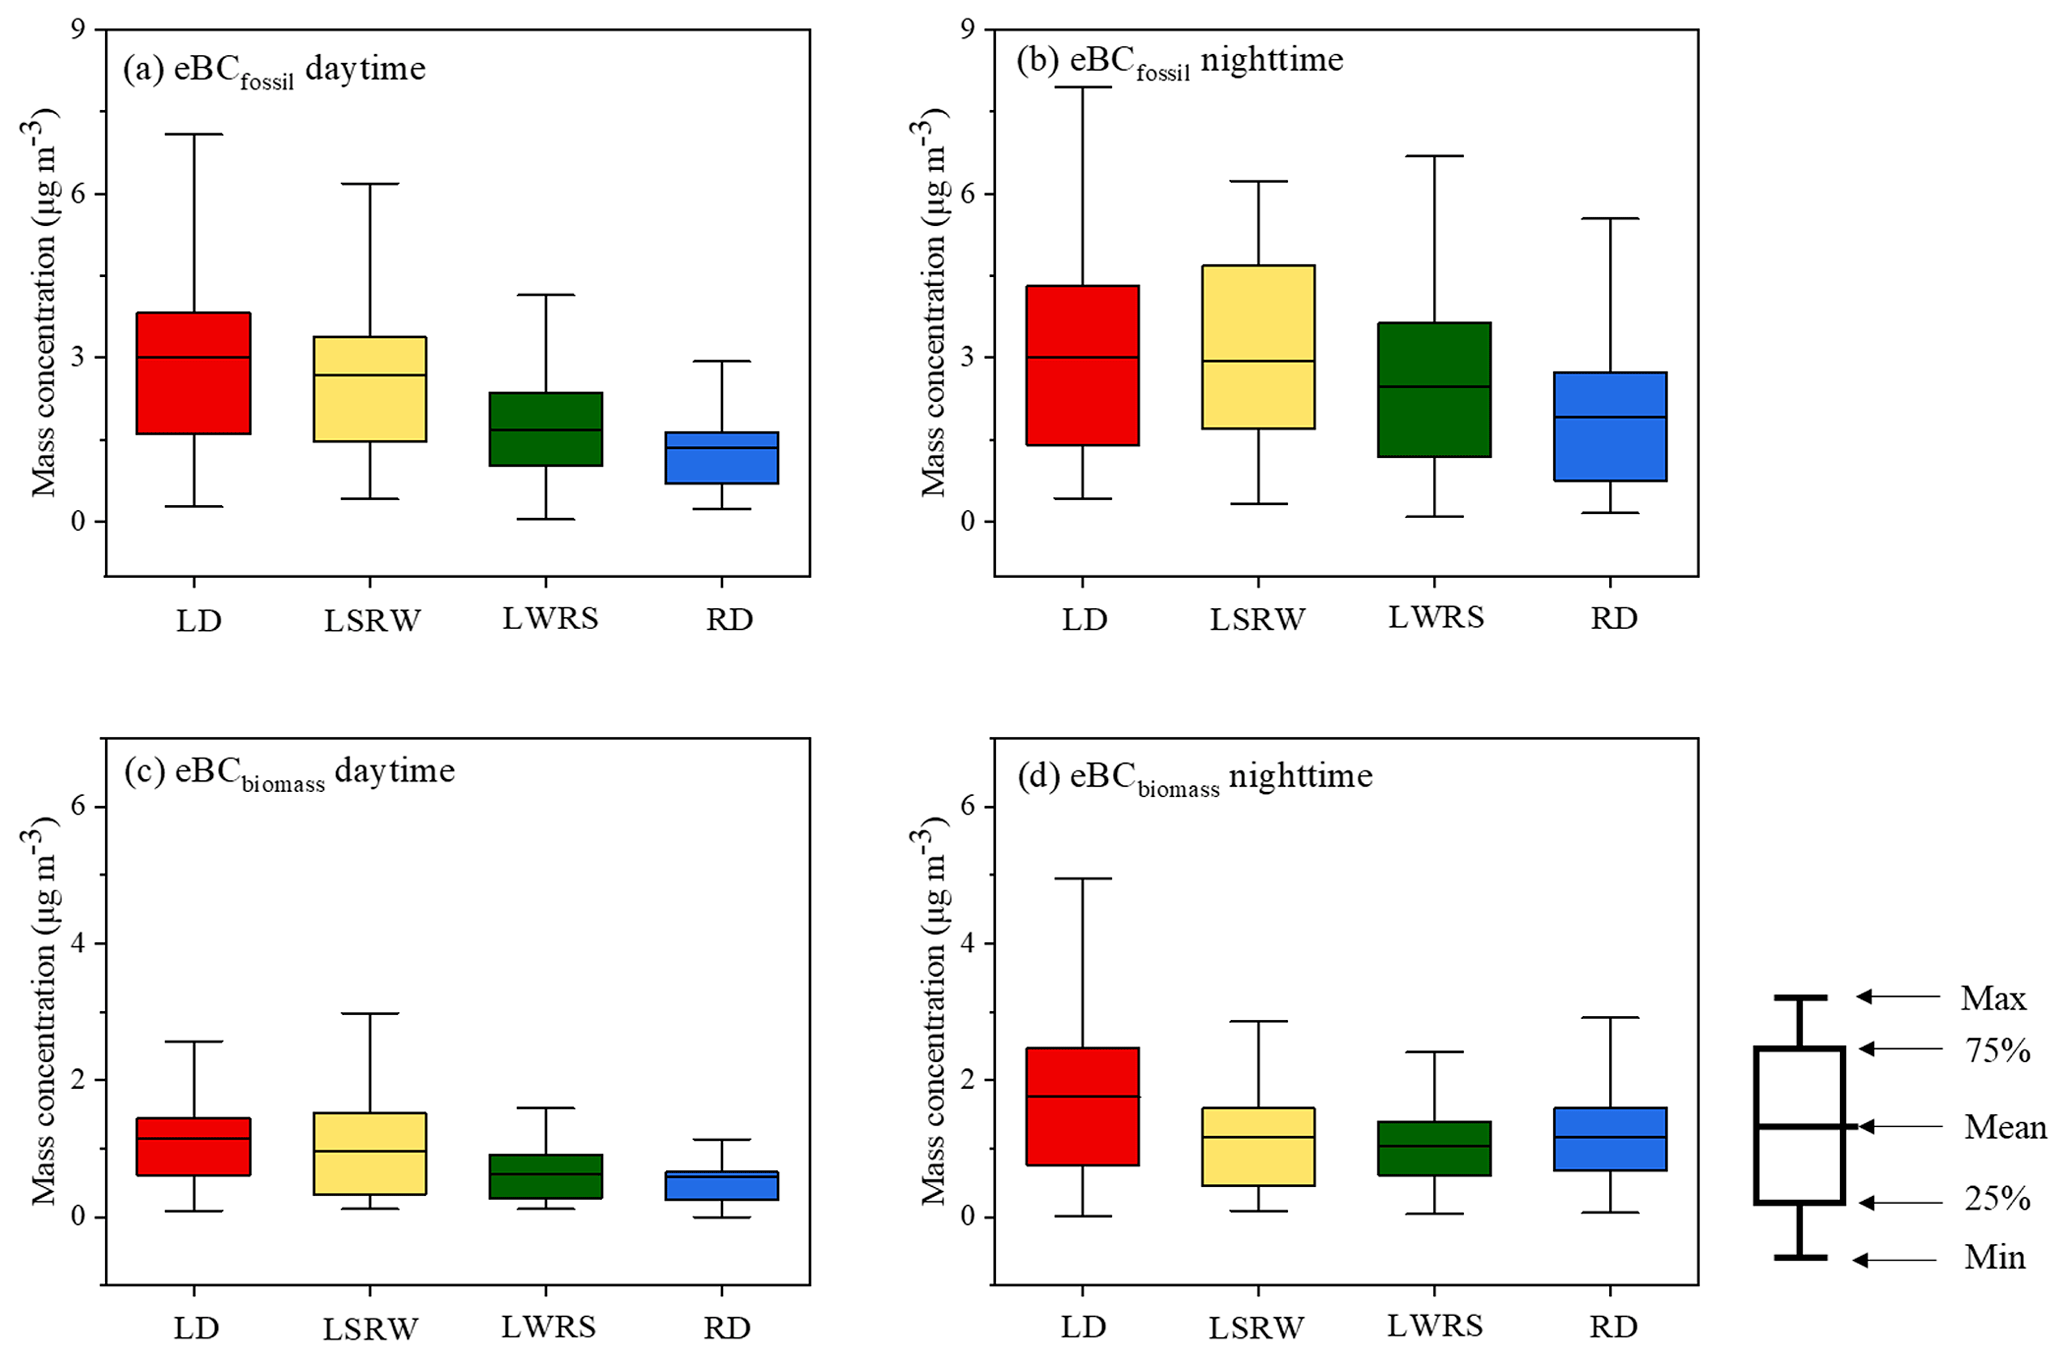
Figure 4Mass concentrations of the eBC from fossil fuel combustion (eBCfossil) and the eBC from biomass burning (eBCbiomass) during daytime (a, c) and nighttime (b, d) under LD, LSRW, LWRS, and RD.
3.3 Impacts of air mass directions
Atmospheric motions can not only cause the dispersal of pollution, but can also bring polluted air to the site from distant sources. Indeed, air mass movements can mean the difference between no pollution and severe pollution at a receptor site. To examine the impacts caused by air masses from different directions, the hourly 24 h back-trajectories were calculated at 100 m a.g.l. using the Hybrid Single-Particle Lagrangian Integrated Trajectory model (Draxler and Hess, 1998, Text S2). Then the trajectories were clustered by using an angle-based distance statistics method (Text S2) to show the general directional features. This method determines the direction from which the air masses reach the site and has been widely used for air mass trajectory clusters. A detailed method description can be found in Sirois and Bottenheim (1995). Three air mass trajectory clusters were identified (Fig. S14), 45 % of the total trajectories associated with Cluster 1, which originated from the north. Cluster 2 accounted for 36 % of the trajectories, and those were from the easterly direction, while Cluster 3 comprised 19 % of the total trajectories and displayed origins from the southwest.
Hourly trajectories were assigned to the four featured atmospheric motions. The varying concentrations of the source-specific eBC associated with different clusters indicate the divergent impacts of air mass direction on the pollution level at the sampling site. As shown in Table 1, LD was mainly connected with the air masses from Cluster 2 (52 %) and Cluster 1 (45 %). The average mass concentrations of eBCfossil and eBCbiomass associated with Cluster 1 were 2.82 ± 1.59 and 1.34 ± 1.07 µg m−3. In comparison, Cluster 2 was associated with a higher mean eBCfossil (3.2 ± 1.73 µg m−3) and the highest mean eBCbiomass (1.72 ± 1.29 µg m−3) of the three clusters. This could be attributed to more intensive emissions in the eastern parts of Baoji because 75 % of the total population of Baoji is located in this area (http://tjj.baoji.gov.cn/art/2020/10/15/art_9233_1216737.html, last access: 25 September 2021, in Chinese). Several highways and railways are located in the south and southwest of Baoji, but the population is sparse, with only ∼ 4 % of the total population residing in those areas. Thus, Cluster 3 was associated with the highest mean eBCfossil concentration (3.64 ± 0.67 µg m−3) but the lowest mean eBCbiomass (0.67 ± 0.87 µg m−3). It is important to point out, however, that only 3 % of the total trajectories came from this cluster.
Under LSRW, 56 % of the trajectories were from Cluster 1, 33 % from Cluster 2, and 11 % from Cluster 3. Although the total averaged mass concentrations (Table 1) of two types of eBC generally showed that the regional-scale motions favored dissipation of eBC compared with LD, the eBCfossil (3.43 ± 1.17 µg m−3) associated with Cluster 2 and eBCbiomass associated with Cluster 3 (1 ± 0.64 µg m−3) were higher by 0.23 and 0.33 µg m−3, respectively, relative to the LD case. The rise in eBCfossil associated with Cluster 2 was possibly caused by the enhanced regional influence of pollutants brought from adjacent regions. According to previous studies (Wang et al., 2016; Xu et al., 2016), severe BC pollution in winter is caused by fossil fuel combustion in Xi'an, which is to the east of Baoji. Studies have also reported that high EC emitted from biomass burning was found to have originated from Sichuan Province (Wu et al., 2020; Cai et al., 2018; Huang et al., 2020), which is to the southwest of Baoji. Combined with the phenomenon that the mass concentration of eBCbiomass associated with Cluster 3 rose with regional scales of motion, it is reasonable to conclude that the increase in eBCbiomass associated with Cluster 3 was likely influenced by pollution transport from the southwest.
Under LWRS, 42 % of the trajectories were from Cluster 1, 36 % from Cluster 3, and 22 % from Cluster 2. With stronger regional scales of motion, the mean values of eBCfossil and eBCbiomass associated with all clusters were lower than those under LD, except for eBCbiomass associated with Cluster 3, which increased by 0.52 µg m−3. As mentioned before, this increase could have been caused by regional transport.
In the last category (RD), 41 % of the trajectories were from Cluster 1, 39 % from Cluster 3, and 20 % from Cluster 2. Similarly to the results for LWRS, the average mass concentrations of eBCfossil and eBCbiomass associated with Cluster 1 were only 35 % and 48 % of the respective values for LD. The average mass concentrations of eBCfossil and eBCbiomass associated with Cluster 2 were 32 % and 51 % of the eBCfossil and eBCbiomass under LD. As for Cluster 3, the average mass concentration of eBCfossil associated with this cluster was also the lowest of all the clusters. However, interestingly, the mean value of eBCbiomass associated with Cluster 3 was highest compared with other categories of Cluster 3. Under strong influences of a regional scale of motions, the value of eBCbiomass was 1.9 times as high as that under LD.
3.4 Radiative effects
Figure 5a shows the DREs at the top of the atmosphere (DREeBC, TOA), surface (DREeBC, SUF), and the whole atmosphere (DREeBC, ATM) of eBCfossil and eBCbiomass. The DREeBC, TOA and DREeBC, SUF of eBC were 13 and −22.9 W m−2, which were lower than that reported in Lanzhou (21.8 and −47.5 W m−2 for DREeBC, TOA and DREeBC, SUF), which is another river-valley city in China (Zhao et al., 2019). This could be due to the fact that the eBC mass concentration in Baoji was lower than in Lanzhou (Table S5). As for the DREeBC, TOA and DREeBC, SUF per unit mass of BC, the results of the two studies were comparable. The DREeBC, TOA of eBCfossil (DREeBCfossil, TOA) and eBCbiomass (DREeBCbiomass, TOA) were 9.4 ± 7.5 and 3.6 ± 3.4 W m−2, indicating a warming effect at the top of the atmosphere. The DREeBC, SUF of eBCfossil (DREeBCfossil, SUF) and eBCbiomass(DREeBCbiomass, SUF) were −16.5 ± 13.5 and −6.4 ± 6.2 W m−2, showing a cooling effect at the surface. The DREeBC, ATM of eBCfossil (DREeBCfossil, ATM) and eBCbiomass (DREeBCbiomass, ATM) were 25.9 ± 20.8 and 10 ± 9.5 W m−2 in the atmosphere, indicating a heating effect.

Figure 5Direct radiative effect (DRE) of the eBC from fossil fuel combustion (eBCfossil) shaded in grey and the eBC from biomass burning (eBCbiomass) shaded in yellow (a) at the top of the atmosphere (TOA), the surface (SUF), and the atmospheric column (ATM) and (b) DREeBC, ATM of two types of eBC under LD shaded in light grey, LSRW shaded in light blue, LWRS shaded in light grey, and RD shaded in light blue. (c) DRE efficiencies of eBCbiomass (shaded in yellow) and eBCfossil (shaded by grey) in TOA, SUF, and ATM. (d) DRE efficiencies of eBCbiomass and eBCfossil at the ATM under LD (shaded in light grey), LSRW (shaded in light blue), LWRS (shaded in light grey), and RD (shaded in light blue).
Figure 5 also shows the DREeBC, ATM of the source-specific eBC for different atmospheric motions. In general, the changes in DREeBC, ATM are in accordance with those of the eBC mass concentrations. The DREeBCfossil, ATM under LD was the largest, with a mean value of 30.4 ± 23 W m−2, followed by LSRW (28.7 ± 20.7 W m−2). As the mass concentration of eBCfossil was low when regional scales of motion were stronger, the DREeBC, ATM values under LWRS and RD were also lower compared with those under LD or LSRW. By contrast, the DREeBC, ATM of eBCbiomass under LSRW was the highest (11.5 ± 11.8 W m−2), but it is only 0.3 W m−2 higher than that under LD. When the regional scale of motions became stronger, the DREeBCbiomass, ATM declined as expected due to the lower eBCbiomass mass concentrations (Fig. 4c). The DREeBC, ATM values of eBCbiomass under LWRS and RD were 8.6 ± 8.5 and 7.9 ± 7.4 W m−2, respectively.
Although DREeBC, ATM declined with increased influences from the regional scale of motion, the DREeBC, ATM efficiency (DREeBC, ATM per mass concentration) was found to increase with greater regional-scale motion. Furthermore, the DRE efficiencies of both types of eBC under LD and LSRW were comparable, around 10 W m−2 (Table 2). In contrast, the efficiencies varied more when the regional-scale motions were stronger. Under LWRS, the efficiencies of eBCfossil and eBCbiomass were 13.5 ± 6.7 and 14.7 ± 8.1 (W m−2)/(µg m−3), respectively. Under RD, the efficiencies were even higher, 15.6 ± 8.9 (W m−2)/(µg m−3) for eBCfossil and 15.5 ± 8.4 (W m−2)/(µg m−3) for eBCbiomass, which are >1.5 times those recorded under LD. The higher eBC efficiencies may have been caused by the increases in the BC MAC during the regional transport. Studies have confirmed that the aging processes in the atmosphere can enhance the light-absorbing ability of BC (Chen et al., 2017; Shen et al., 2014), and regional transport can provide sufficient time for BC aging (Shiraiwa et al., 2007; Cho et al., 2021). Therefore, the nonlinear change between mass concentration and DRE efficiency was very likely caused by the strong regional-scale motions that dispersed fresh BC from local emissions but also brought aged BC to the area from the upwind regions. As a result, under these conditions, the transported BC reached a receptor site with a higher light-absorbing ability, which led to a higher DRE efficiency of BC at the sampling site. This strongly implies that regionally transported BC can greatly perturb climate, particularly in the river-valley city in our study, where dispersion was weak (Zhao et al., 2015; Wang et al., 2013).
Table 2Direct radiative forcing efficiencies for equivalent black carbon (eBC) from fossil fuel combustion (eBCfossil) and the eBC from biomass burning (eBCbiomass) under four atmospheric motion categories.

a and b: mean ± standard deviation.
This study derived site-specific AAEs using a PMF model for which chemical and optical data collected from a river-valley city during winter were used as the inputs. Based on the calculated AAEs, source-specific eBC (i.e., eBCfossil and eBCbiomass) was then apportioned using an aethalometer model. Finally, the impacts of different scales of atmospheric motions on the mass concentrations of the source-specific eBC and the induced DREs were investigated. Four sources of eBC were identified: diesel vehicular emissions, biomass burning, coal combustion, and mineral dust. The derived AAEs were 1.07 for diesel vehicular emissions, 2.13 for biomass burning, 1.74 for coal combustion, and 1.78 for mineral dust. The mean values of eBCfossil and eBCbiomass were 2.46 and 1.17 µg m−3, respectively.
The self-organizing map indicated that there were four types of atmospheric motions during the sampling period that affected the mass concentrations of source-specific eBC. Of these, the local-scale motions were the main influence on most winter days. The eBCfossil and eBCbiomass under those identified atmospheric motions showed that over half of the 75th to 100th percentile values for the entire data set were found in the LD group (60 % for eBCbiomass and 55 % for eBCfossil). This illustrates that the BC pollution was more severe under the influences of local-scale motion outweighing regional-scale motions. However, even though regional-scale motions were associated with lower eBC, 19 % of the high values of eBCbiomass occurred under RD, especially when there was good ventilation. Furthermore, the air masses from different directions also had impacts on the source-specific eBC that varied relative to the different atmospheric motions. eBCfossil most likely accumulated under the influence of strong local-scale motions, but eBCbiomass was also found to be increased with the enhanced regional scale of motions of the air masses from the southwest; this indicates that there were impacts from regional transport.
Similarly to the mass concentrations, the DREs of the two types of eBC were both lower when the regional scales of motions were greater than the local ones. However, the changes in mass concentrations and DREs were not proportionate because the regional scale of motions carried the fresh BC away from the local site but brought the aged BCs to the site from the upwind regions. As a result, the DRE efficiency of eBC was ∼ 1.5 times higher when the regional scale of motion was stronger. This study showed that different scales of air motions affected the mass concentrations of source-specific eBC and its DRE efficiencies. More specifically, our study highlights the importance of regional transport for the BC radiative forcing and shows how the enhancement of BC radiative effects caused by aging during regional transport could have especially significant implications for sites in river valleys. The relationships between BC and atmospheric scales of motion should be evaluated for other environments besides river-valley cities because quantitative information on the relative importance of locally emitted versus regionally transported materials will be useful for developing pollution controls and for predicting future changes in climate.
The data are available from the authors upon request.
The supplement related to this article is available online at: https://doi.org/10.5194/acp-22-11739-2022-supplement.
QW and JC designed the study. BZ and SL conducted the field measurements. YQ and JT conducted the data analysis. SL and TZ performed the chemical analysis of filters. HL drafted the article, and QW revised it. JC and YH commented on the paper.
The contact author has declared that none of the authors has any competing interests.
Publisher's note: Copernicus Publications remains neutral with regard to jurisdictional claims in published maps and institutional affiliations.
The authors are grateful to the editor and two anonymous referees for their helpful comments.
This research has been supported by the National Natural Science Foundation of China (grant no. 42192512), the Key Research and Development Program of Shaanxi Province (grant no. 2018-ZDXM3-01), the Key Project of the Chinese Academy of Sciences (grant no. ZDRW-ZS-2017-6), and the Youth Innovation Promotion Association of the Chinese Academy of Sciences (grant no. 2019402).
This paper was edited by Stefania Gilardoni and reviewed by two anonymous referees.
Allwine, K. J. and Whiteman, C. D.: Single-station integral measures of atmospheric stagnation, recirculation and ventilation, Atmos. Environ., 28, 713–721, https://doi.org/10.1016/1352-2310(94)90048-5, 1994.
Amato, F., Alastuey, A., Karanasiou, A., Lucarelli, F., Nava, S., Calzolai, G., Severi, M., Becagli, S., Gianelle, V. L., Colombi, C., Alves, C., Custódio, D., Nunes, T., Cerqueira, M., Pio, C., Eleftheriadis, K., Diapouli, E., Reche, C., Minguillón, M. C., Manousakas, M.-I., Maggos, T., Vratolis, S., Harrison, R. M., and Querol, X.: AIRUSE-LIFE+: a harmonized PM speciation and source apportionment in five southern European cities, Atmos. Chem. Phys., 16, 3289–3309, https://doi.org/10.5194/acp-16-3289-2016, 2016.
Artaxo, P., Fernandas, E. T., Martins, J. V., Yamasoe, M. A., Maenhaut, W., Longo, K. M., Castanho, A., and Hobbs, P. V.: Large-scale aerosol source apportionment in Amazonia, J. Geophys. Res.-Atmos., 103, 31837–31847, https://doi.org/10.1029/98jd02346, 1998.
Bei, N., Li, G., Huang, R.-J., Cao, J., Meng, N., Feng, T., Liu, S., Zhang, T., Zhang, Q., and Molina, L. T.: Typical synoptic situations and their impacts on the wintertime air pollution in the Guanzhong basin, China, Atmos. Chem. Phys., 16, 7373–7387, https://doi.org/10.5194/acp-16-7373-2016, 2016.
Bond, T. C., Doherty, S. J., Fahey, D. W., Forster, P. M., Berntsen, T., DeAngelo, B. J., Flanner, M. G., Ghan, S., Karcher, B., Koch, D., Kinne, S., Kondo, Y., Quinn, P. K., Sarofim, M. C., Schultz, M. G., Schulz, M., Venkataraman, C., Zhang, H., Zhang, S., Bellouin, N., Guttikunda, S. K., Hopke, P. K., Jacobson, M. Z., Kaiser, J. W., Klimont, Z., Lohmann, U., Schwarz, J. P., Shindell, D., Storelvmo, T., Warren, S. G., and Zender, C. S.: Bounding the role of black carbon in the climate system: A scientific assessment, J. Geophys. Res.-Atmos., 118, 5380–5552, https://doi.org/10.1002/jgrd.50171, 2013.
Brown, S. G., Eberly, S., Paatero, P., and Norris, G. A.: Methods for estimating uncertainty in PMF solutions: Examples with ambient air and water quality data and guidance on reporting PMF results, Sci. Total Environ., 518–519, 626–635, https://doi.org/10.1016/j.scitotenv.2015.01.022, 2015.
Brulfert, G., Chemel, C., Chaxel, E., Chollet, J., Jouve, B., and Villard, H.: Assessment of 2010 air quality in two Alpine valleys from modelling: weather type and emission scenarios, Atmos. Environ., 40, 7893–7907, https://doi.org/10.1016/j.atmosenv.2006.07.021, 2006.
Cai, S., Ma, Q., Wang, S., Zhao, B., Brauer, M., Cohen, A., Martin, R., Zhang, Q., Li, Q., Wang, Y., Hao, J., Frostad, J., Forouzanfar, M., and Burnett, R.: Impact of air pollution control policies on future PM2.5 concentrations and their source contributions in China, J. Environ. Manage., 227, 124–133, https://doi.org/10.1016/j.jenvman.2018.08.052, 2018.
Cao, J. J., Lee, S. C., Ho, K. F., Zhang, X. Y., Zou, S. C., Fung, K. K., Chow, J. C., and Watson, J. G.:Characteristics of carbonaceous aerosol in Pearl River Delta Region, China during 2001 winter period, Atmos. Environ., 37, 1451–1460, 2003.
Cao, J.-J., Zhu, C.-S., Tie, X.-X., Geng, F.-H., Xu, H.-M., Ho, S. S. H., Wang, G.-H., Han, Y.-M., and Ho, K.-F.: Characteristics and sources of carbonaceous aerosols from Shanghai, China, Atmos. Chem. Phys., 13, 803–817, https://doi.org/10.5194/acp-13-803-2013, 2013.
Cappa, C. D., Onasch, T. B., Massoli, P., Worsnop, D. R., Bates, T. S., Cross, E. S., Davidovits, P., Hakala, J., Hayden, K. L., Jobson, B. T., Kolesar, K. R., Lack, D. A., Lerner, B. M., Li, S.-M., Mellon, D., Nuaaman, I., Olfert, J. S., Petäjä, T., Quinn, P. K., Song, C., Subramanian, R., Williams, E. J., and Zaveri, R. A.: Radiative absorption enhancements due to the mixing state of atmospheric black carbon, Science, 337, 1078–1081, https://doi.org/10.1126/science.1223447, 2012.
Carvalho, A. C., Carvalho, A., Gelpi, I., Barreiro, M., Borrego, C., Miranda, A., and Perez-Munuzuri, V.: Influence of topography and land use on pollutants dispersion in the Atlantic coast of Iberian Peninsula, Atmos. Environ., 40, 3969–3982, https://doi.org/10.1016/j.atmosenv.2006.02.014, 2006.
Chang, F., Chang, L., Kang, C., Wang, Y., and Huang, A.: Explore spatio-temporal PM2.5 features in northern Taiwan using machine learning techniques, Sci. Total Environ., 736, 139656, https://doi.org/10.1016/j.scitotenv.2020.139656, 2020.
Cheng, Y., He, K.-B., Zheng, M., Duan, F.-K., Du, Z.-Y., Ma, Y.-L., Tan, J.-H., Yang, F.-M., Liu, J.-M., Zhang, X.-L., Weber, R. J., Bergin, M. H., and Russell, A. G.: Mass absorption efficiency of elemental carbon and water-soluble organic carbon in Beijing, China, Atmos. Chem. Phys., 11, 11497–11510, https://doi.org/10.5194/acp-11-11497-2011, 2011.
Chen, X., Wang, Z., Yu, F., Pan, X., Li, J., Ge, B., Wang, Z., Hu, M., Yang, W., and Chen, H.: Estimation of atmospheric aging time of black carbon particles in the polluted atmosphere over central-eastern China using microphysical process analysis in regional chemical transport model, Atmos. Environ., 163, 44–56, https://doi.org/10.1016/j.atmosenv.2017.05.016, 2017.
Cho, C., Schwarz, J., Perriing, A., Lamb, K., Kondo, Y., Park, J., Park, D., Shim, K., Park, J., Park, R., Lee, M., Song, C., and Kim, S.: Light-absorption enhancement of black carbon in the Asian outflow inferred from airborne SP2 and in-situ measurements during KORUS- AQ, Sci. Total Environ., 773, 145531, https://doi.org/10.1016/j.scitotenv.2021.145531, 2021.
Draxler, R. and Hess, G.: An overview of the HYSPLIT_4 modelling system for trajectories, Aust. Meteorol. Mag., 47, 295–308, 1998.
Drinovec, L., Močnik, G., Zotter, P., Prévôt, A. S. H., Ruckstuhl, C., Coz, E., Rupakheti, M., Sciare, J., Müller, T., Wiedensohler, A., and Hansen, A. D. A.: The “dual-spot” Aethalometer: an improved measurement of aerosol black carbon with real-time loading compensation, Atmos. Meas. Tech., 8, 1965–1979, https://doi.org/10.5194/amt-8-1965-2015, 2015
Dutton, J.: The ceaseless wind an introduction to the theory of atmospheric motion, McGraw-Hill, Inc., USA, ISBN:0-07-018407-0, 1976.
Geivanidis, S., Pistikopoulos, P., and Samaras, Z.: Effect on exhaust emissions by the use of methylcyclopentadienyl manganese tricarbonyl (MMT) fuel additive and other lead replacement gasolines, Sci. Total Environ., 305, 129–141, https://doi.org/10.1016/S0048-9697(02)00476-X, 2003.
Glojek, K., Močnik, G., Alas, H. D. C., Cuesta-Mosquera, A., Drinovec, L., Gregorič, A., Ogrin, M., Weinhold, K., Ježek, I., Müller, T., Rigler, M., Remškar, M., van Pinxteren, D., Herrmann, H., Ristorini, M., Merkel, M., Markelj, M., and Wiedensohler, A.: The impact of temperature inversions on black carbon and particle mass concentrations in a mountainous area, Atmos. Chem. Phys., 22, 5577–5601, https://doi.org/10.5194/acp-22-5577-2022, 2022.
Green, M., Chow, J., and Watson, G.: Effects of snow cover and atmospheric stability on winter PM2.5 concentrations in western U.S. valleys, J. Appl. Meteorol. Clim., 54, 1191–1201, https://doi.org/10.1175/JAMC-D-14-0191.1, 2016.
Han, H., Liu, J., Shu, L., Wang, T., and Yuan, H.: Local and synoptic meteorological influences on daily variability in summertime surface ozone in eastern China, Atmos. Chem. Phys., 20, 203–222, https://doi.org/10.5194/acp-20-203-2020, 2020.
He, C., Liou, K.-N., Takano, Y., Zhang, R., Levy Zamora, M., Yang, P., Li, Q., and Leung, L. R.: Variation of the radiative properties during black carbon aging: theoretical and experimental intercomparison, Atmos. Chem. Phys., 15, 11967–11980, https://doi.org/10.5194/acp-15-11967-2015, 2015.
Helin, A., Niemi, J. V., Virkkula, A., Pirjola, L., Teinilä, K., Backman, J., Aurela, M., Saarikoski, S., Rönkkö, T., Asmi, E., and Timonen, H.: Characteristics and source apportionment of black carbon in the Helsinki metropolitan area, Finland, Atmos. Environ., 190, 87–98, https://doi.org/10.1016/j.atmosenv.2018.07.022, 2018.
Hess, M., Koepke, P., and Schult, I.: Optical properties of aerosols and clouds: The software package OPAC, B. Am. Meteorol. Soc., 79, 831–844, https://doi.org/10.1175/1520-0477(1998)079<0831:Opoaac>2.0.Co;2, 1998.
Hewitson, B. C. and Crane, R. G.: Consensus between GCM climate change projections with empirical downscaling: precipitation downscaling over South Africa, Int. J. Climatol., 26, 1315–1337, https://doi.org/10.1002/joc.1314, 2006.
Hsu, C.-Y., Chiang, H.-C., Lin, S.-L., Chen, M.-J., Lin, T.-Y., and Chen, Y.-C.: Elemental characterization and source apportionment of PM10 and PM2.5 in the western coastal area of central Taiwan, Sci. Total Environ., 541, 1139–1150, https://doi.org/10.1016/j.scitotenv.2015.09.122, 2016.
Huang, Y., Zhang, L., Li, T., Chen, Y., and Yang, F.: Seasonal variation of carbonaceous species of PM2.5 in a small city in Sichuan Basin, China, Atmosphere, 11, 1286, https://doi.org/10.3390/atmos11121286, 2020.
IPCC: Climate Change 2021: The Physical Science Basis, contribution of working group i to the sixth assessment report of the intergovernmental panel on climate change, https://reliefweb.int/report/world/climate-change-2021-physical-science-basis (last access: 12 June 2022), 2021.
Jacobson, M. Z.: Control of fossil-fuel particulate black carbon and organic matter, possibly the most effective method of slowing global warming, J. Geophys. Res., 107, 4410, https://doi.org/10.1029/2001JD001376, 2002.
Jiang, N. B., Scorgie, Y., Hart, M., Riley, M. L., Crawford, J., Beggs, P. J., Edwards, G. C., Chang, L. S., Salter, D., and Virgilio, G. D.: Visualising the relationships between synoptic circulation type and air quality in Sydney, a subtropical coastal-basin environment, Int. J. Climatol., 37, 1211–1228, https://doi.org/10.1002/joc.4770, 2017.
Kahnert, M. and Kanngiesser, F.: Review: modelling optical properties of atmospheric black carbon aerosols, J. Quant. Spectrosc. Ra., 244, 106849, https://doi.org/10.1016/j.jqsrt.2020.106849, 2020.
Kalthoff, N., Horlacher, V., Corsmeier, U., Volz-Thomas, A., Kolahgar, B., Geiß, H., Möllmann-Coers, M., and Knaps, A.: Influence of valley winds on transport and dispersion of airborne pollutants in the Freiburg-Schauinsland area, J. Geophys. Res.-Atmos., 105, 1585–1597, https://doi.org/10.1029/1999jd900999, 2000.
Kangas, J. and Kohonen, T.: Developments and applications of the self-organizing map and related algorithms, Math. Comput. Simulat., 41, 3–12, https://doi.org/10.1016/0378-4754(96)88223-1, 1996.
Kant, Y., Shaik, D. S., Mitra, D., Chandola, H., Babu, S. S., and Chauhan, P.: Black carbon aerosol quantification over north-west himalayas: seasonal heterogeneity, source apportionment and radiative forcing, Environ. Pollut., 257, 113446, https://doi.org/10.1016/j.envpol.2019.113446, 2019.
Kirchstetter, T. W., Novakov, T., and Hobbs, P. V.: Evidence that the spectral dependence of light absorption by aerosols is affected by organic carbon, J. Geophys. Res.-Atmos., 109, D21208, https://doi.org/10.1029/2004jd004999, 2004.
Kohonen, T.: The self-organizing map, P. IEEE, 78, 1464–1480, https://doi.org/10.1109/5.58325, 1990.
Kohonen, T., Simula, O., Visa, A., and Kangas, J.: Engineering applications of the aelf-organizing map, P. IEEE, 84, 1358–1384, https://doi.org/10.1109/5.537105, 1996.
Levy, I., Dayan, U., and Mahrer, Y.: Differing atmospheric scales of motion and their impact on air pollutants, Int. J. Climatol., 30, 612–619, https://doi.org/10.1002/joc.1905, 2010.
Lewis, C. W., Norris, G. A., Conner, T. L., and Henry, R. C.: Source apportionment of Phoenix PM2.5 aerosol with the unmix receptor model, J. Air Waste Manage., 53, 325–338, https://doi.org/10.1080/10473289.2003.10466155, 2003.
Liao, Z., Xie, J., Fang, X., Wang, Y., Zhang, Y., Xu, X., and Fan, S.: Modulation of synoptic circulation to dry season PM2.5 pollution over the Pearl River Delta region: An investigation based on self-organizing maps. Atmos. Environ., 230, 117482, https://doi.org/10.1016/j.atmosenv.2020.117482, 2020.
Lin, Y.-C., Tsai, C.-J., Wu, Y.-C., Zhang, R., Chi, K.-H., Huang, Y.-T., Lin, S.-H., and Hsu, S.-C.: Characteristics of trace metals in traffic-derived particles in Hsuehshan Tunnel, Taiwan: size distribution, potential source, and fingerprinting metal ratio, Atmos. Chem. Phys., 15, 4117–4130, https://doi.org/10.5194/acp-15-4117-2015, 2015.
Liu, S., Gautam, A., Yang, X., Tao, J., Wang, X., and Zhao, W.: Analysis of improvement effect of PM2.5 and gaseous pollutants in Beijing based on self-organizing map network, Sustain. Cities Soc., 70, 102827, https://doi.org/10.1016/j.scs.2021.102827, 2021.
Manö, S. and Andreae, M. O.: Emission of methyl bromide from biomass burning, Science., 263, 1255–1257, https://doi.org/10.1126/science.263.5151.1255, 1994.
Manousakas, M., Papaefthymiou, H., Diapouli E., Migliori, A., Karydas, A. G., Bogdanovic-Radovic, I., and Eleftheriadis, K.: Assessment of PM2.5 sources and their corresponding level of uncertainty in a coastal urban area using EPA PMF 5.0 enhanced diagnostics, Sci. Total Environ., 574, 155–164, https://doi.org/10.1016/j.scitotenv.2016.09.047, 2017.
Norris, G., Duvall, R., Brown, S., and Bai, S.: EPA Positive Matrix Factorization (PMF) 5.0 fundamentals and user guide prepared for the US Environmental Protection Agency Office of 30 research and development, Washington, DC, by the National Exposure Research Laboratory, Research Triangle Park, Sonoma Technology, Inc., Petaluma, https://www.epa.gov/air-research/epa-positive-matrix-factorization-50-fundamentals-and-user-guide (last access: 10 January 2022), 2014.
Ochoa-Hueso, R., Munzi, S., Alonso, R., Arróniz-Crespo, M., Avila, A., Bermejo, V., Bobbink, R., Branquinho, C., Concostrina-Zubiri, L., Cruz, C., Cruz de Carvalho, R., De Marco, A., Dias, T., Elustondo, D., Elvira, S., Estébanez, B., Fusaro, L., Gerosa, G., Izquieta-Rojano ,S., Lo Cascio, M., Marzuoli, R., Matos, P., Mereu, S., Merino, J., Morillas, L., Nunes, A., Paoletti, E., Paoli, L., Pinho, P., Rogers, I.B., Santos, A., Sicard, P., Stevens, C. J., and Theobald, M. R.: Ecological impacts of atmospheric pollution and interactions with climate change in terrestrial ecosystems of the Mediterranean Basin: current research and future directions, Environ. Pollut., 227, 194–206, 2017.
Oke, T.: Boundary layer climates, 2nd edn., Taylor & Francis e-Library, ISBN: 0-203-40721-0, 2002.
Panicker, A. S., Pandithurai, G., Safai, P. D., Dipu, S., and Lee, D.-I.: On the contribution of black carbon to the composite aerosol radiative forcing over an urban environment, Atmos. Environ., 44, 3066–3070, https://doi.org/10.1016/j.atmosenv.2010.04.047, 2010.
Pathak, B., Kalita, G., Bhuyan, K., Bhuyan, P., and Moorthy, K.: Aerosol temporal characteristics and its impact on shortwave radiative forcing at a location in the northeast of India, J. Geophys. Res.-Atmos., 115, D19204, https://https://doi.org/10.1029/2009JD013462, 2010.
Pearce, J. L., Waller, L. A., Chang, H. H., Klein, M., Mulholland, J. A., Sarnat, J. A., Sarnat, S. E., Strickland, M. J., and Tolbert, P. E.: Using self-organizing maps to develop ambient air quality classifications: a time series example, Environ. Health-Glob., 13, 56, https://doi.org/10.1186/1476-069X-13-56, 2014.
Peng, J., Hu, M., Guo, S., Du, Z., Zheng, J., Shang, D., Levy, M., and Zeng, L.: Markedly enhanced absorption and direct radiative forcing of black carbon under polluted urban environments, P. Natl. Acad. Sci. USA, 113, 4266–4271, https://doi.org/10.1073/pnas.1602310113, 2016.
Rajesh, T. A. and Ramachandran, S.: Black carbon aerosols over urban and high altitude remote regions: characteristics and radiative implications, Atmos. Environ., 194, 110–122, https://doi.org/10.1016/j.atmosenv.2018.09.023, 2018.
Ramachandran, A., Rustum, R., and Adeloye, A.: Anaerobic digestion process modeling using Kohonen self-organising maps, Heliyon, 5, e01511, https://doi.org/10.1016/j.heliyon.2019.e01511, 2019.
Reusch, D. B., Alley, R. B., and Hewitson, B. C.: Relative performance of self-organizing maps and principal component analysis in pattern extraction from synthetic climatological data, Polar Geogr., 29, 188–212, https://doi.org/10.1080/789610199, 2005.
Ricchiazzi, P., Yang, S., Gautier, C., and Sowle, D.: SBDART: A research and teaching software tool for planeparallel radiative transfer in the earth’s atmosphere, B. Am. Meteorol. Soc., 79, 2101–2114, 1998.
Sandradewi, J., Prévôt, A. S. H., Weingartner, E., Schmidhauser, R., Gysel, M., and Baltensperger, U.: A study of wood burning and traffic aerosols in an Alpine valley using a multi-wavelength Aethalometer, Atmos. Environ., 42, 101–112, https://doi.org/10.1016/j.atmosenv.2007.09.034, 2008.
Schroter, D., Cramer, W., Leemans, R., Prentice, C., Araujo, M., Arnell, N., Bondeau, A., Bugmann, H., Carter, T., Gracia, C., de la Vega-Leinert, A., Erhard, M., Ewert, F., Glendining, M., House, J., Kankaanpaa, S., Klein, R., Lavorel, S., Lindner, M., Metzger, M., Meyer, J., Mitchell, T., Reginster, I., Rounsevell, M., Sabate, S., Sitch, S., Smith, B., Smith, J., Smith, P., Sykes, M., Thonicke, K., Thuiller, W., Tuck, G., Zaehle, S., and Zierl, B.: Ecosystem service supply and vulnerability to global change in Europe, Science, 310, 1333–1337, https://doi.org/10.1126/science.1115233, 2005.
Seinfeld, J. and Pandis, S.: Atmospheric chemistry and physics: from air pollution to climate change, 2nd edn., John Wiley & Sons, Inc., Hoboken, New Jersey, United States of America, ISBN-10: 0-471-72018-6, 2006.
Shen, Z., Liu, J., Horowitz, L. W., Henze, D. K., Fan, S., H., L. I., Mauzerall, D. L., Lin, J.-T., and Tao, S.: Analysis of transpacific transport of black carbon during HIPPO-3: implications for black carbon aging, Atmos. Chem. Phys., 14, 6315–6327, https://doi.org/10.5194/acp-14-6315-2014, 2014.
Shindell, D., Kuylenstierna, J. C. I., Vignati, E., van Dingenen, R., Amann, M., Klimont, Z., Anenberg, S. C., Muller, N., JanssensMaenhout, G., Raes, F., Schwartz, J., Faluvegi, G., Pozzoli, L., Kupiainen, K., Hoglund-Isaksson, L., Emberson, L., Streets, D., Ramanathan, V., Hicks, K., Oanh, N. T. K., Milly, G., Williams, M., Demkine, V., and Fowler, D.: Simultaneously mitigating near-term climate change and improving human health and food security, Science, 335, 183–189, https://doi.org/10.1126/science.1210026, 2012.
Shiraiwa, M., Kondo, Y., Moteki, N., Takegawa, N., Miyazaki, Y., and Blake, D. R.: Evolution of mixing state of black carbon in polluted air from Tokyo, Geophys. Res. Letters., 34, L16803, https://doi.org/10.1029/2007GL029819, 2007.
Sirois, A. and Bottenheim, J. W.: Use of backward trajectories to interpret the 5-year record of PAN and O3 ambient air concentrations at Kejimkujik National Park, Nova Scotia, J. Geophys. Res., 100, 2867–2881, https://doi.org/10.1029/94JD02951, 1995.
Song, Y., Zhang, Y., Xie, S., Zeng, L., Zheng, M., Salmon, L. G., Shao, M., and Slanina, S.: Source apportionment of PM2.5 in Beijing by positive matrix factorization, Atmos. Environ., 40, 1526–1537, https://doi.org/10.1016/j.atmosenv.2005.10.039, 2006.
Stauffer, R. M., Thompson, A. M., and Young, G. S.: Tropospheric ozonesonde profiles at long-term US monitoring sites: 1. A climatology based on self-organizing maps, J. Geophys. Res.-Atmos, 121, 1320–1339, https://doi.org/10.1002/2015JD023641, 2016.
Sun, J., Zhi, G., Hitzenberger, R., Chen, Y., Tian, C., Zhang, Y., Feng, Y., Cheng, M., Zhang, Y., Cai, J., Chen, F., Qiu, Y., Jiang, Z., Li, J., Zhang, G., and Mo, Y.: Emission factors and light absorption properties of brown carbon from household coal combustion in China, Atmos. Chem. Phys., 17, 4769–4780, https://doi.org/10.5194/acp-17-4769-2017, 2017.
Tan, J., Zhang, L., Zhou, X., Duan, J., Li, Y., Hu, J., and He, K.: Chemical characteristics and source apportionment of PM2.5 in Lanzhou, China, Sci. Total Environ., 601, 1743–1752, https://doi.org/10.1016/j.scitotenv.2017.06.050, 2017.
Tao, J., Zhang, L., Zhang, R., Wu, Y., Zhang, Z., Zhang, X., Tang, Y., Cao, J., and Zhang, Y.: Uncertainty assessment of source attribution of PM2.5 and its water-soluble organic carbon content using different biomass burning tracers in positive matrix factorization analysis – a case study in Beijing, China, Sci. Total Environ., 543, 326–335, https://doi.org/10.1016/j.scitotenv.2015.11.057, 2016.
Tao, J., Zhang, L. M., Cao, J. J., Zhong, L. J., Chen, D. S., Yang, Y. H., Chen, D. H., Chen, L. G., Zhang, Z. S., Wu, Y. F., Xia, Y. J., Ye, S. Q., and Zhang, R. J.: Source apportionment of PM2.5 at urban and suburban areas of the Pearl River Delta region, south China – with emphasis on ship emissions, Sci. Total Environ., 574, 1559–1570, https://doi.org/10.1016/j.scitotenv.2016.08.175, 2017.
Thorpe, A. and Harrison, R. M.: Sources and properties of non-exhaust particulate matter from road traffic: a review, Sci. Total Environ., 400, 270–282, https://doi.org/10.1016/j.scitotenv.2008.06.007, 2008.
Urban, R. C., Lima-Souza, M., Caetano-Silva, L., Queiroz, M. E. C., Nogueira, R. F. P., Allen, A. G., Cardoso, A. A., Held, G., and Campos, M. L. A. M.: Use of levoglucosan, potassium, and water-soluble organic carbon to characterize the origins of biomass-burning aerosols, Atmos. Environ., 61, 562–569, https://doi.org/10.1016/j.atmosenv.2012.07.082, 2012.
Wang, Q., Huang, R., Zhao, Z., Cao, J., Ni, H., Tie, X., Zhao, S., Su, X., Han, Y., Shen, Z., Wang, Y., Zhang, N., Zhou, Y., and Corbin, J.: Physicochemical characteristics of black carbon aerosol and its radiative impact in a polluted urban area of China, J. Geophys. Res.-Atmos., 121, 12505–12519, https://doi.org/10.1002/2016JD024748, 2016.
Wang, Q., Han, Y., Ye, J., Liu, S., Pongpiachan, S., Zhang, N., Han, Y., Tian, J., Wu, C., Long, X., Zhang, Q., Zhang, W., Zhao, Z., and Cao, J.: High contribution of secondary brown carbon to aerosol light absorption in the southeastern margin of Tibetan Plateau, Geophys. Res. Lett., 46, 4962–4970, https://doi.org/10.1029/2019GL082731, 2019.
Wang, Q., Liu, H., Wang, P., Dai, W., Zhang, T., Zhao, Y., Tian, J., Zhang, W., Han, Y., and Cao, J.: Optical source apportionment and radiative effect of light-absorbing carbonaceous aerosols in a tropical marine monsoon climate zone: the importance of ship emissions, Atmos. Chem. Phys., 20, 15537–15549, https://doi.org/10.5194/acp-20-15537-2020, 2020.
Wang, W., Chen, N., and Ma, X.: Characteristic analysis on mountain-valley wind in deep valley, Adv. Mater., 610–613, 817–824, https://https://doi.org/10.4028/www.scientific.net/AMR.610-613.817, 2013.
Washenfelder, R., Attwood, A., Brock, C., Guo, H., Xu, L., Weber, R., Ng, N., Allen, H., Ayres, B., Baumann, K., Cohen, R., Draper, D., Duffey, K., Edgerton, E., Fry, J., Hu, W., Jimenez, J., Palm, B., Romer, P., Stone, E., Wooldridge, P., and Brown, S.: Biomass burning dominates brown carbon absorption in the rural southeastern United States, Geophys. Res. Lett., 42, 653–664, https://doi.org/10.1002/2014GL062444, 2015.
Wehrens, R. and Kruisselbrink, J.: Supervised and unsupervised self-organising maps, Package “kohonen”, https://cran.r-project.org/ (last access: 2 January 2022), 2019.
Wei, N., Wang, N., Huang, X., Liu, P., and Chen, L.: The effects of terrain and atmospheric dynamics on cold season heavy haze in the Guanzhong Basin of China, Atmos. Pollut. Res., 11, 1805–1819, https://doi.org/10.1016/j.apr.2020.07.007, 2020.
Wu, C. and Yu, J. Z.: Determination of primary combustion source organic carbon-to-elemental carbon () ratio using ambient OC and EC measurements: secondary OC-EC correlation minimization method, Atmos. Chem. Phys., 16, 5453–5465, https://doi.org/10.5194/acp-16-5453-2016, 2016.
Wu, J., Kong, S., Wu, F., Cheng, Y., Zheng, S., Qin, S., Liu, X., Yan, Q., Zheng, H., Zheng, M., Yan, Y., Liu, D., Ding, S., Zhao, D., Shen, G., Zhao, T., and Qi, S.: The moving of high emission for biomass burning in China: view from multiyear emission estimation and human-driven forces, Environ. Int., 142, 105812, https://doi.org/10.1016/j.envint.2020.105812, 2020.
Xiao, S., Wang, Q., Cao, J., Huang, R., Chen, W., Han, Y., Xu, H., Xu, H., Liu, S., Zhou, Y., Wang, P., Zhang, J., and Zhan, C.: Long-term trends in visibility and impacts of aerosol composition on visibility impairment in Baoji, China, Atmos. Res., 149, 88–95, https://doi.org/10.1016/j.atmosres.2014.06.006, 2014.
Xu, H., Cao, J., Chow, J., Huang, R., Shen, Z., Chen, L. W., Ho, K., and Watson, J.: Inter-annual variability of wintertime PM2.5 chemical composition in Xi'an, China: evidences of changing source emissions, Sci. Total Environ., 545, 546–555, https://doi.org/10.1016/j.scitotenv.2015.12.070, 2016.
Xu, H. M., Cao, J. J., Ho, K. F., Ding, H., Han, Y. M., Wang, G. H., Chow, J. C., Watson, J. G., Khol, S. D., Qiang, J., and Li, W. T.: Lead concentrations in fine particulate matter after the phasing out of leaded gasoline in Xi'an, China, Atmos. Environ., 46, 217–224, https://doi.org/10.1016/j.atmosenv.2011.09.078, 2012.
Xu, H., Ren, Y., Zhang, W., Meng, W., Yun, X., Yu, X., Li, J., Zhang, Y., Shen, G., Ma, J., Li, B., Cheng, H., Wang, X., Wan, Y., and Tao, S.: Updated global black carbon emissions from 1960 to 2017: improvements, trends, and drivers, Environ. Sci. Technol., 55, 7869–7879, https://doi.org/10.1021/acs.est.1c03117, 2021.
Yan, C., Zheng, M., Sullivan, A., Bosch, C., Desyaterik, Andersson, A., Li, X., Guo, X., Zhou, T., Gustafsson, O., and Collett Jr., J.: Chemical characteristics and light-absorbing property of water soluble organic carbon in Beijing: biomass burning contributions, Atmos. Environ., 121, 4–12, https://doi.org/10.1016/j.atmosenv.2015.05.005, 2015.
Yang, M., Howell, S. G., Zhuang, J., and Huebert, B. J.: Attribution of aerosol light absorption to black carbon, brown carbon, and dust in China – interpretations of atmospheric measurements during EAST-AIRE, Atmos. Chem. Phys., 9, 2035–2050, https://doi.org/10.5194/acp-9-2035-2009, 2009.
Yao, X., Chan, C. K., Fang, M., Cadle, S., Chan, T., Mulawa, P., He, K., and Ye, B.: The water-soluble ionic composition of PM2.5 in Shanghai and Beijing, China, Atmos. Environ., 36, 4223–4234, https://doi.org/10.1016/S1352-2310(02)00342-4, 2002.
Zhang, J. P., Zhu, T., Zhang, Q. H., Li, C. C., Shu, H. L., Ying, Y., Dai, Z. P., Wang, X., Liu, X. Y., Liang, A. M., Shen, H. X., and Yi, B. Q.: The impact of circulation patterns on regional transport pathways and air quality over Beijing and its surroundings, Atmos. Chem. Phys., 12, 5031–5053, https://doi.org/10.5194/acp-12-5031-2012, 2012.
Zhang, X., Li, Z., Ming, J., and Wang, F.: One-Year Measurements of Equivalent Black Carbon,Optical Properties, and Sources in the Urumqi River Valley, Tien Shan, China, Atmosphere, 11, 478, https://doi.org/10.3390/atmos11050478, 2020.
Zhang, Y., Li, M., Cheng, Y., Geng, G., Hong, C., Li, H., Li, X., Tong, D., Wu, N., Zhang, X., Zheng, B., Zheng, Y., Bo, Y., Su, H., and Zhang, Q.: Modeling the aging process of black carbon during atmospheric transport using a new approach: a case study in Beijing, Atmos. Chem. Phys., 19, 9663–9680, https://doi.org/10.5194/acp-19-9663-2019, 2019.
Zhang, Z., Gao, J., Engling, G., Tao, J., Chai, F., Zhang, L., Zhang, R., Sang, X., Chan, C., Lin, Z., and Cao, J.: Characteristics and applications of size-segregated biomass burning tracers in China's Pearl River Delta region, Atmos. Environ., 102, 290–301, https://doi.org/10.1016/j.atmosenv.2014.12.009, 2015.
Zhao, S. P., Yu, Y., Yin, D., Yu, Z., Dong, L. X., Mao, Z., He, J. J., Yang, J., Li, P., and Qin, D. H.: Concentrations, optical and radiative properties of carbonaceous aerosols over urban Lanzhou, a typical valley city: results from in-situ observations and numerical model, Atmos. Environ., 213, 470–484, https://doi.org/10.1016/j.atmosenv.2019.06.046, 2019.
Zhao, S., Tie, X., Cao, J., and Zhang, Q.: Impacts of mountains on black carbon aerosol under different synoptic meteorology conditions in the Guanzhong region, China, Atmos. Res., 164–165, 286–296, https://doi.org/10.1016/j.atmosres.2015.05.016, 2015.
Zhao, S., Tian, H., Luo, L., Liu, H., Wu, B., Liu, S., Bai, X., Liu, W., Liu, X., Wu, Y., Lin, S., Guo, Z., Lv, Y., and Xue, Y.: Temporal variation characteristics and source apportionment of metal elements in PM2.5 in urban Beijing during 2018–2019, Environ. Pollut., 268, 115856, https://doi.org/10.1016/j.envpol.2020.115856, 2021.
Zhou, B., Wang, Q., Zhou, Q., Zhang, Z., Wang, G., Fang, N., Li, M., and Cao, J.: Seasonal characteristics of black carbon aerosol and its potential source regions in Baoji, China, Aerosol Air. Qual. Res., 18, 397–406, https://doi.org/10.4209/aaqr.2017.02.0070, 2018.
Zotter, P., Herich, H., Gysel, M., El-Haddad, I., Zhang, Y., Močnik, G., Hüglin, C., Baltensperger, U., Szidat, S., and Prévôt, A. S. H.: Evaluation of the absorption Ångström exponents for traffic and wood burning in the Aethalometer-based source apportionment using radiocarbon measurements of ambient aerosol, Atmos. Chem. Phys., 17, 4229–4249, https://doi.org/10.5194/acp-17-4229-2017, 2017.