the Creative Commons Attribution 4.0 License.
the Creative Commons Attribution 4.0 License.
 | 09 Sep 2022
Springtime nitrogen oxides and tropospheric ozone in Svalbard: results from the measurement station network
Alena Dekhtyareva
Mark Hermanson
Anna Nikulina
Ove Hermansen
Tove Svendby
Kim Holmén
Rune Grand Graversen
Svalbard is a remote and scarcely populated Arctic archipelago and is considered to be mostly influenced by long-range-transported air pollution. However, there are also local emission sources such as coal and diesel power plants, snowmobiles and ships, but their influence on the background concentrations of trace gases has not been thoroughly assessed. This study is based on data of tropospheric ozone (O3) and nitrogen oxides (NOx) collected in three main Svalbard settlements in spring 2017. In addition to these ground-based observations and radiosonde and O3 sonde soundings, ERA5 reanalysis and BrO satellite data have been applied in order to distinguish the impact of local and synoptic-scale conditions on the NOx and O3 chemistry. The measurement campaign was divided into several sub-periods based on the prevailing large-scale weather regimes. The local wind direction at the stations depended on the large-scale conditions but was modified due to complex topography. The NOx concentration showed weak correlation for the different stations and depended strongly on the wind direction and atmospheric stability. Conversely, the O3 concentration was highly correlated among the different measurement sites and was controlled by the long-range atmospheric transport to Svalbard. Lagrangian backward trajectories have been used to examine the origin and path of the air masses during the campaign.
- Article
(15714 KB) - Full-text XML
- BibTeX
- EndNote


Fossil fuel combustion and biomass burning create high-temperature conditions, leading to the reaction between atmospheric oxygen and nitrogen present in the fuel and in the air and formation of nitrogen oxides (NOx = NO + NO2) (Seinfeld and Pandis, 2006). NOx emitted locally in the Arctic or transported from midlatitudes may increase the deposition of nitrates (), which act as nutrients and which during climate change may cause changes in the relative abundances of species in nutrient-deficient environments such as lakes in Svalbard (AMAP, 2006). Aerosols, containing particulate nitrate, are formed from the gaseous nitric acid (HNO3) produced through the oxidation of nitrogen dioxide (NO2) by OH radicals in the presence of sunlight or by the night-time reaction with tropospheric ozone (O3) (AMAP, 2006).
High concentrations of NOx may lead to regional soil and water acidification and have negative effects on human health (AMAP, 2006). In addition to this, NOx are vital for the formation of tropospheric ozone O3, which is a harmful air pollutant and a greenhouse gas (IPCC, 2013). The O3 production and loss depend on the ratios between hydrocarbons NOx and (carbon monoxide and nitrogen oxides) and the presence or absence of sunlight. In the absence of sunlight during polar night, O3 that has been produced within long-range-transported polluted air masses may accumulate in the Arctic. Therefore, the atmospheric lifetime of O3 may be increased from days in summer to months in winter (Quinn et al., 2008).
Ultraviolet (UV) solar irradiance has a complex influence on NOx and O3 chemistry in the troposphere (Seinfeld and Pandis, 2006). Some of the reactions are only efficient at shorter wavelengths, while other processes occur even at longer wavelengths. The insolation increases rapidly in the Arctic during the springtime transition from polar night to midnight sun, but the UV irradiance is dominated by the UV-A fraction with wavelengths from 315 to 400 nm, while the amount of incoming shortwave UV-B irradiance with wavelengths from about 300 to 315 nm is still minimal in this period (Seinfeld and Pandis, 2006). One of the processes that takes place even under low solar elevation and higher column ozone concentration over the sea-ice and snow-covered surfaces is the photolysis of dihalogens (Simpson et al., 2015). This process is the initial step needed for the heterogeneous photochemical reactions with bromine compounds, promoting the springtime tropospheric O3 depletion events (Fan and Jacob, 1992; Monks, 2005; Simpson et al., 2015). According to the study performed by Beine et al. (1997a), the background NOx values were also lower than normal during such events observed at the Zeppelin station in Svalbard. The reactions with Br species, which result in the oxidation of NO to NO2 and the removal of NO2 by the reaction with BrO or OH radical and formation of HNO3, were proposed as a possible explanation to this phenomenon. However, lower NOx values are also characteristic of the pristine air masses from the remote regions in the high Arctic. In contrast, elevated NOx values are observed during the pollution episodes near the local emission sources or when NOx are transported to the Arctic from midlatitudes directly or in the form of peroxyacetyl nitrate (PAN), which is further thermally decomposed locally in the Arctic when the air temperature increases in spring (Beine et al., 1997b). Irrespective of the UV irradiance, in the vicinity of large sources of NO, such as cruise ships, the titration of O3 and formation of NO2 may be observed (Eckhardt et al., 2013). However, if NO and CO or hydrocarbons are present in sufficient quantities downwind from the emission source and insolation increases (Wallace and Hobbs, 2006), the photolysis of O3 at wavelengths below 320 nm may lead to production of the OH radical in the presence of water vapour, which may further yield net O3 production. The UV irradiance also affects the ratio. NO2 dissociates to NO and O in the range of wavelengths from 300 to 370 nm. The photodissociation efficiency reduces gradually at higher wavelengths and vanishes at 420 nm (Seinfeld and Pandis, 2006). A diurnal variation in the background ratio has been observed in Svalbard in spring, and the increase in this ratio around noon becomes more pronounced from March to May (Beine et al., 1997b). The efficiency of NO2 photolysis and formation of NO and O3 enhances as insolation increases, despite concurrent rapid oxidation of NO by O3 leading to formation of NO2, a second part of the so-called daytime NOx null cycle (Wallace and Hobbs, 2006). Thus, both UV-B and UV-A solar irradiance fractions may have influence on the springtime concentrations of NOx and O3 in Svalbard and should be taken into consideration.
Meteorological conditions, such as wind speed and direction, air temperature and humidity, affect the formation of aerosols and efficiency of pollution dispersion and deposition. Synoptic-scale north-easterly wind prevails in the Svalbard region (Adakudlu et al., 2019), but the mesoscale flow is affected locally by topographical channelling and air density gradient from the inland glaciers to the warmer sea. The most pronounced wind direction is along the valleys or fjords towards the coast (Førland et al., 1997): from south-east in Longyearbyen and Ny-Ålesund and from south-south-east in Barentsburg (Fig. 1). Nevertheless, despite the difference in local wind direction in the settlements, there may be common mesoscale meteorological conditions promoting accumulation of locally emitted pollutants in the atmospheric boundary layer (ABL) at all three sites, such as ABL height variation and atmospheric temperature inversion (Dekhtyareva et al., 2018).
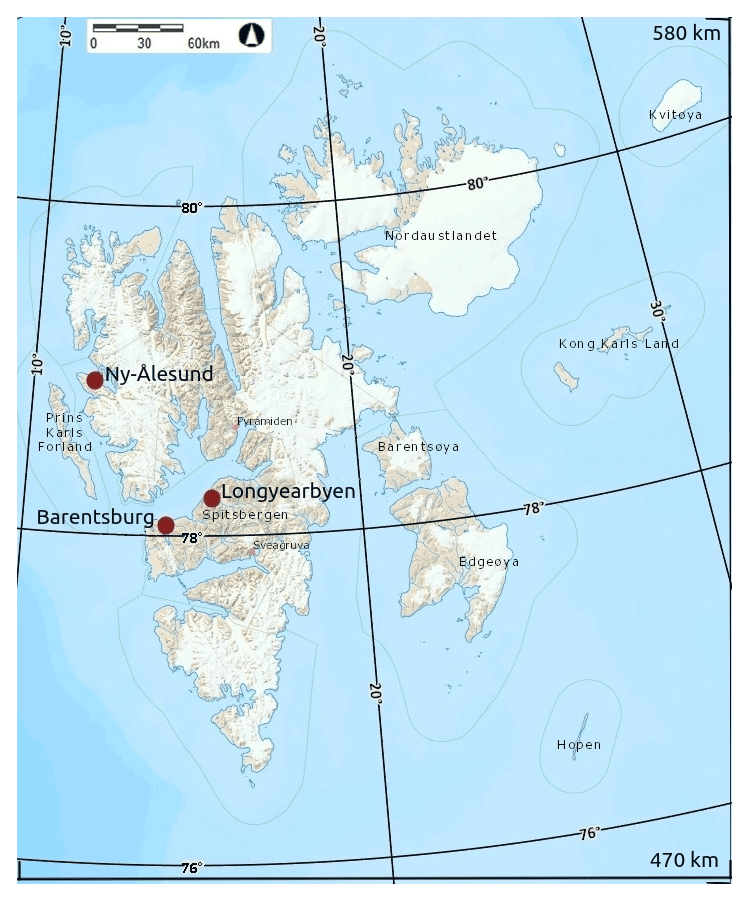
Figure 1Map of Svalbard with three settlements where the NOx were measured in spring 2017. The map is made using the online tool https://toposvalbard.npolar.no/ (last access: 14 July 2022), provided by the Norwegian Polar Institute.
The main anthropogenic emission sources on the archipelago are related to electricity and heat production: coal power plants in Barentsburg and Longyearbyen and a diesel-fuelled generator in Ny-Ålesund (Dekhtyareva et al., 2016; Vestreng et al., 2009). The energy demand for heating in Longyearbyen is 2 times higher in winter than in summer due to the lower temperatures in wintertime. On winter days, the production of energy for heating increases from 06:00 to 09:00 CET in the morning and then decreases steadily until it reaches its minimum at 03:00 in the night, while in summer the production varies little throughout the day (Tennbakk et al., 2018). In contrast to the energy needed for heating, the energy demand for electricity production is mostly independent of the air temperature. Industry, business and municipal buildings stand for more than 70 % of the electricity consumption in Longyearbyen. There is a diurnal variation in the power demand, with higher daytime values in winter. In summer, the power demand and its diurnal variations are lower, since the mine reduces operation in July (Tennbakk et al., 2018). The power demand for heating in Ny-Ålesund and Barentsburg varies similarly to Longyearbyen, but the absolute values are different for all three settlements.
Svalbard residents use cars for transportation within the settlements and snowmobiles for springtime off-road traffic (Vestreng et al., 2009). There were around 2500 snowmobiles registered at Svalbard in 2007 (MOSJ, 2018), and, according to the report issued by the Norwegian Climate and Pollution Agency (Vestreng et al., 2009), local NOx emissions from these were 3 times higher than emissions from the gasoline cars. The current number of snowmobiles is around 2100, and it has been fairly stable since 2011 (MOSJ, 2018).
In Svalbard, the snowmobile traffic is allowed only in specific zones created to minimize environmental impact from the usage of motorized vehicles on snow-covered and frozen ground (Klima- og miljødepartementet, 2001). Furthermore, because of complex terrain, most of the snowmobile routes are confined to valleys. Therefore, the pollution dispersion is restricted and strongly affected by local circulation patterns. The amount of pollutants emitted instantaneously by one motorcade may be significant, since tourists and residents usually travel in groups consisting of up to 20 snowmobiles due to safety reasons. Previous studies have shown highly elevated levels of volatile organic compounds along snowmobile tracks (Reimann et al., 2009); however, no measurements of nitrogen oxides have previously been done.
NOx concentrations in all three settlements may also be influenced by emissions from ship traffic (Vestreng et al., 2009; Shears et al., 1998), which is the most intensive in summer (Eckhardt et al., 2013; Dekhtyareva et al., 2016), while snowmobiles and power plants are dominant sources of NOx in winter and spring seasons.
The main aim of the current article is to combine NOx and O3 data, collected in spring 2017 in Barentsburg, Longyearbyen and Ny-Ålesund, in order to identify specific factors affecting the concentration of measured compounds and define conditions that promote accumulation of local and long-range-transported pollution in all three settlements.
Meteorological in situ and reanalysis data as well as UV, O3 and NOx observations have been used to test the following hypotheses:
-
There is a diurnal pattern in concentration of NOx at all three stations due to a variable emission rate from the local sources of NOx.
-
Complex topography determines local circulation, and therefore variation of NOx concentration measured at the stations will be dominated by micro- and mesoscale phenomena.
-
Local emissions of NOx in Ny-Ålesund and Barentsburg affect O3 concentrations in the settlements.
-
Despite the topographically induced features, there are common synoptic meteorological conditions, which have an influence on the concentrations of NOx and O3 in the settlements.
The observational setup at the three stations and methods applied to study various factors of influence on the concentration of measured compounds are introduced in “Materials and methods” (Sect. 2). In the Results (Sect. 3), the NOx and O3 observations from Adventdalen, Barentsburg and Ny-Ålesund are compared, and the influence of large-scale weather regimes on the concentrations of measured compounds at the three stations is identified. In the Discussion (Sect. 4), the results from the 2017 campaign are contrasted to the modelled ratio and NO2 produced through PAN decomposition and long-term observations from Ny-Ålesund and weather regime and trajectory data are utilized to confirm large-scale circulation and air pollution links. Finally, the Conclusion section summarizes main findings of the paper and implications of the weather regime approach for air pollution studies in Svalbard.
2.1 Measurements in Adventdalen (Longyearbyen)
In the spring season, the main snowmobile route from Longyearbyen to the east coast of Spitzbergen goes along the road through the Adventdalen valley, and therefore there is daily snowmobile traffic nearby the CO2 laboratory belonging to the University Centre in Svalbard (UNIS CO2 lab, coordinates: 78.20247∘ N, 15.82887∘ E). The station is located at a distance of approximately 5 km to the south-east of the coal power plant and major crossroads in Longyearbyen and thus is representative of monitoring of air pollution from snowmobiles. The chemiluminescence analyser (model T200) was installed at this laboratory for the period from 23 March to 15 May 2017. The inlet of the sampling hose was secured outside from the window, while the temperature inside the laboratory was kept constant with the help of a thermostat to maintain stable conditions needed for correct functioning of the analyser. The sensor was calibrated weekly using a zero-air generator and a certified NO gas with known concentration (800 ppb), and the hourly average NOx data were scaled linearly to eliminate zero drift. The automatic weather station (UNIS AWS) is located nearby the UNIS CO2 lab, and the data from that station have been used to assess local meteorological conditions.
In addition to the meteorological parameters from the Adventdalen station, data from UV monitors installed at the UNIS roof in Longyearbyen have been used. The sensors SKU 420 UV-A (315–380 nm) and SKU 430 UV-B (280–315 nm), produced by the SKYE Instruments, were calibrated on 24 August 2016.
2.2 Measurements in Ny-Ålesund
Continuous NOx measurements are performed by the Norwegian Institute for Air Research (NILU) in the framework of the air quality monitoring programme in Ny-Ålesund (Johnsrud et al., 2018). The analyser is installed in the middle of the settlement (coordinates: 78.92470∘ N, 11.92641∘ E), 100 m to the north-west of the meteorological station operated by the Norwegian Meteorological Institute and 300 m to the south-south-east of the diesel power plant. Similarly to the measurements in Adventdalen, weekly calibrations with zero air and span gas are performed at the Ny-Ålesund station, and the hourly average NOx data are corrected for drift. The hourly O3 gas monitor data from the Zeppelin observatory, located nearby the mountain top (474 m a.s.l.), 2 km to the southwest of Ny-Ålesund (coordinates: 78.90719∘ N, 11.88606∘ E), were used for comparison with the O3 measurements in Barentsburg. The UV data obtained using the multifilter radiometer GUV 541 at the Sverdrup station in Ny-Ålesund (Gröbner et al., 2010; Schmalwieser et al., 2017) and local meteorological observations from the Zeppelin station were provided by NILU as well. The GUV radiometer is checked and corrected against a travelling reference instrument every year.
In addition to this, daily radiosonde and weekly ozonesonde data from the French–German AWIPEV research station in Ny-Ålesund have been used. Since temperature inversion may be an important factor promoting accumulation of local pollution in the atmospheric boundary layer, the method for its detection in the radiosonde vertical profiles, described by Dekhtyareva et al. (2018), has been applied: the days when the temperature was increasing with height by more than 0.3 ∘C in the lowest 500 m were defined as days with temperature inversions. In order to compare the O3 sonde measurements with ground-level observations, the O3 mixing ratio in units of parts per billion per volume (ppbv) were calculated from the O3 partial pressure and atmospheric pressure measured by the radiosonde (Seinfeld and Pandis, 2006).
Daily radiosonde launches were operated at the AWIPEV station (AWI), using Vaisala RS92 radiosondes until April 2017 (Maturilli and Kayser, 2017) and Vaisala RS41 radiosondes afterwards. In this study, we apply radiosonde data for March 2017, post-processed according to the principles of the GCOS Reference Upper-Air Network (GRUAN; Immler et al., 2010). The RS41 data for April–May 2017 are processed with the manufacturer's software.
2.3 Measurements in Barentsburg
The Russian Arctic and Antarctic Research Institute (AARI) performs the measurements in Barentsburg independently in the frame of the air quality monitoring programme. The equipment installed in the settlement includes chemiluminescence NOx AC32M and UV photometric O3 O342M analysers produced by Environnement S.A. and the Vaisala HydroMet system MAWS201. The observational site is located on the narrow terrace 40 m above sea level (coordinates: 78.06070∘ N, 14.21718∘ E) and 600 m to the north-east of the coal power plant. The analysers continuously gather the data and transmit them to the laboratory facility of the Russian Scientific Centre in Barentsburg. The data with 20 min time resolution were averaged to obtain hourly data. The analysers were installed and initially calibrated by the manufacturer's accredited specialists in December 2016. After the installation, zero control was performed regularly using the NOx analyser's built-in automatic zero-air function for the correction of zero drift lines. The maintenance of the converter filter was done at the frequency recommended by the manufacturer. However, in contrast to the equipment in Ny-Ålesund and Longyearbyen, the NOx and O3 analysers in Barentsburg were not calibrated manually during the field campaign. Therefore, the data from this station may be prone to drift. This is especially important to keep in mind when studying NOx concentrations, since the NOx values are usually very low in the remote Arctic environment (Dekhtyareva et al., 2016). On the other hand, the UV O3 monitor is more stable and does not demand as frequent calibration as chemiluminescence instruments (Williams et al., 2006), and thus data from this instrument are more reliable.
2.4 Methods to study the effect of meteorological conditions on the concentration of measured compounds
Previous studies showed the influence of large-scale weather phenomena on long-range-transported and local air pollution. Eckhardt et al. (2003) demonstrated how positive and negative phases of the North Atlantic Oscillation control long-range transport of air pollution to the Arctic. The modelling study of Ménégoz et al. (2010) introduced four weather regimes based on ERA40 data and described the aerosol budget variations associated with different regimes and feedback of aerosol distribution on the weather regime persistence. Ibrahim et al. (2021) classified nine weather regimes using self-organizing maps and cluster analysis of principal components and investigated the influence of the prevailing large-scale meteorological conditions on the air quality in Berlin. In the current work, we apply Christian Grams' weather regime classification that is based on the 6-hourly ERA-Interim data. This classification was previously used to investigate the frequency of poleward moisture transport events by atmospheric rivers (Pasquier et al., 2019) and southward transport of Arctic air during cold-air outbreaks (Papritz and Grams, 2018) and for assessment of Europe's wind power output (Grams et al., 2017). Thus, this approach is suitable for the study of long-range transport of air masses and local dispersion efficiency that depends on atmospheric stability and wind speed. The following three-step procedure has been implemented to assess the effect of the prevailing synoptic meteorological situation on long-range transport of pollutants and on the local meteorological conditions affecting concentrations of O3 and NOx in Svalbard.
Firstly, the whole measurement period was divided into sub-periods based on the prevailing large-scale atmospheric circulation patterns. In the climatological mean, the large-scale conditions are characterized by weak ridging of absolute geopotential height at 500 hPa over the eastern North Atlantic and westerly upper level flow over Svalbard. Such a regime is placed in the “no regime” category in the Grams et al. (2017) classification (their Fig. S1h). The deviations from these mean conditions are classified into seven distinct weather regimes that represent the variation of the large-scale circulation patterns over the North Atlantic and European region.
Secondly, the hourly meteorological data, O3 concentration and planetary boundary layer height (PBL) from the global ERA5 reanalysis data set with 31 km spatial resolution (Hersbach et al., 2020) were used to investigate the prevailing large-scale weather conditions for the identified sub-periods. The ERA5 O3 mass mixing ratio is estimated based on the assimilated satellite observations and external 2-D photochemical model (Park et al., 2020). The PBL in the ERA5 data set is defined by the height when the Richardson number for the adjacent vertical model layers exceeds a critical value of 0.25, and the air becomes stably stratified (European Centre for Medium-Range Weather Forecasts, 2017).
Thirdly, the FLEXible PARTicle (FLEXPART) V8.2 air parcel trajectory data set was utilized for the same sub-periods to study the long-range atmospheric transport to Svalbard. Previously, FLEXPART data have been used to investigate long-range transport of black carbon and sulfates (Hirdman et al., 2010a, b) and mercury and O3 (Hirdman et al., 2009) in the Arctic. The current FLEXPART data set contains a 3-dimensional Lagrangian dispersion simulation (Stohl et al., 2005) with 5 million air parcels (Läderach and Sodemann, 2016; Fremme and Sodemann, 2019) driven with the meteorological data from the ERA-Interim reanalysis with a spatial resolution of approximately 80 km and temporal resolution of 6 h (Dee et al., 2011). The 10 d backward trajectories starting within the lowest 500 m above the ground in the region covering Ny-Ålesund, Longyearbyen and Barentsburg (from 77.5 to 79.5∘ N and from 10 to 20∘ E) were extracted from this data set. The trajectory model data were combined with BrO total column data derived from GOME-2 (ir)radiance satellite observations (AC SAF, 2017) to identify regions with elevated concentration of this O3-depleting substance.
Additionally, to study long-range transport of extremely O3-depleted or O3-enriched air masses, the following procedure has been implemented to detect O3 decrease and increase events occurring simultaneously in Barentsburg and at the Zeppelin station:
-
Since the distance between the Zeppelin observatory and Barentsburg is more than 100 km, a time lag in correlation between the data from the two stations is expected. The acceptable time lag has been defined based on the lagged linear correlation between the data sets. The maximum time lag for which the correlation coefficient is higher than or equal to the coefficient calculated for the zero-hour lag is defined as the maximum allowable time lag.
-
Applying the extreme definition of air quality stated in Porter et al. (2015), O3 levels below the 5th quantile and above the 95th quantile were found separately for the Barentsburg and Zeppelin measurements to define severe depletion and increase events, respectively.
-
Continuous episodes were defined for the periods where the time difference between consecutive event points is less than 3 h.
-
Minimum (maximum) O3 concentrations within each event were defined. The time of minimum (maximum) within the events in Barentsburg and at the Zeppelin station were compared, and if the difference between them was less than the acceptable time lag, the events at both stations were classified as one joint event.
The backward air mass ensemble trajectories have been simulated using the Hybrid Single Particle Lagrangian Integrated Trajectory (HYSPLIT) model for these joint events for 240 h back in time to identify the source regions of the air masses (Stein et al., 2015). This 10 d simulation time has been chosen as a compromise between the average lifetime of tropospheric O3, which may be 3 to 4 weeks (Christiansen et al., 2017), and the uncertainty of modelled air mass trajectories that increases with travelled distance (Freud et al., 2017). The standard ensemble simulation with 27 members was calculated in the READY system by offsetting the Global Data Assimilation System (GDAS) meteorological data with a 0.5∘ resolution by a fixed grid factor in the horizontal and vertical dimensions to take into account the uncertainty of the trajectory forecast (Rolph et al., 2017).
2.5 Methods to study the effect of local pollution in Ny-Ålesund and in Barentsburg on the measured O3 concentrations
Previously, the only collocated NOx and O3 measurements from Ny-Ålesund were performed at the Zeppelin station from February to May 1994. The results were published in Beine et al. (1996). In that study, the combination of NOx data and concentration of particles with diameter below 10 nm, atmospheric stability and wind direction was used to identify possible local pollution events. In spring 1994, the local pollution was detected at the Zeppelin station during 6.4 % of the measurement time, and the number of these events increased with increased insolation in May. As there were no O3 data from Ny-Ålesund available, the O3, CO and differential mobility particle sizer (DMPS) data from the Zeppelin station were used to study the influence of local NOx emissions in Ny-Ålesund on the O3 concentration. CO indicates the presence of other pollutants emitted simultaneously in the process of fossil fuel burning, and although the correlation between NOx and CO concentration in the plumes depends on the engine and fuel type, age of the plume and environmental conditions (Li et al., 2015), we expect elevated CO concentrations in the fresh plumes arriving at the Zeppelin station. Therefore, a local pollution effect was defined for O3 measurements at the Zeppelin station when all four conditions were fulfilled:
-
The wind direction measured both in Ny-Ålesund and at the Zeppelin station was northerly (above 270∘ or below 90∘) since the diesel power plant is located 300 m to the north–north-west of the NOx monitor in Ny-Ålesund and 2 km to the north–north-east of the Zeppelin station.
-
NOx concentrations were above the mean value in Ny-Ålesund.
-
The concentration of particles with diameter below 10 nm had a strong increase (above 95 percentile value for the whole campaign).
-
CO concentrations observed at the Zeppelin station were above the mean value, indicating the possible impact of local pollution.
To assess how the NOx emissions in Barentsburg affect the local O3 concentration there, the NOx and O3 data from the Barentsburg station have been compared. Positive anomalies in O3 concentration were found for the same wind directions where increased NOx concentrations were observed, but this may be due to higher concentrations of O3 in air masses, which were transported to Svalbard from the south and south-west. Since there are multiple sources of local pollution in Barentsburg (coal power plant, ships and cars), another method has been implemented:
-
The hours when NOx concentrations were above average in Barentsburg have been defined.
-
O3 values for these hours in the original and in the 6-hourly smoothed data series from Barentsburg have been compared.
3.1 Comparison of NOx and O3 observations from Adventdalen, Barentsburg and Ny-Ålesund
The hourly NOx and O3 concentrations and meteorological data from all three stations are shown in Figs. 2 and 3. Nine distinct large-scale weather regimes have been identified for the campaign period (marked with numbers from I to IX). A detailed description of the weather regimes is given in Sect. 3.2 of the current paper.
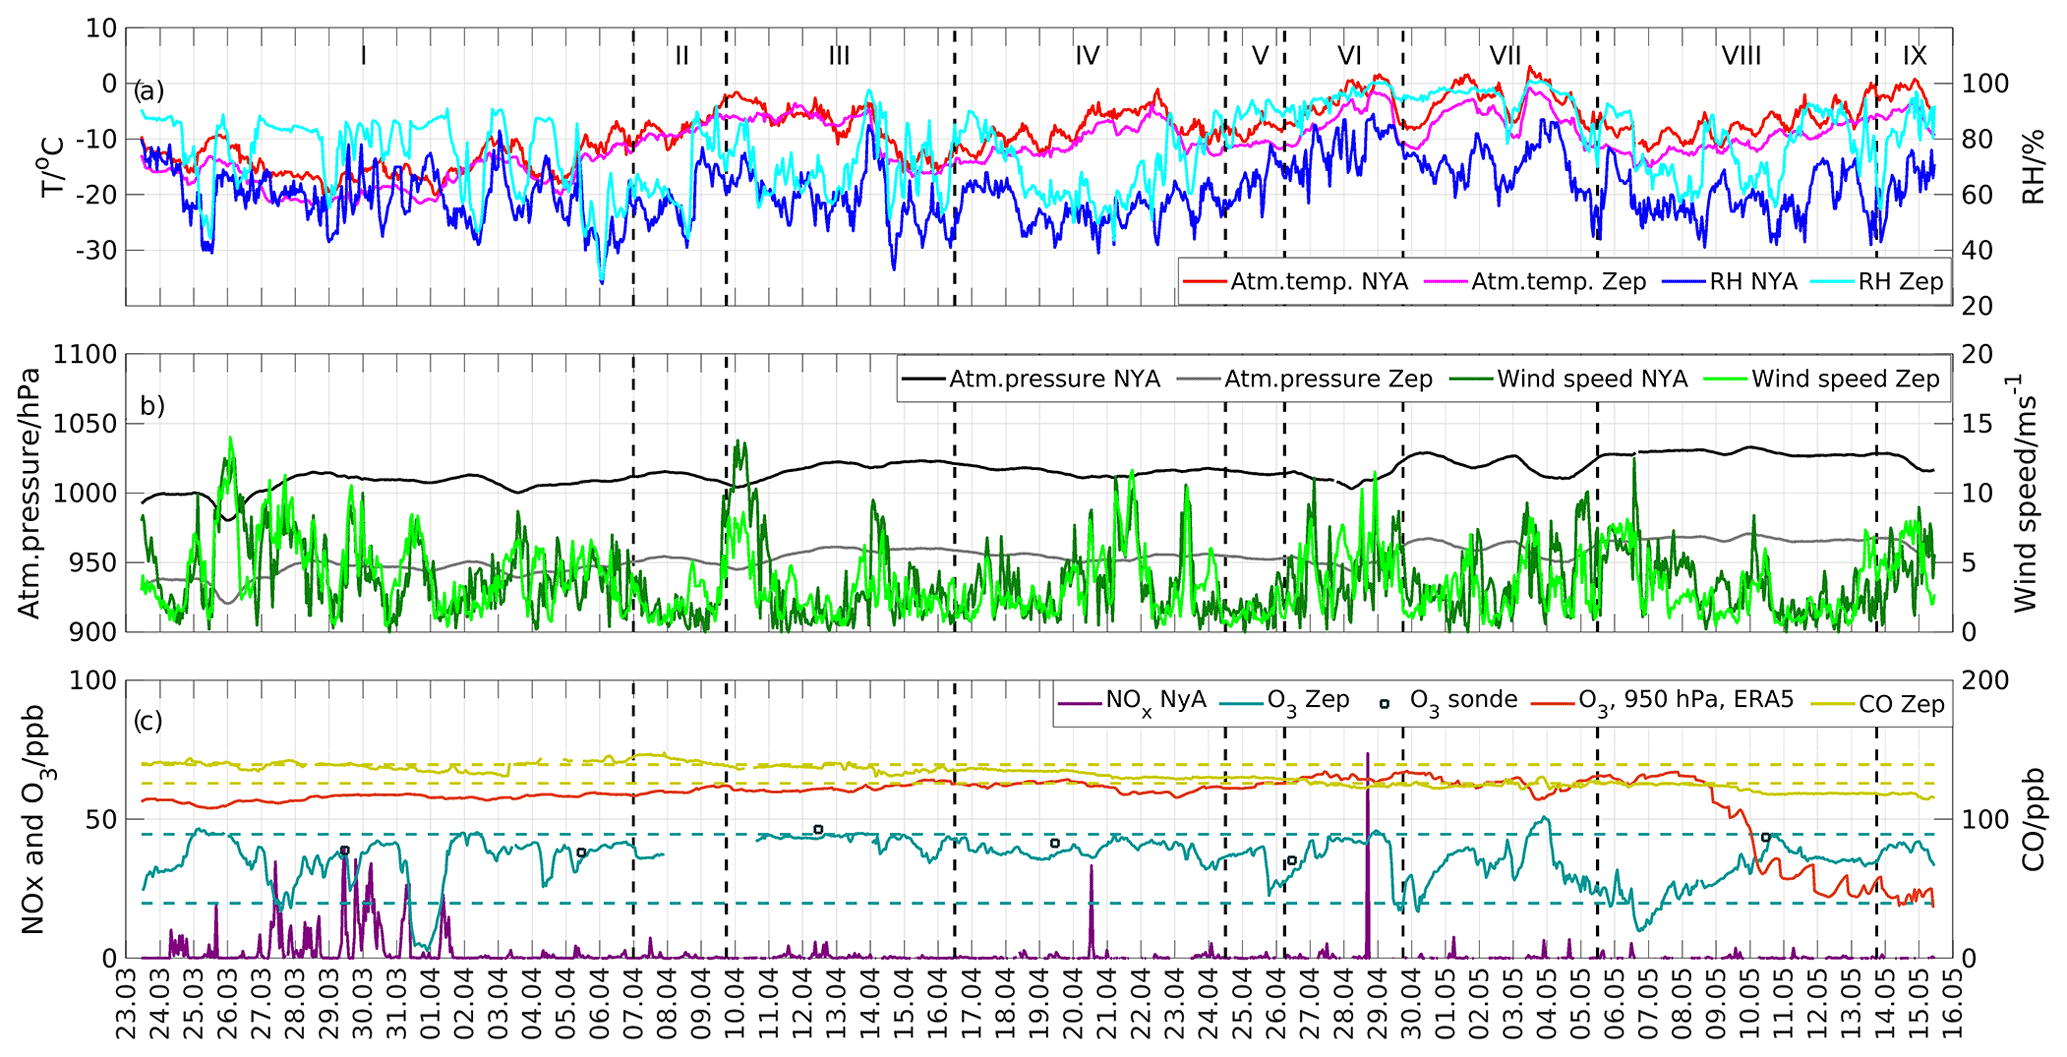
Figure 2(a) The hourly average air temperature and relative humidity measured in Ny-Ålesund (NYA) and at the Zeppelin station (Zep). (b) Atmospheric pressure and wind speed measured in Ny-Ålesund and at the Zeppelin station. (c) NOx, CO and O3 concentrations in Ny-Ålesund, at the Zeppelin station and in the ERA5 reanalysis for the nearest grid point the coordinates of Ny-Ålesund for the period from 23 March to 16 May 2017. The dashed black lines represent time frames of the different weather regimes. The dashed blue line shows 5th and 95th quantiles of the O3 concentration.
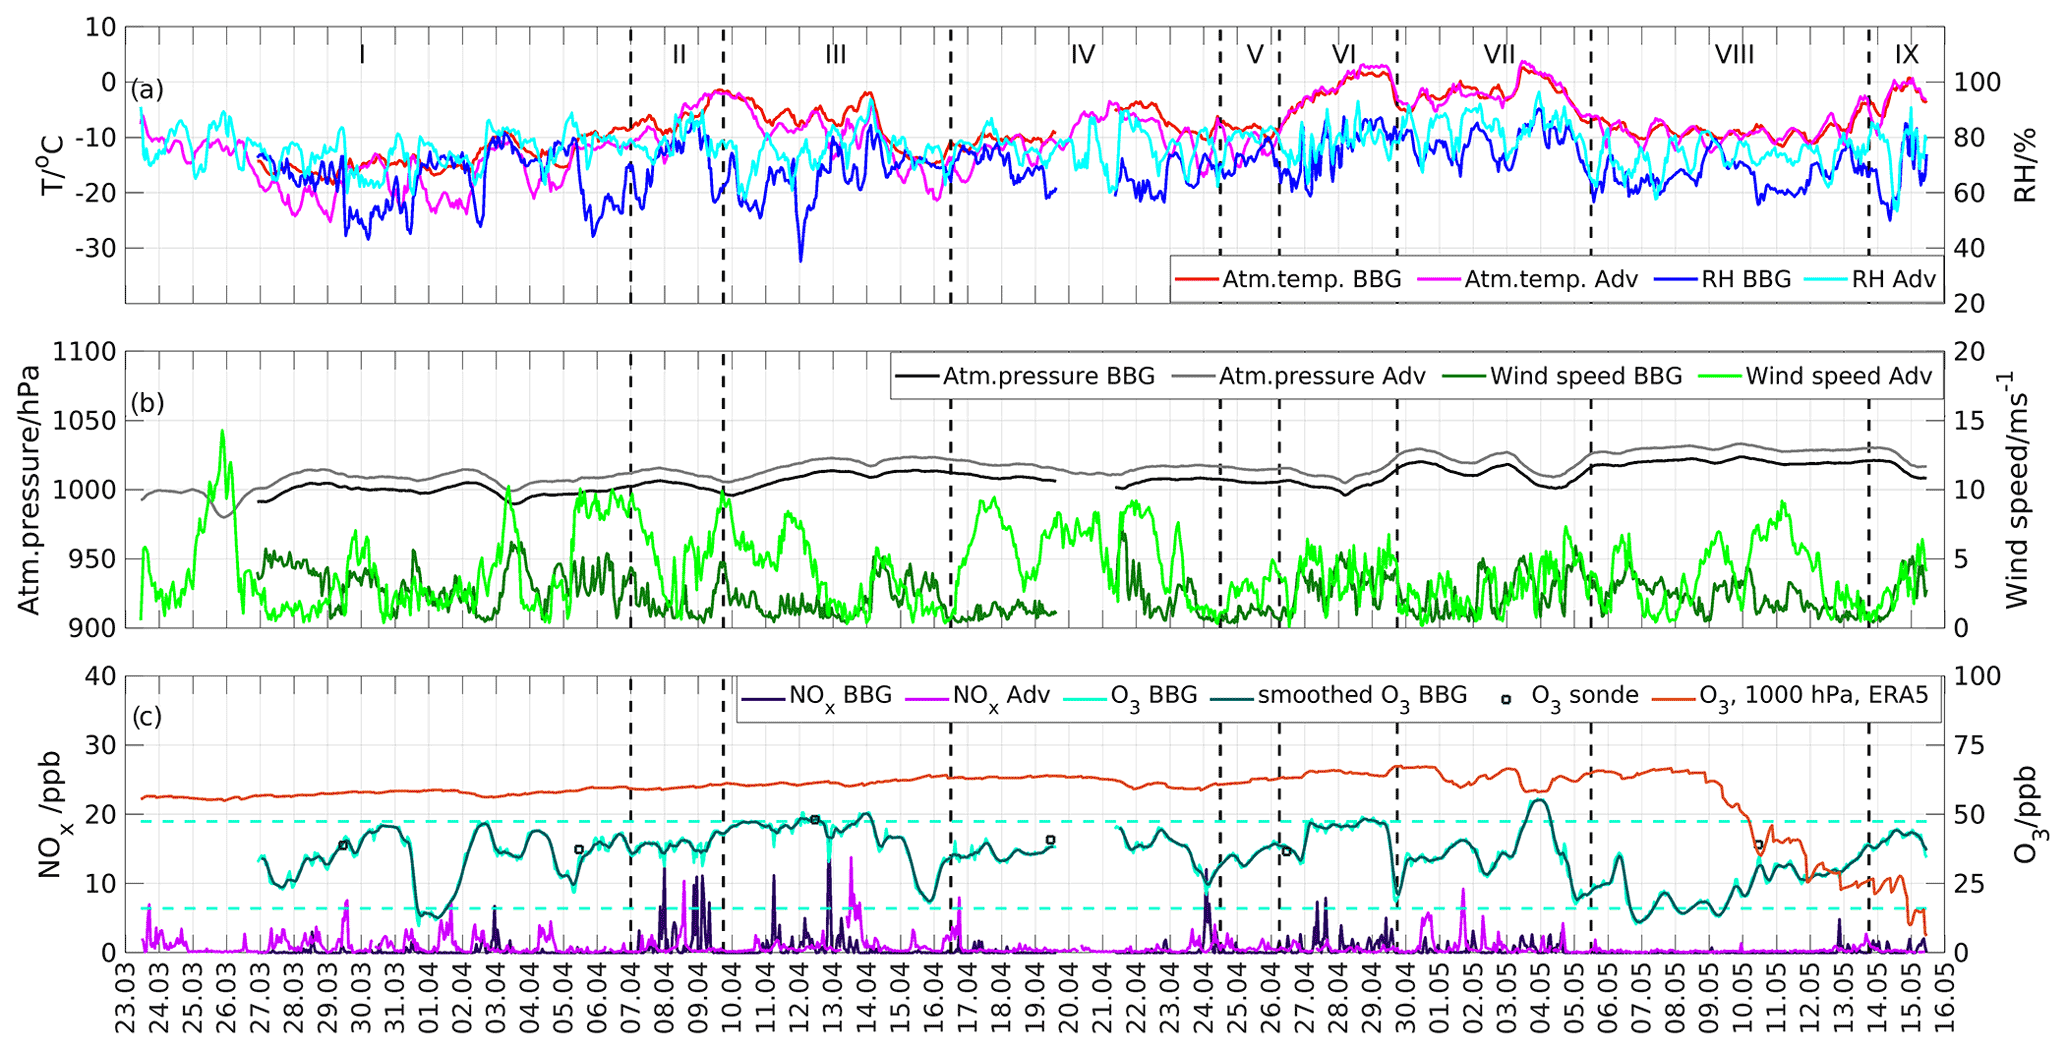
Figure 3(a) The hourly average air temperature and relative humidity measured in Adventdalen (Adv) and Barentsburg (BBG). (b) Atmospheric pressure and wind speed measured in Adventdalen and Barentsburg. (c) NOx and O3 concentrations in Adventdalen, in Barentsburg and in the ERA5 reanalysis for the nearest grid point to the coordinates of Barentsburg for the period from 23 March to 16 May 2017. The dashed black lines represent time frames of the different weather regimes. The dashed light blue line shows 5th and 95th quantiles of the O3 concentration.
Despite alteration in the large-scale circulation, little variability was found in CO data from the Zeppelin station (solid olive line in the Fig. 2c) and O3 values in ERA5 reanalysis (orange line in the Fig. 2c). The threshold of CO median value ± median absolute deviation (132.6±6.7 ppb) is shown by the dashed olive line in the Fig. 2c. There were no sharp peaks in the concentration of this gas, indicating that there was little influence of local pollution on the measurements at the mountain station, but the levels of this compound were stably high in the beginning of the campaign and showed a gradual decline from the end of March to the middle of May. This is a response to increased insolation throughout the fieldwork period (from 0.03 to 0.3 W m−2 and from 7.9 to 28.9 W m−2 UV-B and UV-A irradiation observed in Ny-Ålesund, respectively), as CO is rapidly oxidized by the OH radical produced in the O3 photolysis. A pronounced decline in CO concentration and sharp drop in O3 values in ERA5 reanalysis may be observed in sub-period VIII. The O3 concentration in the ERA5 reanalysis exceeds the values observed at the Zeppelin station (dark blue line in the Fig. 2c) most of the time except this sub-period. Thus, the O3 ERA5 reanalysis data are not representative of the regional Arctic processes or short-term variability in long-range transport but show strong sensitivity to photochemical destruction.
There is a weak statistically significant positive correlation between NO, NO2 and NOx values measured in Adventdalen and in Ny-Ålesund (the Pearson correlation coefficients are rNO = 0.13, rNO2 = 0.15 and rNOx = 0.13; p<0.0001 for all compounds). Conversely, no correlation is present with NOx data from Barentsburg. Low correlation between the NOx values at the three stations indicates the importance of local emission sources and micrometeorology (wind channelling and spatial variation in atmospheric stability) rather than synoptic meteorological conditions. The background NOx concentrations observed in Svalbard in previous studies (Beine et al., 1997a, b) using different measurement techniques are below 0.4 ppb, and thus, the natural variability in NOx values due to long-range transport to Svalbard would be undetected in the NOx data sets presented in the current study.
The Barentsburg O3 data contain some abrupt peaks with magnitude of up to 9 ppbv and duration of just 1 h (light blue line in Fig. 3c), while they are absent in the Zeppelin O3 data. Indeed, the Barentsburg station is located inside the settlement, and the O3 data there are more prone to be influenced by local NOx pollution, while the Zeppelin station is situated far from the local emission sources. In order to investigate the significance of this local impact, a 6 h moving average filter has been applied to the O3 Barentsburg data, and the results are shown with a dark blue line in Fig. (3c). The smoothed and original O3 data from Barentsburg have been compared statistically: both the two-sided Wilcoxon rank sum (WRS) test and the t test show that the application of the low-pass filter on the O3 data from Barentsburg does not result in significant change in the concentration distribution. The correlation between O3 concentrations at the Zeppelin station and in Barentsburg is moderate (Pearson correlation coefficient r=0.69 both for smoothed and unsmoothed data; p<0.001). This indicates that O3 concentrations at both stations are highly influenced by the meteorological conditions on the synoptic scale, and local impacts are of minor importance.
We have applied methods described in Sect. 2.5 to define the effect of local NOx emissions in Ny-Ålesund and Barentsburg on the O3 concentrations in the settlements. As a result, 5 % of the O3 data from the Zeppelin station might have been influenced by the local pollution from Ny-Ålesund, and the statistically significant (p<0.0001) decrease in the O3 mean (31.6 vs. 36.1 ppb) and median (34.4 vs. 38.0 ppb) concentrations has been revealed for this group. However, northerly wind that may transport local pollution from Ny-Ålesund also brings air masses which have a lower O3 background value. Therefore, when one compares potentially locally polluted air masses with the background air masses coming from the north, the difference in mean and median O3 concentrations becomes statistically insignificant, 31.6 vs. 33.3 ppb and 35.6 vs. 34.4 ppb, respectively. Following the method of Beine et al. (1996) for the local pollution event detection, the concentration of particles with a diameter of 10 nm routinely measured by the DMPS at the Zeppelin station and a threshold of >95 percentile have been used to identify peaks in concentration of newly formed particles. Similarly to the results of Beine et al. (1996), the peak events were detected at the Zeppelin station only in the second part of the 2017 measurement campaign (from 24 April to 13 May). The northerly wind direction was present only during 12 out of 45 h with peak particle concentration; however, none of these cases was characterized by increased CO concentration at the Zeppelin station. Thus, these peaks in concentration of small particles might have been related to natural rather than anthropogenic emission sources. Indeed, Heintzenberg et al. (2017) described the offset in new particle formation towards late spring and summer when biological emissions become important sources for this process. Therefore, both statistical comparison of the O3 concentrations in clean and potentially polluted air masses mentioned above and the absence of coinciding peaks in particle concentration and CO concentration indicate that the O3 observations at the Zeppelin station were not significantly affected by local NOx pollution during the 2017 campaign.
The difference between the original and smoothed O3 data from Barentsburg varies from −19 % to 11 % of the smoothed value, and there is a moderate negative correlation between the magnitude of NOx peak and the reduction in O3 concentration (, p<0.0001). Despite this sensitivity of O3 concentration to local pollution in Barentsburg, the median NOx concentrations observed there were low, and average reduction of O3 concentration in comparison to the smoothed values was only 1 %. This effect is not statistically significant, and therefore other factors, such as variation in concentrations within long-range-transported air masses, may be more important for explanation of difference between the O3 Zeppelin and Barentsburg data sets.
The comparison of the vertical O3 data from the O3 sondes (dark blue squares in Figs. 2c and 3c) from Ny-Ålesund and the ground-based measurements at the Zeppelin station and in Barentsburg reveals that the discrepancy in the data between the two stations may be explained by the fact that the stations are located at different heights and measure air masses with an uneven distribution of O3 in the lowest 500 m. If contrasting the closest point to the sounding time in the observations made in Barentsburg and in Ny-Ålesund, similar tendencies as in the O3 sonde data may be observed. For example, there is a significant difference between the data from Barentsburg and Ny-Ålesund (33.74 ppb vs. 38.88 ppb) for the measurement closest to the time of sounding on 10 May, and an increase of O3 concentration with height between 1000 hPa (50 m) and 950 hPa (500 m) is noticeable in the sounding data as well (Fig. 4a). One can see in the potential temperature profiles (Fig. 4b) that the pronounced atmospheric inversion tends to be noticeable in the O3 sonde profiles as well. For example, a simultaneous increase in O3 concentrations and potential temperature is pronounced at the level of 850 hPa (1300 m) on 26 April, 860 hPa (at 1200 m) on 5 April and 900 hPa (at 1000 m) on 12 April (Fig. 4a and b). The O3 concentration in the ERA5 profiles was overestimated and showed little variability in the lowermost layer, except the profile for 10 May (dashed dark grey line in the Fig. 4a) when the reanalysis and observational values coincided for 1000 hPa level, but the O3 concentration in ERA5 was underestimated by almost 40 % at the height of 925 hPa (Fig. 4a). The virtual potential temperature profiles in reanalysis resemble O3 sonde profiles closely (Fig. 4b). The PBL height from ERA5 reanalysis (marked with stars in the Fig. 4b) was above the low-level temperature inversions detected on 5 and 12 April and below the level of the most pronounced virtual temperature inversion in the O3 sonde profiles.
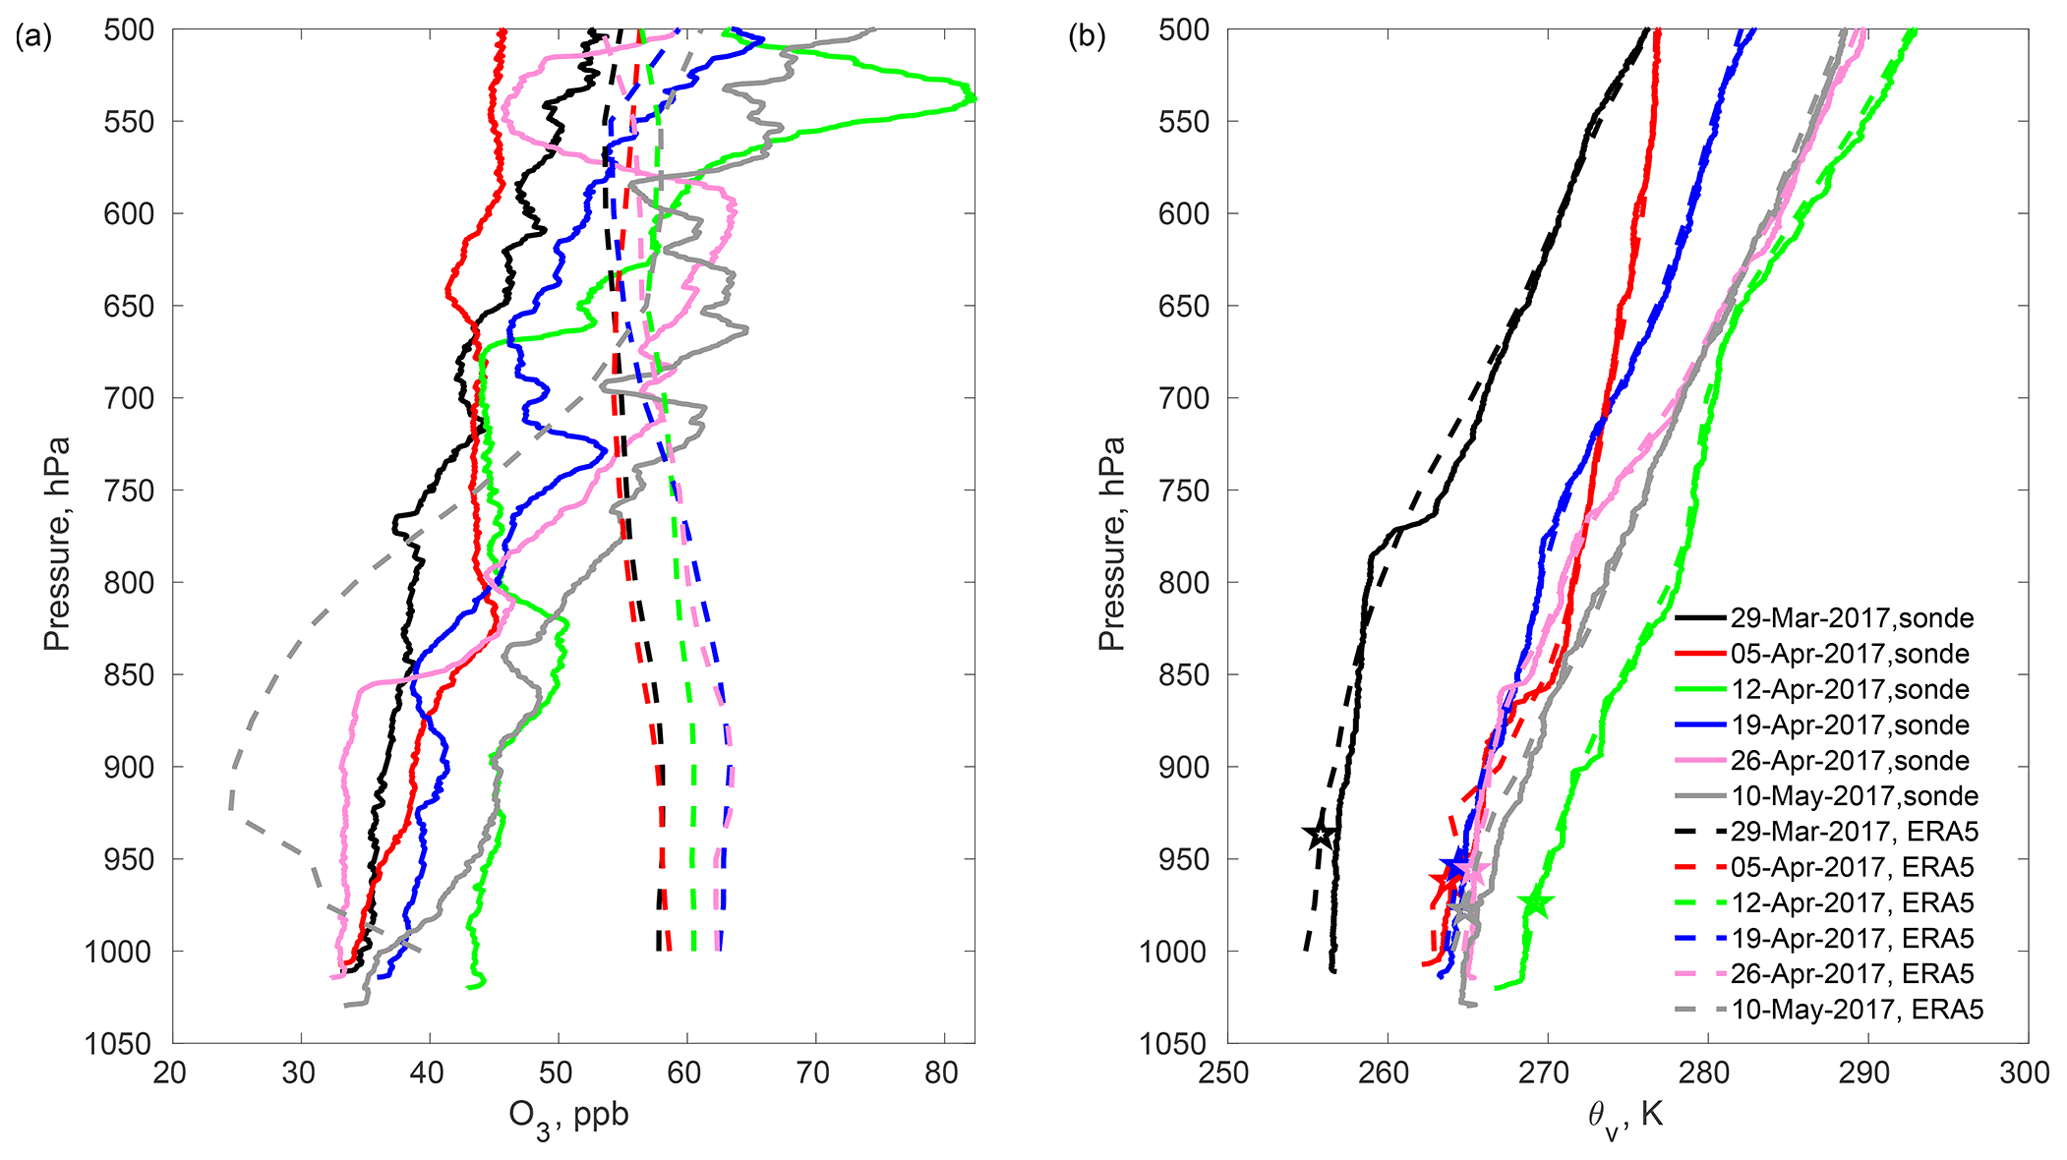
Figure 4Vertical profiles of O3 (a) and virtual potential temperature (b) from O3 sondes and ERA5 reanalysis data. O3 sonde profiles are shown with solid lines, and ERA5 profiles are shown with dashed lines. The planetary boundary layer height (PBL) in the ERA5 data is plotted with stars on the virtual potential temperature profiles from the reanalysis.
In addition to hourly values, average concentrations of measured compounds have been calculated for each hour of the day. The diurnal variation in NO, NO2 and O3 concentrations at the stations is shown in Fig. 5. Mean and median daytime (from 06:00 to 17:00 UTC) and night-time (from 18:00 to 05:00 UTC) concentrations are shown in Table 1 (here the daytime and night-time are defined based on the snowmobile traffic pattern in the Adventdalen valley).

Figure 5(a) Variation of measured NO and NO2 concentrations depending on the time of the day (in UTC) in Adventdalen (Adv), Ny-Ålesund (NyA) and Barentsburg stations (BBG). (b) Variation of measured O3 concentration depending on the time of the day (in UTC) at the Zeppelin (Zep) and Barentsburg stations (BBG). The whiskers show standard error of the mean for each group.
Table 1Measurement results from Adventdalen, Barentsburg and Ny-Ålesund. The two-sided t test compares daytime and night-time concentrations at each station and checks if there is a significant difference in mean values for these two groups. The two-sided WRS test compares daytime and night-time concentrations at each station and checks if there is a significant difference in median values for these two groups. Pairs with significant (p<0.05) t and WRS test results are shown with bold font.
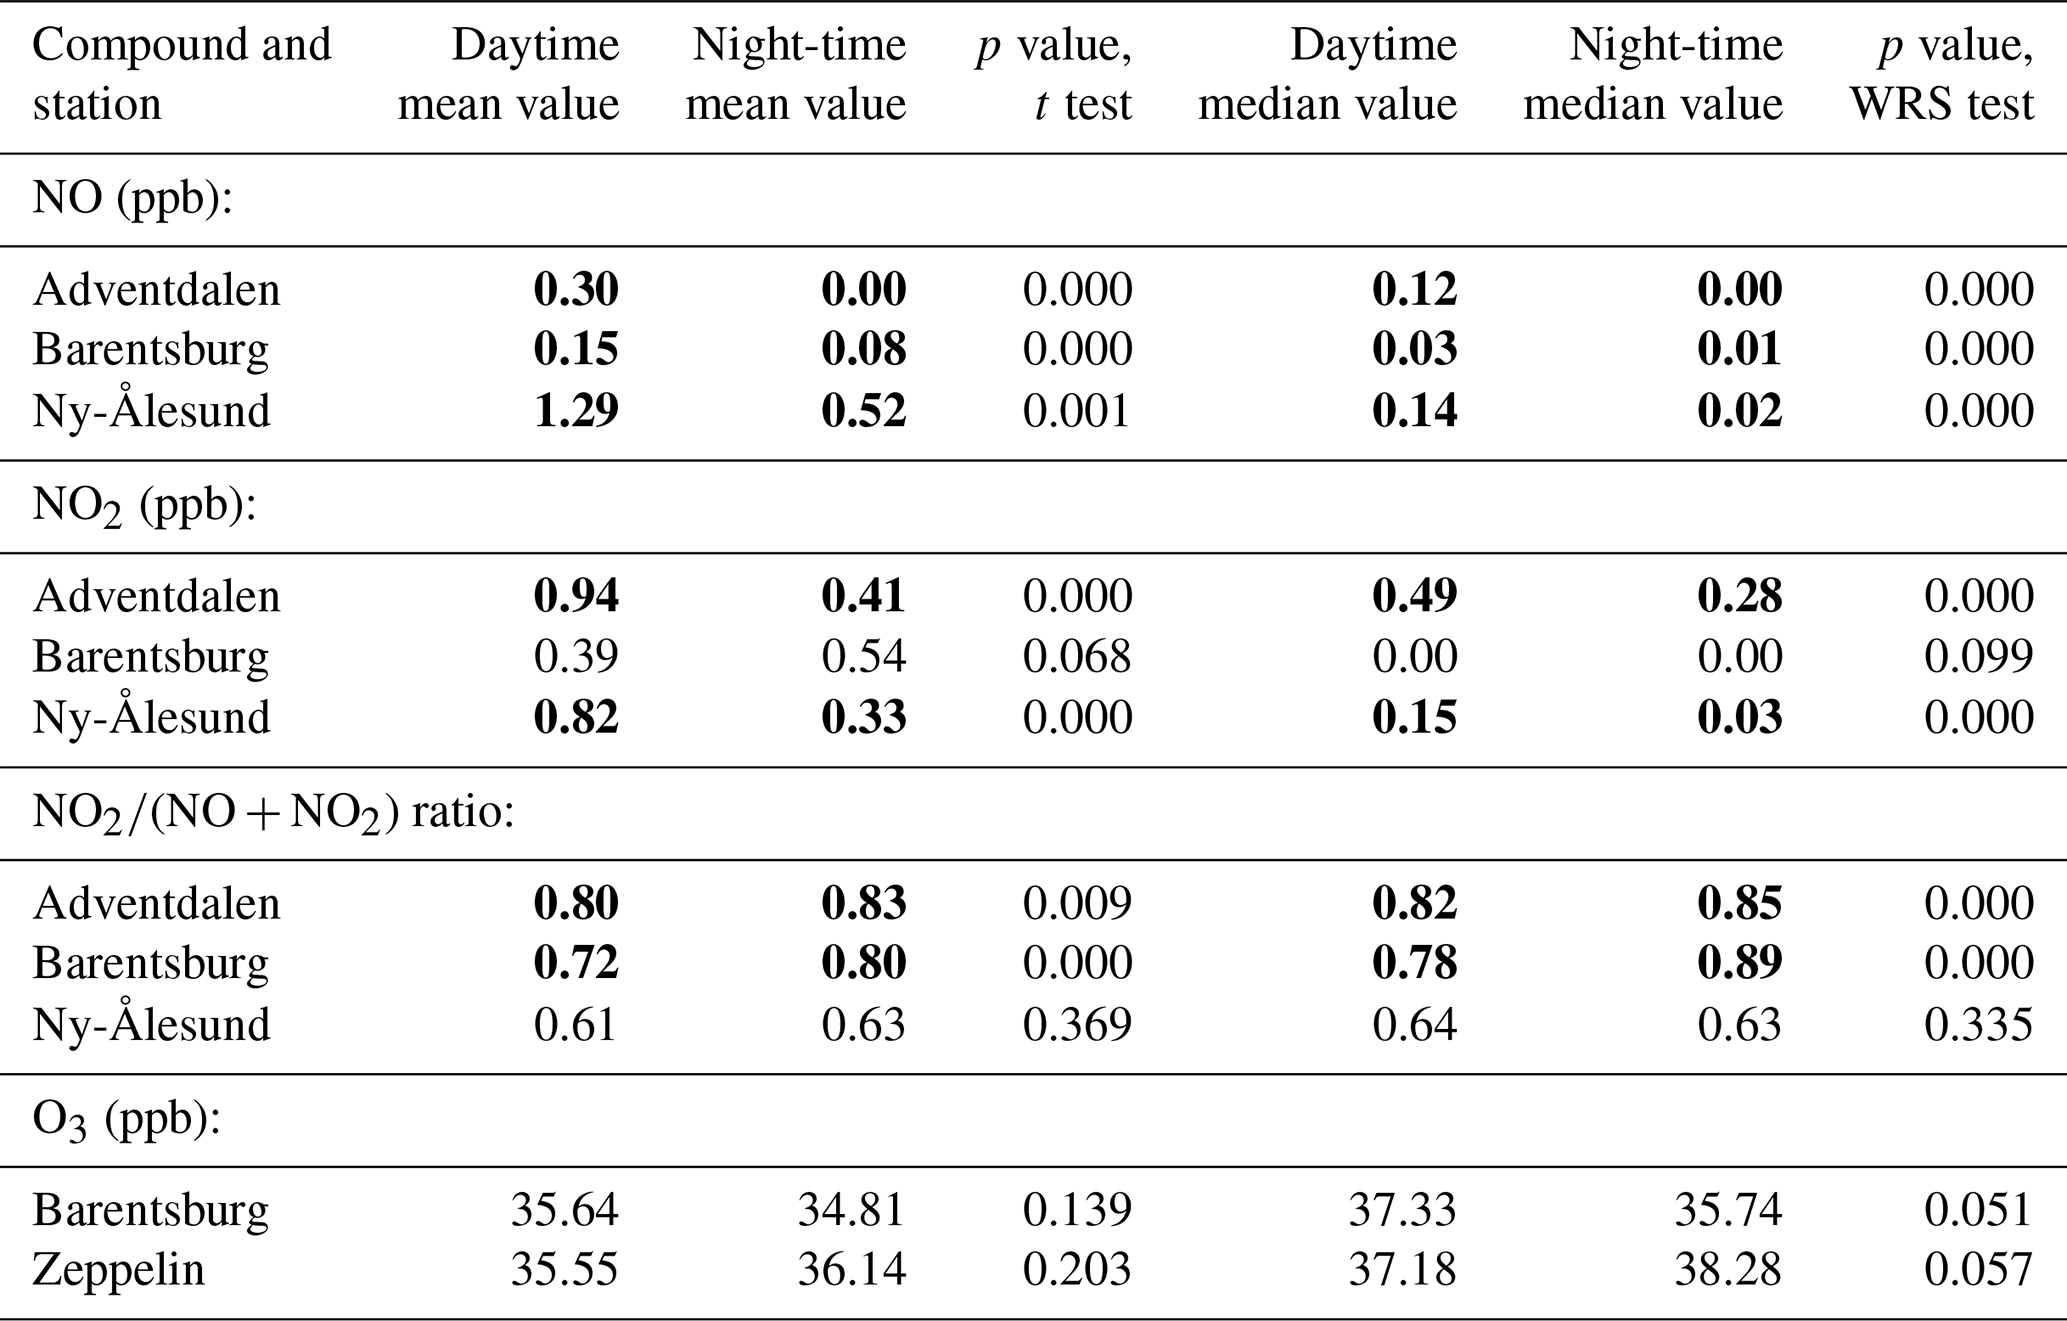
The ratio is quite high in Adventdalen and in Barentsburg and exhibits diurnal variation, while it is much lower in Ny-Ålesund, and there is no statistically significant difference between its day and night values. This may be explained by the fact that the measurement station in Ny-Ålesund was located much closer to the diesel power plant, a constant source of fresh NOx emissions, where the ratio is much lower irrespective of the time of the day (Beine et al., 1996). The lowest hourly ratio of 0.29 and the highest peak of NOx were observed in Ny-Ålesund at 17:00 UTC 28 April (Fig. 2). The concentration of NO and NO2 was 87.8 and 16.4 ppb, respectively, which indicates the presence of a strong emission source, for example snowmobiles, in the immediate vicinity from the station. Since this was a single NOx peak in the data, the ratio was unusually low, and the meteorological conditions were untypical for pollution accumulation in Ny-Ålesund (south-easterly wind with moderate speed of 5.3 m s−1); hence this value has been excluded from further statistical analysis.
NO is a primary product of fossil fuel combustion (Seinfeld and Pandis, 2006; Arya, 1999), and a higher ratio is expected close to the emission source. The station in Adventdalen is located at a distance of 5 km from the coal power plant, and snowmobile traffic there is a temporarily emission source present mostly during daytime. In contrast, measurement stations in Barentsburg and Ny-Ålesund are located near the power plants, constantly releasing combustion products at a variable rate. Thus, it is noticeable in Adventdalen that the NO concentration is close to zero during the night (dark blue bar in Fig. 5a) in the absence of fresh traffic emissions and photochemical conversion of NO2 to NO. As the traffic intensity increases during the day, the NO concentration rises, however, and so does the NO2 concentration (red bar in Fig. 5a), since there is a rapid conversion of NO to NO2 by the reaction with O3.
There is a slight increase in the O3 values in Barentsburg (grey line in Fig. 5b) during daytime. In contrast, a slight decrease in daytime O3 concentration is observed at the Zeppelin station. The discrepancy in the diurnal O3 profiles from the two stations may be explained by the difference of the altitude of each of the two stations and response of the measurements to the boundary layer dynamics. The ERA5 data show diurnal variation in the PBL height for both locations with highest average values of 462 and 293 m, in Barentsburg and Zeppelin, respectively, for 13:00 UTC. The Barentsburg station is located at the altitude of 50 m a.s.l. and samples air within the ABL. During the daytime, the vertical mixing between the atmospheric surface layer and the air masses aloft enhances, and the boundary layer height increases. This mixing process may enrich the surface layer with O3. A similar influence of convection on replenishing the O3 in the Arctic ABL after the depletion events has been described in the work of Moore et al. (2014). In contrast, the Zeppelin station is located at the altitude of 474 m a.s.l. and mostly samples air from the free troposphere with higher O3 concentration, and thus the data from this station do not exhibit similar diurnal variation as the Barentsburg station. However, the magnitude of these effects is small, and according to the t test and the WRS test, there is no statistically significant difference between the night-time and daytime O3 concentrations measured at the stations (Table 1).
The average NO and NO2 concentrations measured at the stations are distributed unevenly over the wind directions. In Adventdalen, the average wind speed was 5.1±3.1 m s−1. The south-easterly wind dominated during the field campaign (Table 2), and there was no significant difference between the daytime and night-time observations. The highest average daytime NO and NO2 concentrations were observed when the wind was from north-east and south-east in Adventdalen (Fig. 6). To test if the size of snowmobile motorcade has an influence on the NOx concentration in Adventdalen, manual observations of the number of snowmobiles were done in 19 d. In general, the effect of a large number of snowmobiles was only noticeable in the NOx data when there was low wind speed. For example, in the evening of 1 May 2017, the wind speed was 1.9 m s−1, and the NO2 concentration increased sharply to 7.3 ppb due to 21 snowmobiles passing by the station. A group of a similar size was passing by in the evening of 2 May 2017, but the effect on NO2 values was 3 times lower as the wind speed was higher (4.0 m s−1). The maximum hourly NO2 concentration of 11.4 ppb was measured during the Easter holiday on 13 April 2017. In that day, the combination of increased recreational traffic and mild weather conditions (wind speed below 1 m s−1 and air temperature −8 ∘C) led to accumulation of concentration 13 times higher than daytime hourly average measured during the field campaign. Such low wind speed is untypical for the wind regime in Adventdalen, where normally ventilation is sufficient to effectively disperse NOx emitted by the usual amount of motorized traffic. The highest average night-time NO2 concentrations were detected when the wind was from north-west, which reveals possible influence of the coal power plant. The average night-time concentrations of NO were very low, regardless of the wind direction.
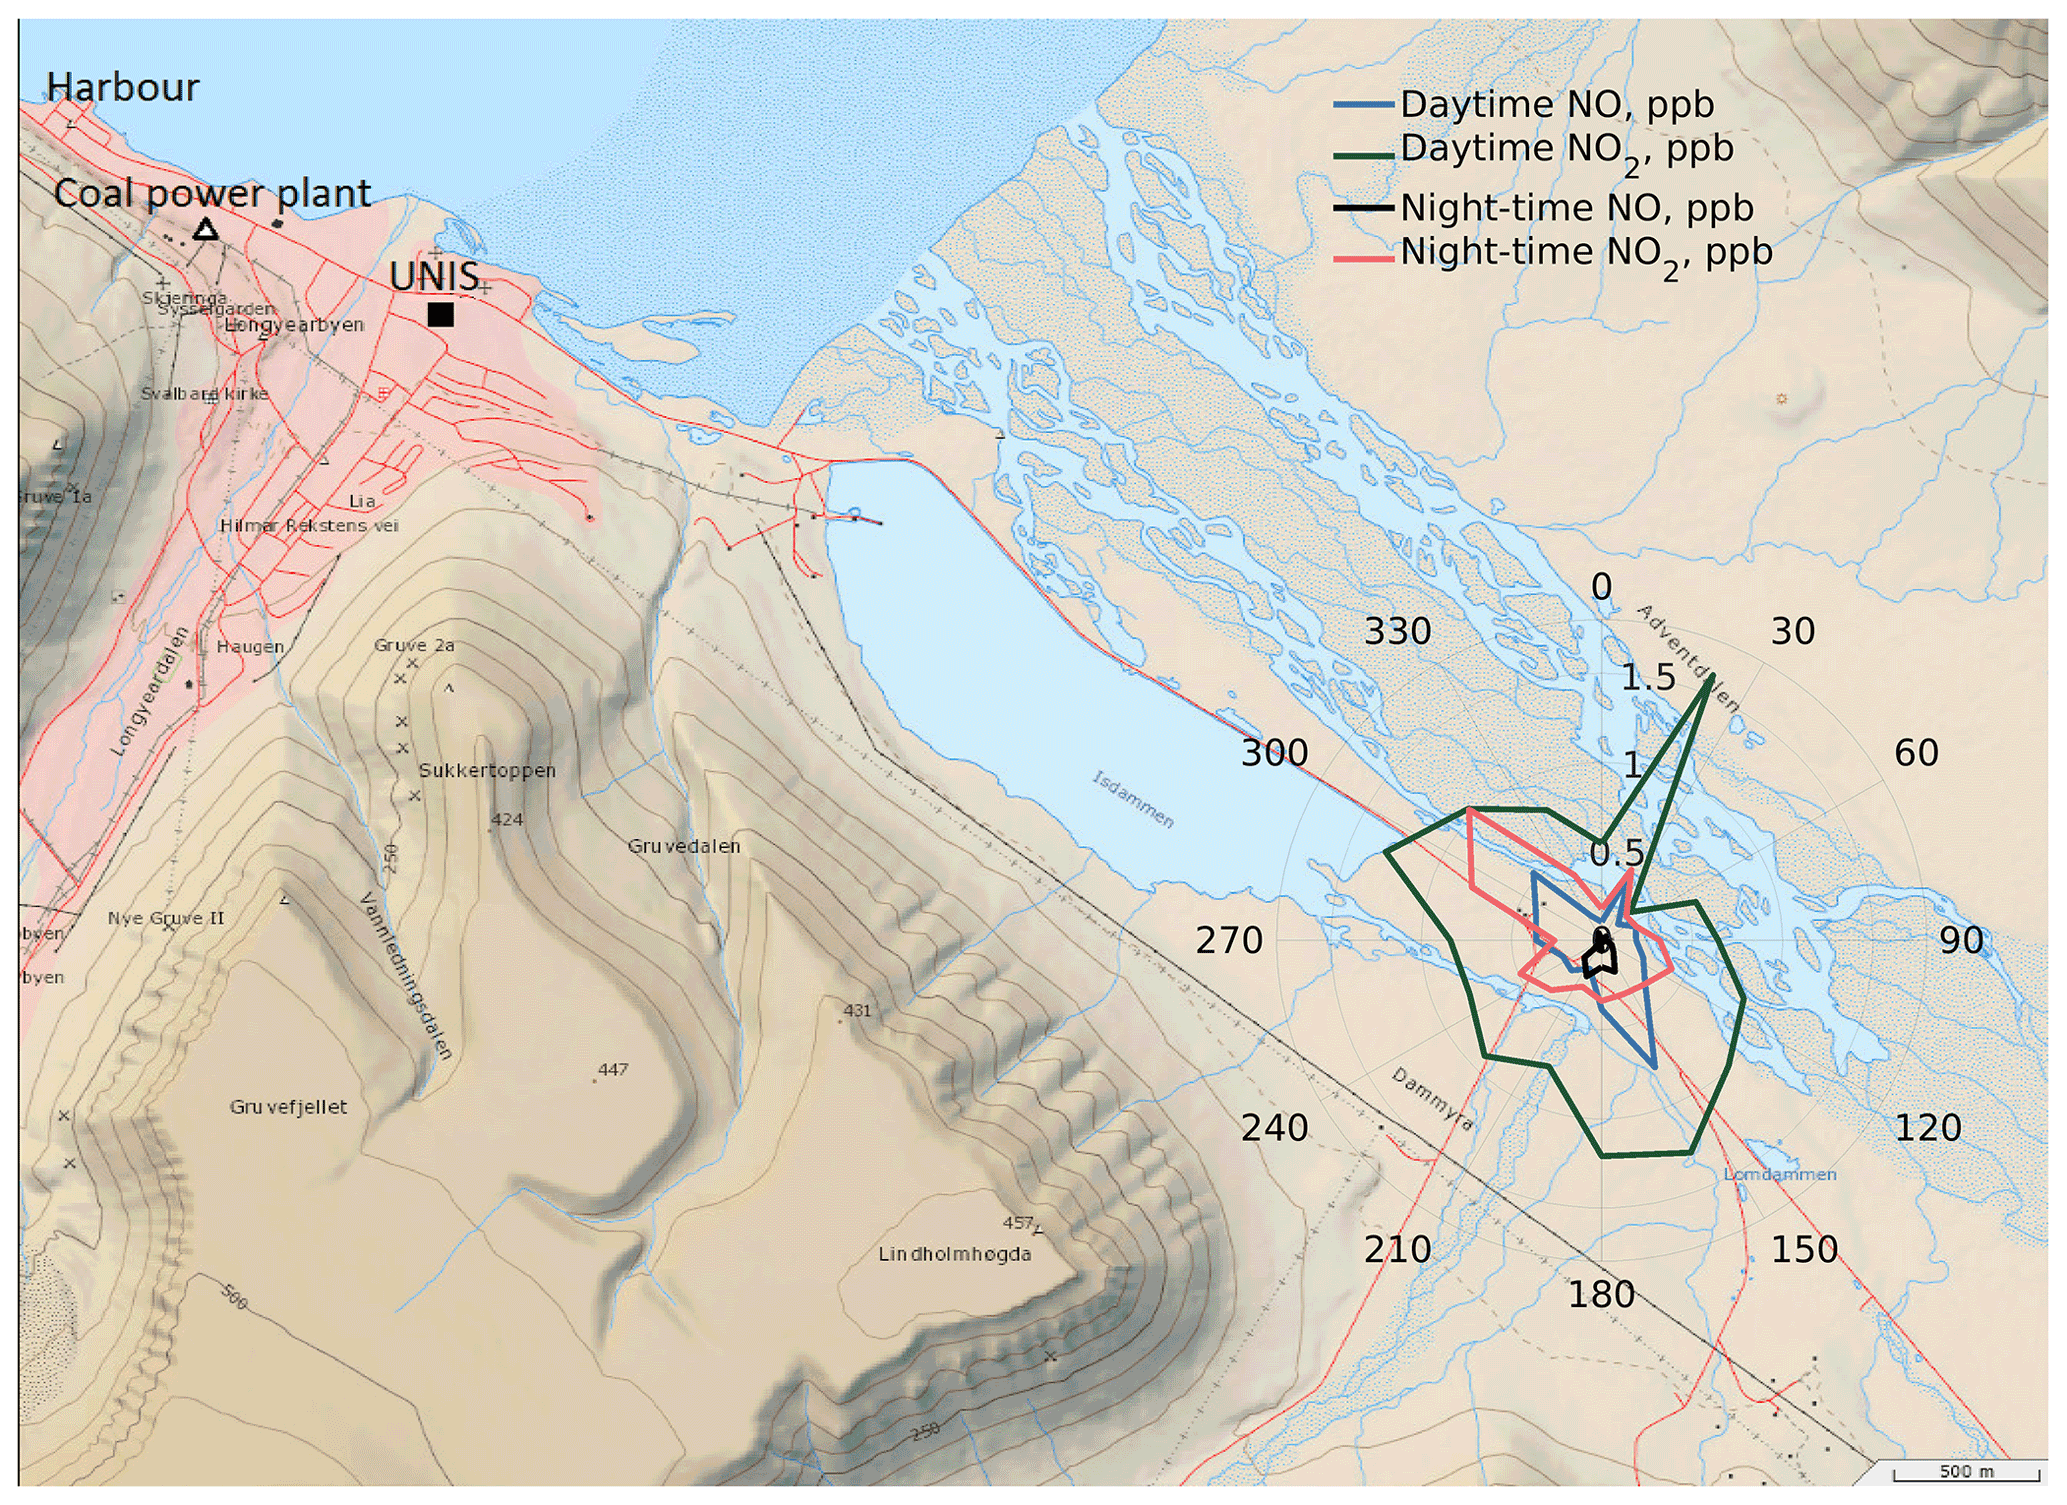
Figure 6Distribution of average NO and NO2 concentrations over wind directions in daytime and night-time at the station in Adventdalen. The background map is made using the online tool https://toposvalbard.npolar.no/, provided by the Norwegian Polar Institute.
Figure 7a and b illustrate distribution of NO and NO2 concentrations over wind directions in Ny-Ålesund and Barentsburg, respectively. South-easterly wind with average speed of 3.6 and 3.9 m s−1 in daytime and night-time, respectively, was dominating in Ny-Ålesund. However, the highest average NOx concentrations in Ny-Ålesund were measured when the wind was coming from the north (Fig. 7a). This points clearly to the local diesel power plant being the main emission source. Similar results regarding the influence of the local power plant in Ny-Ålesund on NOx concentrations were presented in Dekhtyareva et al. (2016) and Johnsrud et al. (2018). During the field campaign, the prevailing wind in Barentsburg was from south and south-east, with an average speed of 2.5 m s−1 and from south-east and east with mean speed of 2.3 m s−1 in daytime and night-time, respectively. The NOx concentrations measured there were much lower and more evenly distributed over different wind directions than in Ny-Ålesund (Fig. 7b). The coal power plant operates day and night and, in the light wind conditions, may contribute to accumulation of local pollution in the settlement even in the absence of south-westerly wind.
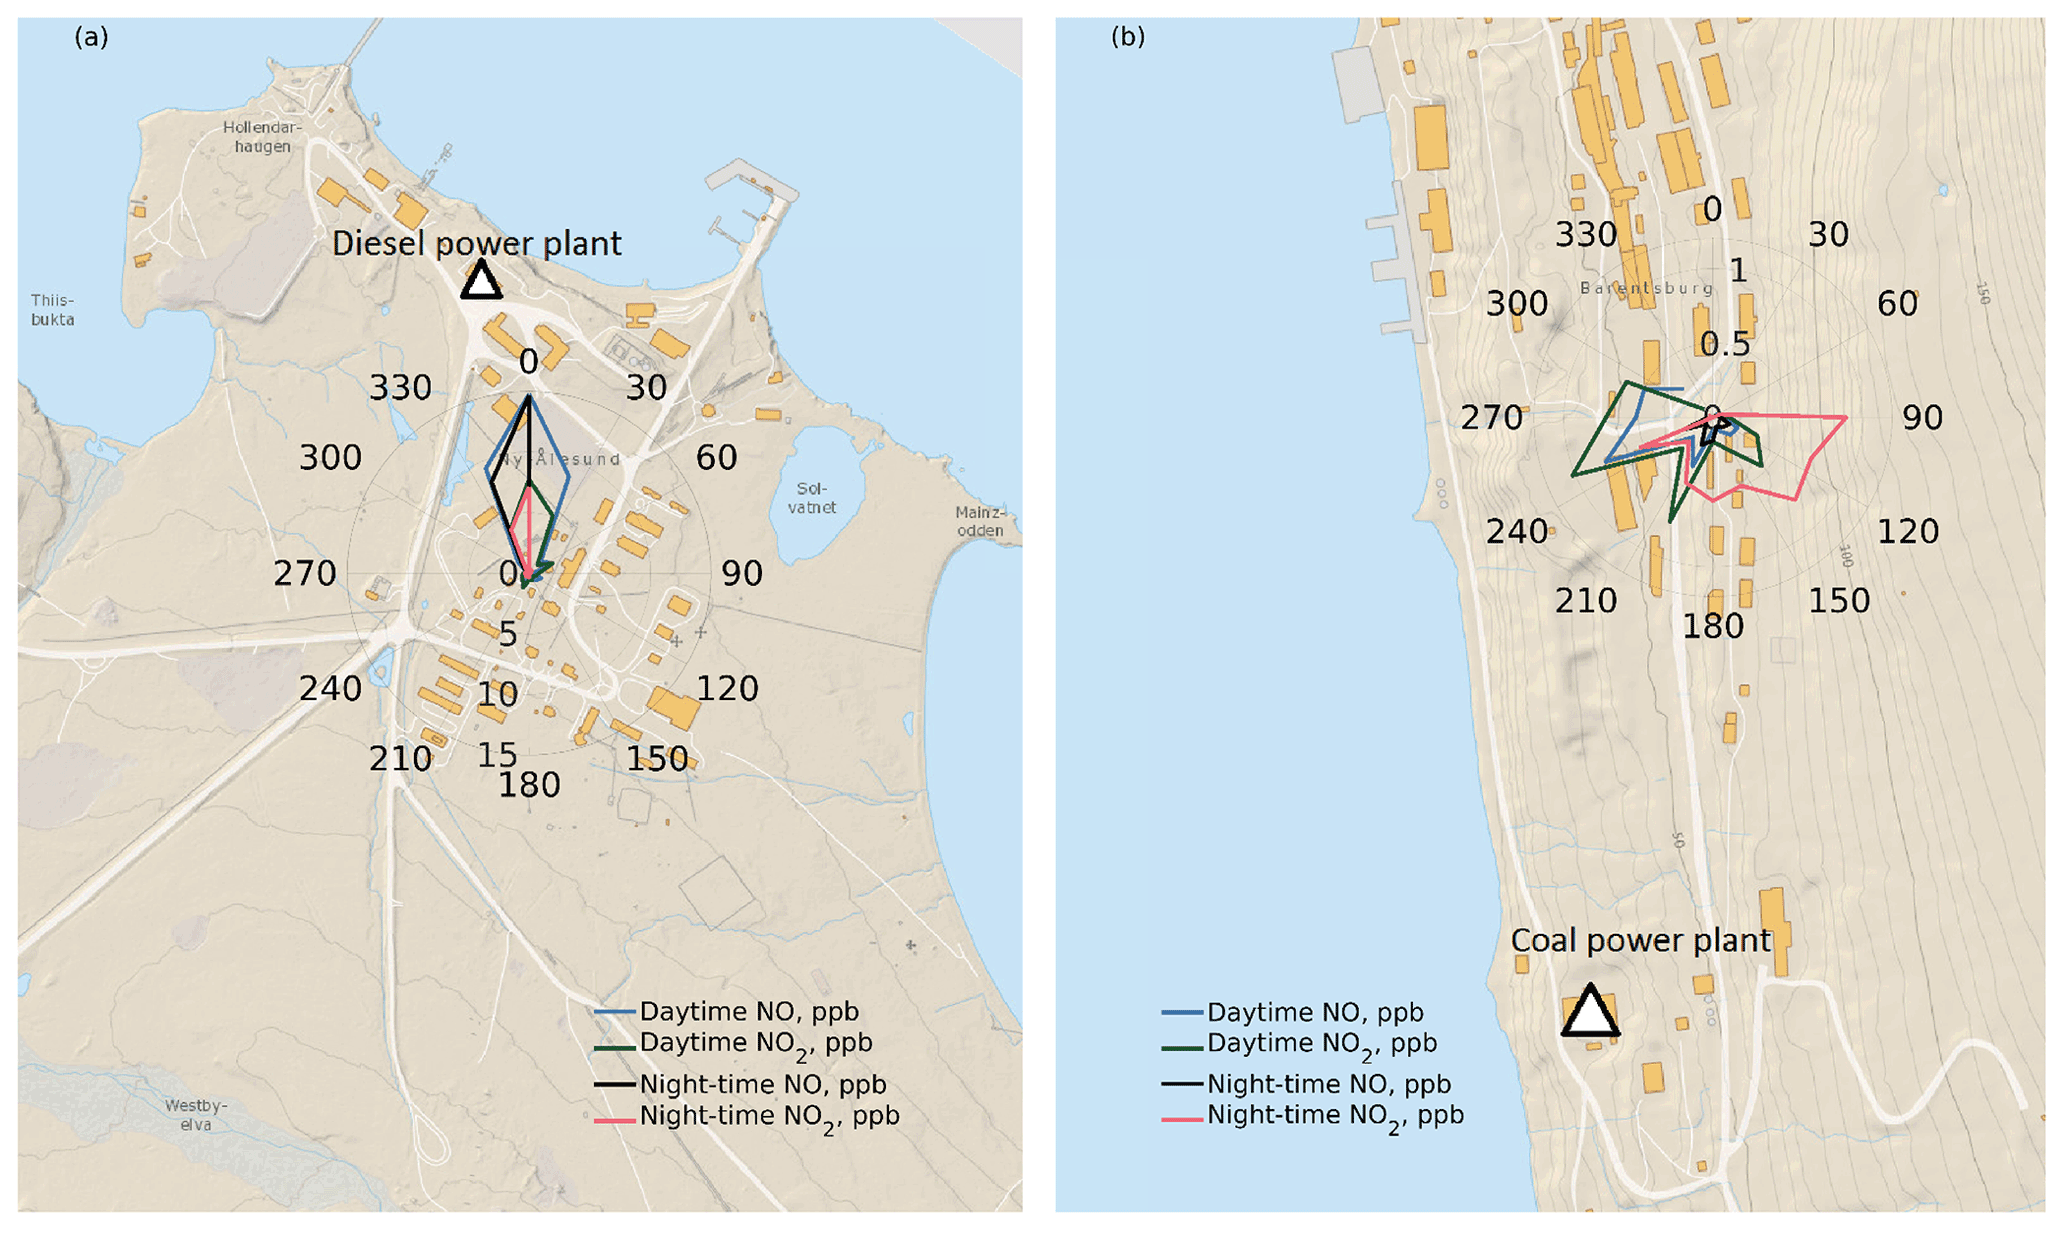
Figure 7Distribution of average NO and NO2 concentrations over wind directions in daytime and night-time at the stations in Ny-Ålesund (a) and Barentsburg (b). The background maps are made using the online tool https://toposvalbard.npolar.no/, provided by the Norwegian Polar Institute.
3.2 Influence of large-scale weather regimes on the concentrations of measured compounds at the three stations
An overview of median concentrations of measured compounds and prevailing local meteorological conditions for the nine sub-periods defined based on the prevailing weather regimes is given in Table 2. The wind directions observed at the stations during each of the sub-periods have been sorted into 16 bins with a 22.5∘ interval. The three main wind directions for each sub-period and for the whole campaign are stated with letters in Table 2. A detailed analysis of the meteorological conditions prevailing during each of the weather regimes and their influence on the concentration of the compounds measured at the three station is given below.
The “no regime” conditions were present for almost 20 d or 37 % of total campaign duration. The sub-period I lasted for 14 d and was characterized by the lowest median temperatures and UV irradiance at all stations and by synoptic-scale north-easterly flow (Fig. 8a). However, the conditions were inhomogeneous for this period: there were two quick passing cyclones on the 26 March and 3 April (pressure drops in Figs. 2b and 3b) that led to an increase in local air temperatures and wind speeds. In the sub-period I, the temperature inversions were observed in 46 % of the radiosonde profiles from Ny-Ålesund, but the median inversion strength was below 0.95 ∘C (median for the whole campaign).
The sub-periods II–V were characterized by Atlantic ridge (AR) and Scandinavian trough (ScTr). These regimes are characterized by the varying degree of geopotential height ridging over the North Atlantic at 500 hPa. During the AR regime, an upper-level north-westerly flow prevails (Grams et al., 2017). The strongest wind speed was observed in Adventdalen during the AR regimes, since the synoptic-scale lower-level flow (Fig. 8b and d) was parallel to the Adventdalen valley (Fig. 6). During the transition from AR to ScTr, the upper-level ridge weakened and shifted southwards (Grams et al., 2017), as did the cyclonic systems on the lower level (Fig. 8c and e). The AR and ScTr regimes were characterized by the PBL height being below the median value for the campaign at all sites. The temperature inversions were observed for the regimes II, III and IV with an inversion frequency of 67 %, 57 % and 13 %, respectively, and the inversion strength was above the median for the campaign.
The sub-period VI was a 3 d “no regime” transition between the AR and ScTr and two blocking regimes: Scandinavian blocking (ScBL) and Greenland blocking (GL). This sub-period was characterized by the synoptic-scale westerly wind bringing warm Atlantic air over Svalbard (Fig. 8f), increasing local temperature and PBL height and adding the westerly component to the wind direction at all stations.
During the sub-period VII (ScBL), the positive geopotential height anomaly was located over northern Scandinavia, and part of the upper-level flow was deflected poleward around the blocking anticyclone (Grams et al., 2017). The anticyclonic movement was pronounced in the lower-level flow (Fig. 8g), and the synoptic-scale north-westerly flow prevailed over the western part of Svalbard. The local wind speed, temperature and PBL height decreased.
The sub-period VIII (GL) was characterized by the strong positive anomaly in the geopotential height at 500 hPa over Greenland and the prevailing upper level north-westerly wind (Grams et al., 2017). The lower-level blocking over Greenland promoted north-easterly flow over Svalbard (Fig. 8h).
The sub-period IX (“no regime”) was characterized by the strong anticyclone over the Barents Sea, that led to pronounced transport of warm Atlantic air with southerly flow to Svalbard (Fig. 8h). No temperature inversions were detected in the radiosonde data from Ny-Ålesund for the sub-periods VII, VIII and IX.
The elevated NOx concentrations were observed in Ny-Ålesund and Adventdalen during the sub-periods I–V. This may be explained by the enhanced accumulation of locally emitted NOx in the ABL due to suppressed vertical mixing on cold days associated with the AR and ScTr regimes. In Adventdalen, NOx concentrations are not dependent on the wind direction (Fig. 6 and Table 2), and east-south-easterly and south-easterly are the dominant wind directions for all regimes except for the period VI. The highest median values of NOx were observed during the periods with the lowest PBL height, ScTr regimes. During the periods VI and VII, the PBL height increased, but westerly and west-north-westerly wind might have brought pollution from the coal power plant and the town of Longyearbyen to the Adventdalen valley (Fig. 6). In Ny-Ålesund, the highest median NOx value was observed in sub-period I due to the presence of north-north-westerly wind that brought the plume from the power plant to the measurement station (Fig. 7a).
In contrast to Adventdalen, the boundary layer height and cold temperatures played a secondary role for the NOx concentrations in Barentsburg, and the controlling factor was south-westerly component of the wind for the most polluted periods. The highest median NOx values were detected during the sub-period VI, when south-south-westerly wind was dominating. The major emission sources in Barentsburg are located on the seashore, and warmer marine air from west and south-west may bring local pollution to the station situated on the hill above these sources (Fig. 7b). However, the second highest median NOx value was observed for the sub-period II, the period with the lowest PBL height and easterly wind at this station. The wind direction was not from the coal power plant, but the wind speed was very low, and thus, the local pollution could accumulate in the ABL if a strong inversion was present aloft.
Table 2Median values of measured parameters and the three most often observed wind directions for different weather regimes and for the whole campaign. The concentrations exceeding median value for the whole campaign are shown with bold font.
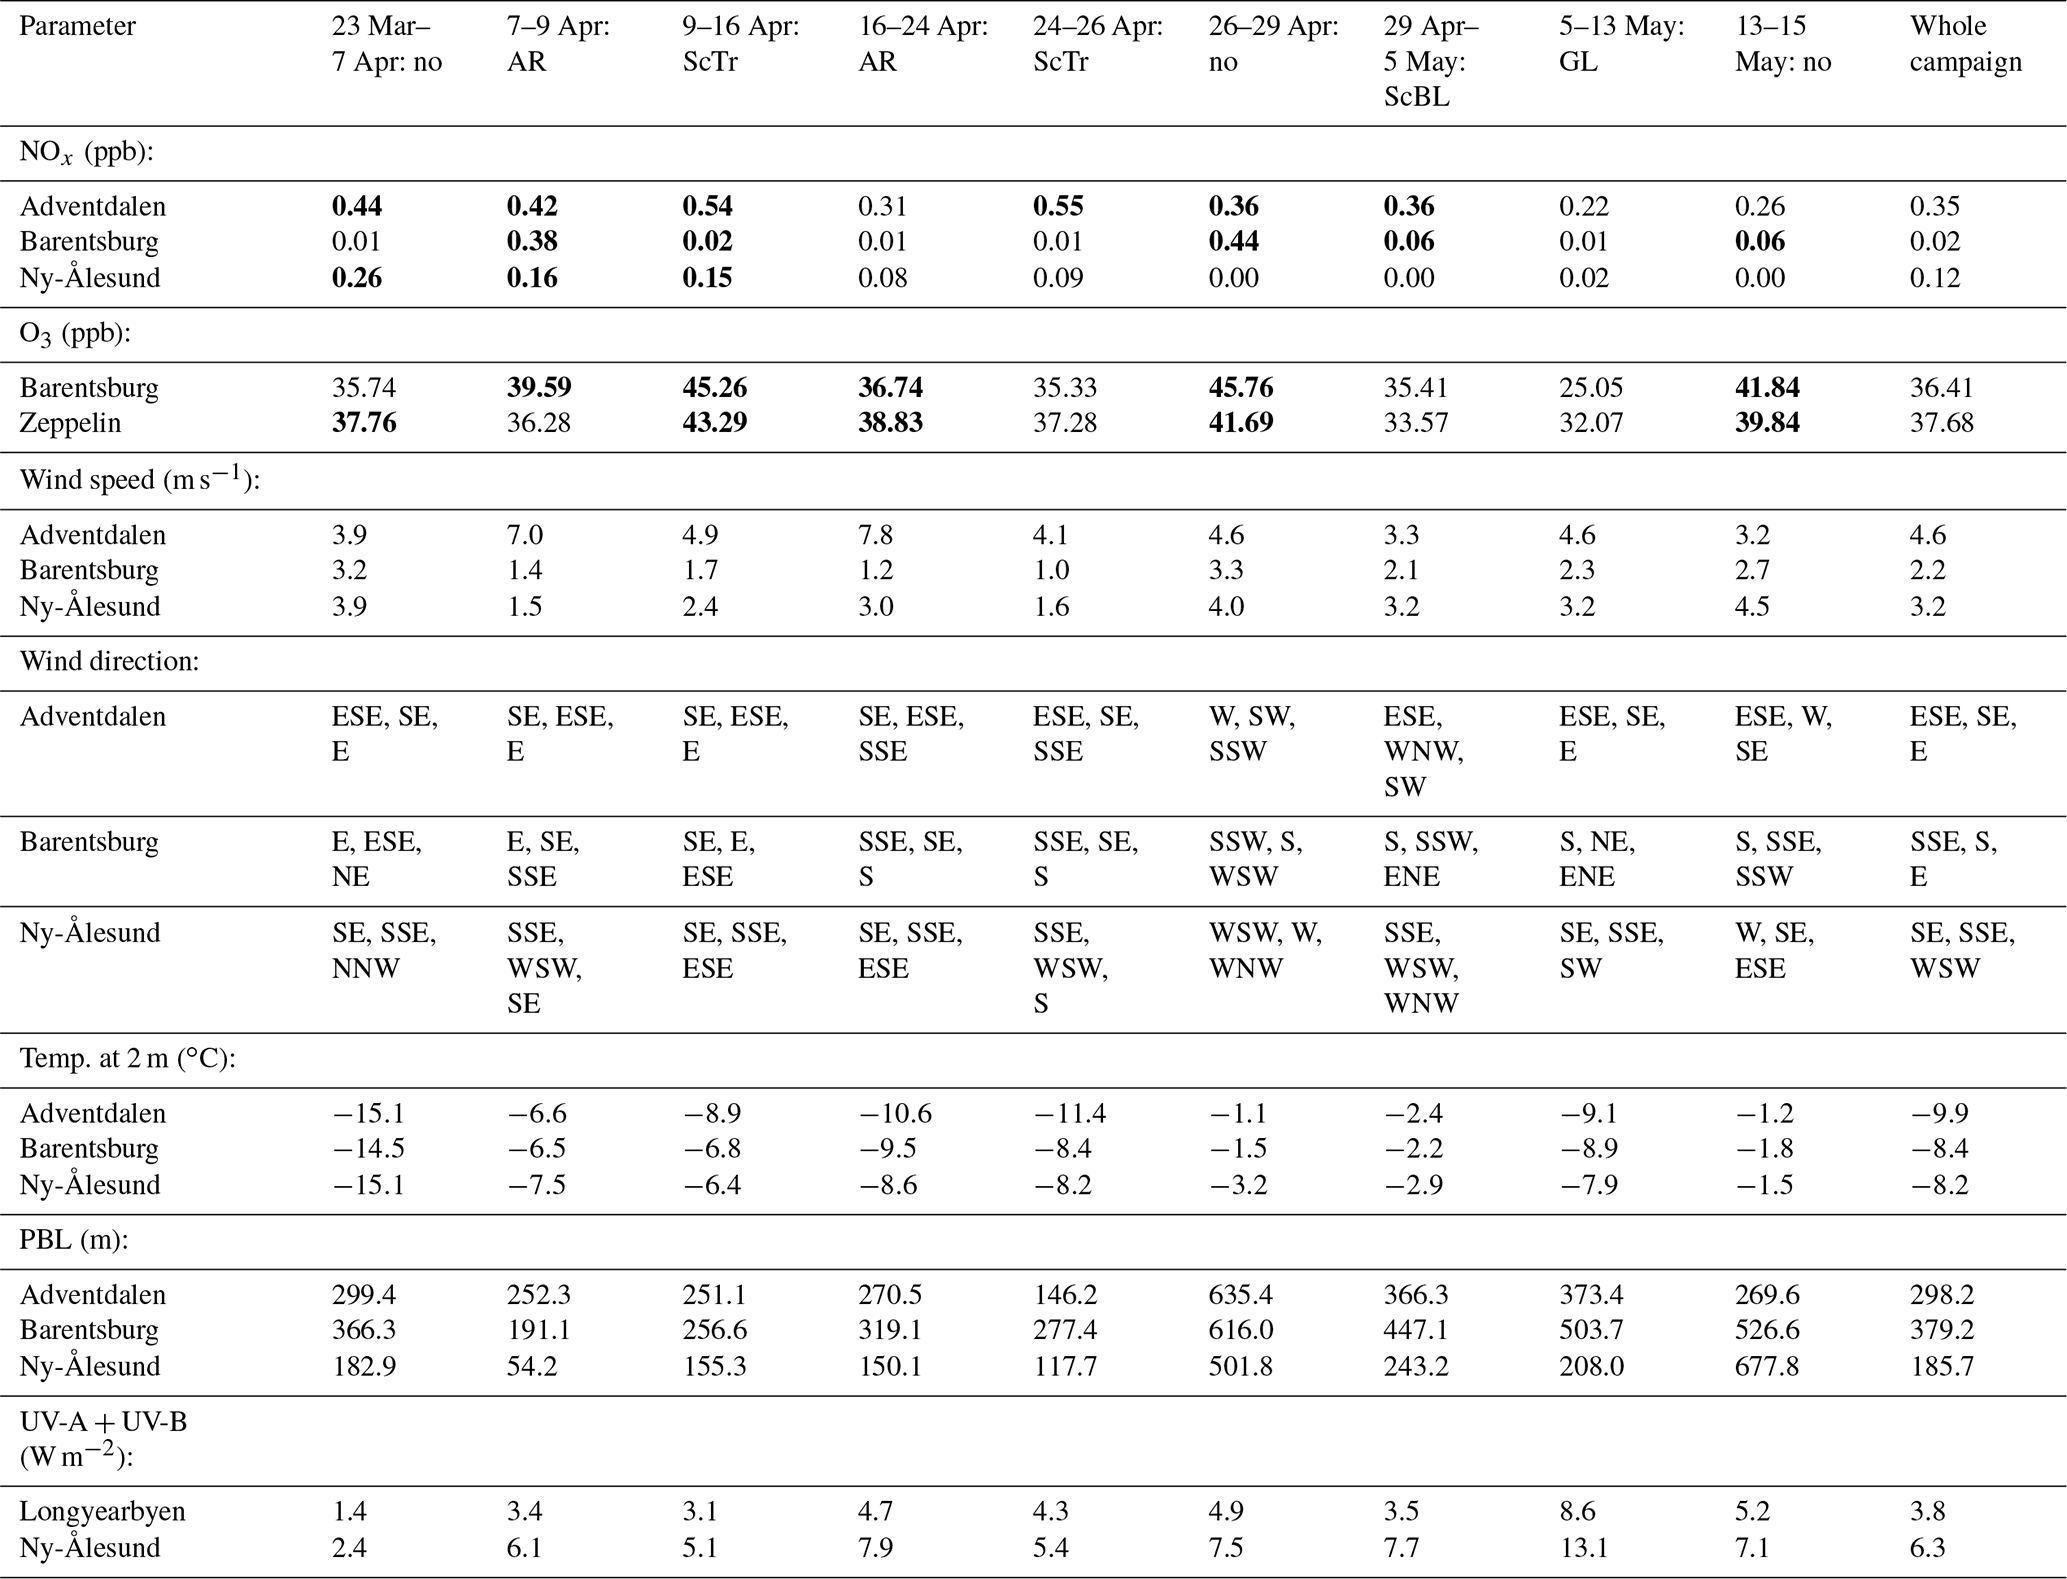
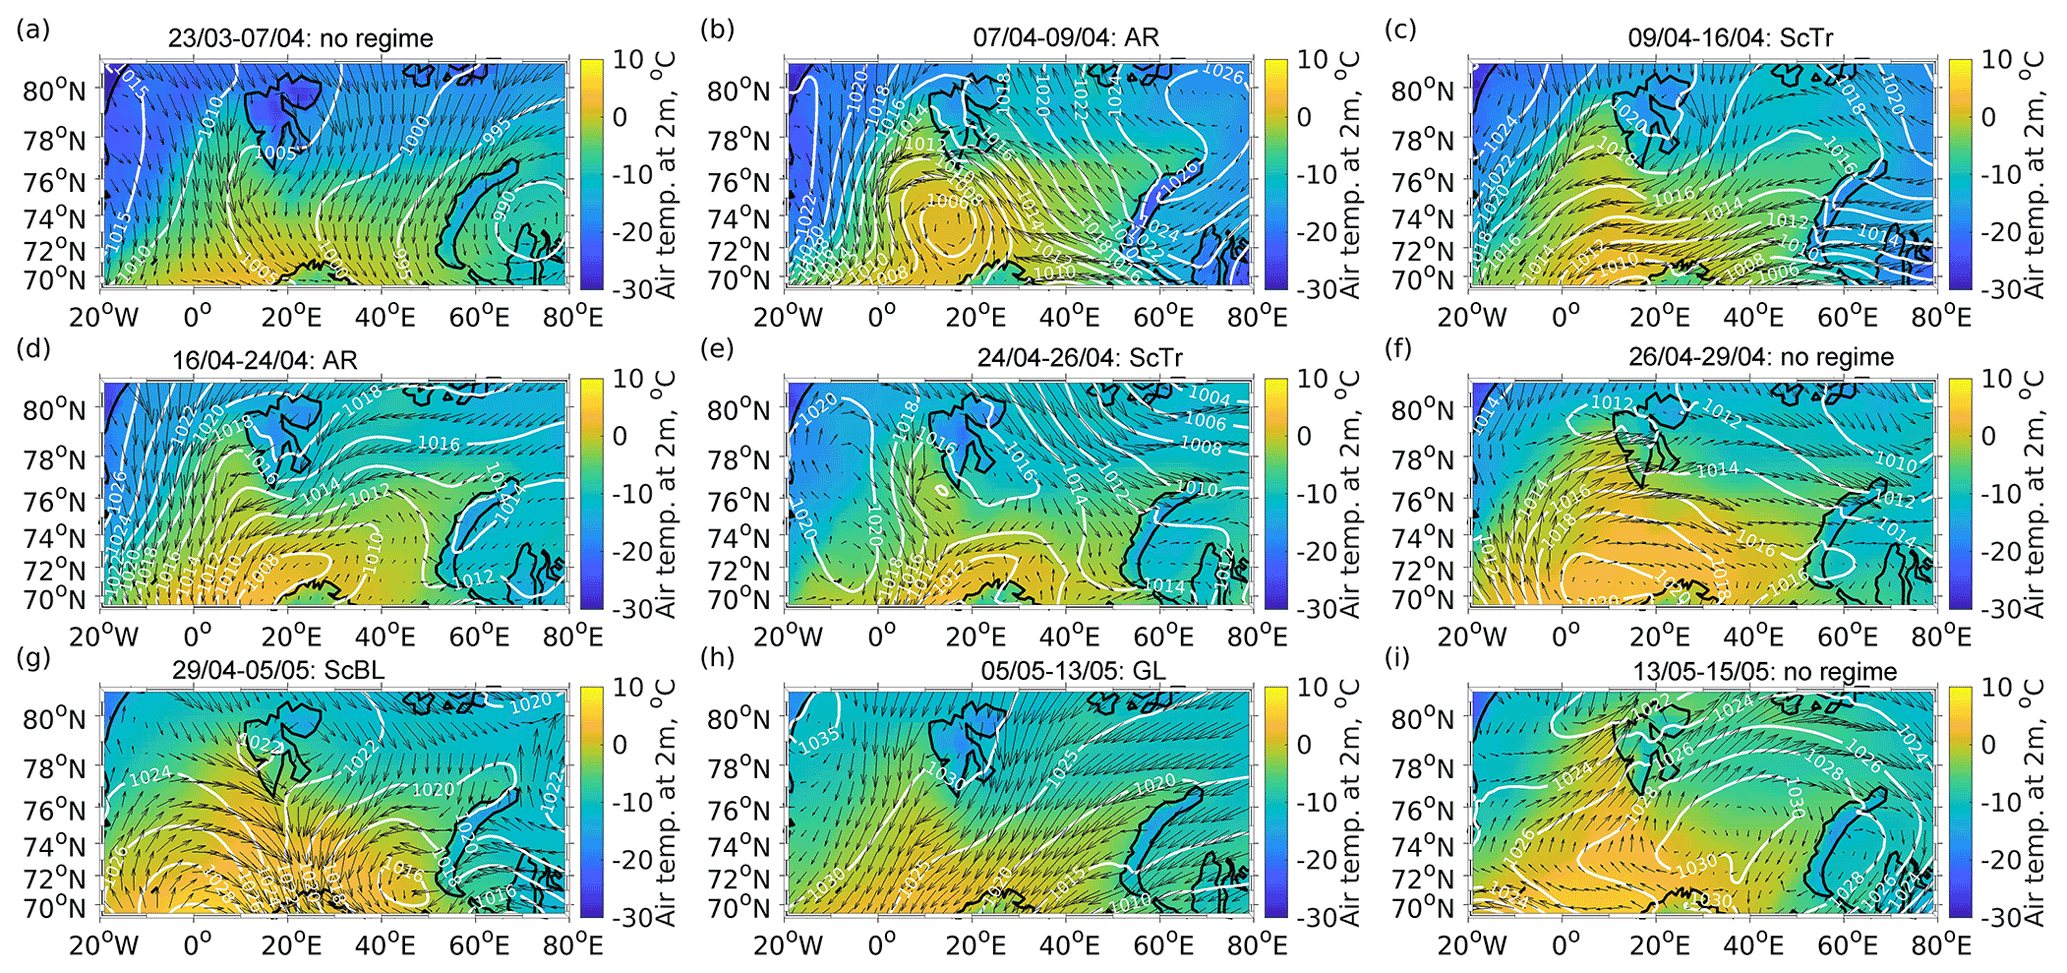
Figure 8Synoptic-scale meteorological conditions in ERA5 reanalysis data for the nine sub-periods. The colour scale and the white contour lines show air temperature at 2 m height and mean sea level pressure, respectively. The black arrows represent the prevailing wind direction and show the length relative to the wind speed. They are plotted with a resolution of 2∘ longitude and 1∘ latitude.
The O3 data show similar variability for the Zeppelin station and Barentsburg. The concentrations below the campaign's median were observed for the sub-periods V, VII and VIII. The FLEXPART 10 d backward trajectory probability contours show that for these sub-periods, the air masses passed over the region north of Svalbard where the concentration of BrO was elevated (Fig. 9e, g, h). Conversely, the sub-periods III, IV, VI and IX, with O3 concentration above the median at both stations, are characterized by the air masses arriving from the south-east, east, west and south-west (Fig. 9c, d, i), respectively. In the sub-period I, 24 % of the data from Barentsburg were missing. This sub-period's concentrations at the Zeppelin station were slightly higher than the campaign's median, despite the most significant O3 depletion episode occurring on 31 March–1 April (Fig. 2). The trajectory contours show possible influence of the local depletion in the Svalbard region (Fig. 9a). In the sub-period II, 67 % of the data from the Zeppelin station were missing (Fig. 2). The O3 concentration in Barentsburg was above the median for this sub-period, and the trajectory data show the air masses arriving from the south-east (Fig. 9b). As in previous studies of Hirdman et al. (2009), the downward transport of O3-enriched air masses from higher altitudes played a significant role during the 2017 campaign. The percentage of trajectory points reaching elevations above 2000 m was highest for the sub-periods III, VI and IX (27 %, 33 % and 24 % of the total number trajectory points for each sub-period respectively). In contrast, during the sub-period VIII with the lowest O3 concentration at both stations, the percentage of elevated trajectory points was minimal, only 4 %. One can also see that the percentage of elevated trajectories varies for the same type of weather regime and determines importance of the downward air mass transport for the measured surface O3 concentrations in different sub-periods (e.g. ScTr regime in Fig. 9c and e and Table 2).
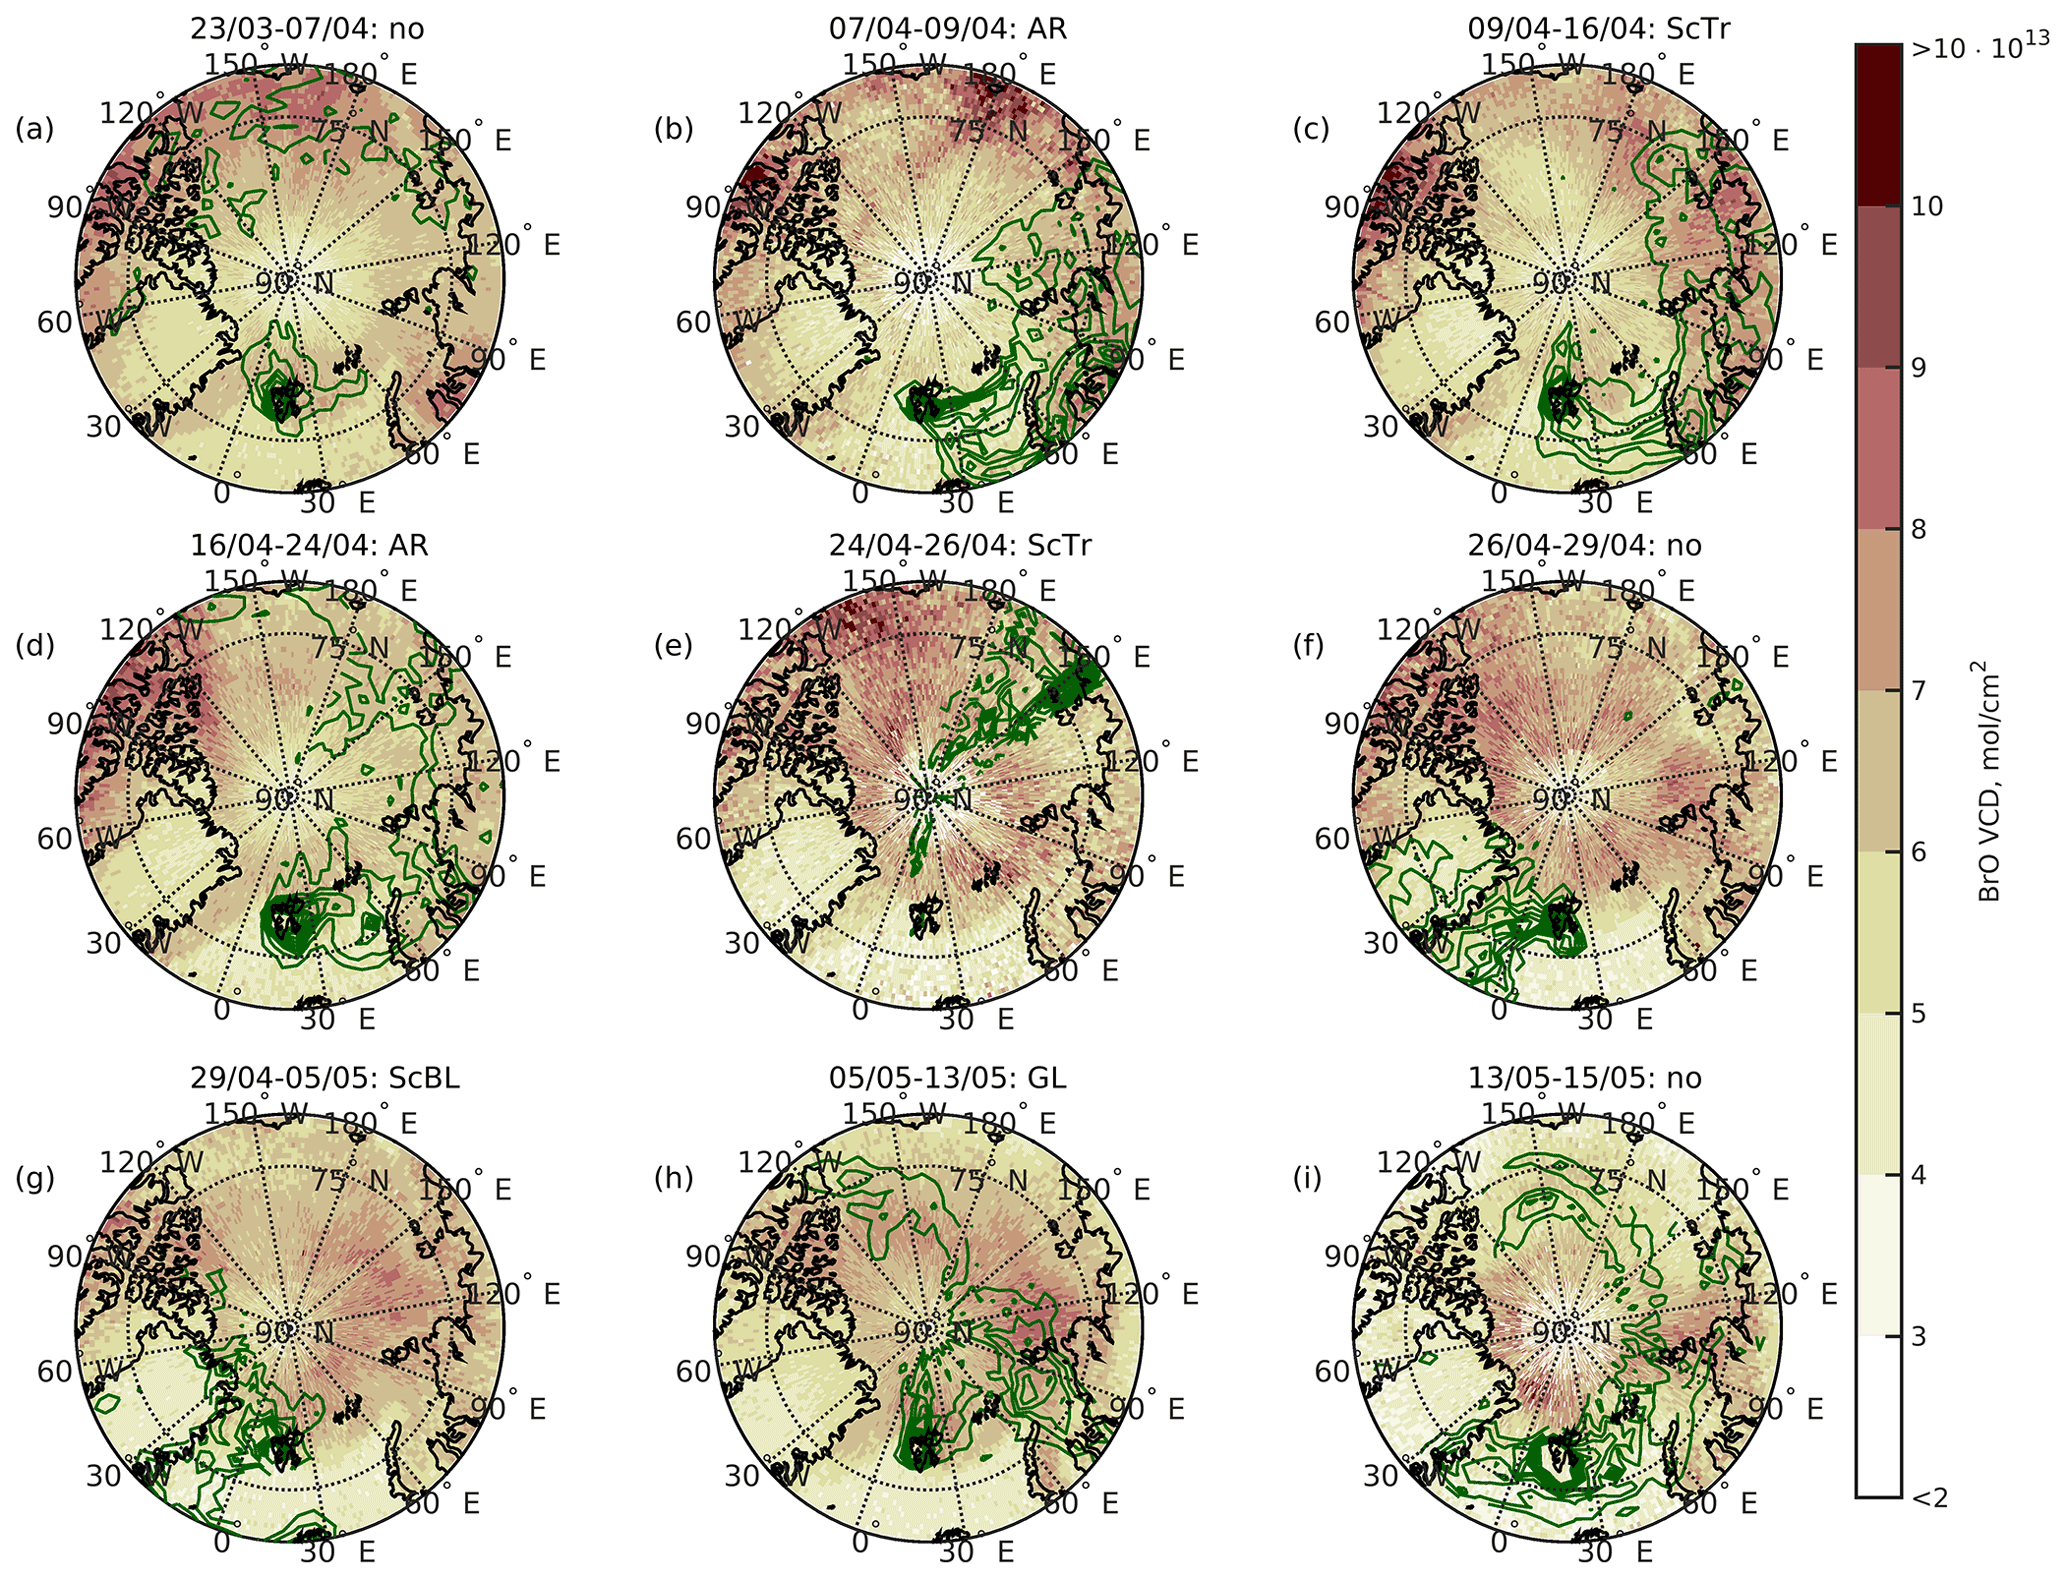
Figure 9FLEXPART trajectory probability for 10 d backward trajectories (dark green contours with step of 0.001) and GOME2 BrO vertical column density (VCD) (colour scale) for the different sub-periods. The percentage of trajectories descending from higher altitudes (>2000 m) is 7 %, 12 %, 27 %, 9 %, 9 %, 33 %, 18 %, 4 % and 24 % for the sub-periods in (a)–(i), respectively.
Two joint extreme O3 depletion events (31 March and 6 May 2017) and three increase events (13 April, 28 April and 3 May 2017) have been detected (Figs. 2 and 3). The HYSPLIT trajectory analysis shows that these O3 depletion events occurred when the cold air masses from the central Arctic reached Svalbard. The trajectory for the strongest depletion episode is shown in Fig. (10a). The concentration of O3 in the Arctic air masses may be lower because of a lack of sunlight and O3 precursors such as NOx, hydrocarbons and CO needed for the O3 formation. Further depletion may have occurred due to photochemical reactions with bromine species over the sea ice in the period from 30 March 2017 at 10:00 to 31 March 2017 at 17:00 when the trajectories passed the region with elevated BrO concentration between 80∘ N and 85∘ N. The simulated median sun flux was quite low (67 W m−2) but probably sufficient enough to support the halogen-induced O3 destruction, which might occur even under low-light conditions (Simpson et al., 2015). The trajectories for the increase events revealed southerly origin of the air masses, but source regions were different for all three cases. In the first case, air masses were arriving from the northern part of Russia and in the second one from North America and Iceland. However, the highest O3 concentrations at both stations were observed on 3 May 2017 when the air masses were transported from Europe (Fig. 10b). The air masses arrived in Svalbard from the west and did not pass over the areas with elevated BrO concentration.
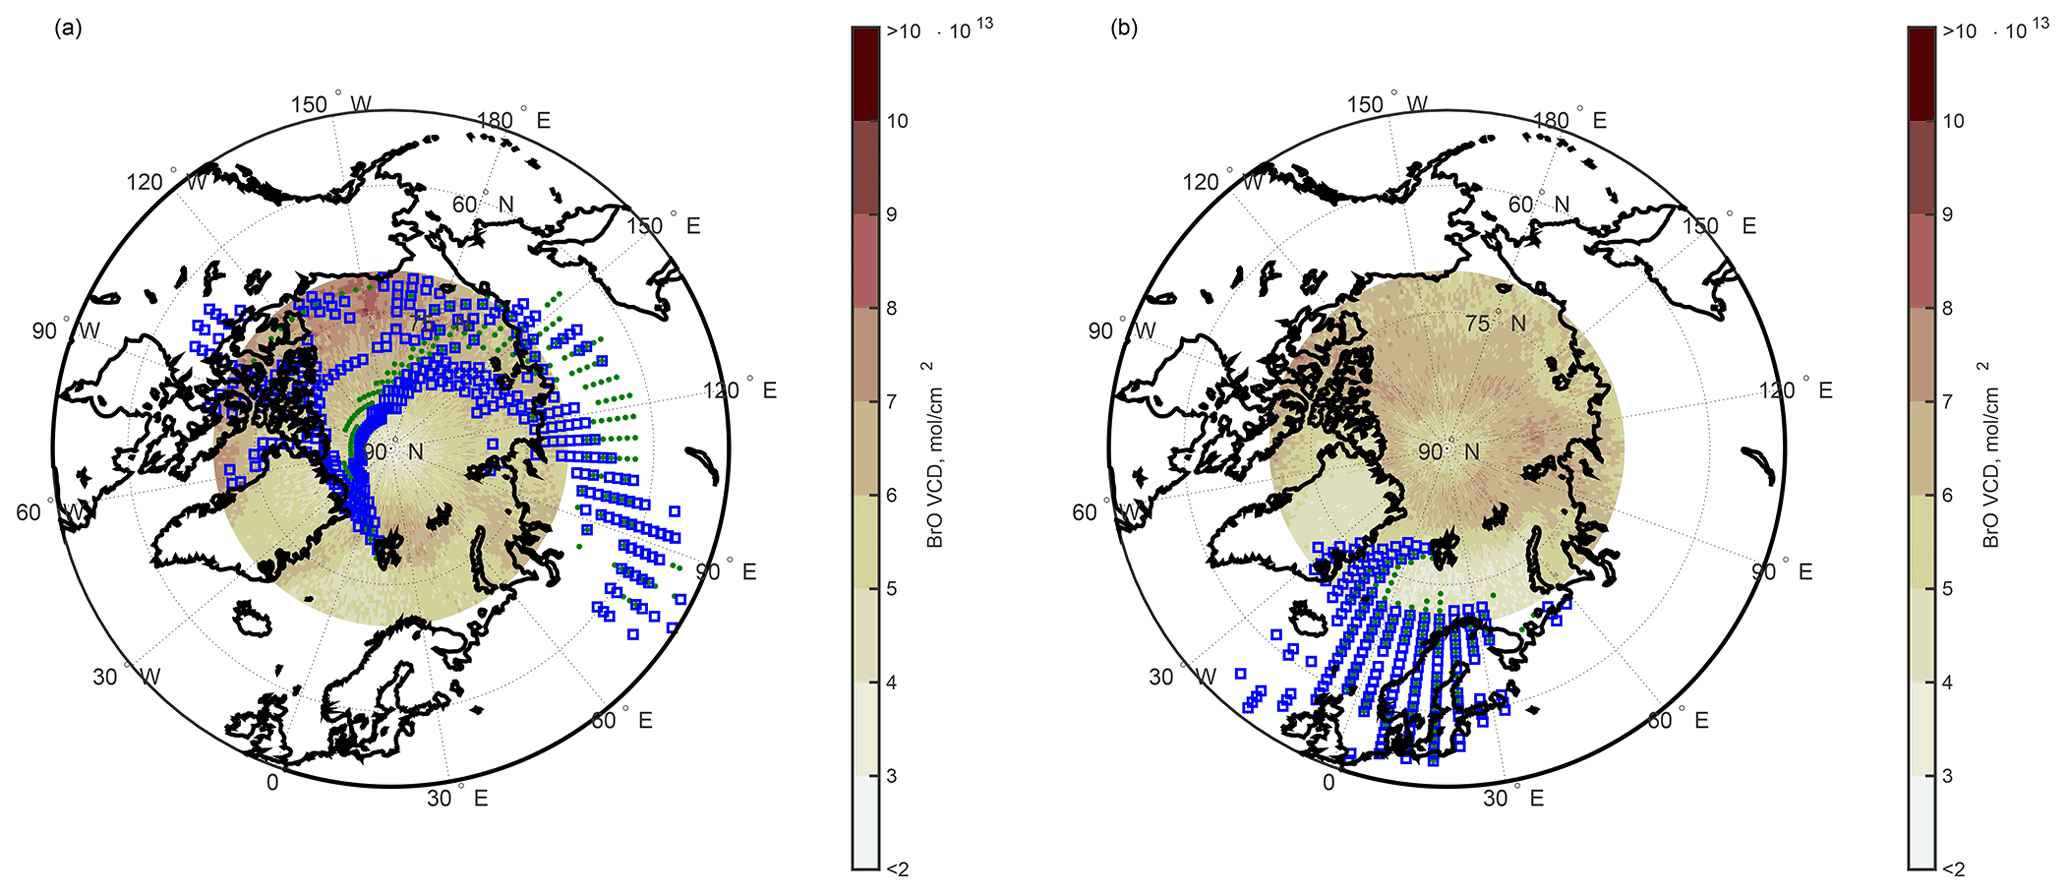
Figure 10HYSPLIT 10 d air mass backward trajectories probability for the strongest O3 depletion (a) and O3 increase (b) events detected both in Barentsburg (green dots) and at the Zeppelin station (blue squares). The points show the trajectory probability above the median calculated for the ensemble with 27 trajectories. The 10 d mean BrO total VCD for the Arctic region (>70∘ N) is shown with the colour scale. The percentage of trajectories descending from higher altitudes (>2000 m) is 1 % and 3 % for the depletion case (a) and 25 % and 14 % for the O3 increase (b) for Zeppelin and Barentsburg, respectively.
The NOx monitor in Adventdalen was located far away from stationary emission sources and showed the highest daytime ratio (Table 1). We would like to investigate how the ratios observed there were affected by photolysis. The photolysis rate of NO2 depends on solar zenith angle (Parrish et al., 1983), which in turn depends on day of year. Measurements were performed between days 81 and 134, and the noon solar zenith angle in Longyearbyen area varied from approximately 77 to 62∘ (Robertson et al., 2006). Following Eq. (15) in Parrish et al. (1983), the minimum clear-sky photolysis rate for the start of the campaign was 0.0026 s−1, and the maximum clear-sky photolysis rate for the end of the campaign was 0.0061 s−1 (black squares in Fig. A1a in Appendix A). There are many factors that affect NO2 photolysis rate, such as aerosol load, clouds, water vapour content and surface albedo (Trebs et al., 2009). The albedo may significantly increase the NO2 photolysis rate (Trebs et al., 2009), and Dickerson et al. (1982) suggested albedo of snow with respect to j(NO2) to be 93 %. Trebs et al. (2009) suggested in their Eq. (2) a polynomial fit between global irradiance and NO2 photolysis rate that includes both clear-sky and cloudy conditions and takes into account the contribution of albedo. The albedo calculated as the ratio of upward and downward short-wave radiation measured by a CNR1 net radiometer (Kipp & Zonen) in Adventdalen and observed global radiation were used to estimate j(NO2) (red line in Fig. A1a). Figure (A1b) shows the ratio calculated using O3 concentration measured in Barentsburg (closest station where O3 measurements were available), j(NO2) and the temperature-dependent rate coefficient obtained using temperatures in Adventdalen (Eq. 6.6 and Table 6.1 in Seinfeld and Pandis, 2006). The peaks of ratios are especially pronounced for the days with decreased O3 concentration (1 April 2017 and the period from 4 to 9 May 2017). Note that the calculation is based on the O3 data from Barentsburg; thus this introduces an uncertainty in the exact ratios estimated for Adventdalen. The observed and calculated ratios for Adventdalen are shown in Fig. (A1c). The missing data in the observed ratio (light blue line) indicate that both NO and NO2 values were within zero-noise level, while missing data in the calculated ratio are due to missing O3 observations in Barentsburg. The observed and calculated values are of the same order, but the ratio is underestimated in 64 % of all available data, especially for the days with low O3 values. This underestimation was present, even in hours influenced by fresh local NO emission (light purple line), and might have resulted from the modelling errors that could occur if the surface albedo was high (Trebs et al., 2009) or because the actual O3 values in Adventdalen were lower than in Barentsburg. The ratio is overestimated in 31 % of all available data. In these hours, the actual O3 concentration might have been higher in Adventdalen than in Barentsburg (used for calculations). The most pronounced overestimation is noticeable in the period from 26 to 29 April when NO values in Barentsburg were higher than in Adventdalen, and thus more pronounced O3 titration with local NO might have occurred in Barentsburg.
The results from radiosonde and ozone soundings as well as CO and particle measurements, presented in this study, demonstrate that the O3 observations at the Zeppelin station were not sensitive to the local NOx pollution from Ny-Ålesund and thus were representative as background values for comparison with Barentsburg and investigation of the influence of prevailing long-range transport patterns on the measurements at these stations. Furthermore, O3 data from the Zeppelin station may be used to assess how the PAN decomposition might have affected the background NOx concentrations in Svalbard during the 2017 campaign. Previous studies have shown that the ratio increases at temperatures above −10 ∘C, and PAN decomposition becomes a major source of background NOx in Svalbard (Beine et al., 1997a; Beine and Krognes, 2000). As the temperature at the Zeppelin station varied from −22.7 to 0.8 ∘C during the campaign, we would like to investigate the contribution of PAN decomposition to the background NOx concentration in Svalbard. The PAN decomposition rate may be estimated using several approaches (Beine et al., 1997a); here we apply a linear relationship between O3 and PAN concentration derived from previous measurements at the Zeppelin station, PAN [ppt] = (O3 [ppb] − 26.58)0.034, and then we calculate the PAN decomposition rate (Beine and Krognes, 2000) (Fig. A2a). The maximum PAN decomposition rate has been calculated using temperatures and O3 concentration observed at the Zeppelin station, applying Eq. (1) from Beine and Krognes (2000). The depletion events when O3 concentration was below 26.58 ppb have been excluded from the calculation (Beine and Krognes, 2000). The median calculated PAN concentration of 356 pptv (10−3 ppb) is comparable with previous springtime Arctic observations (Beine and Krognes, 2000; Kramer et al., 2015). The estimated maximum PAN decomposition rate for the whole campaign varied from −0.0033 to −17.2 pptv h−1, with a median value of −1.29 pptv h−1 (Fig. A2b). The maximum PAN concentration coincides with the strongest O3 increase event which occurred on 3 May 2017 (Fig. 10b). The temperature increased simultaneously for that day (Fig. 2a), promoting efficient PAN decomposition (Fig. A2b). Applying Theil's non-parametric regression with a slope of −5.07 (pptv NOx (pptv h−1 PAN)−1) suggested by Beine et al. (1997a) for Svalbard, the background concentration of NOx would be 87.2 pptv. However, these concentrations are too low for the equipment used in the 2017 campaign to detect the variations in the concentrations caused by the PAN decomposition.
The absence of collocated measurements in Ny-Ålesund and Longyearbyen does not allow us to investigate how the local emissions affect O3 concentrations in these settlements. This is a drawback of this study. The O3 monitoring at the Zeppelin station is a long-term ongoing research project, and relocation of the instrument to the village from the mountain observatory would introduce bias in the long-term atmospheric composition observations. The study in Adventdalen was the first combined air pollution and meteorological fieldwork in Longyearbyen. The measurements there were done by the main author, and only the NOx monitor was installed there due to the limited grant funding.
To investigate the influence of local NOx emissions on the O3 concentration in Ny-Ålesund, as is required in the third hypothesis stated in the introduction of the current paper, we may use historical observations. The data from only six O3 sonde launches were available for the 2017 campaign (Fig. 4). However, the long-term data below 100 m from the O3 sonde profiles may be used to study influence of the local NOx pollution in Ny-Ålesund on the O3 concentration. These observations are suitable for this purpose because the O3 sonde launching facility is located just 200 m to the south-south-west and 500 m to the south from the NOx monitor and diesel power plant, respectively. Thus, when the monitor detected NOx concentration above the long-term springtime average in the launch hour, the influence of locally polluted air masses might have been observed in the lowest O3 sonde data. There were in total 59 O3 sonde launches for which NOx monitor data were available in spring 2009, 2010, 2015, 2016, 2017 and 2018. The O3 profile data in the lowest 100 m have been extracted for all 59 launches and grouped according to the NOx concentration detected by the monitor and wind direction in the O3 sonde profiles: (1) above mean NOx concentration and northerly wind direction and (2) below or equal to mean NOx concentration and northerly wind direction. The median and mean O3 values below 100 m in the group where the NOx values were above NOx mean were 11 % and 15 % lower, respectively, than for the second group with northerly winds but without elevated NOx concentration. Thus, the O3 concentration in lowest 100 m downwind from the power plant in the settlement may be reduced significantly due to local NOx emissions, but the frequency of such events is unknown in the absence of continuous O3 measurements in the village.
The NOx concentrations depended strongly on the wind direction at the stations located in the vicinity of the stationary pollution sources, Ny-Ålesund and Barentsburg. In turn, the wind direction at all the sites depended on the synoptic-scale conditions but was modified locally due to different mechanical and thermodynamic processes controlling local circulations such as katabatic winds and topography-induced wind channelling specific for each location (Esau and Repina, 2012; Maturilli et al., 2013). Remarkably, the westerly component of the wind at all stations only appears when the synoptic-scale westerly wind brought warm air from the North Atlantic to the Svalbard inland during transition to, and during part of, the large-scale ScBL regime. This reverses semi-permanent thermal flow from the glaciers towards the sea prevailing in Svalbard in spring.
Our analysis of the trajectory probability for different weather regimes showed that the elevated median O3 concentrations were observed for the sub-periods when the air masses arrived from the south, west or east. In contrast, the long-range-transported O3, brought by the air masses from the north, may be affected by the regional O3 depletion north of Svalbard where the elevated concentrations of total BrO VCDs were detected in the satellite data. Similarly, Koo et al. (2012) studied advection of the O3-depleted air masses and found that these events were driven by local or short-range (1 d) transport from the nearby region. A recent study of Bougoudis et al. (2020) explored connection between first-year sea ice and bromine explosion events. In spring (March, April, May) 2017, Arctic mean tropospheric BrO VCDs over sea ice were on the order of 4×10¹³ molec. cm−2, and significant anomalies of tropospheric BrO VCDs were observed over the sea ice north of Svalbard at approximately 85∘ N. In addition to the sea-ice conditions, the tropospheric BrO plume formation depends on various meteorological factors and the amount of blowing snow (Bougoudis et al., 2020). To investigate these processes, the weather regime approach presented in the current study may be applied together with the long-term BrO remote-sensing data and in situ measurements from the Arctic stations in further studies.
However, as we show in the analysis of the extreme O3 depletion and increase episodes, the specific short-term events of long-range transport need to be investigated separately as there is a spread in air mass origin and transport altitude for the longer periods defined by the weather regime classification, especially for the “no regime” situation.
To get a more robust result linking weather regimes and air quality, we would like to compare long-term springtime (23 March–15 May) weather regime data with NOx data from Ny-Ålesund, O3 concentration from the Zeppelin station, O3 sonde and radiosonde data as well as FLEXPART trajectories for the period from 1990 to 2018. The FLEXPART and weather regime data were available for all years, while there were gaps in observational data from Ny-Ålesund. The data availability chart is shown in Fig. A3, indicating the number of hourly measurements for surface NOx and O3 data and the number of radiosonde and ozonesonde launches per spring season each year. The hourly O3 data are available for all years, while hourly NOx data were only available in 2009, 2010, 2015, 2016, 2017 and 2018. After spring 2018, the NOx monitor was moved to another location in Ny-Ålesund; therefore 2019–2022 data are not included in the current analysis to keep measurement consistency. The O3 soundings and radiosonde AWI's data sets start in 1992 and 1993, with the median number of radiosonde soundings and O3 soundings per spring season being 54 and 11, respectively.
The box and whisker plots of O3, NOx and temperature inversion strength (TIS) for different weather regimes are shown in Fig. A4. As during the 2017 campaign, the highest median O3 values were detected for the ScTr regime, while the zonal regime (ZO), during which O3 values were also higher, was absent during the fieldwork (Fig. A4a). The ZO regime is characterized by a negative geopotential height anomaly at 500 hPa centred between Iceland and the southern tip of Greenland and southerly flow over Svalbard (Papritz and Grams, 2018). The lowest median O3 values in the long-term data are for GL regime and for European blocking (EUBL) that was absent in spring 2017. The variability of O3 concentrations (range between the 25th percentile and 75th percentile) for the EUBL regime is also remarkably higher than for other regimes. The EUBL regime is characterized by the positive 500 hPa anomaly centred over the North Atlantic. This promotes transport of air from south-west and west to Svalbard (Papritz and Grams, 2018). Long-term trajectories for the different regimes are shown in Fig. A5. The lowest percentage of trajectories descending from higher altitude (>2000 m) is modelled for GL regime, while the highest percentage of elevated trajectories is obtained for EUBL, ScBL and ZO regimes. No specific trajectory probability pattern may be defined for “no regime” conditions (Fig. A5a), while distinct long-range transport signatures are identified for the other seven regimes (Fig. A5b–h). In addition to the air transport path and trajectory altitudes, the sea-ice conditions and BrO concentration are important factors affecting the concentration of O3 in each particular season.
Similar to the 2017 results, the highest median NOx values are observed for “no regime” and ScTr, but two other regimes, when the long-term median NOx values are high as well, EUBL and ZO, were not present during the campaign (Fig. A4b). The EUBL shows pronounced transport of air masses from the west to Svalbard (Fig. A5f). Thus, a westerly component of the wind at the measurement stations and significant changes in local pollution dispersion conditions are expected for this regime, as was observed during the ScBL regime in 2017, when a westerly component of the wind was present as well.
Temperature inversions are common phenomena at high latitudes, in particular during the cold seasons due to radiative cooling of the surface and descending motion and heat advection from the south aloft. The inversions were detected on 27 % of all the days in the measurement campaign period in 2017. This frequency of inversion occurrence is quite low in comparison with the results from previous studies of Dekhtyareva et al. (2018), where it was observed in 60 % of the springtime profiles in 2009. Despite low frequency of occurrence, temperature inversions have significant influence on the dispersion efficiency, and, hence, according to the WRS test, the median daytime (from 06:00 to 18:00 UTC) concentrations of NOx were higher (p<0.05) at all three stations for the days when this phenomenon was observed in the radiosonde data in 2017. In the long-term data, the median temperature inversion strength was high for “no regime”, GL, AR and ScBL, but the highest median TIS was for the Atlantic trough (AT) regime, the regime that was absent during the campaign (Fig. A4c). The AT regime is characterized by a negative 500 hPa geopotential height anomaly to the east of Ireland and high cyclone frequency in that region (Papritz and Grams, 2018), while the cyclonic activity around Svalbard is lower, and these conditions may promote strengthening of the temperature inversion.
Thus, the results of the weather regime analysis performed for the 2017 campaign are representative of the characterization of the influence of different synoptic-scale conditions on the NOx and O3 concentration in Ny-Ålesund. However, the three regimes that were absent during the 2017 campaign (AT, EUBL and ZO) are important in the long-term statistics for NOx, O3 and TIS in the settlement.
Despite decades of industrial activity in Svalbard, there is no continuous air pollution monitoring in the region's settlements except Ny-Ålesund. The NOx measurement results from the three-station network, Ny-Ålesund, Barentsburg and Longyearbyen, and O3 data from Ny-Ålesund and Barentsburg have been compared for the first time.
A diurnal pattern in concentration of NOx at all three stations has been observed and attributed to variable emissions from the local sources of NOx. However, only data from Barentsburg and Adventdalen station show a significant change in the ratio during the day, since the station in Ny-Ålesund is located close to a diesel power plant, a stationary source of fresh NOx emissions contributing to higher NO concentration. The ratio observed in Adventdalen is comparable with modelling results obtained using radiation data from the valley and O3 concentration from Barentsburg. Local emissions of NOx in Barentsburg may reduce O3 concentrations in the settlement by a few percent from the background value due to O3 titration. As has been shown from the analysis of the long-term O3 sonde record, NOx emissions in Ny-Ålesund may affect O3 concentration in the lowest 100 m downwind, but no influence of local pollution has been detected at the Zeppelin station at 474 m a.s.l. in spring 2017. There was no statistically significant difference in daytime and night-time O3 values measured in Barentsburg and at the Zeppelin station, and both sites showed similar O3 concentration dynamics controlled by long-range air mass transport.
The weather regime approach is novel in Svalbard air pollution research. This method has been used in the current study to identify the influence of large-scale circulation on local and long-range-transported air pollution in the area with complex topography. As expected, the large-scale wind is channelled by the local topographical features, and this determines the wind direction and speed in all three settlements, and therefore the correlations of NOx concentrations between the stations are weak. In Ny-Ålesund and Barentsburg, the stations are located so that downwind concentrations from the local sources are observed rarely, since the prevailing wind direction is different. The measurements in Adventdalen have been made downwind from the source, since both the snowmobile route and prevailing wind direction are along the valley. However, traffic is a temporary source of emissions, and the mean wind speed in Adventdalen valley is high, and therefore mean NOx concentrations there are low. Despite low correlation between the NOx values from the three stations, there are common synoptic conditions that promote accumulation of local pollution in the settlements, namely low wind speed and air temperature and the presence of temperature inversions. In contrast to NOx, the concentrations of O3 in Barentsburg and at the Zeppelin observatory are moderately correlated and depend on synoptic conditions that promote transport of air masses enriched or depleted in O3. In other words, both these stations are regionally representative of the O3 concentrations.
The large-scale weather regimes control the synoptic meteorological conditions and determine the atmospheric stability and efficiency of local pollution dispersion. The analysis of the long-term weather regime, trajectory and observational data from Ny-Ålesund supports our findings from the 2017 campaign. The lowest median O3 values were identified for the Greenland blocking regime, when the trajectories were arriving more frequently from the sea-ice-covered regions, and the percentage of high-altitude trajectories that might bring O3-enriched air was low. The highest median O3 values were observed for the Scandinavian trough regime, characterized by the relatively high percentage of high-altitude trajectories and trajectories arriving from south-east of Svalbard. During this regime, NOx concentrations were elevated as well. The highest temperature inversion strength was observed for “no regime”, Greenland blocking, Atlantic ridge and Scandinavian blocking. The maximum background NO2 concentration originating from PAN decomposition was modelled for the strongest O3 increase event that occurred during the Scandinavian blocking regime. At the same time, three regimes absent during the 2017 campaign (Atlantic trough, European blocking and Zonal regime) appeared to be significant for NOx, O3 and temperature inversion statistics in Ny-Ålesund. However, the effect of each weather regime on the air quality in different settlements depends on the local features such as pollution sources and wind channelling; thus it would be of interest to compare long-term NOx and O3 data from Barentsburg with weather regime data in further studies.
The application of the weather regime approach in air quality study for the three Svalbard stations allows us to facilitate prediction of the conditions promoting long-range transport to and accumulation of local pollutants at the measurement sites. The weather regimes typically persist for a period of 10 d and longer. Hence, joint intensive observational campaigns may be planned ahead at any of the three stations depending on the expected conditions. This provides a new opportunity for the collaboration in atmospheric research in Svalbard and allows more effective organization of specific field observations devoted to, for example, the study of photochemical reactions in the polar atmosphere, investigations of the influence of turbulence and stability on air pollutant dispersion, and studies on aerosol and cloud interaction.
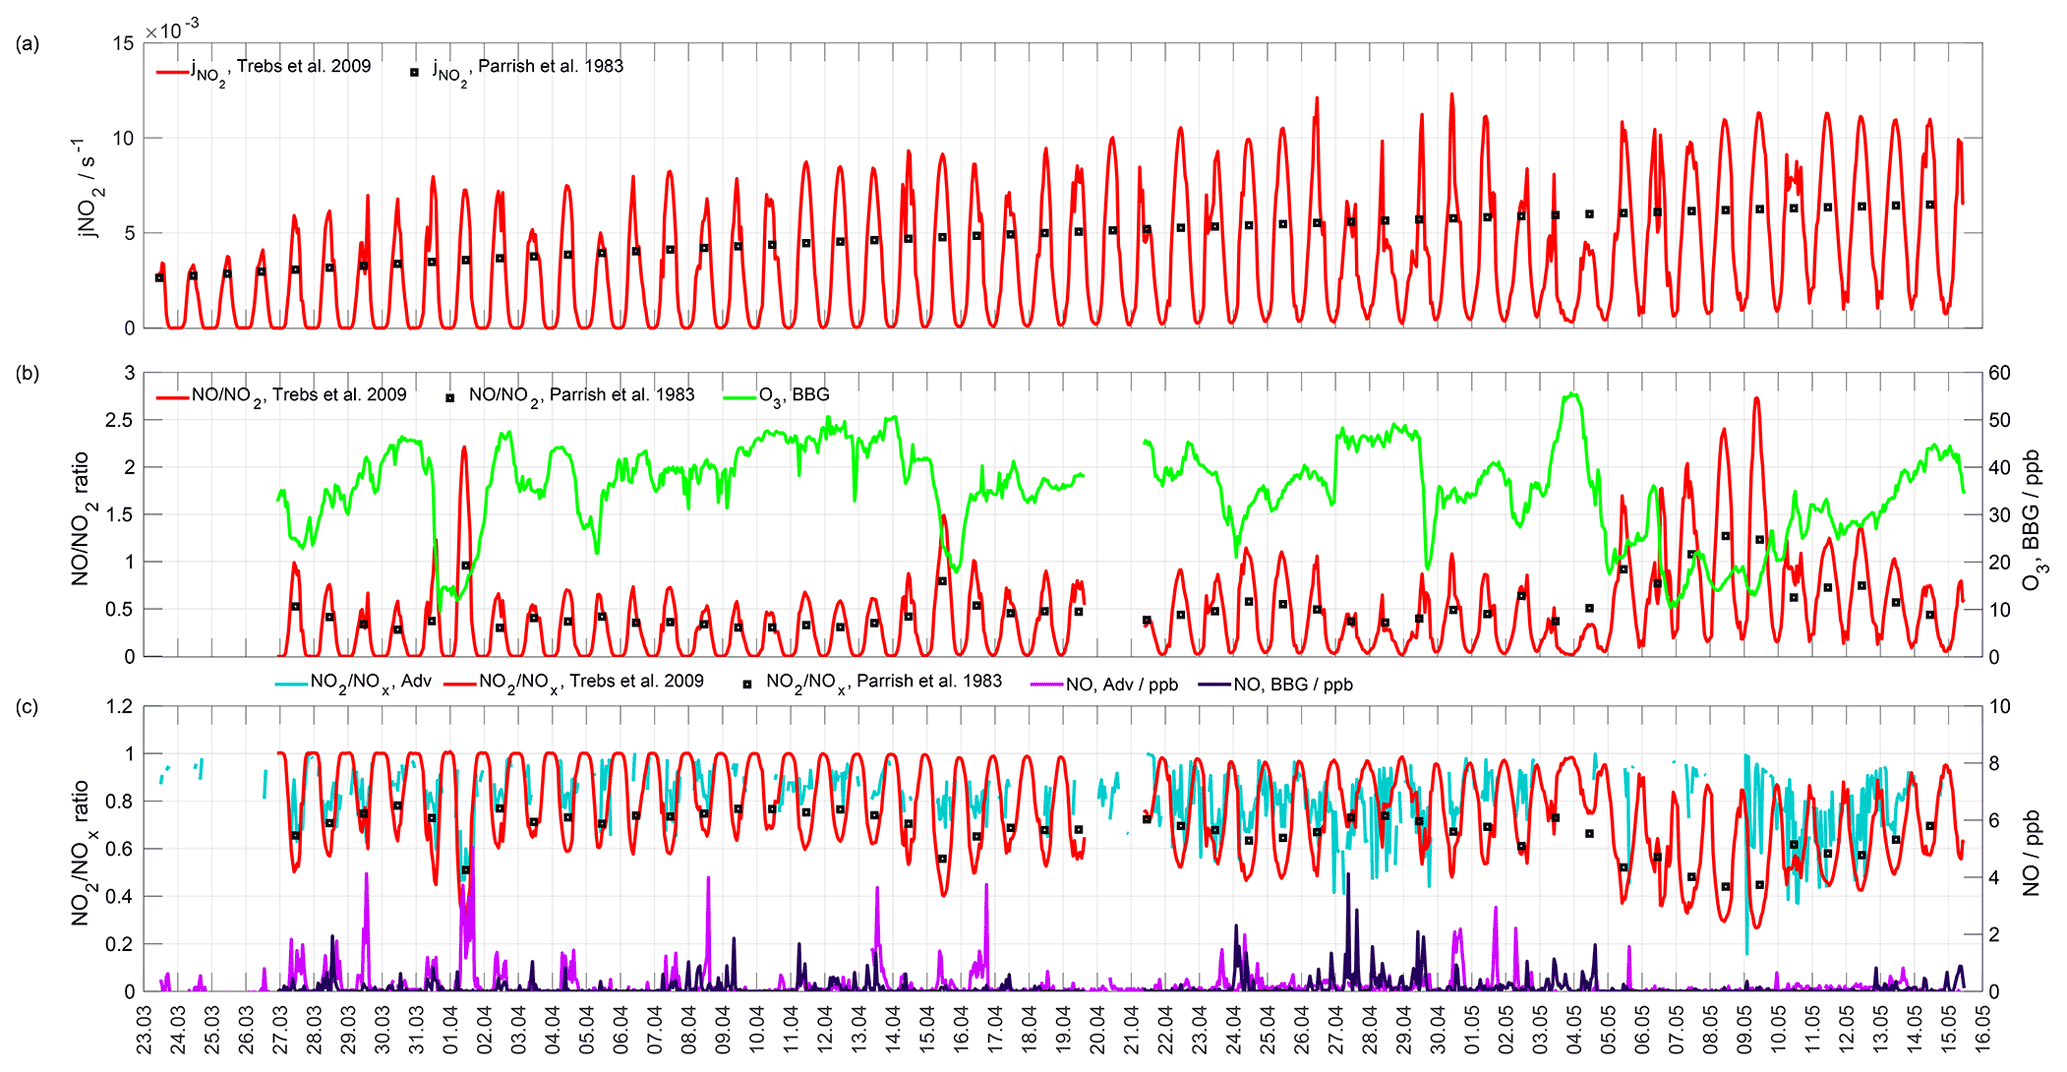
Figure A1(a) calculated as a function of solar zenith angle in clear-sky conditions (Parrish et al., 1983) (decreasing from 77 to 59∘ for solar noon time in Adventdalen from 23 March to 15 May 2017 (Robertson et al., 2006)) and as a function of observed global radiation and albedo (Trebs et al., 2009); (b) ratio calculated using O3 concentration measured in Barentsburg, and temperature-dependent rate coefficient obtained using temperatures in Adventdalen (Eq. 6.6 and Table 6.1 in Seinfeld and Pandis, 2006); (c) observed and calculated ratio for Adventdalen.
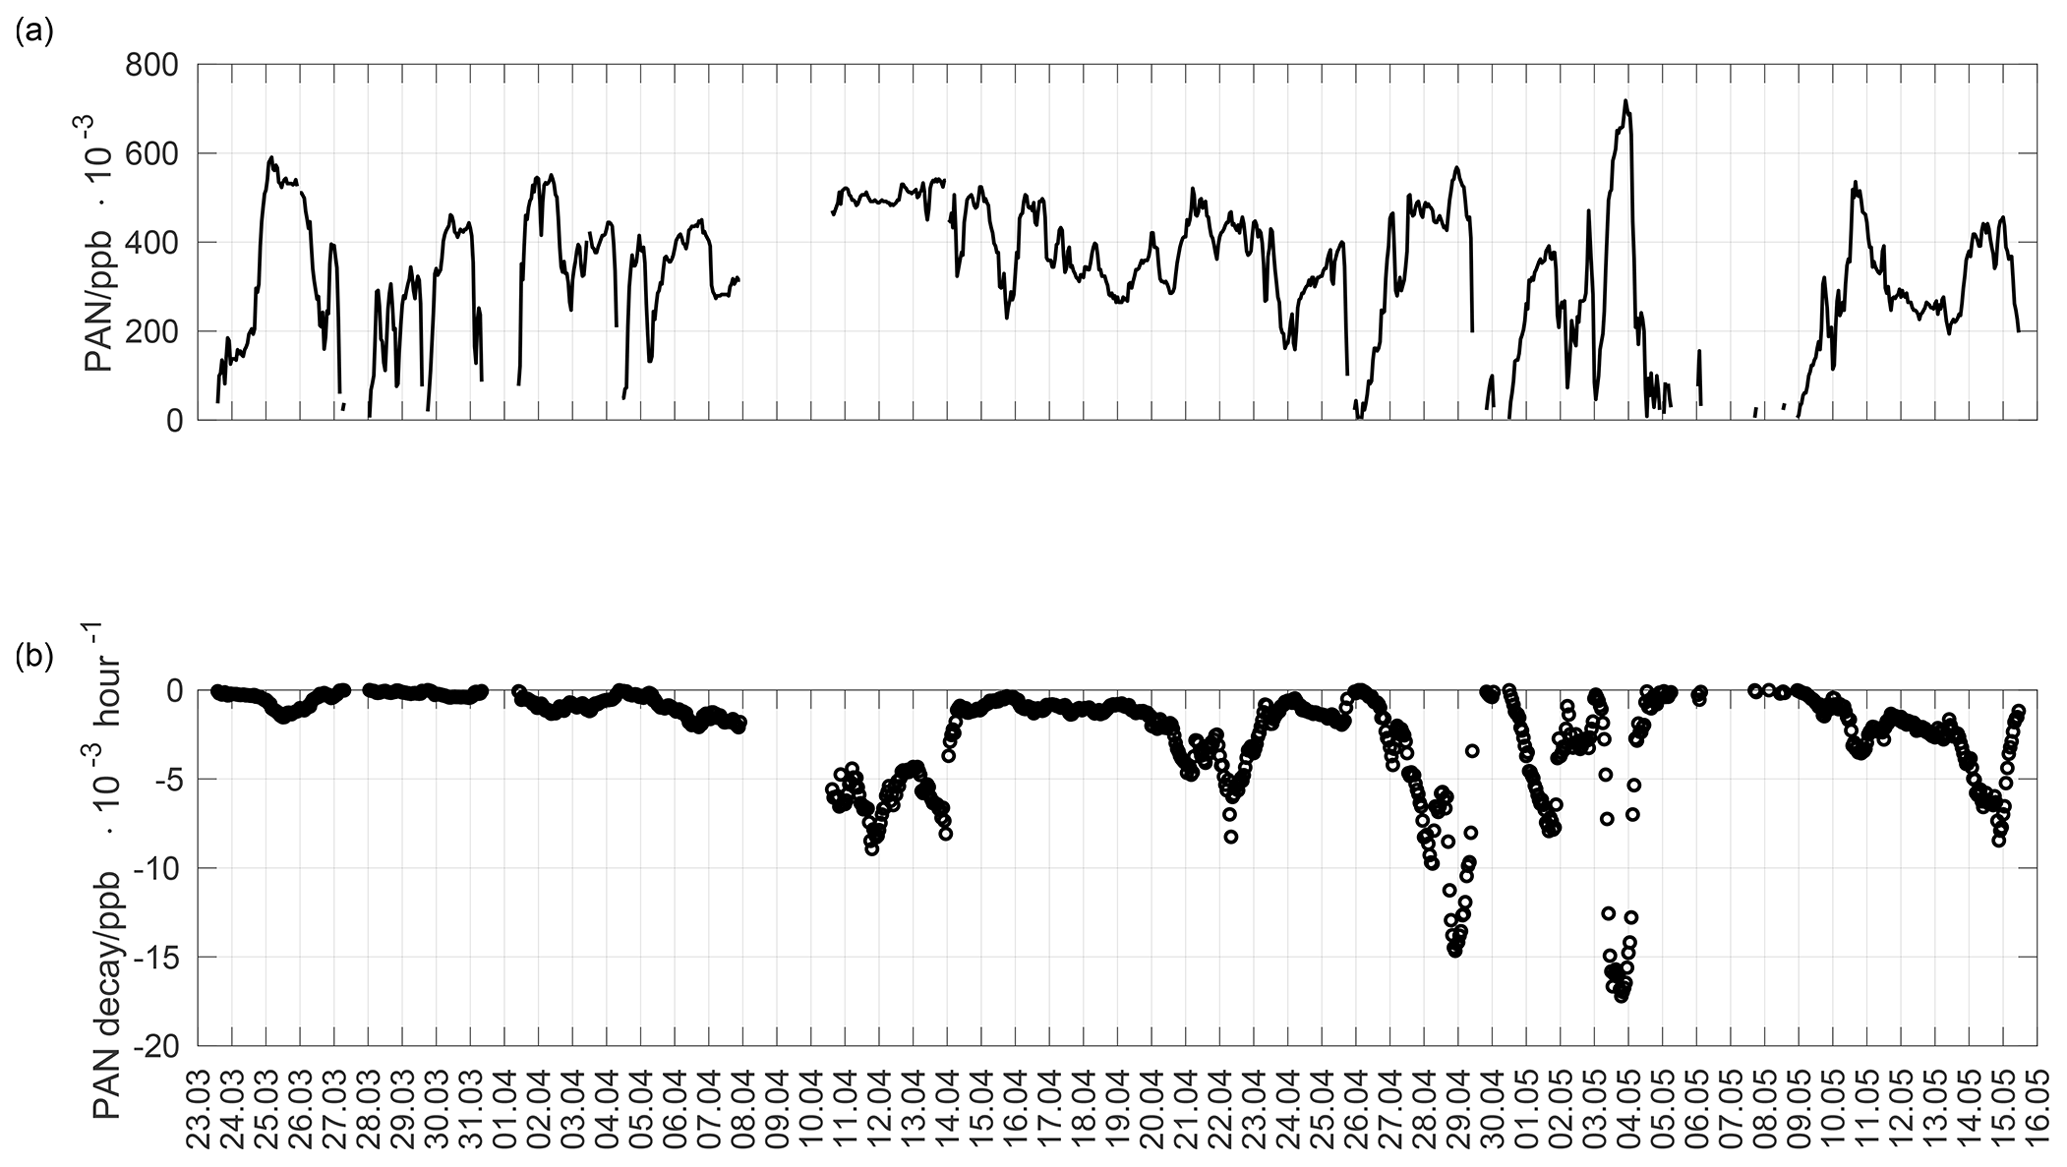
Figure A2(a) PAN concentration calculated using the linear relationship between PAN and O3 concentration suggested by Beine and Krognes (2000). (b) PAN decomposition rate calculated using Eqs. (1) and (2) from Beine and Krognes (2000).

Figure A3The O3 and NOx hourly observations and O3 sonde and radiosonde data availability chart for spring seasons 1990–2018.
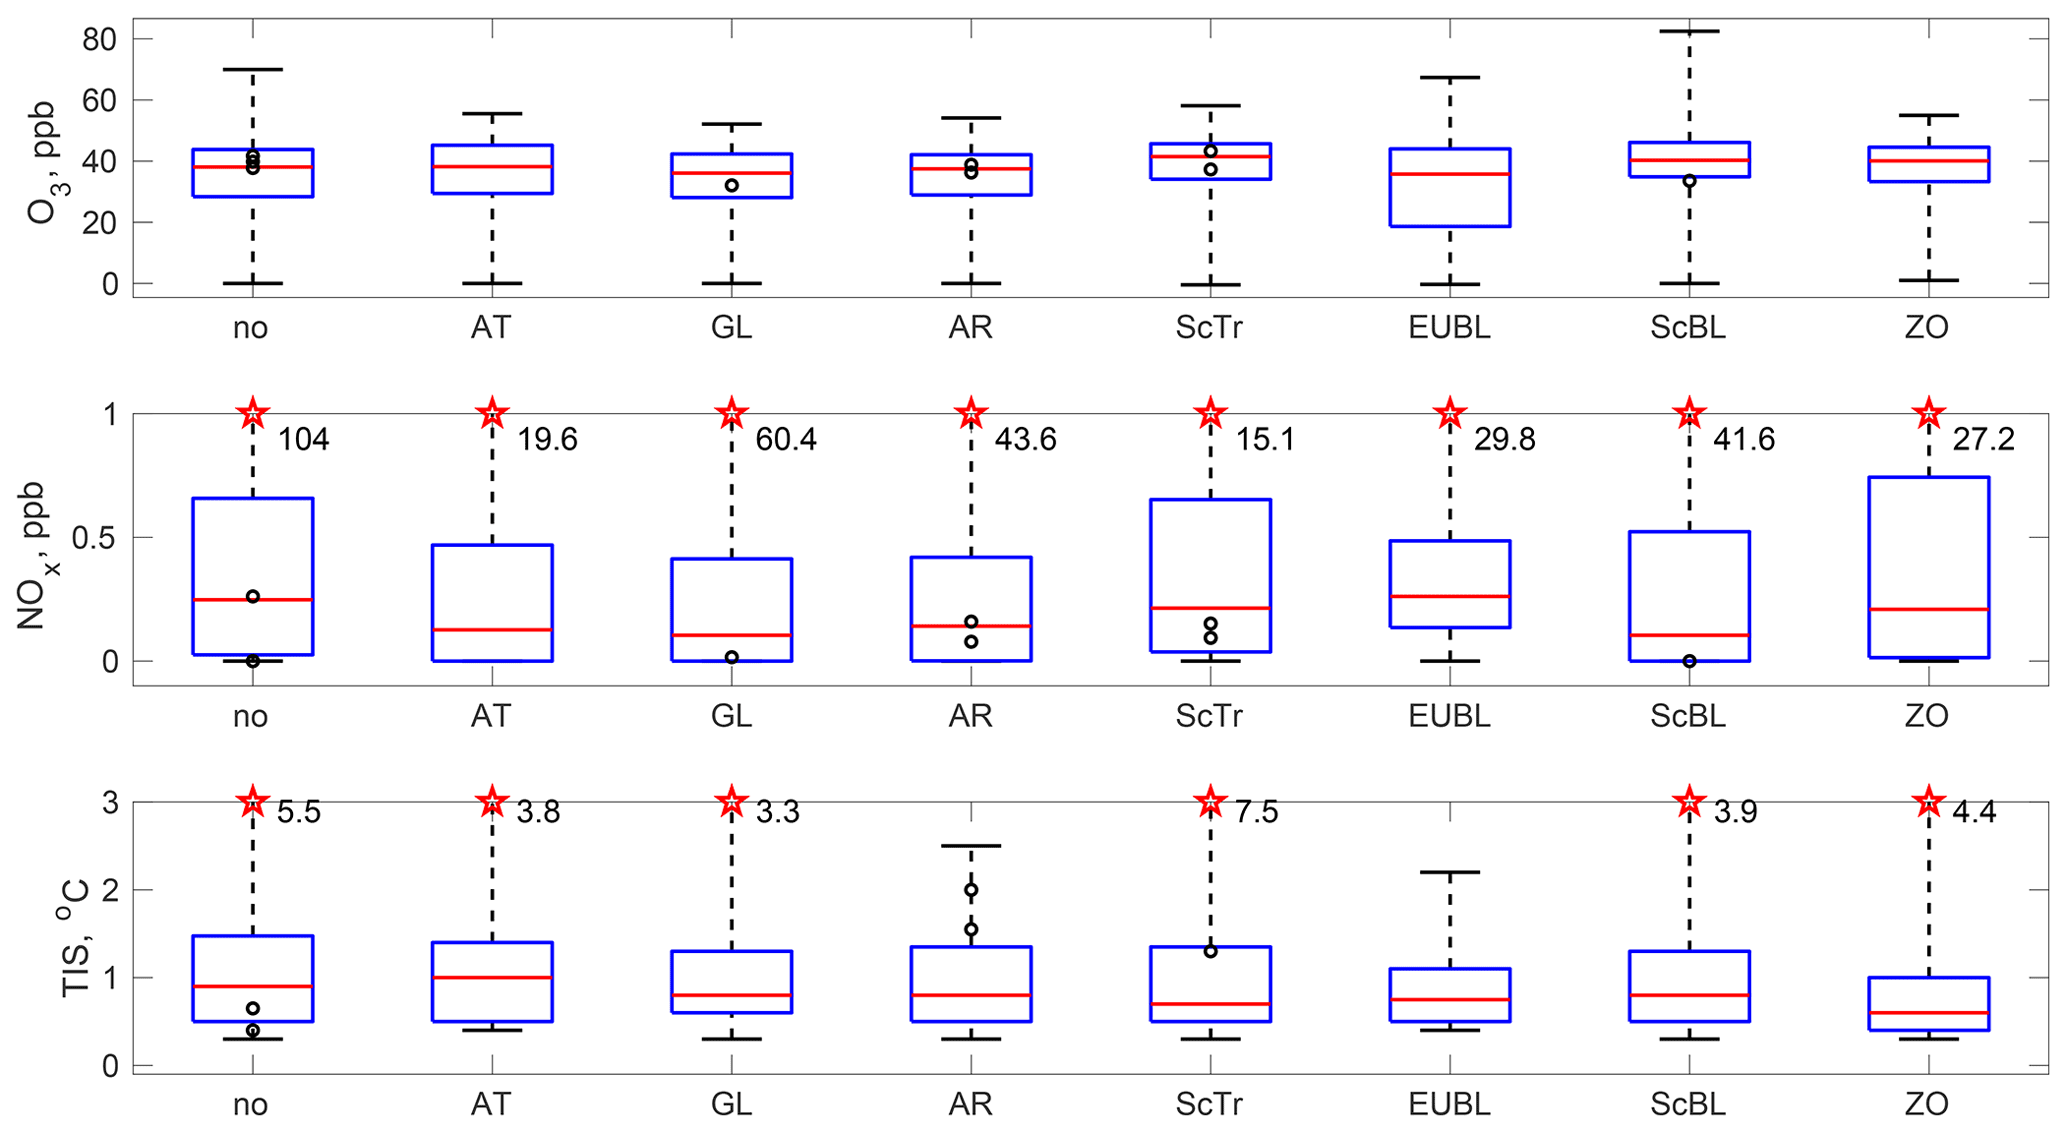
Figure A4(a) O3 concentrations for different weather regimes for spring seasons 1990–2018. (b) NOx concentrations for different weather regimes for spring seasons 1990–2018. (c) Temperature inversion strength for different weather regimes for spring seasons 1990–2018. The maximum values that exceed y-axis limits in plots (b) and (c) are shown with red stars.
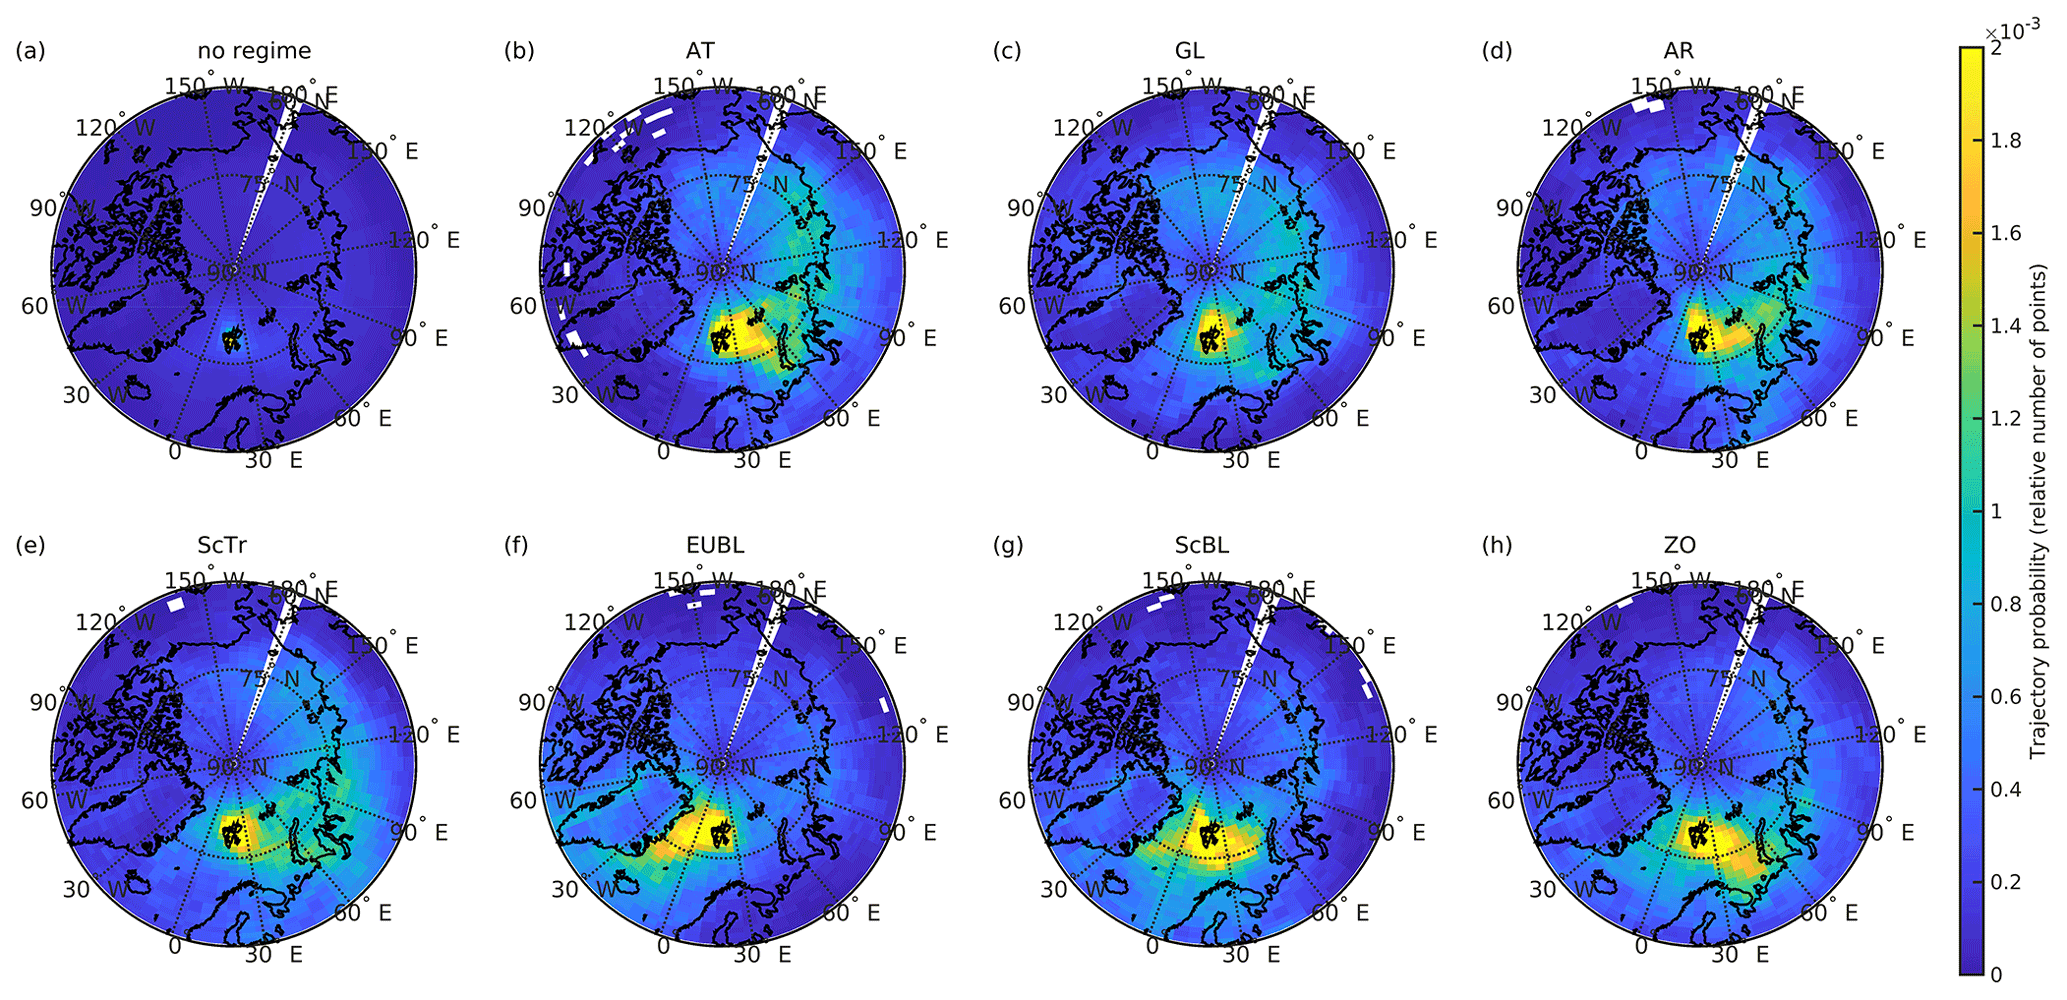
Figure A5FLEXPART trajectory probability for 10 d backward trajectories for the different weather regimes for spring seasons 1990–2018. The percentage of trajectories descending from higher altitudes (>2000 m) is 18 %, 14 %, 13 %, 15 %, 17 %, 22 %, 21 % and 21 % for the regimes in plots (a)–(h), respectively.
The radiosonde data for March 2017 and for April–May 2017 are available via the GRUAN home page (https://doi.org/10.5676/GRUAN/RS92-GDP.2, Sommer et al., 2012) and in the database PANGAEA (https://doi.org/10.1594/PANGAEA.879767, Maturilli, 2017a and https://doi.org/10.1594/PANGAEA.879820, Maturilli, 2017b), respectively. The analysed O3 sonde data are stored in the Network for the Detection of Atmospheric Composition Change (NDACC) archive at https://www-air.larc.nasa.gov/missions/ndacc/data.html?station=ny.alesund/ames/o3sonde/ (von der Gathen and Rex, 2020). The NOx data from Adventdalen are available at the UiT Open Research data portal (https://doi.org/10.18710/TXQ7EV, Dekhtyareva, 2018).
AD was responsible for conceptualization, project administration, fieldwork planning and realization. AD, KH, AN, OH and MH acquired resources and funding for the fieldwork. AD, RG, KH and MH developed methodology. AD and RG performed data analysis and validation. AD, RG and TS carried out formal analysis. AD performed investigation and evaluation of measurement results and prepared the manuscript with contributions from all co-authors.
The contact author has declared that none of the authors has any competing interests.
Publisher's note: Copernicus Publications remains neutral with regard to jurisdictional claims in published maps and institutional affiliations.
Special thanks are given to the staff of the Norwegian Polar Institute (NPI) and the University Centre in Svalbard for the invaluable logistical assistance. The Norwegian Institute for Air Research is acknowledged for the leasing of the equipment and technical support during the operation of the monitor. We would like to acknowledge the Norwegian Meteorological Institute for the meteorological data from Ny-Ålesund available in the https://seklima.met.no/observations/ (last access: 5 September 2022) database. NPI and the European Centre for Medium-Range Weather Forecasts are acknowledged for the map of Svalbard available at http://svalbardkartet.npolar.no (last access: 5 September 2022) and for the data from the ERA5 global atmospheric reanalysis data set, respectively. We would like to thank Marion Maturilli and Peter von der Gathen from the Alfred Wegener Institute Helmholtz Centre for Polar and Marine Research for processing and quality assurance of the radiosonde and O3 sonde data from Ny-Ålesund, respectively, and for the reviewing of an earlier version of the current paper. Special appreciation is given to Christian Grams from the Karlsruhe Institute of Technology for providing the weather regime data and useful comments for the current paper.
The measurements of NOx in Adventdalen have been performed in the frame of the project 269953/E10 “Monitoring of nitrogen oxides from mobile and stationary sources at Svalbard”, financed by the Arctic Field Grant funding established by the Norwegian Research Council. The measurements of NOx are performed by the NPI and NILU with logistical support from Kings Bay AS in connection with the project “Limits of Acceptable Change” in Ny-Ålesund. Continuous O3 measurements at the Zeppelin station are performed in the frame of the long-term programme for greenhouse gases monitoring and were financed by NILU and the Norwegian Environmental Agency. The measurements in Barentsburg were done by AARI in the scope of the project “Air quality monitoring by automatic analysing stations in Barentsburg”. The support from the Transregional Collaborative Research Centre (TR 172) “ArctiC Amplification: Climate Relevant Atmospheric and SurfaCe Processes, and Feedback Mechanisms (AC)3”, funded by the German Research Foundation (DFG, Deutsche Forschungsgemeinschaft), is acknowledged for the radiosonde data from Ny-Ålesund.
This paper was edited by Radovan Krejci and reviewed by two anonymous referees.
AC SAF: GOME-2 BrO Total Column Density Data Record Release 1 – Metop, AC SAF [data set], https://doi.org/10.15770/EUM_SAF_O3M_0011, 2017. a
Adakudlu, M., Andresen, J., Bakke, J., Beldring, S., Benestad, R., Bilt, W., Bogen, J., Borstad, C., Breili, K., Breivik, Ø., Børsheim, K. Y., Christiansen, H. H., Dobler, A., Engeset, R., Frauenfelder, R., Gerland, S., Gjelten, H. M., Gundersen, J., Isaksen, K., Jaedicke, C., Kierulf, H., Kohler, J., Li, H., Lutz, J., Melvold, K., Mezghani, A., Nilsen, F., Nilsen, I. B., Nilsen, J. E. Ø., Pavlova, O., Ravndal, O., Risebrobakken, B., Saloranta, T., Sandven, S., Schuler, T. V., Simpson, M. J. R., Skogen, M., Smedsrud, L. H., Sund, M., Vikhamar-Schuler, D., Westermann, S., and Wong, W. K.: Climate in Svalbard 2100 – a knowledge base for climate adaptation, 1/2019, https://www.miljodirektoratet.no/globalassets/publikasjoner/M1242/M1242.pdf (last access: 5 September 2022), 2019. a
AMAP: AMAP Assessment 2006: Acidifying Pollutants , Arctic Haze , and Acidification in the Arctic, Tech. rep., Arctic Monitoring and Assessment Programme (AMAP), Oslo, Norway, ISBN 82-7971-046-9, 2006. a, b, c
Arya, S. P.: Air pollution meteorology and dispersion, Oxford University press, New York, ISBN 978-0-19-507398-0, 1999. a
Beine, H. J. and Krognes, T.: The seasonal cycle of peroxyacetyl nitrate (PAN) in the European Arctic, Atmos. Environ., 34, 933–940, https://doi.org/10.1016/S1352-2310(99)00288-5, 2000. a, b, c, d, e, f, g
Beine, H. J., Engardt, M., Jaffe, D., Hov, Ø., Holmén, K., and Stordal, F.: Measurements of NOx and aerosol particles at the Ny-Ålesund Zeppelin mountain station on Svalbard: influence of regional and local pollution sources, Atmos. Environ., 30, 1067–1079, 1996. a, b, c, d
Beine, H. J., Jaffe, D. A., Herring, J. A., Kelley, J. A., Krognes, T., and Stordal, F.: High-Latitude Springtime Photochemistry. Part I: NOx, PAN and Ozone Relationships, J. Atmos. Chem., 27, 127–153, 1997a. a, b, c, d, e
Beine, H. J., Jaffe, D. A., Stordal, F., Engardt, M., Solberg, S., Schmidbauer, N., and Holmén, K.: NOx during ozone depletion events in the arctic troposphere at Ny-Ålesund, Svalbard, Tellus B, 49, 556–565, https://doi.org/10.3402/tellusb.v49i5.16008, 1997b. a, b, c
Bougoudis, I., Blechschmidt, A.-M., Richter, A., Seo, S., Burrows, J. P., Theys, N., and Rinke, A.: Long-term time series of Arctic tropospheric BrO derived from UV–VIS satellite remote sensing and its relation to first-year sea ice, Atmos. Chem. Phys., 20, 11869–11892, https://doi.org/10.5194/acp-20-11869-2020, 2020. a, b
Christiansen, B., Jepsen, N., Kivi, R., Hansen, G., Larsen, N., and Korsholm, U. S.: Trends and annual cycles in soundings of Arctic tropospheric ozone, Atmos. Chem. Phys., 17, 9347–9364, https://doi.org/10.5194/acp-17-9347-2017, 2017. a
Dee, D. P., Uppala, S. M., Simmons, A. J., Berrisford, P., Poli, P., Kobayashi, S., Andrae, U., Balmaseda, M. A., Balsamo, G., Bauer, P., Bechtold, P., Beljaars, A. C. M., van de Berg, L., Bidlot, J., Bormann, N., Delsol, C., Dragani, R., Fuentes, M., Geer, A. J., Haimberger, L., Healy, S. B., Hersbach, H., Hólm, E. V., Isaksen, L., Kållberg, P., Köhler, M., Matricardi, M., McNally, A. P., Monge-Sanz, B. M., Morcrette, J.-J., Park, B.-K., Peubey, C., de Rosnay, P., Tavolato, C., Thépaut, J.-N., and Vitart, F.: The ERA-Interim reanalysis: configuration and performance of the data assimilation system, Q. J. Roy. Meteor. Soc., 137, 553–597, https://doi.org/10.1002/qj.828, 2011. a
Dekhtyareva, A.: Monitoring of nitrogen oxides at Svalbard: measurements in Adventdalen, https://doi.org/10.18710/TXQ7EV, 2018. a
Dekhtyareva, A., Edvardsen, K., Holmén, K., Hermansen, O., and Hansson, H. C.: Influence of local and regional air pollution on atmospheric measurements in Ny-Ålesund, International Journal of Sustainable Development and Planning, 11, 578–587, https://doi.org/10.2495/SDP-V11-N4-578-587, 2016. a, b, c, d
Dekhtyareva, A., Holmén, K., Maturilli, M., Hermansen, O., and Graversen, R.: Effect of seasonal mesoscale and microscale meteorological conditions in Ny-Ålesund on results of monitoring of long-range transported pollution, Polar Res., 37, 1508196, https://doi.org/10.1080/17518369.2018.1508196, 2018. a, b, c
Dickerson, R. R., Stedman, D. H., and Delany, A. C.: Direct measurements of ozone and nitrogen dioxide photolysis rates in the troposphere, J. Geophys. Res., 87, 4933–4946, https://doi.org/10.1029/JC087iC07p04933, 1982. a
Eckhardt, S., Stohl, A., Beirle, S., Spichtinger, N., James, P., Forster, C., Junker, C., Wagner, T., Platt, U., and Jennings, S. G.: The North Atlantic Oscillation controls air pollution transport to the Arctic, Atmos. Chem. Phys., 3, 1769–1778, https://doi.org/10.5194/acp-3-1769-2003, 2003. a
Eckhardt, S., Hermansen, O., Grythe, H., Fiebig, M., Stebel, K., Cassiani, M., Baecklund, A., and Stohl, A.: The influence of cruise ship emissions on air pollution in Svalbard – a harbinger of a more polluted Arctic?, Atmos. Chem. Phys., 13, 8401–8409, https://doi.org/10.5194/acp-13-8401-2013, 2013. a, b
Esau, I. and Repina, I.: Wind climate in Kongsfjorden, Svalbard, and attribution of leading wind driving mechanisms through turbulence-resolving simulations, Adv. Meteorol., 2012, 568454, https://doi.org/10.1155/2012/568454, 2012. a
European Centre for Medium-Range Weather Forecasts: IFS DOCUMENTATION – Cy43r3 Operational implementation 11 July 2017 PART IV: PHYSICAL PROCESSES, Tech. Rep. July, https://www.ecmwf.int/sites/default/files/elibrary/2017/17736-part-iv-physical-processes.pdf (last access: 14 July 2022), 2017. a
Fan, S.-M. and Jacob, D. J.: Surface ozone depletion in Arctic spring sustained by bromine reactions on aerosols, Nature, 359, 522–524, 1992. a
Førland, E. J., Hanssen-Bauer, I., and Nordli, P. Ø.: Climate statistics & longterm series of temperature and precipitation at Svalbard and Jan Mayen, Tech. rep., Norwegian Meteorological Institute, Oslo, ISSN 0805-9918, 1997. a
Fremme, A. and Sodemann, H.: The role of land and ocean evaporation on the variability of precipitation in the Yangtze River valley, Hydrol. Earth Syst. Sci., 23, 2525–2540, https://doi.org/10.5194/hess-23-2525-2019, 2019. a
Freud, E., Krejci, R., Tunved, P., Leaitch, R., Nguyen, Q. T., Massling, A., Skov, H., and Barrie, L.: Pan-Arctic aerosol number size distributions: seasonality and transport patterns, Atmos. Chem. Phys., 17, 8101–8128, https://doi.org/10.5194/acp-17-8101-2017, 2017. a
Grams, C. M., Beerli, R., Pfenninger, S., Staffell, I., and Wernli, H.: Balancing Europe's wind-power output through spatial deployment informed by weather regimes, Nat. Clim. Change, 7, 557–562, https://doi.org/10.1038/NCLIMATE3338, 2017. a, b, c, d, e, f
Gröbner, J., Hülsen, G., Wuttke, S., Schrems, O., De Simone, S., Gallo, V., Rafanelli, C., Petkov, B., Vitale, V., Edvardsen, K., and Stebel, K.: Quality assurance of solar UV irradiance in the Arctic, Photoch. Photobio. Sci., 9, 384–391, https://doi.org/10.1039/b9pp00170k, 2010. a
Heintzenberg, J., Tunved, P., Galí, M., and Leck, C.: New particle formation in the Svalbard region 2006–2015, Atmos. Chem. Phys., 17, 6153–6175, https://doi.org/10.5194/acp-17-6153-2017, 2017. a
Hersbach, H., Bell, B., Berrisford, P., Hirahara, S., Horányi, A., Muñoz-Sabater, J., Nicolas, J., Peubey, C., Radu, R., Schepers, D., Simmons, A., Soci, C., Abdalla, S., Abellan, X., Balsamo, G., Bechtold, P., Biavati, G., Bidlot, J., Bonavita, M., De Chiara, G., Dahlgren, P., Dee, D., Diamantakis, M., Dragani, R., Flemming, J., Forbes, R., Fuentes, M., Geer, A., Haimberger, L., Healy, S., Hogan, R. J., Hólm, E., Janisková, M., Keeley, S., Laloyaux, P., Lopez, P., Lupu, C., Radnoti, G., de Rosnay, P., Rozum, I., Vamborg, F., Villaume, S., and Thépaut, J. N.: The ERA5 global reanalysis, Q. J. Roy. Meteor. Soc., 146, 1999–2049, https://doi.org/10.1002/qj.3803, 2020. a
Hirdman, D., Aspmo, K., Burkhart, J. F., Eckhardt, S., Sodemann, H., and Stohl, A.: Transport of mercury in the Arctic atmosphere: Evidence for a springtime net sink and summer-time source, Geophys. Res. Lett., 36, 1–5, https://doi.org/10.1029/2009GL038345, 2009. a, b
Hirdman, D., Burkhart, J. F., Sodemann, H., Eckhardt, S., Jefferson, A., Quinn, P. K., Sharma, S., Ström, J., and Stohl, A.: Long-term trends of black carbon and sulphate aerosol in the Arctic: changes in atmospheric transport and source region emissions, Atmos. Chem. Phys., 10, 9351–9368, https://doi.org/10.5194/acp-10-9351-2010, 2010a. a
Hirdman, D., Sodemann, H., Eckhardt, S., Burkhart, J. F., Jefferson, A., Mefford, T., Quinn, P. K., Sharma, S., Ström, J., and Stohl, A.: Source identification of short-lived air pollutants in the Arctic using statistical analysis of measurement data and particle dispersion model output, Atmos. Chem. Phys., 10, 669–693, https://doi.org/10.5194/acp-10-669-2010, 2010b. a
Ibrahim, M., Curci, G., Habbani, F. I., Kucharski, F., Tuccella, P., and Strada, S.: Association of Air Pollution Levels to Atmospheric Weather Regimes over Europe, Journal of Environmental Science and Pollution Research, 7, 442–446, 2021. a
Immler, F. J., Dykema, J., Gardiner, T., Whiteman, D. N., Thorne, P. W., and Vömel, H.: Reference Quality Upper-Air Measurements: guidance for developing GRUAN data products, Atmos. Meas. Tech., 3, 1217–1231, https://doi.org/10.5194/amt-3-1217-2010, 2010. a
IPCC: Climate Change 2013: The Physical Science Basis. Contribution of Working Group I to the Fifth Assessment Report of the Intergovernmental Panel on Climate Change, edited by: Stocker, T. F., Qin, D., Plattner, G.-K., Tignor, M., Allen, S. K., Boschung, J., Nauels, A., Xia, Y., Bex, V., and Midgley, P. M., Cambridge University Press, Cambridge, United Kingdom and New York, NY, USA, 1535 pp., https://www.ipcc.ch/site/assets/uploads/2018/02/WG1AR5_all_final.pdf (last access: 5 September 2022), 2013. a
Johnsrud, M., Hermansen, O., and Tørnkvist, K.: Air Quality in Ny-Ålesund. Monitoring of Local Air Quality 2016–2017, Tech. rep., NILU – Norwegian Institute for Air Research, ISBN 978-82-425-2953-4, 2018. a, b
Klima- og miljødepartementet: Lov om miljøvern på Svalbard (svalbardmiljøloven), https://lovdata.no/dokument/NL/lov/2001-06-15-79 (last access: 14 July 2022), 2001. a
Koo, J.-H., Wang, Y., Kurosu, T. P., Chance, K., Rozanov, A., Richter, A., Oltmans, S. J., Thompson, A. M., Hair, J. W., Fenn, M. A., Weinheimer, A. J., Ryerson, T. B., Solberg, S., Huey, L. G., Liao, J., Dibb, J. E., Neuman, J. A., Nowak, J. B., Pierce, R. B., Natarajan, M., and Al-Saadi, J.: Characteristics of tropospheric ozone depletion events in the Arctic spring: analysis of the ARCTAS, ARCPAC, and ARCIONS measurements and satellite BrO observations, Atmos. Chem. Phys., 12, 9909–9922, https://doi.org/10.5194/acp-12-9909-2012, 2012. a
Kramer, L. J., Helmig, D., Burkhart, J. F., Stohl, A., Oltmans, S., and Honrath, R. E.: Seasonal variability of atmospheric nitrogen oxides and non-methane hydrocarbons at the GEOSummit station, Greenland, Atmos. Chem. Phys., 15, 6827–6849, https://doi.org/10.5194/acp-15-6827-2015, 2015. a
Läderach, A. and Sodemann, H.: A revised picture of the atmospheric moisture residence time, Geophys. Res. Lett., 43, 924–933, https://doi.org/10.1002/2015GL067449, 2016. a
Li, J., Reiffs, A., Parchatka, U., and Fischer, H.: In situ measurements of atmospheric CO and its correlation with NOx and O3 at a rural mountain site, Metrol. Meas. Syst., XXII, 25–38, https://doi.org/10.1515/mms-2015-0001, 2015. a
Maturilli, M.: High resolution radiosonde measurements from station Ny-Ålesund (2017-04), PANGAEA [data set], https://doi.org/10.1594/PANGAEA.879767, 2017a. a
Maturilli, M.: High resolution radiosonde measurements from station Ny-Ålesund (2017-05), PANGAEA [data set], https://doi.org/10.1594/PANGAEA.879820, 2017b. a
Maturilli, M. and Kayser, M.: Arctic warming , moisture increase and circulation changes observed in the Ny-Ålesund homogenized radiosonde record, Theor. Appl. Climatol., 130, 1–17, https://doi.org/10.1007/s00704-016-1864-0, 2017. a
Maturilli, M., Herber, A., and König-Langlo, G.: Climatology and time series of surface meteorology in Ny-Ålesund, Svalbard, Earth Syst. Sci. Data, 5, 155–163, https://doi.org/10.5194/essd-5-155-2013, 2013. a
Ménégoz, M., Guemas, V., Salas Y Melia, D., and Voldoire, A.: Winter interactions between aerosols and weather regimes in the North Atlantic European region, J. Geophys. Res.-Atmos., 115, 1–19, https://doi.org/10.1029/2009JD012480, 2010. a
Monks, P. S.: Gas-phase radical chemistry in the troposphere, Chem. Soc. Rev., 34, 376–395, https://doi.org/10.1039/b307982c, 2005. a
Moore, C. W., Obrist, D., Steffen, A., Staebler, R. M., Douglas, T. A., Richter, A., and Nghiem, S. V.: Convective forcing of mercury and ozone in the Arctic boundary layer induced by leads in sea ice, Nature, 506, 81–84, https://doi.org/10.1038/nature12924, 2014. a
MOSJ: MOSJ (Miljøovervåking Svalbard og Jan Mayen), Antall Registrerte Snøskutere, http://www.mosj.no/no/pavirkning/ferdsel/snoskuter.html (last access: 14 July 2022), 2018. a, b
Papritz, L. and Grams, C. M.: Linking Low-Frequency Large-Scale Circulation Patterns to Cold Air Outbreak Formation in the Northeastern North Atlantic, Geophys. Res. Lett., 45, 2542–2553, https://doi.org/10.1002/2017GL076921, 2018. a, b, c, d
Park, S., Son, S. W., Jung, M. I., Park, J., and Park, S. S.: Evaluation of tropospheric ozone reanalyses with independent ozonesonde observations in East Asia, Geosci. Lett., 7, 12, https://doi.org/10.1186/s40562-020-00161-9, 2020. a
Parrish, D. D., Murphy, P. C., Albritton, D. L., and Fehsenfeld, F. C.: The measurement of the photodissociation rate of NO2 in the atmosphere, Atmos. Environ., 17, 1365–1379, https://doi.org/10.1016/0004-6981(83)90411-0, 1983. a, b, c
Pasquier, J. T., Pfahl, S., and Grams, C. M.: Modulation of Atmospheric River Occurrence and Associated Precipitation Extremes in the North Atlantic Region by European Weather Regimes, Geophys. Res. Lett., 46, 1014–1023, https://doi.org/10.1029/2018GL081194, 2019. a
Porter, W. C., Heald, C. L., Cooley, D., and Russell, B.: Investigating the observed sensitivities of air-quality extremes to meteorological drivers via quantile regression, Atmos. Chem. Phys., 15, 10349–10366, https://doi.org/10.5194/acp-15-10349-2015, 2015. a
Quinn, P. K., Bates, T. S., Baum, E., Bond, T., Burkhart, J. F., Fiore, A. M., Flanner, M. G., Garrett, T. J., Koch, D., Mcconnell, J. R., Shindell, D., and Stohl, A.: The Impact of Short-Lived Pollutants on Arctic Climate., Tech. Rep. 1, Arctic Monitoring and Assessment Programme (AMAP), Oslo, Norway, http://hdl.handle.net/11374/739 (last access: 14 July 2022), 2008. a
Reimann, S., Kallenborn, R., and Schmidbauer, N.: Severe aromatic hydrocarbon pollution in the Arctic town of Longyearbyen (Svalbard) caused by snowmobile emissions, Environ. Sci. Technol., 43, 4791–4795,2009. a
Robertson, S. C., Lanchester, B. S., Galand, M., Lummerzheim, D., Stockton-Chalk, A. B., Aylward, A. D., Furniss, I., and Baumgardner, J.: First ground-based optical analysis of Hβ Doppler profiles close to local noon in the cusp, Ann. Geophys., 24, 2543–2552, https://doi.org/10.5194/angeo-24-2543-2006, 2006. a, b
Rolph, G., Stein, A., and Stunder, B.: Real-time Environmental Applications and Display sYstem: READY, Environ. Modell. Softw., 95, 210–228, https://doi.org/10.1016/j.envsoft.2017.06.025, 2017. a
Schmalwieser, A. W., Gröbner, J., Blumthaler, M., Klotz, B., De Backer, H., Bolsée, D., Werner, R., Tomsic, D., Metelka, L., Eriksen, P., Jepsen, N., Aun, M., Heikkilä, A., Duprat, T., Sandmann, H., Weiss, T., Bais, A., Toth, Z., Siani, A. M., Vaccaro, L., Diémoz, H., Grifoni, D., Zipoli, G., Lorenzetto, G., Petkov, B. H., Di Sarra, A. G., Massen, F., Yousif, C., Aculinin, A. A., Den Outer, P., Svendby, T., Dahlback, A., Johnsen, B., Biszczuk-Jakubowska, J., Krzyscin, J., Henriques, D., Chubarova, N., Kolarž, P., Mijatovic, Z., Groselj, D., Pribullova, A., Gonzales, J. R. M., Bilbao, J., Guerrero, J. M. V., Serrano, A., Andersson, S., Vuilleumier, L., Webb, A., and O'Hagan, J.: UV Index monitoring in Europe, Photoch. Photobio. Sci., 16, 1349–1370, https://doi.org/10.1039/c7pp00178a, 2017. a
Seinfeld, J. H. and Pandis, S. N.: Atmospheric Chemistry and Physics: From Air Pollution to Climate Change, John Wiley & Sons, Inc, New York, U.S., 2nd Edn., ISBN 978-0-471-72018-8, 2006. a, b, c, d, e, f, g, h
Shears, J., Theisen, F., Bjørdal, A., and Norris, S.: Environmental impact assessment. Ny-Ålesund international scientific research and monitoring station, Svalbard, Tech. rep., Norsk Polarinstitutt, Tromsø, ISBN 82-766-157-2, 1998. a
Simpson, W. R., Brown, S. S., Saiz-Lopez, A., Thornton, J. A., and Von Glasow, R.: Tropospheric Halogen Chemistry: Sources, Cycling, and Impacts, Chem. Rev., 115, 4035–4062, https://doi.org/10.1021/cr5006638, 2015. a, b, c
Sommer, M., Dirksen, R., and Immler, F.: RS92 GRUAN Data Product Version 2 (RS92-GDP.2), GRUAN Lead Centre [data set], https://doi.org/10.5676/GRUAN/RS92-GDP.2, 2012. a
Stein, A., Draxler, R., Rolph, G., Stunder, B., Cohen, M., and Ngan, F.: NOAA's HYSPLIT atmospheric transport and dispersion modeling system, B. Am. Meteorol. Soc., 96, 2059–2077, https://doi.org/10.1175/BAMS-D-14-00110.1, 2015. a
Stohl, A., Forster, C., Frank, A., Seibert, P., and Wotawa, G.: Technical note: The Lagrangian particle dispersion model FLEXPART version 6.2, Atmos. Chem. Phys., 5, 2461–2474, https://doi.org/10.5194/acp-5-2461-2005, 2005. a
Tennbakk, B., Fiksen, K., Borsche, T., Grøndahl, R., Jarstein, S., and Ramm, B.: Alternativer for framtidig energiforsyning på Svalbard, Tech. Rep. 2018-09, THEMA Consulting Group, Oslo, Norway, https://www.regjeringen.no/contentassets/cdaceb5f6b5e4fb1aa4e5e151a87859a/thema-og-multiconsult---energiforsyningen-pa-svalbard.pdf (last access: 14 July 2022), 2018. a, b
Trebs, I., Bohn, B., Ammann, C., Rummel, U., Blumthaler, M., Königstedt, R., Meixner, F. X., Fan, S., and Andreae, M. O.: Relationship between the NO2 photolysis frequency and the solar global irradiance, Atmos. Meas. Tech., 2, 725–739, https://doi.org/10.5194/amt-2-725-2009, 2009. a, b, c, d, e
Vestreng, V., Kallenborn, R., and Økstad, E.: Climate influencing emissions, scenarios and mitigation options at Svalbard, Klima- og forurensningsdirektoratet, Oslo, Norway, https://www.miljodirektoratet.no/globalassets/publikasjoner/klif2/publikasjoner/2552/ta2552.pdf (last access: 14 July 2022), 2009. a, b, c, d
von der Gathen, P. and Rex, M.: O3 sonde year-round soundings since 1992, https://www-air.larc.nasa.gov/missions/ndacc/data.html?station=ny.alesund/ames/o3sonde/ (last access: 5 September 2022), 2020. a
Wallace, J. M. and Hobbs, P. V.: Atmospheric science: an introductory survey, edited by: Dmowska, R., Hartmann, D., and Rossby, T. H., Academic Press, New York, 2nd Edn., ISBN 0-12-732951-X, 2006. a, b
Williams, E. J., Fehsenfeld, F. C., Jobson, B. T., Kuster, W. C., Goldan, P. D., Stutz, J., and McClenny, W. A.: Comparison of Ultraviolet Absorbance, Chemiluminescence,and DOAS Instruments for Ambient Ozone Monitoring, Environ. Sci. Technol., 40, 5755–5762, https://doi.org/10.1021/es0523542, 2006. a