the Creative Commons Attribution 4.0 License.
the Creative Commons Attribution 4.0 License.
 | 05 Sep 2022
Contribution of wood burning to exposures of PAHs and oxy-PAHs in Eastern Sweden
Hwanmi Lim
Sanna Silvergren
Silvia Spinicci
Farshid Mashayekhy Rad
Ulrika Nilsson
Roger Westerholm
Christer Johansson
A growing trend in developed countries is the use of wood as fuel for domestic heating due to measures taken to reduce the usage of fossil fuels. However, this imposed another issue with the environment and human health. That is, the emission from wood burning contributed to the increased level of atmospheric particulates and the wood smoke caused various respiratory diseases. The aim of this study was to investigate the impact of wood burning on the polycyclic aromatic hydrocarbons (PAHs) in air PM10 using known wood burning tracers, i.e. levoglucosan, mannosan and galactosan from the measurement at the urban background and residential areas in Sweden. A yearly measurement from three residential areas in Sweden showed a clear seasonal variation of PAHs during the cold season mainly from increased domestic heating and meteorology. Together, an increased sugar level assured the wood burning during the same period. The sugar ratio (levoglucosan(mannosan+galactosan)) was a good marker for wood burning source such as the wood type used for domestic heating and garden waste burning. On the Walpurgis Night, the urban background measurement demonstrated a dramatic increase in levoglucosan, benzo[a]pyrene (B[a]P) and oxygenated PAHs (OPAHs) concentrations from the increased wood burning. A significant correlation between levoglucosan and OPAHs was observed suggesting OPAHs to be an indicator of wood burning together with levoglucosan. The levoglucosan tracer method and modelling used in predicting the B[a]P concentration could not fully explain the measured levels in the cold season. The model showed that the local wood source contributed to 98 % of B[a]P emissions in the Stockholm area and 2 % from the local traffic. However, non-local sources were dominating in the urban background (60 %). A further risk assessment estimated that the airborne particulate PAHs caused 13.4 cancer cases per 0.1 million inhabitants in Stockholm County.
Please read the corrigendum first before continuing.
-
Notice on corrigendum
The requested paper has a corresponding corrigendum published. Please read the corrigendum first before downloading the article.
-
Article
(3550 KB)
- Corrigendum
-
Supplement
(595 KB)
-
The requested paper has a corresponding corrigendum published. Please read the corrigendum first before downloading the article.
- Article
(3550 KB) - Full-text XML
- Corrigendum
-
Supplement
(595 KB) - BibTeX
- EndNote


In the year 2016, fuel combustion, especially biomass for domestic heating, was the single most important source of airborne benzo[a]pyrene (B[a]P) and many other polycyclic aromatic hydrocarbons (PAHs), primary fine particulate matter (PM) and black carbon (BC) in Europe (EEA, 2018a). Concentrations of airborne PM of particle diameters less than 10 or 2.5 µm (PM10 and PM2.5) on a daily or yearly basis and B[a]P on an annual basis are regulated by the EU Ambient Air Quality Directives. For daily mean PM10 concentrations, a maximum of 35 d per year is allowed to exceed 50 mu g m−3 (WHO, 2006; EU, 2008; EEA, 2017). Most incidents with exceedances of the daily PM10 limit value due to the increased residential heating from wood burning occur during the cold season (Maenhaut et al., 2012). During the winter, wood smoke has been estimated to contribute to approximately 20 %–50 % of the total organic matter (Puxbaum et al., 2007) and contribute to elevated levels of PM10, PM2.5, B[a]P and BC (Yttri et al., 2005; Favez et al., 2009; Maenhaut et al., 2012; Wagener et al., 2012; Fuller et al., 2014; Beekmann et al., 2015; Cordell et al., 2016; Glasius et al., 2018). The use of wood as a fuel for domestic heating is growing in industrialised countries as an alternative to fossil fuels. Between 2010 and 2020, a 57 %–110 % increase of biomass usage has been estimated as a result of CO2 emission-related policies and regulations (Wagner et al., 2010).
Air pollution from biomass burning has been estimated to contribute to at least 40 000 premature deaths in Europe (Sigsgaard et al., 2015). Earlier studies have shown that exposure to wood smoke is associated with respiratory diseases, e.g. asthma (Boman et al., 2003) and possibly also cardiovascular diseases (Kocbach Bølling et al., 2009). It was also noted that different combustion conditions may lead to different types of wood smoke particles with varying physicochemical properties and health risks (Kocbach Bølling et al., 2009).
B[a]P is regarded as a marker for PAHs which originate from different types of incomplete combustion of organic matter such as fossil and biomass fuels and smoking (Boström et al., 2002; EU, 2005, 2008; Lewtas, 2007). B[a]P has been classified as a known human carcinogen (Group I) by the International Agency for Research on Cancer (IARC), which recently added outdoor air pollution and PM to the same group (IARC, 2010, 2016). There are also other PAHs classified as probable and possible human carcinogens (IARC, 2010) but among PAHs, it is only B[a]P that is regulated (annual mean of 1 ng m−3 as target value) in the EU Ambient Air Quality Directives. Additionally, a compound belonging to the class of oxygenated PAHs (OPAHs), 9,10-anthraquinone, has been classified as a possible human carcinogen (Group 2B) (IARC, 2013) but is still not on the regulation list. The main emission sources of OPAHs are traffic and biomass burning but they are also formed at photo degradation of PAHs (Alves et al., 2017). The OPAHs are mainly particle-associated in the atmosphere due to their low vapour pressure (Walgraeve et al., 2010; Delgado-Saborit et al., 2013).
A highly selective tracer for burning of wood is levoglucosan (1,6-anhydro-β-D-glucopyranose), a monosaccharide derivative formed when cellulose is pyrolysed at high temperatures (Shafizadeh, 1968; Simoneit et al., 1999). Due to the high concentration in the smoke and a high chemical stability, this tracer compound can be detected in the atmosphere through long-range transports (Simoneit et al., 1999; Fraser and Lakshmanan, 2000). In addition, mannosan and galactosan released from the thermal degradation of hemicellulose are also detected in wood smoke emissions and suggested to be source-specific tracers for wood burning (Nolte et al., 2001; Simoneit, 2002). However, recent studies indicate that atmospheric degradation of levoglucosan is important and may shorten the lifetime significantly (Li et al., 2021). They suggest considering the ageing in air masses of levoglucosan when it is used to calculate the biomass burning contribution to organic carbon (Hong et al., 2022). In our case, the sites were located in close proximity to the main sources of levoglucosan and the photochemical degradation is expected to be insignificant for these conditions. Earlier studies have measured either levoglucosan or the combination of all three monosaccharides to estimate the contribution of wood burning to the total air PM collected in various cities of central and northern European countries (Yttri et al., 2005; Caseiro et al., 2009; Maenhaut et al., 2012, 2016; Wagener et al., 2012; Glasius et al., 2018).
A significant reduction in the emissions of air pollutants has been observed in Europe since 1990 due to measures taken in the energy, road transport and industry area, and fuel change and advances in fuel technology, e.g. desulfurisation (EEA 2018b). PM10 and PM2.5 have undergone a considerable decrease in emissions from the public electricity and heat production while a steady state or even an increasing trend was observed in the residential category (EEA 2018b). B[a]P, on the other hand, showed first a clear declining trend until 2000 but, since then, a gradual increase has been shown (EEA, 2018b). The emission inventory report, however, noted that PAH emission was mainly from the chemical industry (42 %) whereas the commercial, institutional and households including residential sources are the main emission category for PM10 and PM2.5, contributing with 39 % and 56 %, respectively (EEA, 2018b), which implies that the emissions of both PM10 and PM2.5 from households are increasing.
The aim of the present study was to quantify the importance of wood burning for PAHs, OPAHs and PM10 during different seasons in three different residential areas in Sweden and the impacts of biomass burning on the urban background during the episodic events using tracers of wood burning. Altogether, the lung cancer risk of air PM associated with the exposure was estimated in the urban background and residential areas.
2.1 Chemicals and solvents
All solvents used were of high-performance liquid chromatography (HPLC) grade: toluene, hexane and methyl tert-butyl ether from Rathburn Chemicals (Walkerburn, UK) and acetonitrile from VWR (Radnor, PA, USA). Anhydrous dodecane (>99 %) was purchased from Sigma-Aldrich (St. Louis, MO, USA). PAHs, OPAHs and internal standards (ISs) are listed in Table S1 in the Supplement. Supplier and purity information of PAH and OPAH standards, and ISs are given elsewhere (Ahmed et al., 2015; Nyström et al., 2016). Levoglucosan (1,6-anhydro-β-D-glucose) of 99 % purity was obtained from Sigma-Aldrich (St. Louis, MO, USA) and its isotope-labelled IS, levoglucosan-13C6 of 98 % purity was from Cambridge Isotope Laboratories, Inc. (Andover, MA, USA). Mannosan (1,6-anhydro-β-D-mannose) and galactosan (1,6-anhydro-β-D-galactose), both of more than 95 % purity, were purchased from Cayman chemical (Ann Arbor, MI, USA). A Milli-Q plus system from Millipore (Bedford, MO, USA) was used to prepare ultrapure water with a resistivity of 18 MΩ cm.
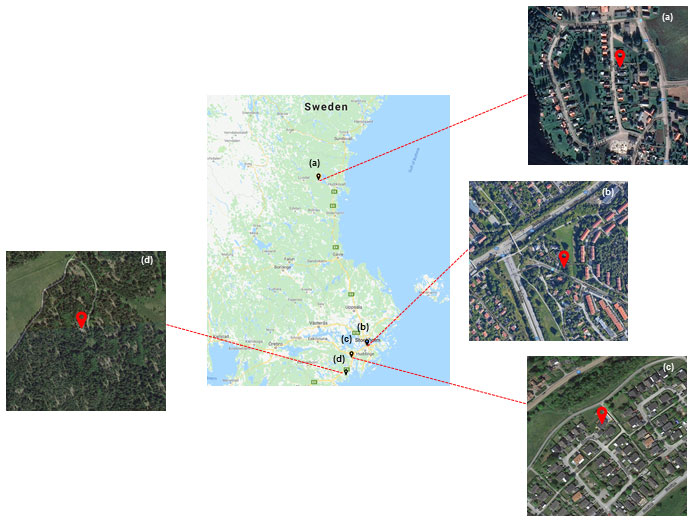
Figure 1Geographical location of four sampling sites in Sweden: (a) Delsbo (DE), (b) Enskede (EN), (c) Ytterjärna (YJ) and (d) Aspvreten (ASP). Map data: ©Google, DigitalGlobe and Lantmäteriet/Metria.
2.2 Sampling
2.2.1 Sampling location characterisation
Three different residential sampling sites in Sweden were selected to collect PM10 filter samples and one rural site for measurements of the non-local contributions as shown in Fig. 1. In detail, Delsbo (DE, 61.80378∘ N, 16.55225∘ E) is a low-traffic villa area in the western Hudiksvall, a city approx. 300 km north of Stockholm. The other two residential areas are located in Stockholm, Enskede (EN, 59.28004∘ N, 18.04046∘ E) and Södertälje, Ytterjärna (YJ, 59.08761∘ N, 17.57143∘ E) with road traffic influence. The rural background sample was collected in Aspvreten (ASP, 58.80584∘ N, 17.38832∘ E), approximately 80 km southwest of Stockholm. In addition, two sampling stations close to Enskede in central Stockholm (not shown in the map) were also included, one located in a densely trafficked street canyon, Hornsgatan (HG, 59.31728∘ N, 18.04984∘ E) and one on a rooftop (24 m above the streets) classified as an urban background site, Torkel Knutssonsgatan (TK, 59.31605∘ N, 18.05785∘ E). Basic meteorological parameters (temperature, wind) and other air quality data (black carbon, NOx , PM10 and PM2.5) for these two areas were available from the Environment and Health Administration (SLB), Stockholm (Meteorology: https://www.slb.nu/slbanalys/historiska-data-met, last access: 15 August 2022; other data: https://www.slb.nu/slbanalys/historiska-data-luft (last access: 15 August 2022). Black carbon data are available from the Environment and Health Administration (SLB) via https://www.slb.nu/publications/lim_et_al_2022/, last access: 31 August 2022).
2.2.2 PM10 sampling
Particulate matter (<10 µm aerodynamic diameter) was collected by active sampling through a micro-quartz fibre filter (Ø = 47 mm, T293 grade, Munktell, Ahlstrom-Munksjö, Stockholm, Sweden) using a sequential sampler (SEQ47/50, Sven Leckel, Ingenieurbüro GmbH, Berlin, Germany) at an airflow rate of 1 m3 h−1. The sampling period was set to 24 h from January to April, after which it was set to 48 h until the end of the year 2017. A sampling campaign was done at TK, the urban background site, from 22 February to 6 May 2016, thereby including the Walpurgis Night event (30 April). The samples were collected in the same way as the other sampling sites but with a flow rate of 2.3 m3 h−1. A field blank was prepared using a filter treated the same as a sample except that no air was taken via sampler. The individual filter sample was stored at −20 ∘C until extraction.
2.3 Sample preparation
The filter sample was put at room temperature for 1 h after being taken out from the fridge, then cut into three parts. The first and second quarters were used for PAH, OPAH (TK sample only) and sugar analysis while the remaining half was kept as backup for re-analysis. All three parts were weighed separately. As shown in Table S2, the cut filters were pooled into half calendar months during the winter season (November–April) when higher emission was expected while whole-month samples were analysed during the warmer period (May–October).
2.3.1 PAH
The filter samples were prepared as described previously (Ahmed et al., 2015). In brief, the pooled filters were first spiked with ISs and then extracted using an accelerated solvent extraction (ASE) system. The extracts were then applied to a silica SPE column and eluted with toluene. The final eluate was subjected to liquid chromatography–gas chromatography/mass spectrometry (LC-GC/MS) analysis. All analytical parameters are given in detail elsewhere (Sadiktsis et al., 2014; Olsson et al., 2014). The field and method blank filters were extracted and prepared in the same manner as sample filters. However, the PAH data for rural background samples were provided by the Swedish Environmental Research Institute (https://www.ivl.se, last access: 26 July 2022.).
2.3.2 OPAHs
OPAHs were collected on filters at TK during the spring in 2016. The samples were prepared similarly as for the PAH determination except that an additional IS, deuterated 9,10-anthraquinone (AQ-d8), was spiked onto each filter before the ASE. The details of sample preparation and the parameters used in LC-GC/MS analysis have been described previously (Ahmed et al., 2015). Both field and method blank filters were prepared and analysed in the same way as the samples.
2.3.3 Levoglucosan, mannosan and galactosan
In brief, the pooled filters were spiked with 13C-labelled levoglucosan as IS prior to extraction by ultrasonication in ultrapure water. The extracts were vacuum-dried, then re-dissolved in water/acetonitrile (5:95) and finally analysed by hydrophilic interaction liquid chromatography/electrospray–tandem mass spectrometry (HILIC/ESI-MS/MS). The details of sample preparation and instrumental analysis have been described previously (Mashayekhy Rad et al., 2018). Both field and method blank filters were extracted and prepared in the same manner as the sample filters.
2.4 Emission inventory of B[a]P
A previous emission inventory during 2010 quantified local sources of B[a]P within Stockholm County and neighbouring Uppsala County for emissions during the year 2006 (SLB-analys, 2010). In the local inventory, a total of 73 kg of B[a]P was accounted for, of which, 96 % were local traffic and residential wood sources. The remaining sources were residential oil combustion, boilers, industrial energy sources and shipping which together contributed to 4 % of the emitted B[a]P. Non-local sources, e.g. transport of B[a]P from outside the regions, were concluded to be a substantial source as well. Based upon the previous emission inventory, focus was directed towards local traffic and residential wood sources in the presented work.
2.4.1 Residential wood combustion
An emission inventory of residential wood combustion was built including 0.28 million objects based on chimney sweeper documentations and housing data in Stockholm County (see Appendix for details). The methodology was to a large extent based on a report from the Swedish Meteorological and Hydrological Institute (SMHI) (Andersson et al., 2018).
2.4.2 Road traffic
We used a detailed bottom-up inventory of traffic in Stockholm County, part of the Eastern Swedish Air Quality Association (in Swedish: Östra Sveriges Luftvårdsförbund). The traffic exhaust emissions in the inventory are based on data from the Handbook Emission Factors for Road Transport (HBEFA) 3.3 (http://www.hbefa.net/e/index.html, last access: 15 August 2022). It includes emission factors for passenger cars (PC), light-duty vehicles (LDV, <3.5 ton), heavy goods vehicles (HGV, >3.5 ton), urban buses, coaches and motorcycles, each divided into different categories for a wide range of traffic situations. As in a previous publication on B[a]P emissions from wood in Helsinki (Hellén et al., 2017), a factor of 0.000031 was applied on PM exhaust emissions to estimate the B[a]P contribution from traffic.
2.4.3 Non-local sources
The emission inventory only covers local sources of B[a]P from residential wood burning and road traffic. However, there is transport from outside regions that affects the concentrations of airborne B[a]P in Stockholm County. There are several regional background sites located in areas with few inhabitants where continuous monitoring of B[a]P and other air pollutants are measured. In the present work, we have used regional background data for 2014–2018 from Råö, a coastal area in Kungsbacka in Western Sweden. It is located upwind from the other sampling locations in this work. There is another background site available located in a forested area just outside Stockholm but it was dismissed due to interference and local emissions showing higher concentrations of B[a]P than those in the suburban and urban measurements. The B[a]P concentration in Råö was very similar in 2017 (0.042 ng m−3) as the average during 2014–2018 with concentrations ranging between 0.033–0.053 ng m−3 during the period.
2.4.4 Model simulations
All dispersion modelling of local emissions was performed with a Gaussian plume model within in the Airviro air quality management system (Apertum, 2021; Segersson et al., 2017). The models used to calculate the concentrations based on the emissions are part of the commercial software Airviro (https://www.airviro.com/airviro, last access: 26 July 2022). The photochemical degradation of particle phase PAH is a very slow process (Keyte et al., 2013) and the local emission source was very close to the sampling sites in the study. Therefore, a Gaussian model without photochemistry can be used assuming that the OPAH concentrations are from direct emissions rather than photochemical formation of locally emitted PAH. Airviro uses a diagnostic wind model based on the theory first described by Danard (1977) in which it is assumed that small-scale winds can be seen as a local adaptation of large-scale winds. Calculation of B[a]P concentrations was performed for local wood and traffic sources in a 5.5 km2 size area with a 100 m grid size around the measurement sites using meteorology during the measurement period from a 50 m meteorological mast located in Högdalen, a suburb in Stockholm. Meteorological data include the wind speed, wind direction, temperature, relative humidity and solar radiation. Modelled monthly mean concentrations due to local residential wood combustion and road traffic at the Stockholm County measurement sites were based on hourly time series calculations using hourly meteorological from the Högdalen mast. The measured monthly concentration of B[a]P in regional background was added to the calculated local amount, and the total B[a]P concentration can then be compared with the measured concentration during the measurement campaign in Stockholm urban background (TK), residential area (EN) and (YJ). The measurement in the northern residential area (DE) is outside of the emission inventory area and cannot be compared with calculated concentrations. Dispersion modelling was also done for the entire Stockholm County for local wood and local traffic sources using climatology for 1993–2010. The climatology data consist of frequency of occurrence of hourly mean data in 60 wind sectors, each 6∘ with 6 stability classes which are classified according to the atmospheric stability conditions (as default discriminated by 6 intervals of Monin–Obukhov lengths). After data sorting, frequencies of all classes are estimated and the median values (of the Monin–Obukhov lengths) of each class (in this case, 360 classes) are identified including the specific date/hour when each class example occurred. We use the diagnostic wind model that takes into account topography, roughness and land use in order to extrapolate over the whole model domain. The climatology derived modelled data were used to calculate yearly B[a]P concentrations in entire Stockholm County in 100×100 m grid size in order to obtain a general exposure and health impact assessment for average meteorological conditions. The average regional background B[a]P concentrations during the years 2014–2018 were added to the modelled local contribution.
2.5 B[a]P equivalent concentration
B[a]P equivalent concentrations (B[a]Peq) were calculated by multiplying individual PAH concentration with its relative potency factor (RPF). As shown in Table 1, this study used 17 PAHs for the total B[a]Peq.
Table 1The relative potency factor (RPF) for PAHs used in this study.
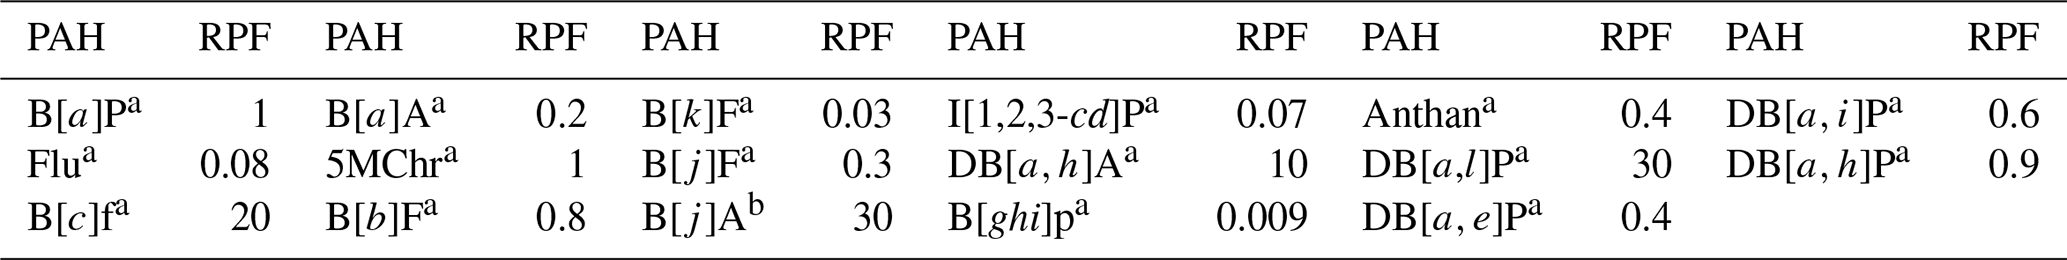
a MDH, 2016, b Lim et al., 2015. See Table S1 for compound abbreviations.
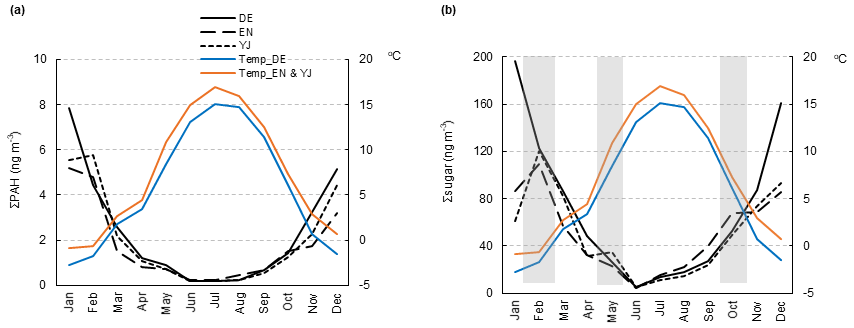
Figure 2Seasonal variation of (a) Σ PAHs (sum of 48 PAHs in Table S1) and (b) Σ sugars (sum of levoglucosan, mannosan and galactosan) in PM10 collected from three sampling sites (DE, EN and YJ) in 2017. The local temperature data were obtained from the Swedish Meteorological and Hydrological Institute (https://www.smhi.se, last access: 26 July 2022). Periodic occasions with elevated sugar level were marked in grey colour in (b).
3.1 Seasonal variation of PAH and sugar levels
The monthly variations of the PAHs and sugars in 2017 are shown in Fig. 2a and b, respectively. In January, the most northern area (DE) showed much higher levels of both PAHs and sugars and also lower temperatures than the two areas in Stockholm (EN and YJ). This is not only due to increased emissions but also meteorology. That is, the low temperature is associated with higher emissions from residential heating, traffic and less efficient ventilation of pollutants due to lower wind speeds and more stable atmosphere, involving more frequent situations with inversions. There were three occasions when the sugar levels were increased more than the PAHs, indicating the increased emission source of levoglucosan, mannosan and galactosan, i.e. wood burning. For all sampling sites, the lowest levels are detected in the summertime.
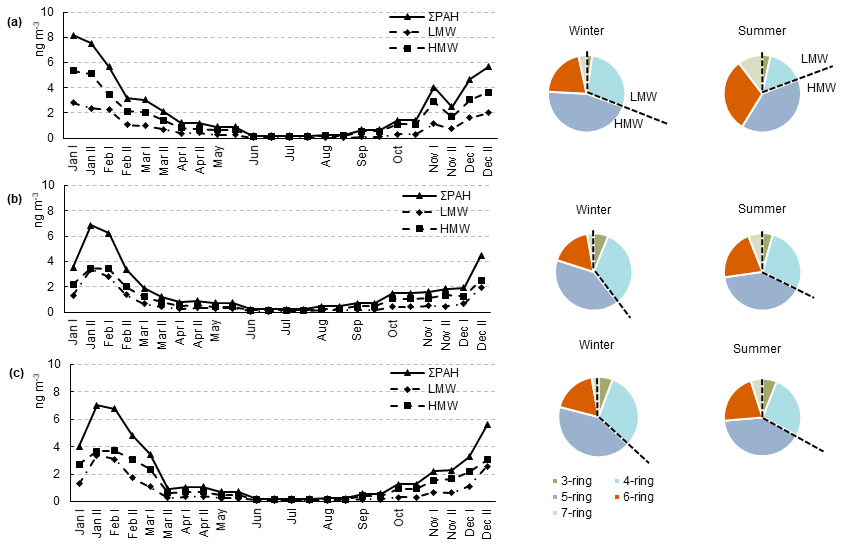
Figure 3Seasonal variation of low and high molecular weight PAHs in PM10 collected from three sampling sites in 2017: (a) DE, (b) EN and (c) YJ.
3.1.1 PAHs
The PAH concentrations showed a strong seasonal variation at all three sites as shown in Fig. 3. On the left side, the mass concentration of low and high molecular weight PAHs (LMW and HMW) are compared together with those of the total PAHs. PAHs with three and four rings were grouped in LMW while five- and six-ring PAHs were in HMW. PAHs are semi-volatile compounds and partitioned in gas and particle phases depending on the volatility. Three- and four-ring PAHs are distributed mostly in the gas phase during the warmer season and vice versa (Bi et al., 2003). The same applied to this study where LMW PAH levels were lower during summer due to their partitioning more in the gas phase. The pie chart (right side in Fig. 3) shows the relative abundance of LMW and HMW during summer (June–July) and winter (January–February). A considerable shift in the relative LMW level from winter to summer was observed in all three locations with the largest change in DE. The distinctive seasonal shift observed in DE was also from the increased residential heating which mostly affected the PAHs with four rings. The increased emission of four-ring PAHs from domestic heating was also reported in the high Arctic during winter (Singh et al., 2017). The sugar levels, in general, followed the seasonal variation as the PAHs, however, there were occasions with increased sugar levels when biomass burning or wood combustion happened.
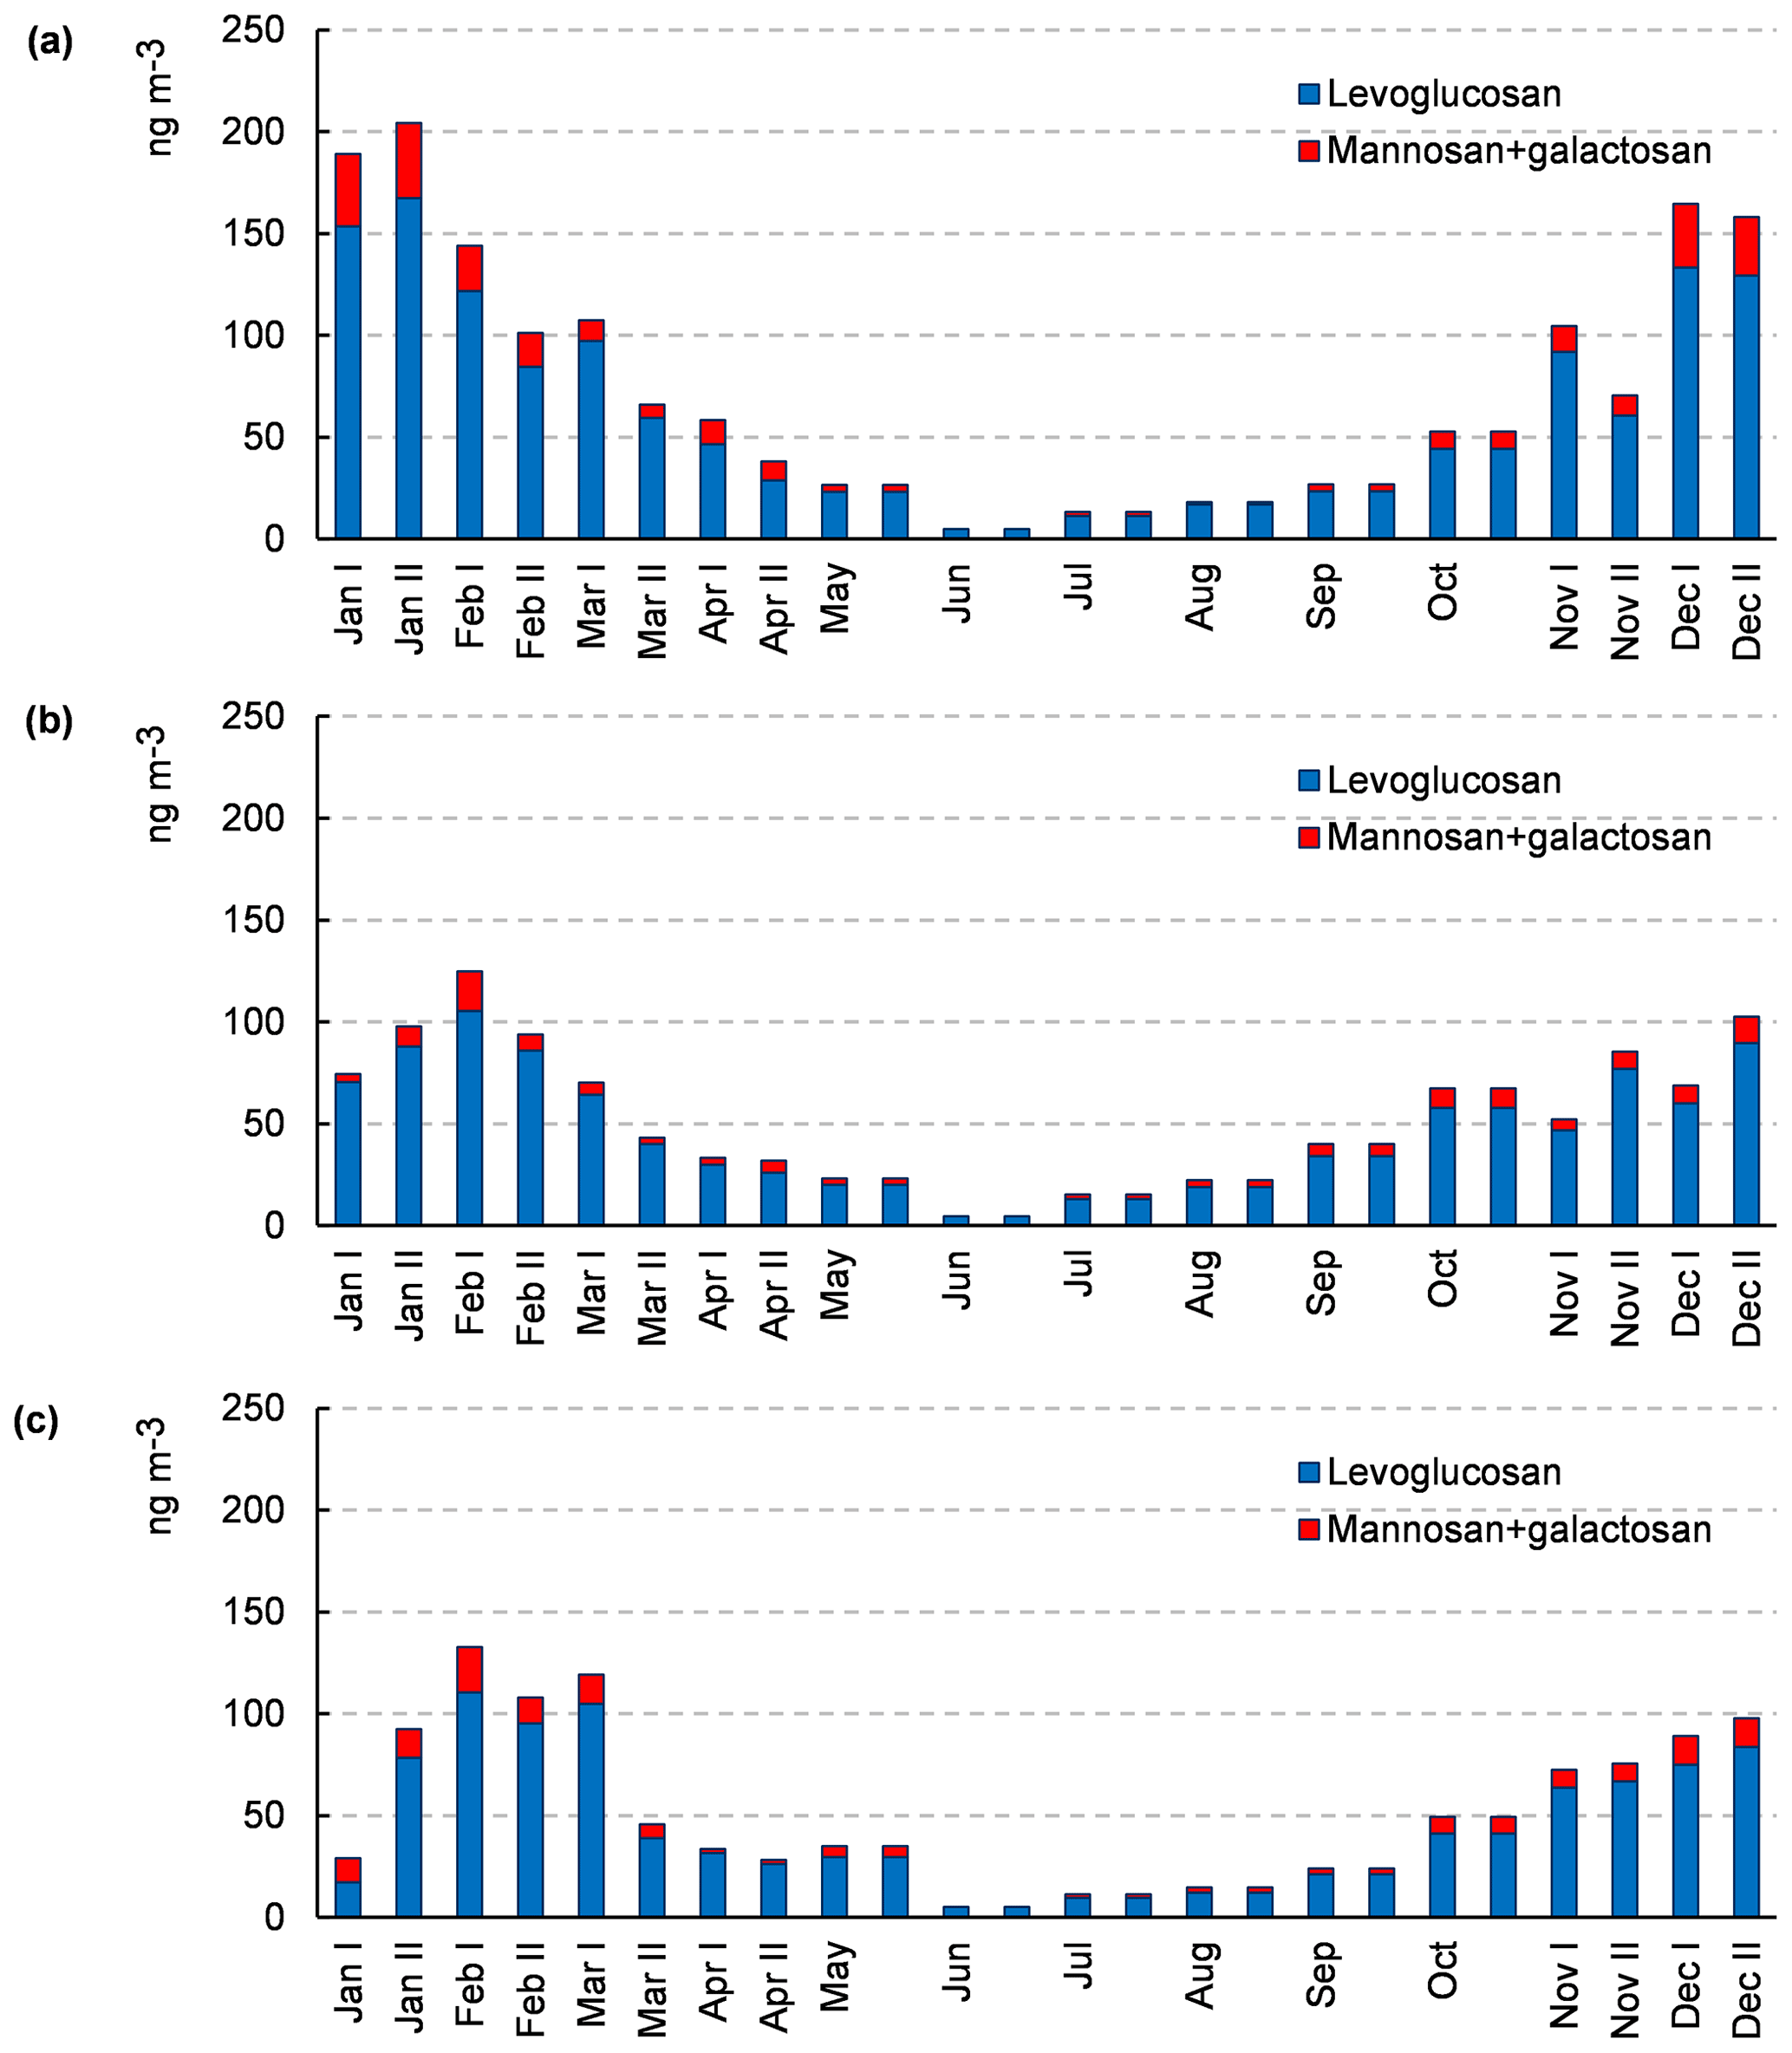
Figure 4Distribution of annual measurement data for levoglucosan, mannosan and galactosan from three sampling locations. Mannosan and galactosan are determined as sum due to co-elution in the chromatogram: (a) DE, (b) EN and (c) YJ.
3.1.2 Levoglucosan, mannosan and galactosan
Annual sugar concentrations from three sampling locations are summarised in Fig. 4. The level is higher during colder season, January in DE and February in EN and YJ while the level was lowest in June from all sampling sites. The seasonal variation of levoglucosan concentrations was the largest in DE (4.96–167 ng m−3) followed by EN and YJ (4.41–105 and 5.30–111 ng m−3, respectively) as shown in Table S3.
3.2 PAH and sugar emission trend associated with residential wood burning
Other air quality parameters, e.g. NOx, PM10 and PM2.5, were also measured at the urban background site (TK) during the sampling period (Fig. S1 in the Supplement). The seasonal variation was the greatest at the residential area in northern Sweden (DE) with regard to the winter-to-summer ratio of B[a]P concentration (Table S4). The annual mean concentration of B[a]P from the three sites (DE, EN, YJ) and one rural background (ASP) were 0.11, 0.08, 0.09 and 0.06 ng m−3, respectively (Table S4), which is far below than the EU target value of 1 ng m−3.
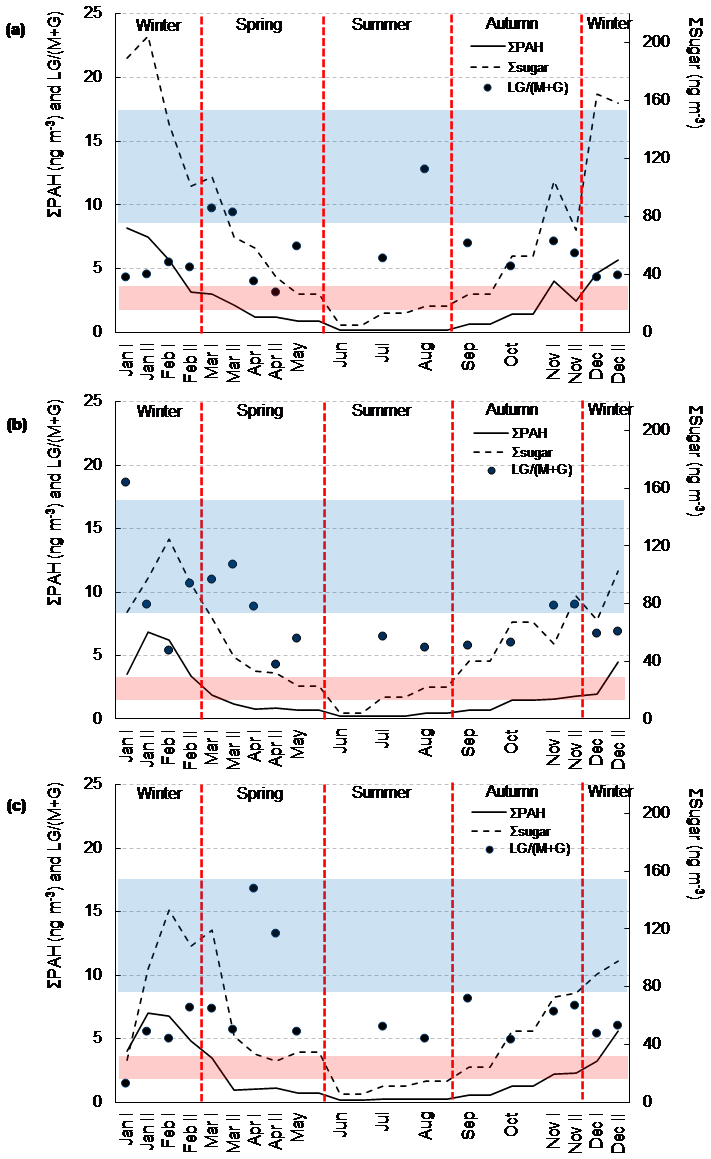
Figure 5Seasonal variation of Σ PAHs, Σ sugars and levoglucosan(mannosan+galactosan) (LG(M+G) ratio in PM10 collected from three sampling sites in 2017: (a) DE, (b) EN and (c) YJ. The blue and red zone represents the previously reported sugar ratio from hard and soft wood burning, respectively.
The variation in both total PAH concentration and the sum of anhydrous monosaccharides (levoglucosan, mannosan and galactosan) is shown in Fig. 5. Also, the relative ratio between levoglucosan and the other two isomers (LG(M+G)) is plotted to estimate the contribution of different wood sources to the sugar emission. The hard wood burning generally gave higher ratios (8.5–17.6) while combustion from soft wood showed lower values (1.8–3.6) (Nolte et al., 2001; Fine et al., 2002, 2004; Schmidl et al., 2008). The reported sugar ratios in the air PM ranged from 3.2 to 14 (Fabbri et al., 2009) and this study showed comparable but slightly wider sugar ratios (1.46–18.6).
Detailed results and discussion for each location are as follows.
3.2.1 Delsbo
A clear winter-to-summer variation in the sugar emission was observed in the northern villa area as shown in Fig. 5a. The measured sugar level in January was almost twice as high as those from the other two locations while the PAH levels were similar in all three locations throughout the year. It is likely that there was a substantial increase in wood burning in DE during the winter largely from the residential heating. The sugar ratio (LG(M+G)) during the winter varied within the range 4.3–5.5, suggesting that both hard and soft wood was used as fuel for heating. During spring, there were two occasions with elevated sugar levels. The first was in March with the indication of hard wood burning (ratio 9.7 and 9.4) while the second was in April with mixed wood combustion sources (4.0 and 3.1).
3.2.2 Enskede
Figure 5b shows the annual variation in PAH and sugar emissions in the trafficked urban residential area. The winter-to-summer variation was observed but the sugar emissions were lower than in DE during the cold season implying less wood burning. The sugar ratios revealed a predominant burning of hard wood. Apart from the annual event of the Walpurgis Night, Stockholm city allowed residents to burn their garden wastes (e.g. grasses, leaves, weeds, shrubs, and wood) twice a year in weeks 18 (1–7 May 2017) and 40 (2–8 October 2017). This is clearly reflected by the elevated sugar level in October and the sugar ratio (5.2), the latter indicating mixed combustion sources.
3.2.3 Ytterjärna
As shown in Fig. 5c, the suburban residential area in Stockholm also showed a seasonal variation in PAH and total sugar similar to DE and EN. However, a different trend was observed with the sugar ratios. It was noted that the sugar emissions were largely from mixed wood burning except for April when the sugar ratios were as high as 16.8 and 13.3 indicating hard wood burning. This infers that the residents in YJ used both hard and soft wood for domestic usage but predominantly hard wood for special occasions, e.g. Walpurgis Night. The elevated sugar level in May was related to the garden waste burning week as reflected by the sugar ratio of 5.6.
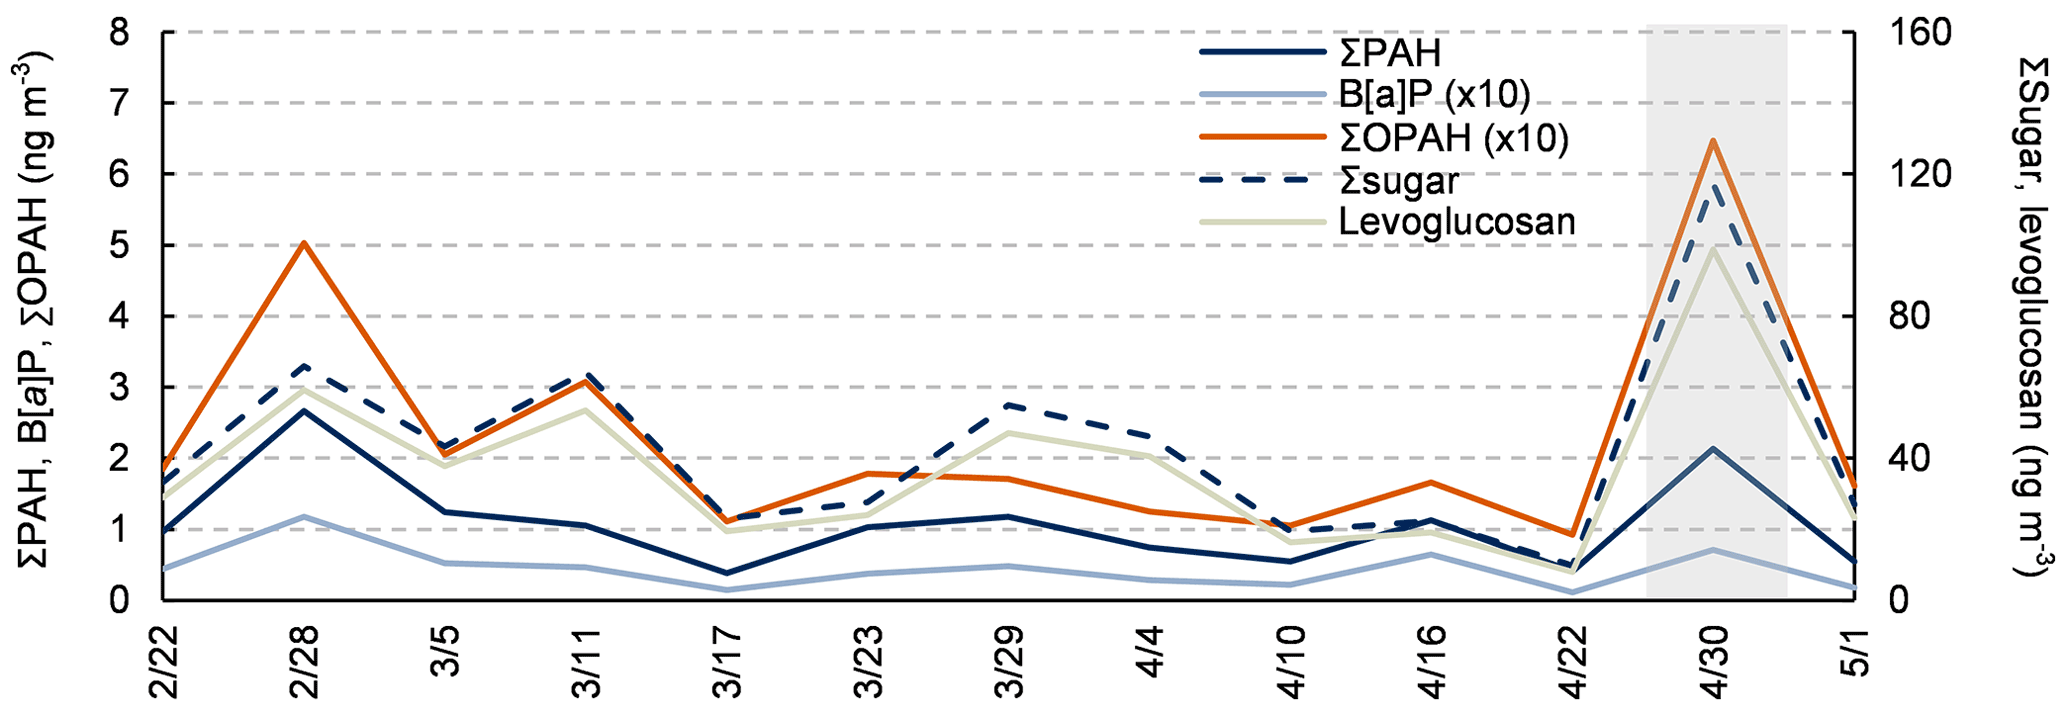
Figure 6Measured concentrations of Σ PAHs, B[a]P, Σ OPAH, Σ sugars and levoglucosan in PM10 collected from Stockholm urban background (TK) during 22 February–5 May 2016.
3.3 Impact of non-residential biomass burning and OPAHs
The measured levels of PAHs, OPAHs and sugars in airborne PM10 taken at the urban background (TK) around the Walpurgis Night (30 April) in 2016 are shown in Fig. 6. A clear elevation of both the total sugar and levoglucosan can be observed in the sample collected on the event day. In the present study, the total sugar level showed an increase of almost three times from 36.4 to 117 ng m−3. The total OPAH level was also shown to increase approximately threefold. The sugar ratios (4.4–7.2) from the urban background indicated a mixed emission source of hard and soft wood combustion except for the sample collected on the 30th April. This sample exhibited sugar ratio of 8.8, i.e. reflecting hard wood burning. Detailed information is given in Table S5.
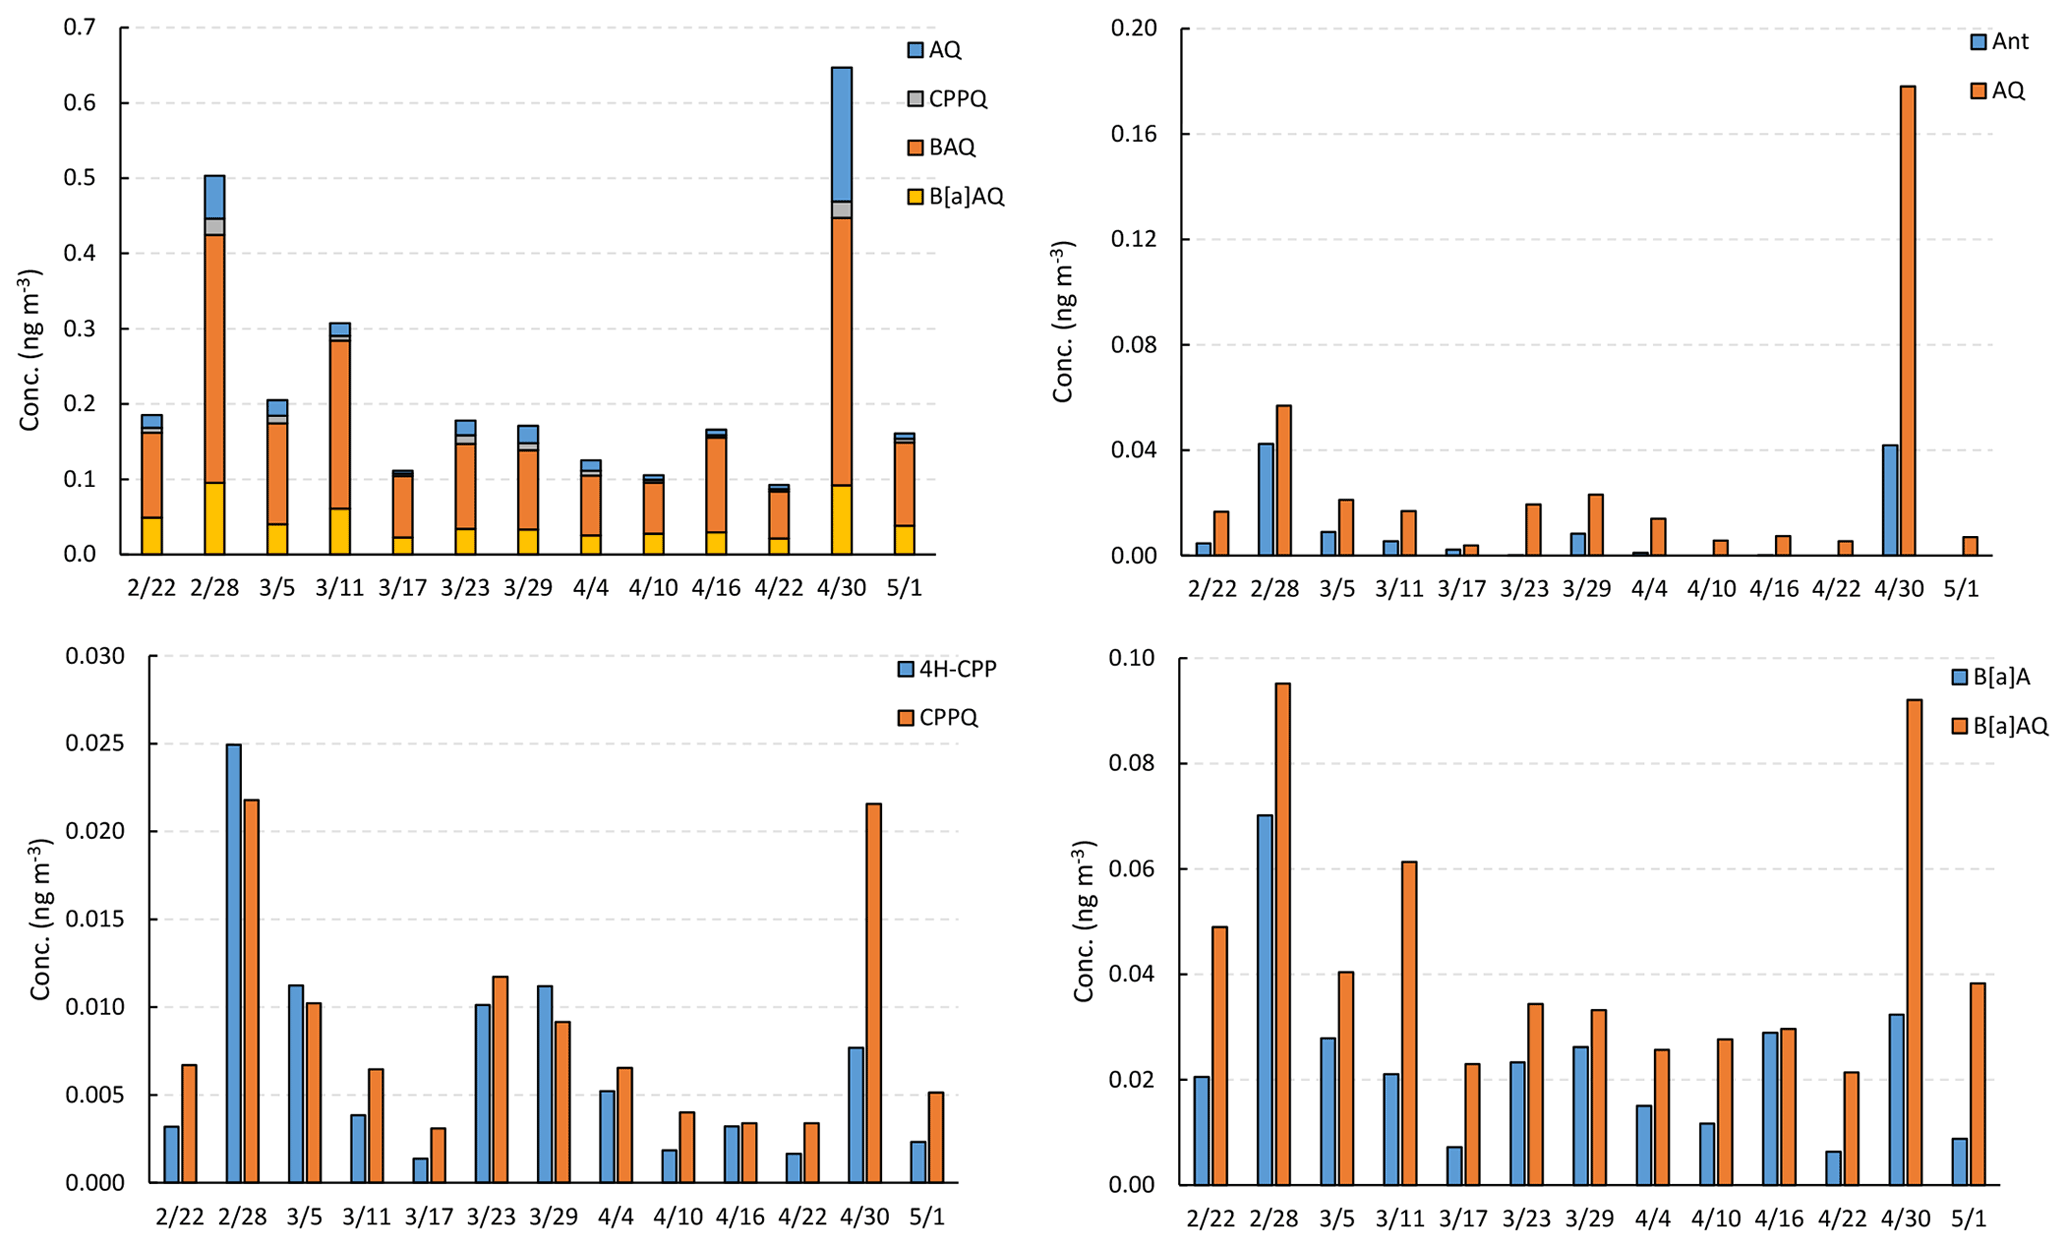
Figure 7Measured concentration of total OPAHs (AQ, CPPQ, BAQ and B[a]AQ) and individual concentration of OPAH and its parent PAH in PM10 collected from Stockholm urban background (TK) during 22 February–5 May 2016.
The dominating OPAH was 7H-benzo[de]anthracen-7-one (benzanthrone, BAQ), accounting for more than 50 % of the measured OPAHs (55 %–76 %), followed by 9,10-anthracenedione (AQ) (4 %–28 %) (Fig. 7). The same trend has been reported in atmospheric PM2.5 measured at an urban background site in Bologna, Italy (Pietrogrande et al., 2022). The correlation between OPAH and its parent PAH was significant (p<0.01), indicating PAHs and OPAHs were from the same primary combustion source or PAHs were the secondary source of OPAHs. However, the increased emission of OPAHs on the Walpurgis Night is mainly from the primary combustion source, i.e. biomass burning (Fig. 7).
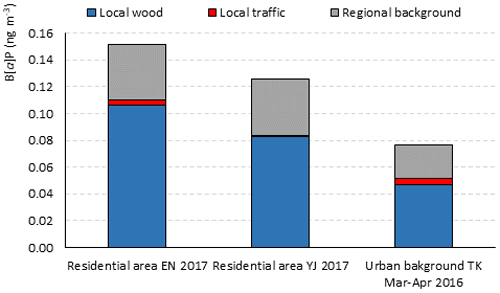
Figure 8Modelled concentrations of B[a]P in Stockholm compared with measured values. In urban background (TK), the regional background data are from 29 February–2 May and measured data from 28 February–1 May.

Figure 9Modelled monthly concentrations of B[a]P in residential areas (EN and YJ) and urban background (TK) compared with measured values. Measured data are from 2017 for residential areas and from April–May 2016 for urban background.
3.4 Modelled concentrations of B[a]P
The modelled results at all measurement sites compared to measured data are shown in Figs. 8 and 9. At all three locations, urban background (TK) and residential areas (YJ, EN), the average modelled B[a]P concentration is higher than the measured value. The modelled concentrations are overestimated consistently both during year and at all sites. The poor correlation between modelled and measured data is likely to have several causes. Regional background data are very important to add to the modelled concentrations but it also adds to the uncertainty partly depending on the prevailing wind direction and whether local emission affects the measurements. Also, previous work has showed that emissions vary significantly between old and new wood stoves (Omstedt et al., 2014); details that were unavailable in the chimney sweeper data. In this work, we used emissions factors based on Todorovic et al. (2007), EMEP/EEA (2013), SMED and the Swedish EPA Naturvårdsverket (2017). The range of emission factors documented in Todorovic (2007) are shown in Table A4 in the Appendix, clearly showing the difficulty in predicting B[a]P concentrations by modelling. For example, an emission factor range between 0.004–0.27 (0.05 was used in inventory) was documented for wood stoves, the type of stove that dominates the local wood sources in the Stockholm emission inventory. The assumed emission factor for wood stoves could alone vary the B[a]P concentration outcome significantly.
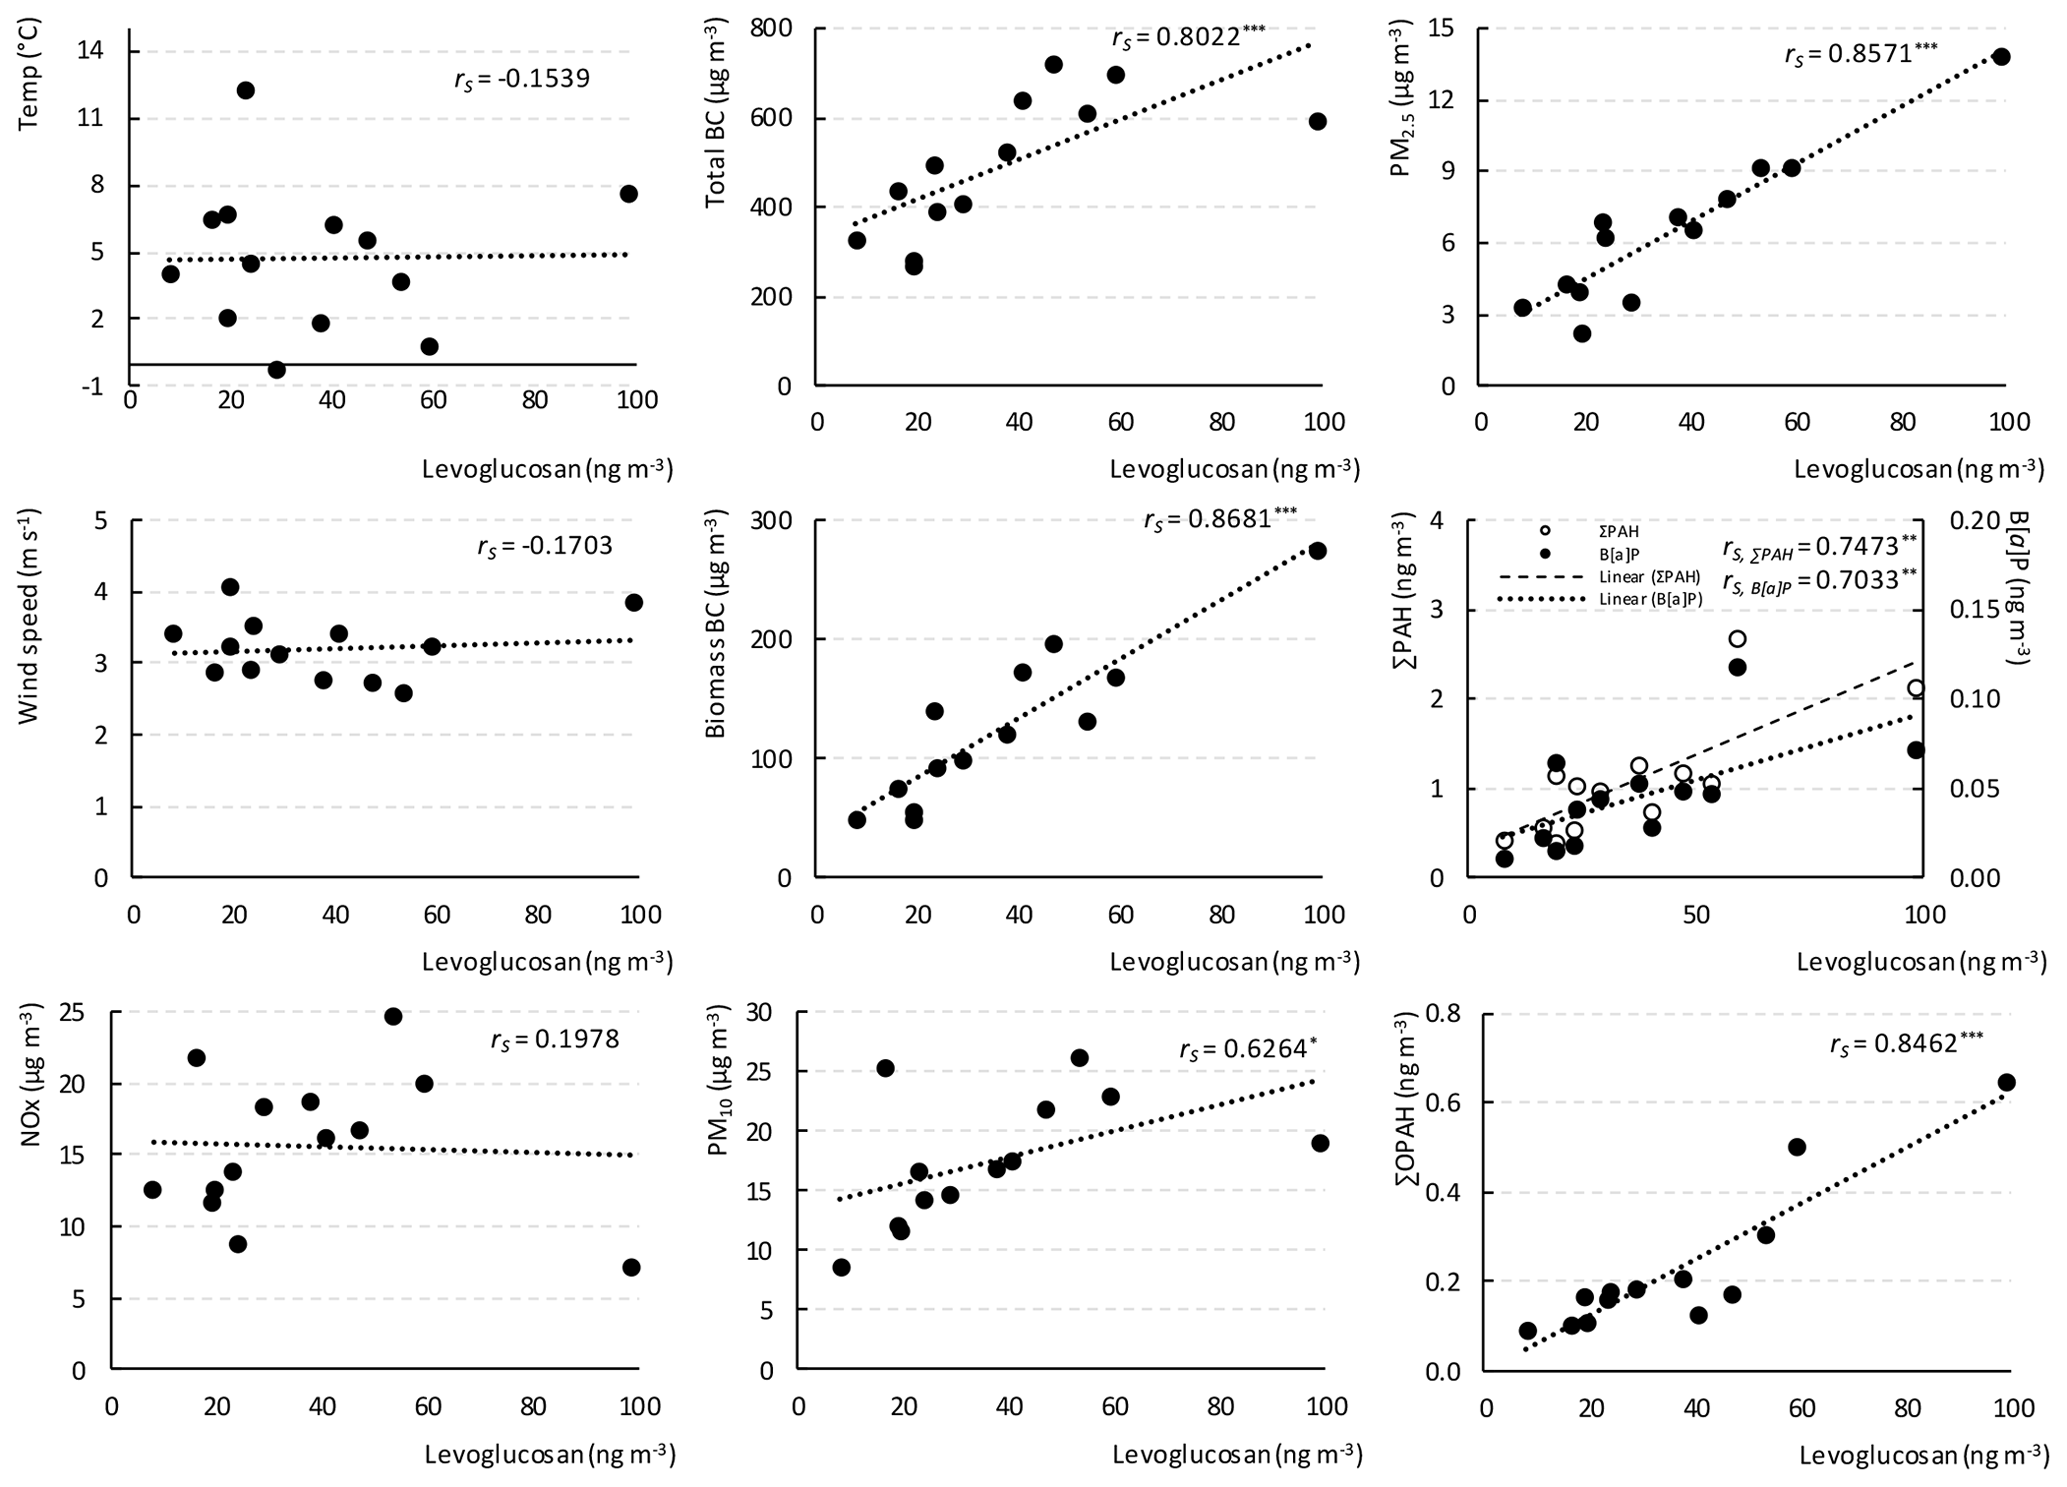
Figure 10Scatterplot and Spearman correlation coefficient (rS) of measured meteorological and air quality parameters against levoglucosan level at the urban background (TK). *Statistically significant with p<0.05, Statistically significant with p<0.01, Statistically significant with p<0.001.
4.1 Levoglucosan: strong relationship with black carbon, PM2.5 and oxy-PAHs
At the urban background site (TK), the highest correlation (rs) of levoglucosan values was found with biomass BC (0.87), PM2.5 (0.86), Σ OPAH (0.85) and total BC (0.80) followed by other parameters, Σ PAH (0.75), B[a]P (0.70) and PM10 (0.63), as shown in Fig. 10. The strong relationship between levoglucosan and PM2.5 was also reported for another northern European city, Oslo (residential, urban background and street area) but not for other European areas such as the Netherlands, Germany and Spain (Jedynska et al., 2015). The strong correlation with black carbon suggests biomass burning under high temperatures as shown previously (Saleh et al., 2014; Martinsson et al., 2015). The levoglucosan emission levels are much more strongly correlated with Σ OPAH than with Σ PAH and B[a]P which implies the origin of OPAHs in the urban background is mainly biomass burning and wood combustion, while Σ PAH and B[a]P originate from other emission sources such as fossil fuel combustion.
4.2 Estimation of source contribution to B[a]P
4.2.1 Dispersion model
According to the emission inventory for Stockholm County (approx. 2 million habitants), the annual emission of B[a]P from local residential wood burning is 186 kg. That can be translated into approximately 0.08 g B[a]P per inhabitant. In Helsinki, with 1.1 million inhabitants, 196 kg B[a]P emission was estimated from wood sources in 2014 (Hellén et al., 2017). That is approximately 0.18 g B[a]P per inhabitant. In Finland, sauna stoves account for a large amount of the total emission source and sauna stoves are generally high emitters. Wood sources contribute to approximately 98 % of the total local emission of B[a]P in the inventory for Stockholm County. The remaining 2 % is expected to be from local traffic sources. The calculated annual B[a]P from traffic exhaust in Stockholm County was 4.5 kg based on the year 2015. A very similar result was estimated for Helsinki traffic in 2014. B[a]P from traffic in Stockholm County is approximately 2 % of the total estimated local B[a]P emissions (traffic and wood).
Table 2Calculated percentage contribution from local and non-local sources to B[a]P.
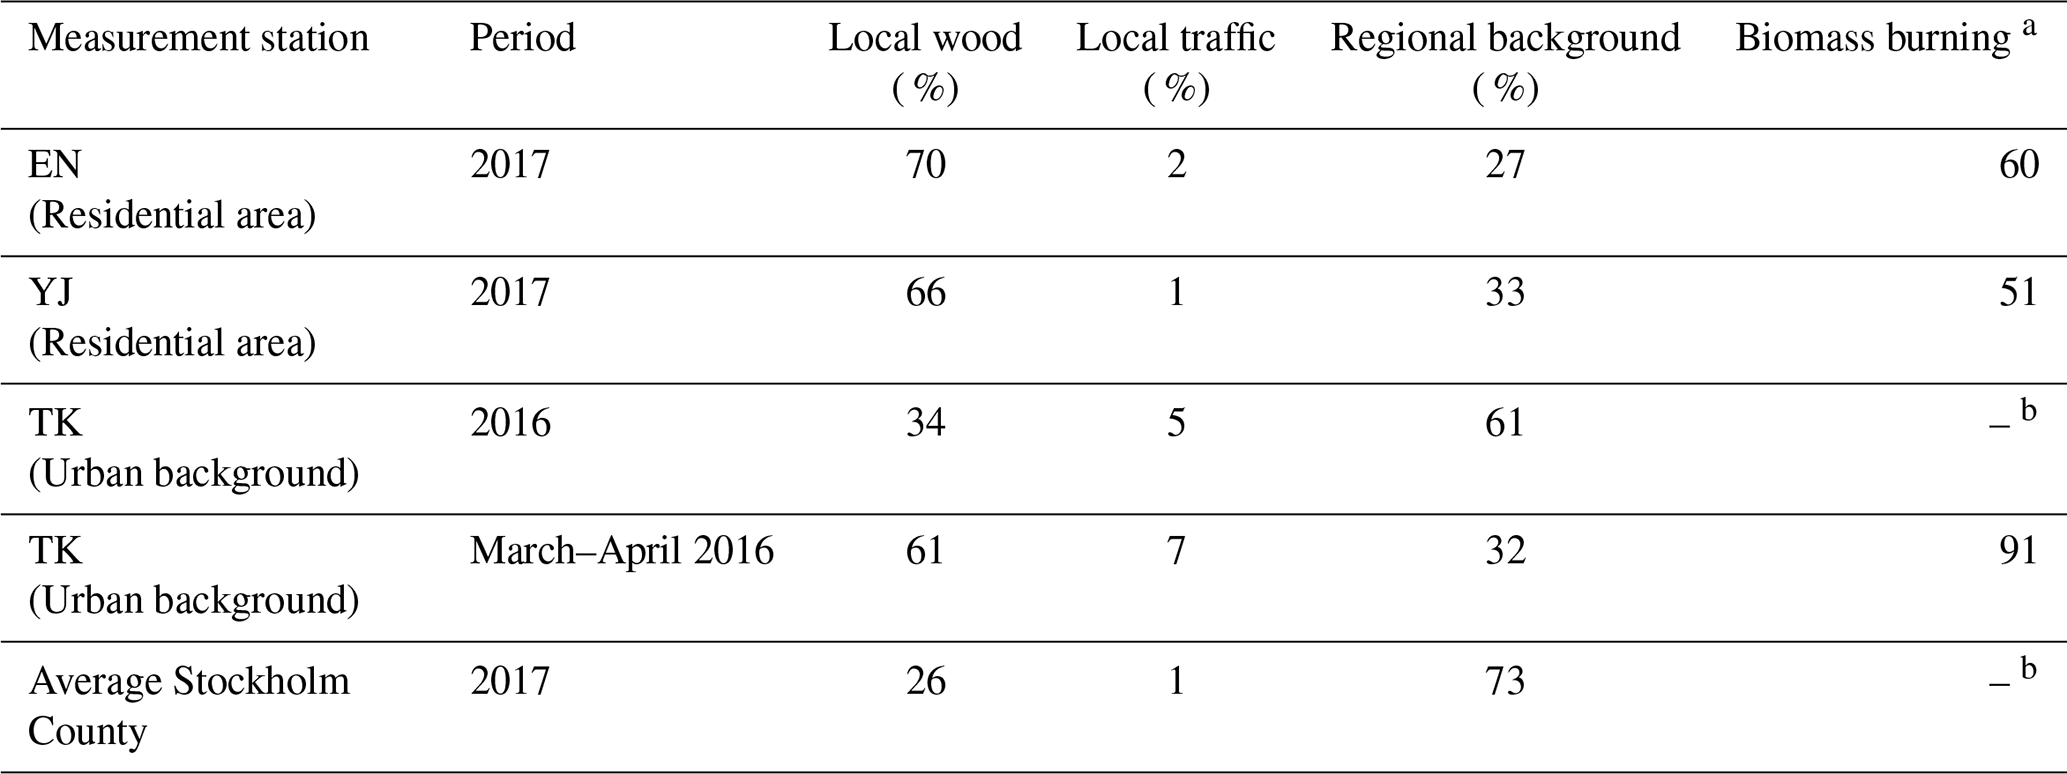
a Biomass burning contribution to B[a]P estimated from levoglucosan (B[a]P levoglucosan, r2=0.54, Belis et al., 2011). b Data not available since the levoglucosan measurement was not done throughout the year in 2016.
The estimated source contributions to B[a]P from local wood, local traffic and regional background are shown in Table 2. According to the modelled results, local residential wood sources account for 60 %–70 % of the total B[a]P in residential areas (EN) and (YJ). In urban background (TK), traffic sources are relatively more important; of B[a]P with local origin is estimated to be from residential heating and from traffic sources. At all sites, regional background is a significant source. In urban background, it is expected to account for around 60 %. On average, local emissions contribute more than of the average B[a]P concentration in entire Stockholm County, showing wood sources as the dominating contributor.
The estimated B[a]P from biomass burning, using levoglucosan as a marker, accounts for 33 %–156 % and 11 %–221 % of the total B[a]P at the urban background (TK) and residential areas (DE, EN and YJ), respectively (Fig. S2). As seen in Table 2, the model indicates that the sources of biomass burning in the residential areas (EN and YJ) and urban background (TK) are different. The former is mainly from the local wood burning while the latter comes from the combination of local and regional background.
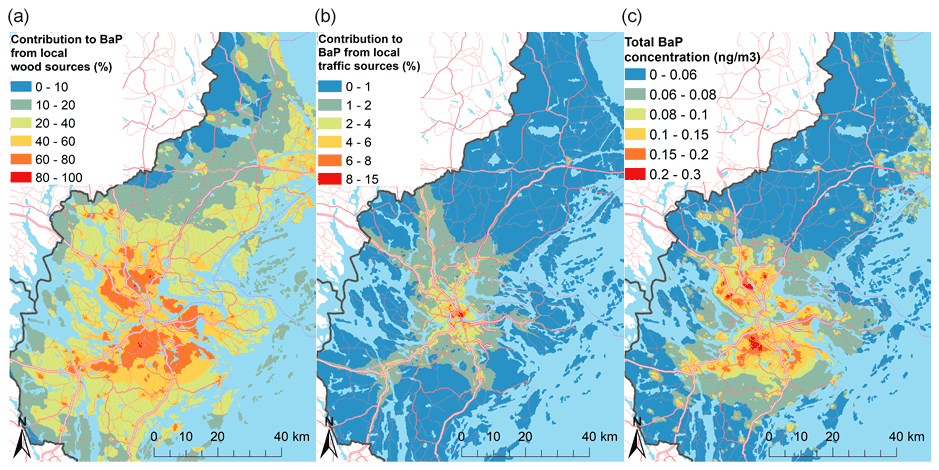
Figure 11Modelled contribution to B[a]P from (a) local residential wood burning and (b) traffic in Stockholm County for a normal meteorological year and (c) modelled total B[a]P concentration in Stockholm County for a normal meteorological year with regional background data from 2014–2018. Red lines show road net and dark grey lines show the border of the County.
4.3 Modelled concentration fields of B[a]P from local sources and total B[a]P concentrations in Stockholm County
All results shown below in Fig. 11 are based on climatology and represent a normal meteorological year. However, the total concentration is based on the 5-year average from measurements during 2014–2018 in Råö. Local wood burning contributes to approximately 98 % of the total local sources from residential wood burning and traffic inventory data. It can be seen in Fig. 11a and b that the traffic sources mainly affect the B[a]P concentrations in the central parts of Stockholm whilst the emissions from local wood sources result in higher concentrations of B[a]P in the rather central suburban regions of Stockholm County.
4.4 B[a]P equivalency concentration
The annual mean B[a]Peq concentration from all three locations was 1.03 ng m−3 with a large summer–to–winter variation (0.09–2.15 ng m−3). As shown in Table S6, the low-trafficked residential area (DE) exhibited the most dramatic variation in B[a]Peq levels throughout the year, ranging from 0.06 to 3.56 ng m−3, followed by the two urban areas (EN: 0.08–2.82 ng m−3, YJ 0.07–2.76 ng m−3). The levels were comparable to those reported from the residential area in Dettenhausen (Germany), 2.7 and 3.4 ng m−3 during the winters of 2005/2006 and 2009, respectively (Bari et al., 2011). At an urban background site in Thessaloniki (Greece), slightly lower values were observed during the cold season, 2.0 and 1.4 ng m−3 (Sarigiannis et al., 2015; Manoli et al., 2016). The Greek studies used smaller RPF values, initially proposed by Nisbet and LaGoy as toxic equivalency factors (TEFs) (Nisbet and LaGoy, 1992), than those used in this study, resulting in slightly underestimated B[a]Peq. Later studies using updated TEFs (Muller, 1997; Boström et al., 2002) showed higher concentrations than those from the present study. As an example, 4.0 ng m−3 was measured at the urban site in Oporto (Portugal) during the winter (Slezakova et al., 2013). Another study from six sampling stations in northwest Italy reported an annual mean B[a]Peq of 2.7 ng m−3 (Khan et al., 2018), probably underestimated due to the use of smaller factors. The B[a]Peq at the urban background (TK) in the present study was 0.43 ng m−3 (0.15–1.06 ng m−3), similar to the spring average B[a]Peq (0.52 ng m−3) obtained from the other three locations. It is also noted that the B[a]P concentration constituted approximately 10 % of the summed B[a]Peq, 10.3 % and 11.2 % in the urban background and residential areas, respectively. In addition, the PAH profiles are compared after TEF adjustment from three locations as discussed in Sect. S3 in the Supplement. Those PAHs with higher TEF values, e.g. B[c]f, B[j]A, DB[a,h]A, and DB[a,l]P, become predominant after the conversion despite their lower abundances as shown in Fig. S3.
Table 3PAH profiles assumed for the various sources and used RPF.

See Table S1 for compound abbreviations.
Table 4Estimated lung-related cancer cases in Stockholm County.
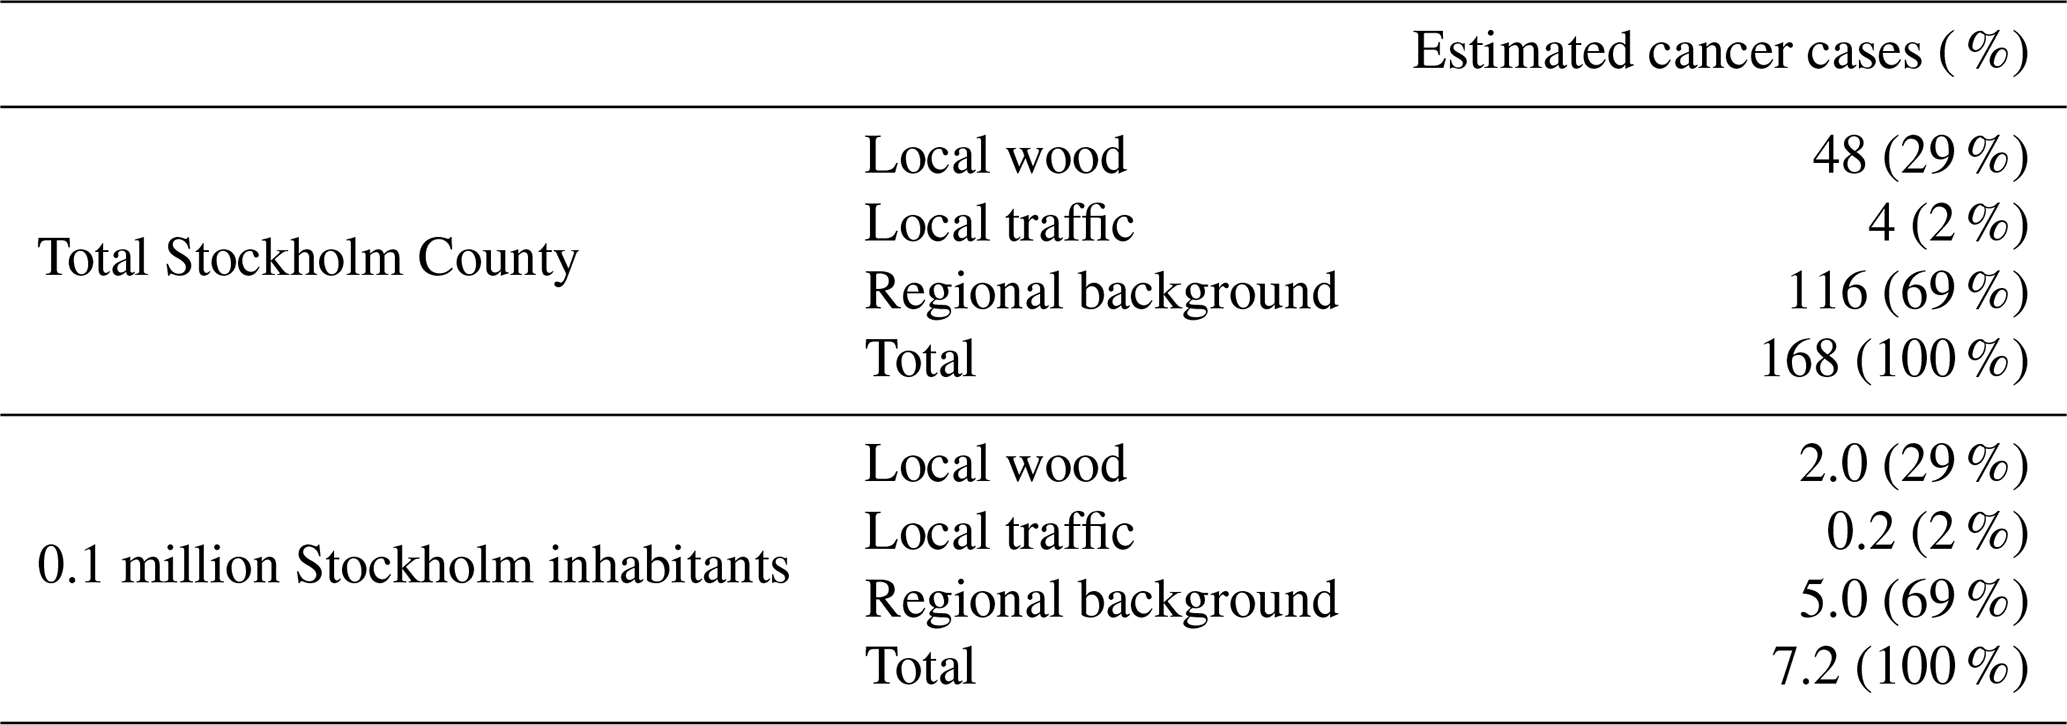
4.5 Population exposure and calculated cancer cases
Cancer risk assessments have been evaluated for the measured concentrations of PAHs within this work. We used a previous method published in 2017 (Dreij et al., 2017). The method is based on in vitro data in which potency factors of several PAHs are assessed. The resulting cancer risk is significantly higher than that from the established method using separate in vivo risk factors. In short, we have used 100×100 m gridded population residential data for Stockholm County together with the calculated concentrations of B[a]P from local wood burning sources and local traffic sources based on normal meteorology, e.g. climatology. The regional background is assumed to be equal throughout the area and is a five-year average (2014–2018) from the regional background station in Råö. The result is population weighted concentrations of B[a]P. The cancer risk is finally assessed using the weighted B[a]P concentration together with 12 PAH profiles for each source, i.e. traffic, wood and the regional background. The assumed relative abundances are shown in Table 3 together with the RPF values. The mixture potency factors (MPFs) used are 487 and 1094 which were derived from analyses of filter samples in Stockholm, in a car tunnel and at a suburban area (Dreij et al., 2017). The result from population exposure risk estimations is shown in Table 4. On an average, 168 cancer cases or 7.2 cases per 1 million inhabitants are estimated to be caused yearly by exposure to PAHs in Stockholm County. According to the National Board of Health and Welfare (Socialstyrelsen) in Sweden, there were 3432 lung-related cancer cases during 2014–2017. This means that approx. 20 % of all lung cancer cases in Stockholm County could be caused by airborne PAHs when applying MPFs although a percentage of 6.4 has been reported previously (Dreij et al., 2017). However, it should be noted that using traditional individual potency factors result in far less cancer cases (<1) per year.
In this study, the measurement of PAHs and sugars in air PM10 was done from one urban background and three residential areas in Sweden to understand the influence of wood burning on PAHs. A clear seasonal variation of PAHs was observed especially during the colder season due to the increased residential heating and meteorology. The seasonal shift in the distribution of low and high molecular weight PAH between gas and particle phase was present. In addition, the increased sugar level reassured the increased wood burning during the colder season. The sugar ratio, levoglucosan(mannosan+galactosan), is a useful marker for identifying the wood burning source in the three residential areas. The estimated burning source was consistent with the observations in each area such as the preferences of the residents for wood type, garden waste burning, domestic wood burning, etc. Periods with intense wood burning were denoted by elevated sugar ratios.
The measurement during the Walpurgis Night showed high sugar emissions due to the increased wood burning. The event resulted in elevated levoglucosan, B[a]P and OPAH concentrations. Interestingly, OPAH levels increased as much as for levoglucosan while the B[a]P level increased to a lesser extent. This suggests that the level of total OPAHs as combined with levoglucosan could be a good indicator for wood burning. Both B[a]P and levoglucosan levels highly correlated with PM2.5 concentrations, although levoglucosan is strongly correlated with black carbon and OPAHs. Since this study measured OPAHs in air PM10 in the urban background, the levoglucosan-OPAH relationship could be further investigated in relation to the measurement at residential areas.
Either the levoglucosan tracer method or the model did not fully explain the measured B[a]P concentrations especially for the cold season, showing underestimated B[a]P levels in the levoglucosan tracer method whilst the modelled data based on the emission inventory consistently overestimated B[a]P. The model indicates that the local wood sources contribute to 98 % of all B[a]P emissions within Stockholm County and the local traffic to the remaining 2 %. At the residential area measurement sites in Stockholm, approximately 30 % of the B[a]P is non-local according to calculations from an emission inventory within this present work. From local emissions, wood sources contribute to 60 %–70 %, which leaves up to 2 % from traffic sources. In the urban background area, traffic sources are calculated to contribute of the B[a]P concentration from local sources and wood the remaining of the B[a]P. In urban background, non-local sources are dominating as the source of B[a]P, contributing to around 60 %.
The B[a]P equivalency concentration shows a high winter-to-summer ratio, posing an underestimated risk on a yearly basis. The lung cancer related risk assessment estimates 13.4 cancer cases per 0.1 million inhabitants in Stockholm County caused by airborne particulate PAHs, accounting for almost 40 % of the total lung cancer prevalence in the region when assuming that the modelled concentrations of B[a]P is valid. Since modelled data are shown to be higher than measured values, we can conclude that there is a significant uncertainty in the prediction in cancer cases, thus highlighting the importance of air quality measurements.
The emission inventory of residential wood combustion includes approximately 0.11 million objects based on chimney sweeper documentations in seven municipalities in Stockholm County obtained from the Greater Stockholm fire brigade. In the other parts of the county, standardised sources have been placed among residential area based on housing data from Statistics Sweden (Statistiska centralbyrån, or SCB) with the assumption that the share of stoves, boiler and fireplaces, etc. are equal in the region as in the available sweeper data. Except for wood combustion sources based on chimney sweeper data, there are approximately 0.17 million standardised sources in Stockholm County. There are various parameters included in the estimated amount of B[a]P emission and are described in the sections below.
A1 Combustion system
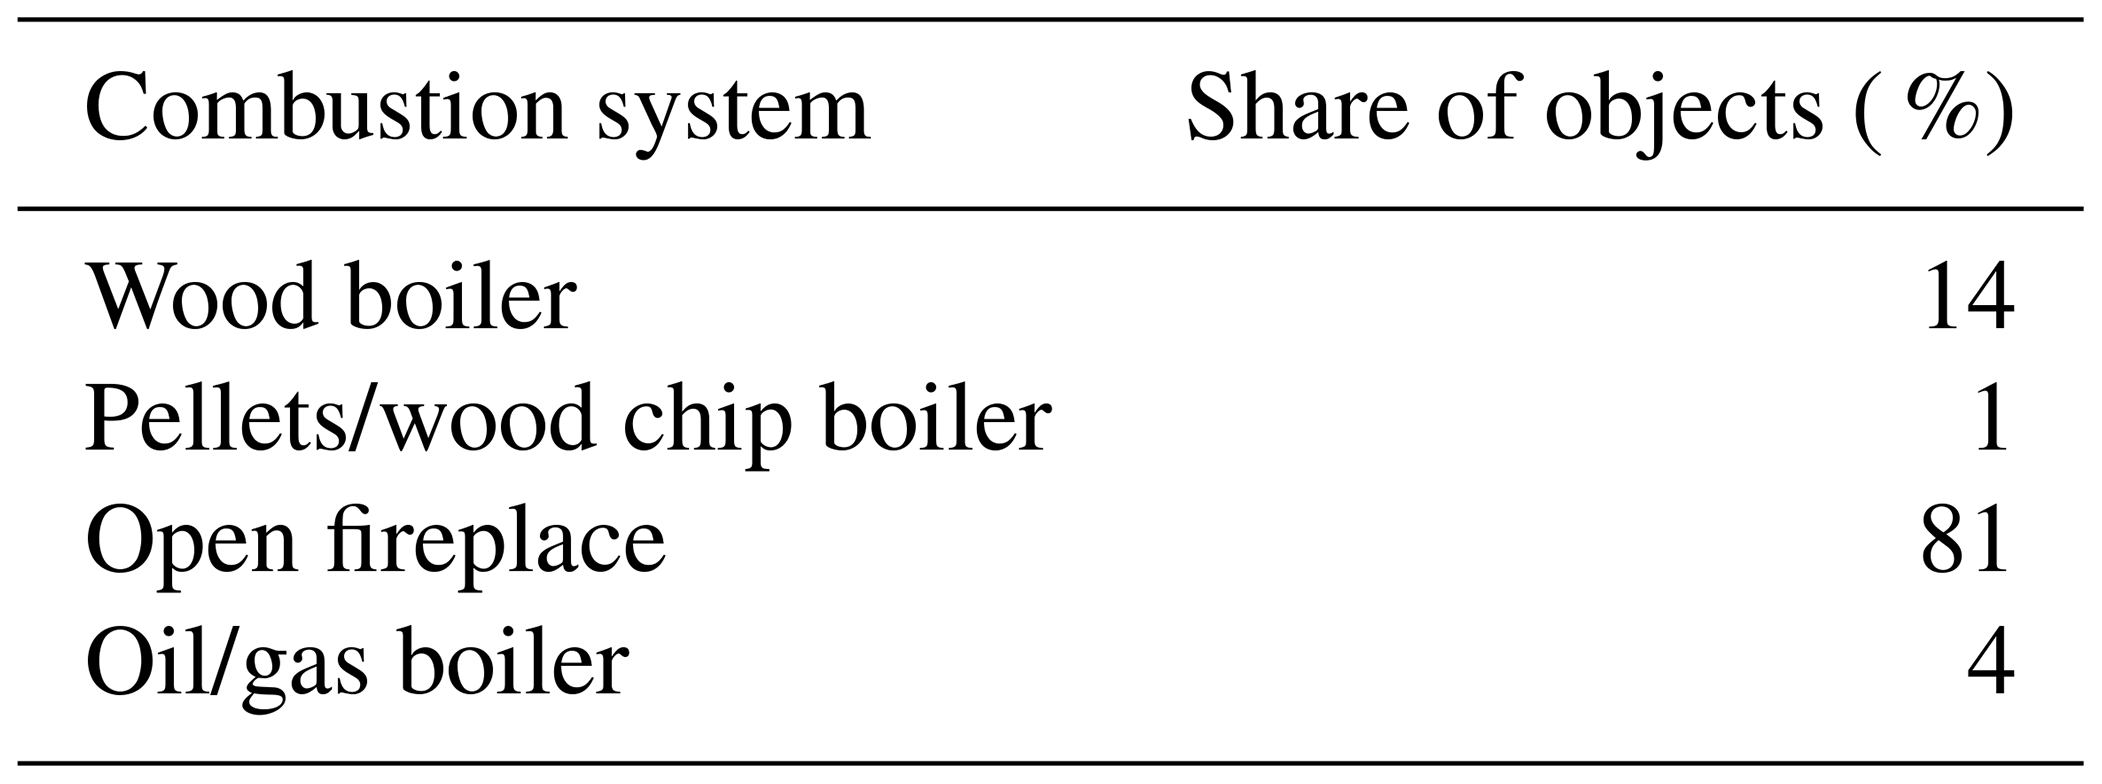
From the chimney sweeper data, there are 110 348 combustion units aggregated into four main categories according to Table A1 below.
A2 Energy consumption
The annual energy consumption has previously been assessed by the Swedish Meteorological and Hydrological Institute (SMHI) with the ENLOSS model. (Taesler and Andersson, 1984; Taesler et al., 2006) The size of housing and the weather affect the required need for heating. A general energy consumption has been assumed based on an average residential housing with 152 m−2 living space in Stockholm County. That assumption is made for a normal meteorological year during the reference period 1960–1990. The needed annual energy need is estimated to be 13 259 kW h house within the whole county.
Table A1Share of each combustion system type from chimney sweeper data in the municipalities of Danderyd, Stockholm, Täby, Värmdö, Vaxholm, Vallentuna and Österåker.
A3 Low emission wood boiler
There are environmentally certified boilers and regular boilers in use. The emission from the types vary vastly and, therefore, it is of importance to estimate how many boilers of each type are used. According to a national inventory, 695 000 local heating systems with 230 000 wood boilers of the low emission type accounted for approximately 30 % of the total from wood boilers (Todorovic et al., 2007). In a more recent survey by SMHI during 2018 in areas outside Stockholm County (Skellefteå, Strömsund, Alingsås), the results were approximately the same, 27 % of the wood boilers were low emission types (Andersson et al., 2018). In the emission inventory for Stockholm, the amount of low emission boilers was assumed to be 30 %.
A4 Efficiency
The efficiency of the type of boilers or fireplace is shown in Table A2 and was previously reported by SMHI (Omstedt et al., 2014; Andersson et al., 2015).
Table A2Efficiency of boilers and fireplaces used in emission inventory (Omstedt et al., 2014; Andersson et al., 2015).
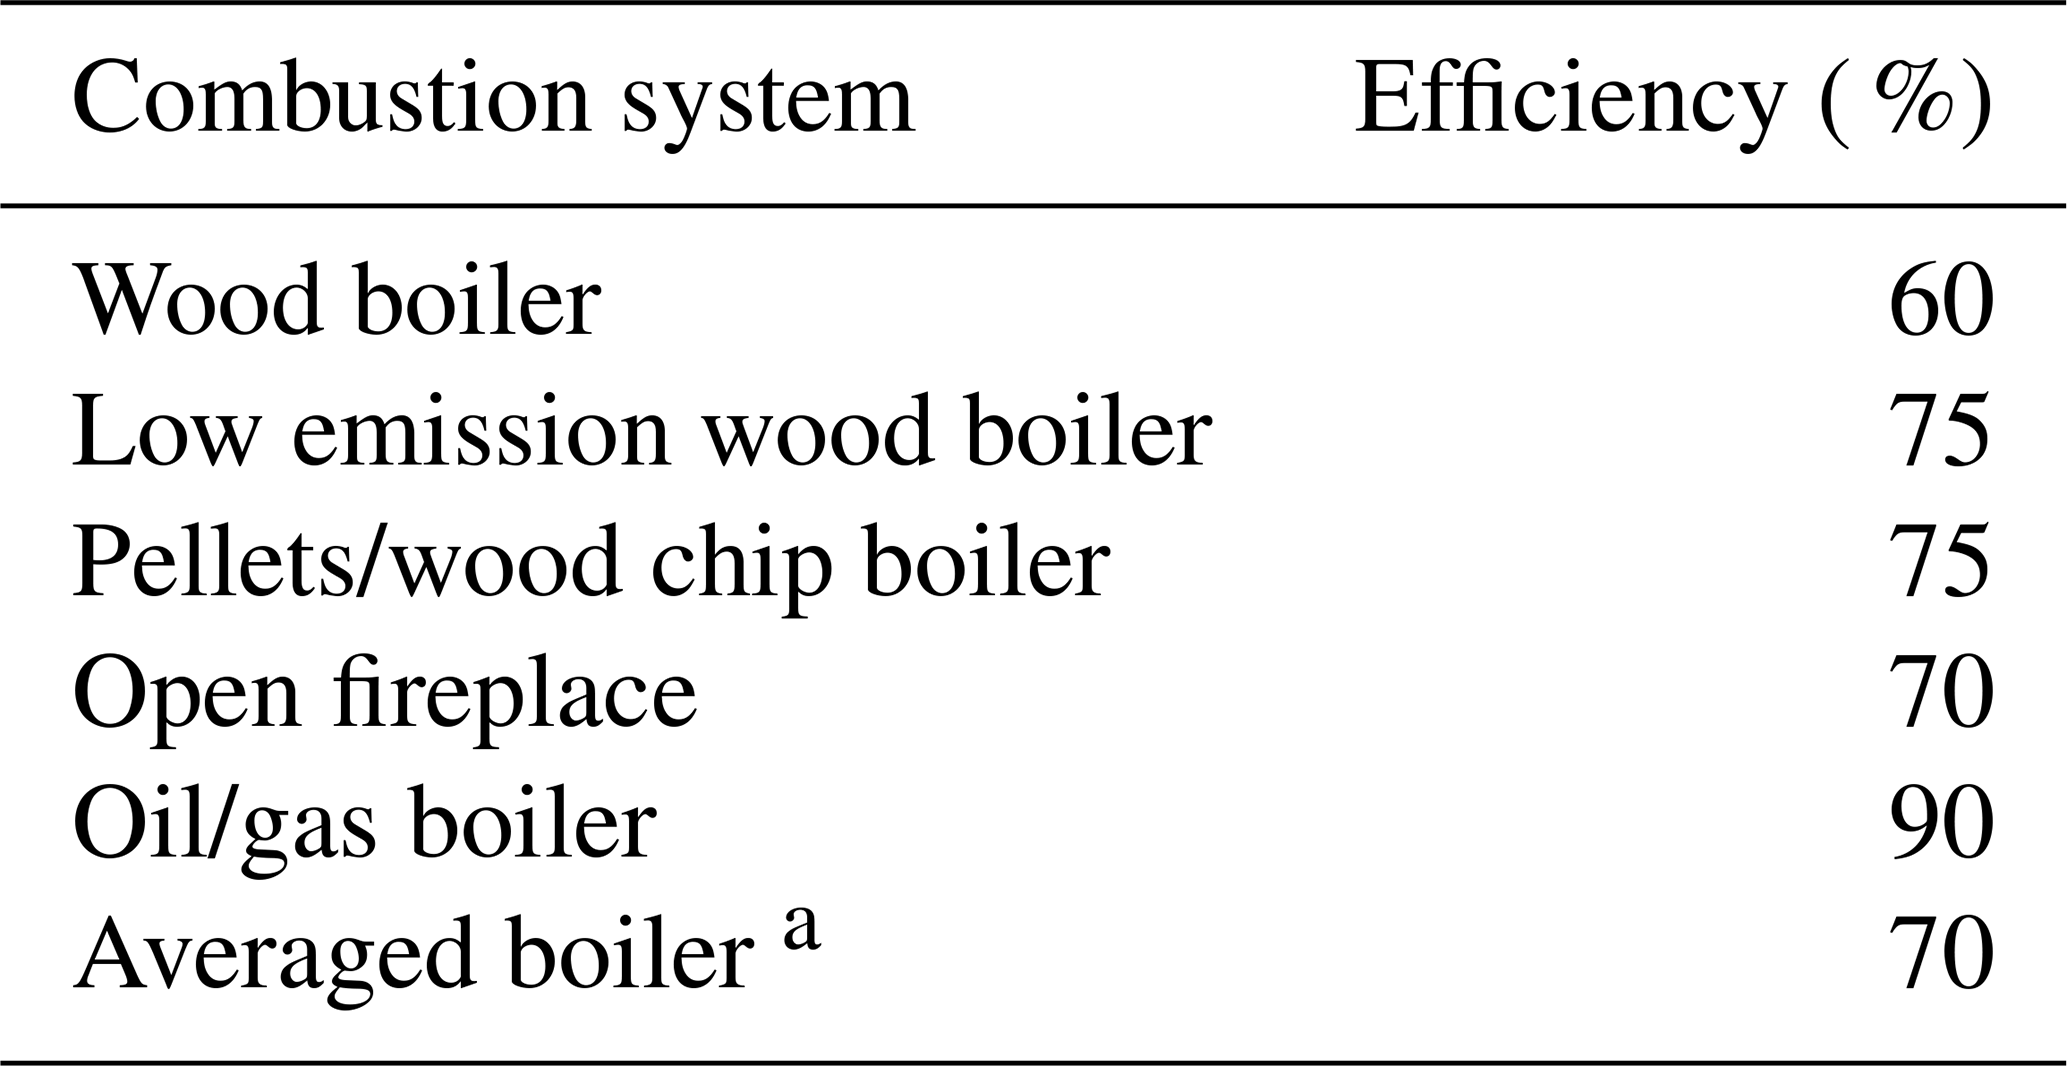
a Used where no chimney sweeper data are available.
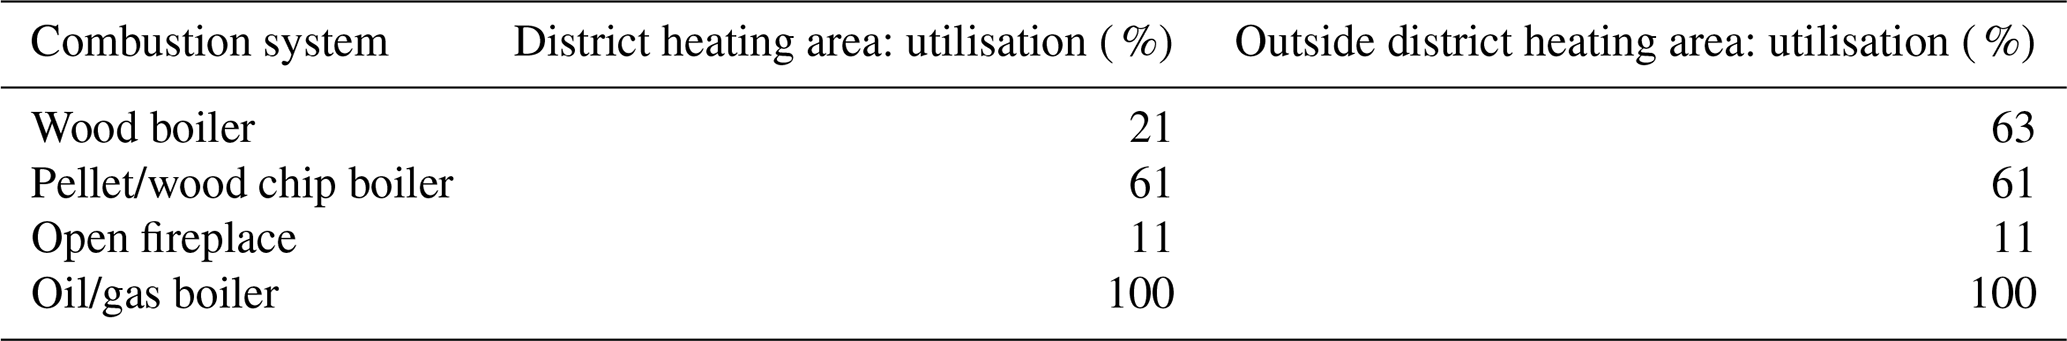
Table A4B[a]P emission factors used in emission inventory in Stockholm County.
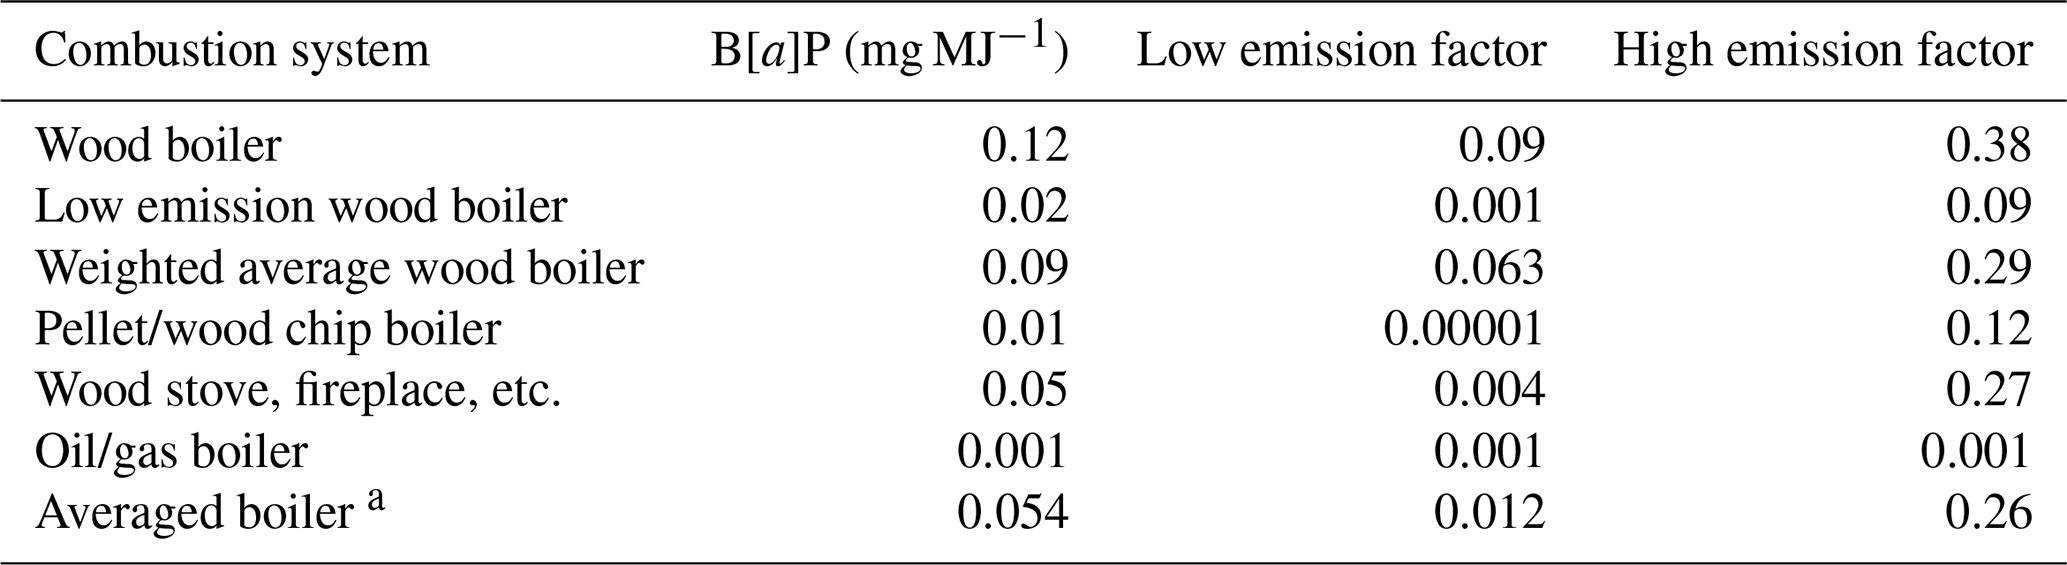
a Used where no chimney sweeper data are available.
A5 Utilisation
The utilisation of the boiler depends both on the boiler type and also whether the building can use the district heating system. The utilisation assumed in the emission inventory for Stockholm is based on two previous firing habit surveys within Sweden from SMHI and can be read in Table A3 (Omstedt et al., 2014; Andersson et al., 2018). Note that only boilers are affected by whether the house is within the district heating system. Open fireplaces are commonly used for leisure firing rather than heating.
A6 Emission factors
All the previously mentioned factors have been used to estimate the emission for each boiler or fireplace in the emission inventory. An average emission factor has been calculated based on the known chimney sweeper data for the areas in municipalities where no chimney sweeper data were available. It is known that the individual habits are important for the amount of emission. The moisture in the wood and the oxygen supply during combustion have a substantial effect on the emissions. However, the used emission factored listed in Table A4 were based on emission data in various previous work and can be considered as a base case (Todorovic et al., 2007; SMED and Naturvårdsverket, 2017; EMEP/EEA, 2013).
An assumption that has been made is that 10 % of the wood boilers have bad combustion, e.g. moist wood or smoldering fire.
A7 Chimney
In the database, each chimney is assumed to have the same properties regarding proportions and gas flow, etc. All point sources properties are listed in bullets below.
-
Height: 5 m
-
Gas temperature: 100 ∘C
-
Gas flow: 1 m s−1
-
Outer/inner diameter of chimney: m
A8 Emission variation
Since the meteorology changes during the year, hourly assumptions were also made about the emission variation. The assumptions depend on the boiler or fireplace and were based on a master's project written in 2000 in which a survey was one to determine heating habits in the Swedish town Vännäs (Johansson et al., 2003).
Table A5Share of total yearly combustion during each month used in emission inventory.
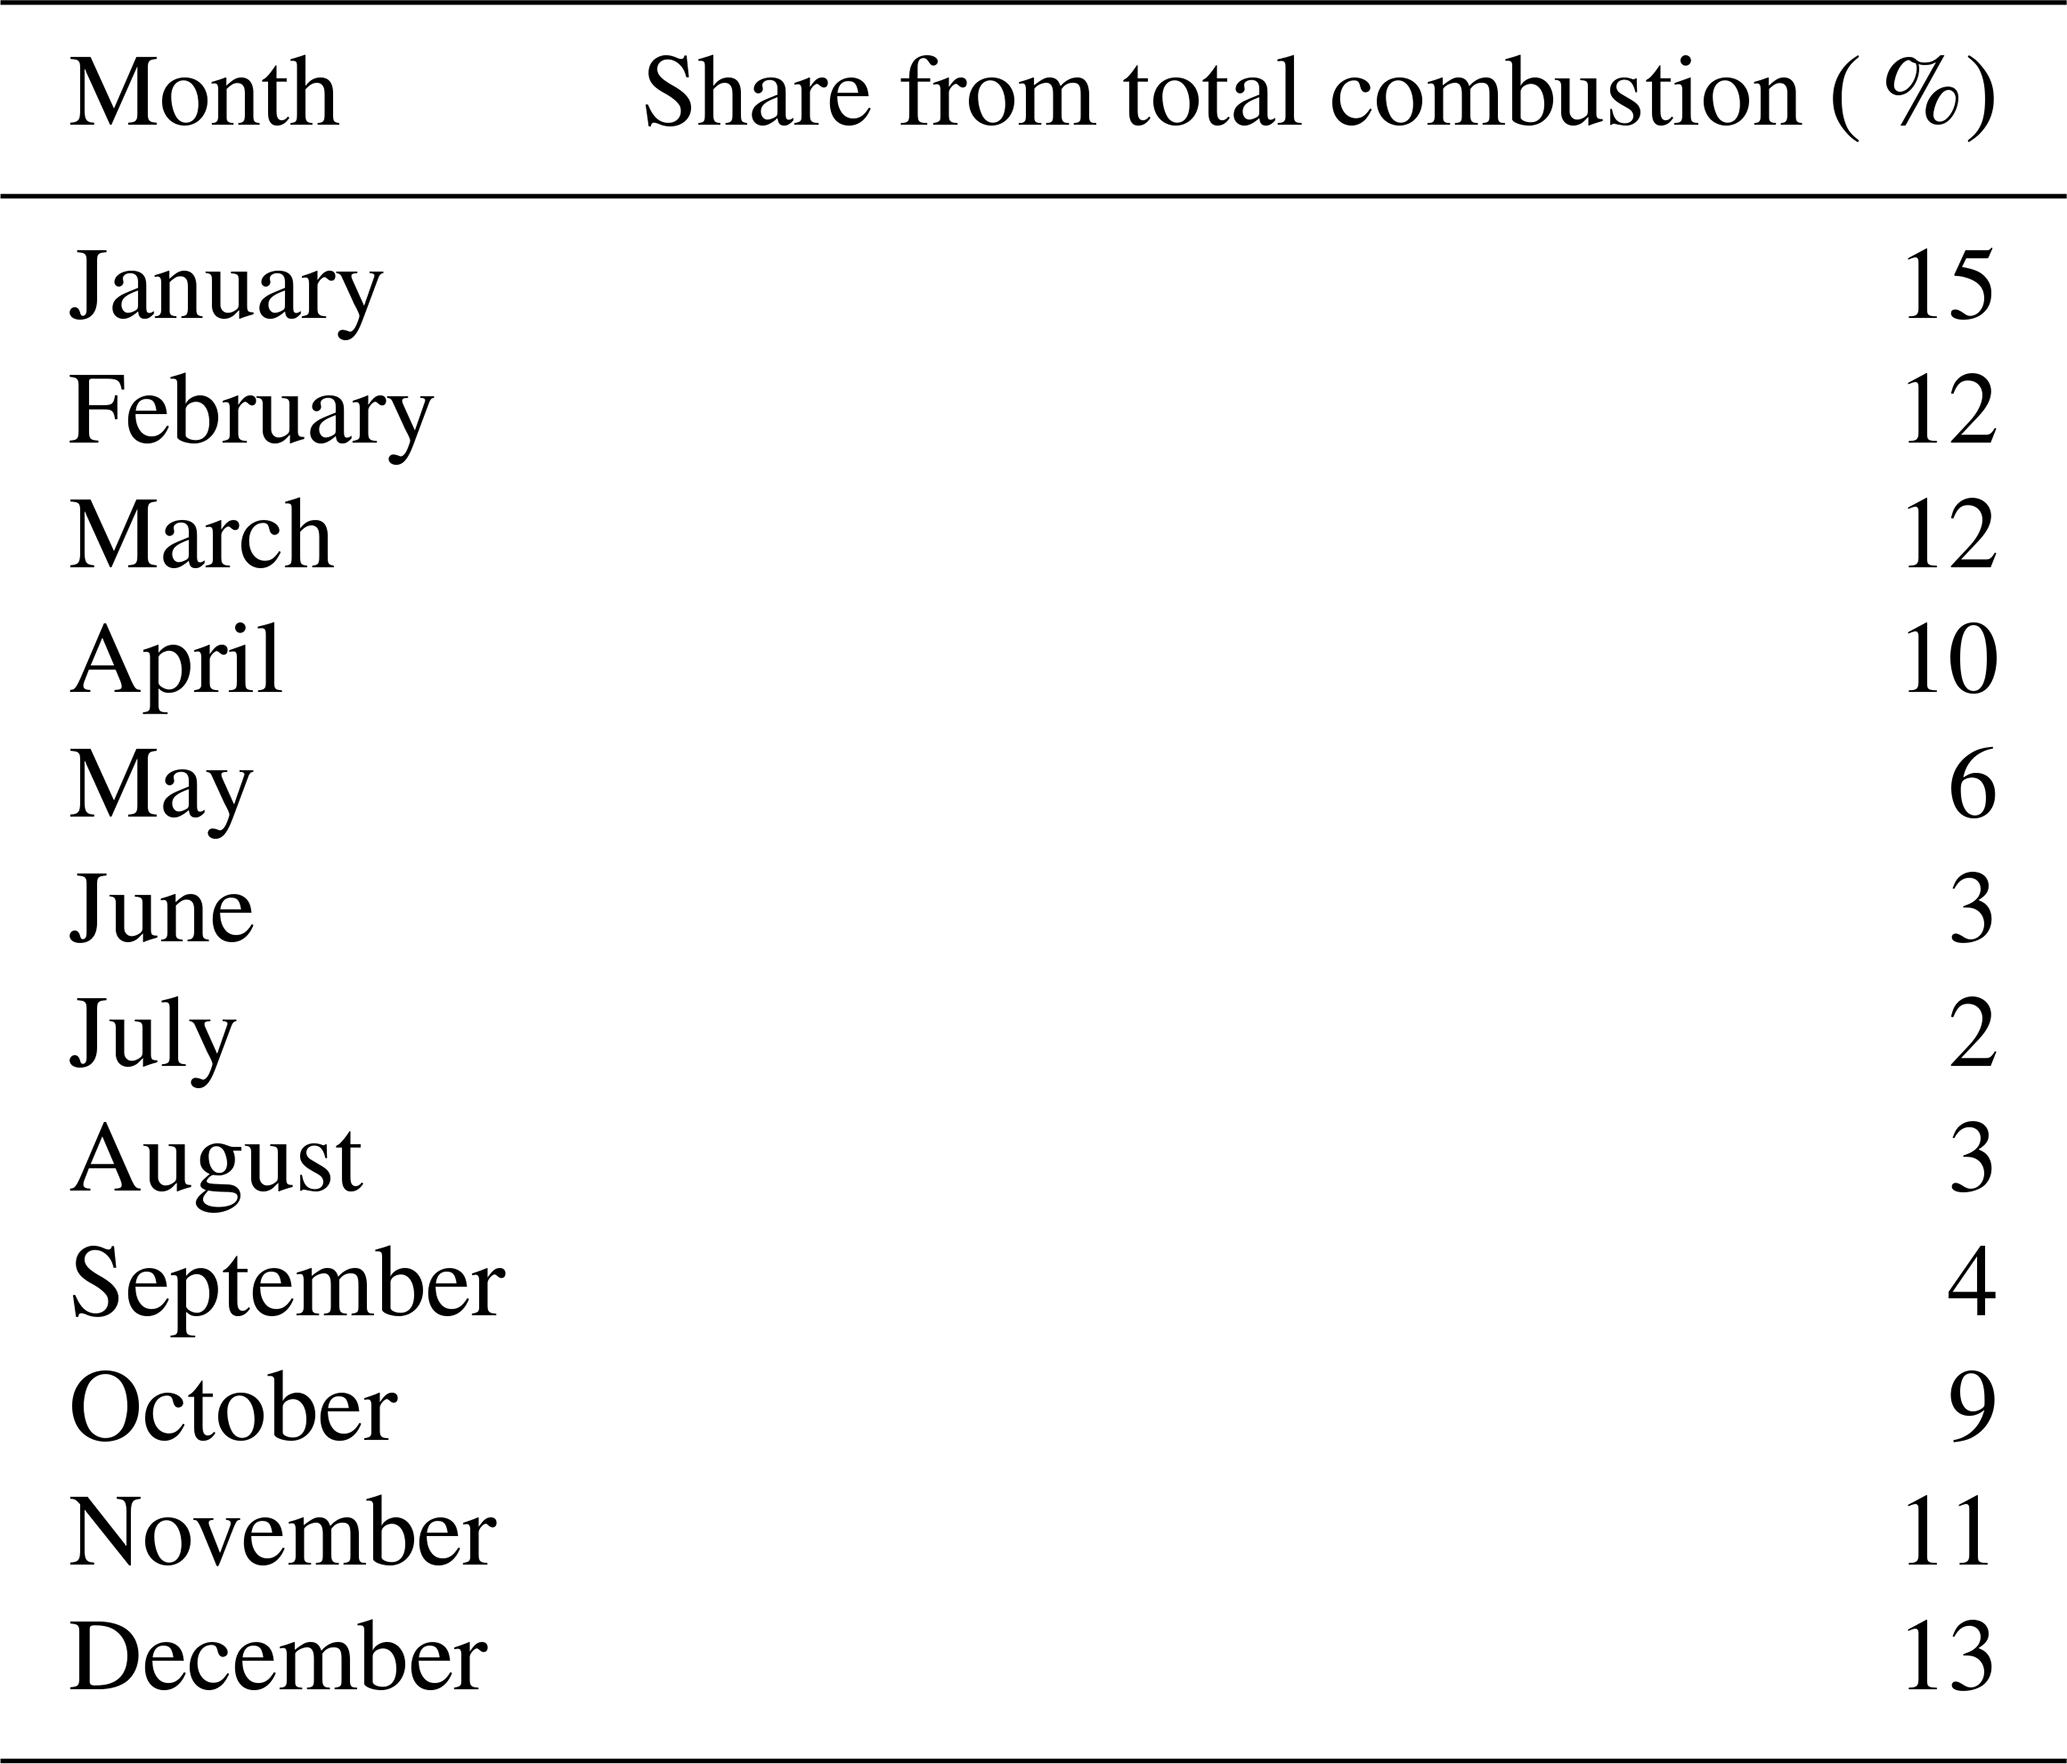
Table A6Share of total daily combustion used in emission inventory for open fireplace, oil/gas boiler and pellet/wood chip boiler.
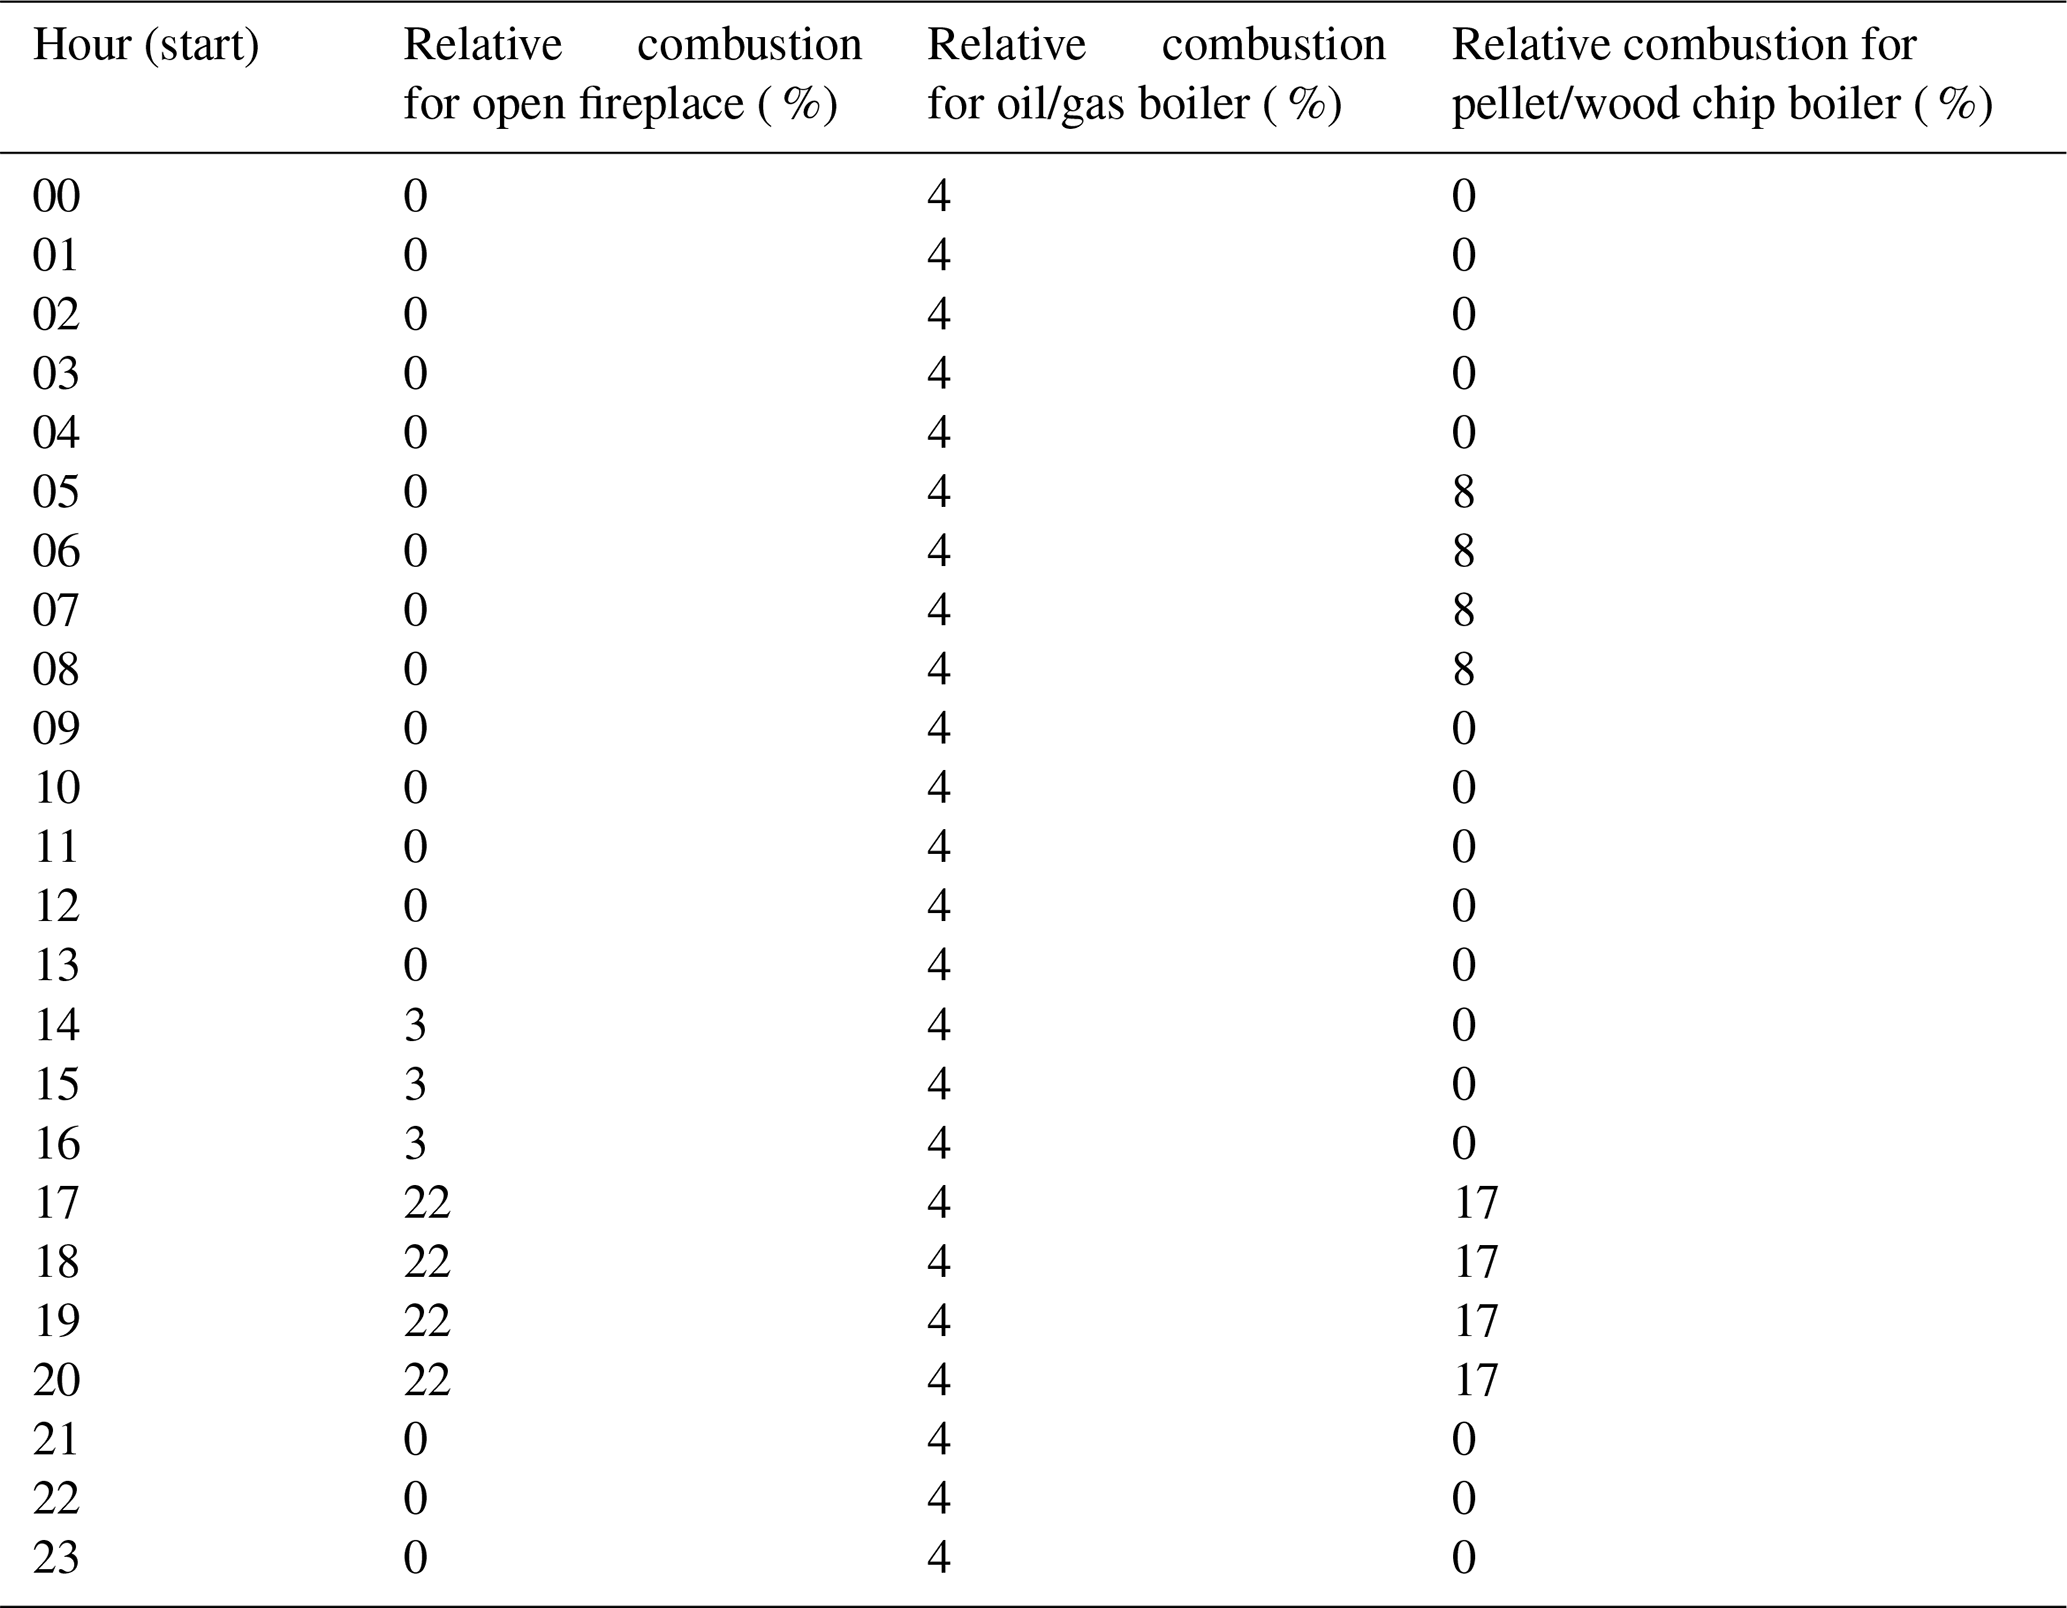
Table A7Share of total daily combustion used in emission inventory for wood boilers separated in weekdays and Saturday and Sunday.

The models used to calculate the concentrations based on the emissions are part of the commercial software Airviro, https://www.airviro.com/airviro (Apertum, 2022).
Meteorological data is available for download, https://www.slb.nu/slbanalys/historiska-data-met (SLB-analys, 2022a). Measured air pollutant data is available for download, https://www.slb.nu/slbanalys/historiska-data-luft (SLB-analys, 2022b). Third party measured air pollutant data (station ASP, Aspvreten) is available for download, https://datavardluft.smhi.se/portal/concentrations-in-air, last access: 15 August 2022.
The supplement related to this article is available online at: https://doi.org/10.5194/acp-22-11359-2022-supplement.
SaS handled and collected samples, created emission data and performed dispersion modelling; HL, SiS and FMR performed PAH, OPAH and sugar analysis; and HL prepared the article with contributions from all co-authors.
The contact author has declared that none of the authors has any competing interests.
Publisher’s note: Copernicus Publications remains neutral with regard to jurisdictional claims in published maps and institutional affiliations.
The authors are grateful for the help with filter sampling and storage by staff at SLB-analys (Environment and Health Administration, Stockholm). We also acknowledge the Atmospheric Science unit from the Department of Environmental Science (Stockholm University, Stockholm) for the support during this project.
This research has been funded by the
Stockholms Läns Landsting (grant no. TRN 2016-0098) and SLB-analys from the Environment and Health Administration.
The article processing charges for this open-access publication were covered by Stockholm University.
This paper was edited by Joshua Fu and reviewed by three anonymous referees.
Ahmed, T. M., Bergvall, C., Åberg, M., and Westerholm, R.: Determination of oxygenated and native polycyclic aromatic hydrocarbons in urban dust and diesel particulate matter standard reference materials using pressurized liquid extraction and LC–GC/MS, Anal. Bioanal. Chem., 407, 427–438, https://doi.org/10.1007/s00216-014-8304-8, 2015.
Alves, C. A., Vicente, A. M., Custódio, D., Cerqueira, M., Nunes, T., Pio, C., Lucarelli, F., Calzolai, G., Nava, S., Diapouli, E., Eleftheriadis, K., Querol, X., and Bandowe, B. A. M.: Polycyclic aromatic hydrocarbons and their derivatives (nitro-PAHs, oxygenated PAHs, and azaarenes) in PM2.5 from Southern European cities, Sci. Total Environ., 595, 494–504, https://doi.org/10.1016/j.scitotenv.2017.03.256, 2017.
Andersson, S., Arvelius, J., Verbova, M., Omstedt, G., and Torstensson, M.: Identifiering av potentiella riskområden för höga halter av benso(a)pyren, Nationell kartering av emissioner och halter av B(a)P från vedeldning i småhusområden, SMHI report 159, http://urn.kb.se/resolve?urn=urn%3Anbn%3Ase%3Asmhi%3Adiva-2815 or http://smhi.diva-portal.org/smash/get/diva2:948111/FULLTEXT01.pdf, (last access: 15 August 2022), 2015.
Andersson, S., Arvelius, J., Jones, J., Kindell, S., and Leung, W.: Beräkningar av emissioner och halter av benso(a)pyren och partiklar från småskalig vedeldning. Luftkvalitetsmodellering för Skellefteå, Strömsunds och Alingsås kommuner, SMHI report 29, http://urn.kb.se/resolve?urn=urn%3Anbn%3Ase%3Asmhi%3Adiva-5169, or http://smhi.diva-portal.org/smash/get/diva2:1290201/FULLTEXT02.pdf (last access: 15 August 2022), 2018.
Apertum: Airviro user's reference, Working with the Dispersion Module, How to simulate the dispersion of pollutants, Airviro version 4.0, Linköping, Sweden, https://www.airviro.com/airviro/extras/pdffiles/UserRef_Volume2_Dispersion_v4.00.pdf, last access: 1 February 2021.
Apertum: Airviro, airviro [code], https://www.airviro.com/airviro, last access: 26 July 2022.
Bari, M. A., Baumbach, G., Kuch, B., and Scheffknecht, G.: Air pollution in residential areas from wood-fired heating, Aerosol Air Qual. Res., 11, 749–757, https://doi.org/10.4209/aaqr.2010.09.0079, 2011.
Beekmann, M., Prévôt, A. S. H., Drewnick, F., Sciare, J., Pandis, S. N., Denier van der Gon, H. A. C., Crippa, M., Freutel, F., Poulain, L., Ghersi, V., Rodriguez, E., Beirle, S., Zotter, P., von der Weiden-Reinmüller, S.-L., Bressi, M., Fountoukis, C., Petetin, H., Szidat, S., Schneider, J., Rosso, A., El Haddad, I., Megaritis, A., Zhang, Q. J., Michoud, V., Slowik, J. G., Moukhtar, S., Kolmonen, P., Stohl, A., Eckhardt, S., Borbon, A., Gros, V., Marchand, N., Jaffrezo, J. L., Schwarzenboeck, A., Colomb, A., Wiedensohler, A., Borrmann, S., Lawrence, M., Baklanov, A., and Baltensperger, U.: In situ, satellite measurement and model evidence on the dominant regional contribution to fine particulate matter levels in the Paris megacity, Atmos. Chem. Phys., 15, 9577–9591, https://doi.org/10.5194/acp-15-9577-2015, 2015.
Belis, C. A., Cancelinha, J., Duane, M., Forcina, V., Pedroni, V., Passarella, R., Tanet, G., Douglas, K., Piazzalunga, A., Bolzacchini, E., Sangiorgi, G., Perrone, M.-G., Ferrero, L., Fermo, P., and Larsen, B. R.: Sources for PM air pollution in the Po Plain, Italy: I. Critical comparison of methods for estimating biomass burning contributions to benzo(a)pyrene, Atmos. Environ., 45, 7266–7275, https://doi.org/10.1016/j.atmosenv.2011.08.061, 2011.
Bi, X., Sheng, G., Peng, P., Chen, Y., Zhang, Z., and Fu, J.: Distribution of particulate- and vapor-phase n-alkanes and polycyclic aromatic hydrocarbons in urban atmosphere of Guangzhou, China, Atmos. Environ., 37, 289–298, https://doi.org/10.1016/S1352-2310(02)00832-4, 2003.
Boman, B. C., Forsberg, A. B., and Järvholm, B. G.: Adverse health effects from ambient air pollution in relation to residential wood combustion in modern society, Scand. J. Work Environ. Health, 29, 251–260, https://doi.org/10.5271/sjweh.729, 2003.
Boström, C. E., Gerde, P., Hanberg, A., Jernström, B., Johansson, C., Kyrklund, T., Rannug, A., Törnqvist, M., Victorin, K., and Westerholm, R.: Cancer risk assessment, indicators, and guidelines for polycyclic aromatic hydrocarbons in the ambient air, Environ. Health Persp., 110, 451–488, https://doi.org/10.1289/ehp.110-1241197, 2002.
Caseiro, A., Bauer, H., Schmidl, C., Pio, C. A., and Puxbaum, H.: Wood burning impact on PM10 in three Austrian regions, Atmos. Environ., 43, 2186–2195, https://doi.org/10.1016/j.atmosenv.2009.01.012, 2009.
Cordell, R. L., Mazet, M., Dechoux, C., Hama, S. M. L., Staelens, J., Hofman, J., Stroobants, C., Roekens, E., Kos, G. P. A., Weijers, E. P., Frumau, K. F. A., Panteliadis, P., Delaunay, T., Wyche, K. P., and Monks, P. S.: Evaluation of biomass burning across North West Europe and its impact on air quality, Atmos. Environ., 141, 276–286, https://doi.org/10.1016/j.atmosenv.2016.06.065, 2016.
Danard, M.: A simple model for mesoscale effects of topography on surface winds, Mon. Weather Rev., 99, 831–839, 1977.
Delgado-Saborit, J. M., Alam, M. S., Pollitt, K. J. G., Stark, C., and Harrison, R. M.: Analysis of atmospheric concentrations of quinones and polycyclic aromatic hydrocarbons in vapour and particulate phases, Atmos. Environ., 77, 974–982, https://doi.org/10.1016/j.atmosenv.2013.05.080, 2013.
Dreij, K., Mattsson, Å., Jarvis, I. W. H., Lim, H., Hurkmans, J., Gustafsson, J., Bergvall, C., Westerholm, R., Johansson, C., and Stenius, U.: Cancer risk assessment of airborne PAHs based on in vitro mixture potency factors, Environ. Sci. Technol., 51, 8805–8814, https://doi.org/10.1021/acs.est.7b02963, 2017.
EEA: European Environment Agency Air quality standards, https://www.eea.europa.eu/themes/air/air-quality-standards (last access: 7 November 2018), 2017.
EEA: Air quality in Europe – 2018 report, EEA Report, European Environment Agency, Publications Office of the European Union, Luxembourg, https://www.eea.europa.eu/publications/air-quality-in-europe-2018, (last access: 25 July 2022) 2018a.
EEA: European Union emission inventory report 1990–2016 under the UNECE convention on long-range transboundary air pollution (LRTAP), European Environment Agency, Publications Office of the European Union, Luxembourg, https://www.eea.europa.eu/publications/european-union-emission-inventory-report-1990-2016 (last access: 25 July 2022), 2018b.
EMEP/EEA: EMEP/EEA air pollutant emission inventory guidebook 2013, EEA technical report, No. 12/2013, A.4 Small combustion Appendix D 20+13update of methodologies for Small combustion (1A4), http://www.eea.europa.eu/publications/emep-eea-guidebook-2013, (last access: 15 August 2022), 2013.
EU: Directive 2004/107/EC of the European Parliament and of the Council of 15 December 2004 relating to arsenic, cadmium, mercury, nickel and polycyclic aromatic hydrocarbons in ambient air, Official Journal of the European Union, L23, 26 January 2005, https://eur-lex.europa.eu/LexUriServ/LexUriServ.do?uri=OJ:L:2005:023:0003:0016:EN:PDF (last access: 25 July 2022), 2005.
EU: Directive 2008/50/EC of the European Parliament and of the Council of 21 May 2008 on ambient air quality and cleaner air for Europe, Official Journal of the European Union, L152, 11 June 2008, https://eur-lex.europa.eu/legal-content/EN/TXT/?uri=OJ%3AL%3A2008%3A152%3ATOC, (last access: 25 July 2022), 2008.
Fabbri, D., Torri, C., Simo.neit, B. R. T., Marynowski, L., Rushdi, A. I., and Fabiańska, M. J.: Levoglucosan and other cellulose and lignin markers in emissions from burning of Miocene lignites, Atmos. Environ., 43, 2286–2295, https://doi.org/10.1016/j.atmosenv.2009.01.030, 2009.
Favez, O., Cachier, H., Sciare, J., Sarda-Estève, R., and Martinon, L.: Evidence for a significant contribution of wood burning aerosols to PM2.5 during the winter season in Paris, France, Atmos. Environ., 43, 3640–3644, https://doi.org/10.1016/j.atmosenv.2009.04.035, 2009.
Fine, P. M., Cass, G. R., and Simoneit, B. R. T.: Chemical characterization of fine particle emissions from the fireplace combustion of woods grown in the southern United States, Environ. Sci. Technol., 36, 1442–1451, https://doi.org/10.1021/es0108988, 2002.
Fine, P. M., Cass, G. R., and Simoneit, B. R. T.: Chemical characterization of fine particle emissions from the fireplace combustion of wood types grown in the midwestern and western United States, Environ. Eng. Sci., 21, 387–409, https://doi.org/10.1089/109287504323067021, 2004.
Fraser, M. P. and Lakshmanan, K.: Using levoglucosan as a molecular marker for the long-range transport of biomass combustion aerosols, Environ. Sci. Technol., 34, 4560–4564, https://doi.org/10.1021/es991229l, 2000.
Fuller, G. W., Tremper, A. H., Baker, T. D., Yttri, K. E., and Butterfield, D.: Contribution of wood burning to PM10 in London, Atmos. Environ., 87, 87–94, https://doi.org/10.1016/j.atmosenv.2013.12.037, 2014.
Glasius, M., Hansen, A. M. K., Claeys, M., Henzing, J. S., Jedynska A. D., Kasper-Giebl, A., Kistler, M., Kristensen, K., Martinsson, J., Maenhaut, W., Nøjgaard, J. K., Spindler, G., Stenström, K. E., Swietlicki, E., Szidat, S., Simpson, D., and Yttri, K. E.: Composition and sources of carbonaceous aerosols in Northern Europe during winter, Atmos. Environ., 173, 127–141, https://doi.org/10.1016/j.atmosenv.2017.11.005, 2018.
Hellén, H., Kangas, L., Kousa, A., Vestenius, M., Teinilä, K., Karppinen, A., Kukkonen, J., and Niemi, J. V.: Evaluation of the impact of wood combustion on benzo[a]pyrene (BaP) concentrations; ambient measurements and dispersion modeling in Helsinki, Finland, Atmos. Chem. Phys., 17, 3475–3487, https://doi.org/10.5194/acp-17-3475-2017, 2017.
Hong, Y., Cao, F., Fan, M.-Y., Lin, Y.-C., Gul, C., Yu, M., Wu, X., Zhai, X. and Zhang, Y.-L.: Impacts of chemical degradation of levoglucosan on quantifying biomass burning contribution to carbonaceous aerosols: A case study in Northeast China, Sci. Total Environ., 819, 152007, https://doi.org/10.1016/j.scitotenv.2021.152007, 2022.
Jedynska, A., Hoek, G., Wang, M., Eeftens, M., Cyrys, J., Beelen, R., Cirach, M., De Nazelle, A., Keuken, M., Visschedijk, A., Nystad, W., Akhlaghi, H. M., Meliefste, K., Nieuwenhuijsen, M., de Hoogh, K., Brunekreef, B., and Kooter, I. M.: Spatial variations of levoglucosan in four European study areas, Sci. Total Environ., 505, 1072–1081, https://doi.org/10.1016/j.scitotenv.2014.10.091, 2015.
Johansson, C., Pettersson, M., Omstedt, G.: Metodik för utvärdering av den lokala vedeldningens påverkan på luftkvalitet – Erfarenheter från BHM, ITM Report 118, Inst of Applied Environmental Research, Stockholm University, Sweden, http://www.aces.su.se/reflab/wp-content/uploads/itm_rapp118_2003-12-10.pdf (last access: 22 August, 2022), 2003.
Keyte, I. J., Harrison, R. M. and Lammel, G: Chemical reactivity and long-range transport potential of polycyclic aromatic hydrocarbons – a review, Chem. Soc. Rev., 42, 9333–9391, https://doi.org/10.1039/c3cs60147a, 2013.
Khan, M. B., Masiol, M., Bruno, C., Pasqualetto, A., Formenton, G. M., Agostinelli, C., and Pavoni, B.: Potential sources and meteorological factors affecting PM2.5-bound polycyclic aromatic hydrocarbon levels in six main cities of northeastern Italy: an assessment of the related carcinogenic and mutagenic risks, Environ. Sci. Pollut. Res., 25, 31987–32000, https://doi.org/10.1007/s11356-018-2841-1, 2018.
Kocbach Bølling, A., Pagels, J., Yttri, K. E., Barregard, L., Sallsten, G., Schwarze, P. E., and Boman, C.: Health effects of residential wood smoke particles: the importance of combustion conditions and physicochemical particle properties, Part. Fibre Toxicol., 6, 29, https://doi.org/10.1186/1743-8977-6-29, 2009.
Lewtas, J.: Air pollution combustion emissions: Characterization of causative agents and mechanisms associated with cancer, reproductive, and cardiovascular effects, Mut. Res., 636, 95–133, https://doi.org/10.1016/j.mrrev.2007.08.003, 2007.
Li, Y., Fu, T.-M., Yu, J. Z., Feng, X., Zhang, L., Chen, J., Boreddy, S. K. R., Kawamura, K., Fu, P., Yang, X., Zhu, L. and Zeng, Z.: Impacts of chemical degradation on the global budget of atmospheric levoglucosan and its use as a biomass burning tracer, Environ. Sci. Technol., 55, 5525–5536, https://doi.org/10.1021/acs.est.0c07313, 2021.
Lim, H., Mattsson, Å., Jarvis, I. W. H., Bergvall, C., Bottai, M., Morales, D. A., Kummrow, F., Umbuzeiro, G. A., Stenius, U., Westerholm, R., and Dreij, K.: Detection of benz[j]aceanthrylene in urban air and evaluation of its genotoxic potential, Environ. Sci. Technol., 49, 3101–3109, https://doi.org/10.1021/es505458g, 2015.
Maenhaut, W., Vermeylen, R., Claeys, M., Vercauteren, J., Matheeussen, C., and Roekens, E.: Assessment of the contribution from wood burning to the PM10 aerosol in Flanders, Belgium, Sci. Total Environ., 437, 226–236, https://doi.org/10.1016/j.scitotenv.2012.08.015, 2012.
Maenhaut, W., Vermeylen, R., Claeys, M., Vercauteren, J., and Roekens, E.: Sources of the PM10 aerosol in Flanders, Belgium, and re-assessment of the contribution from wood burning, Sci. Total Environ., 562, 550–560, https://doi.org/10.1016/j.scitotenv.2016.04.074, 2016.
Manoli, E., Kouras, A., Karagkiozidou, O., Argyropoulos, G., Voutsa, D., and Samara, C.: Polycyclic aromatic hydrocarbons (PAHs) at traffic and urban background sites of northern Greece: source apportionment of ambient PAH levels and PAH-induced lung cancer risk, Environ. Sci. Pollut. Res., 23, 3556–3568, https://doi.org/10.1007/s11356-015-5573-5, 2016.
Martinsson, J., Eriksson, A. C., Elbæk Nielsen, I., Berg Malmborg, V., Ahlberg, E., Andersen, C., Lindgren, R., Nyström, R., Nordin, E. Z., Brune, W. H., Svenningsson, B., Swietlicki, E., Boman, C. and Pagels, J. H.: Impacts of combustion conditions and photochemical processing on the light absorption of biomass combustion aerosol, Environ. Sci. Technol., 49, 14663–14671, https://doi.org/10.1021/acs.est.5b03205, 2015.
Mashayekhy Rad, F., Spinicci, S., Silvergren, S., Nilsson, U., and Westerholm, R.: Validation of a HILIC/ESI-MS/MS method for the wood burning marker levoglucosan and its isomers in airborne particulate matter, Chemosphere, 211, 617–623, https://doi.org/10.1016/j.chemosphere.2018.07.188, 2018.
MDH: Guidance for evaluating the cancer potency of polycyclic aromatic hydrocarbon (PAH) mixtures in environmental samples, Minnesota Department of Health, St. Paul, MN, USA, https://www.health.state.mn.us/communities/environment/risk/docs/guidance/pahguidance.pdf (last access: 25 July 2022), 2016.
Mitchell, J.: IARC Monographs on the evaluation of carcinogenic risks to humans, Volume 92, Some Non-heterocyclic polycyclic aromatic hydrocarbons and some related exposures, International Agency for Research on Cancer, Lyon, France, https://publications.iarc.fr/Book-And-Report-Series/Iarc-Monographs-On-The-Identification-Of-Carcinogenic-Hazards-To-Humans/Some-Non-heterocyclic-Polycyclic-Aromatic-Hydrocarbons-And-Some-Related-Exposures-2010 (last access: 25 July 2022), 2010.
Mitchell, J.: IARC Monographs on the evaluation of carcinogenic risks to humans, Volume 101, Some chemicals present in industrial and consumer products, food and drinking-water, International Agency for Research on Cancer, Lyon, France, https://publications.iarc.fr/Book-And-Report-Series/Iarc-Monographs-On-The-Identification-Of-Carcinogenic-Hazards-To-Humans/Some-Chemicals-Present-In-Industrial-And-Consumer-Products-Food-And-Drinking-water-2012 (last access: 25 July 2022), 2013.
Müller, K.: IARC Monographs on the evaluation of carcinogenic risks to humans, Volume 109, Outdoor air pollution, International Agency for Research on Cancer, Lyon, France, https://publications.iarc.fr/Book-And-Report-Series/Iarc-Monographs-On-The-Identification-Of-Carcinogenic-Hazards-To-Humans/Outdoor-Air-Pollution-2015 (last access: 25 July 2022), 2016.
Muller, P.: Scientific criteria document for multimedia standards development, polycyclic aromatic hydrocarbons (PAH), Part 1, Hazard identification and dose-response assessment, Ontario Ministry of Environment and Energy, Ontario, Canada, https://www.osti.gov/etdeweb/biblio/607219 (last access: 26 July 2022), 1997.
Nisbet, I. C. T. and LaGoy, P. K.: Toxic equivalency factors (TEFs) for polycyclic aromatic hydrocarbons (PAHs), Regul. Toxicol. Pharm., 16, 290–300, https://doi.org/10.1016/0273-2300(92)90009-X, 1992.
Nolte, C. G., Schauer, J. J., Cass, G. R., and Simoneit, B. R. T.: Highly polar organic compounds present in wood smoke and in the ambient atmosphere, Environ. Sci. Technol., 35, 1912–1919, https://doi.org/10.1021/es001420r, 2001.
Nyström, R., Sadiktsis, I., Ahmed, T. M., Westerholm, R., Koegler, J. H., Blomberg, A., Sandström, T., and Boman, C.: Physical and chemical properties of RME biodiesel exhaust particles without engine modifications, Fuel, 186, 261–269, https://doi.org/10.1016/j.fuel.2016.08.062, 2016.
Olsson, P., Sadiktsis, I., Holmbäck, J., and Westerholm, R.: Class separation of lipids and polycyclic aromatic hydrocarbons in normal phase high performance liquid chromatography – A prospect for analysis of aromatics in edible vegeTable oils and biodiesel exhaust particulates, J. Chromatogr. A., 1360, 39–46, https://doi.org/10.1016/j.chroma.2014.07.064, 2014.
Omstedt, G., Forsberg, M., Persson, K.: Vedrök i Västerbotten – mätningar, beräkningar och hälsokonsekvenser, SMHI report 156, http://urn.kb.se/resolve?urn=urn%3Anbn%3Ase%3Asmhi%3Adiva-2792, or https://www.diva-portal.org/smash/get/diva2:948088/FULLTEXT01.pdf (last access: 15 August 2022), 2014.
Pietrogrande, M. C., Bacco, D., Demaria, G., Russo, M., Scotto, F., and Trentini, A.: Polycyclic aromatic hydrocarbons and their oxygenated derivatives in urban aerosol: levels, chemical profiles, and contribution to PM2.5 oxidative potential, Environ. Sci. Pollut. Res., 29, 54391–54406, https://doi.org/10.1007/s11356-021-16858-z, 2022.
Puxbaum, H., Caseiro, A., Sánchez-Ochoa, A., Kasper-Giebl, A., Claeys, M., Gelencsér, A., Legrand, M., Preunkert, S., and Pio, C.: Levoglucosan levels at background sites in Europe for assessing the impact of biomass combustion on the European aerosol background, J. Geophys. Res., 112, D23S05, https://doi.org/10.1029/2006JD008114, 2007.
Sadiktsis, I., Koegler, J. H., Benham, T., Bergvall, C., and Westerholm, R.: Particulate associated polycyclic aromatic hydrocarbon exhaust emissions from a porTable power generator fueled with three different fuels – A comparison between petroleum diesel and two biodiesels, Fuel, 115, 573–580, https://doi.org/10.1016/j.fuel.2013.07.062, 2014.
Saleh, R., Robinson, E. S., Tkacik, D. S., Ahern, A. T., Liu, S., Aiken, A. C., Sullivan, R. C., Presto, A. A., Dubey, M. K., Yokelson, R. J., Donahue, N. M., and Robinson, A. L.: Brownness of organics in aerosols from biomass burning linked to their black carbon content, Nat. Geosci., 7, 647–650, https://doi.org/10.1038/ngeo2220, 2014.
Sarigiannis, D. A., Karakitsios, S. P., Zikopoulos, D., Nikolaki, S., and Kermenidou, M.: Lung cancer risk from PAHs emitted from biomass combustion, Environ. Res., 137, 147–156, https://doi.org/10.1016/j.envres.2014.12.009, 2015.
Schmidl, C., Marr, I. L., Caseiro, A., Kotianová, P., Berner, A., Bauer, H., Kasper-Giebl, A., and Puxbaum, H.: Chemical characterisation of fine particle emissions from wood stove combustion of common woods growing in mid-European Alpine regions, Atmos. Environ., 42, 126–141, https://doi.org/10.1016/j.atmosenv.2007.09.028, 2008.
Segersson, D., Eneroth, K., Engström Nylén, A., Gidhagen, L., Omstedt, G., Johansson, C., and Forsberg, B.: Health impact of PM10, PM2.5 and BC exposure due to different source sectors in Stockholm, Gothenburg and Umea, Sweden, Int. J. Environ. Res. Public Health, 14, 742, https://doi.org/10.3390/ijerph14070742, 2017.
Shafizadeh, F.: Pyrolysis and combustion of cellulosic materials, Adv. Carbohydr. Chem., 23, 419–474, https://doi.org/10.1016/S0096-5332(08)60173-3, 1968.
Sigsgaard, T., Forsberg, B., Annesi-Maesano, I., Blomberg, A., Bølling, A., Boman, C., Bønløkke, J., Brauer, M., Bruce, N., Héroux, M. E., Hirvonen, M. R., Kelly, F., Künzli, N., Lundbäck, B., Moshammer, H., Noonan, C., Pagels, J., Sallsten, G., Sculier, J. P., and Brunekreef, B.: Health impacts of anthropogenic biomass burning in the developed world, Eur. Respir. J., 46, 1577–1588, https://doi.org/10.1183/13993003.01865-2014, 2015.
Simoneit, B. R. T.: Biomass burning – a review of organic tracers for smoke from incomplete combustion, Appl. Geochem., 17, 129–162, https://doi.org/10.1016/S0883-2927(01)00061-0, 2002.
Simoneit, B. R. T., Schauer, J. J., Nolte, C. G., Oros, D. R., Elias, V. O., Fraser, M. P., Rogge, W. F., and Cass, G. R.: Levoglucosan, a tracer for cellulose in biomass burning and atmospheric particles, Atmos. Environ., 33, 173–182, https://doi.org/10.1016/S1352-2310(98)00145-9, 1999.
Singh, D. K., Kawamura, K., Yanase, A., and Barrie, L. A.: Distributions of polycyclic aromatic hydrocarbons, aromatic ketones, carboxylic acids, and trace metals in Arctic aerosols: Long-range atmospheric transport, photochemical degradation/production at polar sunrise, Environ. Sci. Technol., 51, 8992–9004, https://doi.org/10.1021/acs.est.7b01644, 2017.
SLB-analys: LVF 2010:06 Kartläggning av bens(a)pyrenhalter i Stockholms- och Uppsala län samt tätorterna Gävle och Sandviken, Technical report by Stockholm and Uppsala Air quality management association, https://www.slb.nu/slb/rapporter/pdf8/lvf2010_006.pdf (last access: 15 August 2022), 2010.
SLB-analys: Meteorological data/Meteorologi timdatabas, Meteorologi dygnsdatabas, slb.nu [data set], https://www.slb.nu/slbanalys/historiska-data-met, last access: 15 August 2022a.
SLB-analys: Measured air pollutant data/Luftkvalitet timdatabas, slb.nu [data set], https://www.slb.nu/slbanalys/historiska-data-luft, last access: 15 August 2022b.
Slezakova, K., Castro, D., Delerue-Matos, C., Alvim-Ferraz, M. C., Morais, S., and Pereira, M. C.: Impact of vehicular traffic emissions on particulate-bound PAHs: Levels and associated health risks, Atmos. Res., 127, 141–147, https://doi.org/10.1016/j.atmosres.2012.06.009, 2013.
SMED and Naturvårdsverket: Informative Inventory Report Sweden 2017, Swedish Environmental Protection Agency, Stockholm, Sweden, https://www.naturvardsverket.se/upload/sa-mar-miljon/klimat-och-luft/luft/luftfororeningar/informative-inventory-report-sweden-2017.pdf (last access: last access: 31 January 2019), 2017.
Taesler, R. and Andersson, C.: A method for solar radiation computations using routine meteorological observations, Energy and Buildings, 7, 341–352, 1984.
Taesler, R., Andersson, C., Nord, M., Gollvik, L.: Analyses of impacts of weather and climate on building energy performance with special regard to urban climate characteristics, Preprint, 6th International Conference on Urban Climate, Göteborg, Sweden, 12–16 June 2006, http://www.urban-climate.org/documents/ICUC6_Preprints.pdf (last access: 16 August 2022), 2006.
Todorovic, J., Broden, H., Padban, N., Lange, S, Gustafsson, L., Johansson, L., Paulrud, S., and Löfgren, B. E.: Syntes och analys av emissionsfaktorerer för småskalig biobränsleförbränning, TPS Termiska Processer, SP Technical Research Institute of Sweden, IVL Swedish Environmental Research Institute, and ÄFAB, 2007.
Wagener, S., Langner, M., Hansen, U., Moriske, H. J., and Endlicher, W. R.: Spatial and seasonal variations of biogenic tracer compounds in ambient PM10 and PM1 samples in Berlin, Germany, Atmos. Environ., 47, 33–42, https://doi.org/10.1016/j.atmosenv.2011.11.044, 2012.
Wagner, F., Amann, M., Bertok, I., Cofala, J., Heyes, C., Klimont, Z., Rafaj, P., and Schöpp, W.: Baseline emission projections and further cost-effective reductions of air pollution impacts in Europe – a 2010 perspective, IIASA, Austria, 2010.
Walgraeve, C., Demeestere, K., Dewulf, J., Zimmermann, R., and Van Langenhove, H.: Oxygenated polycyclic aromatic hydrocarbons in atmospheric particulate matter: Molecular characterization and occurrence, Atmos. Environ., 44, 1831–1846, https://doi.org/10.1016/j.atmosenv.2009.12.004, 2010.
WHO: WHO Air quality guidelines for particulate matter, ozone, nitrogen oxide and sulfur dioxide, Global update 2005, Summary of risk assessment, World Health Organization, WHO Press, Geneva, Switzerland, https://apps.who.int/iris/handle/10665/69477 (last access: 26 July 2022), 2006.
Yttri, K. E., Dye, K., Slørdal, L. H., and Braathen, O. A.: Quantification of monosaccharide anhydrides by liquid chromatography combined with mass spectrometry: application to aerosol samples from an urban and a suburban site influenced by small-scale wood burning, J. Air Waste Manag. Assoc., 55, 1169–1177, https://doi.org/10.1080/10473289.2005.10464720, 2005.
- Abstract
- Introduction
- Methods
- Results
- Discussion
- Summary and conclusions
- Appendix A: Input data for emission inventory of B[a]P from residential wood combustion in Stockholm County
- Code availability
- Data availability
- Author contributions
- Competing interests
- Disclaimer
- Acknowledgements
- Financial support
- Review statement
- References
- Supplement
The requested paper has a corresponding corrigendum published. Please read the corrigendum first before downloading the article.
- Article
(3550 KB) - Full-text XML
- Corrigendum
-
Supplement
(595 KB) - BibTeX
- EndNote
- Abstract
- Introduction
- Methods
- Results
- Discussion
- Summary and conclusions
- Appendix A: Input data for emission inventory of B[a]P from residential wood combustion in Stockholm County
- Code availability
- Data availability
- Author contributions
- Competing interests
- Disclaimer
- Acknowledgements
- Financial support
- Review statement
- References
- Supplement