the Creative Commons Attribution 4.0 License.
the Creative Commons Attribution 4.0 License.
 | 02 Sep 2022
Experimental study on the evolution of droplet size distribution during the fog life cycle
Frédéric Burnet
Cyrielle Denjean
The evolution of the droplet size distribution (DSD) during the fog life cycle remains poorly understood and progress is required to reduce the uncertainty of fog forecasts. To gain insights into the physical processes driving the microphysical properties, intensive field campaigns were conducted during the winters of 2010–2013 at the Instrumented Site for Atmospheric Remote Sensing Research (SIRTA) in a semi-urban environment southwest of Paris city center to monitor the simultaneous variations in droplet microphysical properties and their potential interactions at the different evolutionary stages of the fog events. Liquid water content (LWC), fog droplet number concentration (Nd) and effective diameter (Deff) show large variations among the 42 fog events observed during the campaign and for individual events. Our findings indicate that the variability of these parameters results from the interaction between microphysical, dynamical and radiative processes. During the formation and development phases, activation of aerosols into fog droplets and condensational growth were the dominant processes. When vertical development of radiation fog occurred under the influence of increasing wind speed and subsequent turbulent motion, additional condensational growth of fog droplets was observed. The DSDs with single mode (around 11 µm) and double mode (around 11 and 22 µm) were observed during the field campaign. During the development phase of fog with two droplet size modes, a mass transfer occurred from the smaller droplets into the larger ones through collision–coalescence or Ostwald ripening processes. During the mature phase, evaporation due to surface warming induced by infrared radiation emitted by fog was the dominant process. Additional droplet removal through sedimentation is observed during this phase for fog with two droplet size modes. Because of differences in the physical processes involved, the relationship between LWC and Nd is largely driven by the DSD. Although a positive relationship is found in most of the events due to continuous activation of aerosol into fog droplets, LWC varies at a constant Nd in fog with large Deff (>17 µm) due to additional collision–coalescence and Ostwald ripening processes. This work illustrates the need to accurately estimate the supersaturation for simulating the continuous activation of aerosols into droplets during the fog life cycle and to include advanced parameterizations of relevant microphysical processes such as collision–coalescence and Ostwald ripening processes, among others, in numerical models.
- Article
(1854 KB) - Full-text XML
- BibTeX
- EndNote


Fog is defined by the National Oceanic and Atmospheric Administration (NOAA) as a suspension of very small droplets in the air, reducing the visibility to less than 1 m close to the surface. These low visibilities are responsible for strong perturbation in aviation, transport and health. The associated economic losses are estimated around several billion a year for the airport only (Gultepe et al., 2017; Price et al., 2018; Kulkarni et al., 2019). Fog is a complex meteorological system dealing with various fine-scale processes. Continental fog often forms by radiative cooling of the surface (radiation fog) or by the lowering of pre-existing stratus to ground level (Tardif and Rasmussen, 2007). The fog life cycle is driven by radiation, turbulent, thermodynamic and cloud microphysical (hereafter referred to as microphysics) processes, which interact with each other in complex manners that are not yet fully understood. Despite significant advances in the skills of numerical weather prediction (NWP) models and large-eddy simulation (LES) in recent decades, the timing of formation and dissipation of fog is poorly forecasted (Bergot et al., 2005; Van der Velde et al., 2010; Boutle et al., 2016; Martinet et al., 2020).
Accurate modeling of fog requires precise determination of the microphysical parameters, such as liquid water content (LWC), droplet number concentration (Nd) and effective diameters (Deff). Both Nd and Deff have a particularly large impact on the development of the fog layer due to their feedback on gravitational settling, LWC and radiative cooling at the fog top (Stolaki et al., 2015; Maalick et al., 2016; Boutle et al., 2018; Schwenkel and Maronga, 2018; Kutty et al., 2021). In situ measurements of fog microphysics have shown a large variability of these parameters: LWC, Nd and Deff are commonly in the range of 0.01–0.5 g m−3, 10–500 cm−3 and 10–20 µm in diameter, respectively (Pilié et al., 1975; Choularton et al., 1981; Gerber, 1991; Wendisch et al., 1998; Liu et al., 2011, 2020; Lu et al., 2013; Niu et al., 2010; Price, 2011; Zhao et al., 2013; Gultepe et al., 2019). Large spatial and temporal variabilities have also been noticed during individual fog events, and even at different heights of fog layers (Okita, 1962; Pilié et al., 1975; Goodman, 1977; Pinnick et al., 1978; Garcıa-Garcıa et al., 2002).
The initial Nd and Deff values depend on the ambient supersaturation and the aerosol population which act as cloud condensation nuclei (CCN) (Mazoyer et al., 2019). In recent years, various numerical studies investigated this aerosol indirect effect to study the influence of microphysics on the fog life cycle (Boutle et al., 2018; Schwenkel and Maronga, 2018; Ducongé et al., 2020). Once the fog is formed, several physical processes affect the fog microphysical properties. Droplets can grow either by water vapor condensation, by collision–coalescence (Xue et al., 2008 and Zhao et al., 2013) or by Ostwald ripening that corresponds to the deactivation and evaporation of the smallest droplets in favor of vapor diffusion on the largest ones (Wendisch et al., 1998; Boers et al., 2013; Yang et al., 2018). Droplets can conversely sediment by gravity (Bott, 1991 and Degefie et al., 2015) or turbulent motions (Tav et al., 2018), or evaporate if the supersaturation decreases due to heating or drying of the air mass, e.g., in the case of mixing with the residual dry air (Pilié et al., 1975; Choularton et al., 1981; Gerber, 1991). Additionally, Schwenkel and Maronga (2018) showed that different parametrizations of the activation and condensation processes impact the vertical extent and liquid water path of fog, which strongly affect the fog life cycle (Wærsted et al., 2019 and Karimi, 2020).
Observational studies showed that the fog cycle can be separated into four phases during which LWCs vary largely from phase to phase: (i) formation, (ii) development, (iii) maturity and (iv) dissipation phases (Liu et al., 2011; Zhao et al., 2013; Lu et al., 2013). Although these studies have contributed valuable insights into the physical processes driving the fog life cycle, measurements of the evolution of fog microphysical parameters at different fog stages are currently lacking. As a result, current NWP and LES models do not represent the microphysical processes explicitly and typically overestimate the observed LWC and Nd (Mazoyer et al., 2017 and Boutle et al., 2018). Recently, Boutle et al. (2022) pointed out model sensitivity of fog development to the shape of the cloud droplet size distribution (DSD). Improving our understanding concerning physical processes driving fog microphysical properties during the fog life cycle appears crucial for improving fog forecasting and mitigating the impacts of such events.
The fog life cycle and microphysics are strongly related to dynamics (Mazoyer et al., 2017) and especially to the fog vertical development (Bergot, 2013). The radiation fog LES of Boutle et al. (2018) shows that the gradual rise in the downwelling long-wave radiation, which causes the low transition towards a well-mixed fog layer, is mainly driven by the fog-layer physical depth. Price (2019) pointed out the increasing wind speed as a non-local factor for fog development, but they did not investigate its relation to microphysics. The present study explores the impact of the fog vertical development on its microphysical properties at the surface by taking advantage of the sampling of four fog events evolving from a thin layer to a thick fog developed vertically (Dupont et al., 2016 and Elias et al., 2018).
In this study, we quantify the evolution of fog microphysical parameters of 42 fog events sampled at the Instrumented Site for Atmospheric Remote Sensing Research (SIRTA) downwind of the urban area of Paris during the winters of 2010–2013. We aim to provide comprehensive information about the physical processes driving the fog microphysical parameters at the different fog stages, and how these processes affect the evolution of the fog life cycle. Specifically, in the indicated sections, the following questions are addressed:
-
Given the scarcity of data, what are the fog microphysics in the semi-urban environment of Paris?
-
What are the dynamic conditions for fog formation and evolution? What are the processes driving the vertical dispersion of fog. Are the fog microphysics altered during the thin-to-thick transition?
-
What is the evolution of fog microphysics during the fog life cycle? What are the key processes involved?
-
What is the relationship between LWC and Nd? How sensitive is this relationship to droplet size distribution (DSD)?
2.1 Observational site and instrumentation
The ParisFog field campaign was conducted at SIRTA (Haeffelin et al., 2005) located 20 km, southwest of Paris, France, in winters of 2010–2013 using the framework of the ParisFog field campaigns (Haeffelin et al., 2010). The site is situated in a semi-urban area with mixed land cover including forest, lake, meadows and shrubs next to a built-up area. It is located on a plateau elevated 60 m higher than the surroundings.
During the winters of 2010–2013, specific instrumentation was deployed for the PreViBOSS project (Elias et al., 2012) to provide continuous observation of aerosol and fog microphysics. Aerosol particles and DSDs at ambient humidity were measured using a WELAS-2000 (Palas Gmbh, Karlsruhe, Germany, 0.4–40 µm) and an FM-100 (Droplet Measurement Technologies Inc., Boulder, CO, USA, 2–50 µm). Both instruments are located on a scaffolding about 2.5 m high, close to a PVM-100 from Gerber Scientific Inc. used as a reference for the LWC measurements in the size range of 2–50 µm.
Mazoyer et al. (2019) examined the properties of the hydrated aerosol particle and cloud DSDs during the fog formation of 23 events to evaluate the impact of aerosol particles on the fog microphysics. They derived accurate estimations of the wet critical diameter for each case to exclude hydrated aerosols from the data analysis of Nd and avoid subsequent overestimation of the activated droplet concentration. This method requires additional measurements such as CCN and dry aerosol size distribution. Here we extend the analysis to the 42 events with WELAS-2000 and FM-100 measurements and analyze the DSD characteristics during the entire fog life cycle. We used the median value of the wet critical diameters of 3.8 µm for all the cases. Sensibility tests have been performed and will be discussed in the discussion section. In the following, data from WELAS-2000 and FM-100 are then combined on the [3.8–50] µm range diameter following the method described in Mazoyer et al. (2019).
The temporal and vertical evolution of the visibility were measured by two Degreanne diffusometers (DF20+ and DF320) located at 4 and 18 m above ground. Confidence is given in FM-100 measurements by comparing the integrated LWC over its size range with the LWC measured by PVM-100 and the visibility trend (Burnet et al., 2012 for the 2010–2011 period). Temperature and humidity sensors were located at heights between 1 and 30 m (1, 2, 5, 10, 20 and 30 m) on an instrumented mast. Wind speed was measured by two ultrasonic anemometers at 10 and 30 m on the same mast.
2.2 Fog type and classification
During the three winter campaigns of 2010–2013, 42 fog events with reliable measurements of DSD and meteorological conditions were retained in the analysis of the present study. To minimize the impact of non-local effects (Ducongé et al., 2020), only radiative and stratus-lowering fog have been selected. Classification of the fog events was based on the measured visibility, temperature, wind speed, precipitation, cloud cover and ceiling height according to the Tardif and Rasmussen (2007) algorithm. At SIRTA, radiation fog and stratus-lowering fog occur with about the same frequency. Following Elias et al. (2009) and Dupont et al. (2016), further classification of radiation fog was based on their vertical development using the comparison of the two diffusometers: a thick fog produces low-visibility conditions at 4 and 18 m simultaneously, whereas a thin fog produces low-visibility conditions at 4 m only. Development of radiation fog events from optically thin fog in a stable boundary layer to well-mixed optically thick fog were also observed during the field campaign. The 42 fog events analyzed here can be classified as follows: radiative thick fogs (12), radiative thin fog (6), thin-to-thick transition of radiation fog (4) and stratus-lowering fog (20).
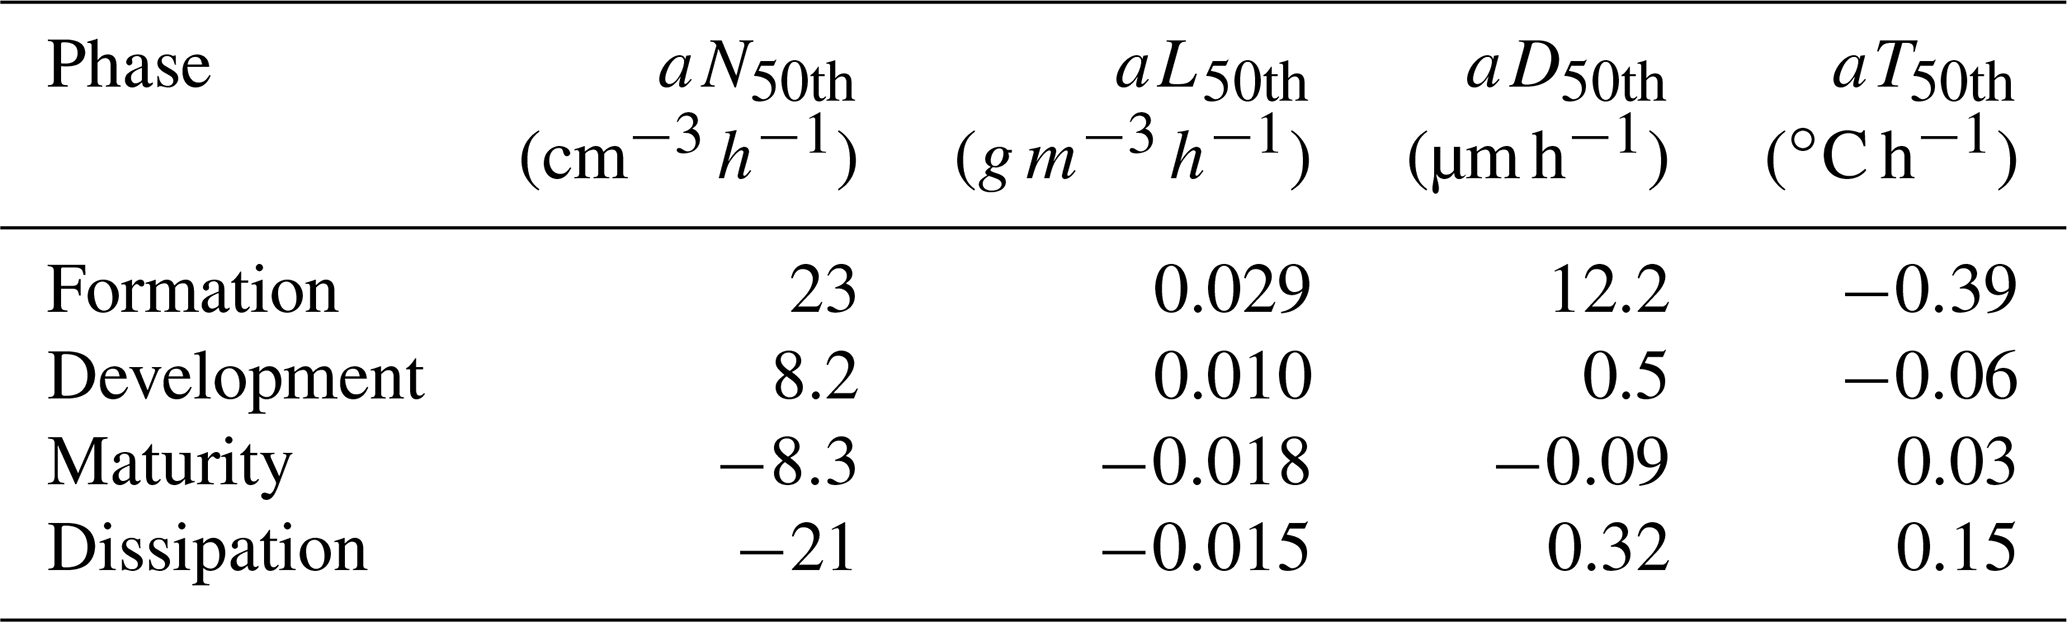
Table 1Linear regression temporal evolution of LWC, Nd, Deff and the temperature for the 4 phases identified in the 42 fog events.
3.1 Overview of the fog microphysics
Statistics of Nd, LWC, and Deff values over life cycle of the 42 fog events are presented in Table A1 in the Appendix. The median values of Nd, LWC, and Deff vary over the ranges of 5–200 cm−3, 0.002–0.096 g cm−3 and 8–22 µm, respectively, which are in agreement with values reported for fog events in other regions (Eldridge, 1966; Pilié et al., 1975; Pinnick et al., 1978; Choularton et al., 1981; Kunkel, 1984; Gerber, 1991; Wendisch et al., 1998; Liu et al., 2011, 2020; Lu et al., 2013; Niu et al., 2010; Price, 2011; Zhao et al., 2013; Gultepe et al., 2019). Considerable variability on Nd, Deff and LWC is observed both for different fog events and during individual events. Additionally, fog DSD with a single mode (around 11 µm) and a double mode (around 11 and 22 µm) are observed. Determination of the number of the modes has been done for each event according to the existence of local minima on the number of DSD: 13 events have a bimodal DSD that is about 30 % of the 42 fog events analyzed here, and none of them are thin radiative fog. While DSD with two modes has already been observed by Frank et al., 1998; Wendisch et al., 1998; and Gultepe and Milbrandt, 2007, the origin of the largest second mode is still unclear.
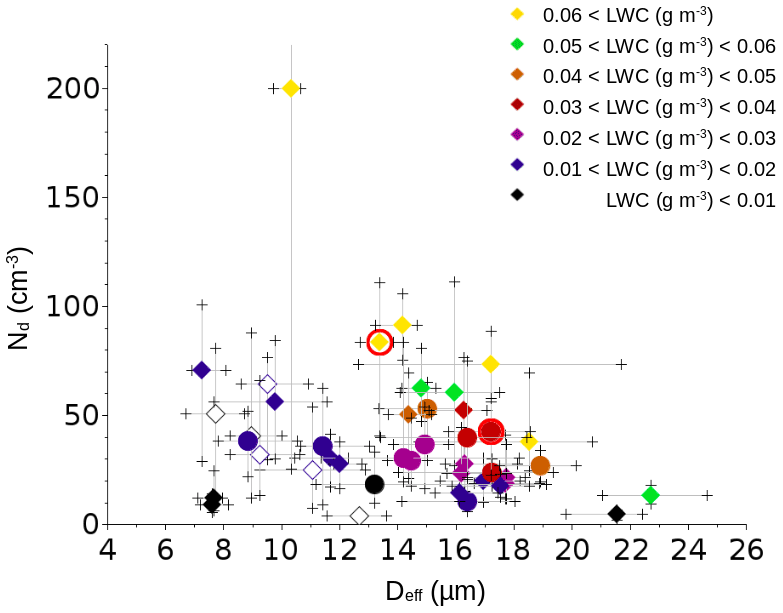
Figure 1Nd as a function of Deff for the 42 fog events. The color set indicates the range of LWC values. Error bars are the 25th and 75th percentiles. Statistics are made only when LWC > 0.005 g m−3. The diamonds and circles represent fog with a single- and double-droplet mode, respectively. Thin fog is represented by empty diamonds. F9 is the yellow point surrounded by a red circle and F32 is the brown point surrounded by a red circle.
Figure 1 shows the relationship between Nd, Deff and LWC for the 42 selected fog events. For a given range of LWC values, Nd decreases as Deff increases, except for very low LWC values <0.01 g m−3. This trend is more pronounced as the LWC range increases. Such a dependence between the size and the number of droplets is ubiquitous in convective clouds since droplets compete for the available water vapor. It appears less marked in fog due to lower concentration values resulting from lower supersaturation. In addition, Mazoyer et al. (2019) showed that mean Nd values averaged over the complete fog life cycle are significantly lower than the Nd values determined during the first hour of fog. Moreover, no direct correlation can be observed between Nd and LWC. These results confirm that the predictability of droplet activation in fog cannot only be described by LWC. Comparing the fog microphysics between the different classified fog events, lower Deff and LWC are observed in thin fog (empty diamonds in Fig. 1) than in thick fog (full symbols) for a given Nd. As a result, the median value of LWC for thin fog is only 0.010 g m−3, i.e., three times lower than for thick fog, despite very similar median values of Nd of about 37 cm−3. In addition, lower Nd and LWC are observed for fog with double-droplet modes (circular symbols) than for fog with a single-droplet mode (diamond symbols). Indeed for the double-mode group, the highest value of Nd and LWC reach 53 cm−3 and 46 mg m−3, respectively, for F2 in Table A1. In contrast, among the single-mode group, there are 11 cases with higher Nd and 8 cases with higher LWC, and they are not necessarily the same cases. This puts forward the need for a microphysical analysis of fog during its life cycle.
In the following section, our analysis of the evolution of the fog life cycle takes advantage of the occurrence of the four episodes of thin-to-thick radiative fog transition to explore the impact of the fog vertical development on microphysics. We present results for a typical event representative of the general behavior of the other thin-to-thick events. In a second part, two thick events are analyzed in detail to provide guidance on a statistical analysis of the whole set of events.
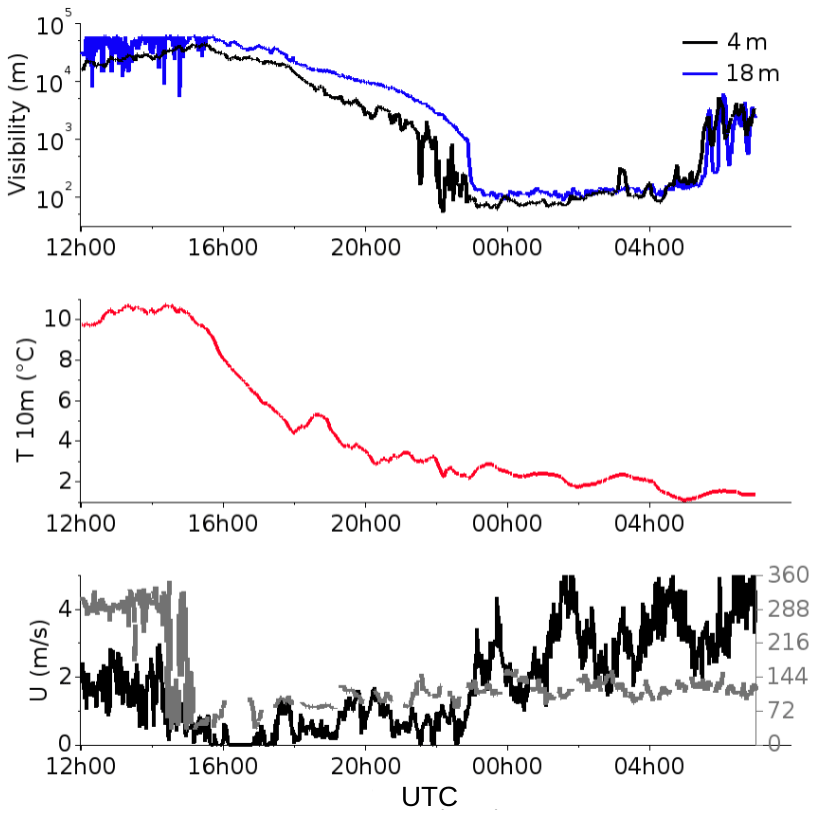
Figure 2Temporal evolution of the visibility measured at 4 and 18 m, the relative humidity, the temperature, the wind speed and the wind direction for F2.
3.2 Thin-to-thick transition
Figure 2 presents the visibility and thermodynamic (temperature, wind speed and direction) evolution of the F2 thin-to-thick fog event. Temperature at 10 m decreases all along the fog event. Wind direction is constant from southeast during the event and wind speed is below 2 m s−1 till 22:50 UTC. At 21:30 UTC, the visibility at 4 m decreases to below 1000 m. However, because of the weak wind speed (<2 m s−1), fog is not able to develop vertically (Rodhe, 1962; Duynkerke, 1991). At 22:50 UTC, wind speed increases to around 3 m s−1 with maximum of 5 m s−1. At 23:00 UTC, this increase of the wind speed is immediately followed by the vertical development of the fog marked by a decrease of the visibility at the 18 m altitude level. Finally, fog dissipates at 05:40 UTC at 4 and 18 m simultaneously. The three other thin-to-thick transitions sampled during this campaign were also concomitant with an increase in wind speed. Therefore, in agreement with Bergot (2013); Price (2019); Gultepe et al. (2021) studies of fog dynamics, the thin-to-thick transition is most likely caused by the increase of wind speed and the subsequent turbulent motion. A gravity current could be responsible for the association of fog development and wind increase (Bardoel et al., 2021). However, the data selection we performed in section “Fog type and classification” should have limited the influence of non-local effects on fog development.
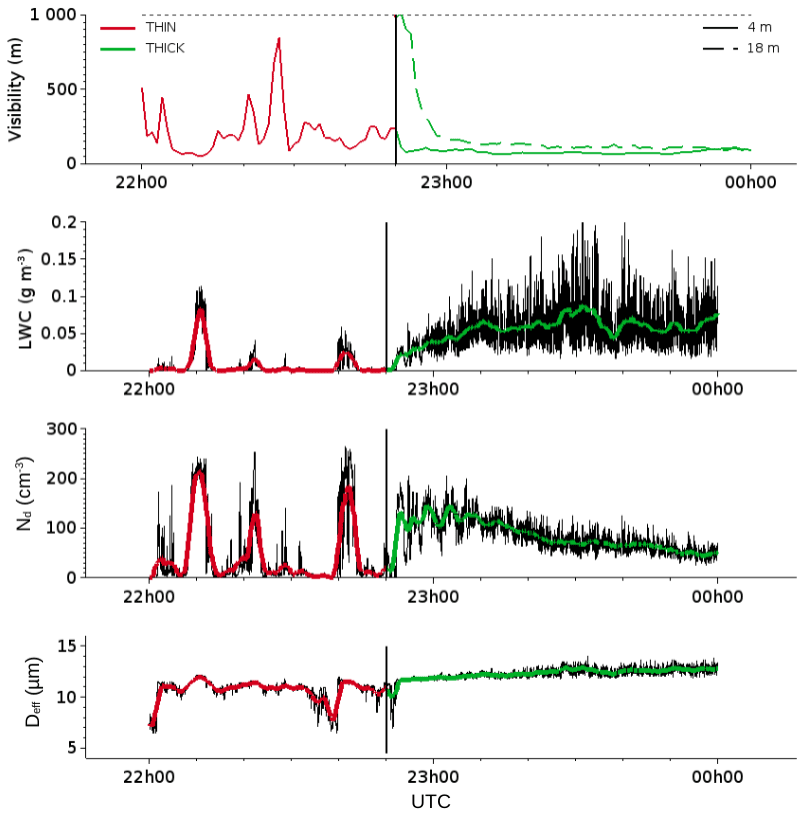
Figure 3Temporal evolution of the visibility, LWC, Nd and Deff for F2 on [2–50] µm. FM-100 data at 1 s (dark lines) and at 1 min (colored lines). Red points correspond to the thin phase and green points to the thick phase.
The temporal evolution of the fog microphysical properties of F2 are reported in Fig. 3. Before the vertical development (red lines), the fog layer appears discontinuous with alternating periods of dense fog, and almost clear air despite the visibility close to the ground (4 m) remains below 1km. The FM-100 measurements indicate that both Nd and LWC fluctuate strongly with values ranging between 5–220 cm−3 and 0.01–0.11 g m−3, respectively, while Deff remains more stable at ∼12 µm. Such a feature of stable Deff could reflect the inhomogeneous mixing with residual air (Baker et al., 1980). The importance of mixing in fog is supported by observational studies of fog top by Pilié et al. (1975); Choularton et al. (1981); Gerber (1991). However, wind and turbulence are very low during this thin phase and then homogeneous mixing is rather expected in such a stable layer. It is then more likely that such fog patches, that are often observed in stable conditions, actually reflect that the condensation of liquid water firstly occurs in isolated layers where the temperature reaches the dew point locally. In contrast, the fog layer becomes more continuous when it thickens vertically. There are still large fluctuations on 1 s samples (black lines), especially on LWC and Nd, but 1 min average data (green lines) reveal gradual changes that are relatively slower. After a short increase of LWC during 20 min, it seems to fluctuate slowly around a steady state, while Nd decreases almost continuously and therefore Deff follows a reverse trend.
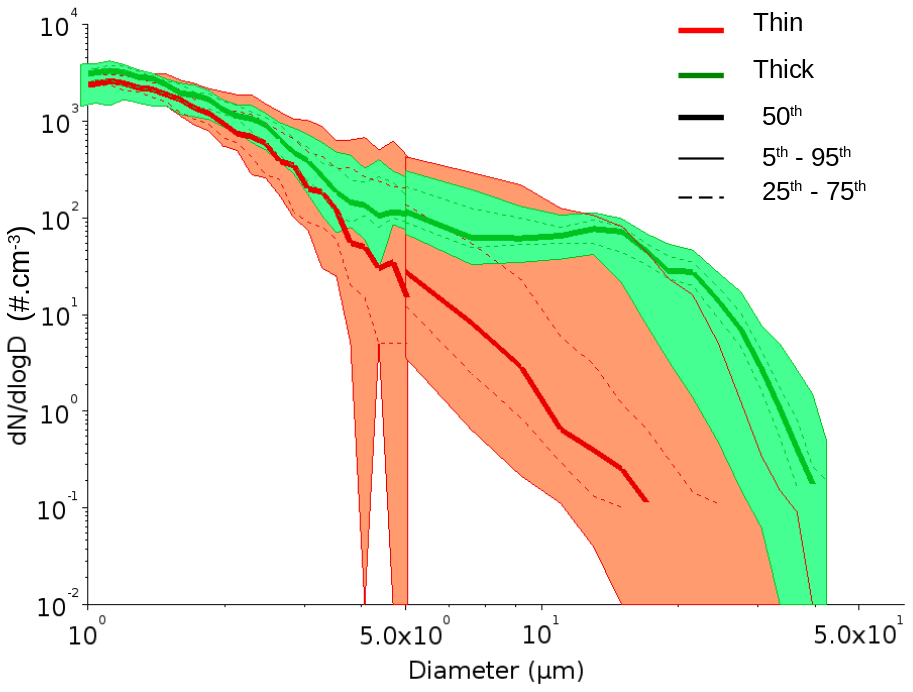
Figure 4Median (bold lines) and filled values between the 5th and 95th percentiles for the aerosol and droplet size distributions (DSDs) during the vertical development of F2 for the periods of thin fog (in red) and thick fog (in green).
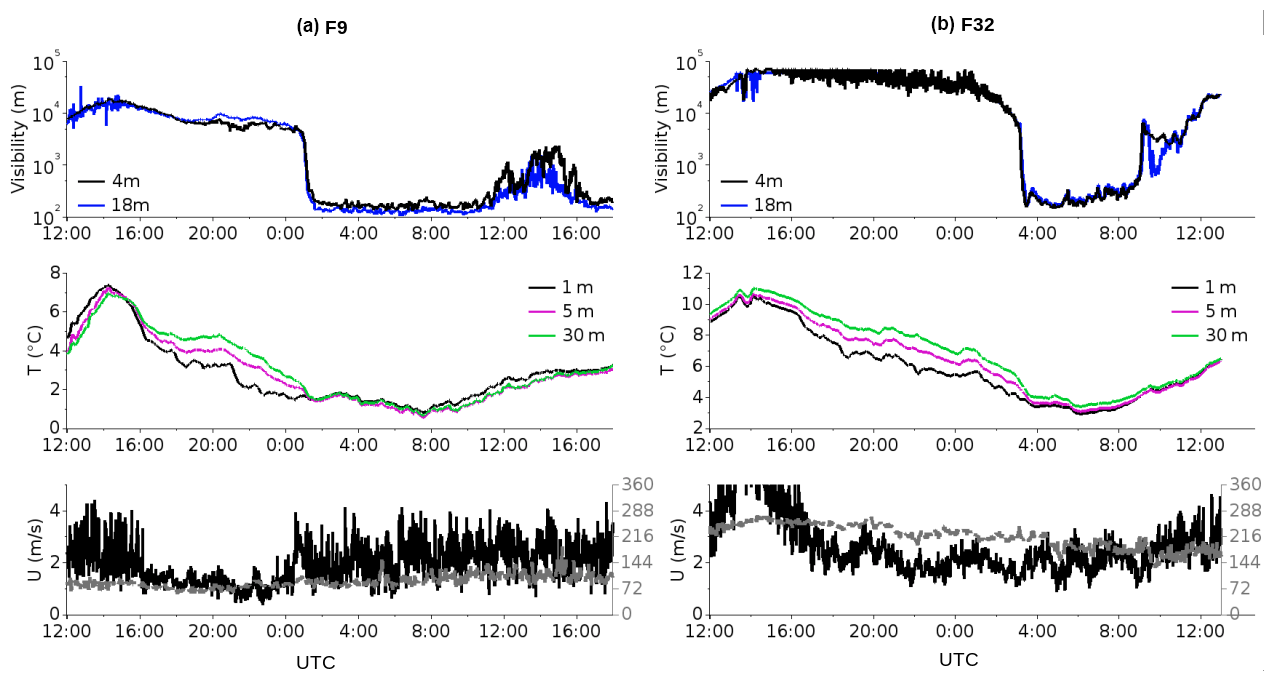
Figure 5Temporal evolution of the visibility measured at 4 and 18 m, the temperature, the wind speed and the wind direction for (a) F9 and (b) F32.
The corresponding composite particle size distribution derived from the combination of WELAS-2000 and FM-100 measurements are displayed in Fig. 4. During the thin phase (red lines and orange shaded area) no mode appears on the size distribution that exhibits a continuous decrease for supermicronic particles, as reflected by the median and 25th–75th percentiles. There are only a very small fraction of samples containing large droplets as revealed by the 95th percentile. In contrast, during the thick phase (green lines and shaded area) we observe a first droplet mode centered at 5 µm with a large amount of large droplets and a second mode centered around 20 µm with very low dispersion around the median values. This could be explained by the growth of the cloud droplets by condensation and collision–coalescence processes. Indeed, Mazoyer et al. (2019) found a wet critical diameter of 4.24 µm for this event. It follows that during the thin phase, particles are mainly deliquescent aerosols with very few activated particles. In contrast, once the fog is vertically developed, numerous droplets are produced by activation and subsequent growth by condensation. They can then reach the threshold diameter required to trigger the collision–coalescence process. Shortly after the vertical development, we observe the shift of DSD toward larger sizes with droplets as large as ∼ 30 µm. The thin-to-thick transition is followed in Fig. 3 by a slight decrease of Nd which confirms the possible occurrence of collision–coalescence. The enhanced turbulence during the transition may favor the onset of collision–coalescence for the diameter of small droplets according to Xue et al. (2008). The thickening of the fog layer will obviously also increase the opportunity for gravitational settling of droplets to collect more water along their path as they sediment. The largest mode of fog droplets is not observed before the vertical development of fog, most likely due to the very low rate of aerosol activation in fog patches, which prevents the growth of fog droplets to sufficient size.
The three other fog events with thin-to-thick transition exhibit very similar microphysical properties and temporal evolution. They reveal that thin fog is composed of mainly unactivated particles, while large cloud droplets appear in very short time scale when the thickness increases, suggesting growth by condensation and collision–coalescence. While the thickening of the fog layer could also have been enhanced by fog advection despite our selection to avoid it, our conclusions support the existence of specific growth processes during the thick phase of fogs. In the following section we investigate the processes occurring at 4 m in fog already developed vertically.
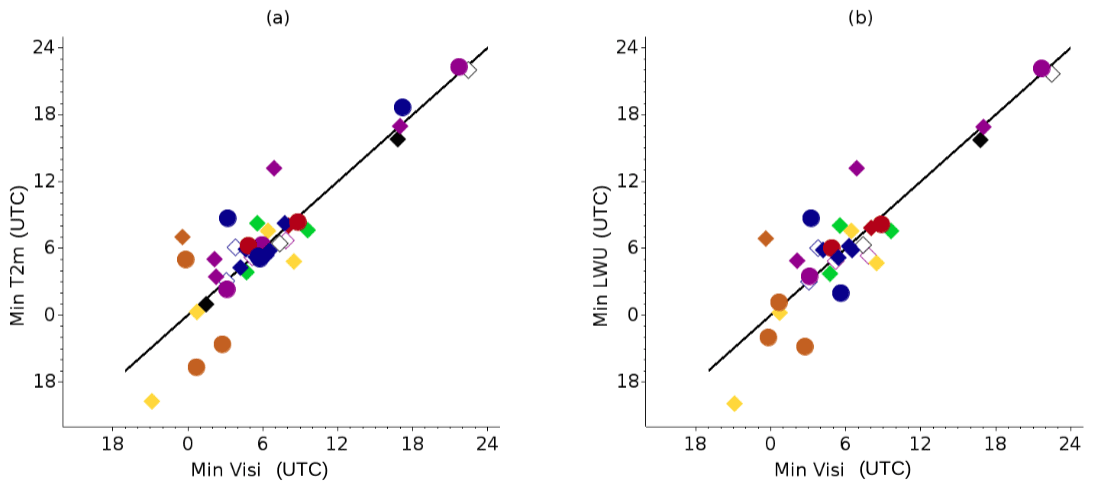
Figure 6Correlation between the time of minimum visibility and (a) the time of minimum temperature at 2 m and (b) the time of upwelling infrared flux at 10 m for the 42 fog events.
3.3 Meteorological conditions during thick fog events
Figure 5 shows the evolution of the visibility, temperature and wind speed during two contrasting thick fog events. Fog 9 (F9) is a 12 h long radiative fog formed at 150 m before reaching the ground and is characterized by a single-droplet mode. As underlined by Stolaki et al. (2015) and Mazoyer et al. (2017), the formation of fog that is low in altitude is very common at SIRTA, and 88 % of the radiation fog events during the field experiment followed a similar pattern. Mazoyer et al. (2017) demonstrated that it is a consequence of the tree-drag effect (and not local topography) when the wind meets this obstacle and the deposition effect, which reduces the formation of droplets near the surface. Fog 32 (F32) is a 6 h long radiative fog formed at ground level characterized by a double-droplet mode. As shown in Fig. 1 (see the red circles), these two fog cases are representative of the ensemble of events in terms of median microphysical values during the whole fog life cycle.
For both cases, temperatures in the first 30 m above the ground reached maximum values around 14:00 UTC the day before, then radiative cooling occurred in the afternoon and during the night, with a continuous decrease of the temperatures, stronger near to the surface. For both fog events, the visibilities show sudden and simultaneous fog formation at 4 and 18 m. At the same time, temperatures become even and decrease much slower until they reach a minimum in the morning. Although less apparent in the figure due to the log scale, the visibilities follow the same trend until a minimum is reached around the same time. Such a minimum was also put forward by Pilié et al. (1975). According to them, it is associated with a slow droplet evaporation. Additionally, a minimum temperature evolution during the fog life cycle was observed by Price (2011), but they did not link it to visibility evolution. All 42 fog events sampled during the experiment exhibit similar temporal evolution of visibility and temperature at 2 m, as well as of the upwelling of long-wave radiation flux at 10 m. Figure 6 shows that the minimum visibility occurs almost simultaneously with both the minimum temperature and the minimum upwelling of infrared flux. This appears to be consistent with a strong influence of surface warming on the fog life cycle due to infrared radiation emitted by fog, which would in turn cause a slow evaporation of fog droplets. The impact of the short-wave warming can be ruled out since the minimum of temperature occurs before the sunrise for 32 events. Note that some scatter exists, with delays of up to several hours, when advection processes are involved. After a slight increase, the visibility steadily increases and fog dissipates at the surface at 09:00 and 13:00 UTC for F9 and F32, respectively.
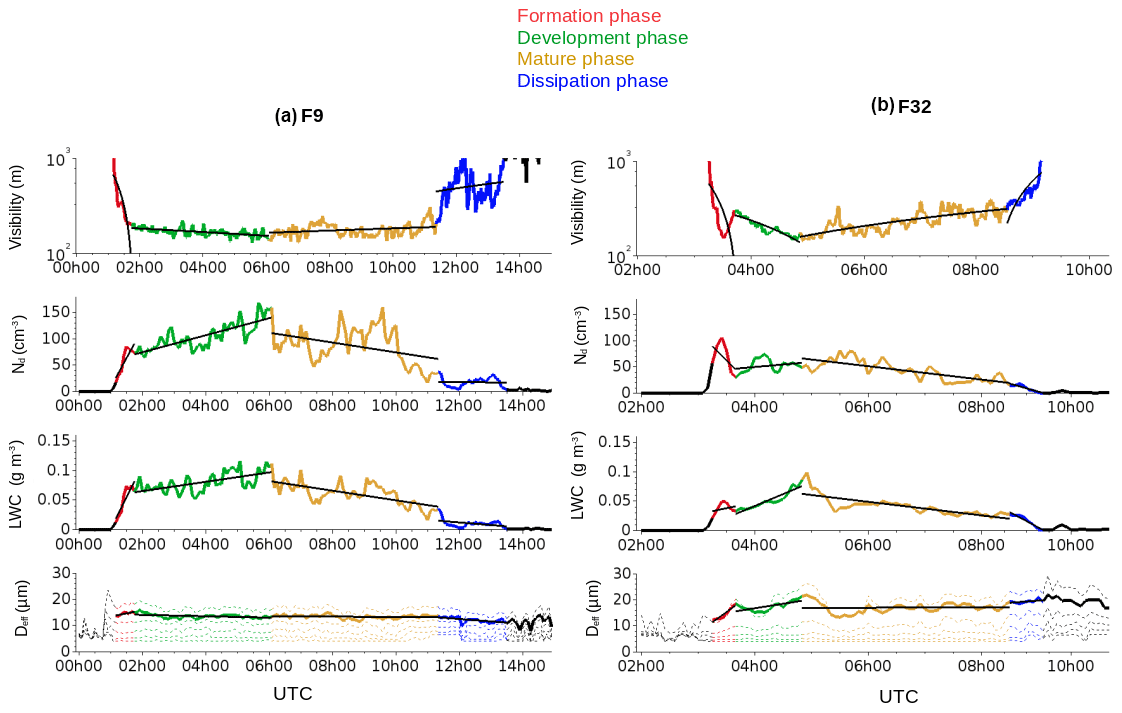
Figure 7Temporal evolution of the visibility, LWC, Nd and Deff (full lines) and droplet diameter of the 5th, 25th, 75th and 95th percentiles (dashed lines) for (a) F9 and (b) F32. The color coding is based on the separation of the fog event into four phases based on the evolution of the visibility. Dark lines represent the linear regression corresponding to each phase.
3.4 Temporal evolution of microphysical properties
In order to investigate the temporal evolution of fog, a division into four phases depending on the visibility evolution is commonly made (Pilié et al., 1975; Niu et al., 2010; Liu et al., 2011; Zhao et al., 2013; Degefie et al., 2015). Pilié et al. (1975) showed that droplet number concentration and LWC reach maximum values during the fog life cycle's visibility minimum, and Liu et al. (2011) linked their visibility division to turbulence evolution which is also a commonly used parameter to divide fog into phases (Nakanishi, 2000; Porson et al., 2011; Bergot, 2013). In the following section, each fog event is separated into four phases based on the evolution of visibility calculated with a 15 min sliding average (see color-time splitting in Fig. 7). The formation phase (red line) is characterized by a sharp decrease of the visibility from 1000 to 200 m in about 30 min for both the cases. During the development phase (green), the visibility continues to decrease but very slowly until its minimum value: for F9 the visibility lost only 50 m in 4 h 15 min. During the mature phase (yellow), the visibility slightly increases at a similar rate. Finally, during the dissipation phase (blue), the visibility increases rapidly to 1000 m. Consistently, comparable trends are depicted for microphysical properties, especially for droplet concentration and LWC, with sharp variations during formation and dissipation phases, and a weaker increase and decrease during the development and mature phases, respectively. It is obvious that there are large fluctuations within each phase, because many processes impact the microphysics locally, but we here consider the general trend in an attempt to characterize the typical fog life cycle.
A statistical characterization of the microphysical properties during the 4 phases is performed on the 42 events. Figure 8 and Table 1 show the linear regression slopes of the temporal evolution of LWC, Nd, Deff and temperature at 2 m during each phase. The formation phase is characterized by a strong increase of LWC, Nd and Deff, associated with a decrease of the temperature. The cooling of the air masses resulted in the condensation of water vapor and the activation of aerosols into fog droplets. The Nd is still increasing in the development phase as more is formed than lost in fog processing and sedimentation, causing a slight increase of Nd and Deff, although their production and growth are much slower. Such an increase of Nd during this phase is surprising as condensation is expected to consume ambient supersaturation and consequently limit new aerosol activation. During the mature phase, the temperature becomes positive and both Nd and LWC decline. At the dissipation phase, the decrease of Nd and LWC is more pronounced.
Fog issued formed by stratus lowering (blue squares in Fig. 8) experiences less cooling for activation than radiative fog, as previously reported by Dupont et al. (2016). As a result, Deff and LWC evolve slower for fog issued from stratus lowering than for radiative fog during the formation and development phases. Dupont et al. (2016) hypothesized that formation of fog from stratus lowering is due to the droplet sedimentation and evaporation, which induce the cooling below the stratus base and enhance the activation/condensation processes. Koračin et al. (2001) suggested that radiative cooling at the stratus top and large-scale subsidence are responsible for the mixing of the dryer layer under the stratus base, which favors its descent. These hypotheses contrast with the formation mechanism of radiation fog (ground-surface cooling) and could explain the differences in microphysics of radiation fog and stratus-lowering fog.
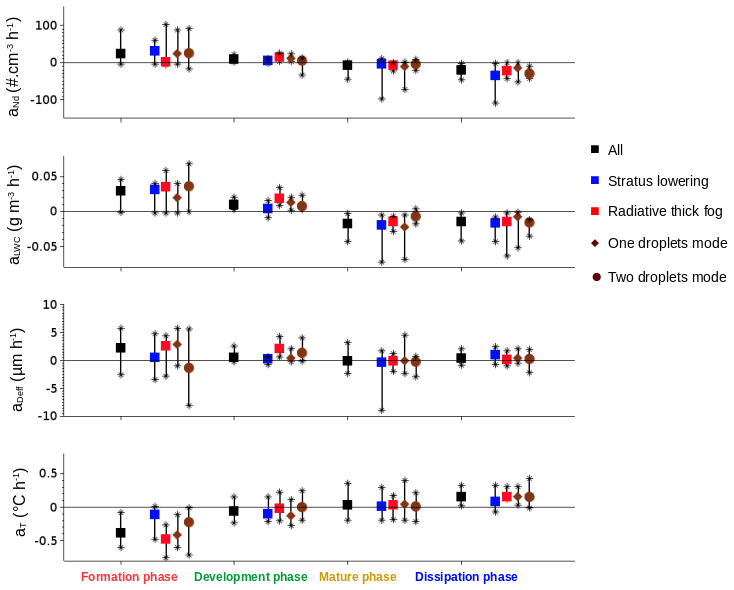
Figure 8Statistical analysis of LWC, Nd and Deff and the temperature at the different phases of the fog events for the fog characterized by a single- (gray squares), double-droplet mode (gray circles), but also stratus-lowering fog (blue marker) and radiative thick fog (red marker). Symbols represent the median values and error bars represent the 25th and 75th percentiles of the data.
Variabilities between fog with a single- and double-droplet mode are stronger during the formation phase. The gradient of Deff during the formation phase is slower and even sometimes negative for fog characterized by a double-droplet mode compared to fog characterized by a single-droplet mode. To gain insights into these differences, Fig. 9 shows the number–size distribution of aerosol particles and fog droplets during the two contrasted fog events presented in Sect. 3.3. Observations indicate that the size distribution of fog droplets vary differently over time depending on the initial fog microphysical properties. For our 42 cases, the number of droplet modes is determined during the formation phase. When fog is characterized by a single-droplet mode (F9), the number–size distribution can be approximated by a bimodal lognormal size distribution with an aerosol mode centered at 0.4 µm and fog droplet mode centered at 11 µm. Droplet size distribution is marked by very little increase in Deff during the development phase. During the mature phase, Deff declines and the number concentration of hydrated aerosols grows. This can be due to the release of water vapor from the start of droplet evaporation due to surface warming (i.e., Sect. 3.3 and Fig. 8). At the dissipation phase, Nd declines but the modes of hydrated aerosols and droplets possibly subside under the influence of sedimentation processes. When compared to F9, F32 shows an additional droplet mode centered at 22 µm, formed at the same moment as the droplet mode centered at 11 µm. The observed decrease of Deff in Fig. 8 during the formation phase is due to the faster increasing concentration of the smaller droplet size. During the development phase, DSDs exhibit a drastic rise in number of the largest droplet and a decrease of the smallest one. This mass transfer phase can be explained by either the collision–coalescence process or Ostwald ripening process as put forward in Wendisch et al. (1998); Boers et al. (2013); Yang et al. (2018). The decrease of Nd and Deff begins during the mature phase, but more quickly than in F9. Since the sedimentation rate of droplets increases with the droplet diameter, it is likely that the droplet removal through sedimentation is accelerated in F32 compared to F9. Figure 7b shows the evolution of the 95th percentile of the droplet diameter (top dashed lines). Quasi-periodic oscillations of this diameter are observed during the mature phase. Bott (1991) also observed such fluctuations using numerical modeling and suggested that these fluctuations could be due to the combined effect of condensation and sedimentation processes of the largest droplet mode. During the dissipation phase, the droplet mode centered at 22 µm vanishes, probably due to the combination of evaporation and sedimentation processes, leading to fog droplets distributed in a unique mode before the total dissipation of the fog event (Fig. 9).
Our statistical analyses highlight the main presumed microphysical processes during developed fog: the activation/condensation and evaporation/deactivation, the sedimentation, the collision–coalescence and the Ostwald ripening processes (Wendisch et al., 1998; Boers et al., 2013; Yang et al., 2018).
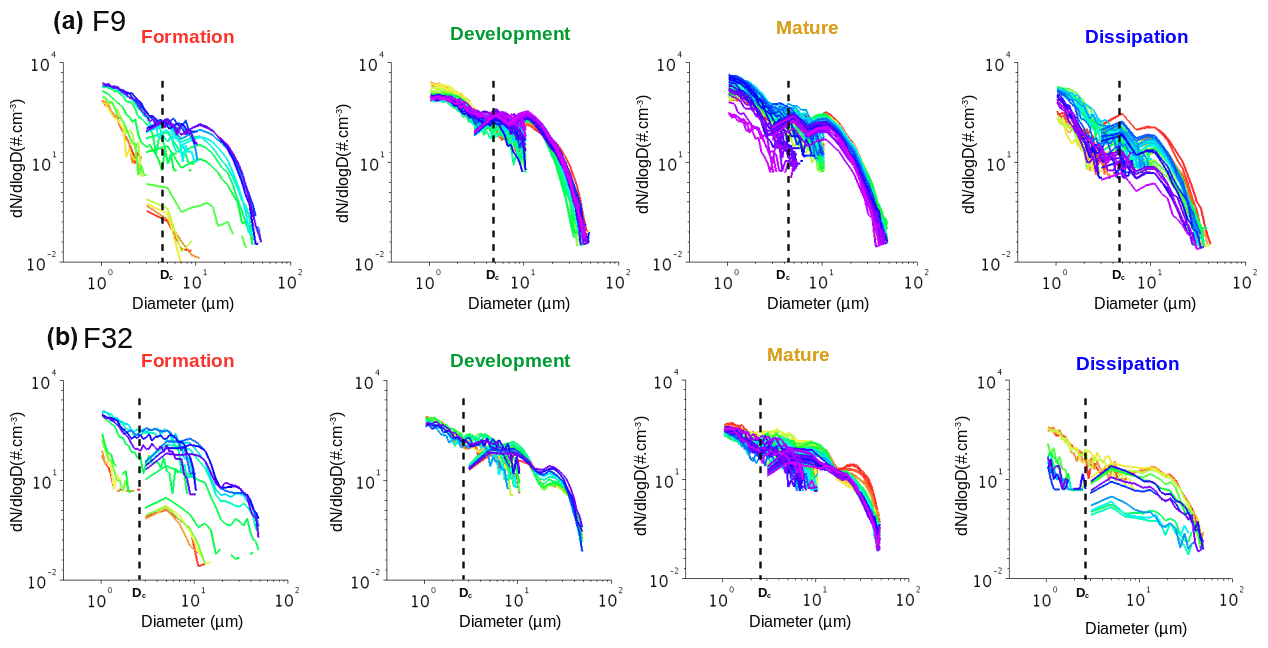
Figure 95-min averages of the aerosol and droplet size distributions (DSDs) during the fog life cycles of (a) F9 and (b) F32. Colors vary from red to violet according to time. Vertical dashed lines represent the activation diameter for each event as determined in Mazoyer et al., 2019.
3.5 Correlation of Nd and LWC
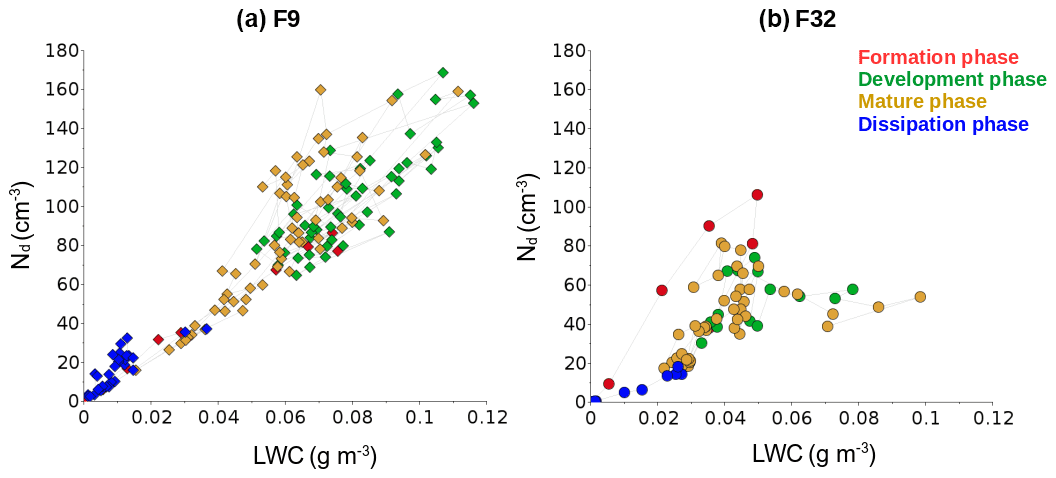
In an attempt to go further into the examination of the microphysical processes, we investigate the link between the rate of the LWC time increase with Nd (slope value of LWC =aNd) and the correlation coefficient that relates to this evolution. A low slope value suggests strong droplet growth by condensation/evaporation compared to new droplet activation/deactivation. A low correlation coefficient value suggests that this evolution is far from being linear so that processes other than activation/condensation and evaporation/deactivation occur. Figure 10 shows the slope value of the LWC =aNd time evolution against the correlation coefficient associated with this evolution for the 42 fog events at the different phases. In general, Nd positively correlates with LWC with a strong correlation factor of around 0.8. For eight events, the correlation factor between Nd and LWC is poor, with values lower than 0.7. Half of these cases are characterized by Deff larger than 17 µm (green points in Fig. 10). The other half of these cases are characterized by double-droplet modes (diamonds markers). Figure 11 shows the 5-min averaged Nd as a function of LWC for our two contrasting fog events characterized by a single- (F9) and a double-droplet mode (F32), respectively. In Fig. 10 (see the gray circles), Nd positively correlates with LWC for F9, whereas the correlation is poor for F32. In Sect. 3.4, we showed that the collision–coalescence process or Ostwald ripening process took place during F32, while it is more unlikely during F9. We also showed that F32 had more droplet removals through sedimentation than F9. Altogether, our observations indicate that the linear relationship between LWC and Nd is highly dependent on Deff. A positive correlation is found when fog droplets exhibit lower sizes. A likely explanation is that fog with higher Deff experience more sedimentation and collision–coalescence processes.
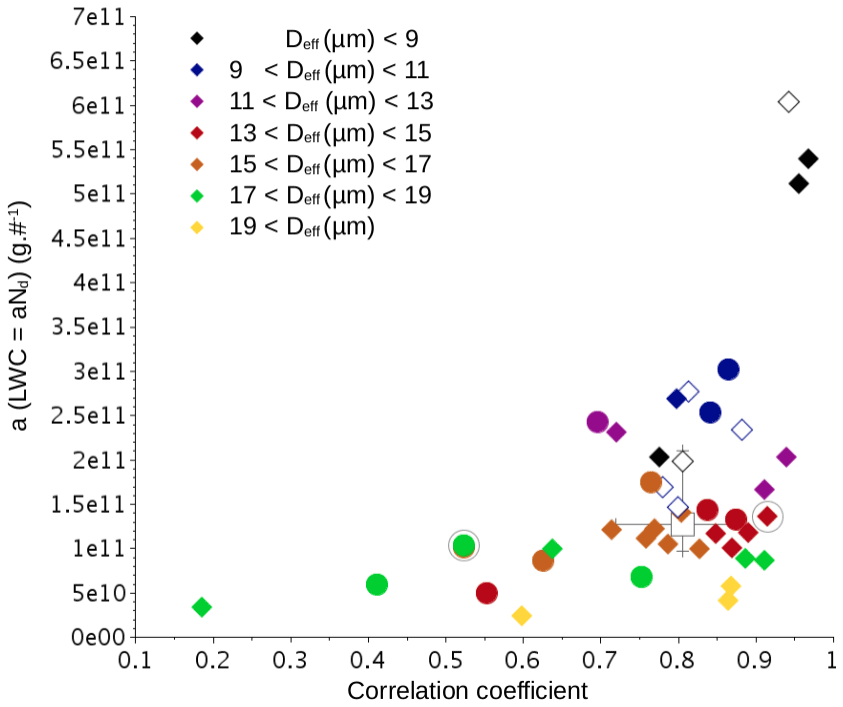
Figure 10Correlation coefficient between Nd and LWC for the 42 fog events. The color set indicates the range of Deff values. A fog with a single- and double-droplet mode is denoted by the circle and diamond markers, respectively. The square marker indicates the median value. F9 is the red point surrounded by a gray circle and F32 is the green point surrounded by a gray circle.
These results clearly contradict the observations in adiabatic cloud core where LWC vary with constant Nd (Rosenfeld and Lensky, 1998 and Pawlowska et al., 2006). The increase of LWC with increasing Nd in most of the fog events is mainly due to the continuous activation of aerosol into droplets (i.e., Sect. 3.4). When compared with a cloud, fog is usually formed under conditions with lower supersaturation values (Mazoyer et al., 2019). It is plausible that the low supersaturation limits the growth of droplets by condensation and the consumption of the water content. The excess water vapor could therefore become available for additional activation of aerosols into cloud droplets. However, once the fog has grown into the development phase, turbulent motions could also contribute to supersaturation at peak values (Boutle et al., 2018) and to new aerosol activation.
The results obtained in this study were obtained by analyzing DSD calculated with the unique combination of WELAS-2000 and FM-100 instruments. We followed the method presented in Mazoyer et al. (2019) to take advantage of both instrument limitations and resolution. A unique wet critical diameter of 3.8 µm was subsequently used for all our events. That means that we only consider particles larger than 3.8 µm. Previous observational studies of fog evolution commonly used the [2–50] µm diameter range (Wendisch et al., 1998; Garcıa-Garcıa et al., 2002; Gultepe and Milbrandt, 2007; Niu et al., 2010; Price, 2011; Liu et al., 2011; Lu et al., 2013; Zhao et al., 2013). However, they were not able to assess the wet critical diameter and may have considered hydrated non-activated particles that would result in increased concentration. To improve the representation of fog microphysical processes in NWP models, both species must be studied separately. Recently, Boutle et al. (2018) showed that this is of crucial importance and found a size limit of 6 µm for their specific LES case study. The wet critical diameter used was the median value determined for 23 fog events of the 42 studied here by Mazoyer et al. (2019). The variation range varies from 3.03 to 4.67 µm for the 25th and 75th percentiles, respectively. Thus, we may have neglected droplets or considered hydrated non-activated aerosols for some of our fog events. To validate this approximation, the linear regression slopes of LWC, Nd and Deff, calculated using this mean wet critical diameter, have been compared to the values calculated using the wet critical diameter determined individually for 23 fog events by Mazoyer et al., 2019. The linear regression slopes agree well with the two approaches (see Fig. A1 in Appendix), which suggest that, for what concerns our process analysis, the concentration and diameter of fog droplets can be estimated well using a single wet critical diameter.
A recent study by Ducongé et al. (2020) showed that non-local effects can be as important as local effects in valley-fog development. Therefore, non-local effects due to either topography, surface heterogeneities or mixed land cover around the SIRTA plateau may have an impact on the thickening and formation of fog at the SIRTA station. To limit the impact of non-local effects, only radiative and stratus-lowering fog have been selected in our analysis.
The study presented in this paper focused on the fog life cycle based on ground-based observations. Bergot et al. (2015) and Mazoyer et al. (2017) showed that surface heterogeneities can induce significant variabilities in the vertical distribution of the fog layer. Wærsted et al. (2017) observed the critical role of vertical structures in the fog layer for controlling fog top radiative cooling using remote-sensing instruments. Recent studies have underlined the necessity to add a detailed representation of activation processes along the vertical distribution (Egli et al., 2015; Stolaki et al., 2015; Mazoyer et al., 2019). Further field investigations of the vertical distribution of fog meteorological and microphysical properties are required to provide insight into the microphysical processes driving fog variability, and the relationship between turbulence,radiation, droplet activation and droplet evolution in order to improve the representation of process parameterization of fog events by NWP models.
This paper presents in situ observations of meteorological and microphysical properties for 42 fog events that occurred downwind of the urban area of Paris during the winters of 2010–2013. The analysis separates the fog events between their mechanism of formation, their vertical development and their evolutionary stages in order to examine the physical processes driving the fog life cycles. The median values of Nd, LWC and Deff vary over the ranges of 5–200 cm−3, 0.002–0.096 g cm−3 and 8–22 µm, respectively, which is in agreement with values reported for fog events in other regions. Variabilities in these parameters between the events and for individual events are attributed to the combination and interaction of microphysical, dynamical and radiative processes and surface conditions.
During the fog-formation phase, activation of aerosols into fog droplets and condensational growth are the dominant processes. The former process is responsible for the formation of smaller droplets, whereas the latter one is responsible for the growth of the larger droplets by condensation of water vapor due to the cooling of the air masses.
Approximately 10 % of the events remain as optically thin fog, whereas 90 % form optically thick fog. The increase of the wind speed and the subsequent turbulent motion has an important role in the vertical development of the fog. When compared to thick fog, thin fog displays lower Deff and Nd due to the presence of a residual dryer layer that counteracts their growth. In the thin-to-thick transition, additional vertical mixing of air masses causes the growth of fog droplets by collision–coalescence or condensation.
The initial DSD has a strong influence on the evolution of fog microphysical properties over time. Fog with a single- (Deff around 11 µm) and a double- (Deff around 11 and 22 µm) droplet mode are observed during the formation phase. At the development phase, most of the observed fog events experience a slight continued production and growth of fog droplets by activation and condensation processes. When fog is characterized by two modes, a mass transfer occurs from the smaller fog droplets into the larger droplets, likely due to collision–coalescence or Ostwald ripening processes. During the mature phase, evaporation due to surface warming induced by infrared radiation emitted by fog is the dominant process. Additional droplet removal through sedimentation is observed during this phase when fog events are characterized by two modes. Because of differences in the physical processes involved, the relationship between LWC and Nd is largely driven by DSD. Although a positive relation is found in most of the events due to continuous activation of aerosol into fog droplets, LWC varies at constant Nd in fog with large Deff (>17 µm) due to additional collision–coalescence and Ostwald ripening processes. Our results show that DSD has a large impact on the development of the fog layers due to its feedback on the physical processes driving the fog life cycle. The current NPW and LES models rely on bulk formulations of integral values (e.g., LWC and Nd) or assume DSD fixed in space and time to represent fog microphysical properties (Hong and Lim, 2006; Seity et al., 2011; Khain et al., 2015; Vié et al., 2016), but recent intercomparison of radiation fog models (Boutle et al., 2022) put forward the fog sensitivity to the shape of the cloud DSD. Explicitly simulating the changes of DSD in the fog layer by including advanced parameterizations of all relevant microphysical processes such as size-resolved collision–coalescence and Ostwald ripening, among others, could significantly improve fog forecasting models that often suffer from values of LWC that are too high (Philip et al., 2016; Pithani et al., 2019; Ducongé et al., 2020). This study also showed that fog experiences continuous activation during the formation and development phases. It is not consistent with the saturation adjustment often used in numerical models and use of different supersaturation parameterization has been shown to impact the fog life cycle (Schwenkel and Maronga, 2018; Gultepe et al., 2021; Boutle et al., 2022). This highlights the importance of a careful computation of fog supersaturation during fog evolution.

Figure A1Same as Fig. 8 using wet critical diameter of the 23 fog cases of Mazoyer et al. (2019).
Table A1Summary of information about the fog events analyzed in this study, including the fog event number (second column corresponds to fog studied in Mazoyer et al., 2019) and corresponding date, the time span of the fog event, the type of the fog event (STL for stratus-lowering fog, RAD for radiative fog, THICK for thick fog and THIN for thin fog), the number of droplet mode and the 25th, 50th and 75th percentiles of Nd, LWC and Deff as measured by the combination of the WELAs-2000 and the FM-100 on [3.79–50] µm range diameter.

Advanced data are available in Table A1. Data are available upon request to the authors.
This work is a part of the PhD of MM supervised by FB. MM, FB and CD analyzed the data and wrote the paper.
The contact author has declared that none of the authors has any competing interests.
Publisher’s note: Copernicus Publications remains neutral with regard to jurisdictional claims in published maps and institutional affiliations.
The authors are very grateful to all SIRTA operators and database managers.
This campaign was held in the framework of the PreViBOSS project, supported by DGA/DGIS. This research was partially funded by the European Commission's Seventh Framework Programme (FP7/2007-2013) under the SESAR WP 11.2.2 project, under grant agreement 11-120809-C.
This paper was edited by Barbara Ervens and reviewed by two anonymous referees.
Baker, M., Corbin, R., and Latham, J.: The influence of entrainment on the evolution of cloud droplet spectra: I. A model of inhomogeneous mixing, Q. J. Roy. Meteor. Soc., 106, 581–598, 1980. a
Bardoel, S. L., Horna Muñoz, D. V., Grachev, A. A., Krishnamurthy, R., Chamorro, L. P., and Fernando, H. J.: Fog formation related to gravity currents interacting with coastal topography, Bound.-Lay. Meteorol., 181, 499–521, 2021. a
Bergot, T.: Small-scale structure of radiation fog: a large-eddy simulation study, Q. J. Roy. Meteor. Soc., 139, 1099–1112, 2013. a, b, c
Bergot, T., Carrer, D., Noilhan, J., and Bougeault, P.: Improved site-specific numerical prediction of fog and low clouds: A feasibility study, Weather Forecast., 20, 627–646, 2005. a
Bergot, T., Escobar, J., and Masson, V.: Effect of small-scale surface heterogeneities and buildings on radiation fog: Large-eddy simulation study at Paris–Charles de Gaulle airport, Q. J. Roy. Meteor. Soc., 141, 285–298, 2015. a
Boers, R., Baltink, H. K., Hemink, H., Bosveld, F., and Moerman, M.: Ground-Based Observations and Modeling of the Visibility and Radar Reflectivity in a Radiation Fog Layer, J. Atmos. Ocean. Tech., 30, 288–300, 2013. a, b, c
Bott, A.: On the influence of the physico-chemical properties of aerosols on the life cycle of radiation fogs, Bound.-Lay. Meteorol., 56, 1–31, 1991. a, b
Boutle, I., Finnenkoetter, A., Lock, A., and Wells, H.: The London Model: forecasting fog at 333 m resolution, Q. J. Roy. Meteor. Soc., 142, 360–371, 2016. a
Boutle, I., Price, J., Kudzotsa, I., Kokkola, H., and Romakkaniemi, S.: Aerosol–fog interaction and the transition to well-mixed radiation fog, Atmos. Chem. Phys., 18, 7827–7840, https://doi.org/10.5194/acp-18-7827-2018, 2018. a, b, c, d, e, f
Boutle, I., Angevine, W., Bao, J.-W., Bergot, T., Bhattacharya, R., Bott, A., Ducongé, L., Forbes, R., Goecke, T., Grell, E., Hill, A., Igel, A. L., Kudzotsa, I., Lac, C., Maronga, B., Romakkaniemi, S., Schmidli, J., Schwenkel, J., Steeneveld, G.-J., and Vié, B.: Demistify: a large-eddy simulation (LES) and single-column model (SCM) intercomparison of radiation fog, Atmos. Chem. Phys., 22, 319–333, https://doi.org/10.5194/acp-22-319-2022, 2022. a, b, c
Burnet, F., Gomes, L., Haeffelin, M., Dupont, J., and Elias, T.: Analysis of the microphysical structures of fog during the ParisFog project, ICCP Leipzig, 2012. a
Choularton, T., Fullarton, G., Latham, J., Mill, C., Smith, M., and Stromberg, I.: A field study of radiation fog in Meppen, West Germany, Q. J. Roy. Meteor. Soc., 107, 381–394, 1981. a, b, c
Degefie, D., El-Madany, T.-S., Hejkal, J., Held, M., Dupont, J.-C., Haeffelin, M., and Klemm, O.: Microphysics and energy and water fluxes of various fog types at SIRTA, France, Atmos. Res., 151, 162–175, 2015. a, b
Ducongé, L., Lac, C., Vié, B., Bergot, T., and Price, J.: Fog in heterogeneous environments: the relative importance of local and non-local processes on radiative-advective fog formation, Q. J. Roy. Meteor. Soc., 146, 2522–2546, 2020. a, b, c, d
Dupont, J., Haeffelin, M., Stolaki, S., and Elias, T.: Analysis of dynamical and thermal processes driving fog and quasi-fog life cycles using the 2010–2013 ParisFog dataset, Pure Appl. Geophys., 173, 1337–1358, 2016. a, b, c, d
Duynkerke, P. G.: Radiation fog: A comparison of model simulation with detailed observations, Month. Weather Rev., 119, 324–341, 1991. a
Egli, S., Maier, F., Bendix, J., and Thies, B.: Vertical distribution of microphysical properties in radiation fogs – A case study, Atmos. Res., 151, 130–145, 2015. a
Elias, T., Haeffelin, M., Drobinski, P., Gomes, L., Rangognio, J., Bergot, T., Chazette, P., Raut, J.-C., and Colomb, M.: Particulate contribution to extinction of visible radiation: Pollution, haze, and fog, Atmos. Res., 92, 443–454, 2009. a
Elias, T., Jolivet, D., Dupont, J.-C., Haeffelin, M., and Burnet, F.: Preliminary results of the PreViBOSS project: description of the fog life cycle by ground-based and satellite observation, in: SPIE Remote Sensing, International Society for Optics and Photonics, 853406–853406, 2012. a
Elias, T., Jolivet, D., Mazoyer, M., and Dupont, J.-C.: Favourable and Unfavourable Scenarii of Radiative Fog Formation Defined by Ground-Based and Satellite Observation Data, Aerosol Air Qual. Res., 18, 145–164, 2018. a
Frank, G., Martinsson, B. G., Cederfelt, S.-I., Berg, O. H., Swietlicki, E., Wendisch, M., Yuskiewicz, B., Heintzenberg, J., Wiedensohler, A., Orsini, D., Stratmann, F., Laj, P., and Ricci, L.: Droplet formation and growth in polluted fogs, Contributions to Atmospheric Physics, 71, 65–85, 1998.
Garcıa-Garcıa, F., Virafuentes, U., and Montero-Martınez, G.: Fine-scale measurements of fog-droplet concentrations: A preliminary assessment, Atmos. Res., 64, 179–189, 2002. a, b
Gerber, H.: Supersaturation and droplet spectral evolution in fog, J. Atmos. Sci., 48, 2569–2588, 1991. a, b, c
Goodman, J.: The microstructure of California coastal fog and stratus, J. Appl. Meteorol., 16, 1056–1067, 1977. a
Gultepe, I. and Milbrandt, J.: Microphysical observations and mesoscale model simulation of a warm fog case during FRAM project, in: Fog and Boundary Layer Clouds: Fog Visibility and Forecasting, Springer, 1161–1178, 2007. a
Gultepe, I., Milbrandt, J. A., and Zhou, B.: Marine fog: A review on microphysics and visibility prediction, in: Marine Fog: Challenges and Advancements in Observations, Modeling, and Forecasting, Springer, 345–394, 2017. a
Gultepe, I., Fernando, H. J., Pardyjak, E., Wang, Q., Hocut, C., Creegan, E., Hoch, S., Flagg, D., Scanland, N., Desjardins, S., et al.: C-FOG Field Campaign for Coastal Fog: Emphases on Microphysics versus Dynamics., in: Geophysical Research Abstracts, Vol. 21, 2019. a
Gultepe, I., Heymsfield, A., Fernando, H., Pardyjak, E., Dorman, C., Wang, Q., Creegan, E., Hoch, S., Flagg, D., Yamaguchi, R., et al.: A review of coastal fog microphysics during C-FOG, Bound.-Lay. Meteorol., 181, 1–39, https://doi.org/10.3390/atmos11010012, 2021. a, b
Haeffelin, M., Barthès, L., Bock, O., Boitel, C., Bony, S., Bouniol, D., Chepfer, H., Chiriaco, M., Cuesta, J., Delanoë, J., et al.: SIRTA, a ground-based atmospheric observatory for cloud and aerosol research, Ann. Geophys., 23, 253–275, 2005. a
Haeffelin, M., Bergot, T., Elias, T., Tardif, R., Carrer, D., Chazette, P., Colomb, M., Drobinski, P., Dupont, E., Dupont, J., et al.: PARISFOG: shedding new light on fog physical processes, B. Am. Meteorol. Soc., 91, 767–783, 2010. a
Hong, S.-Y. and Lim, J.-O. J.: The WRF single-moment 6-class microphysics scheme (WSM6), Asia-Pac. J. Atmos. Sci., 42, 129–151, 2006. a
Karimi, M.: Direct Numerical Simulation of Fog: The Sensitivity of a Dissipation Phase to Environmental Conditions, Atmosphere, 11, 198 pp., 2020. a
Khain, A., Beheng, K., Heymsfield, A., Korolev, A., Krichak, S., Levin, Z., Pinsky, M., Phillips, V., Prabhakaran, T., Teller, A., et al.: Representation of microphysical processes in cloud-resolving models: Spectral (bin) microphysics versus bulk parameterization, Rev. Geophys., 53, 247–322, 2015. a
Koračin, D., Lewis, J., Thompson, W. T., Dorman, C. E., and Businger, J. A.: Transition of stratus into fog along the California coast: Observations and modeling, J. Atmos. Sci., 58, 1714–1731, 2001. a
Kulkarni, R., Jenamani, R. K., Pithani, P., Konwar, M., Nigam, N., and Ghude, S. D.: Loss to Aviation Economy Due to Winter Fog in New Delhi during the Winter of 2011–2016, Atmosphere, 10, 198 pp., 2019. a
Kutty, S. G., Dimri, A., and Gultepe, I.: Physical Processes Affecting Radiation Fog Based on WRF Simulations and Validation, Pure Appl. Geophys., 10, 4265–4288, 2021. a
Liu, D., Yang, J., Niu, S., and Li, Z.: On the evolution and structure of a radiation fog event in Nanjing, Adv. Atmos. Sci., 28, 223–237, 2011. a, b, c, d, e
Liu, Q., Wu, B., Wang, Z., and Hao, T.: Fog Droplet Size Distribution and the Interaction between Fog Droplets and Fine Particles during Dense Fog in Tianjin, China, Atmosphere, 11, 258 pp., 2020. a
Lu, C., Liu, Y., Niu, S., Zhao, L., Yu, H., and Cheng, M.: Examination of microphysical relationships and corresponding microphysical processes in warm fogs, Acta Meteorol. Sin., 27, 832–848, 2013. a, b, c
Maalick, Z., Kühn, T., Korhonen, H., Kokkola, H., Laaksonen, A., and Romakkaniemi, S.: Effect of aerosol concentration and absorbing aerosol on the radiation fog life cycle, Atmos. Environ., 133, 26–33, 2016. a
Martinet, P., Cimini, D., Burnet, F., Ménétrier, B., Michel, Y., and Unger, V.: Improvement of numerical weather prediction model analysis during fog conditions through the assimilation of ground-based microwave radiometer observations: a 1D-Var study, Atmos. Meas. Tech., 13, 6593–6611, https://doi.org/10.5194/amt-13-6593-2020, 2020. a
Mazoyer, M., Lac, C., Thouron, O., Bergot, T., Masson, V., and Musson-Genon, L.: Large eddy simulation of radiation fog: impact of dynamics on the fog life cycle, Atmos. Chem. Phys., 17, 13017–13035, https://doi.org/10.5194/acp-17-13017-2017, 2017. a, b, c, d, e
Mazoyer, M., Burnet, F., Denjean, C., Roberts, G. C., Haeffelin, M., Dupont, J.-C., and Elias, T.: Experimental study of the aerosol impact on fog microphysics, Atmos. Chem. Phys., 19, 4323–4344, https://doi.org/10.5194/acp-19-4323-2019, 2019. a, b, c, d, e, f, g, h, i, j, k, l, m
Nakanishi, M.: Large-eddy simulation of radiation fog, Bound.-Lay. Meteorol., 94, 461–493, 2000. a
Niu, S., Lu, C., Liu, Y., Zhao, L., Lü, J., and Yang, J.: Analysis of the microphysical structure of heavy fog using a droplet spectrometer: A case study, Adv. Atmos. Sci., 27, 1259–1275, 2010. a, b, c
Okita, T.: Observations of the vertical structure of a stratus cloud and radiation fogs in relation to the mechanism of drizzle formation, Tellus, 14, 310–322, 1962. a
Pawlowska, H., Grabowski, W. W., and Brenguier, J.-L.: Observations of the width of cloud droplet spectra in stratocumulus, Geophys. Res. Lett., 33, https://doi.org/10.1029/2006GL026841, 2006. a
Philip, A., Bergot, T., Bouteloup, Y., and Bouyssel, F.: The impact of vertical resolution on fog forecasting in the kilometric-scale model arome: a case study and statistics, Weather Forecast., 31, 1655–1671, 2016. a
Pilié, R., Mack, E., Kocmond, W., Rogers, C., and Eadie, W.: The life cycle of valley fog, Part I: Micrometeorological characteristics, J. Appl. Meteorol., 14, 347–363, 1975. a, b, c, d, e, f, g
Pinnick, R. G., Hoihjelle, D., Fernandez, G., Stenmark, E., Lindberg, J., Hoidale, G., and Jennings, S.: Vertical structure in atmospheric fog and haze and its effects on visible and infrared extinction, J. Atmos. Sci., 35, 2020–2032, 1978. a
Pithani, P., Ghude, S. D., Chennu, V. N., Kulkarni, R. G., Steeneveld, G.-J., Sharma, A., Prabhakaran, T., Chate, D., Gultepe, I., Jenamani, R., et al.: WRF model prediction of a dense fog event occurred during the winter fog experiment (WIFEX), Pure Appl. Geophys., 176, 1827–1846, 2019. a
Porson, A., Price, J., Lock, A., and Clark, P.: Radiation fog. Part II: Large-eddy simulations in very stable conditions, Bound.-Lay. Meteorol., 139, 193–224, 2011. a
Price, J.: Radiation fog. Part I: observations of stability and drop size distributions, Bound.-Lay. Meteorol., 139, 167–191, 2011. a, b, c
Price, J.: On the formation and development of radiation fog: an observational study, Bound.-Lay. Meteorol., 172, 167–197, 2019. a, b
Price, J., Lane, S., Boutle, I., Smith, D., Bergot, T., Lac, C., Duconge, L., McGregor, J., Kerr-Munslow, A., Pickering, M., et al.: LANFEX: a field and modeling study to improve our understanding and forecasting of radiation fog, B. Am. Meteorol. Soc., 99, 2061–2077, 2018. a
Rodhe, B.: The effect of turbulence on fog formation, Tellus, 14, 49–86, 1962. a
Rosenfeld, D. and Lensky, I. M.: Satellite-based insights into precipitation formation processes in continental and maritime convective clouds, B. Am. Meteorol. Soc., 79, 2457–2476, 1998. a
Schwenkel, J. and Maronga, B.: Large-eddy simulation of radiation fog with comprehensive two-moment bulk microphysics: impact of different aerosol activation and condensation parameterizations, Atmos. Chem. Phys., 19, 7165–7181, https://doi.org/10.5194/acp-19-7165-2019, 2019. a, b, c, d
Seity, Y., Brousseau, P., Malardel, S., Hello, G., Bénard, P., Bouttier, F., Lac, C., and Masson, V.: The AROME-France convective-scale operational model, Month. Weather Rev., 139, 976–991, 2011. a
Stolaki, S., Haeffelin, M., Lac, C., Dupont, J.-C., Elias, T., and Masson, V.: Influence of aerosols on the life cycle of a radiation fog event, A numerical and observational study, Atmos. Res., 151, 146–161, 2015. a, b, c
Tardif, R. and Rasmussen, R.: Event-based climatology and typology of fog in the New York City region, J. Appl. Meteorol. Clim., 46, 1141–1168, 2007. a, b
Tav, J., Masson, O., Burnet, F., Paulat, P., Bourrianne, T., Conil, S., and Pourcelot, L.: Determination of Fog-Droplet Deposition Velocity from a Simple Weighing Method, Aerosol Air Qual. Res., 18, 103–113, 2018. a
Van der Velde, I., Steeneveld, G., Wichers Schreur, B., and Holtslag, A.: Modeling and forecasting the onset and duration of severe radiation fog under frost conditions, Monthly Weather Rev., 138, 4237–4253, 2010. a
Vié, B., Pinty, J.-P., Berthet, S., and Leriche, M.: LIMA (v1.0): A quasi two-moment microphysical scheme driven by a multimodal population of cloud condensation and ice freezing nuclei, Geosci. Model Dev., 9, 567–586, https://doi.org/10.5194/gmd-9-567-2016, 2016. a
Wærsted, E. G., Haeffelin, M., Dupont, J.-C., Delanoë, J., and Dubuisson, P.: Radiation in fog: quantification of the impact on fog liquid water based on ground-based remote sensing, Atmos. Chem. Phys., 17, 10811–10835, https://doi.org/10.5194/acp-17-10811-2017, 2017. a
Wærsted, E. G., Haeffelin, M., Steeneveld, G.-J., and Dupont, J.-C.: Understanding the dissipation of continental fog by analysing the LWP budget using idealized LES and in situ observations, Q. J. Roy. Meteor. Soc., 145, 784–804, 2019. a
Wendisch, M., Mertes, S., Heintzenberg, J., Wiedensohler, A., Schell, D., Wobrock, W., Frank, G., Martinsson, B., Fuzzi, S., Orsi, G., et al.: Drop size distribution and LWC in Po Valley fog, Contributions to Atmospheric Physics, 71, 87–100, 1998. a, b, c, d, e
Xue, Y., Wang, L.-P., and Grabowski, W. W.: Growth of cloud droplets by turbulent collision-coalescence, J. Atmos. Sci., 65, 331–356, 2008. a, b
Yang, F., Kollias, P., Shaw, R. A., and Vogelmann, A. M.: Cloud droplet size distribution broadening during diffusional growth: ripening amplified by deactivation and reactivation, Atmos. Chem. Phys., 18, 7313–7328, https://doi.org/10.5194/acp-18-7313-2018, 2018. a, b, c
Zhao, L., Niu, S., Zhang, Y., and Xu, F.: Microphysical characteristics of sea fog over the east coast of Leizhou Peninsula, China, Adv. Atmos. Sci., 30, 1154–1172, 2013. a, b, c, d, e