the Creative Commons Attribution 4.0 License.
the Creative Commons Attribution 4.0 License.
 | 02 Sep 2022
What caused the interdecadal shift in the El Niño–Southern Oscillation (ENSO) impact on dust mass concentration over northwestern South Asia?
Lamei Shi
Jiahua Zhang
Da Zhang
Jingwen Wang
Xianglei Meng
Yuqin Liu
Fengmei Yao
Changes in large-scale circulation, especially El Niño–Southern Oscillation (ENSO), have significant impacts on dust activities over the dust source and downwind regions. However, these impacts present an interdecadal pattern, and it remains less clear which factors lead to the interdecadal variability of the ENSO impact on dust activities over northwestern South Asia, although previous studies have discussed the response of interannual dust activities over northwestern South Asia to the ENSO circle. Based on the linear regression model and MERRA-2 atmospheric aerosol reanalysis data, this study investigated the interdecadal variability of the ENSO impact on dust activities as well as the associated possible atmospheric drivers under two different warming phases over northwestern South Asia. Results indicated that the relationship between ENSO and dust column mass density (DUCMASS) experienced an obvious shift from the accelerated global warming period (1982–1996) to the warming hiatus period (2000–2014). The change in Atlantic and Indian Ocean sea surface temperature anomaly (SSTA) patterns weakened the impact of ENSO on dust activities over northwestern South Asia during 1982–1996, while the change in Pacific Decadal Oscillation (PDO) strengthened ENSO's effect when it was in phase with ENSO. Both the Atlantic and Indian Ocean SSTA patterns were modulated by the duration of ENSO events (i.e., continuing and emerging ENSO). This study provides new insights into numerical simulation involving the influence of atmospheric teleconnections on the variability of dust activities and their influence mechanisms.
- Article
(24654 KB) - Full-text XML
-
Supplement
(1312 KB) - BibTeX
- EndNote


Dust aerosols are attracting increasing concern due to their adverse impacts on human health (Chen et al., 2004; Bozlaker et al., 2013; Erel et al., 2006; Kaiser and Granmar, 2005; Poulsen et al., 1995; Sanchez de la Campa et al., 2013; Schulz et al., 2012) and environmental problems (Avila, 1998; Razakov and Kosnazarov, 1996; Behrooz et al., 2017). Dust aerosols can also influence the Earth's radiation budget balance and climate change through direct and indirect effects (Mahowald et al., 2014; Miller and Tegen, 1998). Dust aerosols can reflect incoming solar radiation and cool the surface, which are known as the direct effects (Mahowald et al., 2006; Tegen et al., 1996); they can also affect the cloud droplet size, cloud albedo, and lifespan by forming cloud condensation nuclei and ice nuclei, which are known as the indirect effects (Hansen et al., 1997). The northwestern Indian subcontinent, which is the most arid and semiarid area of South Asia, suffers heavy and frequent dust storms in summer due to extremely dry climate and strong winds (Jin and Wang, 2018). Those dusts can travel long distances to northern India and the Arabian Sea, degrading air quality (Mahowald et al., 2010) and modifying ocean biogeochemistry processes (Richon et al., 2018; Singh et al., 2008). In particular, dust aerosols can change the local radiation budget, circulations, and Indian summer monsoon rainfall through absorption and scattering of solar radiation (Wu et al., 2018; Jin et al., 2021; Mahowald et al., 2006; Tegen et al., 1996). The mineral dust over northwestern South Asia is closely associated with the long-term variation of global climate (Bollasina et al., 2011; Jin et al., 2018; Banerjee et al., 2019). To better understand such feedback and give early warning to reduce disasters and losses caused by dust events, it is important to find out the controlling factors of the dust column mass density (DUCMASS) and its long-term variation.
El Niño–Southern Oscillation (ENSO), as a periodic fluctuation in sea surface temperature (SST) and the air pressure across the equatorial Pacific Ocean, is the primary large-scale driver of dust loading over the global dust source region (Trenberth et al., 2014). Prospero and Nees (1986) found that ENSO-related large-scale atmospheric circulation changes led to the increase in winter dust concentration over northern Africa. Xi and Sokolik (2016) indicated that, in La Niña years, the precipitation and soil moisture over central Asia decreased and caused poor vegetation conditions and heavy drought conditions, which strengthened dust activities. Yu et al. (2015) suggested that La Niña events provided favorable conditions for dust activities over Saudi Arabia. However, Banerjee and Kumar (2016) proposed that the low-level southwesterly winds and high-level westerly winds accompanied by La Niña events were the main factor that contributed to the elevated dust levels over the Arabian Peninsula. Abish and Mohanakumar (2013) pointed out that strengthened westerly circulation related to El Niño increased the dust transmission from the Middle East to the Indian subcontinent. Simultaneously, the impacts of ENSO on dust activities were also modulated by other atmospheric factors; e.g., Pacific Decadal Oscillation (PDO) could strengthen the effect of ENSO when it was in phase with ENSO (He and Wang, 2013; Wang et al., 2008, 2014). The spring dust index over northern China in the years when negative AO and El Niño occurred synchronously was significantly higher than that in the years when positive AO and La Niña were concurrent (Liu et al., 2020; Lee et al., 2015). IOD could also influence the dust activities over the northwestern Indian Ocean by adjusting the El Niño-related water vapor conditions (Banerjee and Kumar, 2016).
ENSO exhibits profound impacts on the global climate. Nevertheless, the Earth's climate is varying, and ENSO, including its feedback and influences on the changing global climate, is also experiencing significant changes (Yang and Jiang, 2014; Yuan and Yang, 2012; Weng et al., 2007; Weare et al., 1976; Yu and Kao, 2007; Ashok et al., 2007). In the mid-1970s, an interdecadal climate regime shift was observed in the large-scale boreal winter circulation pattern over the North Pacific (Graham, 1994; Nitta and Yamada, 1989; Trenberth and Hurrell, 1994). Another remarkable climate change was observed in the early 21st century; i.e., an accelerated global warming prevailed before the late 1990s, and a warming hiatus dominated after that (Easterling and Wehner, 2009; Fyfe et al., 2011, 2013). After 2013, the global warming hiatus came to an end due to a persistent warm condition over the equatorial Pacific between March 2014 and May 2016 (Hu and Fedorov, 2017). Concurrent with the Pacific climate shift, the large-scale circulation pattern and its atmospheric teleconnection also exhibited an interdecadal change; e.g., the correlation between El Niño and rainfall over India turned out to be insignificant from the late 1970s. Simultaneously, the relationship between ENSO and monsoon also weakened around this turning point (Kumar et al., 1999). Two influence mechanisms were proposed to explain this weakened ENSO–monsoon relationship. One was the varied location of the Walker circulation that adjusted the monsoon rainfall over the Indian region; the other was the temperature change over Eurasia that modulated the land–sea thermal gradient. Besides, the impact of the Atlantic Ocean pattern on the monsoon circulation over the Indian Ocean became stronger from the late 1970s as the influence of the tropical Pacific was reduced (Srivastava et al., 2019; Sabeerali et al., 2019; Kucharski et al., 2007). This in turn impacted the circulation responsible for dust uplift and transport.
It was reported that the effect of ENSO on Indian summer monsoon rainfall (ISMR), which was an important modulator of DUCMASS, experienced a remarkable interdecadal change, and many factors may cause this transition (Yang and Huang, 2021). Till now, the interdecadal variability in the links of DUCMASS over northwestern South Asia with ENSO has not been fully investigated as compared to the northern African and western Asian counterparts (Yu et al., 2015). In addition, though many factors have been proven to influence the short-term (e.g., interannual-scale) variation of the relationship between ENSO and dust activities over South Asia, their effects on the long-term (e.g., interdecadal-scale) change are still unclear. Cai et al. (2014) pointed out that global warming will have a significant impact on ENSO. The extreme El Niño events will become more frequent under the changes in atmospheric convention in the next half of the 21st century. Thus, understanding the physical mechanism of the shifting ENSO–DUCMASS relationship is of profound importance for the forecast of dust trends in the future climate change scenario. This study aims to investigate the large-scale atmospheric factors that contribute to the interdecadal variability of the ENSO impact on DUCMASS over northwestern South Asia.
The paper is organized into the following structure: Sect. 2 describes the datasets and methods. Sect. 3 presents factors that influence the interdecadal change in the relationship between DUCMASS and the wintertime Niño-3 index. Sect. 4 discusses the deficiency and prospects of this study, and the conclusions are given in Sect. 5.
2.1 Study area
The main dust source over South Asia is a large arid region in the northwestern part of the Indian subcontinent, which stretches from India to Pakistan. Most of the dust aerosols over this region come from the Thar Desert. The southeastern part of the Thar Desert lies between the Aravalli Hills. The desert extends as far as the Punjab Plain in the north and northeast, the alluvial plains of the Indus River in the west and northwest, and the Great Rann of Kutch along the western coast. The desert presents an undulating surface, with high and low sand dunes separated by sandy plains and low barren hills. The soils mainly consist of desert soils, red desertic soils, sierozems, the red and yellow soils of the foothills, the saline soils of the depressions, and the lithosols (shallow weathered soils) and Regosols (soft loose soils) found in the hills. The subtropical desert climate here results from persistent high pressure and subsidence. The prevailing southwesterly monsoon winds from the Indian Ocean that bring rain to much of the Indian subcontinent in summer tend to bypass the Thar to the east. The soils are generally infertile and overblown with sand due to severe wind erosion (https://www.britannica.com/place/Thar-Desert, last access: 18 December 2019). The amount of annual rainfall in the desert is low, ranging from about 100 mm or less in the west to about 500 mm in the east. Almost 90 % of the annual rainfall occurs in the seasonal southwesterly monsoon from July to September, while the prevailing wind is a dry northeasterly monsoon during the other seasons. Dust storms and dust-raising winds are common from May to July (Chauhan, 2003). Thus, the DUCMASS used in this study and averaged from June to July and May is neglected to eliminate the disturbance of seasonal climatological differences. Analysis is carried out over the dust source in northwestern South Asia (65–82∘ E, 24–32∘ N), as shown in Fig. 1. All variables involving spatial averages are taken from this region unless stated otherwise.
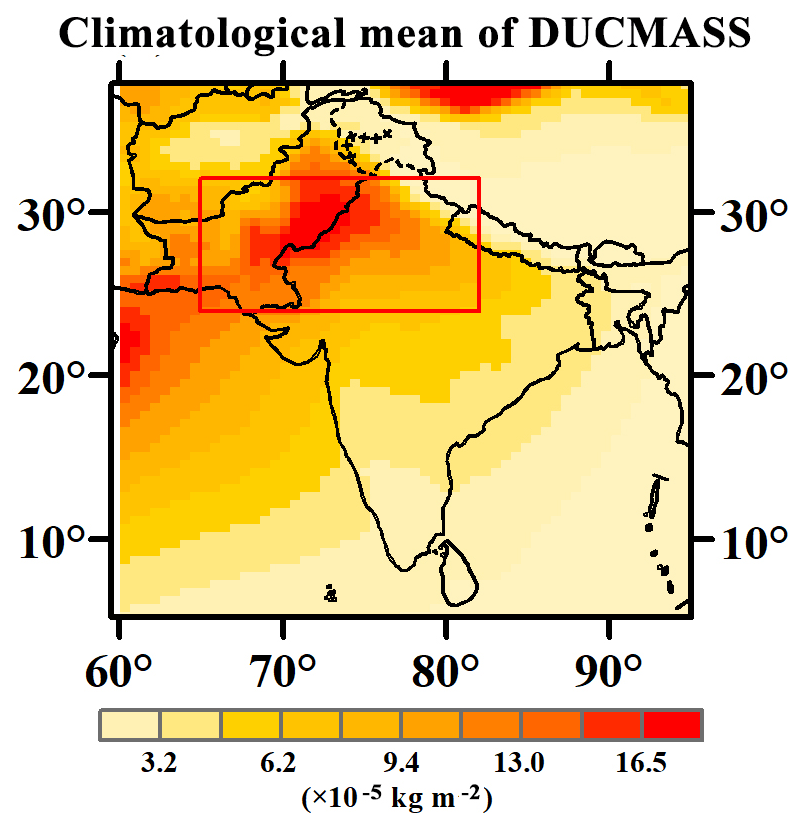
Figure 1Climatological mean DUCMASS over South Asia based on the MERRA-2 dataset. The dust source over northwestern South Asia is marked with a red rectangle.
2.2 Datasets
2.2.1 Dust concentration
Dust column mass density from 1982 to 2014 was obtained from the Modern-Era Retrospective Analysis for Research and Applications, version 2 (MERRA-2). MERRA-2 is produced by the Goddard Earth Observing System-Data Assimilation System (GEOS-DAS, version 5.12.4) based on the GEOS-5 climate model and the Gridpoint Statistical Interpolation (GSI) analysis scheme (Gelaro et al., 2017). Extensive satellite data are integrated into MERRA-2 to estimate dust concentration (Veselovskii et al., 2018; Randles et al., 2017). The dust products were comprehensively validated using the results of ground-based observation, satellite measurements, and numerical simulation (Buchard et al., 2017; Randles et al., 2017). They have been widely applied to studies on global environment and climate change (He et al., 2019; Randles et al., 2017). The variable “Dust Column Mass Density-PM2.5” (DUCMASS25) with a spatial resolution of 0.625∘ × 0.5∘ (longitude × latitude) used in this study is from the dataset of “tavgM_2d_aer_Nx”. The time series of the DUCMASS25 dataset was compared with that of the DUCMASS dataset to find that the time series of DUCMASS25 and its association with the Niño index showed the same change pattern as that of DUCMASS. Only the results acquired by DUCMASS25 were presented in this study.
2.2.2 Land and sea surface temperature
To explore the possible influence of SST on the South Asian dust activity, we used three SST datasets from 1981 to 2014 for comparison: (1) the National Oceanic and Atmospheric Administration (NOAA) Extended Reconstructed SST (ERSST) version 5 (Huang et al., 2017) that is available at 2∘ × 2∘ spatial resolution is used for analysis, with (2) Centennial in situ Observation-Based Estimates (COBE) version 2 SST data at 1∘ × 1∘ spatial resolution (Hirahara et al., 2014) and the (3) Hadley Centre Global Sea Ice and Sea Surface Temperature (HadISST1.1) dataset produced by the Met Office, starting from 1870 up to the present with a horizontal resolution of 1∘ × 1∘ (Rayner et al., 2003), while the land–sea thermal contrast was calculated from the Hadley Centre Climate Research Unit Temperature version 5.0.1.0 (HadCRUT5) data from 1981 to 2014, which are a blend of the Climatic Research Unit land-surface air temperature dataset (CRUTEM5) and the Hadley Centre sea-surface temperature (HadSST4) dataset (Osborn et al., 2021). The longitude and latitude of the SST index involved in this study are shown in Table 1.
Table 1Longitude and latitude of the SST index used in this study.

2.2.3 Large-scale climate indices
Three monthly Niño indices, Niño-3, Niño-3.4, and Niño-4, from 1981 to 2014, which monitor the SST anomalies averaged across the eastern equatorial Pacific, the Pacific from the dateline to the South American coast, and the central equatorial Pacific, respectively, were used to analyze their links with DUCMASS over northwestern South Asia. Kinter et al. (2002) pointed out that November–January is the peak season for El Niño/La Niña, and thus the average Niño index from (−1) November to (0) January was used. Only one Niño index that showed the highest correlation coefficient was retained in this study, i.e., Niño-3. The time series of ENSO was represented by Niño-3, also referred to as ENSO. The large-scale climate indices, such as PDO and IOD, were also used to explore the potential factors that contributed to the interdecadal shift in the ENSO–DUCMASS relationship. All those indices were from the Climate Prediction Center of the National Oceanic and Atmospheric Administration (NOAA/CPC).
2.3 Method
In this study, we compared the impact of ENSO on DUCMASS over northwestern South Asia under two different warming epochs and investigated the potential global change drivers of the shift in the ENSO–DUCMASS relationship. The global warming was separated into the accelerated warming period from 1982 to 1996 (P1) and the warming hiatus period from 2000 to 2014 (P2). The year 2014 was added to the warming hiatus period to keep the lengths of those two periods consistent. This classification was not controversial since the ENSO year stated in this study spanned from the antecedent November to the current January.
2.3.1 Contribution of factors to the relationship
The contribution of X (Indian Ocean SSTA, Atlantic SSTA gradient index, and PDO) modifying the ENSO–DUCMASS relationship was defined as a sliding regression of X onto the Niño-3 index multiplied by the sliding regression of DUCMASS onto X with Niño-3 removed (Yang and Huang, 2021).
2.3.2 Signal removal method
The ENSO signals were removed from the oceanic SSTA pattern when analyzing spatial coupling and the regression mode between the oceanic SSTA pattern and DUCMASS as well as local surface conditions (precipitation, soil moisture, land cover, wind). Simultaneously, the oceanic SSTA signals were removed from ENSO when calculating the sliding correlation between ENSO and DUCMASS. In this study, the residual time series based on the linear regression method were used to represent the ENSO (or oceanic SSTA index)-independent components (Yang and Huang, 2021), as shown in Eq. (1):
where ξremove is the time series of variable ξ with Z removed, ξ is the time series of the original variable, Z is the time series of the related signal that needs to be removed, cov indicates the covariance between two variables, and var indicates the variance of ENSO.
2.3.3 Coupled spatial pattern analysis
The maximum covariance analysis (MCA) is a useful tool for isolating the most coherent pairs of spatial patterns and their associated time series by performing an eigenanalysis of the temporal covariance matrix between two geophysical fields (von Storch and Zwiers, 1999). The MCA method was used to analyze the coupled patterns between DUCMASS and oceanic SSTA.
2.3.4 Definition of different types of ENSO
Following Yang and Huang (2021), the emerging (EM) and continuing (CT) ENSO were defined based on the 3-month running mean of the Niño-3 index. Two situations for the CT ENSO were considered, i.e., the slowly decaying events and the developing events since the previous winter. For the slowly decaying situation, the CT ENSO was identified when the average Niño-3 of (−1) October–(0) January was greater than 0.5 (below −0.5) standard deviation (SD) and became greater than 0.5 (below –0.5) SD in a single month during (0) March–(0) May and remained positive (negative) during (0) June–(0) September. For the developing events since the previous winter, a CT ENSO was identified when Niño-3 was greater than 0.75 (below −0.75) SD in any month from (−1) October to (0) May, accompanied by positive (negative) values for 8 single months, and the average Niño-3 of (0) June–(0) September was greater than 0.5 (below −0.5) SD. To acquire more available samples in the study period, all the ENSO years that were not defined as CT ENSO were identified as an EM ENSO year in this study, which was different from Yang and Huang (2021). Based on this definition, the CT El Niño years during 1982–2014 included 1982, 1983, and 1987, CT La Niña years included 1984, 1985, 1989, 1996, 1999, 2000, and 2011, EM El Niño years included 1995, 1998, 2003, 2005, 2007, and 2010, and EM La Niña years included 2008 and 2012.
In this study, “(0) month” represented the year concurrent with the year when DUCMASS was acquired and “(−1) month” represented the preceding year.
3.1 Observed interdecadal change in the impact of ENSO on DUCMASS
In the present study, we found that the DUCMASS–Niño-3 relationship experienced an interdecadal transition at around 1999/2000. Based on the 15-year sliding correlation from 1982 to 2014 (Fig. 4a), the DUCMASS–Niño-3 relationship was weak before the early 2000s and became stronger after that. Specifically, the winter Niño-3 index – −1 November–(0) January – presented a significant negative relationship (R = −0.68, p < 0.01) with DUCMASS during 2000–2014 (P2), while no significant correlation (R = −0.41, p > 0.05) was observed in 1982–1996 (P1), as shown in Fig. 2.
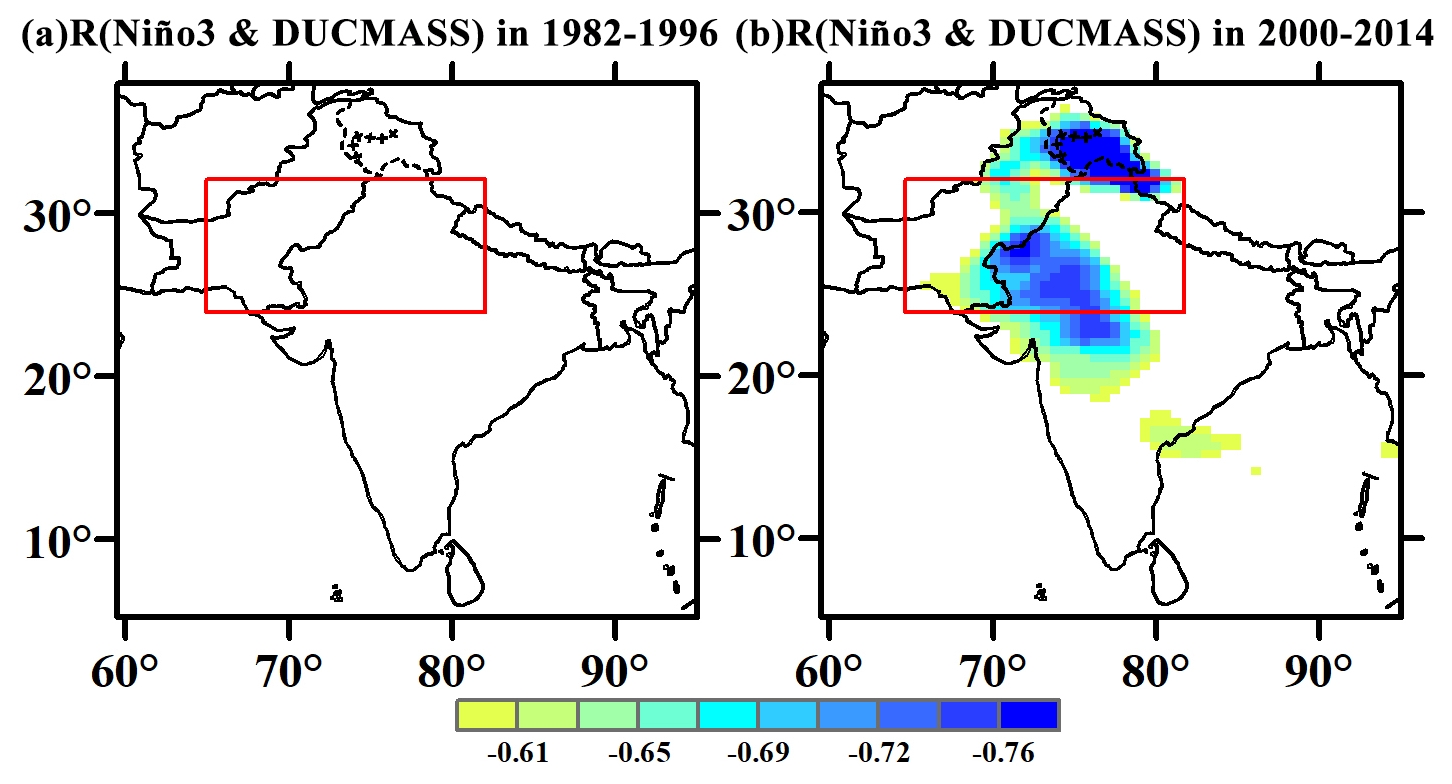
Figure 2Correlation between the Niño-3 index and DUCMASS over South Asia during (a) 1982–1996 and (b) 2000–2014. (Only correlations that passed the 99 % confidence level were presented.)
3.2 Factors influencing the interdecadal change in the impact of ENSO on DUCMASS
3.2.1 Tropical Atlantic SSTA pattern
With the global climate change observed in the early 2000s, the ENSO-related tropical Atlantic SSTA experienced an obvious transition, i.e., from an Atlantic Niña pattern during 1982–1996 to an Atlantic Niño pattern during 2000–2014 (Fig. 3), which coincides with the findings of Yang and Huang (2021). The tropical Atlantic SSTA pattern was a crucial factor in the restoration of the ENSO–ISMR relationship since the late 1990s (Yang and Huang, 2021), and thus it could also disturb the impact of ENSO on dust activities over northwestern South Asia. In order to validate the connection between the Atlantic SSTA and the DUCMASS–Niño-3 relationship, an Atlantic SSTA gradient index (ASGI) was used to describe the SSTA pattern shift in the tropical Atlantic, which represented the difference in the averaged SSTA between the tropical North Atlantic and tropical South Atlantic (marked by the two rectangles in Fig. 3). According to Tokinaga et al. (2019), the Atlantic Niña pattern develops and is most sensitive to ENSO in spring, and thus the SST averaged from March to May was used in this section.
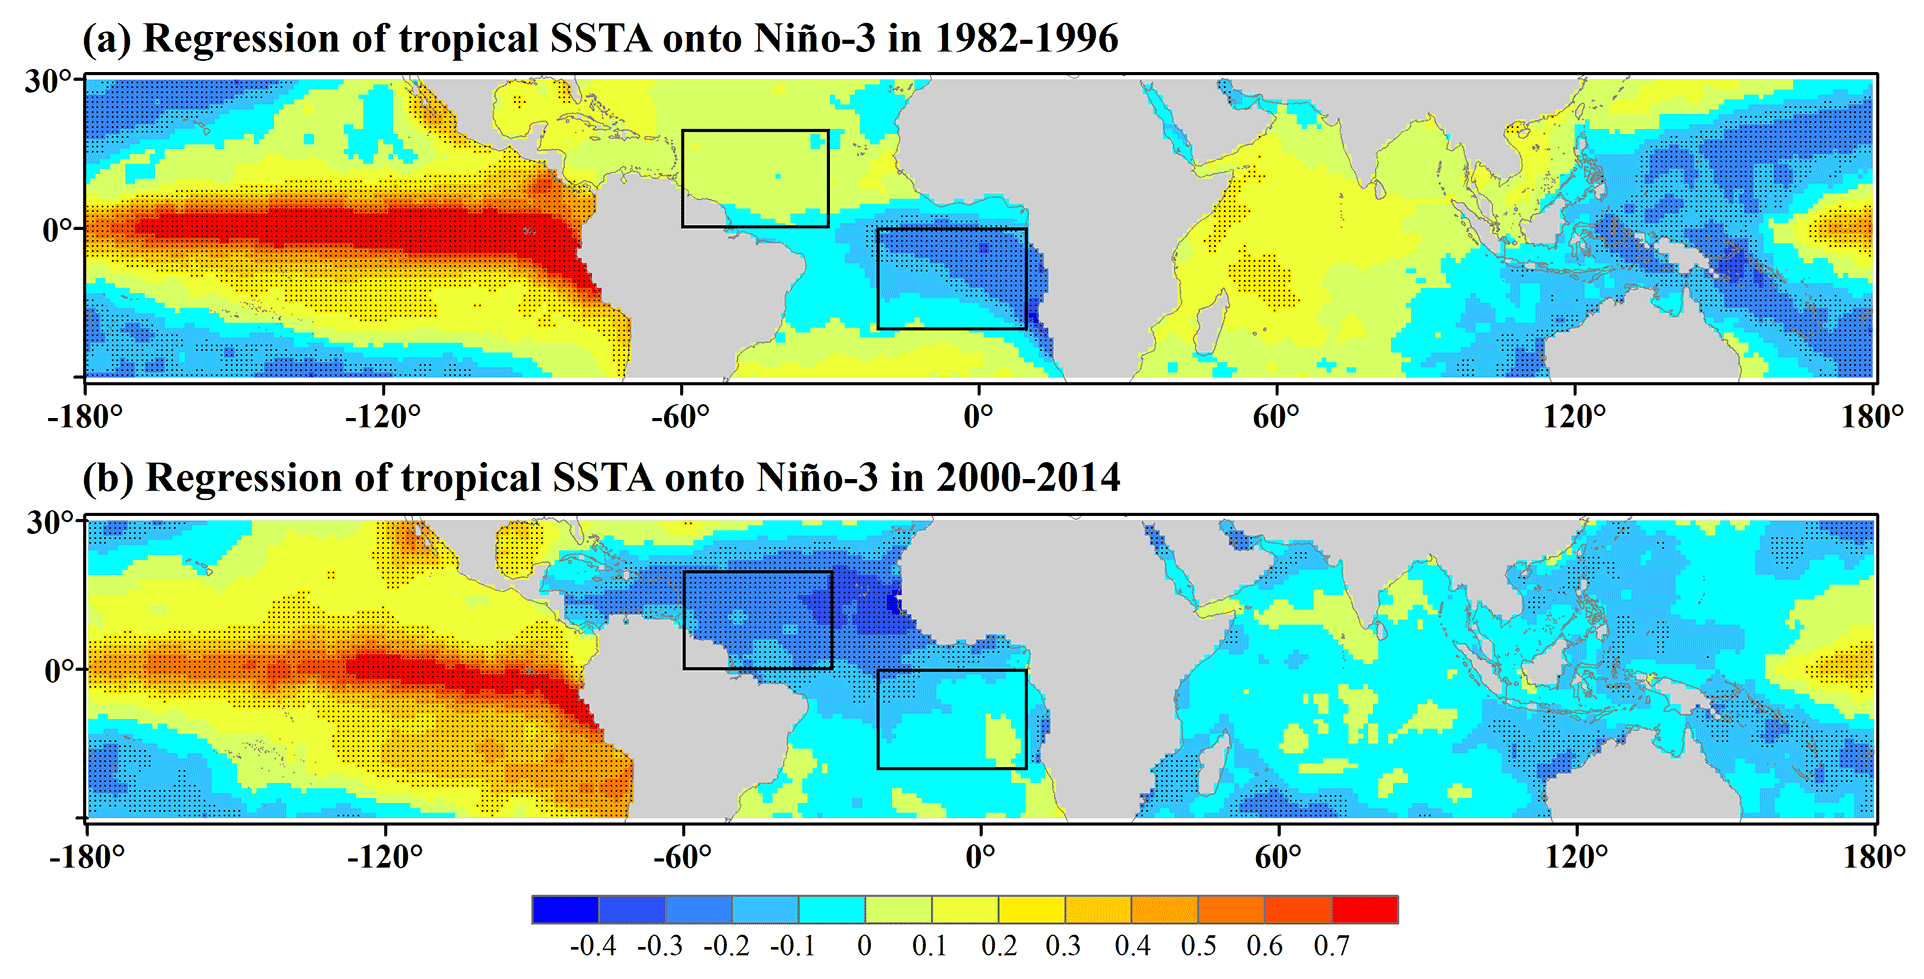
Figure 3Regression of spring (March–May) tropical SSTA onto the Niño-3 index. Black rectangles denote the regions to define ASGI. The range of the upper one is 60–30∘ W, 0–20∘ N, and that of the lower one is 20∘ W–10∘ E, 20–0∘ S. The black dots represent significance at the ≥ 90 % confidence level, similar to Fig. 2c–d of Yang and Huang (2021) but with different time spans.

Figure 4(a) The 15-year sliding correlation between DUCMASS and Niño-3 with and without ASGI-related signals removed; (b) 15-year sliding correlation between Niño-3 and ASGI; (c) sliding contribution of ASGI to the DUCMASS–Niño-3 relationship. The two red-filled markers represented the 15-year window spanning from 1982 to 1996 and from 2000 to 2014, respectively. The x axis denotes the middle year of the period under analysis.
The relationship between Niño-3 and DUCMASS witnessed a reversal in the early 2000s; simultaneously, the correlation between Niño-3 and ASGI exhibited a similar change. The correlation between Niño-3 and ASGI passed the 99 % confidence level during P1, while it did not pass the 95 % confidence level during P2, as shown in Fig. 4b. However, the correlation between Niño-3 and DUCMASS showed a contrary trend, with a higher correlation coefficient appearing in P2. Figure 4a showed that the DUCMASS–Niño-3 relationship was weakened when the ASGI signals were removed from the Niño-3 index during P1, while during P2, the DUCMASS–Niño-3 relationship remained the same with or without the ASGI signals removed. In addition, the contribution of ASGI to the DUCMASS–Niño-3 relationship (Fig. 4c) proved that, during P1, ASGI weakened this relationship, while no significant contribution was observed during P2. Thus, it is hypothesized that the strengthening (weakening) of the response of ASGI to Niño-3 weakened (strengthened) the impact of Niño-3 on DUCMASS during P1 (P2).

Figure 5Spatial correlation between the spring (March–May) tropical Atlantic SSTA and DUCMASS of the first mode of the MCA analysis in 1982–2014. The first MCA mode of (a) the DUCMASS and (b) the tropical Atlantic SSTA with ENSO-related signals removed. (c–d) As in (a)–(b) but for the original series including the ENSO signal. The black dots represent significance at the ≥ 90 % confidence level.
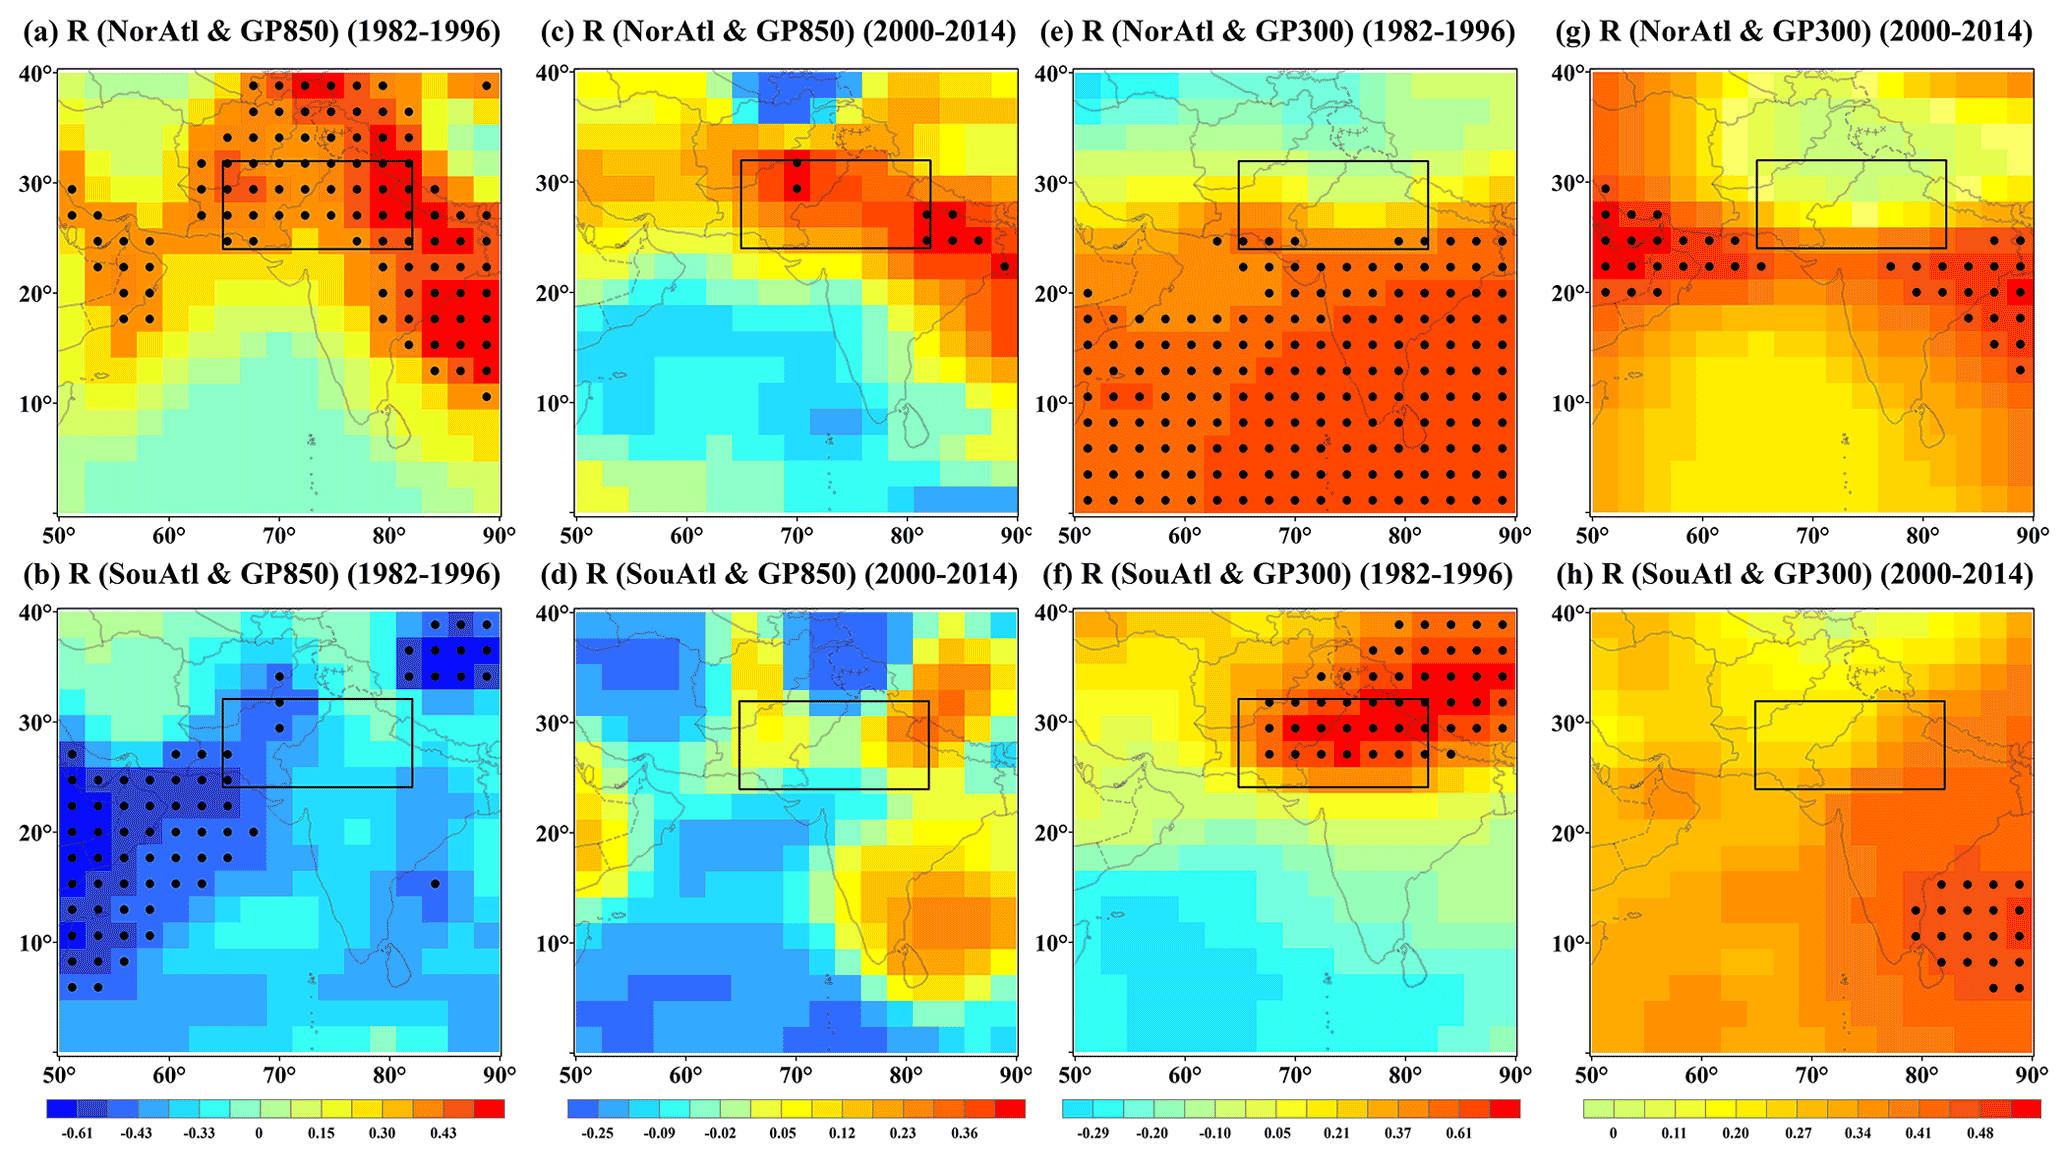
Figure 6Correlation between spring (March–May) tropical North and South Atlantic SSTA (NorAtl/SouAtl) with the ENSO signal removed and geopotential height (GP) at 850 hPa (a–d) as well as 300 hPa (e–h) in the dust season (June–July). (Correlations that passed the 90 % confidence level were marked by black dots.)
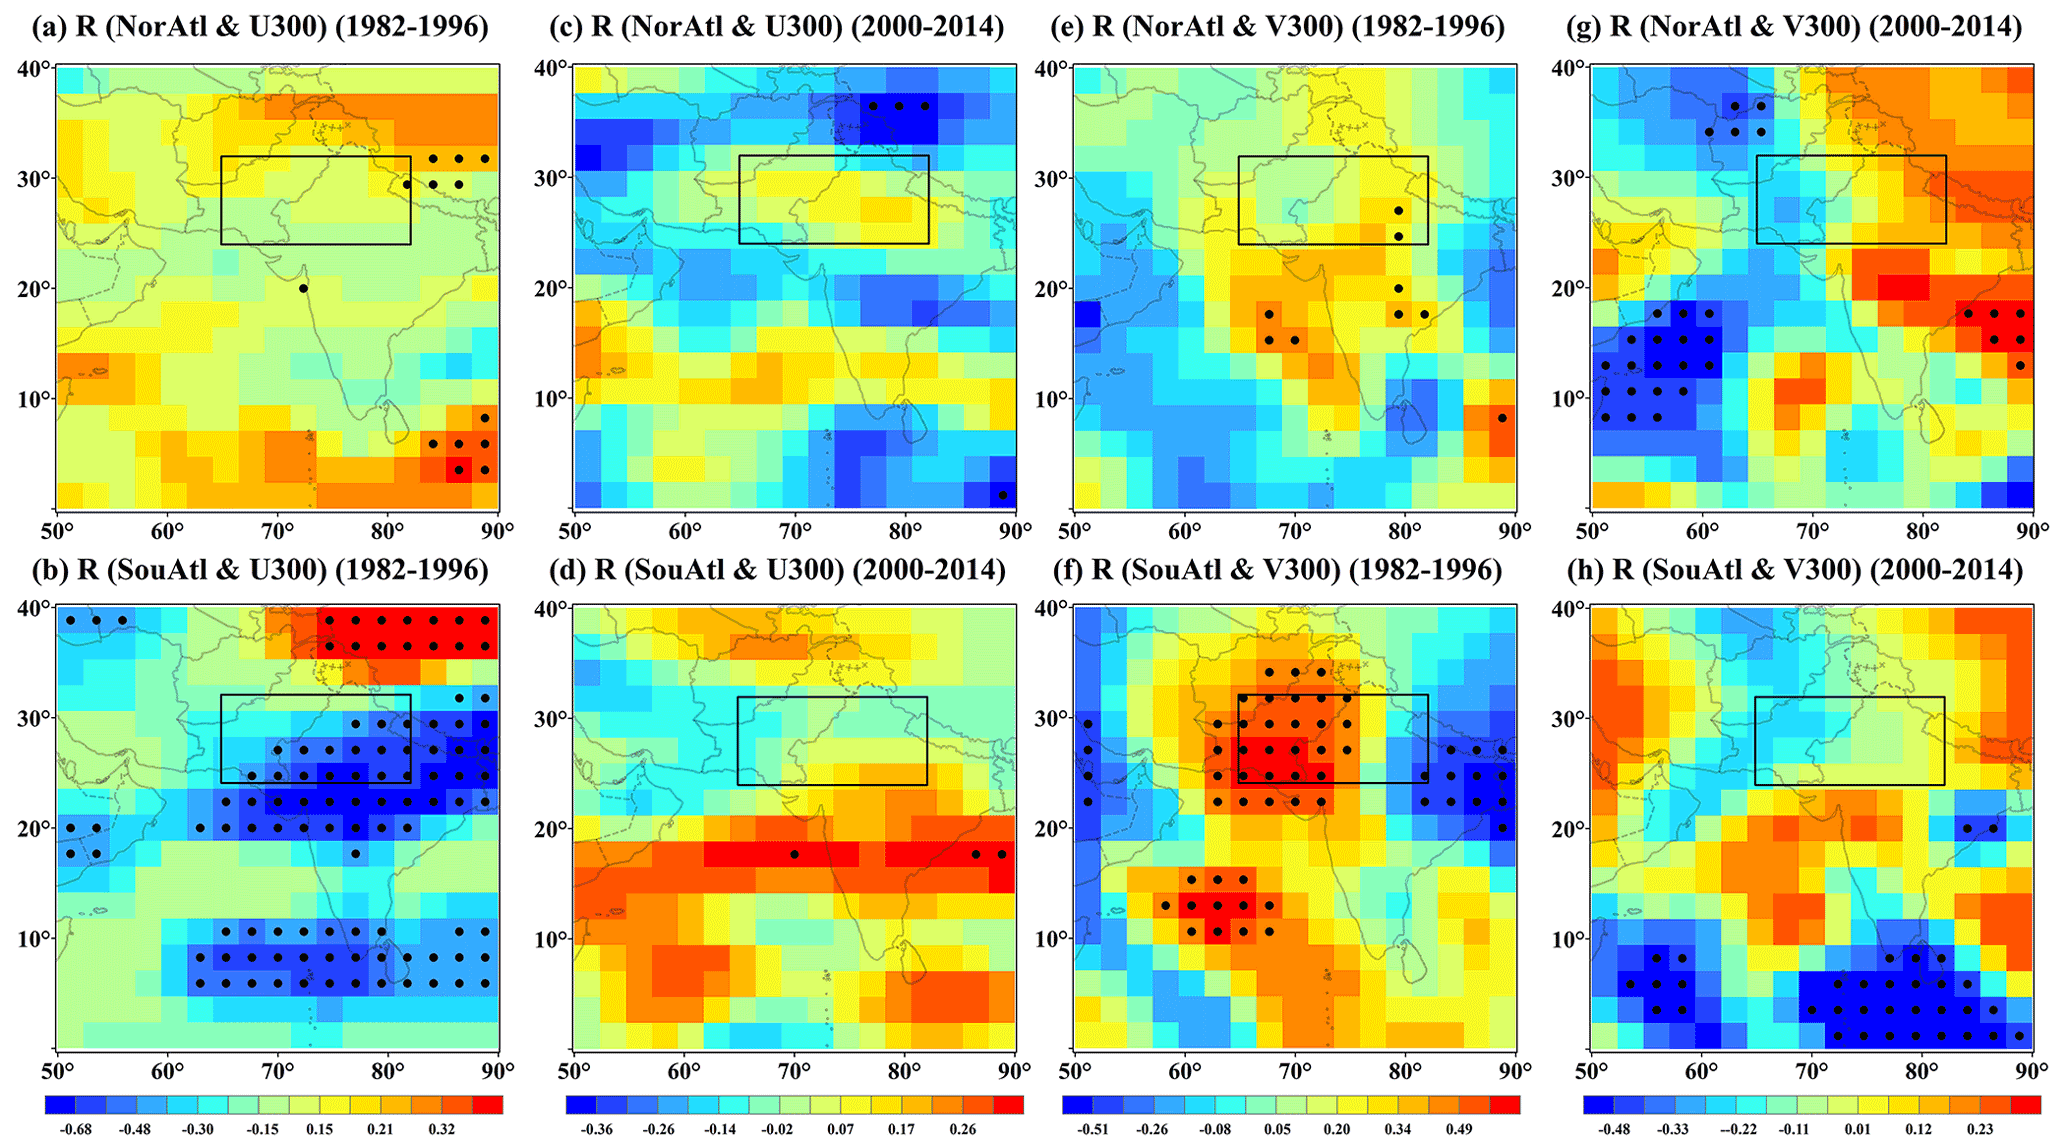
Figure 7Correlation between the spring (March–May) tropical North and South Atlantic SSTA (NorAtl/SouAtl) with the ENSO signal removed and zonal wind (U) (a–d) as well as meridional wind (V) (e–h) at 300 hPa in the dust season (June–July). (Correlations that passed the 90 % confidence level were marked by black dots.)
In order to validate the effect of the Atlantic SSTA pattern on the DUCMASS–Niño-3 relationship, the spatial coupling mode between DUCMASS and tropical Atlantic SSTA was explored. Figure 5 showed that the negative ASGI, i.e., a negative SST anomaly over the tropical North Atlantic and a positive SST anomaly over the tropical South Atlantic, was coupled to increased DUCMASS over northern and northwestern India. This pattern was not impacted by ENSO since the MCA results with ENSO-related signals removed were similar to those including the ENSO-related signals, as shown in Fig. 5. Figures 6 and 7 further illustrated the influence mechanism of the Atlantic SSTA pattern on DUCMASS. Figure 6 showed that the effect of North and South Atlantic SSTA (NorAtl/SouAtl) with the ENSO signal removed on the geopotential height (GP) at 850 hPa/300 hPa exhibited a significant difference during P1, while they were close (all are not significant) in P2. Similarly, a significant difference was also seen in the effect of North and South Atlantic SSTA on the zonal/meridional wind () at 300 hPa in P1, which disappeared in P2, as shown in Fig. 7. This was consistent with the variation of the Atlantic SSTA contribution to the DUCMASS–Niño-3 relationship; i.e., during P1, the Atlantic SSTA pattern was featured with a Niña type (Fig. 3a), and thus the South Atlantic presented a stronger influence on the atmospheric circulation over South Asia, which weakened the impact of ENSO on DUCMASS, while in P2, the negative North Atlantic SSTA (Fig. 3b) decreased the SSTA gradient between the North and South Atlantic and offset the effect of the Niña pattern, which weakened the response of the atmospheric circulation to the North and South Atlantic SSTA gradient and strengthened the DUCMASS–Niño-3 relationship.
In order to verify the inhibitory effect of the Atlantic SSTA pattern on the DUCMASS–Niño-3 relationship, we analyzed the regression of ASGI onto the local conditions that directly influenced DUCMASS, such as precipitation (PPT), soil moisture (SoilM), the Normalized Difference Vegetation Index (NDVI), and air flow. Figure 8 showed that the regression coefficients between ASGI and SoilM as well as PPT and NDVI (not shown) were opposite to those between Niño-3 and SoilM during P1, while during P2, the abovementioned differences were weakened. Besides, Figure 9 demonstrated that the regression coefficients between Niño-3 and velocity potential (VP) as well as the wind fields at 200 hPa and 850 hPa were also contrary to the regression coefficients between ASGI and those factors, indicating the opposite effect of ASGI and ENSO on local wind field and convection. All of those proved the inhibitory effect of the Atlantic SSTA pattern on the DUCMASS–Niño-3 relationship during P1. In addition, to further elaborate on the physical mechanisms of the interaction between ENSO and dust activities, the composite differences in the abovementioned climatic variables between El Niño and La Niña years as well as those between positive ASGI (ASGI+) and negative ASGI (ASGI−) years were presented, as shown in Figs. S1–S2 in the Supplement. Figure S1 showed that the SoilM averaged from June to July in El Niño years exhibited positive anomalies, while that in La Niña years exhibited the reversed anomalies. The differences in SoilM between ASGI+ and ASGI− during P1 were negative, which were contrary to that between El Niño and La Niña conditions, while the differences during P2 reversed compared to those in P1. Simultaneously, the differences in VP at 200 and 850 hPa between ASGI+ and ASGI− also presented contrary changes to those between El Niño and La Niña years during P1 and P2, as shown in Fig. S2. The mechanisms illustrated by the composite difference were analogous with the regression between dust activities and the climatic variables, both of which clarified the effect of ASGI on the relationship between ENSO and dust activities over the northwestern South Asian dust source.

Figure 8(a–b) Regression of ENSO with ASGI-related signals removed onto SoilM in the dust season (June–July). (c–d) Regression of ASGI with ENSO-related signals removed onto SoilM in the dust season (June–July).
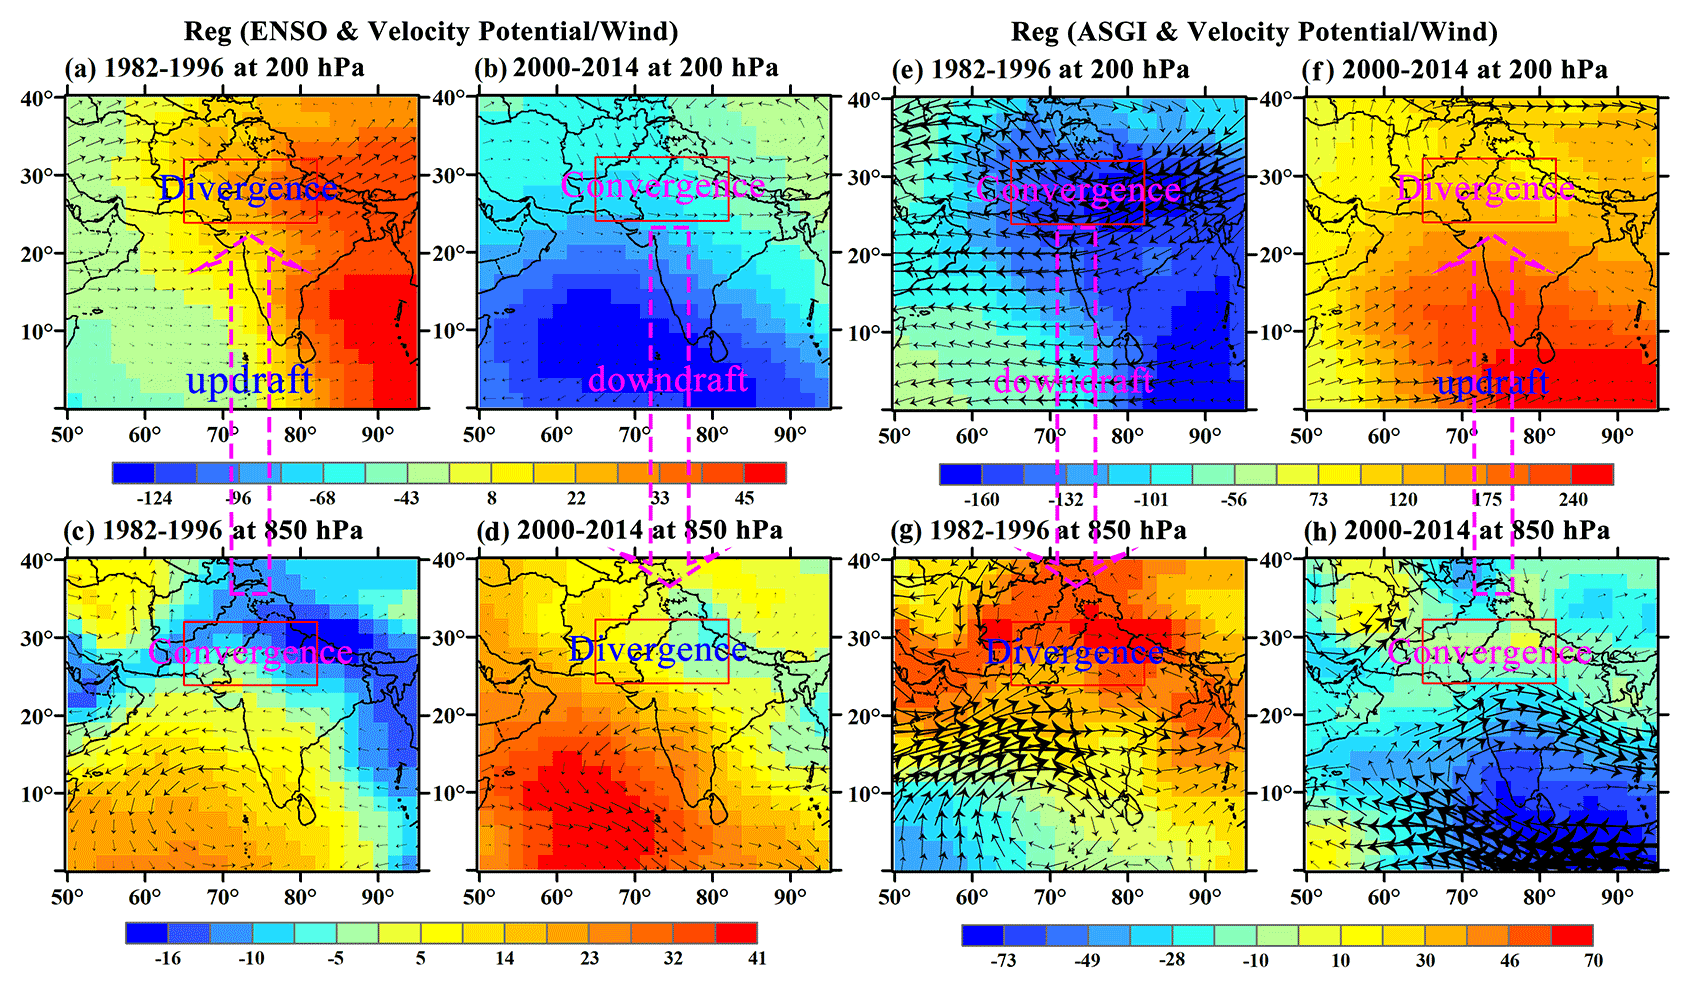
Figure 9(a–d) Regression of ENSO with ASGI-related signals removed onto velocity potential (VP) and wind at 200 and 850 hPa in the dust season (June–July). (e–h) Regression of ASGI with ENSO-related signals removed onto velocity potential and wind at 200 and 850 hPa in the dust season (June–July).
3.2.2 Tropical Indian Ocean SSTA pattern
This study explored the effect of the Indian Ocean SSTA pattern on the DUCMASS–Niño-3 relationship. The covariability between the western Pacific and Indian oceans has been widely recognized by previous studies (Kug et al., 2005; Wang et al., 2003; Watanabe and Jin, 2002). ENSO can affect the Indian Ocean SST in the form of the Walker circulation, and the Indian Ocean variability can also modulate the ENSO variability (Wu and Kirtman, 2004; Yu et al., 2002; Kug et al., 2005). It is known that ENSO mainly influences the monsoon rainfall of South Asia by changing the SST of the Indian Ocean (Krishnamurthy and Kirtman, 2003; Srivastava et al., 2019). Du et al. (2009) indicated that the northern Indian Ocean warming displayed two peaks in November–December (−1) and June–August (0), with the second peak larger in magnitude. Cherchi and Navarra (2013) also pointed out that the connection between the ISM and the Indian Ocean SST pattern was mostly confined in summer and fall. Besides, compared to the Atlantic, the Indian Ocean is closer to the South Asian dust source, and thus it takes less time to transmit the signal (partially through wave train propagation) from the Indian Ocean to the dust source than that from the Atlantic. Given all of that, the Indian Ocean SST used in this study was the summer average that was concurrent with the dust season (June–July).
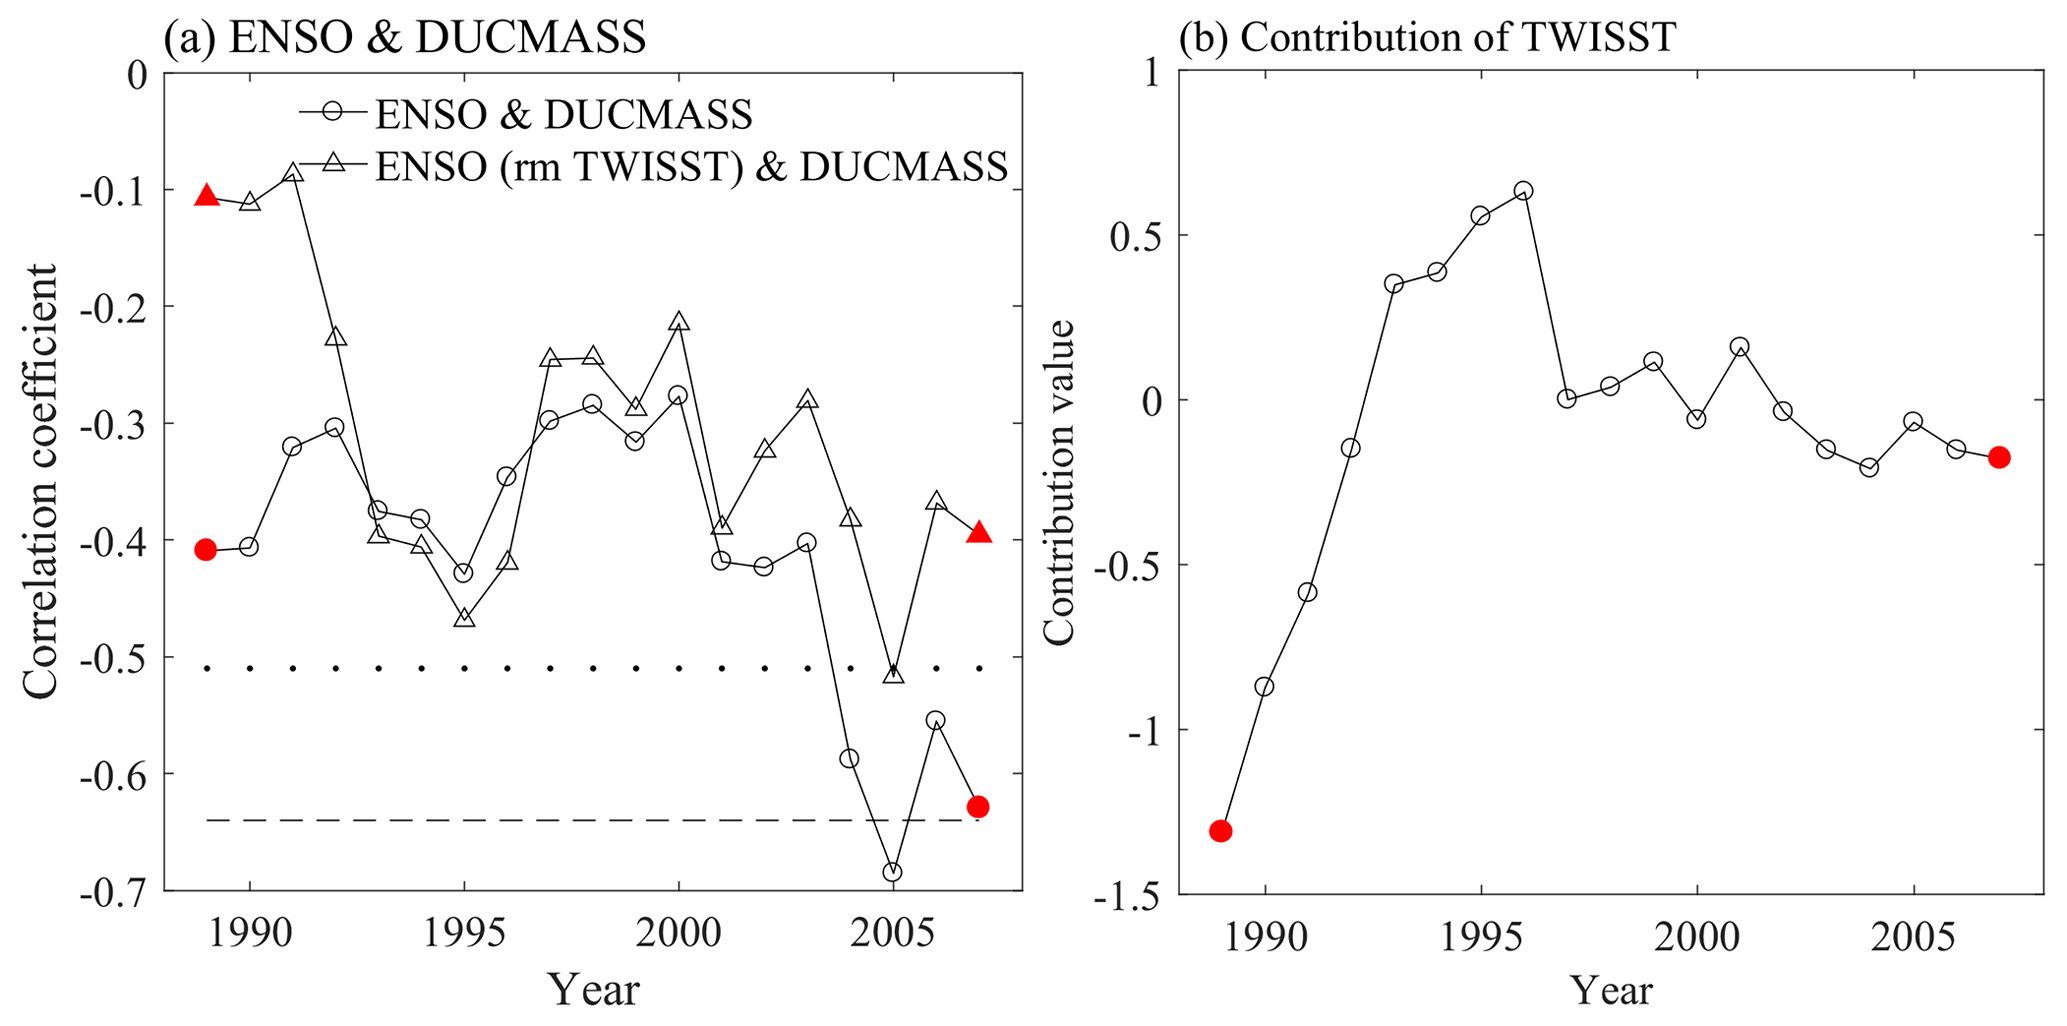
Figure 10(a) The 15-year sliding correlation between DUCMASS and Niño-3 with and without TWISST-related signals removed. (b) Sliding contribution of TWISST to the DUCMASS–Niño-3 relationship. The two red-filled markers represented the 15-year window spanning from 1982 to 1996 and from 2000 to 2014, respectively. The x axis denotes the middle year of the period under analysis.
The relationship between DUCMASS and Niño-3 with the Indian Ocean SST signal also experienced decadal variation. Figure 10a showed that the correlation between Niño-3 and DUCMASS was obviously reduced when the tropical western Indian Ocean SSTA (TWISST) was removed from Niño-3. As illustrated by Fig. 10b, during P1, TWISST weakened this correlation, while no significant contribution was observed during P2. Thus, it is hypothesized that TWISST weakened the impact of ENSO on DUCMASS during P1. However, when the IOD (rather than TWISST) was considered, the correlation between Niño-3 and DUCMASS remained the same when IOD was removed from Niño-3, indicating that the IOD exhibited no significant impact on the correlation between Niño-3 and DUCMASS. Clark et al. (2000) showed that the SST in the central Indian Ocean exhibited a stronger correlation with the Indian precipitation than that in the Arabian Sea and northwest of Australia. Cherchi and Navarra (2013) also pointed out that when the eastern and western poles of the IOD were considered separately, the western side exhibited the largest correlation. Thus, the TWISST was considered when exploring the effect of the Indian Ocean SSTA pattern on the DUCMASS–Niño-3 relationship.
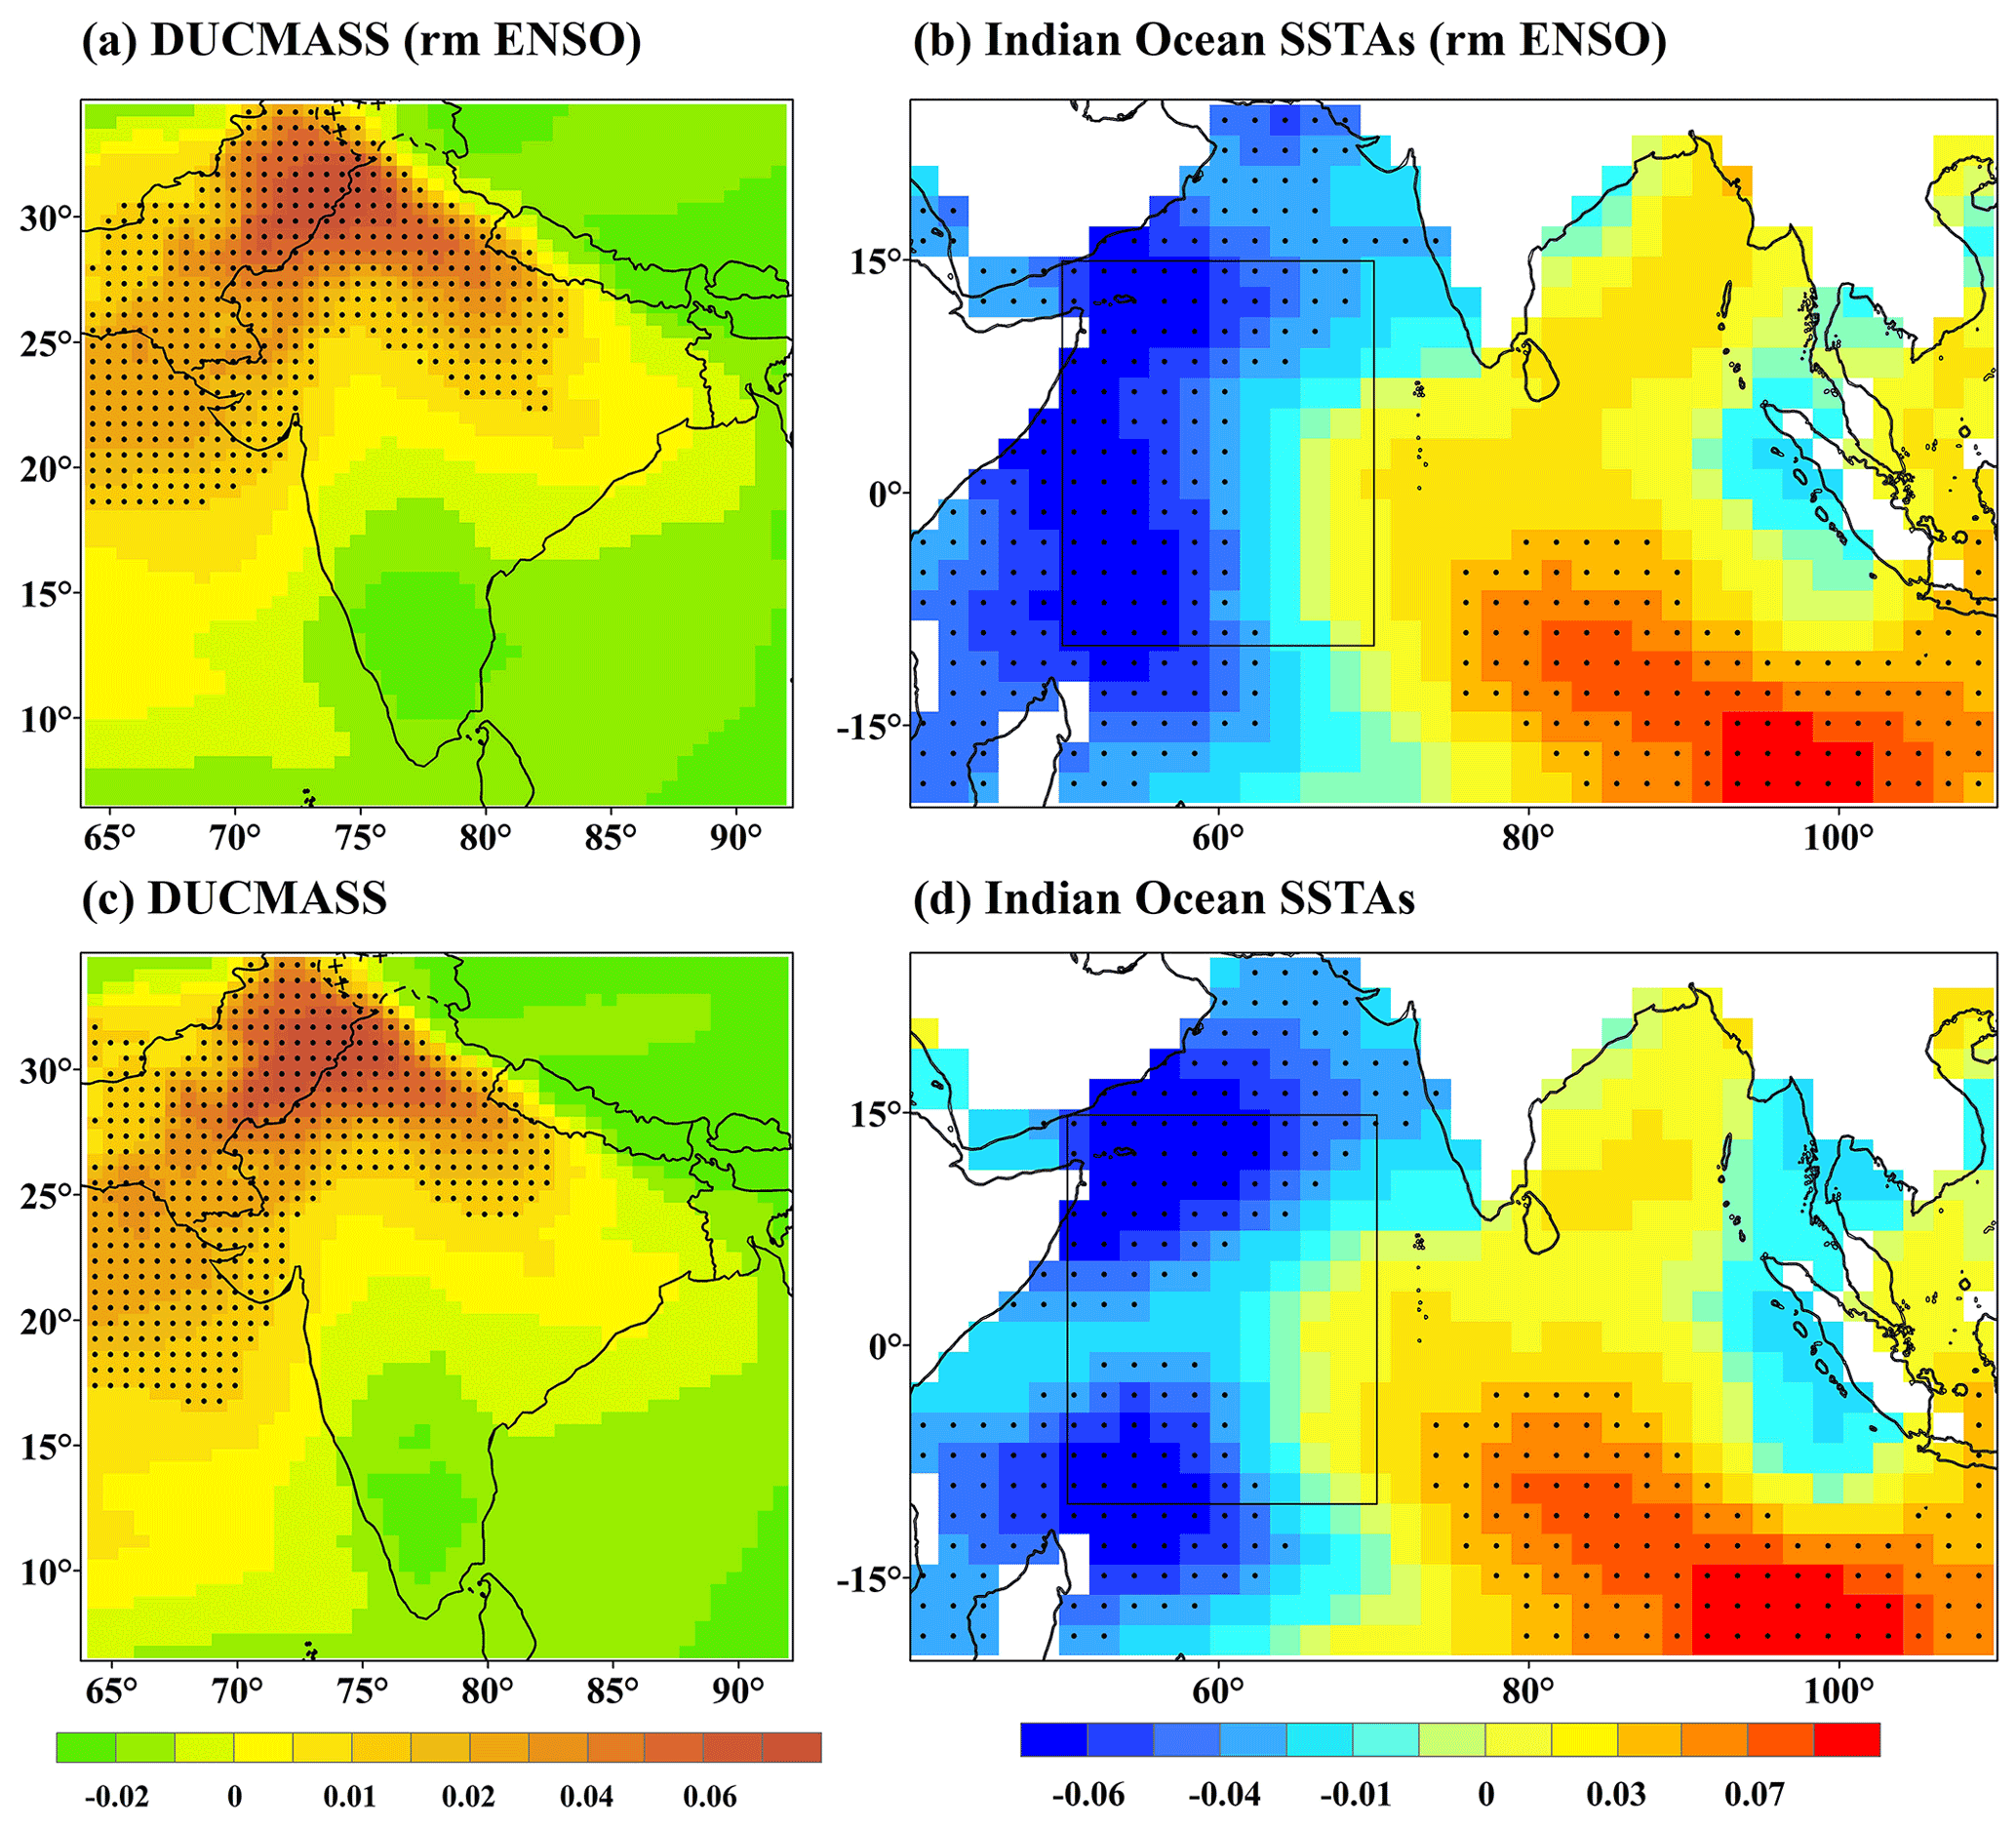
Figure 11Spatial correlation between summer (June–July) tropical Indian Ocean SSTA (TWISSTA) and DUCMASS of the first mode of the MCA analysis in 1982–2014. The first MCA mode of (a) the DUCMASS and (b) summer (June–July) tropical Indian Ocean SSTA with ENSO-related signals removed. (c–d) As in (a)–(b) but for the original series including the ENSO signal. The black dots represent significance at the ≥ 90 % confidence level.
The spatial coupling mode between DUCMASS and tropical Indian Ocean SSTA showed that the cold tropical western Indian Ocean and warm tropical eastern Indian Ocean were coupled with higher DUCMASS over northern and northwestern India. This pattern was not impacted by ENSO since the MCA results with ENSO-related signals removed were similar to those including the ENSO-related signals, as shown in Fig. 11. Figures 12–14 further illustrated the influence mechanism of the Indian Ocean SSTA pattern on DUCMASS. Figure 12 showed that, during P1, the regression coefficients between ENSO and PPT were opposite to those between TWISST and PPT, while during P2, the regression coefficients between ENSO and DUCMASS as well as those between TWISST and DUCMASS were all positive. Similar changes were also seen when the effects of ENSO/TWISST on SoilM (Fig. 13), VP, and wind field (Fig. 14) were considered. These illustrated the opposite effect of TWISST and ENSO on the key factors that influence the dust concentration, i.e., the local wind field and surface conditions. The above results further verified the inhibitory effect of the Indian Ocean SST pattern on the DUCMASS–Niño-3 relationship during P1 as well as the promotional effect during P2. In addition, to further elaborate on the physical mechanisms of the interaction between ENSO and dust activities that were impacted by the tropical western Indian Ocean, the composite differences in the abovementioned climatic variables between El Niño and La Niña years as well as those between positive TWITSST (TWITSST+) and negative TWITSST (TWITSST−) years were presented, as shown in Figs. S3–S5. Figures S3–S4 showed that the PPT and SoilM averaged from June to July in El Niño years exhibited positive anomalies, while those in La Niña years exhibited reversed anomalies. The differences in PPT and SoilM between TWITSST+ and TWITSST− during P1 were negative, which was consistent with that between El Niño and La Niña conditions, while the differences during P2 were contrary to those during P1. Simultaneously, the differences in VP at 200 hPa between TWITSST+ and TWITSST− also presented contrary changes to those between El Niño and La Niña years during P1 and P2, as shown in Fig. S5. The mechanisms illustrated by the composite difference were analogous with the regression between dust activities and the climatic variables, both of which clarified the effect of TWITSST on the relationship between ENSO and dust activities over the northwestern South Asian dust source.
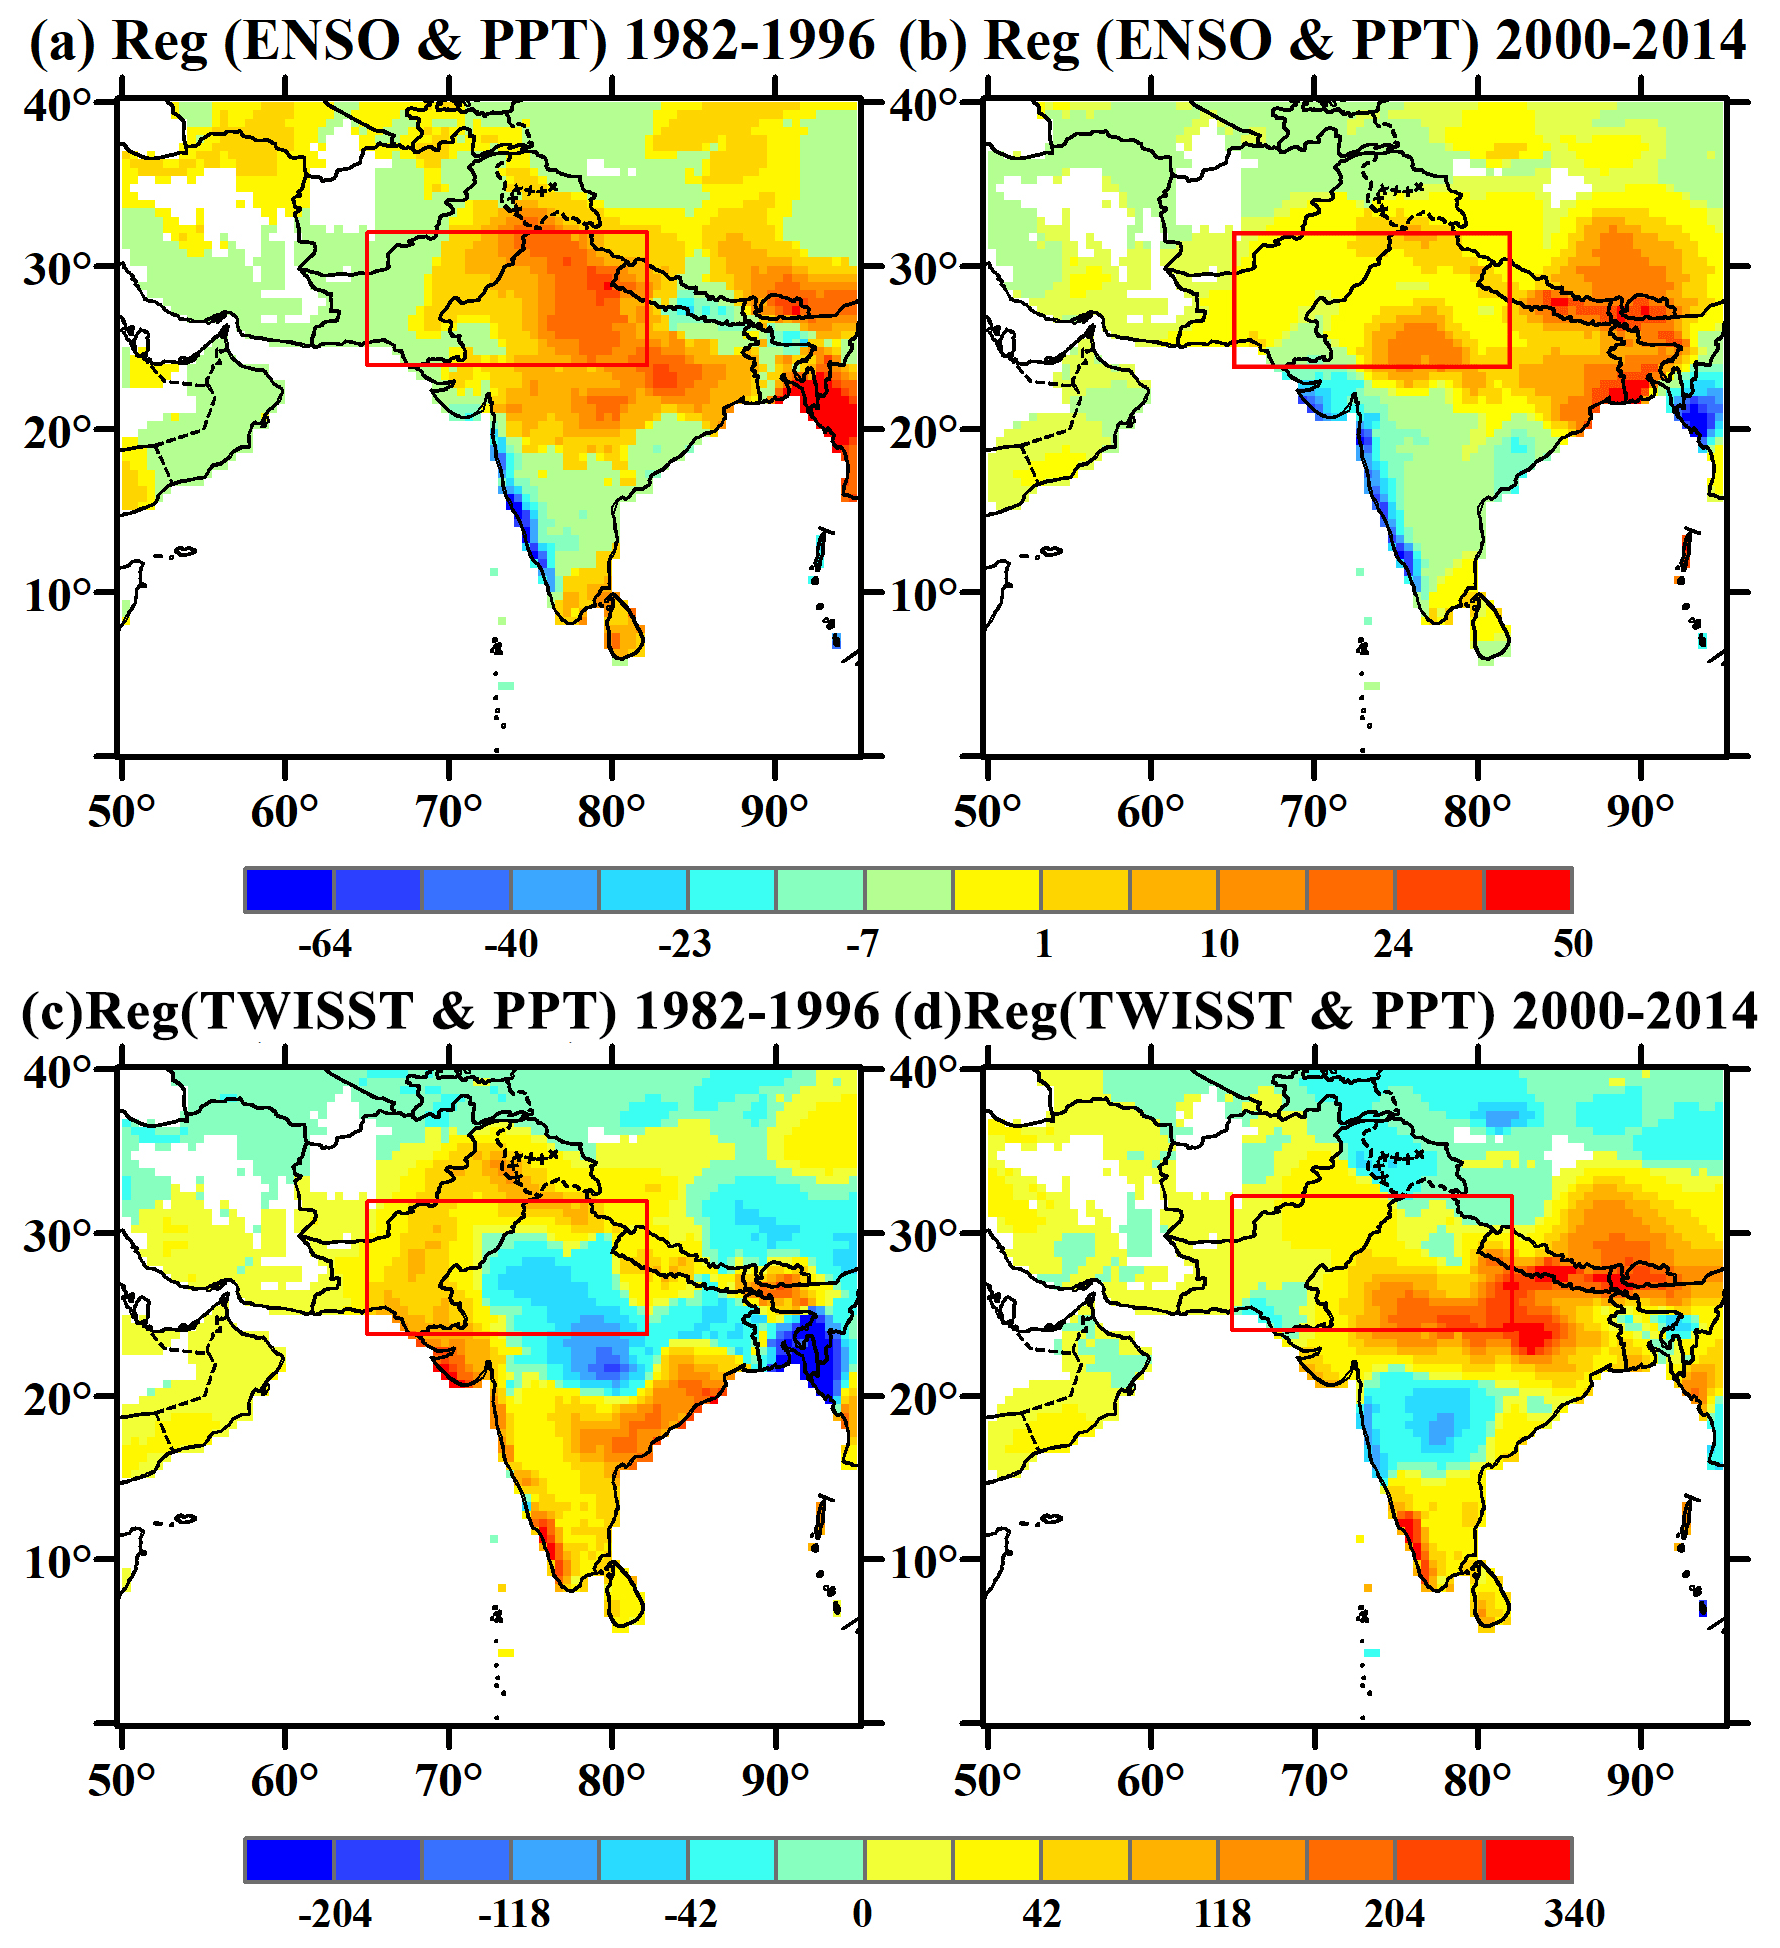
Figure 12(a–b) Regression of ENSO with TWISST-related signals removed onto PPT in the dust season (June–July). (c–d) Regression of TWISST with ENSO-related signals removed onto PPT in the dust season (June–July).

Figure 13(a–b) Regression of ENSO with TWISST-related signals removed onto SoilM in the dust season (June–July). (c–d) Regression of TWISST with ENSO-related signals removed onto SoilM in the dust season (June–July).
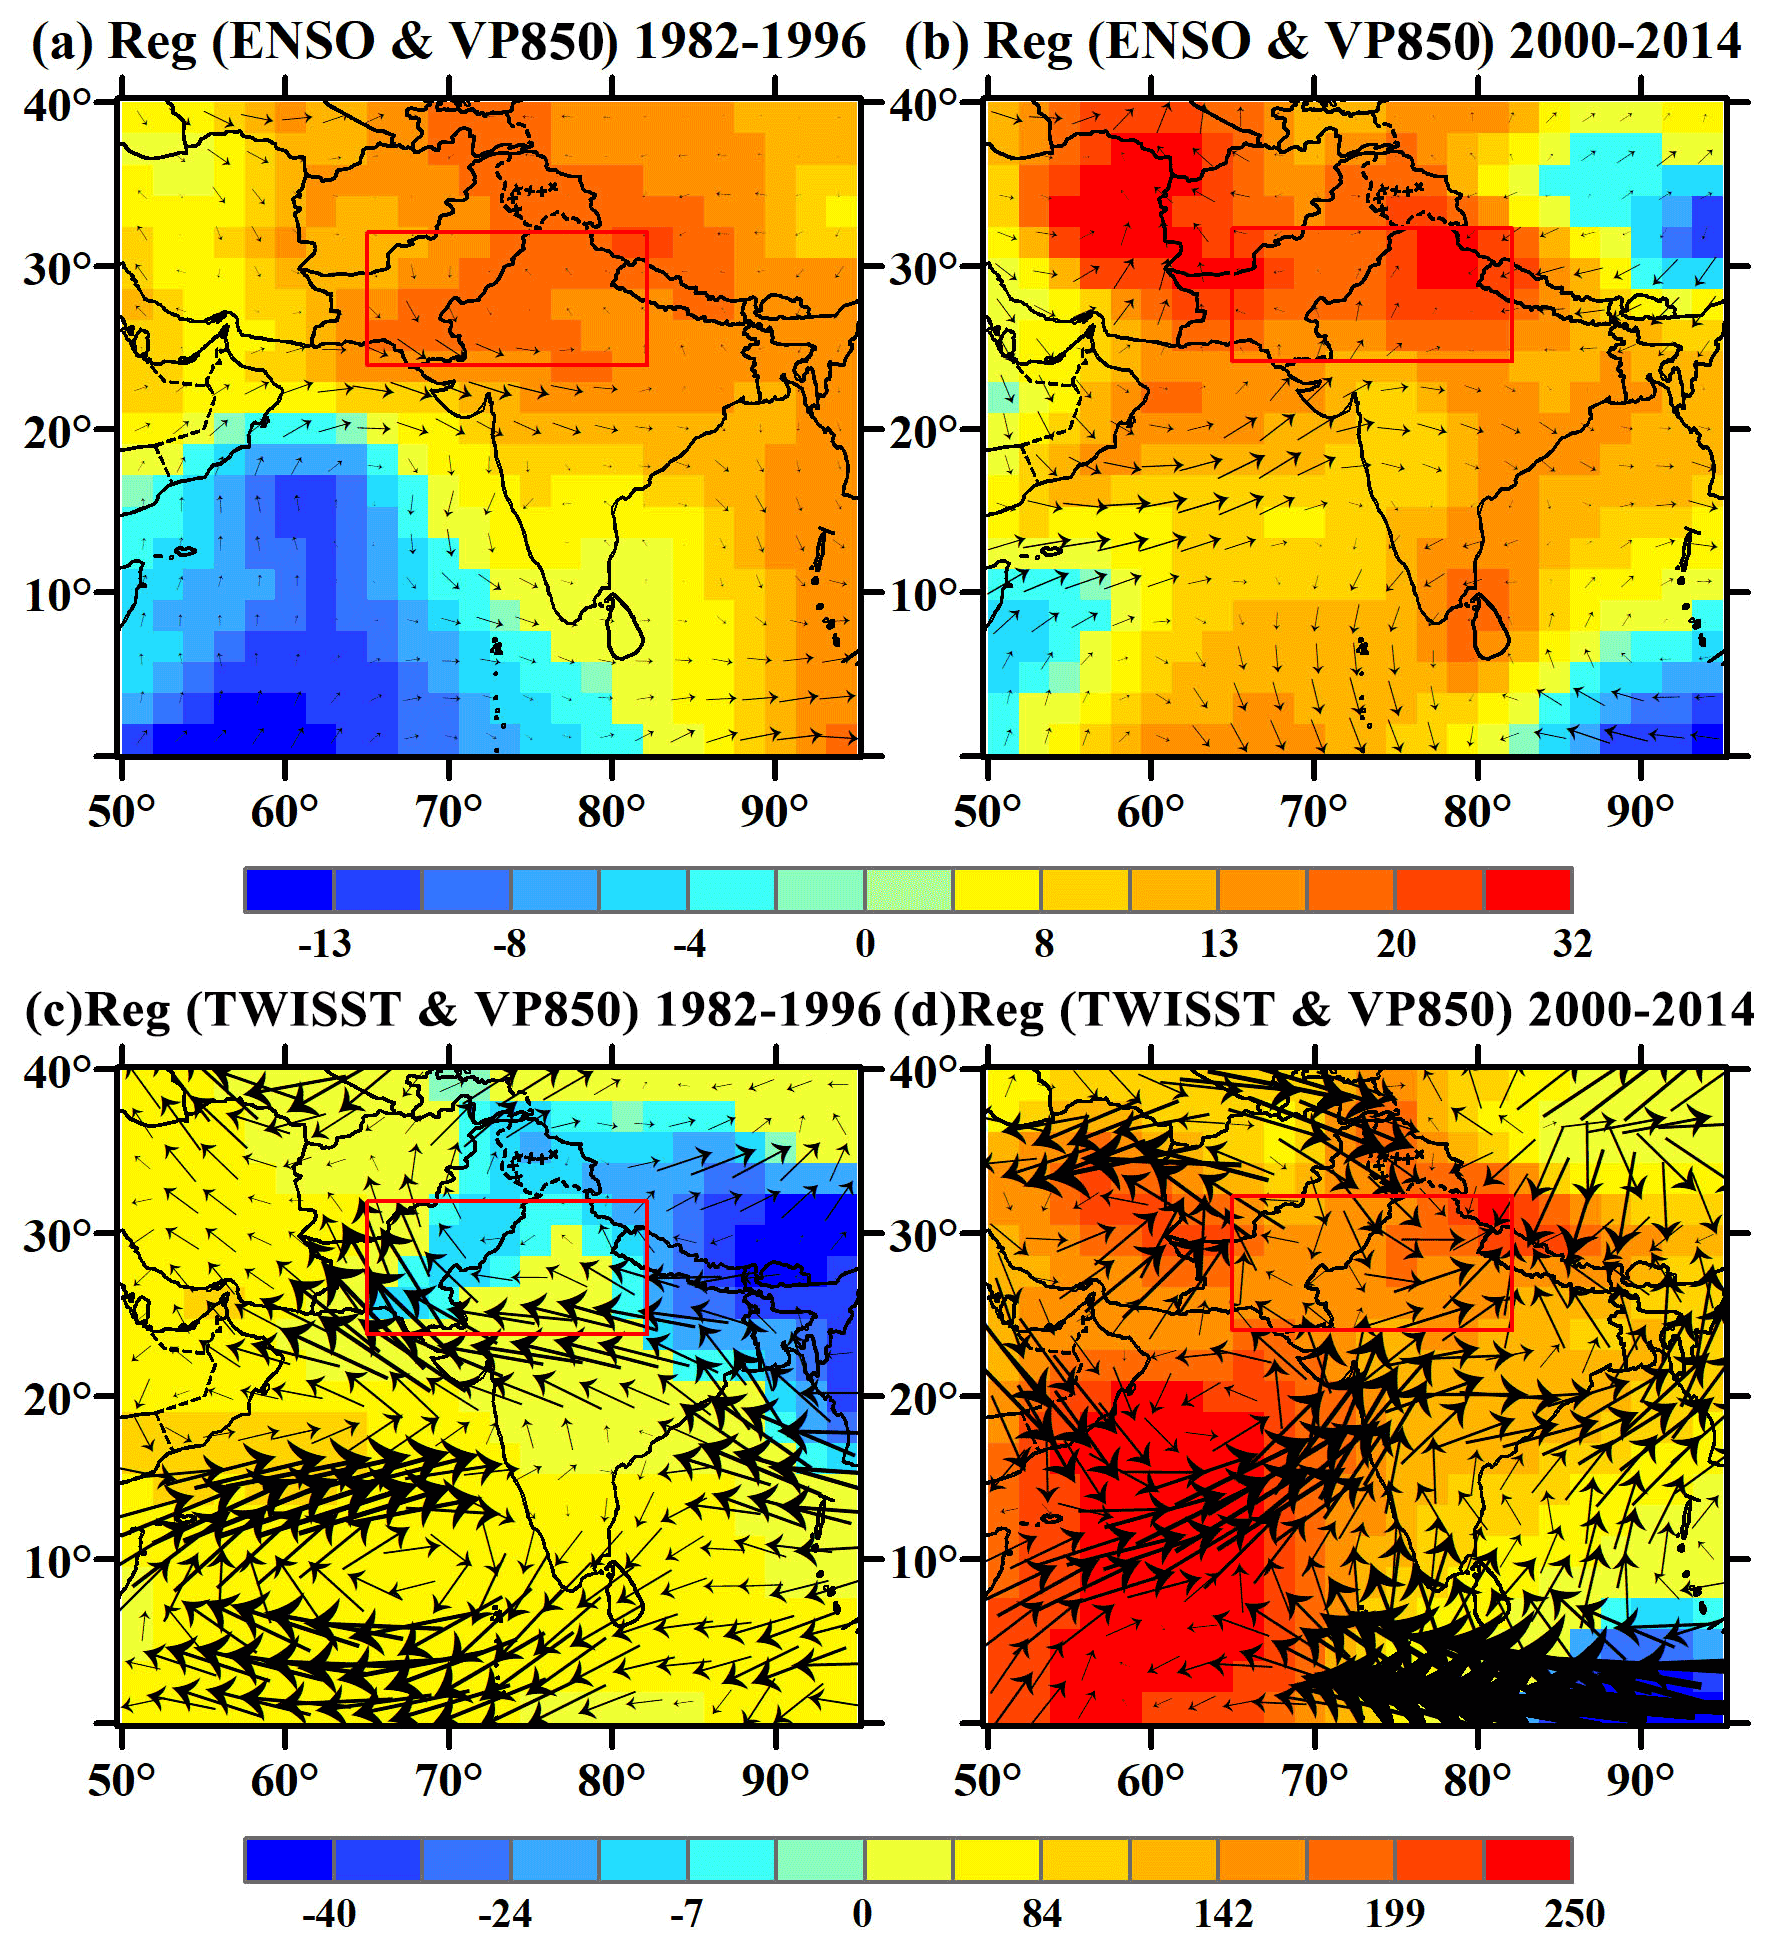
Figure 14(a–b) Regression of ENSO with TWISST-related signals removed onto velocity potential at 850 hPa (VP850) and wind in the dust season (June–July). (c–d) Regression of TWISST with ENSO-related signals removed onto velocity potential at 850 hPa (VP850) and wind in the dust season (June–July).
3.2.3 Pacific Decadal Oscillation
It is suggested that the PDO can influence the interannual variability of ISMR by enhancing the ENSO–ISMR relationship when ENSO and PDO were in phase while weakening the relationship when they were out of phase (Dong et al., 2018; Krishnamurthy and Krishnamurthy, 2014). However, it is unclear whether PDO is responsible for the shift in the DUCMASS–Niño-3 relationship. Table 2 listed the years with different phases of ENSO and PDO as well as years when ENSO and PDO are in (out of) phase separately. The correlation coefficient between ENSO and DUCMASS and the significance level were also given. It demonstrated that the PDO significantly strengthened the correlation between ENSO and DUCMASS as the coefficient turned from −0.39 (P > 0.1) when PDO and ENSO were out of phase to −0.69 (P < 0.01) when they were in phase.
Table 2List of individual and combined wintertime ENSO–PDO years during 1982–2014.
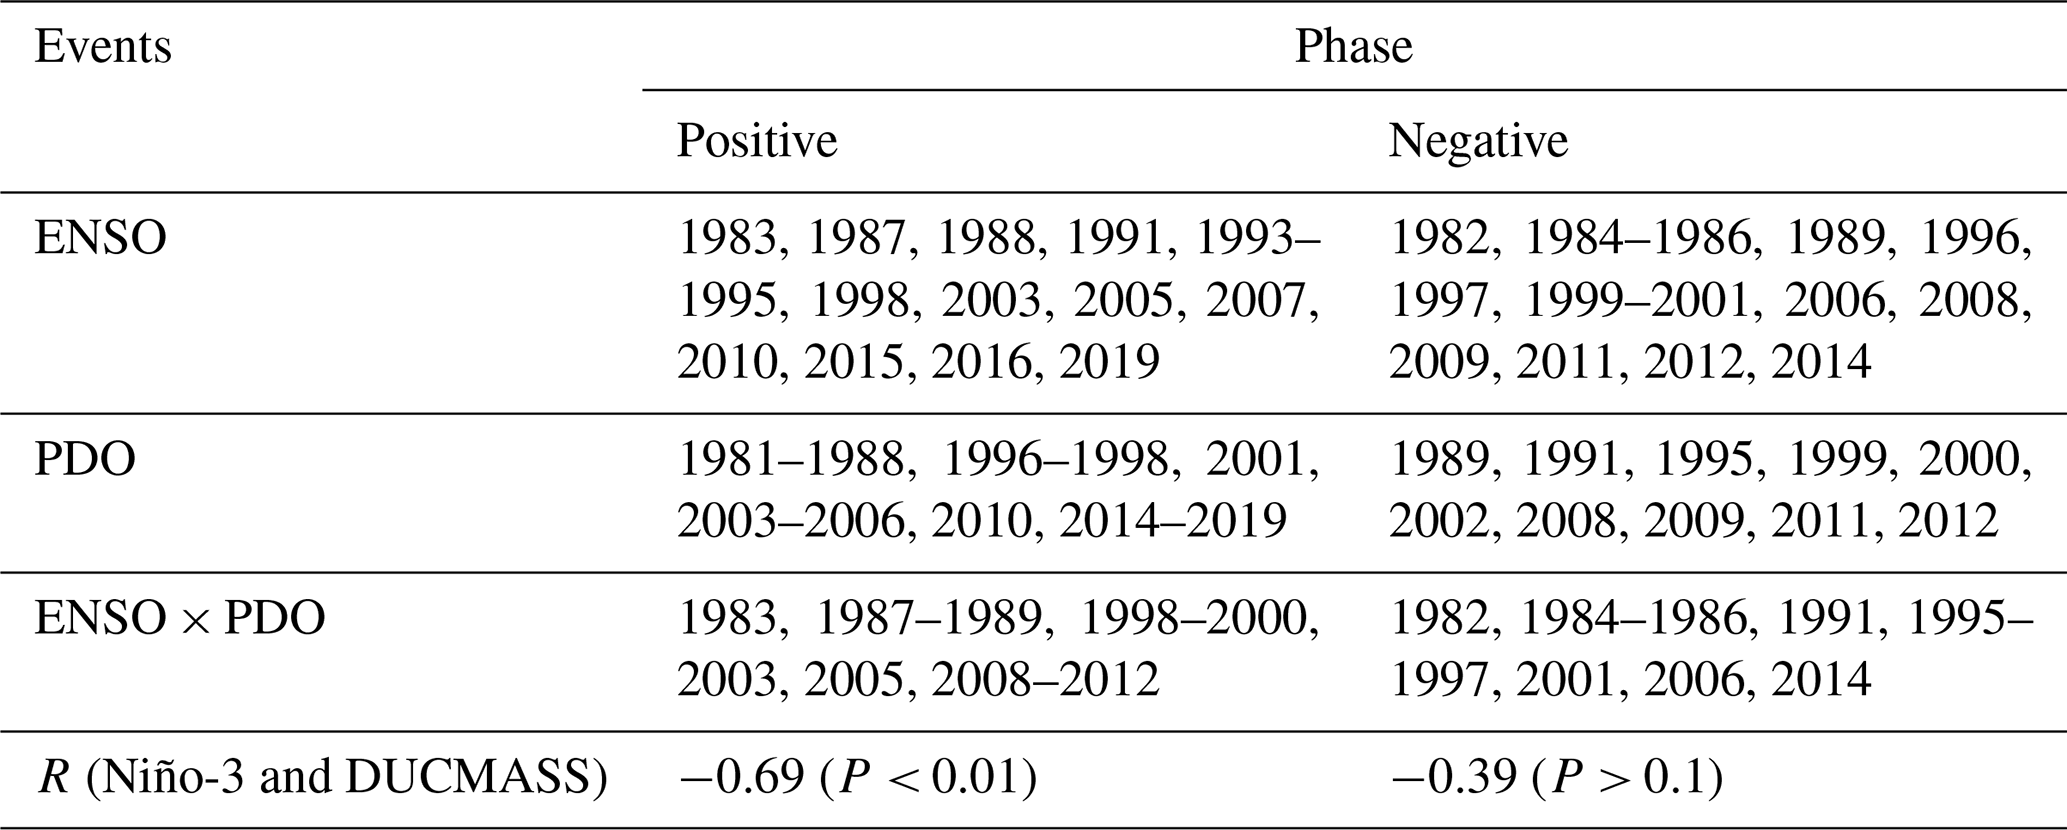
Table 2 revealed that P2 includes most years (8 out of 14) when ENSO and PDO were in phase, i.e., 2000, 2003, 2005, and 2008–2012, while most of the out-of-phase years (8 out of 11) appeared in P1, i.e., 1982, 1984–1986, 1991, 1995, 1996, and 1997. Simultaneously, the winter Niño-3 exhibited a lower correlation with DUCMASS in P1, when most ENSO years were accompanied by the anti-phase PDO. In addition, the quantitative contribution of the PDO shown in Fig. 15 further confirmed that the PDO strengthened the impact of ENSO on DUCMASS in P2, while the contribution was close to 0.0 in P1. All these demonstrated that the phase shift in the PDO plays an important role in modulating the revolution of the DUCMASS–Niño-3 relationship.

Figure 15Sliding contribution of the PDO to the DUCMASS–Niño-3 relationship. The two circles represented the 15-year window spanning from 1982 to 1996 and from 2000 to 2014, respectively.
Figure 16 revealed the influence mechanism of the PDO on DUCMASS. During P1, the 200 hPa velocity potential in the positive PDO years exhibited a decrease (convergence) over the eastern tropical Pacific and an increase (divergence) over the tropical Indian Ocean and Indian subcontinent (Fig. 16a). The upper-level divergence over India and the adjacent seas corresponded to the anomalous ascending motion, which promoted ISMR and consequently suppressed the dust storms over South Asia. Meanwhile, an anomalous cyclone developed to the north of India due to the enhanced convection. The westerlies on the southern flank of the cyclonic anomaly transported wet air from the Arabian Sea to the northwest of India (Huang et al., 2020), which further inhibited dust emissions, while in the negative PDO years during P2, the 200 hPa velocity potential exhibited a decrease (convergence) over India, corresponding to an anomalous descending motion, as shown in Fig. 16b. This descending flow suppressed the Indian monsoon convection and rainfall, which consequently enhanced dust emissions. Similarly, an anomalous cyclone developed over the south of India. The easterlies on the northern flank of the cyclonic anomaly advected relatively drier air from the Eurasian continent to northern India (Parker et al., 2016), which favored dust emissions. The difference in flow movements and their effects on dust activities between positive and negative PDO years was consistent with that between El Niño and La Niña years, which further proved that the PDO could significantly strengthen the effect of ENSO on DUCMASS when it was in phase with ENSO.
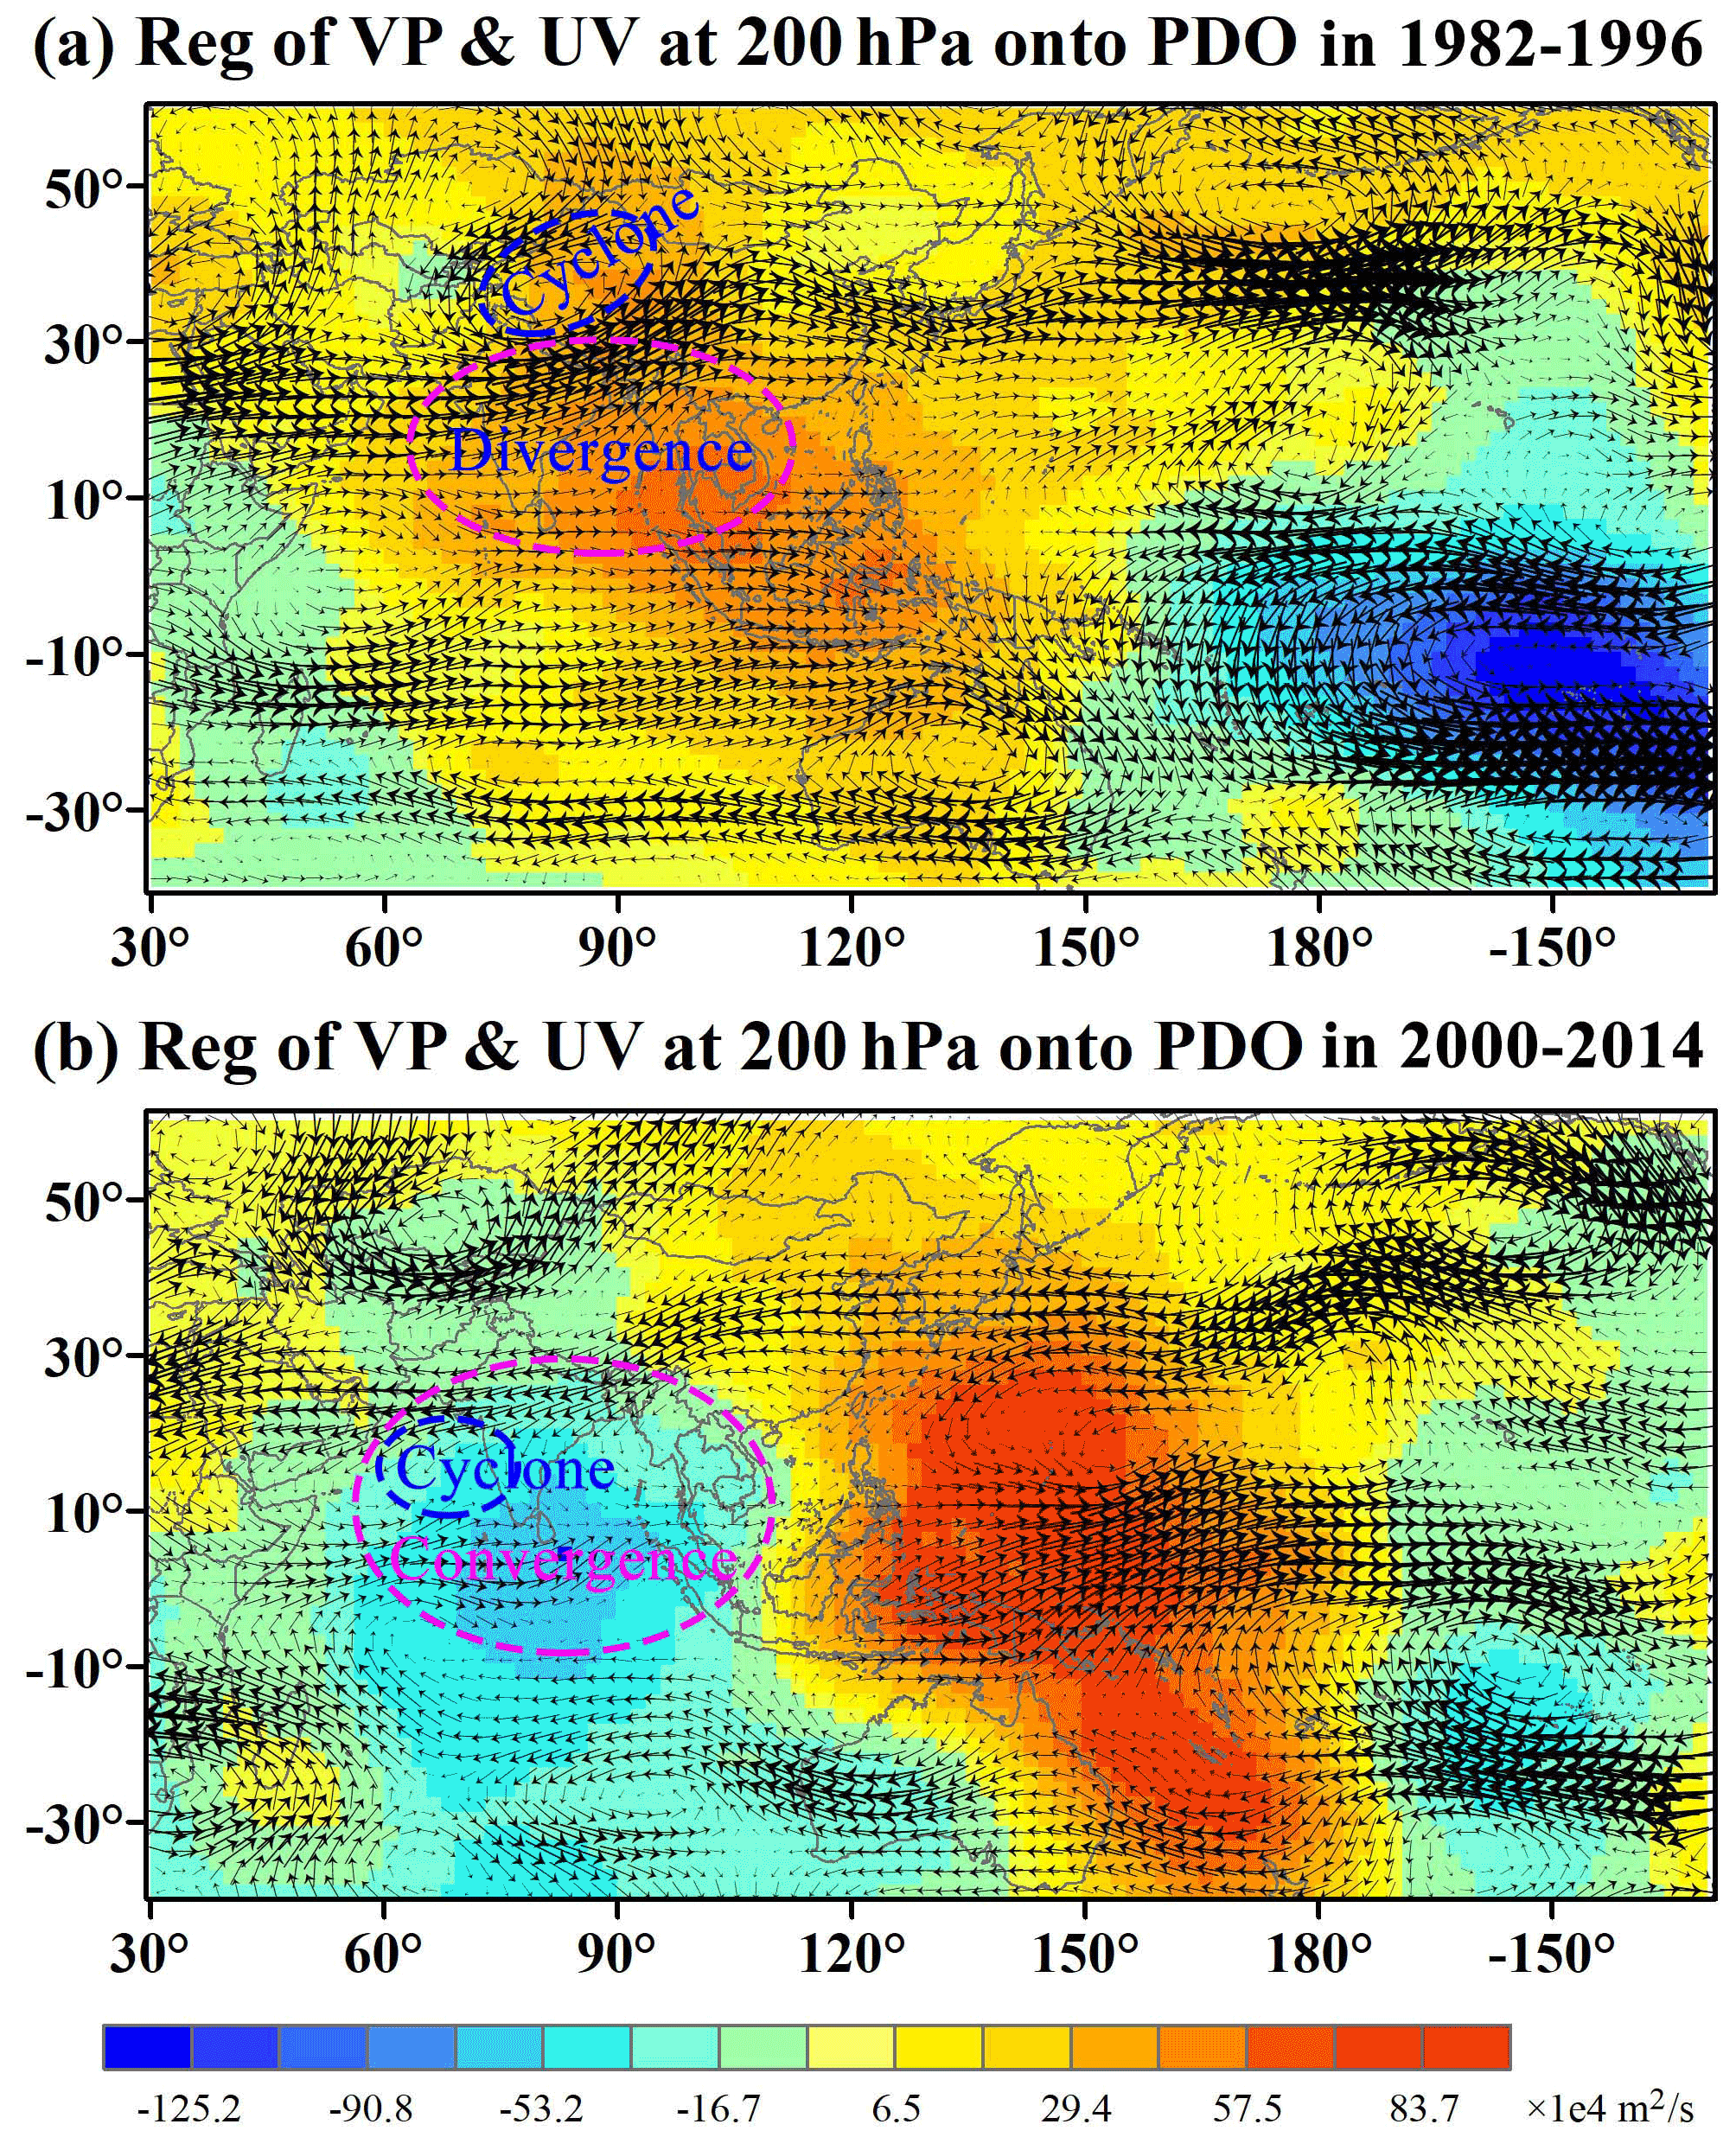
Figure 16(a) Regression of summer (June–July) velocity potential at 200 hPa onto previous winter PDO (averaged from November to January) overlaid with the average of summer wind in positive PDO years during 1982–1996. (b) Regression of summer velocity potential at 200 hPa onto previous winter PDO overlaid with the average of summer wind in negative PDO years during 2000–2014.
4.1 Response of the Atlantic SSTA pattern to CT/EM ENSO
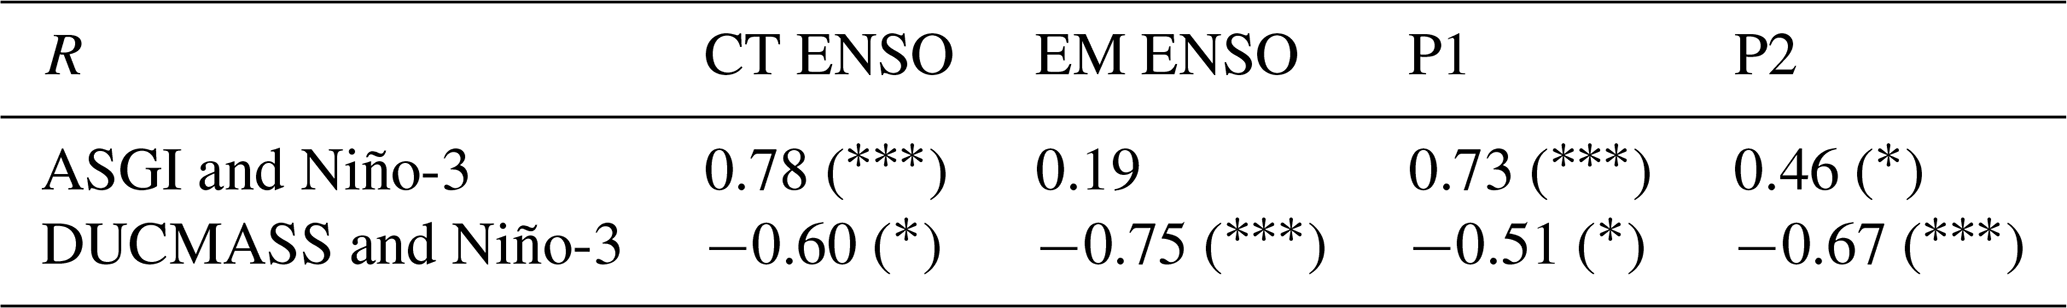
It was reported that the interdecadal shift in the tropical Atlantic SSTA pattern was a response to the multi-year ENSO events (Tokinaga et al., 2019). The multi-year ENSO event, namely, CT ENSO, was a situation where the summer ENSO SSTA continued from the preceding year. Another type of ENSO, which was called EM ENSO, was characterized as a late Atlantic SSTA response that started from June. The CT ENSO primarily dominated during P1, while P2 was dominated by EM ENSO (Yang and Huang, 2021). The impact of the two types of ENSO on the shift in the DUCMASS–Niño-3 relationship was examined. Table 3 showed that ASGI was significantly correlated with Niño-3 in the CT ENSO years, which was not observed in the EM ENSO years. Simultaneously, DUCMASS was significantly related to Niño-3 only in the EM ENSO years. The composite correlation difference between CT and EM ENSOs was consistent with that between the periods of P1 and P2, indicating that the shift in the Atlantic SSTA pattern, which was prominently modulated by the type of ENSO, plays an important role in modulating the DUCMASS–Niño-3 relationship.
Table 3Correlation between ASGI and Niño-3 as well as DUCMASS in two different phases (∗ and indicate the correlations that are significant at the 0.1 and 0.01 levels, respectively).
4.2 Response of the Indian Ocean SSTA pattern to CT/EM ENSO
As discussed in Sect. 3.2.2, ENSO can affect the Indian Ocean SST, and the Indian Ocean variability can also modulate the ENSO variability (Wu and Kirtman, 2004; Yu et al., 2002; Kug et al., 2005). It is known that, during CT ENSO years, the ENSO event in summer primarily starts from the preceding winter, while in EM ENSO years, the ENSO event mainly emerges in late spring (Yang and Huang, 2021). Correspondingly, the associated Indian Ocean SST oscillation also varies in these two different ENSO years. In order to explore whether the different types of ENSO impacted the DUCMASS over northwestern South Asia by adjusting the duration of the temperature anomaly, we compared the SST and the variance of the monthly SSTA from (−1) September to (0) May over the tropical western Indian Ocean (TWISSTA).
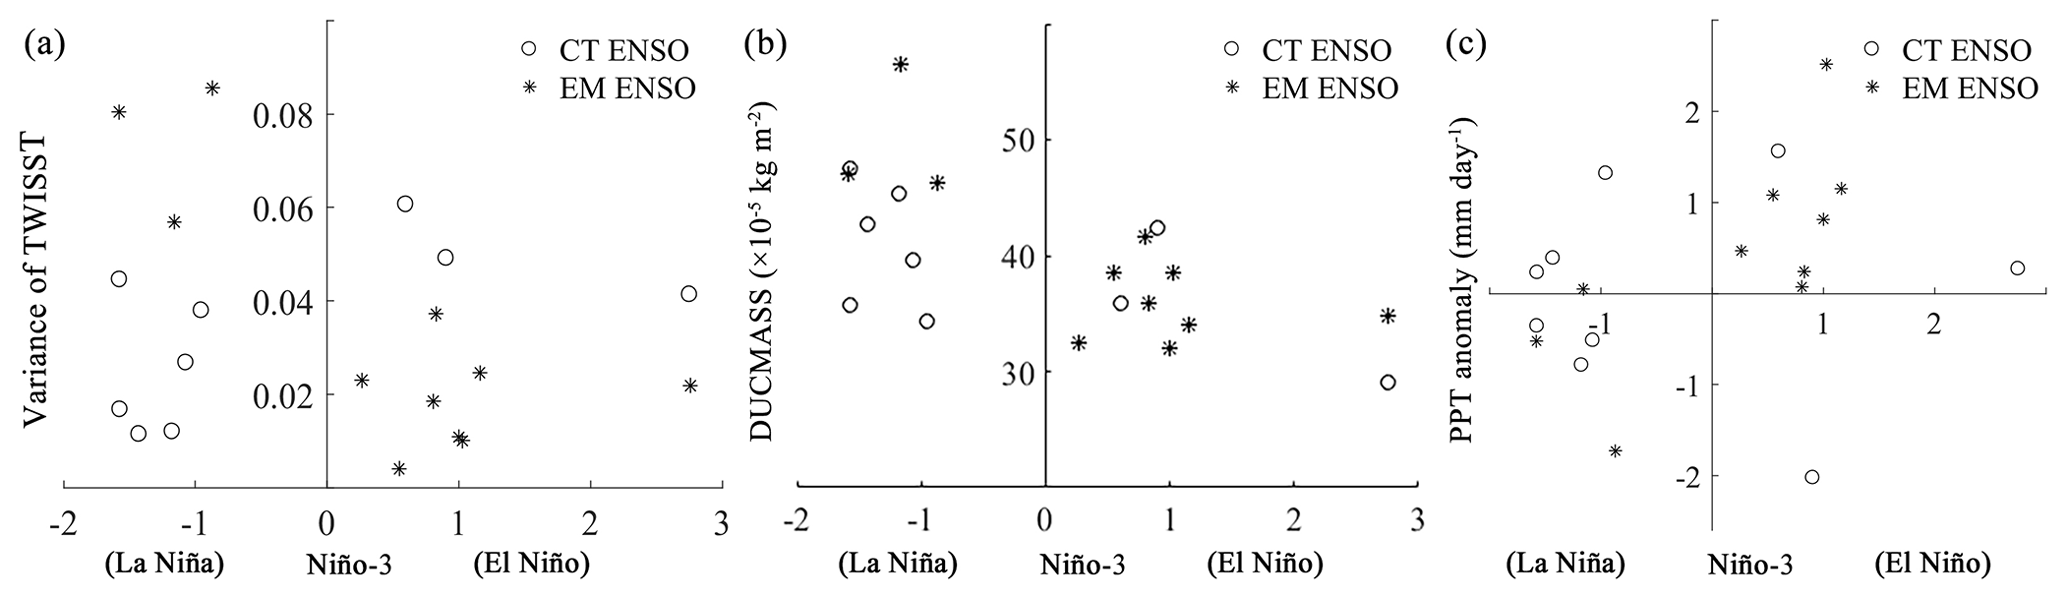
Figure 17Scatter diagram between (a) variance of the monthly TWISSTA from (−1) September to (0) May, (b) DUCMASS, and (c) the PPT anomaly and Niño-3 index separately for continuing (CT) and emerging (EM) ENSO.
Figure 17a showed that the variances in the EM La Niña years were generally larger than those in the CT La Niña years, while the variances in the EM El Niño years were generally smaller than those in the CT El Niño years. Concurrently, the difference in DUCMASS in El Niño and La Niña years was obvious in the EM ENSO period, with higher values appearing in La Niña years (Fig. 17b). However, in the CT ENSO period, no significant difference was observed between El Niño and La Niña years. Therefore, it is hypothesized that the EM ENSO conditions, which were associated with higher TWISST variance, were more favorable for triggering the variation of DUCMASS. Yang and Huang (2021) reported that P1 was primarily dominated by CT ENSOs, while EM ENSOs primarily controlled it during P2. Combined with the abovementioned hypothesis, the correlation between DUCMASS and Niño-3 should be higher in P2, which was consistent with the interdecadal change in this relationship. Figure 17c further revealed the influence mechanism of TWISSTA on DUCMASS. It showed that, compared to the CT ENSO type, the difference in PPT between El Niño and La Niña years was more significant in the EM ENSO years; in addition, the PPT in La Niña years (with a high TWISSTA variance) was lower than that in El Niño years (with a low TWISSTA variance), which was contrary to the difference in DUCMASS between those two types of ENSO years, while, when other atmospheric factors were considered, such as land cover and winds at multi-layers, no similar change was observed. This indicated that the Indian Ocean SSTA, which was also remarkably modulated by the type of ENSO, impacted DUCMASS by adjusting the PPT and further influenced the relationship between ENSO and DUCMASS.
4.3 Uncertainty in analyzing the contribution of the influence factors
The contributions of those abovementioned factors to the interdecadal shift in the ENSO-DUCMASS relationship were analyzed based on the linear regression model. However, the linear regression model would definitely bring uncertainty to the results (Guo et al., 2017) and may not be sufficient to verify the cause and effect. Thus, the numerical models are suggested for future research to quantify the contribution of those factors to the shift in the ENSO–DUCMASS relationship. However, before such a quantitative study, regression analysis is indispensable for identifying the possible driving factors. In this context, it is undeniable that this study provides new insights into the dust-storm-related numerical simulation by taking account of the teleconnections and their influence mechanisms.
In addition, while analyzing the effects of different types of ENSO events, we compared the variance of TWISST and DUCMASS under the two types of ENSO periods, as shown in Fig. 17. It showed that only 8 EM ENSO years were identified, and the number of PDO years that were in or out of phase with ENSO were also insufficient. The statistical results acquired from the insufficient number of samples could also be explained by the random events (Pallikari, 2004). In order to verify this conclusion, we calculated the interannual correlation between the variance of TWISST and DUCMASS from 1982 to 2014. Even so, the significant interannual correlation does not guarantee a significant link between different types of ENSO. Therefore, longer time series with valid samples (i.e., CT/EM ENSO and PDO years) are needed to further validate the influence of ENSO types on the ENSO–DUCMASS relationship in the future. Alternatively, using a numerical model to simulate the teleconnection pattern of ENSO over South Asia under different types of ENSO is also favorable.
Except for the large-scale atmospheric circulation, the anthropogenic land-use management could also play an important role in the interdecadal variability of the ENSO–DUCMASS relationship (Kumar et al., 1999), which should be considered in future studies.
The dust activities analyzed in this study were from the dust season, i.e., June–July, which were part of the monsoon season (June–September) (Babu et al., 2013); however, the dust activities during the pre-monsoon season (March–May or April–May) were also a hot topic (Babu et al., 2013; Lakshmi et al., 2017, 2019). Therefore, we analyzed the interdecadal change in the ENSO impact on DUCMASS during the dust season (June–July) and pre-monsoon (March–May or April–May) separately to find that the significant interdecadal change occurred only when the DUCMASS during the dust season was considered. As for that during the pre-monsoon season, there should be some other factors that influenced its interdecadal change, which will be discussed in future studies.
4.4 Precision validation of the MERRA-2 dust concentration dataset
It is known that the nonspherical aerosol optical depth retrieved from satellites, the concentration of PM2.5/PM10, and coarse-mode aerosol optical depth acquired from observation stations represents extinction characteristics of dust aerosols in the whole atmospheric column, and thus they can be used to validate the dust column concentration datasets but are not appropriate for the validation of dust emissions, which reflect the dust loading lifted from the ground. The dust dataset used in this study was the dust column concentration “Dust Column Mass Density-PM2.5”, and thus the PM2.5, coarse-mode aerosol optical depth acquired from AERONET (AERONET/DOD), and the nonspherical aerosol optical depth retrieved from MISR (MISR/DOD) were utilized to validate the precision of the DUCMASS dataset. The time coverage and continuity of satellite and observation-based products lagged behind the MERRA-2 datasets, and thus only a few stations over the dust belt with relatively longer time series were chosen. They were Kanpur (26.5∘ N, 80.2∘ E; time span: 2001–2021), Sede Boker (30.9∘ N, 34.8∘ E; time span: 2007–2019), and Tamanrasset INM (22.8∘ N, 5.5∘ E; time span: 2007–2019). The MISR/DOD, PM2.5, and dust variables from MERRA-2 were the regional averages within 1∘ of the corresponding station. No dust emission was observed over the Kanpur and Tamanrasset INM stations. Besides, the datasets over the study area (represented by the Thar Desert in Fig. 18a) were also accounted for, and the AERONET/DOD was obtained from the nearest Kanpur station. For the study area, PM2.5 was chosen as the reference dataset (A) because the study area did not overlap with the Kanpur station, while AERONET/DOD was chosen as the reference data for the other stations.
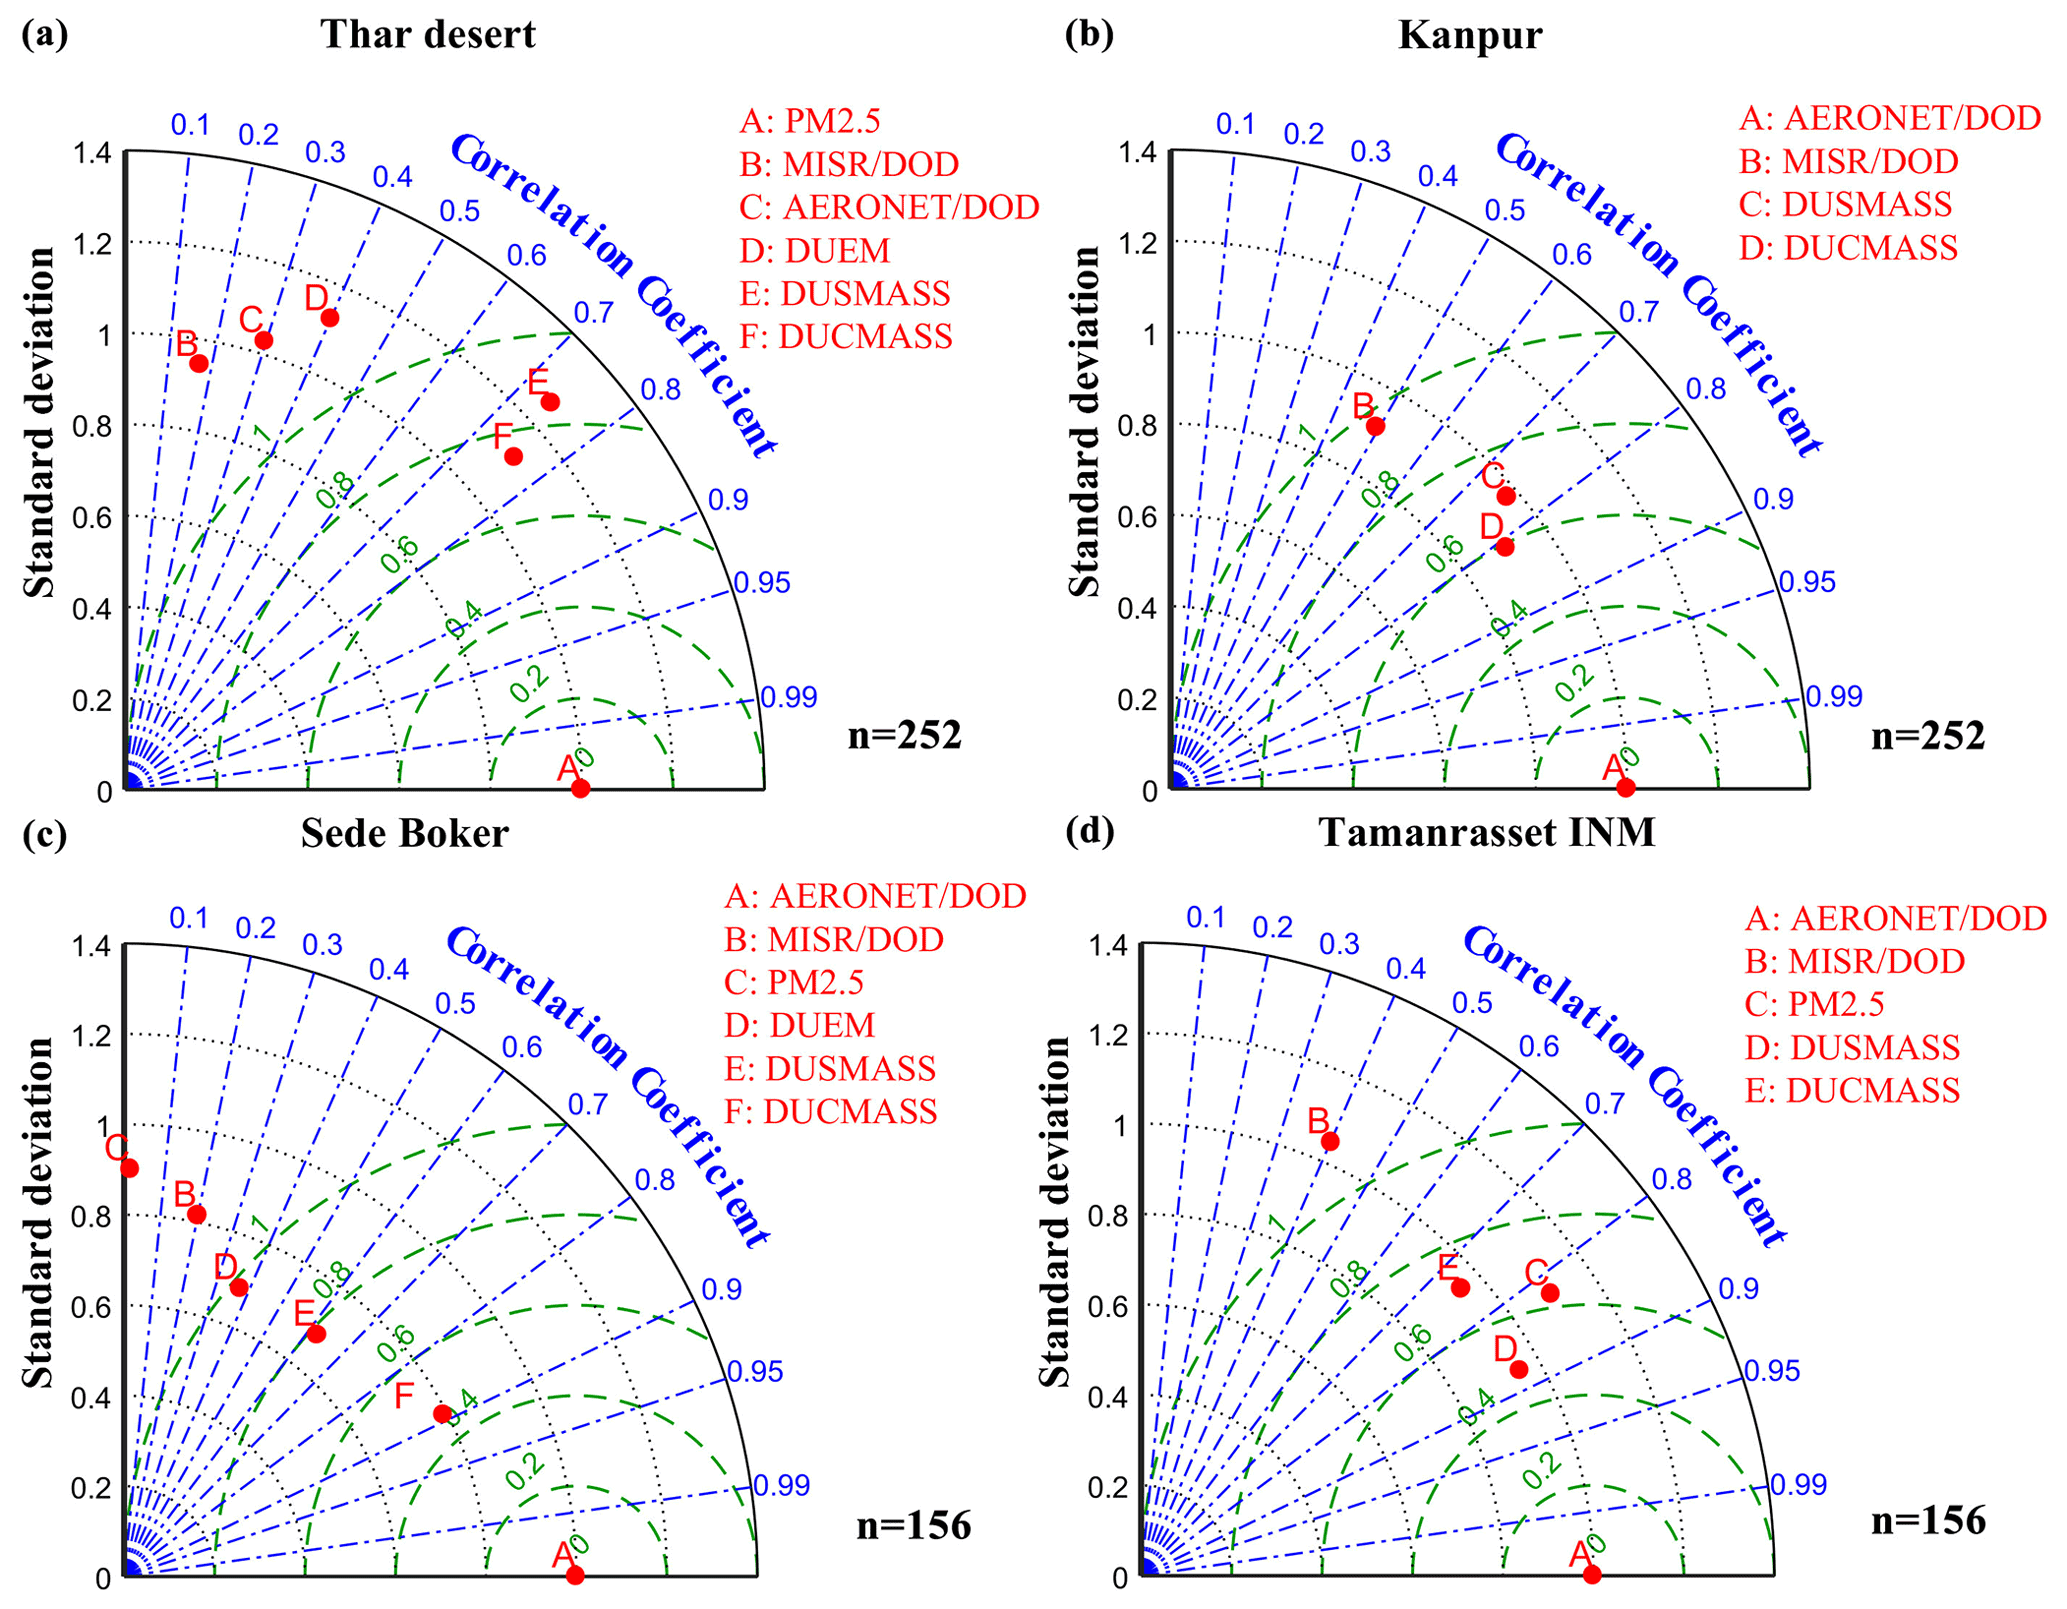
Figure 18Normalized Taylor diagrams showing (a) the difference between dust variables acquired from the MISR, AERONET, and MERRA2 datasets and that acquired from the PM2.5 dataset and (b–d) the difference between dust variables from the MISR, PM2.5, and MERRA2 datasets and that acquired from the AERONET dataset. The normalized standard deviation is on the radial axis (black contours), the correlation coefficient is on the angular axis (blue contours), and the green dashed lines indicate the centered RMSE. N indicates the sample size.
Figure 18a compared the precision of MISR/DOD, AERONET/DOD, dust emission (DUEM), surface dust mass concentration (DUSMASS), and DUCMASS to that of PM2.5. It shows that no significant correlation was observed between AERONET/DOD and PM2.5 because this study area did not coincide with the Kanpur station. However, the correlations between PM2.5 and DUSMASS as well as DUCMASS were significant (R > 0.7, RMSE < 0.9) and stronger than those between PM2.5 and DUEM. Figure 18b showed the precision of MISR/DOD, DUSMASS, and DUCMASS compared to AERONET/DOD over the Kanpur station. The results indicated that both DUSMASS and DUCMASS were significantly correlated with AERONET/DOD (R > 0.7, RMSE < 0.8). In addition, the comparison results over the other two stations also indicated that DUSMASS and DUCMASS were significantly correlated with AERONET/DOD, while the relationship between DUEM and AERONET/DOD was weak, as shown in Fig. 18c–d. The above results demonstrated that the DUCMASS from MERRA-2 was strongly consistent with MISR/DOD, AERONET/DOD, and PM2.5, indicating that the DUCMASS datasets used in this study were relatively reliable for studies on dust.
In the study, we revealed the interdecadal change in the ENSO impact on DUCMASS over northwestern South Asia from 1982 to 2014 and further investigated the factors contributing to the shifts in the responses of DUCMASS to the wintertime ENSO. It was found that the ENSO–DUCMASS relationship shifted from a weak negative relation during 1982–1996 to a significant negative correlation during 2000–2014. The change in Atlantic and Indian Ocean SSTA patterns weakened the impact of wintertime ENSO on dust activities over northwestern South Asia during 1982–1996, while the PDO tended to strengthen ENSO's effect on dust activities when it was in phase with ENSO. Both the Atlantic and Indian Ocean SSTA patterns were modulated by the duration of ENSO events (i.e., continuing and emerging ENSO). The current results are based solely on the linear regression, and further studies integrating numerical models and longer time series are needed to validate the results. Nevertheless, this study indeed found multiple large-scale factors that could impact the interdecadal interaction between ENSO and dust activities over northwestern South Asia. Given that it is possible to forecast the change in some large-scale atmospheric circulation patterns, the results of this study could provide new insight into the prediction of dust storm trends in the near future based on the variability of the ENSO–DUCMASS relationship.
The MERRA-2 dust concentration datasets were obtained from NASA Goddard Earth Sciences Data and Information Services Center (GES DISC) (https://disc.gsfc.nasa.gov/, last access: 1 February 2021, GMAO, 2021). NOAA ERSST version 5 data, COBE SST version 2 data, HadISST1.1 data, and HadCRUT version 5.0.1.0 data were obtained from NOAA Physical Sciences Laboratory website (https://psl.noaa.gov/data/gridded/data.ncep.reanalysis.html, last access: 1 March 2021, NCEP/NCAR, 2021). Large-scale climate indices from Climate Prediction Center of the National Oceanic and Atmospheric Administration (NOAA/CPC) were available at https://psl.noaa.gov/data/climateindices/list/ (last access: 1 February 2021, NOAA/CPC, 2021).
The supplement related to this article is available online at: https://doi.org/10.5194/acp-22-11255-2022-supplement.
LS designed the study, performed the analysis with feedback from JZ and FY, and wrote the paper that was reviewed by JZ, FY, DZ, JW, XM, and YL. All the authors discussed the results.
The contact author has declared that none of the authors has any competing interests.
Publisher's note: Copernicus Publications remains neutral with regard to jurisdictional claims in published maps and institutional affiliations.
This article is part of the special issue “Dust aerosol measurements, modeling and multidisciplinary effects (AMT/ACP inter-journal SI)”. It is not associated with a conference.
The authors are grateful to the Modern-Era Retrospective Analysis for Research and Applications, version 2 (MERRA-2) for providing the surface dust mass concentration, wind speed, and planetary boundary-layer height, the National Oceanic and Atmospheric Administration (NOAA) for providing the SST, the Hadley Centre Climate Research Unit for the land-surface temperature and precipitation, the National Aeronautics and Space Administration (NASA) for the NDVI, and the Climate Prediction Center of the National Oceanic and Atmospheric Administration (NOAA/CPC) for the large-scale climate indices.
This research has been supported by the CAS Key Laboratory of Digital Earth Science (grant no. XDA19030402) and the National Natural Science Foundation of China (grant no. 42071425).
This paper was edited by Hang Su and reviewed by three anonymous referees.
Abish, B. and Mohanakumar, K.: Absorbing aerosol variability over the Indian subcontinent and its increasing dependence on ENSO, Glob. Planet. Change, 106, 13–19, https://doi.org/10.1016/j.gloplacha.2013.02.007, 2013.
Ashok, K., Behera, S. K., Rao, S. A., Weng, H., and Yamagata, T.: El Nino Modoki and its possible teleconnection, J. Geophys. Res., 112, C11007, https://doi.org/10.1029/2006JC003798, 2007.
Avila, A.: The chemical composition of dust transported in red rains – its contribution to the biogeochemical cycle of a holm oak forest in Catalonia (Spain), Atmos. Environ., 32, 179–191, https://doi.org/10.1016/S1352-2310(97)00286-0, 1998.
Babu, S. S., Manoj, M. R., Moorthy, K. K., Gogoi, M. M., Nair, V. S., Kompalli, S. K., Satheesh, S. K., Niranjan, K., Ramagopal, K., Bhuyan, P. K., and Singh, D.: Trends in aerosol optical depth over Indian region: Potential causes and impact indicators, J. Geophys. Res.-Atmos., 118, 11794–11806, https://doi.org/10.1002/2013JD020507, 2013.
Banerjee, P. and Kumar, S. P.: ENSO modulation of interannual variability of dust aerosols over the northwest Indian Ocean, J. Clim., 29, 1391–1415, https://doi.org/10.1175/JCLI-D-15-0039.1, 2016.
Banerjee, P., Satheesh, S. K., Moorthy, K. K., Nanjundiah, R. S., and Nair, V. S.: Long-range transport of mineral dust to the northeast Indian Ocean: Regional versus remote sources and the implications, J. Clim., 32, 1525–1549, https://doi.org/10.1175/JCLI-D-18-0403.1, 2019.
Behrooz, R. D., Esmaili-Sari, A., Bahramifar, N., and Kaskaoutis, D. G.: Analysis of the TSP, PM10 concentrations and water-soluble ionic species in airborne samples over Sistan, Iran during the summer dusty period, Atmos. Pollut. Res., 8, 403–417, https://doi.org/10.1016/j.apr.2016.11.001, 2017.
Bollasina, M. A., Ming, Y., and Ramaswamy, V.: Anthropogenic aerosols and the weakening of the south asian summer monsoon, Science, 334, 502–505, https://doi.org/10.1126/science.1204994, 2011.
Bozlaker, A., Prospero, J. M., Fraser, M. P., and Chellam, S.: Quantifying the contribution of long-range saharan dust transport on particulate matter concentrations in Houston, Texas, using detailed elemental analysis, Environ. Sci. Technol., 47, 10179–10187, https://doi.org/10.1021/es4015663, 2013.
Buchard, V., Randles, C. A., da Silva, A. M., Darmenov, A., Colarco, P. R., Govindaraju, R., Ferrare, R., Hair, J., Beyersdorf, A. J., Ziemba, L. D., and Yu, H.: The MERRA-2 aerosol reanalysis, 1980 onward. Part II: Evaluation and case studies, J. Clim., 30, 6851–6872, https://doi.org/10.1175/JCLI-D-16-0613.1, 2017.
Cai, W., Borlace, S., Lengaigne, M., Van Rensch, P., Collins, M., Vecchi, G., Timmermann, A., Santoso, A., Mcphaden, M. J., Wu, L., England, M. H., Wang, G., Guilyardi, E., and Jin, F. F.: Increasing frequency of extreme El Niño events due to greenhouse warming, Nat. Clim. Chang., 4, 111–116, https://doi.org/10.1038/nclimate2100, 2014.
Chauhan, S. S.: Desertification control and management of land degradation in the Thar desert of India, Environmentalist, 23, 219–227, https://doi.org/10.1023/B:ENVR.0000017366.67642.79, 2003.
Chen, Y.-S., Sheen, P.-C., Chen, E.-R., Liu, Y.-K., Wu, T.-N., and Yang, C.-Y.: Effects of Asian dust storm events on daily mortality in Taipei, Taiwan, Environ. Res., 95, 151–155, https://doi.org/10.1016/j.envres.2003.08.008, 2004.
Cherchi, A. and Navarra, A.: Influence of ENSO and of the Indian Ocean Dipole on the Indian summer monsoon variability, Clim. Dyn., 41, 81–103, https://doi.org/10.1007/s00382-012-1602-y, 2013.
Clark, C. O., Cole, J. E., and Webster, P. J.: Indian Ocean SST and Indian summer rainfall: Predictive relationships and their decadal variability, J. Clim., 13, 2503–2519, https://doi.org/10.1175/1520-0442(2000)013<2503:IOSAIS>2.0.CO;2, 2000.
Dong, B., Dai, A., Vuille, M., and Timm, O. E.: Asymmetric modulation of ENSO teleconnections by the interdecadal Pacific oscillation, J. Clim., 31, 7337–7361, https://doi.org/10.1175/JCLI-D-17-0663.1, 2018.
Du, Y., Xie, S. P., Huang, G., and Hu, K.: Role of air-sea interaction in the long persistence of El Niño-induced north Indian Ocean warming, J. Clim., 22, 2023–2038, https://doi.org/10.1175/2008JCLI2590.1, 2009.
Easterling, D. R. and Wehner, M. F.: Is the climate warming or cooling?, Geophys. Res. Lett., 36, 4–6, https://doi.org/10.1029/2009GL037810, 2009.
Erel, Y., Dayan, U., Rabi, R., Rudich, Y., and Stein, M.: Trans boundary transport of pollutants by atmospheric mineral dust, Environ. Sci. Technol., 40, 2996–3005, https://doi.org/10.1021/es051502l, 2006.
Fyfe, J. C., Merryfield, W. J., Kharin, V., Boer, G. J., Lee, W. S., and Von Salzen, K.: Skillful predictions of decadal trends in global mean surface temperature, Geophys. Res. Lett., 38, 1–5, https://doi.org/10.1029/2011GL049508, 2011.
Fyfe, J. C., Gillett, N. P., and Zwiers, F. W.: Overestimated global warming over the past 20 years, Nat. Clim. Chang., 3, 767–769, https://doi.org/10.1038/nclimate1972, 2013.
Gelaro, R., McCarty, W., Suárez, M. J., Todling, R., Molod, A., Takacs, L., Randles, C. A., Darmenov, A., Bosilovich, M. G., Reichle, R., Wargan, K., Coy, L., Cullather, R., Draper, C., Akella, S., Buchard, V., Conaty, A., da Silva, A. M., Gu, W., Kim, G. K., Koster, R., Lucchesi, R., Merkova, D., Nielsen, J. E., Partyka, G., Pawson, S., Putman, W., Rienecker, M., Schubert, S. D., Sienkiewicz, M., and Zhao, B.: The modern-era retrospective analysis for research and applications, version 2 (MERRA-2), J. Clim., 30, 5419–5454, https://doi.org/10.1175/JCLI-D-16-0758.1, 2017.
Global Modeling and Assimilation Office (GMAO): MERRA-2, NASA Goddard Earth Sciences Data and Information Services Center (GES DISC) [data set], https://disc.gsfc.nasa.gov/, last access: 1 February 2021.
Graham, N. E.: Decadal-scale climate variability in the tropical and North Pacific during the 1970s and 1980s: observations and model results, Clim. Dyn., 10, 135–162, https://doi.org/10.1007/BF00210626, 1994.
Guo, H., Wang, X., and Gao, Z.: Uncertain linear regression model and its application, J. Intell. Manuf., 28, 559–564, https://doi.org/10.1007/s10845-014-1022-4, 2017.
Hansen, J. E., Sato, M., and Ruedy, R.: Radiative forcing and climate response, J. Geophys. Res.-Atmos., 102, 6831–6864, https://doi.org/10.1029/96JD03436, 1997.
He, L., Lin, A., Chen, X., Zhou, H., Zhou, Z., and He, P.: Assessment of MERRA-2 Surface PM2.5 over the Yangtze River Basin: Ground-based verification, spatiotemporal distribution and meteorological dependence, Remote Sens., 11, 460, https://doi.org/10.3390/rs11040460, 2019.
He, S. and Wang, H.: Oscillating relationship between the East Asian Winter Monsoon and ENSO, J. Clim., 26, 9819–9838, https://doi.org/10.1175/JCLI-D-13-00174.1, 2013.
Hirahara, S., Ishii, M., and Fukuda, Y.: Centennial-scale sea surface temperature analysis and its uncertainty, J. Clim., 27, 57–75, https://doi.org/10.1175/JCLI-D-12-00837.1, 2014.
Hu, S. and Fedorov, A. V.: The extreme El Niño of 2015–2016 and the end of global warming hiatus, Geophys. Res. Lett., 44, 3816–3824, https://doi.org/10.1002/2017GL072908, 2017.
Huang, B., Thorne, P. W., Banzon, V. F., Boyer, T., Chepurin, G., Lawrimore, J. H., Menne, M. J., Smith, T. M., Vose, R. S., and Zhang, H. M.: Extended reconstructed Sea surface temperature, Version 5 (ERSSTv5): Upgrades, validations, and intercomparisons, J. Clim., 30, 8179–8205, https://doi.org/10.1175/JCLI-D-16-0836.1, 2017.
Huang, X., Zhou, T., Turner, A., Dai, A., Chen, X., Clark, R., Jiang, J., Man, W., Murphy, J., Rostron, J., Wu, B., Zhang, L., Zhang, W., and Zou, L.: The recent decline and recovery of Indian summer monsoon rainfall: Relative roles of external forcing and internal variability, J. Clim., 33, 5035–5060, https://doi.org/10.1175/JCLI-D-19-0833.1, 2020.
Jin, Q. and Wang, C.: The greening of Northwest Indian subcontinent and reduction of dust abundance resulting from Indian summer monsoon revival, Sci. Rep., 8, 1–9, https://doi.org/10.1038/s41598-018-23055-5, 2018.
Jin, Q., Wei, J., Pu, B., Yang, Z. L., and Parajuli, S. P.: High Summertime Aerosol Loadings Over the Arabian Sea and Their Transport Pathways, J. Geophys. Res.-Atmos., 123, 10568–10590, https://doi.org/10.1029/2018JD028588, 2018.
Jin, Q., Wei, J., Lau, W. K. M., Pu, B., and Wang, C.: Interactions of Asian mineral dust with Indian summer monsoon: Recent advances and challenges, Earth-Sci. Rev., 215, 103562, https://doi.org/10.1016/j.earscirev.2021.103562, 2021.
Kaiser, J. and Granmar, M.: Mounting Evidence Indicts Fine-Particle Pollution, Science, 307, 1858–1861, https://doi.org/10.1126/science.307.5717.1858a, 2005.
Kinter, I. L., Miyakoda, K., and Yang, S.: Recent change in the connection from the Asian monsoon to ENSO, J. Clim., 15, 1203–1215, https://doi.org/10.1175/1520-0442(2002)015<1203:RCITCF>2.0.CO;2, 2002.
Krishnamurthy, L. and Krishnamurthy, V.: Influence of PDO on South Asian summer monsoon and monsoon-ENSO relation, Clim. Dyn., 42, 2397–2410, https://doi.org/10.1007/s00382-013-1856-z, 2014.
Krishnamurthy, V. and Kirtman, B. P.: Variability of the Indian Ocean: Relation to monsoon and ENSO, Q. J. R. Meteorol. Soc., 129, 1623–1646, https://doi.org/10.1256/qj.01.166, 2003.
Kucharski, F., Bracco, A., Yoo, J. H., and Molteni, F.: Low-frequency variability of the Indian monsoon-ENSO relationship and the tropical Atlantic: The “weakening” of the 1980s and 1990s, J. Clim., 20, 4255–4266, https://doi.org/10.1175/JCLI4254.1, 2007.
Kug, J. S., An, S. Il, Jin, F. F., and Kang, I. S.: Preconditions for El Niño and La Niña onsets and their relation to the Indian Ocean, Geophys. Res. Lett., 32, 1–5, https://doi.org/10.1029/2004GL021674, 2005.
Kumar, K. K., Rajagopalan, B., and Cane, M. A.: On the weakening relationship between the indian monsoon and ENSO, Science, 284, 2156–2159, https://doi.org/10.1126/science.284.5423.2156, 1999.
Lakshmi, N. B., Nair, V. S., and Suresh Babu, S.: Vertical structure of aerosols and mineral dust over the Bay of Bengal from multisatellite observations, J. Geophys. Res.-Atmos., 122, 12845–12861, https://doi.org/10.1002/2017JD027643, 2017.
Lakshmi, N. B., Babu, S. S., and Nair, V. S.: Recent Regime Shifts in Mineral Dust Trends over South Asia from Long-Term CALIPSO Observations, IEEE Trans. Geosci. Remote Sens., 57, 4485–4489, https://doi.org/10.1109/TGRS.2019.2891338, 2019.
Lee, Y. G., Kim, J., Ho, C. H., An, S. Il, Cho, H. K., Mao, R., Tian, B., Wu, D., Lee, J. N., Kalashnikova, O., Choi, Y., and Yeh, S. W.: The effects of ENSO under negative AO phase on spring dust activity over northern China: An observational investigation, Int. J. Climatol., 35, 935–947, https://doi.org/10.1002/joc.4028, 2015.
Liu, J., Wu, D., Liu, G., Mao, R., Chen, S., Ji, M., Fu, P., Sun, Y., Pan, X., Jin, H., Zhou, Y., and Wang, X.: Impact of Arctic amplification on declining spring dust events in East Asia, Clim. Dyn., 54, 1913–1935, https://doi.org/10.1007/s00382-019-05094-4, 2020.
Mahowald, N., Albani, S., Kok, J. F., Engelstaeder, S., Scanza, R., Ward, D. S., and Flanner, M. G.: The size distribution of desert dust aerosols and its impact on the Earth system, Aeolian Res., 15, 53–71, https://doi.org/10.1016/j.aeolia.2013.09.002, 2014.
Mahowald, N. M., Yoshioka, M., Collins, W. D., Conley, A. J., Fillmore, D. W., and Coleman, D. B.: Climate response and radiative forcing from mineral aerosols during the last glacial maximum, pre-industrial, current and doubled-carbon dioxide climates, Geophys. Res. Lett., 332, 382–385, https://doi.org/10.1029/2006GL026126, 2006.
Mahowald, N. M., Kloster, S., Engelstaedter, S., Moore, J. K., Mukhopadhyay, S., McConnell, J. R., Albani, S., Doney, S. C., Bhattacharya, A., Curran, M. A. J., Flanner, M. G., Hoffman, F. M., Lawrence, D. M., Lindsay, K., Mayewski, P. A., Neff, J., Rothenberg, D., Thomas, E., Thornton, P. E., and Zender, C. S.: Observed 20th century desert dust variability: impact on climate and biogeochemistry, Atmos. Chem. Phys., 10, 10875–10893, https://doi.org/10.5194/acp-10-10875-2010, 2010.
Miller, R. L. and Tegen, I.: Climate response to soil dust aerosols, J. Clim., 11, 3247–3267, https://doi.org/10.1175/1520-0442(1998)011<3247:CRTSDA>2.0.CO;2, 1998.
National Centers for Environmental Prediction/National Center for Atmospheric Research (NCEP/NCAR): Atmospheric reanalysis dataset, Physical Sciences Laboratory (PSL) [data set], https://psl.noaa.gov/data/gridded/data.ncep.reanalysis.html, last access: 1 March 2021.
Nitta, T. and Yamada, S.: Recent warming of tropical sea surface temperature and its relationship to the Northern Hemisphere circulation, J. Meteorol. Soc. Japan, 67, 375–383, https://doi.org/10.2151/jmsj1965.67.3_375, 1989.
NOAA/CPC: Climate indices: monthly atmospheric and ocean time series, Climate Prediction Center of the National Oceanic and Atmospheric Administration (NOAA/CPC), Physical Sciences Laboratory (PSL) [data set], https://psl.noaa.gov/data/climateindices/list/, last access: 1 February 2021.
Osborn, T. J., Jones, P. D., Lister, D. H., Morice, C. P., Simpson, I. R., Winn, J. P., Hogan, E., and Harris, I. C.: Land Surface Air Temperature Variations Across the Globe Updated to 2019: The CRUTEM5 Data Set, J. Geophys. Res.-Atmos., 126, e2019JD032352, https://doi.org/10.1029/2019JD032352, 2021.
Pallikari, F.: On the false hypothesis of psi-mediated shift of statistical average in tests with random number generators, in: The Parapsychological Association Convention 2004, 5–8 August 2004, Vienna University, 157–171, https://doi.org/10.13140/2.1.4054.5289, 2004.
Parker, D. J., Willetts, P., Birch, C., Turner, A. G., Marsham, J. H., Taylor, C. M., Kolusu, S., and Martin, G. M.: The interaction of moist convection and mid-level dry air in the advance of the onset of the Indian monsoon, Q. J. R. Meteorol. Soc., 142, 2256–2272, https://doi.org/10.1002/qj.2815, 2016.
Poulsen, O. M., Breum, N. O., Ebbehoj, N., Hansen, A. M., Ivens, U. I., van Lelieveld, D., Malmros, P., Matthiasen, L., Nielsen, B. H., and Nielsen, E. M.: Sorting and recycling of domestic waste. Review of occupational health problems and their possible causes, Sci. Total Environ., 168, 33–56, https://doi.org/10.1016/0048-9697(95)04521-2, 1995.
Prospero, J. M. and Nees, R. T.: Impact of the North African drought and El Niño on mineral dust in the Barbados trade winds, Nature, 320, 735–738, https://doi.org/10.1038/320735a0, 1986.
Randles, C. A., Sliva, A. M. da, Buchard, V., Colarco, P., Armenov, A., and Govindaraju, R.: The MERRA-2 Aerosol Reanalysis, 1980 Onward. Part I: System Description and Data Assimilation Evaluation, J. Clim., 30, 6823–6850, https://doi.org/10.1175/JCLI-D-16-0609.1, 2017.
Rayner, N. A., Parker, D. E., Horton, E. B., Folland, C. K., Alexander, L. V., Rowell, D. P., Kent, E. C., and Kaplan, A.: Global analyses of sea surface temperature, sea ice, and night marine air temperature since the late nineteenth century, J. Geophys. Res.-Atmos., 108, 4407, https://doi.org/10.1029/2002jd002670, 2003.
Razakov, R. M. and Kosnazarov, K. A.: Dust and salt transfer from the exposed bed of the Aral Sea and measures to decrease its environmental impact, in: The Aral Sea Basin, edited by: Micklin, P. P. and Williams, W. D., Springer, Berlin, Heidelberg, 95–102, https://doi.org/10.1007/978-3-642-61182-7_9, 1996.
Richon, C., Dutay, J.-C., Dulac, F., Wang, R., and Balkanski, Y.: Modeling the biogeochemical impact of atmospheric phosphate deposition from desert dust and combustion sources to the Mediterranean Sea, Biogeosciences, 15, 2499–2524, https://doi.org/10.5194/bg-15-2499-2018, 2018.
Sabeerali, C. T., Ajayamohan, R. S., Bangalath, H. K., and Chen, N.: Atlantic Zonal Mode: An Emerging Source of Indian Summer Monsoon Variability in a Warming World, Geophys. Res. Lett., 46, 4460–4467, https://doi.org/10.1029/2019GL082379, 2019.
Sanchez de la Campa, A., Garcia-Salamanca, A., Solano, J., de la Rosa, J., and Ramos, J.-L.: Chemical and microbiological characterization of atmospheric particulate matter during an intense African dust event in Southern Spain., Environ. Sci. Technol., 47, 3630–3638, https://doi.org/10.1021/es3051235, 2013.
Schulz, M., Prospero, J. M., Baker, A. R., Dentener, F., Ickes, L., Liss, P. S., Mahowald, N. M., Nickovic, S., García-Pando, C. P., Rodríguez, S., Sarin, M., Tegen, I., and Duce, R. A.: Atmospheric Transport and Deposition of Mineral Dust to the Ocean: Implications for Research Needs, Environ. Sci. Technol., 46, 10390–10404, https://doi.org/10.1021/es300073u, 2012.
Singh, R. P., Prasad, A. K., Kayetha, V. K., and Kafatos, M.: Enhancement of oceanic parameters associated with dust storms using satellite data, J. Geophys. Res., 113, C11008, https://doi.org/10.1029/2008JC004815, 2008.
Srivastava, G., Chakraborty, A., and Nanjundiah, R. S.: Multidecadal see-saw of the impact of ENSO on Indian and West African summer monsoon rainfall, Clim. Dyn., 52, 6633–6649, https://doi.org/10.1007/s00382-018-4535-2, 2019.
Tegen, I., Lacis, A. A., and Fung, I.: The influence on climate forcing of mineral aerosols from disturbed soils, Nature, 380, 419–422, https://doi.org/10.1038/380419a0, 1996.
Tokinaga, H., Richter, I., and Kosaka, Y.: ENSO Influence on the Atlantic Niño, Revisited: Multi-Year versus Single-Year ENSO Events, J. Clim., 32, 4585–4600, https://doi.org/10.1175/JCLI-D-18-0683.1, 2019.
Trenberth, K. E. and Hurrell, J. W.: Decadal atmosphere-ocean variations in the Pacific, Clim. Dyn., 9, 303–319, https://doi.org/10.1007/BF00204745, 1994.
Trenberth, K. E., Dai, A., Van Der Schrier, G., Jones, P. D., Barichivich, J., Briffa, K. R., and Sheffield, J.: Global warming and changes in drought, Nat. Clim. Chang., 4, 17–22, https://doi.org/10.1038/nclimate2067, 2014.
Veselovskii, I., Goloub, P., Podvin, T., Tanre, D., da Silva, A., Colarco, P., Castellanos, P., Korenskiy, M., Hu, Q., Whiteman, D. N., Pérez-Ramírez, D., Augustin, P., Fourmentin, M., and Kolgotin, A.: Characterization of smoke and dust episode over West Africa: comparison of MERRA-2 modeling with multiwavelength Mie–Raman lidar observations, Atmos. Meas. Tech., 11, 949–969, https://doi.org/10.5194/amt-11-949-2018, 2018.
von Storch, H. and Zwiers, F. W.: Statistical Analysis in Climate Research, Cambridge University Press, Cambridge, https://doi.org/10.1017/CBO9780511612336, 1999.
Wang, B., Wu, R., and Li, T.: Atmosphere-warm ocean interaction and its impacts on Asian-Australian monsoon variation, J. Clim., 16, 1195–1211, https://doi.org/10.1175/1520-0442(2003)16<1195:AOIAII>2.0.CO;2, 2003.
Wang, L., Chen, W., and Huang, R.: Interdecadal modulation of PDO on the impact of ENSO on the east Asian winter monsoon, Geophys. Res. Lett., 35, L20702, https://doi.org/10.1029/2008GL035287, 2008.
Wang, S., Huang, J., He, Y., and Guan, Y.: Combined effects of the Pacific Decadal Oscillation and El Niño-Southern Oscillation on Global Land Dry-Wet Changes, Sci. Rep., 4, 6651, https://doi.org/10.1038/srep06651, 2014.
Watanabe, M. and Jin, F. F.: Role of Indian Ocean warming in the development of Philippine Sea anticyclone during ENSO, Geophys. Res. Lett., 29, 1161–1164, https://doi.org/10.1029/2001gl014318, 2002.
Weare, B. C., Navato, A. R., and Newell, R. E.: Empirical orthogonal analysis of Pacific sea surface temperatures, J. Phys. Oceanogr., 6, 671–678, https://doi.org/10.1175/1520-0485(1976)006<0671:EOAOPS>2.0.CO;2, 1976.
Weng, H., Ashok, K., Behera, S. K., Rao, S. A., and Yamagata, T.: Impacts of recent El Niño Modoki on dry/wet conditions in the Pacific rim during boreal summer, Clim. Dyn., 29, 113–129, https://doi.org/10.1007/s00382-007-0234-0, 2007.
Wu, R. and Kirtman, B. P.: Understanding the impacts of the Indian ocean on ENSO variability in a coupled GCM, J. Clim., 17, 4019–4031, https://doi.org/10.1175/1520-0442(2004)017<4019:UTIOTI>2.0.CO;2, 2004.
Wu, X., Liu, J., Wu, Y., Wang, X., Yu, X., Shi, J., and Bi, J.: Aerosol optical absorption coefficients at a rural site in Northwest China: The great contribution of dust particles, Atmos. Environ., 189, 145–152, https://doi.org/10.1016/j.atmosenv.2018.07.002, 2018.
Xi, X. and Sokolik, I. N.: Dust interannual variability and trend in Central Asia from 2000 to 2014 and their climatic linkages, J. Geophys. Res.-Atmos., 120, 12175–12191, https://doi.org/10.1038/175238c0, 2016.
Yang, S. and Jiang, X.: Prediction of Eastern and Central Pacific ENSO Events and Their Impacts on East Asian Climate by the NCEP Climate Forecast System, J. Clim., 27, 4451–4472, https://doi.org/10.1175/JCLI-D-13-00471.1, 2014.
Yang, X. and Huang, P.: Restored relationship between ENSO and Indian summer monsoon rainfall around 1999/2000, Innov., 2, 100102, https://doi.org/10.1016/j.xinn.2021.100102, 2021.
Yu, J. and Kao, H.: Decadal changes of ENSO persistence barrier in SST and ocean heat content indices: 1958–2001, J. Geophys. Res., 112, 1–10, https://doi.org/10.1029/2006JD007654, 2007.
Yu, J.-Y., Mechoso, C. R., McWilliams, J. C., and Arakawa, A.: Impacts of the Indian Ocean on the ENSO cycle, Geophys. Res. Lett., 29, 1204, https://doi.org/10.1029/2001GL014098, 2002.
Yu, Y., Notaro, M., Liu, Z., Wang, F., Alkolibi, F., Fadda, E., and Bakhrjy, F.: Climatic controls on the interannual to decadal variability in Saudi Arabian dust activity: Toward the development of a seasonal dust prediction model, J. Geophys. Res.-Atmos., 120, 1739–1758, https://doi.org/10.1002/jgrc.20224, 2015.
Yuan, Y. and Yang, S.: Impacts of Different Types of El Niño on the East Asian Climate: Focus on ENSO Cycles, J. Clim., 25, 7702–7722, https://doi.org/10.1175/JCLI-D-11-00576.1, 2012.