the Creative Commons Attribution 4.0 License.
the Creative Commons Attribution 4.0 License.
 | 29 Aug 2022
Composition and reactivity of volatile organic compounds in the South Coast Air Basin and San Joaquin Valley of California
Shang Liu
Barbara Barletta
Rebecca S. Hornbrook
Alan Fried
Jeff Peischl
Simone Meinardi
Matthew Coggon
Aaron Lamplugh
Jessica B. Gilman
Georgios I. Gkatzelis
Carsten Warneke
Eric C. Apel
Alan J. Hills
Ilann Bourgeois
James Walega
Petter Weibring
Dirk Richter
Toshihiro Kuwayama
Michael FitzGibbon
Donald Blake
Comprehensive aircraft measurements of volatile organic compounds (VOCs) covering the South Coast Air Basin (SoCAB) and San Joaquin Valley (SJV) of California were obtained in the summer of 2019. Combined with the CO, CH4, and NOx data, the total calculated gas-phase hydroxyl radical reactivity (cOHRTOTAL) was quantified to be 6.1 and 4.6 s−1 for the SoCAB and SJV, respectively. VOCs accounted for ∼ 60 %–70 % of the cOHRTOTAL in both basins. In particular, oxygenated VOCs (OVOCs) contributed >60 % of the cOHR of total VOCs (cOHRVOC) and the total observed VOC mixing ratio. Primary biogenic VOCs (BVOCs) represented a minor fraction (<2 %) of the total VOC mixing ratio but accounted for 21 % and 6 % of the cOHRVOC in the SoCAB and SJV, respectively. Furthermore, the contribution of BVOCs to the cOHRVOC increased with increasing cOHRVOC in the SoCAB, suggesting that BVOCs were important ozone precursors during high ozone episodes. Spatially, the trace gases were heterogeneously distributed in the SoCAB, with their mixing ratios and cOHR being significantly greater over the inland regions than the coast, while their levels were more evenly distributed in SJV. The results highlight that a better grasp of the emission rates and sources of OVOCs and BVOCs is essential for a predictive understanding of the ozone abundance and distribution in California.
- Article
(2734 KB) - Full-text XML
-
Supplement
(1043 KB) - BibTeX
- EndNote


Ambient ozone (O3) is a criteria pollutant that forms from complex photochemical reactions of volatile organic compounds (VOCs) and oxides of nitrogen () in the presence of sunlight. Exposure to O3 can lead to adverse health problems such as airway inflammation and decreased lung function, especially in susceptible populations such as children (Nuvolone et al., 2017; Kampa and Castanas, 2008). Persistent NOx emission control measures in California have resulted in the substantially reduced ambient O3 levels, e.g., the ozone design value (ODV) decreased by over 60 % in California's South Coast Air Basin (SoCAB) from 273 parts per billion (ppb) in 1980 to 102 ppb in 2015 (Parrish et al., 2017). However, the SoCAB and San Joaquin Valley (SJV) continue to exceed the health-based, 8 h National Ambient Air Quality Standard (NAAQS) of 70 ppb, particularly during the warm summer months (Faloona et al., 2020; Parrish et al., 2017). The plateauing of O3 levels since 2010 (Wu et al., 2022) poses additional challenges for California's air pollution reduction pathways.
Further reducing ambient O3 may be more difficult than expected due to the nonlinear O3 production rate in response to decreases in NOx and VOCs and the relatively high O3 background. For example, Parrish et al. (2017) showed that the observational-based background ODV for southern California was 62±1.9 ppb, which was comparable to the modeled background ODV of 45–65 ppb, with an outlier of ∼92 ppb. This background ODV has decreased very slowly at ∼1 ppb per decade since the mid-2000s (Parrish et al., 2021). Compared to NOx, VOCs are more complex in their emission sources, composition, and reactivity. VOCs are emitted to the atmosphere from a variety of anthropogenic, pyrogenic, and biogenic sources (Goldstein and Galbally, 2007). After emission, VOCs undergo complex photochemical reactions resulting in the production of O3. VOCs are comprised of hundreds of molecules with different functionalities. The composition of VOCs in California has been rapidly changing over the past few years (Warneke et al., 2012), due in large part to the aggressive emission control measures implemented for on-road mobile sources. This emission source of VOCs is expected to decrease in California over the next few decades, driven by the governor's Executive Order (N-79-20), with a goal of 100 % zero emission vehicle sales of new passenger cars and light-duty trucks by 2035. In contrast, the relative contributions of industrial activities and consumer products to ambient VOCs are growing (Mcdonald et al., 2018; Kim et al., 2022). With a clear path for NOx reduction in the state, it is critical that the current sources of VOCs and their potential for O3 formation are better characterized to guide future policies that effectively reduce ambient O3.
In this study, we analyzed an extensive set of VOCs and other key trace gases measured from the National Aeronautics and Space Administration (NASA) DC-8 research aircraft that flew over the SoCAB and SJV in the summer of 2019. We characterized the composition and the source signatures of the VOCs in these two basins. By examining the calculated hydroxyl radical (OH) reactivity of VOCs (cOHRVOC), we further determined the key VOC species that are responsible for O3 production. The spatial distributions of the cOHRVOC in the SoCAB and SJV are also investigated and compared.
The study was conducted in partnership with the Fire Influence on Regional to Global Environments and Air Quality (FIREX-AQ) campaign in the summer of 2019 (Warneke et al., 2022). We used data from the two California flights (Fig. S1) which were designed to study the spatial distribution of VOCs from non-fire emissions over the SoCAB and SJV in California. The measurements were carried out during ∼ 11:00–18:00 LT (local time) on board the NASA DC-8 research aircraft on 22 July and 5 September 2019, both of which were weekdays. The flights covered SJV by flying in a raster pattern. In the SoCAB, the measurements were made over the northern and inland regions of the SoCAB, where the O3 peak events usually occur (Cai et al., 2019). The flights had fewer measurements in the coastal areas and no measurements over central Los Angeles due to flight restrictions (Fig. 1).
To demonstrate the representativeness of the two flights, we synthesized data from the surface monitoring network (https://aqs.epa.gov/aqsweb/airdata/download_files.html, last access: 24 August 2022) in the SoCAB and SJV for the summer of 2019. We then compared the diurnal profiles of the air pollutants and meteorological parameters between the 2 measurement days with the days during July–September 2019. Examples are shown for Los Angeles County in the SoCAB and Kern County in SJV (Fig. S2). The O3 and air temperature profiles from the 2 measurement days overlapped with those from July–September. These comparisons show that the measurement days are representative of typical summer days in the SoCAB and SJV. It is expected that the summer period features high O3 pollution, high biogenic VOC (BVOC) emissions, and high secondary oxygenated VOC (OVOC) productions.

Figure 1Spatial distribution of (a) O3, (b) NOx, (c) VOCs, and (d) cOHRVOC. The flight tracks and sample locations are represented by colored lines and points, respectively. The points are sized by flight altitude and colored by the mixing ratios of O3, NOx, VOCs, and cOHRVOC values in panels (a), (b), (c), and (d), respectively, with the scales shown in the legend. The background map (gray) shows the boundaries of the California air basins, with black indicating the SoCAB and SJV.
Table 1Summary of measurementsa.

a The following abbreviations are used: CSL represents the Chemical Science Laboratory, LaRC represents the Langley Research Center, ACOM represents the Atmospheric Chemistry Observation and Modeling Laboratory, HR-ToF-GC/MS represents high-resolution time-of-flight gas chromatography and mass spectrometry, H3O+ ToF-CIMS represents hydronium ions time-of-flight chemical ionization mass spectrometer.
Here we present analyses of the VOCs, CO, NOx, and O3 measured by eight research groups operating instrumentation on board the DC-8 (Table 1). The technical details of the instruments are described in the Supplement. Since the diverse techniques have different sampling frequencies, the data were merged to the sampling time (∼40 s in duration) of the whole air samples collected by the University of California Irvine (UCI-WAS). The merged data set was created using the data merge tool provided in the FIREX-AQ data archive (https://www-air.larc.nasa.gov/cgi-bin/ArcView/firexaq?MERGE=1, last access: 24 August 2022). Specifically, the measurements from data set nos. 1 to 10 in Table 1 were sequentially merged. The duplicated measurements were removed during each merging step, i.e., if the measurement of a compound existed in the merged data set and was above detection limit, then additional measurements of that compound were not added to the merged data set during the following merging steps.
Figure S3 shows the comparison of the study-averaged mixing ratios and standard deviations calculated from the merged data set (a subset of the original data sets) and the original data sets for the species merged to the UCI-WAS measurements. Each data set was pre-processed such that only the measurements covering the SoCAB and SJV were used for the comparison. The agreement (slope of 1.07 and r2 of 1.00) between the merged data set and the original data set suggests that the merged data set can represent the original measurements.
To better represent the near-surface mixing ratios, the samples collected at altitudes higher than 4000 ft (1.2 km) above ground level (a.g.l.) were removed from the merged data set. The samples collected over the ocean were also excluded. After screening, the final data set for this study has 69 and 95 samples for the SoCAB and SJV, respectively. These samples are shown in Fig. 1. A total of 168 gas-phase compounds were measured, of which 137 had a detectable mixing ratio (Table 2). Given that the aircraft speed was about 125 m s−1 and the sample collection time was about 40 s, the measurements represented approximately 5 km integrated space along the flight track. The average altitude (± standard deviation) of the samples was 625 (±237) m a.g.l. and 360 (±107) m a.g.l. in the SoCAB and SJV, respectively. Observations have shown that the daily maximum planetary boundary layer (PBL) height was approximately 1–1.5 km in the SoCAB and 0.5–1 km in SJV (Cui et al., 2019; Bianco et al., 2011). Therefore, the samples were most likely collected within the PBL. Since the samples were collected at least a few hundred meters away from emission sources, the reactive VOCs likely have undergone photochemical processing. Using the NOx and NOy measurements and assuming that the ambient [OH] was 4×10⁶ molec. cm−3, the photochemical age of the samples was estimated to be approximately 12 h on average (Cappa et al., 2012). This means that a species with an OH rate coefficient of 10−11 cm3 molec.−1 s−1 had lost ∼80 % of its mass before they were sampled by the aircraft. Compounds with higher rate coefficients (e.g., the BVOCs) had more loss. The statistics of the observed mixing ratios of the gas-phase species and their OH rate coefficients are summarized in Table 2.
3.1 Mixing ratio and spatial distribution of O3, VOCs, and NOx
The study-averaged aircraft-measured O3 (±1σ) mixing ratio was 70.2±26.7 ppb in the SoCAB and 73.5±9.5 ppb in SJV. The maximum observed O3 mixing ratio was 122.0 and 101.0 ppb in the SoCAB and SJV, respectively. The average non-CH4 VOC mixing ratio (±1σ) in the SoCAB and SJV was 36.9.0±7.3 and 45.8±5.6 ppb, respectively (for simplicity, we use VOC to represent non-CH4 VOC hereafter). The higher VOC levels in SJV were mainly driven by methanol. The average observed methanol was 17.1 ppb in SJV, which doubled the average 7.7 ppb observed in the SoCAB. The average aircraft-measured NOx (±1σ) was 3.8±4.8 ppb in the SoCAB, which was 3.5 times the NOx (±1σ) of 1.1±0.6 ppb in SJV. The high NOx levels in the SoCAB resulted in a relatively lower VOC-to-NOx ratio of 9.7±12.4 compared to 41.6±23.3 in SJV.
The spatial distributions of O3, VOCs, and NOx are shown in Fig. 1a–c. In the SoCAB, the mixing ratios of O3, VOCs, and NOx generally increased from coastal to inland regions, with the highest mixing ratios occurring near the northern boundary of the SoCAB. The coast–inland gradient likely resulted from the accumulation and chemical aging of the air pollutants as they were transported eastwards. In SJV, the mixing ratios of O3, VOCs, and NOx were more homogeneously distributed, i.e., the occurrence frequency of the high mixing ratios was smaller compared to that in the SoCAB (Figs. S4–S6). Since the very high mixing ratios determine the design values (Parrish et al., 2017), the result suggests that O3 in the SoCAB is more prone to exceeding the NAAQS. This is consistent with the higher O3 design values in the SoCAB compared to SJV that resulted from analyses using the monitoring network data (Parrish et al., 2017).
Table 2Statistics of the mixing ratios (median, average, 1σ standard deviation, and maximum values in parts per trillion (ppt), unless otherwise specified) and OH reaction rate coefficients of the measured VOCs in the SoCAB and SJV.
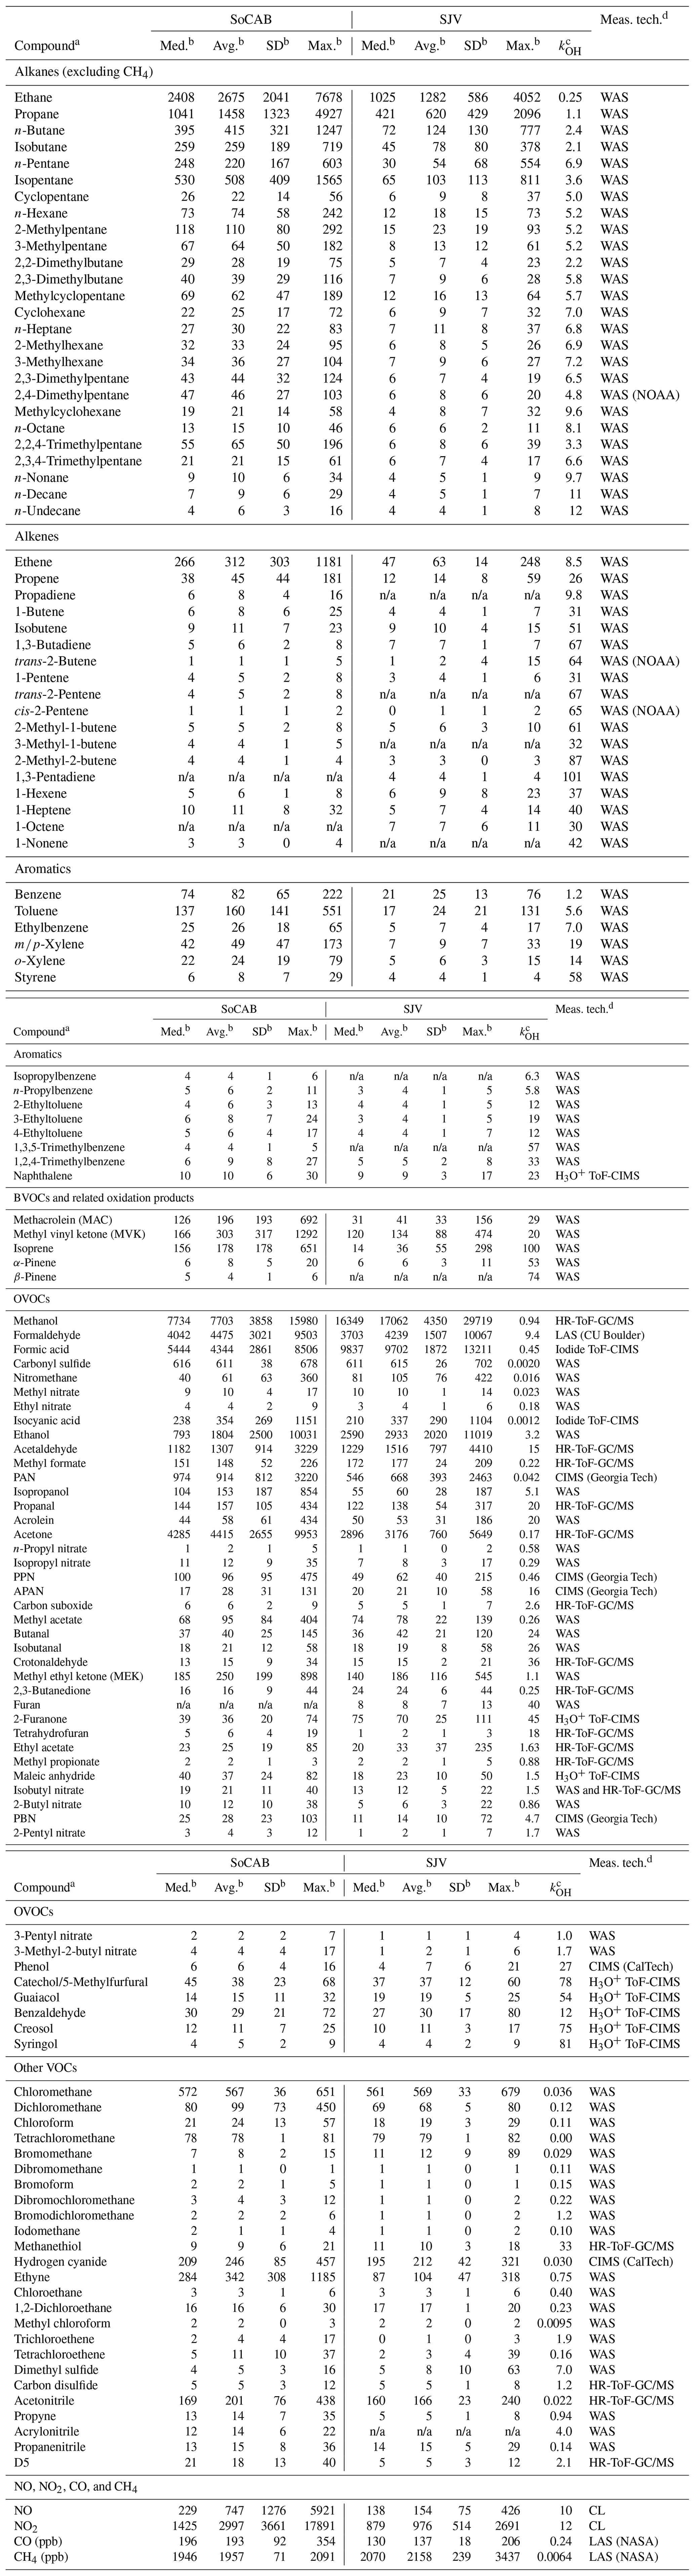
a The following species were measured but not reported as their mixing ratios were below detection limit: cis-2-butene, 1,2-butadiene, 1-buten-3-yne, 1,3-butadiyne, 1-butyne, 2-butyne, cis-2-pentene, 3-methyl-1-pentene/4-methyl-1-pentene, 1-decene, cyclopentene, ethynylbenzene, chlorobenzene, tricyclene, camphene, myrcene, limonene, Δ3-carene, 2-methylfuran, 3-methylfuran, benzofuran, 1,3-butadiyne, chloroiodomethane, 2-methyl-3-buten-2-ol, methylacrylonitrile, pyrrole, 2-ethylfuran, dimethylfurans, vinylfuran, 3-furaldehyde, and 1,3-pentadiene. The mixing ratios of carbon suboxide, 2,3-butanedione, tetrahydrofuran, ethyl acetate, methyl propionate, and methanthiol from the HR-ToF-GC/MS measurement was estimated using relative sensitivities. The sum of these species accounted for less than 0.2 % of the total VOC mixing ratio in the SoCAB and SJV. The following abbreviations are used: D5 represents decamethylcyclopentasiloxane, PAN represents peroxyacetyl nitrate, PPN represents peroxylpropionyl nitrate, APAN represents peroxyacryloyl nitrate, and PBN represents peroxybutyryl nitrate. b n/a represents not applicable because the VOCs are below the detection limit. c The unit for kOH is 10−12 cm3 molec.−1 s−1. kOH values are given at 298 K. References for the kOH values are provided in the text. d WAS refers to the UC Irvine (University of California Irvine) WAS, unless otherwise stated. The H3O+ ToF-CIMS measurements and the formic acid mixing ratio (from iodide ToF-CIMS) were only available during the flight on 5 September 2019. Hydrogen cyanide was measured by the CalTech (California Institute of Technology) CIMS and HR-ToF-GC/MS. The high time resolution (1 Hz) of the CalTech CIMS measurement was used. The mixing ratio of isobutyl nitrate was derived from the difference between the sum of isobutyl nitrate and 2-butyl nitrate (measured by the HR-ToF-GC/MS) and 2-butyl nitrate (measured by the UC Irvine WAS).
3.2 Composition and source signatures of VOCs
The measured VOCs are grouped into chemical families based on their characteristic functional groups or emission sources (for biogenic VOCs and their oxidation products). The average VOC composition from the two research flights was similar, so the study-averaged composition (i.e., average of all samples collected during the two flights) is presented (Fig. 2). The mean, median, and maximum mixing ratios for each VOC measured in this study are listed in Table 2. Oxygenated VOCs (OVOCs) and alkanes dominated the measured VOC mixing ratios, accounting for 91 %–96 % of the total measured VOC mixing ratio in both the SoCAB and SJV. This is comparable to the measurements conducted at Pasadena in 2010 during the California Research at the Nexus of Air Quality and Climate Change (CalNex) field study, where OVOCs and alkanes comprised ∼80 % of the measured reactive organic carbon (ROC) mass (Heald et al., 2020). They are also the two most abundant chemical families in other regions of the world, e.g., in Seoul, South Korea (Simpson et al., 2020; Kim et al., 2018), and Hong Kong (Ling et al., 2014). Specifically, OVOCs accounted for 74 % and 91 % of the total measured VOC mixing ratio in the SoCAB and SJV, respectively, and the contributions of alkanes were 17 % and 5 % in the SoCAB and SJV, respectively. In contrast, primary biogenic VOCs (BVOCs) are a minor fraction (<2 %) of the total measured VOC mixing ratio in both basins.
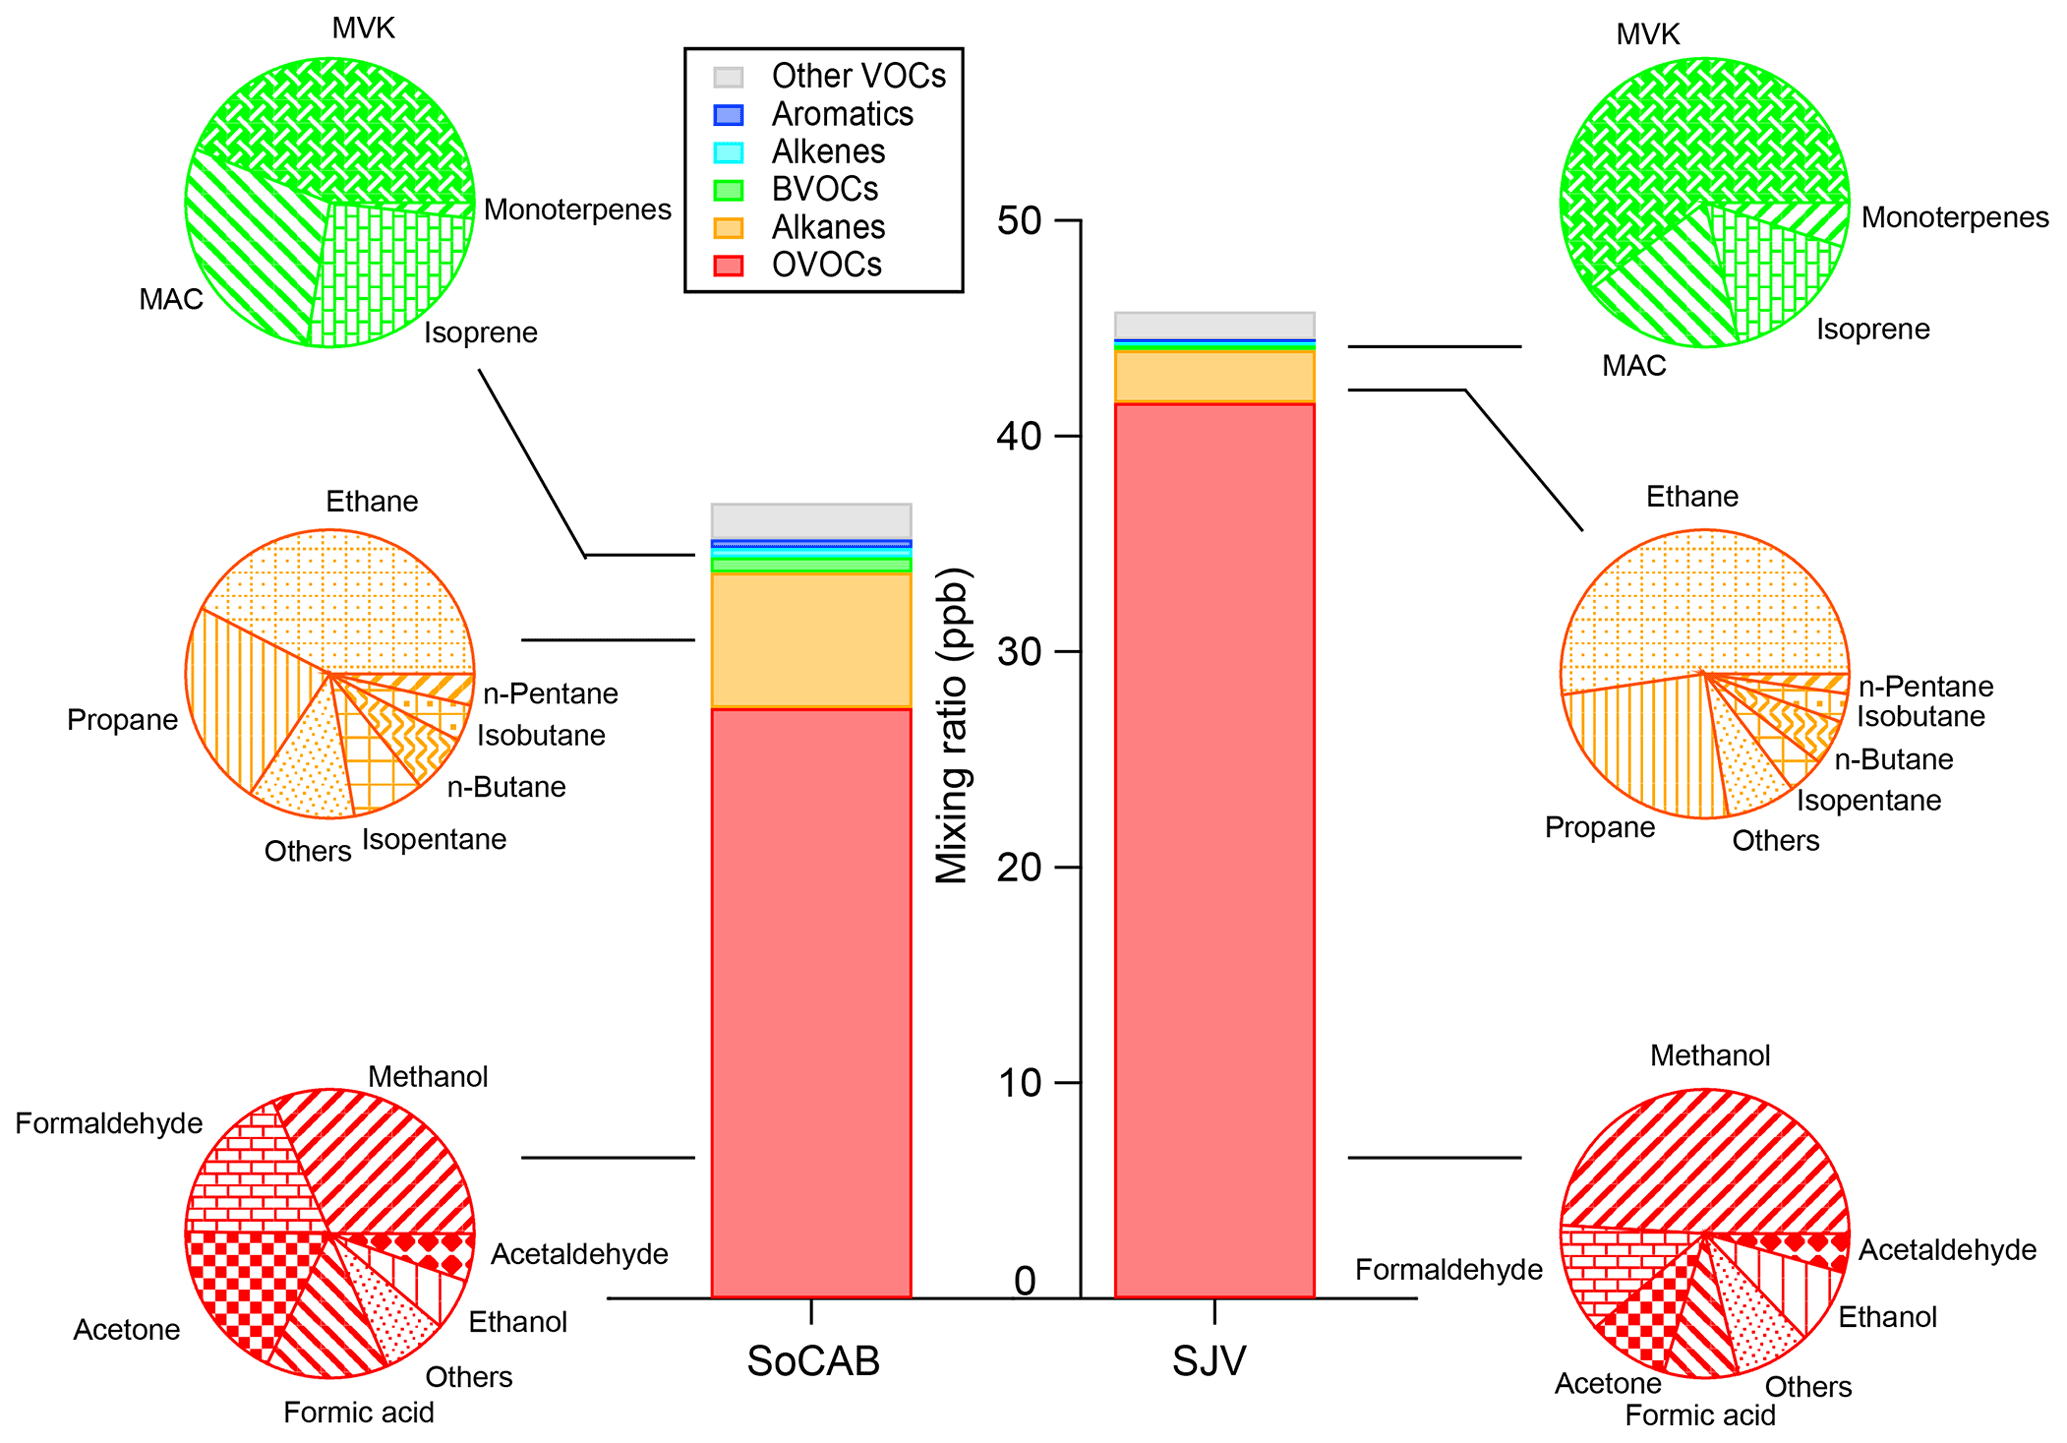
Methanol was the most abundant OVOC in both basins, which was responsible for 28 % and 41 % of the OVOC mixing ratio in the SoCAB and SJV, respectively. Methanol in the SoCAB (7.7 ppb) was about half of the methanol levels in SJV (17.1 ppb). Very high methanol (>25 ppb) was observed over the southeastern (e.g., Delano, Tulare, and Visalia) regions of Fresno, where dense, confined animal farming operations (CAFOs) are located, suggesting direct methanol emissions from dairy operations. Similar to methanol, formic acid in the SoCAB (4.3 ppb) was about half of the formic acid in SJV (9.7 ppb). Formic acid has been identified as a major fatty acid from dairy operations (Page et al., 2014; Mårtensson et al., 1999). Formic acid also increased with methanol (r2=0.7), suggesting that dairies may be a major source of formic acid in SJV. The region with a high methanol mixing ratio also features high ethanol levels, which likely resulted from dairy emissions as well. Studies have shown that methanol and ethanol are the dominant VOCs emitted from dairy cows and their waste (Gentner et al., 2014; Shaw et al., 2007; Sun et al., 2008). In addition, ethanol is likely the most abundant VOC species emitted from dairy silages in SJV (Malkina et al., 2011; Yuan et al., 2017b), while consumer product use has a sizable contribution to its ambient mixing ratios in urban cores (Mcdonald et al., 2018; Coggon et al., 2021). Vehicle operations also emit ethanol into the atmosphere due to the increasing use of the E10 and E85 ethanol–gasoline blends (De Gouw et al., 2012; Gkatzelis et al., 2021). More detailed surface-level source apportionment methods must be employed to determine the specificity of its origin. The high ethanol levels in SJV may lead to high mixing ratios of its oxidation product, e.g., acetaldehyde, which was 16 % higher in SJV than that in the SoCAB.
Formaldehyde (HCHO) was the second and third most abundant OVOC, with a comparable mixing ratio (∼4.5 ppb) in the SoCAB and SJV, respectively. HCHO contributed to 16 % and 10 % to the OVOC mixing ratio in the SoCAB and SJV, respectively. Primary sources of HCHO include automotive exhaust (Anderson et al., 1996), industrial emissions (Salthammer et al., 2010), biomass burning (Holzinger et al., 1999), and off-gassing from building materials (Gilbert et al., 2008; Liu et al., 2016). HCHO can also form from the photooxidation of VOCs, such as alkenes and BVOCs (Choi et al., 2010; Parrish et al., 2012). Given the contrast between anthropogenic emission sources in the SoCAB and SJV (e.g., the CO emissions in the SoCAB are 1.4 times the CO emissions in SJV, as estimated from California Air Resources Board's emission inventory), the similarity of HCHO mixing ratio between the two regions during the 2 flight days suggests that photooxidation of non-anthropogenic emissions (e.g., BVOCs) may be the dominant regional driver of HCHO, which is consistent with the findings from previous studies in North America (Lee et al., 1998; Palmer et al., 2003). The high methanol, ethanol, and formic acid mixing ratios in SJV made the OVOC level in SJV 52 % higher compared to the OVOC level in the SoCAB. Acetone also had sizable contributions to the OVOC mixing ratio (Fig. 2).
The composition of alkanes in the SoCAB and SJV was similar, but the total alkane mixing ratio was 2.6 times higher in the SoCAB. Ethane and propane were the dominant species. Specifically, ethane accounted for ∼40 %–50 % of the total alkane mixing ratio, followed by propane (∼25 %) in both regions. The linear regressions of propane versus ethane for the SoCAB and SJV fell on the same line, with a Pearson's r value of 0.96 and a slope of 0.6. Peischl et al. (2013) summarized the propane versus ethane slope values from different sources. The slope obtained from this study is consistent with the aircraft observation over the SoCAB in 2010 and fell within the slope range for local oil and gas well emissions (Peischl et al., 2013). In contrast, the propane-to-ethane ratios for pipeline quality natural gas are ∼0.15, as heavier alkanes are removed during processing (Wennberg et al., 2012; Peischl et al., 2013). On-road emission ratios of propane to ethane are also very low, but relatively minor, as gasoline and diesel do not contain large amounts of these alkanes (Fraser et al., 1998). This result suggests that oil and gas production activities are likely the major source of propane and ethane in the SoCAB and SJV. Isopentane and n-pentane were tightly correlated in both basins but with different slopes. The isopentane/n-pentane ratio was 2.4 in the SoCAB. This value is consistent with ratios of 2.3–3.8 observed for regions highly impacted by vehicular emissions (Gilman et al., 2013). In contrast, the isopentane/n-pentane ratio was 1.8 for SJV, suggesting that the air mass was mixed with non-urban emissions.
The BVOCs accounted for <2 % of the total VOC mixing ratio in both basins. In the BVOC category, isoprene is assumed to be only from biogenic emissions, and anthropogenically driven isoprene emissions are negligible in summer (Guenther et al., 2012; Reimann et al., 2000). The BVOCs were dominated by isoprene and its oxidation products methacrolein (MAC) and methyl vinyl ketone (MVK; Wennberg et al., 2018), the sum of which accounted for ∼95 % of the total observed BVOC mixing ratio. MVK was the most abundant BVOC species that contributed ∼50 % of the BVOC mixing ratio, followed by nearly equal contributions of isoprene and MAC. The monoterpenes (such as α- and β-pinene) were minor, with their average mixing ratios smaller than 10 ppt.
3.3 Total OH reactivity
Quantifying the OH reactivity (cOHR) of reactive gases provides estimates of the potential roles of individual O3 precursors (Ling et al., 2014; Gilman et al., 2009; Mcdonald et al., 2018). The cOHR of a compound is calculated from the compound concentration multiplied by its reaction rate coefficient with the OH radical. The total cOHR is the sum of the cOHR of all reactants in the atmosphere, which is given by the following equation:
where the subscript of cOHR indicates the species X used to calculate the cOHR, [X] is the mixing ratio of X, and kOH+X is the reaction rate coefficient of X with the OH radical. The kOH+X values were obtained from the literature or kinetic databases (Atkinson and Arey, 2003; Atkinson et al., 1997, 2004, 2006, 2008; Kwok and Atkinson, 1995; Burkholder et al., 2015; Alton and Browne, 2020; Atkinson, 1986; Bierbach et al., 1994, 1995; Borduas et al., 2016; Lauraguais et al., 2015; Roberts et al., 2003; Semadeni et al., 1995; National Institute of Standards and Technology Chemical Kinetics Database) and are tabulated in Table 2. We used the rate constants at 298 K. This is reasonable, as the average ambient air temperature (± standard deviation) of the samples was 26.7(±2.1) and 31.0(±1.6) ∘C in the SoCAB and SJV, respectively. There is likely missing cOHR from unmeasured VOCs due to the limitation of the quantification methods. Previous studies show that the fraction of the missing cOHR ranges from 5 % to 80 %, depending on the sampling location, time, and the number of measured VOC species (Yang et al., 2016; Hansen et al., 2021). With the extensive VOC measurements in this study, it is expected that the fraction of the missing cOHR is close to the lower end of the 5 %–80 % range. Nevertheless, the cOHRVOC reported in this study should be interpreted as a minimum for the cOHR of the total VOCs.
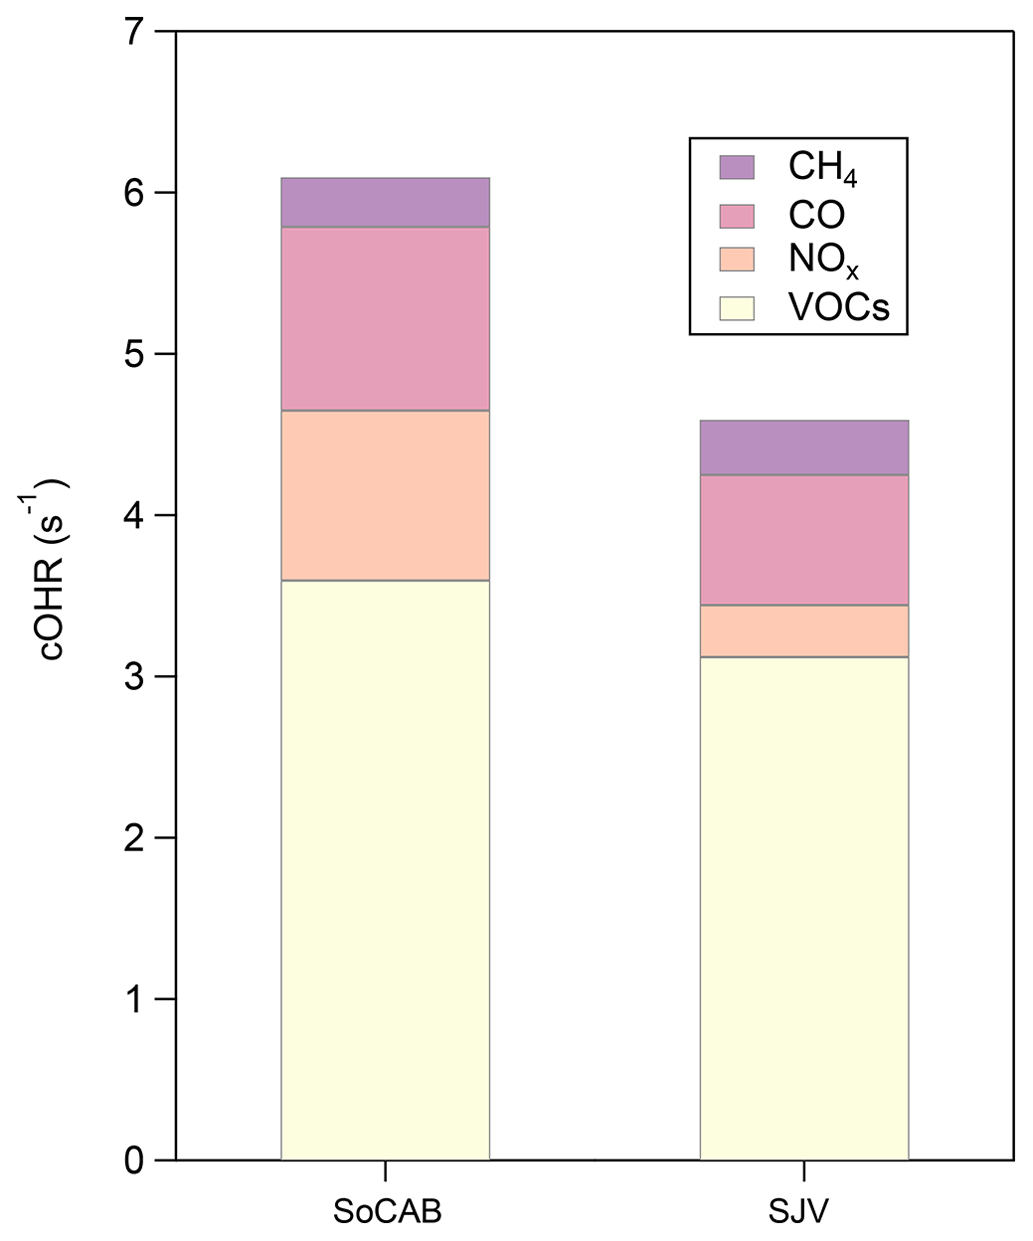
The cOHRTOTAL was 6.1 and 4.6 s−1 for the SoCAB and SJV, respectively (Fig. 3). The O3 mixing ratio generally increased nonlinearly with increasing cOHRVOC, cOHRCO, cOHR, and cOHR in both basins, especially for O3 >40 ppb (Fig. S7). The cOHRTOTAL values observed in this study are generally less than half of the cOHRTOTAL reported in Pasadena and central California 10–20 years ago (Table S1). However, we note that the comparison may be biased, as the previous studies are from ground measurements. The percentage contributions of CH4, CO, NOx, and VOCs to cOHRTOTAL were similar between the SoCAB and SJV, with the VOCs accounting for ∼60 % of the cOHRTOTAL (Fig. 3). For reference, the global annual mean contribution of VOCs to cOHRTOTAL is ∼50 % from a recent review study (Heald and Kroll, 2020). The large contribution of VOCs to cOHRTOTAL is consistent with previous measurements in California (Table S1), suggesting that VOCs remain a high potential for O3 formation in the SoCAB and SJV. CO was the second most important species following VOCs and was responsible for ∼18 % of the cOHRTOTAL in both basins. The contribution of NOx to cOHRTOTAL was 17 % in the SoCAB and 6 % in SJV.
3.4 OH reactivity of individual VOCs
The cOHR of the individual species for the SoCAB and SJV generally follows a similar order. The linear regression of the cOHRSOCAB versus the cOHRSJV for the individual species shows a slope of 1.3 and r2 of 0.8 (Fig. 4), confirming that the overall cOHR in the SoCAB was 30 % higher than that in SJV. The top five VOCs that have the largest cOHR in the SoCAB were HCHO, acetaldehyde, isoprene, methanol, and MVK in descending order. In SJV, the top five most abundant VOCs in terms of cOHR were formaldehyde, acetaldehyde, methanol, ethanol, and formic acid. The sum of these species accounted for 63 % and 73 % of the calculated cOHRVOC in the SoCAB and SJV, respectively. These results suggest that (i) aldehydes are the key compounds contributing to cOHR in both basins, (ii) biogenic VOCs are important for cOHR in the SoCAB, and (iii) dairy emissions are likely important for cOHR in SJV. Compared to the cOHR of the VOCs measured in Pasadena in 2010 during the CalNex campaign (57 species measured in common), the majority of the species measured in the SoCAB (52 out of 57) in 2019 had smaller cOHR values, with a mean percentage decrease of 53 %.
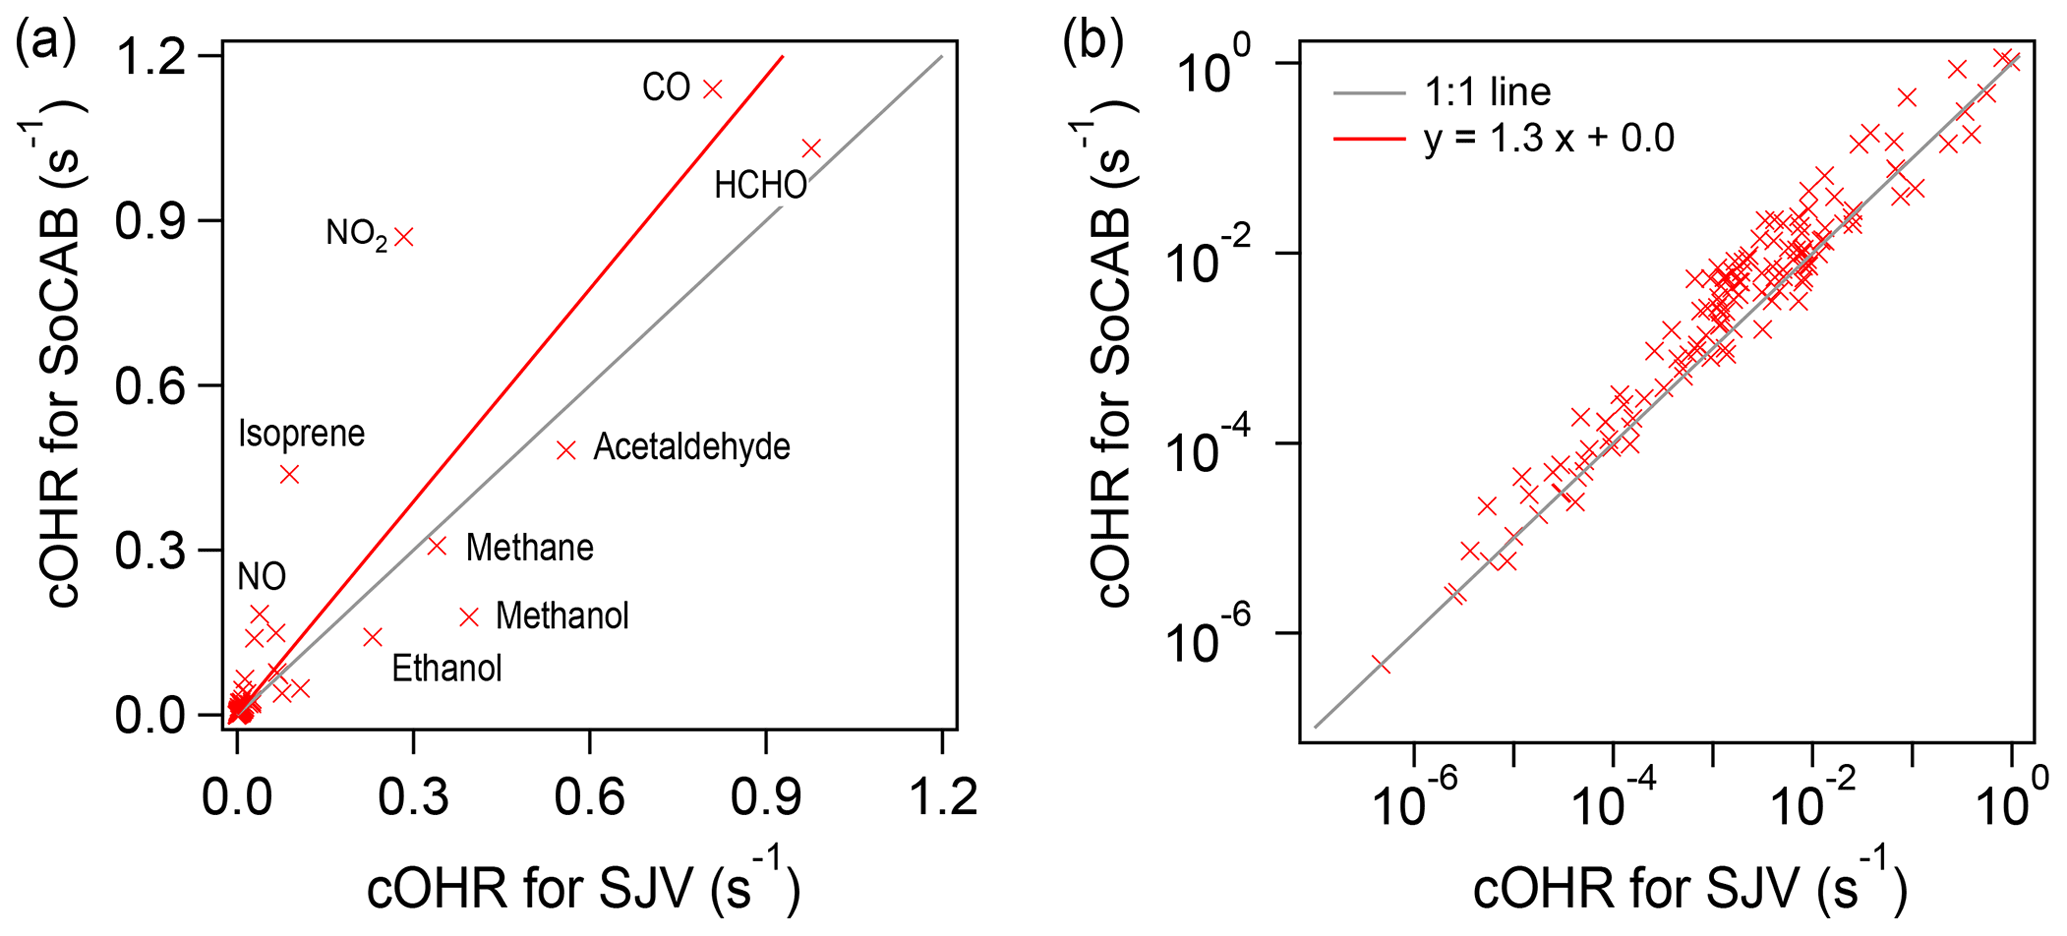
Figure 4Scatterplot of cOHRSOCAB versus cOHRSJV for the individual species in the (a) linear scale and (b) logarithmic scale. The red line represents linear regression using the orthogonal distance regression method.
The OVOCs category was the largest contributor to the cOHRVOC among all the categories (Fig. 5; Table S2). The cOHROVOC was 3.6 s−1 in the SoCAB and 3.1 s−1 in SJV, which was responsible for 59 % and 68 % of the cOHRVOC in the SoCAB and SJV, respectively. The contribution of the OVOCs to the cOHRVOC was among the highest compared to the cOHROVOC measurements in other parts of the world (Table S2). For example, the percentage of the OVOC contribution was substantially higher than that in mainland China (calculated from emission inventories), Seoul (South Korea, surface measurement), and Mexico City (Mexico, surface measurement; Table S2; we note that part of the difference may be due to the different study approaches, e.g., ground vs. flight measurements.) HCHO was the most important OVOC in terms of cOHR, which was responsible for 45 % and 36 % of the cOHROVOC in the SoCAB and SJV, respectively. This percentage translates to HCHO, accounting for ∼30 % of the cOHRVOC in both basins. Acetaldehyde contributed 21 % of the cOHROVOC and ∼15 % of the cOHRVOC in both basins. Since ambient measurements of HCHO and acetaldehyde are scant compared to many other VOCs (e.g., aromatics), much remains to be learned about the sources and fate of these species. Methanol contributed 8 % and 15 % of the cOHROVOC in the SoCAB and SJV, respectively, while the ethanol contribution to the cOHROVOC was ∼7 % in both basins. The sum of HCHO, acetaldehyde, methanol, and ethanol accounted for 51 % and 69 % of the cOHRVOC in the SoCAB and SJV, respectively. Our measurements are consistent with modeling results showing that 30 %–50 % of cOHRVOC in California is due to aldehydes and other oxygenated species from over a decade prior (Steiner et al., 2008).
Although BVOCs were only responsible for <2 % of the total measured VOC mixing ratio, they contributed 21 % and 6 % of the cOHRVOC in the SoCAB and SJV, respectively. Therefore, it is important that the reactivity of BVOCs is well represented in photochemical models, especially in the SoCAB. The relatively high cOHRBVOC is due to the high chemical reactivity of the BVOCs, i.e., the reaction rate constants of BVOCs with OH radicals are generally 100 times greater than those of alkanes (Table 2). Among the BVOCs, isoprene accounted for 59 % and 44 % of the cOHRBVOC in the SoCAB and SJV, respectively. The isoprene oxidation products MAC and MVK, together, accounted for ∼45 % of cOHRBVOC in both regions. The contribution of monoterpenes to cOHRBVOC was <10 % in both basins. This should be considered as a lower limit, as a large fraction of monoterpenes may have reacted away by the time they were measured from the aircraft. The dominance of isoprene and its oxidation products in cOHRBVOC is consistent with the high isoprene emissions from the oak woodlands throughout the foothills of the Sierra Nevada mountains and near the northern boundaries of the SoCAB (Fig. S8a; Arey et al., 1995; Benjamin et al., 1997; Misztal et al., 2014).
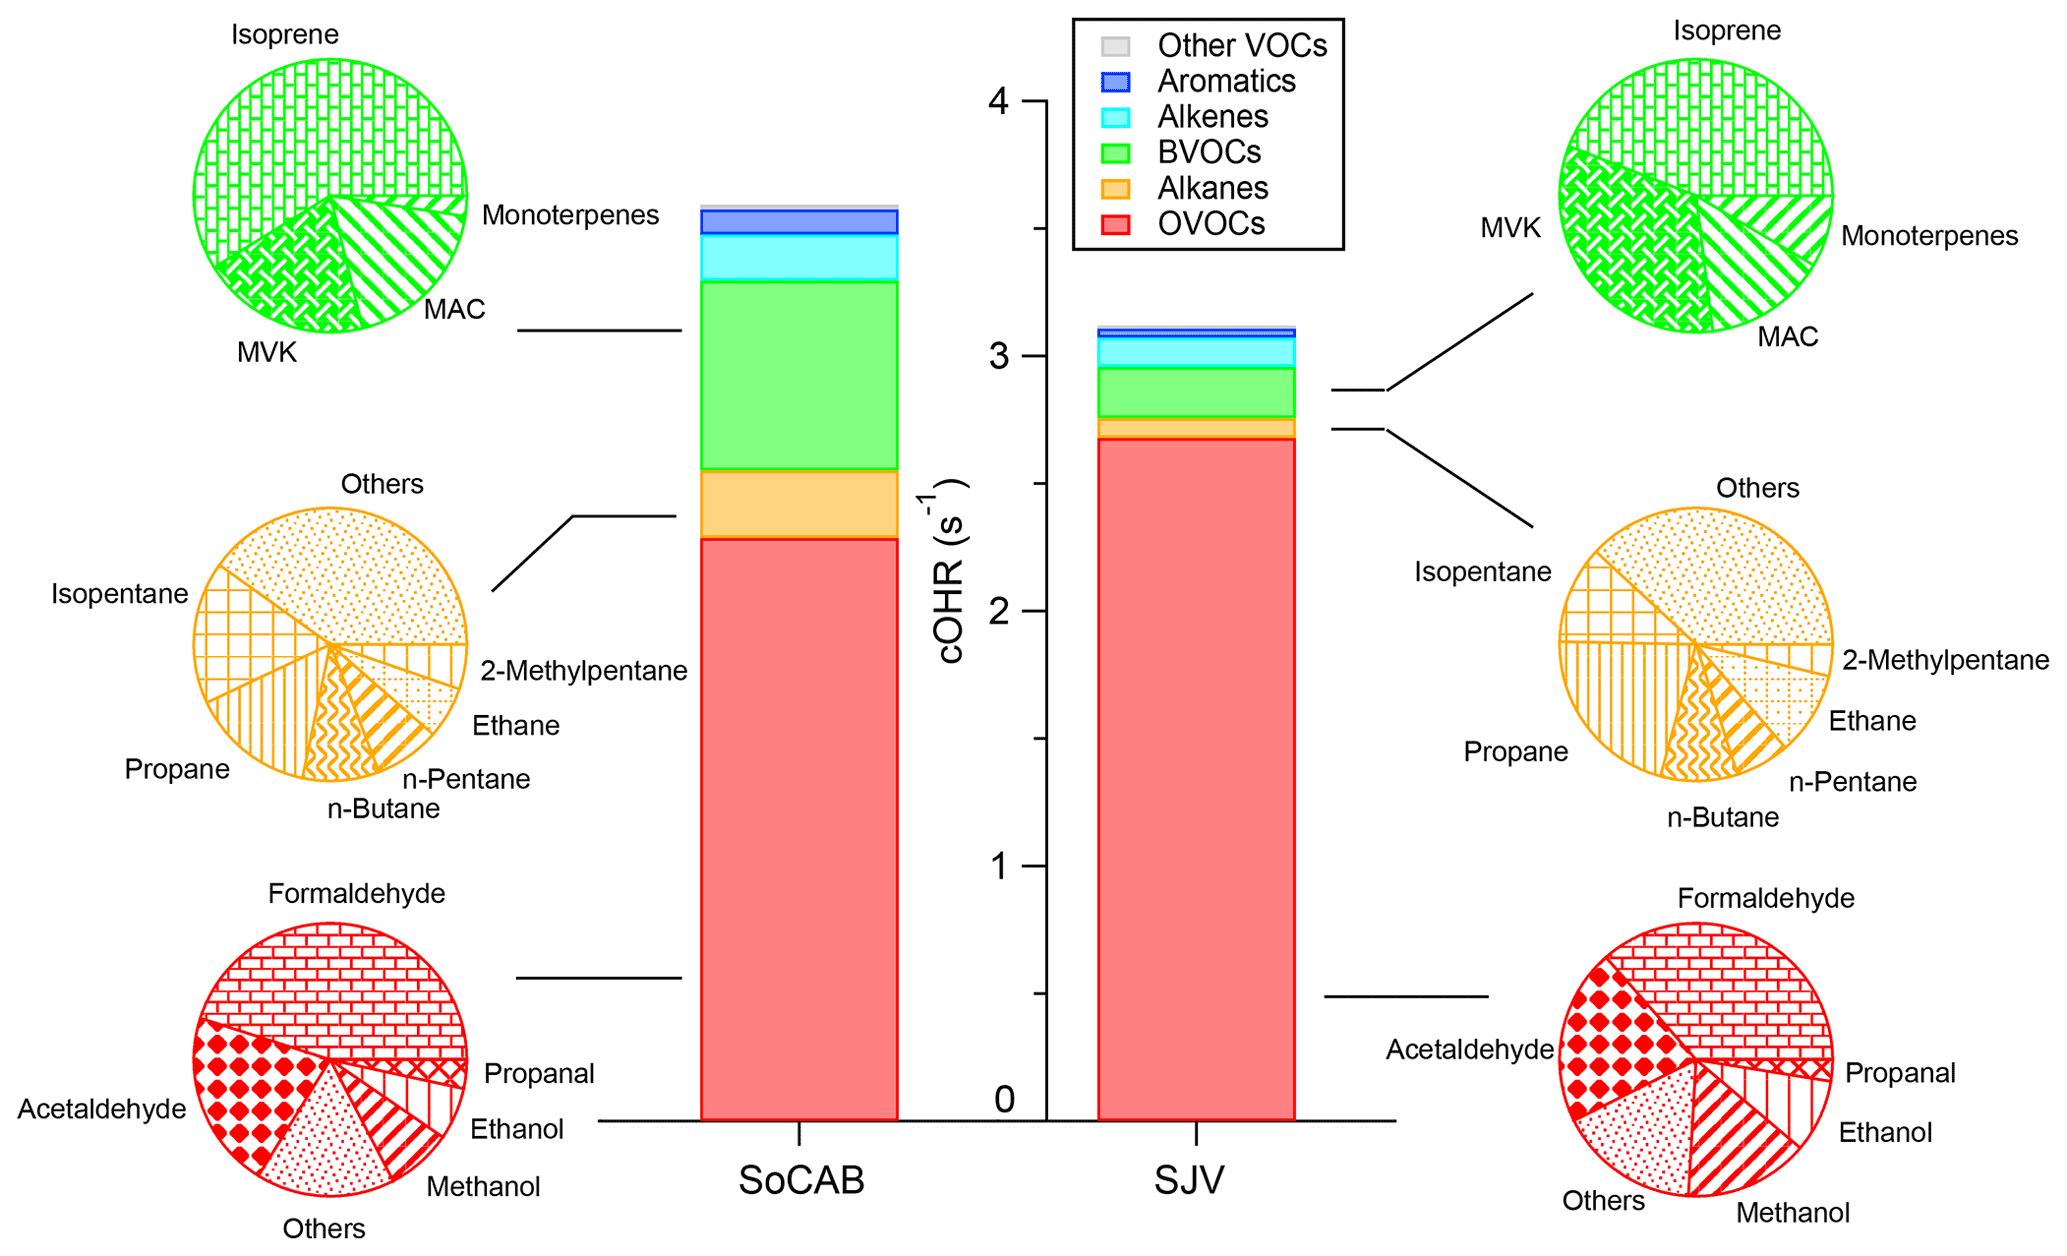
In contrast, the non-CH4 alkanes only contributed 7 % and 3 % of the cOHRVOC in the SoCAB and SJV, respectively, despite their greater atmospheric abundances. The sum of cOHRethane and cOHRpropane accounted for 21 % and 31 % of the cOHRalkanes in the SoCAB and SJV, respectively. The substantially smaller contribution of alkanes to cOHRVOC, compared to their contribution to the total VOC mixing ratio, is due to their low chemical reactivity. On the other hand, the longer-chain alkanes dominated cOHRalkanes. Alkenes, aromatics, and other uncategorized VOCs (see “Other VOCs” in Table 2) together accounted for <10 % of the cOHRVOC in both basins.
3.5 Spatial variability in cOHRVOC
The cOHRVOC showed distinct frequency distributions in the SoCAB and SJV (Fig. 6). The cOHRVOC in the SoCAB spanned from 0 to 8 s−1, with the highest occurrence frequency at 0–1 s−1 and lowest at 7–8 s−1. Higher cOHRVOC occurred in more inland regions (Fig. 1), which was similar to the spatial distribution of O3. This is likely due to the accumulation of air pollutants in downwind locations as they were transported from west to east during the day in the SoCAB (Carreras-Sospedra et al., 2006). In contrast, the cOHRVOC in SJV was narrowly distributed and centered at 1–3 s−1. In addition, the BVOCs in the SoCAB showed increasing contribution to the cOHRVOC as the cOHRVOC increased (see the pie charts in Fig. 6a). The BVOC contribution reached up to 20 %–30 % when the cOHRVOC was above 4 s−1 near the northern boundary of the SoCAB (Figs. 1, S8b). This result suggests that BVOCs are likely key O3 precursors during high O3 episodes in the SoCAB. A similar result was not observed in SJV, i.e., the OVOCs dominated the cOHRVOC across the cOHRVOC range. The minor role of the BVOCs in O3 formation in SJV was likely because of the daytime up-valley winds that prevented the entrainment of the BVOCs emitted over the Sierra Nevada mountains into the valley (Zhong et al., 2004).

Figure 6Frequency distribution of cOHRVOC in the (a) SoCAB and (b) SJV. Also shown above each 1 s−1 binned cOHRVOC range is a pie chart presenting the average contribution to the cOHRVOC by VOC categories (shown in the legend).
In this work, we have updated the mixing ratios and cOHR of a wide range of speciated VOCs in the SoCAB and SJV of California. The limited number of flights is compensated by the wide range of speciated VOCs analyzed. The spatially resolved data set and analyses can be used to evaluate the performance of photochemical models. Our measurements suggest that OVOCs are an important chemical class contributing to the cOHR in California. Specifically, HCHO, acetaldehyde, methanol, and ethanol are the key OVOC species, the sum of which accounted for ∼ 50 %–70 % of the cOHRVOC in the SoCAB and SJV. The observation is consistent with previous field and modeling studies, showing that OVOCs play critical roles in atmospheric chemistry (Lou et al., 2010; Wu et al., 2020). OVOCs have also been suggested to be responsible for a major fraction of the “missing OH reactivity” (Dolgorouky et al., 2012; Karl et al., 2009; Lou et al., 2010), i.e., the difference between directly measured OHRTOTAL and the sum of the cOHR from individually measured species. However, quantifying OVOCs is still challenging, and measurements of their ambient mixing ratios are still lacking in many regions. Our work reinforces that elucidating the chemical composition of OVOCs and their sources will advance our capability to predict O3 abundance and develop O3 reduction strategies.
Biogenic emissions represent a significant source of VOCs for O3 formation, especially in the SoCAB. On average, 21 % and 6 % of the cOHRVOC are contributed by primary BVOCs in the SoCAB and SJV, respectively, assuming that isoprene is solely from biogenic sources. The contribution of BVOCs to cOHRVOC was greatest near the northern edge of the SoCAB. This is consistent with the measurements in Pasadena, California, during the CalNex campaign, where isoprene was the single largest contributor to the cOHRVOC (Heald et al., 2020). The importance of BVOCs as a contributor to cOHR has also been reported for other urban environments, such as London, United Kingdom (Whalley et al., 2016), Beijing, China (Mo et al., 2018), and Seoul, South Korea (Kim et al., 2018). The cOHRBVOC reported in this study should be considered as an underestimation, since a fraction of HCHO may be produced from the oxidation of BVOCs (Choi et al., 2010). Source apportionment of HCHO on the regional scale is thus critical for improving our future understanding of the contribution of biogenic emissions to O3 production. Besides reacting with the OH radical, HCHO is also a source of HOx radicals () via photolysis. Reducing HCHO has the added benefit of reducing the production rate of HOx, thereby lowering the production rate of O3 (Pusede and Cohen, 2012).
As policies continue to curb anthropogenic emissions, BVOCs will continue to become increasingly important in atmospheric chemistry and O3 formation (Gu et al., 2021). The temperature rise due to a warming climate will likely further enhance the emissions of BVOCs in the immediate future. Since BVOCs are highly reactive, a small increase in BVOCs will disproportionately enhance their contribution to the total hydroxyl radical reactivity. This effect makes BVOCs even more critical during peak O3 events that may lead to O3 exceedance. Our current knowledge of the role of BVOCs in the O3 formation in the SoCAB region is still highly uncertain, e.g., a recent photochemical modeling study suggests that there is a significant underestimation of biogenic emissions in the SoCAB (Cai et al., 2019). As the contribution of BVOCs to O3 production may represent a substantial fraction of the background O3 that determines how stringent the O3 standards will be, a more precise understanding of the magnitude and timing of BVOCs in O3 formation is warranted. Such evaluation must be carefully paired with our evolving understanding of the biospheric feedback in response to changing climate to improve mitigation and adaptation actions and future air quality management planning.
The data used in this study can be downloaded from the NASA FIREX-AQ data archive https://www-air.larc.nasa.gov/cgi-bin/ArcView/firexaq (NASA, 2022).
The supplement related to this article is available online at: https://doi.org/10.5194/acp-22-10937-2022-supplement.
BB, RSH, AF, JP, SM, MC, AL, JBG, GIG, CW, ECA, AJH, IB, JW, PW, DR, and DB conducted the aircraft measurements. SL analyzed the data and wrote the paper. BB, RSH, AF, JP, MC, JBG, GIG, CW, TK, and MF provided constructive comments and suggestions.
The contact author has declared that none of the authors has any competing interests.
The statements and conclusions in this paper are those of the authors and do not represent the official views of the California Air Resources Board.
Publisher’s note: Copernicus Publications remains neutral with regard to jurisdictional claims in published maps and institutional affiliations.
We thank the FIREX-AQ team, the coordinators, NASA, and NOAA, for making this data collection possible with the DC-8 research aircraft. We thank Thomas Ryerson, for providing the O3 and NOx data, Glenn Diskin, for providing the CO and CH4 data, Paul Wennberg, Lu Xu, Krystal Vasquez, Hannah Allen, and John Crounse, for providing the phenol and hydrogen cyanide data, Patrick R. Veres and J. Andrew Neuman, for providing the NOAA CIMS data, and Gregory Huey, for providing the Georgia Tech CIMS data. We are grateful to Jeremy Avise and Chenxia Cai, for their technical review and logistical coordination.
The aircraft measurements have been supported by the California Air Resources Board (contract no. RD19014). The HR-ToF-GC/MS measurement has been supported by the National Center for Atmospheric Research, which is a major facility sponsored by the National Science Foundation (grant no. 1852977). Eric C. Apel, Rebecca S. Hornbrook, and Alan J. Hills were also funded in part by NASA (grant no. 80NSSC18K0633).
This paper was edited by Arthur Chan and reviewed by two anonymous referees.
Alton, M. W. and Browne, E. C.: Atmospheric chemistry of volatile methyl siloxanes: Kinetics and products of oxidation by OH radicals and Cl atoms, Environ. Sci. Technol., 54, 5992–5999, 2020.
Anderson, L. G., Lanning, J. A., Barrell, R., Miyagishima, J., Jones, R. H., and Wolfe, P.: Sources and sinks of formaldehyde and acetaldehyde: An analysis of Denver's ambient concentration data, Atmos. Environ., 30, 2113–2123, 1996.
Apel, E., Hornbrook, R., Hills, A., Blake, N., Barth, M., Weinheimer, A., Cantrell, C., Rutledge, S., Basarab, B., and Crawford, J.: Upper tropospheric ozone production from lightning NOx-impacted convection: Smoke ingestion case study from the DC3 campaign, J. Geophys. Res.-Atmos., 120, 2505–2523, 2015.
Arey, J., Crowley, D. E., Crowley, M., Resketo, M., and Lester, J.: Hydrocarbon emissions from natural vegetation in California's South Coast Air Basin, Atmos. Environ., 29, 2977–2988, 1995.
Atkinson, R.: Kinetics and mechanisms of the gas-phase reactions of the hydroxyl radical with organic compounds under atmospheric conditions, Chem. Rev., 86, 69–201, 1986.
Atkinson, R. and Arey, J.: Atmospheric degradation of volatile organic compounds, Chem. Rev., 103, 4605–4638, 2003.
Atkinson, R., Baulch, D., Cox, R., Hampson Jr, R., Kerr, J., Rossi, M., and Troe, J.: Evaluated kinetic, photochemical and heterogeneous data for atmospheric chemistry: Supplement V. IUPAC Subcommittee on Gas Kinetic Data Evaluation for Atmospheric Chemistry, J. Phys. Chem. Ref. Data, 26, 521–1011, 1997.
Atkinson, R., Baulch, D. L., Cox, R. A., Crowley, J. N., Hampson, R. F., Hynes, R. G., Jenkin, M. E., Rossi, M. J., and Troe, J.: Evaluated kinetic and photochemical data for atmospheric chemistry: Volume I – gas phase reactions of Ox, HOx, NOx and SOx species, Atmos. Chem. Phys., 4, 1461–1738, https://doi.org/10.5194/acp-4-1461-2004, 2004.
Atkinson, R., Baulch, D. L., Cox, R. A., Crowley, J. N., Hampson, R. F., Hynes, R. G., Jenkin, M. E., Rossi, M. J., Troe, J., and IUPAC Subcommittee: Evaluated kinetic and photochemical data for atmospheric chemistry: Volume II – gas phase reactions of organic species, Atmos. Chem. Phys., 6, 3625–4055, https://doi.org/10.5194/acp-6-3625-2006, 2006.
Atkinson, R., Baulch, D. L., Cox, R. A., Crowley, J. N., Hampson, R. F., Hynes, R. G., Jenkin, M. E., Rossi, M. J., Troe, J., and Wallington, T. J.: Evaluated kinetic and photochemical data for atmospheric chemistry: Volume IV – gas phase reactions of organic halogen species, Atmos. Chem. Phys., 8, 4141–4496, https://doi.org/10.5194/acp-8-4141-2008, 2008.
Benjamin, M. T., Sudol, M., Vorsatz, D., and Winer, A. M.: A spatially and temporally resolved biogenic hydrocarbon emissions inventory for the California South Coast Air Basin, Atmos. Environ., 31, 3087–3100, 1997.
Bianco, L., Djalalova, I., King, C., and Wilczak, J.: Diurnal evolution and annual variability of boundary-layer height and its correlation to other meteorological variables in California's Central Valley, Bound.-Lay. Meteorol., 140, 491–511, 2011.
Bierbach, A., Barnes, I., Becker, K. H., and Wiesen, E.: Atmospheric chemistry of unsaturated carbonyls: Butenedial, 4-oxo-2-pentenal, 3-hexene-2, 5-dione, maleic anhydride, 3H-furan-2-one, and 5-methyl-3H-furan-2-one, Environ. Sci. Technol., 28, 715–729, 1994.
Bierbach, A., Barnes, I., and Becker, K.: Product and kinetic study of the OH-initiated gas-phase oxidation of furan, 2-methylfuran and furanaldehydes at 300 K, Atmos. Environ., 29, 2651–2660, 1995.
Borduas, N., Abbatt, J. P., Murphy, J. G., So, S., and da Silva, G.: Gas-phase mechanisms of the reactions of reduced organic nitrogen compounds with OH radicals, Environ. Sci. Technol., 50, 11723–11734, 2016.
Bourgeois, I., Peischl, J., Neuman, J. A., Brown, S. S., Thompson, C. R., Aikin, K. C., Allen, H. M., Angot, H., Apel, E. C., and Baublitz, C. B.: Large contribution of biomass burning emissions to ozone throughout the global remote troposphere, P. Natl. Acad. Sci. USA, 118, https://doi.org/10.1073/pnas.2109628118, 2021.
Bourgeois, I., Peischl, J., Neuman, J. A., Brown, S. S., Allen, H. M., Campuzano-Jost, P., Coggon, M. M., DiGangi, J. P., Diskin, G. S., Gilman, J. B., Gkatzelis, G. I., Guo, H., Halliday, H., Hanisco, T. F., Holmes, C. D., Huey, L. G., Jimenez, J. L., Lamplugh, A. D., Lee, Y. R., Lindaas, J., Moore, R. H., Nowak, J. B., Pagonis, D., Rickly, P. S., Robinson, M. A., Rollins, A. W., Selimovic, V., St. Clair, J. M., Tanner, D., Vasquez, K. T., Veres, P. R., Warneke, C., Wennberg, P. O., Washenfelder, R. A., Wiggins, E. B., Womack, C. C., Xu, L., Zarzana, K. J., and Ryerson, T. B.: Comparison of airborne measurements of NO, NO2, HONO, NOy and CO during FIREX-AQ, Atmos. Meas. Tech. Discuss. [preprint], https://doi.org/10.5194/amt-2021-432, in review, 2022.
Burkholder, J. B., Sander, S. P., Abbatt, J. P. D., Barker, J. R., Huie, R. E., Kolb, C. E., Kurylo, M. J., Orkin, V. L., Wilmouth, D. M., and Wine, P. H.: Chemical kinetics and photochemical data for use in atmospheric studies, Evaluation Number 18, JPL Publication, 15–10, 2015.
Cai, C., Avise, J., Kaduwela, A., DaMassa, J., Warneke, C., Gilman, J. B., Kuster, W., Gouw, J., Volkamer, R., Stevens, P., Lefer, B., Holloway, J. S., Pollack, I. B., Ryerson, T., Atlas, E., Blake, D., Rappenglueck, B., Brown, S. S., and Dube, W. P.: Simulating the weekly cycle of NOx-VOC-HOx-O3 photochemical system in the South Coast of California during CalNex-2010 campaign, J. Geophys. Res.-Atmos., 124, 3532–3555, 10.1029/2018jd029859, 2019.
Cappa, C. D., Onasch, T. B., Massoli, P., Worsnop, D. R., Bates, T. S., Cross, E. S., Davidovits, P., Hakala, J., Hayden, K. L., and Jobson, B. T.: Radiative absorption enhancements due to the mixing state of atmospheric black carbon, Science, 337, 1078–1081, 2012.
Carreras-Sospedra, M., Dabdub, D., Rodriguez, M., and Brouwer, J.: Air quality modeling in the South Coast Air Basin of California: What do the numbers really mean?, J. Air & Waste Manage. Assoc., 56, 1184–1195, 2006.
Choi, W., Faloona, I. C., Bouvier-Brown, N. C., McKay, M., Goldstein, A. H., Mao, J., Brune, W. H., LaFranchi, B. W., Cohen, R. C., Wolfe, G. M., Thornton, J. A., Sonnenfroh, D. M., and Millet, D. B.: Observations of elevated formaldehyde over a forest canopy suggest missing sources from rapid oxidation of arboreal hydrocarbons, Atmos. Chem. Phys., 10, 8761–8781, https://doi.org/10.5194/acp-10-8761-2010, 2010.
Coggon, M. M., Gkatzelis, G. I., McDonald, B. C., Gilman, J. B., Schwantes, R. H., Abuhassan, N., Aikin, K. C., Arend, M. F., Berkoff, T. A., and Brown, S. S.: Volatile chemical product emissions enhance ozone and modulate urban chemistry, P. Natl. Acad. Sci. USA, 118, 32, https://doi.org/10.1073/pnas.2026653118, 2021.
Crounse, J. D., McKinney, K. A., Kwan, A. J., and Wennberg, P. O.: Measurement of gas-phase hydroperoxides by chemical ionization mass spectrometry, Anal. Chem., 78, 6726–6732, 2006.
Cui, Y. Y., Vijayan, A., Falk, M., Hsu, Y.-K., Yin, D., Chen, X. M., Zhao, Z., Avise, J., Chen, Y., and Verhulst, K.: A multiplatform inversion estimation of statewide and regional methane emissions in California during 2014–2016, Environ. Sci. Technol., 53, 9636–9645, 2019.
De Gouw, J., Gilman, J., Borbon, A., Warneke, C., Kuster, W., Goldan, P., Holloway, J., Peischl, J., Ryerson, T., and Parrish, D.: Increasing atmospheric burden of ethanol in the United States, Geophys. Res. Lett., 39, L15803, https://doi.org/10.1029/2012GL052109, 2012.
Dolgorouky, C., Gros, V., Sarda-Esteve, R., Sinha, V., Williams, J., Marchand, N., Sauvage, S., Poulain, L., Sciare, J., and Bonsang, B.: Total OH reactivity measurements in Paris during the 2010 MEGAPOLI winter campaign, Atmos. Chem. Phys., 12, 9593–9612, https://doi.org/10.5194/acp-12-9593-2012, 2012.
Faloona, I. C., Chiao, S., Eiserloh, A. J., Alvarez, R. J., Kirgis, G., Langford, A. O., Senff, C. J., Caputi, D., Hu, A., Iraci, L. T., Yates, E. L., Marrero, J. E., Ryoo, J.-M., Conley, S., Tanrikulu, S., Xu, J., and Kuwayama, T.: The California baseline ozone transport study (CABOTS), B. Am. Meteorol. Soc., 101, E427–E445, https://doi.org/10.1175/bams-d-18-0302.1, 2020.
Fraser, M. P., Cass, G. R., and Simoneit, B. R.: Gas-phase and particle-phase organic compounds emitted from motor vehicle traffic in a Los Angeles roadway tunnel, Environ. Sci. Technol., 32, 2051–2060, 1998.
Fried, A., Walega, J., Weibring, P., Richter, D., Simpson, I. J., Blake, D. R., Blake, N. J., Meinardi, S., Barletta, B., and Hughes, S. C.: Airborne formaldehyde and volatile organic compound measurements over the Daesan petrochemical complex on Korea's northwest coast during the Korea-United States Air Quality study: Estimation of emission fluxes and effects on air quality, Elementa: Science of the Anthropocene, 8, 1, https://doi.org/10.1525/elementa.2020.121, 2020.
Gentner, D. R., Ford, T. B., Guha, A., Boulanger, K., Brioude, J., Angevine, W. M., de Gouw, J. A., Warneke, C., Gilman, J. B., Ryerson, T. B., Peischl, J., Meinardi, S., Blake, D. R., Atlas, E., Lonneman, W. A., Kleindienst, T. E., Beaver, M. R., Clair, J. M. St., Wennberg, P. O., VandenBoer, T. C., Markovic, M. Z., Murphy, J. G., Harley, R. A., and Goldstein, A. H.: Emissions of organic carbon and methane from petroleum and dairy operations in California's San Joaquin Valley, Atmos. Chem. Phys., 14, 4955–4978, https://doi.org/10.5194/acp-14-4955-2014, 2014.
Gilbert, N. L., Guay, M., Gauvin, D., Dietz, R. N., Chan, C. C., and Lévesque, B.: Air change rate and concentration of formaldehyde in residential indoor air, Atmos. Environ., 42, 2424–2428, https://doi.org/10.1016/j.atmosenv.2007.12.017, 2008.
Gilman, J. B., Kuster, W. C., Goldan, P. D., Herndon, S. C., Zahniser, M. S., Tucker, S. C., Brewer, W. A., Lerner, B. M., Williams, E. J., Harley, R. A., Fehsenfeld, F. C., Warneke, C., and de Gouw, J. A.: Measurements of volatile organic compounds during the 2006 TexAQS/GoMACCS campaign: Industrial influences, regional characteristics, and diurnal dependencies of the OH reactivity, J. Geophys. Res., 114, D00F06, https://doi.org/10.1029/2008jd011525, 2009.
Gilman, J. B., Lerner, B. M., Kuster, W. C., and De Gouw, J. A.: Source signature of volatile organic compounds from oil and natural gas operations in northeastern Colorado, Environ. Sci. Technol., 47, 1297–1305, 2013.
Gkatzelis, G. I., Coggon, M. M., McDonald, B. C., Peischl, J., Gilman, J. B., Aikin, K. C., Robinson, M. A., Canonaco, F., Prevot, A. S., and Trainer, M.: Observations confirm that volatile chemical products are a major source of petrochemical emissions in US cities, Environ. Sci. Technol., 55, 4332–4343, 2021.
Goldstein, A. H. and Galbally, I. E.: Known and unexplored organic constituents in the earth's atmosphere, Environ. Sci. Technol., 41, 1514–1521, 2007.
Gu, S., Guenther, A., and Faiola, C.: Effects of anthropogenic and biogenic volatile organic compounds on Los Angeles air quality, Environ. Sci. Technol., 55, 12191–12201, 2021.
Guenther, A. B., Jiang, X., Heald, C. L., Sakulyanontvittaya, T., Duhl, T., Emmons, L. K., and Wang, X.: The Model of Emissions of Gases and Aerosols from Nature version 2.1 (MEGAN2.1): an extended and updated framework for modeling biogenic emissions, Geosci. Model Dev., 5, 1471–1492, https://doi.org/10.5194/gmd-5-1471-2012, 2012.
Hansen, R. F., Griffith, S. M., Dusanter, S., Gilman, J. B., Graus, M., Kuster, W. C., Veres, P. R., de Gouw, J. A., Warneke, C., Washenfelder, R. A., Young, C. J., Brown, S. S., Alvarez, S. L., Flynn, J. H., Grossberg, N. E., Lefer, B., Rappenglueck, B., and Stevens, P. S.: Measurements of total OH reactivity during CalNex-LA, J. Geophys. Res.-Atmos., 126, e2020JD032988, https://doi.org/10.1029/2020jd032988, 2021.
Heald, C. L. and Kroll, J. H.: The fuel of atmospheric chemistry: Toward a complete description of reactive organic carbon, Sci. Adv., 6, eaay8967, https://doi.org/10.1126/sciadv.aay8967, 2020.
Heald, C. L., Gouw, J., Goldstein, A. H., Guenther, A. B., Hayes, P. L., Hu, W., Isaacman-VanWertz, G., Jimenez, J. L., Keutsch, F. N., Koss, A. R., Misztal, P. K., Rappengluck, B., Roberts, J. M., Stevens, P. S., Washenfelder, R. A., Warneke, C., and Young, C. J.: Contrasting reactive organic carbon observations in the southeast United States (SOAS) and southern California (CalNex), Environ. Sci. Technol., 54, 14923–14935, https://doi.org/10.1021/acs.est.0c05027, 2020.
Holzinger, R., Warneke, C., Hansel, A., Jordan, A., Lindinger, W., Scharffe, D. H., Schade, G., and Crutzen, P. J.: Biomass burning as a source of formaldehyde, acetaldehyde, methanol, acetone, acetonitrile, and hydrogen cyanide, Geophys. Res. Lett., 26, 1161–1164, https://doi.org/10.1029/1999gl900156, 1999.
Kampa, M. and Castanas, E.: Human health effects of air pollution, Environ. Pollut., 151, 362–367, https://doi.org/10.1016/j.envpol.2007.06.012, 2008.
Karl, T., Guenther, A., Turnipseed, A., Tyndall, G., Artaxo, P., and Martin, S.: Rapid formation of isoprene photo-oxidation products observed in Amazonia, Atmos. Chem. Phys., 9, 7753–7767, https://doi.org/10.5194/acp-9-7753-2009, 2009.
Kim, S., Jeong, D., Sanchez, D., Wang, M., Seco, R., Blake, D., Meinardi, S., Barletta, B., Hughes, S., Jung, J., Kim, D., Lee, G., Lee, M., Ahn, J., Lee, S.-D., Cho, G., Sung, M.-Y., Lee, Y.-H., and Park, R.: The controlling factors of photochemical ozone production in Seoul, South Korea, Aerosol Air Qual. Res., 18, 2253–2261, https://doi.org/10.4209/aaqr.2017.11.0452, 2018.
Kim, S. W., McDonald, B. C., Seo, S., Kim, K. M., and Trainer, M.: Understanding the paths of surface ozone abatement in the Los Angeles Basin, J. Geophys. Res.-Atmos., 127, e2021JD035606, 2022.
Kwok, E. S. and Atkinson, R.: Estimation of hydroxyl radical reaction rate constants for gas-phase organic compounds using a structure-reactivity relationship: An update, Atmos. Environ., 29, 1685–1695, 1995.
Lauraguais, A., Bejan, I., Barnes, I., Wiesen, P., and Coeur, C.: Rate coefficients for the gas-phase reactions of hydroxyl radicals with a series of methoxylated aromatic compounds, J. Phys. Chem. A, 119, 6179–6187, 2015.
Lee, Y. N., Zhou, X., Kleinman, L., Nunnermacker, L., Springston, S., Daum, P., Newman, L., Keigley, W., Holdren, M., and Spicer, C.: Atmospheric chemistry and distribution of formaldehyde and several multioxygenated carbonyl compounds during the 1995 Nashville/Middle Tennessee Ozone Study, J. Geophys. Res.-Atmos., 103, 22449–22462, 1998.
Lerner, B. M., Gilman, J. B., Aikin, K. C., Atlas, E. L., Goldan, P. D., Graus, M., Hendershot, R., Isaacman-VanWertz, G. A., Koss, A., Kuster, W. C., Lueb, R. A., McLaughlin, R. J., Peischl, J., Sueper, D., Ryerson, T. B., Tokarek, T. W., Warneke, C., Yuan, B., and de Gouw, J. A.: An improved, automated whole air sampler and gas chromatography mass spectrometry analysis system for volatile organic compounds in the atmosphere, Atmos. Meas. Tech., 10, 291–313, https://doi.org/10.5194/amt-10-291-2017, 2017.
Ling, Z. H., Guo, H., Lam, S. H. M., Saunders, S. M., and Wang, T.: Atmospheric photochemical reactivity and ozone production at two sites in Hong Kong: Application of a Master Chemical Mechanism-photochemical box model, J. Geophys. Res.-Atmos., 119, 10567–10582, https://doi.org/10.1002/2014jd021794, 2014.
Liu, S., Li, R., Wild, R., Warneke, C., De Gouw, J., Brown, S., Miller, S., Luongo, J., Jimenez, J., and Ziemann, P.: Contribution of human-related sources to indoor volatile organic compounds in a university classroom, Indoor Air, 26, 925–938, 2016.
Lou, S., Holland, F., Rohrer, F., Lu, K., Bohn, B., Brauers, T., Chang, C. C., Fuchs, H., Häseler, R., Kita, K., Kondo, Y., Li, X., Shao, M., Zeng, L., Wahner, A., Zhang, Y., Wang, W., and Hofzumahaus, A.: Atmospheric OH reactivities in the Pearl River Delta – China in summer 2006: measurement and model results, Atmos. Chem. Phys., 10, 11243–11260, https://doi.org/10.5194/acp-10-11243-2010, 2010.
Malkina, I. L., Kumar, A., Green, P. G., and Mitloehner, F. M.: Identification and quantitation of volatile organic compounds emitted from dairy silages and other feedstuffs, J. Environ. Qual., 40, 28–36, 10.2134/jeq2010.0302, 2011.
Mårtensson, L., Magnusson, M., Shen, Y., and Jönsson, J. Å.: Air concentrations of volatile organic acids in confined animal buildings–determination with ion chromatography, Agr. Ecosyst. Environ., 75, 101–108, 1999.
McDonald, B. C., De Gouw, J. A., Gilman, J. B., Jathar, S. H., Akherati, A., Cappa, C. D., Jimenez, J. L., Lee-Taylor, J., Hayes, P. L., and McKeen, S. A.: Volatile chemical products emerging as largest petrochemical source of urban organic emissions, Science, 359, 760–764, 2018.
Misztal, P. K., Karl, T., Weber, R., Jonsson, H. H., Guenther, A. B., and Goldstein, A. H.: Airborne flux measurements of biogenic isoprene over California, Atmos. Chem. Phys., 14, 10631–10647, https://doi.org/10.5194/acp-14-10631-2014, 2014.
Mo, Z., Shao, M., Wang, W., Liu, Y., Wang, M., and Lu, S.: Evaluation of biogenic isoprene emissions and their contribution to ozone formation by ground-based measurements in Beijing, China, Sci. Total Environ., 627, 1485–1494, https://doi.org/10.1016/j.scitotenv.2018.01.336, 2018.
NASA: FIREX-AQ data, https://www-air.larc.nasa.gov/cgi-bin/ArcView/firexaq, last access: 24 August 2022.
Nuvolone, D., Petri, D., and Voller, F.: The effects of ozone on human health, Environ. Sci. Pollut. Res. Int., 25, 8074–8088, https://doi.org/10.1007/s11356-017-9239-3, 2017.
Page, L. H., Ni, J.-Q., Heber, A. J., Mosier, N. S., Liu, X., Joo, H.-S., Ndegwa, P. M., and Harrison, J. H.: Characteristics of volatile fatty acids in stored dairy manure before and after anaerobic digestion, Biosyst. Eng., 118, 16–28, 2014.
Palmer, P. I., Jacob, D. J., Fiore, A. M., Martin, R. V., Chance, K., and Kurosu, T. P.: Mapping isoprene emissions over North America using formaldehyde column observations from space, J. Geophys. Res.-Atmos., 108, 4180, https://doi.org/10.1029/2002JD002153, 2003.
Parrish, D. D., Ryerson, T. B., Mellqvist, J., Johansson, J., Fried, A., Richter, D., Walega, J. G., Washenfelder, R. A., de Gouw, J. A., Peischl, J., Aikin, K. C., McKeen, S. A., Frost, G. J., Fehsenfeld, F. C., and Herndon, S. C.: Primary and secondary sources of formaldehyde in urban atmospheres: Houston Texas region, Atmos. Chem. Phys., 12, 3273–3288, https://doi.org/10.5194/acp-12-3273-2012, 2012.
Parrish, D. D., Young, L. M., Newman, M. H., Aikin, K. C., and Ryerson, T. B.: Ozone design values in southern California's air basins: Temporal evolution and U.S. background contribution, J. Geophys. Res.-Atmos., 122, 11166–111182, https://doi.org/10.1002/2016jd026329, 2017.
Parrish, D. D., Derwent, R. G., and Faloona, I. C.: Long-term baseline ozone changes in the Western US: A Synthesis of Analyses, J. Air Waste Manage. Assoc., 71, 1397–1406, 2021.
Peischl, J., Ryerson, T., Brioude, J., Aikin, K., Andrews, A., Atlas, E., Blake, D., Daube, B., De Gouw, J., and Dlugokencky, E.: Quantifying sources of methane using light alkanes in the Los Angeles basin, California, J. Geophys. Res.-Atmos., 118, 4974–4990, 2013.
Pusede, S. E. and Cohen, R. C.: On the observed response of ozone to NOx and VOC reactivity reductions in San Joaquin Valley California 1995–present, Atmos. Chem. Phys., 12, 8323–8339, https://doi.org/10.5194/acp-12-8323-2012, 2012.
Reimann, S., Calanca, P., and Hofer, P.: The anthropogenic contribution to isoprene concentrations in a rural atmosphere, Atmos. Environ., 34, 109–115, 2000.
Richter, D., Weibring, P., Walega, J. G., Fried, A., Spuler, S. M., and Taubman, M. S.: Compact highly sensitive multi-species airborne mid-IR spectrometer, Appl. Phys. B, 119, 119–131, 2015.
Roberts, J. M., Jobson, B. T., Kuster, W., Goldan, P., Murphy, P., Williams, E., Frost, G., Riemer, D., Apel, E., and Stroud, C.: An examination of the chemistry of peroxycarboxylic nitric anhydrides and related volatile organic compounds during Texas Air Quality Study 2000 using ground-based measurements, J. Geophys. Res.-Atmos., 108, 4495, https://doi.org/10.1029/2003JD003383, 2003.
Sachse, G. W., Hill, G. F., Wade, L. O., and Perry, M. G.: Fast-response, high-precision carbon monoxide sensor using a tunable diode laser absorption technique, J. Geophys. Res.-Atmos., 92, 2071–2081, 1987.
Salthammer, T., Mentese, S., and Marutzky, R.: Formaldehyde in the indoor environment, Chem. Rev., 110, 2536–2572, 2010.
Semadeni, M., Stocker, D. W., and Kerr, J. A.: The temperature dependence of the OH radical reactions with some aromatic compounds under simulated tropospheric conditions, Int. J. Chem. Kinet., 27, 287–304, 1995.
Shaw, S. L., Mitloehner, F. M., Jackson, W., DePeters, E. J., Fadel, J. G., Robinson, P. H., Holzinger, R., and Goldstein, A. H.: Volatile organic compound emissions from dairy cows and their waste as measured by proton-transfer-reaction mass spectrometry, Environ. Sci. Technol., 41, 1310–1316, 2007.
Simpson, I. J., Blake, D. R., Blake, N. J., Meinardi, S., Barletta, B., Hughes, S. C., Fleming, L. T., Crawford, J. H., Diskin, G. S., and Emmons, L. K.: Characterization, sources and reactivity of volatile organic compounds (VOCs) in Seoul and surrounding regions during KORUS-AQ, Elementa: Science of the Anthropocene, 8, 37, https://doi.org/10.1525/elementa.434, 2020.
Steiner, A. L., Cohen, R. C., Harley, R. A., Tonse, S., Millet, D. B., Schade, G. W., and Goldstein, A. H.: VOC reactivity in central California: comparing an air quality model to ground-based measurements, Atmos. Chem. Phys., 8, 351–368, https://doi.org/10.5194/acp-8-351-2008, 2008.
Sun, H., Trabue, S. L., Scoggin, K., Jackson, W. A., Pan, Y., Zhao, Y., Malkina, I. L., Koziel, J. A., and Mitloehner, F. M.: Alcohol, volatile fatty acid, phenol, and methane emissions from dairy cows and fresh manure, J. Environ. Qual., 37, 615–622, 2008.
Veres, P. R., Neuman, J. A., Bertram, T. H., Assaf, E., Wolfe, G. M., Williamson, C. J., Weinzierl, B., Tilmes, S., Thompson, C. R., and Thames, A. B.: Global airborne sampling reveals a previously unobserved dimethyl sulfide oxidation mechanism in the marine atmosphere, P. Natl. Acad. Sci. USA, 117, 4505–4510, 2020.
Warneke, C., De Gouw, J. A., Holloway, J. S., Peischl, J., Ryerson, T. B., Atlas, E., Blake, D., Trainer, M., and Parrish, D. D.: Multiyear trends in volatile organic compounds in Los Angeles, California: Five decades of decreasing emissions, J. Geophys. Res.-Atmos., 117, D00V17, https://doi.org/10.1029/2012JD017899, 2012.
Warneke, C., Schwarz, J. P., Crawford, J., Dibb, J., Kalashnikova, O., Frost, G., Seidel, F., Al-Saadi, J., Brown, S., Washenfelder, R., Brewer, A., Moore, R., Anderson, B., Yacovitch, T., Herndon, S., Liu, S., Jaffe, D., Johnston, N., Selimovic, V., Yokelson, B., Giles, D., Holben, B., Goloub, P., Popovici, I., Trainer, M., Pierce, B., Fahey, D., Roberts, J., Soja, A., Peterson, D., Saide, P. E., Holmes, C., Wang, S., Coggon, M., Decker, Z., Ye, X., Stockwell, C., Xu, L., Gkatzelis, G. I., Lefer, B., and Crawford, J.: Fire influence on regional to global environments and air quality (FIREX-AQ), in prep., 2022.
Wennberg, P. O., Mui, W., Wunch, D., Kort, E. A., Blake, D. R., Atlas, E. L., Santoni, G. W., Wofsy, S. C., Diskin, G. S., Jeong, S., and Fischer, M. L.: On the sources of methane to the Los Angeles atmosphere, Environ. Sci. Technol., 46, 9282–9289, https://doi.org/10.1021/es301138y, 2012.
Wennberg, P. O., Bates, K. H., Crounse, J. D., Dodson, L. G., McVay, R. C., Mertens, L. A., Nguyen, T. B., Praske, E., Schwantes, R. H., Smarte, M. D., St Clair, J. M., Teng, A. P., Zhang, X., and Seinfeld, J. H.: Gas-Phase reactions of isoprene and its major oxidation products, Chem. Rev., 118, 3337–3390, https://doi.org/10.1021/acs.chemrev.7b00439, 2018.
Whalley, L. K., Stone, D., Bandy, B., Dunmore, R., Hamilton, J. F., Hopkins, J., Lee, J. D., Lewis, A. C., and Heard, D. E.: Atmospheric OH reactivity in central London: observations, model predictions and estimates of in situ ozone production, Atmos. Chem. Phys., 16, 2109–2122, https://doi.org/10.5194/acp-16-2109-2016, 2016.
Wu, C., Wang, C., Wang, S., Wang, W., Yuan, B., Qi, J., Wang, B., Wang, H., Wang, C., Song, W., Wang, X., Hu, W., Lou, S., Ye, C., Peng, Y., Wang, Z., Huangfu, Y., Xie, Y., Zhu, M., Zheng, J., Wang, X., Jiang, B., Zhang, Z., and Shao, M.: Measurement report: Important contributions of oxygenated compounds to emissions and chemistry of volatile organic compounds in urban air, Atmos. Chem. Phys., 20, 14769–14785, https://doi.org/10.5194/acp-20-14769-2020, 2020.
Wu, S., Lee, H. J., Anderson, A., Liu, S., Kuwayama, T., Seinfeld, J. H., and Kleeman, M. J.: Direct measurements of ozone response to emissions perturbations in California, Atmos. Chem. Phys., 22, 4929–4949, https://doi.org/10.5194/acp-22-4929-2022, 2022.
Yang, Y., Shao, M., Wang, X., Nölscher, A. C., Kessel, S., Guenther, A., and Williams, J.: Towards a quantitative understanding of total OH reactivity: A review, Atmos. Environ., 134, 147–161, https://doi.org/10.1016/j.atmosenv.2016.03.010, 2016.
Yuan, B., Koss, A. R., Warneke, C., Coggon, M., Sekimoto, K., and de Gouw, J. A.: Proton-transfer-reaction mass spectrometry: Applications in atmospheric sciences, Chem. Rev., 117, 13187–13229, 2017a.
Yuan, B., Coggon, M. M., Koss, A. R., Warneke, C., Eilerman, S., Peischl, J., Aikin, K. C., Ryerson, T. B., and de Gouw, J. A.: Emissions of volatile organic compounds (VOCs) from concentrated animal feeding operations (CAFOs): chemical compositions and separation of sources, Atmos. Chem. Phys., 17, 4945–4956, https://doi.org/10.5194/acp-17-4945-2017, 2017b.
Zheng, W., Flocke, F. M., Tyndall, G. S., Swanson, A., Orlando, J. J., Roberts, J. M., Huey, L. G., and Tanner, D. J.: Characterization of a thermal decomposition chemical ionization mass spectrometer for the measurement of peroxy acyl nitrates (PANs) in the atmosphere, Atmos. Chem. Phys., 11, 6529–6547, https://doi.org/10.5194/acp-11-6529-2011, 2011.
Zhong, S., Whiteman, C. D., and Bian, X.: Diurnal evolution of three-dimensional wind and temperature structure in California's Central Valley, J. Appl. Meteorol., 43, 1679–1699, 2004.