the Creative Commons Attribution 4.0 License.
the Creative Commons Attribution 4.0 License.
 | 19 Aug 2022
Variations and sources of volatile organic compounds (VOCs) in urban region: insights from measurements on a tall tower
Xiao-Bing Li
Sihang Wang
Chunlin Wang
Jing Lan
Zhijie Liu
Yongxin Song
Xianjun He
Yibo Huangfu
Chenglei Pei
Peng Cheng
Suxia Yang
Jipeng Qi
Caihong Wu
Shan Huang
Yingchang You
Ming Chang
Huadan Zheng
Wenda Yang
Xuemei Wang
Min Shao
Volatile organic compounds (VOCs) are key precursors of ozone and particulate matter, which are the two dominant air pollutants in urban environments. However, compositions and sources of VOCs in urban air aloft have rarely been reported so far. To address this matter, highly time-resolved measurements of VOCs were made by a proton-transfer-reaction time-of-flight mass spectrometer (PTR-ToF-MS) at a 450 m platform on the Canton Tower in Guangzhou, China. A combination of in situ measurements and modeling techniques was used to characterize variations in and sources of VOCs. Five sources were identified from positive matrix factorization (PMF) analysis, namely daytime mixed (e.g., biogenic emissions and secondary formation), visitor-related (e.g., human breath, cooking, and volatilization of ethanol-containing products), vehicular–industrial, regional transport, and volatile chemical product (VCP) (i.e., volatilization of personal care products), contributing on average to 21 %, 30 %, 28 %, 10 %, and 11 % of total VOC (TVOC) mixing ratios, respectively. We observe that contributions of the visitor-related source, mainly composed of ethanol, followed with the variation in visitor numbers on the tower well. The VCP-dominated source only had an average contribution of ∼5.7 ppb during the campaign, accounting for a small fraction (11 %) of TVOC mixing ratios but a large fraction (22 %) of the total OH reactivity. However, large fractions of reactive VOC species, e.g., monoterpenes (49 %), were attributed to the VCP-dominated source, indicating important contributions of VCPs to ambient concentrations of these species in urban environments. Vertical profiles of air pollutants (namely NOx, ozone, Ox, and PM2.5), measured at 5, 118, 168, and 488 m, exhibited more evident gradients at night than in the daytime owing to the stronger stability of the nocturnal boundary layer. Mixing ratios of VOC species during the nighttime generally decreased with time when the 450 m platform was located in the nocturnal residual layer and markedly increased when impacted by emissions at ground level. The results in this study demonstrated composition characteristics and sources of VOCs in urban air aloft, which could provide valuable implications in making strategies for control of VOCs and secondary air pollutants.
- Article
(8825 KB) - Full-text XML
-
Supplement
(1346 KB) - BibTeX
- EndNote


Volatile organic compounds (VOCs) are important trace gases in the atmosphere and are composed of myriad chemical species (Pallavi et al., 2019; C. Wang et al., 2020; Gkatzelis et al., 2021). In addition to their direct adverse impacts on human health (Zhang et al., 2013), VOCs are also important precursors of secondary pollutants such as ozone and secondary aerosol (Vo et al., 2018; Zhou et al., 2019; Qin et al., 2021). Reduction in ambient VOC concentrations is the key for synergistic control of both ozone and particle pollution. However, it is highly challenging for this target due to complex sources and chemical transformations of VOCs in urban environments (Yuan et al., 2012; Mo et al., 2016; Zhu et al., 2019).
In addition to compiling accurate emission inventories (bottom-up method) (Zheng et al., 2013; An et al., 2021), the combination of in situ measurements and receptor models (top-down method) was widely adopted to quantitatively apportion sources of ambient VOCs (Baudic et al., 2016; Liu et al., 2016; Fan et al., 2021; Pernov et al., 2021). Concentrations of various VOC species can be measured by offline and online techniques. A gas chromatographer–flame ionization detector–mass spectrometer (GC-FID-MS) combined with stainless-steel canisters is the most popular offline technique (Guo et al., 2011; Yuan et al., 2013; Zhang et al., 2013; Qin et al., 2021). An automated online GC-FID system and high-time-resolution mass spectrometer, such as a proton-transfer-reaction mass spectrometer (PTR-MS) and chemical ionization mass spectrometer (CIMS), are popular online techniques (de Gouw and Warneke, 2007; C. Wang et al., 2020; Z. Wang et al., 2020; Fan et al., 2021; Ye et al., 2021). However, VOC measurements made by both online and offline instruments are markedly affected by very local emission sources, particularly in urban environments, when they are usually deployed at ground level. This is highly important for studies aiming to characterize variations and sources of ambient VOCs at large spatial scales (such as a city or city clusters) based on measurements of only one site. To address this concern, VOC measurements made in the upper part of the planetary boundary layer (PBL) may be a better choice due to the mixing of surface emissions when being transported upward from sources to observation sites (Hu et al., 2015a, b; Squires et al., 2020).
As reported in the literature, in situ measurements of VOCs at high altitudes (e.g., hundreds of meters or several kilometers above ground level) were predominantly made using the combination of offline techniques and samples collected by various platforms such as aircraft (Geng et al., 2009; Xue et al., 2011; Benish et al., 2020), tethered balloons (Zhang et al., 2018; S. Wu et al., 2020, 2021; Wang et al., 2021), high buildings and towers (Ting et al., 2008; Mo et al., 2020), and unmanned aerial vehicles (UAVs) (Vo et al., 2018; Liu et al., 2021). These offline measurements were predominantly used to reveal vertical variations in VOC concentrations, impacts of VOC degradation chemistry on the formation of secondary pollutants, and source characteristics of the species of interest. Offline measurements made at high altitudes were generally not capable of fully characterizing temporal variations in concentrations and source characteristics of VOCs due to strict limitations in their time resolution and sample sizes. In this condition, online VOC measurements with fast response at high altitudes are required. Lack of available platforms has been a key limiting factor for conducting online VOC measurements at high altitudes in China. For instance, the combined utilization of aircraft and an online spectrometer (such as PTR-MS) has been widely used in North America to measure VOC concentrations in the lower troposphere (Hornbrook et al., 2011; Müller et al., 2016; Yuan et al., 2016; Koss et al., 2017; Fry et al., 2018; Chen et al., 2019), while this is quite difficult in China due to the lack of professional research aircraft and the strict control of airspace. Tethered balloons and UAVs are generally not suitable for online VOC measurements due to their limited payloads (Dieu Hien et al., 2019). Tower-based platforms provide another path for online VOC measurements at high altitudes in urban environments. However, tower-based online measurements of VOCs have only been reported in Beijing, China, so far (Squires et al., 2020; Zhang et al., 2020).
In this study, continuous online VOCs measurements, including more than 200 species with a time resolution of 10 s, were made at a 450 m platform on the Canton Tower in the Pearl River Delta (PRD) region, China, during August–November 2020. A combination of the VOC measurements and the positive matrix factorization (PMF) receptor model was used to provide new insights into the concentrations, temporal variations, and source contributions of VOCs in the urban region.
2.1 Site description and field campaign
The PRD region is one of the most developed city clusters in China with more than 70 million residents by 2020 and is suffering from air pollution problems (e.g., ozone and secondary aerosol) (Wang et al., 2017; Y. H. Wang et al., 2020; Yan et al., 2020; Li et al., 2022). In this study, VOC measurements were made at the Canton Tower (CTT, 23.11∘ N, 113.33∘ E) in Guangzhou, a large city in the PRD (Fig. S1 in the Supplement), from 18 August to 5 November 2020. The CTT has a total height of 610 m including the shaft on the top (Fig. S1c). The observation was conducted in a room (Fig. S1) at the 450 m lookout platform (Jin et al., 2022), which is a ramp with stairs and is located on the top of the main body of the CTT. The observation room is located below the ramp, and a sampling port is reserved on the wall outside the tower. A louver is located ∼3 m below the sampling port. The 450 m lookout platform is a famous tourist attraction with an opening time of 10:00–22:30 LT (UTC+8), and visitors can walk around for a panorama of downtown Guangzhou. Each day, there are two busy tourist hours, roughly at 11:00–14:00 and 18:00–21:00 LT, on the 450 m platform. In addition, there are three restaurants between 376 and 423 m. The VOC measurements were interrupted from 8–12 October due to instrument malfunction.
2.2 VOC measurements
VOC measurements were made using a high-resolution proton-transfer-reaction quadrupole interface time-of-flight mass spectrometer (PTR-QiToF-MS, Ionicon Analytik, Innsbruck, Austria) with both hydronium ion (H3O+) (Yuan et al., 2017; C. Wu et al., 2020) and nitric oxide ion (NO+) chemistry (C. Wang et al., 2020). The H3O+ and NO+ modes were automatically switched with 22 min for the H3O+ mode and 12 min for the NO+ mode during the campaign. In this study, only VOC measurements made in the H3O+ mode were used for analysis. In H3O+ mode, the PTR-QiToF-MS was operated with a drift tube pressure of 3.8 mbar, a drift tube temperature of 120 ∘C, and a drift tube voltage of 760 V, resulting in an (E refers to electric field and N refers to number density of buffer gas in the drift tube) value of ∼120 Td (townsend). Raw data of PTR-ToF-MS were processed and analyzed using Tofware software (Tofwerk AG, v3.0.3), and please refer to our previous works (C. Wang et al., 2020; C. Wu et al., 2020) for more details. Signals of 3035 ions with up to 510 were obtained at time resolutions of 10 s. To measure VOC concentrations outside the tower, a ∼5 m long perfluoroalkoxy (PFA) Teflon tube (OD: in.) was used to connect the inlet of the instrument and the sampling port (Fig. S1). The PFA Teflon tubing has been proven to be effective in measuring ambient concentrations of VOCs (Deming et al., 2019; Liu et al., 2019) and has been widely used in field studies (de Gouw et al., 2003a; Hu et al., 2011; C. Wu et al., 2020). Air sample in the tubing was drawn by a pump at a flow rate of ∼5 L min−1. Blank measurements were performed automatically at the last 2 min of the H3O+ mode by passing ambient air through a platinum catalyst heated to 365∘.
A gas standard with 35 VOC species (Table S1 in the Supplement) was used for calibrations of the PTR-ToF-MS once per day. Ten organic acids and nitrogen-containing VOC species were calibrated using a liquid calibration unit in the laboratory. Sensitivities of the remaining VOC species were determined using the quantification method based on reaction kinetics of the PTR-ToF-MS (C. Wu et al., 2020; He et al., 2022). Impacts of the change in ambient humidity on measured signals of the PTR-ToF-MS were removed using humidity-dependence curves of VOC species determined in the laboratory (C. Wang et al., 2020; C. Wu et al., 2020). The limit of detection (LOD) for a VOC species was defined as the concentration when the signal-to-noise ratio (SNR) equals 3 (Yuan et al., 2017). Average mixing ratios, LODs, sensitivities, chemical formula, and suggested compounds of 225 VOC species used in this study are summarized in Table S1.
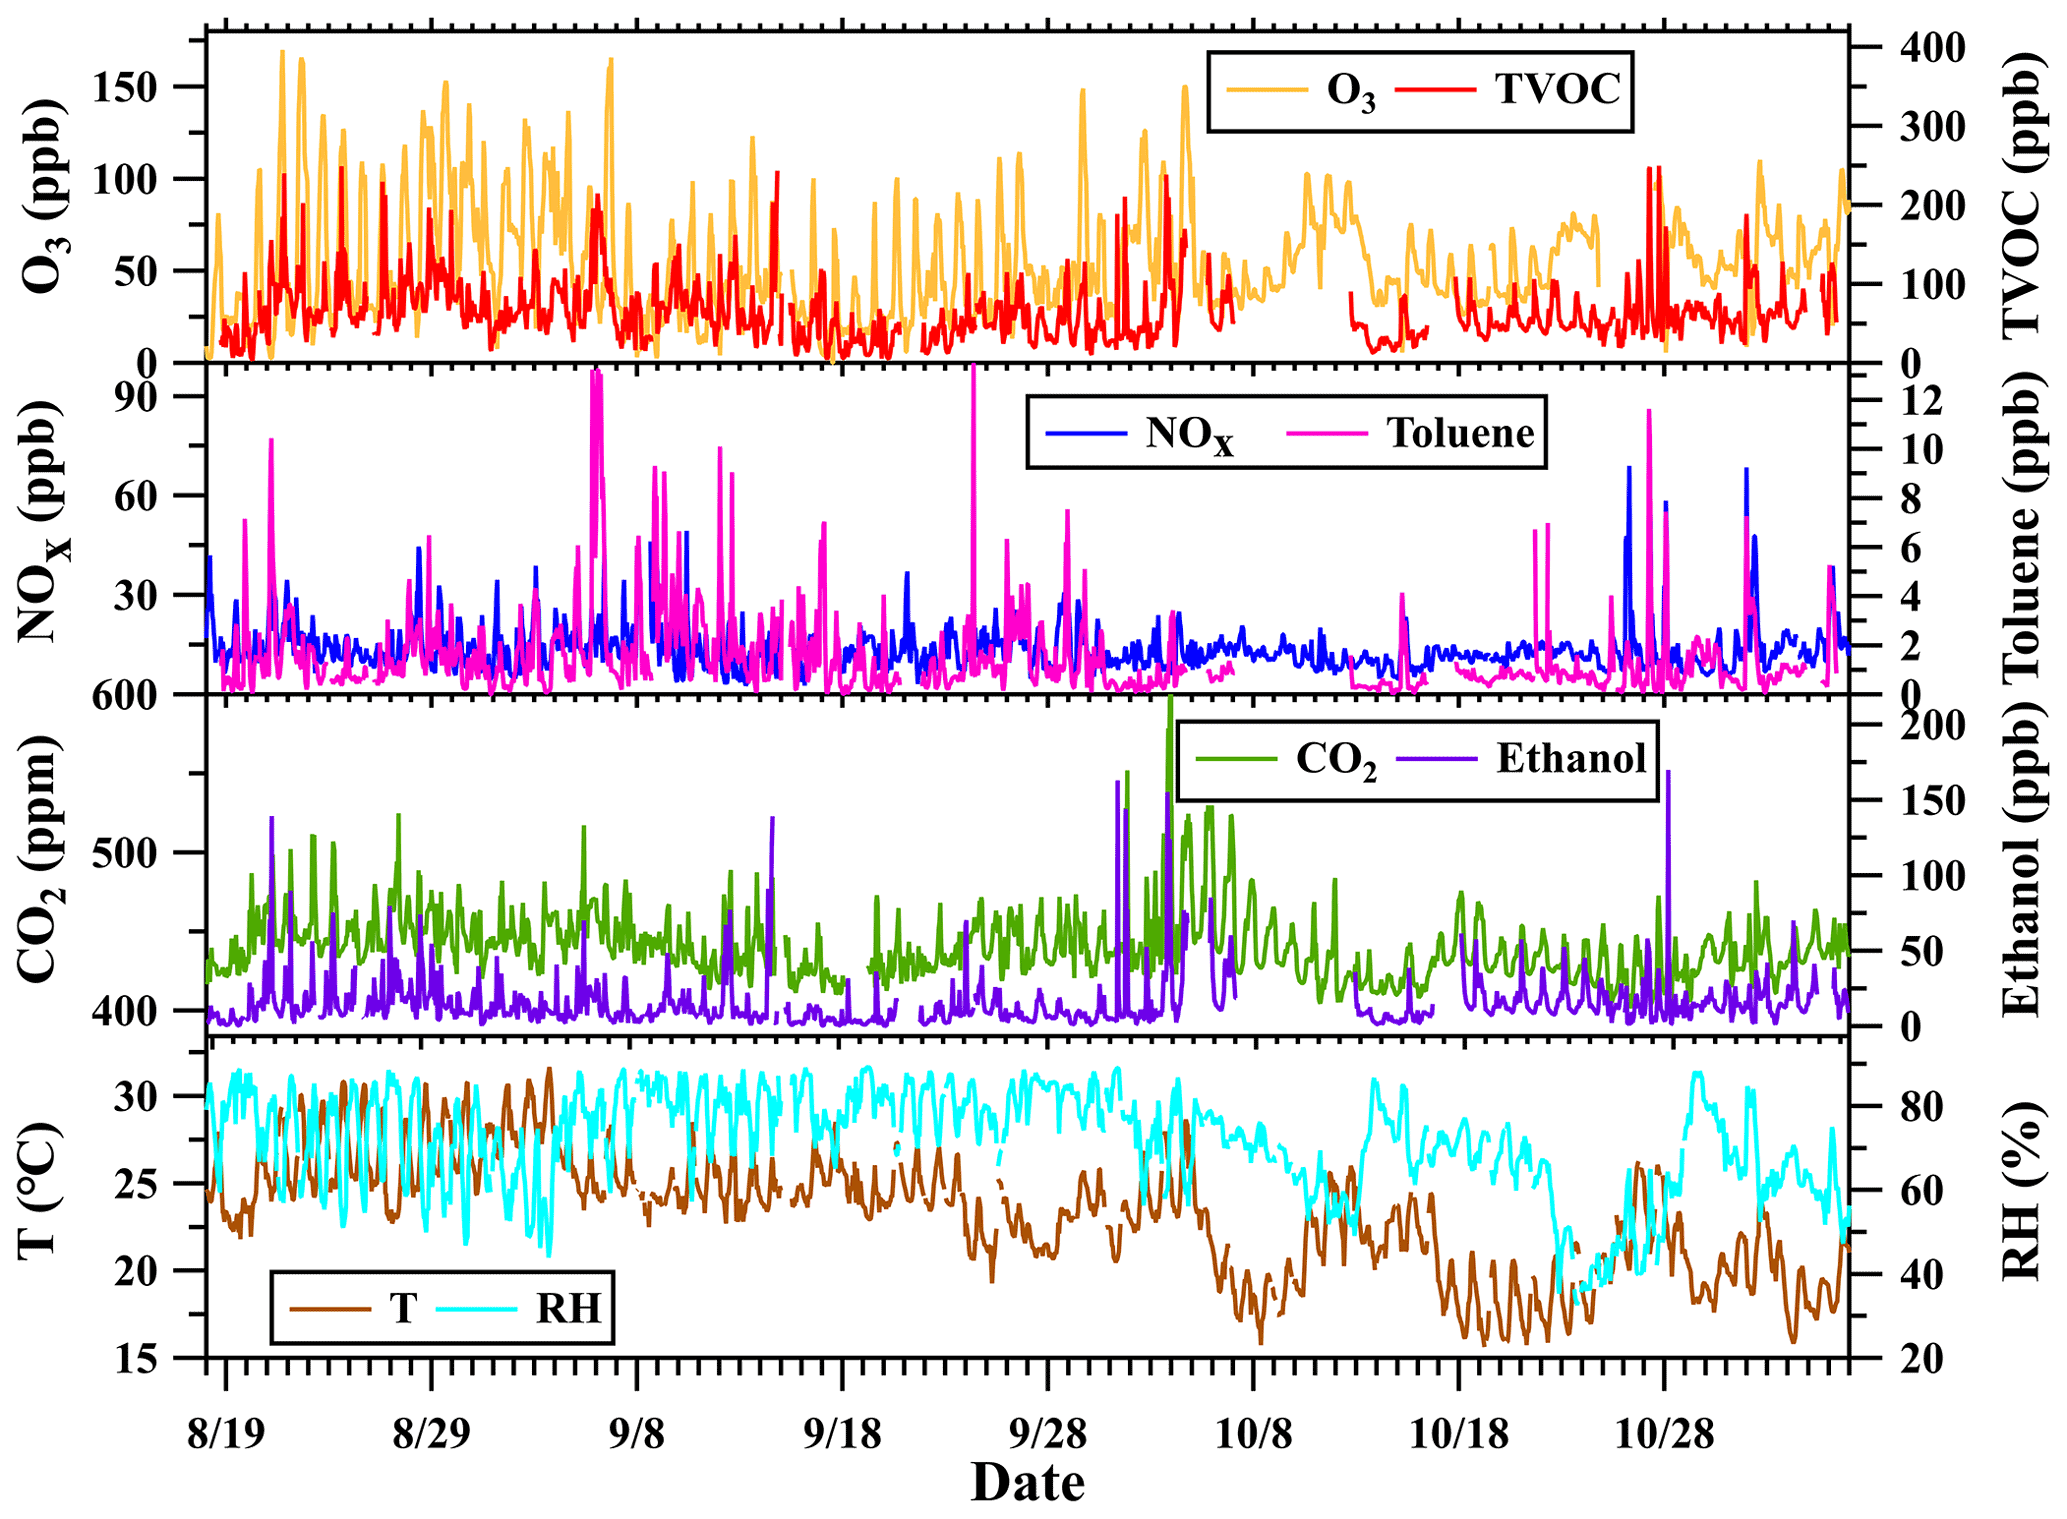
Figure 1Time series of concentrations of some typical chemical species along with meteorological parameters (hourly averages) during the CTT campaign. Temperature (T), relative humidity (RH), and concentrations of ozone and NOx were measured at 488 m. Concentrations of VOCs, ethanol, and CO2 were measured at 450 m.
2.3 Other measurements
During the CTT campaign, a CO2 and H2O gas analyzer (model Li-840A, Licor Inc., USA) was deployed to measure carbon dioxide (CO2, ppm in dry air) and humidity (mmol mol−1). In addition, four automatic air quality monitoring stations are located at ground level (∼5 m), 118, 168, and 488 m of the CTT, which report hourly concentrations of ozone, NO, NO2, NOx, and PM2.5 along with meteorological parameters, namely temperature (T), relative humidity (RH), and pressure (Mo et al., 2020). Mass concentrations of gaseous pollutants were reported at 25 ∘C and 1013.25 hPa and were converted to mixing ratios (ppb) accordingly. Contour plots of vertical profiles of NOx, ozone, Ox (O3 + NO2), and PM2.5 concentrations were made using the bilinear method in Igor software (v8.04). Linear interpolations for concentrations of these pollutants were performed on both spatial (altitude) and temporal scales. A ceilometer (CL31, Vaisala, Finland) deployed on the Panyu Campus of Jinan University (23.02∘ N, 113.41∘ E, Fig. S1), approximately 13.5 km to the southeast of the CTT, was used to measure planetary boundary layer height (PBLH) during the campaign. In addition, measurements of VOCs and CO2 made on the campus of Guangzhou Institute of Geochemistry (GIG), Chinese Academy of Sciences (23.15∘ N, 113.36∘ E, ∼25 m a.g.l. – above ground level) from September–November 2018 (C. Wang et al., 2020; Z. Wang et al., 2020; C. Wu et al., 2020) were used for comparison with those measured on the CTT. The p values were obtained using the Student t test to determine statistical significance levels of differences. The GIG site is located approximately 5.7 km to the northeast of the CTT. Measurements of VOCs and CO2 at the GIG site were made using the same instruments as those at the CTT site.
2.4 PMF receptor model
The PMF receptor model was used to quantitatively analyze sources of the VOC measurements made at the 450 m platform. The PMF model has been widely used to determine source contributions of measured VOC concentrations in previous studies (Yuan et al., 2012; Pallavi et al., 2019; Pernov et al., 2021). A simple description of the PMF model was provided in the Supplement.
The PMF model was performed on 225 VOC species (Table S1) in this study. In preparation of PMF input data, measured concentrations of a VOC species below the LOD were replaced with half of the LOD and corresponding uncertainties were assigned to five-sixths of the LOD. Missing samples of a VOC species were replaced with its median value during the campaign, and corresponding uncertainties were set as values equal to 3 times the median value (Zhang et al., 2013; Pernov et al., 2021; Qin et al., 2021). During the CTT campaign, the measured ethanol concentrations were impacted by the change in the number of visitors (a detailed discussion in Sect. 3.3) and exhibited strong variations (Fig. 1). Thus, measurement uncertainties of ethanol calculated by Eq. (S3) were reduced by a factor of 5 to increase its weight in PMF analysis, which successfully resolved factors representing visitor influences and reduced residuals of PMF solution from over 20 % to ∼14 %. The PMF analysis was performed using the PMF Evaluation Tool (v3.05) with Igor Pro (Ulbrich et al., 2009).
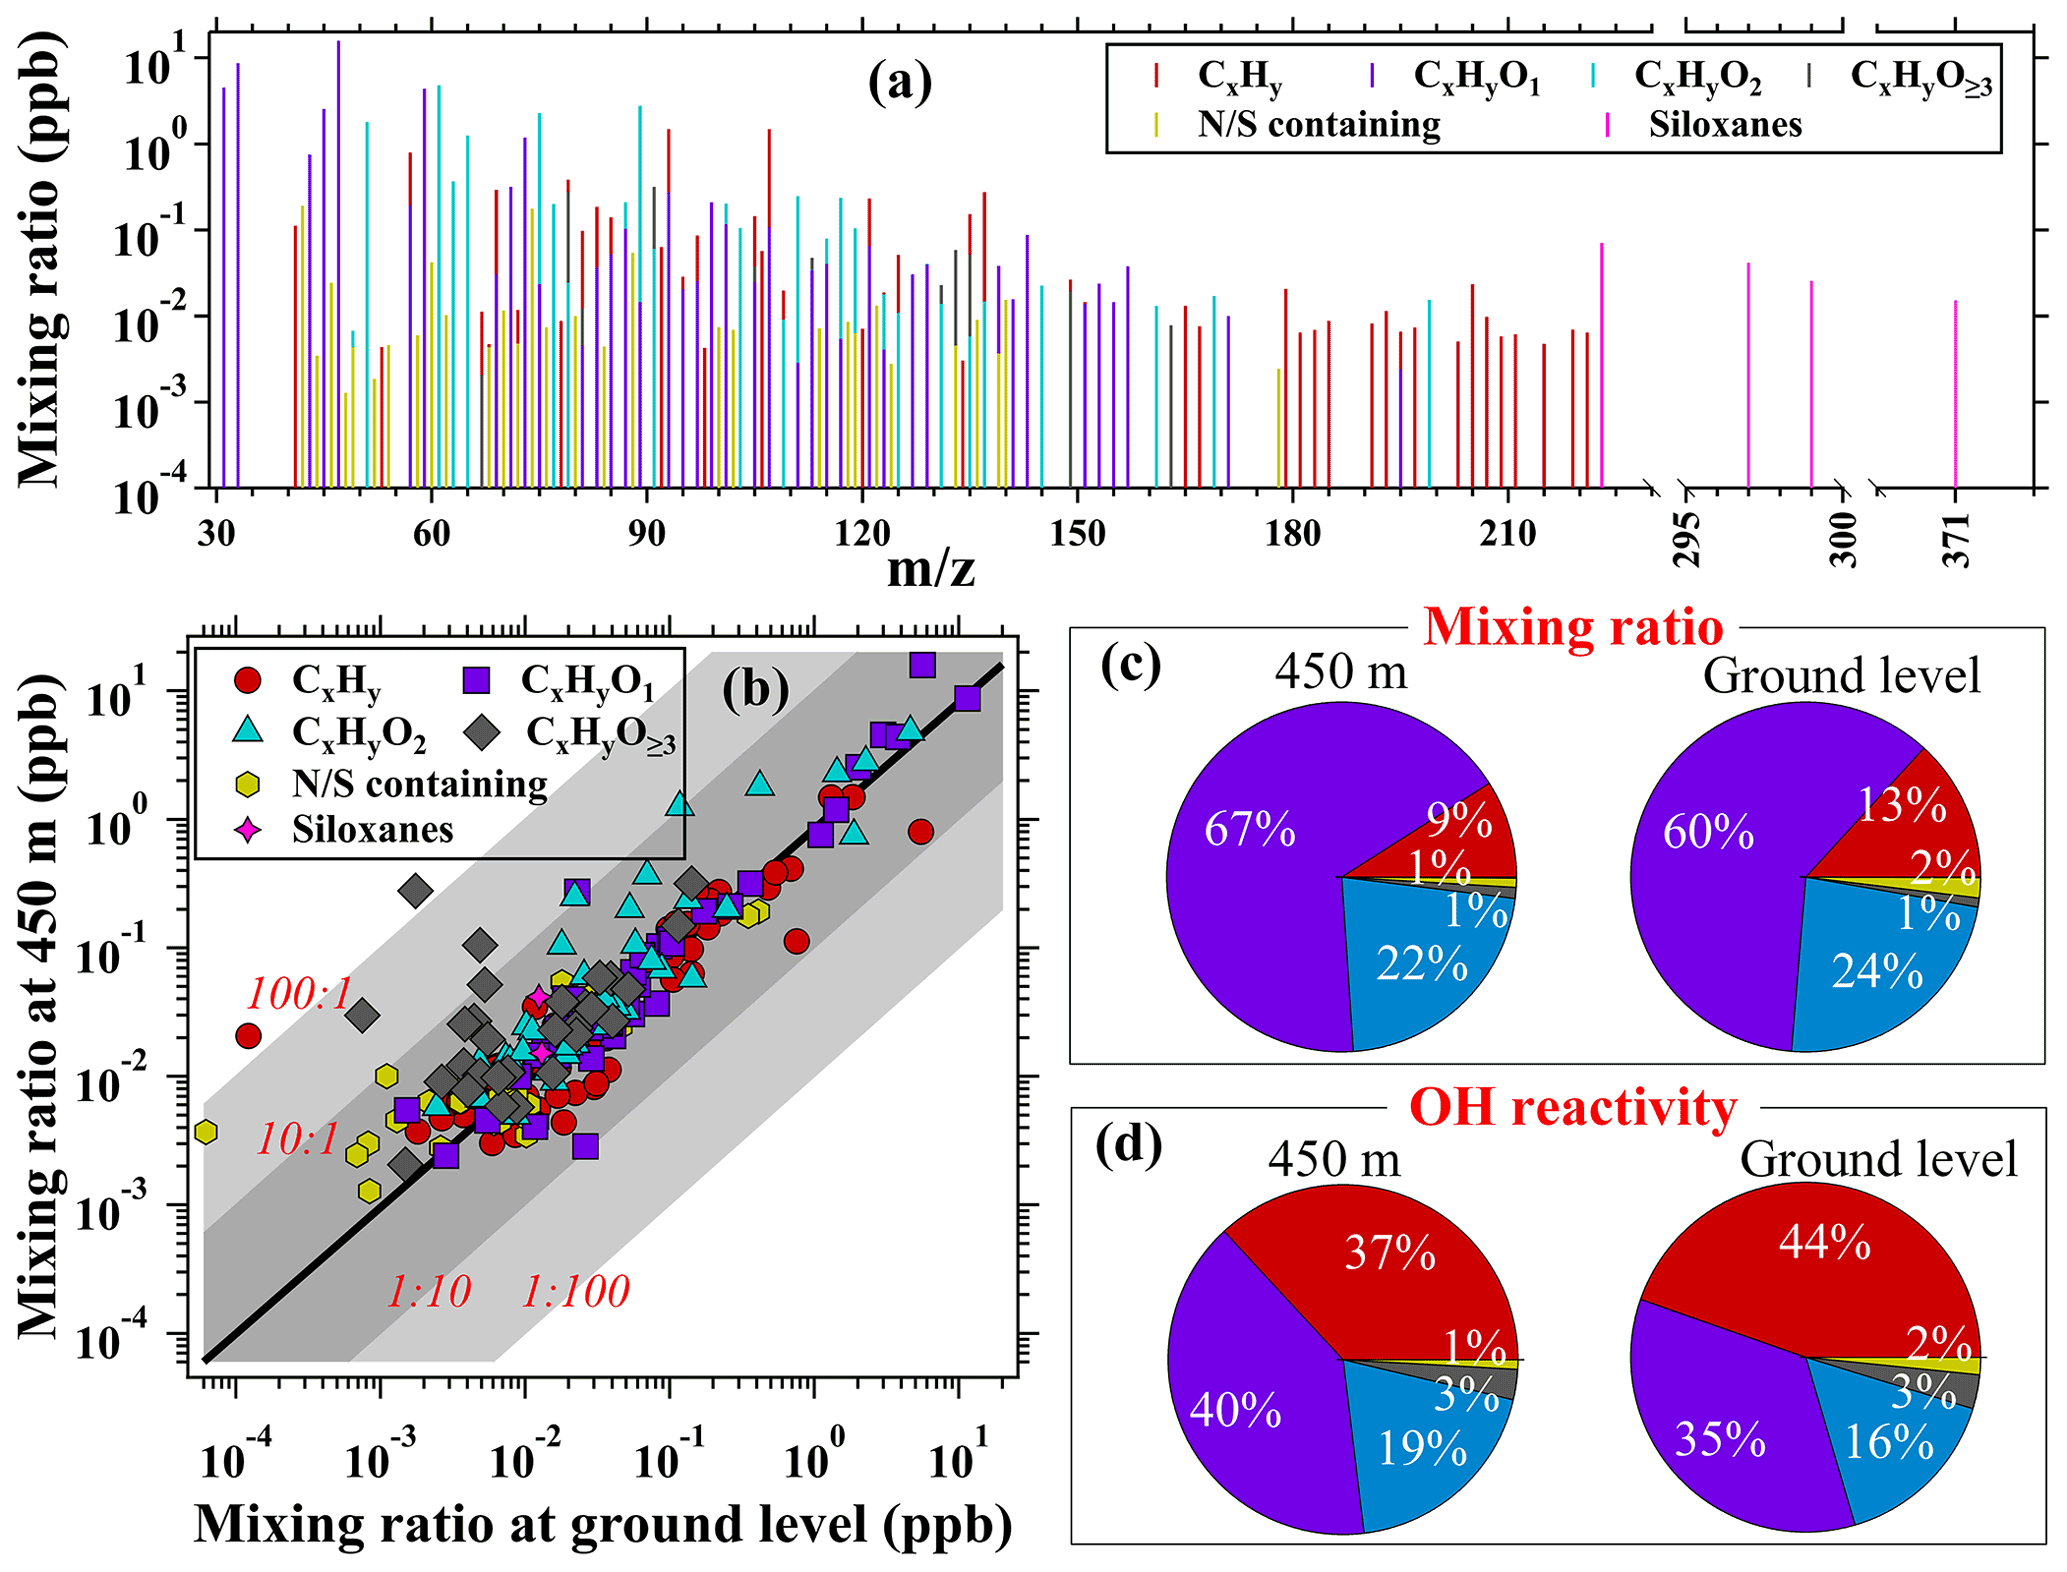
Figure 2(a) Average mass spectra of VOCs (including 225 species) obtained by PTR-ToF-MS measured at 450 m during the CTT campaign. (b) Scatter plots of the average VOC mixing ratios measured at 450 m during the CTT campaign versus those measured at ground level during the GIG campaign; the black solid line indicates the ratio of 1:1; the dark grey shaded areas indicate the ratios of 10:1 and 1:10; the light grey shaded areas indicate the ratios of 100:1 and 1:100. (c, d) Average contribution percentages of the six VOC categories to their total concentrations and OH reactivities at 450 m and the ground level, respectively. Only the VOC species that have known reaction rate constants with the OH radical (Table S1) were used for calculation.
3.1 Overview of field measurements during the campaign
As shown in Fig. 1, concentrations of various species and meteorological parameters all exhibited strong variations during the campaign. Daily mean ozone mixing ratios varied in the range of 17.8–105.0 ppb with an average (± SD – standard deviation) of 55.1±18.3 ppb. Daily mean total VOC (TVOC) mixing ratios, including a total of 225 species, varied between 23.9–124.2 ppb with an average of 62.1±21.8 ppb. Daily mean NOx mixing ratios varied in the range of 7.9–31.6 ppb with an average of 13.6±3.8 ppb. Measured CO2 mixing ratios exhibited strong variability, with daily mean values ranging from 403.5 to 471.4 ppm. Ethanol was the most abundant VOC species, accounting on average for 23.5 % of measured TVOC mixing ratios. Daily mean ethanol mixing ratios varied between 4.3–53.4 ppb with an average of 15.3±9.1 ppb. Toluene was the most abundant aromatic species and had an average mixing ratio of 1.4±0.9 ppb. Daily mean temperatures varied in the range of 17.7–29.0 ∘C with an average of 23.2±3.0 ∘C. Daily mean RH varied between 39.3 %–85.0 % with an average of 71.6 % ± 10.3 %. In general, the observation site was predominantly influenced by hot and moist air masses from 18 August to 4 October but cooler and drier air masses from 5 October to 5 November.
The 10 most abundant VOC species measured by PTR-ToF-MS during the CTT campaign were ethanol, methanol, acetic acid, formaldehyde, acetone, ethyl acetate, acetaldehyde, hydroxyacetone and propionic acid, toluene, and C8 aromatics, contributing to over 70 % of TVOC mixing ratios. As shown in Fig. 2, the 225 VOC species were classified into six categories, namely CxHy (i.e., hydrocarbons), CxHyO1 (i.e., VOC species containing one oxygen atom), CxHyO2 (i.e., VOC species containing two oxygen atoms), CxHyO≥3 (i.e., VOC species containing three or more oxygen atoms), N/S-containing species (i.e., VOC species containing nitrogen or sulfur atoms), and siloxanes (C. Wu et al., 2020; He et al., 2022). The most abundant category was CxHyO1, which had an average contribution of 67 % to TVOC mixing ratios, but only contributed to 40 % of total OH reactivity. The CxHyO2 and CxHyO≥3 categories contributed to 22 % and 1 % of TVOC mixing ratios, respectively. CxHy only accounted for 9 % of TVOC mixing ratios but contributed to 37 % of the total OH reactivity, indicating more reactive VOC species in this category. Concentrations of N/S-containing species and siloxanes were generally lower than 0.5 ppb and totally contributed to ∼1 % of TVOC mixing ratios.
At ground level, each VOC category accounted for comparable fractions in TVOC mixing ratios and the total OH reactivity to those measured at 450 m. However, the majority of the CxHy, CxHyO≥3, and N/S-containing species measured at 450 m had lower mixing ratios than those measured at ground level (Figs. 2b and S2), implying their predominant contributions from surface emission sources. Most of the CxHyO1 and CxHyO2 species measured at 450 m had comparable mixing ratios to those measured at the ground level. However, mixing ratios of some CxHyO2, CxHyO≥3, and N/S-containing species measured at 450 m were higher than those measured at ground level, which can be attributed to either enhancement of their emissions on the 450 m platform or more secondary formation from oxidation of VOCs (e.g., CxHy and CxHyO1 species). The differences in contributions of VOC categories to the total concentrations and OH reactivity imply that sources of the VOC measurements made at 450 m and the ground level are different.
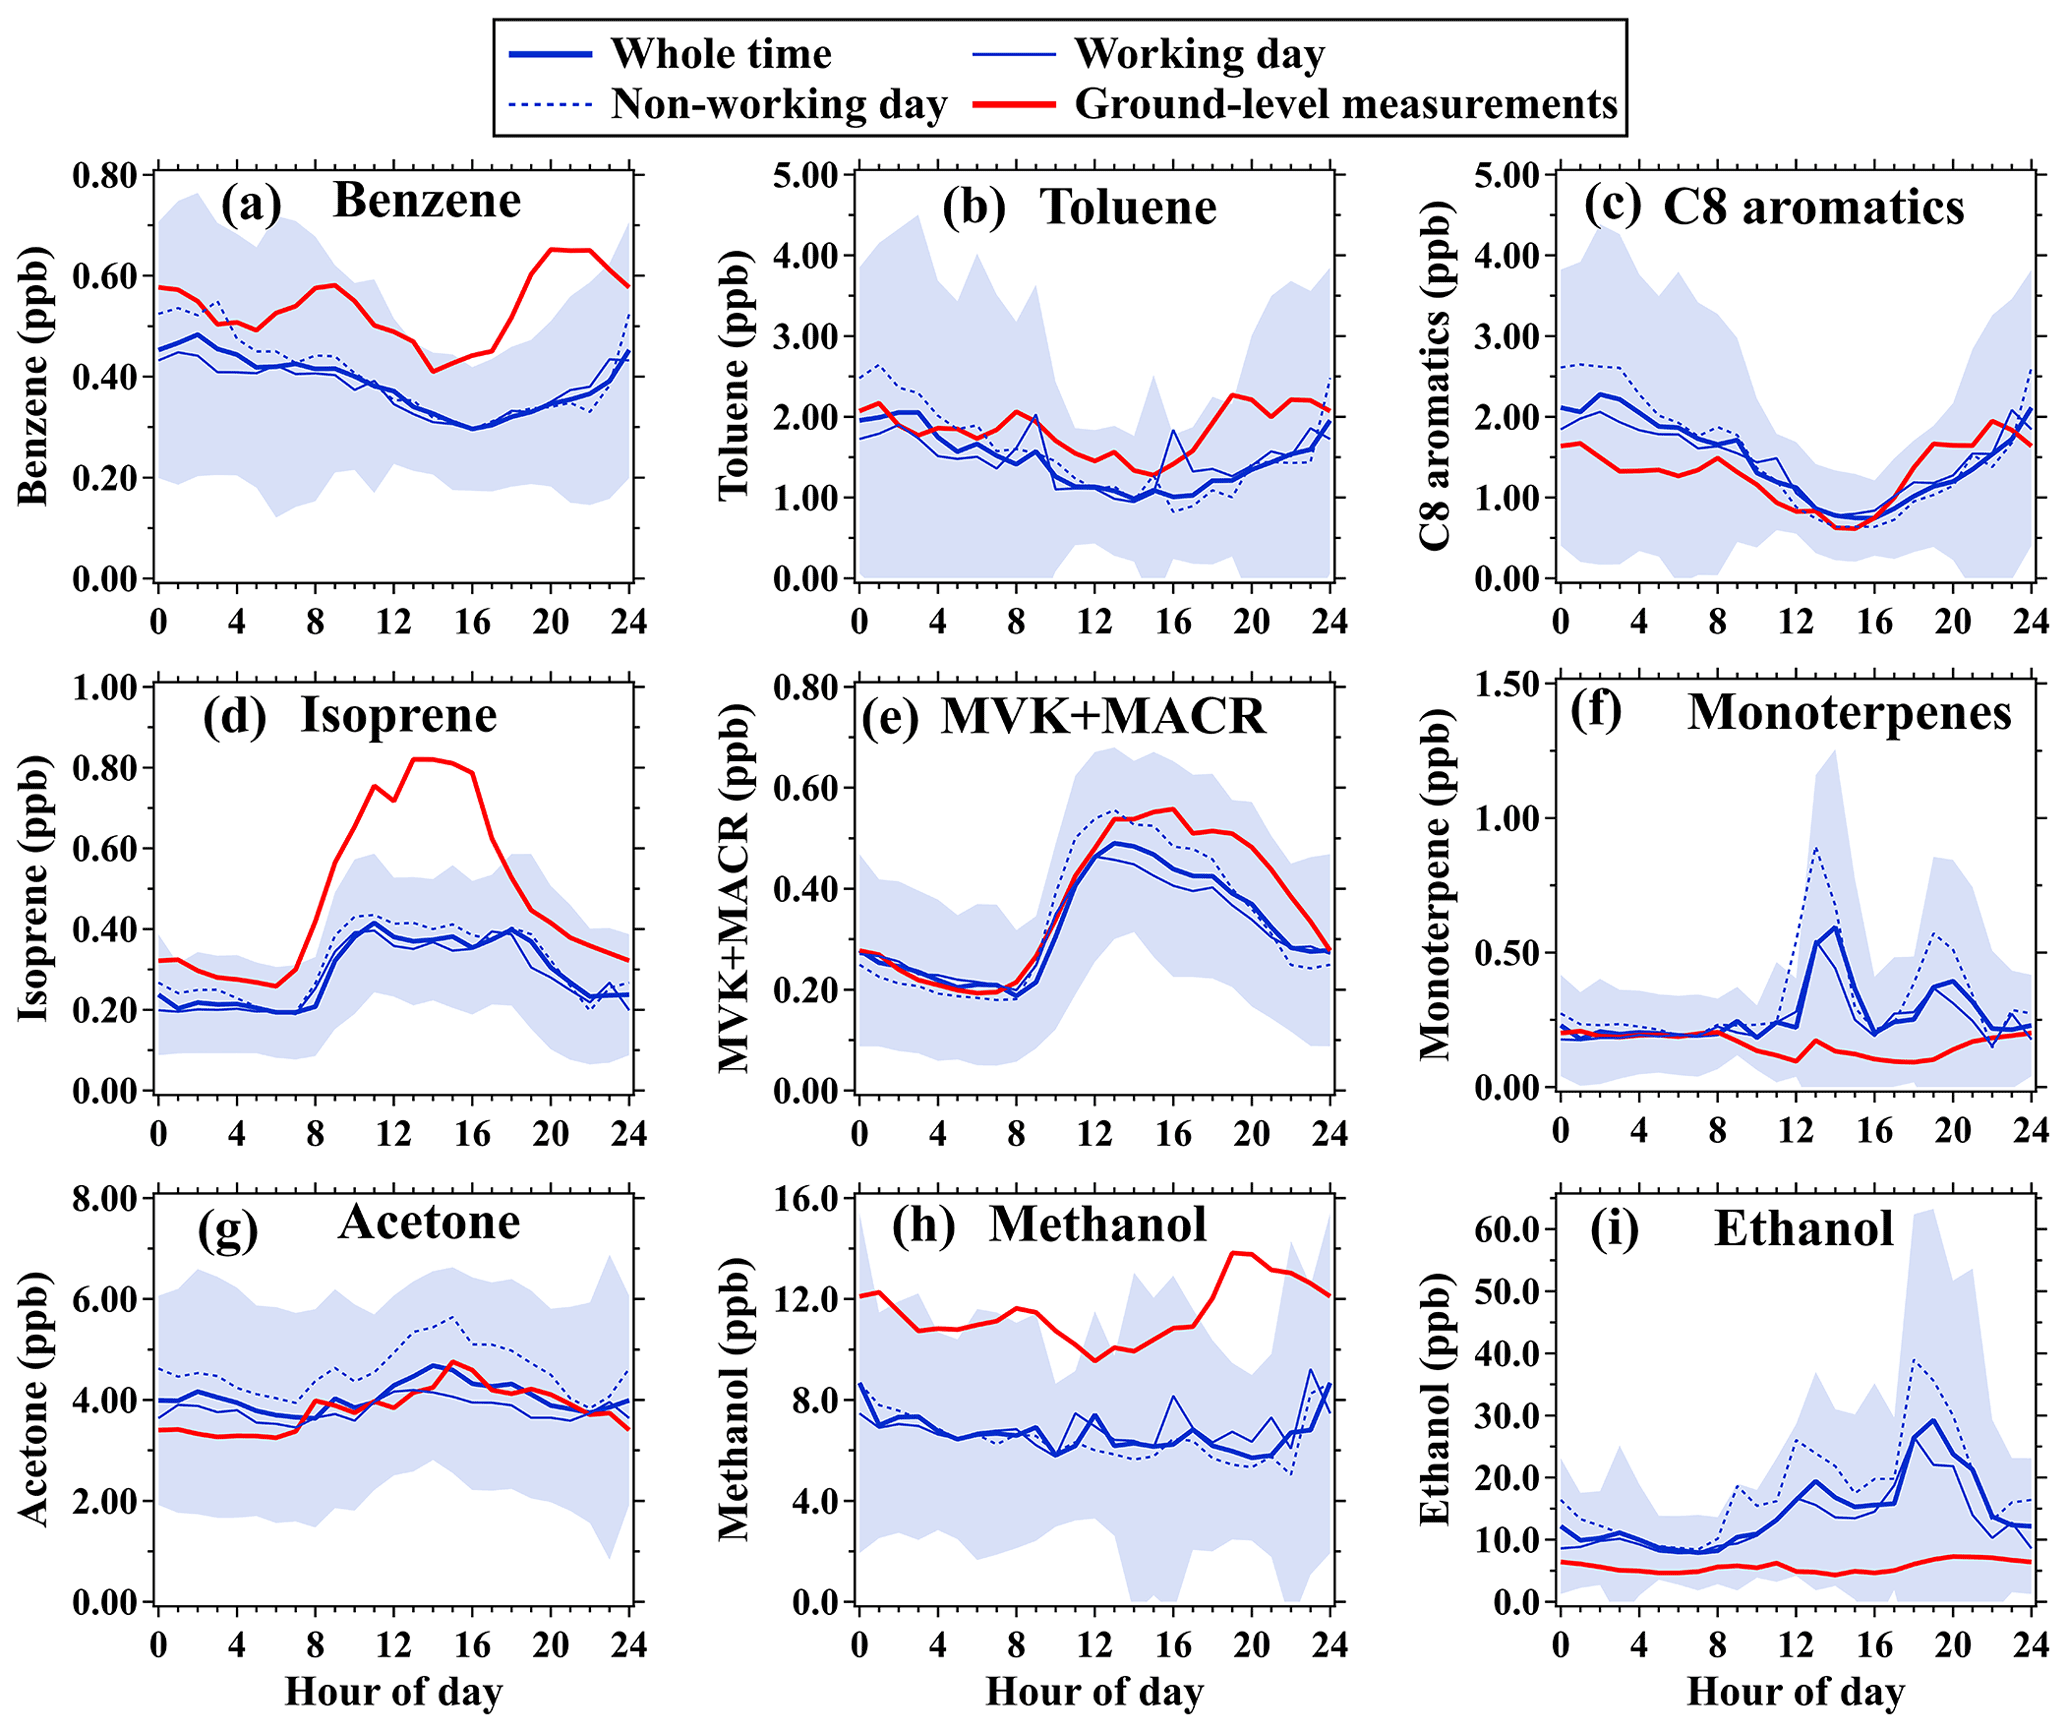
Figure 3Diurnal variations in mixing ratios of selected VOC species measured by PTR-ToF-MS. Thick blue solid lines and shaded areas represent averages and standard deviations, respectively, during the CTT campaign (18 August–5 November 2020). Red solid lines represent averages during the GIG campaign (11 September–19 November 2018). Thin blue solid and dashed lines represent averages in working days and non-working days (including weekends and public holidays), respectively, during the CTT campaign.
3.2 Diurnal variations in selected VOC species
Average diurnal profiles of nine selected VOC species measured by PTR-ToF-MS during the CTT campaign are shown in Fig. 3. Measurement results at GIG in 2018 are also shown for comparison to investigate differences in their diurnal variation patterns and likely sources. In addition, average diurnal profiles of the selected VOC species on working and non-working days (including weekends and public holidays when the 450 m platform had more visitors) during the CTT campaign are compared to explore potential emissions from visitors. Average diurnal variations in ratios of concentrations of selected VOC species measured on non-working days to those measured on working days were also calculated, as shown in Fig. S3. Meteorological factors, namely temperature and RH, exhibited insignificant differences between working and non-working days (Fig. S4). Thus, the differences in VOC concentrations between working and non-working days were not notably impacted by the change in meteorological conditions.
Diurnal profiles of aromatic species, including benzene, toluene, and C8 aromatics measured at 450 m exhibited similar variability, with minima occurring between 12:00–16:00 LT. Aromatics with higher chemical reactivity could be removed more rapidly by reactions with hydroxyl radicals (OH) in the daytime (Yuan et al., 2012; C. Wu et al., 2020). In addition, rapid elevation of the daytime PBL could enhance the dilution of chemical species, leading to rapid decreases in their concentrations (Sangiorgi et al., 2011; Zhang et al., 2018). The two effects are the two most important factors for controlling diurnal profiles of aromatics measured at 450 m. By contrast, diurnal profiles of aromatics measured at ground level displayed a different pattern, with two peaks occurring in the morning (07:00–08:00 LT) and evening (19:00–22:00 LT). Diurnal patterns of aromatics are consistent with those of NOx (a typical tracer of traffic emissions in urban regions) at ground level but were different from those of NOx at 450 m (Fig. 4). Therefore, measured concentrations of aromatics, particularly for benzene, were markedly affected by traffic emissions at ground level, but were contributed by more complex sources at 450 m. The differences in diurnal profiles of aromatics between working and non-working days were insignificant (p>0.05), implying minor contributions from visitor-related emissions. On working days, toluene concentrations measured at 450 m were more affected by traffic emissions as manifested by the two remarkable peaks in the morning and late afternoon.
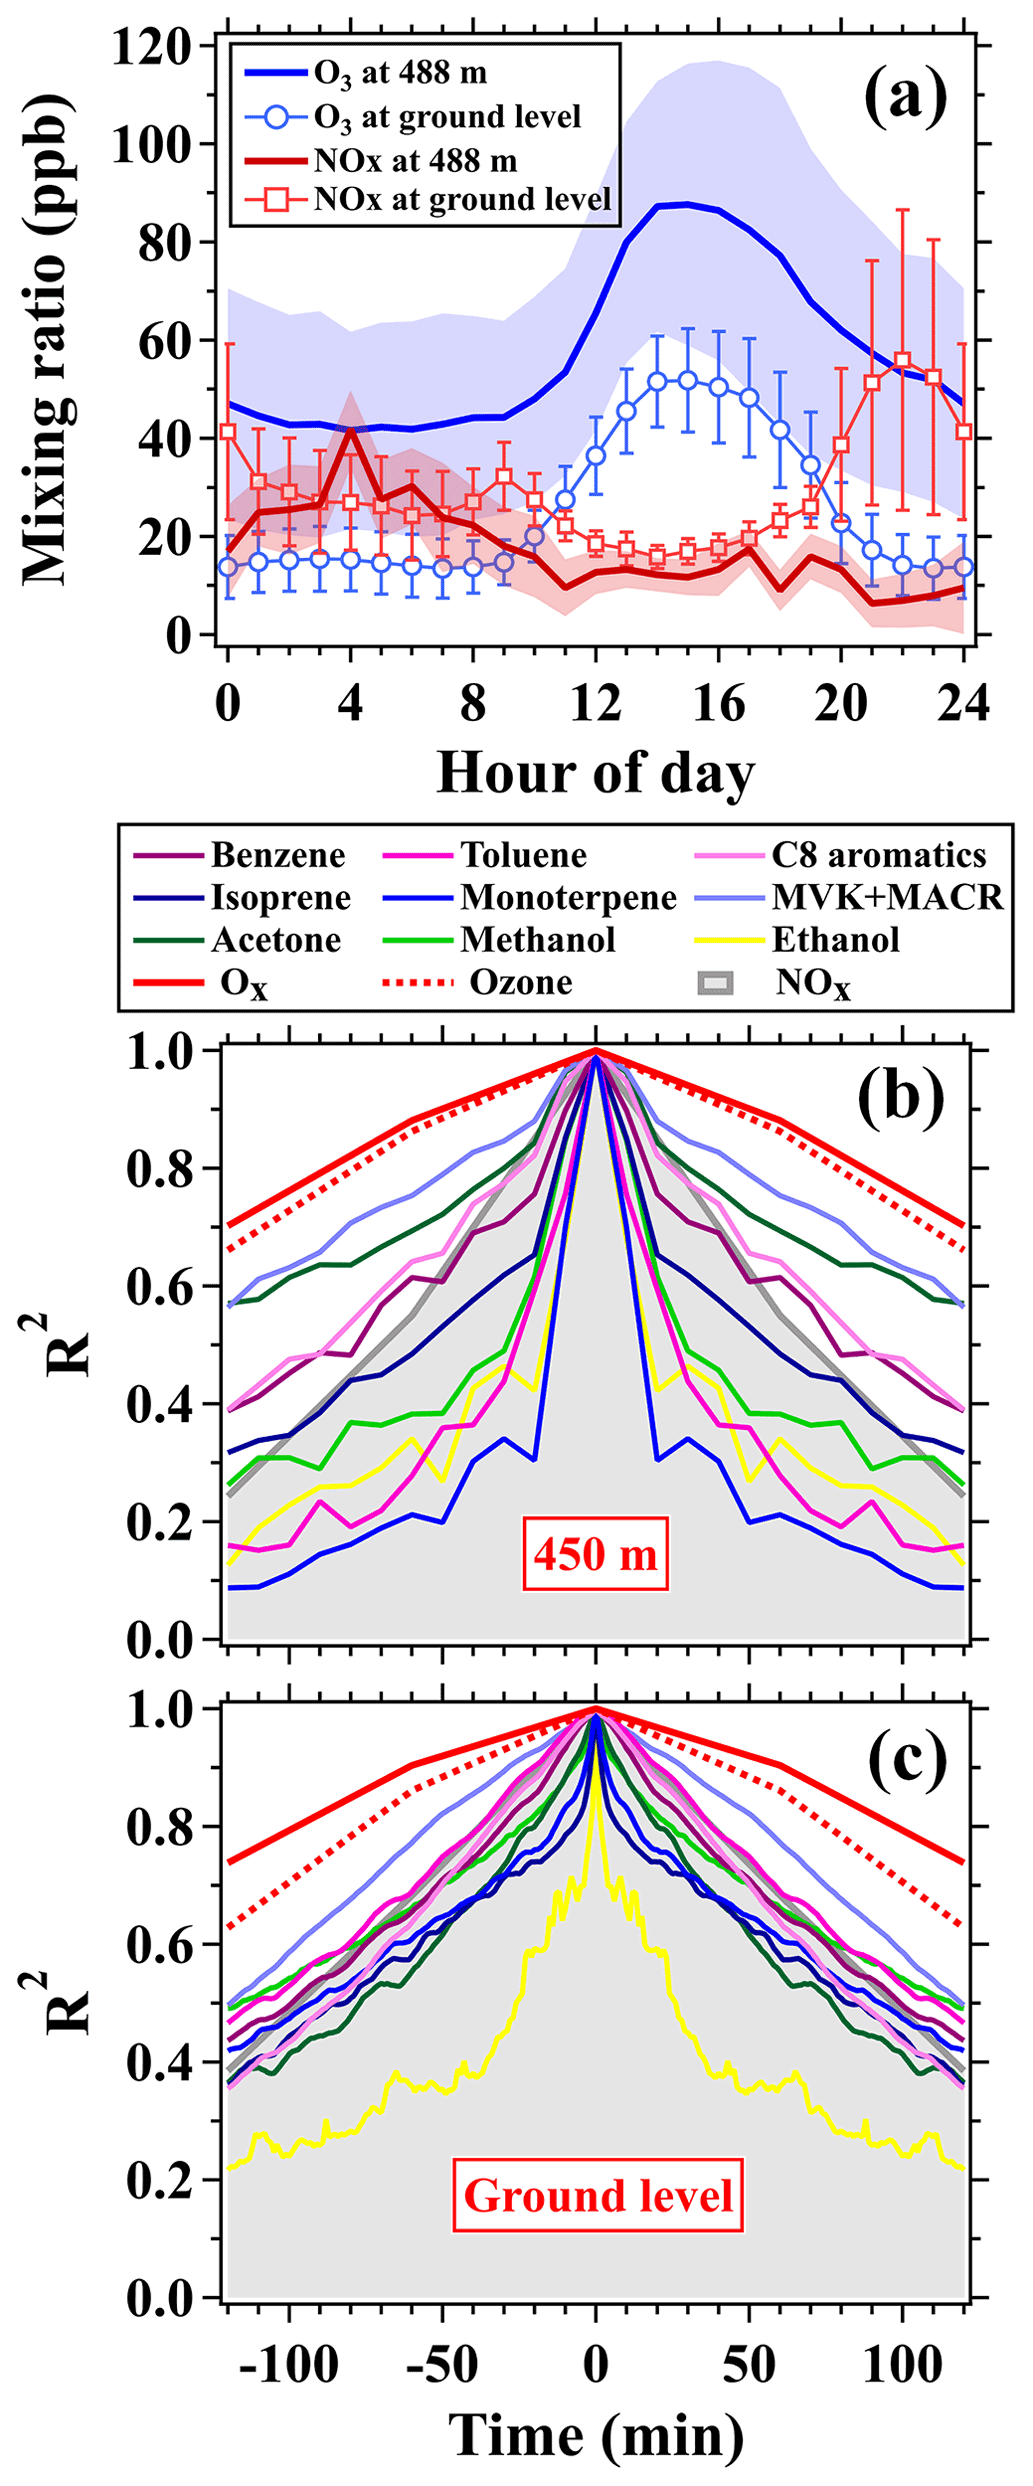
Figure 4(a) Diurnal profiles of ozone and NOx mixing ratios measured at the 488 m site (mean ± SD – standard deviation) and the surface site (mean ± 0.5 SD) on the CTT. (b) Autocorrelation of the time series of ozone (488 m), NOx (488 m), Ox (488 m), and selected VOC species (450 m) during the CTT campaign. (c) Autocorrelation of the time series of the selected VOC species at ground level during the GIG campaign. Autocorrelation of the time series of ozone, NOx, and Ox in panel (c) is calculated using the measurements made at the surface site of Canton Tower during the CTT campaign.
Isoprene and monoterpenes exhibited distinct diurnal variation patterns during the two campaigns. As reported in Gómez et al. (2020) and Tan et al. (2021), diurnal profiles of isoprene and monoterpene concentrations in non-urban regions usually displayed unimodal patterns with a peak occurring at noon due to the strong light and temperature dependence of biogenic emissions. In this study, isoprene concentrations at 450 m plateaued during the daytime and were slightly higher on non-working days than on working days, implying large contributions from visitor-related emissions. The diurnal profile of monoterpenes measured at 450 m exhibited a bimodal pattern with two peaks at 14:00 and 20:00 LT, which was roughly in accordance with diurnal peaks of visitor numbers on the 450 m platform. In addition, monoterpene concentrations at 450 m were significantly (p<0.01) higher on non-working days (particularly during the busiest tourist hours) than on working days, confirming significant contributions from visitor-related or cooking emissions (Klein et al., 2016). The diurnal profiles of methyl vinyl ketone (MVK) and methacrolein (MACR) demonstrated similar shapes to ozone at both 450 m and ground level, with maxima occurring between 13:00–15:00 LT (Fig. 4), consistent with MVK and MACR as photooxidation products of isoprene (Greenberg et al., 1999; Zhao et al., 2021). The concentrations of MVK and MACR during the daytime on non-working days were also significantly (p<0.01) higher than those on working days, which is consistent with isoprene observations.
Acetone, methanol, and ethanol are abundant OVOC species in the urban atmosphere. Diurnal profiles of acetone measured at both 450 m and the ground level were characterized by higher concentrations in the daytime, suggesting predominant contributions from daytime sources, such as vegetation emissions and photooxidation of hydrocarbons (Hu et al., 2013; Gkatzelis et al., 2021). In addition, acetone concentrations at 450 m were higher on non-working days than on working days, implying prominent contributions from visitor-related emissions. Diurnal profiles of methanol and ethanol measured at ground level were characterized by a bimodal pattern, with two peaks occurring in the morning (08:00 LT) and evening (20:00 LT), confirming strong contributions from traffic emissions. However, methanol concentrations measured at 450 m exhibited weak diurnal variability and lower concentrations on non-working days, indicating that they were less affected by visitor-related emissions. The diurnal profile of ethanol at 450 m displayed two peaks at 13:00 and 19:00 LT, which was in accordance with the two busiest tourist hours of the 450 m platform. In addition, ethanol concentrations at 450 m on non-working days were significantly (p<0.01) higher than those on working days, particularly in the opening hours of the 450 m platform. These results suggest that the ethanol concentrations measured at 450 m were largely contributed by visitor-related emissions.
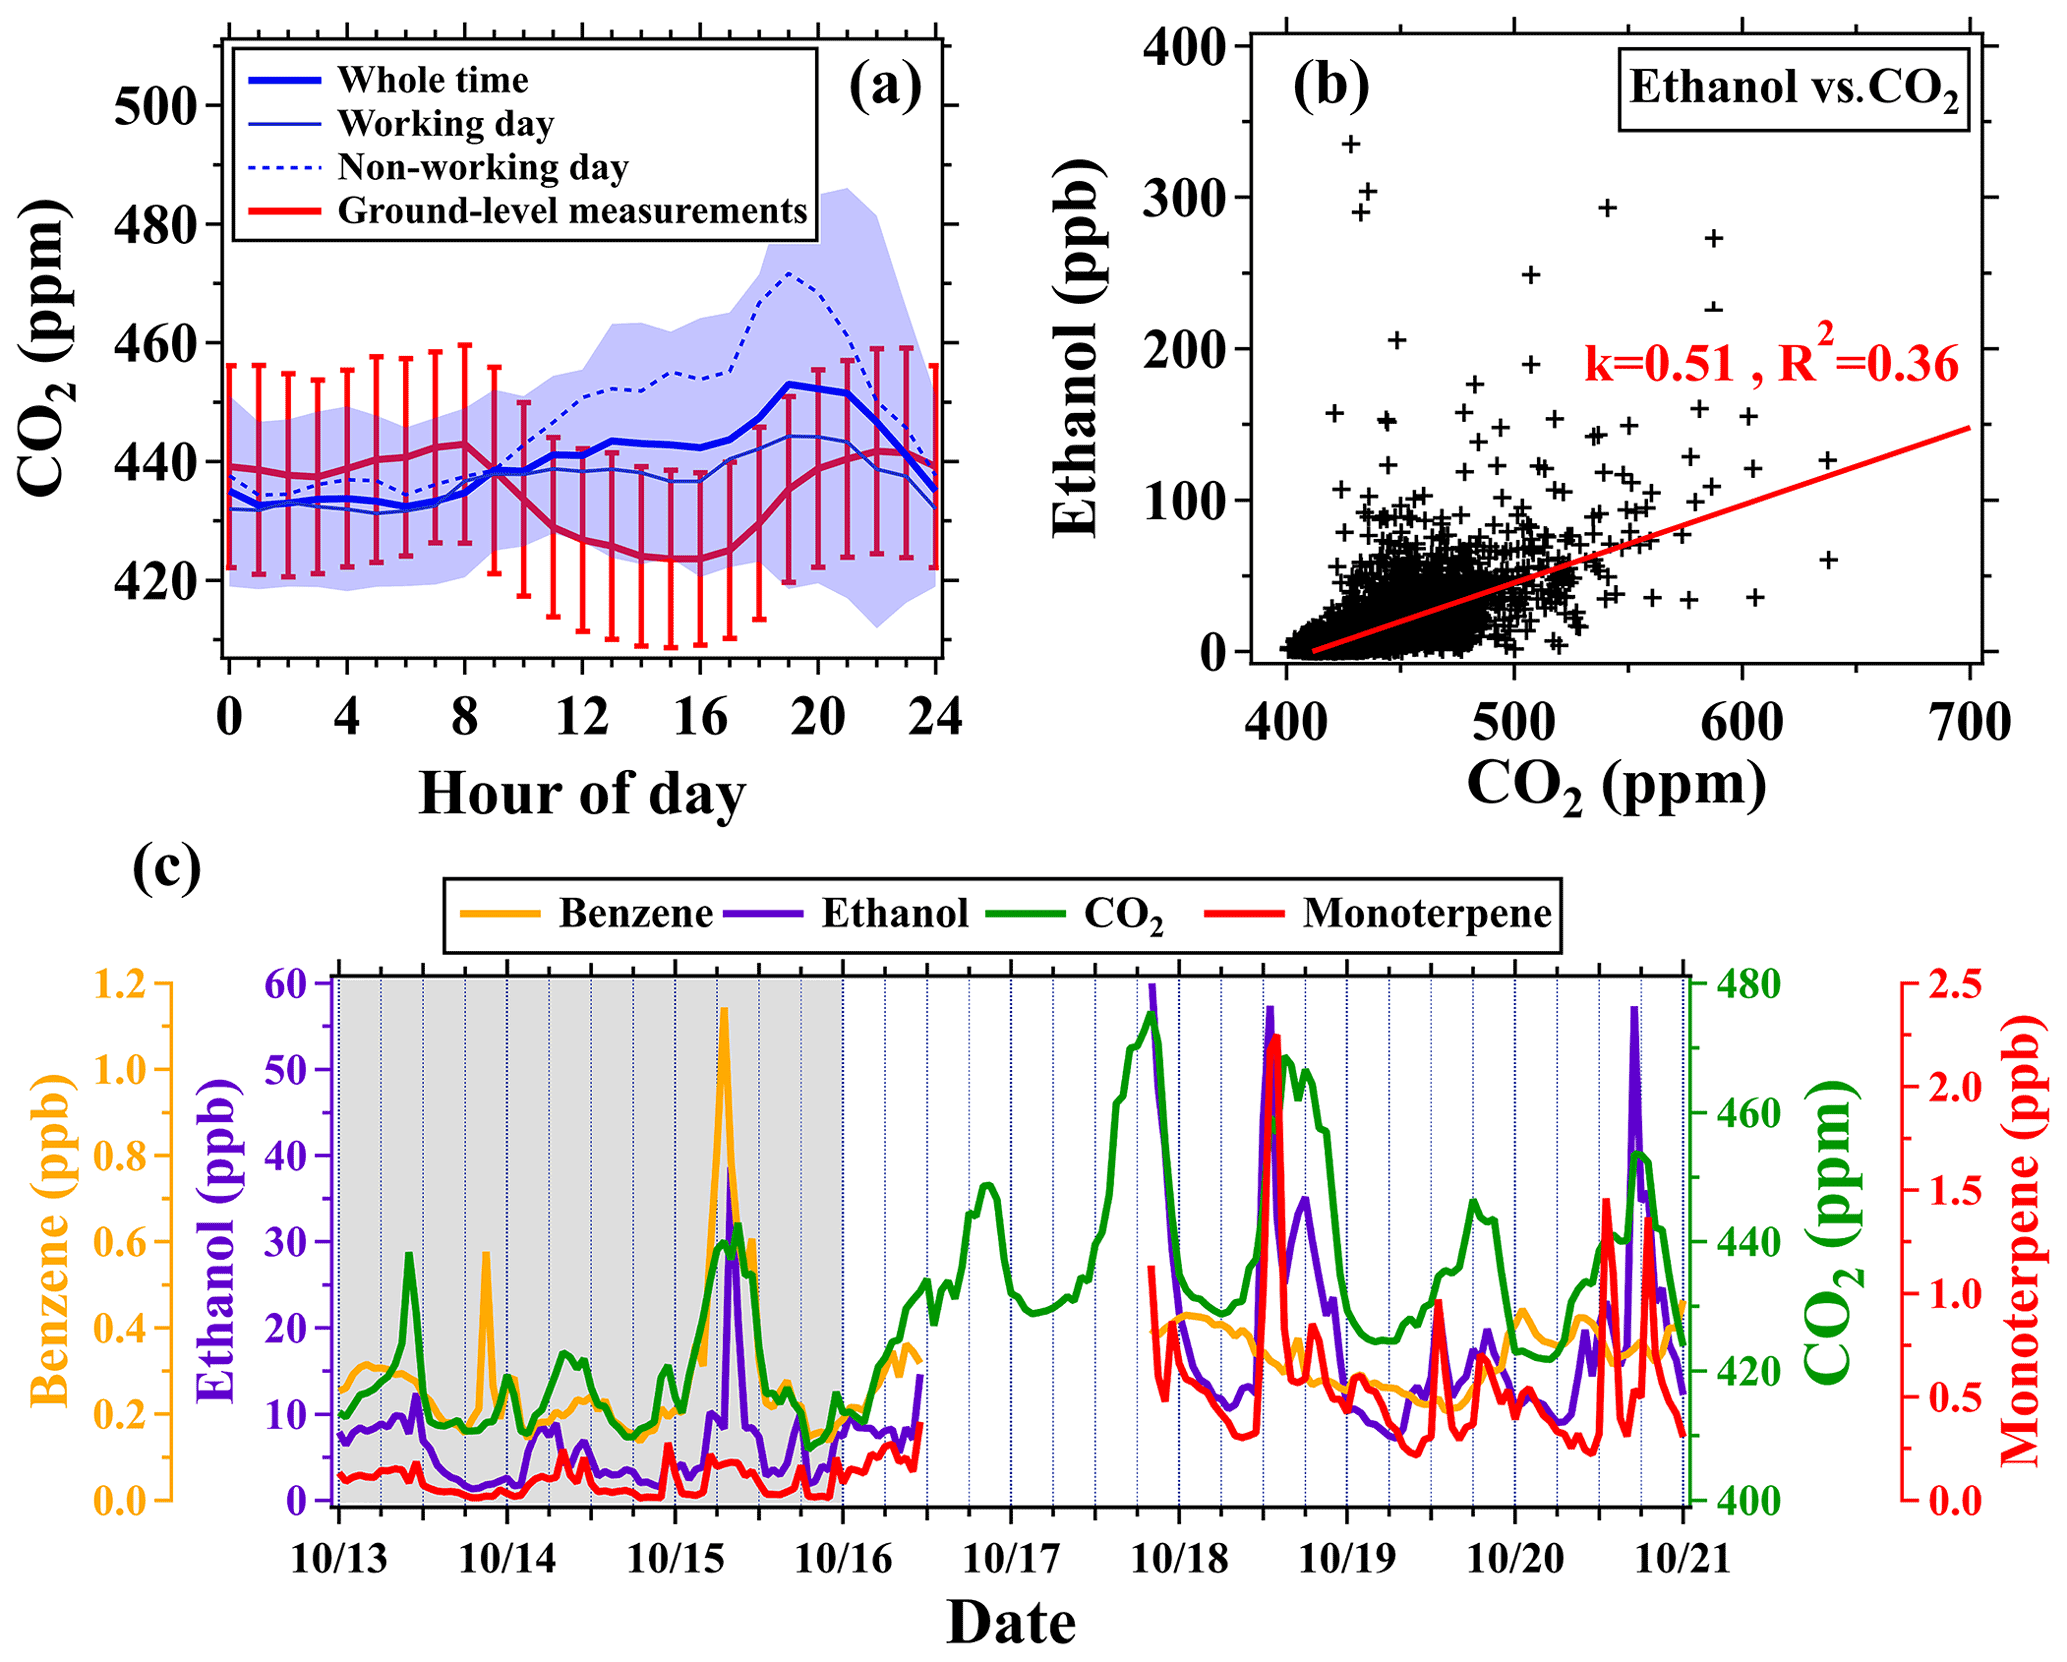
Figure 5(a) Diurnal variations in CO2 mixing ratios at 450 m and the ground level, respectively. (b) Scatterplots of 10 min mean mixing ratios of ethanol versus CO2 measured at 450 m during the CTT campaign. (c) Time series of benzene, ethanol, CO2, and monoterpene mixing ratios measured at 450 m from 13 to 21 October; the grey shaded area indicates the period (13–21 October) when the 450 m platform was closed due to the influence of Typhoon Kompasu.
To further explore spatial scales of emission source regions for different VOC species, autocorrelation profiles of their time series were calculated by offsetting time from −120 to 120 min. As indicated in previous studies (Hayes et al., 2013; Hu et al., 2016), concentrations of a species that is more affected by local sources would have a narrower autocorrelation profile. As shown in Fig. 4, peak widths of autocorrelation profiles for different species at 450 m strongly varied. Autocorrelation profiles of monoterpenes, toluene, ethanol, methanol, and isoprene were relatively narrower (even narrower than the autocorrelation profile of NOx), and thus sources of these species had more local characteristics. Autocorrelation profiles of benzene, C8 aromatics, acetone, and MVK–MACR were much flatter (but narrower than the autocorrelation profile of ozone and Ox), indicating that concentrations of these species were more contributed by sources at larger spatial scales. By contrast, peak widths of the autocorrelation profiles for different species (except for ethanol) were comparable to those of NOx. Therefore, concentrations of the selected VOC species were notably contributed by local traffic emissions at ground level but contributed by more complex sources on larger spatial scales at 450 m.
3.3 Impacts of visitor-related emissions on VOC measurements
As introduced in Sect. 2.1, the CTT campaign was conducted in August–November 2020, during which visitors were required to wear masks when visiting the CTT, and ethanol-containing products were widely used to prevent the spread of the COVID-19 pandemic. For example, medicinal alcohol (75 %) spray was widely used to wipe public utilities and 75 % ethanol bacteriostatic gel was extensively used as sanitizer for hands. The total usage of ethanol-containing products was closely associated with the number of visitors. This can be manifested by the diurnal profiles of some VOC species (e.g., ethanol) that exhibited similar variation patterns to those of the number of visitors at the 450 m platform, as shown in Fig. 3. In addition, the restaurants are located ∼30 m below the observation site and emission intensities of VOCs (e.g., monoterpenes) from cooking-related sources were also closely associated with the number of visitors. Therefore, the VOC measurements were inevitably affected by visitor-related emissions, such as human breath, cooking, and volatilization of ethanol-containing and personal care products (Veres et al., 2013).
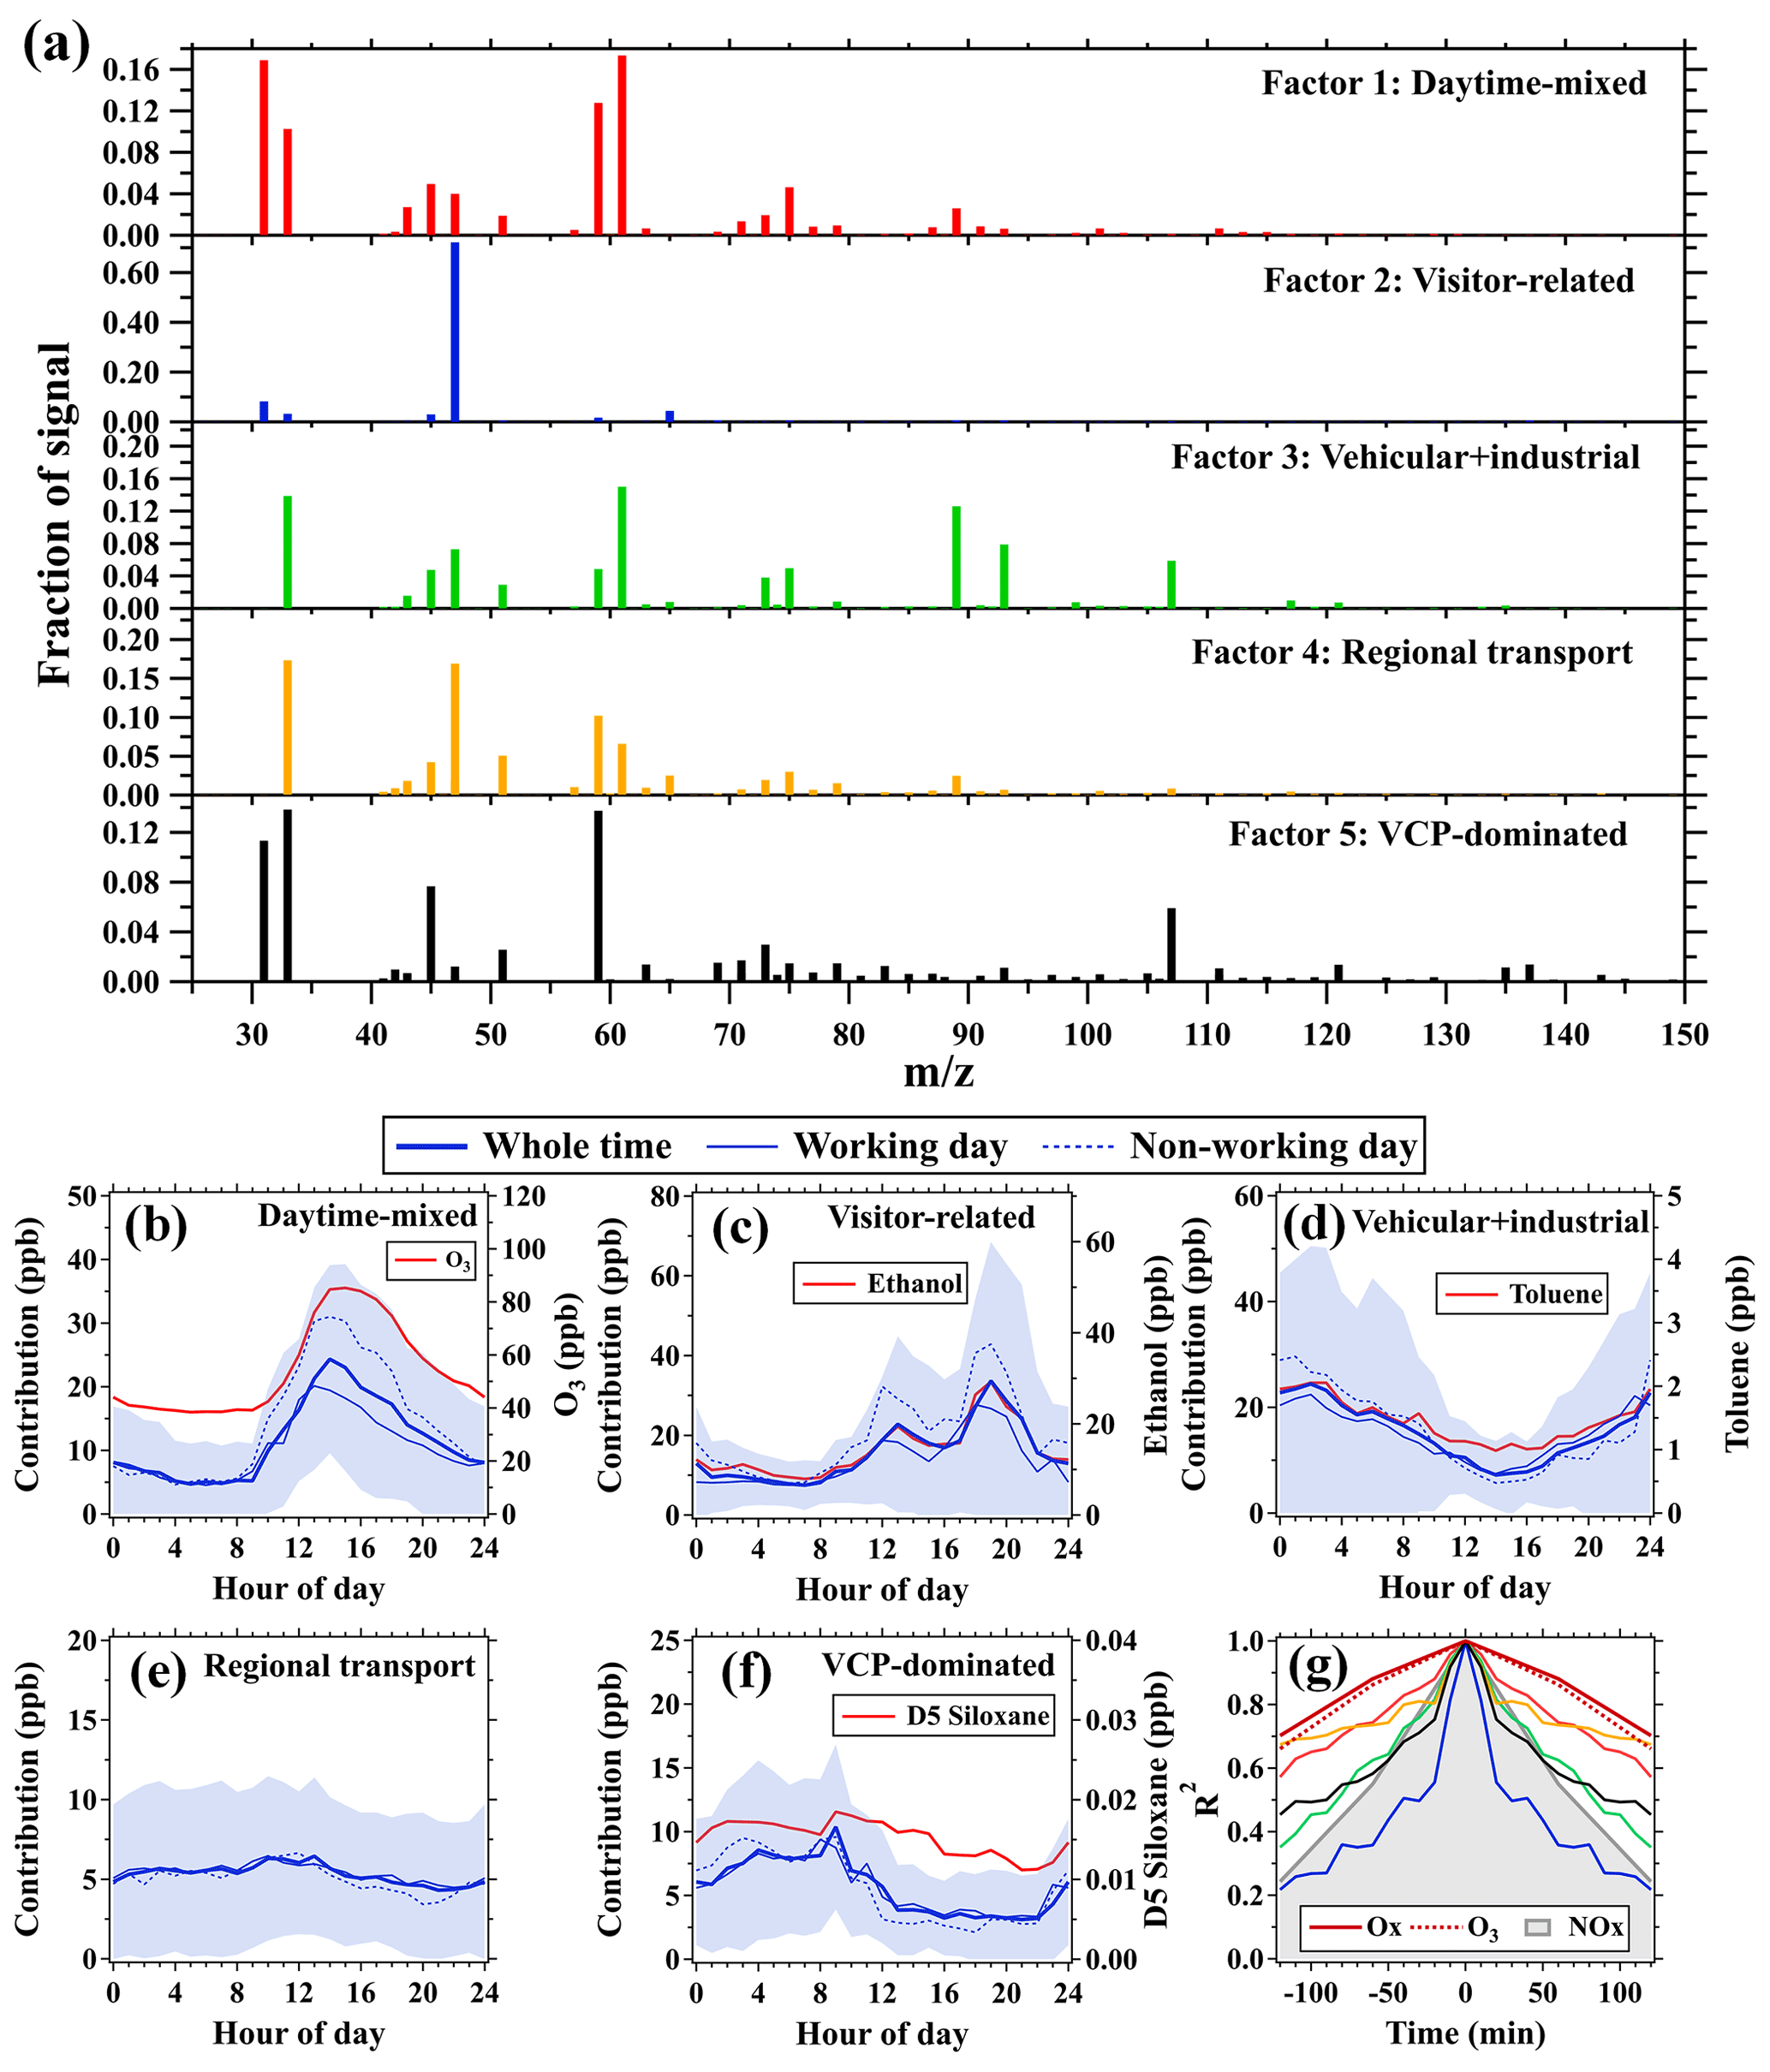
Figure 6(a) Factor profiles () of the five PMF factors; factor profiles with a full range of the mass spectra are provided in Fig. S7. (b–f) Average diurnal profiles of the five PMF factors and source tracers. (g) Autocorrelation of the time series of the five PMF factors along with Ox, ozone, and NOx mixing ratios at 488 m; colors of lines are consistent with the five factors in panel (a).
As shown in Fig. 5a, the diurnal profile of CO2 measured at 450 m increased between 09:00–20:00 LT, which was different from those measured at ground level. The higher CO2 mixing ratios at 450 m were predominantly contributed by human breath due to the absence of combustion sources. Measured ethanol mixing ratios were well correlated with those of CO2 (R2=0.36, p<0.01) during the CTT campaign (Fig. 5b), indicating that ethanol concentrations, as well as its variations, were predominantly determined by the change in the number of visitors on the tower. In addition, the CO2 mixing ratios on non-working days, especially during the busiest tourist hours, were significantly (p<0.01) higher than those on working days. The 450 m platform was closed during 13–15 October as the result of the influence of Typhoon Kompasu. On these days, mixing ratios of ethanol, CO2, and monoterpenes exhibited similar variation patterns to benzene (a typical tracer of traffic emissions), as shown in Fig. 5c. However, mixing ratios of ethanol, CO2, and monoterpenes exhibited quite different variation patterns from benzene when the 450 m platform was re-opened (16–21 October). For instance, mixing ratios of ethanol, CO2, and monoterpenes generally decreased from 12:00 to 18:00 LT between 13–15 October, but markedly increased during the same period between 16–21 October. Therefore, it can be concluded that the VOC measurements made at 450 m were significantly affected by visitor-related emissions, which will be quantitatively assessed using the PMF analysis in the following sections.

Figure 7(a, b) Stacked time series of factor fractions and factor contributions for the PMF analysis. (c–e) Average contribution percentages of the five PMF factors to (c–e) the total VOC concentrations in the whole period, working days, and non-working days and (f) the total OH reactivities during the CTT campaign. In panel (d), only the VOC species that have known reaction rate constants with OH radicals (Table S1) were used.
3.4 Source analysis of VOC measurements
In this study, a five-factor solution for the PMF analysis was chosen as the optimal result. Figure 6 displays source profiles (; the full range of the mass spectra is shown in Fig. S7) of the five PMF factors along with average diurnal profiles of their contributions. The five factors were assigned to likely sources of daytime mixed, visitor-related, vehicular–industrial, regional transport, and volatile chemical product (VCP) according to characteristics of their source profiles and temporal variations, which are discussed in detail in the Supplement.
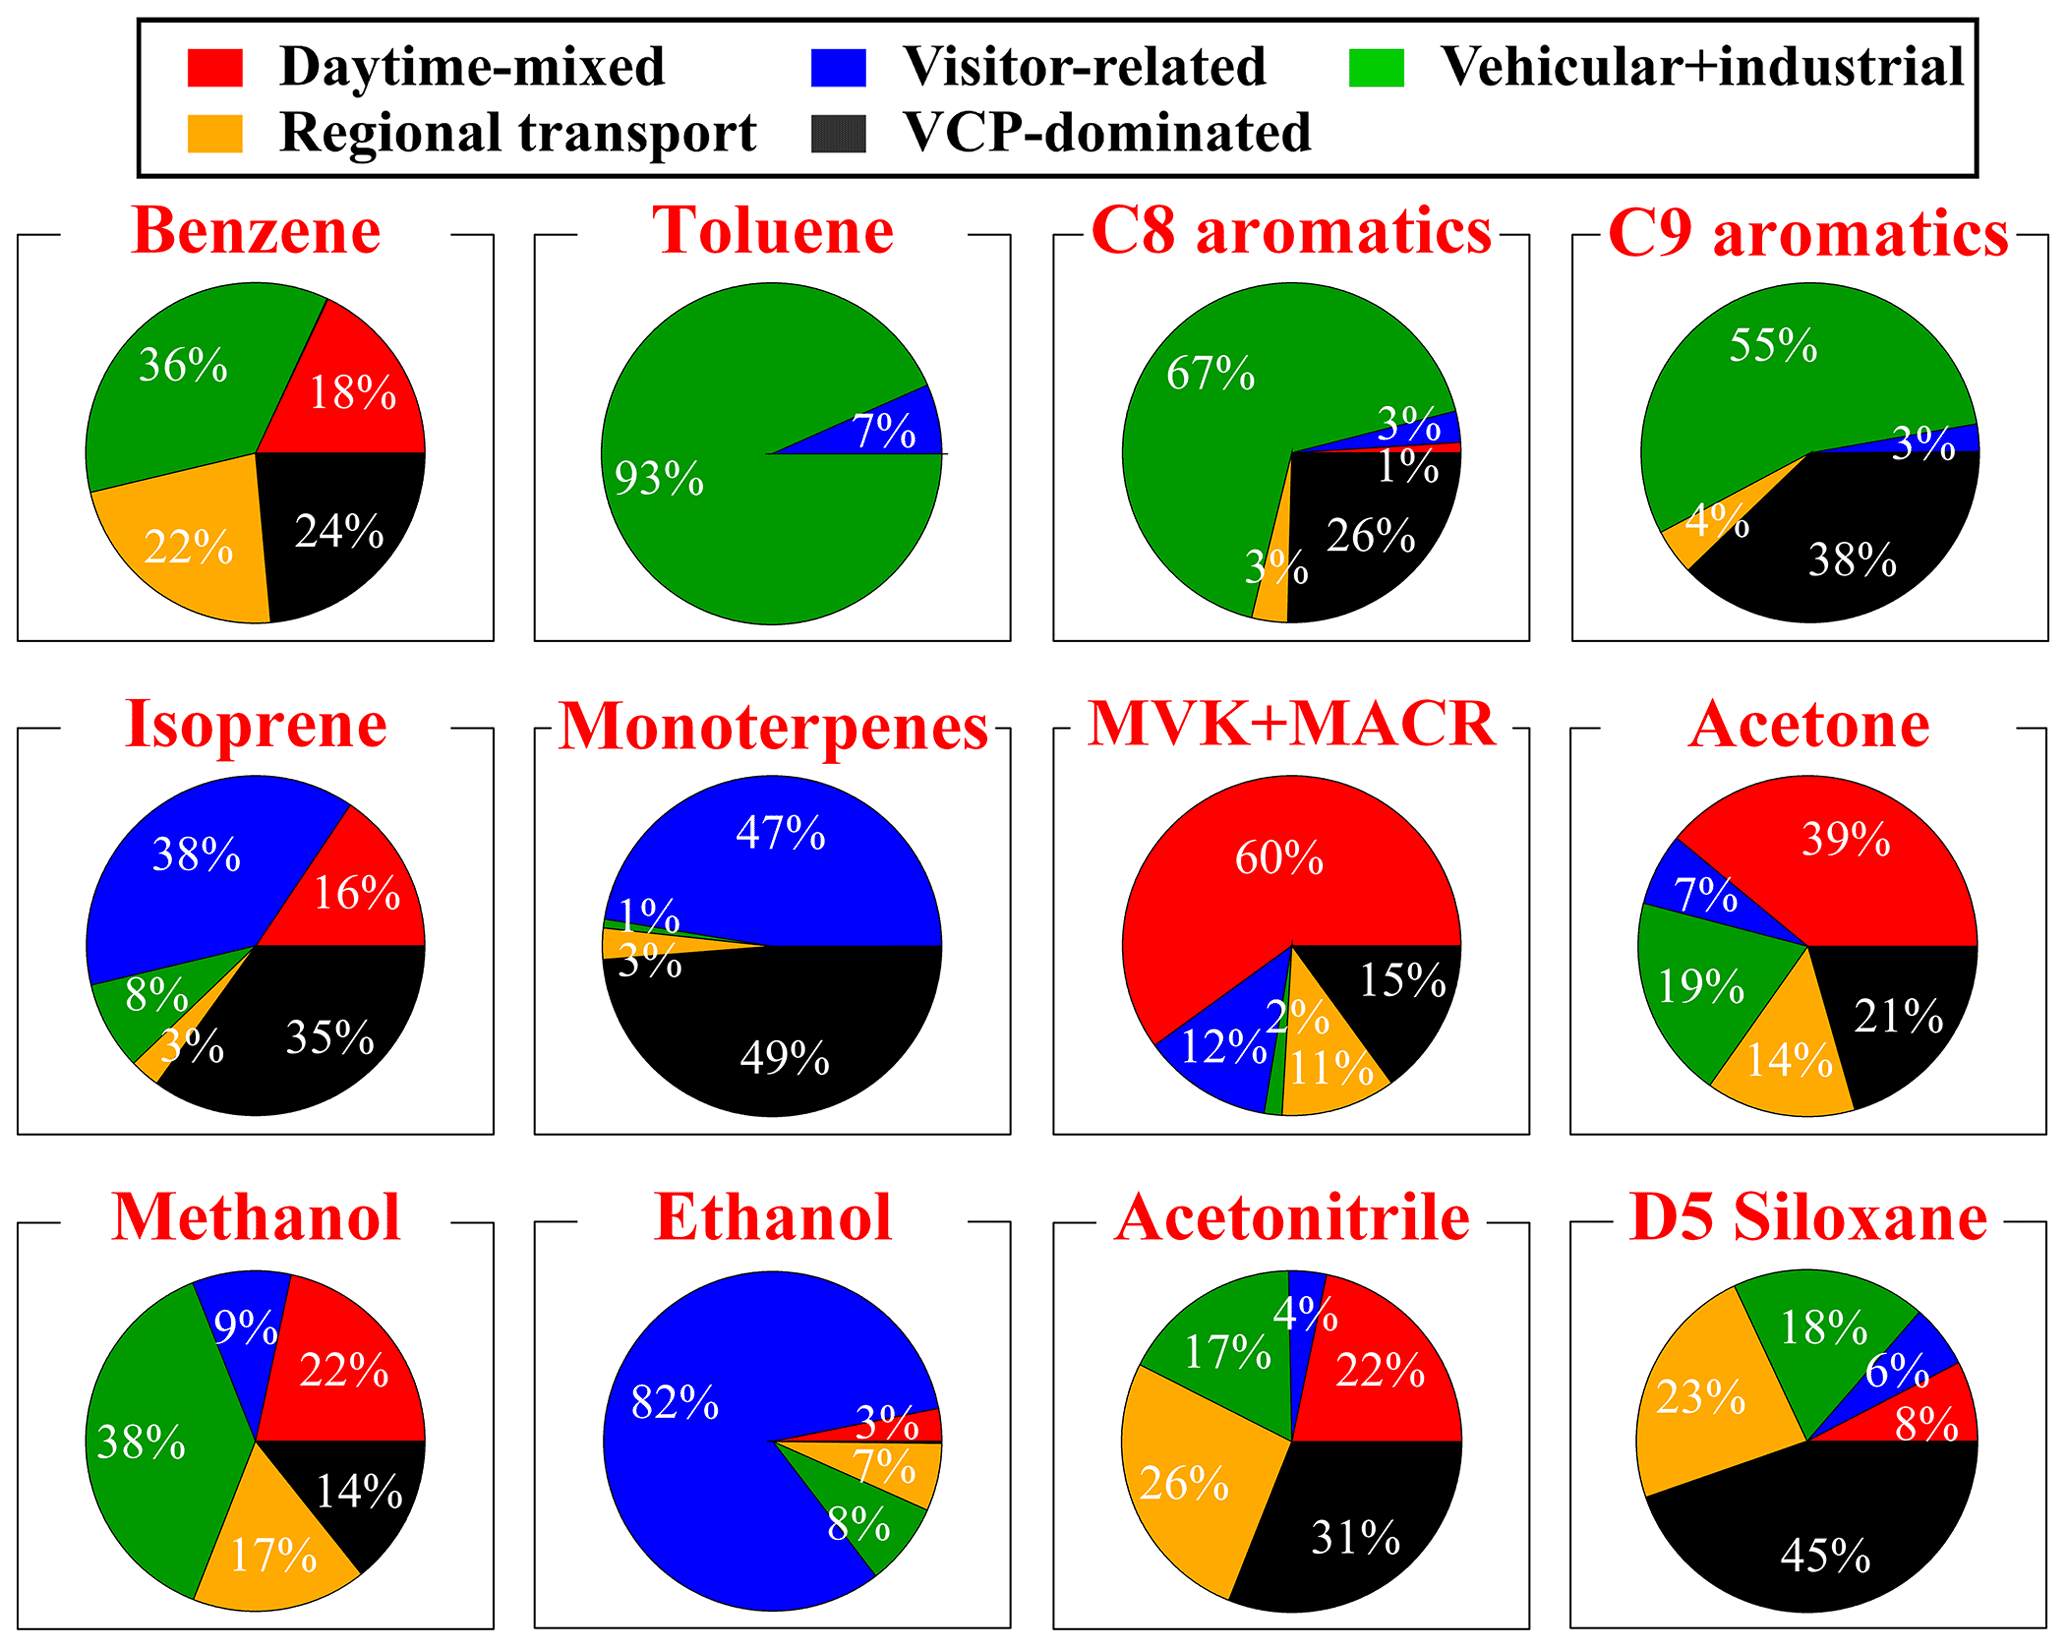
Figure 8Average contribution percentages of the five PMF factors to concentrations of the nine selected VOC species during the CTT campaign.
The visitor-related source predominantly includes contributions from human breath and volatilization of ethanol-containing and personal care products. Contributions of the visitor-related source had the narrowest autocorrelation profile among the five factors (Fig. 6g), confirming its mostly local characteristics. As shown in Fig. 7, the visitor-related source had the largest contributions (15.9±19.6 ppb), accounting for 30 % of the average TVOC mixing ratio. In addition, contributions of the visitor-related source accounted for a larger fraction of TVOC mixing ratios on non-working days (33 %) than those on working days (28 %), as shown in Figs. 7 and S8. It should be noted that visitor-related emissions belonged to highly local sources on the 450 m platform and were not typical of the VOC measurements in the upper boundary layer. The vehicular–industrial source mainly includes contributions from vehicular exhausts and emissions of various industrial processes. Contributions of the vehicular–industrial source (15.1±18.3 ppb) were comparable to those of the visitor-related source, accounting for 28 % of the average TVOC mixing ratio. As anticipated, the vehicular–industrial source contributed to a smaller fraction of TVOC mixing ratios on non-working days (26 %) than those on working days (30 %). The VCP-dominated source predominantly includes contributions from the volatilization of VCPs in urban environments. The VCP-dominated source had an average contribution of 5.7±5.4 ppb, accounting for 11 % of the average TVOC mixing ratio. The average contribution of the VCP-dominated source in this study was comparable to those (∼6.0 ppb) measured in New York City (Gkatzelis et al., 2021). However, VCPs contributed to over 50 % of anthropogenic VOC emissions in New York City, which is much greater than the fraction in this study (11 %, and it will increase to 16 % when contributions of the visitor-related source were removed). In comparison to large cities in the US, traffic and industrial emissions were still dominant sources of ambient VOCs in Chinese cities. However, VCP emissions should also be given more attention as the VCP-dominated (22 %) and vehicular–industrial (23 %) sources had comparable contributions to the total OH reactivities, as shown in Fig. 7f.
The daytime mixed source predominantly includes contributions from biogenic emissions and photooxidation products of various VOCs. The daytime mixed source had an average contribution of 11.6±12.6 ppb, accounting for 21 % of the average TVOC mixing ratio. It exhibited consistent diurnal variation patterns on both working and non-working days but had larger contributions in the daytime on non-working days (Fig. 6). This may be attributed to the enhanced formation of secondary OVOC species as manifested by the higher ozone concentrations on non-working days (Fig. S9). The regional transport source mainly includes contributions from advection transport of aged air masses. Contributions of the regional transport source had the flattest autocorrelation profile, implying its most regional characteristics. Only a small fraction (<5 %) of reactive chemical species such as aromatics were attributed to this factor, leading to the lowest contribution to the total OH reactivity. Contributions of the regional transport source accounted for 13 % of the TVOC mixing ratio when affected by continental airflows, but only accounted for 3 % when affected by marine airflows (Fig. S10). By contrast, contributions of the other factors displayed weak dependences on wind direction.
As shown in Fig. 8, source apportionment of the selected VOC species (Fig. 3) discussed in Sect. 3.2 was further investigated. The vehicular–industrial source had the largest contribution (36 %) to benzene. The daytime mixed source also contributed to 18 % of measured benzene mixing ratios. In addition, more than 20 % of benzene was attributed to the VCP-dominated source. In contrast to benzene, toluene was predominantly attributed to the vehicular–industrial (93 %) and visitor-related (7 %) sources. The average ratio of toluene to benzene was 5.7 ppb ppb−1 during the CTT campaign (Fig. S11), further confirming primary contributions of toluene from vehicular and industrial emissions (Wu et al., 2016; Zhou et al., 2019; Xia et al., 2021). The vehicular–industrial source also accounted for the largest fractions of C8 and C9 aromatics. In addition, 26 % of C8 aromatics and 38 % of C9 aromatics were attributed to the VCP-dominated source. The other three sources in total contributed to less than 10 % of concentrations of C8 and C9 aromatics. These results indicate that VCPs are important sources of aromatics in urban environments, but they were rarely identified in previous studies.
Isoprene and monoterpenes are widely known tracers of biogenic emissions (Millet et al., 2016; Zhao et al., 2021). However, the daytime mixed source only contributed to 16 % of measured isoprene mixing ratios. By contrast, more than 70 % of isoprene was attributed to the visitor-related (38 %) and VCP-dominated (35 %) sources. As for monoterpenes, more than 95 % of the measured mixing ratios were attributed to the visitor-related (47 %) and VCP-dominated (49 %) sources. The average ratio of monoterpene to isoprene mixing ratios at 450 m was 0.84 in the daytime (08:00–18:00 LT), which was significantly (p<0.01) greater than that at the ground level (0.05) (Fig. S11). It further confirms strong contributions of monoterpenes from visitor-related emissions at the 450 m platform. The daytime mixed source did not exhibit discernible contributions to monoterpenes. This agrees well with the results in New York City where monoterpene mixing ratios were primarily attributed to anthropogenic sources such as VCPs, cooking, and building materials (Coggon et al., 2021; Gkatzelis et al., 2021). These results suggest that emission intensities of isoprene and monoterpenes may be highly underestimated in urban regions if their anthropogenic emissions are overlooked or less considered. This is exceedingly important for air quality models when estimating formation of ozone and secondary organic aerosol driven by the oxidation of isoprene and monoterpene. As the key photooxidation products of isoprene, nearly 60 % of MVK and MACR were attributed to the daytime mixed source. The visitor-related, regional transport, and VCP-dominated sources contributed to comparable fractions (11 %–15 %) of MVK and MACR. Therefore, anthropogenic emissions are also important sources of MVK and MACR in urban environments.
As shown in Fig. 8, 39 % of acetone was attributed to the daytime mixed source. The vehicular–industrial (19 %) and VCP-dominated (21 %) sources accounted for comparable fractions of measured acetone mixing ratios. The visitor-related source had the lowest contribution (7 %) to acetone. As for methanol, the vehicular–industrial source accounted for the largest fraction (38 %), followed by the daytime mixed (22 %), regional transport (17 %), VCP-dominated (14 %), and visitor-related (9 %) sources. These results reveal that VCPs also contributed significantly to ambient concentrations of acetone and methanol and should be carefully considered when estimating their total emission intensities from anthropogenic sources. Ethanol was predominantly attributed to the visitor-related source. Therefore, the enhanced ethanol mixing ratios were not capable of representing its characteristic concentrations in urban environments. Although synchronous ground-level measurements are absent, we can speculate that ethanol concentrations at ground level were also increased during the outbreak of the COVID-19 pandemic due to the extensive usage of ethanol-containing products. The enhancement of ethanol concentrations can contribute significantly to the increase in atmospheric OH reactivity (Millet et al., 2012; de Gouw et al., 2017, 2018) and then regulate the formation of secondary pollutants. Therefore, impacts of the ethanol enhancement on ambient air quality should be explicitly investigated in future studies due to the wide report of ozone enhancement during the outbreak of the COVID-19 pandemic (Huang et al., 2020; Qi et al., 2021).
Acetonitrile is widely used as a typical tracer of biomass burning sources in previous studies (de Gouw et al., 2003b; Zhang et al., 2020; Tan et al., 2021). However, the biomass burning source was not identified in this study because acetonitrile was not predominantly attributed to a single factor. In addition to the visitor-related source, the other four sources also had large contributions to acetonitrile. As indicated by Huangfu et al. (2021), it is not always suitable, particularly in urban environments, to use absolute concentrations of acetonitrile as the indication of biomass burning sources. The ratio of acetonitrile to CO is a better indicator to identify whether VOC measurements are predominantly contributed by biomass burning emissions. The average ratio of acetonitrile to CO was only 0.09 (ppb ppm−1) during the CTT campaign (Fig. S11), indicating negligible contributions from biomass burning sources. In addition to the daytime mixed (22 %) and vehicular–industrial (26 %) sources, the VCP-dominated source (31 %) also had large contributions to acetonitrile in urban environments.
3.5 Vertical distributions of air pollutant concentrations
As introduced in Sect. 2.1, hourly concentrations of some air pollutants were routinely measured at four automatic sites on the CTT. Figure 9 shows contour plots of vertical profiles of NOx, ozone, Ox (O3 + NO2), and PM2.5 concentrations in September 2020. Concentrations of the four pollutants all exhibited stratified structures between 488 m and the ground level. Higher mixing ratios of ozone and Ox predominantly occurred at higher altitudes, while higher NOx mixing ratios mainly occurred at ground level. By contrast, higher PM2.5 concentrations were observed at both middle altitudes and ground level.
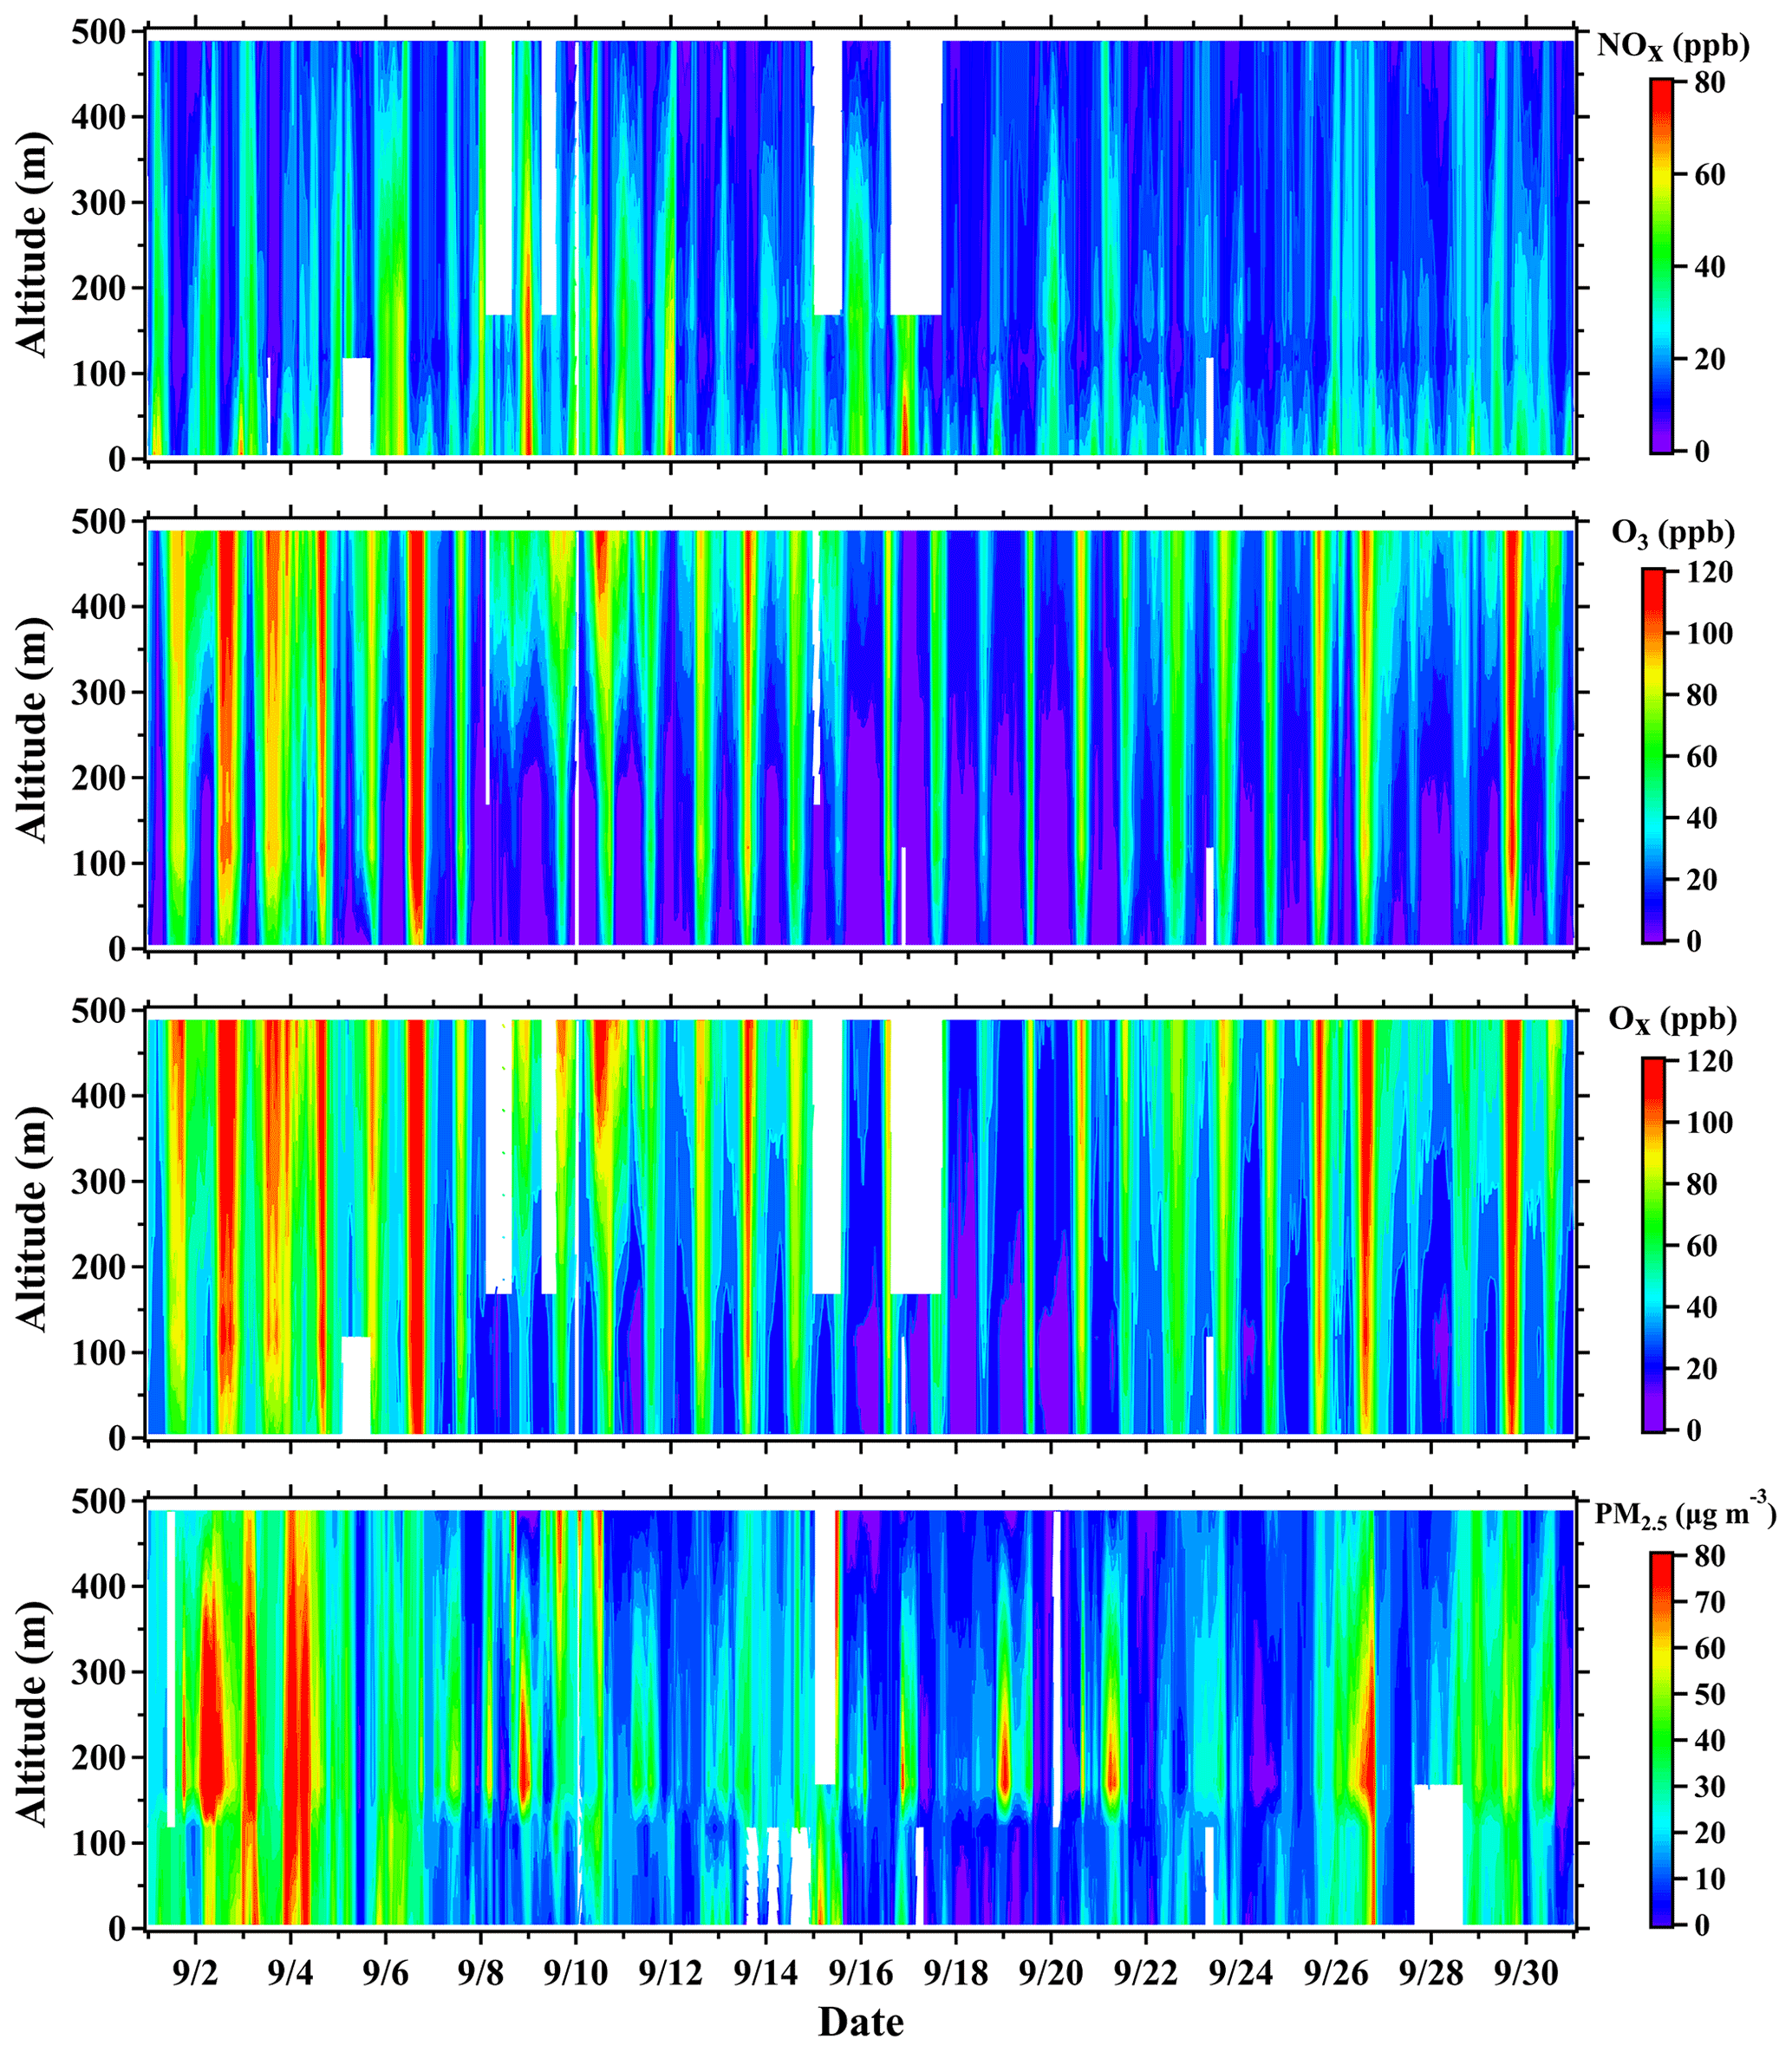
Figure 9Time series of vertical profiles for O3, NOx, Ox (O3 + NO2), and PM2.5 concentrations in September during the CTT campaign. The contour plots are made using the measurements from the four CTT sites (5, 118, 168, and 488 m).
To further clarify vertical distribution patterns of air pollutant concentrations, their composite profiles for daytime (08:00–18:00 LT), nighttime (19:00–05:00 LT), and the whole day in the campaign were determined, as shown in Fig. 10. Vertical profiles of air pollutant concentrations exhibited similar shapes in both daytime and nighttime. NOx mixing ratios decreased from the ground level to 488 m, suggesting intensive surface emissions around the CTT. Ozone mixing ratios rapidly increased from the ground level to 488 m, which was consistent with the results reported in previous studies (Velasco et al., 2008; Li et al., 2018; Zhang et al., 2019; Li et al., 2021b). The positive gradients of ozone profiles are mainly caused by enhanced NO titration (NO + O3 = O2 + NO2) and dry deposition near the ground. Ox mixing ratios also increased from the ground level to 488 m but exhibited weaker gradients in comparison to ozone. Vertical profiles of PM2.5 concentrations exhibited similar shapes to NOx. Daily mean concentrations of PM2.5 and Ox were well correlated at the four altitudes, with r values varying in the range of 0.61–0.82, suggesting prominent contributions of secondary formation to ambient PM concentrations. Moreover, the correlation coefficients between Ox and PM2.5 concentrations at 488 m (0.82) were greater than those at ground level (0.78), as they were less affected by nearby vehicular emissions. This is consistent with the work by Yan et al. (2020), who reported that secondary components contributed to ∼80 % of PM2.5 concentrations in the PRD over the 2008–2019 period.
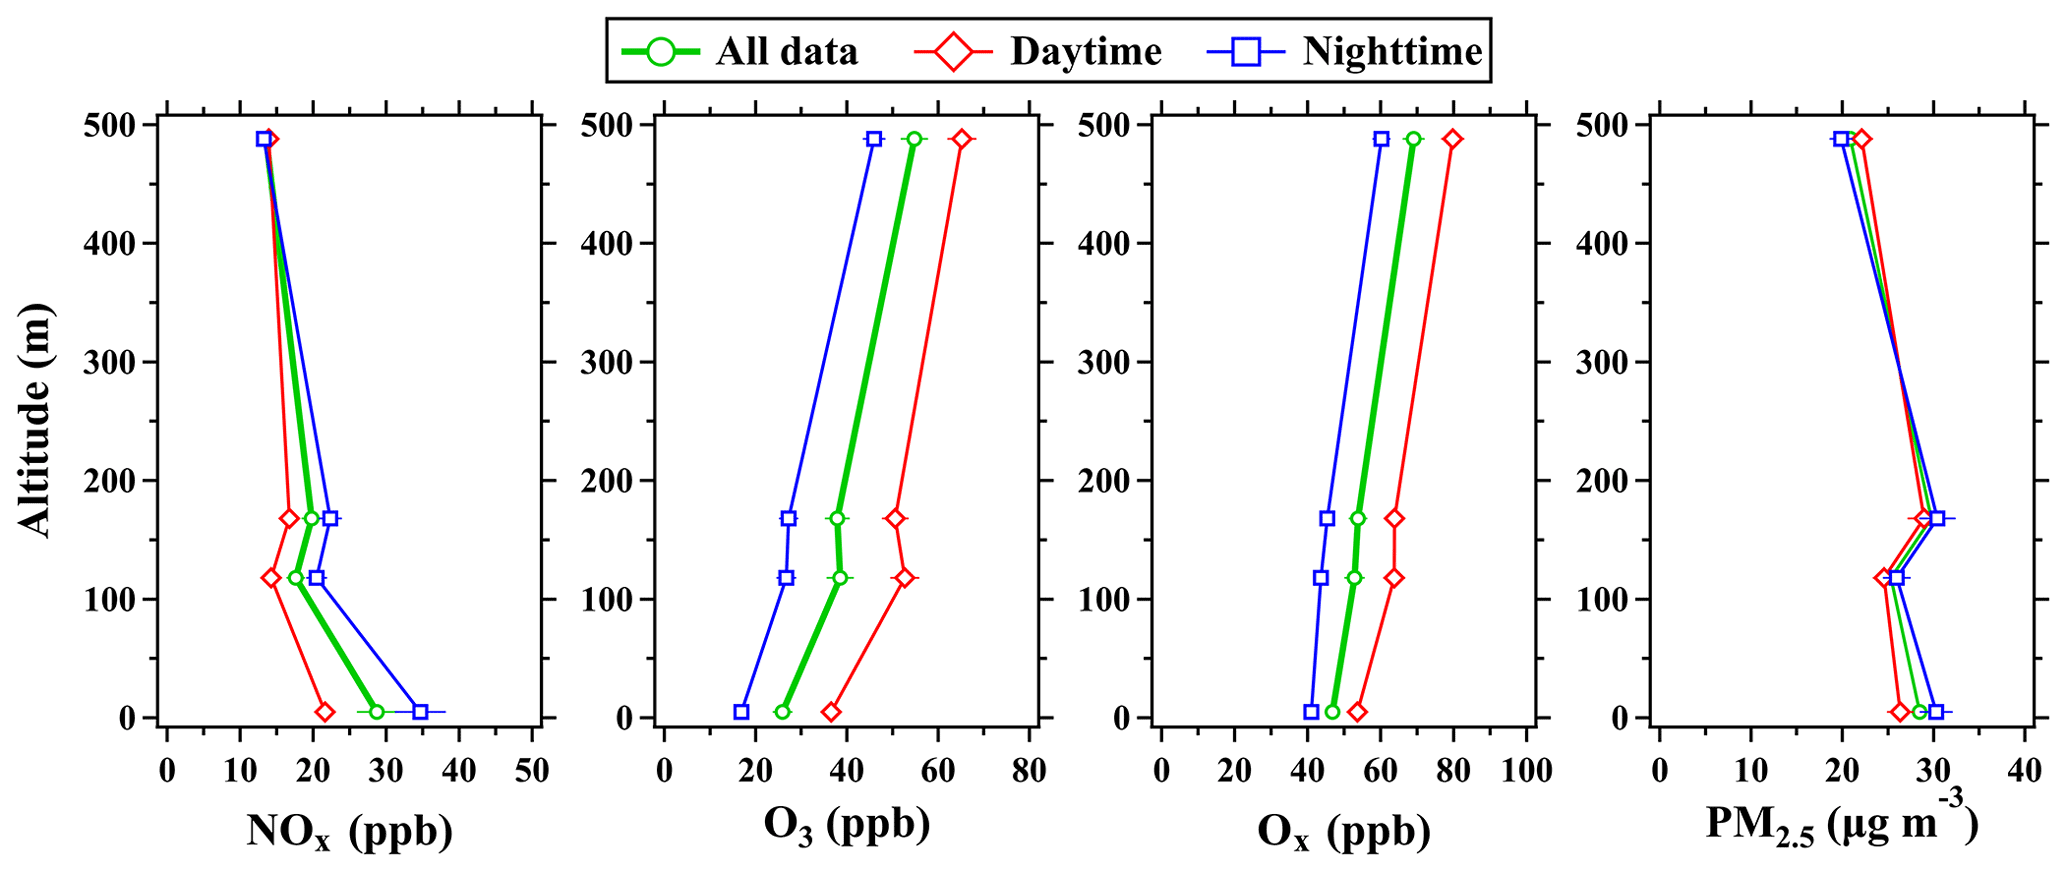
Figure 10Average vertical profiles of O3, NOx, Ox (O3 + NO2), and PM2.5 concentrations (mean ± 0.1 SDs) measured at the four CTT sites (5, 118, 168, 488 m) during the campaign. Daytime refers to the time between 08:00–18:00 LT; nighttime refers to the time between 19:00–05:00 LT.
As shown in Figs. 9 and 10, vertical profiles of air pollutant concentrations exhibited weaker gradients in the daytime than in the nighttime. Therefore, the daytime VOC chemistry may have minor differences between the ground level and the 450 m site due to strong vertical mixing of chemical species in the planetary boundary layer (PBLH > 450 m, as shown in Fig. S12). In the nighttime, the oxidative products (such as organic nitrates and OVOCs) of unsaturated hydrocarbons, predominantly initiated by nitrate radicals (NO3) and ozone, are also important precursors of secondary aerosol (Warneke et al., 2004; Brown et al., 2011; Ng et al., 2017; Liebmann et al., 2019). However, it is highly challenging to investigate the nighttime VOC chemistry with only ground-level measurements due to the rapid removal of NO3 radicals and ozone by enhanced NO titration (Geyer and Stutz, 2004; Stutz et al., 2004; Brown et al., 2007). In this condition, the nocturnal residual layer, separated from the nocturnal boundary layer and retained, to a large extent, the chemical composition of the daytime atmosphere and could provide an ideal place for investigating nighttime VOCs chemistry. Oxidative products of VOCs in the residual layer could be mixed downward with the expansion of the PBL during the daytime (Geyer and Stutz, 2004; Stutz et al., 2004; Li et al., 2021a), contributing to the formation of ozone and secondary aerosol at ground level. Investigation of the nighttime VOC chemistry was one of the initial purposes of this study. Unfortunately, the 450 m site was rarely located in the nocturnal residual layer during the CTT campaign due to frequent occurrences of cloudy and rainy weather. The average nighttime PBLH in Guangzhou was approximately stabilized at 500 m during the campaign (Fig. S12), implying notable impacts from surface emissions on the measurements made at 450 m.
In addition to the measured PBLH data, formation of the residual layer at 450 m could also be identified by comparing differences of ozone mixing ratios between 488 m and the ground level. Without fresh NO emissions, ozone mixing ratios in the nocturnal residual layer were markedly higher than at ground level and exhibited weak variability throughout the nighttime (Caputi et al., 2019; Udina et al., 2020). By contrast, surface ozone mixing ratios are generally very low (close to zero) due to enhanced titration by freshly emitted NO and strong inhibition of atmospheric vertical mixing (Ma et al., 2011; Chen et al., 2020). In this study, the data collected between 27–30 September were one of the cases discussed above and were used to briefly describe behaviors of some representative VOC species (namely ethanol, monoterpene, styrene, phenol, and toluene) at 450 m.
As shown in Fig. 11, ozone mixing ratios measured at ground level (10.2±10.4 ppb) were significantly (p<0.01) lower than those at 488 m (44.2±19.6 ppb) on the night of 27–30 September, indicating formation of the nocturnal residual layer lower than 450 m. On the night of 27–28 September, ozone mixing ratios at 488 m slightly fluctuated around 46.8 ppb between 19:00–00:00 LT and suddenly decreased to 28.4 ppb at 01:00 LT on 28 September. The sudden decrease in ozone at 01:00 LT was accompanied by slight increases in both NOx and VOCs but notable decreases in NOx and NO at ground level, indicating a transitory intrusion of surface fresh emissions into the residual layer. On 28 September, ozone mixing ratios at 488 m slightly decreased from 33.0 to 31.5 ppb from 02:00 to 05:00 LT, during which mixing ratios of NOx and VOCs all decreased in different degrees. The continuous decreases in both toluene and ethanol between 02:00–05:00 LT confirm that the VOC measurements at 450 m were free of interferences by fresh emissions due to their large contributions from vehicular exhausts (Fig. 8). Toluene mixing ratios decreased by 43 % from 02:00 to 05:00 LT, which was larger than those (12 %–27 %) of the other VOC species shown in Fig. 11. However, the NO3 reactivity (characterized by reaction rate constants of VOC species to NO3 radical, ) of toluene ( cm3 molec.−1 s−1) is exceedingly lower than that of the other unsaturated VOC species ( varies in the magnitude of 10−12 cm3 molec.−1 s−1) (Atkinson and Arey, 2003; Atkinson et al., 2006). Therefore, the decline of unsaturated VOC species in the nocturnal residual layer may not all be attributed to the degradation chemistry initiated by NO3 radicals or ozone.

Figure 11Time series of O3, NOx, NO, ethanol, monoterpene, styrene, phenol, and toluene mixing ratios along with planetary boundary layer height (PBLH) during 26–30 September. O3 difference refers to the differences in ozone mixing ratios between 488 and 5 m. Grey shaded areas indicate nighttime periods (19:00–05:00 LT).
On the night of 28–29 September, the PBLH was higher than 500 m between 19:00–00:00 LT, resulting in notable decreases in ozone and increases in NOx and VOCs. As shown in Fig. 11, the 450 m site may be located in the residual layer after 01:00 LT. However, the rapid decrease in mixing ratios of NOx and VOCs between 01:00–05:00 LT was not likely caused by chemical removal due to the rapid increase in ozone. Regional transport of aged air masses (characterized by high ozone and low NOx mixing ratios) may be responsible for the rapid decline in various VOC species in the early morning of 29 September. On the night of 29–30 September, the 450 m site may be impacted by surface fresh emissions as mixing ratios of ozone, NOx, and VOCs all decreased between 19:00–01:00 LT and simultaneously increased between 02:00–05:00 LT. NOx and toluene mixing ratios generally increased between 12:00–18:00 LT during 27–29 September, which was quite different from their average diurnal variation patterns during the whole campaign (Figs. 3 and 4). As discussed above, the 450 m site was located in the nocturnal residual layer during 27–29 September. Therefore, emissions of pollutants from surface sources could be mixed upward to the measurement site only when the PBLH was higher than 450 m. Furthermore, the PBL was relatively lower and rapidly shrank in the afternoon, leading to the accumulation of chemical species at 450 m.
In summary, the VOC measurements made by PTR-ToF-MS at the 450 m site can be used to characterize variations in VOC species from their primary emissions during the nighttime. Nevertheless, the oxidative degradation processes of VOCs in the nighttime were not well captured. It is highly difficult to provide more information on the nighttime chemistry of VOC species solely depending on their temporal variations. We believe that the oxidative degradation of reactive VOC species did occur in the nocturnal residual layer due to the coexistence of high concentrations of NOx and ozone. Measurement techniques that target oxidation products (e.g., ToF-CIMS) and numerical models should be jointly used to deeply analyze the nighttime chemistry of VOCs in the nocturnal residual layer and quantitatively evaluate their impacts on ambient air quality during the daytime.
Continuous measurements of VOC mixing ratios were made by PTR-ToF-MS at 450 m on the CTT in the PRD, China, from 18 August–5 November 2020. In addition to some specific VOC species (such as ethanol and monoterpenes) that were intensively emitted by visitor-related sources, mixing ratios of most VOC species at 450 m were generally lower than those at ground level. Due to intensive emissions from visitor-related sources, mixing ratios of some VOC species were significantly higher on non-working days than those on working days. The VOC mixing ratios measured at 450 m also exhibited different diurnal variations from those at ground level, indicating that they were contributed by more mixed sources at larger spatial scales. Five sources, namely daytime mixed, visitor-related, vehicular–industrial, regional transport, and VCP-dominated, were determined by the PMF model, contributing to 21 %, 30 %, 28 %, 10 %, and 11 % of the average TVOC mixing ratio, respectively. In addition to the daytime mixed and visitor-related sources, the other three sources all had relatively lower contributions on non-working days than on working days. The VCP-dominated source contributed an average of 5.7 ppb to TVOC mixing ratios, which was comparable to those reported in American cities (Gkatzelis et al., 2021). However, the VCP-dominated source accounted for a much smaller fraction (11 %) of measured TVOC mixing ratios in this study than in US cities (>50 %). Therefore, the reduction in anthropogenic VOC emissions from traffic and industrial sources are still priorities of current air pollution control for Chinese cities. Though a smaller fraction of VOCs contributed by VCPs was observed in this study compared to cities in the US (McDonald et al., 2018; Gkatzelis et al., 2021), large fractions of key VOC species (such as monoterpenes and some aromatic species) were attributed to the VCP-dominated source. In addition, the VCP-dominated (22 %) and vehicular–industrial sources (23 %) had comparable contributions to the total OH reactivity. Therefore, VCP emissions should be given more attention when making strategies for control of VOCs in urban regions.
The vertical distribution patterns of NOx, ozone, Ox, and PM2.5 concentrations were investigated using measurements made at four different heights on the CTT. Vertical profiles of NOx and PM2.5 generally exhibited negative gradients, while vertical profiles of ozone demonstrated positive gradients. In addition, the vertical gradients of air pollutant concentrations were larger in the nighttime than in the daytime, predominantly owing to stronger stability of the nocturnal boundary layer. The 450 m site was rarely located in the nocturnal residual layer as cloudy and rainy weather dominated during the campaign. The selected case revealed that the NO3- or O3-initiated degradation chemistry may be not the sole path for the removal of unsaturated VOC species in nighttime. The degradation chemistry of reactive VOC species in the nocturnal residual layer and their impacts on ground-level air quality could be further investigated in combination with model simulations in future studies.
The observational data used in this study are available from corresponding authors upon request.
The supplement related to this article is available online at: https://doi.org/10.5194/acp-22-10567-2022-supplement.
XBL and BY designed the research. XBL, BY, SW, CWa, JL, ZL, XH, YF, CPe, PC, JQ, CWu, YY, MC, HZ, WY, XW, and MS contributed to the data collection and data analysis. XBL and BY performed the PMF analysis with contributions from YS, SY, and SH. XBL and BY wrote the paper. All the coauthors discussed the results and reviewed the paper.
The contact author has declared that none of the authors has any competing interests.
Publisher's note: Copernicus Publications remains neutral with regard to jurisdictional claims in published maps and institutional affiliations.
We sincerely appreciate the help and support from the Canton Tower management team.
This work was financially supported by the National Natural Science Foundation of China (grant nos. 41877302 and 42121004), Key-Area Research and Development Program of Guangdong Province (grant no. 2020B1111360003), China Postdoctoral Science Foundation (grant no. 2019M663367), National Research Program for Key Issues in Air Pollution Control (grant no. DQGG202101), Guangdong Innovative and Entrepreneurial Research Team Program (grant no. 2016ZT06N263), and Special Fund Project for Science and Technology Innovation Strategy of Guangdong Province (grant no. 2019B121205004).
This paper was edited by Drew Gentner and reviewed by two anonymous referees.
An, J., Huang, Y., Huang, C., Wang, X., Yan, R., Wang, Q., Wang, H., Jing, S., Zhang, Y., Liu, Y., Chen, Y., Xu, C., Qiao, L., Zhou, M., Zhu, S., Hu, Q., Lu, J., and Chen, C.: Emission inventory of air pollutants and chemical speciation for specific anthropogenic sources based on local measurements in the Yangtze River Delta region, China, Atmos. Chem. Phys., 21, 2003–2025, https://doi.org/10.5194/acp-21-2003-2021, 2021.
Atkinson, R. and Arey, J.: Atmospheric Degradation of Volatile Organic Compounds, Chem. Rev., 103, 4605–4638, https://doi.org/10.1021/cr0206420, 2003.
Atkinson, R., Baulch, D. L., Cox, R. A., Crowley, J. N., Hampson, R. F., Hynes, R. G., Jenkin, M. E., Rossi, M. J., Troe, J., and Subcommittee, I.: Evaluated kinetic and photochemical data for atmospheric chemistry: Volume II – gas phase reactions of organic species, Atmos. Chem. Phys., 6, 3625–4055, https://doi.org/10.5194/acp-6-3625-2006, 2006.
Baudic, A., Gros, V., Sauvage, S., Locoge, N., Sanchez, O., Sarda-Estève, R., Kalogridis, C., Petit, J. E., Bonnaire, N., Baisnée, D., Favez, O., Albinet, A., Sciare, J., and Bonsang, B.: Seasonal variability and source apportionment of volatile organic compounds (VOCs) in the Paris megacity (France), Atmos. Chem. Phys., 16, 11961–11989, https://doi.org/10.5194/acp-16-11961-2016, 2016.
Benish, S. E., He, H., Ren, X., Roberts, S. J., Salawitch, R. J., Li, Z., Wang, F., Wang, Y., Zhang, F., Shao, M., Lu, S., and Dickerson, R. R.: Measurement report: Aircraft observations of ozone, nitrogen oxides, and volatile organic compounds over Hebei Province, China, Atmos. Chem. Phys., 20, 14523–14545, https://doi.org/10.5194/acp-20-14523-2020, 2020.
Brown, S. S., Dubé, W. P., Osthoff, H. D., Stutz, J., Ryerson, T. B., Wollny, A. G., Brock, C. A., Warneke, C., de Gouw, J. A., Atlas, E., Neuman, J. A., Holloway, J. S., Lerner, B. M., Williams, E. J., Kuster, W. C., Goldan, P. D., Angevine, W. M., Trainer, M., Fehsenfeld, F. C., and Ravishankara, A. R.: Vertical profiles in NO3 and N2O5 measured from an aircraft: Results from the NOAA P-3 and surface platforms during the New England Air Quality Study 2004, J. Geophys. Res.-Atmos., 112, D22304, https://doi.org/10.1029/2007JD008883, 2007.
Brown, S. S., Dubé, W. P., Peischl, J., Ryerson, T. B., Atlas, E., Warneke, C., de Gouw, J. A., te Lintel Hekkert, S., Brock, C. A., Flocke, F., Trainer, M., Parrish, D. D., Feshenfeld, F. C., and Ravishankara, A. R.: Budgets for nocturnal VOC oxidation by nitrate radicals aloft during the 2006 Texas Air Quality Study, J. Geophys. Res.-Atmos., 116, D24305, https://doi.org/10.1029/2011JD016544, 2011.
Caputi, D. J., Faloona, I., Trousdell, J., Smoot, J., Falk, N., and Conley, S.: Residual layer ozone, mixing, and the nocturnal jet in California's San Joaquin Valley, Atmos. Chem. Phys., 19, 4721–4740, https://doi.org/10.5194/acp-19-4721-2019, 2019.
Chen, Q., Li, X.-B., Song, R., Wang, H.-W., Li, B., He, H.-D., and Peng, Z.-R.: Development and utilization of hexacopter unmanned aerial vehicle platform to characterize vertical distribution of boundary layer ozone in wintertime, Atmos. Pollut. Res., 11, 1073–1083, https://doi.org/10.1016/j.apr.2020.04.002, 2020.
Chen, X., Millet, D. B., Singh, H. B., Wisthaler, A., Apel, E. C., Atlas, E. L., Blake, D. R., Bourgeois, I., Brown, S. S., Crounse, J. D., de Gouw, J. A., Flocke, F. M., Fried, A., Heikes, B. G., Hornbrook, R. S., Mikoviny, T., Min, K. E., Müller, M., Neuman, J. A., O'Sullivan, D. W., Peischl, J., Pfister, G. G., Richter, D., Roberts, J. M., Ryerson, T. B., Shertz, S. R., Thompson, C. R., Treadaway, V., Veres, P. R., Walega, J., Warneke, C., Washenfelder, R. A., Weibring, P., and Yuan, B.: On the sources and sinks of atmospheric VOCs: an integrated analysis of recent aircraft campaigns over North America, Atmos. Chem. Phys., 19, 9097–9123, https://doi.org/10.5194/acp-19-9097-2019, 2019.
Coggon, M. M., Gkatzelis, G. I., McDonald, B. C., Gilman, J. B., Schwantes, R. H., Abuhassan, N., Aikin, K. C., Arend, M. F., Berkoff, T. A., Brown, S. S., Campos, T. L., Dickerson, R. R., Gronoff, G., Hurley, J. F., Isaacman-VanWertz, G., Koss, A. R., Li, M., McKeen, S. A., Moshary, F., Peischl, J., Pospisilova, V., Ren, X., Wilson, A., Wu, Y., Trainer, M., and Warneke, C.: Volatile chemical product emissions enhance ozone and modulate urban chemistry, P. Natl. Acad. Sci. USA, 118, e2026653118, https://doi.org/10.1073/pnas.2026653118, 2021.
de Gouw, J. and Warneke, C.: Measurements of volatile organic compounds in the earth's atmosphere using proton-transfer-reaction mass spectrometry, Mass Spectrom. Rev., 26, 223–257, https://doi.org/10.1002/mas.20119, 2007.
de Gouw, J. A., Goldan, P. D., Warneke, C., Kuster, W. C., Roberts, J. M., Marchewka, M., Bertman, S. B., Pszenny, A. A. P., and Keene, W. C.: Validation of proton transfer reaction-mass spectrometry (PTR-MS) measurements of gas-phase organic compounds in the atmosphere during the New England Air Quality Study (NEAQS) in 2002, J. Geophys. Res.-Atmos., 108, 4682, https://doi.org/10.1029/2003jd003863, 2003a.
de Gouw, J. A., Warneke, C., Parrish, D. D., Holloway, J. S., Trainer, M., and Fehsenfeld, F. C.: Emission sources and ocean uptake of acetonitrile (CH3CN) in the atmosphere, J. Geophys. Res.-Atmos., 108, 4329, https://doi.org/10.1029/2002JD002897, 2003b.
de Gouw, J. A., Gilman, J. B., Kim, S.-W., Lerner, B. M., Isaacman-VanWertz, G., McDonald, B. C., Warneke, C., Kuster, W. C., Lefer, B. L., Griffith, S. M., Dusanter, S., Stevens, P. S., and Stutz, J.: Chemistry of Volatile Organic Compounds in the Los Angeles basin: Nighttime Removal of Alkenes and Determination of Emission Ratios, J. Geophys. Res.-Atmos., 122, 11843–11861, https://doi.org/10.1002/2017JD027459, 2017.
de Gouw, J. A., Gilman, J. B., Kim, S.-W., Alvarez, S. L., Dusanter, S., Graus, M., Griffith, S. M., Isaacman-VanWertz, G., Kuster, W. C., Lefer, B. L., Lerner, B. M., McDonald, B. C., Rappenglück, B., Roberts, J. M., Stevens, P. S., Stutz, J., Thalman, R., Veres, P. R., Volkamer, R., Warneke, C., Washenfelder, R. A., and Young, C. J.: Chemistry of Volatile Organic Compounds in the Los Angeles Basin: Formation of Oxygenated Compounds and Determination of Emission Ratios, J. Geophys. Res.-Atmos., 123, 2298–2319, https://doi.org/10.1002/2017JD027976, 2018.
Deming, B. L., Pagonis, D., Liu, X., Day, D. A., Talukdar, R., Krechmer, J. E., de Gouw, J. A., Jimenez, J. L., and Ziemann, P. J.: Measurements of delays of gas-phase compounds in a wide variety of tubing materials due to gas–wall interactions, Atmos. Meas. Tech., 12, 3453–3461, https://doi.org/10.5194/amt-12-3453-2019, 2019.
Dieu Hien, V. T., Lin, C., Thanh, V. C., Kim Oanh, N. T., Thanh, B. X., Weng, C.-E., Yuan, C.-S., and Rene, E. R.: An overview of the development of vertical sampling technologies for ambient volatile organic compounds (VOCs), J. Environ. Manage., 247, 401–412, https://doi.org/10.1016/j.jenvman.2019.06.090, 2019.
Fan, M.-Y., Zhang, Y.-L., Lin, Y.-C., Li, L., Xie, F., Hu, J., Mozaffar, A., and Cao, F.: Source apportionments of atmospheric volatile organic compounds in Nanjing, China during high ozone pollution season, Chemosphere, 263, 128025, https://doi.org/10.1016/j.chemosphere.2020.128025, 2021.
Fry, J. L., Brown, S. S., Middlebrook, A. M., Edwards, P. M., Campuzano-Jost, P., Day, D. A., Jimenez, J. L., Allen, H. M., Ryerson, T. B., Pollack, I., Graus, M., Warneke, C., de Gouw, J. A., Brock, C. A., Gilman, J., Lerner, B. M., Dubé, W. P., Liao, J., and Welti, A.: Secondary organic aerosol (SOA) yields from NO3 radical + isoprene based on nighttime aircraft power plant plume transects, Atmos. Chem. Phys., 18, 11663–11682, https://doi.org/10.5194/acp-18-11663-2018, 2018.
Geng, F., Zhang, Q., Tie, X., Huang, M., Ma, X., Deng, Z., Yu, Q., Quan, J., and Zhao, C.: Aircraft measurements of O3, NOx, CO, VOCs, and SO2 in the Yangtze River Delta region, Atmos. Environ., 43, 584–593, https://doi.org/10.1016/j.atmosenv.2008.10.021, 2009.
Geyer, A., and Stutz, J.: Vertical profiles of NO3, N2O5, O3, and NOx in the nocturnal boundary layer: 2. Model studies on the altitude dependence of composition and chemistry, J. Geophys. Res.-Atmos., 109, D12307, https://doi.org/10.1029/2003jd004211, 2004.
Gkatzelis, G. I., Coggon, M. M., McDonald, B. C., Peischl, J., Gilman, J. B., Aikin, K. C., Robinson, M. A., Canonaco, F., Prevot, A. S. H., Trainer, M., and Warneke, C.: Observations Confirm that Volatile Chemical Products Are a Major Source of Petrochemical Emissions in U.S. Cities, Environ. Sci. Technol., 55, 4332–4343, https://doi.org/10.1021/acs.est.0c05471, 2021.
Gómez, M. C., Durana, N., García, J. A., de Blas, M., Sáez de Cámara, E., García-Ruiz, E., Gangoiti, G., Torre-Pascual, E., and Iza, J.: Long-term measurement of biogenic volatile organic compounds in a rural background area: Contribution to ozone formation, Atmos. Environ., 224, 117315, https://doi.org/10.1016/j.atmosenv.2020.117315, 2020.
Greenberg, J. P., Guenther, A., Zimmerman, P., Baugh, W., Geron, C., Davis, K., Helmig, D., and Klinger, L. F.: Tethered balloon measurements of biogenic VOCs in the atmospheric boundary layer, Atmos. Environ., 33, 855–867, https://doi.org/10.1016/S1352-2310(98)00302-1, 1999.
Guo, H., Cheng, H. R., Ling, Z. H., Louie, P. K. K., and Ayoko, G. A.: Which emission sources are responsible for the volatile organic compounds in the atmosphere of Pearl River Delta?, J. Hazard Mater., 188, 116–124, https://doi.org/10.1016/j.jhazmat.2011.01.081, 2011.
Hayes, P. L., Ortega, A. M., Cubison, M. J., Froyd, K. D., Zhao, Y., Cliff, S. S., Hu, W. W., Toohey, D. W., Flynn, J. H., Lefer, B. L., Grossberg, N., Alvarez, S., Rappenglück, B., Taylor, J. W., Allan, J. D., Holloway, J. S., Gilman, J. B., Kuster, W. C., de Gouw, J. A., Massoli, P., Zhang, X., Liu, J., Weber, R. J., Corrigan, A. L., Russell, L. M., Isaacman, G., Worton, D. R., Kreisberg, N. M., Goldstein, A. H., Thalman, R., Waxman, E. M., Volkamer, R., Lin, Y. H., Surratt, J. D., Kleindienst, T. E., Offenberg, J. H., Dusanter, S., Griffith, S., Stevens, P. S., Brioude, J., Angevine, W. M., and Jimenez, J. L.: Organic aerosol composition and sources in Pasadena, California, during the 2010 CalNex campaign, J. Geophys. Res.-Atmos., 118, 9233–9257, https://doi.org/10.1002/jgrd.50530, 2013.
He, X., Yuan, B., Wu, C., Wang, S., Wang, C., Huangfu, Y., Qi, J., Ma, N., Xu, W., Wang, M., Chen, W., Su, H., Cheng, Y., and Shao, M.: Volatile organic compounds in wintertime North China Plain: Insights from measurements of proton transfer reaction time-of-flight mass spectrometer (PTR-ToF-MS), J. Environm. Sci., 114, 98–114, https://doi.org/10.1016/j.jes.2021.08.010, 2022.
Hornbrook, R. S., Blake, D. R., Diskin, G. S., Fried, A., Fuelberg, H. E., Meinardi, S., Mikoviny, T., Richter, D., Sachse, G. W., Vay, S. A., Walega, J., Weibring, P., Weinheimer, A. J., Wiedinmyer, C., Wisthaler, A., Hills, A., Riemer, D. D., and Apel, E. C.: Observations of nonmethane organic compounds during ARCTAS – Part 1: Biomass burning emissions and plume enhancements, Atmos. Chem. Phys., 11, 11103–11130, https://doi.org/10.5194/acp-11-11103-2011, 2011.
Hu, L., Millet, D. B., Mohr, M. J., Wells, K. C., Griffis, T. J., and Helmig, D.: Sources and seasonality of atmospheric methanol based on tall tower measurements in the US Upper Midwest, Atmos. Chem. Phys., 11, 11145–11156, https://doi.org/10.5194/acp-11-11145-2011, 2011.
Hu, L., Millet, D. B., Kim, S. Y., Wells, K. C., Griffis, T. J., Fischer, E. V., Helmig, D., Hueber, J., and Curtis, A. J.: North American acetone sources determined from tall tower measurements and inverse modeling, Atmos. Chem. Phys., 13, 3379–3392, https://doi.org/10.5194/acp-13-3379-2013, 2013.
Hu, L., Millet, D. B., Baasandorj, M., Griffis, T. J., Travis, K. R., Tessum, C. W., Marshall, J. D., Reinhart, W. F., Mikoviny, T., Müller, M., Wisthaler, A., Graus, M., Warneke, C., and de Gouw, J.: Emissions of C6–C8 aromatic compounds in the United States: Constraints from tall tower and aircraft measurements, J. Geophys. Res.-Atmos., 120, 826–842, https://doi.org/10.1002/2014JD022627, 2015a.
Hu, L., Millet, D. B., Baasandorj, M., Griffis, T. J., Turner, P., Helmig, D., Curtis, A. J., and Hueber, J.: Isoprene emissions and impacts over an ecological transition region in the U.S. Upper Midwest inferred from tall tower measurements, J. Geophys. Res.-Atmos., 120, 3553–3571, https://doi.org/10.1002/2014jd022732, 2015b.
Hu, W., Hu, M., Hu, W., Jimenez, J. L., Yuan, B., Chen, W., Wang, M., Wu, Y., Chen, C., Wang, Z., Peng, J., Zeng, L., and Shao, M.: Chemical composition, sources, and aging process of submicron aerosols in Beijing: Contrast between summer and winter, J. Geophys. Res.-Atmo., 121, 1955–1977, https://doi.org/10.1002/2015JD024020, 2016.
Huang, X., Ding, A., Gao, J., Zheng, B., Zhou, D., Qi, X., Tang, R., Wang, J., Ren, C., Nie, W., Chi, X., Xu, Z., Chen, L., Li, Y., Che, F., Pang, N., Wang, H., Tong, D., Qin, W., Cheng, W., Liu, W., Fu, Q., Liu, B., Chai, F., Davis, S. J., Zhang, Q., and He, K.: Enhanced secondary pollution offset reduction of primary emissions during COVID-19 lockdown in China, Natl. Sci. Rev., 8, nwaa137, https://doi.org/10.1093/nsr/nwaa137, 2020.
Huangfu, Y., Yuan, B., Wang, S., Wu, C., He, X., Qi, J., de Gouw, J., Warneke, C., Gilman, J. B., Wisthaler, A., Karl, T., Graus, M., Jobson, B. T., and Shao, M.: Revisiting Acetonitrile as Tracer of Biomass Burning in Anthropogenic-Influenced Environments, Geophys. Res. Lett., 48, e2020GL092322, https://doi.org/10.1029/2020GL092322, 2021.
Jin, X., Li, Z., Wu, T., Wang, Y., Cheng, Y., Su, T., Wei, J., Ren, R., Wu, H., Li, S., Zhang, D., and Cribb, M.: The different sensitivities of aerosol optical properties to particle concentration, humidity, and hygroscopicity between the surface level and the upper boundary layer in Guangzhou, China, Sci. Total Environ., 803, 150010, https://doi.org/10.1016/j.scitotenv.2021.150010, 2022.
Klein, F., Farren, N. J., Bozzetti, C., Daellenbach, K. R., Kilic, D., Kumar, N. K., Pieber, S. M., Slowik, J. G., Tuthill, R. N., Hamilton, J. F., Baltensperger, U., Prévôt, A. S. H., and El Haddad, I.: Indoor terpene emissions from cooking with herbs and pepper and their secondary organic aerosol production potential, Scient. Rep., 6, 36623, https://doi.org/10.1038/srep36623, 2016.
Koss, A., Yuan, B., Warneke, C., Gilman, J. B., Lerner, B. M., Veres, P. R., Peischl, J., Eilerman, S., Wild, R., Brown, S. S., Thompson, C. R., Ryerson, T., Hanisco, T., Wolfe, G. M., Clair, J. M. S., Thayer, M., Keutsch, F. N., Murphy, S., and de Gouw, J.: Observations of VOC emissions and photochemical products over US oil- and gas-producing regions using high-resolution H3O+ CIMS (PTR-ToF-MS), Atmos. Meas. Tech., 10, 2941–2968, https://doi.org/10.5194/amt-10-2941-2017, 2017.
Li, X.-B., Wang, D., Lu, Q.-C., Peng, Z.-R., Fu, Q., Hu, X.-M., Huo, J., Xiu, G., Li, B., Li, C., Wang, D.-S., and Wang, H.: Three-dimensional analysis of ozone and PM2.5 distributions obtained by observations of tethered balloon and unmanned aerial vehicle in Shanghai, China, Stoch. Environ. Res. Risk A., 32, 1189–1203, https://doi.org/10.1007/s00477-018-1524-2, 2018.
Li, X.-B., Fan, G., Lou, S., Yuan, B., Wang, X., and Shao, M.: Transport and boundary layer interaction contribution to extremely high surface ozone levels in eastern China, Environ. Pollut., 268, 115804, https://doi.org/10.1016/j.envpol.2020.115804, 2021a.
Li, X.-B., Peng, Z.-R., Wang, D., Li, B., Huangfu, Y., Fan, G., Wang, H., and Lou, S.: Vertical distributions of boundary-layer ozone and fine aerosol particles during the emission control period of the G20 summit in Shanghai, China, Atmos. Pollut. Res., 12, 352–364, https://doi.org/10.1016/j.apr.2020.09.016, 2021b.
Li, X.-B., Yuan, B., Parrish, D. D., Chen, D., Song, Y., Yang, S., Liu, Z., and Shao, M.: Long-term trend of ozone in southern China reveals future mitigation strategy for air pollution, Atmos. Environ., 269, 118869, https://doi.org/10.1016/j.atmosenv.2021.118869, 2022.
Liebmann, J., Sobanski, N., Schuladen, J., Karu, E., Hellén, H., Hakola, H., Zha, Q., Ehn, M., Riva, M., Heikkinen, L., Williams, J., Fischer, H., Lelieveld, J., and Crowley, J. N.: Alkyl nitrates in the boreal forest: formation via the , OH− and O3-induced oxidation of biogenic volatile organic compounds and ambient lifetimes, Atmos. Chem. Phys., 19, 10391–10403, https://doi.org/10.5194/acp-19-10391-2019, 2019.
Liu, B., Liang, D., Yang, J., Dai, Q., Bi, X., Feng, Y., Yuan, J., Xiao, Z., Zhang, Y., and Xu, H.: Characterization and source apportionment of volatile organic compounds based on 1-year of observational data in Tianjin, China, Environ. Pollut., 218, 757–769, https://doi.org/10.1016/j.envpol.2016.07.072, 2016.
Liu, X., Deming, B., Pagonis, D., Day, D. A., Palm, B. B., Talukdar, R., Roberts, J. M., Veres, P. R., Krechmer, J. E., Thornton, J. A., de Gouw, J. A., Ziemann, P. J., and Jimenez, J. L.: Effects of gas–wall interactions on measurements of semivolatile compounds and small polar molecules, Atmos. Meas. Tech., 12, 3137–3149, https://doi.org/10.5194/amt-12-3137-2019, 2019.
Liu, Y., Wang, H., Jing, S., Zhou, M., Lou, S., Qu, K., Qiu, W., Wang, Q., Li, S., Gao, Y., Liu, Y., Li, X., Peng, Z.-R., Chen, J., and Lu, K.: Vertical Profiles of Volatile Organic Compounds in Suburban Shanghai, Adv. Atmos. Sci., 38, 1177–1187, https://doi.org/10.1007/s00376-021-0126-y, 2021.
Ma, Z., Zhang, X., Xu, J., Zhao, X., and Meng, W.: Characteristics of ozone vertical profile observed in the boundary layer around Beijing in autumn, J. Environ. Sci., 23, 1316–1324, https://doi.org/10.1016/s1001-0742(10)60557-8, 2011.
McDonald, B. C., de Gouw, J. A., Gilman, J. B., Jathar, S. H., Akherati, A., Cappa, C. D., Jimenez, J. L., Lee-Taylor, J., Hayes, P. L., McKeen, S. A., Cui, Y. Y., Kim, S.-W., Gentner, D. R., Isaacman-VanWertz, G., Goldstein, A. H., Harley, R. A., Frost, G. J., Roberts, J. M., Ryerson, T. B., and Trainer, M.: Volatile chemical products emerging as largest petrochemical source of urban organic emissions, Science, 359, 760–764, https://doi.org/10.1126/science.aaq0524, 2018.
Millet, D. B., Apel, E., Henze, D. K., Hill, J., Marshall, J. D., Singh, H. B., and Tessum, C. W.: Natural and Anthropogenic Ethanol Sources in North America and Potential Atmospheric Impacts of Ethanol Fuel Use, Environ. Sci. Technol., 46, 8484–8492, https://doi.org/10.1021/es300162u, 2012.
Millet, D. B., Baasandorj, M., Hu, L., Mitroo, D., Turner, J., and Williams, B. J.: Nighttime Chemistry and Morning Isoprene Can Drive Urban Ozone Downwind of a Major Deciduous Forest, Environ. Sci. Technol., 50, 4335–4342, https://doi.org/10.1021/acs.est.5b06367, 2016.
Mo, Z., Shao, M., and Lu, S.: Compilation of a source profile database for hydrocarbon and OVOC emissions in China, Atmos. Environ., 143, 209–217, https://doi.org/10.1016/j.atmosenv.2016.08.025, 2016.
Mo, Z., Huang, S., Yuan, B., Pei, C., Song, Q., Qi, J., Wang, M., Wang, B., Wang, C., Li, M., Zhang, Q., and Shao, M.: Deriving emission fluxes of volatile organic compounds from tower observation in the Pearl River Delta, China, Sci. Total Environ., 741, 139763, https://doi.org/10.1016/j.scitotenv.2020.139763, 2020.
Müller, M., Anderson, B. E., Beyersdorf, A. J., Crawford, J. H., Diskin, G. S., Eichler, P., Fried, A., Keutsch, F. N., Mikoviny, T., Thornhill, K. L., Walega, J. G., Weinheimer, A. J., Yang, M., Yokelson, R. J., and Wisthaler, A.: In situ measurements and modeling of reactive trace gases in a small biomass burning plume, Atmos. Chem. Phys., 16, 3813–3824, https://doi.org/10.5194/acp-16-3813-2016, 2016.
Ng, N. L., Brown, S. S., Archibald, A. T., Atlas, E., Cohen, R. C., Crowley, J. N., Day, D. A., Donahue, N. M., Fry, J. L., Fuchs, H., Griffin, R. J., Guzman, M. I., Herrmann, H., Hodzic, A., Iinuma, Y., Jimenez, J. L., Kiendler-Scharr, A., Lee, B. H., Luecken, D. J., Mao, J. Q., McLaren, R., Mutzel, A., Osthoff, H. D., Ouyang, B., Picquet-Varrault, B., Platt, U., Pye, H. O. T., Rudich, Y., Schwantes, R. H., Shiraiwa, M., Stutz, J., Thornton, J. A., Tilgner, A., Williams, B. J., and Zaveri, R. A.: Nitrate radicals and biogenic volatile organic compounds: oxidation, mechanisms, and organic aerosol, Atmos. Chem. Phys., 17, 2103–2162, https://doi.org/10.5194/acp-17-2103-2017, 2017.
Pallavi, Sinha, B., and Sinha, V.: Source apportionment of volatile organic compounds in the northwest Indo-Gangetic Plain using a positive matrix factorization model, Atmos. Chem. Phys., 19, 15467–15482, https://doi.org/10.5194/acp-19-15467-2019, 2019.
Pernov, J. B., Bossi, R., Lebourgeois, T., Nøjgaard, J. K., Holzinger, R., Hjorth, J. L., and Skov, H.: Atmospheric VOC measurements at a High Arctic site: characteristics and source apportionment, Atmos. Chem. Phys., 21, 2895–2916, https://doi.org/10.5194/acp-21-2895-2021, 2021.
Qi, J., Mo, Z., Yuan, B., Huang, S., Huangfu, Y., Wang, Z., Li, X., Yang, S., Wang, W., Zhao, Y., Wang, X., Wang, W., Liu, K., and Shao, M.: An observation approach in evaluation of ozone production to precursor changes during the COVID-19 lockdown, Atmos. Environ., 262, 118618, https://doi.org/10.1016/j.atmosenv.2021.118618, 2021.
Qin, J., Wang, X., Yang, Y., Qin, Y., Shi, S., Xu, P., Chen, R., Zhou, X., Tan, J., and Wang, X.: Source apportionment of VOCs in a typical medium-sized city in North China Plain and implications on control policy, J. Environ. Sci., 107, 26–37, https://doi.org/10.1016/j.jes.2020.10.005, 2021.
Sangiorgi, G., Ferrero, L., Perrone, M. G., Bolzacchini, E., Duane, M., and Larsen, B. R.: Vertical distribution of hydrocarbons in the low troposphere below and above the mixing height: Tethered balloon measurements in Milan, Italy, Environ. Pollut., 159, 3545–3552, https://doi.org/10.1016/j.envpol.2011.08.012, 2011.
Squires, F. A., Nemitz, E., Langford, B., Wild, O., Drysdale, W. S., Acton, W. J. F., Fu, P., Grimmond, C. S. B., Hamilton, J. F., Hewitt, C. N., Hollaway, M., Kotthaus, S., Lee, J., Metzger, S., Pingintha-Durden, N., Shaw, M., Vaughan, A. R., Wang, X., Wu, R., Zhang, Q., and Zhang, Y.: Measurements of traffic-dominated pollutant emissions in a Chinese megacity, Atmos. Chem. Phys., 20, 8737–8761, https://doi.org/10.5194/acp-20-8737-2020, 2020.
Stutz, J., Alicke, B., Ackermann, R., Geyer, A., White, A., and Williams, E.: Vertical profiles of NO3, N2O5, O3, and NOx in the nocturnal boundary layer: 1. Observations during the Texas Air Quality Study 2000, J. Geophys. Res.-Atmos., 109, D12306, https://doi.org/10.1029/2003jd004209, 2004.
Tan, Y., Han, S., Chen, Y., Zhang, Z., Li, H., Li, W., Yuan, Q., Li, X., Wang, T., and Lee, S.-c.: Characteristics and source apportionment of volatile organic compounds (VOCs) at a coastal site in Hong Kong, Sci. Total Environ., 777, 146241, https://doi.org/10.1016/j.scitotenv.2021.146241, 2021.
Ting, M., Yue-si, W., Jie, J., Fang-kun, W., and Mingxing, W.: The vertical distributions of VOCs in the atmosphere of Beijing in autumn, Sci. Total Environ., 390, 97-108, https://doi.org/10.1016/j.scitotenv.2007.08.035, 2008.
Udina, M., Soler, M. R., Olid, M., Jiménez-Esteve, B., and Bech, J.: Pollutant vertical mixing in the nocturnal boundary layer enhanced by density currents and low-level jets: two representative case studies, Bound.-Lay. Meteorol., 174, 203–230, https://doi.org/10.1007/s10546-019-00483-y, 2020.
Ulbrich, I. M., Canagaratna, M. R., Zhang, Q., Worsnop, D. R., and Jimenez, J. L.: Interpretation of organic components from Positive Matrix Factorization of aerosol mass spectrometric data, Atmos. Chem. Phys., 9, 2891–2918, https://doi.org/10.5194/acp-9-2891-2009, 2009.
Velasco, E., Marquez, C., Bueno, E., Bernabe, R. M., Sanchez, A., Fentanes, O., Wohrnschimmel, H., Cardenas, B., Kamilla, A., Wakamatsu, S., and Molina, L. T.: Vertical distribution of ozone and VOCs in the low boundary layer of Mexico City, Atmos. Chem. Phys., 8, 3061–3079, https://doi.org/10.5194/acp-8-3061-2008, 2008.
Veres, P. R., Faber, P., Drewnick, F., Lelieveld, J., and Williams, J.: Anthropogenic sources of VOC in a football stadium: Assessing human emissions in the atmosphere, Atmos. Environ., 77, 1052–1059, https://doi.org/10.1016/j.atmosenv.2013.05.076, 2013.
Vo, T.-D.-H., Lin, C., Weng, C.-E., Yuan, C.-S., Lee, C.-W., Hung, C.-H., Bui, X.-T., Lo, K.-C., and Lin, J.-X.: Vertical stratification of volatile organic compounds and their photochemical product formation potential in an industrial urban area, J. Environ. Manage., 217, 327–336, https://doi.org/10.1016/j.jenvman.2018.03.101, 2018.
Wang, C., Yuan, B., Wu, C., Wang, S., Qi, J., Wang, B., Wang, Z., Hu, W., Chen, W., Ye, C., Wang, W., Sun, Y., Wang, C., Huang, S., Song, W., Wang, X., Yang, S., Zhang, S., Xu, W., Ma, N., Zhang, Z., Jiang, B., Su, H., Cheng, Y., Wang, X., and Shao, M.: Measurements of higher alkanes using NO+ chemical ionization in PTR-ToF-MS: important contributions of higher alkanes to secondary organic aerosols in China, Atmos. Chem. Phys., 20, 14123–14138, https://doi.org/10.5194/acp-20-14123-2020, 2020.
Wang, T., Xue, L., Brimblecombe, P., Lam, Y. F., Li, L., and Zhang, L.: Ozone pollution in China: A review of concentrations, meteorological influences, chemical precursors, and effects, Sci. Total Environ., 575, 1582–1596, https://doi.org/10.1016/j.scitotenv.2016.10.081, 2017.
Wang, Y., Wang, Y., Tang, G., Yang, Y., Li, X., Yao, D., Wu, S., Kang, Y., Wang, M., and Wang, Y.: High gaseous carbonyl concentrations in the upper boundary layer in Shijiazhuang, China, Sci. Total Environ., 799, 149438, https://doi.org/10.1016/j.scitotenv.2021.149438, 2021.
Wang, Y. H., Gao, W. K., Wang, S., Song, T., Gong, Z. Y., Ji, D. S., Wang, L. L., Liu, Z. R., Tang, G. Q., Huo, Y. F., Tian, S. L., Li, J. Y., Li, M. G., Yang, Y., Chu, B. W., Petaja, T., Kerminen, V. M., He, H., Hao, J. M., Kulmala, M., Wang, Y. S., and Zhang, Y. H.: Contrasting trends of PM2.5 and surface-ozone concentrations in China from 2013 to 2017, Natl. Sci. Rev., 7, 1331–1339, https://doi.org/10.1093/nsr/nwaa032, 2020.
Wang, Z., Yuan, B., Ye, C., Roberts, J., Wisthaler, A., Lin, Y., Li, T., Wu, C., Peng, Y., Wang, C., Wang, S., Yang, S., Wang, B., Qi, J., Wang, C., Song, W., Hu, W., Wang, X., Xu, W., Ma, N., Kuang, Y., Tao, J., Zhang, Z., Su, H., Cheng, Y., Wang, X., and Shao, M.: High Concentrations of Atmospheric Isocyanic Acid (HNCO) Produced from Secondary Sources in China, Environ. Sci. Technol., 54, 11818–11826, https://doi.org/10.1021/acs.est.0c02843, 2020.
Warneke, C., de Gouw, J. A., Goldan, P. D., Kuster, W. C., Williams, E. J., Lerner, B. M., Jakoubek, R., Brown, S. S., Stark, H., Aldener, M., Ravishankara, A. R., Roberts, J. M., Marchewka, M., Bertman, S., Sueper, D. T., McKeen, S. A., Meagher, J. F., and Fehsenfeld, F. C.: Comparison of daytime and nighttime oxidation of biogenic and anthropogenic VOCs along the New England coast in summer during New England Air Quality Study 2002, J. Geophys. Res.-Atmos., 109, D10309, https://doi.org/10.1029/2003jd004424, 2004.
Wu, C., Wang, C., Wang, S., Wang, W., Yuan, B., Qi, J., Wang, B., Wang, H., Wang, C., Song, W., Wang, X., Hu, W., Lou, S., Ye, C., Peng, Y., Wang, Z., Huangfu, Y., Xie, Y., Zhu, M., Zheng, J., Wang, X., Jiang, B., Zhang, Z., and Shao, M.: Measurement report: Important contributions of oxygenated compounds to emissions and chemistry of volatile organic compounds in urban air, Atmos. Chem. Phys., 20, 14769–14785, https://doi.org/10.5194/acp-20-14769-2020, 2020.
Wu, F., Yu, Y., Sun, J., Zhang, J., Wang, J., Tang, G., and Wang, Y.: Characteristics, source apportionment and reactivity of ambient volatile organic compounds at Dinghu Mountain in Guangdong Province, China, Sci. Total Environ., 548–549, 347–359, https://doi.org/10.1016/j.scitotenv.2015.11.069, 2016.
Wu, S., Tang, G., Wang, Y., Yang, Y., Yao, D., Zhao, W., Gao, W., Sun, J., and Wang, Y.: Vertically decreased VOC concentration and reactivity in the planetary boundary layer in winter over the North China Plain, Atmos. Res., 240, 104930, https://doi.org/10.1016/j.atmosres.2020.104930, 2020.
Wu, S., Tang, G. Q., Wang, Y. H., Mai, R., Yao, D., Kang, Y. Y., Wang, Q. L., and Wang, Y. S.: Vertical Evolution of Boundary Layer Volatile Organic Compounds in Summer over the North China Plain and the Differences with Winter, Adv. Atmos. Sci., 38, 1165–1176, https://doi.org/10.1007/s00376-020-0254-9, 2021.
Xia, S.-Y., Wang, C., Zhu, B., Chen, X., Feng, N., Yu, G.-H., and Huang, X.-F.: Long-term observations of oxygenated volatile organic compounds (OVOCs) in an urban atmosphere in southern China, 2014–2019, Environ. Pollut., 270, 116301, https://doi.org/10.1016/j.envpol.2020.116301, 2021.
Xue, L., Wang, T., Simpson, I. J., Ding, A., Gao, J., Blake, D. R., Wang, X., Wang, W., Lei, H., and Jin, D.: Vertical distributions of non-methane hydrocarbons and halocarbons in the lower troposphere over northeast China, Atmos. Environ., 45, 6501–6509, https://doi.org/10.1016/j.atmosenv.2011.08.072, 2011.
Yan, F., Chen, W., Jia, S., Zhong, B., Yang, L., Mao, J., Chang, M., Shao, M., Yuan, B., Situ, S., Wang, X., Chen, D., and Wang, X.: Stabilization for the secondary species contribution to PM2.5 in the Pearl River Delta (PRD) over the past decade, China: A meta-analysis, Atmos. Environ., 242, 117817, https://doi.org/10.1016/j.atmosenv.2020.117817, 2020.
Ye, C., Yuan, B., Lin, Y., Wang, Z., Hu, W., Li, T., Chen, W., Wu, C., Wang, C., Huang, S., Qi, J., Wang, B., Wang, C., Song, W., Wang, X., Zheng, E., Krechmer, J. E., Ye, P., Zhang, Z., Wang, X., Worsnop, D. R., and Shao, M.: Chemical characterization of oxygenated organic compounds in the gas phase and particle phase using iodide CIMS with FIGAERO in urban air, Atmos. Chem. Phys., 21, 8455–8478, https://doi.org/10.5194/acp-21-8455-2021, 2021.
Yuan, B., Shao, M., de Gouw, J., Parrish, D. D., Lu, S., Wang, M., Zeng, L., Zhang, Q., Song, Y., Zhang, J., and Hu, M.: Volatile organic compounds (VOCs) in urban air: How chemistry affects the interpretation of positive matrix factorization (PMF) analysis, J. Geophys. Res.-Atmos., 117, D24302, https://doi.org/10.1029/2012jd018236, 2012.
Yuan, B., Koss, A., Warneke, C., Gilman, J. B., Lerner, B. M., Stark, H., and de Gouw, J. A.: A high-resolution time-of-flight chemical ionization mass spectrometer utilizing hydronium ions (H3O + ToF-CIMS) for measurements of volatile organic compounds in the atmosphere, Atmos. Meas. Tech., 9, 2735–2752, https://doi.org/10.5194/amt-9-2735-2016, 2016.
Yuan, B., Koss, A. R., Warneke, C., Coggon, M., Sekimoto, K., and de Gouw, J. A.: Proton-Transfer-Reaction Mass Spectrometry: Applications in Atmospheric Sciences, Chem. Rev., 117, 13187–13229, https://doi.org/10.1021/acs.chemrev.7b00325, 2017.
Yuan, Z., Zhong, L., Lau, A. K. H., Yu, J. Z., and Louie, P. K. K.: Volatile organic compounds in the Pearl River Delta: Identification of source regions and recommendations for emission-oriented monitoring strategies, Atmos. Environ., 76, 162–172, https://doi.org/10.1016/j.atmosenv.2012.11.034, 2013.
Zhang, H., Zhang, Y., Huang, Z., Acton, W. J. F., Wang, Z., Nemitz, E., Langford, B., Mullinger, N., Davison, B., Shi, Z., Liu, D., Song, W., Yang, W., Zeng, J., Wu, Z., Fu, P., Zhang, Q., and Wang, X.: Vertical profiles of biogenic volatile organic compounds as observed online at a tower in Beijing, J. Environ. Sci., 95, 33–42, https://doi.org/10.1016/j.jes.2020.03.032, 2020.
Zhang, K., Xiu, G., Zhou, L., Bian, Q., Duan, Y., Fei, D., Wang, D., and Fu, Q.: Vertical distribution of volatile organic compounds within the lower troposphere in late spring of Shanghai, Atmos. Environ., 186, 150–157, https://doi.org/10.1016/j.atmosenv.2018.03.044, 2018.
Zhang, K., Zhou, L., Fu, Q., Yan, L., Bian, Q., Wang, D., and Xiu, G.: Vertical distribution of ozone over Shanghai during late spring: A balloon-borne observation, Atmos. Environ., 208, 48–60, https://doi.org/10.1016/j.atmosenv.2019.03.011, 2019.
Zhang, Y., Wang, X., Barletta, B., Simpson, I. J., Blake, D. R., Fu, X., Zhang, Z., He, Q., Liu, T., Zhao, X., and Ding, X.: Source attributions of hazardous aromatic hydrocarbons in urban, suburban and rural areas in the Pearl River Delta (PRD) region, J. Hazard Mater., 250–251, 403–411, https://doi.org/10.1016/j.jhazmat.2013.02.023, 2013.
Zhao, D., Pullinen, I., Fuchs, H., Schrade, S., Wu, R., Acir, I. H., Tillmann, R., Rohrer, F., Wildt, J., Guo, Y., Kiendler-Scharr, A., Wahner, A., Kang, S., Vereecken, L., and Mentel, T. F.: Highly oxygenated organic molecule (HOM) formation in the isoprene oxidation by NO3 radical, Atmos. Chem. Phys., 21, 9681–9704, https://doi.org/10.5194/acp-21-9681-2021, 2021.
Zheng, J., Yu, Y., Mo, Z., Zhang, Z., Wang, X., Yin, S., Peng, K., Yang, Y., Feng, X., and Cai, H.: Industrial sector-based volatile organic compound (VOC) source profiles measured in manufacturing facilities in the Pearl River Delta, China, Sci. Total Environ., 456–457, 127–136, doi10.1016/j.scitotenv.2013.03.055, 2013.
Zhou, X., Li, Z., Zhang, T., Wang, F., Wang, F., Tao, Y., Zhang, X., Wang, F., and Huang, J.: Volatile organic compounds in a typical petrochemical industrialized valley city of northwest China based on high-resolution PTR-MS measurements: Characterization, sources and chemical effects, Sci. Total Environ., 671, 883–896, https://doi.org/10.1016/j.scitotenv.2019.03.283, 2019.
Zhu, B., Han, Y., Wang, C., Huang, X., Xia, S., Niu, Y., Yin, Z., and He, L.: Understanding primary and secondary sources of ambient oxygenated volatile organic compounds in Shenzhen utilizing photochemical age-based parameterization method, J. Environ. Sci., 75, 105–114, https://doi.org/10.1016/j.jes.2018.03.008, 2019.