the Creative Commons Attribution 4.0 License.
the Creative Commons Attribution 4.0 License.
 | 29 Jun 2021
Disparities in particulate matter (PM10) origins and oxidative potential at a city scale (Grenoble, France) – Part 2: Sources of PM10 oxidative potential using multiple linear regression analysis and the predictive applicability of multilayer perceptron neural network analysis
Lucille Joanna S. Borlaza
Samuël Weber
Jean-Luc Jaffrezo
Stephan Houdier
Rémy Slama
Camille Rieux
Alexandre Albinet
Steve Micallef
Cécile Trébluchon
The oxidative potential (OP) of particulate matter (PM) measures PM capability to potentially cause anti-oxidant imbalance. Due to the wide range and complex mixture of species in particulates, little is known about the pollution sources most strongly contributing to OP. A 1-year sampling of PM10 (particles with an aerodynamic diameter below 10) was performed over different sites in a medium-sized city (Grenoble, France). An enhanced fine-scale apportionment of PM10 sources, based on the chemical composition, was performed using the positive matrix factorization (PMF) method and reported in a companion paper (Borlaza et al., 2020). OP was assessed as the ability of PM10 to generate reactive oxygen species (ROS) using three different acellular assays: dithiothreitol (DTT), ascorbic acid (AA), and 2,7-dichlorofluorescein (DCFH) assays. Using multiple linear regression (MLR), the OP contributions of the sources identified by PMF were estimated. Conversely, since atmospheric processes are usually non-linear in nature, artificial neural network (ANN) techniques, which employ non-linear models, could further improve estimates. Hence, the multilayer perceptron analysis (MLP), an ANN-based model, was additionally used to model OP based on PMF-resolved sources as well. This study presents the spatiotemporal variabilities of OP activity with influences by season-specific sources, site typology and specific local features, and assay sensitivity. Overall, both MLR and MLP effectively captured the evolution of OP. The primary traffic and biomass burning sources were the strongest drivers of OP in the Grenoble basin. There is also a clear redistribution of source-specific impacts when using OP instead of mass concentration, underlining the importance of PM redox activity for the identification of potential sources of PM toxicity. Finally, the MLP generally offered improvements in OP prediction, especially for sites where synergistic and/or antagonistic effects between sources are prominent, supporting the value of using ANN-based models to account for the non-linear dynamics behind the atmospheric processes affecting OP of PM10.
- Article
(1901 KB) - Full-text XML
- Companion paper
-
Supplement
(1361 KB) - BibTeX
- EndNote


One of the most critical pollutants in the atmosphere is particulate matter (PM), especially in urban areas that are heavily impacted by anthropogenic emissions (David et al., 2019; Qiao et al., 2018; Schwela, 2000). Recent studies showed increasing interest in PM at a city level, allowing assessment of fine-scale pollution variability (Boppana et al., 2019; Dionisio et al., 2010; Etyemezian et al., 2005; Krasnov et al., 2016; Padhi and Padhy, 2008). The intricate topography and seasonality of particulate air pollution in the city of Grenoble (France) make it an ideal location to explore variabilities of PM pollution while also accounting for different site typologies within a single medium-sized city (Calas et al., 2019; Favez et al., 2010; Srivastava et al., 2018; Tomaz et al., 2016, 2017; Weber et al., 2019). Such small-scale variabilities for mass and chemical composition have been recently addressed in a companion paper (Borlaza et al., 2021).
Many research studies have focused on the links between PM mass exposure and various adverse health effects (Dabass et al., 2018; Delfino et al., 2005; Du et al., 2016; Hime et al., 2018; Lao et al., 2019; Matus C. and Oyarzún G., 2019; Pope et al., 2009; Pope, 2002; Winterbottom et al., 2018). However, it is also of high concern to improve the understanding of the PM sources in relation to such health impacts. Indeed, oxidative stress is now well recognized as one of the main biological mechanisms considered to be contributing to these detrimental impacts from air pollution exposure through the capability of PM to generate reactive oxygen species (ROS) within the lung, which leads to pro-inflammatory responses that can ultimately result in apoptosis (Ayres et al., 2008; Baulig et al., 2003; Dhalla et al., 2000; Donaldson et al., 2001; Jin et al., 2018; Kelly, 2003; Leni et al., 2020; Mudway et al., 2020; Nel, 2005; Piao et al., 2018). The oxidative potential (OP) of PM, defined as the capability of PM to generate ROS/deplete anti-oxidants, makes an interesting complement to regulated metrics of ambient PM exposure (Bates et al., 2019; Daellenbach et al., 2020; Guo et al., 2020; Gurgueira et al., 2002; Park et al., 2018; Shiraiwa et al., 2017; Valavanidis et al., 2008).
Most studies often correlate OP from PM with chemical species in ambient aerosols (Bell and HEI Health Review Committee, 2012; Boogaard et al., 2012; Borlaza et al., 2018; Cassee et al., 2013; Janssen et al., 2014; Perrone et al., 2016; Pietrogrande et al., 2018; Rohr and Wyzga, 2012; Yang et al., 2015). However, due to the wide range and complex mixture of PM and the dynamic atmospheric processes to consider, the main drivers of OP can be difficult to highlight (Calas et al., 2019). Several methods have been used to assign the sources of OP, including the application of receptor modelling techniques such as positive matrix factorization (PMF) and chemical mass balance (CMB) (Ayres et al., 2008; Bates et al., 2015; Cesari et al., 2019; Fang et al., 2016; Paraskevopoulou et al., 2019; Verma et al., 2014; Weber et al., 2018, 2021; Yu et al., 2019; Zhou et al., 2019), principal component analysis (PCA) (Borlaza et al., 2018; Conte et al., 2017), and robotic chemical mass balance (RCMB) coupled with multiple linear regression (MLR) analysis (Argyropoulos et al., 2016). With these current techniques, the OP of PM has been linked to specific emission sources and their estimated contributions. However, a non-linear relationship of redox-active components of PM is generally observed (Arangio et al., 2016; Calas et al., 2017; Charrier and Anastasio, 2015; Li et al., 2012; Xiong et al., 2017; Yu et al., 2018), and hence traditional deterministic models could be, in some way, limited.
Approaches using artificial neural network (ANN) analysis have demonstrated enhanced results compared to classical models when predicting PM from different variables such as meteorological data (Abderrahim et al., 2016; Chaloulakou et al., 2003; Díaz-Robles et al., 2008; Hooyberghs et al., 2005; Huang and Kuo, 2018; McKendry, 2002; Papanastasiou et al., 2007; Perez and Reyes, 2006), satellite-derived aerosol products (Gupta and Christopher, 2009), and other traffic-related variables (Cabaneros et al., 2020, 2017; Gietl and Klemm, 2009; He et al., 2015). The ANN-based models, such as multilayer perceptron (MLP), support pattern recognition and could extract trends from non-linear data, making it an interesting and competitive innovative method of analysis in many scientific disciplines, including air quality studies (Cabaneros et al., 2019; Chattopadhyay and Bandyopadhyay, 2007; Dorling et al., 2003; García Nieto et al., 2018; Gupta and Christopher, 2009; Jiang et al., 2004; Ordieres et al., 2005; Perez and Reyes, 2006). Since atmospheric processes are generally non-linear in nature, exploring the features of MLP could provide meaningful results closer to realistic estimates than most linear models (Elangasinghe et al., 2014; Eldakhly et al., 2017; Gerken et al., 2006; Kukkonen, 2003; Nathan et al., 2017; Rahimi, 2017).
This study takes advantage of the enhanced source apportionment obtained in the companion paper (Borlaza et al., 2021), revealing the fine-scale spatiotemporal characteristics of PM sources within a medium-size city area (Grenoble basin), specifically in three different urban environments (background, hyper-centre, and peri-urban typologies). Here, the main drivers of OP are first attributed to PM sources (resolved by PMF) using a classical MLR analysis. Second, the possible advantages of MLP analysis are also evaluated to compare MLP prediction of OP activity with MLR prediction. In summary, by taking the opportunity of this unique database on PM chemistry and OP, we aim to investigate mainly two innovative questions.
-
Is there variability in the OP activity within a medium-sized urban area, and can this be related to the variability of the contributions of the emission sources?
-
Can MLP be used to accurately model the spatiotemporal evolution of OP by taking the PM source contributions as input variables and, if so, does it catch the non-linear pattern of OP?
2.1 Site description and PM10 sampling collection
The sampling sites and samples used in this study are described in detail in the companion paper (Borlaza et al., 2021). Briefly, the sampling sites are located in the city of Grenoble in the south-east of France, as illustrated in Fig. 1. The mountainous environment in the area restricts atmospheric movements and promotes the development of atmospheric thermal inversions, resulting in an increase in pollutant concentrations, especially during the winter season (Bessagnet et al., 2020; Tomaz et al., 2017). The three measurement sites are located in an urban background (UB, Les Frênes), urban hyper-centre (UH, Caserne de Bonne), and peri-urban (PU, Vif), all within 15 km from the city centre of Grenoble. The UB site is an established urban background reference site for the regional air quality monitoring network (Atmo Auvergne Rhône-Alpes) in the south of the city and largely investigated previously (Srivastava et al., 2018; Tomaz et al., 2016). The PU site is in a suburban area with rural residential areas adjacent to an urbanization (low-density area), where biogenic emissions are prominently expected as the site is at the foot of the Vercors and Belledone mountain ranges. Lastly, the UH site is in the hyper-centre of Grenoble and, despite being in a pedestrian area, is the most highly exposed to surrounding commercial and traffic emissions amongst the three sites.
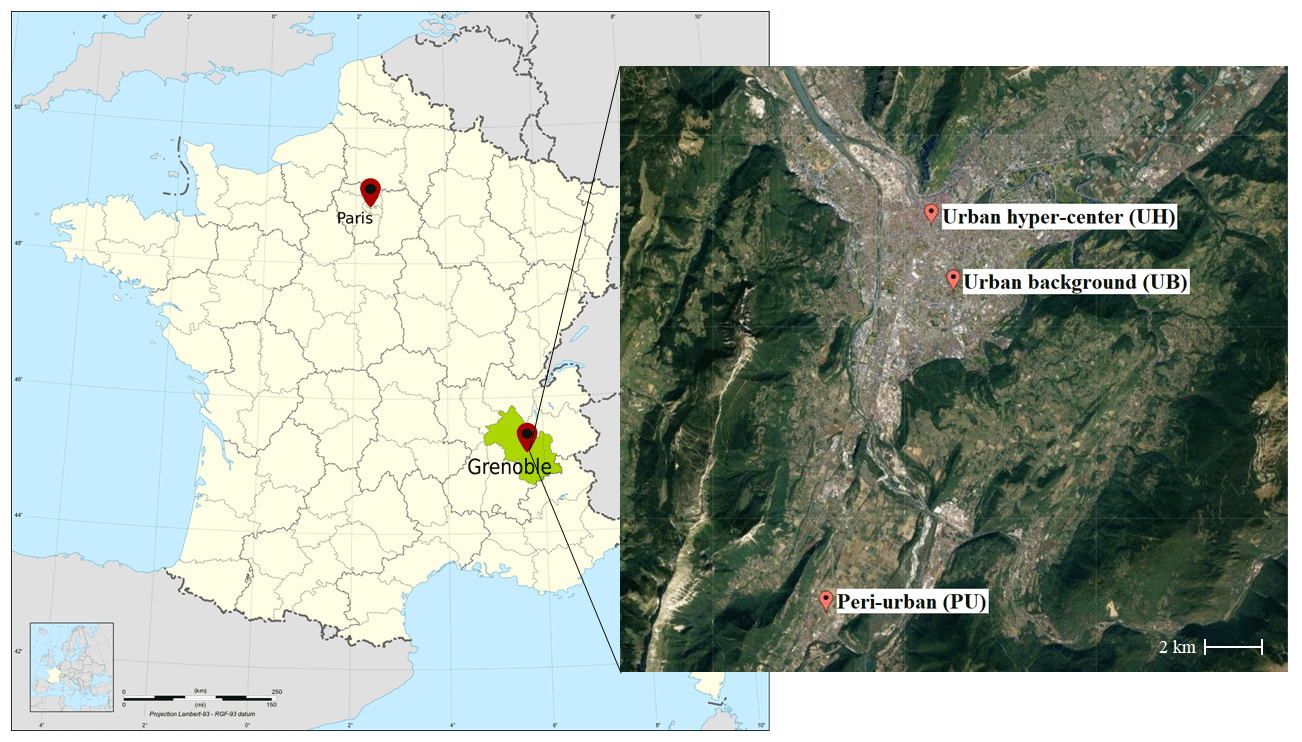
Figure 1Study area in Grenoble (France) on a European map (left) and location of the three urban sites (right), namely Les Frênes or UB (urban reference background site), Caserne de Bonne or UH (urban hyper-centre site), and Vif or PU (peri-urban site). © OpenStreetMap contributors 2020. Distributed under the Open Data Commons Open Database License (ODbL) v1.0.
The daily (24 h) filter-based PM10 (particles ≤10 µm in diameter) sampling was performed with a 3 d interval for about 1 year (28 February 2017 to 10 March 2018; sampling starts at 00:00 CEST) obtaining a total of about 130 samples per site. PM10 was collected using a high-volume sampler (Digitel DA-80, 30 m3 h−1) onto 150 mm diameter quartz fibre filters (Tissu-quartz PALL QAT-UP 2500 diameter 150 mm) following the recommendations of EN 12341:2014 procedures (CEN, 2014). All filters underwent a preheating treatment at 500 ∘C for 12 h to avoid any organic contamination. Additionally, field blank filters (n=20) were collected to determine the detection limits of the applied chemical analysis and to secure quality of samples during transport, setup, and recovery. The total PM10 mass concentration was also simultaneously measured using a tapered element oscillating microbalance equipped with filter dynamics measurement systems (TEOM-FDMS) (CEN, 2017; Grover, 2005).
2.2 Chemical characterization
All samples were subjected to several chemical analyses to quantify major and minor constituents of PM10, including organic carbon (OC), elemental carbon (EC), ions (sodium, Na+; ammonium, ; potassium, K+, magnesium, Mg2+; calcium, Ca2+; chloride, Cl−; nitrate, ; sulfate, ), methane sulfonic acid (MSA), organic acids (3-MBTCA, pinic acid, phthalic acid), anhydro-sugars (levoglucosan and mannosan) and primary saccharides (arabitol and mannitol, hereafter summed up and referred to as polyols), cellulose, and elements (Al, As, Ba, Cd, Cr, Cu, Fe, Mn, Mo, Ni, Pb, Rb, Sb, Se, Sn, Ti, V, Zn). Detailed descriptions of the chemical analyses are available in the companion paper (Borlaza et al., 2021), and a summary of PM10 characteristics is available in Table S1 in the Supplement.
2.3 OP analysis
For OP analysis, the filters were subjected to PM10 extraction using a simulated lung fluid (SLF) solution composed of a Gamble+DPPC (dipalmitoylphosphatidylcholine) mixture (Calas et al., 2018). In order to maintain a constant amount of extracted PM10, filter punches were adjusted by area to obtain iso-mass at 25 µg mL−1. No filtration was done in order to include both water-soluble and insoluble particles. Such an extraction method has been adopted to facilitate the extraction of PM10 in conditions closer to lung physiology (Calas et al., 2017). To avoid the interferences in the wells by insoluble particles, we subtracted the intrinsic absorbance of all PM extractions before adding the reactants. This procedure has been tested on both soluble and insoluble compounds that are likely within the range of atmospheric concentrations. The results have confirmed good dispersion of particles, leading to homogeneous results. A more detailed report is available in Calas et al. (2018).
For positive control tests, the 1,4-naphthoquinone (1,4-NQ) was used for both DTT and AA assays. Particularly, a 40 µL of 24.7 µM stock solution was used for DTT assay and 80 µL of 24.7 µM 1,4-NQ solution for AA assay (Calas et al., 2017, 2018). A 100 nM H2O2 was used for DCFH assay. The measurement quality was estimated by calculating the coefficient of variation (CV) of the positive controls; all CVs were <3 % for the three assays. Additionally, an ambient filter collected from the lab roof, with a known and constant expected OP value, was analysed to ensure precision of OP measurements.
The OP activity can be represented using two different measures: (1) the mass-normalized OP activity (OPm), where OP is normalized by the mass of PM10 (µg), and (2) the volume-normalized OP activity (OPv), where OP is normalized by the sampled air volume (m3). The OPm is the intrinsic OP property of 1 µg of PM, while OPv represents the PM-derived OP per m3 of air. Three acellular complementary assays were used to perform OP measurements and are briefly described in the following sections. All samples were subjected to triplicate analysis, and each sample results in the mean of such a triplicate. The common CV is between 0 % and 10 % for each assay.
2.3.1 Dithiothreitol (DTT) assay
DTT is considered a chemical surrogate to cellular reducing agents, nicotinamide adenine dinucleotide (NADH) and nicotinamide adenine dinucleotide phosphate oxidase (NADPH) to mimic in vivo interactions of PM and biological oxidants. The consumption of DTT in the assay is inferred as a measure of the ability of the PM to transfer electrons from DTT to oxygen, thereby producing reactive oxygen species (ROS). Our procedure is based on a modified protocol by Cho et al. (2005), as described in Calas et al. (2018). The PM10 extracts were reacted with DTT, resulting in the consumption of DTT in the solution. The remaining DTT is then titrated with 5,5-dithiobis-(2-nitrobenzoic acid) (DTNB) to produce a yellow chromophore (5-mercapto-2-nitrobenzoic acid or TNB), which is in direct proportion to the amount of reduced DTT remaining in solution after the reaction with the PM10 extract. These mixtures were injected in a 96-well plate (CELLSTAR, Greiner-Bio), and the consumption of DTT (nmol min−1) was determined by following the TNB absorbance at 412 nm wavelength using a microplate reader (TECAN spectrophotometer Infinite M200 Pro) at 10 min intervals for a total of 30 min of analysis time.
2.3.2 Ascorbic acid (AA) assay
The AA assay is based on a modified procedure by Kelly and Mudway (2003), as described in Calas et al. (2018), using a respiratory tract lining fluid (RTFL). This assay uses AA, a known antioxidant which prevents the oxidation of lipids and proteins in the lung lining fluid (Valko et al., 2005). The consumption of AA (nmol min−1) in the assay is inferred as the OP of PM10 quantified by the transfer of electrons from AA to oxygen (O2). Similar to the DTT assay, the PM10 extracts were reacted with AA into a 96-well plate UV-transparent (CELLSTAR, Greiner-Bio). The absorbance was measured at 265 nm using a plate reader (TECAN spectrophotometer Infinite M200 Pro) at 4 min intervals for a total of 30 min of analysis time.
2.3.3 Dichloro-dihydro-fluorescein diacetate (DCFH) assay
The 2,7-dichlorofluorescin (DCFH) assay is commonly used for detecting intracellular H2O2 and oxidative stress using a non-fluorescent probe through the formation of a fluorescent product (dichlorofluorescein or DCF) in the presence of ROS and horseradish peroxidase (HRP). The DCF is measured by fluorescence at the excitation and emission wavelengths of 485 and 530 nm, respectively, every 2 min for a total of 30 min of analysis time. The ROS concentration in the sample is calculated in terms of H2O2 equivalent based on a H2O2 calibration (100, 200, 300, 400, 500, 1000, and 2000 nmol).
2.4 Data analysis
2.4.1 Synthesis of the methodology used for PM10 source apportionment
The source apportionment performed on this dataset has been described in detail in the companion paper (Borlaza et al., 2021). In brief, the PMF methodology used the EPA PMF5.0 software (US EPA, Norris et al., 2014) and closely follows the parameterization used in previous works by our group (Favez et al., 2017; Waked et al., 2014; Weber et al., 2019, 2021) with a few relevant modifications.
The input variables used were mass concentration and uncertainty levels of PM10 and its chemical composition (a total of 35 variables) including OC, EC, ions, elements, and some organic markers (MSA, levoglucosan, mannosan, polyols, pinic acid, 3-MBTCA, phthalic acid, and cellulose). The associated uncertainties were calculated based on a method proposed by Gianini et al. (2012). Specific geochemical constraints, based on expert prior knowledge, were added to the solution using the ME-2 solver (Paatero, 1999), particularly for the traffic source factor (Charron et al., 2019). The statistical validity of the solution and the uncertainties were estimated using the bootstrap and displacement methods following the European recommendation for source apportionment studies (Belis et al., 2019; Brown et al., 2015). The specific tracers used to identify the sources are presented in Table S2.
2.4.2 Multiple linear regression (MLR) analysis
A MLR analysis was performed to attribute OP from the PMF-resolved sources of PM10, following the OP deconvolution methodology proposed by Weber et al. (2018). The OPv from the three assays were used individually as the dependent variable, while the PMF-resolved source contributions were used as independent variables, as shown in Eq. (1):
where OPobs is the observed daily OPv matrix of size d×1 in , G is the contribution of the sources from the PMF in µg m−3 of size d×n, and β is the regression coefficient representing the intrinsic OP (or the OPm) of size 1×n in nmol min−1 µg−1. Finally, ε is the residual term accounting for the difference between the observed and modelled OP of size d×1 in . The OP contribution of each source is calculated by multiplying the source-specific regression coefficient by the contribution of the source to PM10 (Gk×βk).
2.4.3 Multilayer perceptron (MLP) neural network analysis
Background of the MLP analysis
The MLP analysis is designed using a feed-forward learning model (Calcagno et al., 2010; García Nieto et al., 2018; Salazar-Ruiz et al., 2008) that produces a predictive model for one or more output variables (OPv) based on the values of the input variables (PM10 source contributions). The three main components of MLP are (1) the input layer, (2) the hidden layer, and (3) the output layer. Generally, the MLP consists of interconnected layers of artificial neurons that form a network using a set of input data and draws it onto a set of output data, which are then used to further train the neural network through a back-propagation process (Bishop, 1995; Fontes et al., 2014; Kim and Gilley, 2008). In this study, the neural network architecture was limited to a one hidden layer design to demonstrate the applicability of non-linear models, even only with a rudimentary architecture, and to compare its predictive capability against that of MLR.
Implementation of the MLP
As an initial step, a rescaling process is applied to both the input and output layers to eliminate potential bias due to the range of variance within the dataset (Gardner and Dorling, 1998). Each variable is standardized by subtracting the mean observed value and then divided by the standard deviation. The daily contributions of the PM sources obtained from the PMF were fed in the input layer to the hidden layer. The MLP analysis was performed for each site using the OPv from each assay (, , and ) as multiple variables in the output layer (see Fig. 2), making a set of nine independent studies. At each node (or neuron), the information given by the input neurons is condensed into a unique value and propagated to the next layer. For instance, the MLP described in Fig. 2 is formally defined by Eq. (2) for the first layer (hidden layer):
with the weight of the neuron between the input and hidden layer and an activation constant for neuron j. The activation function H is often non-linear.
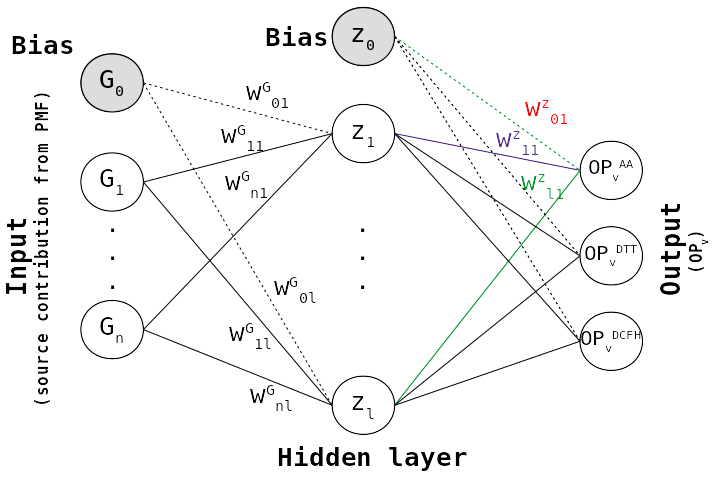
Figure 2The MLP neural network architecture used in this study, where n refers to the number of sources, G is the normalized contribution from the PMF, and OPv is the different volume-normalized OP activities (, , and ).
To sum up, the hidden layer develops the input data and deciphers the relationship of the neurons within the MLP network. The number of neurons in the hidden layer was determined automatically by the estimation algorithm. With the activation function, the hidden layer transfers a response onto the output layer. The activation functions tested in this study were sigmoid and hyperbolic tangent (TanH) as these are appropriate for continuous dependent variables (IBM, 2016). A weight initialization was preset for potential occurrence of vanishing gradients (Bengio et al., 1994; Hochreiter, 1998; Hochreiter and Schmidhuber, 1997). The scaled conjugate and stochastic gradient descent optimization algorithms were tested to obtain the optimal weights in both the input and output layers (Slini et al., 2006; Vakili et al., 2015). The various MLP architectures tested are summarized in Sect. S3 in the Supplement.
The dataset was partitioned into (1) the training set accounting for 80 % and (2) the testing set accounting for 20 % of the dataset. For each of the nine studies, the training set contains data points that were used to train the MLP, while the testing set is an independent set of data points used to monitor errors during the training step. During the training step, the MLP is continually developed and refined until the weighting values between the nodes accurately predict the outcome (i.e. minimal possible errors). To prevent the model from over-fitting, a set of stopping rules is applied to terminate the training of the MLP when any of these scenarios occur, such as (1) there being no decrease in prediction error for more than one step, (2) the maximum training time being reached (15 min), (3) the minimum relative change in the training error being reached (0.0001), and (4) the minimum relative change in the training error ratio being reached (0.001). A maximum of 1000 data passes (epochs) are stored in memory until this step is completed. Using the results obtained in the training step, the results are validated in the testing step to check the performance of the network by assessing its forecasting capability on data points outside the training set. The MLP neural network analysis was performed using IBM SPSS Statistics for Windows, version 20 (IBM Corp., Armonk, NY, USA).
Demonstration of the non-linear behaviour of sources using the MLP models
Since MLP analysis should account for the interactions between PM10 sources, the non-linear atmospheric dynamics causing possible synergistic or antagonistic effects on the OP activity can be captured. To visualize such possible non-linear behaviour, the MLP models obtained were applied on a set of dummy datasets. Each dummy dataset consists of the same mass contributions (from PMF analysis) of each source (in µg m−3) as in the original dataset but setting one source (n) to zero.
This modelled OP using a dummy dataset (MLPn) is subtracted to the modelled OP by the original MLP model (MLP) (containing all source contributions). This difference represents a source-specific OP contribution, and their summation (MLPsum) is described in Eq. (3):
For example, if the biomass burning source contribution was set to zero in the dummy dataset (MLPn=biomass burning), then () represents the MLP-modelled OP contribution of the biomass burning source. Assuming there are completely no synergistic or antagonistic effects between PM10 sources, then the original MLP-modelled OP contributions should be equal to the sum of all source-specific OP contributions (MLP=MLPsum). In cases where MLP>MLPsum, then synergistic effects are highlighted between some PM10 sources, resulting in an increased MLP-modelled OP activity. Conversely, MLP<MLPsum highlights antagonistic effects between some PM10 sources, resulting in a decreased MLP-modelled OP activity.
2.4.4 Statistical analysis
For the comparison of temporal variations of the observed measurements, all the correlations were evaluated using Spearman rank correlation coefficients (rs), where p≤0.05 is considered statistically significant. For the comparison of OP measures, the correlations were evaluated using Pearson correlation coefficients (r), where p≤0.05 is considered statistically significant. For the evaluation and comparison of model performance between the MLR and MLP results, a number of performance indicators were calculated, such as the goodness of fit (R2), root mean square error (RMSE), and Pearson correlation coefficient (r). The STATA/SE version 15.1 software (College Station, TX, USA) or Python libraries were used for the statistical analyses.
3.1 Temporal variation of PM10 and OP activity
The daily distributions of PM10 and OP activity (, , and ) for each site are provided in Sect. S4. The range of the OP measurements in Grenoble is well within the range of measurements in France (Calas et al., 2018, 2019; Weber et al., 2021, 2018). Detailed discussion of the temporal variability of PM10 sources is available in the companion paper (Borlaza et al., 2021).
Overall, the average PM10 concentrations on days of measurements were higher during the colder months (October to April) at 17±10 µg m−3 and lower during the warmer months (May to September) at 10±4 µg m−3 in the city of Grenoble. With the Alpine environment and the atmospheric dynamics in the study area, the occurrence of atmospheric inversions and the restriction of strong winds often result in higher concentration levels of air pollutants, especially in the winter season (Bessagnet et al., 2020; Tomaz et al., 2017). Such observed seasonality in PM10 mass concentration is also commonly explained by higher contributions from the biomass burning source in the colder seasons, especially in an Alpine valley as previously reported in previous studies (Calas et al., 2019; Favez et al., 2010; Herich et al., 2014; Srivastava et al., 2018; Tomaz et al., 2016, 2017; Weber et al., 2018, 2019). In the same way, a seasonality is displayed in OP activity in the Grenoble basin as well. In fact, the average daily OP activity levels during the winter season can be up to 2, 7, and 5 times higher than in the summer season for , , and , respectively. Indeed, the observed strong seasonality (higher OP during winter, lower OP during summer) at all sites could induce a high spatial homogeneity between sites as well. However, there are a number of local features observed at different sites, such as spikes in the OP activity during the warmer months at the UH and PU sites (see Fig. S1 in the Supplement). These spikes are prominently seen in , with some occurrences also in the and , which also emphasizes the sensitivity of each assay.
Previous studies have reported that has shown higher sensitivity with organics, metals, and the synergistic effect of the two (Bates et al., 2019; Dou et al., 2015; Fang et al., 2017; Gao et al., 2020a, b; Jiang et al., 2019; Weber et al., 2021; Yu et al., 2018), with being sensitive mostly to metal concentrations (Bates et al., 2019; Crobeddu et al., 2017; Visentin et al., 2016; Weber et al., 2021). Table S4 summarizes several publications on OP assays and their correlations with chemical species. In our study, a good correlation (r=0.68) was found between and when all sites are combined (see Fig. S1), possibly affected by the local features solely captured by the DTT assay. Due to the sensitivity to various ROS and RNS (reactive nitrogen species) of most molecular probes, the sensitivity of the DCFH assay to specific components of PM10 can be difficult to isolate (Bates et al., 2019; Jovanovic et al., 2019). However, showed good correlation (r=0.68) with and an even stronger correlation (r=0.93) with (see Fig. S2).
The comparison of the two OP measures, OPv and OPm, of each OP assay can provide information regarding the dependency of OP activity on PM10 mass concentration. As shown in Fig. S3, there is only a moderate correlation (r=0.51) between and , suggesting the dependency of the DTT assay on chemical composition rather than PM10 mass concentration. On the other hand, both OPAA (r=0.76) and OPDCFH (r=0.70) showed good correlations between their measures per volume or per mass, pointing out their dependency on PM10 concentrations and, indeed, a potential stronger influence by meteorological conditions, a key driver for concentrations in Alpine valleys.
3.2 Spatial variation of OP activity
The seasonal mean ratios (MR) of OP activities between sites are presented in Fig. 3, calculated by averaging the daily ratios of volume-normalized OP activities (, , and ) between the sites (hyper-centrebackground , hyper-centreperi-urban , and backgroundperi-urban ) by season, where winter is from December to February, spring is from March to May, summer is June to August, and autumn is September to November.
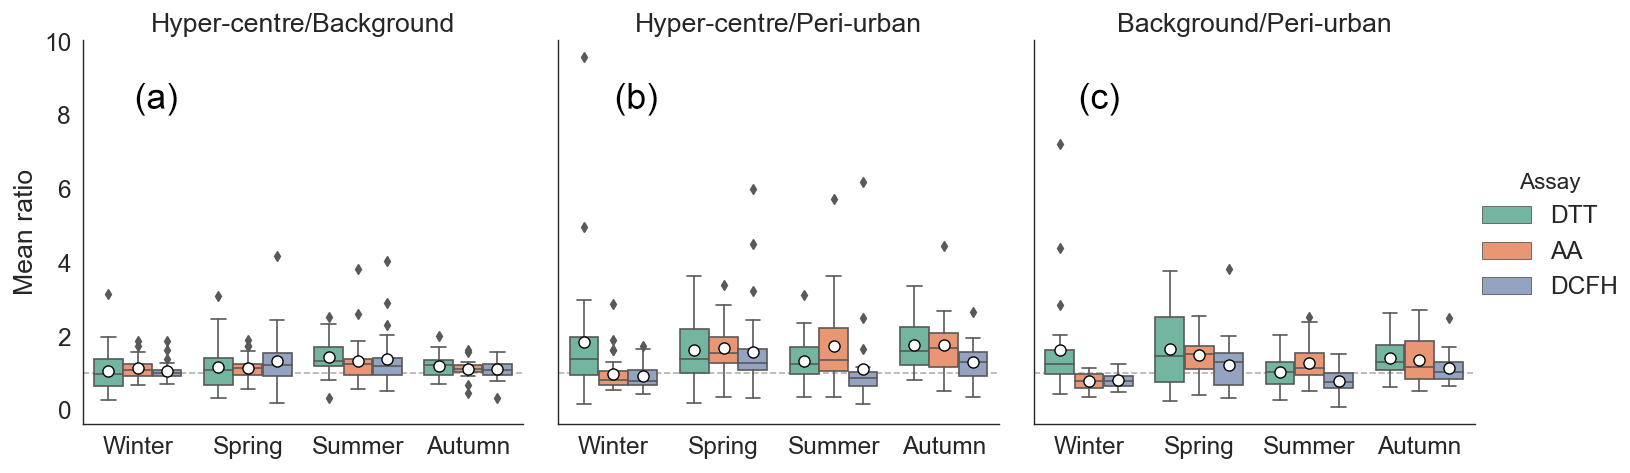
Figure 3Seasonal mean ratios (MR) between the sites (a) hyper-centrebackground (), (b) hyper-centreperi-urban (), and (c) background/peri-urban () using volume-normalized OP activities (, , and ). Dashed grey line denotes MR equal to 1, suggesting total spatial homogeneity. Boxplot mean marked by white circle and median marked by black line.
Generally, there is spatial homogeneity (MR closer to 1) in OP between the UB and UH sites in line with the findings from the companion paper (Borlaza et al., 2021). Their similarities in terms of PM10 sources have been previously attributed to similarities in source contribution not only from common sources (e.g. biomass burning and nitrate-rich), but also in terms of specific local sources in these sites such as primary traffic, mineral dust, and, to a lesser extent, the industrial factor. This could be attributed not only to their proximity in terms of geographical location, but also to their resemblance in typology, resulting in similarities of both PM10 and OP variabilities.
Conversely, there is an observed variability in the MR in and suggesting weaker homogeneity (MR farther to 1) in the PU site compared to sites closer to the city centre (UH and UB sites). For example, the PU site can be strongly influenced by some event days with extremely low , especially in the winter season ( , n=3), resulting in an increase in the MR against other sites. In fact, the MR for can be as high as 9.6 and 7.2 during winter for the and ratio. This can also be seen in the other seasons but is more prominent between the UH and PU sites. Aside from seasonal influences, there are also some differences between assays as observed in the and ratio during winter. For instance, the MR in are notably much higher than in and , further highlighting assay sensitivity.
Although spatial homogeneity was generally observed between the sites, there are local features that must be taken into consideration, as well as seasonal influence and OP assay sensitivity. Overall, there is an observed similarity in the spatiotemporal variabilities of PM10 and measured OP activity, making it even more interesting to determine which of the PM10 sources are driving OP.
3.3 Determination of the sources driving OP using multiple linear regression (MLR) analysis
To determine the main drivers of the OP of PM10, an OP deconvolution method was performed with a classical MLR analysis following the proposed method by Weber et al. (2018) using the source contributions obtained in the PMF studies presented in the companion paper (Borlaza et al., 2021) and the measured OP at each site.
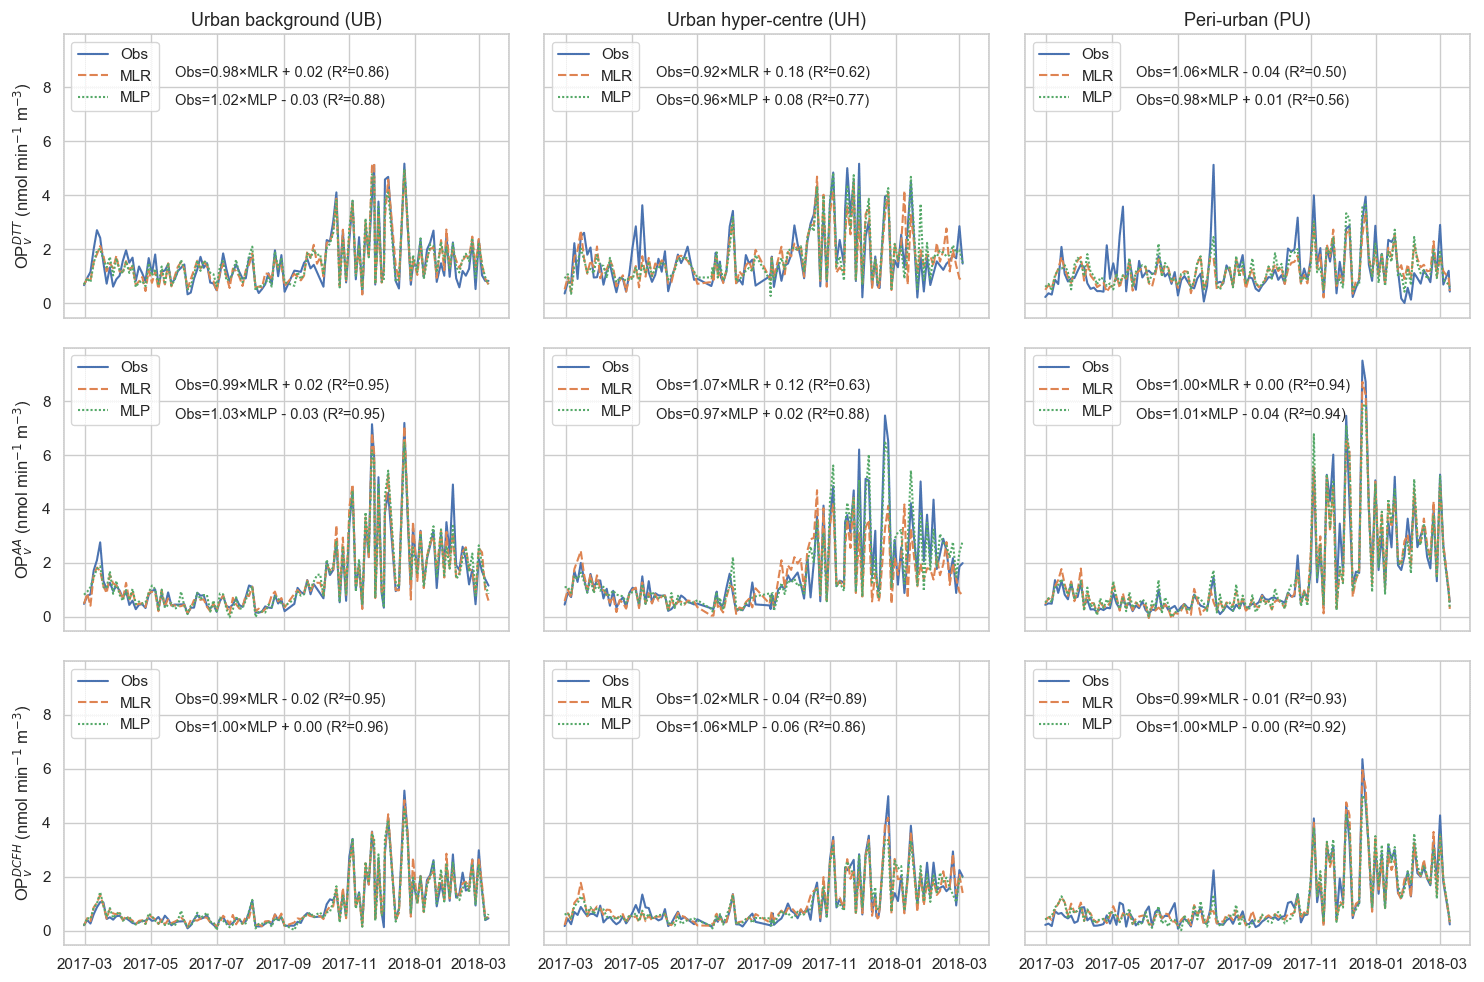
Figure 4Comparison of the observed and modelled OPv (, , and ) at different urban sites using MLR and MLP models. The equation of the line and goodness of fit (R2) between observed and modelled OP are included.
3.3.1 Performance of the MLR models
Thanks to the OP deconvolution method, the measured OP has been attributed to the PM10 sources, allowing the quantification of the contribution of each source to OP. Generally, the MLR-modelled OPs are well within the range of the observed OP activity, even taking into account the low uncertainties of the measurements as presented in Fig. 4. However, there are a few local features (i.e. high OP events) in the observed during warmer months in the UH and PU sites that were not captured by the MLR models. There are also some overestimations during the colder months (specifically around January to February 2018) at the same sites. Yet these lead to an acceptable goodness of fit (R2) for the MLR-modelled in the UB (R2=0.80), UH (R2=0.62), and PU (R2=0.50) sites compared to the MLR-modelled (UB: R2=0.73, UH: R2=0.63, and PU: R2=0.94) and (UB: R2=0.96, UH: R2=0.89, and PU: R2=0.93). These associations were also confirmed using Pearson correlations (r) as presented in Fig. S6.
However, there are instances where models, even those with good R2 values, could have a considerable bias and should be interpreted with caution. For example, the relationship between the observed and MLR-modelled in the UB site has a slope of 0.9 but an intercept of 0.7, showing significant deviation between model and measurements. Additional details on the correlation between the observed and MLR-modelled OP activity are summarized in Sect. S6.
3.3.2 Intrinsic OP (OPm) of each PM10 source
The ability of each PM source to induce oxidative stress is represented by the intrinsic OP (OPm) given by the regression coefficient (β) of the MLR model, as shown in Fig. 5. With higher OPm, the source is more redox-active and highly likely to contribute to the overall OP.

Figure 5Site-specific intrinsic OP (OPm) per source analysis from each assay (, , and ) represented by mean (bar) and standard deviation (error bar) based on the MLR (urban background, UB: blue, urban hyper-centre, UH: orange, peri-urban, PU: green). Note: asterisks represent statistically significant OPm within a 95 % confidence interval (p value ≤0.05).
Generally, the statistically dominant sources (based on the MLR models, p value≤0.05) in every site are the industrial, biomass burning, and primary traffic (except for in the UH site) sources, suggesting stronger impact of anthropogenic sources. Both the biomass burning and primary traffic sources have mostly shown significant positive OPm across all sites. However, amongst the sources with dominant intrinsic OP, it is important to note the variability of the OPm of the industrial source. This source has been previously identified as a heterogeneous source in the companion paper. It is important to note that the impact of trace metals, used to identify this source (i.e. As, Cd, Cr, Mn, Mo, Ni, Pb, Zn), is inherently variable at this spatial scale. Particularly, the industrial source has the highest OPm for both the UB (, p≤0.01; , p≤0.01; , p≤0.01) and UH (, p≤0.01; , p≤0.01; , p≤0.01) sites. However, for the PU site, the industrial source has a low to negative OPm for the DTT and DCFH assays, suggesting that this source has less impact on this specific urban typology. In fact, in the PU site, the highest OPm was found in different sources, such as the primary biogenic (, p≤0.01), industrial (0.44±0.17, p≤0.01), and biomass burning (, p≤0.01) sources for the DTT, AA, and DCFH assays, respectively.
Although it is clear that anthropogenic sources have higher OPm, there are also impacts from biogenic sources (both primary and secondary biogenic oxidation) that need to be considered, especially in sites that have an abundance of this type of source. The secondary biogenic oxidation source has only shown statistically significant OPm in the PU site for all OP assays (also the UB site on only), underlining the influence of site-specific features on OPm.
Aside from biogenic sources, thanks to the enhanced PMF solution used in this study, we were able to determine the redox characteristics of commonly unresolved sources. The contributions of specific organic tracers (particularly phthalic acid) in some anthropogenically derived sources, such as sulfate- and nitrate-rich sources, can also point to contributions from anthropogenic secondary organic aerosols (SOA) as discussed in the companion paper (Borlaza et al., 2021). This is particularly important, especially that such sources could play a key role in the dynamics of OP of PM10 (Daellenbach et al., 2020).
It is also interesting that biomass burning appears to be contributing less to OPm in the DTT assay compared to both the AA and DCFH assays. We acknowledge the fact that OP from the DTT assay has been reported to be responsive/sensitive to organics, making this quite intriguing. However, recent studies have reported that OP from the DTT assay could be unreactive to some metal species (specifically iron), unlike other assays, namely AA and glutathione (GSH). Hence, OP measured using the DTT assay may not completely capture ROS from Fenton chemistry or even the synergistic effects with regards to hydroxyl radical (•OH) generation as reported by Xiong et al. (2017). Similarly, Yu et al. (2018) have reported that soluble manganese showed synergistic effects with quinones and an antagonistic effect between soluble copper and quinones. Generally, there is an undeniable interplay between species that needs to be considered as well as the sensitivity of each assay to species. As much as each analysis attempts to fully characterize the chemistry of PM, there can still be species that are unmeasured but, in fact, play a role in ROS generation. Hence, reported associations could be due to similarity in variations with PM concentration rather than a significant causal relationship between assays and PM components. Nevertheless, the sensitivity of the DTT assay to a wider range of compounds that are present in various sources led to a more balanced distribution of OP sources (and so weighting the contribution of biomass burning with regards to other sources) than the other OP assays, such as AA and DCFH.
Finally, Weber et al. (2021) discussed the variability of OP at the national scale, and the values here are in the ballpark of the national results. A key feature is that the uncertainties of each OPm can provide information on its statistical significance, therefore offering caution when using these values for modelling purposes.
3.3.3 All-site average OP contribution (OPv) by each PM10 source
In terms of overall daily mean contribution, as presented in Fig. 6 (see Sect. S7 for site-specific figures), the main contributors of PM10 mass are the biomass burning and the nitrate- and sulfate-rich sources in the Grenoble basin when taking into account the results from the three sites. However, in terms of , the primary traffic source showed the highest contribution (0.33 ) closely followed by the biomass burning source (0.31 ). For both and , the biomass burning source is notably the strongest contributor (0.72 and 0.56 , respectively).
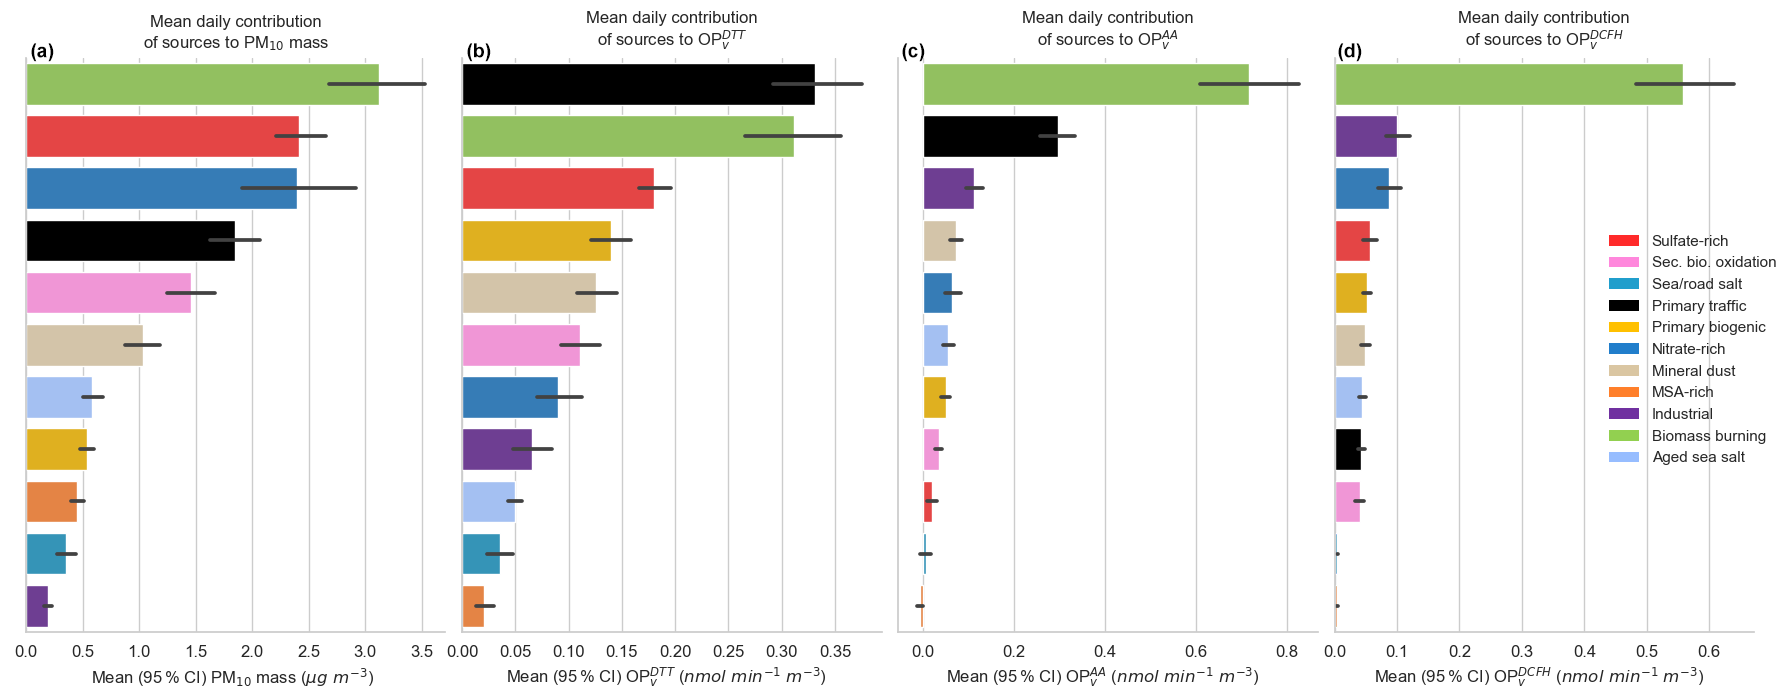
Figure 6Overall daily mean OPv contribution of the sources to PM10, , , and using MLR analysis in the form of mean and 95 % confidence interval of the mean (error bar) (n=378 samples).
The mass contributions of the biomass burning source can be twice as much as that of the primary traffic source, but OP contributions in terms of are almost similar. The industrial source also has very minimal contribution in terms of PM10 mass but has a relevant contribution to OPv. Moreover, there are sources that contribute to a large extent to the total PM10 mass but barely contribute to the OP, such as the nitrate-rich (all OP assays) and sulfate-rich sources (only for and ). This observed redistribution of source impacts based on OPv highlights the importance of considering PM redox activity instead of solely mass concentration (Daellenbach et al., 2020).
Although secondary inorganic sources are commonly associated with low impact on PM toxicity (Cassee et al., 2013; Daellenbach et al., 2020), the sulfate- and nitrate-rich sources showed contributions to and , respectively. Even with minimal OPm (see Fig. 5), the relevant mass contribution of these sources resulted in a relevant contribution to OPv. It should also be considered that both sulfate- and nitrate-rich sources have been previously associated with anthropogenic SOA due to phthalic acid contribution in this factor (Borlaza et al., 2021).
Clearly, the OPv contribution of the biomass burning source is captured by all assays. In fact, in the AA and DCFH assays, the OPv contributions are both heavily dominated by the biomass burning source, while the DTT assay showed sensitivity to a wider range of sources. However, it is important to take into consideration the mechanism at work behind these assays. Both the DTT and AA assays mimic in vivo interactions of redox-active components in PM10 and biological oxidants representing PM-induced oxidative stress, while DCFH measures generated particle-bound ROS. Although these source-specific OPv contributions provide critical knowledge on the main drivers of OPv, it is difficult to rely on just one measurement (i.e. one type of assay) without testing its relevance to health outcomes.
3.3.4 Seasonal and site-specific differences in OP contribution (OPv) by each PM10 source
Clearly, the previous yearly averages mask strong seasonal variabilities as presented in the monthly OPv contributions of each source (see Fig. 7). During colder months, the OPv of the biomass burning source is present in all assays and especially prominent in the AA and DCFH assays. During warmer months, the source OPv contributions vary across different assays. However, the OPv contributions from the primary traffic source is present throughout the year. Aside from seasonal influences, there are also differences between the sites that vary according to the assay.

Figure 7The monthly mean OPv contributions of each PM10 source in the three urban sites in Grenoble, France, for , , and based on MLR analysis.
For , there are similarities in the contributions of some sources in the UB and PU sites such as the consistent monthly contribution from the sulfate-rich source and the contributions from the secondary biogenic source during warmer months, highlighting the influence of secondary aerosols in these sites. The UB and UH sites also have similarities in terms of contributions from the mineral dust source during warmer months and from the nitrate-rich source during the colder months, both of which are sources that can be influenced by road emissions and anthropogenic SOA. This can be explained by the proximity of the UB and UH sites to roadways, where PM10 in these sites is more inclined to interact with metals from road dust resuspension and other non-exhaust vehicular emissions than the PU site (discussed in detail in the companion paper, Borlaza et al., 2021). Surprisingly, there is also a similarity seen in the UH and PU sites in terms of contributions from the primary biogenic source during warmer months.
For , the contribution from the mineral dust source during warmer months in the UB and UH sites and the contribution from secondary biogenic oxidation source in the PU site were similarly captured. During colder months, biomass burning is dominating in the UB and PU sites; however, the UH site exhibited contributions from a variety of sources. There is also a consistent contribution of aged sea salt in the UB site and the contribution of nitrate-rich and sea/road salt during the colder months in the PU site.
For , the contributions from the primary traffic source (especially in the UB and PU sites) are much less than the two other assays, suggesting weaker sensitivity of the DCFH assay to this source. Instead, the contributions from the nitrate-rich source, a source also commonly associated with secondary anthropogenic emissions (Aksoyoglu et al., 2017; Boyd et al., 2017; Faxon et al., 2018; Pennino et al., 2016; Priestley et al., 2018), are more prominent during the colder months in all sites.
This further highlights not only the importance of PM redox activity over mass concentration, but also the importance of considering the seasonal influence on PM sources that drive the OP of PM. These findings are also consistent with current research, underlining that the main sources of OP are those including species mainly originating from anthropogenic emissions (Janssen et al., 2014; Shi et al., 2006; Yang et al., 2015) such as road transport and biomass burning (Boogaard et al., 2012; Borlaza et al., 2018; Calas et al., 2019; Daellenbach et al., 2020; Daher et al., 2014; Pant et al., 2015; Park et al., 2018; Seo et al., 2020; Simonetti et al., 2018; Weber et al., 2021) and also site typologies that favour the accumulation of pollutants and photo-active aging (Daellenbach et al., 2020; Janssen et al., 2014; Pietrogrande et al., 2019).
3.4 Predicting OP activity from PM10 sources using MLP analysis
The residuals between the observed and MLR-modelled OP could be attributed to atmospheric processes that were not captured as most linear models assume no interaction between independent variables (i.e. multicomponent or multisource interactions). With this in mind, we are inclined to explore another method of predicting OP from PM10 sources that hopefully addresses this limitation. The application of ANN techniques using non-linear functions, such as MLP analysis, is an interesting new approach that accounts for correlation and/or non-linear interactions between independent variables.
3.4.1 Optimization of the MLP neural network architecture
A number of MLP architectures (8 architectures in each site; total of 24 MLP models) were explored to find the optimal neural network in each site by exploring two different activation functions (TanH and sigmoid), an optimization algorithm (scaled conjugate and gradient descent), and different learning rates (from 0.2 to 0.6). In Sect. S3, Table S3 shows the performance comparison of all of the MLP models tested. The optimal model was selected based on the lowest RMSE (ideally nearly 0) and the highest Pearson correlation coefficient (r) (ideally nearly 1). Other model performance measures such as mean absolute error (MAE), mean absolute percentage error (MAPE), and Spearman rank correlation coefficient (rs) were also explored and led to relatively similar results.
It is important to note that, although there are other more complex architectures, we limited our tests to a rudimentary MLP architecture that is deemed sufficient and appropriate based on the type of input and output dataset of this study. Clearly, there is room for further exploration in the direction of using MLP for predicting OP from PM sources. To our knowledge, this is the first attempt to use MLP in apportioning OP from PM sources and may serve as a baseline for future applications of MLP in PM toxicity.
3.4.2 Comparison of predictive accuracy between the MLP and MLR models
To conduct insightful evaluation of the predictive accuracy of the MLP and MLR models, the model performance measures were calculated as shown in Table 1. The predicted by the MLP model generally showed lower prediction error (RMSE) than the MLR model for all the sites. Conversely, the model performance measures in and were less straightforward. The predicted showed lower prediction errors for the UB and UH sites using MLP models, with lower prediction errors for the PU site using MLR models.
Table 1The comparison of predictive accuracy of the observed OP activity between the MLR and MLP models based on root mean square error (RMSE) and Pearson correlation (r). Note: RMSE is ideally ∼0 (lower RMSE in bold), and r is ideally ∼1 (higher r in bold).

The temporal distribution of the observed and modelled OP activities for both the MLR and MLP models were previously presented in Fig. 4. It is interesting to note that even MLP was not able to fully capture some peaks (especially in the warmer months) of the observed . However, the RMSE values using MLP were much lower than MLR, particularly in the UH site, where the RMSE was reduced from 0.69 to 0.54 and in the PU site from 0.62 to 0.58. In the UB site, the MLP did not exceed the performance of MLR by a weighty extent. Nonetheless, the MLP model generally performed better, making it a competitive new technique in predicting OP activity even with a rudimentary MLP architecture.
3.4.3 The non-linearity of OP contributions of PM10 sources based on MLP analysis
With some interactions between PM10 sources resulting in synergistic or antagonistic effects on the OP activity, it is deemed essential to look closer into this potential non-linear aspect to understand better the oxidizing capacity of PM10 sources. To demonstrate this non-linearity, the MLP models were applied to dummy datasets leading to source-specific OPv. The total source-specific OPv (MLPsum; see Sect. 2.4.3) was compared to the original MLP-modelled OPv as presented in Fig. 8 for in the UH site (see Sect. S7 for similar figures for the UB and PU sites). The data points below the 1:1 line show an overall synergistic effect between PM10 sources on OPv, while data points above the 1:1 line show an overall antagonistic effect between PM10 sources on OPv.
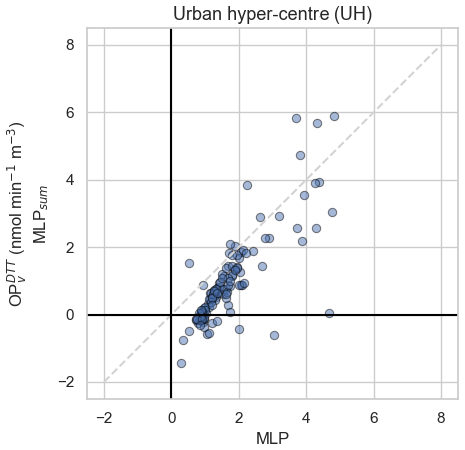
Figure 8The comparison of the original modelled (MLP) and the sum of source-specific modelled activity. Note: dashed grey line corresponds to the 1:1 line. Data points below the 1:1 line show an overall synergistic effect between PM10 sources on OP activity; above the 1:1 line it is otherwise.
Overall, there is a synergistic effect of PM10 sources on in most days in the UH site. This is also seen in the and (see Fig. S9). Several studies have reported synergistic effects in OP due to the interaction between metal and organic species (Arangio et al., 2016; Charrier and Anastasio, 2015; Dou et al., 2015; Fang et al., 2017; Li et al., 2012; Lin and Yu, 2020; Xiong et al., 2017; Yu et al., 2018). The UH site has pertinent contributions coming from the mineral dust source (high in metal species, possibly combined with anthropogenic organics, from road dust resuspension) and primary biogenic source (high in organic species) which could be initiating the synergistic effects (see Fig. S7). While there are relevant contributions from biogenic sources in the other two sites, their mineral dust source is not as high as in the UH site (or vice versa). These findings further support the importance of accounting for the contribution of biogenic sources as previously reported in other similar studies (Samake et al., 2017; Tuet et al., 2017) as well as the importance of source interactions and dynamics, as it could have considerable influence on the OP of PM10.
In Sect. 3.4.2, it was presented that MLP offered improvements compared to MLR, based on its much lower prediction errors in the UH site (see Table 1). Indeed, it is possible that MLR had difficulties in generating an accurate OP model for a site that has a highly non-linear behaviour based on the potential synergistic effects between PM10 sources. In fact, the lowest prediction error by MLR (the model in the PU site with RMSE=0.21; see Table 1) also showed data points closer to the 1:1 line between the MLP vs. MLPsum (see Fig. S9), suggesting weaker influence of the synergistic/antagonistic effects between PM10 sources. However, the MLP still performed better (the model in the PU site with RMSE=0.19; see Table 1), supporting the flexibility of MLP in both linear and non-linear behaviour of PM10 sources compared to MLR.
This study, together with the findings of its companion paper (Borlaza et al., 2021), has presented an extensive analysis of a city-scale OP and its association with various sources of PM10 based on a 1-year PM10 sampling over different sites in Grenoble (France), with approaches using both linear and non-linear modelling techniques. The main findings of this study are as follows.
-
There is a strong seasonality in the observed OP found in all assays used (AA, DTT, and DCFH), with higher OP during colder months and lower OP during warmer months.
-
There is a notable spatial difference in OP in a suburban typology against sites closer to the city centre.
-
There is an overall agreement (spatiotemporal homogeneity) between the three sites in the Grenoble basin; however, there are some influences from local features and site-specific events due to specific sources' contribution.
-
The OP of PM10 has been successfully attributed to PMF-resolved sources using multiple linear regression analysis with a mostly good model fit.
-
The sources of OP with the highest redox characteristics (i.e. intrinsic OP or OPm) are mainly anthropogenic sources such as industrial, primary traffic, and biomass burning sources. The redox characteristics of commonly unresolved sources in the biogenic fraction (MSA-rich, primary biogenic, and secondary biogenic oxidation) were also obtained, and such natural sources also contribute to the overall OP during mild seasons.
-
There is a redistribution of the impacts in terms of source OPv contributions compared to mass contributions, highlighting the importance of considering redox activity over mass concentration in air quality policies.
-
There are seasonal influences on sources contributing to OP. During the colder months, the biomass burning source is typically the strongest contributor to all OP. During the warmer months, there are different sources (mineral dust, primary biogenic, secondary biogenic oxidation) contributing to OP in each site. However, there is a consistent contribution from the primary traffic source during the overall year.
-
Even with a rudimentary design, the multilayer perceptron approach successfully modelled OP based on PMF-resolved sources, with some improvements in model performance (lower prediction errors, higher association with observed OP) compared to MLR.
-
The MLP also offered improvements, especially in sites where there are prominent synergistic and/or antagonistic effects between PM10 sources supporting the capabilities of MLP in capturing non-linearities in OP.
Finally, in this paper, we tested for the very first time the use of neural network analysis to apportion OP sources from PM10. We showed that such a methodology is at least as robust as the linear classical inversion one and permits an improvement in the OP prediction when local features or non-linear effects occur. This study also demonstrated that enhanced-PMF solution allows us to show differences in the spatiotemporal distribution of OP activity, targeting the responsible sources at a city scale. These findings pave the way to establishing exposure in homogenous OP areas.
The software code is available upon request.
The chemical, PMF, and OP datasets are available upon request.
The supplement related to this article is available online at: https://doi.org/10.5194/acp-21-9719-2021-supplement.
GU and JLJ designed the atmospheric chemistry part of the MobilAir and QUAMECS programme and the whole Get OP stand OP project. SM and CT supervised the sampling at the three sites for Atmo AuRA. AA is involved in the CARA programme that allows the collection of samples from the Les Frênes site. SH is developing OP assays for the group. LJSB and SW processed the data. SW developed some of the tools and ideas for in-depth PMF analysis. LJSB and SW wrote the paper. JLJ and GU revised the original draft. All the authors reviewed and edited the manuscript.
The authors declare that they have no conflict of interest.
Publisher’s note: Copernicus Publications remains neutral with regard to jurisdictional claims in published maps and institutional affiliations.
The authors would like to kindly thank the dedicated efforts of many people from Atmo-AuRA at the sampling sites and in the lab at IGE (Anthony Vella, Claire Vérin, Céline Voiron, Rhabira El Azzouzi, and Armelle Crouzet) for collecting and analysing the samples, respectively. The authors would also like to thank the Fondation Université Grenoble Alpes (FUGA) for supporting this research.
This work is supported by the French National Research Agency in the framework of the Investissements d'avenir programme (ANR-15-IDEX-02), for the MobilAir programme and ANR Get OP Stand OP (ANR-19-CE34-0002-01), and the Fondation Université Grenoble Alpes (FUGA) through the Predict'Air programme. It also received support from the QAMECS programme funded by ADEME (convention 1662C0029) and from LCSQA and the French Ministry of Environment for part of the analyses for the Les Frênes site within the CARA programme. Chemical analysis of the Air-O-Sol facility at IGE was made possible with the funding of some of the equipment by the Labex OSUG@2020 (ANR10 LABX56). The PhD of Samuël Weber is funded by ENS Paris. The internship of T Cañete is taking place within the Erasmus exchange programme.
This paper was edited by James Allan and reviewed by two anonymous referees.
Abderrahim, H., Chellali, M. R., and Hamou, A.: Forecasting PM10 in Algiers: efficacy of multilayer perceptron networks, Environ. Sci. Pollut. R., 23, 1634–1641, https://doi.org/10.1007/s11356-015-5406-6, 2016.
Aksoyoglu, S., Ciarelli, G., El-Haddad, I., Baltensperger, U., and Prévôt, A. S. H.: Secondary inorganic aerosols in Europe: sources and the significant influence of biogenic VOC emissions, especially on ammonium nitrate, Atmos. Chem. Phys., 17, 7757–7773, https://doi.org/10.5194/acp-17-7757-2017, 2017.
Arangio, A. M., Tong, H., Socorro, J., Pöschl, U., and Shiraiwa, M.: Quantification of environmentally persistent free radicals and reactive oxygen species in atmospheric aerosol particles, Atmos. Chem. Phys., 16, 13105–13119, https://doi.org/10.5194/acp-16-13105-2016, 2016.
Argyropoulos, G., Besis, A., Voutsa, D., Samara, C., Sowlat, M. H., Hasheminassab, S., and Sioutas, C.: Source apportionment of the redox activity of urban quasi-ultrafine particles (PM0.49) in Thessaloniki following the increased biomass burning due to the economic crisis in Greece, Sci. Total Environ., 568, 124–136, https://doi.org/10.1016/j.scitotenv.2016.05.217, 2016.
Ayres, J. G., Borm, P., Cassee, F. R., Castranova, V., Donaldson, K., Ghio, A., Harrison, R. M., Hider, R., Kelly, F., Kooter, I. M., Marano, F., Maynard, R. L., Mudway, I., Nel, A., Sioutas, C., Smith, S., Baeza-Squiban, A., Cho, A., Duggan, S., and Froines, J.: Evaluating the Toxicity of Airborne Particulate Matter and Nanoparticles by Measuring Oxidative Stress Potential – A Workshop Report and Consensus Statement, Inhal. Toxicol., 20, 75–99, https://doi.org/10.1080/08958370701665517, 2008.
Bates, J. T., Weber, R. J., Abrams, J., Verma, V., Fang, T., Klein, M., Strickland, M. J., Sarnat, S. E., Chang, H. H., Mulholland, J. A., Tolbert, P. E., and Russell, A. G.: Reactive Oxygen Species Generation Linked to Sources of Atmospheric Particulate Matter and Cardiorespiratory Effects, Environ. Sci. Technol., 49, 13605–13612, https://doi.org/10.1021/acs.est.5b02967, 2015.
Bates, J. T., Fang, T., Verma, V., Zeng, L., Weber, R. J., Tolbert, P. E., Abrams, J. Y., Sarnat, S. E., Klein, M., Mulholland, J. A., and Russell, A. G.: Review of Acellular Assays of Ambient Particulate Matter Oxidative Potential: Methods and Relationships with Composition, Sources, and Health Effects, Environ. Sci. Technol., 53, 4003–4019, https://doi.org/10.1021/acs.est.8b03430, 2019.
Baulig, A., Garlatti, M., Bonvallot, V., Marchand, A., Barouki, R., Marano, F., and Baeza-Squiban, A.: Involvement of reactive oxygen species in the metabolic pathways triggered by diesel exhaust particles in human airway epithelial cells, Am. J. Physiol.-Lung C., 285, L671–L679, https://doi.org/10.1152/ajplung.00419.2002, 2003.
Belis, C. A., Pikridas, M., Lucarelli, F., Petralia, E., Cavalli, F., Calzolai, G., Berico, M., and Sciare, J.: Source apportionment of fine PM by combining high time resolution organic and inorganic chemical composition datasets, Atmos. Environ.-X, 3, 100046, https://doi.org/10.1016/j.aeaoa.2019.100046, 2019.
Bell, M. L. and HEI Health Review Committee: Assessment of the health impacts of particulate matter characteristics, Res. Rep. Health Eff. Inst, 161, 5–38, 2012.
Bengio, Y., Simard, P., and Frasconi, P.: Learning long-term dependencies with gradient descent is difficult, IEEE T. Neural Networ., 5, 157–166, https://doi.org/10.1109/72.279181, 1994.
Bessagnet, B., Menut, L., Lapere, R., Couvidat, F., Jaffrezo, J.-L., Mailler, S., Favez, O., Pennel, R., and Siour, G.: High Resolution Chemistry Transport Modeling with the On-Line CHIMERE-WRF Model over the French Alps – Analysis of a Feedback of Surface Particulate Matter Concentrations on Mountain Meteorology, Atmosphere, 11, 565, https://doi.org/10.3390/atmos11060565, 2020.
Bishop, C. M.: Neural networks for pattern recognition, Clarendon Press, Oxford University Press, Oxford, New York, 482 pp., 1995.
Boogaard, H., Janssen, N. A. H., Fischer, P. H., Kos, G. P. A., Weijers, E. P., Cassee, F. R., van der Zee, S. C., de Hartog, J. J., Brunekreef, B., and Hoek, G.: Contrasts in Oxidative Potential and Other Particulate Matter Characteristics Collected Near Major Streets and Background Locations, Environ. Health Persp., 120, 185–191, https://doi.org/10.1289/ehp.1103667, 2012.
Boppana, V. B. L., Wise, D. J., Ooi, C. C., Zhmayev, E., and Poh, H. J.: CFD assessment on particulate matter filters performance in urban areas, Sustain. Cities Soc., 46, 101376, https://doi.org/10.1016/j.scs.2018.12.004, 2019.
Borlaza, L. J. S., Cosep, E. M. R., Kim, S., Lee, K., Joo, H., Park, M., Bate, D., Cayetano, M. G., and Park, K.: Oxidative potential of fine ambient particles in various environments, Environ. Pollut., 243, 1679–1688, https://doi.org/10.1016/j.envpol.2018.09.074, 2018.
Borlaza, L. J. S., Weber, S., Uzu, G., Jacob, V., Cañete, T., Micallef, S., Trébuchon, C., Slama, R., Favez, O., and Jaffrezo, J.-L.: Disparities in particulate matter (PM10) origins and oxidative potential at a city scale (Grenoble, France) – Part 1: Source apportionment at three neighbouring sites, Atmos. Chem. Phys., 21, 5415–5437, https://doi.org/10.5194/acp-21-5415-2021, 2021.
Boyd, C. M., Nah, T., Xu, L., Berkemeier, T., and Ng, N. L.: Secondary Organic Aerosol (SOA) from Nitrate Radical Oxidation of Monoterpenes: Effects of Temperature, Dilution, and Humidity on Aerosol Formation, Mixing, and Evaporation, Environ. Sci. Technol., 51, 7831–7841, https://doi.org/10.1021/acs.est.7b01460, 2017.
Brown, S. G., Eberly, S., Paatero, P., and Norris, G. A.: Methods for estimating uncertainty in PMF solutions: Examples with ambient air and water quality data and guidance on reporting PMF results, Sci. Total Environ., 518–519, 626–635, https://doi.org/10.1016/j.scitotenv.2015.01.022, 2015.
Cabaneros, S. M., Calautit, J. K., and Hughes, B. R.: A review of artificial neural network models for ambient air pollution prediction, Environ. Modell. Softw., 119, 285–304, https://doi.org/10.1016/j.envsoft.2019.06.014, 2019.
Cabaneros, S. M., Calautit, J. K., and Hughes, B.: Short- and long-term forecasting of ambient air pollution levels using wavelet-based non-linear autoregressive artificial neural networks with exogenous inputs, International Journal of Environmental Impacts, 3, 143–154, https://doi.org/10.2495/EI-V3-N2-143-154, 2020.
Cabaneros, S. M. S., Calautit, J. K. S., and Hughes, B. R.: Hybrid Artificial Neural Network Models for Effective Prediction and Mitigation of Urban Roadside NO2 Pollution, Energy Proced., 142, 3524–3530, https://doi.org/10.1016/j.egypro.2017.12.240, 2017.
Calas, A., Uzu, G., Martins, J. M. F., Voisin, D., Spadini, L., Lacroix, T., and Jaffrezo, J.-L.: The importance of simulated lung fluid (SLF) extractions for a more relevant evaluation of the oxidative potential of particulate matter, Scientific Reports, 7, 11617, https://doi.org/10.1038/s41598-017-11979-3, 2017.
Calas, A., Uzu, G., Kelly, F. J., Houdier, S., Martins, J. M. F., Thomas, F., Molton, F., Charron, A., Dunster, C., Oliete, A., Jacob, V., Besombes, J.-L., Chevrier, F., and Jaffrezo, J.-L.: Comparison between five acellular oxidative potential measurement assays performed with detailed chemistry on PM10 samples from the city of Chamonix (France), Atmos. Chem. Phys., 18, 7863–7875, https://doi.org/10.5194/acp-18-7863-2018, 2018.
Calas, A., Uzu, G., Besombes, J.-L., Martins, J. M. F., Redaelli, M., Weber, S., Charron, A., Albinet, A., Chevrier, F., Brulfert, G., Mesbah, B., Favez, O., and Jaffrezo, J.-L.: Seasonal Variations and Chemical Predictors of Oxidative Potential (OP) of Particulate Matter (PM), for Seven Urban French Sites, Atmosphere, 10, 698, https://doi.org/10.3390/atmos10110698, 2019.
Calcagno, G., Staiano, A., Fortunato, G., Brescia-Morra, V., Salvatore, E., Liguori, R., Capone, S., Filla, A., Longo, G., and Sacchetti, L.: A multilayer perceptron neural network-based approach for the identification of responsiveness to interferon therapy in multiple sclerosis patients, Inform. Sciences, 180, 4153–4163, https://doi.org/10.1016/j.ins.2010.07.004, 2010.
Cassee, F. R., Héroux, M.-E., Gerlofs-Nijland, M. E., and Kelly, F. J.: Particulate matter beyond mass: recent health evidence on the role of fractions, chemical constituents and sources of emission, Inhal. Toxicol., 25, 802–812, https://doi.org/10.3109/08958378.2013.850127, 2013.
CEN: Ambient air – Standard gravimetric measurement method for the determination of the PM10 or PM2.5 mass concentration of suspended particulate matter, CEN, Brussels, Belgium, 2014.
CEN: Ambient air – Standard method for measurement of , , Cl−, , Na+, K+, Mg2+, Ca2+ in PM2.5 as deposited on filters, CEN, Brussels, Belgium, 2017.
Cesari, D., Merico, E., Grasso, F. M., Decesari, S., Belosi, F., Manarini, F., De Nuntiis, P., Rinaldi, M., Volpi, F., Gambaro, A., Morabito, E., and Contini, D.: Source Apportionment of PM2.5 and of its Oxidative Potential in an Industrial Suburban Site in South Italy, Atmosphere, 10, 758, https://doi.org/10.3390/atmos10120758, 2019.
Chaloulakou, A., Grivas, G., and Spyrellis, N.: Neural Network and Multiple Regression Models for PM10 Prediction in Athens: A Comparative Assessment, JAPCA J. Air Waste Ma., 53, 1183–1190, https://doi.org/10.1080/10473289.2003.10466276, 2003.
Charrier, J. G. and Anastasio, C.: Rates of Hydroxyl Radical Production from Transition Metals and Quinones in a Surrogate Lung Fluid, Environ. Sci. Technol., 49, 9317–9325, https://doi.org/10.1021/acs.est.5b01606, 2015.
Charron, A., Polo-Rehn, L., Besombes, J.-L., Golly, B., Buisson, C., Chanut, H., Marchand, N., Guillaud, G., and Jaffrezo, J.-L.: Identification and quantification of particulate tracers of exhaust and non-exhaust vehicle emissions, Atmos. Chem. Phys., 19, 5187–5207, https://doi.org/10.5194/acp-19-5187-2019, 2019.
Chattopadhyay, S. and Bandyopadhyay, G.: Artificial neural network with backpropagation learning to predict mean monthly total ozone in Arosa, Switzerland, Int. J. Remote Sens., 28, 4471–4482, https://doi.org/10.1080/01431160701250440, 2007.
Cho, A. K., Sioutas, C., Miguel, A. H., Kumagai, Y., Schmitz, D. A., Singh, M., Eiguren-Fernandez, A., and Froines, J. R.: Redox activity of airborne particulate matter at different sites in the Los Angeles Basin, Environ. Res., 99, 40–47, https://doi.org/10.1016/j.envres.2005.01.003, 2005.
Conte, E., Canepari, S., Frasca, D., and Simonetti, G.: Oxidative Potential of Selected PM Components, Proceedings, 1, 108, https://doi.org/10.3390/ecas2017-04131, 2017.
Crobeddu, B., Aragao-Santiago, L., Bui, L.-C., Boland, S., and Baeza Squiban, A.: Oxidative potential of particulate matter 2.5 as predictive indicator of cellular stress, Environ. Pollut., 230, 125–133, https://doi.org/10.1016/j.envpol.2017.06.051, 2017.
Dabass, A., Talbott, E. O., Rager, J. R., Marsh, G. M., Venkat, A., Holguin, F., and Sharma, R. K.: Systemic inflammatory markers associated with cardiovascular disease and acute and chronic exposure to fine particulate matter air pollution (PM2.5) among US NHANES adults with metabolic syndrome, Environ. Res., 161, 485–491, https://doi.org/10.1016/j.envres.2017.11.042, 2018.
Daellenbach, K. R., Uzu, G., Jiang, J., Cassagnes, L.-E., Leni, Z., Vlachou, A., Stefenelli, G., Canonaco, F., Weber, S., Segers, A., Kuenen, J. J. P., Schaap, M., Favez, O., Albinet, A., Aksoyoglu, S., Dommen, J., Baltensperger, U., Geiser, M., El Haddad, I., Jaffrezo, J.-L., and Prévôt, A. S. H.: Sources of particulate-matter air pollution and its oxidative potential in Europe, Nature, 587, 414–419, https://doi.org/10.1038/s41586-020-2902-8, 2020.
Daher, N., Saliba, N. A., Shihadeh, A. L., Jaafar, M., Baalbaki, R., Shafer, M. M., Schauer, J. J., and Sioutas, C.: Oxidative potential and chemical speciation of size-resolved particulate matter (PM) at near-freeway and urban background sites in the greater Beirut area, Sci. Total Environ., 470–471, 417–426, https://doi.org/10.1016/j.scitotenv.2013.09.104, 2014.
David, L. M., Ravishankara, A. R., Kodros, J. K., Pierce, J. R., Venkataraman, C., and Sadavarte, P.: Premature Mortality Due to PM2.5 Over India: Effect of Atmospheric Transport and Anthropogenic Emissions, GeoHealth, 3, 2–10, https://doi.org/10.1029/2018GH000169, 2019.
Delfino, R. J., Sioutas, C., and Malik, S.: Potential Role of Ultrafine Particles in Associations between Airborne Particle Mass and Cardiovascular Health, Environ. Health Persp., 113, 934–946, https://doi.org/10.1289/ehp.7938, 2005.
Dhalla, N. S., Temsah, R. M., and Netticadan, T.: Role of oxidative stress in cardiovascular diseases, J. Hypertens., 18, 655–673, https://doi.org/10.1097/00004872-200018060-00002, 2000.
Díaz-Robles, L. A., Ortega, J. C., Fu, J. S., Reed, G. D., Chow, J. C., Watson, J. G., and Moncada-Herrera, J. A.: A hybrid ARIMA and artificial neural networks model to forecast particulate matter in urban areas: The case of Temuco, Chile, Atmos. Environ., 42, 8331–8340, https://doi.org/10.1016/j.atmosenv.2008.07.020, 2008.
Dionisio, K. L., Arku, R. E., Hughes, A. F., Vallarino, J., Carmichael, H., Spengler, J. D., Agyei-Mensah, S., and Ezzati, M.: Air pollution in Accra neighborhoods: spatial, socioeconomic, and temporal patterns, Environ. Sci. Technol., 44, 2270–2276, https://doi.org/10.1021/es903276s, 2010.
Donaldson, K., Stone, V., Seaton, A., and MacNee, W.: Ambient Particle Inhalation and the Cardiovascular System: Potential Mechanisms, Environ. Health Persp., 109, 523, https://doi.org/10.2307/3454663, 2001.
Dorling, S. R., Foxall, R. J., Mandic, D. P., and Cawley, G. C.: Maximum likelihood cost functions for neural network models of air quality data, Atmos. Environ., 37, 3435–3443, https://doi.org/10.1016/S1352-2310(03)00323-6, 2003.
Dou, J., Lin, P., Kuang, B.-Y., and Yu, J. Z.: Reactive Oxygen Species Production Mediated by Humic-like Substances in Atmospheric Aerosols: Enhancement Effects by Pyridine, Imidazole, and Their Derivatives, Environ. Sci. Technol., 49, 6457–6465, https://doi.org/10.1021/es5059378, 2015.
Du, Y., Xu, X., Chu, M., Guo, Y., and Wang, J.: Air particulate matter and cardiovascular disease: the epidemiological, biomedical and clinical evidence, J. Thorac. Dis., 8, E8–E19, https://doi.org/10.3978/j.issn.2072-1439.2015.11.37, 2016.
Elangasinghe, M. A., Singhal, N., Dirks, K. N., and Salmond, J. A.: Development of an ANN–based air pollution forecasting system with explicit knowledge through sensitivity analysis, Atmos. Pollut. Res., 5, 696–708, https://doi.org/10.5094/APR.2014.079, 2014.
Eldakhly, N. M., Aboul-Ela, M., and Abdalla, A.: Air Pollution Forecasting Model Based on Chance Theory and Intelligent Techniques, Int. J. Artif. Intell. T., 26, 1750024, https://doi.org/10.1142/S0218213017500245, 2017.
Etyemezian, V., Tesfaye, M., Yimer, A., Chow, J., Mesfin, D., Nega, T., Nikolich, G., Watson, J., and Wondmagegn, M.: Results from a pilot-scale air quality study in Addis Ababa, Ethiopia, Atmos. Environ., 39, 7849–7860, https://doi.org/10.1016/j.atmosenv.2005.08.033, 2005.
Fang, T., Verma, V., Bates, J. T., Abrams, J., Klein, M., Strickland, M. J., Sarnat, S. E., Chang, H. H., Mulholland, J. A., Tolbert, P. E., Russell, A. G., and Weber, R. J.: Oxidative potential of ambient water-soluble PM2.5 in the southeastern United States: contrasts in sources and health associations between ascorbic acid (AA) and dithiothreitol (DTT) assays, Atmos. Chem. Phys., 16, 3865–3879, https://doi.org/10.5194/acp-16-3865-2016, 2016.
Fang, T., Guo, H., Zeng, L., Verma, V., Nenes, A., and Weber, R. J.: Highly Acidic Ambient Particles, Soluble Metals, and Oxidative Potential: A Link between Sulfate and Aerosol Toxicity, Environ. Sci. Technol., 51, 2611–2620, https://doi.org/10.1021/acs.est.6b06151, 2017.
Favez, O., El Haddad, I., Piot, C., Boréave, A., Abidi, E., Marchand, N., Jaffrezo, J.-L., Besombes, J.-L., Personnaz, M.-B., Sciare, J., Wortham, H., George, C., and D'Anna, B.: Inter-comparison of source apportionment models for the estimation of wood burning aerosols during wintertime in an Alpine city (Grenoble, France), Atmos. Chem. Phys., 10, 5295–5314, https://doi.org/10.5194/acp-10-5295-2010, 2010.
Favez, O., Salameh, D., and Jaffrezo, J.-L.: Traitement harmonisé de jeux de données multi-sites pour l'étude de sources de PM par Positive Matrix Factorization (PMF), LCSQA, Verneuil-en-Halatte, 2017.
Faxon, C., Hammes, J., Le Breton, M., Pathak, R. K., and Hallquist, M.: Characterization of organic nitrate constituents of secondary organic aerosol (SOA) from nitrate-radical-initiated oxidation of limonene using high-resolution chemical ionization mass spectrometry, Atmos. Chem. Phys., 18, 5467–5481, https://doi.org/10.5194/acp-18-5467-2018, 2018.
Fontes, T., Silva, L. M., Silva, M. P., Barros, N., and Carvalho, A. C.: Can artificial neural networks be used to predict the origin of ozone episodes?, Sci. Total Environ., 488–489, 197–207, https://doi.org/10.1016/j.scitotenv.2014.04.077, 2014.
Gao, D., Ripley, S., Weichenthal, S., and Godri Pollitt, K. J.: Ambient particulate matter oxidative potential: Chemical determinants, associated health effects, and strategies for risk management, Free Radical Bio. Med., 151, 7–25, https://doi.org/10.1016/j.freeradbiomed.2020.04.028, 2020a.
Gao, D., Mulholland, J. A., Russell, A. G., and Weber, R. J.: Characterization of water-insoluble oxidative potential of PM2.5 using the dithiothreitol assay, Atmos. Environ., 224, 117327, https://doi.org/10.1016/j.atmosenv.2020.117327, 2020b.
García Nieto, P. J., Sánchez Lasheras, F., García-Gonzalo, E., and de Cos Juez, F. J.: PM10 concentration forecasting in the metropolitan area of Oviedo (Northern Spain) using models based on SVM, MLP, VARMA and ARIMA: A case study, Sci. Total Environ., 621, 753–761, https://doi.org/10.1016/j.scitotenv.2017.11.291, 2018.
Gardner, M. W. and Dorling, S. R.: Artificial neural networks (the multilayer perceptron) – a review of applications in the atmospheric sciences, Atmos. Environ., 32, 2627–2636, https://doi.org/10.1016/S1352-2310(97)00447-0, 1998.
Gerken, W. C., Purvis, L. K., and Butera, R. J.: Genetic algorithm for optimization and specification of a neuron model, Neurocomputing, 69, 1039–1042, https://doi.org/10.1016/j.neucom.2005.12.041, 2006.
Gianini, M. F. D., Fischer, A., Gehrig, R., Ulrich, A., Wichser, A., Piot, C., Besombes, J.-L., and Hueglin, C.: Comparative source apportionment of PM10 in Switzerland for 2008/2009 and 1998/1999 by Positive Matrix Factorisation, Atmos. Environ., 54, 149–158, https://doi.org/10.1016/j.atmosenv.2012.02.036, 2012.
Gietl, J. K. and Klemm, O.: Analysis of Traffic and Meteorology on Airborne Particulate Matter in Münster, Northwest Germany, JAPCA J. Air Waste Ma., 59, 809–818, https://doi.org/10.3155/1047-3289.59.7.809, 2009.
Grover, B. D.: Measurement of total PM2.5 mass (nonvolatile plus semivolatile) with the Filter Dynamic Measurement System tapered element oscillating microbalance monitor, J. Geophys. Res., 110, D07S03, https://doi.org/10.1029/2004JD004995, 2005.
Guo, H., Jin, L., and Huang, S.: Effect of PM characterization on PM oxidative potential by acellular assays: a review, Rev. Environ. Health, 35, 461–470, https://doi.org/10.1515/reveh-2020-0003, 2020.
Gupta, P. and Christopher, S. A.: Particulate matter air quality assessment using integrated surface, satellite, and meteorological products: 2. A neural network approach, J. Geophys. Res., 114, D20205, https://doi.org/10.1029/2008JD011497, 2009.
Gurgueira, S. A., Lawrence, J., Coull, B., Murthy, G. G. K., and González-Flecha, B.: Rapid increases in the steady-state concentration of reactive oxygen species in the lungs and heart after particulate air pollution inhalation., Environ. Health Persp., 110, 749–755, https://doi.org/10.1289/ehp.02110749, 2002.
He, H.-D., Lu, W.-Z., and Xue, Y.: Prediction of particulate matters at urban intersection by using multilayer perceptron model based on principal components, Stoch Env. Res. Risk A., 29, 2107–2114, https://doi.org/10.1007/s00477-014-0989-x, 2015.
Herich, H., Gianini, M. F. D., Piot, C., Močnik, G., Jaffrezo, J.-L., Besombes, J.-L., Prévôt, A. S. H., and Hueglin, C.: Overview of the impact of wood burning emissions on carbonaceous aerosols and PM in large parts of the Alpine region, Atmos. Environ., 89, 64–75, https://doi.org/10.1016/j.atmosenv.2014.02.008, 2014.
Hime, N., Marks, G., and Cowie, C.: A Comparison of the Health Effects of Ambient Particulate Matter Air Pollution from Five Emission Sources, Int. J. Env. Res. Pub. He., 15, 1206, https://doi.org/10.3390/ijerph15061206, 2018.
Hochreiter, S.: The Vanishing Gradient Problem During Learning Recurrent Neural Nets and Problem Solutions, Int. J. Uncertain. Fuzz., 6, 107–116, https://doi.org/10.1142/S0218488598000094, 1998.
Hochreiter, S. and Schmidhuber, J.: Long Short-Term Memory, Neural Comput., 9, 1735–1780, https://doi.org/10.1162/neco.1997.9.8.1735, 1997.
Hooyberghs, J., Mensink, C., Dumont, G., Fierens, F., and Brasseur, O.: A neural network forecast for daily average PM concentrations in Belgium, Atmos. Environ., 39, 3279–3289, https://doi.org/10.1016/j.atmosenv.2005.01.050, 2005.
Huang, C.-J. and Kuo, P.-H.: A Deep CNN-LSTM Model for Particulate Matter (PM2.5) Forecasting in Smart Cities, Sensors, 18, 2220, https://doi.org/10.3390/s18072220, 2018.
IBM: IBM SPSS Neural Networks 24, https://www.ibm.com/support/knowledgecenter/de/SSLVMB_23.0.0/spss/neural_network/idh_idd_mlp_variables.html (21 June 2021), 2016.
Janssen, N. A. H., Yang, A., Strak, M., Steenhof, M., Hellack, B., Gerlofs-Nijland, M. E., Kuhlbusch, T., Kelly, F., Harrison, R., Brunekreef, B., Hoek, G., and Cassee, F.: Oxidative potential of particulate matter collected at sites with different source characteristics, Sci. Total Environ., 472, 572–581, https://doi.org/10.1016/j.scitotenv.2013.11.099, 2014.
Jiang, H., Ahmed, C. M. S., Canchola, A., Chen, J. Y., and Lin, Y.-H.: Use of Dithiothreitol Assay to Evaluate the Oxidative Potential of Atmospheric Aerosols, Atmosphere, 10, 571, https://doi.org/10.3390/atmos10100571, 2019.
Jiang, D., Zhang, Y., Hu, X., Zeng, Y., Tan, J., and Shao, D.: Progress in developing an ANN model for air pollution index forecast, Atmos. Environ., 38, 7055–7064, https://doi.org/10.1016/j.atmosenv.2003.10.066, 2004.
Jin, X., Xue, B., Zhou, Q., Su, R., and Li, Z.: Mitochondrial damage mediated by ROS incurs bronchial epithelial cell apoptosis upon ambient PM2.5 exposure, J. Toxicol. Sci., 43, 101–111, https://doi.org/10.2131/jts.43.101, 2018.
Jovanovic, M. V., Savic, J. Z., Salimi, F., Stevanovic, S., Brown, R. A., Jovasevic-Stojanovic, M., Manojlovic, D., Bartonova, A., Bottle, S., and Ristovski, Z. D.: Measurements of Oxidative Potential of Particulate Matter at Belgrade Tunnel, Comparison of BPEAnit, DTT and DCFH Assays, Int. J. Env. Res. Pub. He., 16, 4906, https://doi.org/10.3390/ijerph16244906, 2019.
Kelly, F. J.: Oxidative stress: its role in air pollution and adverse health effects, Occup. Environ. Med., 60, 612–616, https://doi.org/10.1136/oem.60.8.612, 2003.
Kelly, F. J. and Mudway, I. S.: Protein oxidation at the air-lung interface, Amino Acids, 25, 375–396, https://doi.org/10.1007/s00726-003-0024-x, 2003.
Kim, M. and Gilley, J. E.: Artificial Neural Network estimation of soil erosion and nutrient concentrations in runoff from land application areas, Comput. Electron. Agr., 64, 268–275, https://doi.org/10.1016/j.compag.2008.05.021, 2008.
Krasnov, H., Kloog, I., Friger, M., and Katra, I.: The Spatio-Temporal Distribution of Particulate Matter during Natural Dust Episodes at an Urban Scale, PLoS ONE, 11, e0160800, https://doi.org/10.1371/journal.pone.0160800, 2016.
Kukkonen, J.: Extensive evaluation of neural network models for the prediction of NO2 and PM10 concentrations, compared with a deterministic modelling system and measurements in central Helsinki, Atmos. Environ., 37, 4539–4550, https://doi.org/10.1016/S1352-2310(03)00583-1, 2003.
Lao, X. Q., Guo, C., Chang, L., Bo, Y., Zhang, Z., Chuang, Y. C., Jiang, W. K., Lin, C., Tam, T., Lau, A. K. H., Lin, C.-Y., and Chan, T.-C.: Long-term exposure to ambient fine particulate matter (PM2.5) and incident type 2 diabetes: a longitudinal cohort study, Diabetologia, 62, 759–769, https://doi.org/10.1007/s00125-019-4825-1, 2019.
Leni, Z., Cassagnes, L. E., Daellenbach, K. R., El Haddad, I., Vlachou, A., Uzu, G., Prévôt, A. S. H., Jaffrezo, J.-L., Baumlin, N., Salathe, M., Baltensperger, U., Dommen, J., and Geiser, M.: Oxidative stress-induced inflammation in susceptible airways by anthropogenic aerosol, PLoS ONE, 15, e0233425, https://doi.org/10.1371/journal.pone.0233425, 2020.
Li, Y., Zhu, T., Zhao, J., and Xu, B.: Interactive Enhancements of Ascorbic Acid and Iron in Hydroxyl Radical Generation in Quinone Redox Cycling, Environ. Sci. Technol., 46, 10302–10309, https://doi.org/10.1021/es301834r, 2012.
Lin, M. and Yu, J. Z.: Assessment of Interactions between Transition Metals and Atmospheric Organics: Ascorbic Acid Depletion and Hydroxyl Radical Formation in Organic-Metal Mixtures, Environ. Sci. Technol., 54, 1431–1442, https://doi.org/10.1021/acs.est.9b07478, 2020.
Matus, C. P. and Oyarzún G., M.: Impacto del Material Particulado aéreo (MP2,5) sobre las hospitalizaciones por enfermedades respiratorias en niños: estudio caso-control alterno, Revista Chilena de Pediatría, 90, 166, https://doi.org/10.32641/rchped.v90i2.750, 2019.
McKendry, I. G.: Evaluation of Artificial Neural Networks for Fine Particulate Pollution (PM10 and PM2.5) Forecasting, JAPCA J. Air Waste Ma., 52, 1096–1101, https://doi.org/10.1080/10473289.2002.10470836, 2002.
Mudway, I. S., Kelly, F. J., and Holgate, S. T.: Oxidative stress in air pollution research, Free Radical Bio. Med., 151, 2–6, https://doi.org/10.1016/j.freeradbiomed.2020.04.031, 2020.
Nathan, N. S., Saravanane, R., and Sundararajan, T.: Application of ANN and MLR Models on Groundwater Quality Using CWQI at Lawspet, Puducherry in India, Journal of Geoscience and Environment Protection, 5, 99–124, https://doi.org/10.4236/gep.2017.53008, 2017.
Nel, A.: ATMOSPHERE: Enhanced: Air Pollution-Related Illness: Effects of Particles, Science, 308, 804–806, https://doi.org/10.1126/science.1108752, 2005.
Norris, G., Duvall, R., Brown, S., and Bai, S.: Positive Matrix Factorization (PMF) 5.0 Fundamentals and User Guide, US Environmental Protection Agency, Office of Research and Development, Washington, DC, 136 pp., 2014.
Ordieres, J. B., Vergara, E. P., Capuz, R. S., and Salazar, R. E.: Neural network prediction model for fine particulate matter (PM2.5) on the US–Mexico border in El Paso (Texas) and Ciudad Juárez (Chihuahua), Environ. Modell. Softw., 20, 547–559, https://doi.org/10.1016/j.envsoft.2004.03.010, 2005.
Paatero, P.: The Multilinear Engine – A Table-Driven, Least Squares Program for Solving Multilinear Problems, Including the n-Way Parallel Factor Analysis Model, J. Comput. Graph. Stat., 8, 854–888, https://doi.org/10.1080/10618600.1999.10474853, 1999.
Padhi, B. K. and Padhy, P. K.: Assessment of intra-urban variability in outdoor air quality and its health risks, Inhal Toxicol, 20, 973–979, https://doi.org/10.1080/08958370701866420, 2008.
Pant, P., Baker, S. J., Shukla, A., Maikawa, C., Godri Pollitt, K. J., and Harrison, R. M.: The PM10 fraction of road dust in the UK and India: Characterization, source profiles and oxidative potential, Sci. Total Environ., 530–531, 445–452, https://doi.org/10.1016/j.scitotenv.2015.05.084, 2015.
Papanastasiou, D. K., Melas, D., and Kioutsioukis, I.: Development and Assessment of Neural Network and Multiple Regression Models in Order to Predict PM10 Levels in a Medium-sized Mediterranean City, Water Air Soil Poll., 182, 325–334, https://doi.org/10.1007/s11270-007-9341-0, 2007.
Paraskevopoulou, D., Bougiatioti, A., Stavroulas, I., Fang, T., Lianou, M., Liakakou, E., Gerasopoulos, E., Weber, R., Nenes, A., and Mihalopoulos, N.: Yearlong variability of oxidative potential of particulate matter in an urban Mediterranean environment, Atmos. Environ., 206, 183–196, https://doi.org/10.1016/j.atmosenv.2019.02.027, 2019.
Park, M., Joo, H. S., Lee, K., Jang, M., Kim, S. D., Kim, I., Borlaza, L. J. S., Lim, H., Shin, H., Chung, K. H., Choi, Y.-H., Park, S. G., Bae, M.-S., Lee, J., Song, H., and Park, K.: Differential toxicities of fine particulate matters from various sources, Sci. Rep., 8, 17007, https://doi.org/10.1038/s41598-018-35398-0, 2018.
Pennino, M. J., Kaushal, S. S., Murthy, S. N., Blomquist, J. D., Cornwell, J. C., and Harris, L. A.: Sources and transformations of anthropogenic nitrogen along an urban river–estuarine continuum, Biogeosciences, 13, 6211–6228, https://doi.org/10.5194/bg-13-6211-2016, 2016.
Perez, P. and Reyes, J.: An integrated neural network model for PM10 forecasting, Atmos. Environ., 40, 2845–2851, https://doi.org/10.1016/j.atmosenv.2006.01.010, 2006.
Perrone, M. G., Zhou, J., Malandrino, M., Sangiorgi, G., Rizzi, C., Ferrero, L., Dommen, J., and Bolzacchini, E.: PM chemical composition and oxidative potential of the soluble fraction of particles at two sites in the urban area of Milan, Northern Italy, Atmos. Environ., 128, 104–113, https://doi.org/10.1016/j.atmosenv.2015.12.040, 2016.
Piao, M. J., Ahn, M. J., Kang, K. A., Ryu, Y. S., Hyun, Y. J., Shilnikova, K., Zhen, A. X., Jeong, J. W., Choi, Y. H., Kang, H. K., Koh, Y. S., and Hyun, J. W.: Particulate matter 2.5 damages skin cells by inducing oxidative stress, subcellular organelle dysfunction, and apoptosis, Arch. Toxikol., 92, 2077–2091, https://doi.org/10.1007/s00204-018-2197-9, 2018.
Pietrogrande, M. C., Russo, M., and Zagatti, E.: Review of PM Oxidative Potential Measured with Acellular Assays in Urban and Rural Sites across Italy, Atmosphere, 10, 626, https://doi.org/10.3390/atmos10100626, 2019.
Pietrogrande, M. C., Perrone, M. R., Manarini, F., Romano, S., Udisti, R., and Becagli, S.: PM10 oxidative potential at a Central Mediterranean Site: Association with chemical composition and meteorological parameters, Atmos. Environ., 188, 97–111, https://doi.org/10.1016/j.atmosenv.2018.06.013, 2018.
Pope III, C. A.: Lung Cancer, Cardiopulmonary Mortality, and Long-term Exposure to Fine Particulate Air Pollution, JAMA, 287, 1132, https://doi.org/10.1001/jama.287.9.1132, 2002.
Pope III, C. A., Ezzati, M., and Dockery, D. W.: Fine-Particulate Air Pollution and Life Expectancy in the United States, New Engl. J. Med., 360, 376–386, https://doi.org/10.1056/NEJMsa0805646, 2009.
Priestley, M., Le Breton, M., Bannan, T. J., Leather, K. E., Bacak, A., Reyes-Villegas, E., De Vocht, F., Shallcross, B. M. A., Brazier, T., Anwar Khan, M., Allan, J., Shallcross, D. E., Coe, H., and Percival, C. J.: Observations of Isocyanate, Amide, Nitrate, and Nitro Compounds From an Anthropogenic Biomass Burning Event Using a ToF-CIMS, J. Geophys. Res.-Atmos., 123, 7687–7704, https://doi.org/10.1002/2017JD027316, 2018.
Qiao, F., Li, Q., and Lei, Y.: Particulate Matter Caused Health Risk in an Urban Area of the Middle East and the Challenges in Reducing its Anthropogenic Emissions, Environment Pollution and Climate Change, 2, 1000145, https://doi.org/10.4172/2573-458X.1000145, 2018.
Rahimi, A.: Short-term prediction of NO2 and NOx concentrations using multilayer perceptron neural network: a case study of Tabriz, Iran, Ecological Processes, 6, 4, https://doi.org/10.1186/s13717-016-0069-x, 2017.
Rohr, A. C. and Wyzga, R. E.: Attributing health effects to individual particulate matter constituents, Atmos. Environ., 62, 130–152, https://doi.org/10.1016/j.atmosenv.2012.07.036, 2012.
Salazar-Ruiz, E., Ordieres, J. B., Vergara, E. P., and Capuz-Rizo, S. F.: Development and comparative analysis of tropospheric ozone prediction models using linear and artificial intelligence-based models in Mexicali, Baja California (Mexico) and Calexico, California (US), Environ. Modell. Softw., 23, 1056–1069, https://doi.org/10.1016/j.envsoft.2007.11.009, 2008.
Samake, A., Uzu, G., Martins, J. M. F., Calas, A., Vince, E., Parat, S., and Jaffrezo, J. L.: The unexpected role of bioaerosols in the Oxidative Potential of PM, Scientific Reports, 7, 10978, https://doi.org/10.1038/s41598-017-11178-0, 2017.
Schwela, D.: Air Pollution and Health in Urban Areas, Rev. Environ. Health, 15, 13–42, https://doi.org/10.1515/REVEH.2000.15.1-2.13, 2000.
Seo, I., Lee, K., Bae, M.-S., Park, M., Maskey, S., Seo, A., Borlaza, L. J. S., Cosep, E. M. R., and Park, K.: Comparison of physical and chemical characteristics and oxidative potential of fine particles emitted from rice straw and pine stem burning, Environ. Pollut., 267, 115599, https://doi.org/10.1016/j.envpol.2020.115599, 2020.
Shi, T., Duffin, R., Borm, P. J. A., Li, H., Weishaupt, C., and Schins, R. P. F.: Hydroxyl-radical-dependent DNA damage by ambient particulate matter from contrasting sampling locations, Environ. Res., 101, 18–24, https://doi.org/10.1016/j.envres.2005.09.005, 2006.
Shiraiwa, M., Ueda, K., Pozzer, A., Lammel, G., Kampf, C. J., Fushimi, A., Enami, S., Arangio, A. M., Fröhlich-Nowoisky, J., Fujitani, Y., Furuyama, A., Lakey, P. S. J., Lelieveld, J., Lucas, K., Morino, Y., Pöschl, U., Takahama, S., Takami, A., Tong, H., Weber, B., Yoshino, A., and Sato, K.: Aerosol Health Effects from Molecular to Global Scales, Environ. Sci. Technol., 51, 13545–13567, https://doi.org/10.1021/acs.est.7b04417, 2017.
Simonetti, G., Conte, E., Perrino, C., and Canepari, S.: Oxidative potential of size-segregated PM in an urban and an industrial area of Italy, Atmos. Environ., 187, 292–300, https://doi.org/10.1016/j.atmosenv.2018.05.051, 2018.
Slini, T., Kaprara, A., Karatzas, K., and Moussiopoulos, N.: PM10 forecasting for Thessaloniki, Greece, Environ. Modell. Softw., 21, 559–565, https://doi.org/10.1016/j.envsoft.2004.06.011, 2006.
Srivastava, D., Tomaz, S., Favez, O., Lanzafame, G. M., Golly, B., Besombes, J.-L., Alleman, L. Y., Jaffrezo, J.-L., Jacob, V., Perraudin, E., Villenave, E., and Albinet, A.: Speciation of organic fraction does matter for source apportionment. Part 1: A one-year campaign in Grenoble (France), Sci. Total Environ., 624, 1598–1611, https://doi.org/10.1016/j.scitotenv.2017.12.135, 2018.
Tomaz, S., Shahpoury, P., Jaffrezo, J.-L., Lammel, G., Perraudin, E., Villenave, E., and Albinet, A.: One-year study of polycyclic aromatic compounds at an urban site in Grenoble (France): Seasonal variations, gas/particle partitioning and cancer risk estimation, Sci. Total Environ., 565, 1071–1083, https://doi.org/10.1016/j.scitotenv.2016.05.137, 2016.
Tomaz, S., Jaffrezo, J.-L., Favez, O., Perraudin, E., Villenave, E., and Albinet, A.: Sources and atmospheric chemistry of oxy- and nitro-PAHs in the ambient air of Grenoble (France), Atmos. Environ., 161, 144–154, https://doi.org/10.1016/j.atmosenv.2017.04.042, 2017.
Tuet, W. Y., Chen, Y., Xu, L., Fok, S., Gao, D., Weber, R. J., and Ng, N. L.: Chemical oxidative potential of secondary organic aerosol (SOA) generated from the photooxidation of biogenic and anthropogenic volatile organic compounds, Atmos. Chem. Phys., 17, 839–853, https://doi.org/10.5194/acp-17-839-2017, 2017.
Valavanidis, A., Fiotakis, K., and Vlachogianni, T.: Airborne Particulate Matter and Human Health: Toxicological Assessment and Importance of Size and Composition of Particles for Oxidative Damage and Carcinogenic Mechanisms, J. Environ. Sci. Heal. C, 26, 339–362, https://doi.org/10.1080/10590500802494538, 2008.
Valko, M., Morris, H., and Cronin, M.: Metals, Toxicity and Oxidative Stress, Curr. Med. Chem., 12, 1161–1208, https://doi.org/10.2174/0929867053764635, 2005.
Vakili, M., Sabbagh-Yazdi, S.-R., Kalhor, K., and Khosrojerdi, S.: Using Artificial Neural Networks for Prediction of Global Solar Radiation in Tehran Considering Particulate Matter Air Pollution, Energy Proced., 74, 1205–1212, https://doi.org/10.1016/j.egypro.2015.07.764, 2015.
Verma, V., Fang, T., Guo, H., King, L., Bates, J. T., Peltier, R. E., Edgerton, E., Russell, A. G., and Weber, R. J.: Reactive oxygen species associated with water-soluble PM2.5 in the southeastern United States: spatiotemporal trends and source apportionment, Atmos. Chem. Phys., 14, 12915–12930, https://doi.org/10.5194/acp-14-12915-2014, 2014.
Visentin, M., Pagnoni, A., Sarti, E., and Pietrogrande, M. C.: Urban PM2.5 oxidative potential: Importance of chemical species and comparison of two spectrophotometric cell-free assays, Environ. Pollut., 219, 72–79, https://doi.org/10.1016/j.envpol.2016.09.047, 2016.
Waked, A., Favez, O., Alleman, L. Y., Piot, C., Petit, J.-E., Delaunay, T., Verlinden, E., Golly, B., Besombes, J.-L., Jaffrezo, J.-L., and Leoz-Garziandia, E.: Source apportionment of PM10 in a north-western Europe regional urban background site (Lens, France) using positive matrix factorization and including primary biogenic emissions, Atmos. Chem. Phys., 14, 3325–3346, https://doi.org/10.5194/acp-14-3325-2014, 2014.
Weber, S., Uzu, G., Calas, A., Chevrier, F., Besombes, J.-L., Charron, A., Salameh, D., Ježek, I., Močnik, G., and Jaffrezo, J.-L.: An apportionment method for the oxidative potential of atmospheric particulate matter sources: application to a one-year study in Chamonix, France, Atmos. Chem. Phys., 18, 9617–9629, https://doi.org/10.5194/acp-18-9617-2018, 2018.
Weber, S., Salameh, D., Albinet, A., Alleman, L. Y., Waked, A., Besombes, J.-L., Jacob, V., Guillaud, G., Meshbah, B., Rocq, B., Hulin, A., Dominik-Sègue, M., Chrétien, E., Jaffrezo, J.-L., and Favez, O.: Comparison of PM10 Sources Profiles at 15 French Sites Using a Harmonized Constrained Positive Matrix Factorization Approach, Atmosphere, 10, 310, https://doi.org/10.3390/atmos10060310, 2019.
Weber, S., Uzu, G., Favez, O., Borlaza, L. J., Calas, A., Salameh, D., Chevrier, F., Allard, J., Besombes, J.-L., Albinet, A., Pontet, S., Mesbah, B., Gille, G., Zhang, S., Pallares, C., Leoz-Garziandia, E., and Jaffrezo, J.-L.: Source apportionment of atmospheric PM10 Oxidative Potential: synthesis of 15 year-round urban datasets in France, Atmos. Chem. Phys. Discuss. [preprint], https://doi.org/10.5194/acp-2021-77, in review, 2021.
Winterbottom, C. J., Shah, R. J., Patterson, K. C., Kreider, M. E., Panettieri, R. A., Rivera-Lebron, B., Miller, W. T., Litzky, L. A., Penning, T. M., Heinlen, K., Jackson, T., Localio, A. R., and Christie, J. D.: Exposure to Ambient Particulate Matter Is Associated With Accelerated Functional Decline in Idiopathic Pulmonary Fibrosis, Chest, 153, 1221–1228, https://doi.org/10.1016/j.chest.2017.07.034, 2018.
Xiong, Q., Yu, H., Wang, R., Wei, J., and Verma, V.: Rethinking Dithiothreitol-Based Particulate Matter Oxidative Potential: Measuring Dithiothreitol Consumption versus Reactive Oxygen Species Generation, Environ. Sci. Technol., 51, 6507–6514, https://doi.org/10.1021/acs.est.7b01272, 2017.
Yang, A., Wang, M., Eeftens, M., Beelen, R., Dons, E., Leseman, D. L. A. C., Brunekreef, B., Cassee, F. R., Janssen, N. A. H., and Hoek, G.: Spatial Variation and Land Use Regression Modeling of the Oxidative Potential of Fine Particles, Environ. Health Persp., 123, 1187–1192, https://doi.org/10.1289/ehp.1408916, 2015.
Yu, H., Wei, J., Cheng, Y., Subedi, K., and Verma, V.: Synergistic and Antagonistic Interactions among the Particulate Matter Components in Generating Reactive Oxygen Species Based on the Dithiothreitol Assay, Environ. Sci. Technol., 52, 2261–2270, https://doi.org/10.1021/acs.est.7b04261, 2018.
Yu, S., Liu, W., Xu, Y., Yi, K., Zhou, M., Tao, S., and Liu, W.: Characteristics and oxidative potential of atmospheric PM2.5 in Beijing: Source apportionment and seasonal variation, Sci. Total Environ., 650, 277–287, https://doi.org/10.1016/j.scitotenv.2018.09.021, 2019.
Zhou, J., Elser, M., Huang, R.-J., Krapf, M., Fröhlich, R., Bhattu, D., Stefenelli, G., Zotter, P., Bruns, E. A., Pieber, S. M., Ni, H., Wang, Q., Wang, Y., Zhou, Y., Chen, C., Xiao, M., Slowik, J. G., Brown, S., Cassagnes, L.-E., Daellenbach, K. R., Nussbaumer, T., Geiser, M., Prévôt, A. S. H., El-Haddad, I., Cao, J., Baltensperger, U., and Dommen, J.: Predominance of secondary organic aerosol to particle-bound reactive oxygen species activity in fine ambient aerosol, Atmos. Chem. Phys., 19, 14703–14720, https://doi.org/10.5194/acp-19-14703-2019, 2019.