the Creative Commons Attribution 4.0 License.
the Creative Commons Attribution 4.0 License.
 | 14 Jun 2021
Co-emission of volcanic sulfur and halogens amplifies volcanic effective radiative forcing
Thomas J. Aubry
Youngsub M. Shin
James Weber
Lauren R. Marshall
Nathan Luke Abraham
Alex Archibald
Anja Schmidt
The evolution of volcanic sulfur and the resulting radiative forcing following explosive volcanic eruptions is well understood. Petrological evidence suggests that significant amounts of halogens may be co-emitted alongside sulfur in some explosive volcanic eruptions, and satellite evidence indicates that detectable amounts of these halogens may reach the stratosphere. In this study, we utilise an aerosol–chemistry–climate model to simulate stratospheric volcanic eruption emission scenarios of two sizes, both with and without co-emission of volcanic halogens, in order to understand how co-emitted halogens may alter the life cycle of volcanic sulfur, stratospheric chemistry, and the resulting radiative forcing. We simulate a large (10 Tg of SO2) and very large (56 Tg of SO2) sulfur-only eruption scenario and a corresponding large (10 Tg SO2, 1.5 Tg HCl, 0.0086 Tg HBr) and very large (56 Tg SO2, 15 Tg HCl, 0.086 Tg HBr) co-emission eruption scenario. The eruption scenarios simulated in this work are hypothetical, but they are comparable to Volcanic Explosivity Index (VEI) 6 (e.g. 1991 Mt Pinatubo) and VEI 7 (e.g. 1257 Mt Samalas) eruptions, representing 1-in-50–100-year and 1-in-500–1000-year events, respectively, with plausible amounts of co-emitted halogens based on satellite observations and volcanic plume modelling.
We show that co-emission of volcanic halogens and sulfur into the stratosphere increases the volcanic effective radiative forcing (ERF) by 24 % and 30 % in large and very large co-emission scenarios compared to sulfur-only emission. This is caused by an increase in both the forcing from volcanic aerosol–radiation interactions (ERFari) and composition of the stratosphere (ERFclear,clean). Volcanic halogens catalyse the destruction of stratospheric ozone, which results in significant stratospheric cooling, offsetting the aerosol heating simulated in sulfur-only scenarios and resulting in net stratospheric cooling. The ozone-induced stratospheric cooling prevents aerosol self-lofting and keeps the volcanic aerosol lower in the stratosphere with a shorter lifetime. This results in reduced growth by condensation and coagulation and a smaller peak global-mean effective radius compared to sulfur-only simulations. The smaller effective radius found in both co-emission scenarios is closer to the peak scattering efficiency radius of sulfate aerosol, and thus co-emission of halogens results in larger peak global-mean ERFari (6 % and 8 %). Co-emission of volcanic halogens results in significant stratospheric ozone, methane, and water vapour reductions, resulting in significant increases in peak global-mean ERFclear,clean (> 100 %), predominantly due to ozone loss. The dramatic global-mean ozone depletion simulated in large (22 %) and very large (57 %) co-emission scenarios would result in very high levels of UV exposure on the Earth's surface, with important implications for society and the biosphere.
This work shows for the first time that co-emission of plausible amounts of volcanic halogens can amplify the volcanic ERF in simulations of explosive eruptions. It highlights the need to include volcanic halogen emissions when simulating the climate impacts of past or future eruptions, as well as the necessity to maintain space-borne observations of stratospheric compounds to better constrain the stratospheric injection estimates of volcanic eruptions.
- Article
(6942 KB) - Full-text XML
-
Supplement
(1820 KB) - BibTeX
- EndNote


Sulfur gases emitted into the atmosphere by volcanic eruptions have a strong direct climate impact through the formation of sulfuric acid aerosol, which reflect incoming sunlight and cool the Earth's surface (Robock, 2000). Volcanic aerosols also have the potential to alter the chemistry of the stratosphere, including ozone with significant impacts on both longwave and shortwave radiative fluxes. Ozone is impacted dynamically by stratospheric circulation changes induced by aerosol heating and chemically by changes to ozone catalytic loss cycles. Aerosol heating in the tropics increases the vertical ascent transporting ozone to higher altitudes and latitudes, resulting in an ozone decrease in the tropics and an increase at high latitudes (Kinne et al., 1992). The addition of large amounts of volcanic aerosols increases the surface area of the stratosphere on which heterogeneous reactions can take place (Solomon, 1999). Heterogeneous reactions in the stratosphere drive changes in the partitioning of NOx, ClOx, BrOx, and HOx species between reservoir and active forms. Unlike polar stratospheric clouds (PSCs), which only occur in the extremely cold temperatures inside the winter polar vortex, volcanic aerosols provide surfaces for heterogeneous reactions at all latitudes and at all times of the year. N2O5 reacts with water vapour on the surfaces of these volcanic aerosols to form HNO3. This effectively sequesters reactive NOx species into a long-lived reservoir and limits the availability of NOx radicals which take part in catalytic ozone loss reactions, reducing the chemical destruction of ozone (Crutzen, 1970). In contrast, these reactions liberate reactive ClOx and BrOx species from their long-lived reservoirs, increasing the chemical destruction of ozone (Aquila et al., 2013; Solomon, 1999; Solomon et al., 1996). The net chemical impact of volcanic sulfate aerosol loading on stratospheric ozone is dependent on the stratospheric halogen loading. A large volcanic eruption in low-halogen atmospheric conditions, such as a pre-industrial or future atmosphere, is expected to result in a net stratospheric ozone increase (Langematz, 2018); however, when the halogen loading of the stratosphere is high, an eruption will lead to a net stratospheric ozone decrease (e.g. Tie and Brasseur, 1995). High-halogen loading may arise from anthropogenic or natural emissions.
Petrological data suggest that volcanic eruptions in some geological settings may also release substantial amounts of halogen gases into the atmosphere (Krüger et al., 2015; Kutterolf et al., 2013, 2015). Petrological analysis of the 1257 Mt Samalas eruption suggests as much as 227 Tg of hydrogen chloride (HCl) and 1.3 Tg of hydrogen bromide (HBr) could have been emitted into the atmosphere alongside 158 Tg of sulfur dioxide (SO2) (Vidal et al., 2016). The portion of the halogens erupted at the vent that reach the stratosphere (hereafter halogen injection efficiency) is not well constrained and has been the subject of debate in the community for decades. Halogens are soluble (especially HCl) and may be scavenged by water, ice hydrometeors, and ash in the volcanic plume (Halmer et al., 2002). Despite efficient scavenging, direct stratospheric injection of volcanic halogens is predicted theoretically, and sophisticated plume models suggest that between 10 % and 20 % of the HCl emitted at the vent of large explosive eruptions could reach the stratosphere (Textor et al., 2003).
Aircraft measurements following the 2000 Mt Hekla eruption in Iceland showed that 75 % of the HCl emitted at the vent entered the lower stratosphere and was still present 35 h after the eruption, suggesting that little scrubbing took place in the tropospheric eruption column (Hunton et al., 2005; Rose et al., 2006). Read et al. (2009) used retrievals from the Microwave Limb Sounder (MLS) to show that SO2 and HCl was injected directly into the lower stratosphere during the 2004 Manam, 2007 Anatahan, 2008 Soufrière Hills, 2008 Okmok, 2008 Kasatochi, 2009 Redoubt, and 2009 Sarychev eruptions. Using retrievals from MLS, Prata et al. (2007) reported HCl at ∼ 20 km in the volcanic plume of the 2006 Soufrière Hills eruption, with stratospheric HCl:SO2 gas ratios < 0.1. Carn et al. (2016) reported MLS stratospheric HCl:SO2 gas ratios of 0.01–0.03 (relative mixing ratios) for 14 small eruptions in the period between 2005 and 2014. Limitations with the field of view and spatial sampling of MLS mean these observed ratios are likely an underestimate (Carn et al., 2016).
Petrological analysis in Bacon et al. (1992) suggested that the considerably larger, Volcanic Explosivity Index (VEI) 7, 7.6 kya eruption of Mt Mazama degassed ∼ 100 Tg of Cl, and the ice core record of the same eruption suggested 8.1 Tg Cl and 57.5 Tg SO2 were injected into the stratosphere with a halogen injection efficiency of 8.1 % and a stratospheric HCl:SO2 molar ratio of ∼ 0.3 (Zdanowicz et al., 1999). The two largest eruptions in the satellite era, 1982 El Chichón and 1991 Mt Pinatubo, highlight the variability in stratospheric halogen injection following explosive volcanic eruptions. Both eruptions released relatively small amounts of halogens, 1.8 Tg (Varekamp et al., 1984) and 4.5 Tg of chlorine, respectively, with HCl:SO2 molar ratios of ∼ 0.4 (Mankin et al., 1992). Spectroscopic measurements of the El Chichón stratospheric eruption plume indicated an HCl increase of 40 % compared to measurements taken prior to the eruption, with a stratospheric injection of > 0.04 Tg of HCl and a halogen injection efficiency of at least 2.5 % (Mankin and Coffey, 1984; Woods et al., 1985). Woods et al. (1985) measured NaCl salt particles in the lower stratospheric eruption cloud of El Chichón derived from the chlorine-rich magma. They hypothesised that the rapid ascent of large Plinian eruption phases led to the formation of ice-bearing crystals and salt particles, which would lower the halogen scrubbing efficiency and preserve the halogens for stratospheric release. In the stratosphere, these salt particles may react with volcanic sulfuric acid, leading to the formation of secondary HCl. In contrast, despite emitting more Cl into the atmosphere than El Chichón, observations following the 1991 Mt Pinatubo eruption showed minimal stratospheric halogen injection, due to the fact that halogens were more efficiently scavenged in the eruption cloud (Wallace and Livingston, 1992). The Pinatubo eruption occurred at the same time and in the same location as a typhoon in the Philippines, and it is thought these very wet tropospheric conditions led to the effective washout of halogens (Gerlach et al., 1996; McCormick et al., 1995; Self et al., 1996).
Overall, current datasets show that the stratospheric injection of volcanic halogens is highly variable and depends on both the total mass of halogens released at the vent and the degree of scavenging, which is determined by the geochemistry of the volcano and the prevailing atmospheric conditions during the eruption, particularly the humidity. It is clear, however, that volcanic halogens are injected into the stratosphere after some volcanic eruptions, but there is limited research into how these volcanic halogens may alter the volcanic aerosol microphysics, stratospheric chemistry, and volcanic forcing.
Lurton et al. (2018) simulated the 2009 Sarychev Peak eruption (0.9 Tg of SO2) in CESM1(WACCM) (Community Earth System Model, Whole Atmosphere Community Climate Model) and showed how inclusion of co-emitted halogens (27 Gg of HCl) resulted in a lengthening of the SO2 lifetime, due to the further depletion of OH, and a corresponding delay in the formation of aerosols, giving better agreement between modelled and observed SO2 burden and showing how co-emitted halogens could impact volcanic sulfur processing.
Tie and Brasseur (1995) utilised model calculations to show how background atmospheric chlorine loadings altered the ozone response to volcanic sulfur injections. In conditions typical of the pre-1980 period, the ozone column abundance was shown to increase after a large volcanic eruption. The increase in column abundance was the result of suppression of the NOx-catalysed ozone loss cycle, which was driven by the sequestration of reactive nitrogen to its reservoir species via heterogeneous reactions on the surface of volcanic aerosol. The ozone response was shown to be independent of the magnitude of the eruption, as the heterogeneous conversion of active nitrogen to its reservoir was saturated. However, after 1980, higher background chlorine levels resulting from the anthropogenic emissions of chlorofluorocarbons meant that the ozone response became negative in winter at mid- and high latitudes. The suppression of NOx-catalysed ozone loss was counterbalanced by an increase in the ClOx-catalysed ozone loss, resulting in a transition in the column ozone response. Unlike in pre-industrial conditions, the ozone response was dependent on the eruption size as the heterogeneous conversion of chlorine species from reservoir to reactive was not saturated. Since then, a number of studies have investigated the impact of volcanic halogens on stratospheric ozone. Cadoux et al. (2015) petrologically determined chlorine and bromine degassing budgets for the Bronze Age (∼ 1600 BCE) Santorini eruption and, using a halogen injection efficiency of 2 %, input 36 Tg S, 13.5 Tg Cl, and 0.02 Tg Br uniformly between the tropopause and 35 km in a pre-industrial background state within a 2D chemical transport model (CTM). They simulated ozone depletion lasting a decade with a peak global mean of 20 %–90 % over the Northern Hemisphere. The molar ratio of HCl and SO2 injected into the stratosphere (HCl:SO2) in this study was 0.64, which is considerably larger than observations from MLS (< 0.1) and ice core records of Mt Mazama (< 0.3). Klobas et al. (2017) also used a 2D CTM to study the impact that co-emission of volcanic halogens has on column ozone in contemporary and future background states. They simulated hypothetical Pinatubo-sized eruptions with a HCl:SO2 of ∼ 0.14 and reported global ozone depletion lasting ∼ 2–3 years with a peak of 20 %. These CTM studies used prescribed wind fields and, as a result, do not include the important interactive feedbacks of radiation and dynamics which alter the transport of tracers and thus the composition of the atmosphere. Ming et al. (2020) simulated explosive tropical eruptions in a chemistry–climate model which consisted of the UK Met Office Unified Model (UM) together with the United Kingdom Chemistry and Aerosol (UKCA) scheme, including the interactive stratospheric aerosol model GLOMAP-mode (Mann et al., 2010). They simulated six sets of experiments – low SO2 (10 Tg) and high SO2 (100 Tg) eruptions paired with no HCl, low HCl (0.02 Tg), and high HCl (2 Tg) – and reported significant ozone depletion over both poles for at least 4 years in the high-SO2 and high-HCl experiment. Brenna et al. (2019) used CESM1(WACCM) with prescribed volcanic aerosols and sea surface temperatures (SSTs) to simulate an average eruption of a Central American Volcanic Arc volcano in a pre-industrial background state, with a 10 % halogen injection efficiency (2.5 Tg Cl, 9.5 Gg Br). They found ozone depletion of up to 20 % globally for 10 years, with ozone hole conditions over the tropics and Antarctica. Consequently, UV radiation increases of > 80 % were simulated in the tropics, averaging to > 40 % for 2 years.
However, these studies did not investigate how volcanic halogens may interact with the sulfur aerosol life cycle and modulate volcanic forcing. Brenna et al. (2020) used CESM2(WACCM6) (Community Earth System Model version 2, Whole Atmosphere Community Climate Model version 6) to investigate the coupling and feedback between volcanic aerosol, chemistry, radiation, and climate pre-industrial background state. They investigate the combined effect of the sulfur (523 Tg S) and halogen (120 Tg Cl, 0.2 Tg Br) emissions of the Los Chocoyos super-eruption, assuming a 10 % halogen injection efficiency resulting in a stratospheric HCl:SO2 molar ratio ∼ 0.4, on volcanic gases, ozone, and surface UV. Compared to simulations with sulfur-only injections, they simulate a lower peak sulfate burden attributed to the delay in SO2 oxidation but with the same total sulfur lifetime and aerosol effective radius. Thus, the co-emission of halogens results in a smaller radiative forcing: 20 % lower compared to sulfur-only. Wade et al. (2020) compared HadGEM3-ES (Earth System configuration of the Hadley Centre Global Environment Model version 3) simulations of the 1257 Mt Samalas eruption, utilising the halogen degassing estimates from Vidal et al. (2016) and stratospheric halogen injection efficiencies of 20 % and 1 %, with the available surface temperature proxies. Their results suggest it is unlikely that 20 % of degassed halogens reached the stratosphere, but smaller fractions gave good agreement with multi-proxy surface temperature records.
The aim of this study is to simulate hypothetical large- and very-large-sized eruptions, both with and without halogens, in a coupled chemistry–aerosol model in order to investigate how the co-emission of volcanic sulfur and halogens alters the evolution of volcanic aerosol, ozone, stratospheric composition, and the consequential radiative forcing and UV flux.
2.1 Model description
This study uses UKESM-AMIP, the atmosphere-only configuration of the UK Earth System Model UKESM1.0 (Sellar et al., 2019) including coupled aerosol–chemistry–climate components consisting of the United Kingdom Chemistry and Aerosol (UKCA) module together with the UK Met Office Unified Model (UM). The UKCA module is run at UM version 11.2 with the combined stratosphere and troposphere chemistry (StratTrop) scheme (Archibald et al., 2020). The model is free-running in the atmosphere, forced by sea ice and sea surface temperature surface boundary conditions, similar to the set-up used in the UK Earth System Model (UKESM1) Atmospheric Model Intercomparison Project (AMIP) simulations submitted to the Coupled Model Intercomparison Project Phase 6 (CMIP6) (Sellar et al., 2019, 2020). The resolution was 1.875∘ longitude by 1.25∘ latitude with 85 vertical levels extending from the surface to 85 km. The dynamics of the stratosphere have previously been shown to be well represented in this model, and it has an internally generated Quasi-Biennial Oscillation (QBO; Osprey et al., 2013) The model includes the fully interactive stratospheric GLOMAP-mode aerosol scheme, which simulates microphysical processes including the formation, growth, transport, and loss of aerosol (Dhomse et al., 2014). GLOMAP-mode also calculates aerosol optical properties online, which are used to calculate direct and indirect radiative effects (Mulcahy et al., 2020).
In UKCA, stratospheric ozone concentrations are determined by sets of photochemical reactions as well as ozone-destroying catalytic cycles involving chlorine, bromine, nitrogen, and hydrogen radical species (Archibald et al., 2020). Photolysis reactions in UKCA utilise rates calculated from a combination of the FAST-JX scheme and lookup tables (Telford et al., 2013). Ozone-depleting radical species are produced by the photolysis of halogen-containing compounds reacting on the surface of stratospheric aerosols, including hydrochloric acid (HCl), chlorine nitrate (ClONO2), hydrogen bromide (HBr), and bromine nitrate (BrONO2). Heterogeneous reactions in the presence of polar stratospheric clouds (PSCs) in the polar lower stratosphere or in the presence of sulfate aerosol following explosive volcanic eruptions are also important for stratospheric ozone concentrations. Eight additional heterogeneous reactions involving chlorine and bromine species were added as described in Ming et al. (2020), with the main change being the explicit treatment of the reactions of four additional chemical species – Cl2, Br2, ClNO2, and BrNO2 – which are photolysed to produce Cl and Br radicals.
Volcanic effective radiative forcings (hereafter ERFs) are calculated as differences (Δ) in the net top-of-atmosphere (TOA) radiative fluxes (F) between perturbed and control climatologies as follows:
Volcanic ERF is decomposed as described in Schmidt et al. (2018) and Ghan (2013) as follows:
This decomposition is enabled by implementing extra calls to the radiation scheme as recommended by Ghan (2013) to obtain Fclean and Fclear,clean, where Fclean denotes a radiation flux diagnostic calculation without aerosol–radiation interactions but including aerosol–cloud interactions through microphysics, and Fclear,clean denotes a radiation flux diagnostic calculation that ignores both aerosol–radiation and cloud–radiation interactions. Thus, F−Fclean determines the impact of all aerosols, and Δ(F−Fclean) is an estimate of the forcing from volcanic aerosol–radiation interactions (ERFari). The second term, Δ(Fclean−Fclean,clear), represents the difference in the clean-sky cloud radiative forcing and is an estimate of the aerosol–cloud interactions (ERFaci) due to volcanic emissions. The third term, ERFclear,clean, accounts for changes not directly due to aerosol or cloud interactions, largely the result of changes in surface albedo and atmospheric composition.
2.2 Experimental design
We utilise atmosphere-only, time-slice experiments whereby the SST, sea ice fraction and depth, surface emissions, and lower boundary conditions are prescribed using climatologies calculated using data from the fully coupled UKESM1.0 historical runs produced for CMIP6 (Eyring et al., 2016) and averaged over the years 1990 to 2000. By averaging over the decade the atmosphere-only simulations are forced with boundary conditions typical of the recent historical period but not a specific date within that decade. The fully coupled transient simulations had internally generated El Niño and La Niña cycles; however, averaging the SSTs over the 1990 to 2000 period resulted in a permanent neutral signal in the SST pattern (see Fig. S1 in the Supplement). The 1990s, and thus these time slices, were characterised by high background halogen levels due to anthropogenic emissions of chlorofluorocarbons (CFCs) throughout the preceding decade. The impacts of very-short-lived Bromine species are accounted for by adding a fixed contribution of 5 pptv into the CH3Br surface concentration.
A control simulation was initialised from the January 1995 initialisation file taken from the UKESM1.0 historical scenario which was run as part of CMIP6 (Eyring et al., 2016). The model was allowed to spin up for 15 years, and a control simulation was run for a further 20 years. The effect of explosive volcanic eruptions was investigated by running a series of 10-year volcanic perturbation simulations spun off from 6 different years in the control run to represent the variability in QBO states. Changes are plotted as the difference between the average of the six ensembles and a climatology derived from the 20-year control run, and cumulative forcings are calculated as the time-integrated forcing across the Earth's surface and represent the total energy loss (J) as a result of the volcanic eruption.
The volcanic emissions are prescribed by direct injection of SO2, HCl, and HBr into the stratosphere with a Gaussian vertical distribution centred on 21 km and a width of 2.1 km (10 % of the height), lasting for 24 h on 1 July. An injection altitude of 21 km was chosen as, allowing for lofting, this results in a volcanic plume altitude consistent with recent historical eruptions from the satellite era (Guo et al., 2004). The gases were injected in the tropics (5∘ S latitude and 0∘ longitude) to represent a typical tropical explosive eruption (Newhall et al., 2018).
Table 1Showing the eruption masses of SO2, HCl, and HBr in Tg for the four sets of experiments.

Since historical stratospheric volcanic SO2 fluxes are variable and the volcanic flux of HCl and HBr into the stratosphere remains uncertain, we developed a simulation matrix that spans a range of possible explosive volcanic emissions. The four sets of experiments have one large SO2 (10 Tg) and one very large SO2 (56 Tg) emission scenario both with (HAL10 and HAL56) and without halogens (SULF10 and SULF56), as shown in Table 1. These eruption sizes (10 and 56 Tg SO2) are hypothetical, but they are comparable to a VEI 6 (e.g. 1991 Mt Pinatubo) and VEI 7 (e.g. 1257 Mt Samalas) eruption, representing 1-in-50–100-year and 1-in-500–1000-year events, respectively (Newhall et al., 2018). VEI is used here to provide context of the recurrence rates but is not used as an index representative of climate impact. HAL56 utilises the 1257 Mt Samalas HCl and HBr emission estimates from Vidal et al. (2016) and assumes a conservative ∼ 5 % stratospheric halogen injection efficiency, less than the 10 %–20 % predicted by plume modelling in Textor et al. (2003) and closer to the observed efficiency following El Chichón (> 2.5 %) and in the ice core record of Mt Mazama (8 %), as well as the fraction supported by Wade et al. (2020). HAL10 has a SO2 injection similar to that found to reproduce the spatial and temporal evolution of stratospheric aerosol optical depth (SAOD) following the 1991 Pinatubo eruption (Mills et al., 2016) and a 10-times-smaller HCl and HBr flux than HAL56. This results in a HCl:SO2 ratio of ∼ 0.26 and ∼ 0.47 in HAL10 and HAL56, respectively, similar to the estimated stratospheric injection ratio for Mt Mazama (0.3) (Zdanowicz et al., 1999) and the ratios used in Ming et al. (2020) and Brenna et al. (2020) but smaller than the ratio used in Cadoux et al. (2015).
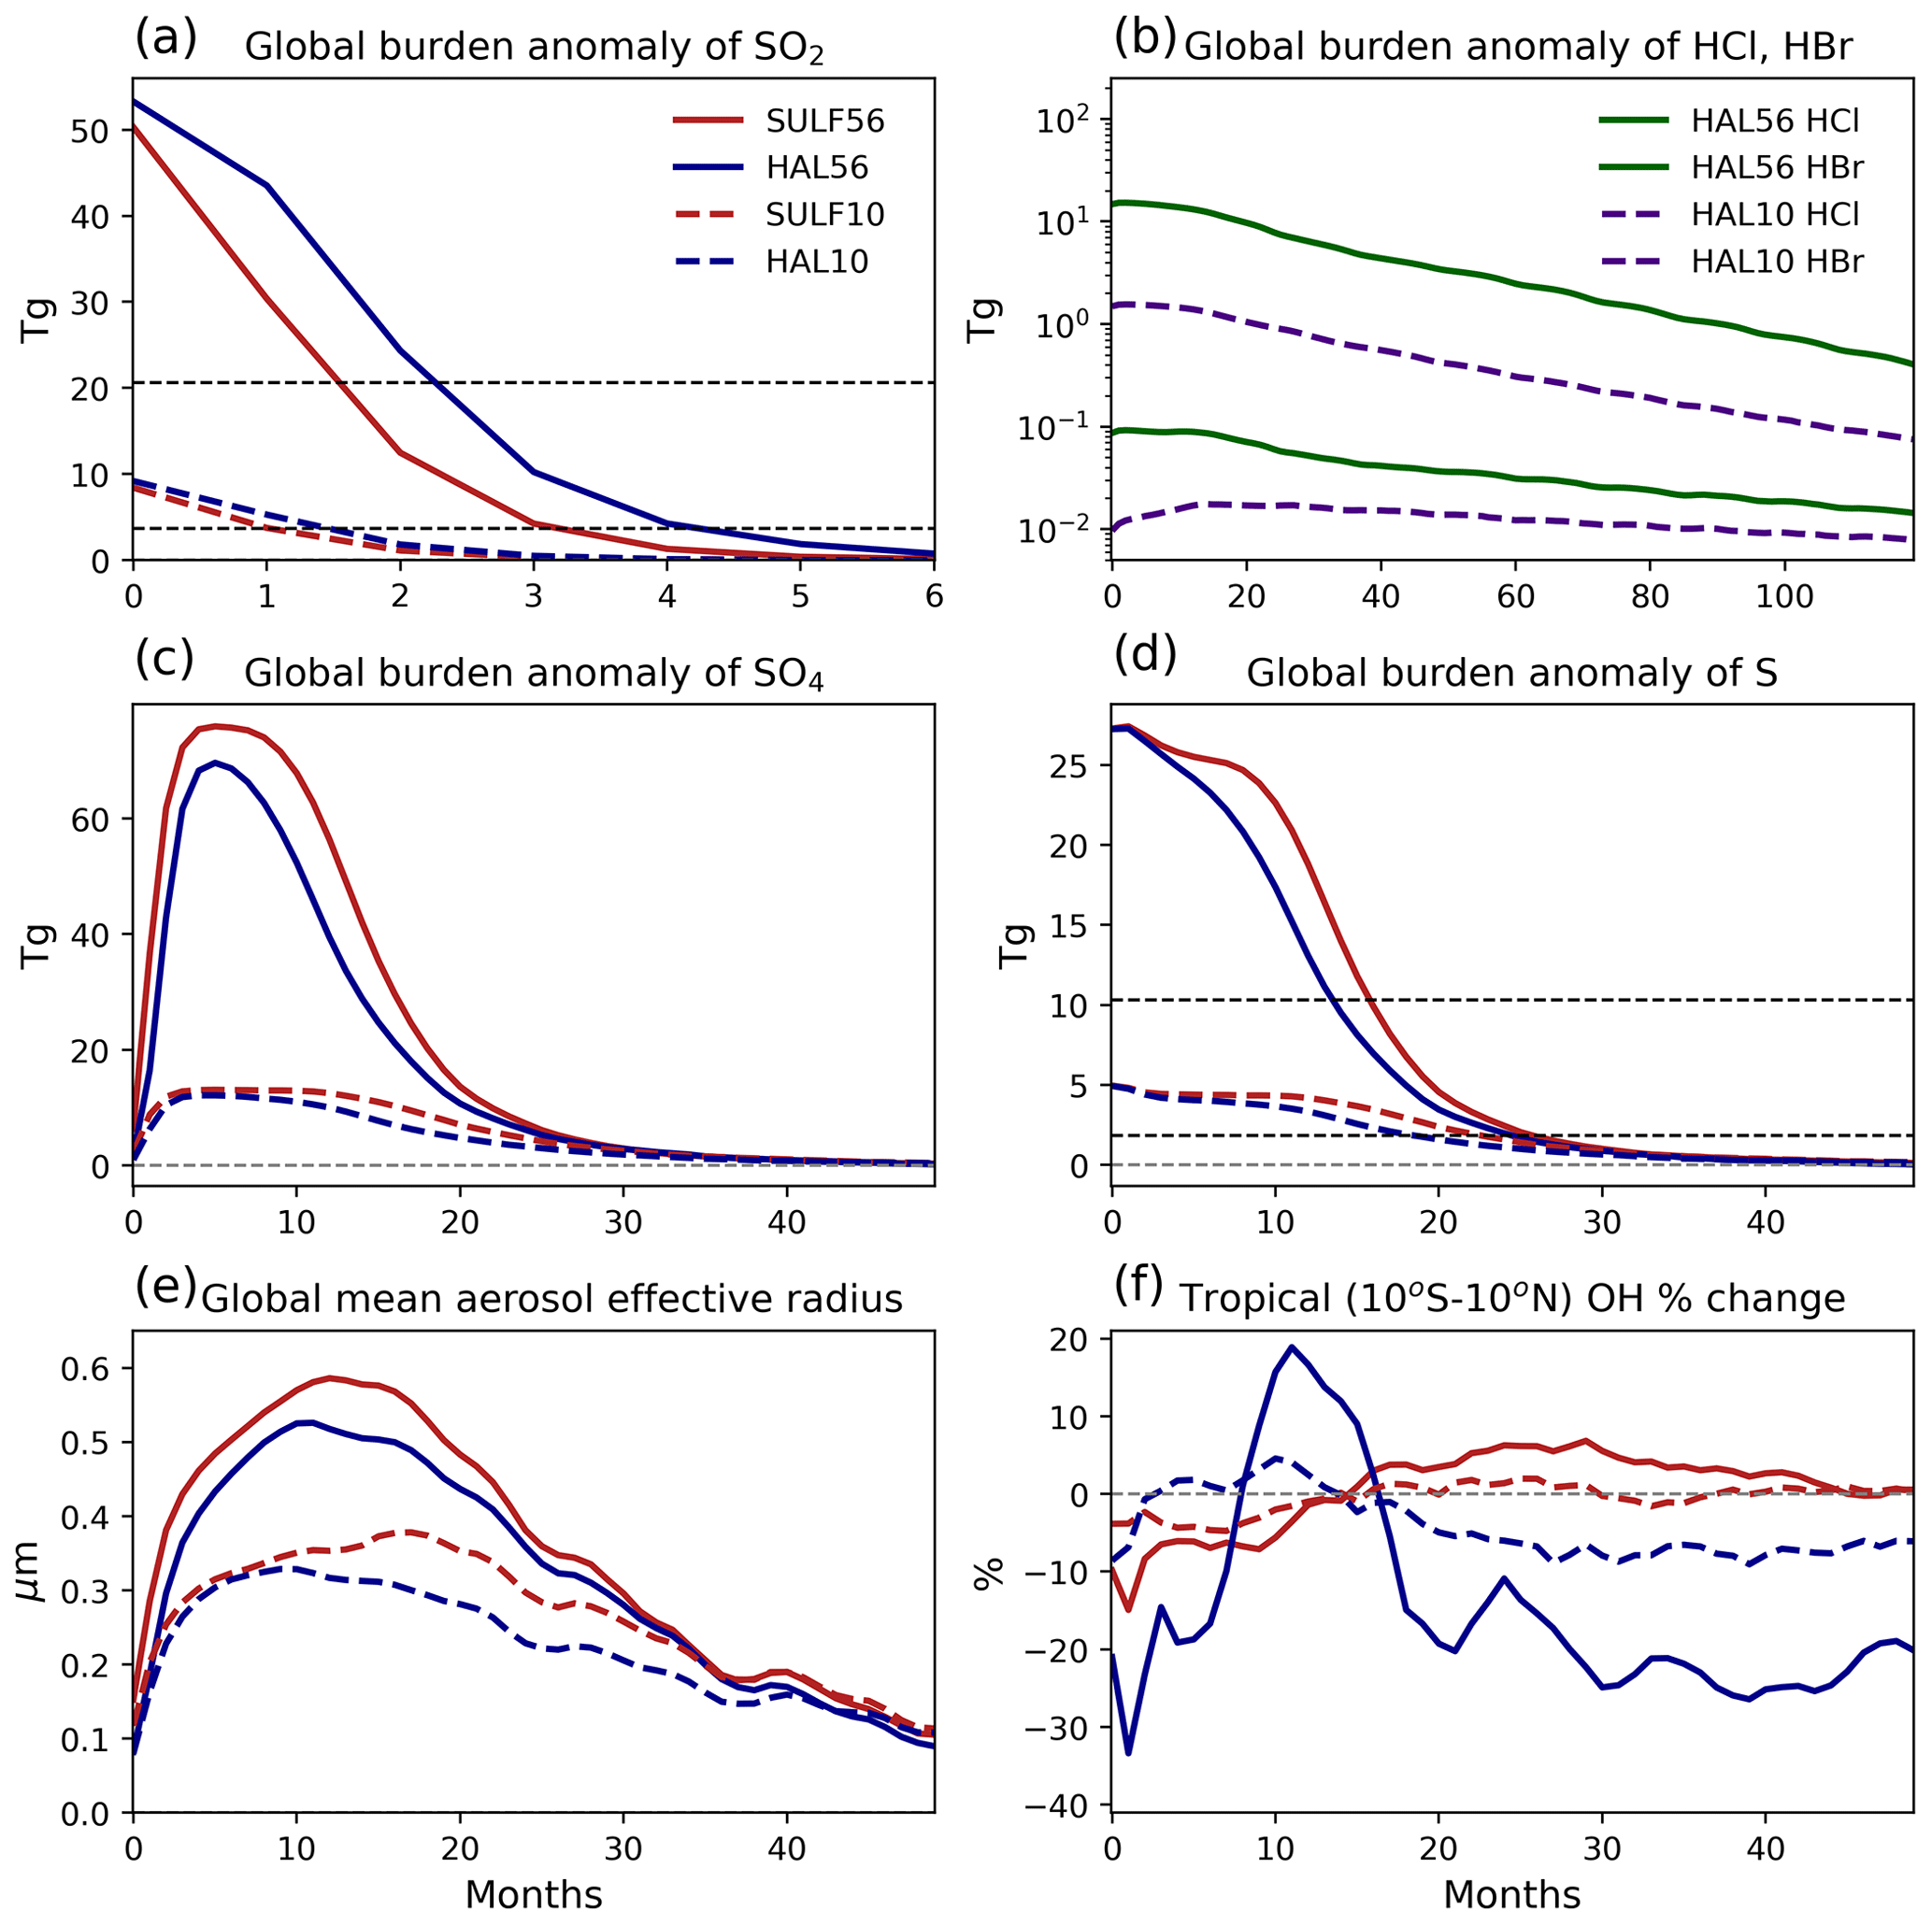
Figure 1Evolution of sulfur, halogens, aerosol effective radius, and OH for the SULF10, HAL10, SULF56, and HAL56 simulations relative to the control climatology. (a) Global SO2 burden anomalies. (b) Global HCl and HBr burden anomalies on a log scale. (c) Global sulfate aerosol burden anomalies. (d) Global total sulfur burden anomalies. (e) Global-mean aerosol effective radius, weighted by aerosol surface area density. (f) Tropical (10∘ N–10∘ S) stratospheric OH change (%). Dashed horizontal lines in panels (a), (b), and (d) represent the mass remaining after one e-folding time. Note the different axis scales.
3.1 Sulfur microphysics and ERFari
Atmospheric burdens of volcanic sulfur species are summarised in Fig. 1. As shown by Lurton et al. (2018), volcanic halogens deplete the hydroxyl radical (OH) via Eq. (4),
which limits the availability of OH for SO2 oxidation, leading to slower destruction of volcanic SO2 and an increase in SO2 e-folding time of 21 % and 40 % in HAL10 and HAL56 compared to SULF10 and SULF56, respectively. As the rate of formation of sulfuric acid is decreased, we simulate a corresponding delay in the formation of sulfate aerosol and a reduction in the peak sulfate aerosol burden by 8 % in both HAL10 and HAL56.
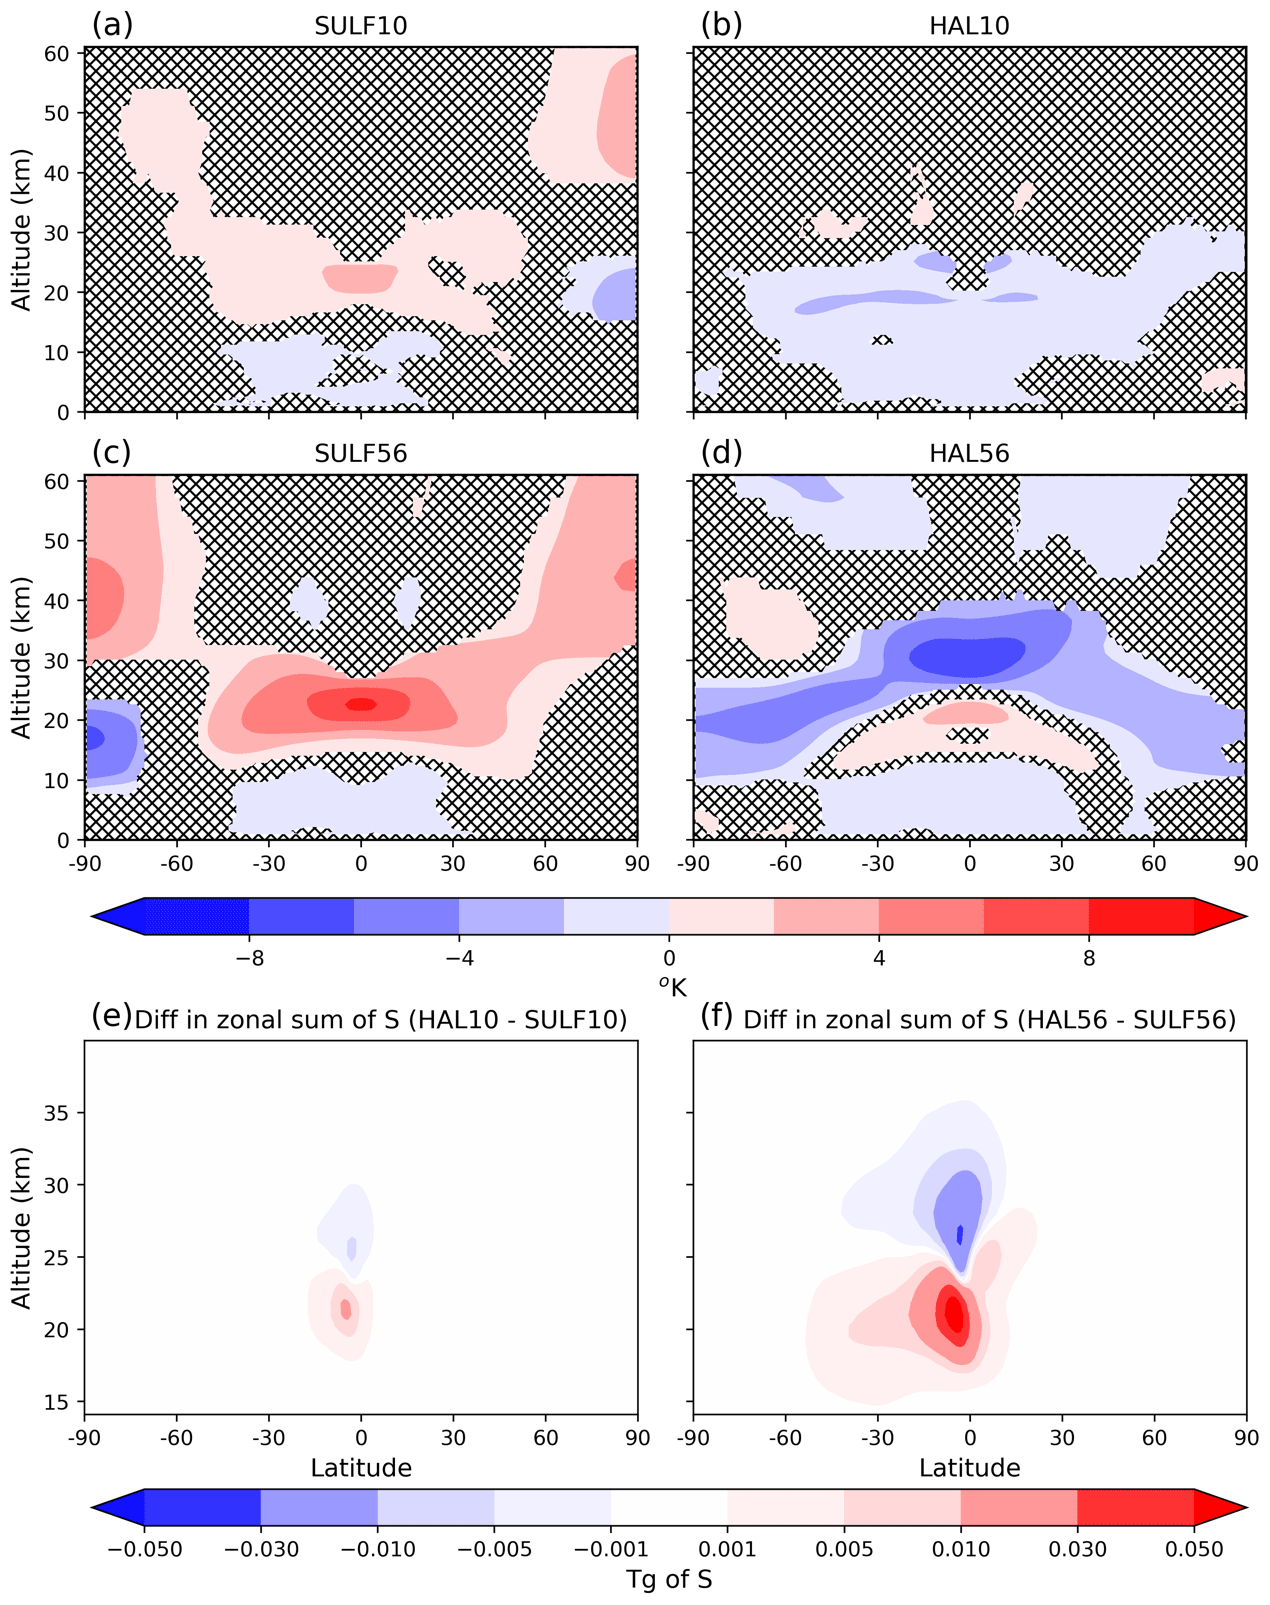
Figure 2Zonal-mean temperature anomaly (K) averaged over the first post-eruption year relative to the control climatology: (a) SULF10, (b) HAL10, (c) SULF56, and (d) HAL56. Differences that are not significant at the 95 % confidence interval according to a Mann–Whitney U test are indicated with stipples. Difference in zonal sum of total sulfur averaged over the first year post-eruption: (e) HAL10 − SULF10 and (f) HAL56 − SULF56.
Despite the slower rate of SO2 oxidation, the co-emission of halogens reduces the e-folding lifetime of the sulfur burden to 17.3 and 11.7 months in HAL10 and HAL56, compared with 21.2 and 13.6 months in SULF10 and SULF56 – a decrease of 18 % and 14 %, respectively. This indicates that co-emission of halogens alters the rate at which sulfur is removed from the atmosphere. Significant differences in stratospheric temperature change are simulated between the sulfur-only and halogen simulations. In sulfur-only simulations, strong positive temperature anomalies (∼ 3 K) due to sulfate aerosol absorption of infra-red radiation are simulated across the tropical stratosphere (Fig. 2). This aerosol heating increases the vertical ascent (Fig. S2 in the Supplement) and lofts volcanic aerosol to altitudes higher than the initial injection height in the model. By contrast, co-emission of volcanic halogens results in significant stratospheric ozone depletion of 22 %–57 % (see Sect. 3.2), and, in turn, this results in large negative temperature anomalies (∼ −3 K) over most of the lower and middle stratosphere (Fig. 2). Ozone generates heat in the stratosphere by absorbing both incoming shortwave (SW) radiation from the Sun and by absorbing upwelling longwave (LW) radiation from the troposphere. Thus, decreasing stratospheric ozone results in stratospheric cooling, offsetting the volcanic aerosol heating and resulting in net stratospheric cooling. This stratospheric cooling decreases the vertical ascent in the tropics (Fig. S2 in the Supplement) and prevents volcanic sulfate aerosol being self-lofted in HAL10 and HAL56. The volcanic sulfate aerosol thus remains at significantly lower altitudes in HAL10 and HAL56 (∼ 21–22 km) compared with SULF10 and SULF56 (∼ 24–25 km) (Fig. 2e and f). Lower altitude aerosol remains in a faster region of the Brewer–Dobson circulation (Fig. S3 in the Supplement), which results in faster transport to high latitudes and removal from the stratosphere (Fig. 1d).

Figure 3Global-mean aerosol effective radius over the first 3 post-eruption years as a function of the global total sulfur e-folding time. Both plots have regression lines fitted with correlation coefficient (r) showing strong positive correlation.
The maximum global-mean aerosol effective radii (Reff) is 0.38 and 0.59 µm in SULF10 and SULF56, respectively. The maximum global-mean Reff simulated in SULF10 is similar to that derived from measurements following the 1991 Pinatubo eruption, with an estimate of 0.4–0.5 µm from balloon-borne measurements (Deshler et al., 1997) and 0.45 µm obtained from GloSSAC satellite observations (GloSSAC, version 1.1; Thomason et al., 2018). The shorter lifetime of sulfur in the atmosphere following HAL10 and HAL56 eruptions results in reduced aerosol growth and smaller aerosol Reff. The peak global-mean Reff is ∼ 15 % and ∼ 10 % smaller in HAL10 and HAL56 compared to their equivalent SULF simulations (Fig. 1e). This aerosol growth stunting effect is a direct result of the shorter sulfur lifetime, rapid spreading, and removal of aerosol. Volcanic sulfate aerosols grow through microphysical processes of condensation and coagulation (Kremser et al., 2016). The faster removal of sulfate aerosol in HAL10 and HAL56 reduces the growth via condensation and coagulation and results in smaller peak global-mean aerosol Reff. This theory is supported by Fig. 3, which shows a scatter plot of the 3-year global-mean aerosol effective radius as a function of the global sulfur burden e-folding lifetime for each individual ensemble member, with a significant correlation within both 10 Tg (r = 0.88) and 56 Tg (r = 0.95) eruption ensembles. The positive correlation between these two variables holds only for each eruption size scenario. To a first order, the aerosol Reff is determined by the magnitude of the volcanic sulfur injection. The larger SO2 injection in HAL56 and SULF56 ensemble simulations leads to larger-sized sulfate aerosols, faster sedimentation, and shorter removal time compared to HAL10 and SULF10 ensemble simulations. However, when we fix the mass of sulfur injected and compare sulfur-only and co-emission scenarios, we find that transport has a second-order effect. The faster removal of sulfate aerosol in HAL10 and HAL56 ensemble simulations leads to smaller-sized aerosol due to reduced opportunity for aerosol growth compared with SULF10 and SULF56, respectively.
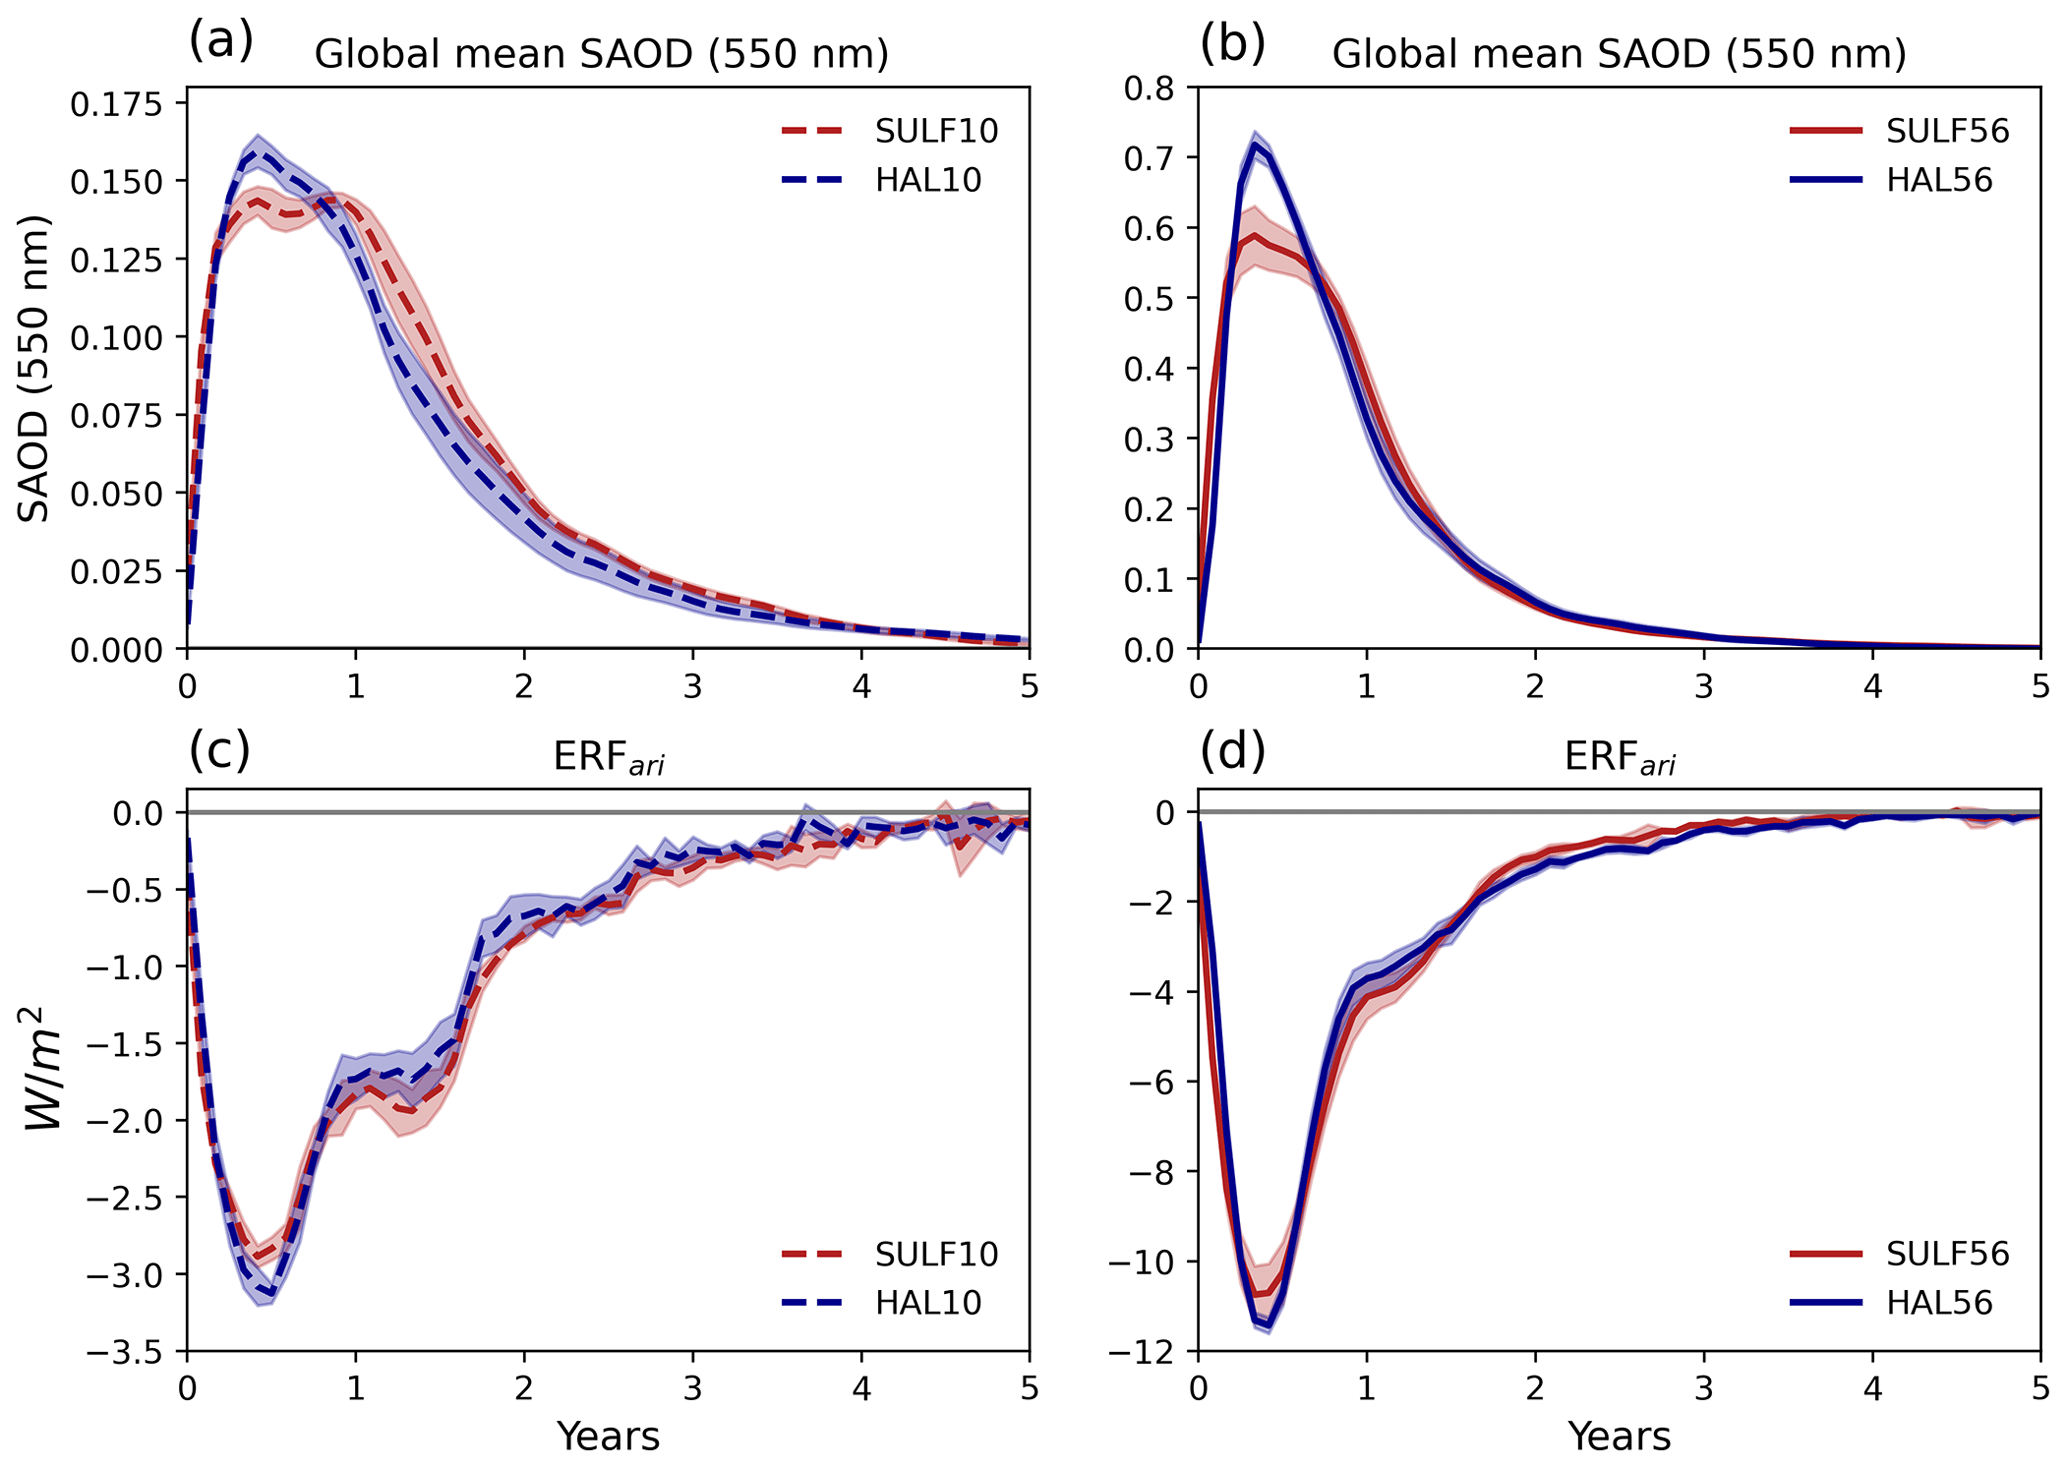
Figure 4Global-mean evolution of the stratospheric aerosol optical depth anomaly at 550 nm: (a) SULF10 and HAL10; (b) SULF56 and HAL56. Global-mean evolution of top-of-atmosphere global-mean ERFari: (c) SULF10 and HAL10; (d) SULF56 and HAL56. Shading represents the ensemble range.
The radiative impact of sulfate aerosols depends on the particle size (Timmreck et al., 2010). Using Mie scattering theory, Lacis (2015) found that the scattering cross section per unit mass is largest for sulfate aerosol with an effective radius of ∼ 0.20 µm. The smaller aerosol Reff in HAL10 and HAL56, compared to SULF10 and SULF56, is closer to 0.20 µm and results in more efficient scattering of SW radiation per unit mass (Timmreck et al., 2010). Therefore, we simulate 11 % and 22 % higher peak global-mean SAOD anomalies at 550 nm in HAL10 and HAL56 than their equivalent SULF simulations (Fig. 4), despite having a 14 % and 9 % smaller peak aerosol burden. Correspondingly, we simulate an 8 % and 6 % increase in the peak global-mean ERFari in HAL10 and HAL56 compared to SULF10 and SULF56 (Fig. 4), driven by a 14 % and 11 % increase in peak global-mean SW forcing (Fig. S4 in the Supplement). The SAOD and ERFari anomalies are a balance between the offsetting effects of smaller aerosol and shorter lifetime, which result in a net-zero impact on cumulative ERFari despite a significant increase in the peak global-mean ERFari (Fig. S5 in the Supplement).
3.2 Composition changes and resulting ERFclear,clean
Co-emission of volcanic sulfur and halogens causes significant perturbations to the chemistry of the stratosphere beyond the depletion of OH in HAL10 and HAL56 mentioned in Sect. 3.1. Stratospheric methane, stratospheric water vapour (SWV), and, in particular, stratospheric ozone are all impacted.
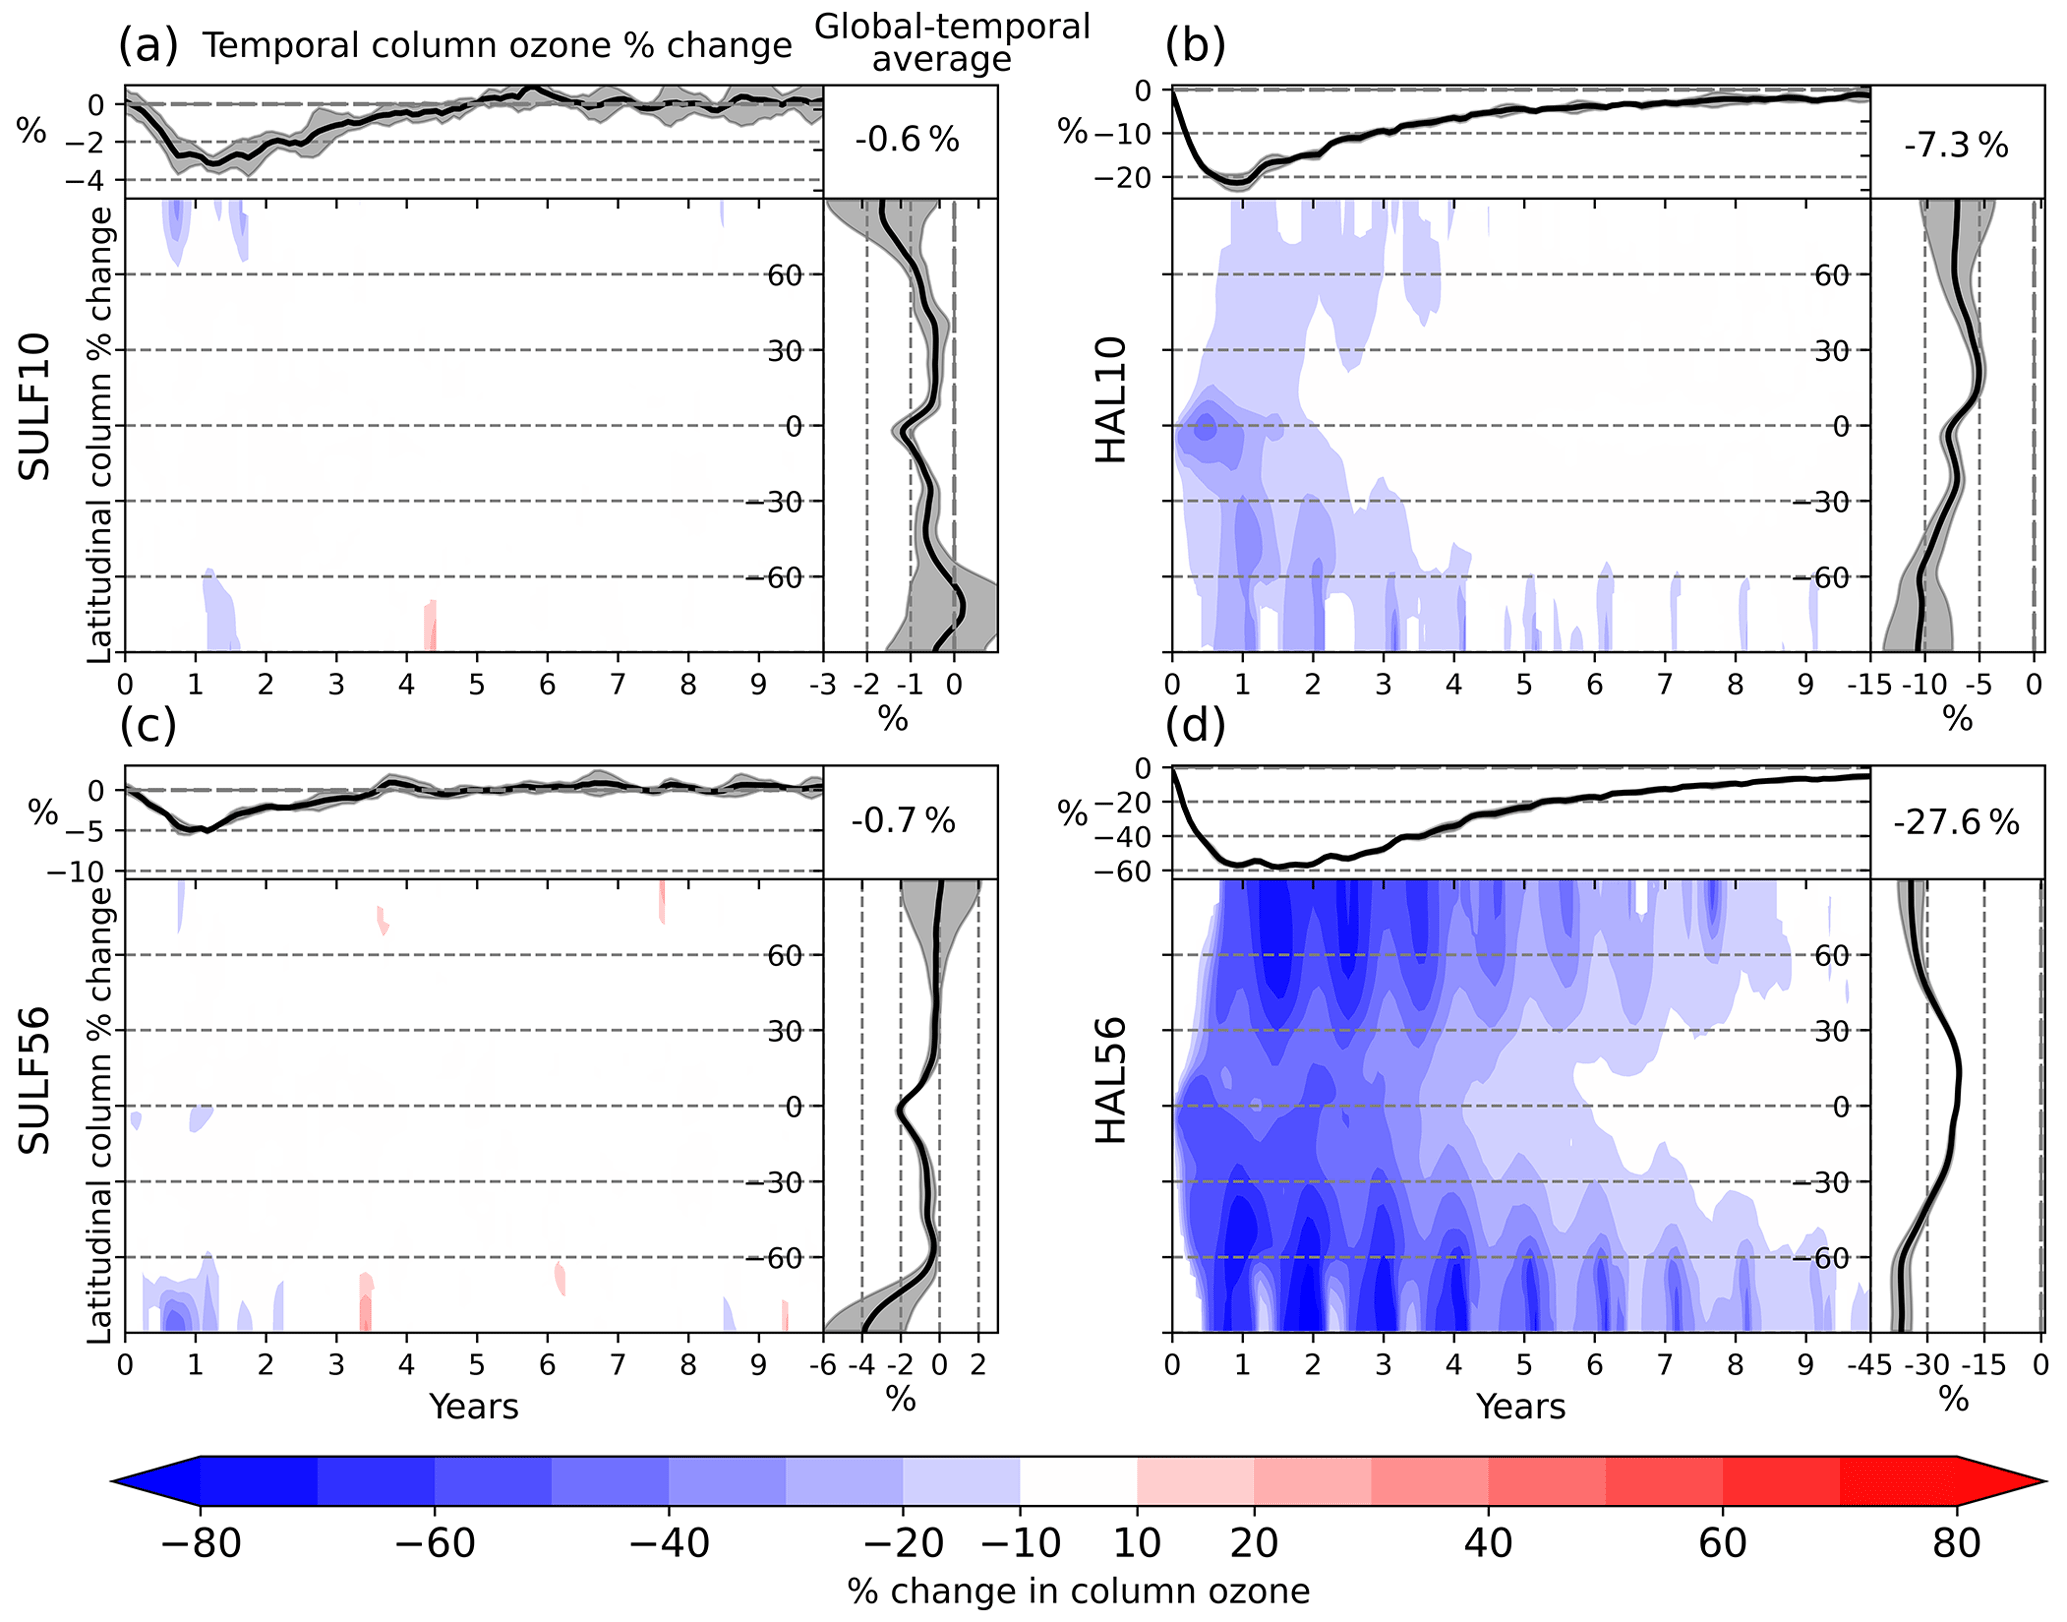
Figure 5Ozone percentage difference in (a) SULF10, (b) HAL10, (c) SULF56, and (d) HAL56. Global-mean total column ozone anomalies are traced as a function of time at the top of each panel. Temporal-mean ozone anomalies are traced on the right; note the different scales. Global-temporal mean anomalies are enumerated in the top right. Red colours indicate column ozone enhancement, and blue colours indicate column ozone depletion. Grey shaded areas represent the ensemble range.
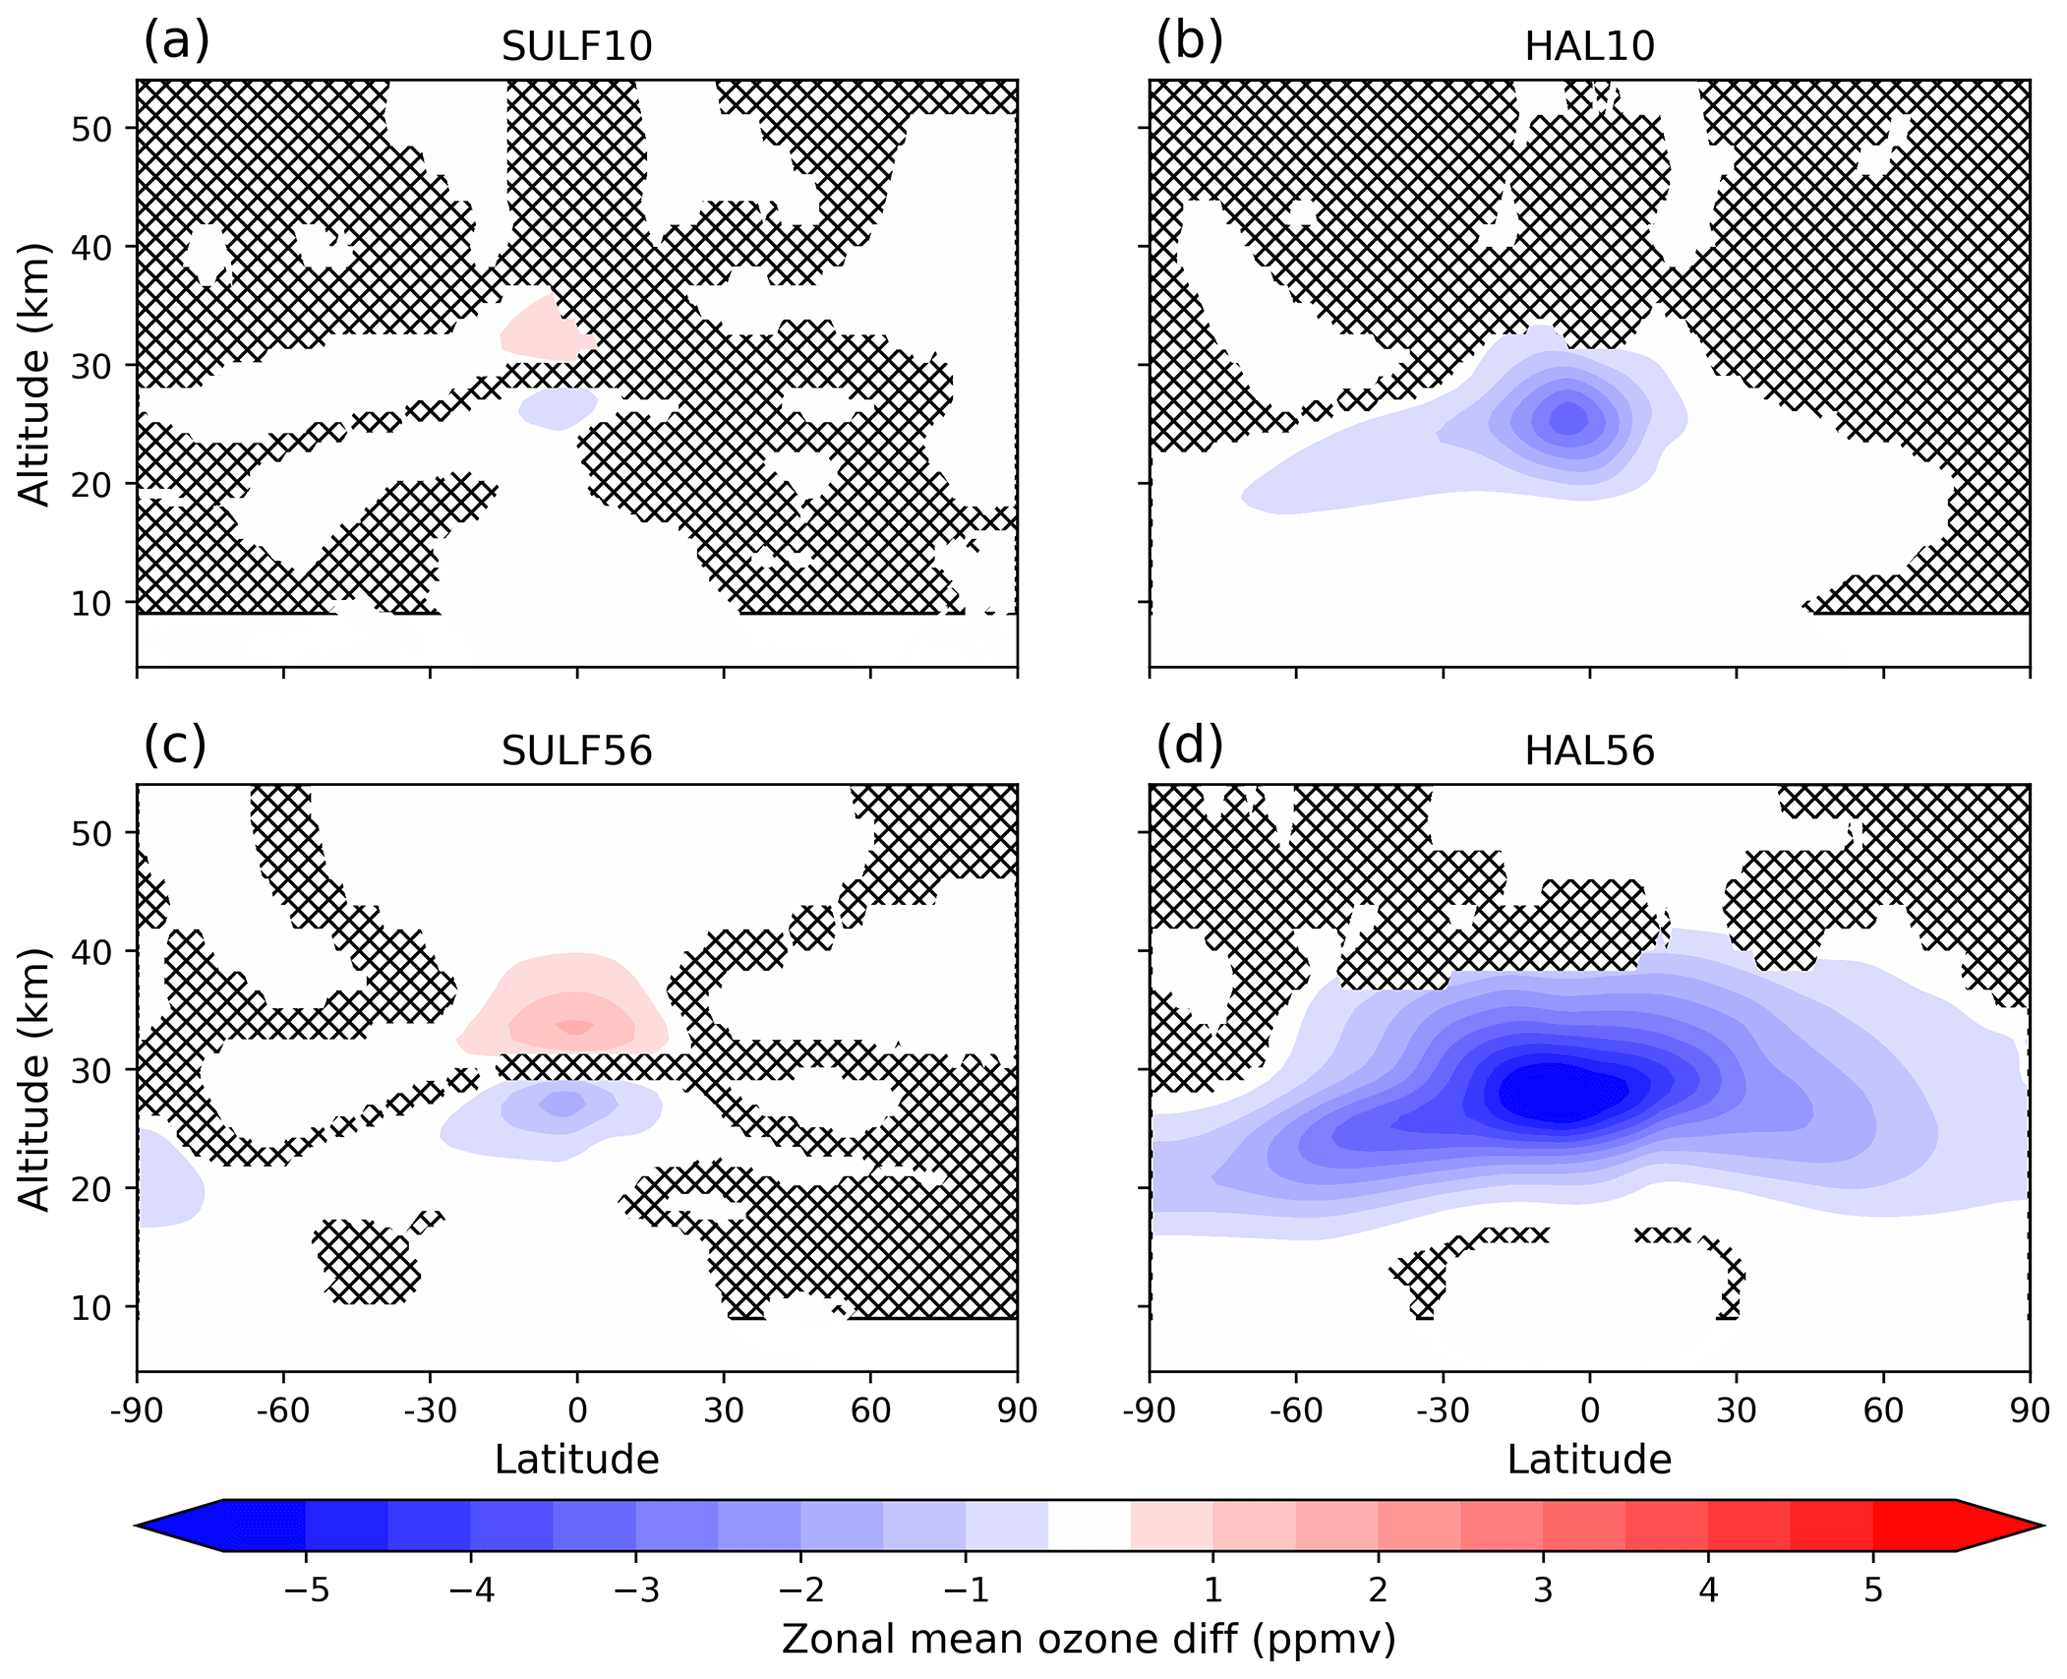
Figure 6Zonal-mean ozone anomaly (ppmv) averaged over the first post-eruption year relative to the control climatology: (a) SULF10, (b) HAL10, (c) SULF56, and (d) HAL56. Red colours indicate ozone enhancement, and blue colours indicate ozone depletion. Anomalies that are not significant at the 95 % confidence interval according to a Mann–Whitney U test are indicated with stipples.
In sulfur-only simulations, we simulate a modest reduction in global-mean ozone column: −9 DU (−3.9 %) in SULF10 and −15 DU (−6.6 %) in SULF56 (Fig. 5a and c). This ozone depletion is catalysed by halogen radicals activated from background halogens on the surface of volcanic aerosol. We also simulate a redistribution of tropical ozone, with decreases of < 0.5 and < 2 ppmv between 23 and 28 km and a symmetrical increase in zonal-mean tropical ozone above in SULF10 and SULF56, respectively (Fig. 6a and c). This tropical ozone dipole pattern is mostly attributed to volcanic heating. Volcanic heating by the aerosol increases the vertical ascent and brings ozone up from below, enhancing the local mixing ratio. In simulations with co-emitted halogens we simulate more dramatic ozone depletions; HAL10 resulted in a peak global-mean ozone reduction of 65 DU (−22 %) 1–2 years after the eruption, followed by a gradual recovery over the next 3–4 years (Fig. 5d). HAL56 resulted in a peak global-mean ozone reduction of 175 DU (−57 %) 1–2 years after the eruption, followed by a gradual recovery the remainder of the 10-year simulation, with an average reduction of 82 DU (−27 %) over the 10-year simulation (Fig. 5b).
Volcanic halogen-catalysed ozone depletion is simulated across all latitudes, but the largest magnitude changes in HAL10 (−40 %) and HAL56 (−80 %) were found within the aerosol cloud and the polar regions, where the co-emitted halogens are activated on aerosol surfaces and PSCs, respectively (Fig. 5). Ozone depletion predominantly occurs in the tropics between 25 and 30 km in the first post-eruption year, with depletion maxima of −3.5 and −6 ppmv in HAL10 and HAL56, respectively (Fig. 6). By year three, the ozone depletion shows a similar bimodal altitude distribution in the stratosphere similar to that found in Brenna et al. (2020), with depletion maxima both in the lower (20 km) and upper (40 km) stratosphere. As the volcanic SO2 and halogens were introduced into the stratosphere just south of the Equator, they are predominantly dispersed into the Southern Hemisphere (Fig. S6 in the Supplement), leading to larger ozone depletions compared with the Northern Hemisphere. In both HAL10 and HAL56 tropical ozone was found to recover first, with significant depletions recurring during the winter in the polar regions for the remainder of the simulation.
The simulated changes in stratospheric heating following sulfur-only and co-emission eruption scenarios affect the dynamical response of the upper atmosphere, for example, the strength of the Arctic and Antarctic polar vortices (see Fig. S7 in the Supplement) (Robock, 2000; Toohey et al., 2014). In SULF10 and SULF56, the positive stratospheric temperature anomalies in the tropics lead to an increased meridional temperature gradient. As a result, we simulate a strengthening of the polar vortex (defined as the mean zonal wind speed at the vortex edge, between 55–65∘ latitude and 1 to 30 hPa) in both the Arctic and Antarctic in the first post-eruption winter. In contrast, the negative stratospheric temperature anomalies in HAL10 and HAL56 lead to a decreased meridional temperature gradient and a weakening of the polar vortices. In HAL10 we simulate significant weakening of the polar vortex in the first two post-eruption winters in the Arctic and the first and third post-eruption winter in the Antarctic. In HAL56, we simulate significant weakening of the polar vortex for 3–4 years at both poles. Polar vortex strength is an important driver of ozone depletion, with stronger polar vortexes leading to enhanced ozone depletion (Solomon, 1999; Zuev and Savelieva, 2019). Lawrence et al. (2020) linked an unusually strong Arctic polar vortex with the record-breaking ozone loss observed in the 2019/2020 Arctic winter. As such, the strengthening of the polar vortices simulated in sulfur-only simulations may intensify ozone depletion in the first post-eruption winters in both the Arctic and Antarctic. Furthermore, the weakening of the polar vortices simulated in co-emission scenarios may dampen the ozone response in both the Arctic and Antarctic. In addition, the simulated changes in polar vortex strength may have important consequences for the North Atlantic Oscillation and Southern Annular Mode (Driscoll et al., 2012; Kwon et al., 2020).
Stratospheric water vapour (SWV) and stratospheric methane are linked. SWV has two main sources: transport from the troposphere and chemical production from methane (Löffler et al., 2016). By contrast, stratospheric methane's only source is transport from the tropics, and it is destroyed by OH (forming SWV) and reaction with halogens via Eq. (5).
Following sulfur-only eruptions we simulate small enhancements in SWV and stratospheric methane (Fig. 8). SULF10 and SULF56 result in a peak global stratospheric mean increase in SWV of 0.4 ppmv (+7 %) and 1.1 ppmv (+17 %) and a 10 ppbv (0.6 %) and 30 ppbv (1.8 %) increase in stratospheric methane, respectively. Perturbations to SWV and stratospheric methane peak 2–3 years after the eruption and recover within 7 years. The increase in stratospheric methane following sulfur-only eruptions is in broad agreement with both Loffler (2015), who showed stratospheric methane mixing ratios increased by ∼ 5 % following simulations of El Chichón and 15 %–20 % following the larger Mt Pinatubo eruption, and Kilian et al. (2020) who reported a 10 % increase in CH4 between 40 and 10 hPa, also following simulations of Pinatubo. Kilian et al. (2020) suggested that this was due to enhanced vertical ascent as a result of aerosol heating, lifting relatively methane-rich air from the lower stratosphere into the upper levels. As Kilian et al. (2020) simulated an increase in stratospheric CH4 burden, they suggested that the lofting of methane must also coincide with an increase in the stratospheric methane lifetime but did not calculate this. In SULF10 and SULF56 of this work, we simulate an increase in tropical vertical ascent (shown at 50 hPa in Fig. S2 in the Supplement); however, we simulate a coinciding reduction in the stratospheric methane lifetime, driven by an increase in methane oxidation by OH and Cl. (Fig. S8 in the Supplement). This suggests that the increased stratospheric methane burden following sulfur-only eruptions SULF10 and SULF56 is not due to a lengthening of the stratospheric methane lifetime and, instead, is likely due to increased transport of methane across the tropopause from the methane-rich troposphere as a result of increased vertical ascent in the stratosphere (Fig. S2 in the Supplement). Due to the model set-up employed in this study we were unable to diagnose this any further.
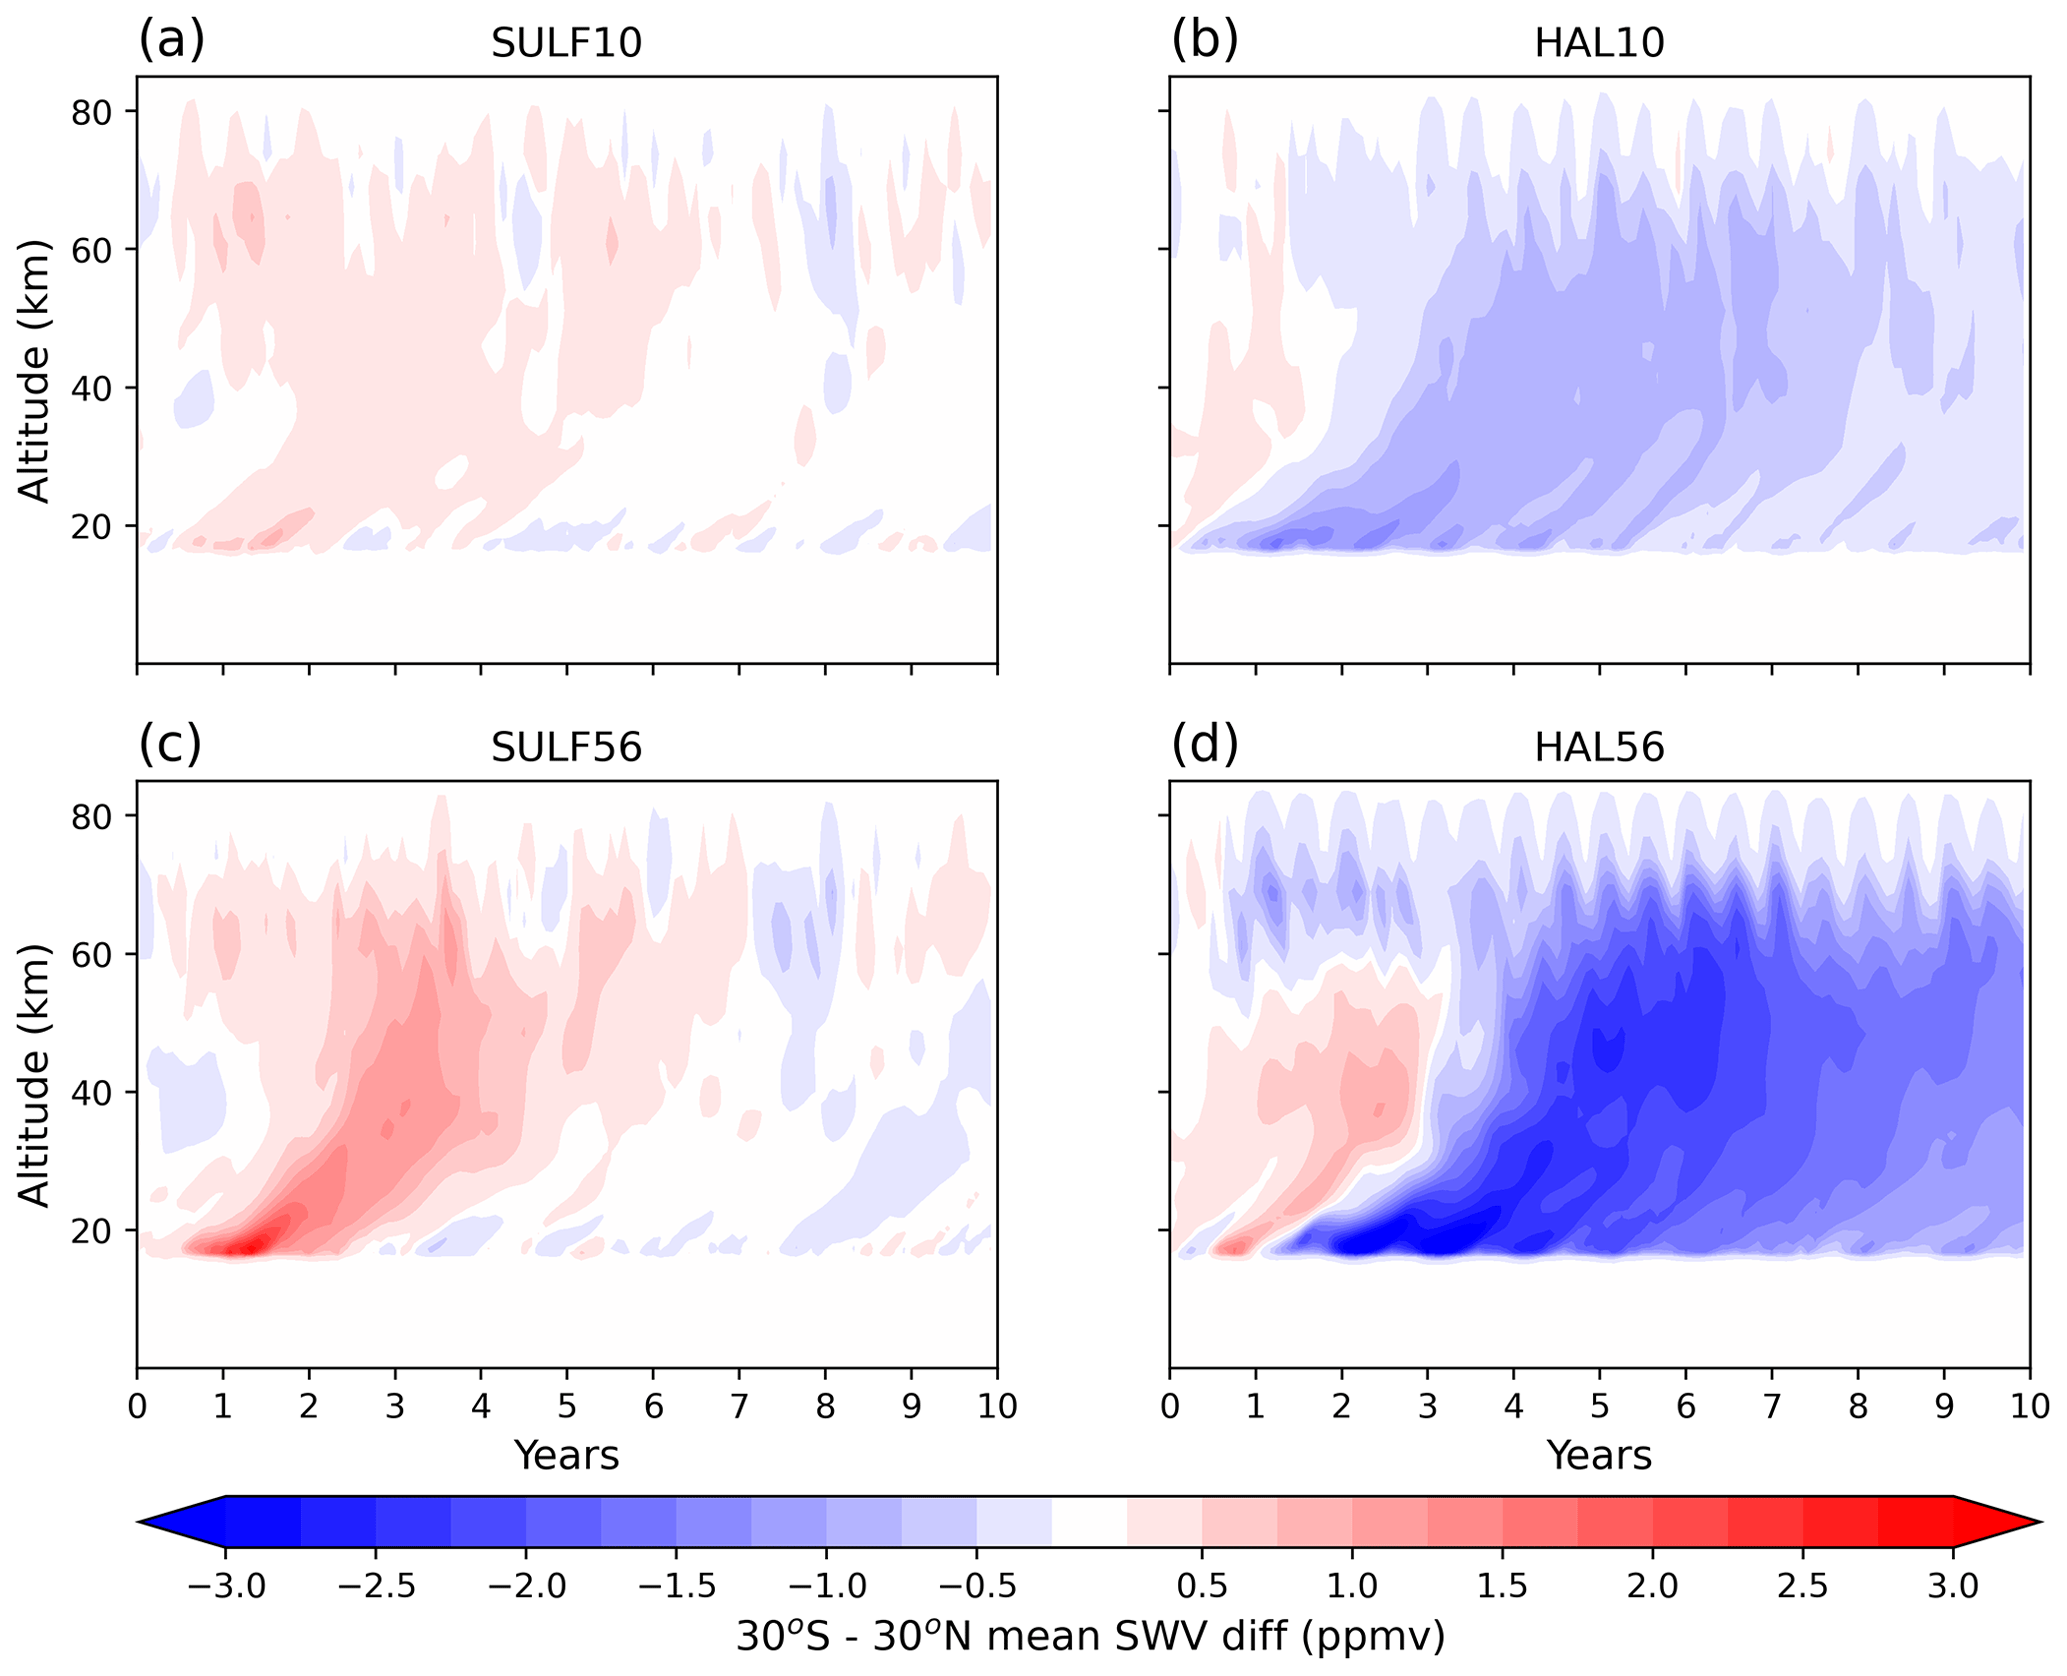
Figure 7The 30∘ S–30∘ N mean stratospheric water vapour anomalies (ppmv) relative to the control climatology as a function of altitude and time: (a) SULF10, (b) HAL10, (c) SULF56, and (d) HAL56. Red colours indicate SWV enhancement, and blue colours indicate column SWV depletion.
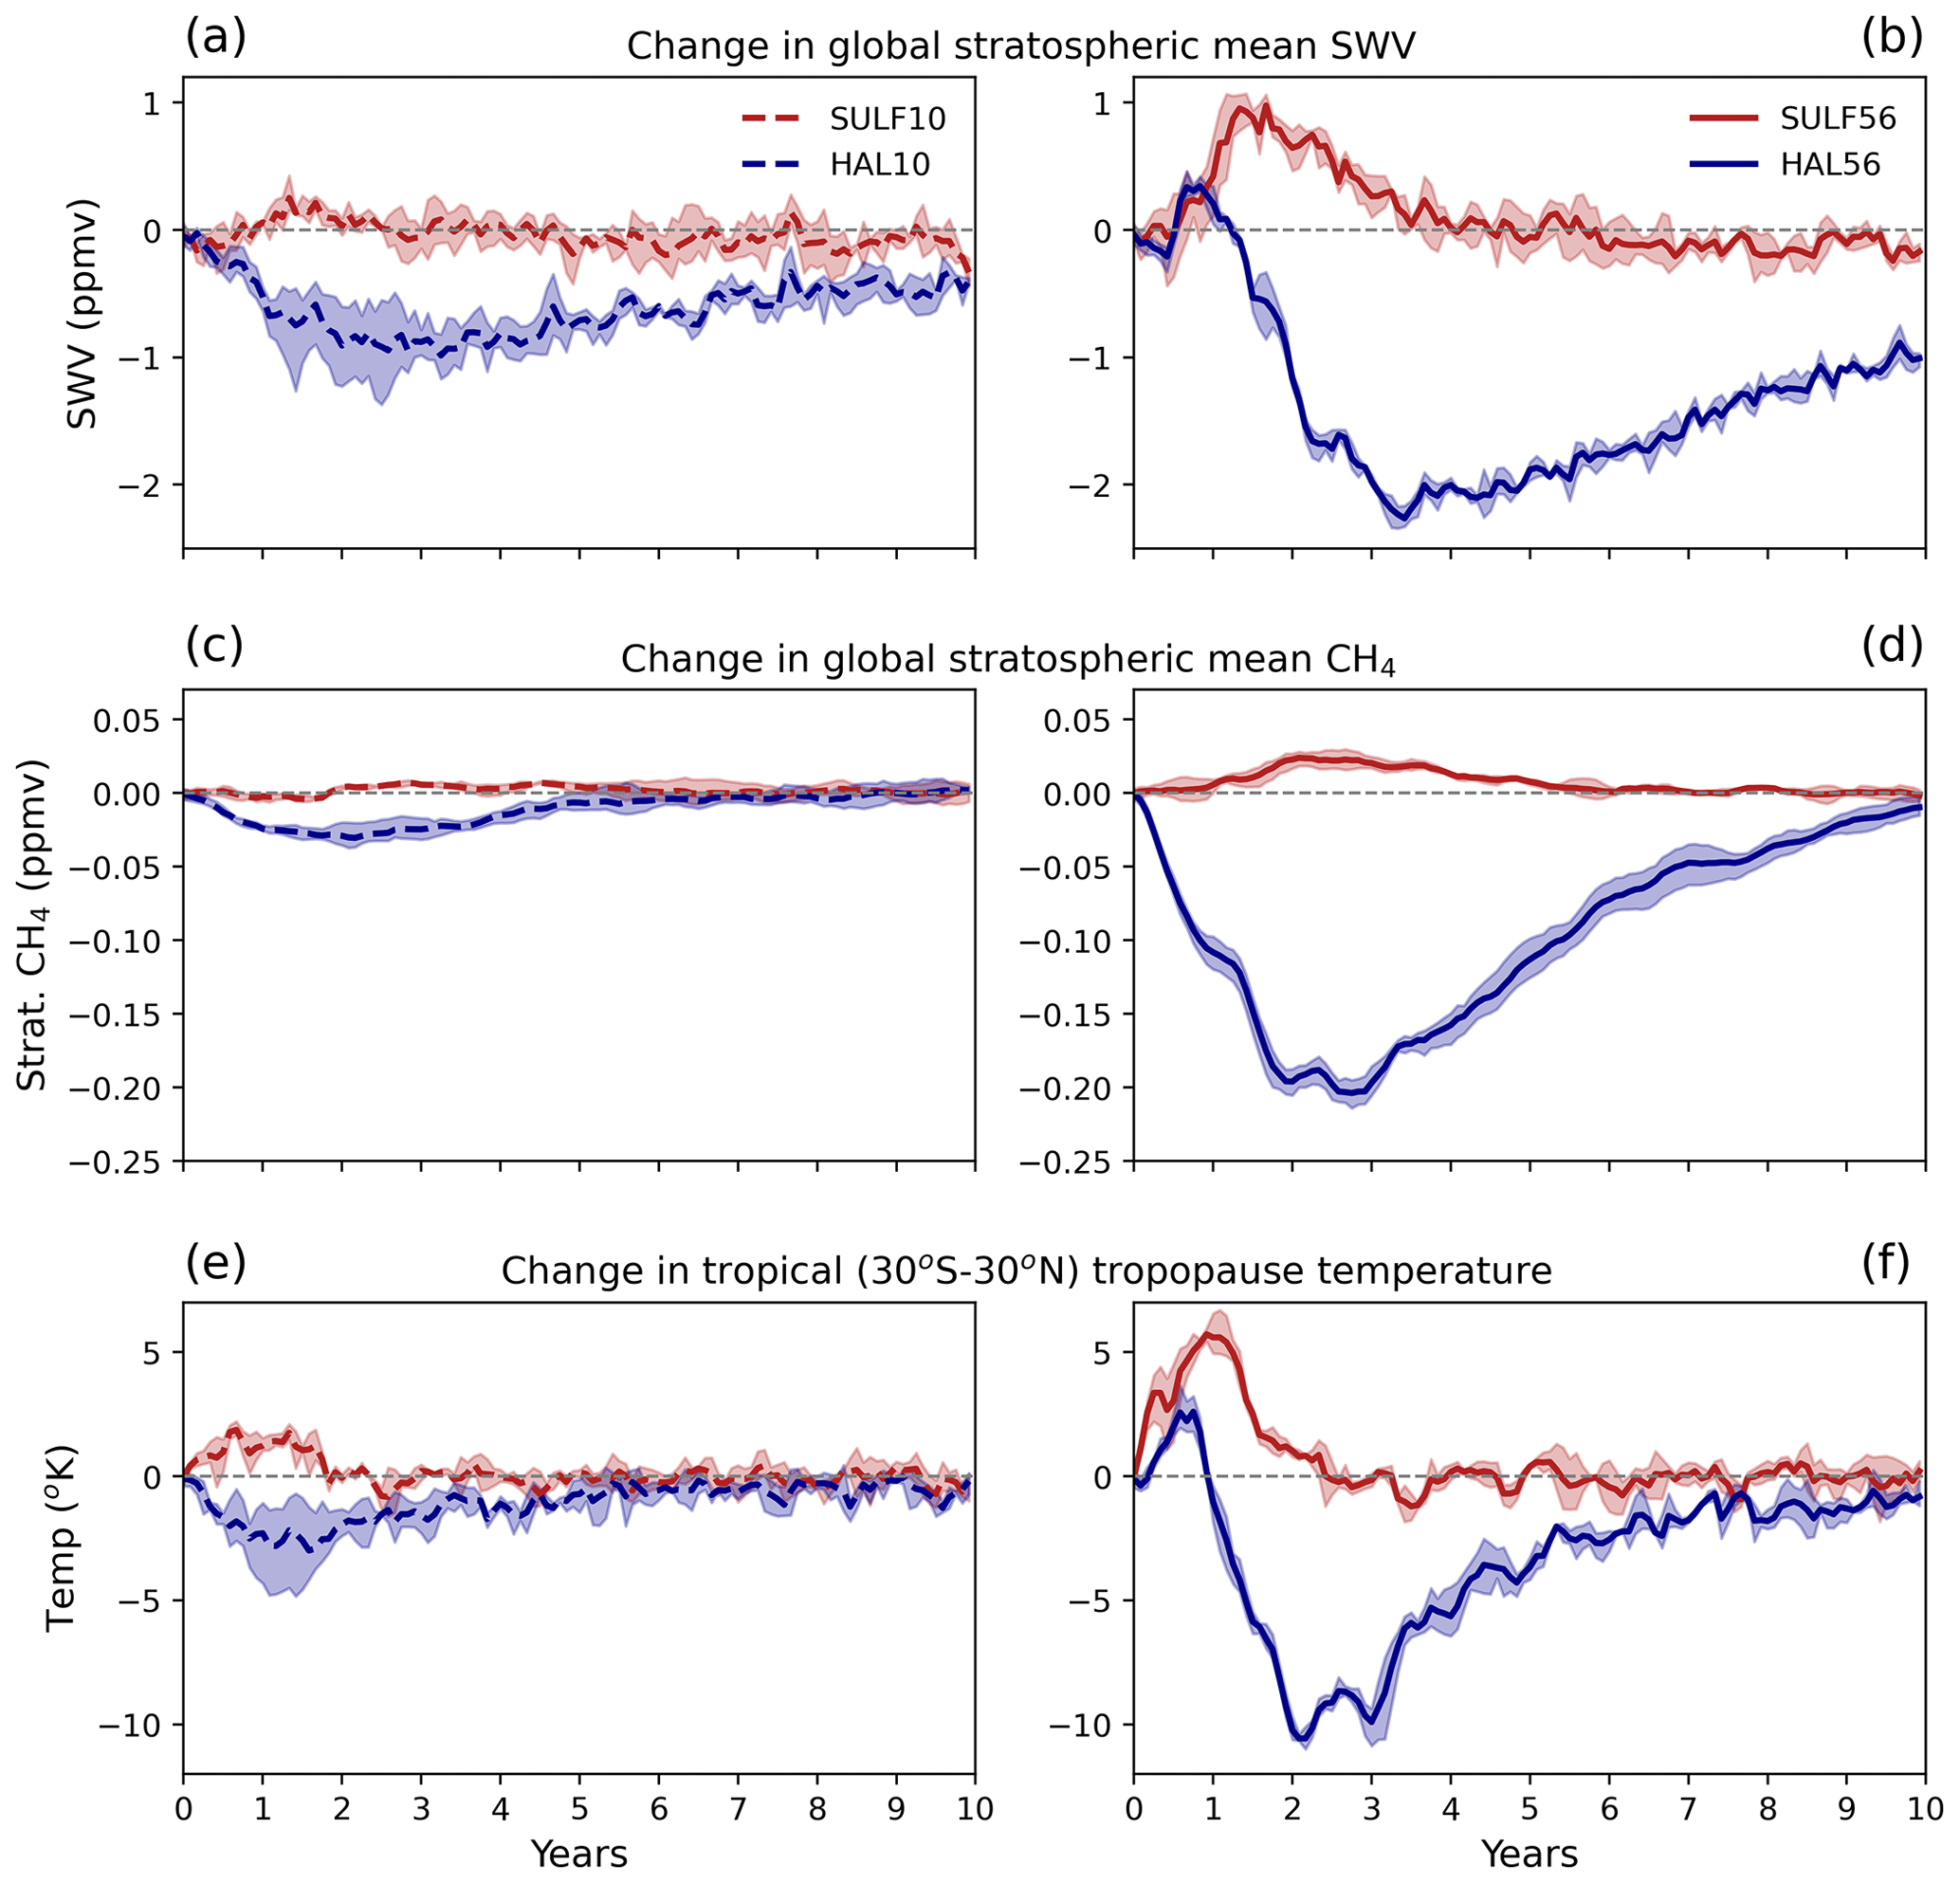
Figure 8Evolution of global stratospheric mean water vapour anomalies (ppmv) in SULF10 and HAL10 (a) and in SULF56 and HAL56 (b). Evolution of global stratospheric methane anomalies (ppmv) in SULF10 and HAL10 (c) and in SULF56 and HAL56 (d). Evolution of tropical tropopause cold trap temperature anomaly averaged over 30∘ S–30∘ N and 15–20 km in SULF10 and HAL10 (e) and in SULF56 and HAL56 (f). Shading represents the ensemble range.
The simulated changes in methane are small in comparison to the SWV changes across all simulations and can only account for a fraction of the SWV change. The dominant driver of SWV change is the amount of water vapour entering the stratosphere through the tropical tropopause cold point (Löffler et al., 2016). Following both SULF10 and SULF56, volcanic aerosol results in warming of the tropical tropopause cold point, leading to an increase in vertical ascent (Fig. S2 in the Supplement) and a weakening of the tropical tropopause cold trap dehydration effect, increasing the transport of water vapour into the stratosphere (Fig. 8) (Loffler et al., 2016). Elevated SWV is seen to initiate at the tropical troposphere before propagating higher into the stratosphere (Fig. 7a and c).
Unlike in sulfur-only eruptions, following eruptions with co-emitted halogens we simulate a reduction in SWV and stratospheric methane (Fig. 8). HAL10 and HAL56 result in peak global stratospheric mean stratospheric methane reductions of 37 ppbv (−3 %) and 214 ppbv (−18 %), respectively, 2 years after the eruption. In HAL10 the stratospheric methane perturbation returns to the background levels by the fourth year, whereas in HAL56 the perturbation remains below zero for between 7 and 8 years. Co-emission of halogens results in enhanced destruction of methane by chlorine via Eq. (5), resulting in the significant decrease in the HAL10 and HAL56 stratospheric methane levels.
HAL10 and HAL56 result in peak SWV reductions of 1.0 ppmv (−16 %) and 2.3 ppmv (−36 %), respectively, 3–4 years after the eruption, followed by a gradual recovery. In HAL10 SWV perturbation levels return to the background levels within 7 years, whereas in HAL56 the perturbation does not fully recover within the 10-year duration of the simulation. Just as was the case following sulfur-only eruptions, the dominant driver of SWV changes is the amount of water vapour entering the stratosphere via the tropical tropopause cold point. In HAL10 and HAL56, the process is the same but in the opposite sense. Cooling in the tropical tropopause vicinity increases the efficiency of the tropical cold trap dehydration effect and reduces the amount of water vapour being brought up from the troposphere (Fig. 8) (Löffler et al., 2016). The negative SWV anomalies can be seen to initiate at the troposphere before propagating higher into the stratosphere (Fig. 7b and d)
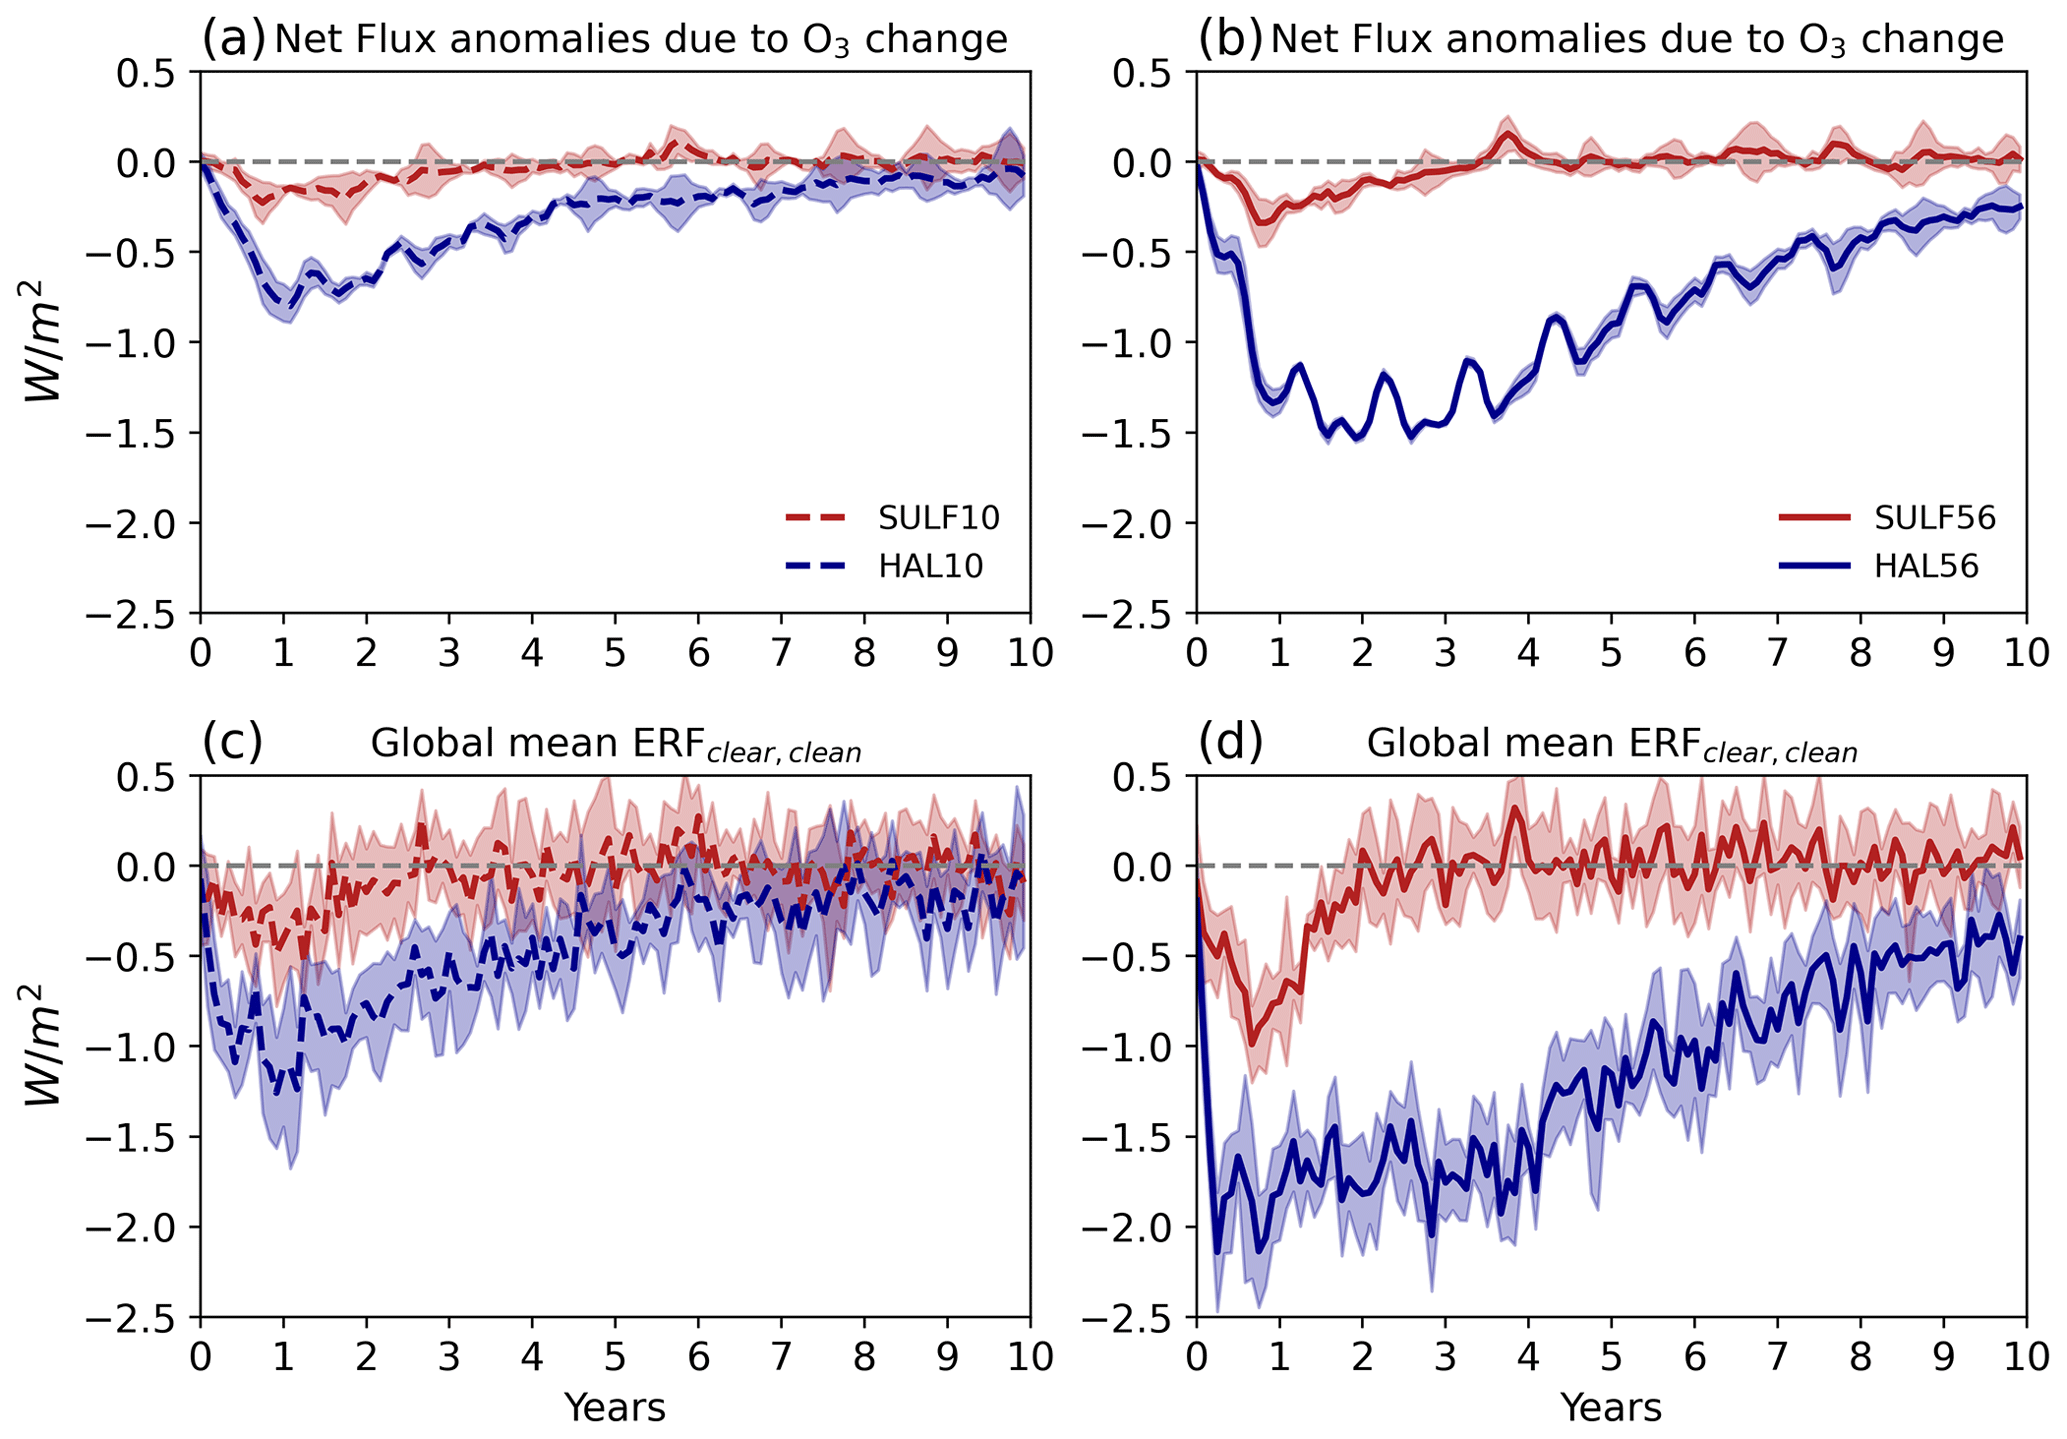
Figure 9Evolution of global-mean top-of-atmosphere net flux anomalies due to stratospheric O3 change estimated from the ozone radiative kernel from Rap et al. (2015) in SULF10 and HAL10 (a) and in SULF56 and HAL56 (b). Evolution of the global-mean top-of-atmosphere compositional forcing (ERFclear,clean) in SULF10 and HAL10 (c) and in SULF56 and HAL56 (d). Ozone changes make up ∼ 75 % of the ERFclear,clean. Shading represents the ensemble range.
Using the forcing diagnosis outlined in Schmidt et al. (2018) and Ghan (2013), we can isolate the radiative forcing due to atmospheric composition and surface albedo changes, ERFclear,clean. As surface temperature and sea ice were prescribed, surface albedo changes were small, meaning that ERFclear,clean predominantly represents the forcing from atmospheric composition changes (Fig. 9c and d). HAL10 results in a peak global-mean ERFclear,clean of −1.3W m−2 1 year after the eruption, which is more than double the ERFclear,clean of SULF10. The forcing recovers gradually over the next 6–7 years and results in a cumulative ERFclear,clean that is 5 times greater than SULF10 (Fig. S2d in the Supplement). Similarly, HAL56 results in a peak global-mean ERFclear,clean of −2.1W m−2 1–2 years after the eruption, which is double the peak global-mean forcing of SULF56. The ERFclear,clean anomaly in HAL56 is more persistent and remains −0.5W m−2 below zero at the end of the simulation, resulting in a cumulative ERFclear,clean that is 10 times greater than SULF56 (Fig. S2c in the Supplement).
To calculate the resulting radiative forcing from the ozone changes simulated in this work, we use the ozone radiative kernel (O3 RK) technique based on Rap et al. (2015) and updated for the whole atmosphere as outlined in Iglesias-Suarez et al. (2018) (Fig. S9 in the Supplement). The O3 RK is constructed by calculating the change in LW and SW flux caused by a 1 ppb perturbation in ozone added to each atmospheric layer in turn. The change in SW and LW flux is diagnosed using the offline version of the Suite Of Community RAdiative Transfer (SOCRATES) model, based on Edwards and Slingo (1996). The LW component of the O3 RK (Fig. S9c in the Supplement) is positive throughout the atmosphere, with a maximum in the tropical upper troposphere and lower stratosphere. The SW component (Fig. S9c in the Supplement) is negative above ∼ 12 km altitude and positive below ∼ 12 km altitude. This results in a net O3 RK (Fig. S9a in the Supplement) which is positive everywhere except above ∼ 25 km between 60∘ S and 60∘ N. Using the O3 RK, we are able to show that the stratospheric ozone change is the dominant driver of the ERFclear,clean, accounting for ∼ 75 % of the ERFclear,clean (Fig. 9a and b). The remainder is likely predominantly due to SWV changes with a small contribution from stratospheric methane changes. The latitudinal pattern of ozone radiative forcing reflects the locations of the ozone change, with the largest forcing at the poles, as shown in Figs. S10 and S11 in the Supplement.
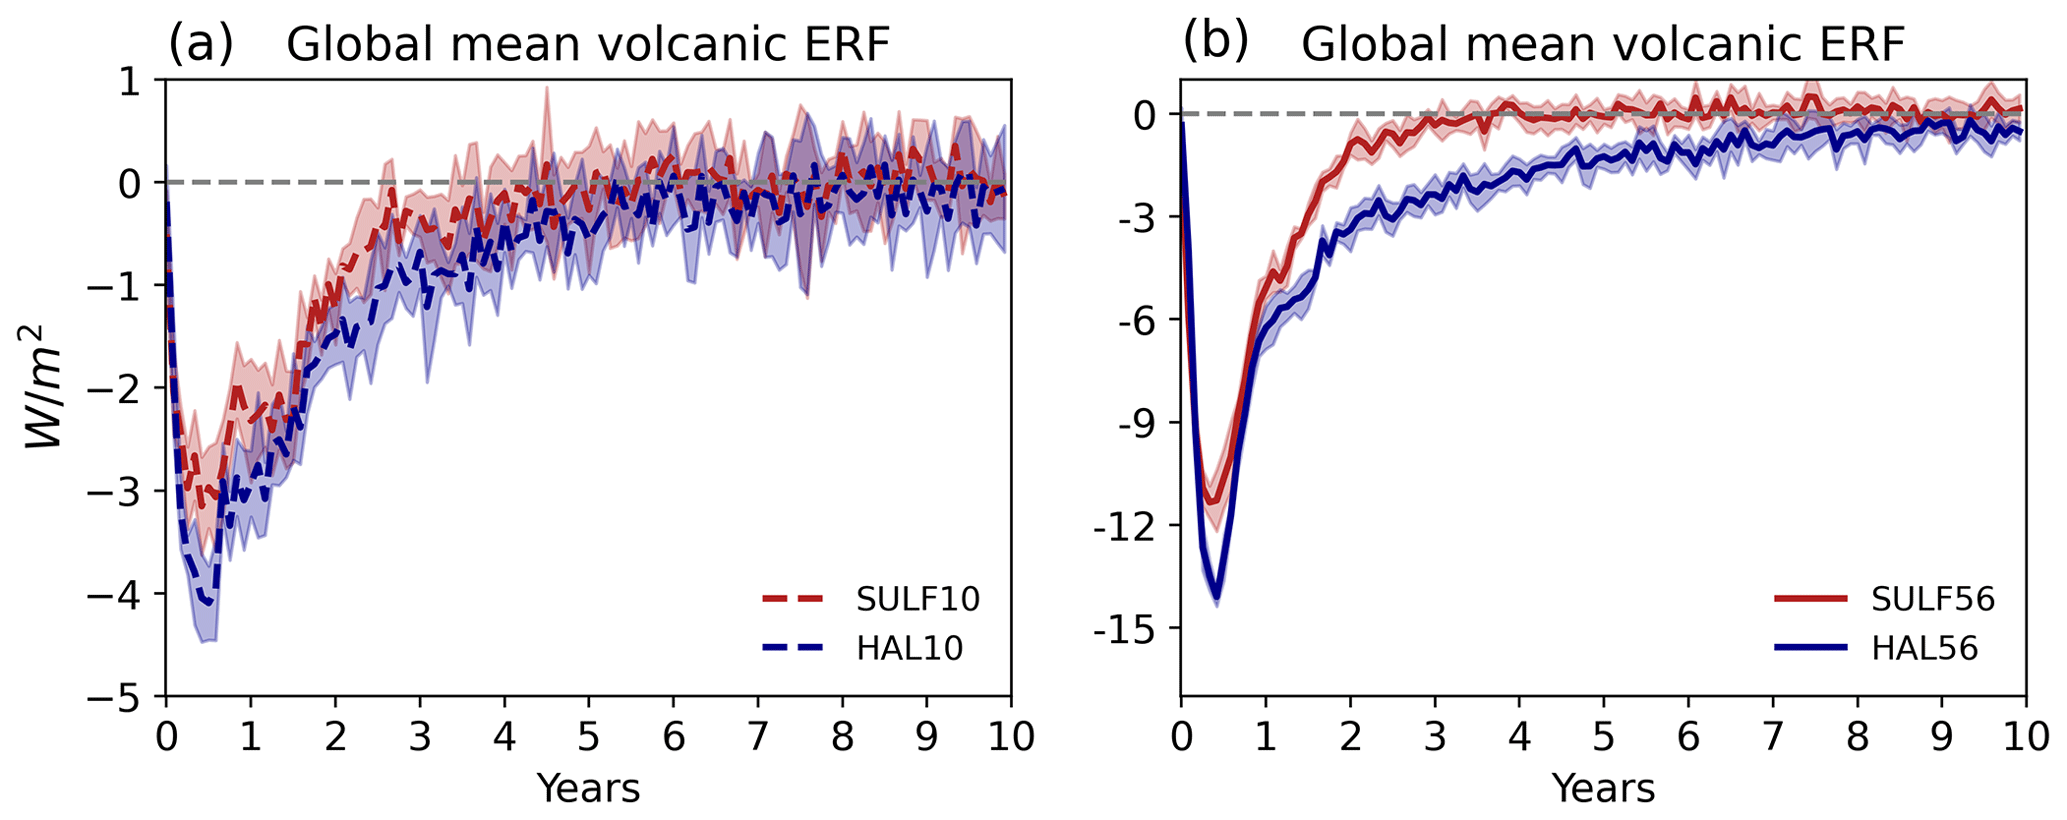
Figure 10Evolution of the global-mean top-of-atmosphere total volcanic forcing (ERF) relative to the control climatology in SULF10 and HAL10 (a) and in SULF56 and HAL56 (b). Volcanic ERF is the sum of ERFari, ERFacii, and ERFclear,clean. Shading represents the ensemble range.
Using the Ghan (2013) method for diagnosing forcing, we have shown that the co-emission of volcanic halogens results in larger peak global-mean ERFari and ERFclear,clean. Taking these in combination, the co-emission of halogens results in substantial increases in the peak global-mean volcanic ERF to −4.1W m−2 (+30 %) in HAL10 and −14.1W m−2 (+24 %) in HAL56 (Fig. 10a and b), as well as increases in the total cumulative forcing to −1.37 × 10²³ J (+60 %) in HAL10 and −3.86 × 10²³ J (+100 %) in HAL56 compared to SULF10 and SULF56 (Fig. S5e and f in the Supplement). In both HAL10 and HAL56, ∼ 25 % of the additional peak global-mean volcanic ERF simulated compared to SULF10 and SULF56, respectively, comes from the changes to ERFari, with the remainder coming from changes to ERFclear,clean.
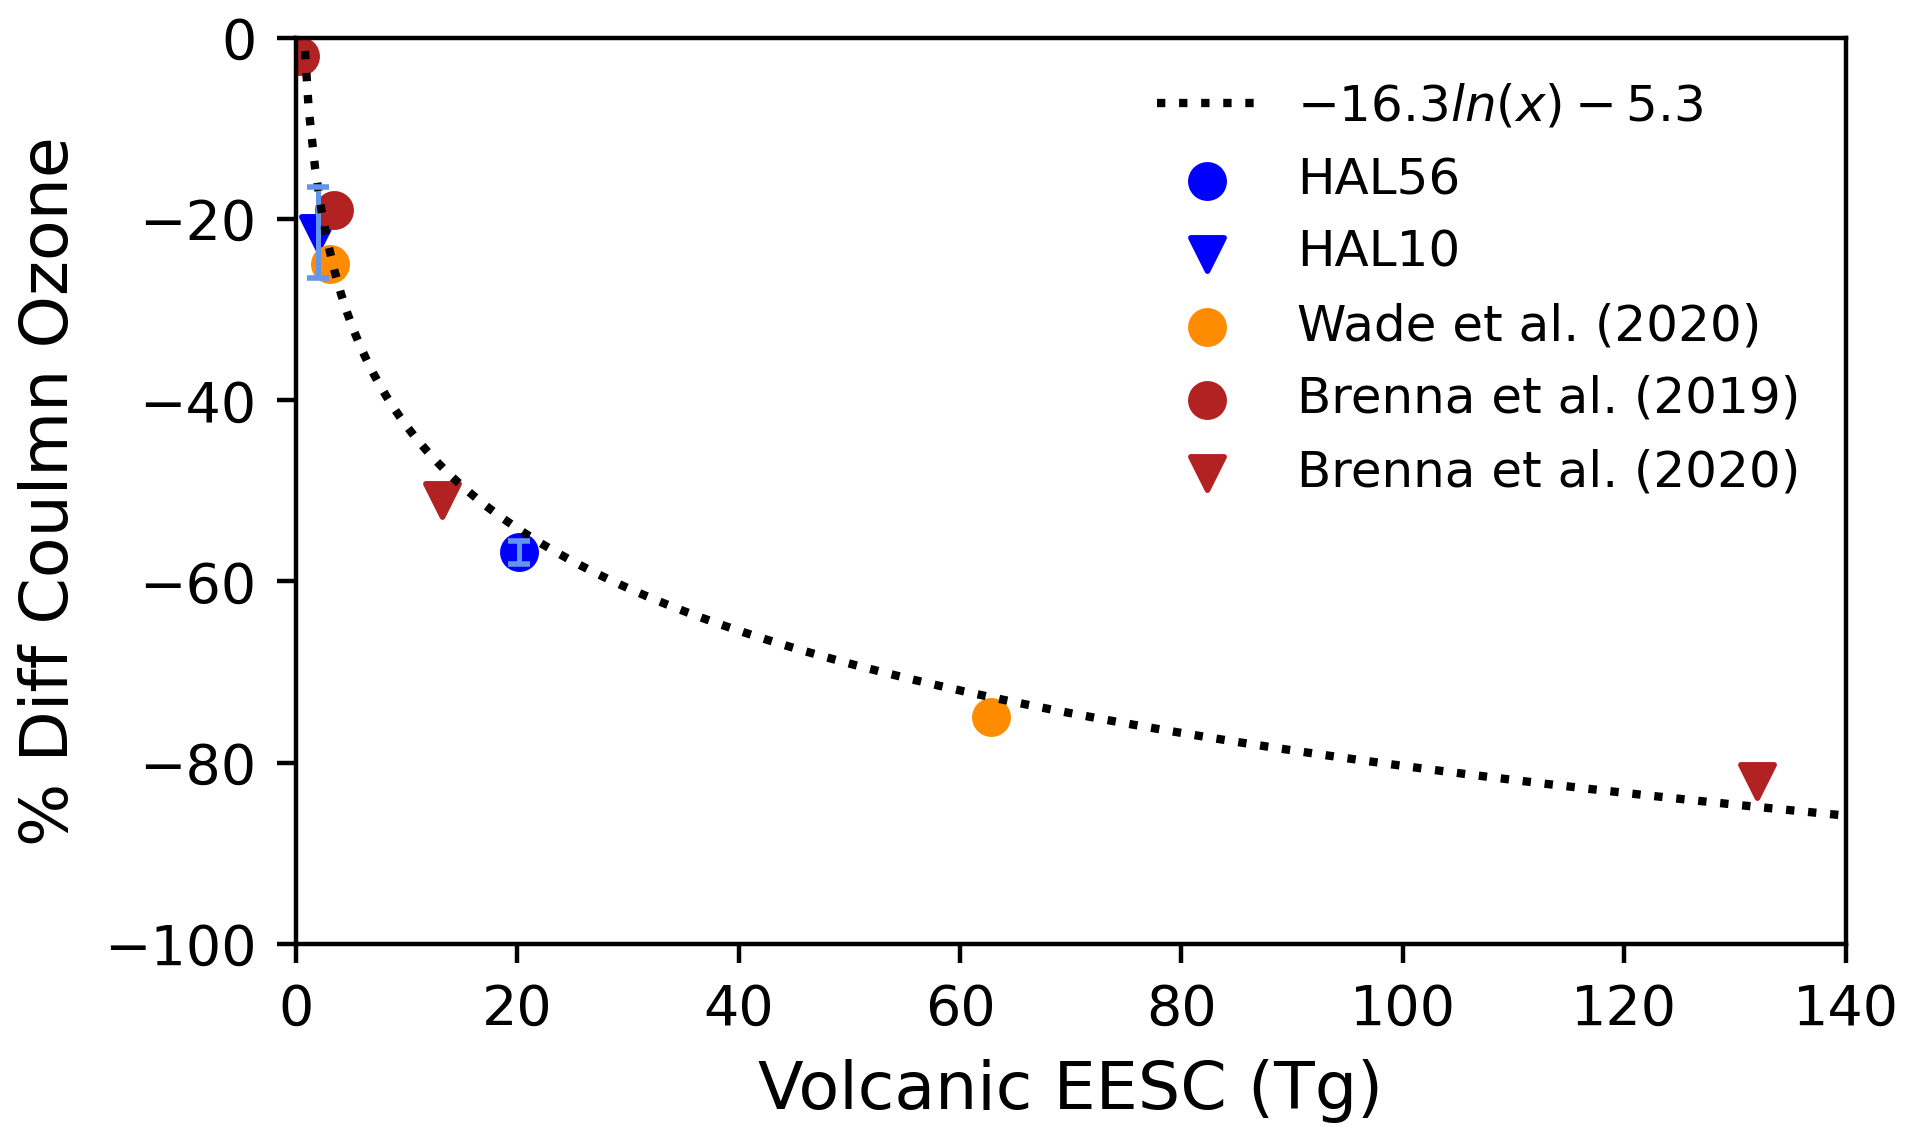
Figure 11Relationship between volcanically emitted equivalent effective stratospheric chlorine (Tg) and peak global-mean % difference in column ozone. Blue: HAL10 and HAL56 ensemble mean and range. Orange: Wade et al. (2020) ensemble mean. Red: Brenna et al. (2019, 2020) ensemble mean.
Comparing the perturbations in HAL56 to HAL10, we find that increasing the volcanic halogen flux by 10 times only results in a ∼ 2.5-times-larger global ozone response and, as ERFclear,clean is dominated by changes in stratospheric ozone, only a ∼ 2-times-larger ERFclear,clean. This suggests that there is a saturation in the ozone-depleting potential of co-emitted volcanic halogens. Plotting the column ozone percentage change against the magnitude of injected halogens expressed as equivalent effective stratospheric chlorine (EESC is a measure of the ozone destruction potential; EESC = [Cl]added to stratosphere + 60 × [Br]added to stratosphere; Cadoux et al., 2015) from this study and a number of previous studies, we find an exponential decay curve describes this relationship: as the EESC increases, the efficiency of volcanic halogen ozone depletion decreases (Fig. 11). This relationship suggests that column ozone is most sensitive to volcanic halogens when the additional EESC is < 20 Tg and that increasing the volcanic EESC flux beyond 60 Tg has little impact on column ozone change. This analysis spans simulations with very different background EESC and column ozone values. Wade et al. (2020), Brenna et al. (2019), and Brenna et al. (2020) simulations are all in a pre-industrial atmosphere background state with low background chlorine levels, whereas the background chlorine levels in HAL10 and HAL56 are significantly higher and with lower initial ozone columns. This relationship suggests that the peak global-mean ozone loss (%) is dependent more on the volcanically injected EESC than the background chlorine and initial ozone columns. In other words, this relationship is time-independent, and this exponential decay curve can be used to estimate the peak global-mean ozone loss for an eruption in any climate state, including future eruptions where the background EESC will have decayed back to pre-1980s levels. This will be especially useful for rapid estimates of ozone change as new or better-constrained volcanic halogen data become available.
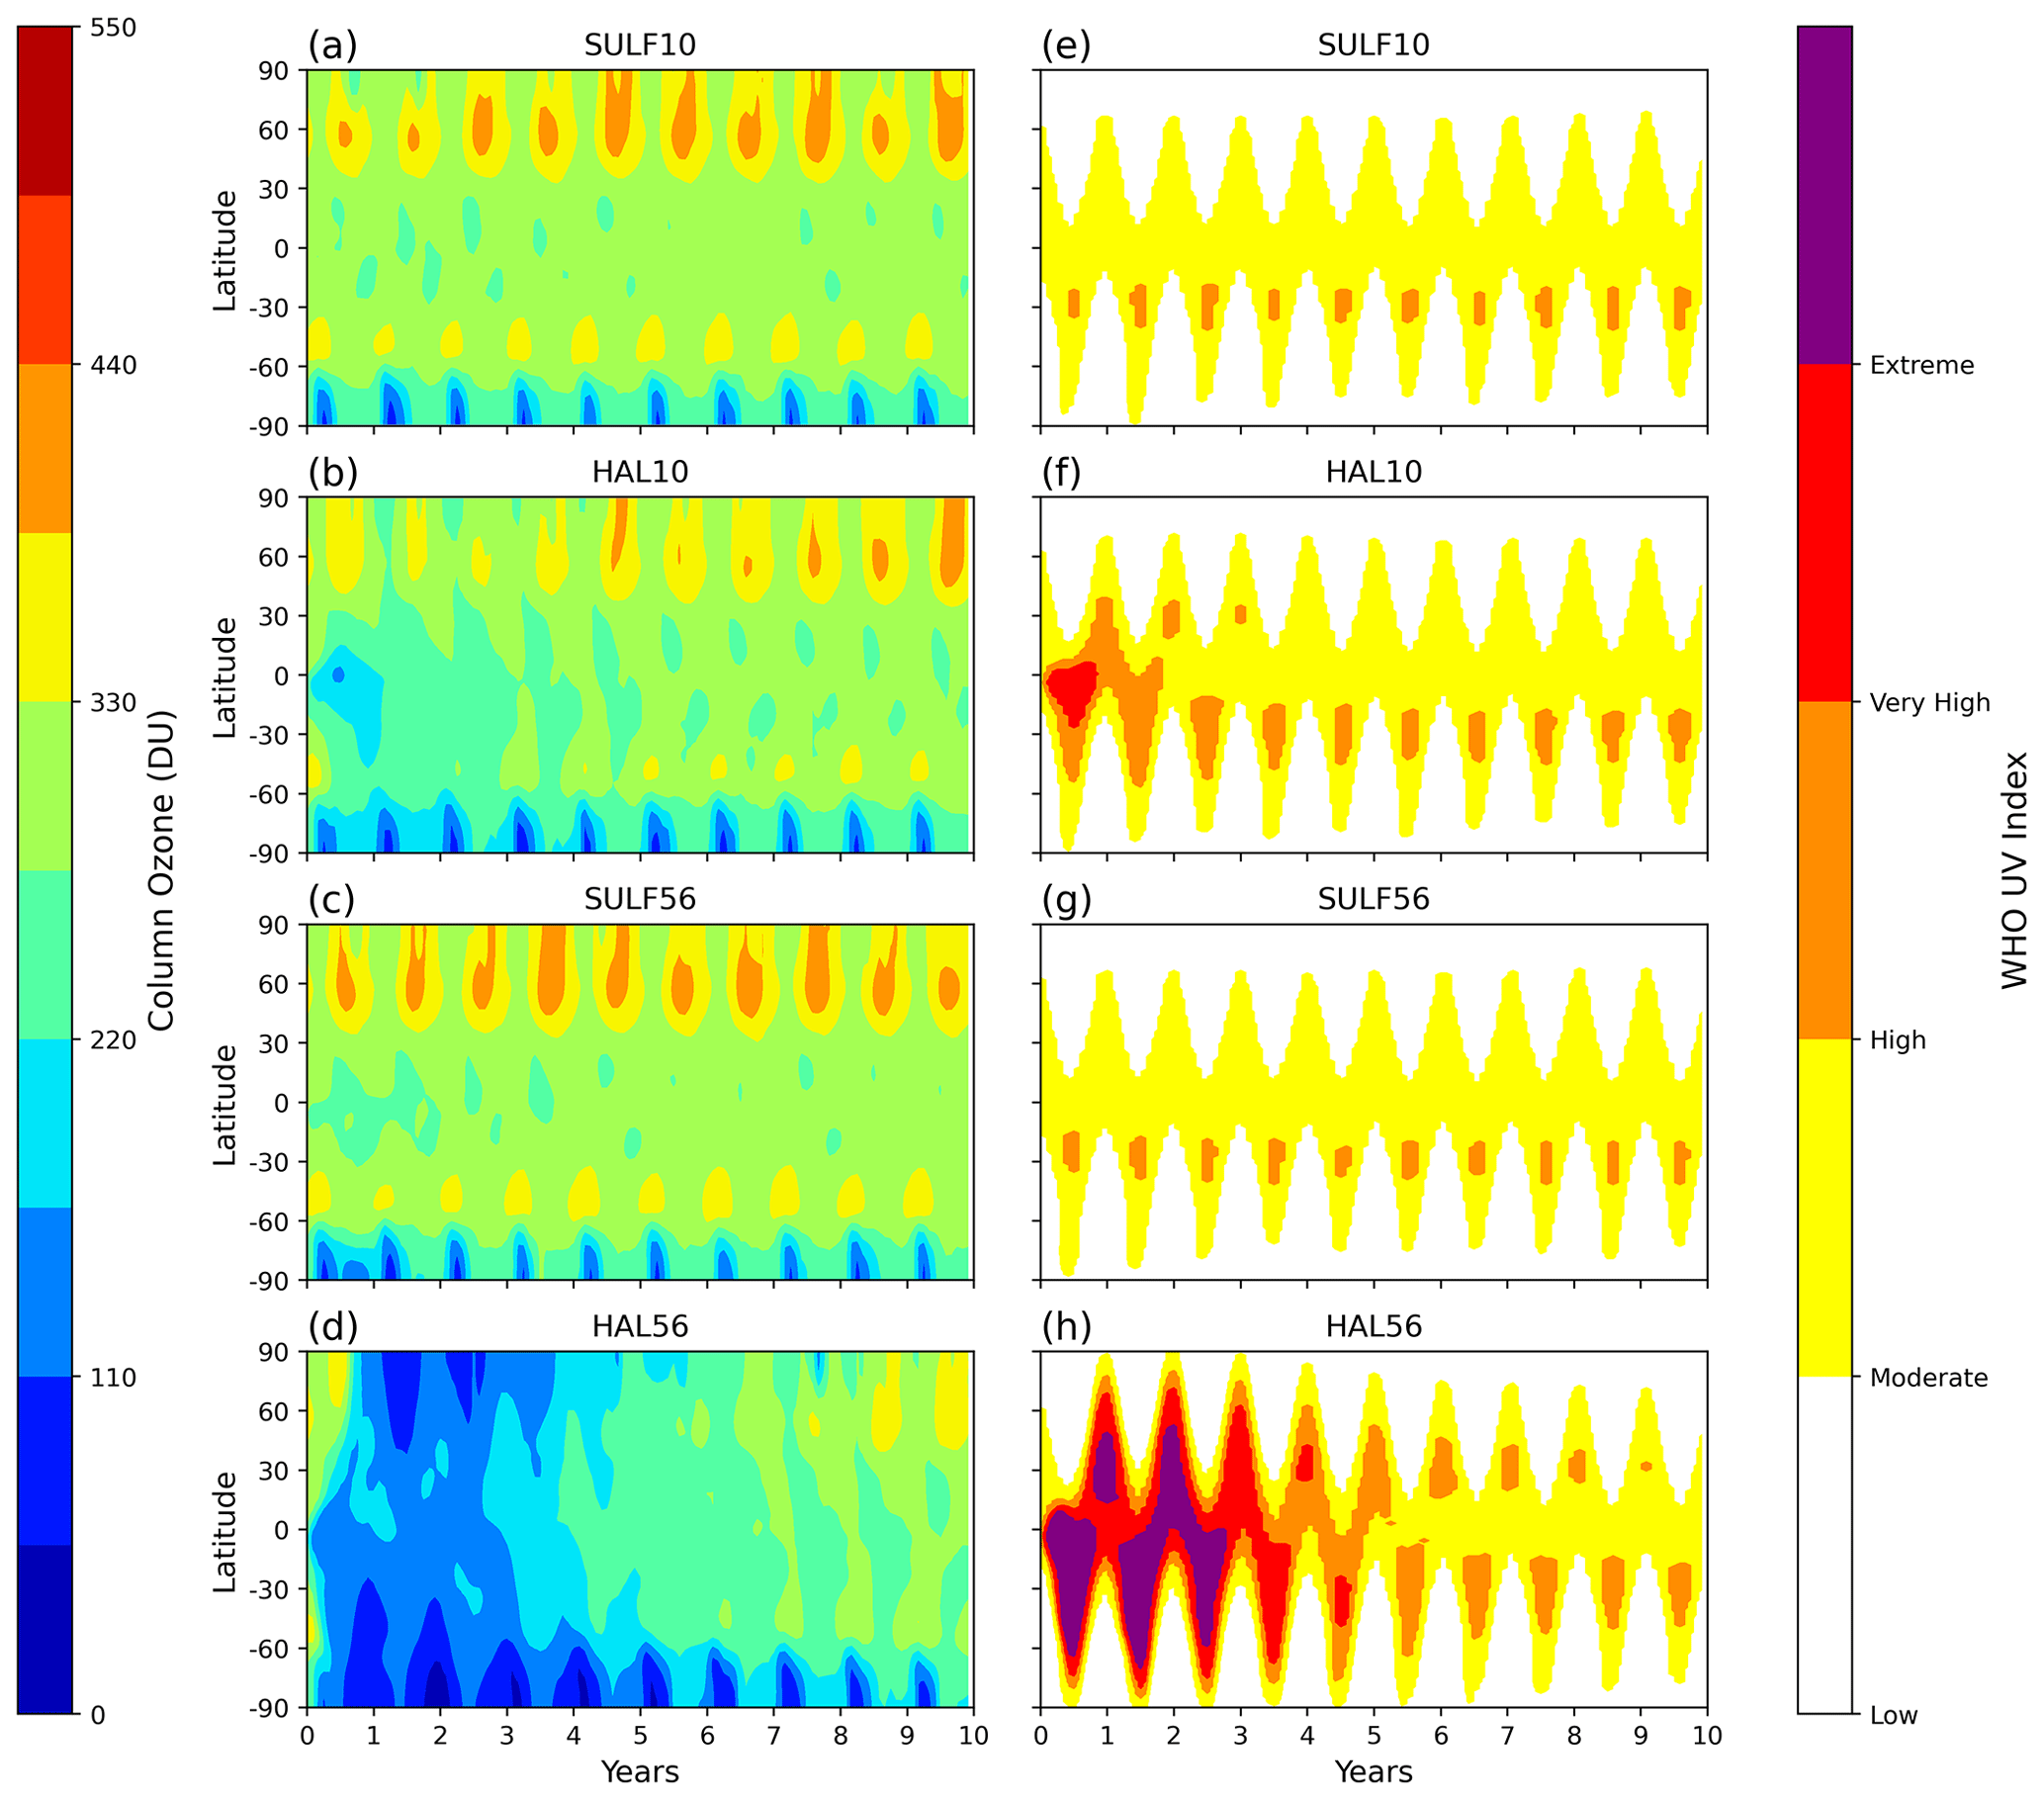
Figure 12Zonal-mean column ozone: (a) SULF10, (b) HAL10, (c) SULF56, and (d) HAL56. Ozone hole conditions are simulated when the column ozone < 220 DU. Zonal-mean surface UV exposure due to column ozone changes (WHO UV index): (e) SULF10, (f) HAL10, (g) SULF56, and (h) HAL56.
The implications of ozone depletion in HAL10 and HAL56 go further than enhancing the ERFclear,clean. High anthropogenic fluxes of halocarbons into the atmosphere during the 1980s caused background chlorine levels to be elevated during the 1990s, and an ozone hole is simulated to develop in the control simulation over the Southern Hemisphere polar regions (Fig. S12 in the Supplement). Using the definition for ozone hole conditions as < 220 DU, we simulate enhanced ozone hole conditions following both HAL10 and HAL56 eruptions (Fig. 12). In HAL10, ozone hole conditions are simulated in the tropics for 1 year after the eruption, and a deepening of ozone hole conditions is seen in Northern Hemisphere polar regions for two winters and in the Southern Hemisphere polar regions for four winters. In HAL56, we simulate ozone hole conditions globally for 5 years, continuing for a further three winters in the Northern Hemisphere polar regions and six winters in the Southern Hemisphere polar regions.
Column ozone depletion on this scale would dramatically increase the flux of harmful UV to the surface, which could cause DNA damage to animals and plants and increase the occurrences of skin cancers, eye damage, and immune system deficiencies among the population (WHO, 1994). Climate modelling and environmental proxies showed that ozone depletion as a result of halogen degassing during the emplacement of Siberian Traps flood basalts led to ozone depletion that stressed ecosystems and caused DNA mutations, which may have contributed to the end-Permian mass extinction (Black et al., 2014). A simple heuristic relating column ozone to clear-sky surface UV index is given by
as defined in (Madronich, 2007), where μo is the cosine of the solar zenith angle and Ω is the total vertical ozone column in Dobson units. The monthly mean average UV index coloured by World Health Organization categories (low [0 to 2], medium [3 to 5], high [6 to 7], very high [8 to 10], and extreme [11 +]) is shown in Fig. 12. This shows that, in the HAL56 scenario, on average “very high” or “extreme” UV levels would be expected all day for much of the globe in the three to four summers after the eruption, with noon values being even higher. The changes in surface UV levels are shown in Fig. S13 in the Supplement. Living under such a high UV exposure would cause immediate immunosuppression, epidemic outbreaks, increases in the occurrences of eye damage, and, in the longer term, skin cancers among the population living between the Equator and the mid-latitudes, which equates to > 95 % of the global population. The assessment of surface UV changes is made more challenging by the presence of volcanic aerosols, which also scatter UV radiation. However, damaging UVB and UVC radiation will not be scattered effectively by larger aerosol size distributions, and volcanic aerosol levels reduce rapidly after peaking in the first post-eruption year.
Whilst we have been able to calculate the composition and climate impacts of the co-emission of halogens and SO2 from volcanic eruptions, these calculations are not without some uncertainty. Recent studies carried out as part of the Volcanic Forcings Model Intercomparison Project (VolMIP) showed large model response disparities in simulations of SO2-only volcanic eruptions (Clyne et al., 2021), but models have been shown to capture the effects of ozone-depleting substances on stratospheric ozone well (World Meteorological Organization (WMO), 2014). As outlined in the introduction, the major uncertainty in this work is the stratospheric injection of HCl and HBr from explosive volcanic eruptions, which is highly variable and depends on both the geochemistry of the volcano and the degree of scavenging determined by the prevailing atmospheric conditions during the eruption. It is clear, however, that significant stratospheric halogen fluxes occur after some explosive volcanic eruptions.
Although this work has focused on simulations of explosive volcanic eruptions in a background climate representative of the 1990s, Fig. 11 demonstrates the simulated ozone depletion predominantly depends on the volcanic halogen injection size and not the background atmospheric state. Using the relationship outlined in Fig. 11, we can estimate the peak global-mean ozone percentage loss for any size of volcanic halogen injection, past or present. We are currently investigating the impacts that plausible future background atmospheric states (such as different greenhouse gas concentrations, background halogen levels, and stratospheric temperatures) may have on the simulated ozone response and volcanic ERF due to co-emitted sulfur and halogen volcanic emissions.
In addition to the co-emission of volcanic halogens, there is also scope to model the co-emission of volcanic water vapour and ash directly into the stratosphere. Legrande et al. (2016) provide a mechanism explaining how SWV originating from volcanic eruptions may alter the chemistry of the stratosphere and the nucleation rate of sulfate aerosol and suggest that this may severely alter the climate impacts. In addition, SWV proved to be an amplifying feedback in simulations in this work, and it would be interesting to see how co-emission of water vapour, halogens, and sulfur would further alter the volcanic forcing in simulations of explosive volcanic eruptions. Zhu et al. (2020) showed the importance of including volcanic ash injections in climate simulations. When heterogeneous chemistry on ash particles was included, they found that 43 % more volcanic sulfur was removed from the stratosphere in the first 2 months. Volcanic ash is also likely to alter the lifetime, activation, and impact of co-emitted volcanic halogens in climate simulations.
In this study we utilised UKESM-AMIP simulations of volcanic eruptions to investigate how the co-emission of volcanic halogens and sulfur alters the effective radiative forcing (ERF) of explosive volcanic eruptions under atmospheric conditions representative of the mid-1990s. As the volcanic flux of HCl and HBr into the stratosphere remains uncertain, a range of plausible explosive volcanic emissions scenarios based on petrological degassing estimates, satellite observations, and volcanic plume modelling were simulated. The four sets of experiments included one large SO2 (10 Tg) and one very large SO2 (56 Tg) emission scenario, both with (HAL10 and HAL56) and without halogens (SULF10 and SULF56), each with an ensemble size of six sampling different QBO states.
These eruption sizes (10 and 56 Tg SO2) are hypothetical, but they are comparable to a VEI 6 (e.g. 1991 Mt Pinatubo) and a VEI 7 (e.g. 1257 Mt Samalas) eruption, representing 1-in-50–100-year and 1-in-500–1000-year events, respectively. HAL56 utilises the 1257 Mt Samalas HCl and HBr emission estimates from Vidal et al. (2016) and assumes a conservative ∼ 5 % stratospheric halogen injection efficiency. HAL10 has a SO2 injection similar to that found to reproduce the spatial and temporal evolution of SAOD following the 1991 Pinatubo eruption (Mills et al., 2016) and a 10-times-smaller HCl and HBr flux than HAL56.
We have shown that the co-emission of halogens and sulfur in simulations of explosive volcanic eruptions significantly increases the peak and cumulative volcanic ERF. This is due to a combination of increased forcing from (i) volcanic aerosol–radiation interactions (ERFari) and (ii) the composition of the stratosphere (ERFclear,clean).
Co-emitting halogens results in a larger global-mean ERFari in both HAL10 (+8 %) and HAL56 (+6 %). Ozone depletion catalysed by volcanic halogens leads to stratospheric cooling, which offsets the volcanic aerosol heating (SULF10 ≃ 1.5 K, SULF56 ≃ 3.5 K) and results in a net stratospheric cooling (HAL10 ≃ −2 K, HAL56 ≃ −3.5 K). The ozone-induced stratospheric cooling prevents aerosol self-lofting and keeps the volcanic aerosol lower in the stratosphere with a shorter lifetime, resulting in reduced growth via condensation and coagulation and smaller peak global-mean effective radius compared to sulfur-only simulations. The peak global-mean effective radii of the HAL10 and HAL56 sulfate aerosols are found to be 15 % and 10 % smaller than SULF10 and SULF56 sulfate aerosols, closer to the most efficient radii for scattering shortwave radiation per unit mass, ∼ 0.20 µm. Subsequently, we find HAL10 and HAL56 have higher peak global-mean SAOD anomalies (+11 %, +22 %) and ERFari (+8 % + 6 %).
Co-emission of halogens also results in significant perturbations to the stratospheric chemistry and compositional-driven forcing. Stratospheric methane was found to decrease by 3 % and 18 %, and stratospheric water vapour (SWV) was found to reduce by 16 % and 36 % in HAL10 and HAL56, respectively. The methane reductions were driven by the enhanced destruction flux by volcanic Cl radicals, and the SWV changes were attributed to the same stratospheric temperature reductions mentioned previously. Cooling in the tropical tropopause vicinity increased the efficiency of the tropical cold trap dehydration effect, reducing the flux of water vapour from the troposphere to the stratosphere. The most dramatic change in chemistry was found to be in stratospheric ozone. Significant ozone depletions were simulated globally in both HAL10 (22 %) and HAL56 (57 %) with prolonged depletion in both NH and SH winter polar regions. In HAL10, ozone hole conditions (< 220 DU) were simulated globally for the first post-eruption year and then for 3–5 years at the poles during the winter. In HAL56, we simulate an ozone hole globally for 5 years followed by a gradual recovery over the following 5 years until only the polar winters exhibit ozone hole conditions. Stratospheric chemistry changes resulting from the co-emission of halogens increased the peak global-mean ERFclear,clean by ∼ 100 % to −2.1W m−2 in HAL56 and −1.3W m−2 in HAL10. Stratospheric ozone depletion is the dominant driver of ERFclear,clean, accounting for ∼ 75 % of the total ERFclear,clean.
The combined effect of increased ERFari and ERFclear,clean is that co-emitting halogens increases the peak global-mean volcanic ERF by 30 % and 24 % and cumulative ERF by 60 % and 100 % in HAL10 and HAL56, respectively. Ozone hole conditions exhibited by both HAL10 and HAL56 would result in dramatic increases in the surface UV flux with “extreme” UV levels being experienced over most of the globe for 4 years following HAL56 eruptions. UV exposure on this scale would lead to devastating negative consequences for society and the biosphere, including increases in the occurrences of skin cancer, eye damage, and immune system deficiencies (WHO, 1994). This work shows for the first time that co-emission of plausible amounts of halogens can amplify the effective radiative forcing in simulations of explosive volcanic eruptions. This highlights the necessity to include volcanic halogens emissions when simulating the climate impacts of past or future eruptions, as well as the critical need to maintain space-borne observations of stratospheric compounds to better constrain the stratospheric injection estimates of volcanic eruptions.
All data required to reproduce our key results are archived in the Centre for Environmental Data Analysis (CEDA) archive and can be found at https://catalogue.ceda.ac.uk/uuid/5f4d2f6daebd4195a0368a79405d3686 (Staunton Sykes et al., 2021). Post-processing and visualisation of data was performed with Python. The scripts and the post-processed data files are available on request from the corresponding author.
The supplement related to this article is available online at: https://doi.org/10.5194/acp-21-9009-2021-supplement.
JSS designed the study, ran the UKESM1-AMIP experiments, analysed the results, and wrote the manuscript. AS and AA provided support for designing the study and analysing the results. TJA, YMS, JW, LRM, and NLA provided support for running the experiments, and TA, YMS, and JW, provided support for the analysis. All authors contributed to revising the manuscript.
The authors declare that they have no conflict of interest.
This article is part of the special issue “The Model Intercomparison Project on the climatic response to Volcanic forcing (VolMIP) (ESD/GMD/ACP/CP inter-journal SI)”. It is not associated with a conference.
John Staunton-Sykes and Youngsub M. Shin would like to thank NERC through the University of Cambridge ESS DTP for funding; James Weber would like to thank the Cambridge Commonwealth, European and International Trust for funding through a Vice Chancellor's Award. Thomas J. Aubry acknowledges support from the Royal Society through a Newton International Fellowship (grant number NIF\R1\180809), from the European Union's Horizon 2020 research and innovation programme under the Marie Skłodowska-Curie grant agreement no. 835939, and from the Sidney Sussex College through a Junior Research Fellowship. Lauren R. Marshall and Anja Schmidt are funded by the UK Natural Environment Research Council (NERC) via the Vol-Clim grant (NE/S000887/1). In addition, Anja Schmidt acknowledges funding via the NERC V-PLUS project (NE/S00436X/1). We would like to thank NERC, through NCAS, and the Met Office for the support of the JWCRP UKCA project. Nathan Luke Abraham and Alex Archibald are supported by NERC and NCAS through the ACSIS project. The team thanks NCAS and the Met Office, through the JWCRP, for support of the UKCA model. This work used Monsoon2, a collaborative high-performance-computing facility funded by the Met Office and the Natural Environment Research Council. This work used JASMIN, the UK collaborative data analysis facility. We would like to thank Alex Rap for allowing the use of the ozone radiative kernel and for his help implementing it in this work. Finally, we thank Daniele Visioni, an anonymous reviewer, and Alan Robock, whose useful and constructive comments helped to improve and clarify this paper.
This research has been supported by NERC through the University of Cambridge ESS DTP funding; Cambridge Commonwealth, European and International Trust funding through a Vice Chancellor’s Award; the Royal Society through a Newton International Fellowship (grant no. NIFnR1n180809); the European Union's Horizon 2020 research and innovation programme under the Marie Skłodowska-Curie grant agreement no. 835939; the UK Natural Environment Research Council (NERC) VolClim grant (NE/S000887/1); the NERC V-PLUS project (NE/S00436X/1); and NERC and NCAS through the ACSIS project.
This paper was edited by Slimane Bekki and reviewed by Daniele Visioni and one anonymous referee.
Aquila, V., Oman, L. D., Stolarski, R., Douglass, A. R., and Newman, P. A.: The response of ozone and nitrogen dioxide to the eruption of Mt. Pinatubo at southern and northern midlatitudes, J. Atmos. Sci., 70, 894–900, https://doi.org/10.1175/JAS-D-12-0143.1, 2013.
Archibald, A. T., O'Connor, F. M., Abraham, N. L., Archer-Nicholls, S., Chipperfield, M. P., Dalvi, M., Folberth, G. A., Dennison, F., Dhomse, S. S., Griffiths, P. T., Hardacre, C., Hewitt, A. J., Hill, R. S., Johnson, C. E., Keeble, J., Köhler, M. O., Morgenstern, O., Mulcahy, J. P., Ordóñez, C., Pope, R. J., Rumbold, S. T., Russo, M. R., Savage, N. H., Sellar, A., Stringer, M., Turnock, S. T., Wild, O., and Zeng, G.: Description and evaluation of the UKCA stratosphere–troposphere chemistry scheme (StratTrop vn 1.0) implemented in UKESM1, Geosci. Model Dev., 13, 1223–1266, https://doi.org/10.5194/gmd-13-1223-2020, 2020.
Bacon, C. R., Newman, S., and Stolper, E.: Water, CO2, Cl, and F in melt inclusions in phenocrysts from three Holocene explosive eruptions, Crater Lake, Oregon, Am. Mineral., 77, 1021, 1992.
Black, B. A., Lamarque, J. F., Shields, C. A., Elkins-Tanton, L. T., and Kiehl, J. T.: Acid rain and ozone depletion from pulsed siberian traps magmatism, Geology, 42, 67–70, https://doi.org/10.1130/G34875.1, 2014.
Brenna, H., Kutterolf, S., and Krüger, K.: Global ozone depletion and increase of UV radiation caused by pre-industrial tropical volcanic eruptions, Sci. Rep., 9, 1–14, https://doi.org/10.1038/s41598-019-45630-0, 2019.
Brenna, H., Kutterolf, S., Mills, M. J., and Krüger, K.: The potential impacts of a sulfur- and halogen-rich supereruption such as Los Chocoyos on the atmosphere and climate, Atmos. Chem. Phys., 20, 6521–6539, https://doi.org/10.5194/acp-20-6521-2020, 2020.
Cadoux, A., Scaillet, B., Bekki, S., Oppenheimer, C., and Druitt, T. H.: Stratospheric Ozone destruction by the Bronze-Age Minoan eruption (Santorini Volcano, Greece), Sci. Rep., 5, 12243, https://doi.org/10.1038/srep12243, 2015.
Carn, S. A., Clarisse, L., and Prata, A. J.: Multi-decadal satellite measurements of global volcanic degassing, J. Volcanol. Geoth. Res., 311, 99–134, https://doi.org/10.1016/j.jvolgeores.2016.01.002, 2016.
Clyne, M., Lamarque, J.-F., Mills, M. J., Khodri, M., Ball, W., Bekki, S., Dhomse, S. S., Lebas, N., Mann, G., Marshall, L., Niemeier, U., Poulain, V., Robock, A., Rozanov, E., Schmidt, A., Stenke, A., Sukhodolov, T., Timmreck, C., Toohey, M., Tummon, F., Zanchettin, D., Zhu, Y., and Toon, O. B.: Model physics and chemistry causing intermodel disagreement within the VolMIP-Tambora Interactive Stratospheric Aerosol ensemble, Atmos. Chem. Phys., 21, 3317–3343, https://doi.org/10.5194/acp-21-3317-2021, 2021.
Crutzen, P. J.: The influence of nitrogen oxides on the atmospheric ozone content, Q. J. Roy. Meteor. Soc., 96, 320–325, https://doi.org/10.1002/qj.49709640815, 1970.
Deshler, T., Liley, J. Ben, Bodeker, G., Matthews, W. A., and Hoffmann, D. J.: Stratospheric aerosol following Pinatubo, comparison of the north and south mid latitudes using in situ measurements, Adv. Space Res., 20, 2089–2095, https://doi.org/10.1016/S0273-1177(97)00600-5, 1997.
Dhomse, S. S., Emmerson, K. M., Mann, G. W., Bellouin, N., Carslaw, K. S., Chipperfield, M. P., Hommel, R., Abraham, N. L., Telford, P., Braesicke, P., Dalvi, M., Johnson, C. E., O'Connor, F., Morgenstern, O., Pyle, J. A., Deshler, T., Zawodny, J. M., and Thomason, L. W.: Aerosol microphysics simulations of the Mt. Pinatubo eruption with the UM-UKCA composition-climate model, Atmos. Chem. Phys., 14, 11221–11246, https://doi.org/10.5194/acp-14-11221-2014, 2014.
Driscoll, S., Bozzo, A., Gray, L. J., Robock, A., and Stenchikov, G.: Coupled Model Intercomparison Project 5 (CMIP5) simulations of climate following volcanic eruptions, J. Geophys. Res.-Atmos., 117, 105, https://doi.org/10.1029/2012JD017607, 2012.
Edwards, J. M. and Slingo, A.: Studies with a flexible new radiation code. I: Choosing a configuration for a large‐scale model, Q. J. Roy. Meteorol. Soc., 122, 689–719, https://doi.org/10.1002/qj.49712253107, 1996.
Eyring, V., Bony, S., Meehl, G. A., Senior, C. A., Stevens, B., Stouffer, R. J., and Taylor, K. E.: Overview of the Coupled Model Intercomparison Project Phase 6 (CMIP6) experimental design and organization, Geosci. Model Dev., 9, 1937–1958, https://doi.org/10.5194/gmd-9-1937-2016, 2016.
Gerlach, T. M., Westrich, H. R., and Symonds, R. B.: Preeruption Vapor in Magma of the Climactic Mount Pinatubo Eruption: Source of the Giant Stratospheric Sulfur Dioxide Cloud, in: Fire Mud Eruptions and Lahars of Mt. Pinatubo, Philippines, edited by: Newhall, C. G. and Punongbayan, R. S., University of Washington Press, pp. 415–433, 1996.
Ghan, S. J.: Technical Note: Estimating aerosol effects on cloud radiative forcing, Atmos. Chem. Phys., 13, 9971–9974, https://doi.org/10.5194/acp-13-9971-2013, 2013.
Guo, S., Bluth, G. J. S., Rose, W. I., Watson, I. M., and Prata, A. J.: Re-evaluation of SO2 release of the 15 June 1991 Pinatubo eruption using ultraviolet and infrared satellite sensors, Geochem. Geophy. Geosy., 5, https://doi.org/10.1029/2003GC000654, 2004.
Halmer, M. M., Schmincke, H. U., and Graf, H. F.: The annual volcanic gas input into the atmosphere, in particular into the stratosphere: A global data set for the past 100 years, J. Volcanol. Geoth. Res., 115, 511–528, https://doi.org/10.1016/S0377-0273(01)00318-3, 2002.
Hunton, D. E., Viggiano, A. A., Miller, T. M., Ballenthin, J. O., Reeves, J. M., Wilson, J. C., Lee, S. H., Anderson, B. E., Brune, W. H., Harder, H., Simpas, J. B., and Oskarsson, N.: In-situ aircraft observations of the 2000 Mt. Hekla volcanic cloud: Composition and chemical evolution in the Arctic lower stratosphere, J. Volcanol. Geoth. Res., 145, 23–34, https://doi.org/10.1016/j.jvolgeores.2005.01.005, 2005.
Iglesias-Suarez, F., Kinnison, D. E., Rap, A., Maycock, A. C., Wild, O., and Young, P. J.: Key drivers of ozone change and its radiative forcing over the 21st century, Atmos. Chem. Phys., 18, 6121–6139, https://doi.org/10.5194/acp-18-6121-2018, 2018.
Kilian, M., Brinkop, S., and Jöckel, P.: Impact of the eruption of Mt Pinatubo on the chemical composition of the stratosphere, Atmos. Chem. Phys., 20, 11697–11715, https://doi.org/10.5194/acp-20-11697-2020, 2020.
Kinne, S., Toon, O. B., and Prather, M. J.: Buffering of stratospheric circulation by changing amounts of tropical ozone a Pinatubo Case Study, Geophys. Res. Lett., 19, 1927–1930, https://doi.org/10.1029/92GL01937, 1992.
Klobas, Eric, J., Wilmouth, D. M., Weisenstein, D. K., Anderson, J. G., and Salawitch, R. J.: Ozone depletion following future volcanic eruptions, Geophys. Res. Lett., 44, 7490–7499, https://doi.org/10.1002/2017GL073972, 2017.
Kremser, S., Thomason, L. W., von Hobe, M., Hermann, M., Deshler, T., Timmreck, C., Toohey, M., Stenke, A., Schwarz, J. P., Weigel, R., Fueglistaler, S., Prata, F. J., Vernier, J.-P., Schlager, H., Barnes, J. E., Antuña-Marrero, J.-C., Fairlie, D., Palm, M., Mahieu, E., Notholt, J., Rex, M., Bingen, C., Vanhellemont, F., Bourassa, A., Plane, J. M. C., Klocke, D., Carn, S. A., Clarisse, L., Trickl, T., Neely, R., James, A. D., Rieger, L., Wilson, J. C., and Meland, B.: Stratospheric aerosol – Observations, processes and impact on climate, Rev. Geophys., 54, 278–335, https://doi.org/10.1002/2015RG000511, 2016.
Krüger, K., Kutterolf, S., and Hansteen, T. H.: Halogen release from Plinian eruptions and depletion of stratospheric ozone, edited by: Schmidt, A., Fristad, K. E., and Elkins-Tanton, L. T., Volcanism Glob. Environ. Chang. chap. 16, 244–259, Cambridge University Press, 2015.
Kutterolf, S., Hansteen, T. H., Appel, K., Freundt, A., Krüger, K., Pérez, W., and Wehrmann, H.: Combined bromine and chlorine release from large explosive volcanic eruptions: A threat to stratospheric ozone?, Geology, 41, 707–710, https://doi.org/10.1130/G34044.1, 2013.
Kutterolf, S., Hansteen, T. H., Freundt, A., Wehrmann, H., Appel, K., Krüger, K., and Pérez, W.: Bromine and chlorine emissions from Plinian eruptions along the Central American Volcanic Arc: From source to atmosphere, Earth Planet. Sc. Lett., 429, 234–246, https://doi.org/10.1016/j.epsl.2015.07.064, 2015.
Kwon, H., Choi, H., Kim, B. M., Kim, S. W., and Kim, S. J.: Recent weakening of the southern stratospheric polar vortex and its impact on the surface climate over Antarctica, Environ. Res. Lett., 15, 094072, https://doi.org/10.1088/1748-9326/ab9d3d, 2020.
Lacis, A.: Volcanic aerosol radiative properties, Past Glob. Chang. Mag., 23, 50–51, https://doi.org/10.22498/pages.23.2.50, 2015.
Langematz, U.: Future ozone in a changing climate, C. R. Geosci., 350, 403–409, https://doi.org/10.1016/j.crte.2018.06.015, 2018.
Lawrence, Z. D., Perlwitz, J., Butler, A. H., Manney, G. L., Newman, P. A., Lee, S. H., and Nash, E. R.: The Remarkably Strong Arctic Stratospheric Polar Vortex of Winter 2020: Links to Record-Breaking Arctic Oscillation and Ozone Loss, J. Geophys. Res.-Atmos., 125, https://doi.org/10.1029/2020JD033271, 2020.
Legrande, A. N., Tsigaridis, K., and Bauer, S. E.: Role of atmospheric chemistry in the climate impacts of stratospheric volcanic injections, Nat. Geosci., 9, 652–655, https://doi.org/10.1038/ngeo2771, 2016.
Loffler, M.: Impact of major volcanic eruptions on stratospheric water vapour, Master's Thesis, The Regensburg University of Applied Sciences, Regensburg, Germany, 2015.
Löffler, M., Brinkop, S., and Jöckel, P.: Impact of major volcanic eruptions on stratospheric water vapour, Atmos. Chem. Phys., 16, 6547–6562, https://doi.org/10.5194/acp-16-6547-2016, 2016.
Lurton, T., Jégou, F., Berthet, G., Renard, J.-B., Clarisse, L., Schmidt, A., Brogniez, C., and Roberts, T. J.: Model simulations of the chemical and aerosol microphysical evolution of the Sarychev Peak 2009 eruption cloud compared to in situ and satellite observations, Atmos. Chem. Phys., 18, 3223–3247, https://doi.org/10.5194/acp-18-3223-2018, 2018.
Madronich, S.: Analytic formula for the clear-sky UV index, Photochem. Photobiol., 83, 1537–1538, https://doi.org/10.1111/j.1751-1097.2007.00200.x, 2007.
Mankin, W. G. and Coffey, M. T.: Increased stratospheric hydrogen chloride in the El Chichon cloud, Science, 226, 170–172, https://doi.org/10.1126/science.226.4671.170, 1984.
Mankin, W. G., Coffey, M. T., and Goldman, A.: Airborne observations of SO2, HCl, and O3 in the stratospheric plume of the Pinatubo Volcano in July 1991, Geophys. Res. Lett., 419, 179–182, https://doi.org/10.1029/91GL02942, 1992.
Mann, G. W., Carslaw, K. S., Spracklen, D. V., Ridley, D. A., Manktelow, P. T., Chipperfield, M. P., Pickering, S. J., and Johnson, C. E.: Description and evaluation of GLOMAP-mode: a modal global aerosol microphysics model for the UKCA composition-climate model, Geosci. Model Dev., 3, 519–551, https://doi.org/10.5194/gmd-3-519-2010, 2010.
McCormick, M. P., Thomason, L. W., and Trepte, C. R.: Atmospheric effects of the Mt Pinatubo eruption, Nature, 373, 399–404, https://doi.org/10.1038/373399a0, 1995.
Mills, M. J., Schmidt, A., Easter, R., Solomon, S., Kinnison, D. E., Ghan, S. J., Neely, R. R., Marsh, D. R., Conley, A., Bardeen, C. G., and Gettelman, A.: Global volcanic aerosol properties derived from emissions, 1990–2014, using CESM1(WACCM), J. Geophys. Res., 121, 2332–2348, https://doi.org/10.1002/2015JD024290, 2016.
Ming, A., Winton, V. H. L., Keeble, J., Abraham, N. L., Dalvi, M. C., Griffiths, P., Caillon, N., Jones, A. E., Mulvaney, R., Savarino, J., Frey, M. M., and Yang, X.: Stratospheric Ozone Changes From Explosive Tropical Volcanoes: Modeling and Ice Core Constraints, J. Geophys. Res.-Atmos., 125, https://doi.org/10.1029/2019JD032290, 2020.
Mulcahy, J. P., Johnson, C., Jones, C. G., Povey, A. C., Scott, C. E., Sellar, A., Turnock, S. T., Woodhouse, M. T., Abraham, N. L., Andrews, M. B., Bellouin, N., Browse, J., Carslaw, K. S., Dalvi, M., Folberth, G. A., Glover, M., Grosvenor, D. P., Hardacre, C., Hill, R., Johnson, B., Jones, A., Kipling, Z., Mann, G., Mollard, J., O'Connor, F. M., Palmiéri, J., Reddington, C., Rumbold, S. T., Richardson, M., Schutgens, N. A. J., Stier, P., Stringer, M., Tang, Y., Walton, J., Woodward, S., and Yool, A.: Description and evaluation of aerosol in UKESM1 and HadGEM3-GC3.1 CMIP6 historical simulations, Geosci. Model Dev., 13, 6383–6423, https://doi.org/10.5194/gmd-13-6383-2020, 2020.
Newhall, C., Self, S., and Robock, A.: Anticipating future Volcanic Explosivity Index (VEI) 7 eruptions and their chilling impacts, Geosphere, 14, 572–603, https://doi.org/10.1130/GES01513.1, 2018.
Osprey, S. M., Gray, L. J., Hardiman, S. C., Butchart, N., and Hinton, T. J.: Stratospheric variability in twentieth-century CMIP5 simulations of the met office climate model: High top versus low top, J. Climate, 26, 1595–1606, https://doi.org/10.1175/JCLI-D-12-00147.1, 2013.
Prata, A. J., Carn, S. A., Stohl, A., and Kerkmann, J.: Long range transport and fate of a stratospheric volcanic cloud from Soufrière Hills volcano, Montserrat, Atmos. Chem. Phys., 7, 5093–5103, https://doi.org/10.5194/acp-7-5093-2007, 2007.
Rap, A., Richards, N. A. D., Forster, P. M., Monks, S. A., Arnold, S. R., and Chipperfield, M. P.: Satellite constraint on the tropospheric ozone radiative effect, Geophys. Res. Lett., 42, 5074–5081, https://doi.org/10.1002/2015GL064037, 2015.
Read, W., Froidvaux, L., Santee, M., and Livesey, N.: Observations of volcanic SO2 and HCl from Aura MLS, American Geophysical Union, Fall Meeting 2009, 14–18 December 2009 San Francisco, California, abstract number V24B-03, 2009.
Robock, A.: Volcanic eruptions and climate, Rev. Geophys., 38, 191–219, https://doi.org/10.1029/1998RG000054, 2000.
Rose, W. I., Millard, G. A., Mather, T. A., Hunton, D. E., Anderson, B., Oppenheimer, C., Thornton, B. F., Gerlach, T. M., Viggiano, A. A., Kondo, Y., Miller, T. M., and Ballenthin, J. O.: Atmospheric chemistry of a 33–34 hour old volcanic cloud from Hekla Volcano (Iceland): Insights from direct sampling and the application of chemical box modeling, J. Geophys. Res.-Atmos., 111, https://doi.org/10.1029/2005JD006872, 2006.
Schmidt, A., Mills, M. J., Ghan, S., Gregory, J. M., Allan, R. P., Andrews, T., Bardeen, C. G., Conley, A., Forster, P. M., Gettelman, A., Portmann, R. W., Solomon, S., and Toon, O. B.: Volcanic Radiative Forcing From 1979 to 2015, J. Geophys. Res.-Atmos., 123, 12491–12508, https://doi.org/10.1029/2018JD028776, 2018.
Self, S., Zhao, J.-X., Holasek, R. E., Torres, R. C., and King, A. J.: The atmospheric impact of the 1991 Mount Pinatubo eruption, in: Fire and Mud: Eruptions and lahars of Mount Pinatubo, Philippines, University of Washington Press, 1996.
Sellar, A. A., Jones, C. G., Mulcahy, J. P., Tang, Y., Yool, A., Wiltshire, A., O'Connor, F. M., Stringer, M., Hill, R., Palmieri, J., Woodward, S., de Mora, L., Kuhlbrodt, T., Rumbold, S. T., Kelley, D. I., Ellis, R., Johnson, C. E., Walton, J., Abraham, N. L., Andrews, M. B., Andrews, T., Archibald, A. T., Berthou, S., Burke, E., Blockley, E., Carslaw, K., Dalvi, M., Edwards, J., Folberth, G. A., Gedney, N., Griffiths, P. T., Harper, A. B., Hendry, M. A., Hewitt, A. J., Johnson, B., Jones, A., Jones, C. D., Keeble, J., Liddicoat, S., Morgenstern, O., Parker, R. J., Predoi, V., Robertson, E., Siahaan, A., Smith, R. S., Swaminathan, R., Woodhouse, M. T., Zeng, G., and Zerroukat, M.: UKESM1: Description and Evaluation of the U. K. Earth System Model, J. Adv. Model. Earth Sy., 11, 4513–4558, https://doi.org/10.1029/2019MS001739, 2019.
Sellar, A. A., Walton, J., Jones, C. G., Wood, R., Abraham, N. L., Andrejczuk, M., Andrews, M. B., Andrews, T., Archibald, A. T., de Mora, L., Dyson, H., Elkington, M., Ellis, R., Florek, P., Good, P., Gohar, L., Haddad, S., Hardiman, S. C., Hogan, E., Iwi, A., Jones, C. D., Johnson, B., Kelley, D. I., Kettleborough, J., Knight, J. R., Köhler, M. O., Kuhlbrodt, T., Liddicoat, S., Linova-Pavlova, I., Mizielinski, M. S., Morgenstern, O., Mulcahy, J., Neininger, E., O'Connor, F. M., Petrie, R., Ridley, J., Rioual, J. C., Roberts, M., Robertson, E., Rumbold, S., Seddon, J., Shepherd, H., Shim, S., Stephens, A., Teixiera, J. C., Tang, Y., Williams, J., Wiltshire, A., and Griffiths, P. T.: Implementation of U. K. Earth System Models for CMIP6, J. Adv. Model. Earth Sy., 12, https://doi.org/10.1029/2019MS001946, 2020.
Solomon, S.: Stratospheric ozone depletion: A review of concepts and history, Rev. Geophys., 37, 275–316, https://doi.org/10.1029/1999RG900008, 1999.
Solomon, S., Portmann, R. W., Garcia, R. R., Thomason, L. W., Poole, L. R., and Mccormick, M. P.: The role of aerosol variations in anthropogenic ozone depletion at northern midlatitudes, J. Geophys. Res., 101, 6713–6727, https://doi.org/10.1029/95JD03353, 1996.
Staunton Sykes, J., Shin, Y., Aubry, T., Weber, J., Marshall, L., Abraham, L., Schmidt, A., and Archibald, A.: Global model data generated for volcanic halogen simulations: United Kingdom Earth System Model 1.0 (UKESM1.0), Unified Model version 11.2, N96L85, 1990s timeslice, Centre for Environmental Data Analysis, in review, https://catalogue.ceda.ac.uk/uuid/5f4d2f6daebd4195a0368a79405d3686 (last access: 10 June 2021), 2021.
Telford, P. J., Abraham, N. L., Archibald, A. T., Braesicke, P., Dalvi, M., Morgenstern, O., O'Connor, F. M., Richards, N. A. D., and Pyle, J. A.: Implementation of the Fast-JX Photolysis scheme (v6.4) into the UKCA component of the MetUM chemistry-climate model (v7.3), Geosci. Model Dev., 6, 161–177, https://doi.org/10.5194/gmd-6-161-2013, 2013.
Textor, C., Graf, H. F., Herzog, M., and Oberhuber, J. M.: Injection of gases into the stratosphere by explosive volcanic eruptions, J. Geophys. Res.-Atmos., 108, https://doi.org/10.1029/2002jd002987, 2003.
Thomason, L. W., Ernest, N., Millán, L., Rieger, L., Bourassa, A., Vernier, J.-P., Manney, G., Luo, B., Arfeuille, F., and Peter, T.: A global space-based stratospheric aerosol climatology: 1979–2016, Earth Syst. Sci. Data, 10, 469–492, https://doi.org/10.5194/essd-10-469-2018, 2018.
Tie, X. X. and Brasseur, G.: The response of stratospheric ozone to volcanic eruptions: Sensitivity to atmospheric chlorine loading, Geophys. Res. Lett., 22, 3035–3038, https://doi.org/10.1029/95GL03057, 1995.
Timmreck, C., Graf, H.-F., Lorenz, S. J., Niemeier, U., Zanchettin, D., Matei, D., Jungclaus, J. H., and Crowley, T. J.: Aerosol size confines climate response to volcanic super-eruptions, Geophys. Res. Lett., 37, https://doi.org/10.1029/2010GL045464, 2010.
Toohey, M., Krüger, K., Bittner, M., Timmreck, C., and Schmidt, H.: The impact of volcanic aerosol on the Northern Hemisphere stratospheric polar vortex: mechanisms and sensitivity to forcing structure, Atmos. Chem. Phys., 14, 13063–13079, https://doi.org/10.5194/acp-14-13063-2014, 2014.
Varekamp, J. C., Luhr, J. F., and Prestegaard, K. L.: The 1982 eruptions of El Chichón Volcano (Chiapas, Mexico): Character of the eruptions, ash-fall deposits, and gasphase, J. Volcanol. Geoth. Res., 23, 39–68, https://doi.org/10.1016/0377-0273(84)90056-8, 1984.
Vidal, C. M., Métrich, N., Komorowski, J. C., Pratomo, I., Michel, A., Kartadinata, N., Robert, V., and Lavigne, F.: The 1257 Samalas eruption (Lombok, Indonesia): The single greatest stratospheric gas release of the Common Era, Sci. Rep., 6, https://doi.org/10.1038/srep34868, 2016.
Wade, D. C., Vidal, C. M., Luke Abraham, N., Dhomse, S., Griffiths, P. T., Keeble, J., Mann, G., Marshall, L., Schmidt, A., and Archibald, A. T.: Reconciling the climate and ozone response to the 1257 CE Mount Samalas eruption, P. Natl. Acad. Sci. USA, 117, 26651–26659, https://doi.org/10.1073/pnas.1919807117, 2020.
Wallace, L. and Livingston, W.: The effect of the Pinatubo cloud on hydrogen chloride and hydrogen fluoride, Geophys. Res. Lett., 19, 1209–1209, https://doi.org/10.1029/92GL01112, 1992.
Woods, D. C., Chuan, R. L., and Rose, W. I.: Halite particles injected into the stratosphere by the 1982 El Chichón eruption, Science, 80, 230, https://doi.org/10.1126/science.230.4722.170, 1985.
World Health Organization & International Programme on Chemical Safety: Ultraviolet radiation : an authoritative scientific review of environmental and health effects of UV, with reference to global ozone layer depletion/published under the joint sponsorship of the United Nations Environment Programme, the International Commission on Non-Ionizing Radiation Protection and the World Health Organization, 2nd ed. World Health Organization, available at: https://apps.who.int/iris/handle/10665/39901 (last access: 10 June 2021), 1994.
WMO (World Meteorological Organization): Scientific Assessment of Ozone Depletion: 2014, World Meteorological Organization, Global Ozone Research and Monitoring Project-Report No. 55, 416 pp., available at: https://csl.noaa.gov/assessments/ozone/2014/#:~:text=The 2014 WMO%2FUNEP assessment,to its preparation and review (last access: 13 June 2021), Geneva, Switzerland, 2014.
Zdanowicz, C. M., Zielinski, G. A., and Germani, M. S.: Mount Mazama eruption: Calendrical age verified and atmospheric impact assessed, Geology, 27, 621–624, https://doi.org/10.1130/0091-7613(1999)027<0621:MMECAV>2.3.CO;2, 1999.
Zhu, Y., Toon, O. B., Jensen, E. J., Bardeen, C. G., Mills, M. J., Tolbert, M. A., Yu, P., and Woods, S.: Persisting volcanic ash particles impact stratospheric SO2 lifetime and aerosol optical properties, Nat. Commun., 11, https://doi.org/10.1038/s41467-020-18352-5, 2020.
Zuev, V. V and Savelieva, E.: The cause of the spring strengthening of the Antarctic polar vortex, Dynam. Atmos. Oceans, 87, https://doi.org/10.1016/j.dynatmoce.2019.101097, 2019.