the Creative Commons Attribution 4.0 License.
the Creative Commons Attribution 4.0 License.
 | 21 Jan 2021
Pan-European rural monitoring network shows dominance of NH3 gas and NH4NO3 aerosol in inorganic atmospheric pollution load
Chris R. Flechard
Ulrich Dämmgen
Sonja Vidic
Vesna Djuricic
Marta Mitosinkova
Hilde T. Uggerud
Maria J. Sanz
Ivan Simmons
Ulrike Dragosits
Eiko Nemitz
Marsailidh Twigg
Netty van Dijk
Yannick Fauvel
Francisco Sanz
Martin Ferm
Cinzia Perrino
Maria Catrambone
David Leaver
Christine F. Braban
J. Neil Cape
Mathew R. Heal
Mark A. Sutton
A comprehensive European dataset on monthly atmospheric NH3, acid gases (HNO3, SO2, HCl), and aerosols (NH, NO, SO, Cl−, Na+, Ca2+, Mg2+) is presented and analysed. Speciated measurements were made with a low-volume denuder and filter pack method (DEnuder for Long-Term Atmospheric sampling, DELTA®) as part of the EU NitroEurope (NEU) integrated project. Altogether, there were 64 sites in 20 countries (2006–2010), coordinated between seven European laboratories. Bulk wet-deposition measurements were carried out at 16 co-located sites (2008–2010). Inter-comparisons of chemical analysis and DELTA® measurements allowed an assessment of comparability between laboratories.
The form and concentrations of the different gas and aerosol components measured varied between individual sites and grouped sites according to country, European regions, and four main ecosystem types (crops, grassland, forests, and semi-natural). The smallest concentrations (with the exception of SO and Na+) were in northern Europe (Scandinavia), with broad elevations of all components across other regions. SO2 concentrations were highest in central and eastern Europe, with larger SO2 emissions, but particulate SO concentrations were more homogeneous between regions. Gas-phase NH3 was the most abundant single measured component at the majority of sites, with the largest variability in concentrations across the network. The largest concentrations of NH3, NH, and NO were at cropland sites in intensively managed agricultural areas (e.g. Borgo Cioffi in Italy), and the smallest were at remote semi-natural and forest sites (e.g. Lompolojänkkä, Finland), highlighting the potential for NH3 to drive the formation of both NH and NO aerosol. In the aerosol phase, NH was highly correlated with both NO and SO, with a near-1:1 relationship between the equivalent concentrations of NH and sum (NO SO, of which around 60 % was as NH4NO3.
Distinct seasonality was also observed in the data, influenced by changes in emissions, chemical interactions, and the influence of meteorology on partitioning between the main inorganic gases and aerosol species. Springtime maxima in NH3 were attributed to the main period of manure spreading, while the peak in summer and trough in winter were linked to the influence of temperature and rainfall on emissions, deposition, and gas–aerosol-phase equilibrium. Seasonality in SO2 was mainly driven by emissions (combustion), with concentrations peaking in winter, except in southern Europe, where the peak occurred in summer. Particulate SO showed large peaks in concentrations in summer in southern and eastern Europe, contrasting with much smaller peaks occurring in early spring in other regions. The peaks in particulate SO coincided with peaks in NH3 concentrations, attributed to the formation of the stable (NH4)2SO4. HNO3 concentrations were more complex, related to traffic and industrial emissions, photochemistry, and HNO3:NH4NO3 partitioning. While HNO3 concentrations were seen to peak in the summer in eastern and southern Europe (increased photochemistry), the absence of a spring peak in HNO3 in all regions may be explained by the depletion of HNO3 through reaction with surplus NH3 to form the semi-volatile aerosol NH4NO3. Cooler, wetter conditions in early spring favour the formation and persistence of NH4NO3 in the aerosol phase, consistent with the higher springtime concentrations of NH and NO. The seasonal profile of NO was mirrored by NH, illustrating the influence of gas–aerosol partitioning of NH4NO3 in the seasonality of these components.
Gas-phase NH3 and aerosol NH4NO3 were the dominant species in the total inorganic gas and aerosol species measured in the NEU network. With the current and projected trends in SO2, NOx, and NH3 emissions, concentrations of NH3 and NH4NO3 can be expected to continue to dominate the inorganic pollution load over the next decades, especially NH3, which is linked to substantial exceedances of ecological thresholds across Europe. The shift from (NH4)2SO4 to an atmosphere more abundant in NH4NO3 is expected to maintain a larger fraction of reactive N in the gas phase by partitioning to NH3 and HNO3 in warm weather, while NH4NO3 continues to contribute to exceedances of air quality limits for PM2.5.
- Article
(19755 KB) - Full-text XML
-
Supplement
(3818 KB) - BibTeX
- EndNote


Air quality policies and research on atmospheric sulfur (S) and nitrogen (N) pollutant impacts on ecosystems and human health have focused on the emissions, concentrations, and depositions of sulfur dioxide (SO2), nitrogen oxides (NOx), ammonia (NH3), and their secondary inorganic aerosols (SIAs; ammonium sulfate, (NH4)2SO4; ammonium nitrate, NH4NO3) (ROTAP, 2012; EMEP, 2019). The aerosols, formed through neutralization reactions between the alkaline NH3 gas and acids generated in the atmosphere by the oxidation of SO2 and NOx (Huntzicker et al., 1980; AQEG, 2012), are a major component of fine particulate matter (PM2.5) (AQEG, 2012; Vieno et al., 2016a) and precipitation (ROTAP, 2012; EMEP, 2019). The negative effects of these pollutants on sensitive ecosystems are mainly through acidification (excess acidity) and eutrophication (excess nutrient N) processes that can lead to a loss of key species and decline in biodiversity (e.g. Hallsworth et al., 2010; Stevens et al., 2010). They are also implicated in radiative forcing and influence climate change through inputs of nitrogen that can alter the carbon cycle (Reis et al., 2012; Sutton et al., 2013; Zaehle and Dalmonech, 2011).
A number of EU policy measures (e.g. 2008/50/EC Ambient Air Quality Directive: EU, 2008; 2016/2284/EU National Emissions Ceilings Directive, NECD: EU, 2016) and wider international agreements (e.g. Gothenburg Protocol; UNECE, 2012) are targeted at abating the emissions and environmental impacts of SO2, NOx, and NH3. The largest emissions reductions have been achieved for SO2, which decreased by 82 % across the 33 member countries of the European Environment Agency (EEA-33) since 1990, to 4743 kt SO2 in 2017 (EEA, 2019). Reductions in NOx emissions have been more modest, at 45 % over the same period, with emissions in 2017 of 8563 kt NOx exceeding those of SO2. By contrast, the reductions in NH3 emissions (of which over 90 % come from agriculture) have been more modest, decreasing by only 18 %. Here, the decrease was largely driven by reductions in fertilizer use and livestock numbers, in particular from eastern European countries, rather than through implementation of any abatement or mitigation measures. More worryingly, the decreasing trend has reversed in recent years, with emissions increasing by 5 % since 2010, to 4788 kt NH3 in 2017 (EEA, 2019).
In recent assessments, critical loads of acidity were exceeded in about 5 % of the ecosystem area across Europe in 2017 (EMEP, 2018). While the substantial decline in SO2 emissions has allowed the recovery of ecosystems from acid rain, NH3 from agriculture and NOx from transport are increasingly contributing to a larger fraction of the acidity load. Although NH3 is not an acid gas, nitrification of NH3 and ammonium (NH) releases hydrogen ions (H+) that acidify soils and fresh water. The deposition of reactive N (Nr; including oxidized N: NOx, HNO3, NO, and reduced N: NH3, NH) and its contribution to eutrophication effects have also been identified by the European Environment Agency (EEA) as the most important impact of air pollutants on ecosystems and biodiversity (EEA, 2019). The deposition of Nr throughout Europe remains substantially larger than the level needed to protect ecosystems, with critical-load thresholds for eutrophication from N exceeded in around 62 % of the EU-28 ecosystem area and in almost all countries in Europe in 2017 (EMEP, 2018).
Following emission, atmospheric transport and fate of the gases are controlled by the following processes: short-range dispersion and deposition, chemical reaction and formation of NH aerosols, and the long-range transport and deposition of the aerosols (Sutton et al., 1998; ROTAP, 2012). Atmospheric S and Nr inputs from the atmosphere to the biosphere occur though (i) dry deposition of gases and aerosols, (ii) wet deposition in rain, and (iii) occult deposition in fog and cloud (Smith et al., 2000; ROTAP, 2012). The deposition processes contribute very different fractions of the total S or Nr input and different chemical forms of the pollutants at different spatial scales. NH3 is a highly reactive, water-soluble gas and deposits much faster than NOx (which is not very water-soluble and has low deposition velocity). Dry N deposition by NH3 therefore contributes a significant fraction of the total N deposition to receptors close to source areas and will often exert the larger ecological impacts compared with other N pollutants (Cape et al., 2004; Sutton et al., 1998, 2007). Numerous studies have shown that Nr deposition in the vicinity of NH3 sources is dominated by dry NH3–N deposition (e.g. Pitcairn et al., 1998; Sheppard et al., 2011), with removal of NH3 close to a source controlled by physical, chemical, and ecophysiological processes (Flechard et al., 2011; Sutton et al., 2007, 2013). Unlike NOx, HNO3 (from oxidation of NOx) is very water-soluble, while NO particles can act as cloud condensation nuclei (CCN) so that they are both scavenged quickly and removed efficiently by precipitation. Since NOx is inefficiently removed by precipitation, wet deposition of NOx near a source is small and only becomes important after NOx has been converted to HNO3 and NO.
Because of the large numbers of atmospheric N species and their complex atmospheric chemistry, quantifying the deposition of Nr is hugely complex and is a key source of uncertainty for ecosystem effect assessment (Bobbink et al., 2010; Fowler and Reis, 2007; Schrader et al., 2018; Sutton et al., 2007). Input by dry deposition can be estimated using a combination of measured and/or modelled concentration fields with high-resolution inferential models (e.g. Smith et al., 2000; Flechard et al., 2011) or by making direct flux measurements (e.g. Fowler et al., 2001; Nemitz et al., 2008). Although it is possible to measure Nr deposition directly (e.g. Skiba et al., 2009), the flux measurement techniques are complex and resource-intensive, unsuited to routine measurements at a large number of sites. The “inferential” modelling approach provides a direct estimation of deposition from Nr measurements by applying a land-use-dependent deposition velocity (Vd) to measured concentrations (Dore et al., 2015; Flechard et al., 2011; Simpson et al., 2006; Smith et al., 2000).
At present, there are limited atmospheric measurements that speciate the gas- and aerosol-phase components at multiple sites over several years. On a European scale, atmospheric measurements of sulfur (SO2, particulate SO) and nitrogen (NH3, HNO3, particulate NH, NO) have been made by a daily filter pack method across the European Monitoring and Evaluation Program (EMEP) networks since 1985, providing data for evaluating wet- and dry-deposition models (EMEP, 2016; Tørseth et al., 2012). The method, however, does not distinguish between the gas- and aerosol-phase N species. Consequently, these data are reported as total inorganic ammonium (TIA = sum of NH3 and NH) and total inorganic nitrate (TIN = sum HNO3 and NO), limiting the usefulness of the data. Speciated measurements by an expensive and labour-intensive daily annular denuder method are also made (Tørseth et al., 2012) but are necessarily restricted to a small number of sites due to the high costs associated with this type of measurement. There are also networks with a focus on specific N components, for example, the national NH3 monitoring networks in the Netherlands (LML; van Zanten et al., 2017) and in the UK (National Ammonia Monitoring Network, NAMN; Tang et al., 2018a) or compliance monitoring across Europe in the case of SO2 and NOx. The UK is unique in having an extensive set of speciated gas and aerosol monitoring data from the Acid Gas and Aerosol Network (AGANet), with measurements from 1999 to the present (Tang et al., 2018b).
In this context, there is an ongoing need for cost-effective, easy-to-operate, time-integrated atmospheric measurement for the respective gas and aerosol phases at sufficient spatial scales. Such data would help to (1) improve estimates of N deposition; (2) contribute to development and validation of long-range transport models, e.g. EMEP (Simpson et al., 2006) and EMEP4UK (Vieno et al., 2014, 2016b); (3) interpret interactions between the gas and aerosol phases; and (4) interpret ecological responses to nitrogen (e.g. ecosystem biodiversity or net carbon exchange). To contribute to this goal, a “three-level” measurement strategy in the EU Framework Programme 6 Integrated Project “NitroEurope” (NEU; http://www.nitroeurope.ceh.ac.uk/, last access: 29 July 2020) between 2006 and 2010 delivered a comprehensive integrated assessment of the nitrogen cycle, budgets, and fluxes for a range of European terrestrial ecosystems (Sutton et al., 2007; Skiba et al., 2009). At the most intensive level (Level 3), state-of-the-art instrumentation for high-resolution, continuous measurements at just 13 “flux super sites” provided detailed understanding on atmospheric and chemical processes (Skiba et al., 2009). By contrast, manual methods with a low temporal frequency (monthly) at the basic level (Level 1) provided measurements of Nr components at a large number of sites (> 50 sites) in a cost-efficient way in a pan-European network (Tang et al., 2009). Key species of interest included NH3, HNO3, and ammonium aerosols ((NH4)2SO4, NH4NO3).
In this paper, we present and discuss 4 years of monthly reactive gas (NH3, HNO3, HCl) and aerosol (NH, NO, SO, Cl−, Na+, Ca2+, Mg2+) measurements from the Level 1 network set up under the NEU integrated project (Fig. 2). A harmonized measurement approach with a simple, cost-efficient time-integrated method, applied with high spatial coverage, allowed a comprehensive assessment across Europe. The gas and aerosol network was complemented by 2 years of wet-deposition data made at a subset of the sites (Fig. 3). The intention of the smaller bulk wet-deposition network was two-fold: (i) to provide wet-deposition estimates at DELTA® (DEnuder for Long-Term Atmospheric sampling) sites that do not already have such measurements on site and (ii) to compare the relative importance of reduced and oxidized N versus sulfur in the atmospheric pollution load. Measurements across the network were coordinated between multiple European laboratories. The measurement approach and the operations of the networks, including the implementation of annual inter-comparisons to assess comparability between the laboratories, are described. The data are discussed in terms of spatial and temporal variation in concentrations, relative contribution of the inorganic nitrogen and sulfur components to the inorganic pollution load, and changes in atmospheric concentrations of acid gases and their interactions with NH3 gas and NH aerosol.
2.1 NEU Level 1 DELTA® network
The NitroEurope (NEU) Level 1 network was operated between November 2006 and December 2010 to deliver the core measurements of reactive nitrogen gases (NH3, HNO3) and aerosols (NH, NO) for the project (Fig. 1). A low-volume denuder filter pack method, the “DEnuder for Long-Term Atmospheric sampling” system (DELTA®; Sutton et al., 2001a; Tang et al., 2009, 2018b), with time-integrated monthly sampling was used, which made implementation at a large number of sites possible. Other acid gases (SO2, HCl) and aerosols (SO, Cl−, Na+, Ca2+, Mg2+) were also collected at the same time and measured by the DELTA® method. DELTA® measurements were co-located with all NEU Level 3 sites with advanced flux measurements (Skiba et al., 2009) and with the network of main CarboEurope-IP CO2 flux monitoring sites (http://www.carboeurope.org/ceip/, last access: 5 January 2020) (Flechard et al., 2011, 2020). Two of the UK sites in the NEU DELTA® network are existing UK NAMN (Tang et al., 2018a) and AGANet sites (Tang et al., 2018b). These are Auchencorth Moss (UK-Amo) and Bush (UK-EBu), located in southern Scotland. Monthly gas and aerosol data at the two sites, made as part of the UK national networks, were included in the NEU network. NEU network Nr data were used, together with a range of dry-deposition models, to model dry-deposition fluxes (Flechard et al., 2011) and to assess the influence of Nr on the C cycle, potential C sequestration, and the greenhouse gas balance of ecosystems using CO2 exchange data from the co-located CarboEurope sites (Flechard et al., 2020). Other measurements made at the Level 1 sites included estimation of wet-deposition fluxes (Sect. 2.3) and also soil and plant bioassays (Schaufler et al., 2010).

Figure 1Reaction scheme for the formation of ammonium aerosols from interaction of NH3 with acid gases HNO3, SO2, and HCl, showing the components (green) that were measured in the NitroEurope (NEU) DELTA® network. Dry deposition of the gas and aerosol components was estimated by inferential modelling (Flechard et al., 2011), while wet deposition (blue) was measured in the NEU bulk wet-deposition network at a subset of the DELTA® sites.
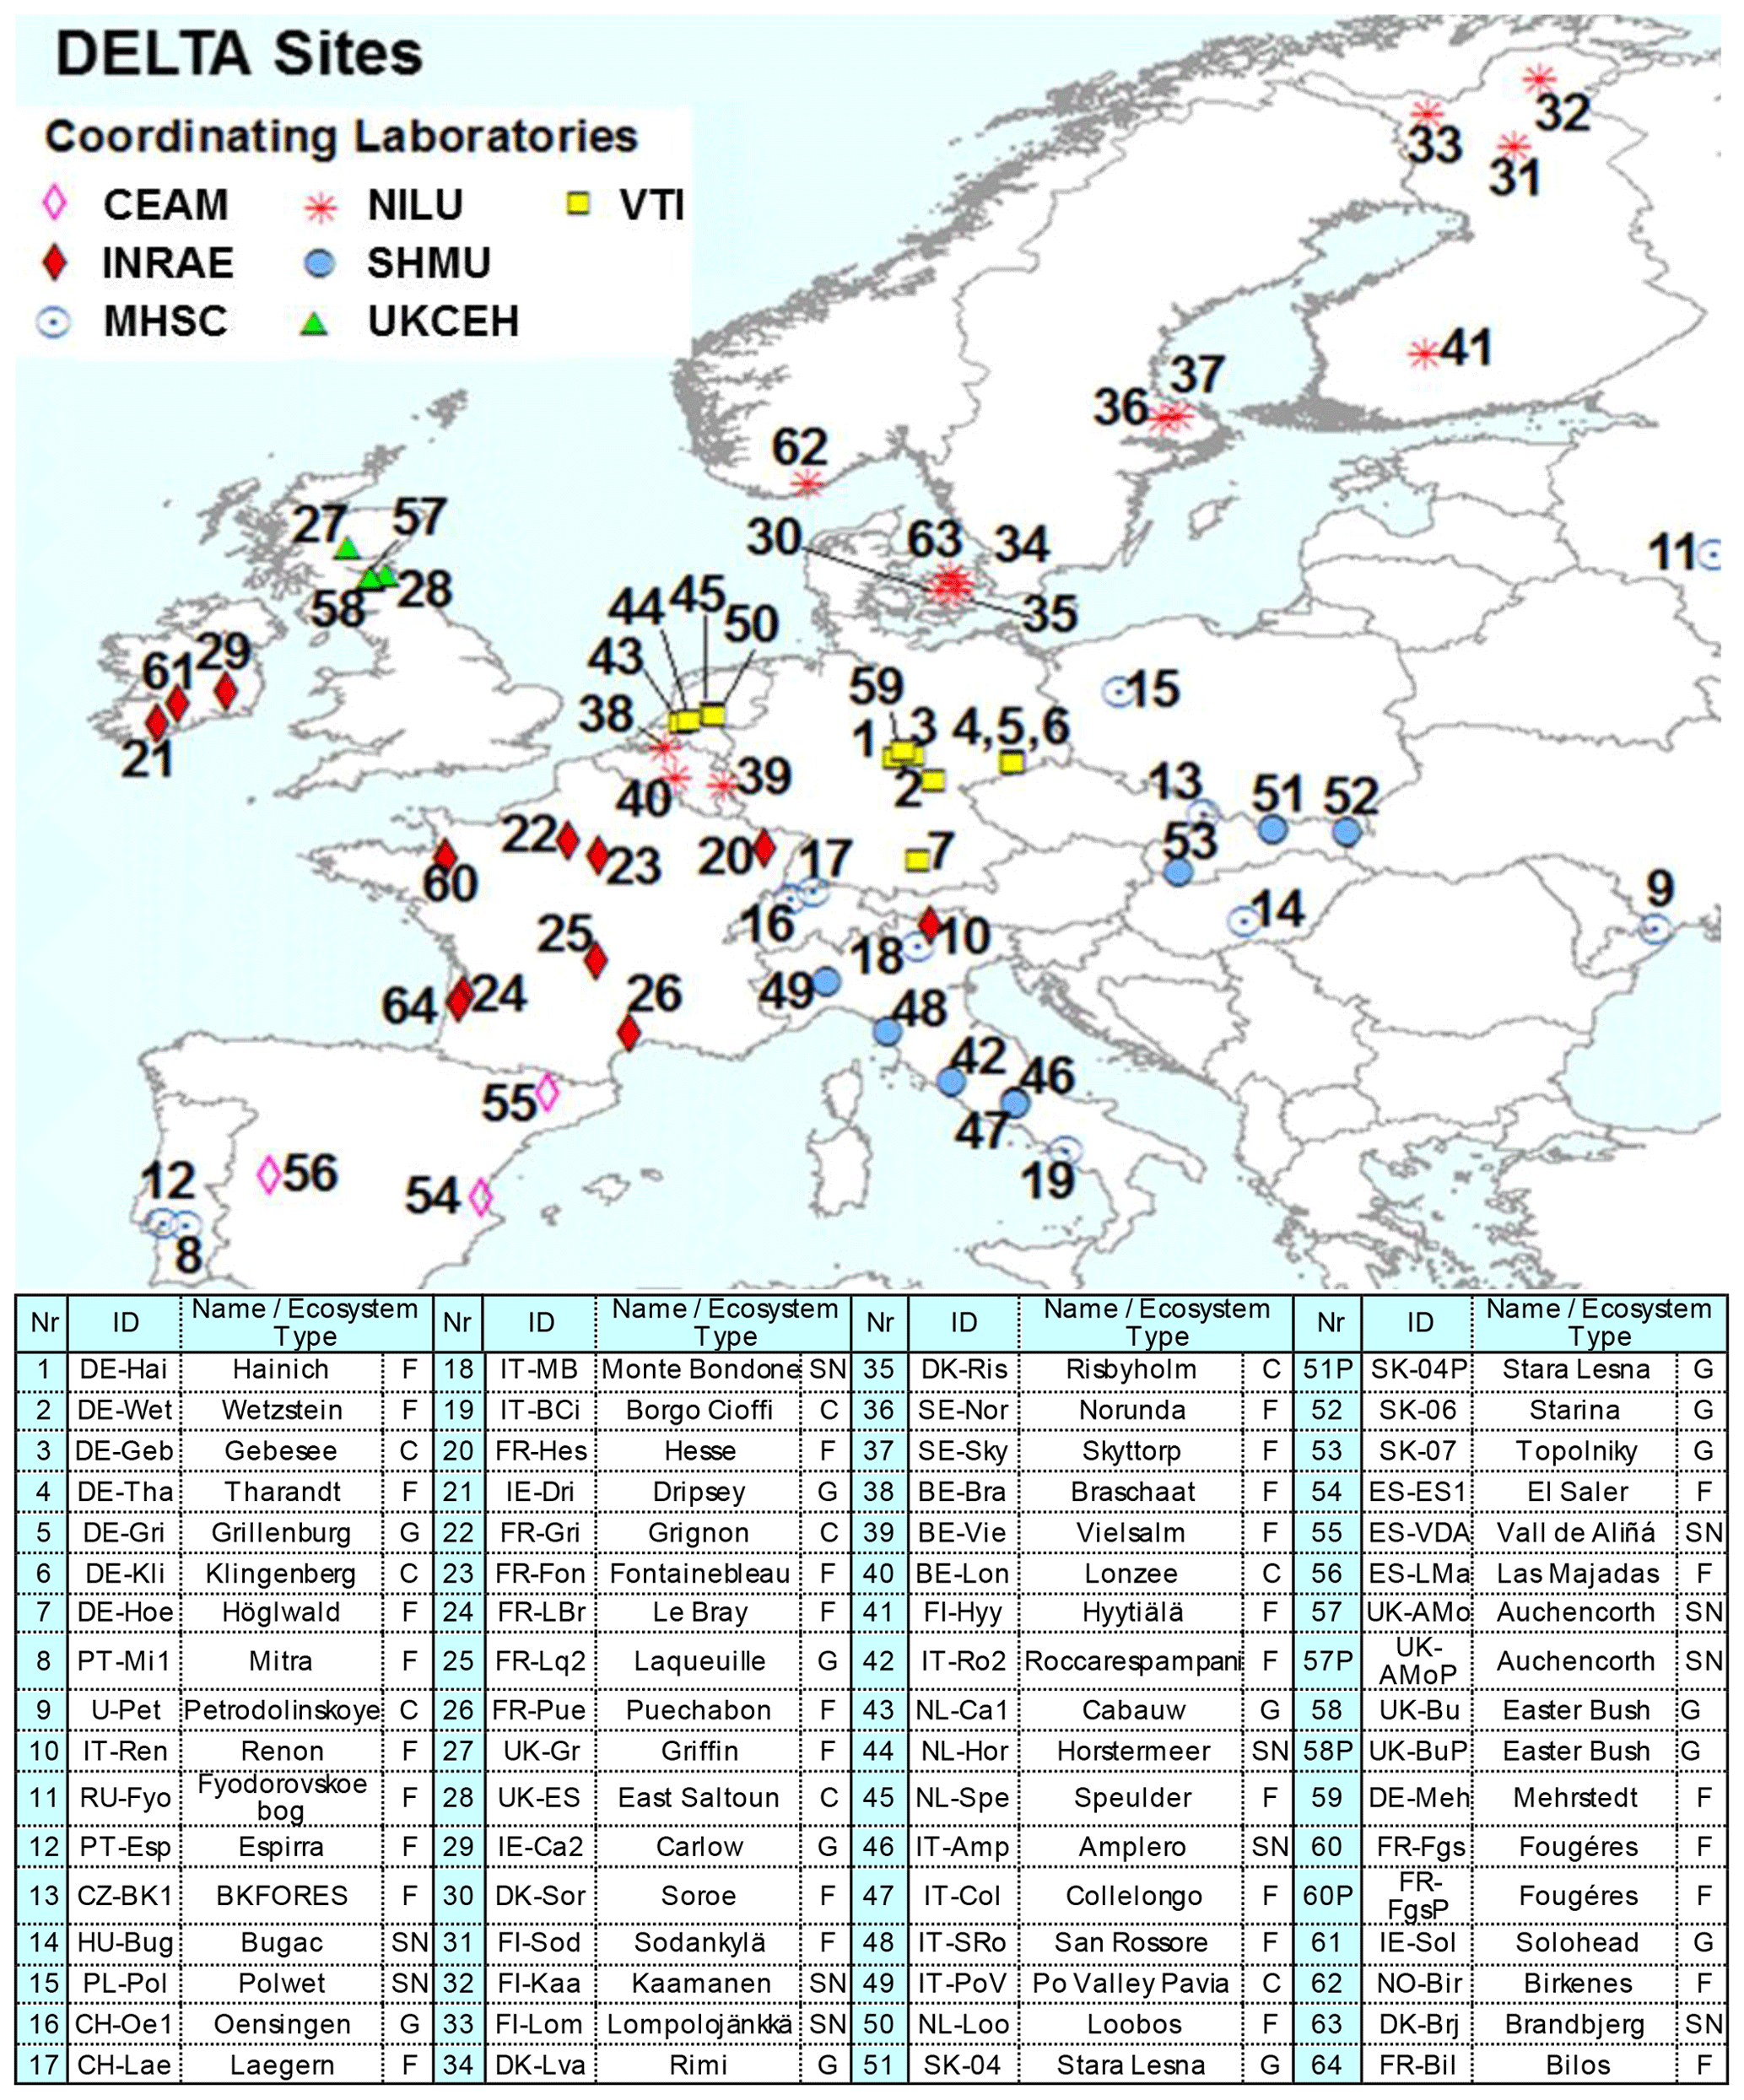
Figure 2NitroEurope (NEU) DELTA® network sites operated between 2006 and 2010. The colour of the symbols indicates the responsible laboratories: CEAM (the Mediterranean Centre for Environmental Studies), vTI (von Thunen Institut), INRAE (French National Research Institute for Agriculture, Food and Environment), MHSC (Meteorological and Hydrological Service of Croatia), UKCEH (UK Centre for Ecology & Hydrology), NILU (Norwegian Institute for Air Research), SHMU (Slovak Hydrometeorological Institute). Ecosystem types are C (crops), G (grassland), F (forests), and SN (short semi-natural; includes moorland, peatland, shrubland, and unimproved and upland grassland). Replicated (P: parallel) DELTA measurements are made at four sites: SK04/SK04P; UK-AMo/UK-AMoP (NH3 and NH only), UK-Bu/UK-BuP, and FR-Fgs/FR-FgsP (NaCl-coated denuders instead of K2CO3–glycerol in sample train).
Altogether, the DELTA® network covered a wide distribution of sites across 20 countries and four major ecosystem types: crops, grassland, semi-natural, and forests. These sites can be described as “rural” and were chosen to provide a regionally representative estimate of air composition. The network site map is shown in Fig. 2, with site details given in Table S1 in the Supplement. Further information on the sites are also provided in Flechard et al. (2011). Network establishment started in November 2006, with 57 sites operational from March 2007 onwards. Over the course of the network, some sites closed or were relocated due to infrastructure changes, and new sites were also added. A total of 64 sites provided measurements at the end of the project, with 45 of the sites operational the entire time. In addition, replicated DELTA® measurements were made at four sites:
-
Auchencorth Moss parallel (P) (UK-AMoP; NH3 and NH measured only);
-
Easter Bush parallel (P) (UK-EBuP; same method as main site);
-
SK04 parallel (P) (SK04P; same method as main site);
-
Fougéres parallel (P) (FR-FgsP; different sample train with 2× NaCl-coated denuders instead of 2× K2CO3–glycerol-coated denuders to capture HNO3; see Sect. 2.2.3) from February to December 2010 only.
2.1.1 Coordinating laboratories
A team of seven European laboratories shared responsibility for running the network. Measurement was on a monthly timescale, with each laboratory preparing and analysing the monthly samples with documented analytical methods (see Table S3 for information on analytical methods and limit of detection (LOD)) for between 5 and 16 DELTA sites (Fig. 2). The use of a harmonized DELTA® methodology, coupled to defined quality protocols (Tang et al., 2009), ensured comparability of data between the laboratories (see later in Sect. 3.1 and 3.2). A network of local site operators representing the science teams of each site performed the monthly sample changes and posted the exposed samples back to their designated laboratories for analysis. Air concentration data were submitted by the laboratories for their respective sites in a standard reporting template to UKCEH. Following data checks against defined quality protocols (Tang et al., 2009), the finalized dataset was uploaded to the NEU database (http://www.nitroeurope.ceh.ac.uk/, last access: 29 July 2020). Establishment of the network, including the first year of measurement results on Nr components, is reported in Tang et al. (2009). Information on co-located measurements and agricultural activities at each of the sites was also collected and is accessible from the NEU website (http://www.nitroeurope.ceh.ac.uk/, last access: 29 July 2020).
2.2 DELTA® methodology
The DELTA® method used in the NEU Level 1 network is based on the system developed for the UK Acid Gas and Aerosol Monitoring Network (AGANet, Tang et al., 2018b). Full details of the DELTA® method and air concentration calculations in the NEU network are provided by Tang et al. (2009, 2018b). The method uses a small 6 V air pump to deliver low air-sampling rates of between 0.2 and 0.4 L min−1, a high-sensitivity gas meter to record the typical monthly volume of air collected, and a DELTA® denuder filter pack sample train to collect separately the gas- and aerosol-phase components. The sample train is made up of two pairs of base- and acid-impregnated denuders (15 and 10 cm long) to collect acid gases and NH3, respectively, under laminar conditions. A two-stage filter pack with base- and acid-coated cellulose filters collects the aerosol components downstream of the denuders. The base coating used was K2CO3–glycerol, which is effective for the simultaneous collection of HNO3, SO2, and HCl (Ferm, 1986), while the acid coating was either citric acid for temperate climates or phosphorous acid for Mediterranean climates (Allegrini et al., 1987; Ferm, 1979; Perrino et al., 1990; Fitz, 2002). In this way, artefacts between gas- and aerosol-phase concentrations are minimized (Ferm et al., 1979; Sutton et al., 2001a). The DELTA® air inlet has a particle cut-off of ∼4.5 µm, which means fine-mode aerosols in the PM2.5 fraction and some of the coarse-mode aerosols < PM4.5 will be collected (Tang et al., 2015).
A low-voltage version of the AGANet DELTA® system was built centrally by UKCEH and sent to each of the European sites, where they were installed by local site contacts. These systems operated on either 6 V (off mains power with a transformer) or 12 V from batteries (wind- and solar-powered). Air sampling was direct from the atmosphere without any inlet lines or filters to avoid potential loss of components – in particular HNO3, which is very “sticky” – to surfaces. Sampling height was 1.5 m above ground or vegetation in open areas. In forested areas, the DELTA® equipment was set up either in large clearings or on towers 2–3 m above the canopy (see Flechard et al., 2011).
2.2.1 Calculation of gas and aerosol concentrations
Atmospheric gas and aerosol concentrations in the DELTA® method are calculated from the number of inorganic ions (NH, NO, SO, Cl−, and base cations) in the denuder and aerosol aqueous extracts and the volume of air sampled (from gas meter readings), which is typically 15 m3 for a monthly sample. The volumes of deionized water used to extract acid-coated denuders and aerosols filters are 3 and 4 mL, respectively. For the base-coated denuders and aerosol filters, the extract volume in both cases is 5 mL An example is shown here for calculating the atmospheric concentrations of NH3 (gas) (Eq. 1) and NH (aerosol) (Eq. 2) from the aqueous extracts, based on an air volume of 15 m3 collected in a typical month.
Pairs of base- and acid-coated denuders are used to collect the acid gases and alkaline NH3 gas, respectively. This allows denuder collection efficiency of, for example, NH3 (Eq. 3) to be assessed as part of the data quality assessment process. An imperfect acid coating on the denuders for example can lead to lower capture efficiencies (Sutton et al., 2001a; Tang and Sutton, 2003).
A correction, based on the collection efficiency, is applied to provide a corrected air concentration (χa (corrected); Eq. 4) (Sutton et al., 2001a; Tang et al., 2018a, 2018b). With a collection efficiency of 95 %, the correction amounts to 0.3 % of the corrected air concentration. For an efficiency below 60 %, the correction amounts to more than 50 % and is not applied. The air concentration (χa) of NH3 is then determined as the sum of NH3 in denuders 1 and 2 (Tang et al., 2018a). By applying the infinite series correction, the assumption is that any NH3 (and other gases) that is not captured by the denuders will be collected on the downstream aerosol filter. To avoid double-counting, the estimated amount of “NH3 breakthrough” is subtracted from the NH concentrations on the aerosol filter.
2.2.2 Estimating sea salt and non-sea-salt SO (ss-SO and nss-SO)
Sea salt SO (ss-SO) in aerosol was estimated according to Eq. (5), based on the ratio of the mass concentrations of SO to the reference Na+ species in seawater (Keene et al., 1986; O'Dowd and de Leeuw, 2007).
Non-sea-salt SO (nss-SO was then derived as the difference between total measured SO and ss-SO (Eq. 6).
2.2.3 Artefact in HNO3 determination
Results from the first DELTA® inter-comparison in the NEU network (Tang et al., 2009) (see also Sect. 2.5) and further work by Tang et al. (2015, 2018b) have shown that HNO3 concentrations may be overestimated on the carbonate-coated denuders used due to co-collection of other oxidized nitrogen components, most likely from nitrous acid (HONO). In the UK AGANet, HNO3 data are corrected with an empirical factor of 0.45 derived by Tang et al. (2015). Since the correction factor for HNO3 is uncertain (estimated to be ±30 %) and derived for UK conditions, no attempt has been made to correct the HNO3 data from the NEU network. The DELTA® method remained unchanged throughout the entire network operation and provided a consistent set of measurements by the same protocol. The caveat is that the HNO3 data presented in this paper also include an unknown fraction of oxidized N, most probably HONO, and therefore represent an upper limit in the determination of HNO3. Contribution from NO2 is likely to be small since this is collected with a low efficiency on carbonate-coated denuders (Bai et al., 2003; Tang et al., 2015), and the network sites are rural, where NOx concentrations are expected to be in the low parts per billion. At the French Fougéres parallel site (FR-FgsP), NaCl-coated denuders were used to measure HNO3 to compare with results from K2CO3–glycerol-coated denuders at the main site (FR-Fgs) (see Sect. 2.1 for methodology and Sect. 3.3.1 for data inter-comparison).
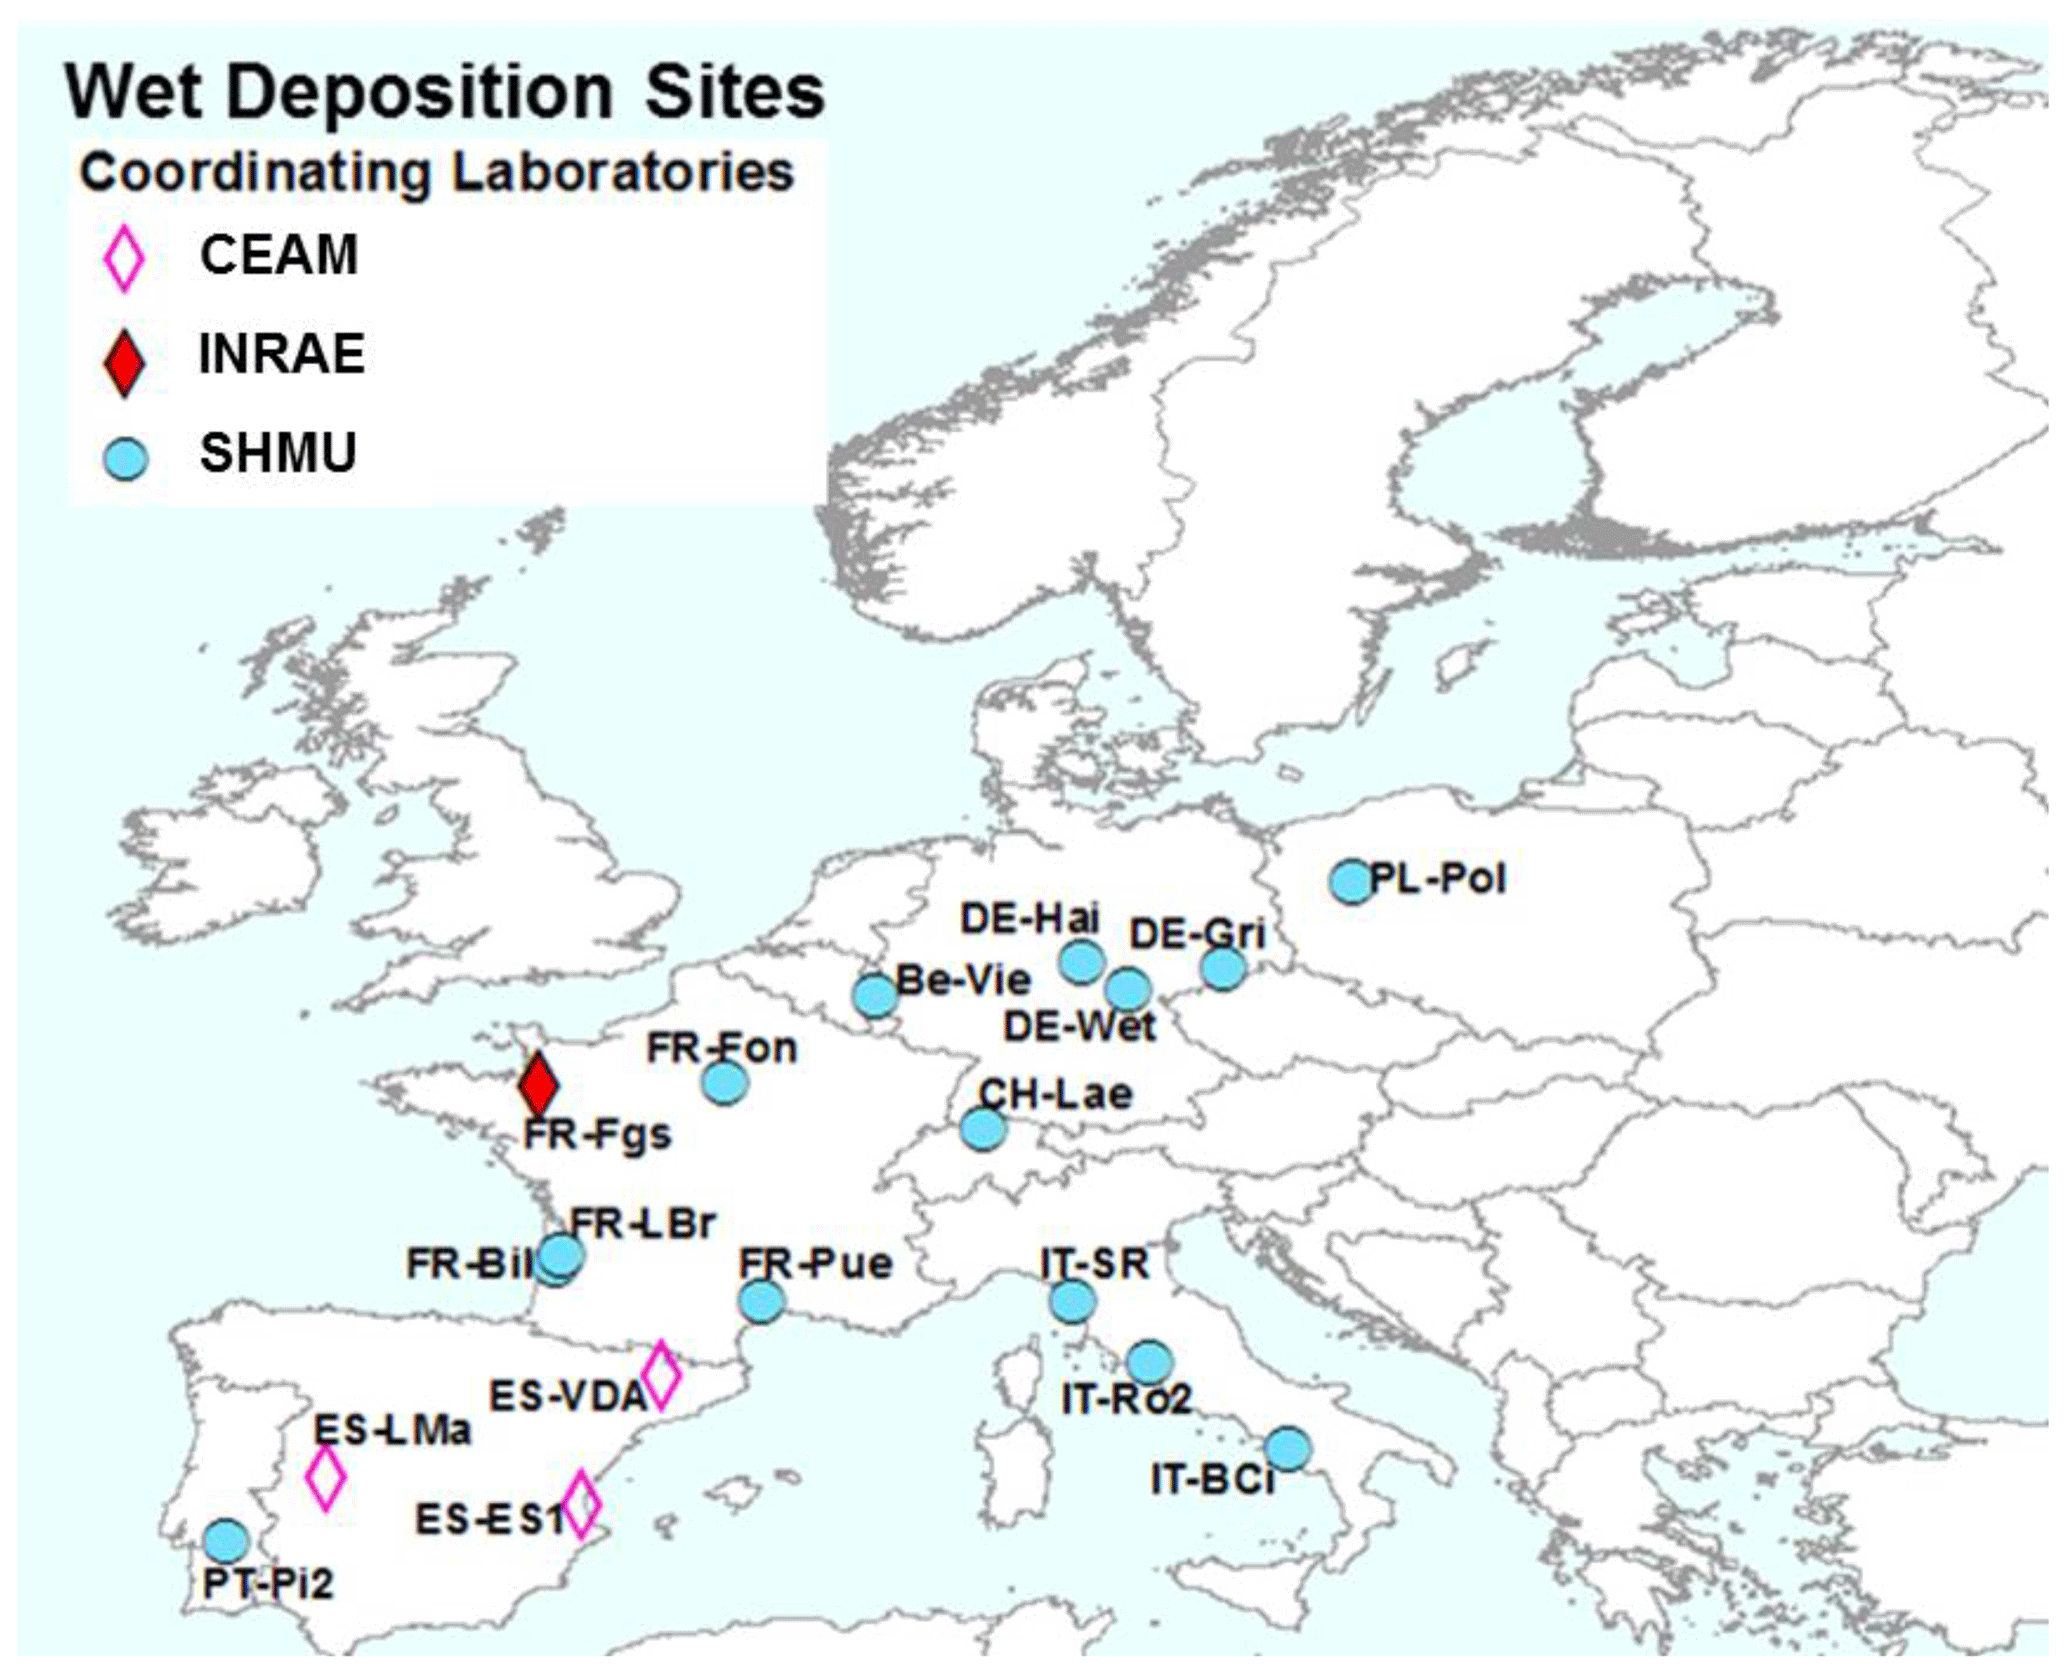
Figure 3NitroEurope (NEU) bulk wet-deposition network sites operated between 2008 and 2010. The colour of the symbols indicates the responsible laboratories: CEAM (the Mediterranean Centre for Environmental Studies), INRAE (French National Research Institute for Agriculture, Food and Environment), and SHMU (Slovak Hydrometeorological Institute).
2.3 NEU bulk wet-deposition network
The NEU bulk wet-deposition network (Fig. 3, Table S2) was established to provide wet-deposition data on NH and NO. It was set up 2 years after the establishment of the NEU DELTA® network, with sites located at a subset of DELTA® sites that did not already have on-site wet-deposition measurements. Sampling commenced at some sites in January 2008, with 14 sites operational from March 2008. Site changes also occurred during the operation of this network, again with some site closures and new site additions over time. In total, 12 sites provided 2 years of monthly data, with a further 6 sites providing 1 year of monthly data between 2008 and October 2010, when measurements ended.
The type of bulk precipitation collector used was a Rotenkamp sampler (Dämmgen et al., 2005), mounted 1.5 m above ground, or in the case of forest sites, either in clearings or above the canopy. Each unit has two collectors providing replicated samples, comprising a pyrex glass funnel (aperture area = 84.9 cm2) with vertical sides, connected directly to a 3 L collection bottle (material: low-density polyethylene), which was changed monthly. Thymol (5-methyl-2-(1-methylethyl)phenol) (150 mg) was added as a biocide (Cape et al., 2012) to a clean, dry pre-weighed bottle at the start of each collection period. This provided a minimum thymol concentration of 50 mg L−1 for a full bottle to preserve the sample against biological degradation of labile nitrogen compounds during the month-long sampling.
Three European laboratories shared management and chemical analysis for the network (Fig. 3). The laboratories were CEAM (all three Spanish sites); INRAE (French Renon site); and SHMU, designated the main laboratory responsible for all other sites. A full suite of precipitation chemistry analyses were carried out that included pH, conductivity, NH, NO, SO, PO, Cl−, Na+, K+, Ca2+, and Mg2+. Rain volumes and precipitation chemistry data were submitted in a standard template to UKCEH for checking and then uploaded to the NEU database (http://www.nitroeurope.ceh.ac.uk/, last access: 29 July 2020). Samples with high P (> 1 µg L−1 PO, high K+, and/or NH values that are indicative of bird contamination were rejected. Annual wet deposition (e.g. kg N ha−1 yr−1) was estimated from the product of the species concentrations and rain volume. Determinations of organic N were also carried out on some of the rain samples in a separate investigation reported by Cape et al. (2012).
2.4 Laboratory inter-comparisons: chemical analysis
All laboratories in the DELTA® and bulk wet-deposition networks participated in water chemistry proficiency testing (PT) schemes in their own countries as well as the EMEP (once annually; http://www.emep.int, last access: 8 February 2010) and/or WMO-GAW (twice annually; http://www.qasac-americas.org, last access: 12 January 2020) laboratory inter-comparison schemes. PT samples for analysis are synthetic precipitation samples for determination of pH, conductivity, and all the major inorganic ions at trace levels. In addition, UKCEH also organized an annual PT scheme for the duration of the project (NEU-PT) to compare laboratory performance in the analysis of inorganic ions at higher concentrations relevant for DELTA® measurements. This comprised the distribution of reference solutions containing known concentrations of ions that were analysed by the laboratories as part of their routine analytical procedures.
2.5 Field inter-comparisons: DELTA measurements
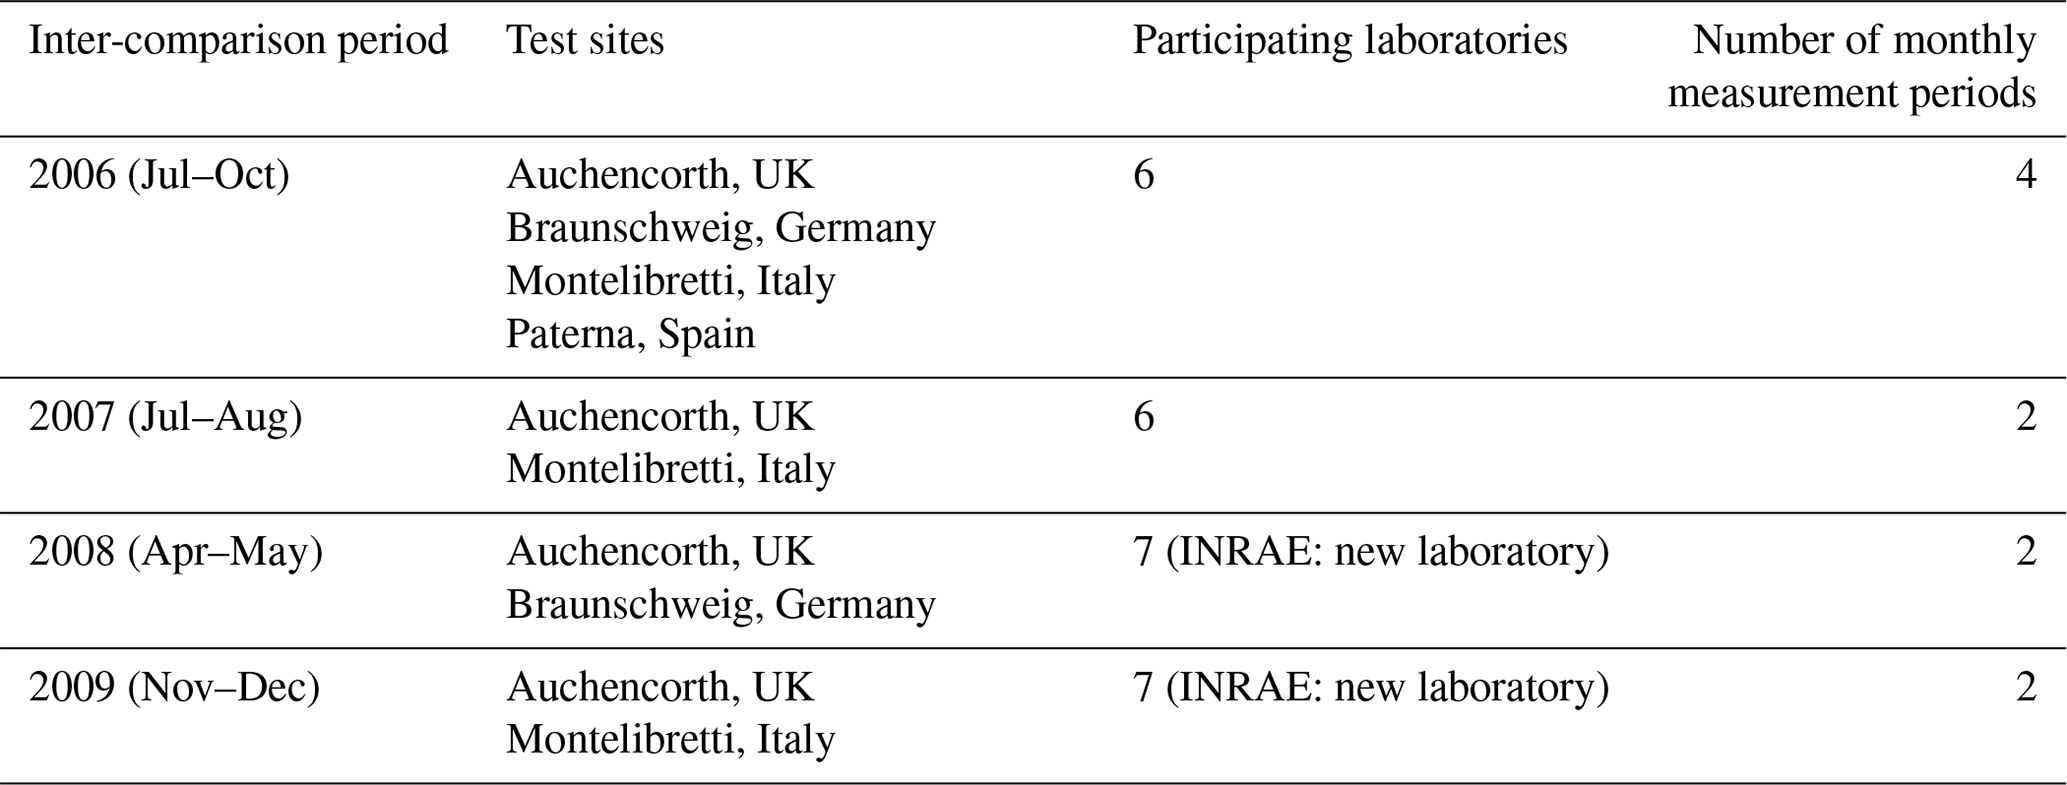
Prior to the NEU DELTA® network establishment, a workshop was held to provide training to participating laboratories on sample preparation and analysis. This was followed by a 4-month inter-comparison exercise (July to October 2006) between six laboratories at four test sites (Montelibretti, Italy; Braunschweig, Germany; Paterna, Spain, and Auchencorth, UK). Results of the inter-comparison on Nr components were reported by Tang et al. (2009), which demonstrated good agreement under contrasting climatic conditions and atmospheric concentrations of the Nr gases and aerosols. The first DELTA® inter-comparison allowed the new laboratories to gain experience in making measurements and was an extremely useful exercise to check how the whole system works, starting with coating of denuders and filters and DELTA® train preparation, sample exchange via post, sample handling, and inter-comparing laboratory analytical performance. Further DELTA® inter-comparisons between laboratories were conducted each year for the duration of the project, details of which are summarized in Table 1. At each test site, DELTA® systems were randomly assigned to each of the participating laboratories. All laboratories provided DELTA® sampling trains for each of the inter-comparison sites and carried out chemical analysis on the returned exposed samples. Measurement results were returned in a standard template to UKCEH, the central coordinating laboratory for collation and analysis.
Table 1Details of annual NitroEurope (NEU) DELTA® field inter-comparisons conducted between 2006 and 2010.
2.6 European emissions data
With the exception of Russia and Ukraine, official reported national emissions data on SO2, NOx, and NH3 are available for all other 18 countries in the NEU network from the European Environment Agency (EEA) website (EEA, 2020). Emissions data for the period 2007 to 2010 were extracted, and the emission densities of each gas (t km−2 yr−1) in each country were derived by dividing the 4-year-averaged total emissions by the land area (km2). Gridded emissions data (at resolution) for SO2, NOx, and NH3 are available from the EMEP emissions database (EMEP, 2020). The gridded data for the period 2007 to 2010 were downloaded and were used to estimate national total emissions (sum of all grid squares in each country) and 4-year-averaged emission densities (t km−2 yr−1) for Russia and Ukraine. As a check, total emissions for the other 18 countries were also calculated by this method and were the same as the national emission totals reported by the EEA (EEA, 2019).
2.7 National air quality network data from the Netherlands and UK
2.7.1 Dutch LML network data
Atmospheric NH3 has been monitored at eight sites in the Dutch national air quality monitoring network (LML, Landelijk Meetnet Luchtkwaliteitl) since 1993 (van Zanten et al., 2017). The low-density, high-time-resolution LML network is complemented by a high-density monthly diffusion tube network, the Measuring Ammonia in Nature (MAN) network (http://man.rivm.nl, last access: 6 November 2018) (Lolkema et al., 2015). The MAN network has 136 monitoring locations sited within nature reserves and includes 60 Natura 2000 sites, with concentrations ranging between 1.0 and 14 µg m−3 (Lolkema et al., 2015). The focus of the MAN network is to provide site-based NH3 concentrations for the nature conservation sites rather than a representative spatial-concentration field for the country. Hourly NH3 and SO2 data which were also available from the eight sites in the LML network were downloaded from the Rijksinstituut voor Volksgezondheid en Milieu (RIVM, the Dutch National Institute for Public Health and the Environment) website (http://www.lml.rivm.nl/gevalideerd/index.php, last access: 6 November 2018). The 4-year-averaged NH3 and SO2 concentrations for the period 2007 to 2010 were calculated and used to complement measurement data from the four Dutch sites in the NEU DELTA® network.
2.7.2 UK NAMN and AGANet network data
Atmospheric NH3, acid gases, and aerosols are measured in the UK NAMN (since 1996) and AGANet (since 1999) (Tang et al., 2018a, b). The UK approach is a high-density network with low-time-resolution (monthly) measurements, combining an implementation of the DELTA® method used in the present NEU DELTA® network and a passive ALPHA® method (Tang et al., 2001) to increase network coverage in NH3 measurements (Sutton et al., 2001b; Tang et al., 2018a). Monthly and annual data for the overlapping period of the project were extracted from the UK-AIR website (https://uk-air.defra.gov.uk/, last access: 25 November 2019) and nested with the NEU network data for analysis in this paper.
3.1 Laboratory inter-comparison results: chemical analysis
Figure 4 compares the percentage deviation of results from reference solution concentrations (“true value”) reported by the laboratories for different chemical components in the EMEP, WMO-GAW, and NEU proficiency testing (PT) schemes, combined from 2006 to 2010. Each data point is colour-coded in the graphs according to the laboratory providing the measurements.
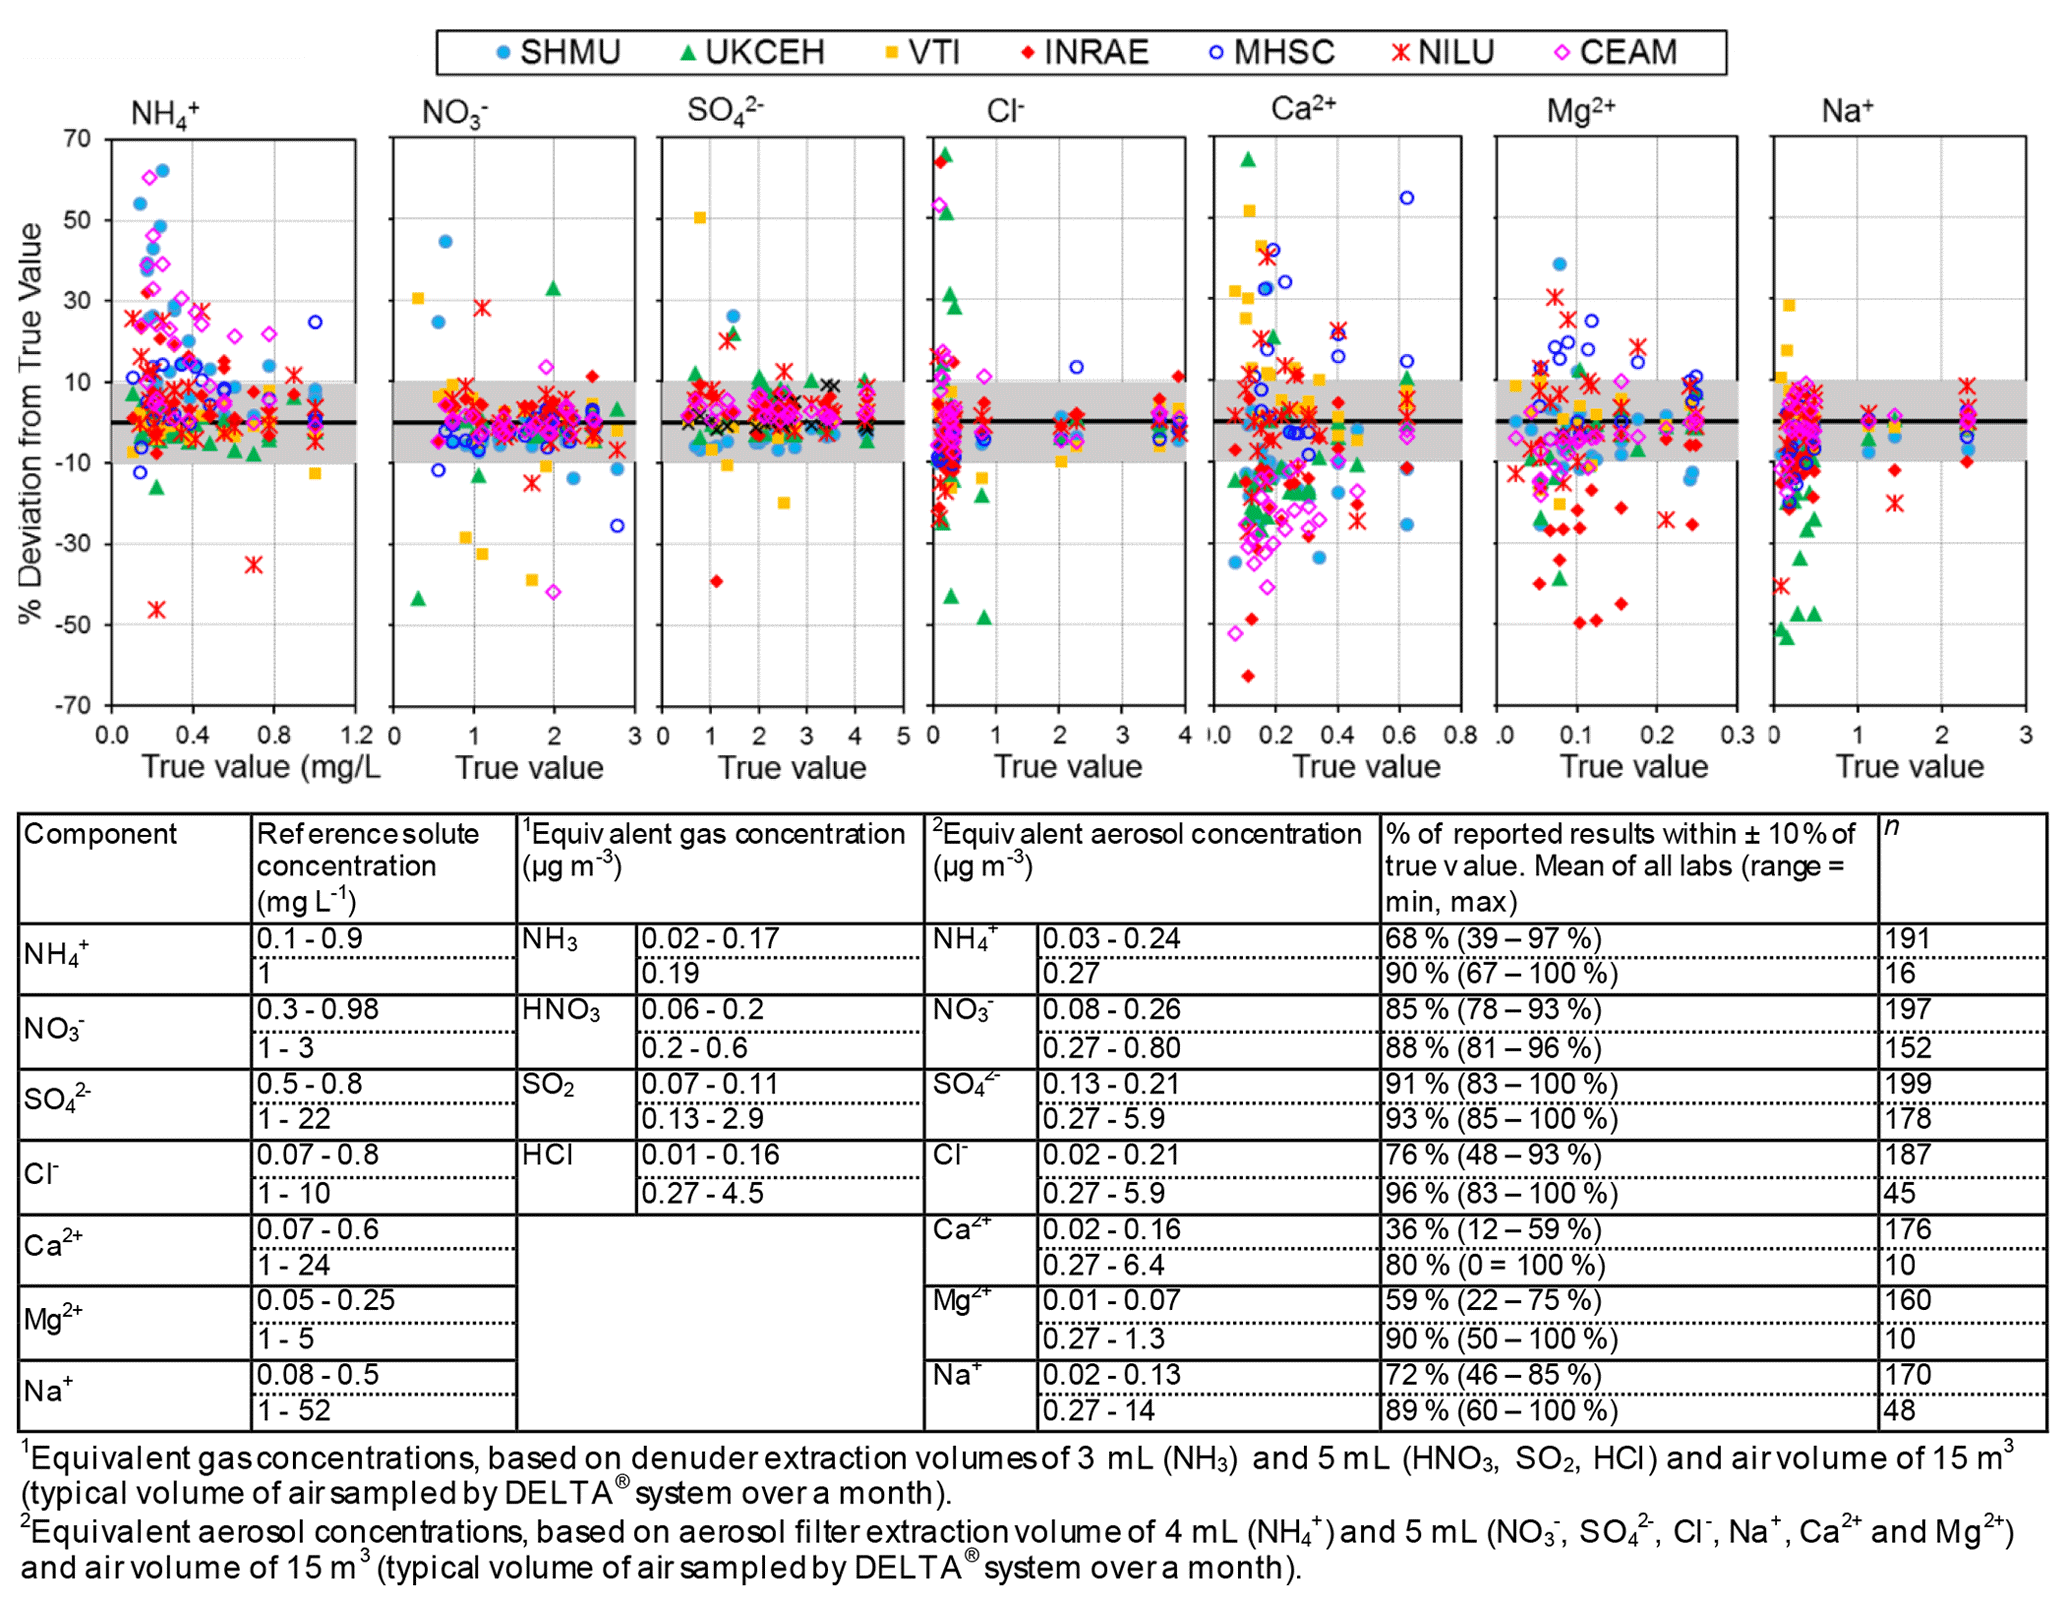
Figure 4Summary of reported results from all laboratories in chemistry proficiency testing (PT) schemes for chemical analysis of aqueous inorganic ions (2006–2010: EMEP, WMO-GAW, and NitroEurope), expressed as a percentage deviation from the true value (PT reference solutions). The grey shaded areas in the graphs show values that are within ±10 % of true value.
Altogether, results from the combined PT schemes produced > 100 observations for each reported chemical component over the 4-year period. The performances of laboratories in Fig. 4 can be summarized in terms of the percentage of reported results agreeing within 10 % of the true values (see summary table below Fig. 4), where the true values represent the nominal concentrations in the aqueous test solutions. The best agreements were for SO and NO, with an average of 92 % and 87 % of all reported results agreeing within 10 % of the true value across the concentration range covered in the PT schemes. In the case of NH, while an average of 90 % of reported results were within 10 % of the reference at 1 mg L−1 NH, laboratory performance was poorer (68 % agreeing within 10 %) at lower concentrations (0.1–0.9 mg L−1). Poorer performance at the low concentrations was largely due to two laboratories (CEAM and SHMU), with > 50 % of their results reading high. For Na+ and Cl−, the percentages of results agreeing within 10 % of the reference were 81 % and 86 %, respectively, across the full range of PT concentrations. At concentrations above 1 mg L−1, the agreement improved and increased to 89 % for Na+ and 96 % for Cl−. A larger spread around the reference values was provided for the base cations Ca2+ and Mg2+ at low concentrations (< 1 mg L−1). The percentage of results passing at low concentrations below 1 mg L−1 was 36 % (Ca2+) and 59 % (Mg2+), increasing to 80 % (Ca2+) and 90 % (Mg2+) above 1 mg L−1. The larger scatter at low concentrations is likely due to uncertainty in the chemical analysis at or close to the method limit of detection and reflects challenges of measuring base cations, in particular Ca2+ as this is very “sticky” and adsorbs–desorbs from surfaces, leading to analytical artefacts.
To show what the PT reference solution concentrations would correspond to if they were a denuder and/or aerosol extract, equivalent gas (Eq. 1) and/or aerosol concentrations (Eq. 2) (Sect. 2.2.1) are calculated for each of the ions and provided in the summary table in Fig. 4. A 0.5 mg L−1 NH solution, for example, is equivalent to an atmospheric concentration of 0.09 µg NH3 m−3 (gas) or 0.13 µg NH m−3 (aerosol) for a monthly sample. In Fig. 5, scatterplots are shown comparing all NEU laboratory-reported results with PT reference, where all ion concentrations (mg L−1) from Fig. 4 have been converted to equivalent gas and aerosol concentrations (µg m−3), based on a typical volume of 15 m3 over a month. With the exception of a small number of outliers, most data points are close to the 1:1 line, with laboratory results agreeing within ±0.05 µg m−3 in equivalent gas and/or aerosol concentrations. These are low ambient concentrations and show that the measurement uncertainty in the analysis of very low concentrations in the PT schemes will be small for the majority of sites in the network, where concentrations were found to be much higher (see Fig. 6).
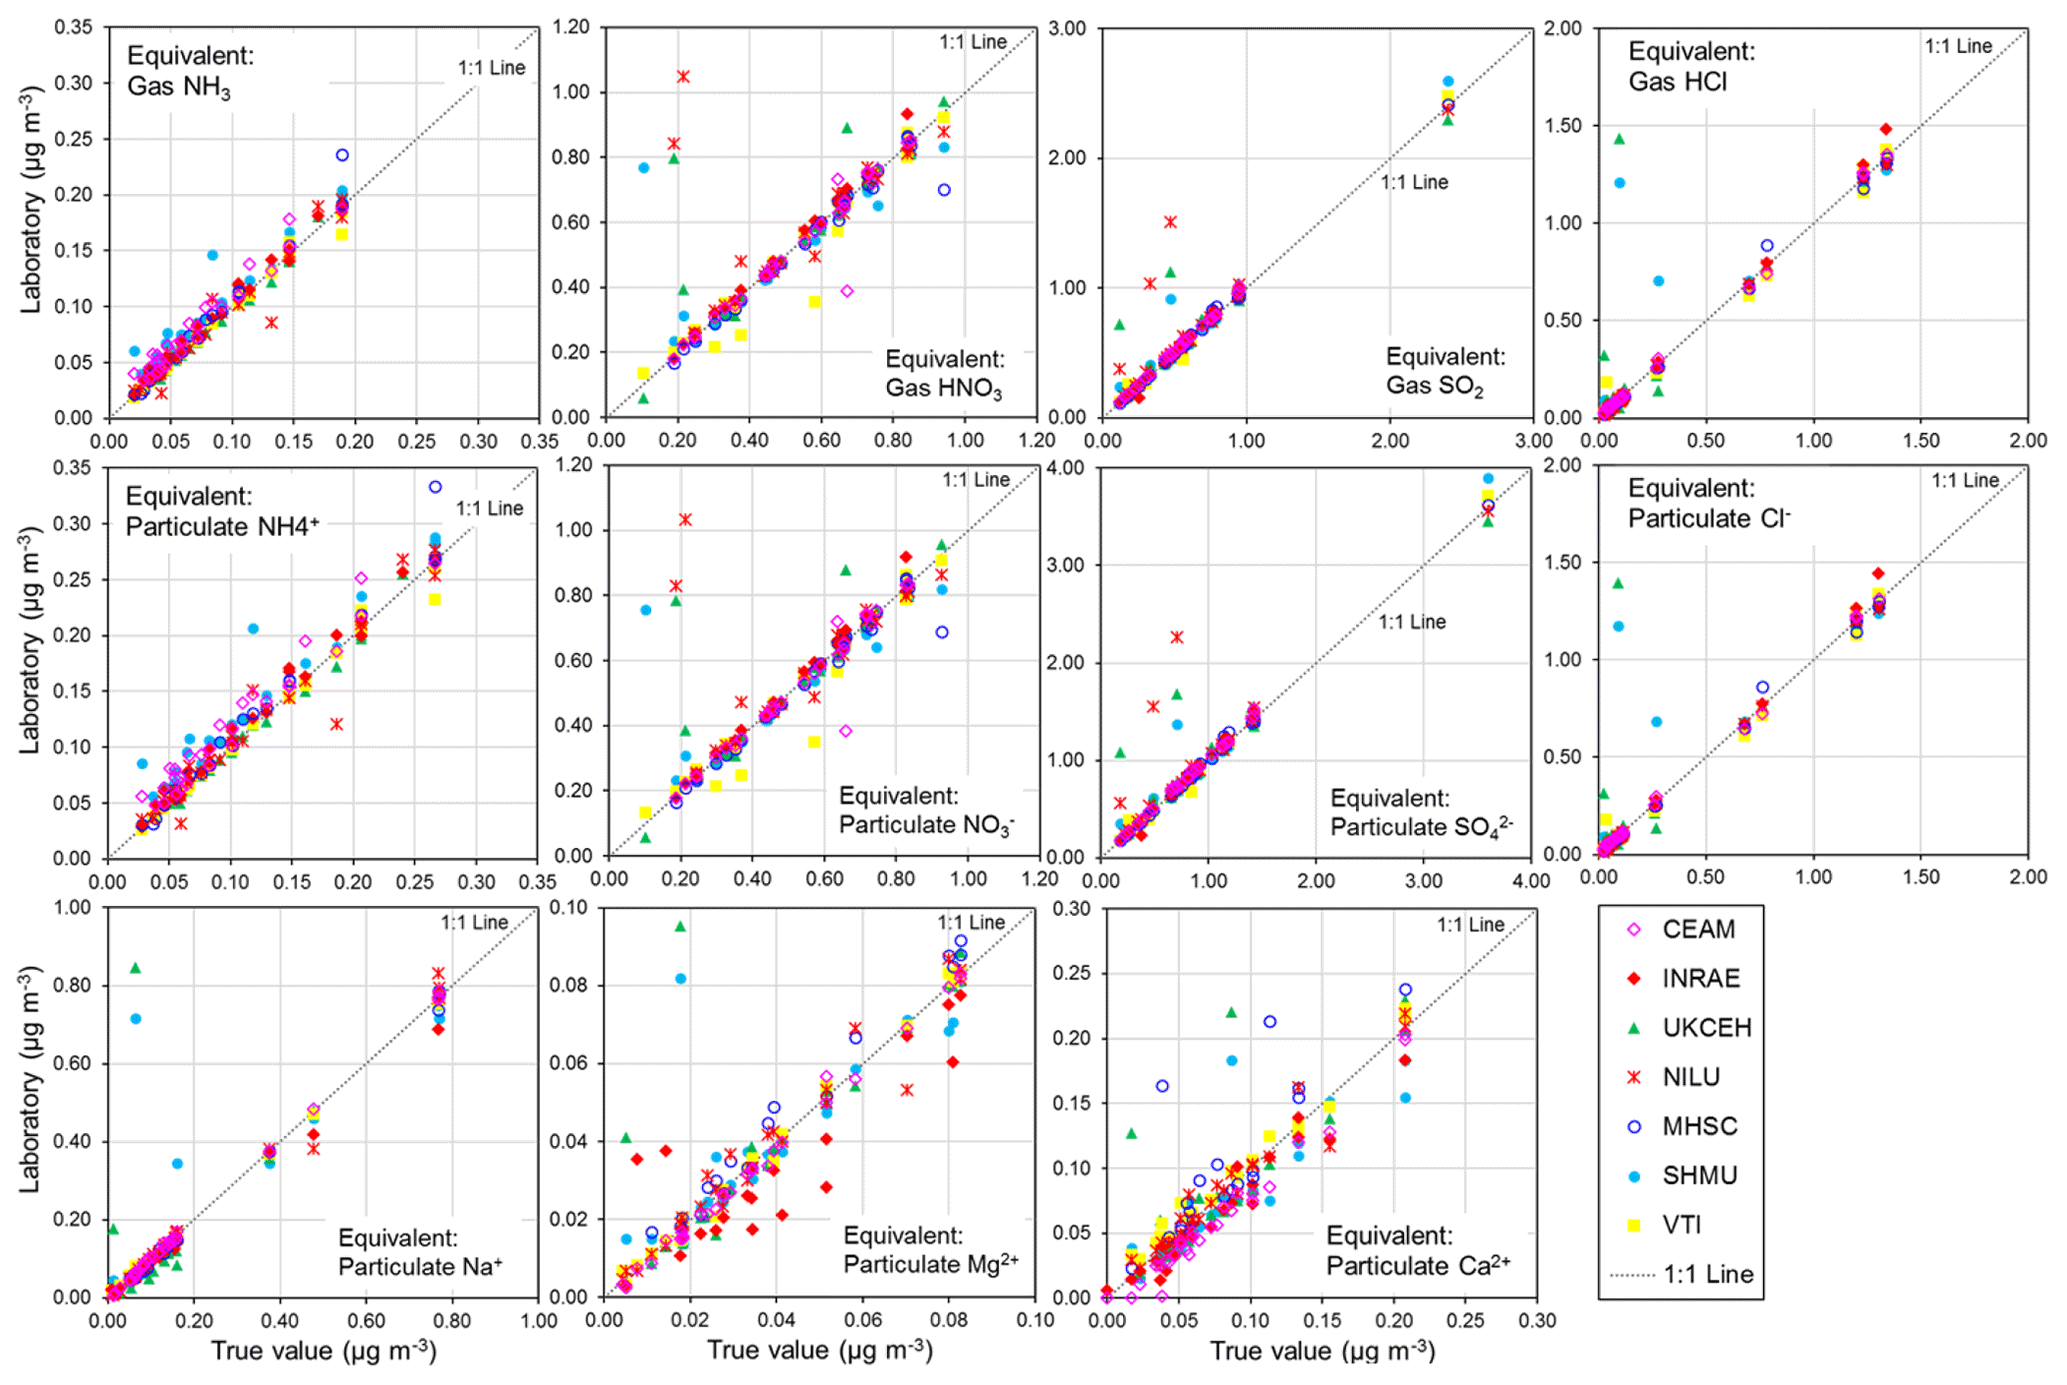
Figure 5Scatterplots comparing all NEU laboratory-reported results from wet chemistry proficiency testing (PT) schemes (2006–2010: EMEP, WMO-GAW, and NitroEurope) vs. true values (PT reference solutions). All aqueous ion concentrations (mg L−1) from Fig. 4 are converted to equivalent gas and aerosol concentrations (µg m−3) for the comparisons.
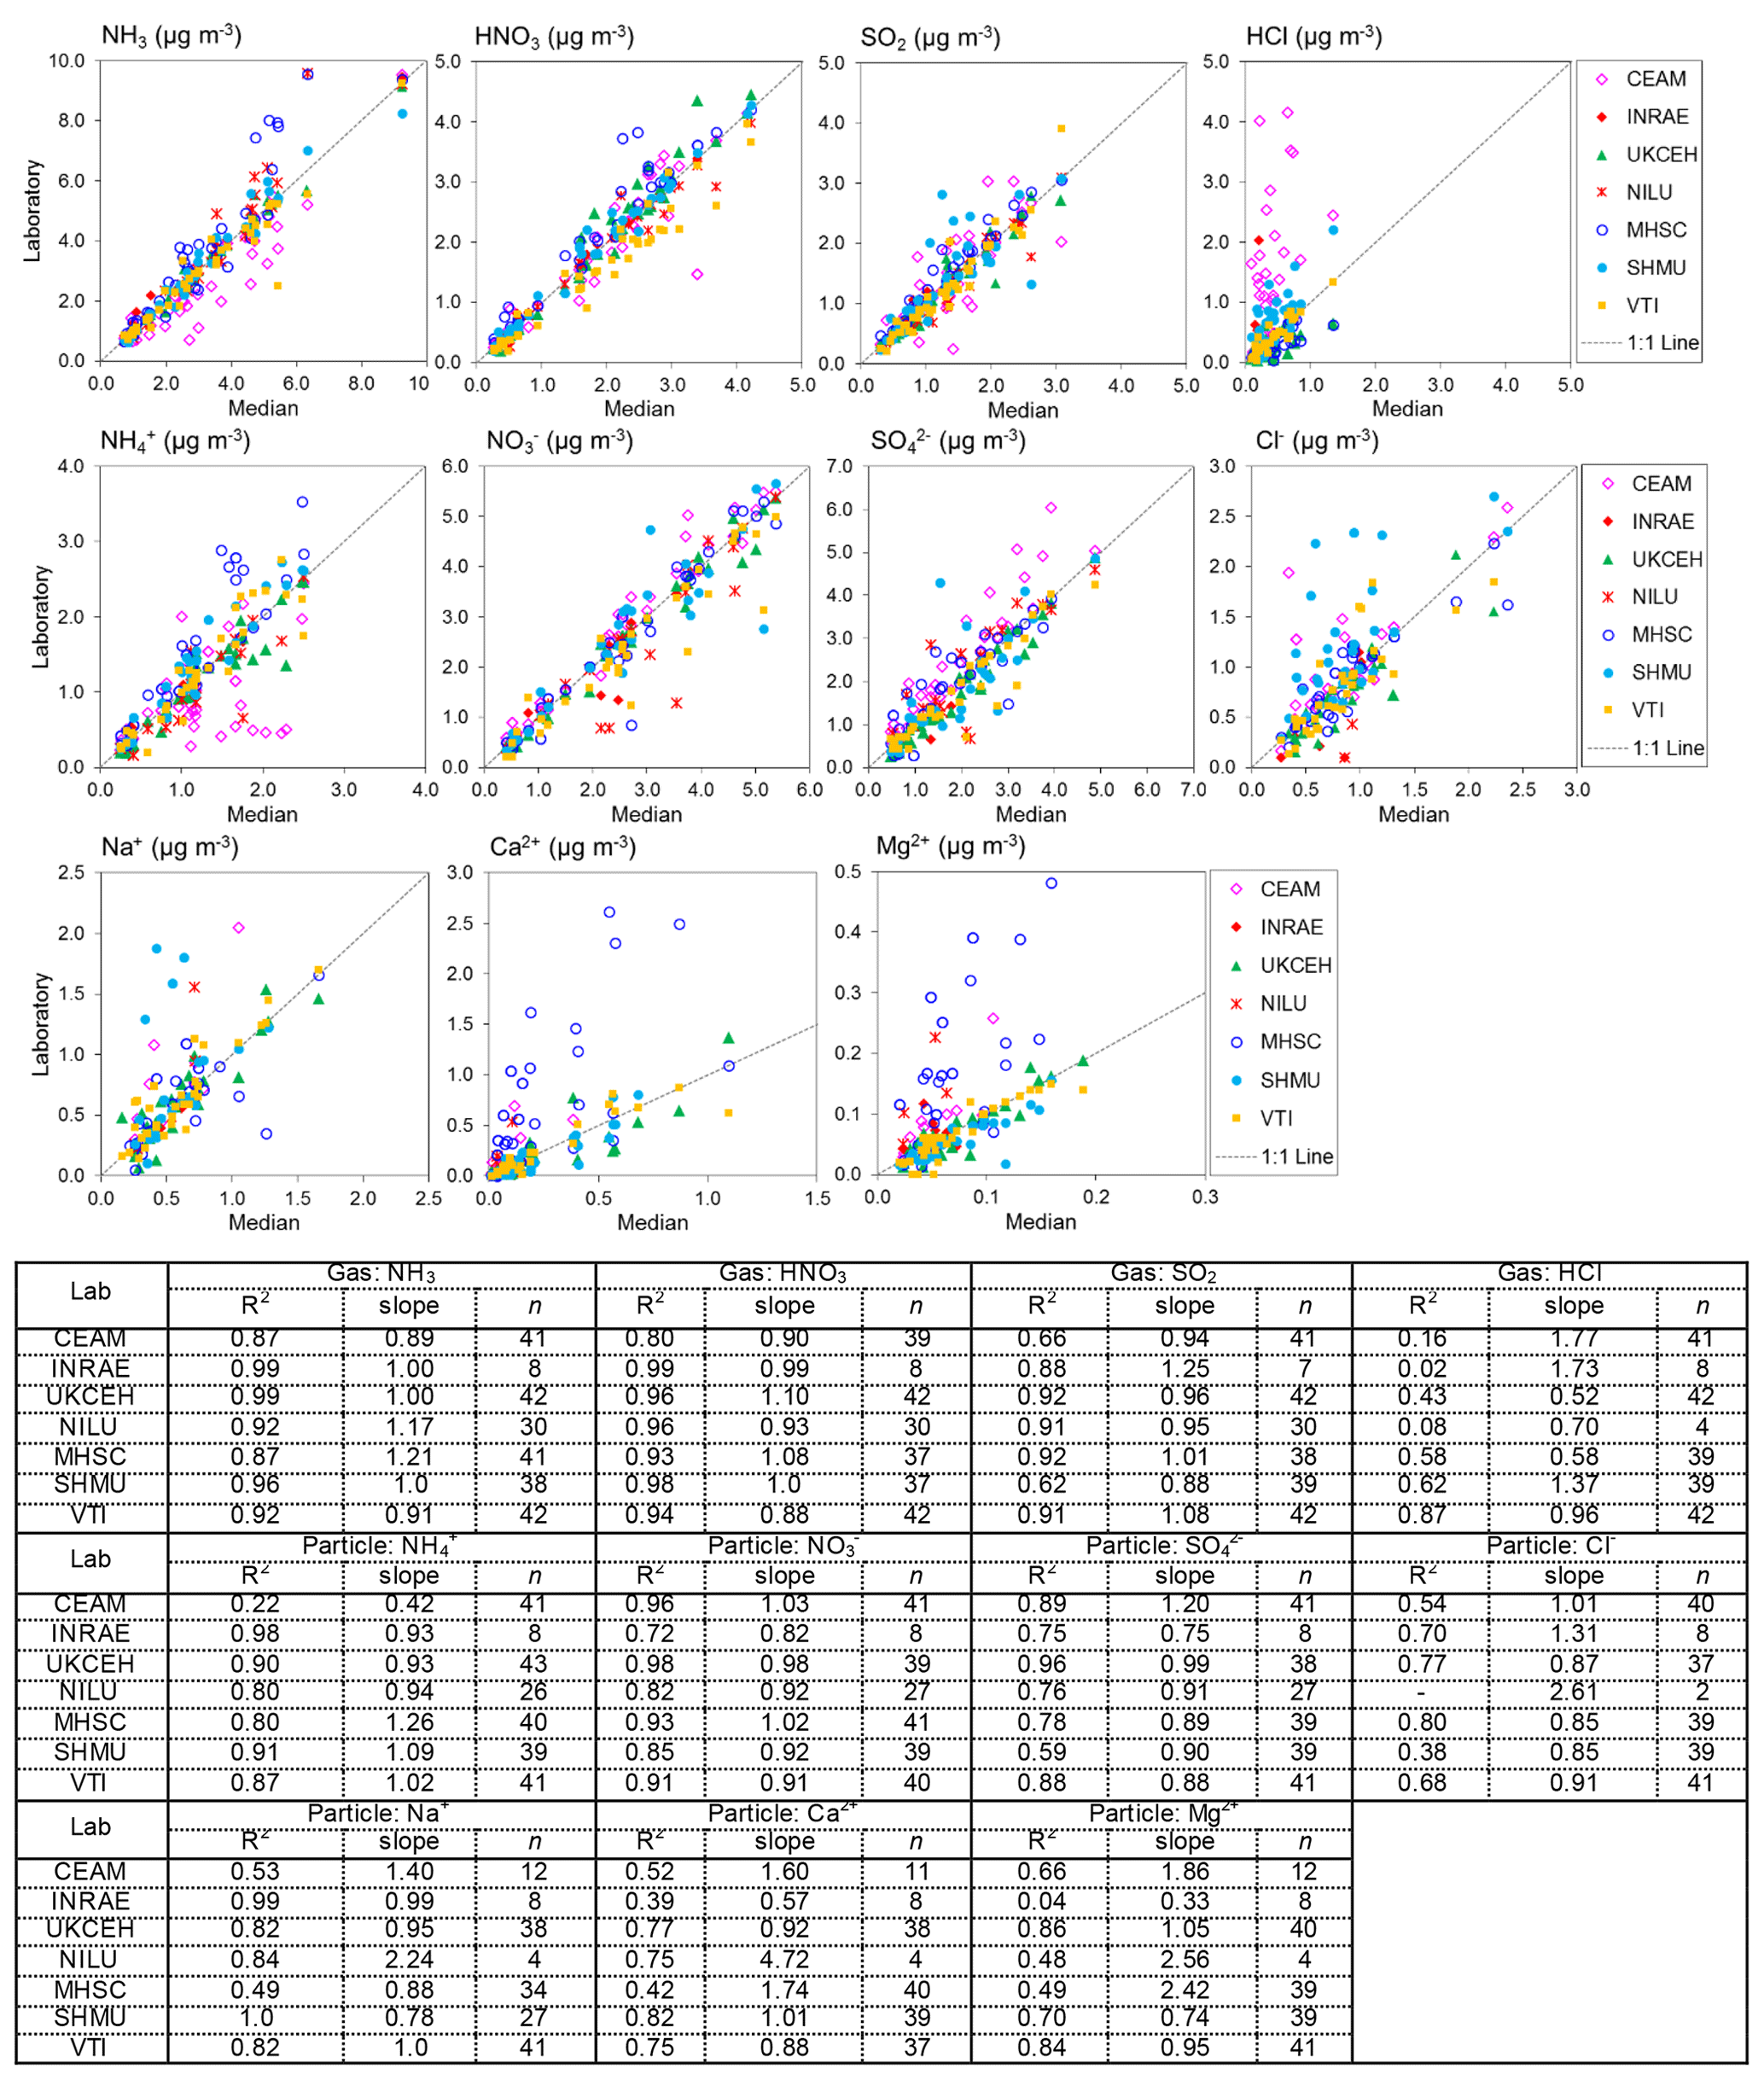
Figure 6Scatterplots comparing atmospheric gas (NH3, HNO3, SO2, and HCl) and aerosol (NH, NO, SO, Cl−, Na+, Ca2+, Mg2+) concentrations measured by each of the NEU laboratories with the median estimate of all laboratories. Data from all field inter-comparisons (2006–2009) for all test sites (Auchencorth, UK; Braunschweig, Germany; Montelibretti, Italy; and Paterna, Spain) are combined in the analysis. A summary of the regression results is shown in the table below the graphs. Note that (i) there are fewer data points for INRAE because they joined the NEU network later in 2007 and participated in the 2008 and 2009 inter-comparisons only, and (ii) the low number of observations in some cases was due to some laboratories not reporting all parameters. NILU: HCl, Cl Na+, Ca2+, and Mg2+ reported for 2008 inter-comparisons only; CEAM: Na+, Ca2+, Mg2+ reported for 2007–2009 inter-comparisons only.
3.2 Field inter-comparison results: DELTA® measurements
Results from 4 years of annual DELTA® field inter-comparisons (2006–2009), for all field sites, are combined and summarized in Fig. 6. The gas and aerosol concentrations measured and reported by each of the laboratories are compared with the median estimate of all laboratories in each of the scatterplots, with the colour of the symbols identifying the laboratory providing the measurements. Regression results (slope and R2) in the table below the plots provide the main features of the inter-comparison. The slope is equivalent to the mean ratio of each laboratory against the median value, where values close to unity indicate closer agreement to the median value. Overall, the scatterplots show good agreement between the laboratories, with some laboratories showing very close agreement to the median estimates and more scatter observed from the others.
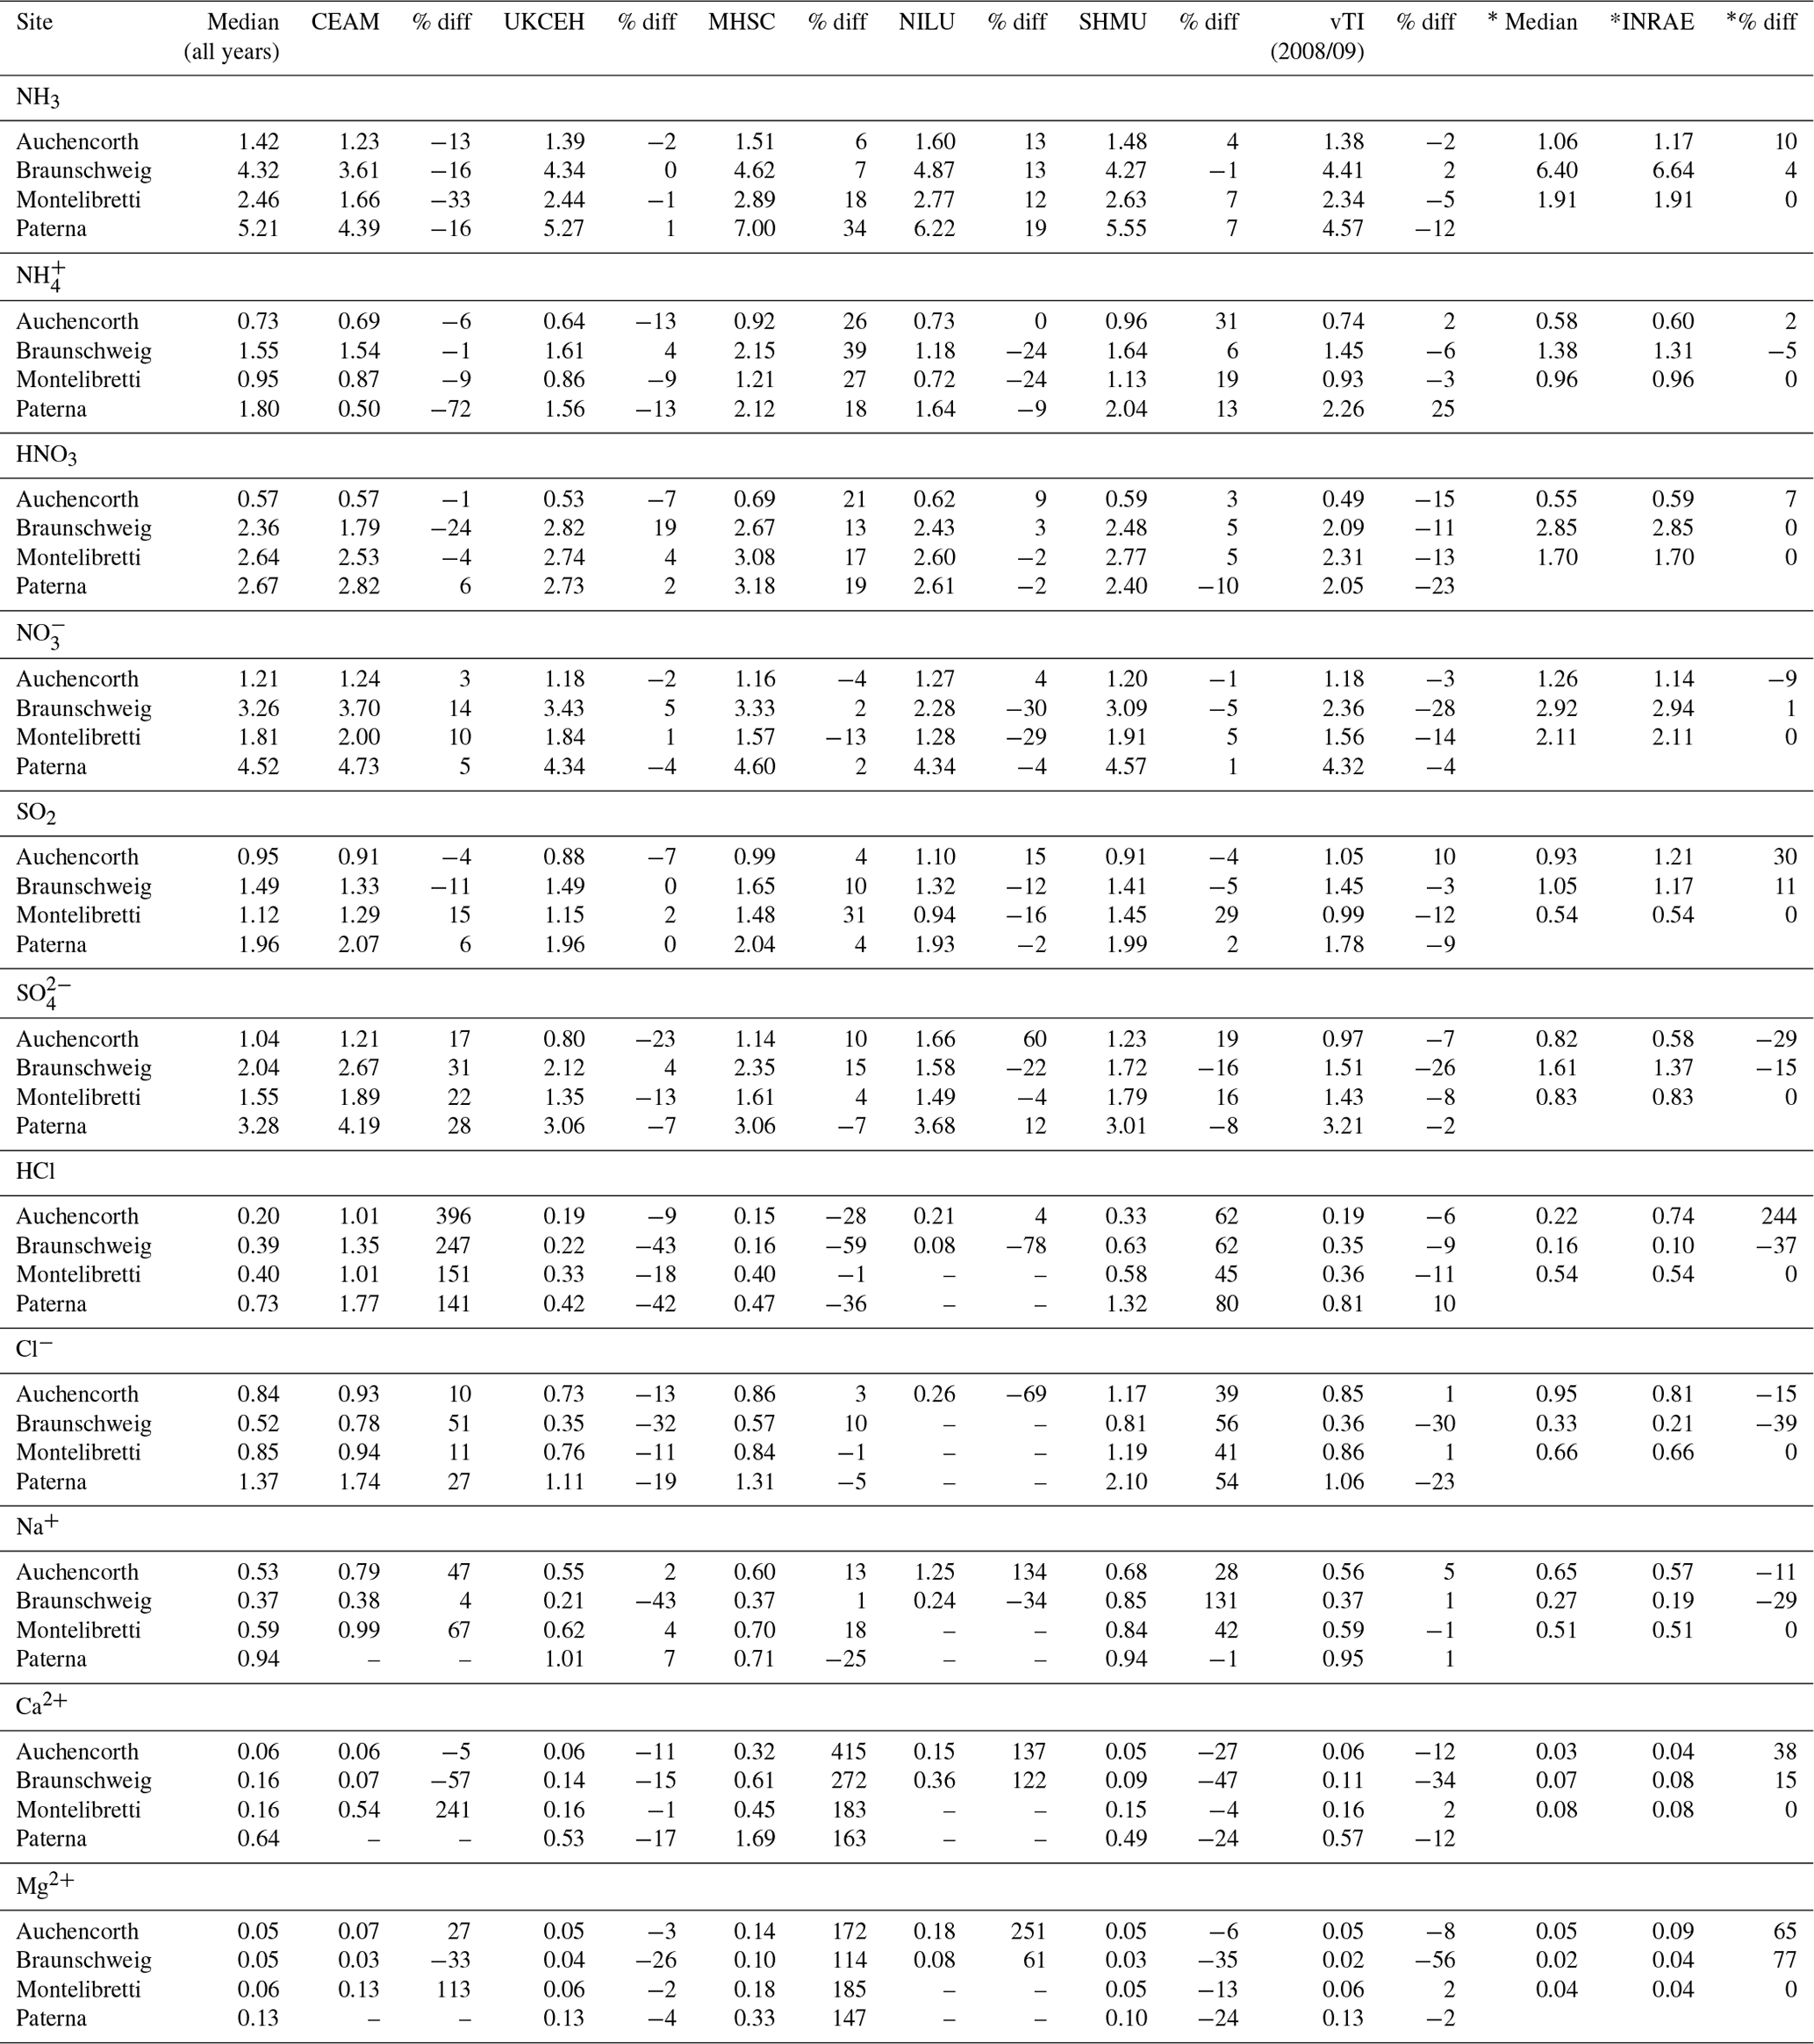
The occurrence of outliers in some of the individual monthly values indicates that caution needs to be exercised in the interpretation of these data points in the inter-comparison. To average out the influence of a few individual outliers, the mean concentrations from each of the seven laboratories for each of the four field sites were calculated and compared with averaged median estimates of all laboratories for each site. A summary of the mean concentrations and the percentage difference from the median is presented in Table 2. Since the INRAE laboratory did not join the NEU network until 2008, averaged median values from the 2008 and 2009 inter-comparisons are used to compare with the INRAE results, included in the table for clarity. The mean concentrations between laboratories are broadly comparable. Each of the laboratories were also able to resolve the main differences in mean concentrations at the four field sites, ranging from the lowest concentrations at Auchencorth (e.g. median = 1.4 µg NH3 m−3) to higher concentrations, representing a more polluted site at Paterna (e.g. median = 5.2 µg NH3 m−3) for the test periods (Table 2). Larger differences for HCl, Ca2+, and Mg2+ are due to clear outliers from one or two laboratories at the very low concentrations of these species encountered and may be related to measurement uncertainties at the low air concentrations. The comparability between laboratories for each of the components is next considered in turn.
Table 2Inter-comparison of results from seven European laboratories at four different field test sites for all years (2006–2010). The results shown are the mean concentrations from each laboratory for each site and the averaged median estimates derived from all laboratories for each site.
3.2.1 Inter-comparisons: NH3, NH, HNO3, NO
The best agreement between laboratories was for the Nr gases (NH3, HNO3) and aerosol species (NH, NO), with slopes within ±10 % of the median values and R2 > 0.9 in the regression analysis from five of the laboratories (Fig. 6, Table 2). This is important since Nr species were the primary focus for the NEU DELTA® network. Slightly poorer agreement for NH3 and NH was provided by CEAM and MHSC laboratories, with data points both above and below the 1:1 line (Fig. 6). The outliers above the 1:1 line from MHSC were from the 2006 inter-comparison exercise. Removal of these 2006 outliers improved the MHSC regression slope for NH3 from 1.21 (R2=0.87, n=41) to 0.99 (R2=0.99, n=10) (Fig. S1). While this seems to suggest that the performance of MHSC for NH3 improved following the first inter-comparison exercise, the regression slope for aerosol NH increased instead from a slope of 1.26 (R2=0.83, n=41) to 1.48 (R2=0.93, n=10), suggesting an overestimation of NH concentrations (Fig. S1). A possible cause may be the quality and/or variability in the aerosol filter blank values for NH as laboratory blanks are subtracted from exposed samples to estimate aerosol NH concentrations. While the laboratory blanks reported by MHSC for aerosol NH were low (mean = 0.48 µg NH) and smaller than other laboratories (mean = 0.64–1.20 µg NH) (Fig. S2), their field blanks in the 2006 DELTA inter-comparison exercise were on average 5.5 times larger than the laboratory blanks. This is likely due to extensive delays in getting samples released from customs in Slovakia at the start of the network. Another possibility is a breakthrough of NH3 from the acid-coated denuders onto the aerosol filters. The denuder collection efficiency of NH3 gas (Eq. 3, Sect. 2.2.1) reported by MHSC was on average 88 % for all years and 91 % where 2006 data have been excluded (Table S3). This is comparable with the mean collection efficiencies of all laboratories (91 % and 90 %) (Table S4), which makes NH3 breakthrough an unlikely explanation for the higher readings. The assessment of NH is however more uncertain from the reduced number of data points (n=10).
For the CEAM laboratory, reported NH3 concentrations were on average 16 % lower (n=41) than the median, with a slope of 0.89 (R2=0.87), and particulate NH was on average 13 % lower (n=41) than the median, with a slope of 0.42 (R2=0.22) (Fig. 6). A need to improve the NH analysis (indophenol colorimetric assay) in the acid-coated denuders and aerosol filters by the CEAM laboratory was identified from the 2006 inter-comparison (Tang et al., 2009). The indophenol method for aqueous NH determination is pH-sensitive. Calibration solutions and quality control checks for the colorimetric assays are made up in deionized water (pH 7), whereas the aqueous extracts from the DELTA® acid-coated denuders and cellulose filters are acidic (pH ∼3). Determination of NH in the denuder extracts may therefore be underestimated if the pH of the indophenol reaction has not been adjusted for the increased acidity in the sample extracts. When the 2006 data are excluded from the regression analysis, the slopes for NH3 and NH increased to 1.02 (R2=0.94, n=12) and 0.98 (R2=0.51, n=12), respectively (Fig. S1). The improved agreement with other laboratories after the 2006 inter-comparison suggests that the method under-read was largely resolved, reflected in an improvement in the slope. Despite some uncertainties in the NH3 and NH measurements, the laboratories were able to clearly resolve the main differences in mean concentrations at the four different field sites in all years (Table 2). The results presented here for CEAM and MHSC highlight the importance of the initial inter-comparison exercise in identifying and resolving sampling and analytical issues at the start of the project.
3.2.2 Inter-comparisons: SO2, SO
Six laboratories provided slopes within 12 % of the median values in the regression analysis for SO2 (Fig. 6). The smaller R2 values were from two laboratories (CEAM and SHMU; R2 < 0.7), with data points both above and below the 1:1 line. For INRAE, the larger slope of 1.6 (R2=9) was due to a single high SO2 reading reported for Auchencorth of 2.0 µg SO2 m−3, compared with the median of 1.4 µg SO2 m−3. When the mean SO2 concentrations measured by INRAE are compared with the median, the difference was on average 13 %, providing acceptable agreement, which suggests that the high reading may just be an outlier. There was more scatter in the inter-comparison for SO, although the majority of points are still close to the 1:1 line (Fig. 6). Six laboratories provided slopes within 12 % of the median values in the regression analysis also for SO. The regression slope from CEAM for SO was 1.2 (R2=0.9), which is still within 20 % of the median. The SO2 and SO measurements were broadly comparable between the laboratories, with mean concentrations agreeing on average within 6 % of the median (Table 2).
3.2.3 Inter-comparisons: HCl, Cl−
The HCl inter-comparison shows clear outliers from the CEAM laboratory, with concentrations that were on average up to 2 times higher than other laboratories (slope = 1.8). For example, a mean concentration of 1.8 µg HCl m−3 was reported by CEAM for Paterna, compared with a median of 0.7 µg HCl m−3. Apart from CEAM, the mean concentrations of HCl reported by the other laboratories were generally comparable (Table 2). The larger percentage differences between the measured mean and median at each site reflect the challenges of measuring the very low concentrations of HCl at these sites of < 0.5 µg HCl m−3 (slightly higher at Paterna). HCl results were reported by NILU for the 2008 inter-comparison exercise only, limiting the number of measurements (n=4) available for comparison.
The comparison for Cl− showed better agreement of the CEAM laboratory results with other laboratories in both the inter-comparison of individual monthly values (Fig. 6) and the mean concentrations (Table 2). Like HCl, larger percentage differences between the measured concentrations and median at each site may be attributed to higher measurement uncertainties at the low concentrations of Cl−. For NILU, there were only two data points for Cl− from the Auchencorth site in the 2008 inter-comparison. Overall, the inter-comparison for HCl and Cl− showed that the laboratories were able to resolve the main differences in mean concentrations at the different sites even at the low concentrations encountered.
3.2.4 Inter-comparisons: base cations (Na+, Ca2+, Mg2+)
Measurements of Ca2+ and Mg2+ were the most uncertain, with the largest scatter in the inter-comparisons (Fig. 6). Despite the trace levels of these base cations at all field sites, four laboratories (INRAE, UKCEH, SHMU, vTI) provided data close to the 1:1 line, demonstrating close agreement between these laboratories. The clear outliers above the 1:1 line are from CEAM, MHSC, and NILU, with slopes > 2. While MHSC over-read Ca2+ and Mg2+, its results for Na+ were in better agreement with other laboratories, with a slope of 0.9 (R2=0.5) (Fig. 6). There was a lot of scatter in the data however, with outlier points both above and below the 1:1 line, suggesting measurement uncertainties in their base cation measurements. For NILU, the only base cation results reported by the laboratory were for the 2008 DELTA® inter-comparisons at Auchencorth and Braunschweig. This accounts for the low number of data points (n=4) from the NILU laboratory. The median concentrations of Ca2+ and Mg2+ at both field sites were very low (< 0.1 µg m−3), which makes comparison with the few data reported from NILU highly uncertain. Like NILU, CEAM also did not report base cation results for all of the DELTA® inter-comparison. Base cation results provided by CEAM were for 2007–2009 only.
3.3 Variation in annual mean gas and aerosol concentrations and composition
3.3.1 Comparisons according to ecosystem types
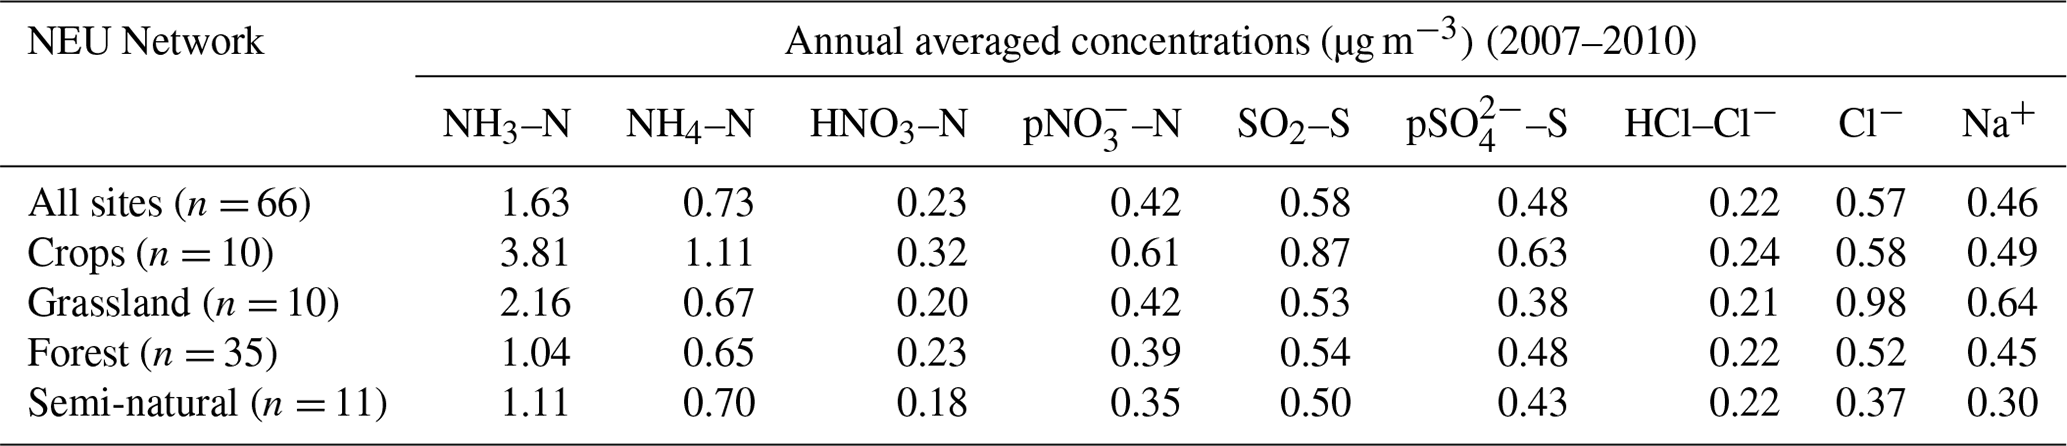
Annual averaged concentrations of gases and aerosols measured in the NEU DELTA® network are presented in Fig. 7, with sites grouped according to each of the four major ecosystem types: crops, grassland, forests, and semi-natural. These are the classifications used in dry-deposition models, where ecosystem-specific deposition velocities (Vd) are combined with measurement data to produce estimates of Nr dry deposition (Flechard et al., 2011).
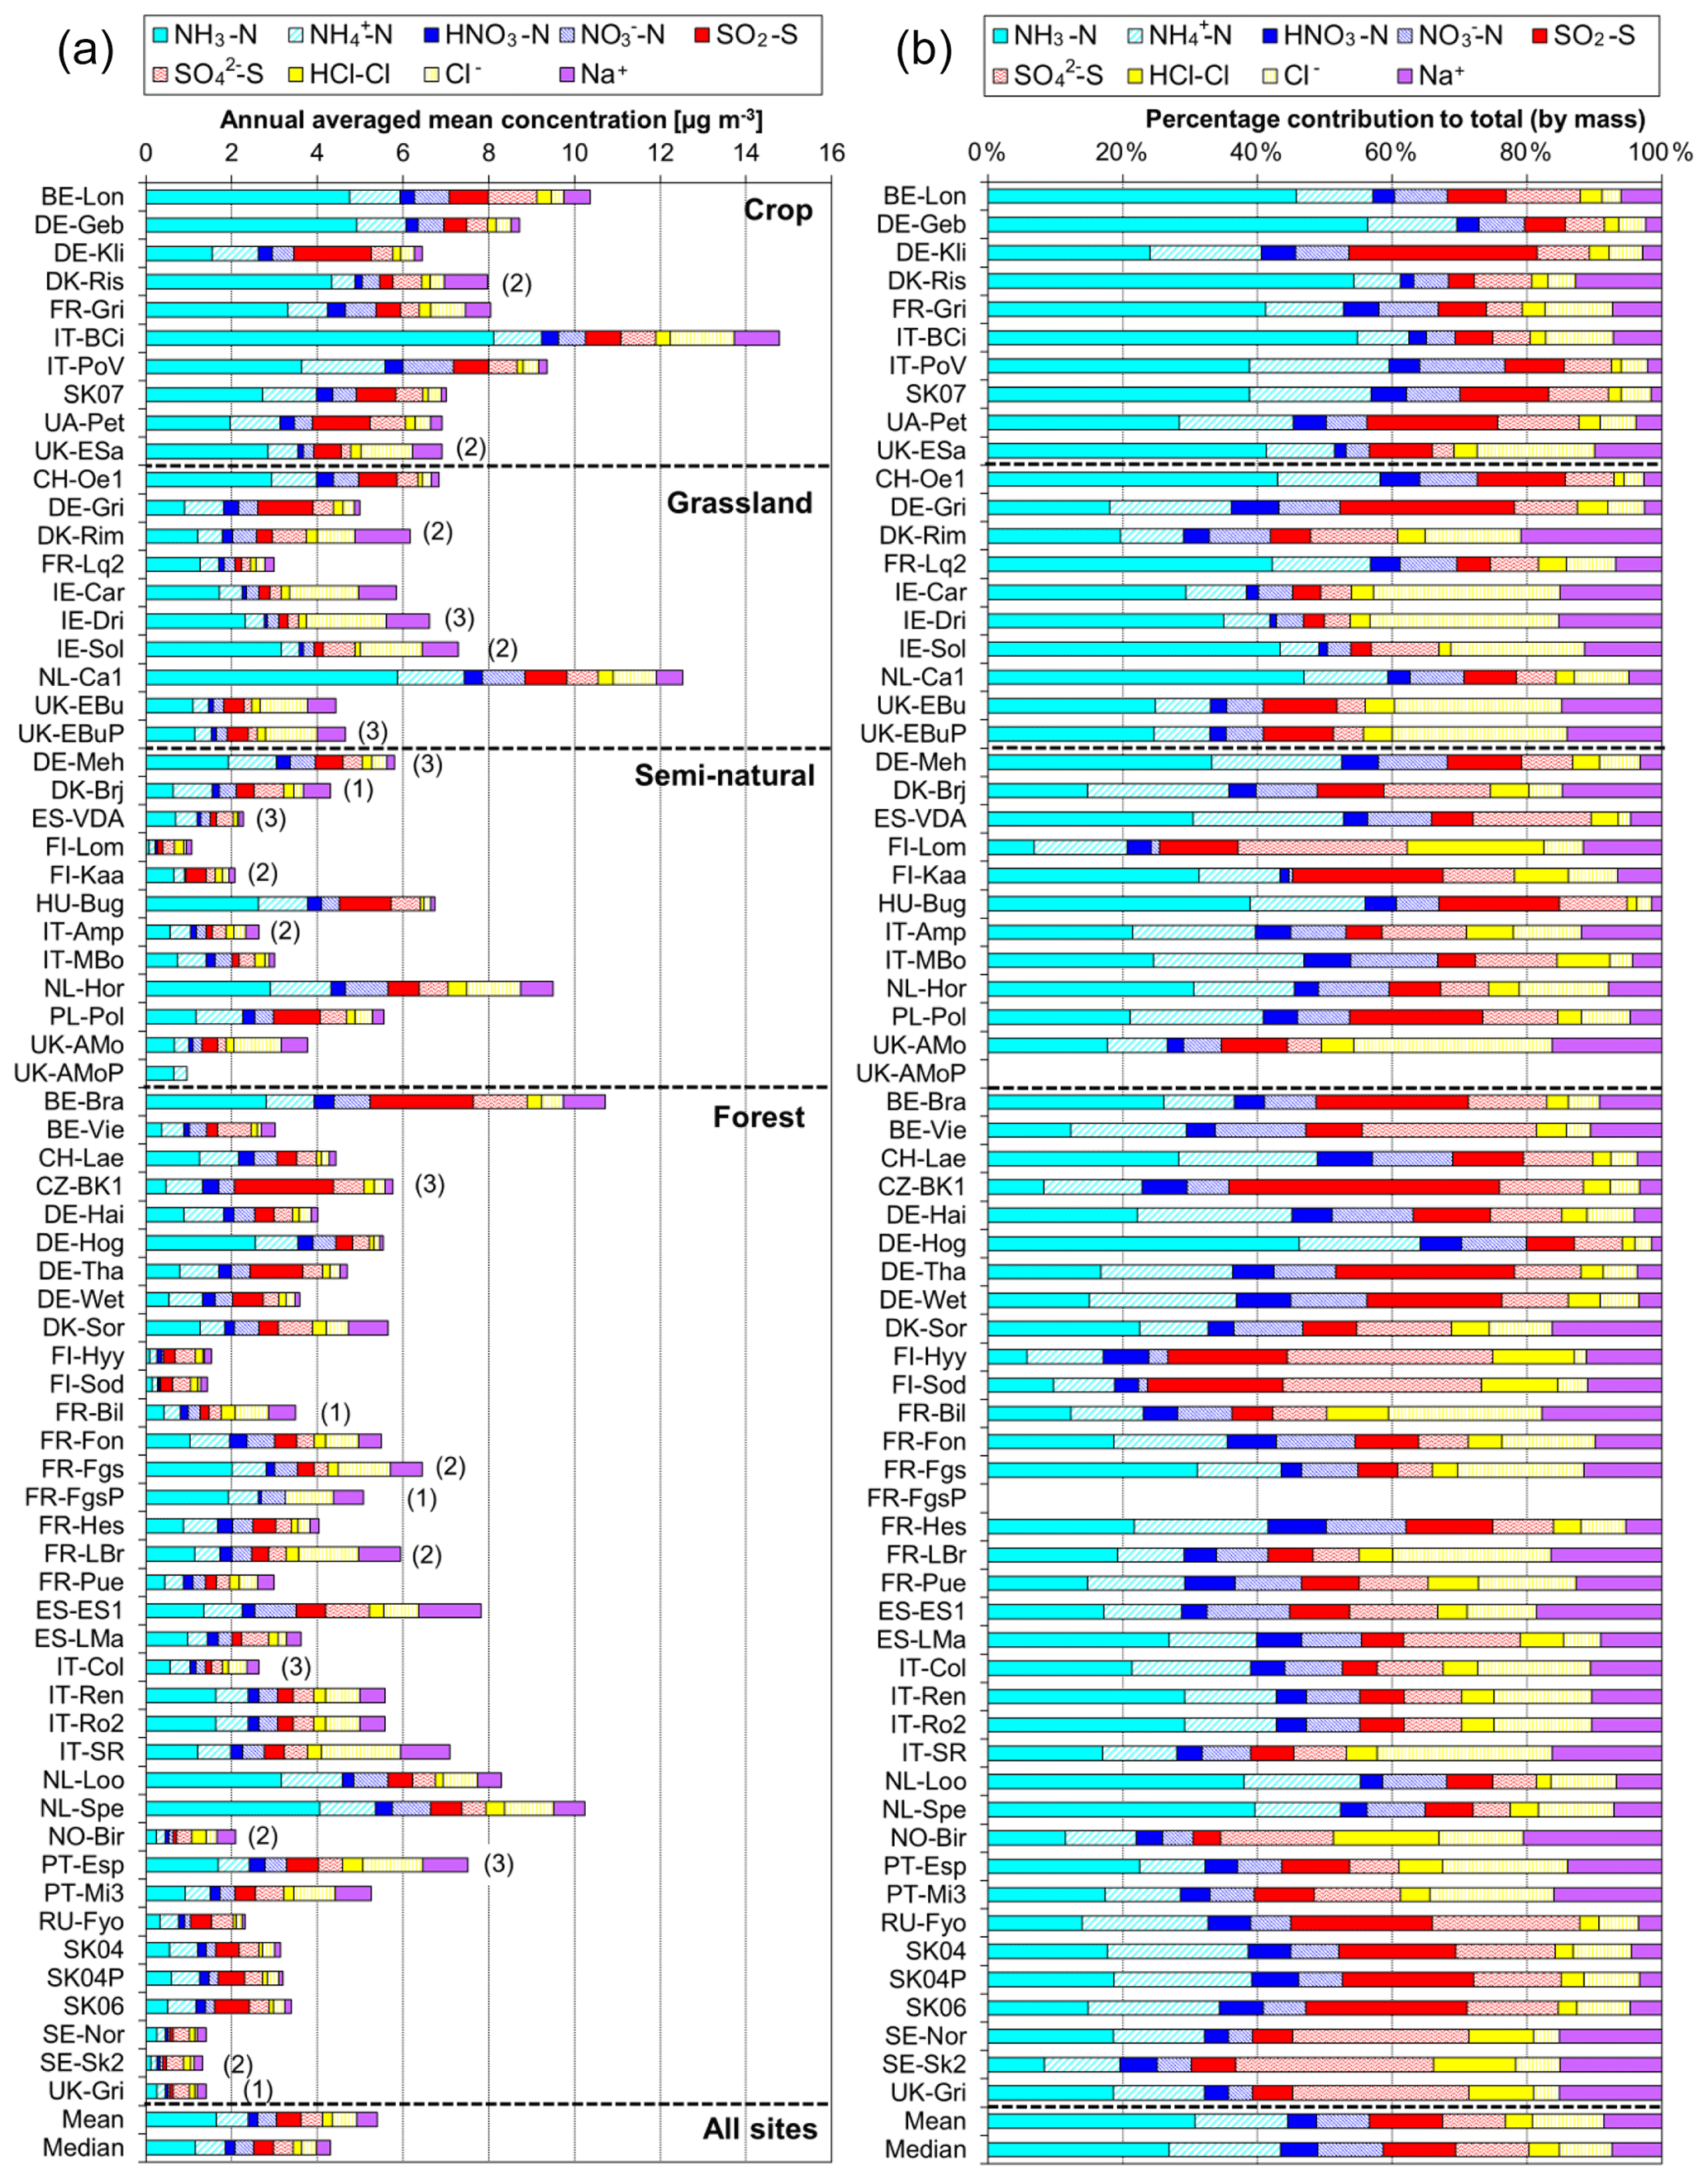
Figure 7(a) Annual averaged gas and aerosol concentrations (2007–2010) of sites in the NEU DELTA® network, grouped according to ecosystem type: crops (n= 10), grassland (n= 9 + 1 parallel), semi-natural (n= 11 + 1 parallel), and forests (n= 34 + 2 parallel). (b) Percentage composition of gas and aerosol components measured at NEU DELTA® network sites (n= 64 + 4 parallel sites) (mean of all annual mean concentrations from 2007 to 2010). Years with < 7 months of data, including 2006, are excluded. Where the number of years contributing to the annual average is < 4, the number is shown in brackets beside the site data. Ca2+ and Mg2+ data are not included as these were mostly at or below the limit of detection. Replicated DELTA measurements are made at four sites: FR-Fgs/FR-FgsP (NaCl instead of K2CO3–glycerol-coated denuders; HCl not measured), SK04/SK04P, UK-Ebu/UK-EBuP, and UK-AMo/UK-AMoP (NH3 and NH only).
A total of 64 sites from 20 different countries, including replicated measurements at four of the sites, are compared in Fig. 7. Not all of the sites however were operational all of the time or at the same time. Changes in the numbers and locations of sites occurred over the duration of the network, for example, due to site closures, relocations, and/or new site additions. The annual averaged concentrations plotted for each site are the mean of all available annual means. Where the annual averaged concentration is derived from less than 4 full years of data, the number of years providing the mean is shown, in brackets, next to the site data in the graph. To avoid bias in the calculation of annual means, due to seasonality in the data (see later in Sect. 3.5), years with incomplete data coverage (< 7 months of data in any year) were excluded. Applying these data exclusions, the number of sites that provided annual data was 55 for 2007, 57 for 2008, 54 for 2009, and 55 for 2010. The number of sites that provided annual data for each year over the entire period was 45 sites.
Sites with parallel (P) DELTA® measurements were Auchencorth Moss (UK-AMoP), Easter Bush (UK-EBuP), Fougéres (FR-FgsP), and SK04P (EMEP site in Slovakia) (Fig. 7). Overall, good reproducibility in DELTA® measurements was demonstrated by the parallel measurements (Figs. S3–S6). At the Auchencorth Moss parallel site (UK-AMoP), NH3 and NH only were measured, and agreement for these two components was on average within 4 % at the low concentrations measured at this site (annual mean: 0.5–0.9 µg NH3 m−3 and 0.3–0.5 µg NH m−3) (Table S5). Parallel measurements at Easter Bush (UK-EBuP) stopped in March 2010. With the exception of Ca2+ and Mg2+, the comparison of annual mean data from the replicated measurements for 2006 to 2009 provided excellent agreement of 4 % (NO) to 12 % (NH) at Easter Bush (Table S6). At Fougéres (Table S7), HNO3 concentration measured on K2CO3–glycerol-coated denuders (FR-Fgs) was about 2-fold higher than on NaCl-coated denuders in the parallel DELTA® system (FR-FgsP), consistent with overestimation of HNO3 (on average 45 %) on carbonate-coated denuders (see Sect. 2.2.3). The disadvantage of a NaCl coating, however, is that it can only collect HNO3 and not the other acid gases. A third carbonate denuder is necessary in the sample train to collect and measure SO2 since SO2 is only partially captured, and HCl cannot be measured on NaCl denuders (Tang et al., 2015, 2018b). This explains the smaller SO2 concentrations reported by the FR-FgsP site, with breakthrough of SO2 (inefficiently captured by NaCl denuders) onto the aerosol filters resulting in larger particulate SO concentrations than the Fr-Fgs site. For the SK04 site, measurement reproducibility for the 4 years of parallel data for the N and S components was good, with agreement ranging from 1.2 % (NH) to 9 % (SO) (Table S8). HCl and Na+ and determinations were however more uncertain, with differences of 67 % and 43 %, respectively (Table S8). It has to be noted, however, that the concentrations of the two components were very low, at < 0.2 µg HCl m−3 and < 0.4 µg Na+ m−3. The differences in concentrations are therefore actually within ±0.1 µg m−3 for HCl and within ±0.2 µg m−3 for Na+.
A key feature in Fig. 7 is the dominance of N over S species at most sites, when expressed as micrograms per cubic metre of the element. The mean percentage contribution of sum Nr (NH3–N, HNO3–N, NH–N, NO–N) concentrations to the total mass of gas and aerosol species measured is 52 % (range = 24 %–80 %), twice as much as from sum S (SO2–S and SO–S; mean = 23 %, range = 7 %–53 %) (Fig. 8). This is consistent with more substantial reductions in SO2 emissions (−72 %) than achieved with NOx (−43 %) or NH3 (−18 %) in Europe between 1991–2010 (EEA, 2019). The differences in atmospheric composition of S and N species in the present assessment therefore reflected changes in emissions of the precursor gases and are also in agreement with a recent assessment of air quality trends showing important changes in S and N composition in air and rain across the EMEP networks (EMEP, 2016).
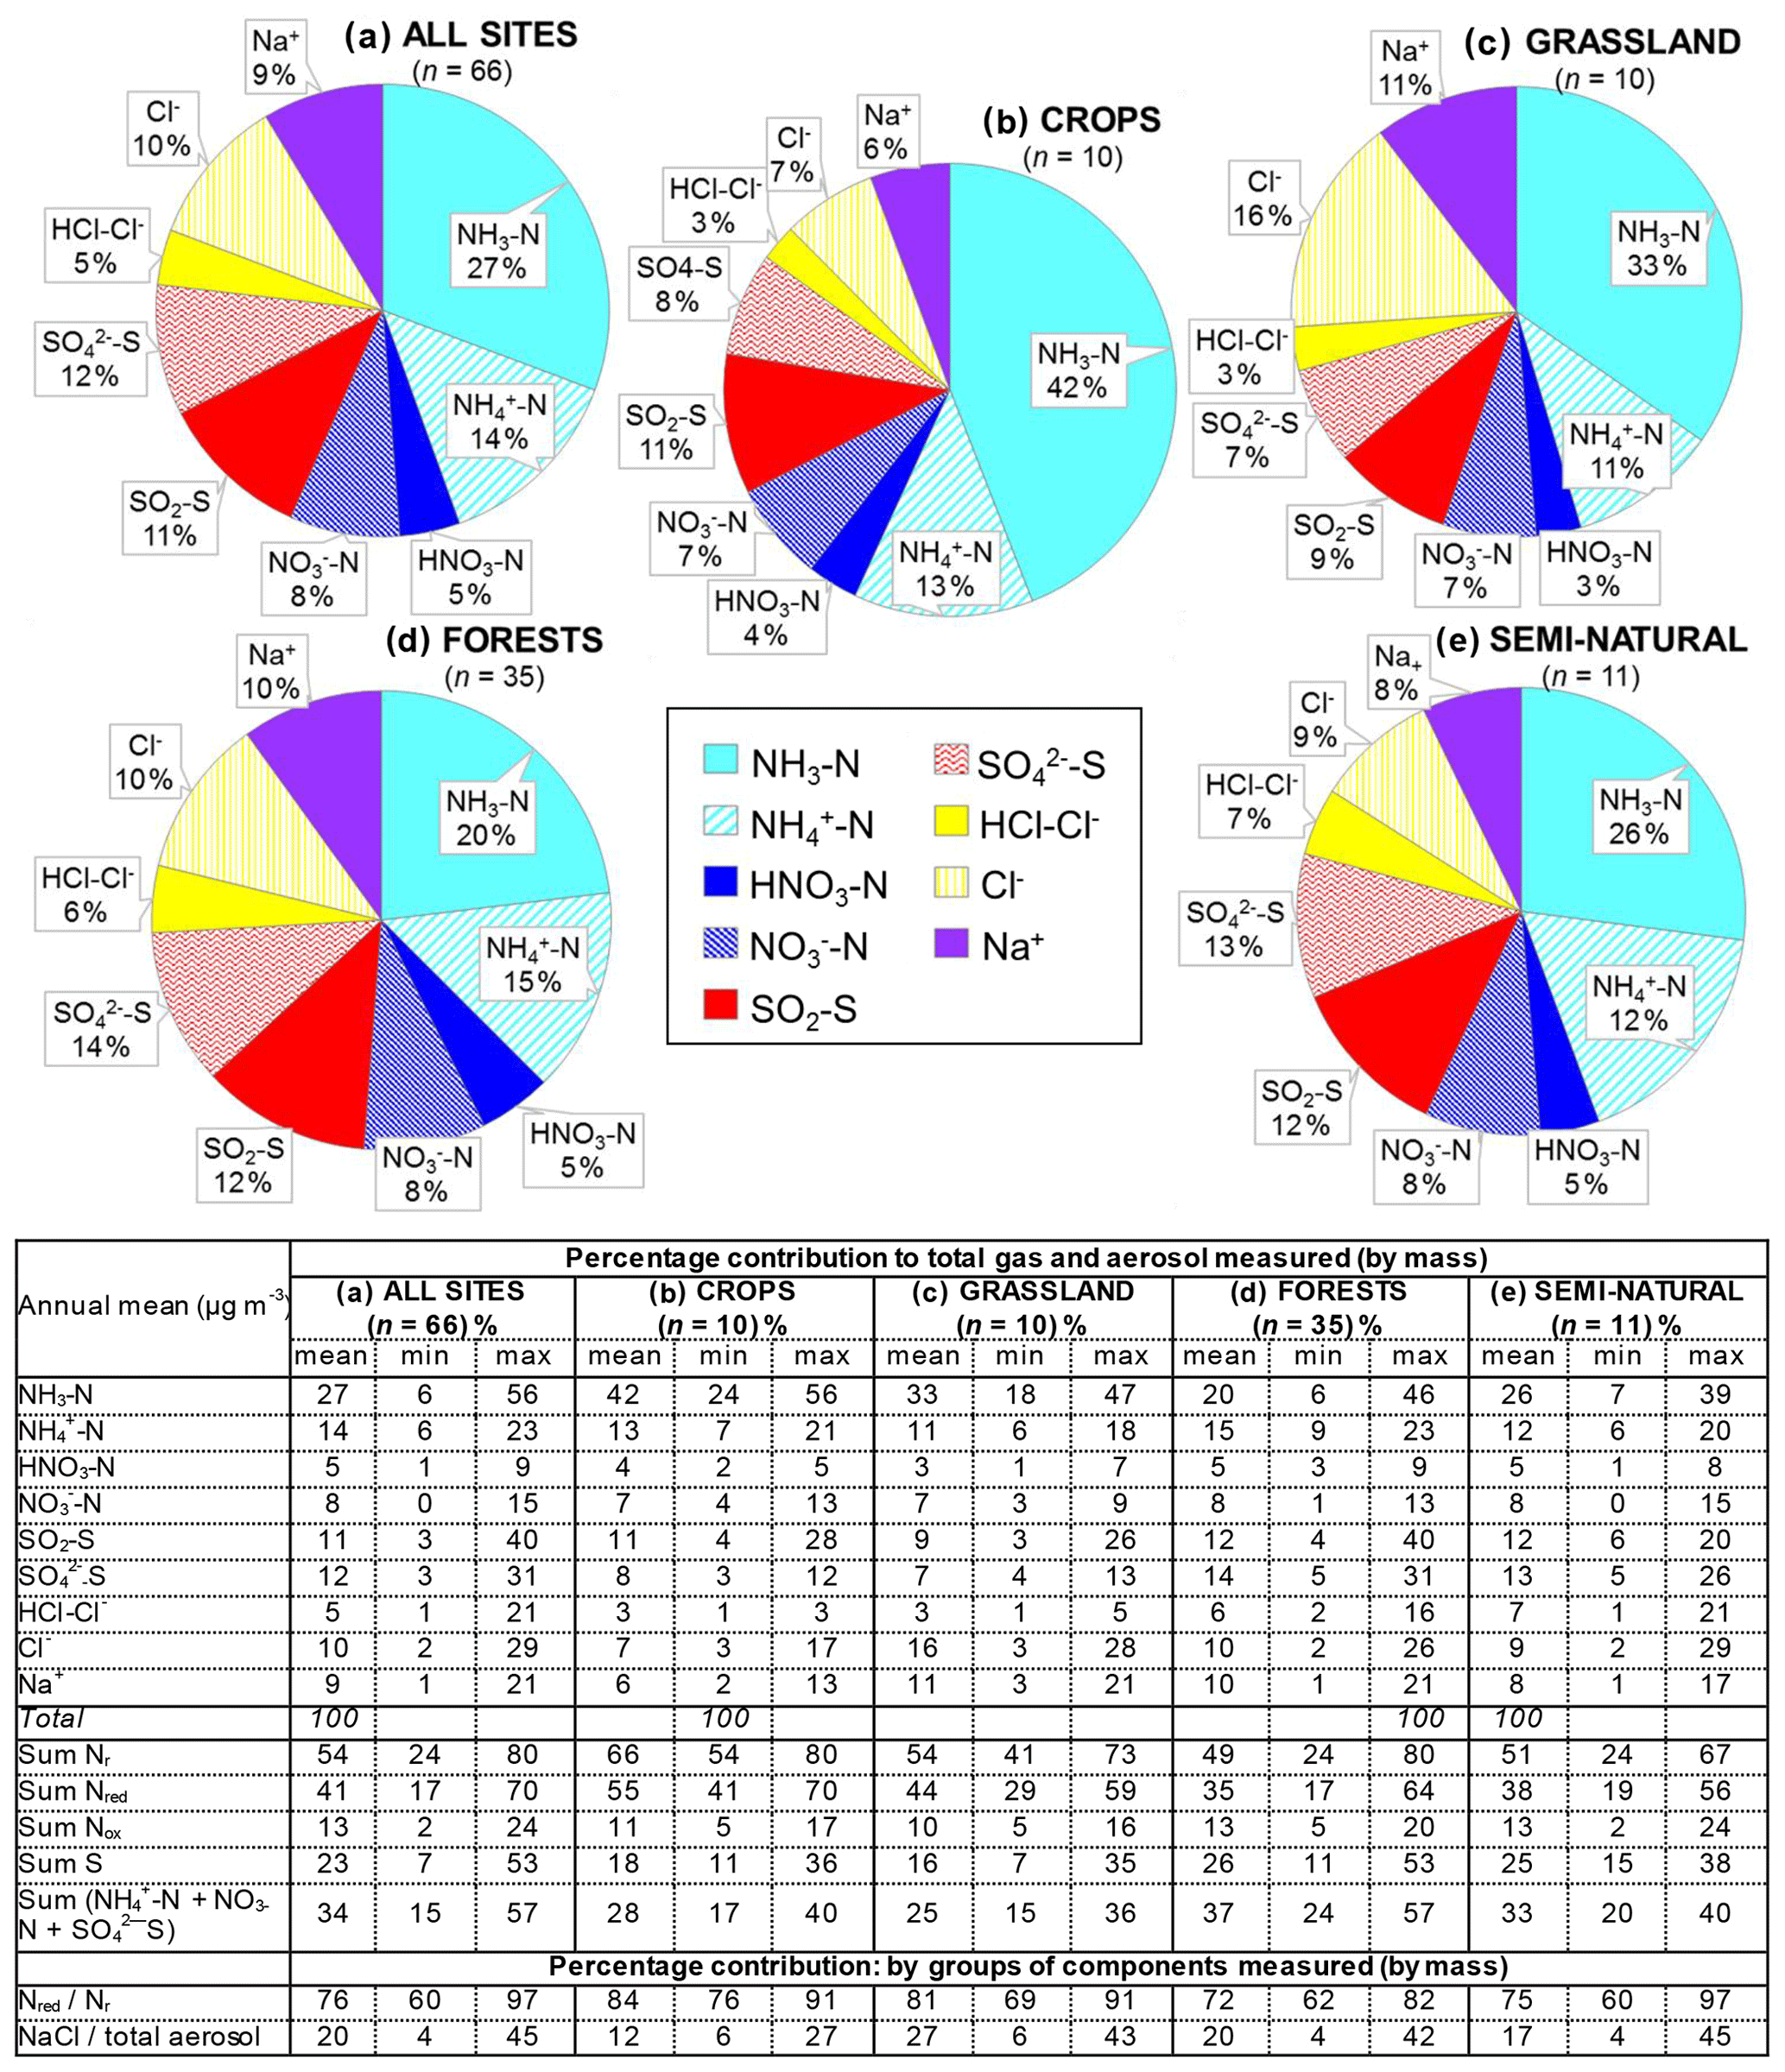
Figure 8(a, b, c) Pie charts showing the mean atmospheric composition of gas and aerosol components from annual averaged concentrations (µg m−3) measured at NEU DELTA® sites for (a) all sites (n= 66) and sites grouped according to ecosystem types, (b) crops (n= 10), (c) grassland (n= 10), (d) forests (n= 35), and (e) semi-natural (n= 11). UK-AMoP (parallel DELTA® at Auchencorth: NH3 and NH only) and FR-FgsP (parallel DELTA® at Fougéres: different sample train) were excluded in this analysis. (d, e) Summary statistics on percentage composition by mass (µg m−3 element) measured. Sum Nr= sum (NH3–N + NH–N + HNO3–N + NO–N), sum S = sum (SO2–S + SO–S), Nred= sum reduced N (NH3–N + NH–N), Nox= sum oxidized N (HNO3–N + NO–N).
Most of the Nr concentrations at each site in turn are dominated by reduced N (NH3–N, NH–N) rather than by oxidized N species (HNO3–N (includes other oxidized N compounds; see Sect. 2.2.3) and NO–N). Of the sum Nr concentrations measured, 60 %–97 % (mean = 76 %, n=66) were reduced N (Nred) (Fig. 8). Even more strikingly, NH3 (NH3–N) was by far the single most dominant component at the majority of sites, contributing on average 42 % (range = 24 %–56 %, n= 10) at cropland sites and 20 % (6 %–46 %, n=35) of the total gas–aerosol concentrations at forest sites (Fig. 8). This illustrates very clearly the importance of NH3 and by association agricultural emissions in contributing to NH3–N concentrations and deposition in Europe, with 92 % of total NH3 emissions in Europe estimated to come from agriculture (EEA, 2019). The reaction of NH3 with the acid gases HNO3 and SO2 forms NH-containing particulate matter (PM) that is primarily NH4NO3 and (NH4)2SO4 (Fig. 1) (see Sect. 3.4). Together, particulate NH–N, NO–N and SO–S made up on average 28 % (17 %–40 %, n= 10) of the total gas–aerosol concentrations measured at cropland sites (Fig. 8). At semi-natural and forest sites however, that number was even bigger, at 33 % (20 %–40 %, n=11) and 37 % (24 %–57 %, n=35), respectively (Fig. 8).
Secondary NH particles are mainly in the “fine” mode with diameters of less than 2.5 µm (PM2.5) and estimated to contribute between 10 % and 50 % of ambient PM2.5 mass concentration in some parts of Europe (Putaud et al., 2010, Schwartz et al., 2016). An assessment by Hendriks et al. (2013) found that secondary NH contributed 10 %–20 % of the PM2.5 mass in densely populated areas in Europe and even higher contributions in areas with intensive livestock farming. Concentrations of PM2.5 continue to exceed the EU limit values of 25 µg m−3 annual mean in large parts of Europe in 2017 (EEA, 2019). Particulate NH data presented from the DELTA® network therefore highlight the potential contribution of NH3 of agricultural origin to fine NH aerosols in PM2.5. The formation and transport of these secondary aerosols pose a serious risk to human health since PM2.5 is linked to increased mortality from respiratory and cardiopulmonary diseases (AQEG, 2012).
A considerable fraction of the aerosol components measured was made up of sea salt (Na+ and Cl−), with contributions from the sum of Na+ and Cl− ranging from 4 % of the total aerosol loading at the inland Höglwald site in Germany (DE-Hog) to 43 % at Dripsey (IE-Dri), a coastal site in Ireland (Fig. 7). With the reduction in European emissions and concentrations of the gases SO2, NOx, and NH3 for formation of NH-containing aerosols, sea salt is therefore assuming a proportionate increase in the aerosol composition, consistent with observations from a recent European assessment of composition and trends in long-term EMEP measurements (EMEP, 2016). The concentrations of Ca2+ and Mg2+ were very low across the network, with values (mean of all sites < 0.1 µg m−3) that were at or below method limit of detection (LOD = ∼0.1 µg m−3) (Table S3). These data are also considered to be underestimated due to the DELTA particle sampling cut-off (∼PM4.5), and they were excluded from further assessment in this paper.
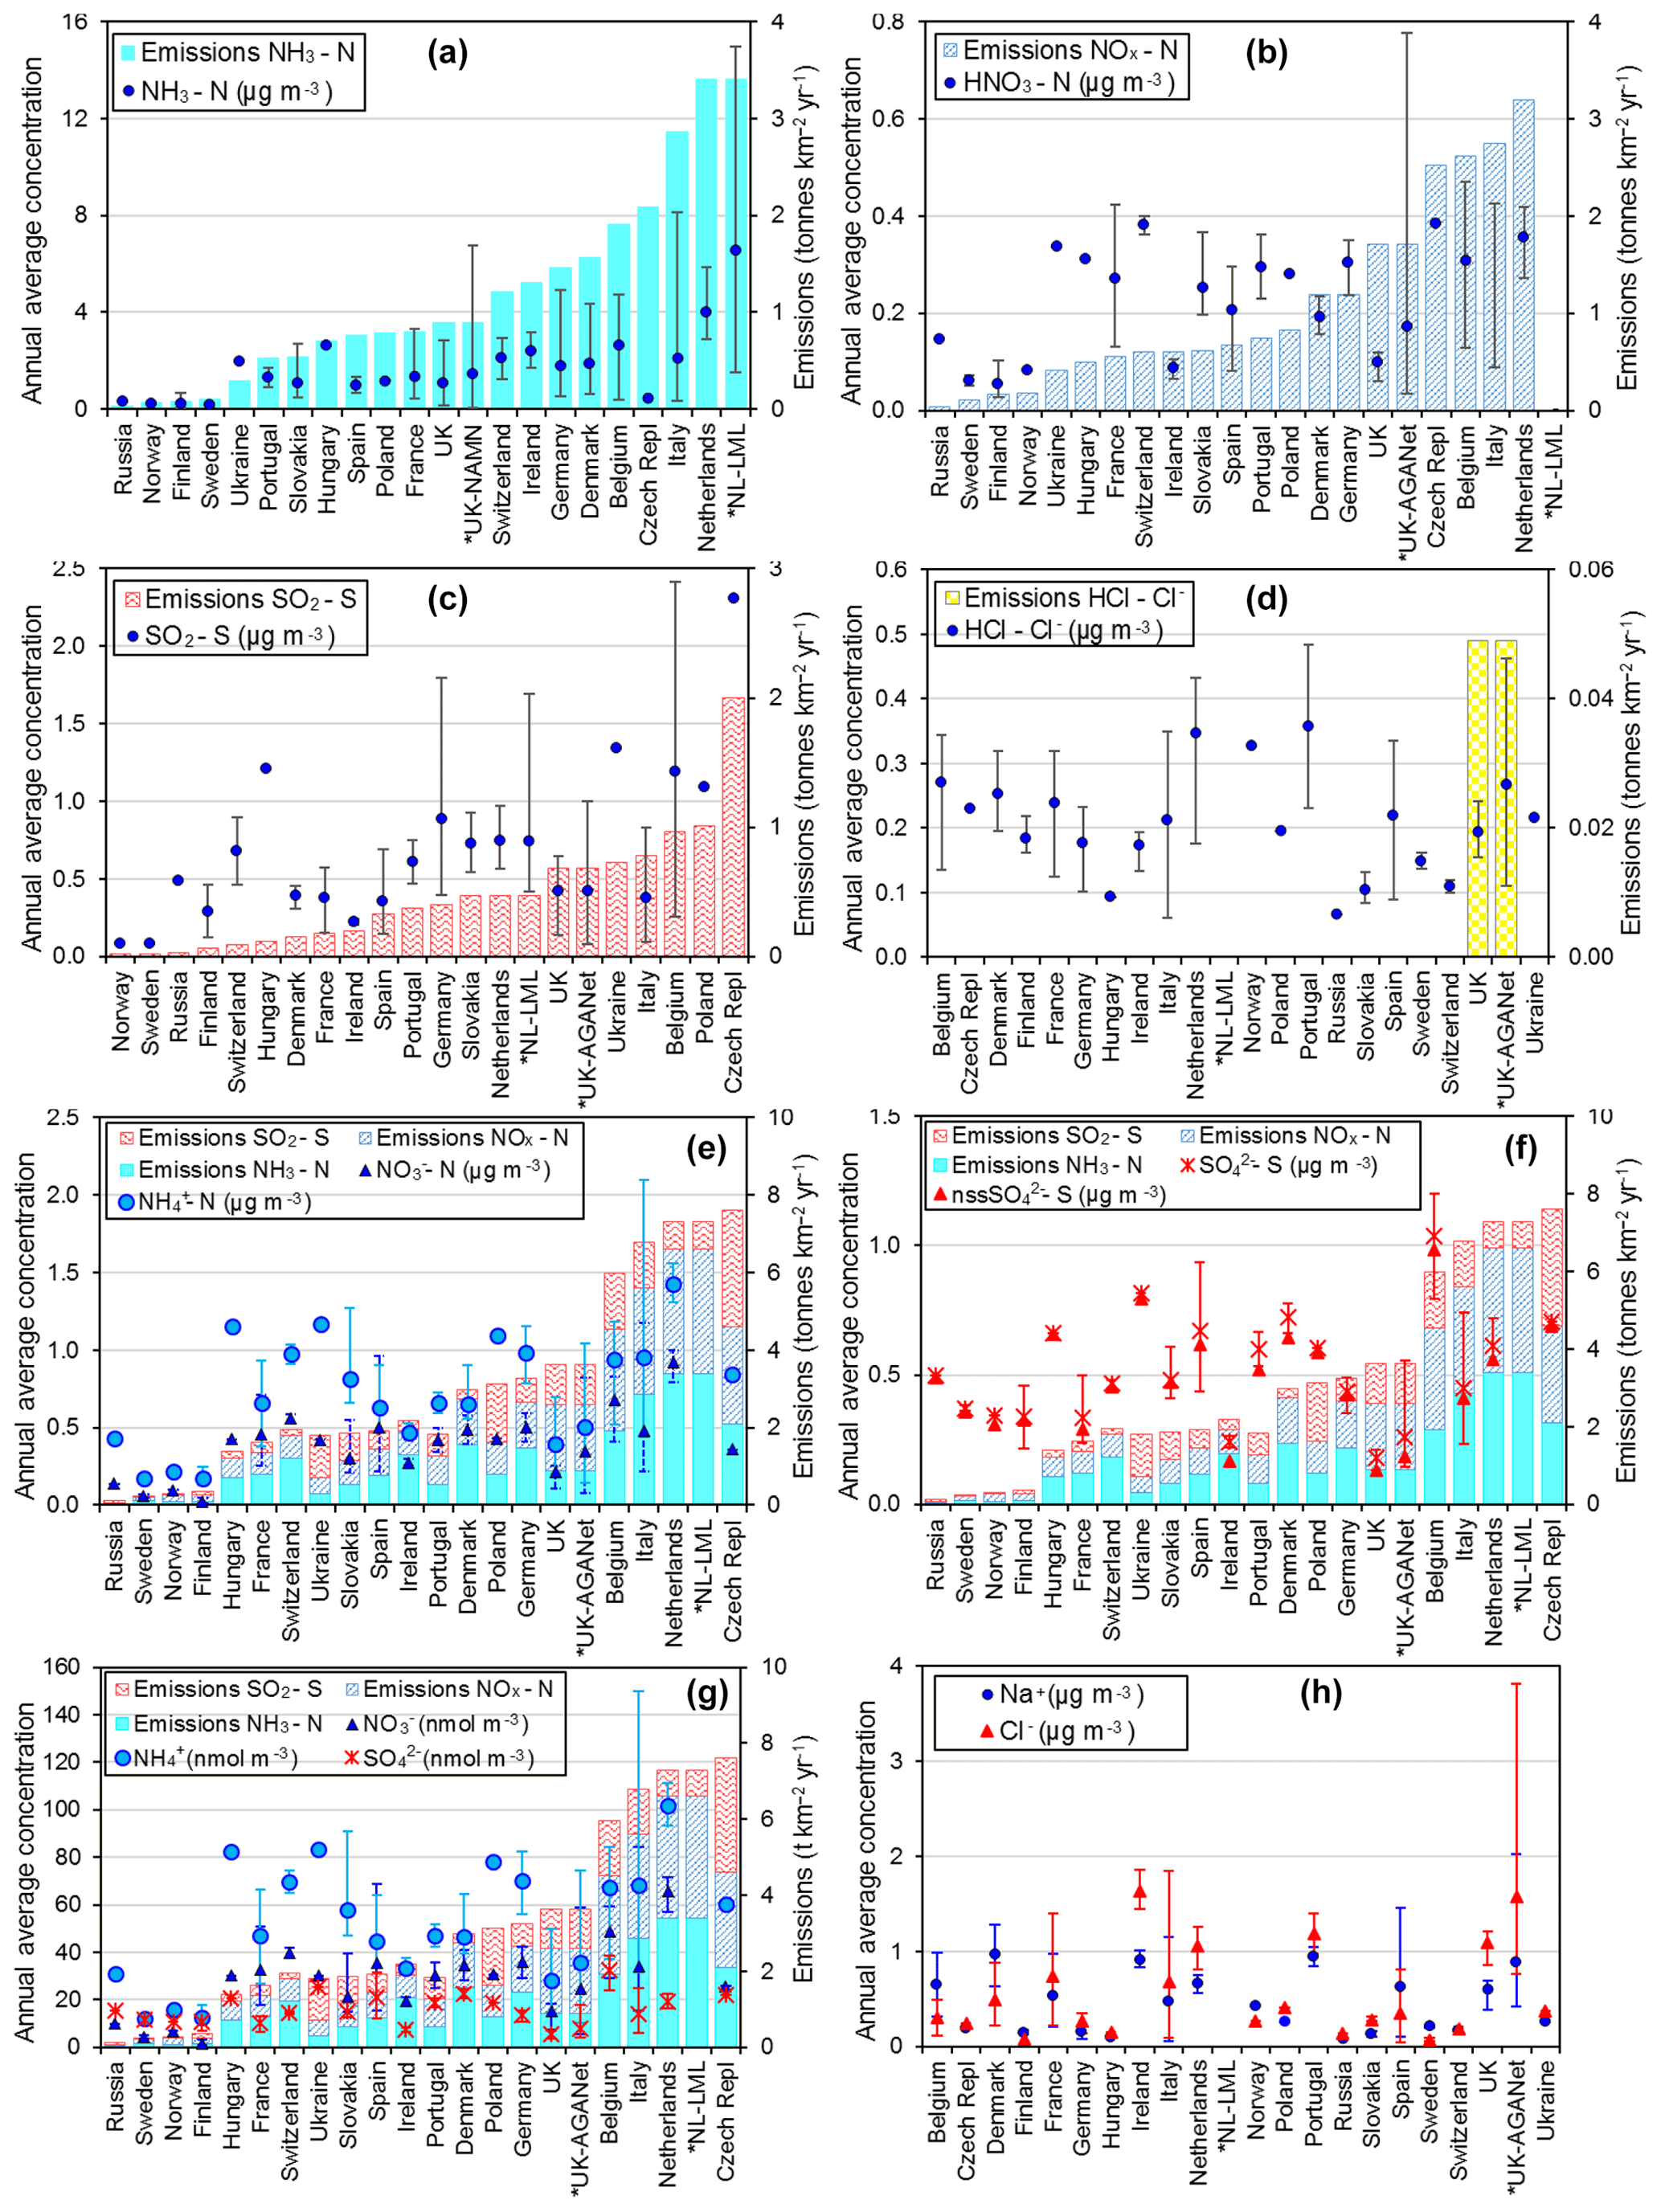
Figure 9Comparisons of annual averaged gas and aerosol concentrations (2007–2010) of sites in the NEU DELTA® network, grouped by country, with the respective 4-year-averaged annual emission densities of gases (NH3, NOx, and SO2) over the same period. Monitoring data from three national monitoring networks: * UK NAMN (NH3 from 72 sites and NH from 30 sites; Tang et al., 2018a), * UK AGANet (raw uncorrected HNO3, SO2, HCl, NO, SO, Cl−, Na+ from 30 sites; Tang et al., 2018b), and * NL-LML (NH3 and SO2 from 8 sites; van Zanten et al., 2017) are also included to illustrate the wider range of concentrations from larger numbers of sites. Error bars show the minimum and maximum concentrations measured in each country in the network. Where error bars are not visible, this indicates that either the country has measurement from just one site, or the range of concentrations measured are very close to the average.
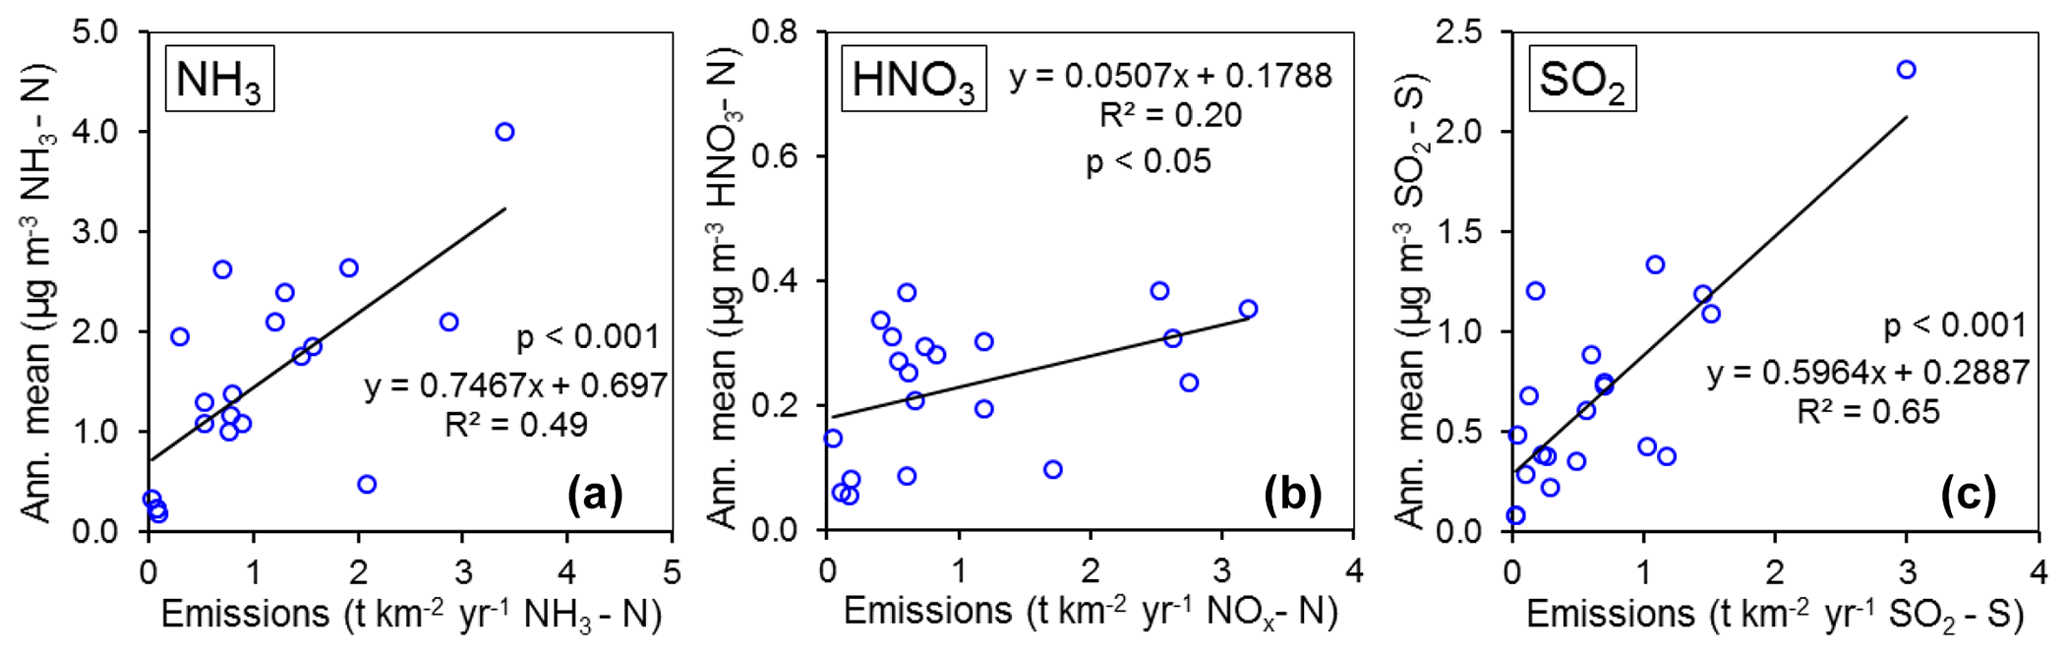
Figure 10Regression plots of national annual averaged gas (NH3, HNO3, SO2) concentrations (2007–2010) vs. 4-year national averaged emission densities of respective gases (NH3, NOx, and SO2: t km−2 yr−1) from each country over the same period (n= 20).
3.3.2 Comparisons with national gas emissions
In Fig. 9, the annual averaged gas and aerosol concentrations of grouped sites from each country are plotted with the corresponding national emission densities derived for NH3, NOx, and SO2. The emissions data in the graphs are the 4-year averages for the period 2007 to 2010, expressed as emissions per unit area of the country per year (t km−2 yr−1) (see Sect. 2.6) and ranked in order of increasing emission densities. From the visual comparisons, national mean measured concentrations in each country appear to scale reasonably well with the ranked emission densities. This is supported by further regression analyses which showed significant correlation between annual averaged concentrations of NH3, NOx, and SO2 with emission densities of NH3 (R2=0.49, p< 0.001; Fig. 10a), NOx (R2=0.20, p< 0.05; Fig. 10b), and SO2 (R2=0.65, p< 0.001; Fig. 10c), respectively (Table 3). The particulate components NH and NO were also correlated with emission densities of NH3 and HNO3 (Table 3). By contrast, there was no relationship between SO with emission densities of any of the three gases, possibly because of contributions to SO from long-range transport. All regression plots of concentrations against emission densities, including summary statistics, are provided in Fig. S7.
Table 3Summary statistics of regression analyses between national annual averaged gas (NH3, HNO3, SO2) and aerosol (NH, NO, SO concentrations and national emission densities (4-year average for period 2007 to 2010, expressed as emissions per unit area of the country per year) for each of the 20 countries in the NEU DELTA® network.
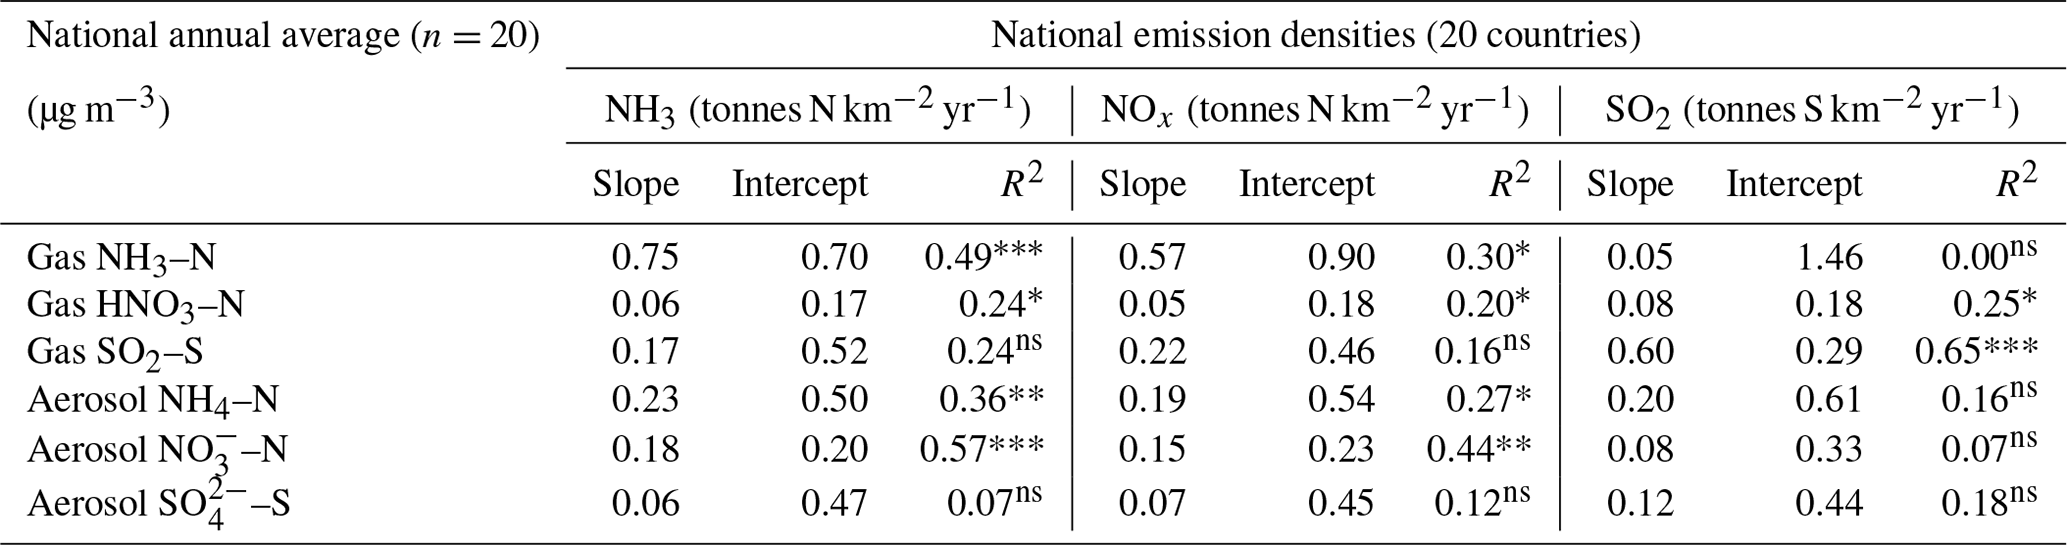
Significance level: , , ; ns: non-significant (p>0.05).
The comparisons here used national emission totals, where emissions have been summed and averaged across very large and heterogeneous areas in each country. Additional analysis was also undertaken to compare the individual site mean data with (i) gridded emissions from individual EMEP grids in which the NEU sites are located (Figs. S8, S9) and (ii) averaged emissions of an extended number of EMEP grids (4× grids) closest to the site (Fig. S10). Since results from this analysis were similar to the comparisons with national emission densities, they are not included for further discussions in this paper. The purpose of the ranked emission densities is to compare the pollution climate in terms of primary gas emissions (SO2, NO2, NH3) across the 20 European countries and to see if this is matched by the DELTA® measurements. Despite the complex relationship between emissions and concentrations, the pollution gradient in Europe is clearly captured by the present data. At the same time, it also demonstrated the potential application of the DELTA® approach in providing national concentration fields as evidence to compare against spatial and long-term trends in the national emissions data.
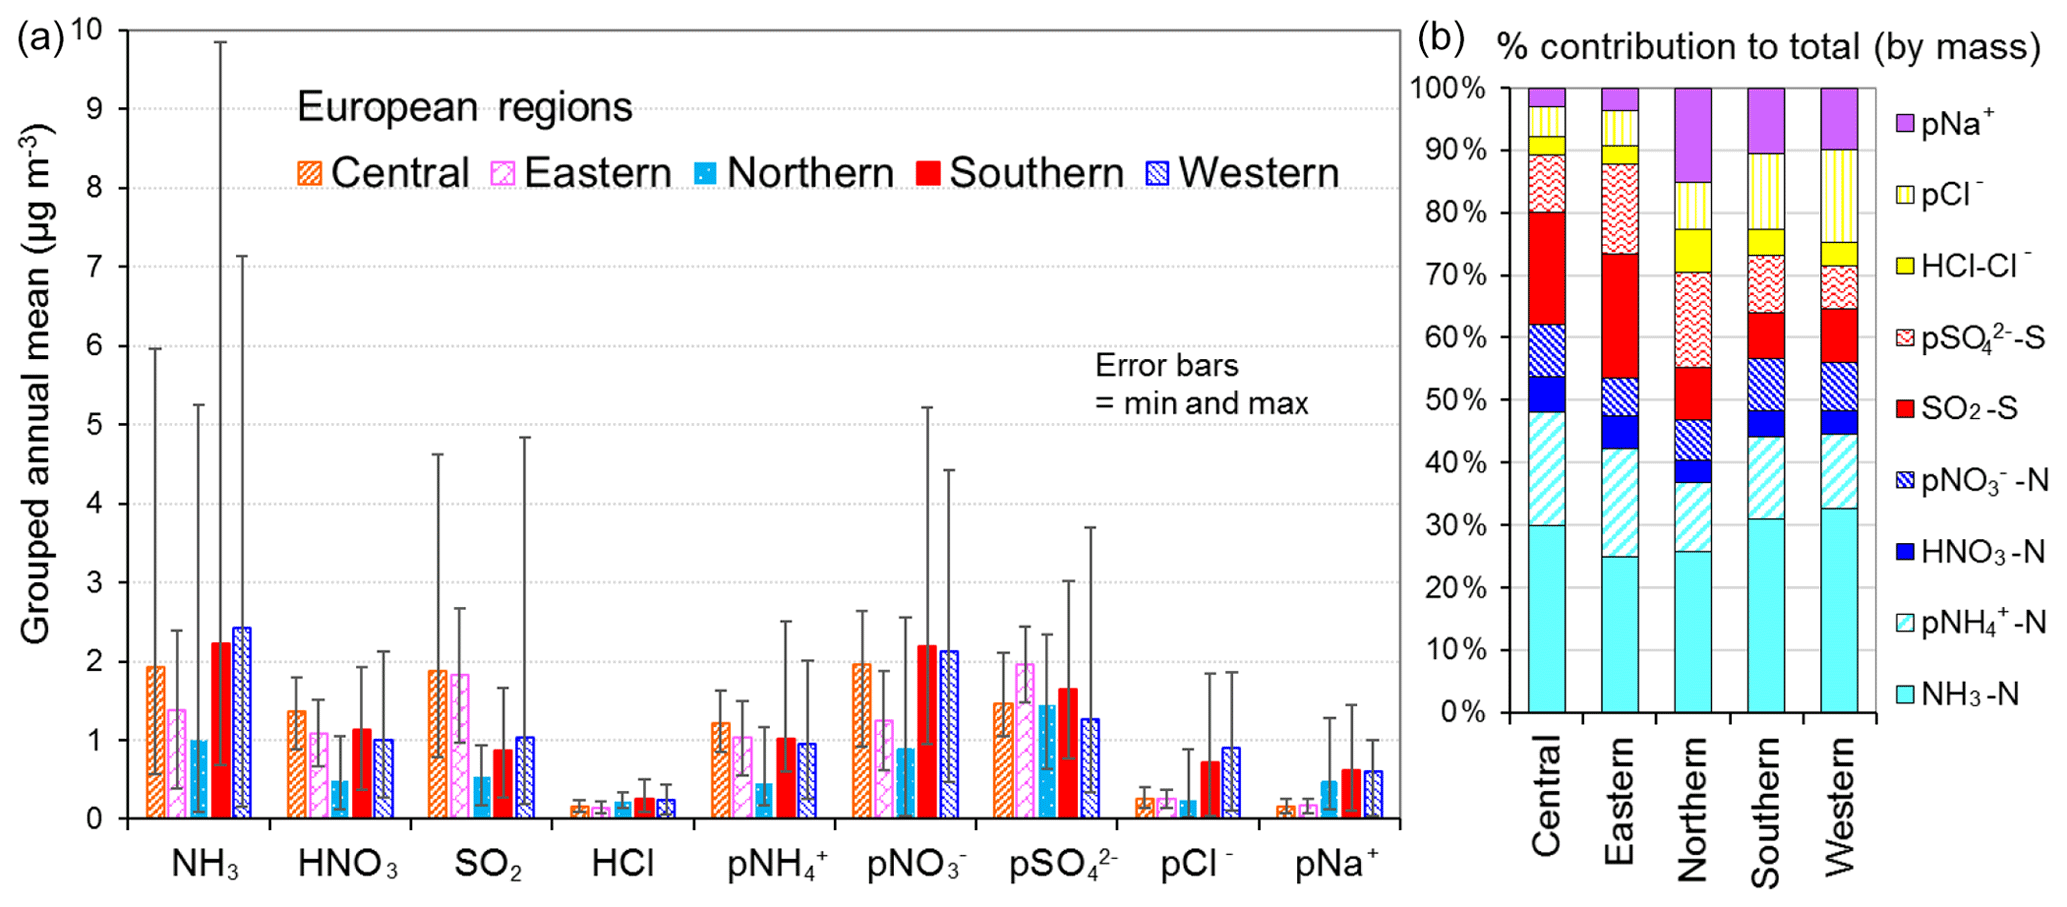
Figure 11(a) Spatial variation in annual averaged gas and aerosol concentrations (2007 to 2010) measured in the NEU DELTA® network across Europe, grouped according to geographical distribution of the monitoring sites: central (n= 17), eastern (n= 2), northern (n= 11), southern (n= 12), and western (n= 26). The p in front of a component name denotes particulate. (b) Percentage composition of gas and aerosol components according to European region.
3.3.3 Spatial variability across geographical regions
The form and concentrations of the different gas and aerosol components measured also varied according to geographic region across Europe (Fig. 11). The smallest concentrations (with the exception of SO and Na+) were in northern Europe (Scandinavia), with broad elevations across other regions. Gas-phase NH3 and particulate NH were the dominant species in all regions (Fig. 11). NH3 showed the widest range of concentrations, with the largest concentrations in western Europe (mean = 2.4 NH3 m−3, range = 0.2–7.1 µg NH3 m−3, n=26 in four countries). By contrast, HNO3 and SO2 concentrations were largest in high-NOx- and high-SO2-emitting countries in central and eastern Europe (Sect. 3.3.2). Particulate SO concentrations were however more homogeneous between regions, which may be attributed to atmospheric dispersion and long-range transboundary transport of this stable aerosol between countries in Europe (Szigeti et al., 2015; Schwarz et al., 2016). In the aerosol components, the spatial correlations between NO, NH, and NH3 illustrate the potential for NH3 emissions to drive the formation and thus regional variations in NH and NO aerosol. Particulate SO concentrations in northern Europe (Scandinavia) were similar to other countries, despite having the smallest SO2 and NH3 emissions and concentrations (Fig. 9). By comparison, the smaller particulate NH and NO concentrations in northern Europe are consistent with the smallest emissions (NH3 and NOx) and concentrations of NH3 and HNO3 (Fig. 9). As discussed later in Sect. 3.4, the larger SO concentrations reported in northern Europe were flagged up as anomalous from ion balance checks (ratio of NH : sum anions).
3.3.4 Comparisons by grouped components
In the following sections, variations in concentrations of the different gas and aerosol components according to ecosystem type (crops, grassland, forests, and semi-natural) and in relation to emissions (NH3, NOx, and SO2) are further discussed. For ease of interpretation, components are grouped as follows: reduced N (NH3, NH), oxidized N (HNO3, NO), S (SO2, SO), HCl, Na+, and Cl−.
Reduced N (NH3 and NH)
Broad differences in NH3 concentrations are observed between the grouped sites, with the largest concentrations at cropland sites, as expected, as these are intensively managed agricultural areas dominated by NH3 emissions (Fig. 7a). Borgo Cioffi (IT-BCi) is an ecosystem station located in a 15 ha field (arable crops) on the Sele Plain, an agricultural area with intensive buffalo farming in southern Italy, and this provided the highest 4-year average of 8.1 µg NH3–N m−3 (cf. group mean = 3.8 µg NH3–N m−3, n=10) (Table 4, Table S9). Next highest in this group are the German Gebesee (DE-Geb) and the Belgian Lonzée (BE-Lon) sites, with 4-year-average concentrations of 4.9 and 4.8 µg NH3–N m−3, respectively (Table S9). At Gebesee, a decrease in NH3 concentrations was observed over the 4-year period, falling almost 2-fold from an annual mean of 8.8 µg NH3–N in 2007 to 4.8 µg NH3–N in 2010 (Table S9). Annual mean concentrations in 2008 (2.9 µg NH3–N m−3) and 2009 (3.2 µg NH3–N m−3) were similar but smaller than in 2010. This illustrates the large inter-annual variability in concentrations that can occur even over a short time period. Variability between years may reflect the impact of changes in meteorological conditions on emissions from potential sources, with for example warmer, drier years increasing emissions and concentrations, contrasting with lower emissions and concentrations from the same source in a colder and wetter year. Episodic pollution events can also have a large influence on the annual mean concentration rather than the direct effects of changes in anthropogenic emissions over this short timescale. This suggests that for compliance assessment, an average over several years would provide a more robust basis than individual years. The assessment of trends also needs a longer time series of at least 10 years (Tang et al., 2018a, b; Tørseth et al., 2012; van Zanten et al., 2017).
Table 4Annual averaged concentrations of gas and aerosol concentrations, measured at all sites and at grouped sites classified according to each of the four ecosystem types in the NEU DELTA® network.
Grassland sites, with NH3 emissions from grazing and fertilizers, provided the next highest concentrations, with annual averaged concentrations of 2.2 µg NH3–N m−3 from the 10 sites in this group (Table 4). Cabauw in the Netherlands (NL-Cab) in this group was the second-highest NH3 concentration site in the DELTA® network, after Borgo Cioffi (IT-BCi), with a 4-year-averaged annual concentration of 5.9 µg NH3–N m−3 (Table S9). Unlike the Gebesee site (DE-Geb), annual NH3 concentrations were consistent between years at Cabauw, ranging from annual mean of 6.3 µg NH3–N m−3 in 2017 to 5.8 µg NH3–N m−3 in 2010 (Table S9).
At the clean end of the NH3 gradient are semi-natural and forest sites. The smallest concentrations were found at remote background sites in Russia (Fyodorovskoe bog, RU-Fyo) and the Scandinavian countries, in Finland (Lompolojänkkä FI-Lom, Hyytiälä FI-Hyy, Sodankylä FI-Sod), Norway (Birkenes, NO-Bir), and Sweden (Norunda SE-Nor, Skyytopr SE-Sky), where NH3 concentration at each site was < 0.3 NH3–N m−3 (Fig. 7, Table S9). By contrast, the semi-natural Horstermeer (NL-Hor) and forest sites Speulder (NL-Spe) and Loobos (NL-Loo) in the Netherlands gave concentrations that were 10-fold higher (2.9–4.1 µg NH3–N m−3) (Fig. 7, Table S9). This is consistent with much higher NH3 emission density in the Netherlands (4-year average = 3.4 kt NH3–N km−2 yr−1) (Fig. 9).
With the exception of the Czech Republic, the annual averaged NH3 concentrations scaled reasonably well with the 4-year-averaged mean NH3 emission density in each country (Figs. 9, 10a1, 10b1) (see also Sect. 3.3.2). In the Czech Republic, measurement was made at a single site, BKFores (CZ-BK1), located at a remote forest location. The 4-year-averaged emissions in the EMEP grid () containing the site are very small, at 2 t NH3–N yr−1, compared with an average of 68 t NH3–N yr−1 (range = < 0.01 to 567 t NH3–N yr−1) across the Czech Republic (Fig. S9). The low emissions, combined with the small concentrations measured at BKFores (0.5 µg NH3–N m−3), suggests it is highly likely to represent concentrations at the low end of the range of NH3 concentrations that might be expected to be encountered in the Czech Republic. By comparison, Belgium has a similar emission density to the Czech Republic, but the mean concentrations from three sites (2.6 µg NH3–N m−3) encompassed sites located in cropland areas (Lonzée BE-Lon, 4.7 µg NH3–N m−3) and forest sites (Braschaat BE-Bra, 2.8 µg NH3–N m−3, and Vielsalm BE-Vie, 0.4 µg NH3–N m−3) (Table S9).
The markedly high concentrations of NH3 across the NEU network indicates that contributions by emission and deposition of NH3 would be a major contributor to the effects of Nr on sensitive habitats. In comparing the annual averaged NH3 concentration with the revised UNECE “critical levels” of NH3 concentrations (Cape et al., 2009), the lower limit of 1 µg NH3 m−3 annual mean for the protection of lichens and bryophytes was exceeded at 63 % of sites (40 sites in 15 countries) (Table S10). Even the higher 3 µg NH3 m−3 annual mean for the protection of vegetation was still exceeded at 27 % of sites (17 sites in 10 countries) (Table S10). Most notably, all four sites from the Netherlands were in exceedance of both the 1 and the 3 µg NH3 m−3 thresholds. The large concentrations in the Netherlands highlight the high levels of NH3 that semi-natural and forest areas are exposed to within an intensive agricultural landscape, where 117 out of the 166 Natura 2000 areas were reported to be sensitive to nitrogen input (Lolkema et al., 2015). A recent assessment estimated that critical loads for eutrophication were exceeded in virtually all European countries and over about 62 % of the European ecosystem area in 2016 (EMEP, 2018). In particular, the highest exceedances occurred in the Po Valley (Italy), the Dutch–German–Danish border areas, and north-western Spain, where the highest NH3 concentrations have been measured in this network. Since NH3 is preferentially deposited to semi-natural and forests (high Vd to these ecosystem types; Sutton et al., 1995), then NH3 will dominate dry N deposition and exert the larger ecological impact. In Flechard et al. (2011), dry NH3–N deposition from the first 2 years of NH3 measurement in the NEU DELTA® network was estimated to contribute between 25 % and 50 % of total dry N deposition in forests, according to models. The fraction is larger in short semi-natural vegetation since Vd for NH and NO is smaller in short vegetation than in forests (Flechard et al., 2011).
Comparison with NH3 data from the Dutch LML network
The 4-year-averaged NH3 concentrations from the Dutch LML air quality network (see Sect. 2.7.1) for the period 2007 to 2010 are plotted alongside the NH3 measurements made at the four Dutch sites in the DELTA® network (Fig. 9a). The 4-year-averaged concentrations from the eight LML sites were between 1.5 and 15 µg NH3–N m−3, highlighting the high concentrations and spatial variability in concentrations in the Netherlands. The mean NH3 concentrations measured at the four Dutch sites in the DELTA® network of 2.9 µg NH3–N m−3 (Horstermeer, NL-Hors; semi-natural) to 5.9 µg NH3–N m−3 (Cabauw, NL-Cab; grassland) were within the range of concentrations measured in the Dutch LML network.
Comparison with NH3 data from the UK NAMN network
The 4-year-averaged NH3 concentrations calculated from the 72 sites in the NAMN (see Sect. 2.7.2) for the period 2007 to 2010 were smaller than the Dutch LML network, ranging from 0.05 to 6.7 µg NH3–N m−3, consistent with smaller NH3 emissions from the UK (Fig. 9a). In a joint collaboration between the UK and Dutch networks, inter-comparison of NH3 measurements by the DELTA® method (monthly) with the AMOR wet chemistry system (hourly; van Zanten et al., 2017) was carried out at the Zegweld site (ID 633) in the Dutch LML network (van Zanten et al., 2017) between 2003 and 2015. Good agreement was provided, lending support for comparability between the independent measurements reported in Tang et al. (2018a).
Particulate NH
Particulate NH concentrations across the 64 sites were more homogeneous than NH3, varying over a narrower range between 0.13 µg NH–N m−3 at Sodankylä (Finland, FI-Sod) and 2.1 µg NH–N m−3 at Borgo Cioffi (Italy, IT-BCi) (Fig. 7, Table S11). By comparison, the difference in NH3 between the smallest (0.07 µg NH3–N m−3 at Lompolojänkkä, Finland, FI-Lom) and largest (8.1 µg NH3–N m−3 at Borgo Cioffi, Italy, IT-BCi) concentrations varied by a factor of 110 (Fig. 7, Table S10). Secondary aerosols have longer atmospheric lifetimes and will therefore vary spatially much less than their precursor gas concentrations. While the concentrations of NH3 vary at a local to regional level owing to large numbers of sources at ground level and high deposition in the landscape, NH is less influenced by proximity to NH3 emission sources and varies in concentration at regional scales (Sutton et al., 1998; Tang et al., 2018a).
In Fig. 9, annual averaged NH concentrations (µg NH–N in Fig. 9e; nmol m−3 in Fig. 9g) are plotted with 4-year-averaged emissions densities for NH3, NOx, and SO2 from each country, with the combined total emission densities shown in ranked order. Regression analyses showed NH concentrations to be correlated with NH3 emissions (R2=0.36, p< 0.01, n=20) and NOx emissions (R2=0.27, p=0.02, n=20) but not with SO2 emissions (Table 3, Fig. S7). The smallest NH concentrations were in Sweden, Norway, and Finland (annual average < 0.3 µg NH–N m−3), with the lowest emissions of NH3, NOx, and SO2 and also the smallest concentrations of the precursors gases NH3 (< 0.3 µg NH3–N m−3), HNO3 (< 0.1 µg HNO3–N m−3), and SO2 (< 0.3 µg SO2–S m−3).
The UK and Irish sites have the next smallest NH concentrations of 0.4 and 0.5 µg NH–N m−3 (cf. mean of all countries = 0.74 µg NH–N m−3). Particulate NH data from the UK NAMN (Tang et al., 2018a) are also included for comparison. The 4-year-average concentrations from the 30 sites (0.5 µg NH–N m−3, range = 0.14 to 1.0 µg NH–N m−3) are comparable with the mean of 0.40 µg NH–N m−3 (range = 0.2 to 0.9 µg NH–N m−3) from just 4 sites in the NEU network. A combination of lower emissions of precursor gases (Fig. 9) and being farther away from the influence of long-range transport of NH aerosols from the higher-emission countries on mainland Europe may be contributing factors to the small NH concentrations measured in the UK and Ireland.
The largest national mean concentration of particulate NH (1.4 µg NH–N m−3) was measured in the Netherlands, which also has highest NH3 and NOx emissions (Fig. 9e). Indeed, the NH was matched by large NO concentration (0.9 µg HNO3–N m−3) (Fig. 9e), lending support to the contribution of NH4NO3 to the NH and NO load, together with contribution from (NH4)2SO4 (0.6 µg SO–S) (Fig. 9f). The particulate NH concentrations measured in Italy (mean = 1.0 µg NH–N m−3) (Fig. 9e), which includes the site in the Po Valley (IT-PoV) with a mean concentration of 1.9 µg NH–N m−3 (Table S11), are comparable with an assessment of PM2.5 composition at four sites in the Po Valley (Ricciardelli et al., 2017).
Oxidized N (HNO3 and NO)
The percentage mass contribution of oxidized N (sum of HNO3 and NO; µg N m−3) to the total gas and aerosol species measured was on average 13 % (range = 2 %–24 %) (Fig. 8). This compares with 41 % (range = 17 %–70 %) from reduced N (sum NH3 and NH; µg N m−3) and 23 % (range = 7 %–53 %) from sulfur (sum of SO2 and SO; µg S m−3) (Fig. 8). DELTA® measurements of HNO3 also include contributions from co-collected oxidized N species such as HONO (see Sect. 2.2.3) and are therefore an upper estimate that may in some cases be twice as large as the actual HNO3 concentration, based on observations in the UK (Tang et al., 2018b; correction factor of 0.45) and from the parallel DELTA® measurements made at Fougéres (FR-FgsP) (Fig. S5). At this site, HNO3 measurement with NaCl-coated denuders provided an annual mean concentration of 0.08 µg HNO3–N m−3, compared with 0.19 µg HNO3–N m−3 measured on carbonate-coated denuders from the main site (FR-Fgs) (Table S7). With this caveat in mind, uncorrected annual mean HNO3 concentrations were in the range of 0.03 µg HNO3–N at Kaamenan (Finland; FI-Kaa) to 0.47 µg HNO3–N at Braschaat (Belgium; BE-Bra) (Table S7). In Fig. 9b, HNO3 concentrations are compared with NOx emissions, the precursor gas for secondary formation of HNO3. Overall, a weak but significant correlation was observed between concentrations of HNO3 and NOx emission densities across the 20 countries (R2=0.2, p< 0.05) (Fig. 10b, Table 3, Fig. S2). Russia has the lowest NOx emission densities (0.04 t NOx–N yr−1), but HNO3 from the single site (0.15 µg HNO3–N m−3) is larger than the smallest concentrations measured in Finland, Norway, and Sweden (annual average < 0.1 µg HNO3–N m−3). HNO3 formation by photochemical processes may be enhanced in hotter, sunnier summer weather in Russia. Since SO2 concentrations (mean = 0.49 µg SO2–S) at the Russian site (RU-Fyo) are in molar excess over the low levels of NH3 (mean = 0.32 µg NH3–N m−3), removal of HNO3 by reaction with NH3 will also be limited. HNO3 concentrations in the UK and Ireland are marginally higher than the Scandinavian countries. Here, the annual averaged concentrations of HNO3 are similar (0.10 vs. 0.09 µg m−3) (Table S12), despite NOx emissions density (t km−2 yr−1) in the UK being 3 times larger than in Ireland (Fig. 9b). HNO3 concentrations on the European continent were generally higher (0.2–0.4 µg HNO3–N m−3).
In the UK, HNO3 data are also available on a wider spatial scale from the AGANet (Sect. 2.7.2; Tang et al., 2018b). The 4-year-average concentrations of HNO3 from 30 sites in the AGANet are plotted alongside the NEU HNO3 data from the four UK sites in its network in Fig. 9b. The UK HNO3 data on the UK-AIR database (https://uk-air.defra.gov.uk/, last access: 25 November 2019) have been corrected for HONO interference with a 0.45 correction factor (see Tang et al., 2018b). For consistency in Fig. 9b, the UK raw uncorrected HNO3 data are used for the present comparison. The 30-site mean (0.17 µg HNO3–N m−3) was higher than from just 4 UK sites in the NEU network (0.10 µg HNO3–N m−3). The range of concentrations was also wider, from 0.03 µg HNO3–N m−3 at a remote background site in Northern Ireland to 0.77 µg HNO3–N m−3 at a central London urban site, where interference from HONO and NOx in HNO3 determination is likely to be larger (Tang et al., 2015; 2018b).
Like particulate NH, NO concentrations are also correlated with emission densities of NH3 (R2=0.57, p< 0.001, n=20) and NOx (slope = 0.15, R2=0.44, p< 0.01, n=20) but not with SO2 (Table 3, Fig. S7). The smallest NO concentrations were again in Sweden, Norway, and Finland with low NH3 and NOx emissions and also smallest concentrations of HNO3, SO2, and NH in the network (Fig. 9). The largest NO concentrations were measured in the Netherlands, with a mean of 0.92 µg NO–N m−3, compared with a network average of 0.39 µg NO–N m−3 (Fig. 9e, Table S13). The higher NO concentrations correlated well with the high NH3, HNO3, and NH concentrations in the Netherlands (Fig. 9). This suggests that concentrations of NO are linked to local formation of NH4NO3, which is dependent on concentrations of NH3 and HNO3, and also to the influence of meteorology on transport of NH4NO3 between countries on mainland Europe and export out of Europe. Countries in Scandinavia such as Sweden, Norway, and Finland and in the British Isles are farthest from the influence of long-range transboundary transport from Europe, with concentrations of NH4NO3 that are smaller than on the continent.
Sulfur (SO2 and SO)
Annual averaged SO2 concentrations measured across the network were between 0.9 and 2.3 µg SO2–S m−3 (Fig. 9c, Table S14). By comparison, the EMEP network of 58 urban-background sites reported annual mean concentrations of 0.03 and 5.5 µg SO2–S m−3 over the same period, with the largest SO2 concentrations from North Macedonia and Serbia. Since these high-emitting countries were not included in the DELTA® network, the range of SO2 concentrations is smaller. Together, the small SO2 concentrations reflect the substantial reductions in SO2 emissions across Europe (−74 % between 1990 and 2010) and large reductions in ambient concentrations and deposition of sulfur species across Europe during the last decades (EMEP, 2016).
SO2 concentrations were also correlated with SO2 emission density (R2=0.65, p< 0.001, n=20) in each country (Fig. 10c, Table 3). The smallest and largest SO2 annual average concentrations corresponded with the lowest emissions in Norway and highest in the Czech Republic (Fig. 9c). By contrast, SO2 concentrations from the only measurement site, Bugac, in Hungary (HU-Bug) are much higher than expected on the basis of SO2 emission density estimated for the country. This suggests that Bugac is likely to be affected by proximity to sources. This contrasts with the BKFores site in the Czech Republic (CZ-BK1), which had smaller NH3 concentrations due to its location away from sources.
Following emission, SO2 disperses and undergoes chemical oxidation in the atmosphere to form SO both in the gas phase and in cloud and rain droplets (Baek et al., 2004; Jones and Harrison, 2011). Particulate SO produced is generally associated with NH and NO (see Sect. 3.4). The regional pattern of SO was similar to, and correlated well with, particulate NH and NO (Fig. 9g), suggesting well-mixed air on the continent since (NH4)2SO4 is stable and long-lived. Countries in the British Isles (UK and Ireland) and in Scandinavia (Sweden, Norway, Finland) have smaller concentrations of SO (Table S15). They are located far enough away from sources and activities on continental Europe such that they are less influenced by the emissions from central Europe.
As discussed earlier, particulate NH and NO concentrations were smallest in the Scandinavian countries, which corresponded with low emission densities of the precursor gases NH3 and NOx. By analogy, since these countries also have the lowest emission densities of SO2 (Fig. 9c), particulate SO concentrations would be expected to be similarly low. Particulate SO in Finland and Norway (mean = 0.34 µg SO–S m−3) and Sweden (mean = 0.37 µg SO–S m−3) were however comparable with concentrations on mainland Europe (range = 0.33 to 1.0 µg SO–S m−3) and larger than the UK (0.18 µg SO–S m−3) and Ireland (0.24 µg SO–S m−3) (Fig. 9f). An ion balance check on the ratio of equivalent concentrations of NH to the sum of NO and SO (see Sect. 3.4) was less than 0.5. Since NH is a counter-ion to NO and SO formation, the imbalance suggests that SO concentrations may be overestimated at the sites in Sweden, Norway, and Finland.
HCl, Cl−, and Na+
The average concentrations of HCl across the network were of low magnitude, with limited variability, ranging from 0.07 in Russia to 0.36 µg HCl–Cl− m−3 in Portugal (Fig. 9d). At a site level, HCl concentrations varied between 0.06 at Renon (Italy; IT-Ren – inland location) to 0.48 µg HCl–Cl− m−3 at Espirra (Portugal, PT-Esp – coastal location) (Table S16). In the UK AGANet network, the highest concentrations of HCl were found in the source areas in the south-east and south-west of England and also in central England, north of a large coal-fired power station (Tang et al., 2018b). HCl emissions and concentrations in the atmosphere are mostly derived from combustion of fossil fuels (coal and oil), biomass burning, and the burning of municipal and domestic waste in municipal incinerators (Roth and Okada 1998; McCulloch et al., 1999; Ianniello et al., 2011). Several manufacturing processes, including cement production, also emit HCl (McCulloch et al., 1999). At coastal sites, HCl released from the reaction of sea salt with HNO3 and H2SO4 can be a significant source (Roth and Okada 1998; Keene et al., 1999; McCulloch et al., 1999; Ianniello et al., 2011). UK is the only country with available HCl emission estimates (https://naei.beis.gov.uk/data/, last access: 3 January 2020). Emissions of HCl in the UK (mainly from coal burning in power stations) have declined to very low levels, from 74 kt in 1999 to 5.7 kt in 2015. The 4-year-averaged emission density for HCl for the period 2007 to 2010 was just 0.05 tonnes HCl–Cl− km−2 yr−1, although HCl emissions could still pose a threat to sensitive habitats close to sources (Evans et al., 2011). The low HCl concentrations measured in the network would suggest that the shift in Europe's energy system from coal to other sources has contributed to low HCl emissions (UK) and concentrations (observed across the network).
Particulate Cl− on the other hand is predominantly marine in origin, with sea salt (NaCl) as the most significant source (Keene et al., 1999). Molar concentrations of Cl− and Na+ are seen to be similar in most countries, demonstrating close coupling between the two components (Fig. 9h). The largest concentrations of Na+ and Cl− occurred in coastal countries such as the UK, Ireland, Netherlands, and Portugal, with the highest of country-averaged annual concentrations of 1.6 µg Cl− m−3 and 0.9 µg Na+ m−3 from Ireland (Tables S16 and S17). Data from the 30 sites in the UK AGANet network showed a wider range of Cl− and Na+ concentrations (Fig. 9h). The AGANet site with the largest 4-year-averaged annual concentrations of 3.8 µg Cl m−3 and 2.0 µg Na+ m−3 is Lerwick from the east coast of the Shetland Islands, exposed to the North Atlantic.
Farther away from the coastal influence of marine aerosol, the smallest concentrations of Cl− and Na+ were measured in landlocked countries such as Germany (mean of all sites = 0.27 µg Cl− m−3 and 0.15 µg Na+ m−3). Concentrations in Hungary, Poland, the Czech Republic, and Russia were also low, but inferences about these countries are necessarily limited by measurements at a single site in each of these countries. At coastal sites in Norway (NO-Bir) and Sweden (SE-Nor and SE-Sk2), the very low particulate Cl− concentrations (< 0.1–0.3 µg m−3) and high Na : Cl molar ratios (3–5) are anomalous. It is possible for sea salt to be depleted in Cl− (through the loss of HCl gas) by the reaction of NaCl particles with atmospheric acids (Finalyson-Pitts and Pitts, 1999; Keene et al., 1999), leading to high Na : Cl ratios for sea salts transported over long distances. The coastal locations of these sites (Fig. 2) suggest that they are more likely to be influenced by freshly generated marine aerosols (cf. coastal sites in UK and Ireland), and larger concentrations of sea salt (Na+ and Cl−) and a 1:1 relationship between Na+ and Cl− are expected. The Cl− concentrations are likely to be underestimated at these sites (see Sect. 3.2.3) and are further discussed in the next section (Sect. 3.4).
3.4 Correlations between gas and aerosol components
Regression analyses were carried out between the mean molar-equivalent concentrations of all inorganic gas and aerosol components measured at each site (n=66; Fr-FgsP and UK-AMoP excluded) in the NEU network, with summary statistics provided in Table 5. With the exception of SO2 vs. HCl (R2=0.05, p> 0.05), the gases were positively correlated with each other, possibly due to similarities in the regional distribution of their emissions and concentrations. Comparing the mean molar concentrations of NH3 with SO2 and HNO3 showed that NH3 was on average 6-fold and 7-fold higher, respectively, whereas molar concentrations of SO2 and HNO3 were similar (Table 6, Fig. 12). The molar ratio of NH3 to the sum of all acid gases (SO2, HNO3, and HCl) was on average 3 (Table 6, Fig. 12), confirming that there is a surplus of the alkaline NH3 gas to neutralize the atmospheric acids in the atmosphere, similar to that observed in the UK (Tang et al., 2018b). With the more substantial decline in emissions of SO2, compared with a more modest reduction in NOx, the concentrations of SO2 are at a level where it is no longer the dominant acid gas, such that HNO3 and HCl are together contributing a larger fraction of the total acidity in the atmosphere in the present assessment.
Table 5Regression correlations (R2) between the mean molar concentrations (nmol m−3) of gas and aerosol components at sites (n= 66) in the NEU DELTA® network.
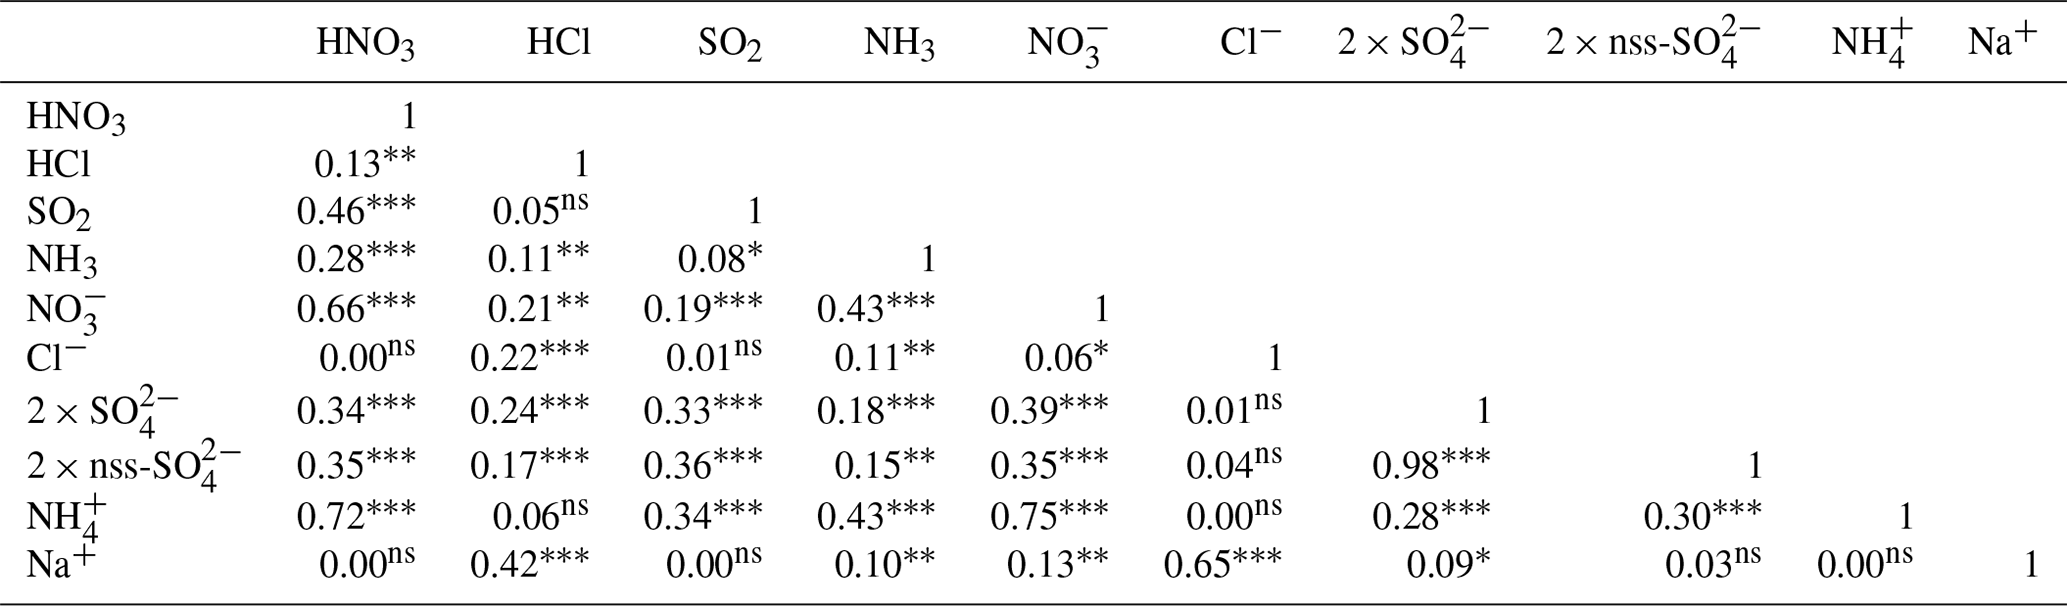
Significance level: * p < 0.05, p < 0.01, p < 0.001; ns: non-significant (p > 0.05).
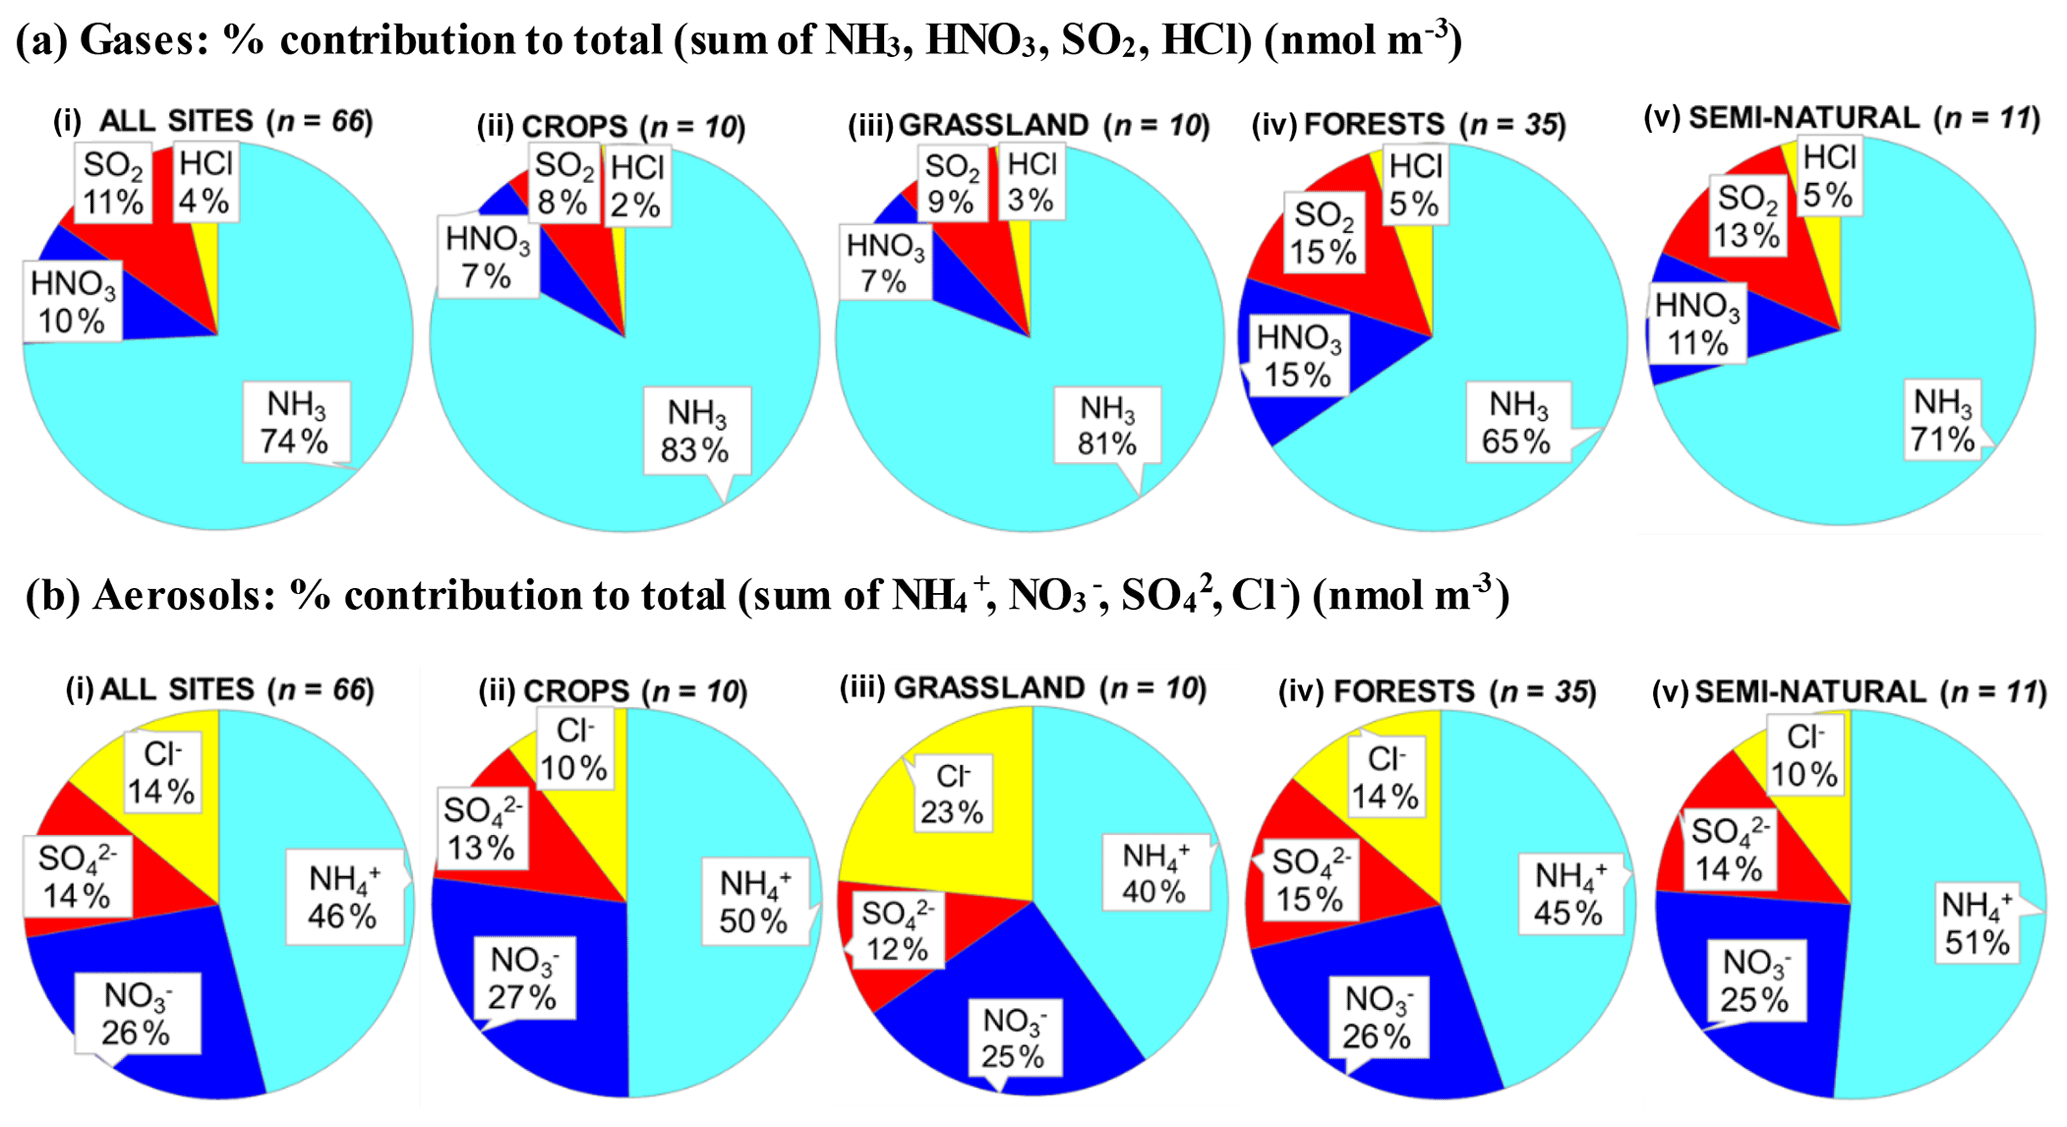
Figure 12Pie charts of mean relative proportions of (a) gases (NH3, HNO3, SO2, HCl) and (b) aerosols (NH, NO, SO, Cl−). Data are annual averaged concentrations (nmol m−3) measured at NEU DELTA® sites for (i) all sites (n= 66) and sites grouped according to ecosystem types, (ii) crops (n= 10), (iii) grassland (n= 10), (iv) forests (n= 35), and (v) semi-natural (n= 11). UK-AMoP (parallel DELTA® at Auchencorth: NH3 and NH only) and FR-FgsP (parallel DELTA® at Fougéres: different sample train) were excluded in this analysis.
In the aerosol phase, NH correlated well with NO (R2=0.75, p< 0.001; Fig. 13a) and SO (R2=0.75, p< 0.001; Fig. 13b) (Tables 5 and 7) but not with Cl− (Table 5). Regression of the molar-equivalent concentrations of the sum of NO and SO against NH shows points close to the 1:1 line (slope = 0.84) and significant correlation (R2=0.64, p< 0.001), which demonstrates the close coupling between the base NH and the acid NO + SO aerosols (Fig. 13c, Table 7). The reaction of NH3 with H2SO4 is irreversible (i.e. “one-way”) under atmospheric conditions (Baek et al., 2004; Finlayson-Pitts and Pitts, 1999; Jones and Harrison, 2011; Huntzicker et al., 1980), whereas any NH4NO3 or NH4Cl that is formed can dissociate to release NH3, which can then be “removed” by reaction with H2SO4. The lack of correlation between NH and Cl− (R2=0.00; Table 5) in the analysis suggests that NH is mainly associated with NO and SO.
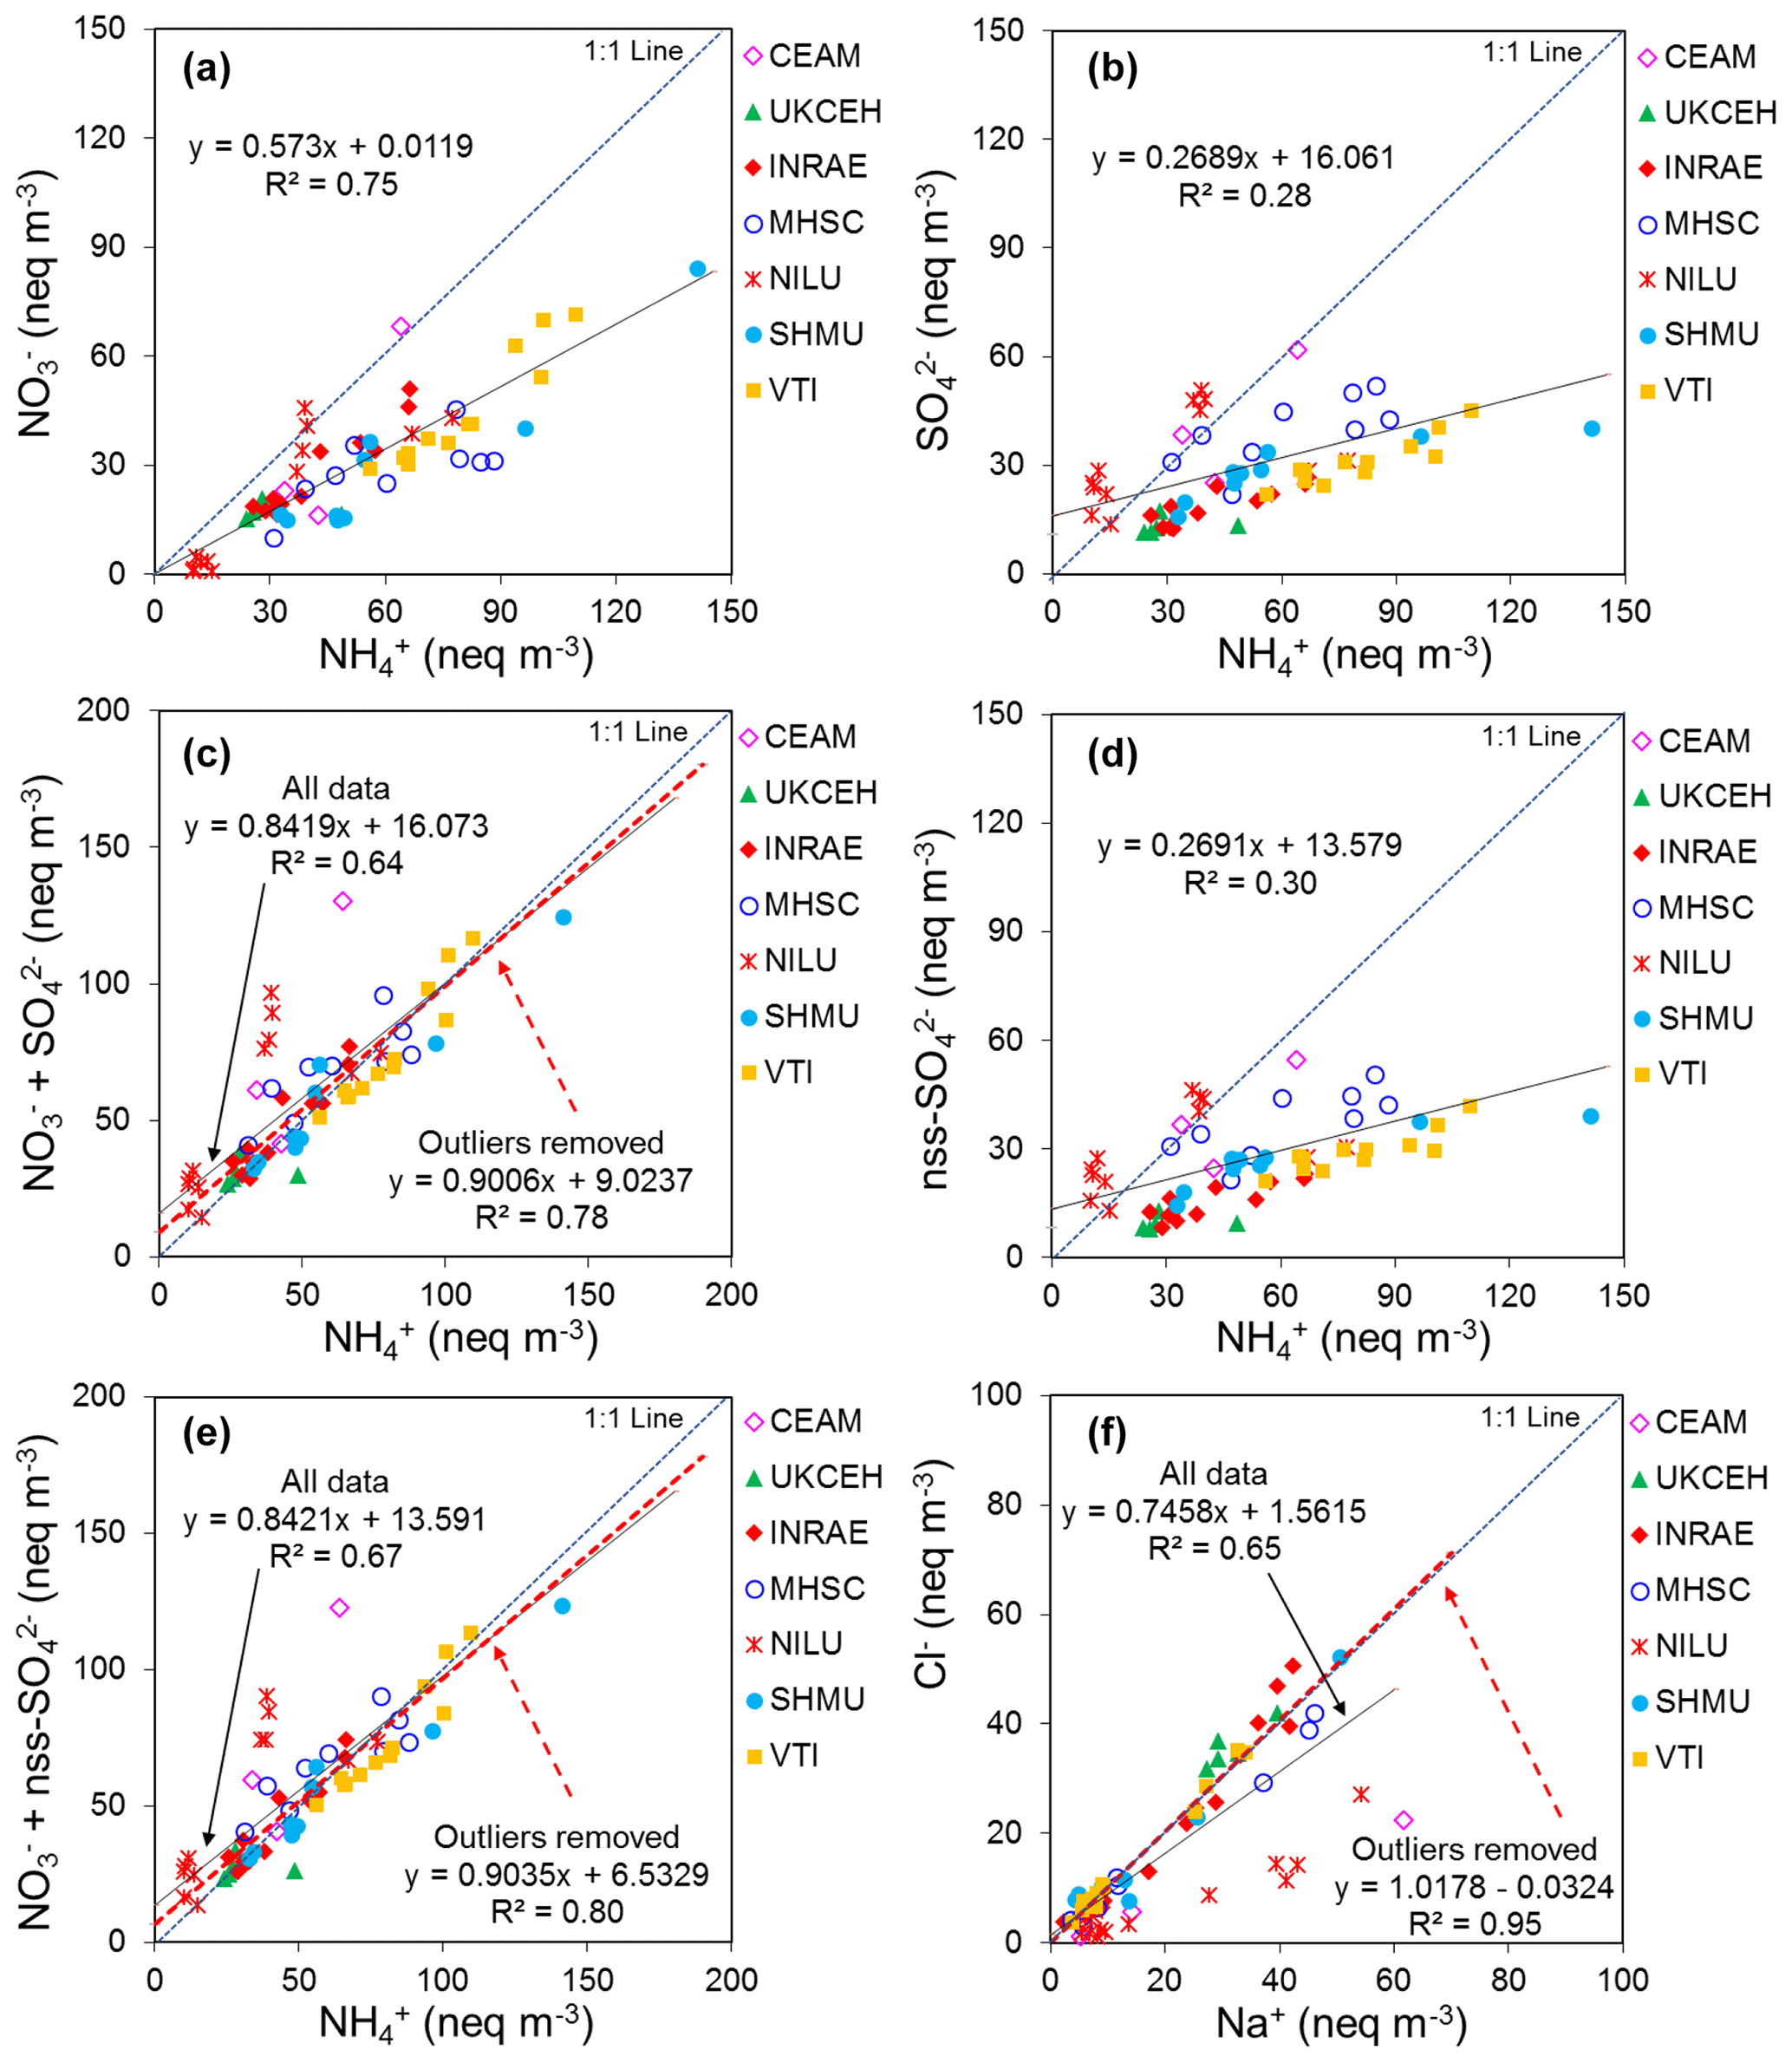
Figure 13Regression plots between mean molar-equivalent concentrations of (a) NH and NO, (b) NH and SO, (c) NH and sum (NO SO), (d) NH and nss-SO, (e) NH and sum (NO nss-SO), and (f) Na+ and Cl−, measured in the NEU DELTA® network. Each data point represents the mean of all monthly measurements at each site, with different coloured symbols for each laboratory making the measurements. Outliers: where equivalent concentrations of NH: sum (anions) < 0.5 and Na : Cl > 2.
Particulate Cl− was correlated with Na+ (R2=0.65, p< 0.001) (Fig. 13f, Tables 5, 7), consistent with observations that NaCl in atmospheric aerosols is mainly sea salt in origin (O'Dowd and de Leeuw, 2007; Tang et al., 2018b). Like the precursor gases, the molar concentrations of particulate NH are larger than either NO or SO (Fig. 12, Table 8). Particulate NO concentrations were on average 2-fold higher than particulate SO (on a molar basis) so that there was twice as much NH4NO3 (Fig. 13a) as (NH4)2SO4 (Fig. 13b). The shift in PM composition from (NH4)2SO4 to NH4NO3 across Europe is well documented (Bleeker et al., 2009; Fowler et al., 2009; Tang et al., 2018b; Tørseth et al., 2012).
Table 6Mean molar concentrations of gases and NH3: acid gas ratios measured at sites (n= 66) in the NEU DELTA® network.
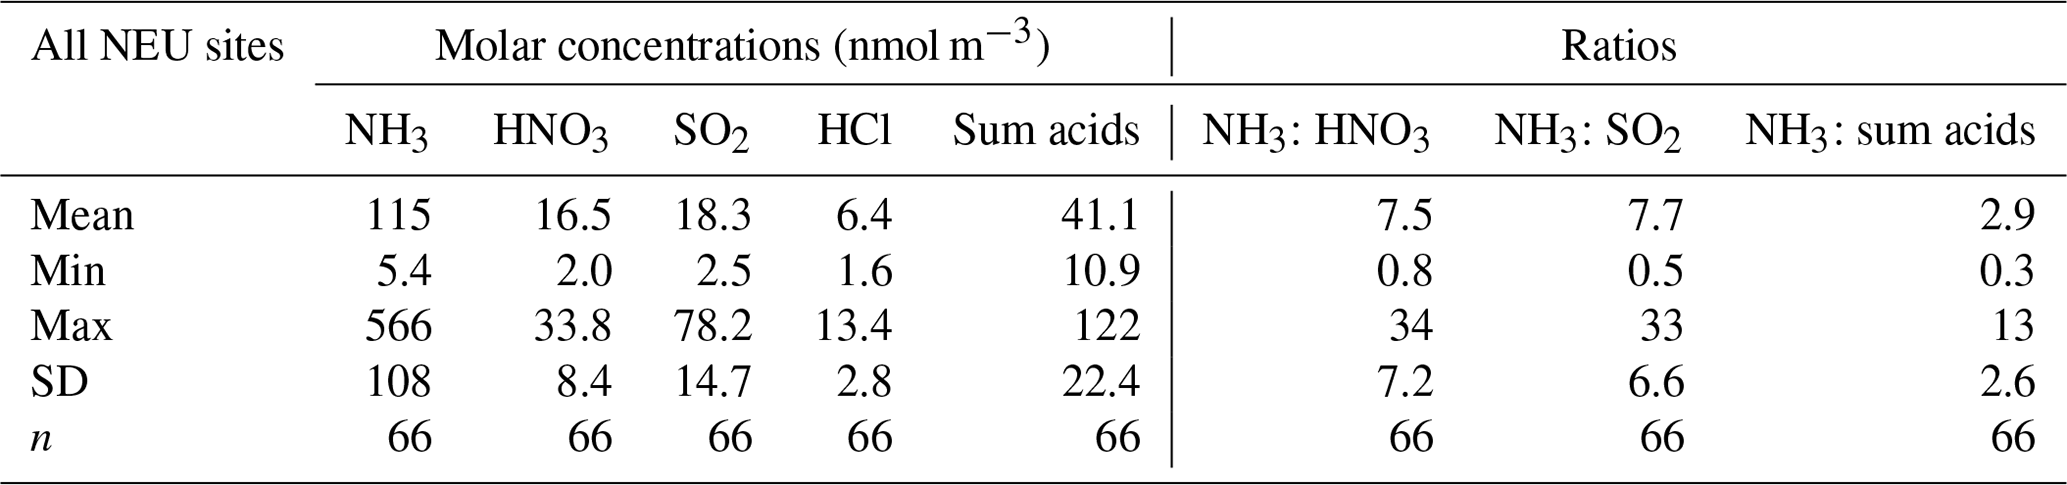
Table 7Linear regressions between the mean molar-equivalent concentrations of aerosol components (nanoequivalent, neq m−3) at sites (n= 66) in the NEU DELTA® network.
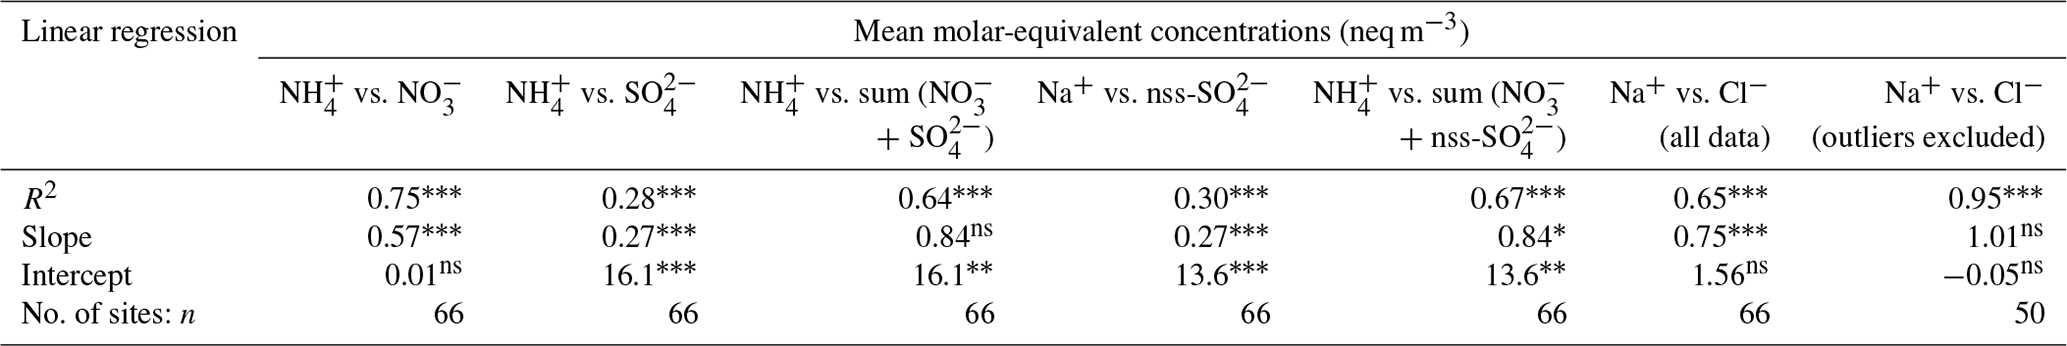
Significance level: * p < 0.05, p < 0.01, ; ns: non-significant (p > 0.05).
Table 8Mean molar concentrations of aerosols and ratios measured at sites (n= 66) in the NEU DELTA® network.
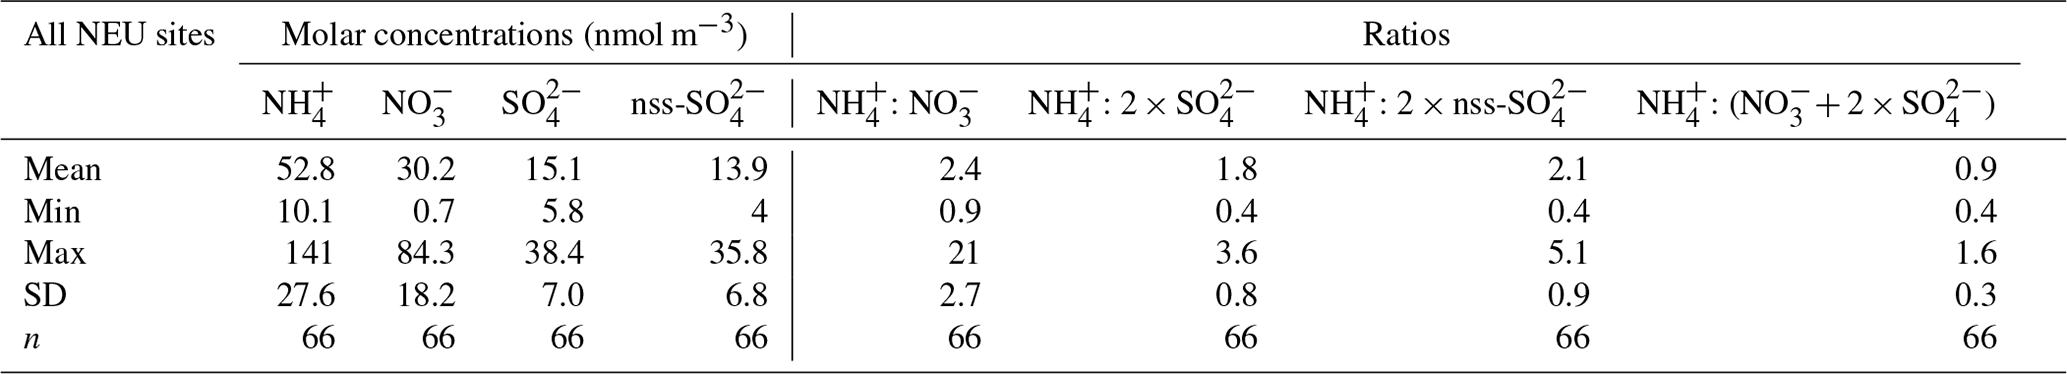
Non-sea-salt SO (nss-SO) was also estimated from the SO and Na+ data (see Sect. 2.2.1). The nss-SO is estimated to comprise on average 25 % (range = 3 %–83 %, n=187) of the measured total SO aerosol (Table 8). This demonstrates that sea salt SO (ss-SO) aerosol makes up a large and variable fraction of the total SO measured, consistent with observations of the contribution by ss-SO to the total SO in precipitation observed in the wet-deposition measurements in this study (Fig. 11) and across Europe (ROTAP, 2012). Regression of nss-SO vs. NH (slope = 0.27, R2=0.30) was not significantly different from the regression of SO vs. NH (slope = 0.27, R2=0.28) (Table 5). This suggests that NH is mainly associated with the nss-SO.
Correlation between NH and the sum of anions (NO+ SO) is an important point of discussion (Table 7) as the ion balance serves as a quality check for the aerosol measurement. Due to some outliers in the comparison, the correlation between NH and SO (R2=0.28; Fig. 13b) is weaker than between NH and NO (R2=0.75; Fig. 13c, Table 7). The outliers were measurements made by NILU and CEAM, although these vary according to monitoring locations. The NILU laboratory made DELTA® measurements for 16 sites in six different countries (Belgium, Denmark, Finland, Norway, Sweden, and Switzerland). At three sites (Kaamanen, FI-Kaa; Laegern, CH-Lae; Oensingen, CH-Oe1), the ion balance of equivalent concentrations of NH : sum (NO+ SO) was 1.0, whereas the ratios at the other 13 sites were between 0.4 and 0.7. The CEAM laboratory made measurements for all three sites in Spain. For CEAM, the ion balance ratio at Vall de Aliñá (ES-VDA) was 1, whereas the other two sites had ratios of 0.5 and 0.6.
Removal of the outlier NILU (7 out of 16) and CEAM (1 out of 3) data points with ion balance ratio < 0.5 improved both the slope (new slope = 0.90) and correlation (new R2=0.78) (Fig. 13c). This indicates either an over-read of the anions (NO, SO) or under-read of NH concentrations by the two laboratories at some sites. Results reported by NILU in the DELTA® field inter-comparisons (Sect. 3.2) showed that, with the exception of a few high NH and NO readings, there was on average no overall bias in the NH, NO, or SO measurements by the NILU laboratory that could account for the high SO outliers in the regression (Fig. 13). An inspection of individual monthly site data reported by NILU showed that 15 % of aerosol NH and 17 % of NO concentrations were below 0.1 µg m−3, compared with only 0.7 % of all SO data. This then points to a potential under-read in NH and NO. Possible reasons include
- i.
loss of NH, NO from filters (e.g. microbial degradation);
- ii.
non-capture on the aerosol filters (e.g. aerosol filters installed wrong way around);
- iii.
filters mixed up and wrong analysis performed on the acid- and base-coated filters;
- iv.
high blanks subtracted from already low concentrations at clean sites.
Possibilities still remain, however, of a potential over-read of SO. The ion balance checks suggest increased uncertainty in the NH, NO, and SO measurements for seven sites: Hyytiälä (FI-Hyy), Sodankylä (FI-Sod), Rimi (DK-Rim), Risbyholm (DK-Ris), Soroe (DK-Sor), Skyttorp (SE-Sk2), and Vielsalm (BE-Vie). Examination of monthly site data from CEAM showed only 1.5 % of aerosol NH and 0.8 % of NO concentrations below 0.1 µg m−3, whereas all SO data were above 0.1 µg m−3. For the CEAM lab, the uncertainty in NH, NO, and SO measurements affected two sites: El Saler (ES-Els) and Las Majadas (ES-Lam) (see also Sect. 3.3.3).
The regression of Na+ and Cl− also showed the majority of data points close to the 1:1 line but with a small group of outliers below the 1:1 line from the CEAM and NILU laboratories (Fig. 13f). Both laboratories performed well in laboratory PT schemes (Sect. 3.1), with more than 80 % of reported data agreeing within ±10 % of reference values in both Na+ and Cl− and no bias in the analytical method. The outliers in the ion balance therefore suggests some problems with Na+ and Cl− determination on the DELTA® aerosol filters. Na+ and Cl− data for some of the field DELTA® inter-comparisons were omitted from submissions by CEAM and NILU, and submitted data were in poor agreement with other laboratories (Sect. 3.2). Further regression analyses were carried out on individual monthly data, with sites grouped according to measurements made by each of the seven laboratories (Fig. S11). Regressions for CEAM and NILU show the vast majority of data points below the 1:1 line, indicating a systematic underestimation of particulate Cl− concentrations. The other five laboratories (INRAE, MHSC, SHMU, UKCEH, and vTI) all have data points close to the 1:1 line, with larger scatter both above and below the 1:1 line at lower concentrations. In Fig. 13f, a new regression line has therefore also been fitted, where outlier data with Na : Cl ratios > 2 from NILU (13 out of 16 sites) and CEAM (all 3 sites) have been removed. Exclusion of the outlier data points provided a regression line that is not significantly different from unity (slope = 1.02), with an R2 value of 0.95 (p< 0.001). The near-1:1 relationship between particulate Na+ and Cl− is consistent with their origin from sea salt (NaCl).
The ion balance checks, together with the regular PT exercises and field inter-comparisons, therefore provided the platform against which to assess data quality and comparability of measurements between laboratories. This shows that overall, with the exception of a few identified outlier measurements, the laboratories are performing well and providing good agreement.
3.5 Seasonal variability in gases and aerosol
The time series of monthly averaged concentrations for the period 2006 to 2010 have been plotted to examine seasonality in the different gas and aerosol components according to ecosystem types (crops, grassland, semi-natural, and forests) (Fig. 14) and geographical regions (Fig. 15). Distinct seasonality was observed in the data, influenced by seasonal changes in emissions, chemical interactions, and the influence of meteorology on partitioning between the main inorganic gases and aerosol species.
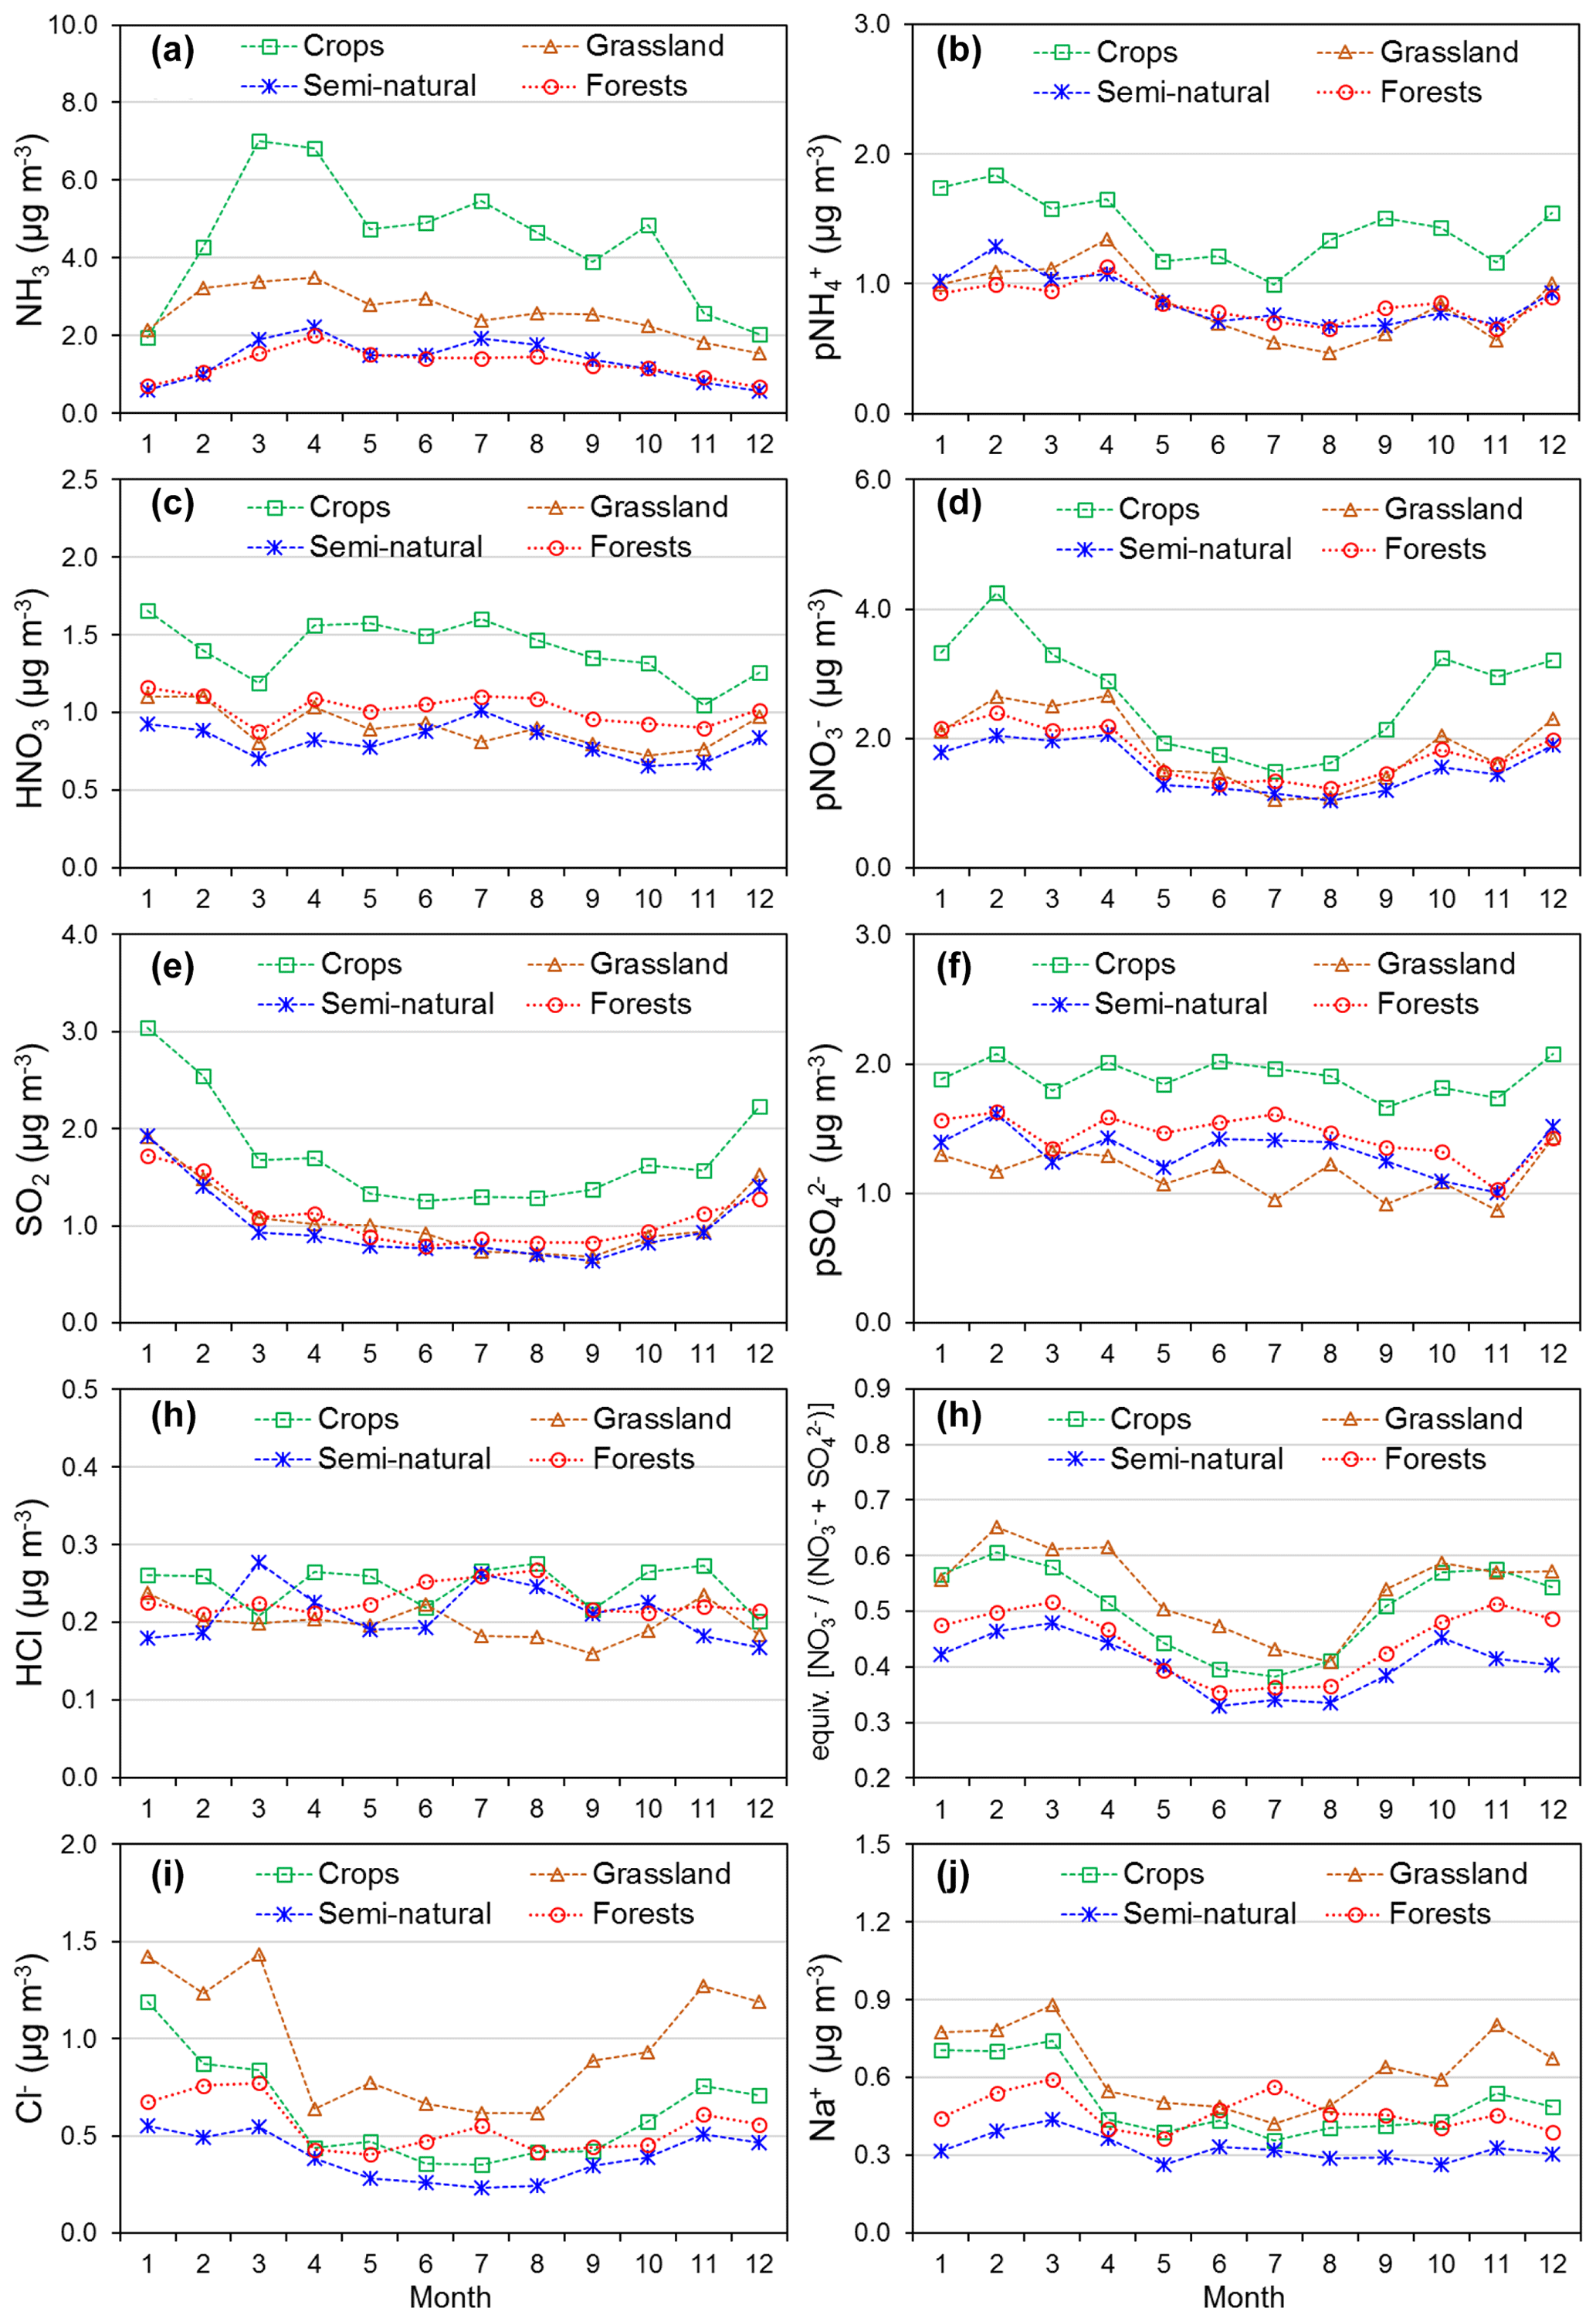
Figure 14Seasonal variability in atmospheric gas (a) NH3, (c) HNO3, (e) SO2, (g) HCl) and aerosol concentrations (b) pNH, (d) pNO, (f) pSO, (i) pCl−, (j) pNa+ (p in front of component name denotes particulate). Each data point is the monthly averaged concentrations of grouped sites for the period 2006 to 2010, classified according to four ecosystem types: crops (n= 10), grassland (n= 10), semi-natural (n= 11), and forests (n= 35). Graph (h) shows the monthly mean ratio of molar-equivalent (equiv.) concentrations of NO to sum (NO SO). Month 1: January; Month 12: December.
3.5.1 NH3
Distinctive and contrasting features in the seasonal cycle are observed, with the largest concentrations at cropland sites and smallest at semi-natural and forest sites (Fig. 14a). Similar to those observed in the annual mean concentrations (Fig. 9, 11), the monthly concentrations are also smallest in northern Europe and largest in western Europe (Fig. 15a).
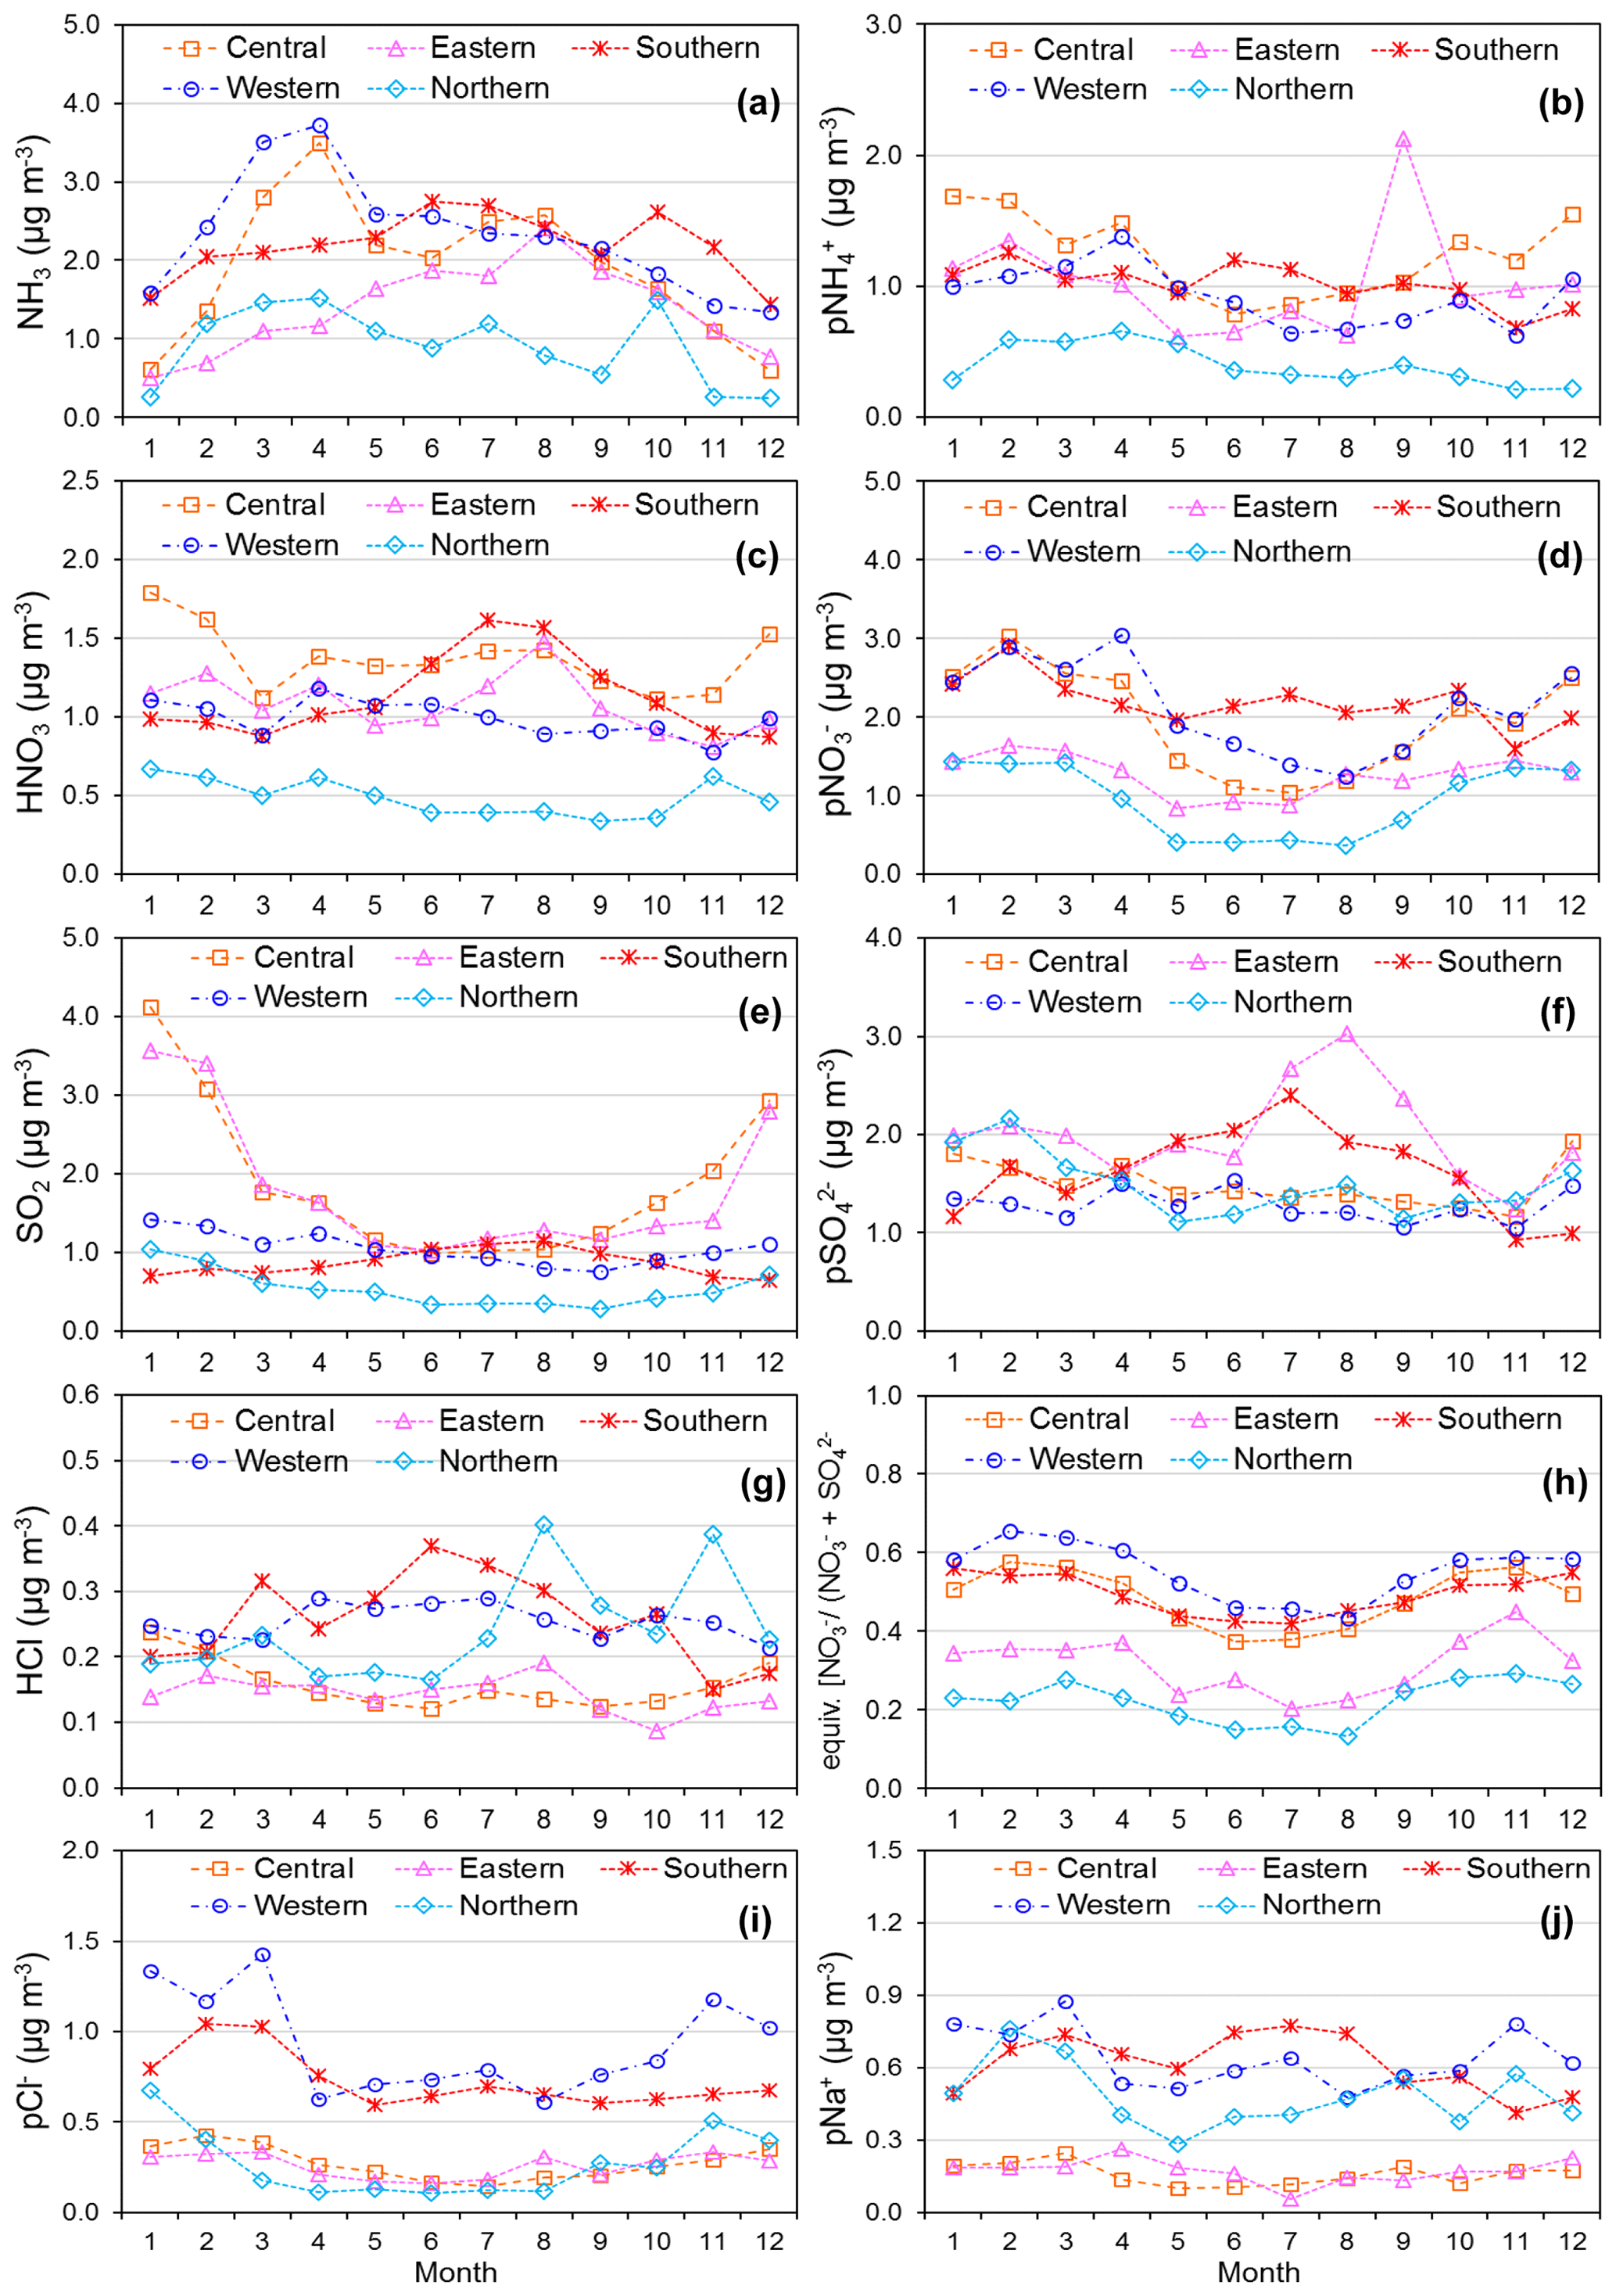
Figure 15Seasonal variability at sites grouped according to European regions in atmospheric gas (a) NH3, (c) HNO3, (e) SO2, (g) HCl) and aerosol concentrations (b) pNH, (d) pNO, (f) pSO, (i) pCl−, (j) pNa+ (p in front of component name denotes particulate). Each data point is the monthly averaged concentrations of grouped sites for the period 2006 to 2010, classified according to five European regions: central (n= 17), eastern (n= 2), northern (n= 11), southern (n= 12), and western (n= 26). Graph (h) shows the monthly mean ratio of molar-equivalent (equiv.) concentrations of NO to sum (NO SO). Month 1: January; Month 12: December.
Semi-natural sites
There are two distinct peaks in the seasonal cycle of grouped semi-natural sites: in April (mean = 2.2 µg NH3 m−3, n=12) and in July (mean = 1.9 µg NH3 m−3, n=12) (Fig. 14a). Since these sites are located away from agricultural sources, the seasonality in NH3 concentrations is mostly governed by changes in environmental conditions and regional changes in NH3 emissions. The differences in concentrations between the summer and winter at these sites were by a factor of 3, with the smallest concentrations in wintertime (December and January), when low temperatures and wetter conditions decrease NH3 emissions from regional agricultural sources while favouring a thermodynamic shift from gaseous NH3 to the aerosol NH phase. Conversely, warm, dry conditions in summer increases surface volatilization of NH3 from low-density grazing livestock and wild animals and favour a thermodynamic shift to the gaseous (NH3) phase, producing the summer peak. Vegetation is another potential source at these background sites under the right conditions (Flechard et al., 2013; Massad et al., 2010). A complex interaction between atmospheric NH3 concentrations and vegetation can lead to both emission and deposition fluxes, known as “bidirectional exchange”, dependent on relative differences in concentrations. This process is controlled by the so-called “compensation point”, defined as the concentration below which growing plants start to emit NH3 into the atmosphere (Flechard et al., 1999; Massad et al., 2010; Sutton et al., 1995). At sites distant from intensive farming and emissions, the bidirectional exchange with vegetation will partly control NH3 concentrations. Inclusion of bidirectional exchange in dispersion modelling of NH3 by incorporating a “canopy compensation point” is shown to improve model results for NH3 concentrations in remote areas (e.g. Smith et al., 2000; Flechard et al., 1999, 2011; Massad et al., 2010). The larger peak in April at these sites on the other hand suggests the influence of emissions from agricultural sources, e.g. from land spreading of manures.
Forest sites
The average seasonal cycle from the forest sites is similar to that of the semi-natural sites but diverged over the summer months (Fig. 14a). Here, the seasonal profile is characterized by the absence of any peaks in summer, with concentrations plateauing between May and August. Studies have shown that atmospherically deposited N is taken up by forest canopies since growth in forest ecosystems is commonly limited by the availability of N (Sievering et al., 2007), and tree canopies are a potential sink for atmospheric NH3 (Fowler et al., 1989; Theobald et al., 2001). The capture and uptake of NH3 during the growing seasons over the summer period could therefore account for the absence of a summer peak in NH3 concentrations at forest monitoring sites, although a similar effect would also be expected for semi-natural sites.
Cropland sites
Fertilizers and arable crops are significant sources of NH3 emissions and concentrations in an intensive agricultural landscape. Sites in this group showed considerably higher monthly mean monitored NH3 concentrations than the other groups (Fig. 14a). A more complex seasonal pattern can be seen, with three peaks in NH3 concentrations. Concentrations here are also lowest in the winter, although the wintertime concentrations are 3 times larger than semi-natural and forest sites, reflecting the elevated regional background in NH3 concentrations located within agricultural landscapes. This rises rapidly with improving weather conditions and peaks in the spring to coincide with the main period for manure spreading and fertilizer application before the sowing of arable crops (Hellsten et al., 2007). The distinct springtime maxima in NH3 also reflects implementation of the Nitrates Directive (EC, 1991), which prohibits manure spreading in winter. In summer, the second peak in NH3 concentrations may be associated with increased land surface emissions promoted by warm, dry conditions and possibly with the application of fertilizers. The smaller autumn peak is also expected to be related to seasonal farming activities (e.g. manure spreading). The key drivers for seasonal variability in NH3 concentrations at crops sites are therefore a combination of seasonal changes in agricultural practices (e.g. timing of fertilizer/manure applications) and climate that will affect emissions, concentrations, transport, and deposition of NH3.
Grassland sites
An additional major source of NH3 in this group of sites is expected to come from grazing emissions and housed livestock (e.g. cattle). Concentrations in this group of sites were generally 2–3 times larger than semi-natural sites (Fig. 14a), attributed to the increased emissions and concentrations from livestock (Hellsten et al., 2007). The spring peak is related to the practice of fertilizer and manure being spread on grazing fields to aid spring grass growth, which will be cut for hay and silage later in the year. NH3 concentrations in June and July are smaller than in spring or late summer, possibly because grass will be actively growing with possible uptake and removal of NH3 from the atmosphere (Sutton et al., 2009). The concentrations are also larger in summer than winter, with warmer conditions promoting NH3 volatilization and thermodynamic shift in NH4NO3 to the gas phase.
European regions
The seasonal profiles of NH3 for central and western European regions were similar, characterized by a large peak in spring that is likely to be agriculture–related (Fig. 15a), as observed at cropland sites (Fig. 14a). While the peak concentrations in both regions are of comparable magnitude (central = 2.6 µg NH3 m−3, western = 2.8 µg NH3 m−3), winter concentrations in central Europe (0.6 µg NH3 m−3) were 3 times smaller than the west (1.5 µg NH3 m−3). This may be related to lower regional background in NH3 concentrations and/or suppressed emissions in colder temperatures of central Europe in winter. By contrast, eastern and southern European regions have a broad peak in summer, although the eastern region also has a second peak in October (likely agriculture-related). The smallest concentrations were found in northern Europe, with the lowest NH3 emissions (Fig. 9). The three peaks in the profile show elevated concentrations in summer driven by warming temperatures, with the spring and autumn peaks attributed to influence from NH3 emissions from agricultural sources.
3.5.2 HNO3
The seasonal distribution in HNO3 is similar between the different ecosystem groups, varying only in magnitude of concentrations (Fig. 14c), and reflects the secondary nature of this component that is formed from oxidation of NOx (Fahey et al., 1986; ROTAP, 2012). Since the HNO3 data are actually the sum of HNO3 and HONO, with a small contribution from NO2 (see Sect. 2.2.3), the temporal patterns seen are likely to be the superimposed profiles of both HNO3 and HONO. In the studied region, NO2 is predominantly from vehicular emissions, which are not expected to show large seasonal variations and should therefore exert a negligible effect on the temporal patterns in HNO3. With this caveat in mind, HNO3 concentrations in the crops group are up to 2 times larger than the grassland group, while the smallest concentrations are in the semi-natural group. This is likely related to the proximity of sites in the different groups to combustion sources. A weak seasonal cycle is seen in the secondary HNO3 air pollutant in all cases, with slightly higher concentrations in late winter, spring, and summer and lowest in March and November. The reaction of NO2 with the OH radical is an important source of HNO3 during daytime, whereas N2O5 hydrolysis is considered an important source of HNO3 at nighttime (Chang et al., 2011). Larger HNO3 concentrations in summer are therefore from increased OH radicals for reaction with NO2 to form HNO3. Similarly, higher concentrations of ozone in spring in Europe (EMEP, 2016) can potentially increase HNO3 concentrations in springtime. Conversely, HNO3 concentrations are lower in winter, when oxidative capacity is less.
Seasonal variability in HNO3 will also be influenced by gas–aerosol-phase equilibrium. In the atmosphere, HNO3 reacts reversibly with NH3, forming the semi-volatile NH4NO3 aerosol if the necessary concentration product [HNO3] ⋅ [NH3] is exceeded (Baek et al., 2004; Jones and Harrison et al., 2011). Because of this process, the prime influences upon HNO3 concentrations at sites where NH4NO3 is formed are expected to be ambient temperature, relative humidity, and NH3 concentrations that affect the partitioning between the gas and aerosol phase (Allen et al., 1989; Stelson and Seinfeld, 1982). The availability of surplus NH3 in spring (Sect. 3.5.1) would tend to reduce HNO3 and increase NH4NO3 formation, which is reflected in the reduced HNO3 concentrations observed in March, when NH3 is at a maximum. In summer, warmer, drier conditions promote volatilization of the NH4NO3 aerosol, increasing the gas-phase concentrations of HNO3 and NH3 relative to the aerosol phase. Seasonality in HNO3 is therefore complex, related to traffic and industrial emissions, photochemistry, and HNO3 : NH4NO3 partitioning.
An analysis of the same data grouped according to geographical region revealed distinctive cycles in HNO3 in eastern and southern Europe (Fig. 15c). These two regions showed the highest concentrations in summer and lowest in winter, consistent with enhanced photochemistry in warmer, sunnier climates, and thermodynamic equilibrium favouring gas-phase HNO3 (Fig. 15c). Summertime peak concentrations in NH3 were also observed in these two regions (Fig. 15a). In comparison, the seasonal profiles of HNO3 in other regions were similar to those described for different ecosystem types (Fig. 14c).
3.5.3 SO2
Seasonality in SO2 shows concentrations peaking in winter at most sites (Fig. 14e), except in southern Europe, where the peak appeared in summer (Fig. 15e). Increased SO2 emissions from combustion processes (heating) in the winter months, coupled to stable atmospheric conditions, can result in build-up of concentrations at ground level, thereby contributing to the peak wintertime concentrations. The largest winter concentrations in central and eastern regions exceeded summer values on average by a factor of 4 compared with smaller differences in other regions (Fig. 15e). Enhanced oxidation processes in summer also tend to further reduce concentrations of SO2 through the oxidation of SO2 to H2SO4 (Saxena and Seigneur, 1987; Sickles and Shadwick, 2007; Paulot et al., 2017). In southern Europe, the seasonal cycle has winter minima and summer maxima instead, likely from increased combustion sources to meet energy demands for air conditioning over the hot summer months. Section 3.4 shows that SO2 was spatially correlated to HNO3; differences in relative concentrations between the different ecosystem groups (Fig. 14e) are thus also likely related to relative distance from emission sources.
3.5.4 NH, NO, and SO
The seasonal profiles of particulate NH (Figs. 14b and 15b) were mirrored by particulate NO (Figs. 14d and 15d) in all groups, demonstrating temporal as well as regional (see Sect. 3.3.4) correlation between these two components. Since NH4NO3 is more abundant than (NH4)2SO4, the seasonality of NH is likely to be influenced more by the temperature and humidity dependence of the semi-volatile NH4NO3 than by the stable (NH4)2SO4. In summer, warmer and drier conditions promote the dissociation of NH4NO3, decreasing particulate-phase NH4NO3 relative to gas-phase NH3 and HNO3. This process accounts for the summertime minima in NH (Figs. 14b and 15b) and NO (Figs. 14d and 15d). Conversely, cooler temperatures and higher-humidity conditions in winter, spring, and autumn shift the equilibrium to the aerosol phase, with observed peaks in concentrations of NH and NO. Since NH3 concentrations are also generally higher in spring than in autumn (Figs. 14a, 15a), the increased availability of NH3 in this period contributes towards the higher concentrations of NH4NO3 in spring than in autumn. In winter, the combination of NH4NO3 remaining in the aerosol phase with the stable conditions that can often develop maintains high concentrations of NH and NO in the atmosphere. The peak in NO in southern Europe was in February only, compared with broader peaks (February–April) in other regions (Fig. 15d), which may reflect differences in climatic conditions. In Figs. 14h and 15h, the ratios of the molar-equivalent concentrations of NO to sum (NO + SO) are plotted. The ratios were highest in spring and autumn and lowest in summer, lending support to the importance of NH4NO3 in controlling the seasonality of NH.
In the seasonal profiles for particulate SO, clear summer maxima and winter minima were observed at sites in southern and eastern Europe (Fig. 15f). The peaks occurred at different times, in July (southern Europe) and in August (eastern Europe) (Fig. 15f), and coincided with the timing of corresponding peaks in NH3 concentrations (Fig. 15a), illustrating the importance of NH3 in driving the formation of the stable (NH4)2SO4. Since (NH4)2SO4 is formed through the preferential and irreversible reaction between the precursor gases (Bower et al., 1997), particulate SO concentrations will be governed by the availability of NH3 and H2SO4 (from oxidation of SO2). As discussed earlier, SO2 concentrations in southern Europe have a different seasonal cycle from other regions, with higher concentrations in summer than in the winter months (Fig. 15e). Although the seasonal cycle for eastern Europe showed the smallest SO2 concentrations in the summer, the summer minima here (mean = 1.3 µg SO2 m−3) are in fact larger than the summer peak in southern Europe (mean = 1.1 µg SO2 m−3) and concentrations in other regions (0.4–1.0 µg SO2 m−3). Enhanced summertime concentrations in HNO3 were observed in these two regions (Fig. 15b), which also suggests potentially increased oxidative capacity for more of the SO2 to be converted to H2SO4 (Sect. 3.5.3). The ready availability of both SO2 (and conversion to H2SO4) and NH3 (Fig. 15a) in southern and eastern regions in this period thus coincides to produce the summer peak in particulate SO.
In other regions (central, northern, western), formation of (NH4)2SO4 will be limited by the availability of SO2, which is lowest in summer (Fig. 15e). Conversely, SO2 concentrations are highest in winter (Fig. 15e), but lower oxidative capacity at this time of year limits formation of H2SO4. Since NH3 concentrations are also smallest in winter (Fig. 15a), formation of (NH4)2SO4 is also limited in winter. This accounts for the higher concentrations of particulate SO concentrations in winter and in early spring in these regions (Fig. 15f).
3.5.5 HCl, Cl−, and Na+
The concentrations of HCl measured at all sites and in all groups were very small, with monthly mean concentrations varying between 0.1 and 0.3 µg HCl m−3 (Figs. 14g and 15g). There is no discernible seasonality in the data, which suggests that either sites in the network are not affected by any large sources of HCl or that small differences between months are not detectable due to measurement uncertainties at the very low concentrations (method limit of detection ∼0.1 µg HCl m−3 for monthly sampling). By contrast, Cl− (Figs. 14i and 15i) has a distinctive seasonal cycle with higher concentrations in the winter months than summer, similar to that of Na+ (Figs. 14j and 15j). The temporal correlation in the data therefore lends further support that Na+ and Cl− in the measurements are mainly sea salt (see also spatial correlation in Sect. 3.4). The highest concentrations of Na+ and Cl− during winter months would be consistent with increased generation and transport of sea salt generated by more stormy weather from marine sources during those periods (O'Dowd and de Leeuw, 2007).
3.6 Bulk wet-deposition measurements
Annual mean wet deposition of chemical species measured at the NEU bulk sampling sites was estimated by combining measured concentrations with annual precipitation. Site changes also occurred during the operation of the bulk wet-deposition network, with some sites closed and new sites added. At Mitra (PT-Mi3), contamination of the rain samples from bird strikes resulted in the rejection of a large proportion of the monthly data, and this site was excluded from the data analysis. In total, 12 sites provided 2 years of monthly data, with a further 5 sites providing 1 year of monthly data over the period 2008 to 2010. Due to differences in start and end dates for bulk measurements between the sites, the annual mean data derived are for 12-month periods or 2×12-month periods and not from calendar years.
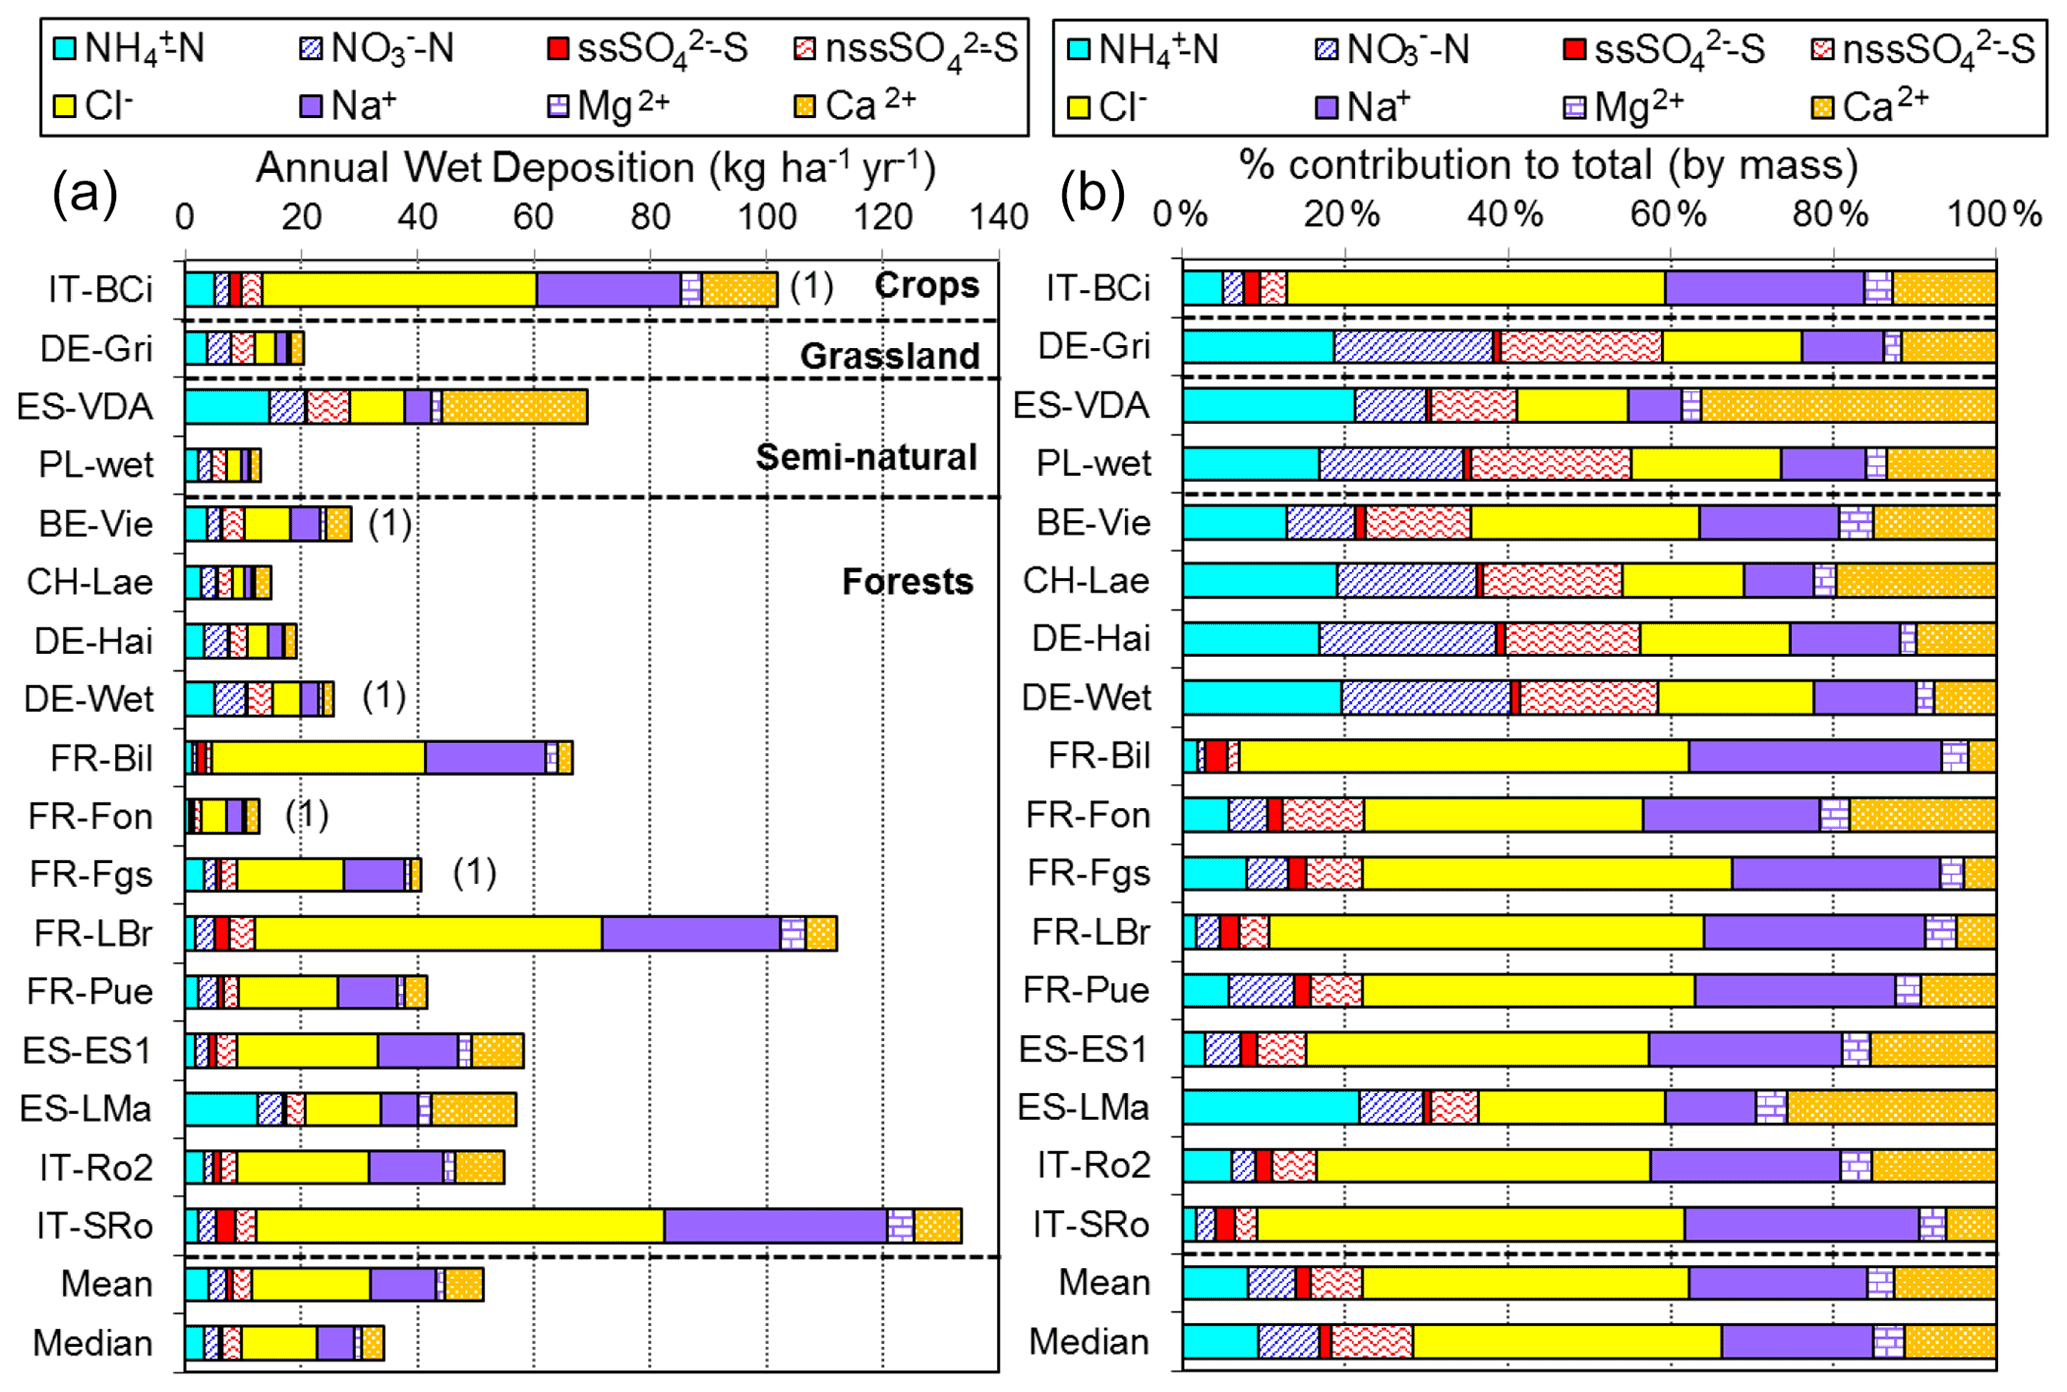
Figure 16(a) Annual wet deposition of inorganic components (kg ha−1 yr−1) estimated from Rotenkamp bulk precipitation collectors in the NEU bulk wet-deposition network. (b) Percentage contribution of inorganic components to total (by mass) measured at 17 sites from 2008 to 2010. The data shown are 2-year-averaged deposition, made between 2008 and 2010, except at five sites with 1 year of measurement only, as indicated in the graph in brackets.
Annual mean wet-deposition data for the 17 sites from seven countries (Belgium, France, Germany, Italy, Poland, Spain, and Switzerland) are summarized in Fig. 16. Using Na+ as a tracer for sea salt (Keene et al., 1986), nss-SO concentrations were also estimated from the total SO (see Sect. 2.2.2) and are included for comparison. Since the measurements were made at a limited number of sites across Europe, there is insufficient information to make inferences about spatial differences in concentrations. Detailed assessments of extensive precipitation chemistry across Europe are made elsewhere, for example from the EMEP wet-deposition networks (EMEP, 2016; Trseth et al., 2012). What the NEU bulk network data clearly shows is that Nr components in rain also exceed those of S (Fig. 16), as was observed in the atmospheric data. The mean proportional contribution of total N (NH and NO) to the sum total of all wet-deposited species measured (by mass) was 19 % (range = 3 %–39 %), compared with a smaller 9 % (range = 1 %–19 %) contribution from nss-SO (Table S14). Wet-deposited N (NH and NO) was on average 2 times higher than nss-SO, similar to that seen in the relative proportion of total Nr (sum of NH3, NH, HNO3, NO) to total S (sum of SO2, SO) in the atmospheric data (Sect. 3.3.4). Similar to the atmospheric data (Sect. 3.3.4), a considerable fraction of the wet-deposited components was made up of sea salt (Na+ and Cl−), with the sum of Na+ and Cl− contributing on average 50 % of the total wet-deposited components (range = 20 %–84 %, n=17). Contributions by the other base cations Ca2+ and Mg2+ gave a further 20 % (range = 8 %–41 %, n=17) (Table S14).
The wet-deposition data on NH and NO, combined with a wider precipitation chemistry dataset (e.g. from EMEP and other national precipitation networks), were used to estimate total Nr deposition to a site (Flechard et al., 2011, 2020). Together, the dry (DELTA® network) and wet Nr estimates (NEU bulk network, combined with data from other national precipitation chemistry networks) are used to compare with EMEP models and to examine the interactions between Nr supply and greenhouse gas exchange at the NEU DELTA® sites, presented in a separate paper by Flechard et al. (2020). The wet-deposition measurements in this paper highlight where DELTA® and bulk wet-deposition data are co-located and provide parallel information on gas and aerosol concentrations (for dry-deposition modelling) and wet deposition at those sites. The co-located data are important for deriving N budgets and linking to ecosystem response (e.g. Flechard et al., 2020) and invaluable for modellers.
The NitroEurope DELTA® network has provided for the first time a comprehensive quality-assured multi-annual dataset on reactive gases (NH3, HNO3, SO2, HCl) and aerosols (NH, NO, SO, Cl−) across the major gradients of emission densities, ecosystem type, and climatic zones of Europe. By sharing the method and protocol with several European laboratories and developing synergies with established infrastructure (e.g. CarboEurope network and EMEP field sites), it has proven possible to establish a large-scale network within a relatively short timescale and with low costs. Key elements were a harmonized methodology and the implementation of quality protocols that included regular laboratory and field inter-comparisons to monitor and improve performance.
At the same time, the concurrent measurement of the gas and aerosol components permitted an assessment of the atmospheric composition and the spatial and seasonal characteristics in the gas and aerosol phase of these components. The dataset has also been used to develop estimates of site-based Nr dry-deposition fluxes across Europe, including supporting the development and validation of long-range transport models. Combined with estimates of wet deposition (from NEU bulk wet-deposition network and other networks such as EMEP), an assessment of the interactions between N supply and greenhouse gas exchange was addressed in a separate paper by Flechard et al. (2020) using Nr and CO2 flux data from the co-location of the NEU DELTA® with CarboEurope Integrated Project sites.
Two key features have emerged in the data. The first is the dominance of NH3 as the largest single component at the majority of sites, with molar concentrations exceeding those of HNO3 and SO2 combined. As expected, the largest NH3 concentrations were measured at cropland sites, in intensively managed agricultural areas dominated by NH3 emissions. The smallest concentrations were at remote semi-natural and forest sites, although concentrations in the Netherlands, Italy, and Germany were up to 45 times larger than similarly classed sites in Finland, Norway, and Sweden (< 0.6 µg NH3–N m−3), illustrating the high NH3 concentrations that sensitive habitats are exposed to in intensive agricultural landscapes in Europe. The second key feature is the dominance of NH4NO3 over (NH4)2SO4, with on average twice as much NO as SO (on a molar basis). A change to an atmosphere that is more abundant in NH4NO3 will likely increase the atmospheric lifetimes and extend the footprint of the NH3 and HNO3 gases by the re-volatilization of NH4NO3 in warm weather.
Temporally, peak concentrations in NH3 for crops and grassland sites occurred in spring, reflecting the implementation of the EU Nitrates Directive that prohibits winter manure spreading. The spring agriculture-related peak was seen even at semi-natural and forest sites, highlighting the influence of NH3 emissions at sites that are more distant from sources. Summer peaks, promoted by increased volatilization of NH3 but also by gas–aerosol-phase thermodynamics under warmer, drier conditions, were seen in all ecosystem groups, except at forest sites. The seasonality in the NH3 concentrations thus provided important insights into both the relationship to occurrence of emissions and possible abatement measures to target peak emission periods.
Seasonality in the other gas and aerosol components is also driven by changes in emission sources, chemical interactions, and changes in environmental conditions influencing partitioning between the precursor gases (SO2, HNO3, NH3) and secondary aerosols (SO, NO, NH).
Seasonal cycles in SO2 were mainly driven by emissions (combustion), with concentrations peaking in winter, except in southern Europe, where the peak occurred in summer. HNO3 concentrations were more complex, as seasonal variations were affected by photochemistry, meteorology, and gas–aerosol-phase equilibrium. Southern and eastern European regions provided the clearest seasonal cycle for HNO3, with the highest concentrations in summer and the lowest in winter, attributed to increased photochemistry in the summer months in hotter climates. In comparison, a weaker seasonal cycle is seen in other regions, with marginally elevated concentrations in late winter, spring, and summer and lowest in March and November. Increased ozone in spring is likely to enhance oxidation of NOx to HNO3 for forming the semi-volatile NH4NO3 by reaction with a surplus of NH3. Cooler, wetter conditions in spring also favour the formation of NH4NO3, and more of the NH4NO3 remains in the aerosol or condensed phase. This accounts for the higher concentrations of NH and NO in spring and the absence of a HNO3 peak at this time of year. Conversely, increased partitioning to the gas phase in summer decreases NH4NO3 concentrations relative to gas-phase NH3 and HNO3. Particulate SO showed large peaks in concentrations in summer in southern and also eastern Europe, contrasting with much smaller peaks occurring in early spring in other regions. The peaks in particulate SO coincided with peaks in NH3 concentrations, illustrating the importance of NH3 in driving the formation of (NH4)2SO4. Since NH4NO3 is more abundant than (NH4)2SO4, the seasonality of NH is likely to be influenced more by the temperature and humidity dependence of the semi-volatile NH4NO3 than by the stable (NH4)2SO4. This is supported by similarity in the seasonal profiles of NH and NO at all sites, demonstrating temporal as well as regional correlation between these two components.
Data from the network showed that critical levels of 1 and 3 µg NH3 m−3 for the protection of lichens and bryophytes and vegetation were exceeded at 62 % and 27 % of the sites, respectively. At the same time, NH3 dry deposition will also contribute to a significant fraction of deposited acidity and total N deposition to sensitive habitats, along with NH and HNO3 dry deposition and wet-deposited NH and NO. Although the concentrations of SO2 have fallen to very low levels at all sites (< 1 µg SO2–S m−3), SO2 will continue to be important in contributing to the exceedance of acidification in European ecosystems (EEA, 2019) since SO2 has a higher acidification potential than NOx (0.70 kg SO2=1 kg equivalent NO2 in acidity) (see Hauschild and Wenzel, 1998). Changes in the relative concentrations of the pollutant gases captured in the data suggest that the deposition rates of SO2 and NH3 will increasingly be controlled by the molar ratio of NH3 to combined acidity (sum of SO2, HNO3, and HCl), and deposition models should take these changes into account. Indications from the current and projected trends in emissions of SO2, NOx, and NH3 are that NH3 and NH4NO3 will continue to dominate the inorganic pollution load over the next decades, contributing to ecosystem effects through acid and N deposition. The growing relative importance of NH3 and NH to total acidic and total N deposition indicates that strategies to tackle acidification and eutrophication need to include measures to abate emissions of NH3 (Sutton and Howard, 2018).
There is still a lack of NH3 and speciated monitoring of the inorganic gas and aerosol composition across the EU. An implementation of the DELTA® approach across Europe would provide cost-efficient monitoring of the gas- and aerosol-phase pollutants for which reduction commitments are set out in Annex II to the NECD. Monitoring of NH3 and the interacting acid gases and aerosols is needed to assess contributions of NH3 to PM2.5, known to be harmful to human health. In addition, such monitoring will also provide the baseline and evidence against which any changes and potential recovery in ecosystem response to changes in emissions of the pollutant gases can be assessed, as required under Article 9 of the NECD. Issues such as human health impacts from fine ammonium aerosols will also drive policy decisions since controlling NH3 should also reduce PM concentrations (Backes et al., 2016).
Summary data are provided in the Supplement. The full dataset is available from http://www.nitroeurope.ceh.ac.uk/ (Tang et al., 2020).
The supplement related to this article is available online at: https://doi.org/10.5194/acp-21-875-2021-supplement.
YST coordinated the establishment of the networks, measurement, and collection of data with the support of several European laboratories. A large number of research institutes provided monitoring sites and local support for installation of equipment and carrying out the monthly exchange of samples. MAS conceived the NEU project and the DELTA® network. IS helped with designing and building the low-voltage DELTA® equipment. EN helped with network logistics and provided science advice. NvD helped with running proficiency testing schemes and inter-comparisons. UlrikD provided GIS support and science advice. CP, MJS, and UlricD facilitated and hosted the DELTA® inter-comparisons at their field sites. UlricD also sourced Rotenkamp bulk collectors for the project. JNC provided advice on bulk wet-deposition measurements and calculations. CRF, UlricD, SV, MM, HTU, and MJS led the chemical laboratories that shared the DELTA® and wet-deposition measurements. DL developed the NEU database and provided support in data submission. Several of the authors contributed to measurements, network operations, and equipment and site maintenance. YST performed all the data collection and data analysis (including statistics) and wrote the manuscript, with input from all co-authors. MAS, MRH, CRF, UlricD, MF, and JNC provided valuable advice on the interpretation of results and feedback on the manuscript.
The authors declare that they have no conflict of interest.
The contributions by UKCEH scientists were further supported by the UK Natural Environment Research Council (NERC) National Capability award NE/R016429/1, as part of the UK-SCAPE programme delivering National Capability (https://www.ceh.ac.uk/ukscape, last access: 1 November 2020). Atmospheric measurements in the UK National Ammonia Monitoring Network (NAMN) and Acid Gas and Aerosol Monitoring Network (AGANet) were funded by the UK Department for Environment, Food and Rural Affairs (Defra) and devolved administrations. Fundación CEAM is partly supported by Generalitat Valenciana, Bancaja, and the programme CONSOLIDERINGENIO 2010 (GRACCIE). The authors gratefully acknowledge support and contributions by (1) the large network of dedicated local site contacts, field teams, and host organizations at NEU DELTA® and bulk wet-deposition sites; (2) all personnel involved in the sample preparations and chemical analyses from the chemical laboratories; (3) RIVM for hosting the DELTA-AMOR inter-comparisons at Vredepeel; and (4) Jan Vonk at RIVM for providing links to access NH3 and SO2 data from the Dutch national network LML (Landelijk Meetnet Luchtkwaliteitl).
This research has been supported by the European Commission (EU FP6 grant no. 17841, The nitrogen cycle and its influence on the European greenhouse gas balance: NitroEurope).
This paper was edited by Maria Kanakidou and reviewed by Martijn Schaap and one anonymous referee.
Allen, A. G., Harrison, R. M., and Erisman, J. W.: Field measurements of the dissociation of ammonium nitrate and ammonium chloride aerosols, Atmos. Environ, 23, 1591–1599. https://doi.org/10.1016/0004-6981(89)90418-6, 1989.
Allegrini, I., De Santis, F., Di Palo, V., Febo, A., Perrino, C., Possanzini, M., and Liberti, A.: Annular denuder method for sampling reactive gases and aerosols in the atmosphere, Science Total Environ., 67, 1–16, https://doi.org/10.1016/0048-9697(87)90062-3, 1987.
AQEG (Air Quality Expert Group): Fine Particulate Matter (PM2.5) in the United Kingdom, Air Quality Expert Group report prepared for Department for Environment, Food and Rural Affairs; Scottish Executive; Welsh Government; and Department of the Environment in Northern Ireland, availabe at: http://uk-air.defra.gov.uk (last access: 24 January 2017), 2012.
Backes, A. M., Aulinger, A., Bieser, J., Matthias, V., and Quante, M.: Ammonia emissions in Europe, part II: How ammonia emission abatement strategies affect secondary aerosols, Atmos. Environ., 126, 153–161, https://doi.org/10.1016/j.atmosenv.2015.11.039, 2016.
Baek, B. H., Aneja, V. P., and Tong, Q.: Chemical coupling between ammonia, acid gases, and fine particles, Environ. Pollut., 129, 89–98, https://doi.org/10.1016/j.envpol.2003.09.022, 2004.
Bai, H., Chungsying, L., Chang, K.-F., and Fang, G.-C.: Sources of sampling error for field measurement of nitric acid gas by a denuder system, Atmos. Environ., 37, 941–947, https://doi.org/10.1016/S1352-2310(02)00972-x, 2003.
Bleeker, A., Sutton, M. A., Acherman, B., Alebic-Juretic, A., Aneja, V. P., Ellermann, T., Erisman, J. W., Fowler, D., Fagerli, H., Gauger, T., Harlen, K. S., Hole, L. R., Horvath, L., Mitosinkova, M., Smith, R. I., Tang, Y. S., and van Pul, A.: Linking Ammonia Emission Trends to Measured Concentrations and Deposition of Reduced Nitrogen at Different Scales, in: Atmospheric Ammonia: Detecting Emission Changes and Environmental Impacts, edited by: Sutton, M. A., Reis, S., and Baker, S. M. H., Springer, the Netherlands, 123–180, 2009.
Bobbink, R., Hicks, K., Galloway, J., Spranger, T., Alkemade, R., Ashmore, M., Bustamante, M., Cinderby, S., Davidson, E., Dentener, F., Emmett, B., Erisman, J., Fenn, M., Gilliam, F., Nordin, A., Pardo, L., and De Vries, W.: Global assessment of nitrogen deposition effects on terrestrial plant diversity: a synthesis, Ecol. Appl., 2,: 30–59, https://doi.org/10.1890/08-1140.1, 2010.
Bower, K. N., Choularton, T. W., Gallagher, M. W., Colvile, R. N., Wells, M., Beswick, K. M., Wiedensohler, A., Hansson, H.-C., Svenningsson, B., Swietlicki, E., Wendisch, M., Berner, A., Kruisz, C., Laj, P., Facchini, M. C., Fuzzi, S., Bizjak, M., Dollard, G., Jones, B., Acker, K., Wieprecht, W., Preiss, M., Sutton, M. A., Hargreaves, K. J., Storeton-West, R. L., Cape, J. N., and Arends, B. G.: Observations and modelling of the processing of aerosol by a hill cap cloud, Atmos. Environ., 31, 2527–2544, 1997.
Cape, J. N., Tang, Y. S., van Dijk, N., Love, L., Sutton, M. A., and Palmer, S. C. F.: Concentrations of ammonia and nitrogen dioxide at roadside verges and their contribution to nitrogen deposition, Environ. Pollut., 132, 469–478, https://doi.org/10.1016/j.envpol.2004.05.009, 2004.
Cape, J. N., van der Eerden, L. J., Sheppard, L. J., Leith, I. D., and Sutton, M. A.: Evidence for changing the critical level for ammonia, Environ. Pollut., 157, 1033–1037, https://doi.org/10.1016/j.envpol.2008.09.049, 2009.
Cape, J. N., Tang, Y. S., González-Beníez, J. M., Mitošinková, M., Makkonen, U., Jocher, M., and Stolk, A.: Organic nitrogen in precipitation across Europe, Biogeosciences, 9, 4401–4409, https://doi.org/10.5194/bg-9-4401-2012, 2012.
Chang, W. L., Bhave, P. V., Brown, S. S., Riemer, N., Stutz, J., and Dabdub, D.: Heterogeneous Atmospheric Chemistry, Ambient Measurements, and Model Calculations of N2O5: A Review, Aerosol Sci. Tech., 45, 665–695, https://doi.org/10.1080/02786826.2010.551672, 2011.
Dämmgen, U., Erisman, J. W., Cape, J. N., Grűnhage, L., and Fowler, D.: Practical considerations for addressing uncertainties in monitoring bulk deposition, Environ. Pollut., 134, 535–548, https://doi.org/10.1016/j.envpol.2004.08.013, 2005.
Dore, A. J., Carslaw, D. C., Braban, C., Cain, M., Chemel, C., Conolly, C., Derwent, R. G., Griffiths, S. J., Hall, J., Hayman, G., Lawrence, S., Metcalfe, S. E., Redington, A., Simpson, D., Sutton, M. A., Sutton, P., Tang, Y. S., Vieno, M., Werner, M., and Whyatt, J. D.: Evaluation of the performance of different atmospheric chemical transport models and inter-comparison of nitrogen and sulphur deposition estimates for the UK, Atmos. Environ., 119, 131–143, https://doi.org/10.1016/j.atmosenv.2015.08.008, 2015.
EC: The Nitrates Directive (91/676/EEC), available at: https://eur-lex.europa.eu/eli/dir/1991/676/2008-12-11 (last access: 11 January 2020), 1991.
EEA (European Environment Agency): European Union emission inventory report 1990–2017 under the UNECE Convention on Long-range Transboundary Air Pollution (LRTAP), EEA Report No 8/2019, available at: https://www.eea.europa.eu/publications/european-union-emissions-inventory-report-2017, last access: 9 December 2019.
EEA (European Environment Agency): Datasource, available at: https://www.eea.europa.eu/data-and-maps/dashboards/air-pollutant-emissions-data-viewer-2, last access: 15 January 2020.
EMEP: Air pollution trends in the EMEP region between 1990 and 2012, CCC-Report 1/2016, available at: http://www.ivl.se/download/18.7e136029152c7d48c202d81/1466685735821/C206.pdf) (last access: 9 November 2018), 2016.
EMEP: Transboundary particulate matter, photooxidants, acidifying and eutrophying components, EMEP Status Report 1/2018, availabe at: https://emep.int/publ/reports/2018/EMEP_Status_Report_1_2018.pdf (last access: 22 October 2019), 2018.
EMEP: Transboundary particulate matter, photooxidants, acidifying and eutrophying components, EMEP Status Report 1/2019, availab;e at: http://www.diva-portal.org/smash/record.jsf?pid=diva2%3A1371039&dswid=-7800 (last access: 22 October 2019), 2019.
EMEP: Datasource: EMEP/CEIP 2019, distributed emission data as used in EMEP models, available at:https://www.eea.europa.eu/data-and-maps/dashboards/air-pollutant-emissions-data-viewer-1, last access: 15 January 2020.
EU: Directive (EU) 2008/50/EC of the European Parliament and of the Council of 21 May 2008 on ambient air quality and cleaner air for Europe, available at: https://eur-lex.europa.eu/legal-content/en/ALL/?uri=CELEX:32008L0050 (last access: 1 November 2019), 2008.
EU: Directive (EU) 2016/2284 of the European Parliament and of the Council of 14 December 2016 on the reduction of national emissions of certain atmospheric pollutants, amending Directive 2003/35/EC and repealing Directive 2001/81/EC, available at: https://eur-lex.europa.eu/legal-content/EN/TXT/?uri=CELEX:32016L2284 (last access: 1 November 2019), 2016.
Evans, C. D., Monteith, D. T., Fowler, D., Cape, J. N., and Brayshaw, S.: Hydrochloric Acid: An Overlooked Driver of Environmental Change, Environ. Sci. Technol., 45, 1887–1894, https://doi.org/10.1021/es103574u, 2011.
Fahey, D. W., Hübler, G., Parrish, D. D., Williams, E. J., Norton, R. B., Ridley, B. A., Singh, H. B., Liu, S. C., and Fehsenfeld, F. C.: Reactive nitrogen species in the troposphere: Measurements of NO, NO2, HNO3, particulate nitrate, peroxyacetyl nitrate (PAN), O3, and total reactive odd nitrogen (NOy) at Niwot Ridge, Colorado, J. Geophys. Res., 91, 9781–9793, https://doi.org/10.1029/JD091iD09p09781, 1986.
Ferm, M.: Method for determination of atmospheric ammonia, Atmos. Environ., 13, 1385–1393, https://doi.org/10.1016/0004-6981(79)90107-0, 1979.
Ferm, M.: A Na2CO3-coated denuder and filter for determination of gaseous HNO3 and particulate NO in the atmosphere, Atmos. Environ., 20, 1193–1201, https://doi.org/10.1016/0004-6981(86)90153-8, 1986.
Finlayson-Pitts, B. J. and Pitts, J. N.: Chemistry of the upper and lower atmosphere: theory, experiments, and applications, Academic Press, San Diego, CA, USA, 1999.
Fitz, D. R.: Evaluation of Diffusion Denuder Coatings for Removing Acid Gases from Ambient Air, Final Report, US Environmental Protection Agency, Riverside, Washington, DC, USA, available at: https://www3.epa.gov/ttnamti1/files/ambient/pm25/spec/denudr.pdf (last access: 10 December 2019), 173 pp., 2002.
Flechard, C. R., Fowler, D., Sutton, M. A., and Cape, J. N.: A dynamic chemical model of bi-directional ammonia exchange between semi-natural vegetation and the atmosphere, Q. J. Roy. Meteor. Soc., 125, 2611–2641, 1999.
Flechard, C. R., Nemitz, E., Smith, R. I., Fowler, D., Vermeulen, A. T., Bleeker, A., Erisman, J. W., Simpson, D., Zhang, L., Tang, Y. S., and Sutton, M. A.: Dry deposition of reactive nitrogen to European ecosystems: a comparison of inferential models across the NitroEurope network, Atmos. Chem. Phys., 11, 2703–2728, https://doi.org/10.5194/acp-11-2703-2011, 2011.
Flechard, C. R., Massad, R.-S., Loubet, B., Personne, E., Simpson, D., Bash, J. O., Cooter, E. J., Nemitz, E., and Sutton, M. A.: Advances in understanding, models and parameterizations of biosphere-atmosphere ammonia exchange, Biogeosciences, 10, 5183–5225, https://doi.org/10.5194/bg-10-5183-2013, 2013.
Flechard, C. R., Ibrom, A., Skiba, U. M., de Vries, W., van Oijen, M., Cameron, D. R., Dise, N. B., Korhonen, J. F. J., Buchmann, N., Legout, A., Simpson, D., Sanz, M. J., Aubinet, M., Loustau, D., Montagnani, L., Neirynck, J., Janssens, I. A., Pihlatie, M., Kiese, R., Siemens, J., Francez, A.-J., Augustin, J., Varlagin, A., Olejnik, J., Juszczak, R., Aurela, M., Berveiller, D., Chojnicki, B. H., Dämmgen, U., Delpierre, N., Djuricic, V., Drewer, J., Dufrêne, E., Eugster, W., Fauvel, Y., Fowler, D., Frumau, A., Granier, A., Gross, P., Hamon, Y., Helfter, C., Hensen, A., Horváth, L., Kitzler, B., Kruijt, B., Kutsch, W. L., Lobo-do-Vale, R., Lohila, A., Longdoz, B., Marek, M. V., Matteucci, G., Mitosinkova, M., Moreaux, V., Neftel, A., Ourcival, J.-M., Pilegaard, K., Pita, G., Sanz, F., Schjoerring, J. K., Sebastià, M.-T., Tang, Y. S., Uggerud, H., Urbaniak, M., van Dijk, N., Vesala, T., Vidic, S., Vincke, C., Weidinger, T., Zechmeister-Boltenstern, S., Butterbach-Bahl, K., Nemitz, E., and Sutton, M. A.: Carbon–nitrogen interactions in European forests and semi-natural vegetation – Part 1: Fluxes and budgets of carbon, nitrogen and greenhouse gases from ecosystem monitoring and modelling, Biogeosciences, 17, 1583–1620, https://doi.org/10.5194/bg-17-1583-2020, 2020.
Fowler, D. and Reis, S.: Challenges in quantifying biosphere-atmosphere exchange of nitrogen species, Environ. Pollut., 150, 125–139, https://doi.org/10.1016/j.envpol.2007.04.014, 2007.
Fowler, D., Cape, N., and Unsworth, M. H.: Deposition of atmospheric pollutants on forests, Philos. T. Roy. Soc. B, 324, 247–265, https://doi.org/10.1098/rstb.1989.0047, 1989.
Fowler, D., Coyle, M., Flechard, C., Hargreaves1, K., Nemitz, E., Storeton-West, R., Sutton, M., and Erisman, J. W.: Advances in micrometeorological methods for the measurement and interpretation of gas and particle nitrogen fluxes, Plant Soil, 228, 117–129, https://doi.org/10.1023/A:1004871511282, 2001.
Fowler, D., Pilegaard, K., Sutton, M. A., Ambus, P., Raivonen, M., Duyzer, J., Simpson, D., Fagerli, H., Fuzzi, S., Schjoerring, J. K., Granier, C., Neftel, A., Isaksen, I. S. A., Laj, P., Maione, M., Monks, P. S., Burkhardt, J., Daemmgen, U., Neirynck, J., Personne, E., Wichink-Kruit, R., Butterbach-Bahl, K., Flechard, C., Tuovinen, J. P., Coyle, M., Gerosa, G., Loubet, B., Altimir, N., Gruenhage, L., Ammann, C., Cieslik, S., Paoletti, E., Mikkelsen, T. N, Ro-Poulsen, H., Cellier, P., Cape, J. N., Horváth, L., Loreto, F., Niinemets, Ü., Palmer, P. I., Rinne, J., Misztal, P., Nemitz, E., Nilsson, D., Pryor, S., Gallagher, M. W., Vesala, T., Skiba, U., Brüggemann, N., Zechmeister-Boltenstern, S., Williams, J., O'Dowd, C., Facchini, M. C., de Leeuw, G., Flossman, A., Chaumerliac, N., and Erisman, J. W.: Atmospheric composition change: Ecosystems-Atmosphere interactions, Atmos. Environ., 43, 5193–5267, https://doi.org/10.1016/j.atmosenv.2009.07.068, 2009.
Hallsworth S., Dore A. J., Bealey W. J., Dragosits U., Vieno M., Hellsten S., Tang Y. S., and Sutton M. A.: The role of indicator choice in quantifying the threat of atmospheric ammonia to the “Natura 2000” network, Environ. Sci. Policy, 13, 671–687, https://doi.org/10.1016/j.envsci.2010.09.010, 2010.
Hauschild, M. and Wenzel, H.: Acidification as a criterion in the environmental assessment of products, in: Environmental assessment of products, Volume 2 Scientific background, edited by: Hauschild, M. and Wenzel, H., Chapman and Hall, London, UK, p. 565, 1998.
Hellsten, S., Dragosits, U., Place, C. J., Misselbrook, T. H., Tang, Y. S., and Sutton, M. A.: Modelling Seasonal Dynamics from Temporal Variation in Agricultural Practices in the UK Ammonia Emission Inventory, Water Air Soil Poll., 7, 3–13, https://doi.org/10.1007/s11267-006-9087-5, 2007.
Hendriks, C., Kranenburg, R., Kuenen, J., van Gijlswijk, R., Kruit, R. W., Segers, A., van der Gon, H. D., and Schaap, M.: The origin of ambient particulate matter concentrations in the Netherlands, Atmos. Environ., 69, 289–303, https://doi.org/10.1016/j.atmosenv.2012.12.017, 2013.
Huntzicker, J. J., Robert A., Cary, R. A., and Ling, C-S.: Neutralization of sulfuric acid aerosol by ammonia, Environ. Sci. Technol., 14, 819–824, https://doi.org/10.1021/es60167a009, 1980.
Ianniello, A., Spataro, F., Esposito, G., Allegrini, I., Hu, M., and Zhu, T.: Chemical characteristics of inorganic ammonium salts in PM2.5 in the atmosphere of Beijing (China), Atmos. Chem. Phys., 11, 10803–10822, https://doi.org/10.5194/acp-11-10803-2011, 2011.
Jones, A.M. and Harrison, R.M.: Temporal trends in sulphate concentrations at European sites and relationships to sulphur dioxide, Atmos. Environ., 45, 873–882, https://doi.org/10.1016/j.atmosenv.2010.11.020, 2011.
Keene, W. C., Pszenny, A. A. P., Galloway, J. N., and Hawley, M. E.: Sea salt corrections and interpretation of constitutent ratios in marine precipitation, J. Geophys. Res., 91, 6647–6658, https://doi.org/10.1029/JD091iD06p06647, 1986.
Keene, W. C., Aslam, M., Khalil, K., Erickson, D. J., McCulloch, A., Graedel, T. E., Lobert, J. M., Aucott, M. L., Gong, S. L., Harper, D. B., Kleiman, G., Midgley, P., Moore, R. M., Seuzaret, C., Sturges, W. T., Benkovitz, C. M., Koropalov, V., Barrie, L. A., and Li, Y. F.: Composite global emissions of reactive chlorine from anthropogenic and natural sources: Reactive Chlorine Emissions Inventory, J. Geophys. Res., 104, 8429– 8440, https://doi.org/10.1029/1998JD100084, 1999.
Lolkema, D. E., Noordijk, H., Stolk, A. P., Hoogerbrugge, R., van Zanten, M. C., and van Pul, W. A. J.: The Measuring Ammonia in Nature (MAN) network in the Netherlands, Biogeosciences, 12, 5133–5142, https://doi.org/10.5194/bg-12-5133-2015, 2015.
Massad, R.-S., Nemitz, E., and Sutton, M. A.: Review and parameterisation of bi-directional ammonia exchange between vegetation and the atmosphere, Atmos. Chem. Phys., 10, 10359–10386, https://doi.org/10.5194/acp-10-10359-2010, 2010.
McCulloch, A., Aucott, M. L., Benkovitz, C. M., Graedel, T. E., Kleiman, G., Midgley, P. M., and Li, Y.-F.: Global emissions of hydrogen chloride and chloromethane from coal combustion, incineration and industrial activities: Reactive Chlorine Emissions Inventory, J. Geophys. Res., 104, 8391–8403, https://doi.org/10.1029/1999JD900025, 1999.
Nemitz, E., Jimenez, J. L., Huffman, J. A., Ulbrich, I. M., Canagaratna, M. R., Worsnop, D. R., and Guenther, A. B.: An Eddy-Covariance System for the Measurement of Surface/Atmosphere Exchange Fluxes of Submicron Aerosol Chemical Species – First Application Above an Urban Area, Aerosol Sci. Tech., 42, 636–657, https://doi.org/10.1080/02786820802227352, 2008.
EC: The Nitrates Directive (91/676/EEC), available at: https://eur-lex.europa.eu/legal-content/EN/TXT/?qid=1561542776070&uri=CELEX:01991L0676-20081211 (last access: 11 January 2020), 1991.
O'Dowd, C. D. and de Leeuw, G.: Marine aerosol production: a review of the current knowledge, Philos. T. Roy. Soc. A, 365, 1753–1774, https://doi.org/10.1098/rsta.2007.2043, 2007.
Paulot, F., Fan, S., and Horowitz, L. W.: Contrasting seasonal responses of sulfate aerosols to declining SO2 emissions in the Eastern US: Implications for the ecacy of SO2 emission controls, Geophys. Res. Lett., 44, 455–464, https://doi.org/10.1002/2016GL070695, 2017.
Perrino, C., De Santis, F., and Febo, A.: Criteria for the choice of a denuder sampling technique devoted to the measurement of atmospheric nitrous and nitric acids, Atmos. Environ., 24, 617–626, https://doi.org/10.1016/0960-1686(90)90017-H, 1990.
Pitcairn, C. E. R., Leith, I. D., Sheppard, L. J., Sutton, M. A., Fowler, D., Munro, R. C., Tang, S., and Wilson, D.: The relationship between nitrogen deposition, species composition and foliar nitrogen concentrations in woodland flora in the vicinity of livestock farms, Environ. Pollut., 102, 41–48, https://doi.org/10.1016/s0269-7491(98)80013-4, 1998.
Putaud, J. P., Van Dingenen, R., Alastuey, A., Bauer, H., Birmili, W., Cyrys, J., Flentje, H., Fuzzi, S., Gehrig, R., Hansson, H. C., Harrison, R. M., Herrmann, H., Hitzenberger, R., Hüglin, C., Jones, A. M., Kasper-Giebl, A., Kiss, G., Kousa, A., Kuhlbusch, T. A. J., Löschau, G., Maenhaut, W., Molnar, A., Moreno, T., Pekkanen, J., Perrino, C., Pitz, M., Puxbaum, H., Querol, X., Rodriguez, S., Salma, I., Schwarz, J., Smolik, J., Schneider, J., Spindler, G., ten Brink, H., Tursic, J., Viana, M., Wiedensohler, A., and Raes, F.: A European aerosol phenomenology III: Physical and chemical characteristics of particulate matter from 60 rural, urban, and kerbside sites across Europe, Atmos. Environ., 44, 1–13, https://doi.org/10.1016/j.atmosenv.2009.12.011, 2010.
Reis, S., Grennfelt, P., Klimont, Z., Amann, M., ApSimon, H., Hettelingh, J.-P., Holland, M., LeGall, A.-C., Maas, R., Posch, M., Spranger, T., Sutton, M. A., and Williams, M.: From acid rain to climate change, Science, 338, 1153–1154, https://doi.org/10.1126/science.1226514, 2012.
Ricciardelli, I., Bacco, D., Rinaldi, M., Bonafè, G., Scotto, F., Trentini, A., Bertacci, G., Ugolini, P., Zigola, C., Rovere, F., Maccone, C., Pironi, C., and Poluzzi, V.: A three-year investigation of daily PM2.5 main chemical components in four sites: the routine measurement program of the Supersito Project (Po Valley, Italy), Atmos. Environ., 152, 418–430, https://doi.org/10.1016/j.atmosenv.2016.12.052, 2017.
ROTAP: Review of Transboundary Air Pollution: Acidification, Eutrophication, Ground Level Ozone and Heavy Metals in the UK, Contract Report to the Department for Environment, Food and Rural Affairs, Centre for Ecology and Hydrology, available at: http://www.rotap.ceh.ac.uk/ (last access: 9 November 2018), 2012.
Roth, B. and Okada, K.: On the modification of sea-salt particles in the coastal atmosphere, Atmos. Environ., 32, 1555–1569, https://doi.org/10.1016/S1352-2310(97)00378-6, 1998.
Saxena, P. and Seigneur, C.: On the oxidation of SO2 to sulfate in atmospheric aerosols, Atmos. Environ., 21, 807–812, https://doi.org/10.1016/0004-6981(87)90077-1, 1987.
Schaufler, G., Kitzler, B., Schindlbacher, A., Skiba, U., Sutton, M. A., and Zechmeister-Boltenstern, S.: Greenhouse gas emissions from European soils under different land use: effects of soil moisture and temperature, Eur. J. Soil Sci., 61, 683–696, https://doi.org/10.1111/j.1365-2389.2010.01277.x, 2010.
Schrader, F., Schaap, M., Zöll, U., Kranenburg, R., and Brümmer, C.: The hidden cost of using low resolution concentration data in the estimation of NH3 dry deposition fluxes, Nat. Sci. Rep., 8, 1–11, https://:10.1038/s41598-017-18021-6, 2018.
Schwarz, J., Cusack, M., Karban, J., Chalupníčková, E., Havránek, V., Smolík, J., and Ždímal, V.: PM2.5 chemical composition at a rural background site in Central Europe, including correlation and air mass back trajectory analysis, Atmos. Res., 176/177, 108–120, https://doi.org/10.1016/j.atmosres.2016.02.017, 2016.
Sheppard, L. J., Leith, I. D., Mizunuma, T., Cape, J. N, Crossley, A., Leeson, S., Sutton, M. A., van Dijk, N., and Fowler, D.: Dry deposition of ammonia gas drives species change faster than wet deposition of ammonium ions: evidence from a long-term field manipulation, Glob. Change Biol., 17, 3589–3607, https://doi.org/10.1111/j.1365-2486.2011.02478.x, 2011.
Sickles, J. E. and Shadwick, D. S.: Seasonal and regional air quality and atmospheric deposition in the eastern United States, J. Geophys. Res., 112, D17302, https://doi.org/10.1029/2006JD008356, 2007.
Sievering, H., Tomaszewski, T., and Torizzo, J.: Canopy uptake of atmospheric N deposition at a conifer forest: part I – canopy N budget, photosynthetic efficiency and net ecosystem exchange, Tellus B, 59, 483–492, https://doi.org/10.1111/j.1600-0889.2007.00264.x, 2007.
Simpson, D., Butterbach-Bahl, K., Fagerli, H., Kesik, M., Skiba, U., and Tang, Y.: Deposition and emissions of reactive nitrogen over European forests: A modelling study, Atmos. Environ., 40, 5712–5726, https://doi.org/10.1016/j.atmosenv.2006.04.063, 2006.
Skiba, U., Drewer, J., Tang, Y. S., van Dijk, N., Helfter, C., Nemitz, E., Famulari, D., Cape, J. N., Jones, S. K., Twigg, M., Pihlatie, M., Vesala, T., Larsen, K. S., Carter, M. S., Ambus, P., Ibrom, A., Beier, C., Hensen, A., Frumau, A., Erisman, J. W., Brűggemann, N., Gasche, R., Butterbach-Bahl, K., Neftel, A., Spirig, C., Horvath, L., Freibauer, A., Cellier, P., Laville, P., Loubet, B., Magliulo, E., Bertolini, T., Seufert, G., Andersson, M., Manca, G., Laurila, T., Aurela, M., Lohila, A., Zechmeister-Boltenstern, S., Kitzler, B., Schaufler, G., Siemens, J., Kindler, R., Flechard, C., and Sutton, M. A.: Biosphere-atmosphere exchange of reactive nitrogen and greenhouse gases at the NitroEurope core flux measurement sites: Measurement strategy and first data sets, Agr. Ecosyst. Environ., 133, 139–149, https://doi.org/10.1016/j.agee.2009.05.018, 2009.
Smith, R. I., Fowler, D., Sutton, M. A., Flechard, C., and Coyle, M.: Regional estimation of pollutant gas dry deposition in the UK: model description, sensitivity analyses and outputs, Atmos. Environ., 34, 3757–3777, https://doi.org/10.1016/s1352-2310(99)00517-8, 2000.
Stelson, A. W. and Seinfeld, J. H.: Relative humidity and temperature dependence of the ammonium nitrate dissociation constant, Atmos. Environ., 16, 983–992, https://doi.org/10.1016/0004-6981(82)90184-6, 1982.
Stevens, C. J., Thompson, K., Grime, J. P., Long, C. J., and Gowing, D. J. G.: Contribution of acidification and eutrophication to declines in species richness of calcifuge grasslands along a gradient of atmospheric nitrogen deposition, Funct. Ecol., 24, 478–484, https://doi.org/10.1111/j.1365-2435.2009.01663.x, 2010.
Sutton, M. A. and Howard, C.: Satellite pinpoints ammonia sources globally, Nature, 564, 49–50, https://doi.org/10.1038/d41586-018-07584-7, 2018.
Sutton, M. A., Fowler, D., Burkhardt, J. K., and Milford, C.: Vegetation atmosphere exchange of ammonia: Canopy cycling and the impacts of elevated nitrogen inputs, Water Air Soil Poll., 85, 2057–2063, https://doi.org/10.1007/bf01186137, 1995.
Sutton, M. A., Milford, C., Dragosits, U., Place, C. J., Singles, R. J., Smith, R. I., Pitcairn, C. E. R., Fowler, D., Hill, J., ApSimon, H. M., Ross, C., Hill, R., Jarvis, S. C., Pain, B. F., Phillips, V. C., Harrison, R., Moss, D., Webb, J., Espenhahn, S. E., Lee, D. S., Hornung, M., Ullyett, J., Bull, K. R., Emmett, B. A., Lowe, J., and Wyers, G. P.: Dispersion, deposition and impacts of atmospheric ammonia: quantifying local budgets and spatial variability, Environ. Pollut., 102, 349–361, https://doi.org/10.1016/s0269-7491(98)80054-7, 1998.
Sutton, M. A., Tang, Y. S., Miners, B., and Fowler, D.: A new diffusion denuder system for long-term, regional monitoring of atmospheric ammonia and ammonium, Water Air Soil Poll., 1, 145–156, https://doi.org/10.1023/A:1013138601753, 2001a.
Sutton, M. A., Tang, Y. S., Dragosits, U., Fournier, N., Dore, A. J., Smith, R. I., Weston, K. J., and Fowler, D.: A spatial analysis of atmospheric ammonia and ammonium in the U.K, Sci. World J., 1, 275–286, https://doi.org/10.1100/tsw.2001.313, 2001b.
Sutton, M. A., Nemitz, E., Erisman, J. W., Beier, C., Bahl, K. B., Cellier, P., de Vries, W., Cotrufo, F., Skiba, U., Di Marco, C., Jones, S., Laville, P., Soussana, J. F., Loubet, B., Twigg, M., Famulari, D., Whitehead, J., Gallagher, M. W., Neftel, A., Flechard, C. R., Herrmann, B., Calanca, P. L., Schjoerring, J. K., Daemmgen, U., Horvath, L., Tang, Y. S., Emmett, B. A., Tietema, A., Penuelas, J., Kesik, M., Brueggemann, N., Pilegaard, K., Vesala, T., Campbell, C. L., Olesen, J. E., Dragosits, U., Theobald, M. R., Levy, P., Mobbs, D. C., Milne, R., Viovy, N., Vuichard, N., Smith, J. U., Smith, P., Bergamaschi, P., Fowler, D., and Reis, S.: Challenges in quantifying biosphere-atmosphere exchange of nitrogen species, Environ. Pollut., 150, 125–139, https://doi.org/10.1016/j.envpol.2007.04.014, 2007.
Sutton, M. A., Nemitz, E., Milford, C., Campbell, C., Erisman, J. W., Hensen, A., Cellier, P., David, M., Loubet, B., Personne, E., Schjoerring, J. K., Mattsson, M., Dorsey, J. R., Gallagher, M. W., Horvath, L., Weidinger, T., Meszaros, R., Dämmgen, U., Neftel, A., Herrmann, B., Lehman, B. E., Flechard, C., and Burkhardt, J.: Dynamics of ammonia exchange with cut grassland: synthesis of results and conclusions of the GRAMINAE Integrated Experiment, Biogeosciences, 6, 2907–2934, https://doi.org/10.5194/bg-6-2907-2009, 2009.
Sutton, M. A., Reis, S., Riddick, S. N., Dragosits, U., Nemitz, E., Theobald, M. R., Tang, Y. S., Braban, C. F. Vieno, M., Dore, A. J., Mitchell, R. F., Wanless, S., Daunt, F., Fowler, D., Blackall, T. D., Milford, C., Flechard, C. R., Loubet, B., Massad, R., Cellier, P., Personne, E., Coheur, P., Clarisse, L., Van Damme, M., Ngadi, Y., Clerbaux, C., Skjoth, C., Geels, C., Hertel, O., Kruit, R. J. W., Pinder, R. W., Bash, J. O., Walker, J. T., Simpson, D., Horvath, L., Misselbrook, T. H., Bleeker, A., Dentener, F., and de Vries, W.: Towards a climate-dependent paradigm of ammonia emission and deposition, Philos. T. Roy. Soc. B, 368, 20130166, https://doi.org/10.1098/rstb.2013.0166, 2013.
Szigeti, T., Óvári, M., Dunster, C., Kelly, F. J., Lucarelli, F., and Záray, G.: Changes in chemical composition and oxidative potential of urban PM2.5 between 2010 and 2013 in Hungary, Sci. Total Environ., 518/519, 534–544, https://doi.org/10.1016/j.scitotenv.2015.03.025, 2015.
Tang, Y. S. and Sutton, M. A.: Quality management in the UK national ammonia monitoring network, in: Proceedings of the International Conference: QA/QC in the field of emission and air quality measurements: harmonization, standardization and accreditation, Prague, Czech Republic, 21–23 May 2003, 297–307, 2003.
Tang, Y. S., Cape, J. N., and Sutton, M. A.: Development and types of passive samplers for monitoring atmospheric NO2 and NH3 concentrations, Sci. World J., 1, 513–529, https://doi.org/10.1100/tsw.2001.82, 2001.
Tang, Y. S., Simmons, I., van Dijk, N., Di Marco, C., Nemitz, E., Dämmgen, U., Gilke, K., Djuricic, V., Vidic, S., Gliha, Z., Borovecki, D., Mitosinkova, M., Hanssen, J. E., Uggerud, T. H., Sanz, M. J., Sanz, P., Chorda, J. V., Flechard, C. R., Fauvel, Y., Ferm, M., Perrino, C., and Sutton, M. A.: European scale application of atmospheric reactive nitrogen measurements in a low-cost approach to infer dry deposition fluxes, Agr. Ecosyst. Environ., 133, 183–195, https://doi.org/10.1016/j.agee.2009.04.027, 2009.
Tang, Y. S., Cape, J. N., Braban, C. F., Twigg, M. M., Poskitt, J., Jones, M. R., Rowland, P., Bentley, P., Hockenhull, K., Woods, C., Leaver, D., Simmons, I., van Dijk, N., Nemitz, E., and Sutton, M. A.: Development of a new model DELTA sampler and assessment of potential sampling artefacts in the UKEAP AGANet DELTA system: summary and technical report, London, Defra. (CEH Project no. C04544, C04845), available at: https://uk-air.defra.gov.uk/library/reports?report_id=861 (last access: 9 November 2018), 2015.
Tang, Y. S., Braban, C. F., Dragosits, U., Dore, A. J., Simmons, I., van Dijk, N., Poskitt, J., Dos Santos Pereira, G., Keenan, P. O., Conolly, C., Vincent, K., Smith, R. I., Heal, M. R., and Sutton, M. A.: Drivers for spatial, temporal and long-term trends in atmospheric ammonia and ammonium in the UK, Atmos. Chem. Phys., 18, 705–733, https://doi.org/10.5194/acp-18-705-2018, 2018a.
Tang, Y. S., Braban, C. F., Dragosits, U., Simmons, I., Leaver, D., van Dijk, N., Poskitt, J., Thacker, S., Patel, M., Carter, H., Pereira, M. G., Keenan, P. O., Lawlor, A., Conolly, C., Vincent, K., Heal, M. R., and Sutton, M. A.: Acid gases and aerosol measurements in the UK (1999–2015): regional distributions and trends, Atmos. Chem. Phys., 18, 16293–16324, https://doi.org/10.5194/acp-18-16293-2018, 2018b.
Tang, Y. S., Dämmgen, U., Gilke, K., Djuricic, V., Vidic, S., Gliha, Z., Borovecki, D., Mitosinkova, M., Hanssen, J. E., Uggerud, T. H., Sanz, M. J., Sanz, P., Chorda, J. V., Flechard, C. R., Fauvel, Y., Ferm,M., Perrino, C., Nemitz, E., Simmons, I., van Dijk, N., Di Marco, C., Lever, D. Owen, S., and Sutton, M. A.: Field measurements – Inferential sites (Code “C1L1”): “Bulk measurements” of anions, cations and total water soluble N; “DELTA” measurements of gaseous HNO3, HONO, SO2, HCl, NH3, aerosol NO, NO, SO, Cl−, NH and basic cations, available at: http://www.nitroeurope.ceh.ac.uk/, last access: 29 July 2020.
Theobald, M. R., Milford, C., Hargreaves, K. J., Sheppard, L. J., Nemitz, E., Tang, Y. S., Phillips, V. R., Sneath, R., McCartney, L., Harvey, F. J., Leith, I. D., Cape, J. N., Fowler, D., and Sutton, M. A.: Potential for Ammonia Recapture by Farm Woodlands: Design and Application of a New Experimental Facility, Sci. World J., 1, 956452, https://doi.org/10.1100/tsw.2001.338, 2001.
Tørseth, K., Aas, W., Breivik, K., Fjæraa, A. M., Fiebig, M., Hjellbrekke, A. G., Lund Myhre, C., Solberg, S., and Yttri, K. E.: Introduction to the European Monitoring and Evaluation Programme (EMEP) and observed atmospheric composition change during 1972–2009, Atmos. Chem. Phys., 12, 5447–5481, https://doi.org/10.5194/acp-12-5447-2012, 2012.
UNECE: 1999 Protocol to Abate Acidification, Eutrophication and Ground-level Ozone to the Convention on Long range Transboundary Air Pollution, as amended on 4 May 2012, available at: https://unece.org/environment-policyair/protocol-abate-acidification-eutrophication-and-ground-level-ozone (last access: 9 November 2018), 2012.
van Zanten, M. C., Wichink Kruit, R. J., Hoogerbrugge, R., Van der Swaluw, E., and van Pul, W. A. J.: Trends in ammonia measurements in the Netherlands over the period 1993–2014, Atmos. Environ., 148, 352–360, https://doi.org/10.1016/j.atmosenv.2016.11.007, 2017.
Vieno, M., Heal, M. R., Hallsworth, S., Famulari, D., Doherty, R. M., Dore, A. J., Tang, Y. S., Braban, C. F., Leaver, D., Sutton, M. A., and Reis, S.: The role of long-range transport and domestic emissions in determining atmospheric secondary inorganic particle concentrations across the UK, Atmos. Chem. Phys., 14, 8435–8447, https://doi.org/10.5194/acp-14-8435-2014, 2014.
Vieno, M., Heal, M. R., Williams, M. L., Carnell, E. J., Nemitz, E., Stedman, J. R., and Reis, S.: The sensitivities of emissions reductions for the mitigation of UK PM2.5, Atmos. Chem. Phys., 16, 265–276, https://doi.org/10.5194/acp-16-265-2016, 2016a.
Vieno, M., Heal, M. R., Twigg, M. M., MacKenzie, I. A., Braban, C. F., Lingard, J. N. N., Ritchie, S., Beck, R.C., Móring, A., Ots, R., Di Marco, C. F., Nemitz, E., Sutton, M. A., and Reis S.: The UK particulate matter air pollution episode of March–April 2014: more than Saharan dust, Environ. Res. Lett., 11, 044004, https://doi.org/10.1088/1748-9326/11/4/044004, 2016b.
Zaehle, S. and Dalmonech, D.: Carbon-nitrogen interactions on land at global scales: current understanding in modelling climate biosphere feedbacks, Curr. Opin. Env. Sust., 3, 311–320, https://doi.org/10.1016/j.cosust.2011.08.008, 2011.