the Creative Commons Attribution 4.0 License.
the Creative Commons Attribution 4.0 License.
 | 09 Jun 2021
Insights into seasonal variation of wet deposition over southeast Asia via precipitation adjustment from the findings of MICS-Asia III
Syuichi Itahashi
Baozhu Ge
Keiichi Sato
Junichi Kurokawa
Jiani Tan
Kan Huang
Joshua S. Fu
Xuemei Wang
Kazuyo Yamaji
Tatsuya Nagashima
Jie Li
Mizuo Kajino
Gregory R. Carmichael
Zifa Wang
Asia has attracted research attention because it has the highest anthropogenic emissions in the world, and the Model Inter-Comparison Study for Asia (MICS-Asia) phase III was carried out to foster our understanding of the status of air quality over Asia. This study analyzed wet deposition in southeast Asian countries (Myanmar, Thailand, Lao People's Democratic Republic (PDR), Cambodia, Vietnam, the Philippines, Malaysia, and Indonesia) with the aim of providing insights into the seasonal variation of wet deposition. Southeast Asia was not fully considered in MICS-Asia phase II due to a lack of observational data; however, the analysis period of MICS-Asia III, namely the year 2010, is covered by ground observations of the Acid Deposition Monitoring Network in East Asia (EANET), and the coordinated simulation domain was extended to cover these observation sites. The analyzed species are wet depositions of S (sulfate aerosol, sulfur dioxide (SO2), and sulfuric acid (H2SO4)), N (nitrate aerosol, nitrogen monoxide (NO), nitrogen dioxide (NO2), and nitric acid (HNO3)), and A (ammonium aerosol and ammonia (NH3)). The wet deposition simulated with seven models driven by a unified meteorological model in MICS-Asia III was used with the ensemble approach, which effectively modulates the differences in performance among models. By comparison with EANET observations, although the seven models generally captured the wet depositions of S, N, and A, there were difficulties capturing these in some cases. Considering the model performance for ambient aerosol concentrations over southeast Asia, this failure of models is considered to be related to the difficulty in capturing the precipitation in southeast Asia, especially during the dry and wet seasons. Generally, meteorological fields overestimate the precipitation during the dry season, which leads to the overestimation of wet deposition during this season. To overcome this, a precipitation-adjusted approach that scaled the modeled precipitation to the observed value was applied, and it was demonstrated that the model performance was improved. Satellite measurements were also used to adjust for precipitation data, which adequately accounted for the spatiotemporal precipitation patterns, especially in the dry season. As the statistical scores were mostly improved by this adjustment, the estimation of wet deposition with precipitation adjustment was considered to be superior. To utilize satellite measurements, the spatial distribution of wet deposition was revised. Based on this revision, it was found that Vietnam, Malaysia, and Indonesia were upward corrected, and Myanmar, Thailand, Lao PDR, Cambodia, and the Philippines were downward-corrected; these corrections were up to ±40 %. The improved accuracy of precipitation amount was key to estimating wet deposition in this study. These results suggest that the precipitation-adjusted approach has the potential to obtain accurate estimates of wet deposition through the fusion of models and observations.
- Article
(8793 KB) - Full-text XML
- Companion paper
-
Supplement
(9776 KB) - BibTeX
- EndNote


With the recent acceleration of its emission from anthropogenic sources, Asia has the world's highest acid deposition (Vet et al., 2014). To measure atmospheric concentrations and depositions in Asia, the Acid Deposition Monitoring Network in East Asia (EANET) has maintained an observation network over Asia since 2000. At present, 13 countries participate in EANET (EANET, 2020a). This observational study is essential for understanding the status of air quality over Asian countries. Another approach is analysis based on chemical transport models (CTMs), which numerically simulate various processes of air pollutants such as emission, transport, chemical reactions, and deposition. CTMs are based on the forefront scientific algorithms; however, uncertainties in each process are critical (Carmichael et al., 2008a). Therefore, relying on a single CTM can lead to the misinterpretation of phenomena. In order to account for uncertainties in CTMs, a multi-model intercomparison study is vital. The Model Inter-Comparison Study for Asia (MICS-Asia) has been conducted over Asian countries: phase I during 1998–2000 (Carmichael et al., 2002), phase II during 2003–2008 (Carmichael et al., 2008b), and phase III during 2010–2020. Phase III contains three parts: topic 1, involving the comparison and evaluation of current air quality models (Akimoto et al., 2019, 2020; Chen et al., 2019; Itahashi et al., 2020; Kong et al., 2020; Li et al., 2019); topic 2, involving the development of emission inventories for Asia (Li et al., 2017); and topic 3, involving the study of interactions between air quality and climate change (Gao et al., 2018, 2020). In terms of deposition, Itahashi et al. (2020) presented an overview of model performance in MICS-Asia III and reported that models generally captured the observed wet deposition; however, it was found that models underestimated the wet deposition of sulfate aerosol (SO), and the differences in modeling performance were largest for nitrate aerosol (NO). For sulfur species, Tan et al. (2020) analyzed the oxidation ratio of sulfur (i.e., the conversion ratio from sulfur dioxide (SO2) to SO) and found that models underestimated the oxidation rate and thus underestimated the concentration and deposition of SO. In China, which is one of the dominant anthropogenic emission sources in Asia, publicly available observational data were once quite limited (Chan and Yao, 2008). However, a nationwide estimation of nitrogen burden has been reported by Liu et al. (2013) and a national observation network has been established (see Ge et al., 2020, and references therein). The use of large amounts of observational data for China is one of the advantages of MICS-Asia III. Ge et al. (2020) analyzed the reactive nitrogen deposition over China, and the results indicated that wet deposition of ammonium aerosol (NH) was underestimated by all models across China.

Figure 1Map of southeast Asia. Circles with different colors indicate observation sites classified as remote (white), rural (light gray), and urban (dark gray) by the Acid Deposition Monitoring Network in East Asia (EANET). Map colors indicate the eight countries participating in EANET in 2010.
This study focuses on southeast Asia. This area has received research attention due to its severe air pollution, which in some cases is caused by emissions from biomass burning (Itahashi et al., 2018; Vadrevu and Justice, 2011). Recently, the 7-Southeast Asian Studies (7SEAS) program was formed to facilitate interdisciplinary research (Lin et al., 2013; Reid et al., 2013). Due to the lack of observational data from EANET, the status of deposition over southeast Asia was not fully analyzed in phase II of MICS-Asia (Wang et al., 2008). However, in phase III, EANET observational data are available and southeast Asian countries are fully covered by the simulation domain in CTMs. In an overview paper (Itahashi et al., 2020), we presented the acid deposition status over Asia; however, this presentation was mostly limited to the annual-accumulated status. Over southeast Asia, which experiences distinct dry and wet seasons, wet deposition varies dramatically between these seasons. Detailed analysis is required to advance our understanding of the wet deposition status over this region, which motivated the present study. Additionally, in Itahashi et al. (2020), we reported the uncertainty of the current model-based estimation of wet deposition and proposed two approaches for improving this estimation, namely model ensemble and precipitation adjustment. The former can modulate the differences between models and the latter can adjust the precipitation amount based on observational data. A total of eight southeast Asian countries participate in EANET. Figure 1 shows a map of the EANET observation sites over southeast Asia whose data were used in this study. Hereafter, Myanmar, Thailand, the Lao People's Democratic Republic (PDR), Cambodia, and Vietnam are taken to constitute continental southeast Asia, and the Philippines, Malaysia, and Indonesia are taken to constitute oceanic southeast Asia. The available EANET observation sites are limited over southeast Asia; therefore, spatial interpolation methods (e.g., kriging, land use regression) that directly use observational data (Briggs et al., 2000; Ross et al., 2007; Araki et al., 2017) may be difficult to apply. Under the framework of MICS-Asia III, an emission inventory over Asia was developed as MIX emissions (Li et al., 2017), and this is used for input data on CTMs in MICS-Asia III and subsequently conducted model intercomparison study over Asia. Producing maps of the estimated wet deposition through CTMs can be a reasonable approach to achieve this goal. This paper is organized as follows. Section 2 describes MICS-Asia phase III in terms of the framework of model intercomparison and observational data. Section 3 presents the results of the analysis of the wet depositions over southeast Asia and discusses the problems in the current models. Section 4 explains how the precipitation-adjusted approach was applied and demonstrates that it improved the modeling performance for wet deposition. The precipitation data used to linearly scale the modeled precipitation were EANET observational data reported previously (Itahashi et al., 2020), and satellite measurements were also used in this study to improve upon this previous study. Furthermore, the wet deposition amount and the fraction of wet deposition occurring during the dry and wet seasons are presented before and after the application of the precipitation-adjusted approaches. Additionally, revised wet deposition maps over southeast Asia are presented. Finally, Sect. 5 gives a summary of this study and looks toward the next phase (IV) of MICS-Asia.
Table 1Descriptions of the models used in this acid deposition study.
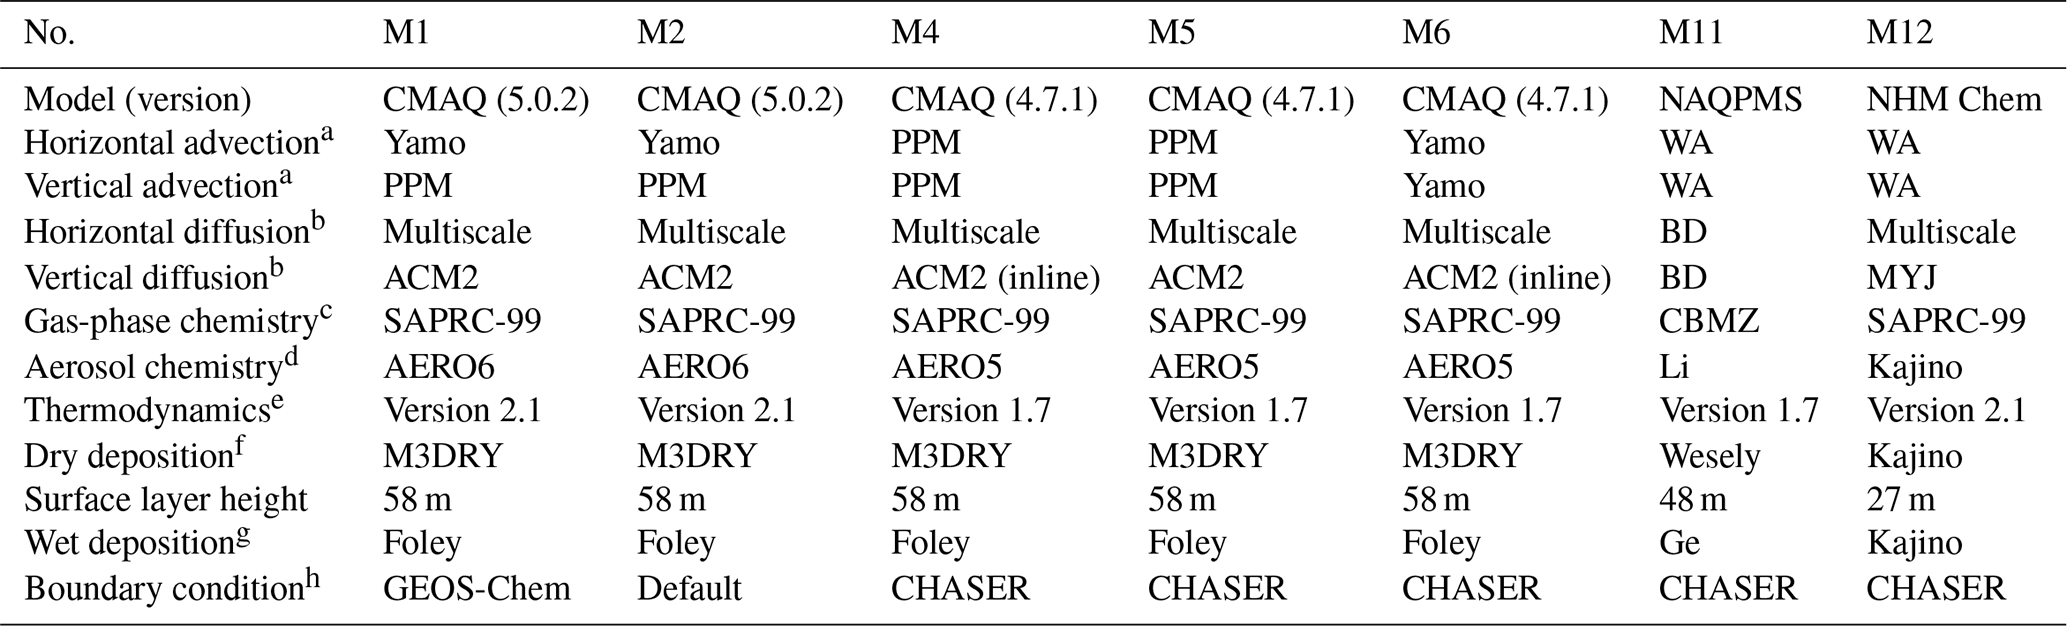
a References for the advection scheme are as follows: Yamo: Yamartino
(1993); PPM: piecewise parabolic method (Colella and Woodward, 1984); WA:
Walcek and Aleksic (1998).
b References for the diffusion scheme are as follows: ACM2: Asymmetric
Convective Model version 2 (Pleim, 2007a, b); BD: Byun and Dennis (1995);
multiscale: Byun and Schere (2006); MYJ: Janjic (1994).
c References for the gas-phase chemistry are as follows: CBMZ: Zaveri and
Peters (1999); SAPRC-99: Carter (2000).
d References for the aerosol chemistry are as follows: AERO5: Foley et
al. (2010); AERO6: Appel et al. (2013); Kajino: Kajino et al. (2019a); Li: Li et
al. (2011).
e On thermodynamics. All models use ISORROPIA but different versions,
namely version 1.7 (Nenes et al., 1998) or version 2.1 (Fountoukis and
Nenes, 2007).
f References for the dry deposition scheme are as follows: M3DRY: Pleim et
al. (2001); Kajino: Kajino et al. (2019a); Wesely: Wesely (1989).
g References for the wet deposition scheme are as follows: Foley: Foley et
al. (2010); Ge: Ge et al. (2014); Kajino: Kajino et al. (2019a).
h References for the boundary condition are as follows: CHASER: Sudo et
al. (2002a, b); GEOS-Chem: Bey et al. (2001). Note that model M2 adopted the
default boundary
condition in the Community Multiscale Air Quality (CMAQ)
modeling system.
2.1 Model description
In MICS-Asia phase III, the target year was 2010. The participating models were requested to submit the monthly accumulated dry and wet deposition amounts of S species (SO, SO2, sulfuric acid (H2SO4)), N species (NO, nitrogen monoxide (NO), nitrogen dioxide (NO2), nitric acid (HNO3)), and A species (NH and ammonia (NH3)). In total, nine models (M1, M2, M4, M5, M6, M11, M12, M13, and M14; these numbers are unified for MICS-Asia phase III) were used in this deposition analysis; these models are summarized in an overview paper (Itahashi et al., 2020, Table 1). In this study, seven models (M1, M2, M4, M5, M6, M11, and M12) that using the same meteorological fields simulated by the Weather Research and Forecasting (WRF) model version 3.4.1 (Skamarock et al., 2008) over the unified modeling domain were selected. The unified modeling domain covered the whole of Asia with a horizontal grid resolution of 45 km and 40 vertical layers from the surface up to 10 hPa. Descriptions of the seven models are listed in Table 1. Models M1, M2, M4, M5, and M6 were from the Community Multiscale Air Quality (CMAQ) modeling system (Byun and Schere, 2006) developed by the U.S. Environmental Protection Agency (EPA) but were configured differently in terms of model version, horizontal and vertical advection/diffusion schemes, gas-phase and aerosol chemistry, dry and wet deposition schemes, and lateral boundary conditions. M11 was the nested air quality prediction model system (NAQPMS) developed by the Institute of Atmospheric Physics (IAP), Chinese Academy of Sciences (CAS) (Ge et al., 2014; Li et al., 2016), and M12 was the non-hydrostatic mesoscale model coupled with a chemistry transport model (NHM-Chem) developed by the Meteorological Research Institute (MRI), Japan (Kajino et al., 2019a). For the CMAQ models, the versions were the same for some models; however, the internal settings of advection and diffusion were different, and an aerosol scheme with thermodynamics was updated. The boundary conditions were different for the CMAQ models. The input emissions data were unified for all models using the MIX inventory (Li et al., 2017). The details of the model configurations and the verification of model performance have been published for gas (Kong et al., 2020; Li et al., 2019), aerosols (Chen et al., 2019), and deposition (Ge et al., 2020; Itahashi et al., 2020; Tan et al., 2020).
To reduce the uncertainty in various processes and configurations of the models, an ensemble approach was applied to the model results. In the findings of MICS-Asia phase II, it was clarified that the ensemble means, rather than means of individual models, agreed well with observed sulfate and total ammonium levels (Hayami et al., 2008). In another model comparison study, namely the Air Quality Model Evaluation International Initiative (AQMEII), which focuses on North America and Europe, model performance was improved by using the ensemble mean (Solazzo et al., 2012). In MICS-Asia phase III, an ensemble approach for the gas species NO2, NH3, and CO (Kong et al., 2020), O3 (Li et al., 2019), aerosols (Chen et al., 2019), and depositions (Ge et al., 2020; Itahashi et al., 2020; Tan et al., 2020) has been used and has generally performed well compared with each model. The equation used to calculate the ensemble mean (ENS) is as follows:
where WD is the wet deposition, and N is the number of models, which is seven in this study. Solazzo et al. (2012) proposed a method to produce a better ensemble. In the deposition analysis of MICS-Asia phase III, a simple ensemble and a weighted ensemble were performed using the correlation coefficient (R) between the modeled and observed wet deposition (Itahashi et al., 2020). It was found that R was always improved by the weighted ensemble; however, biases can be worse in a weighted ensemble for some cases. Therefore, a simple ensemble based on the arithmetic average was applied in this study. The calculated ENS was compared with observations over southeast Asia.
Table 2Information of 25 EANET observation sites located in southeast Asia.

Note: site nos. are unified with the overview paper of Itahashi et al. (2020).
2.2 EANET observations
In EANET, wet deposition is observed by a wet-only sampler that is designed to collect samples during precipitation (EANET, 2010). The locations of the observation sites used in this study are plotted in Fig. 1, and Table 2 shows the latitude, longitude, altitude, sampling interval, and classification information for each. The identification numbers of the sites are unified with the overview paper of deposition analysis of MICS-Asia III (Itahashi et al., 2020). The site classification is defined as follows: urban sites are located in urbanized and industrialized areas; rural sites are located more than 20 km away from large pollution sources; and remote sites are located more than 50 km away from large pollution sources and more than 500 m away from main roads. Ion chromatography was used to analyze anions (SO and NO) and cations (NH). The observational data were checked by ion balance and conductivity agreement. The data completeness was determined from the duration of precipitation coverage and total precipitation amount (EANET, 2000). The sampling intervals differed from site to site, being either daily, weekly, or every 10 d (EANET, 2020b). The monthly accumulated wet deposition at each site was used for the model evaluation. For weekly or 10 d observational data, the central observation day was regarded to represent the corresponding month, and then the monthly accumulated wet deposition was calculated. Meanwhile, the model results were simply calculated from the calendar date. For the analyzed period, observational data were not available for Vientiane (no. 37; Table 2) in Lao PDR, and therefore this location was not analyzed in this study.
To evaluate the model performance compared with EANET observations, the statistical metrics of R, normalized mean bias (NMB), and normalized mean error (NME) were used. These are defined as follows:
where N is the total number of paired observations (O) and models (M). Additionally, the percentage of the total that fell within a factor of 2 (FAC2), within a factor of 3 (FAC3), and within a factor of 5 (FAC5) were also calculated to judge the agreement between observations and models.
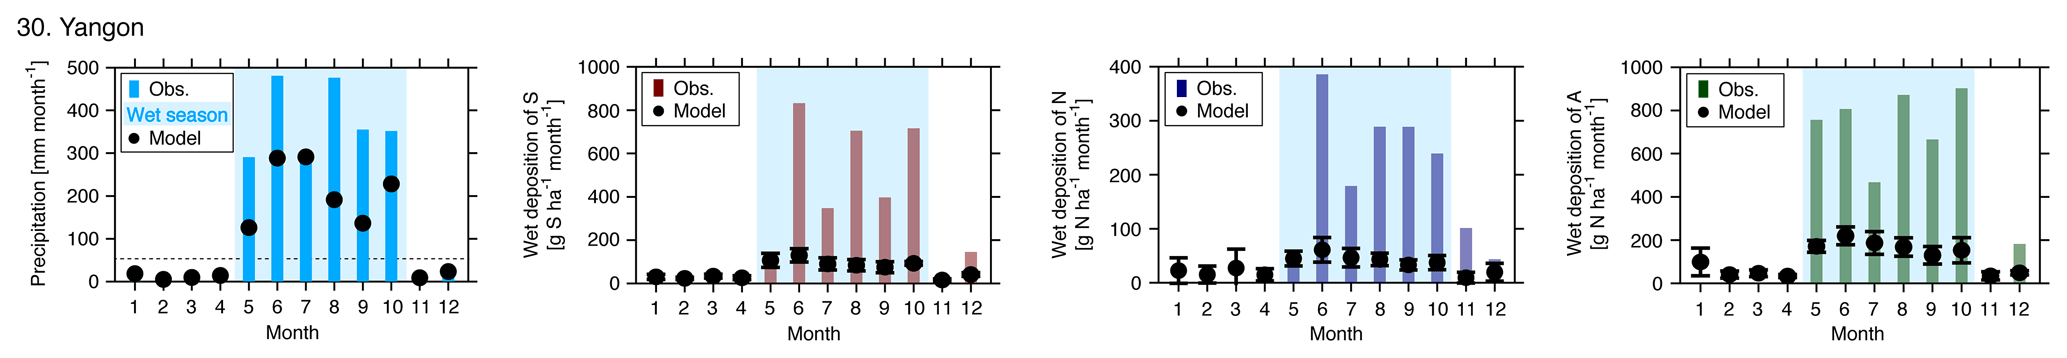
Figure 2Monthly accumulated precipitation and wet depositions of S, N, and A in Yangon, Myanmar. Whiskers represent the standard deviation among the seven models, and the wet season (light blue color) is defined as months when precipitation exceeded 50 mm.
Table 3Statistical analysis of the model performance for Yangon, Myanmar.
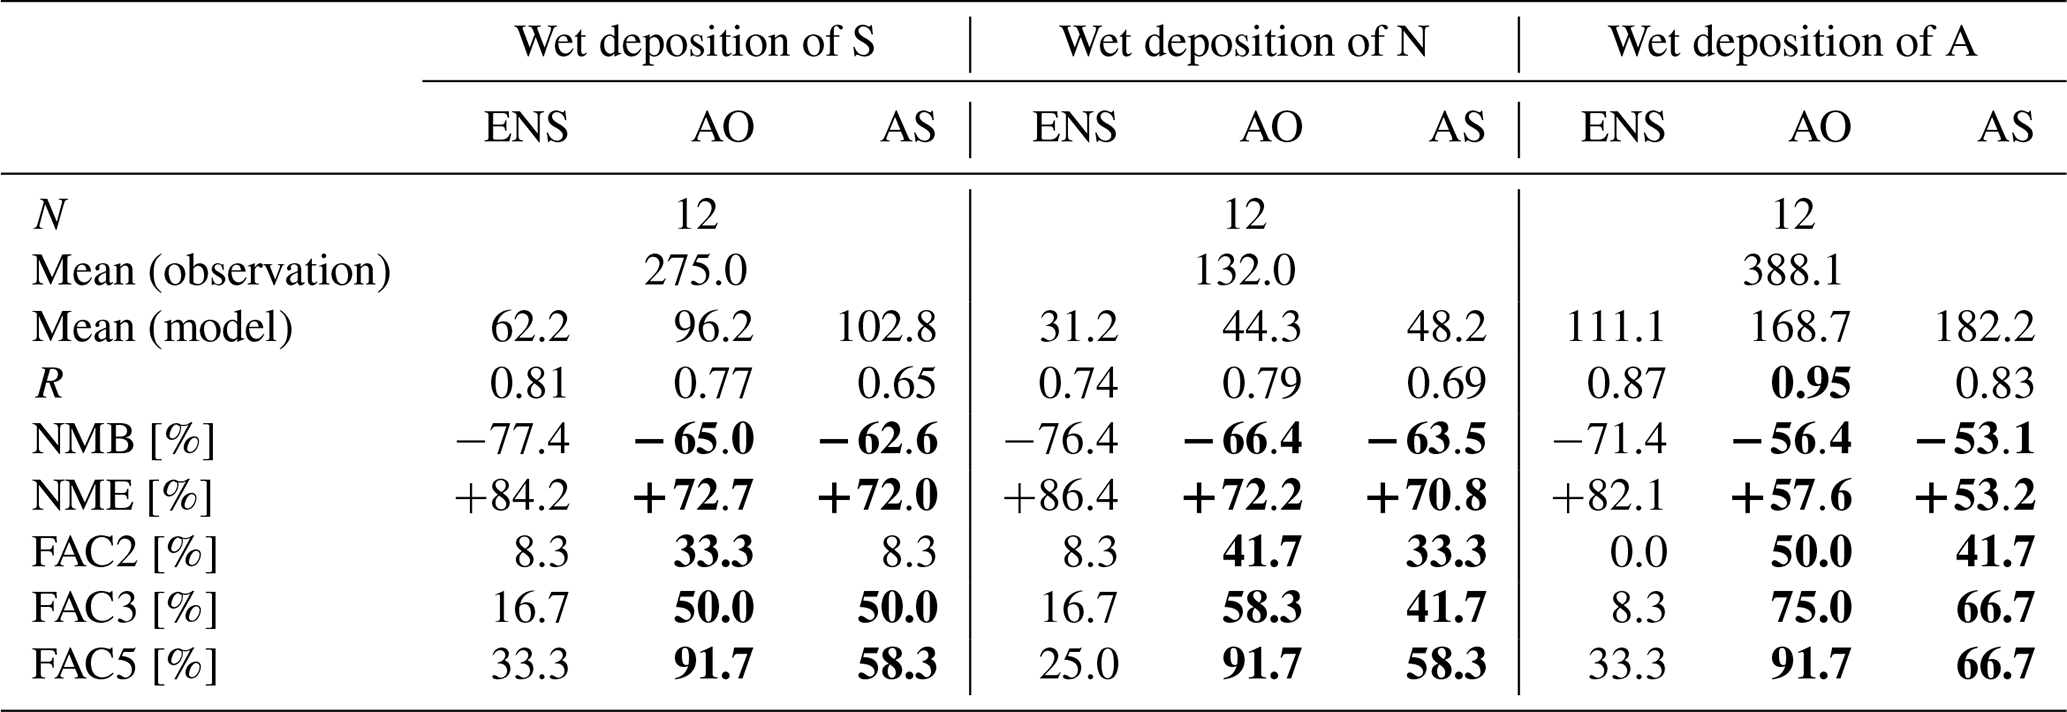
Note: units are g S ha−1 month−1 for the wet deposition of S and g N ha−1 month−1 for the wet depositions of N and A. Improvements in the statistical score with AO and AS compared to ENS are shown in bold font.
3.1 Seasonal variation of wet deposition for each country over southeast Asia
3.1.1 Myanmar
Myanmar has one EANET site for wet deposition in Yangon (no. 30; Table 2). A comparison between observational and model-simulated data for precipitation and wet depositions is shown in Fig. 2. In 2010, the observed monthly accumulated precipitation was zero from January to April, 7.5 mm in November, 25.4 mm in December, and around 300 mm from May to October. Hereafter, precipitation of 50 mm/month is used as the threshold to divide the dry and wet seasons. Based on this criterion, the dry and wet seasons were clearly characterized from observed precipitation; however, the model simulated light precipitation of around 20 mm even during the dry season and underestimated precipitation during the wet season. Due to the seasonal variation in the observed precipitation, the observed wet depositions of S, N, and A also exhibited a clear seasonal dependency during the dry and wet seasons. Compared with the observed wet deposition, the model generally overestimated the wet deposition during the dry season and underestimated it during the wet season. At the Yangon (no. 30) site, the model variation (shown by whiskers in Fig. 2) was small for the wet depositions of S, N, and A; this indicates that the overestimation during the dry season and underestimation during the wet season were common among all models. These results indicate that the model performance for precipitation could be a critical factor in determining the model performance for wet deposition. The statistical performance of the simulated wet depositions of S, N, and A is listed in Table 3. The ENS results showed a good correlation with the observed data, with an R of around 0.8; however, there was a large underestimation for wet deposition, with an NMB greater than −70 % and an NME greater than 80 %. As suggested by the observed monthly wet deposition amount shown in Fig. 2, these underestimations were mainly due to the model performance during the wet season.

Figure 3Monthly accumulated precipitation and wet depositions of S, N, and A over Thailand. Whiskers represent the standard deviation among the seven models, and the wet season (light blue color) is defined as months when precipitation exceeded 50 mm. Months shown in red indicate a lack of observational data.
3.1.2 Thailand
In Thailand, there are six EANET sites for wet deposition, namely Bangkok (no. 31), Samut Prakan (no. 32), Pathum Thani (no. 33), Kanchanaburi (no. 34), Nakhon Ratchasima (no. 35), and Chiang Mai (no. 36; Table 2). A comparison between the observed and simulated precipitation and wet deposition is shown in Fig. 3. The dry and wet seasons were clearly distinct; the wet season is from May to October at Bangkok (no. 31), Samut Prakan (no. 32), Pathum Thani (no. 33), Kanchanaburi (no. 34), and Chiang Mai (no. 36), and from March to October at Nakhon Ratchasima (no. 35). Compared to the monthly precipitation pattern, the observed monthly variations of precipitation amount and wet deposition did not show a clear relationship at Kanchanaburi (no. 34), Nakhon Ratchasima (no. 35), or Chiang Mai (no. 36). Over these sites, ambient concentrations might have contributed to the amount of the wet deposition amount. The model generally overestimated precipitation during the dry season at all six sites. For the wet depositions of S and N, the model tended to underestimate in Bangkok (no. 31), Samut Prakan (no. 32), Pathum Thani (no. 33), and Nakhon Ratchasima (no. 35) during the wet season, which is related to the underestimation of precipitation itself, whereas the model overestimated precipitation in Kanchanaburi (no. 34) and Chiang Mai (no. 36) throughout the year. Large inter-model variability in the modeled wet deposition was found in some months at Kanchanaburi (no. 34). This could be related to the difference in the ambient concentration and the difference in the mechanisms of the wet deposition scheme because all models used the same meteorological field. It should be noted that all models always showed a large wet deposition in February, March, and November, despite the observed zero wet deposition amount in these months (due to the lack of precipitation during the dry season). This suggests that the discrepancy in the simulated precipitation amount could be the cause of the inaccurate simulation of wet deposition. The results of the statistical analyses are listed in Table 4. ENS showed underestimation for the wet depositions of S, N, and A, with an NMB of −20 % to −50 % and an NME larger than 80 %. Additionally, the correlation between the observed and simulated data was small, especially for S, which showed no linear correlation. The observed wet deposition amount was higher in the wet season, but the amount modeled throughout the year was nearly constant.
Table 4Statistical analysis of the model performance for six sites in Thailand.
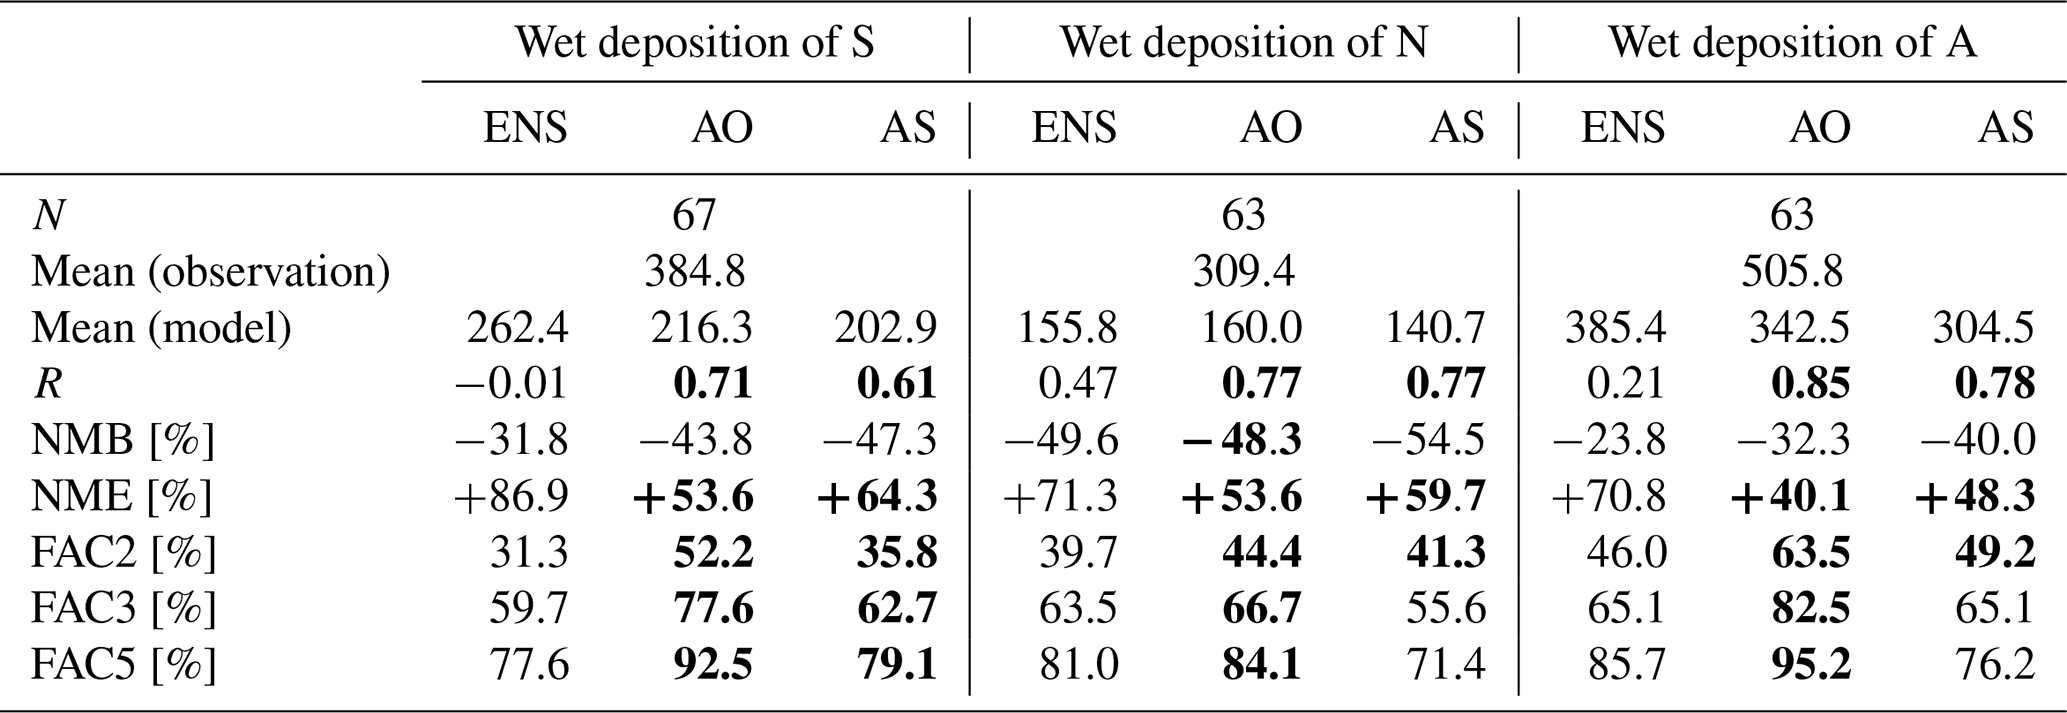
Note: units are g S ha−1 month−1 for the wet deposition of S and g N ha−1 month−1 for the wet depositions of N and A. Improvements in the statistical score with AO and AS compared with ENS are shown in bold font.
3.1.3 Cambodia
Cambodia has one EANET site for wet deposition in Phnom Penh (no. 38; Table 2). A comparison between the observed and simulated precipitation and wet deposition is shown in Fig. 4. The wet season (monthly accumulated precipitation more than 50 mm) lasted from March to November. According to this precipitation pattern, higher wet depositions of S, N, and A were also observed during the wet season. However, the ENS underestimated the wet deposition amount during the wet season, especially in June and July; this is related to the underestimation of precipitation in these months. All models commonly underestimated the wet deposition during the wet season. The statistical analysis is summarized in Table 5. The correlation between the observed and simulated data was low, especially for the wet deposition of S, while the NMB and NME were around −70 % and 70 %–80 %, respectively, for the wet depositions of S, N, and A; that is, there were some difficulties in capturing the wet deposition at this site, even using the ENS.
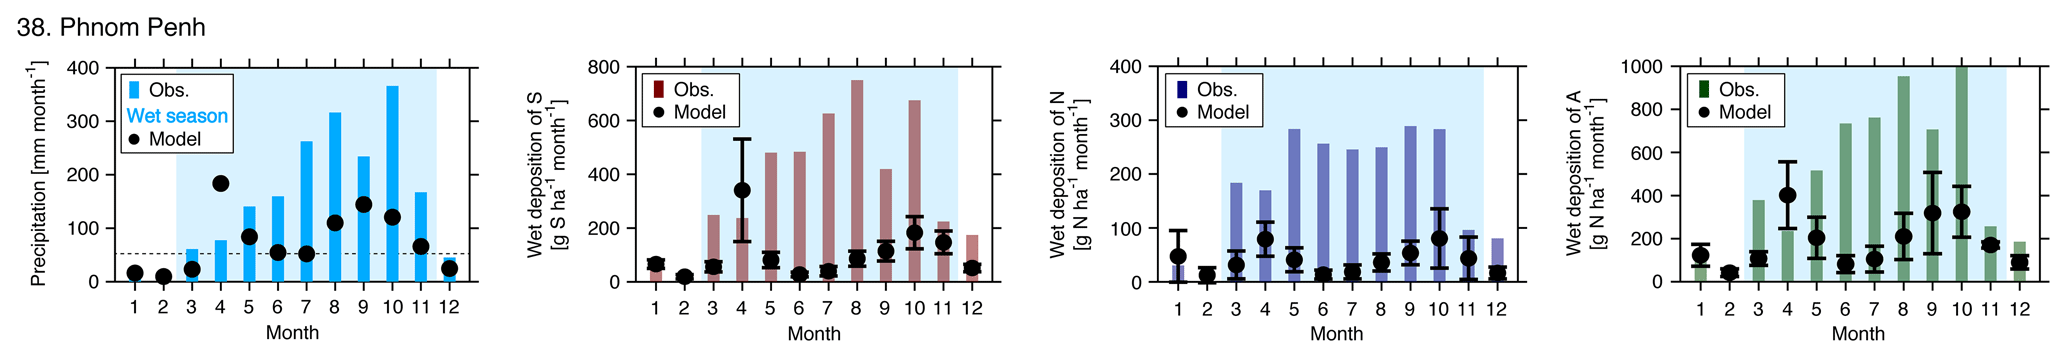
Figure 4Monthly accumulated precipitation and wet depositions of S, N, and A in Phnom Penh, Cambodia. Whiskers represent the standard deviation among the seven models, and the wet season (light blue color) is defined as months when precipitation exceeded 50 mm.
Table 5Statistical analysis of the model performance for Phnom Penh, Cambodia.
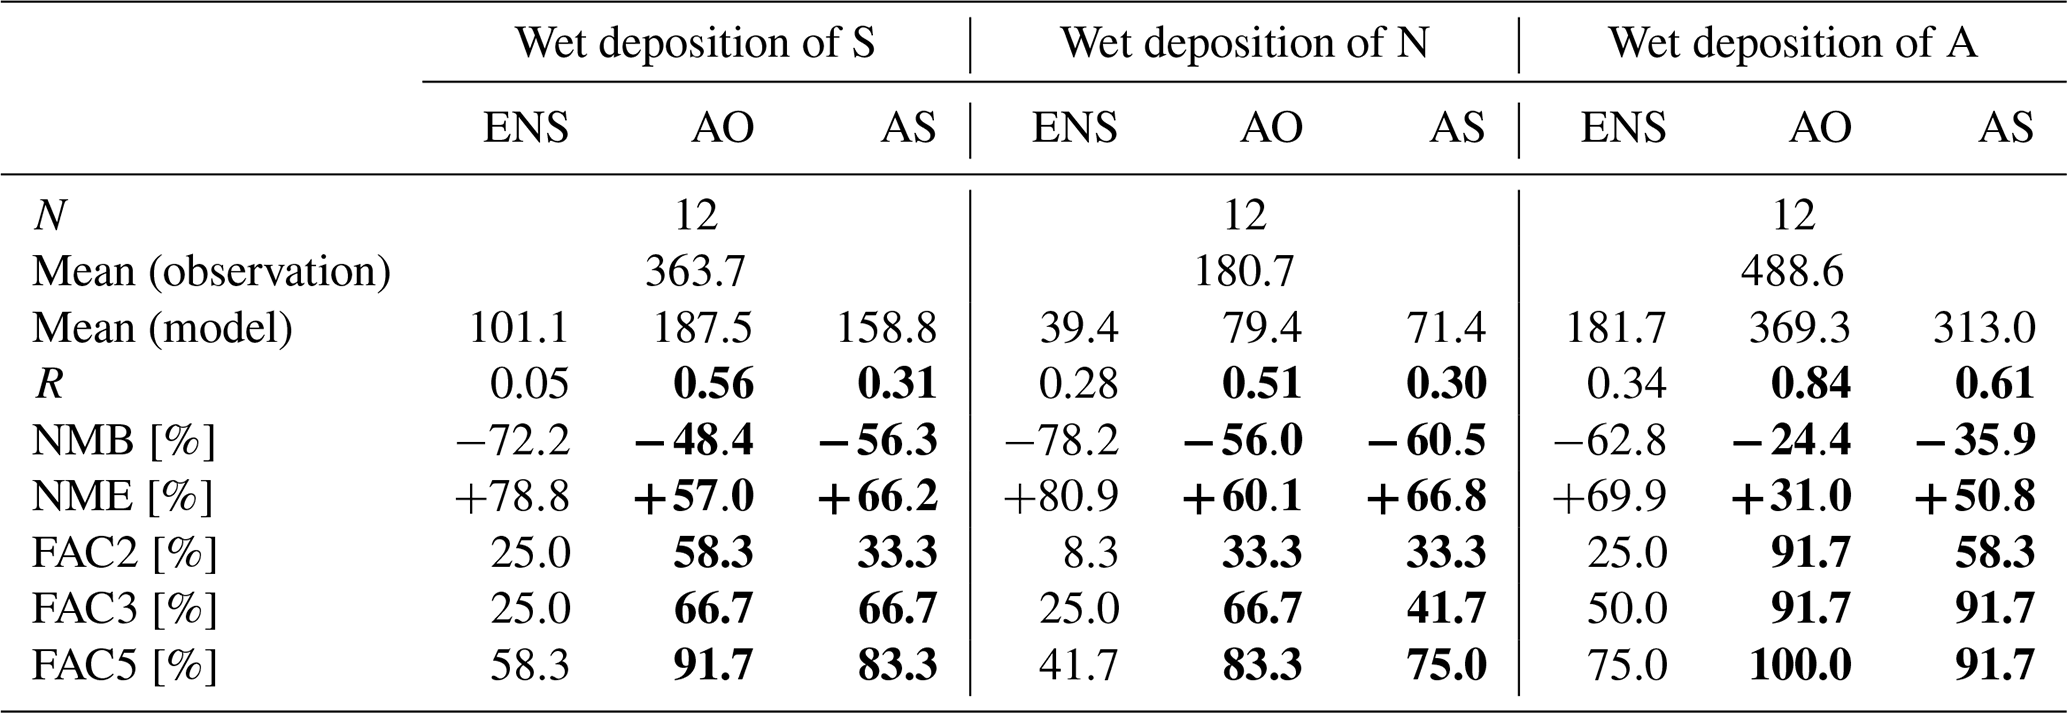
Note: units are g S ha−1 month−1 for the wet deposition of S and g N ha−1 month−1 for the wet depositions of N and A. Improvements in the statistical score with AO and AS compared with ENS are shown in bold font.
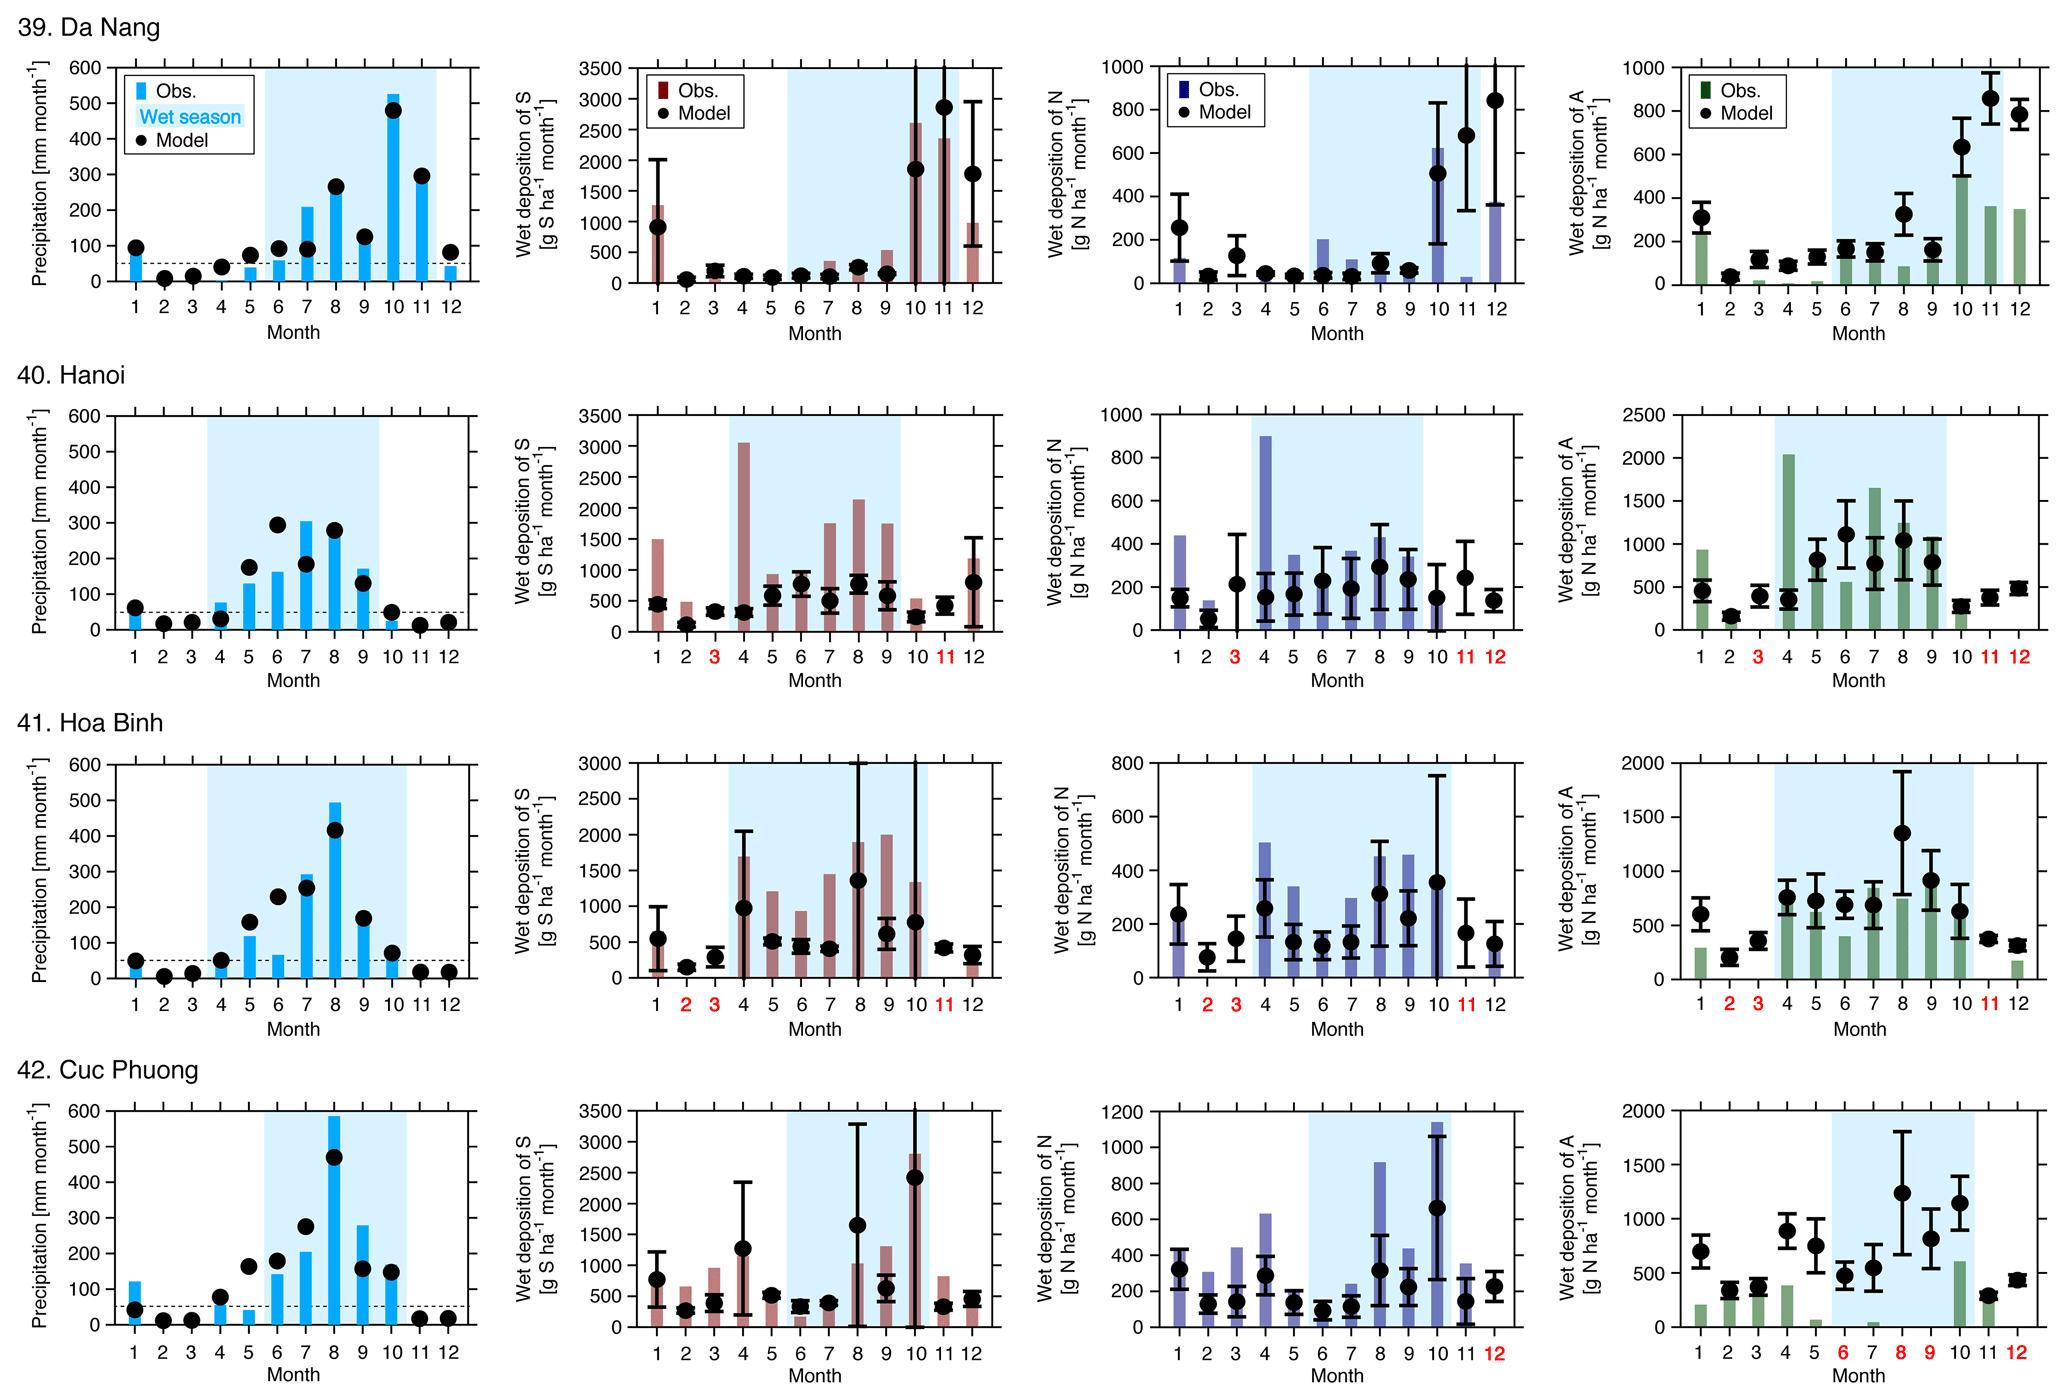
Figure 5Monthly accumulated precipitation and wet depositions of S, N, and A over Vietnam. Whiskers represent the standard deviation among the seven models, and the wet season (light blue color) is defined as months when precipitation exceeded 50 mm. Months shown in red indicate a lack of observational data.
3.1.4 Vietnam
Vietnam has four EANET sites for wet deposition, namely Da Nang (no. 39), Hanoi (no. 40), Hòa Bình (no. 41), and Cúc Phuong (no. 42; Table 2). A comparison between the observed and simulated precipitation and wet deposition is shown in Fig. 5. Compared with other countries in continental southeast Asia, precipitation patterns during the dry and wet seasons were relatively well captured at the four sites in Vietnam. Accordingly, the wet depositions of S, N, and A obtained by the ENS can generally reproduce the observed data. There were large inter-model differences when the precipitation was high. This result suggests that heavy rain events may lead to large inter-model variability in the simulated wet deposition, and the mechanisms should be further investigated. As concluded in our overview paper (Itahashi et al., 2020), this is one of the lessons learned in MICS-Asia phase III, and this will be addressed as part of the next MICS-Asia. The results of the statistical analysis are shown in Table 6. As can be seen from the table, as well as from Fig. 5, the statistical scores for Vietnam were better than those for the other countries in continental southeast Asia. The R value was around 0.5–0.6, while the NMB was around −35 % for the wet depositions of S and N and around +15 % for the wet deposition of A. The NME was around +50 %, which was smaller than for other countries in continental southeast Asia.
Table 6Statistical analysis of the model performance for four sites in Vietnam.
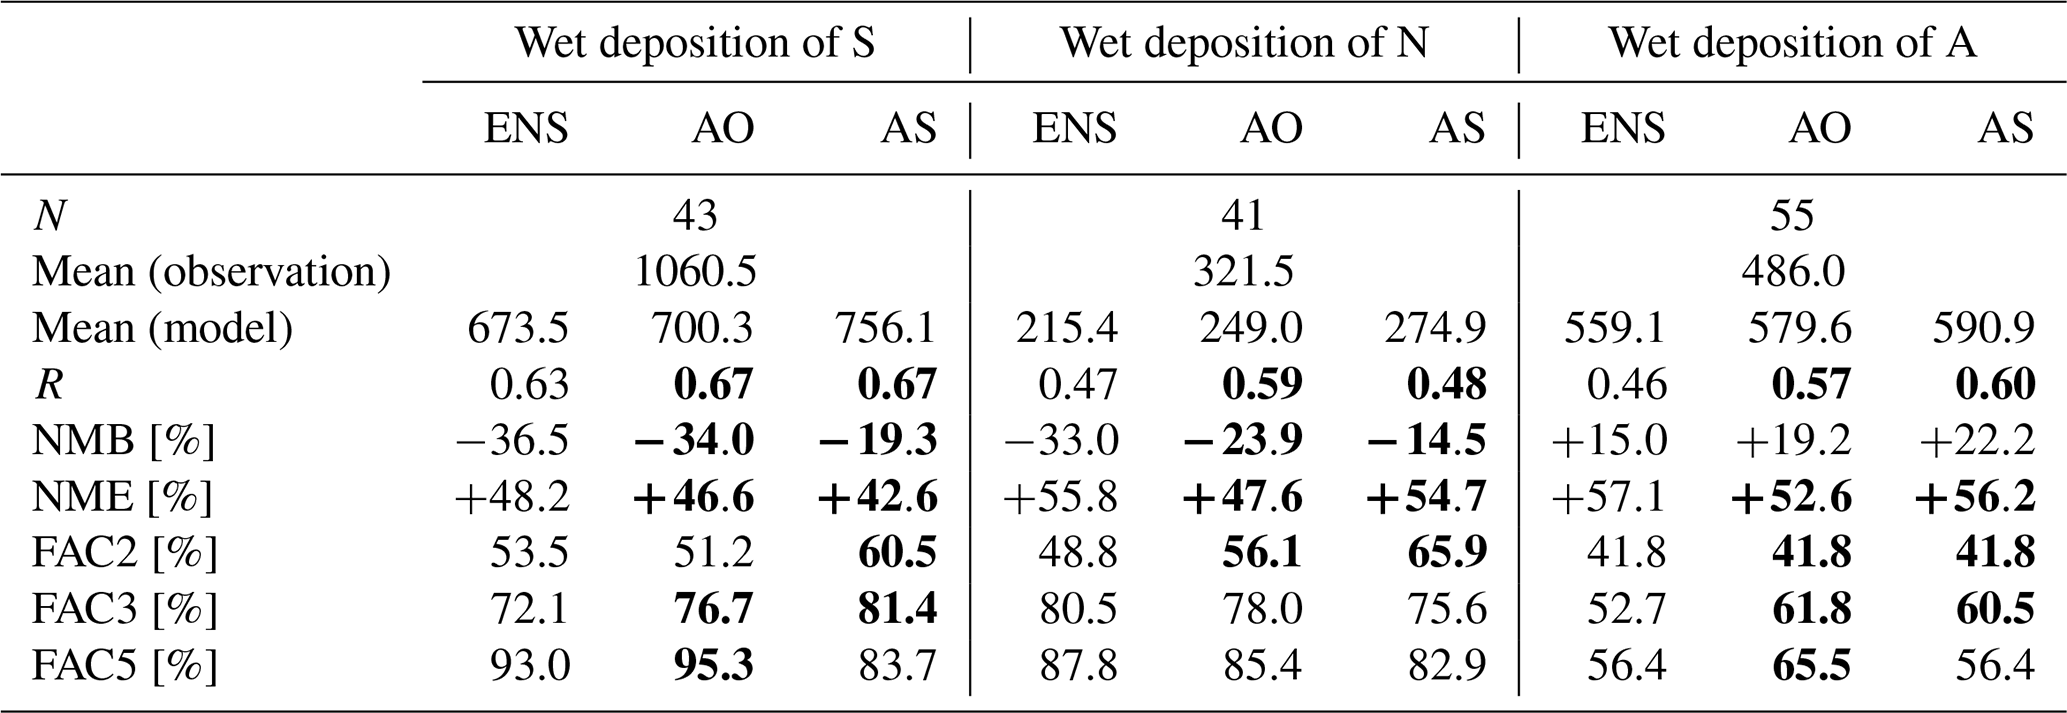
Note: units are g S ha−1 month−1 for the wet deposition of S and g N ha−1 month−1 for the wet depositions of N and A. Improvements in the statistical score with AO and AS compared with ENS are shown in bold font.

Figure 6Monthly accumulated precipitation and wet depositions of S, N, and A over the Philippines. Whiskers represent the standard deviation among the seven models, and the wet season (light blue color) is defined as months when precipitation exceeded 50 mm. Months shown in red indicate a lack of observational data.
Table 7Statistical analysis of the model performance for three sites in the Philippines.
Note: units are g S ha−1 month−1 for the wet deposition of S and g N ha−1 month−1 for the wet depositions of N and A. Improvements in the statistical score with AO and AS compared with ENS are shown in bold font.
3.1.5 Philippines
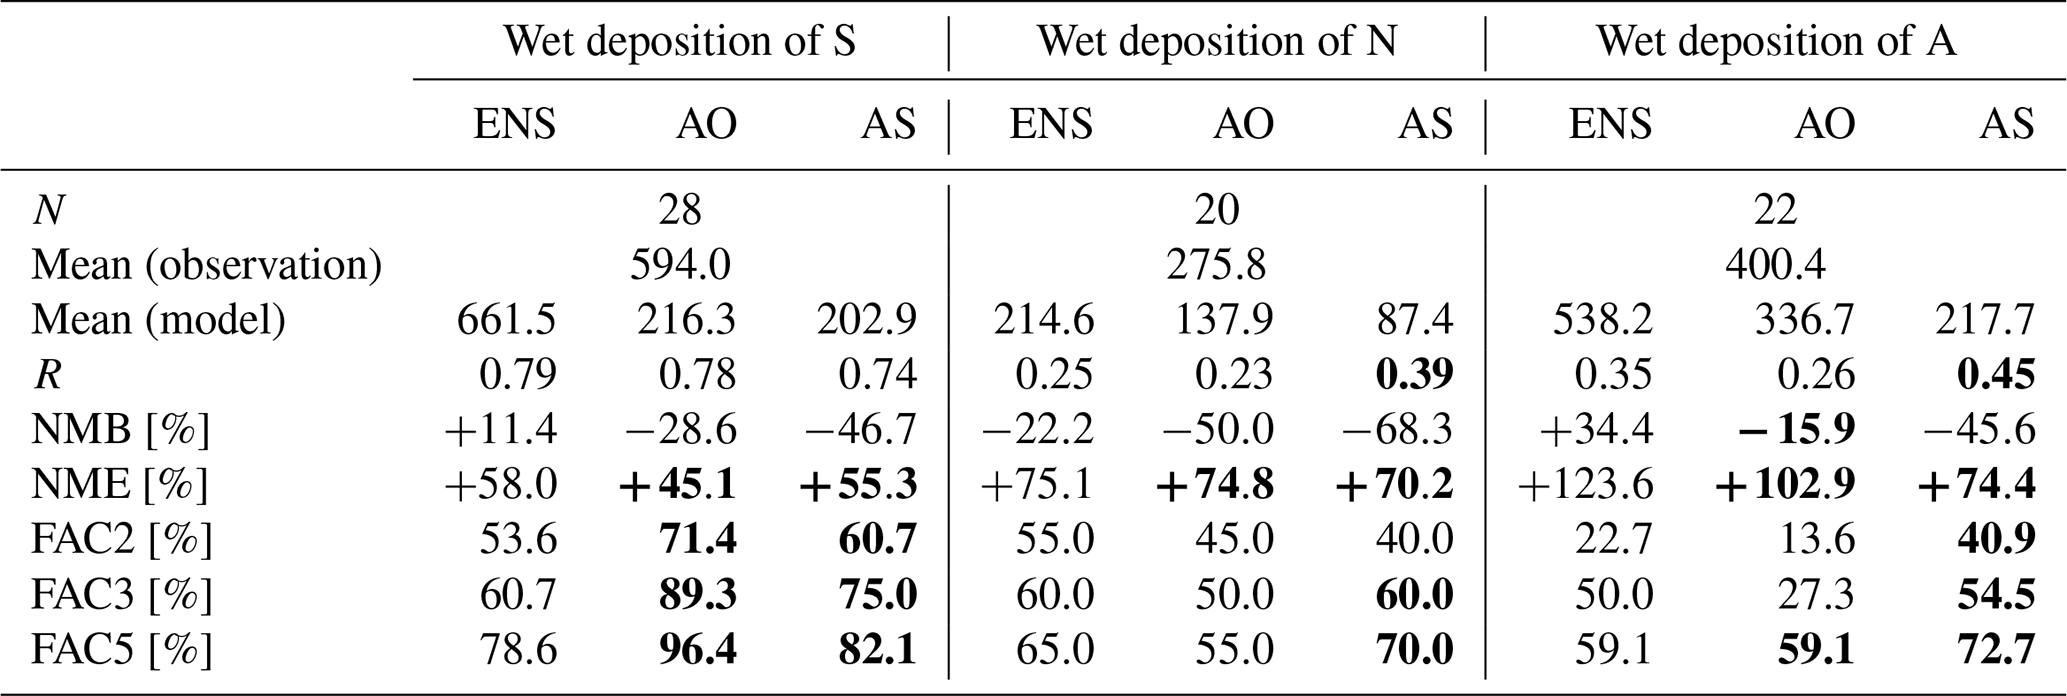
There are three EANET sites for wet deposition in the Philippines, namely Metro Manila (no. 43), Los Baños (no. 44), and Mt. Santo Tomas (no. 45; Table 2). A comparison between the observed and simulated precipitation and wet deposition is shown in Fig. 6. The wet season was classified from June to December at Metro Manila (no. 43) and Los Baños (no. 44), and from April to November at Mt. Santo Tomas (no. 45). Generally, the model captured the seasonal variation of precipitation adequately, but the precipitation was overestimated during the dry season. Because of this precipitation overestimation, the ENS also tended to overestimate the wet depositions of S, N, and A. Compared with other countries, the inter-model differences were larger for the sites in the Philippines. Further seeking of model wet deposition schemes focused on this region will be needed. The statistical analysis is presented in Table 7. For the wet deposition of S, R was 0.79 and NMB and NME were +11.4 % and +58.0 %, respectively. The ENS captured the wet deposition of S adequately. However, the NME values were worse for the wet depositions of N and A. For example, the NME for the wet deposition of A was greater than +100 %. In particular, as shown in Fig. 6, the models could not reproduce the peaks of the wet depositions of N and A in October at either Metro Manila (no. 43) or Los Baños (no. 44). Additionally, the wet depositions of N and A was also underestimated for other months during the wet season at the same two sites. This phenomenon should be further studied in the future to improve the simulation of wet deposition at these sites.
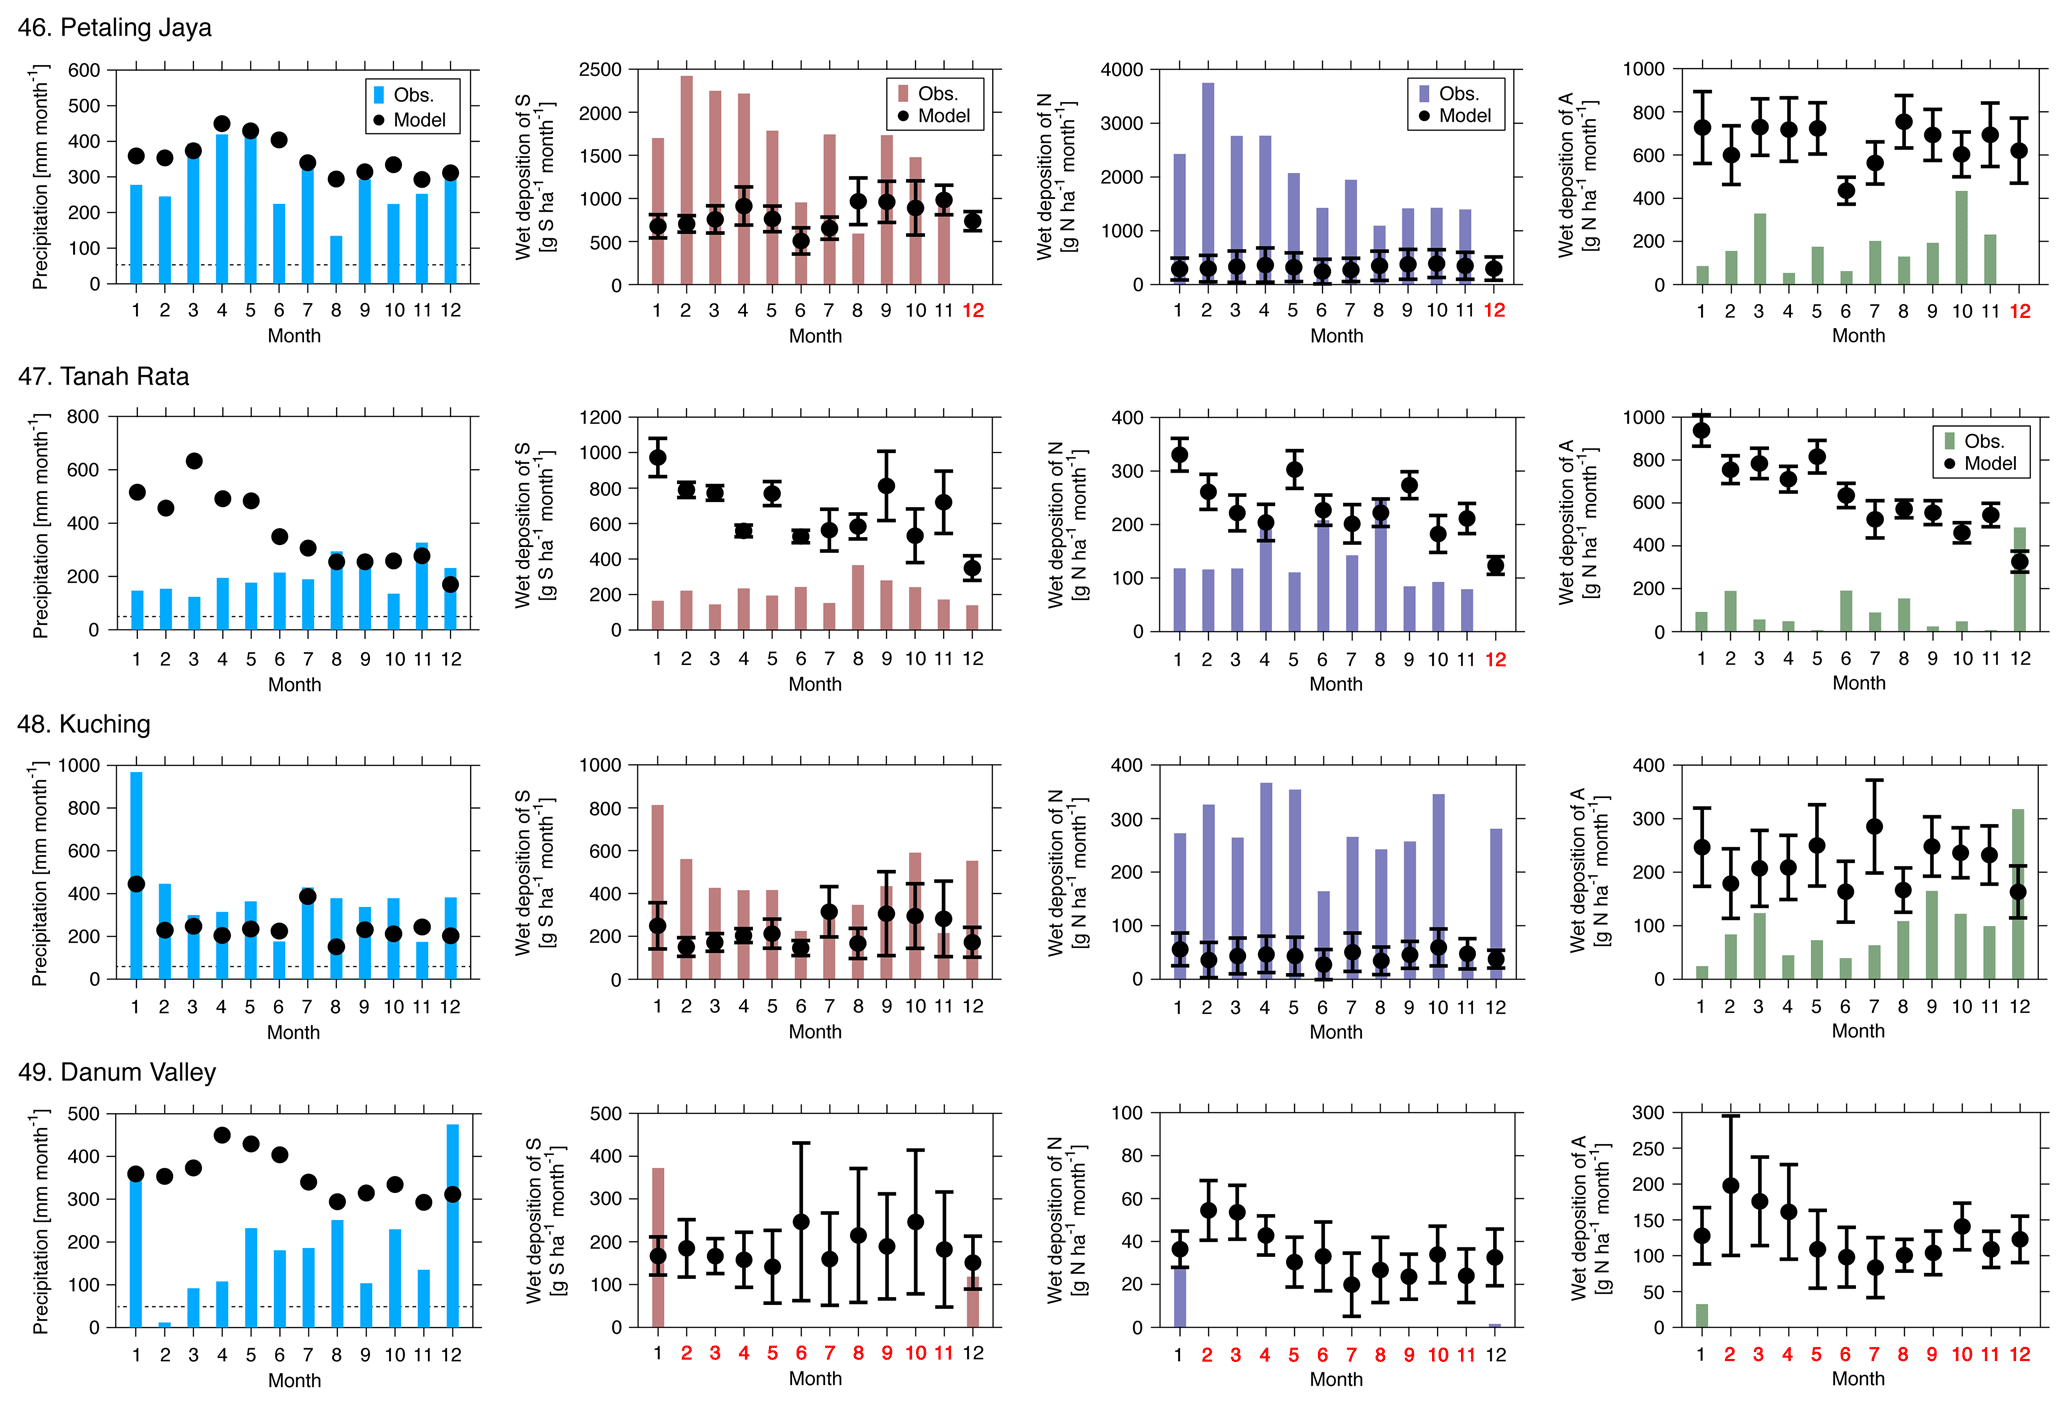
Figure 7Monthly accumulated precipitation and wet depositions of S, N, and A over Malaysia. Whiskers represent the standard deviation among the seven models. Months shown in red indicate a lack of observational data.
3.1.6 Malaysia
There are four EANET sites for wet deposition in Malaysia, namely Petaling Jaya (no. 46), Tanah Rata (no. 47), Kuching (no. 48), and Danum Valley (no. 49; Table 2). A comparison between the observed and simulated precipitation and wet deposition is shown in Fig. 7. Compared with other countries, the four sites in Malaysia did not show clear dry and wet seasons, and precipitation amounts were consistently large over the course of the year. Therefore, the division into dry and wet seasons was not conducted for the four sites in Malaysia. At Danum Valley (no. 49), the observed precipitation was greater than 50 mm in all months except February. However, there was a lack of wet deposition observations at Danum Valley (no. 49). As shown in Fig. 7, the models had difficulties capturing the behavior of wet deposition over Malaysia. At Petaling Jaya (no. 46) and Kuching (no. 48), the ENS underestimated the wet depositions of S and N and overestimated the wet deposition of A. This tendency was common as indicated by the model-to-model variability. At these two sites, observations showed a small wet deposition of N, and the balance between cations and anions should be carefully examined. At Tanah Rata (no. 47), wet deposition was dramatically overestimated for all species. The inter-model variability was small; hence, this overestimation could be connected to the overestimation of precipitation. The results of the statistical analysis are listed in Table 8. There was a moderate correlation between the observations and simulations for the wet depositions of S and N, and the NMB and NME were highest for the wet deposition of S. It should be noted that the wet deposition of A showed much higher NMB and NME values and a lower value of R; this is due to the fact that the wet deposition of A was overestimated at all four sites in Malaysia (Fig. 7).
Table 8Statistical analysis of model performance for four sites in Malaysia.
Note: units are g S ha−1 month−1 for the wet deposition of S and g N ha−1 month−1 for the wet depositions of N and A. Improvements in the statistical score with AO and AS compared with ENS are shown in bold font.
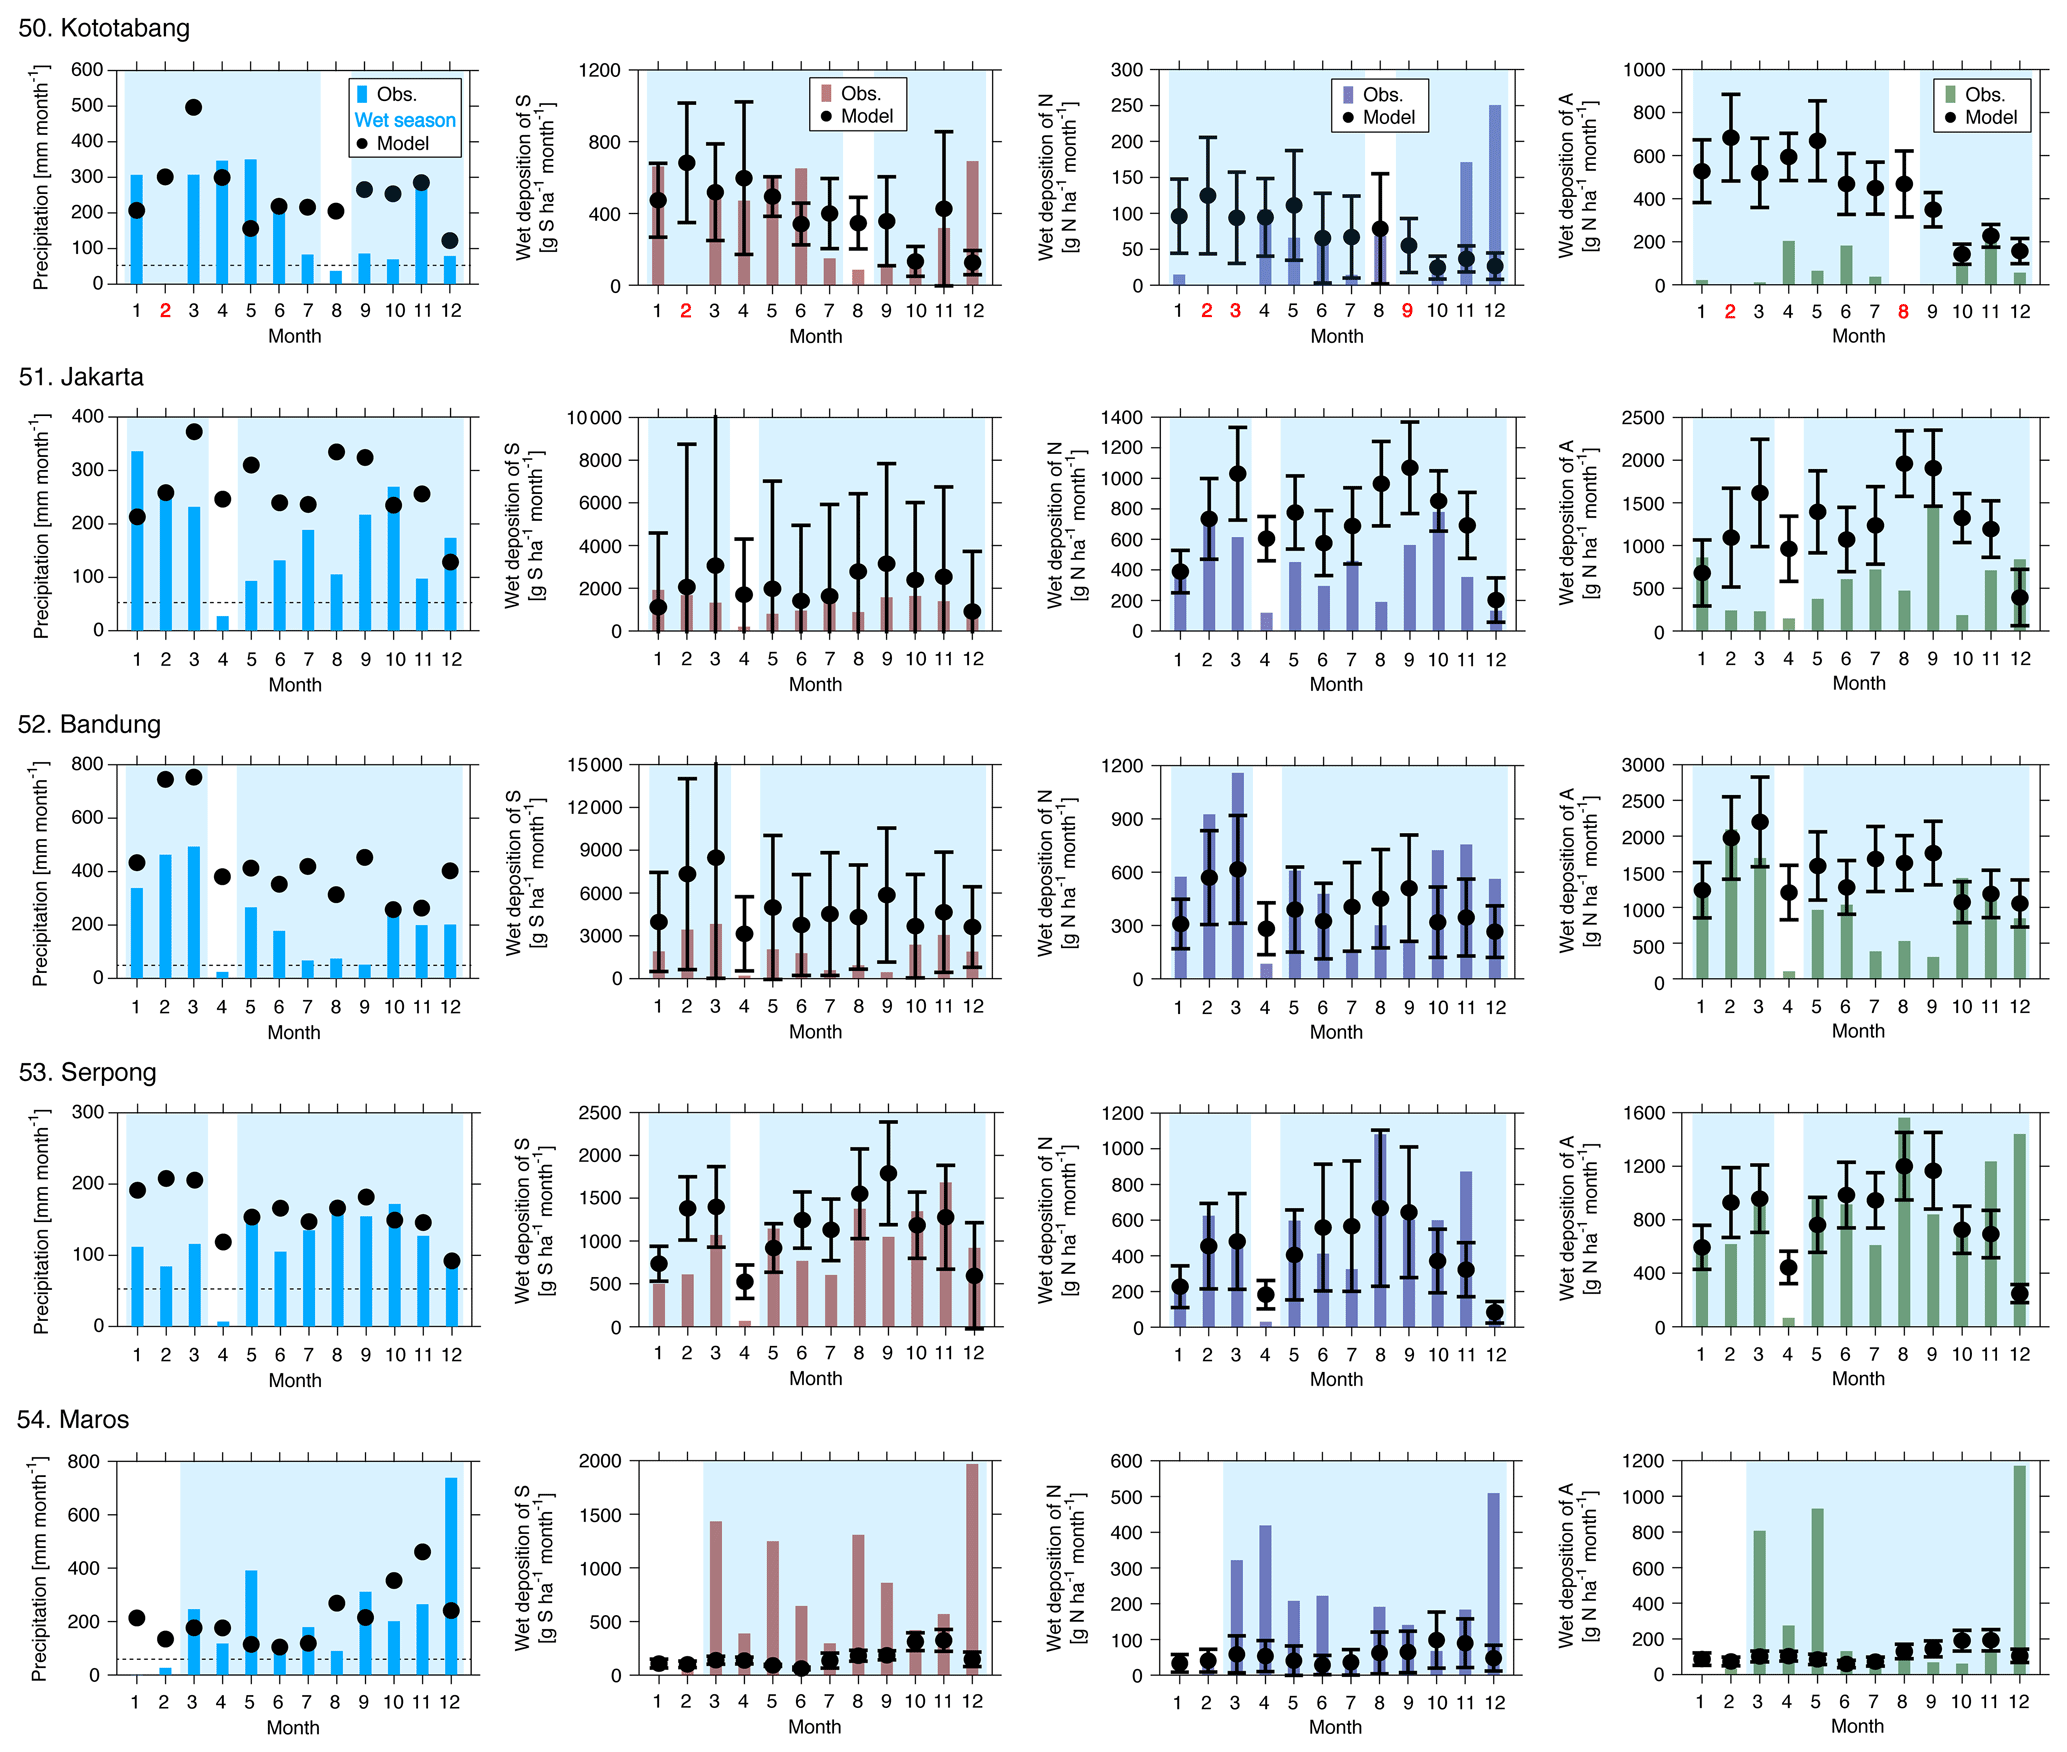
Figure 8Monthly accumulated precipitation and wet depositions of S, N, and A over Indonesia. Whiskers represent the standard deviation among the seven models, and the wet season (light blue color) is defined as months when precipitation exceeded 50 mm. Months shown in red indicate a lack of observational data.
3.1.7 Indonesia
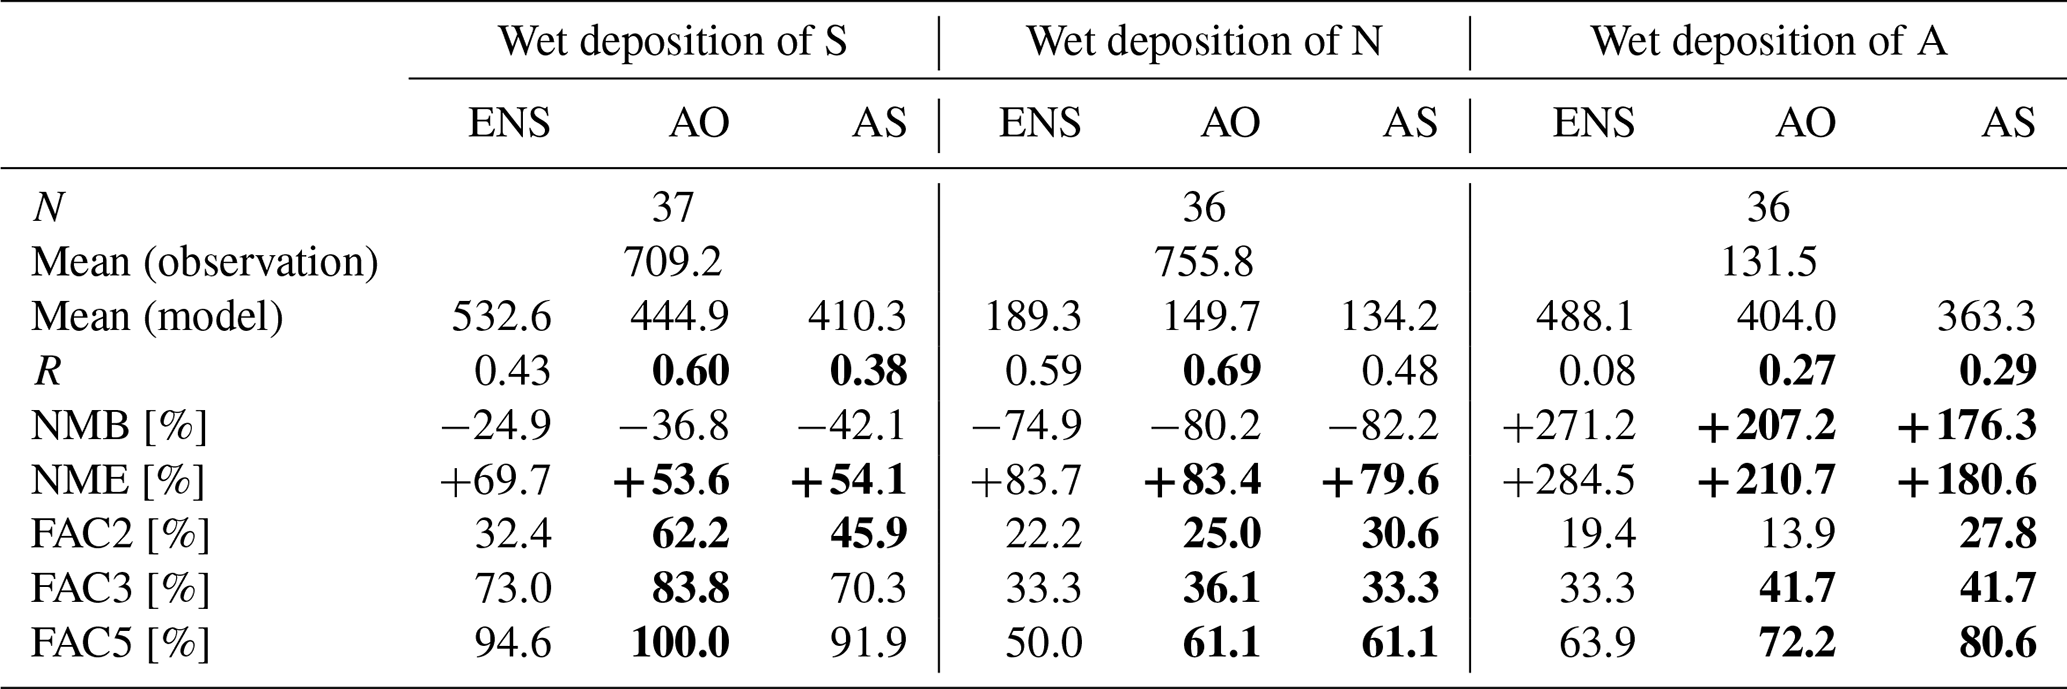
Indonesia has five EANET sites for wet deposition, namely Jakarta (no. 51), Bandung (no. 52), Serpong (no. 53), Kototabang (no. 50), and Maros (no. 54; Table 2). A comparison between the observed and simulated precipitation and wet deposition is shown in Fig. 8. Compared with other countries in continental southeast Asia, the dry season was shorter in Indonesia, occurring only in April in Jakarta (no. 51), Bandung (no. 52), and Serpong (no. 53), which are located on Java; in August in Kototabang (no. 50), which is located on Sumatra; and in January and February in Maros (no. 54), which is located on Sulawesi. The observed wet depositions of S, N, and A in these limited dry seasons were generally lower than during the wet season; however, no difference in the simulated wet depositions of S, N, and A was observed between the wet and dry seasons. The reason for this failure was that the model did not reproduce the observed reduced precipitation amounts during the dry seasons. As was found in the Philippines, the inter-model variation was large, except for Maros (no. 54), and further study focusing on this region will also be required. The results of the statistical analysis are listed in Table 9. A moderate correlation between observations and simulations was found for the wet depositions of S, N, and A, but the ENS overestimated the wet depositions of S, N, and A, especially for S, with an NMB of +65.6 % and an NME larger than 100 %.
Table 9Statistical analysis of model performance for five sites in Indonesia.
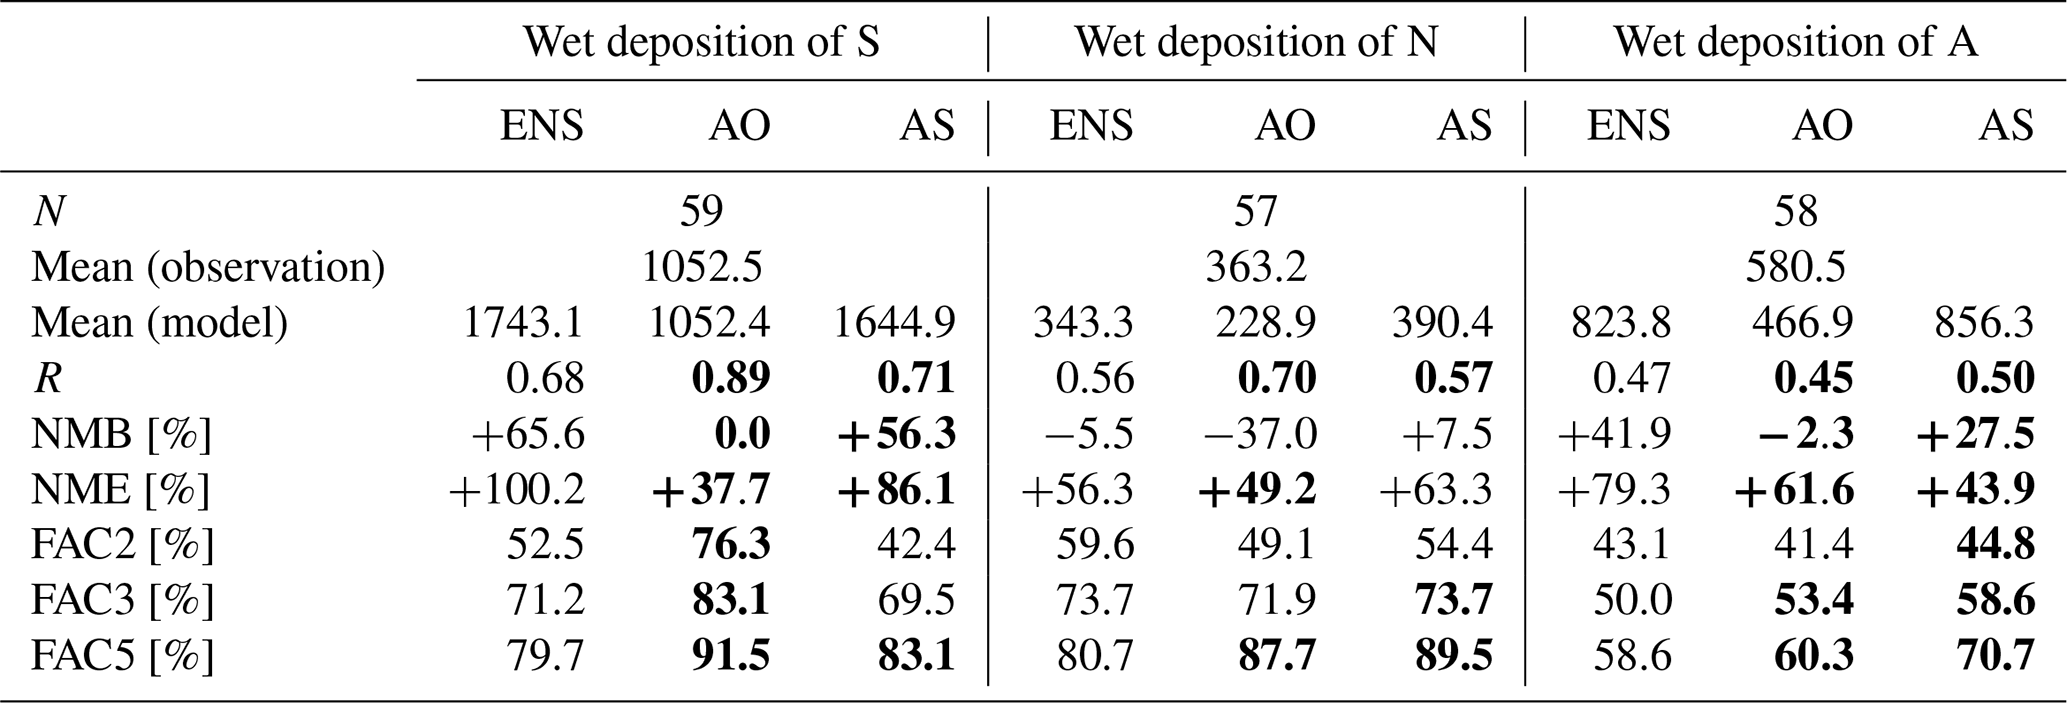
Note that units are g S ha−1 month−1 for the wet deposition of S and g N ha−1 month−1 for the wet depositions of N and A. Improvements in the statistical score with AO and AS compared with ENS are shown in bold font.
4.1 Proposal of precipitation-adjusted approach over southeast Asia
As presented in Sect. 3, although the model performance in MICS-Asia III was based on an ensemble approach generally captured the observed wet deposition over southeast Asia, there were some difficulties in capturing the observed values. The errors in the simulated values of wet deposition are associated with ambient concentration and/or precipitation. Our previous overview paper (Itahashi et al., 2020) presented two approaches for improving the modeling of wet deposition, namely the ensemble approach and the precipitation-adjusted approach. The former approach was used in this study. In terms of the modeling performance for the ambient concentrations of aerosols of SO, NO, and NH, our companion paper reported better performance over southeast Asia compared with north and east Asia (Chen et al., 2019). As noted in Sect. 3, the model generally overestimated precipitation as well as wet deposition during the dry season. Additionally, the model sometimes simulated non-zero precipitation, and consequently non-zero wet deposition, despite the absence of wet deposition due to the absence of precipitation. Based on these findings in MICS-Asia III, the difficulty stemmed from the inaccuracy of the modeled precipitation, which is fundamentally important for simulating the wet deposition. The precipitation-adjustment method is expected to improve model performance. The precipitation-adjusted approach linearly scales the precipitation to obtain the precipitation-adjusted wet deposition via the following equation:
where WDmodel is the original model-simulated wet deposition, and Pmodel and Pobservation are the modeled and observed precipitation, respectively. This method involves adjusting the precipitation amount which affects the wet deposition amount on a monthly timescale. Here, it is assumed that the errors in the modeled precipitation are linearly associated with the errors in the modeled wet deposition. This approach has been used in previous studies in the US (Appel et al., 2011; Zhang et al., 2018) and east Asia (Itahashi, 2018; Saya et al., 2018). Following our previous work in MICS-Asia III for deposition (Itahashi et al., 2020), wet depositions were adjusted on a monthly timescale and then the annual wet deposition was recalculated using the precipitation-adjusted monthly wet deposition. Adjustment using shorter timescales is difficult because the modeled precipitation (Pmodel in Eq. 5) approaches zero, which leads to unreasonably large values, and vice versa for larger timescales. The precipitation-adjusted approach using EANET observational data is hereafter called AO (adjusted by observation at EANET site).
The precipitation-adjusted approach was shown to be effective for improving the modeling reproducibility in MICS-Asia III (Itahashi et al., 2020). However, this approach has a limitation in that the adjusted wet deposition was obtained only at locations corresponding to EANET observation sites, and hence the adjusted wet deposition was spatially limited. To overcome this limitation, in this study, we additionally used a satellite dataset; this precipitation-adjusted approach is hereafter called AS (adjusted by satellite measurement). For this purpose, the Tropical Rainfall Measuring Mission (TRMM) multi-satellite precipitation analysis (TMPA) dataset was applied (Huffman et al., 2007). The used product is the latest version 7 of the 3B43 dataset, which provides monthly precipitation with the most accurate precipitation estimate covering 50∘ S to 50∘ N (TRMM, 2011). The gridded data of 0.25×0.25∘ were converted into the simulation domain used in MICS-Asia phase III. For the AO and AS approaches, wet deposition in each of the seven models was first adjusted on a monthly timescale, and then the ENS was calculated using Eq. (1).

Figure 9Scatter plots of the monthly precipitation amount over southeast Asia comparing EANET surface observations with (a) model simulations and (b) satellite measurements. Symbols indicate different countries and colors indicate different months. In the inset, the statistical metrics of mean, correlation coefficient (R), normalized mean bias (NMB), and normalized mean error (NME) are shown. The vertical dotted line represents observed precipitation of 50 mm month−1, which defines the boundary between the dry and wet seasons in this study.
A comparison among the WRF simulation, EANET surface observations, and TRMM satellite measurements is given in Fig. 9. The results of the statistical analysis are also shown in this figure. The comparison between the EANET surface observations and the WRF model simulations showed that the model generally reproduced the observed monthly precipitation adequately, with an R of 0.56, an NMB of +24.2 %, and an NME of +64.7 %. However, as shown in Figs. 2–8, the model tended to overestimate low precipitation levels (see Fig. 9 for the dry season). As has been discussed for Figs. 2–8, this overestimation may be the reason for the mismatch between the simulated and observed the wet depositions of S, N, and A. Resolving this problem is important for improving simulations of wet deposition. Meanwhile, in the comparison between the EANET surface observations and the satellite measurements, the statistical scores were superior to those obtained between the modeled and observed data, with an R of 0.77, an NMB of +5.9 %, and an NME of +39.5 %. The correspondence between EANET surface observations and satellite measurements was better (relative to the correspondence between the modeled and observed data) for monthly precipitation of less than 50 mm. From this result, it is expected that precipitation adjustment based on satellite measurements also has the potential to improve the original simulation of wet deposition. It should be noted that even though satellite and ground-based observations showed differences in the precipitation amount, this result indicates that further consideration of the how well precipitation is represented by the spatial resolution (broader observation by satellites and point-specific observations using ground-based monitoring) is important. Accordingly, the effect of the modeling spatial resolution on the simulated precipitation should be considered in future studies. The spatial distributions of precipitation from the WRF simulation and TRMM satellite measurements are, respectively, presented in the Supplement (Figs. S1 and S2), and the adjustment factors for each month are given in Fig. S3 in the Supplement.
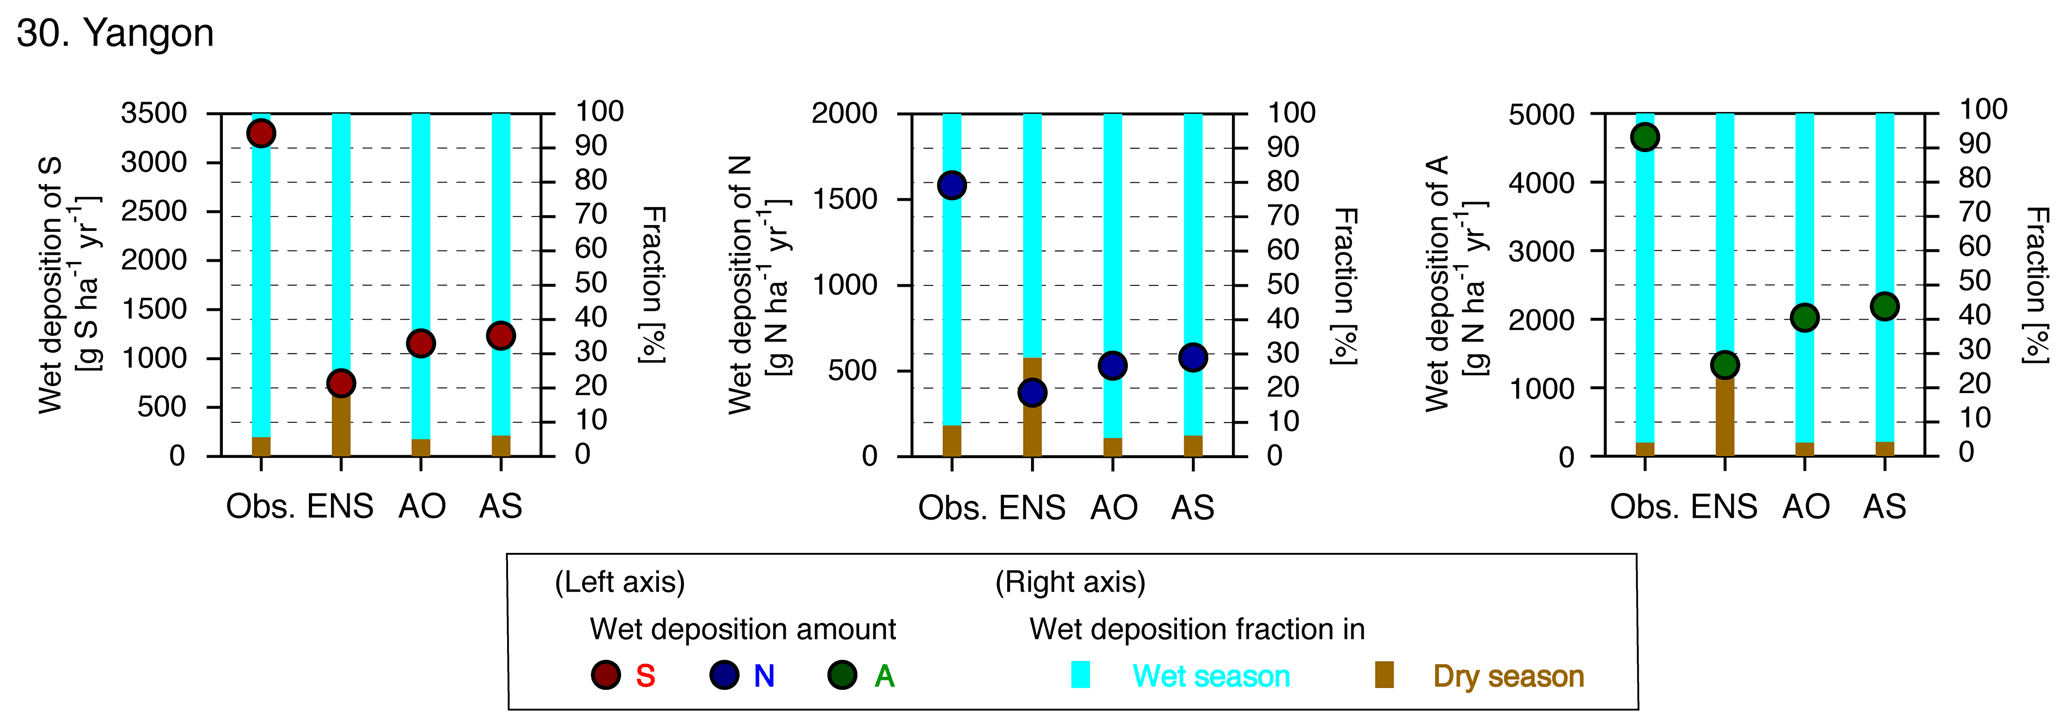
Figure 10Observed and simulated annual accumulated wet deposition amounts of S, N, and A, and the fraction of wet deposition during the wet and dry seasons in Yangon, Myanmar.
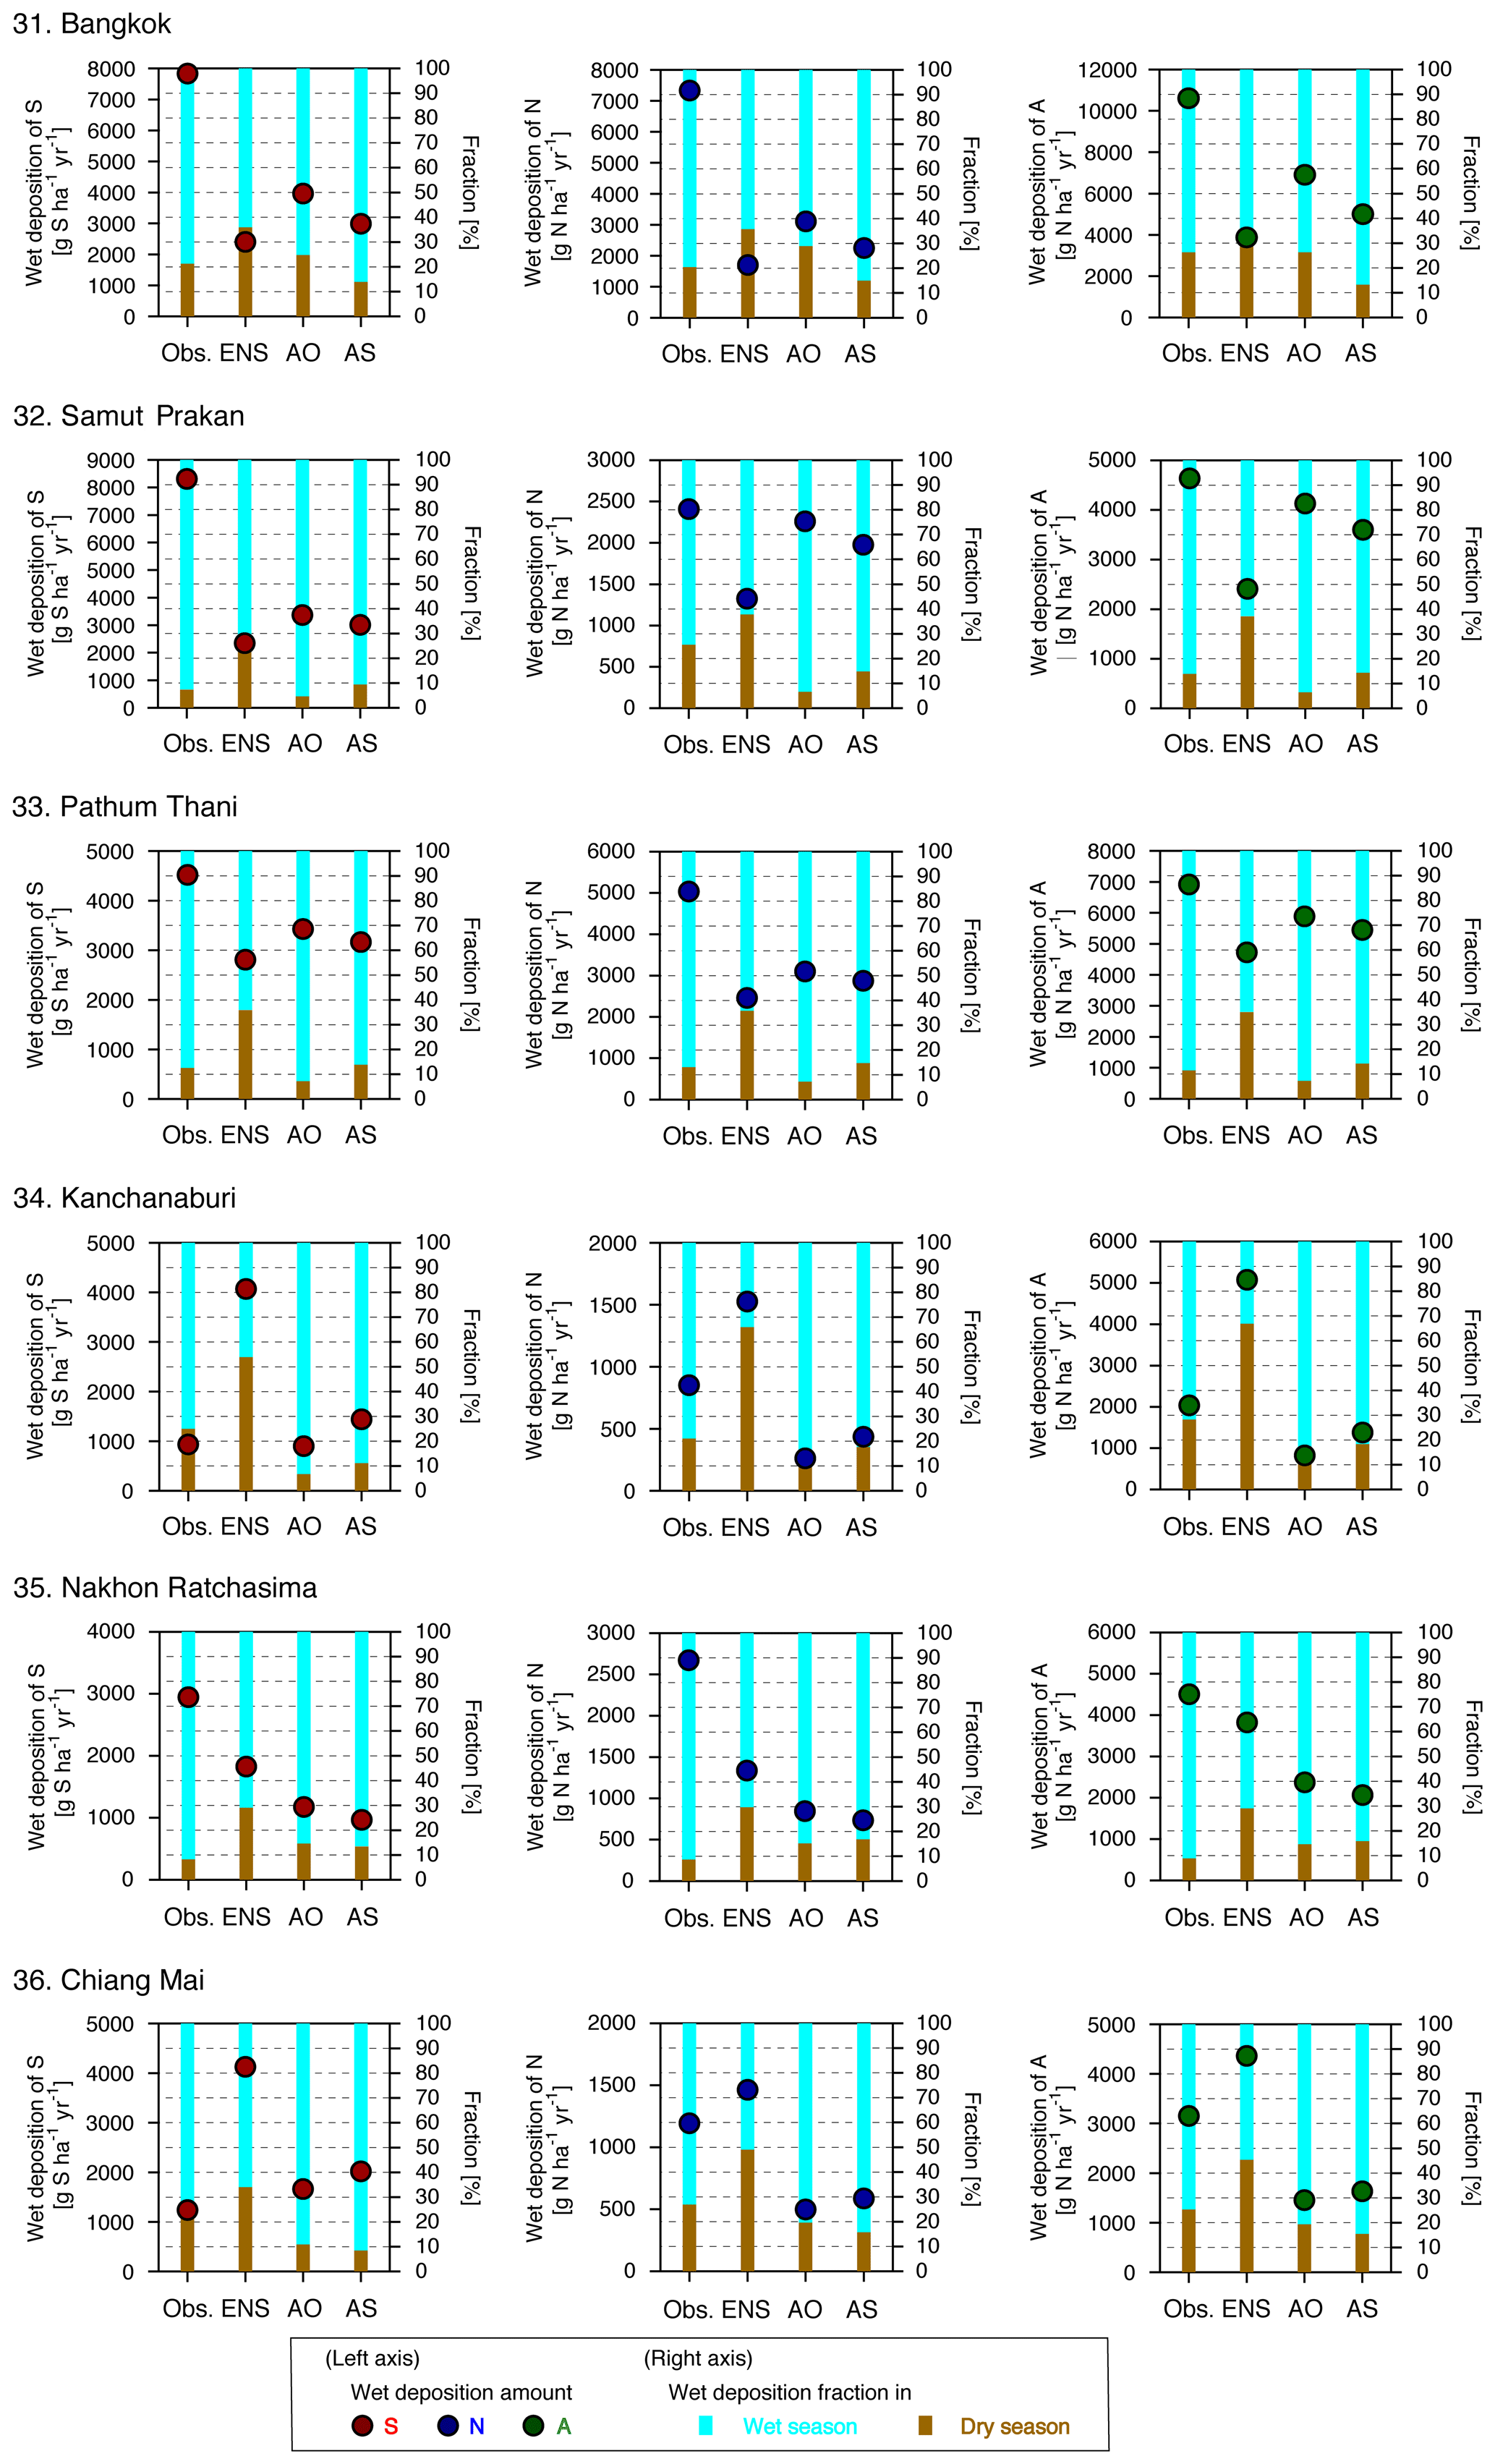
Figure 11Observed and simulated annual accumulated wet deposition amounts of S, N, and A, and the fraction of wet deposition during the wet and dry seasons at six sites in Thailand. The annual accumulated wet deposition amount is based on the months in which wet deposition observations were available (see Fig. 3).
4.2 Improvements of wet deposition modeling through a precipitation-adjusted approach for each country in southeast Asia
4.2.1 Myanmar
At the Yangon (no. 30) site in Myanmar, the wet depositions of S, N, and A were underestimated, with an NMB exceeding −70 %, as listed in Table 3. Table 3 also provides the results of the statistical analysis for the AO and AS approaches, demonstrating that the underestimation in the ENS was improved by both approaches; most of the statistical scores were improved compared with the ENS, though there was still underestimation compared with the observed wet depositions of S, N, and A. Figure 10 shows the annual accumulated wet depositions of S, N, and A from the observational data, ENS, AO, and AS. As shown in the figure, the wet deposition was higher with the AO and AS approaches compared with ENS; that is, the underestimation was partly improved. Figure 10 also shows the fractions of wet deposition occurring during the dry and wet seasons as bar graphs for the observational data, ENS, AO, and AS. It can be clearly seen that, for the wet depositions of S, N, and A, the fraction during the dry season was overestimated with ENS but was well matched with the AO and AS approaches.
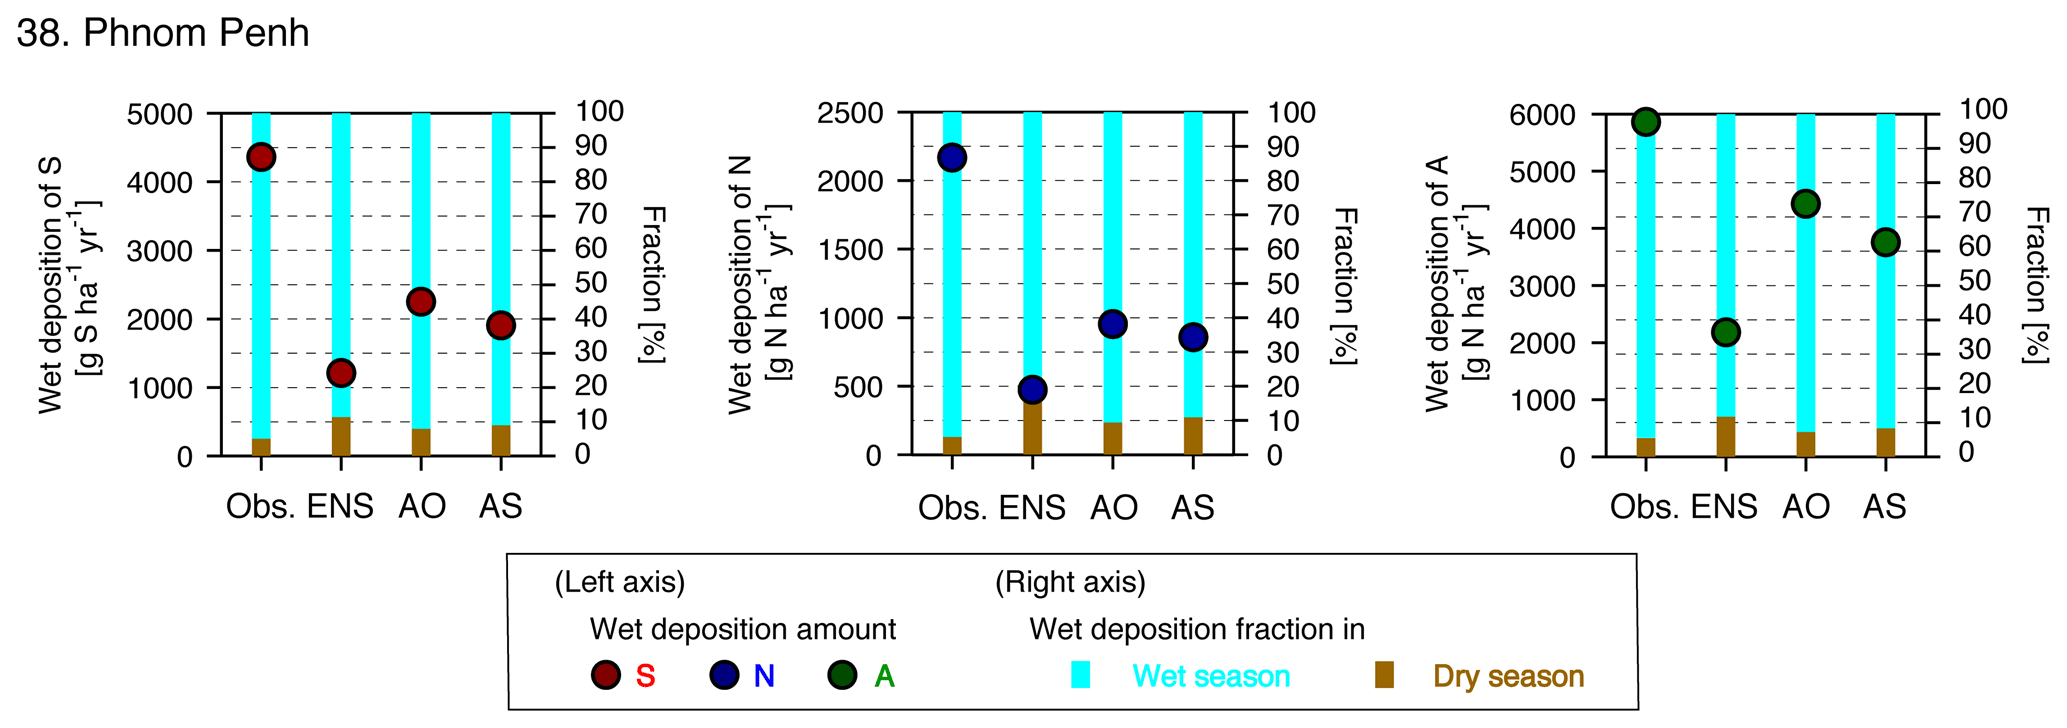
Figure 12Observed and simulated annual accumulated wet deposition amounts of S, N, and A, and the fraction of wet deposition during the wet and dry seasons in Phnom Penh, Cambodia.
4.2.2 Thailand
The wet depositions of S, N, and A were generally underestimated at the six sites in Thailand, as shown in Table 4. The statistical scores for AO and AS are also provided in this table. For the R value and the NME, AO and AS obtained superior values for Thailand compared with the ENS, showing a stronger correlation with the observational data. For AO and AS, the R values ranged from 0.61 to 0.85 for the wet depositions of S, N, and A, and the NMB was improved by 20 %–30 % compared with the ENS. Figure 11 shows the annual accumulated wet depositions of S, N, and A from observational data, ENS, AO, and AS, and the fractions of deposition occurring in the dry and wet seasons. From this figure, it can be seen that, compared with the ENS, the AO and AS approaches obtained superior values of the fractions of wet deposition during the dry and wet seasons at all six sites in Thailand. For Bangkok (no. 31), Samut Prakan (no. 32), and Pathum Thani (no. 33), the underestimation in ENS was improved, and the annual accumulated wet depositions of S, N, and A were close to the observed value for both AO and AS. Meanwhile, at Kanchanaburi (no. 34) and Chiang Mai (no. 36), the overestimation in ENS was improved, and the annual accumulated wet depositions of S, N, and A were close to the observed value for both AO and AS. These results clarify that the precipitation-adjusted approach was effective in solving both overestimation and underestimation problems in the original simulated wet deposition. However, it should be noted that, for Nakhon Ratchasima (no. 35), although the fractions of wet deposition occurring during the dry and wet seasons were improved with the AO and AS approaches, underestimation was worsened.
4.2.3 Cambodia
In Phnom Penh (no. 38) in Cambodia, there were some difficulties capturing the wet depositions of S, N, and A using the ENS. As shown in Table 5, there was a low correlation between the observed values and the ENS for the wet deposition of S, and an even lower correlation for the wet depositions of N and A. The NMB was around −70 % and the NME was 70 %–80 % for the wet depositions of S, N, and A using the ENS. These deficiencies in the ENS were adequately improved using AO and AS. For AO and AS, all statistical scores showed an improvement compared with the ENS. Figure 12 shows the annual accumulated wet depositions of S, N, and A from observational data, ENS, AO, and AS, and the fraction of deposition occurring in the dry and wet seasons in Phnom Penh. It was also found that the ENS mismatched the fraction of wet deposition compared with the observed value, whereas AO and AS obtained more accurate fractions, as well as more accurate values of the annual accumulated wet deposition.
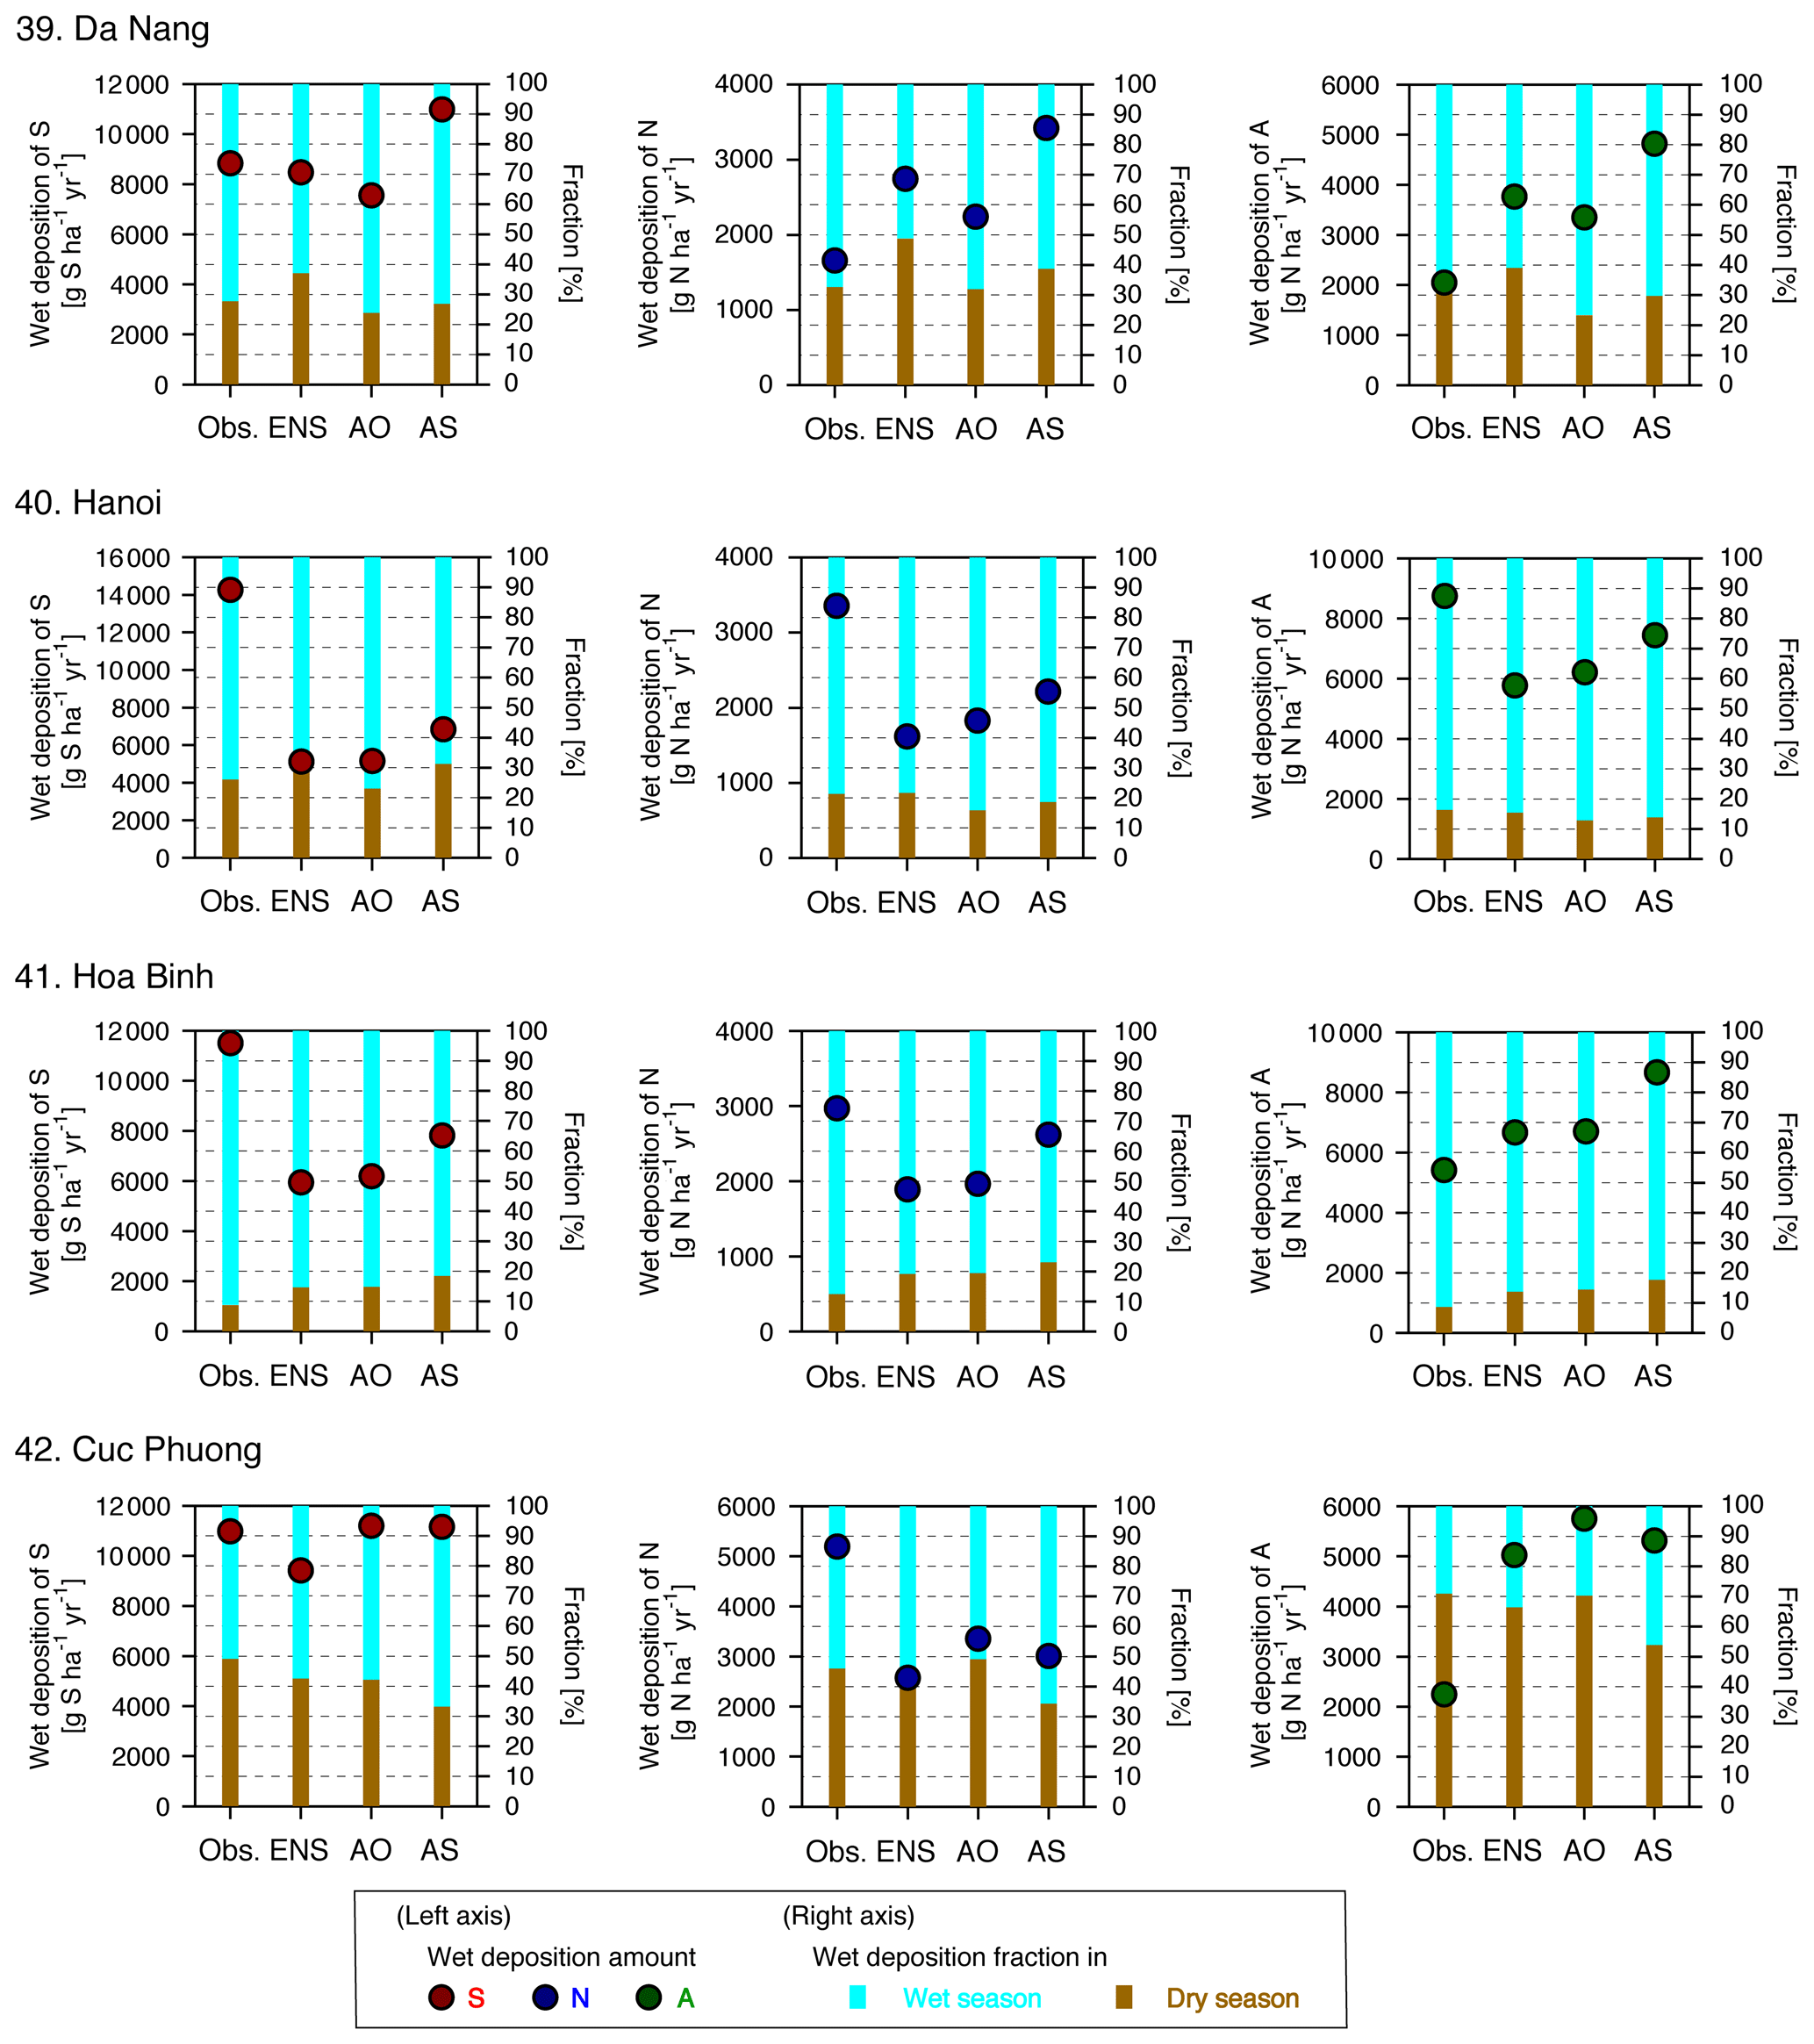
Figure 13Observed and simulated annual accumulated wet deposition amounts of S, N, and A, and the fraction of wet deposition during the wet and dry seasons at four sites over Vietnam. The annual accumulated wet deposition amount is based on the months for which wet deposition observations were available (see Fig. 5).
4.2.4 Vietnam
For the four EANET sites in Vietnam, the statistical scores for the ENS were superior to those for other countries in continental southeast Asia. In most cases, for AO and AS, the scores were improved compared with the ENS for the wet depositions of S, N, and A, as shown in Table 6. Figure 13 shows the annual accumulated wet depositions of S, N, and A from observational data, ENS, AO, and AS, and the fraction of wet deposition occurring in the dry and wet seasons in Vietnam. Compared with other countries in continental southeast Asia, the fraction of wet deposition occurring during the dry and wet seasons was better predicted by the ENS, and AO and AS performed similarly. However, for AS, the fraction during the wet season was overestimated at Hòa Bình (no. 41) and underestimated at Cúc Phuong (no. 42). Additionally, the overestimated wet deposition amount of S, N, and A at Da Nang (no. 39) led to a discrepancy with the observed results.
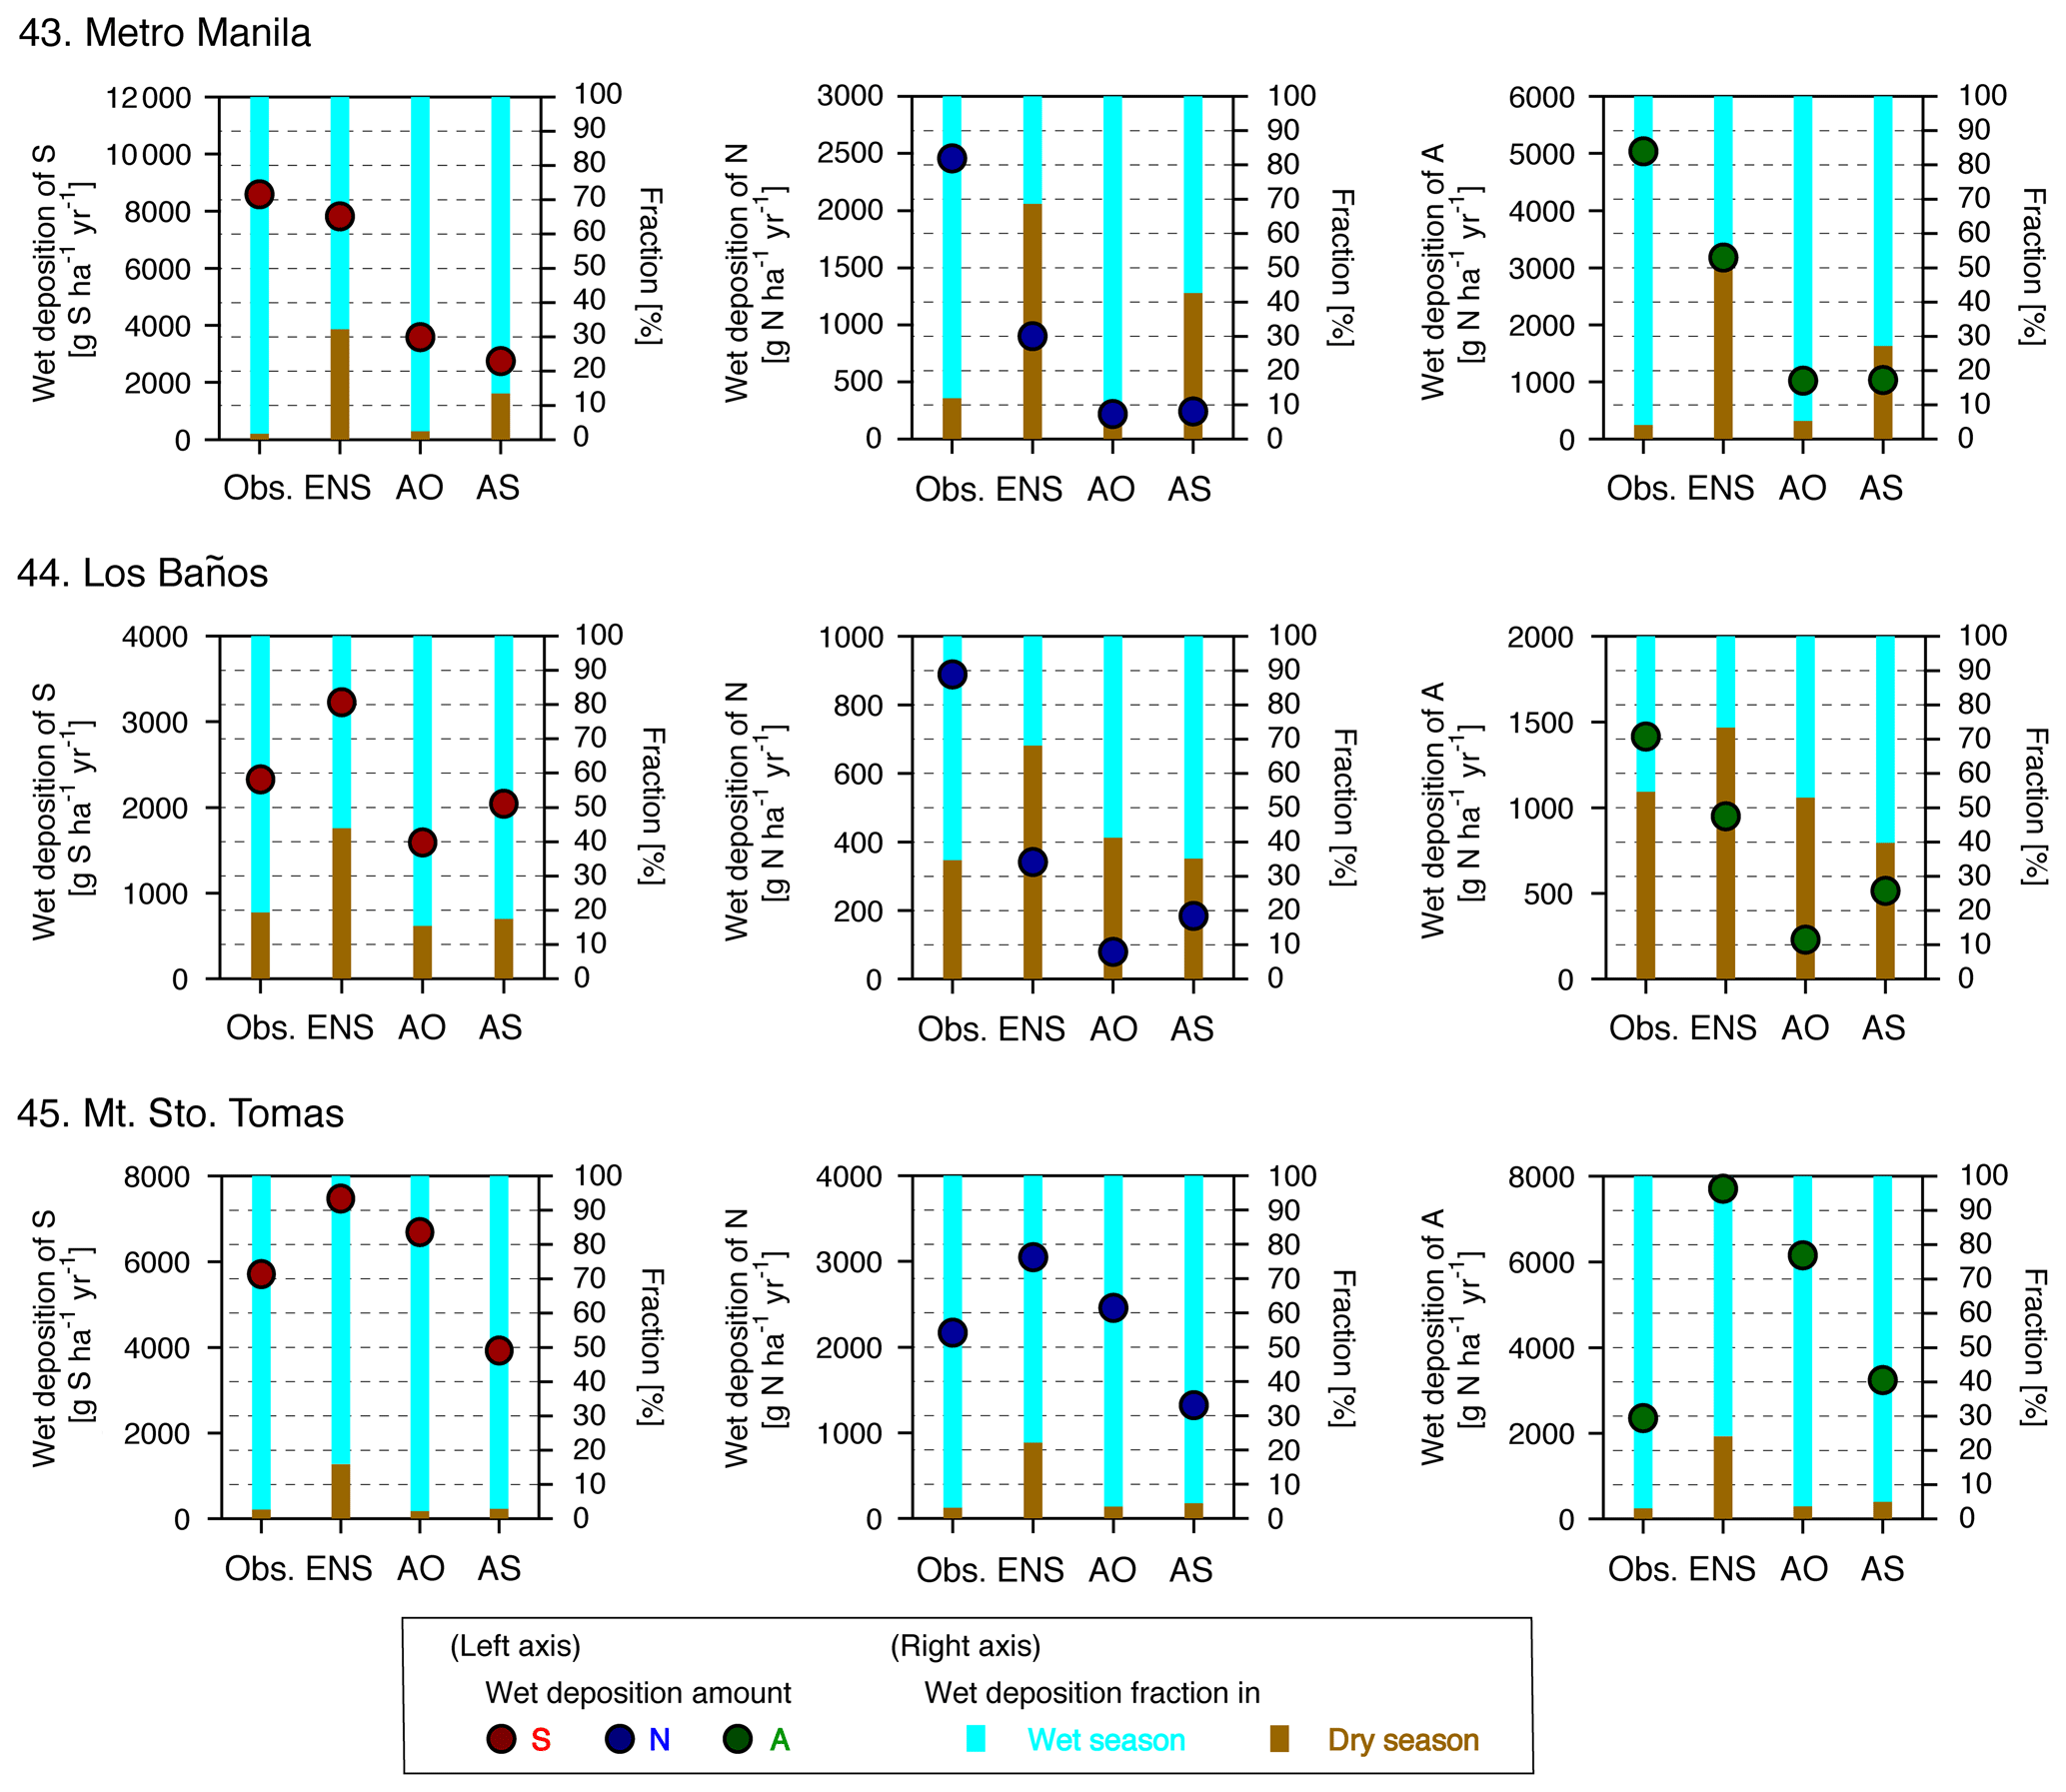
Figure 14Observed and simulated annual accumulated wet deposition amounts of S, N, and A, and the fraction of wet deposition during the wet and dry seasons at three sites in the Philippines. The annual accumulated wet deposition amount is based on the months for which wet deposition observations were available (see Fig. 6).
4.2.5 Philippines
For the three EANET sites in the Philippines, it was found that the model overestimated the precipitation during the dry season. Figure 14 presents the annual accumulated wet depositions of S, N, and A for the observational data, ENS, AO, and AS, and the fraction of the wet deposition occurring in the dry and wet seasons in the Philippines. As shown in the figure, the ENS overestimated the fraction during the wet season at all sites for the wet depositions of S, N, and A. However, with AO and AS, this overestimation was improved and the simulated values were close to the observed ones. The statistical scores are listed in Table 7. As shown in the table, R was not changed or slightly increased and NME was improved, but NMB was not improved. As shown in Fig. 14, this result was related to the change in model performance in Metro Manila (no. 43); the annual accumulated wet deposition amounts of S, N, and A were markedly decreased and very different from the observed data.
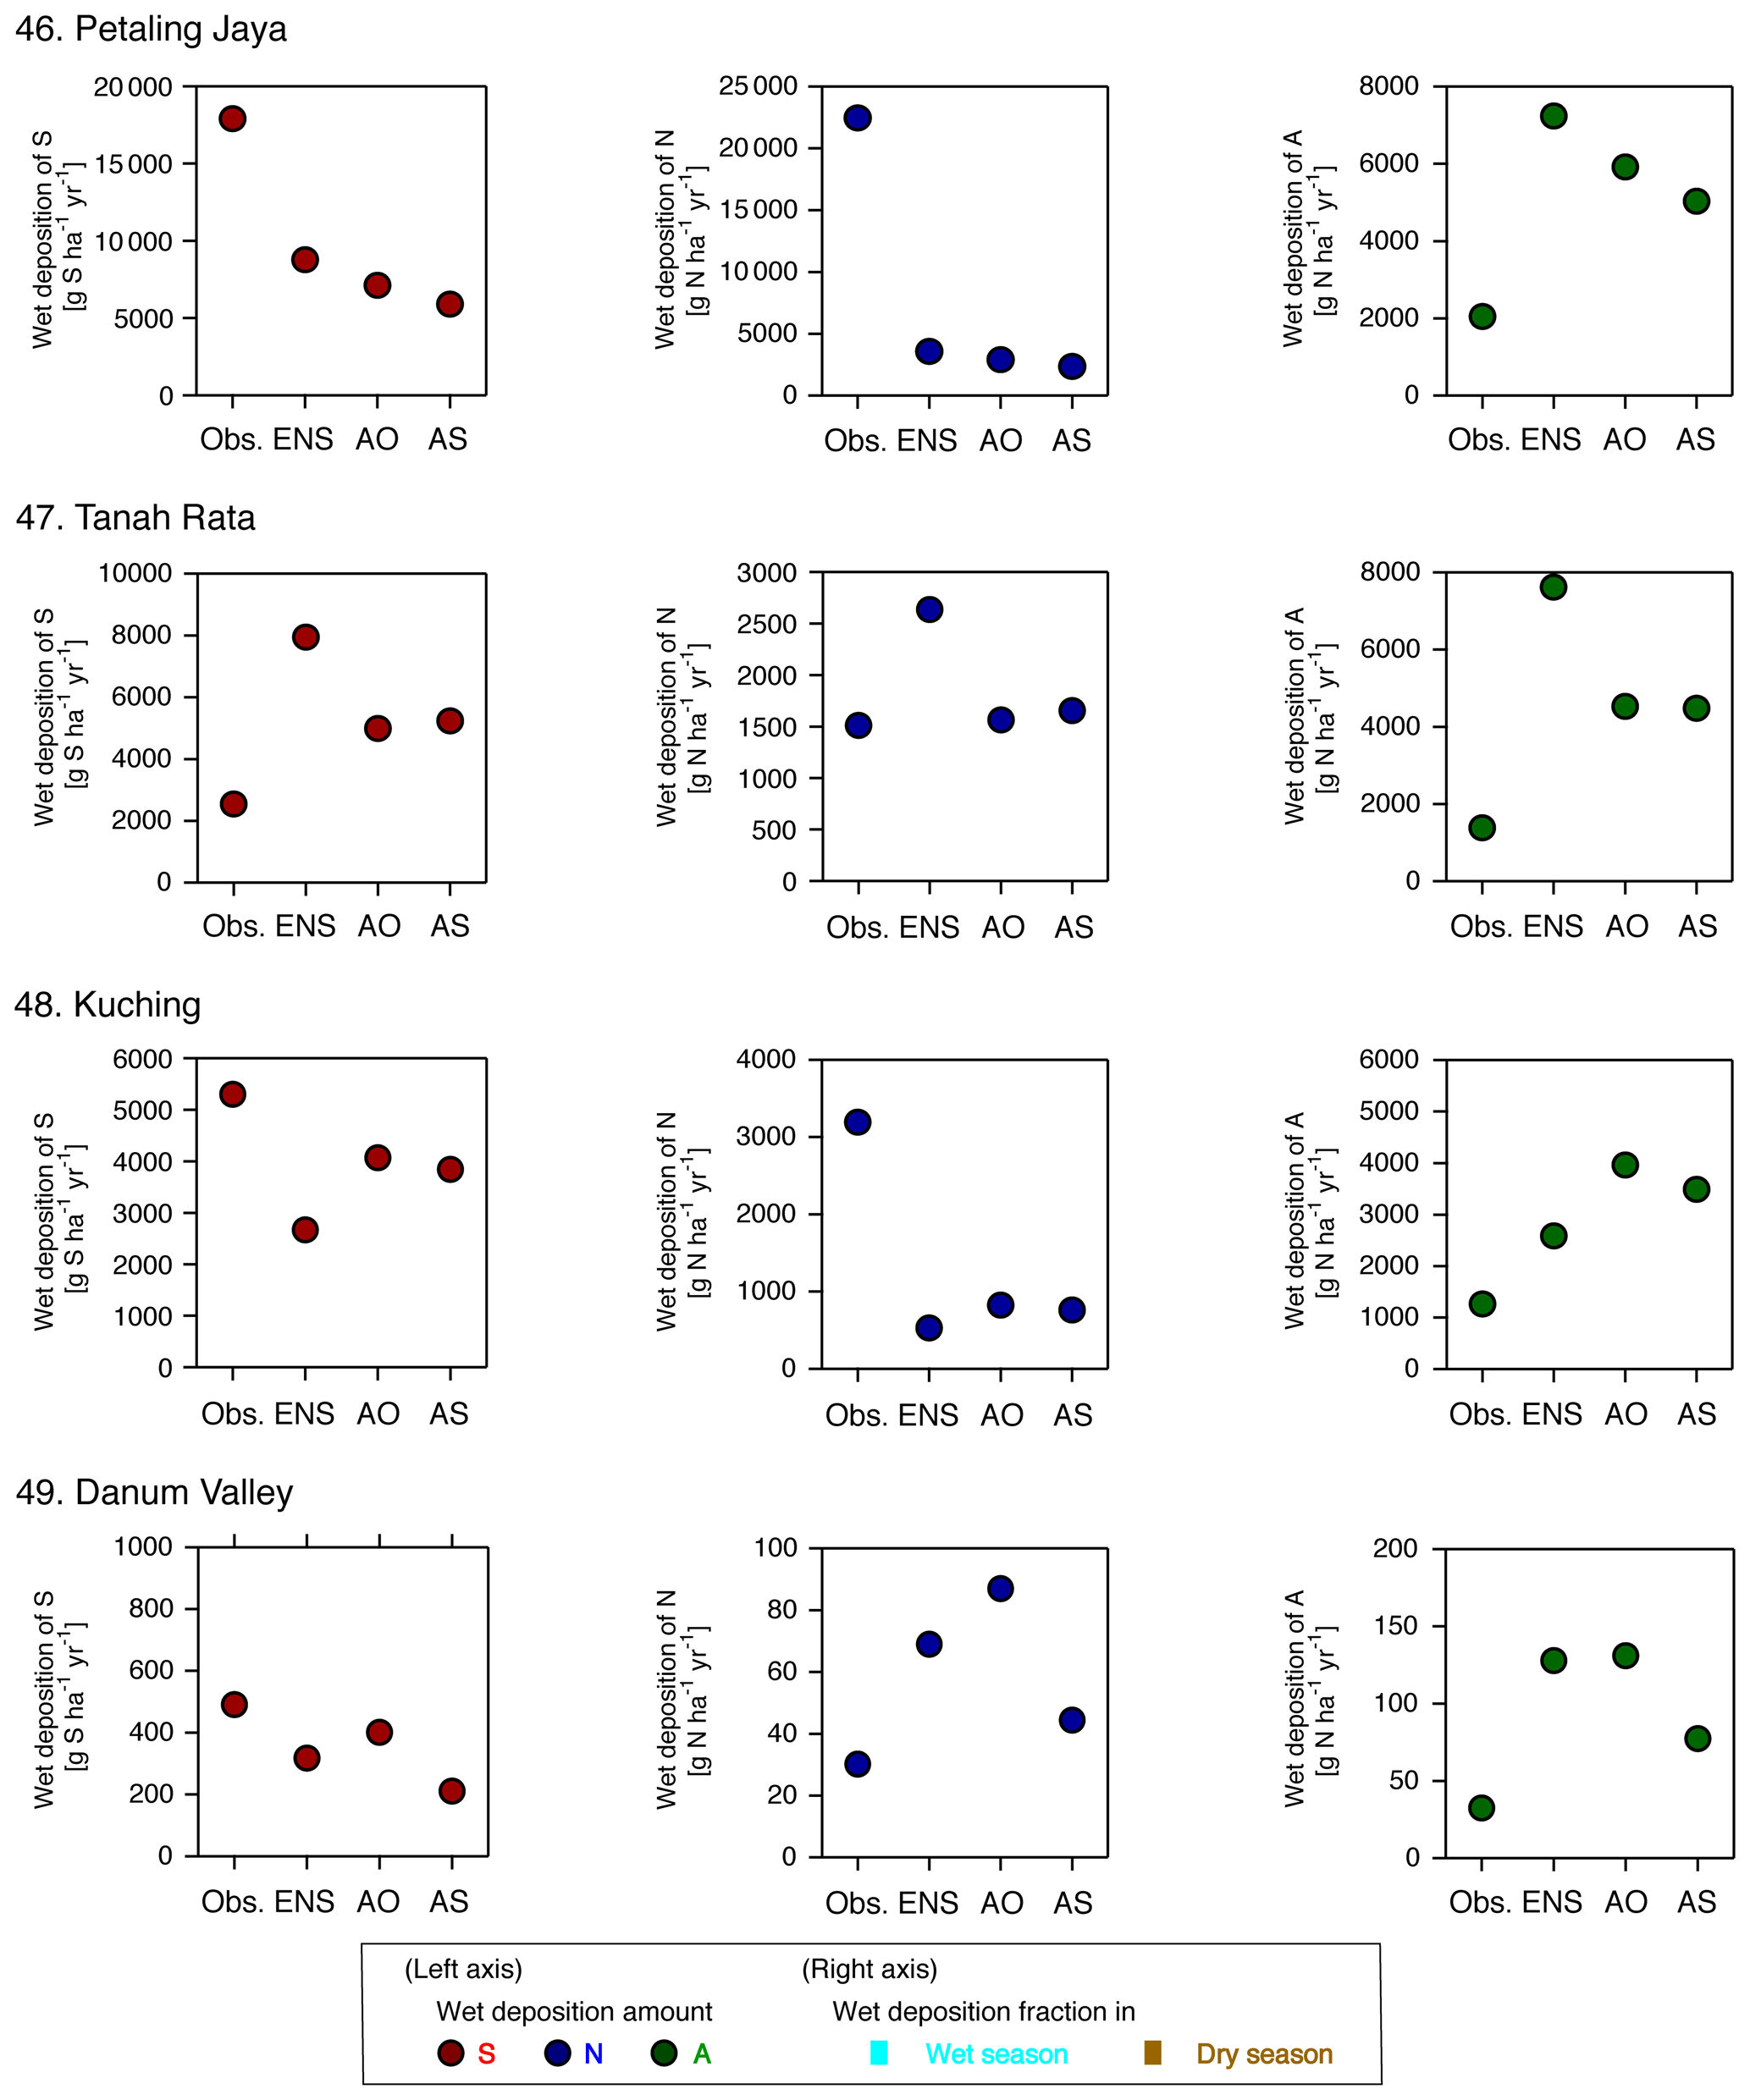
Figure 15Observed and simulated annual accumulated wet deposition amounts of S, N, and A at four sites in Malaysia. The annual accumulated wet deposition amount is based on the months for which wet deposition observations were available (see Fig. 7).
4.2.6 Malaysia
At the four EANET sites in Malaysia, no distinction was found between the dry and wet seasons. Figure 15 shows the annual accumulated wet depositions of S, N, and A from observation, ENS, AO, and AS, while Table 8 lists the statistical scores. AO and AS generally obtained improved results compared with the ENS. In particular, the strikingly large overestimation of the wet deposition of A in the ENS (NMB and NME greater than 200 %) was improved with AO and AS. At Petaling Jaya (no. 46) and Tanah Rata (no. 47), the observed annual accumulated wet deposition of A was around 2000 g N ha−1, whereas the ENS value was nearly 8000 g N ha−1. This large overestimation was reduced by AO and AS, which obtained values close to the observed value.
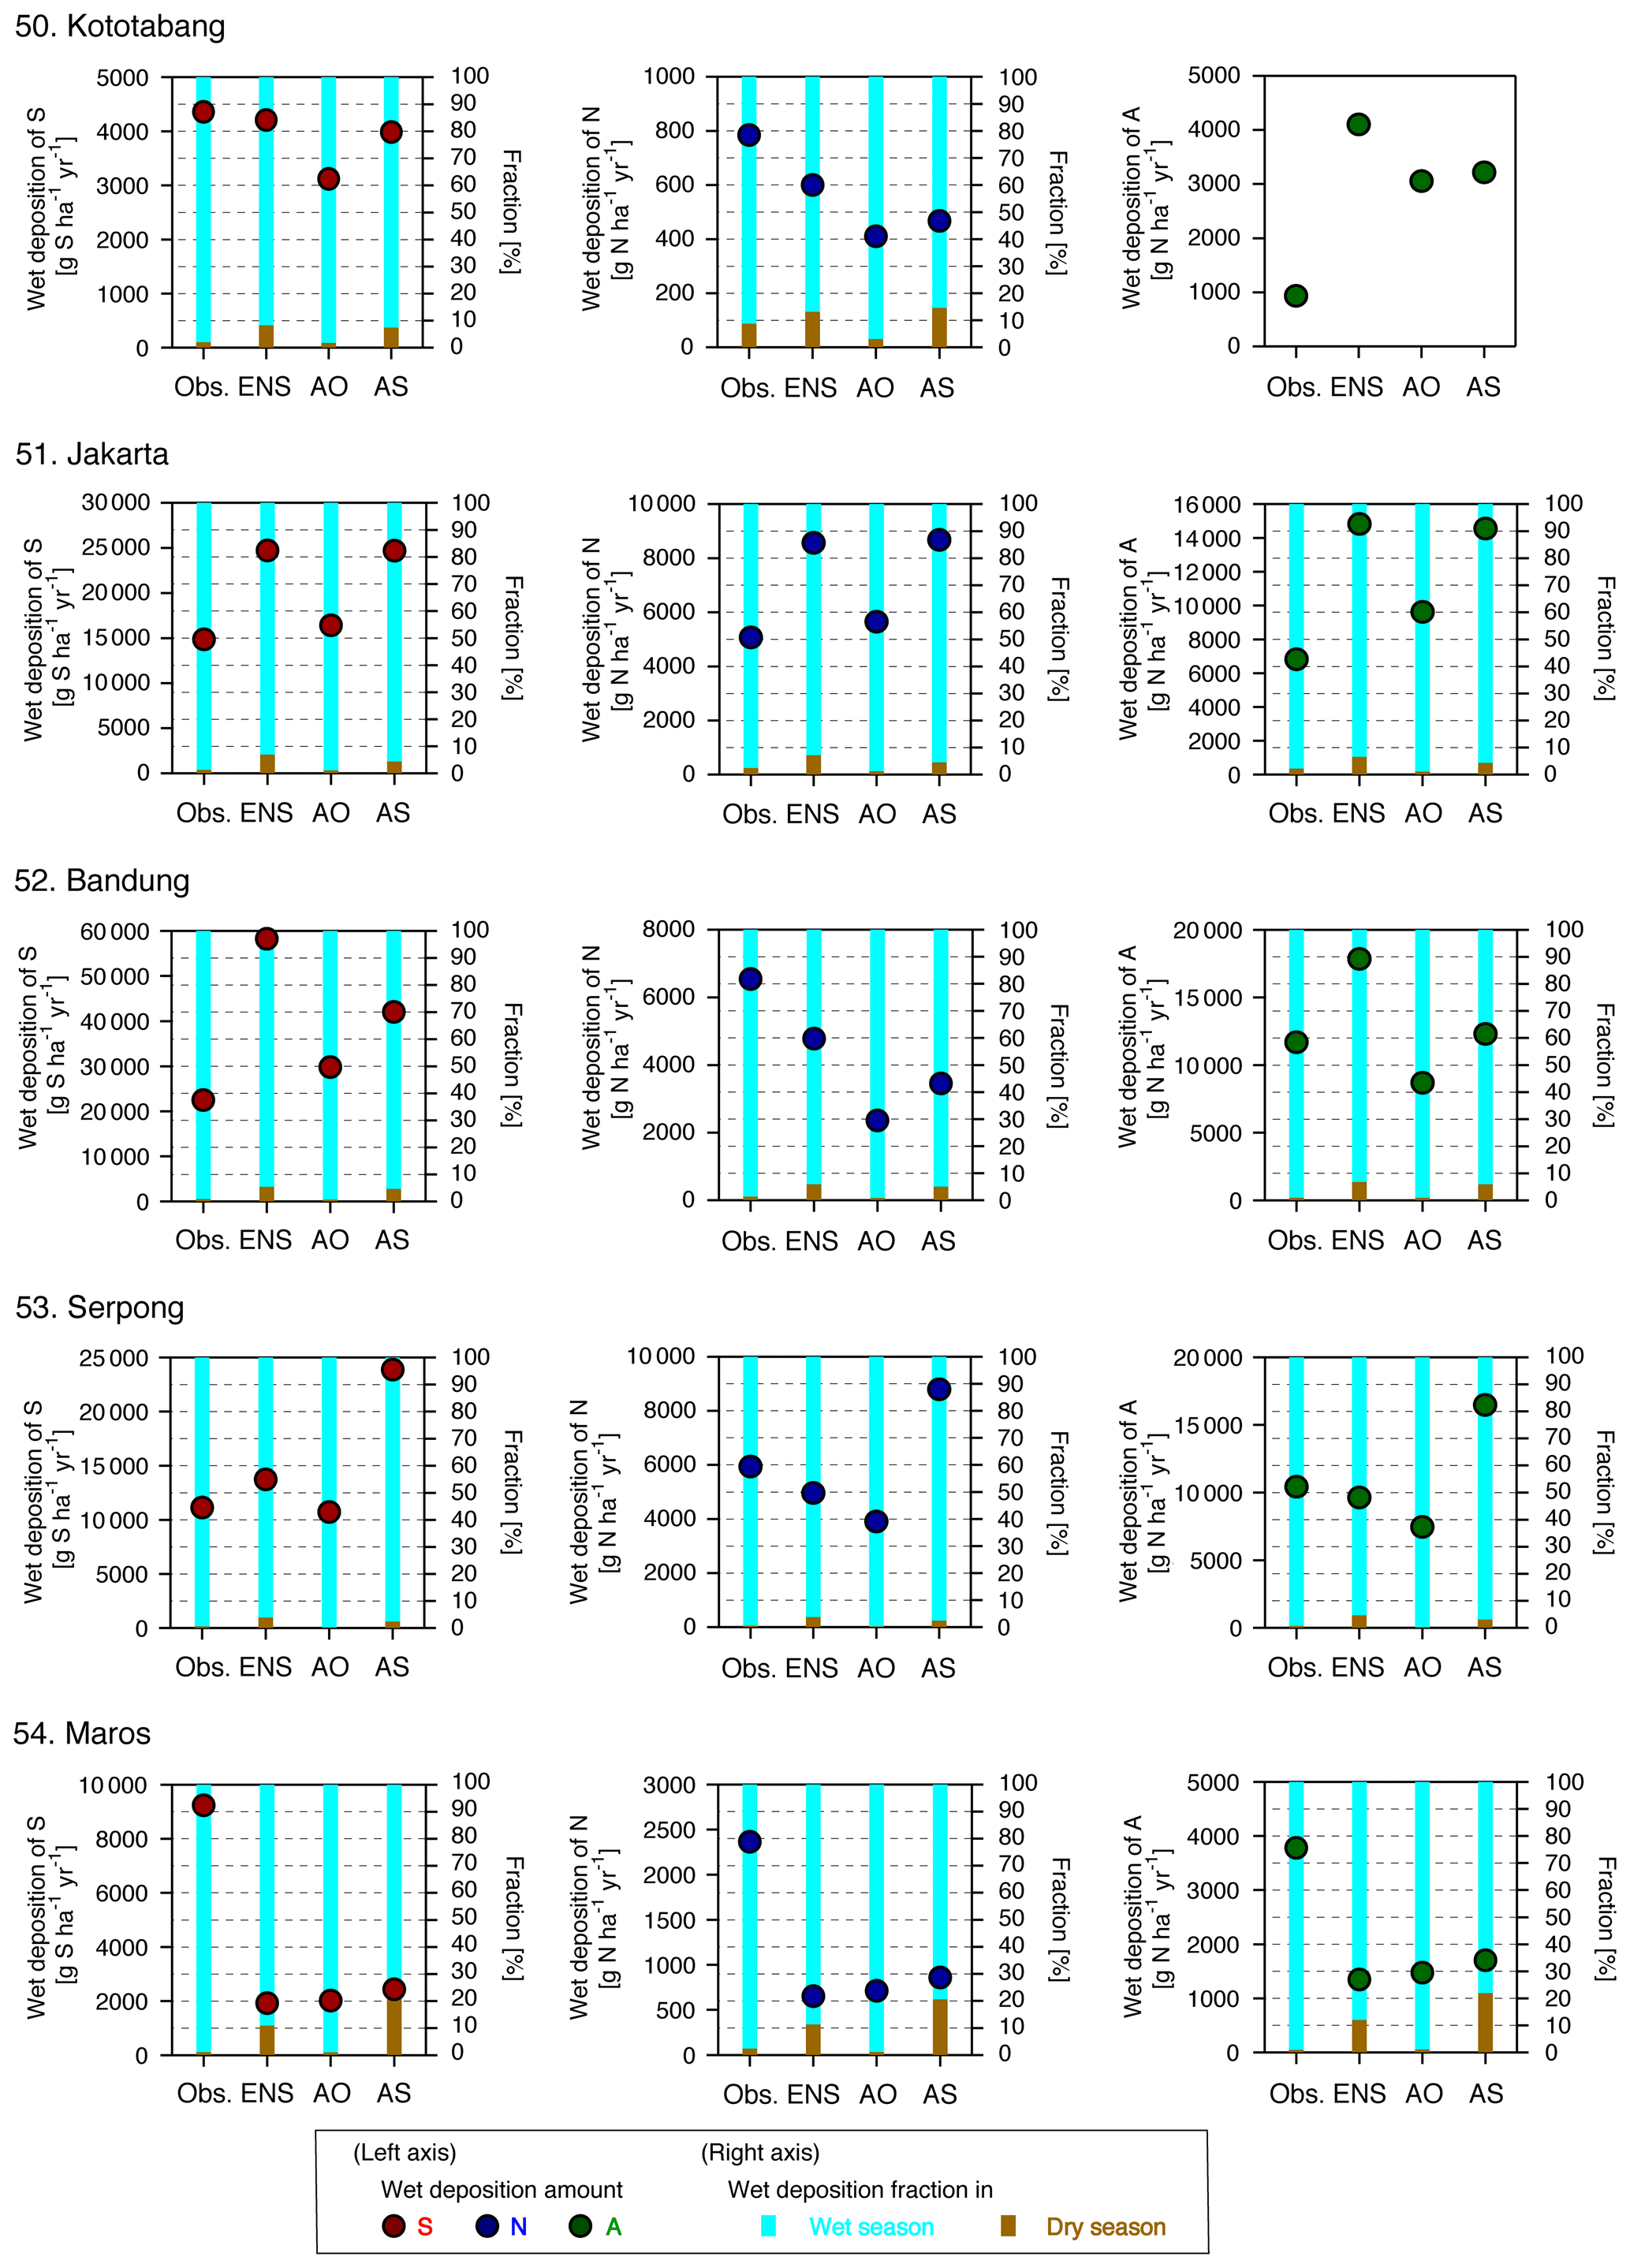
Figure 16Observed and simulated annual accumulated wet deposition amounts of S, N, and A, and the fraction of wet deposition during the wet and dry seasons at five sites in Indonesia. The annual accumulated wet deposition amount is based on the months for which wet deposition observations were available (see Fig. 8).
4.2.7 Indonesia
In Indonesia, during the short dry season, wet deposition showed a steep decline; however, models did not show such a dramatic decrease. As shown in Table 9, the statistical scores for AO and AS were mostly superior to those of the ENS; the moderate correlation found for the wet depositions of S, N, and A in the ENS were improved by AO and AS. For the wet deposition of S, the NMB of +65.6 % and NME of +100.2 % in the ENS were improved by AO and AS. Figure 16 shows the annual accumulated wet depositions of S, N, and A from observational data, ENS, AO, and AS, and the fraction of wet deposition occurring in the dry and wet seasons in Indonesia. The overestimation of the fraction during the wet season obtained by the ENS was improved by AO, but there was no change with AS. Although the annual accumulated wet depositions of S, N, and A for the ENS were generally close to the observed values, AS showed further overestimation in Serpong (no. 53) and there was almost no change in Jakarta (no. 51).

Figure 17Maps of the annual accumulated wet deposition of (a–c) S, (d–f) N, and (g–i) A calculated by (a, d, g) ENS, (b, e, h) AS, and (c, f, i) the difference between AS and ENS. Note that the color scale is different for the wet deposition of N. Some locations around the Savu Sea (south of Flores, Sumba, and Timor) and the eastern part of New Guinea shown in white are outside of the modeling domain.
4.3 Revision of the distribution of wet deposition over southeast Asia
Based on the analysis and statistical results of the precipitation-adjusted approaches using surface observations and satellite measurements, it was found that these approaches improved the simulation of the wet deposition amount, as well as the fraction of wet deposition occurring during the dry and wet seasons. Although there were still difficulties in some cases, the precipitation adjustment was shown to be an effective way to improve the simulated wet deposition. One of the advantages of the adjustment using satellite measurements is that it provides the spatial distribution of adjustment factors; hence, it is possible to revise the wet deposition mapping over the modeling domain. In Fig. 17, the annual accumulated wet depositions of S, N, and A are mapped. Both the ENS and AS simulated hot spots with high depositions of S, N, and A in regions such as northern Vietnam, the southern Malay Peninsula, and Sumatra and Java in Indonesia. However, there were clear differences between AS and ENS. These differences were similar for the wet depositions of S, N, and A. As shown in Fig. 17 (right), for ENS, higher values (blue color) compared with AS occurred in the central part of continental southeast Asia, such as eastern Myanmar; Thailand; the western edge of Sumatra, the south of Java, and Sulawesi in Indonesia, the Philippines; meanwhile, ENS produced lower values (red color) compared with AS over northern Vietnam, the east of Sumatra, and the northern edge of Java and Kalimantan in Indonesia.

Figure 18Simulated annual accumulated wet deposition amounts of (a) S, (b) N, and (c) A over southeast Asian countries calculated by ENS (light bars without outlines) and AS (dark bars outlined in black). Blue numbers with down-facing arrows indicate downward revision by AS and red numbers with upward-facing arrows indicate upward revision by AS.
Finally, Fig. 18 shows the original and revised wet deposition amounts in the eight countries participating in EANET. This figure summarizes the annual accumulated wet depositions of S, N, and A by the country-scale summed amount. As can be seen from the differences between ENS and AS shown in Fig. 17, the revisions by AS were similar for the wet depositions of S, N, and A. For AS, over Vietnam, Malaysia, and Indonesia, the country-level wet depositions were revised upward, whereas they were revised downward in the other five countries. The magnitudes of these revisions were up to ±40 %. The revision of wet deposition by a precipitation-adjusted approach was critically needed for the accurate estimation of wet deposition. The results of this study suggest that an approach which applies the precipitation obtained from satellite measurements could be used as one of the methodologies in the Measurement–Model Fusion for Global Total Atmospheric Deposition (MMF-GTAD) project under the Global Atmosphere Watch (GAW) program of the World Meteorological Organization (WMO) (WMO GAW, 2017, 2019). In this study, we were able to revise the wet deposition mapping over southeast Asia to achieve better modeling reproducibility compared with EANET.
MICS-Asia phase III has been conducted to understand the current modeling capabilities for wet deposition and comprehend air pollution in Asia. This study presented a detailed analysis over southeast Asia. The ensemble means of the modeled wet depositions of S, N, and A from seven models were evaluated by comparison with the wet deposition observed by EANET. Generally, the ensemble model could capture the observed wet deposition; however, it sometimes failed to capture the wet deposition and obtained low correlations and/or large biases and errors. Based on a detailed analysis of the observed precipitation at each EANET observation site, it was found that this failure to capture the wet deposition was related to the poor representation of the precipitation amount. In some cases, the model did not adequately simulate the precipitation pattern during the dry and wet seasons.
To overcome this modeling difficulty for precipitation, in this study, two precipitation-adjusted approaches were applied using EANET surface observations and TRMM satellite measurements, respectively. Both approaches have been shown to be effective for improving the modeling of the wet depositions of S, N, and A. To use satellite measurements of precipitation, the spatial mappings of wet depositions were further revised. It was found that the original modeled wet deposition was overestimated over the central part of continental southeast Asia, the western edge of Sumatra, the south of Java and Sulawesi in Indonesia, and the Philippines, and it was underestimated over northern Vietnam, the east of Sumatra and the northern edge of Java and Kalimantan in Indonesia. For the country-scale accumulation of wet depositions, the wet deposition amounts were revised by up to ±40 % by the precipitation-adjusted approaches. Similar differences were found for wet depositions of S, N, and A; upward corrections were required for Vietnam, Malaysia, and Indonesia, whereas downward corrections were required for Myanmar, Thailand, Lao PDR, Cambodia, and the Philippines. The use of meteorological models could cause large errors related to precipitation patterns, as found in this study, and the use of meteorological model ensembles could be a possible way to obtain more accurate air quality model simulations (e.g., Kajino et al., 2019b). The precipitation-adjustment approach was effective at most sites; however, no improvement was found at other sites. The understanding of the mechanisms of the wet deposition process itself should be further investigated and intercompared in the future (phase IV). This adjustment approach might be difficult to apply at timescales shorter than 1 month; therefore, the performance of meteorological models for precipitation simulation should be paid further attention in order to improve the simulation accuracy of wet deposition. Additionally, greater inter-model variation was noted in the Philippines and Indonesia, especially during months with heavy precipitation. To investigate the differences on the model wet deposition scheme, such heavy rainy events with finer spatiotemporal resolution should be pursued in the future in MICS-Asia phase IV.
The EANET wet deposition data used in this study are available at https://monitoring.eanet.asia/document/public/index (last access: 1 October 2020; EANET, 2020b). The TRMM satellite precipitation measurements were downloaded from https://doi.org/10.5067/TRMM/TMPA/MONTH/7 (TRMM, 2011). The model results of MICS-Asia phase III are available upon request.
The supplement related to this article is available online at: https://doi.org/10.5194/acp-21-8709-2021-supplement.
SI led the deposition analysis group in MICS-Asia III, performed one of the model simulations, and prepared the manuscript with contributions from all co-authors. BG and KS are members of the deposition analysis group in MICS-Asia III and discussed the results with SI. ZW conducted the meteorological simulation driving the CTM simulation. JK prepared the emission inventory data for southeast Asia and discussed the results from the viewpoint of emissions. JT, JSF, XW, KY, TN, JL, BG, and MK performed the model simulations and contributed to submission of their simulated deposition results. MICS-Asia III was coordinated by GRC and ZW.
The authors declare that they have no conflict of interest.
This article is part of the special issue “Regional assessment of air pollution and climate change over East and Southeast Asia: results from MICS-Asia Phase III”. It is not associated with a conference.
The authors thank EANET for providing the wet deposition observational data. The authors are grateful for the satellite measurement dataset from TRMM.
This paper was edited by Yafang Cheng and reviewed by two anonymous referees.
Akimoto, H., Nagashima, T., Li, J., Fu, J. S., Ji, D., Tan, J., and Wang, Z.: Comparison of surface ozone simulation among selected regional models in MICS-Asia III – effects of chemistry and vertical transport for the causes of difference, Atmos. Chem. Phys., 19, 603–615, https://doi.org/10.5194/acp-19-603-2019, 2019.
Akimoto, H., Nagashima, T., Kawano, N., Jie, L., Fu, J. S., and Wang, Z.: Discrepancies between MICS-Asia III simulation and observation for surface ozone in the marine atmosphere over the northwestern Pacific Asian Rim region, Atmos. Chem. Phys., 20, 15003–15014, https://doi.org/10.5194/acp-20-15003-2020, 2020.
Appel, K. W., Foley, K. M., Bash, J. O., Pinder, R. W., Dennis, R. L., Allen, D. J., and Pickering, K.: A multi-resolution assessment of the Community Multiscale Air Quality (CMAQ) model v4.7 wet deposition estimates for 2002–2006, Geosci. Model Dev., 4, 357–371, https://doi.org/10.5194/gmd-4-357-2011, 2011.
Appel, K. W., Pouliot, G. A., Simon, H., Sarwar, G., Pye, H. O. T., Napelenok, S. L., Akhtar, F., and Roselle, S. J.: Evaluation of dust and trace metal estimates from the Community Multiscale Air Quality (CMAQ) model version 5.0, Geosci. Model Dev., 6, 883–899, https://doi.org/10.5194/gmd-6-883-2013, 2013.
Araki, S., Shimadera, H., Yamamoto, K., and Kondo, A.: Effect of spatial outliers on the regression modelling of air pollutant concentrations: a case study in Japan, Atmos. Environ., 153, 83–93, 2017.
Bey, I., Jacob, D. J., Yantosca, R. M., Logan, J. A., Field, B., Fiore, A. M., Li, Q., Liu, H., Mickley, L. J., and Schultz, M.: Global modeling of tropospheric chemistry with assimilated meteorology: model description and evaluation, J. Geophys. Res., 106, 23073–23095, 2001.
Briggs, D. J., Hoogh, C., Gulliver, J., Wills, J., Elliott, P., Kingham, S., and Smallbone, K.: A regression-based method for mapping traffic-related air pollution: application and testing in four contrasting urban environments, Sci. Total Environ., 253, 151–9167, 2000.
Byun, D. W. and Dennis, R. L.: Design artifacts in Eulerian air quality models: Evaluation of the effects of layer thickness and vertical profile correction on surface ozone concentrations, Atmos. Environ., 29, 105–126, 1995.
Byun, D. and Schere, K. L.: Review of the governing equations, computational algorithms, and other components of the models-3 Community Multiscale Air Quality (CMAQ) modeling system, Appl. Mech. Rev., 59, 51–77, https://doi.org/10.1115/1.2128636, 2006.
Carmichael, G. R., Calori, G., Hayami, H., Uno, I., Cho, S. Y., Engardt, M., Kim, S. -B., Ichikawa, Y., Ikeda, Y., Woo, J.-H., Ueda, H., and Amann, M.: The MICS-Asia study: model intercomparison of long-range transport and sulfur deposition in East Asia, Atmos. Environ., 36, 175–199, 2002.
Carmichael, G. R., Sakurai, T., Streets, D., Hozumi, Y., Ueda, H., Park, S. U., Fung, C., Han, Z., Kajino, M., Engardt, M., Bennet, C., Hayami, H., Sartelet, K., Holloway, T., Wang, Z., Kannari, A., Fu, J., Matsuda, K., Thongboonchoo, N., and Amann, M.: MICS-Asia II: The model intercomparison study for Asia Phase II methodology and overview of findings, Atmos. Environ., 42, 3468–3490, 2008a.
Carmichael, G. R., Sandu, A., Chai, T., Daescu, D. N., Constantinescu, E. M., and Tang, Y.: Predicting air quality: Improvements through advanced methods to integrate models and measurements, J. Comp. Phys., 227, 3540–3571, https://doi.org/10.1016/j.jcp.2007.02.024, 2008b.
Carter, W. L.: Implementation of the SAPRC-99 chemical mechanism into the Models-3 framework, Report to the United States Environmental Protection Agency, available at: http://www.engr.ucr.edu/~carter/pubs/s99mod3.pdf (last access: 1 March 2021), 2000.
Chan, C. K. and Yao, X.: Air pollution in mega cities in China, Atmos. Environ., 42, 1–42, 2008.
Chen, L., Gao, Y., Zhang, M., Fu, J. S., Zhu, J., Liao, H., Li, J., Huang, K., Ge, B., Wang, X., Lam, Y. F., Lin, C.-Y., Itahashi, S., Nagashima, T., Kajino, M., Yamaji, K., Wang, Z., and Kurokawa, J.: MICS-Asia III: multi-model comparison and evaluation of aerosol over East Asia, Atmos. Chem. Phys., 19, 11911–11937, https://doi.org/10.5194/acp-19-11911-2019, 2019.
Colella, P. and Woodward, P. R.: The piecewise parabolic method (PPM) for gas dynamical simulations, J. Comp. Phys., 54, 174–201, 1984.
EANET: Quality assurance/quality control (QA/QC) program for wet deposition monitoring in East Asia, available at: https://www.eanet.asia/wp-content/uploads/2019/04/qaqcwet.pdf (last access: 1 October 2020), 2000.
EANET: Technical manual for wet deposition monitoring in East Asia, available at: https://www.eanet.asia/wp-content/uploads/2019/04/techwet.pdf (last access: 1 October 2020), 2010.
EANET: The Acid Deposition Monitoring Network in East Asia (EANET), available at https://www.eanet.asia, last access: 1 October 2020a.
EANET: Data Report, available at: https://monitoring.eanet.asia/document/public/index, last access: 1 October 2020b.
Foley, K. M., Roselle, S. J., Appel, K. W., Bhave, P. V., Pleim, J. E., Otte, T. L., Mathur, R., Sarwar, G., Young, J. O., Gilliam, R. C., Nolte, C. G., Kelly, J. T., Gilliland, A. B., and Bash, J. O.: Incremental testing of the Community Multiscale Air Quality (CMAQ) modeling system version 4.7, Geosci. Model Dev., 3, 205–226, https://doi.org/10.5194/gmd-3-205-2010, 2010.
Fountoukis, C. and Nenes, A.: ISORROPIA II: a computationally efficient thermodynamic equilibrium model for K+–Ca2+–Mg2+–NH–Na+–SO–NO–Cl−–H2O aerosols, Atmos. Chem. Phys., 7, 4639–4659, https://doi.org/10.5194/acp-7-4639-2007, 2007.
Gao, M., Han, Z., Liu, Z., Li, M., Xin, J., Tao, Z., Li, J., Kang, J.-E., Huang, K., Dong, X., Zhuang, B., Li, S., Ge, B., Wu, Q., Cheng, Y., Wang, Y., Lee, H.-J., Kim, C.-H., Fu, J. S., Wang, T., Chin, M., Woo, J.-H., Zhang, Q., Wang, Z., and Carmichael, G. R.: Air quality and climate change, Topic 3 of the Model Inter-Comparison Study for Asia Phase III (MICS-Asia III) – Part 1: Overview and model evaluation, Atmos. Chem. Phys., 18, 4859–4884, https://doi.org/10.5194/acp-18-4859-2018, 2018.
Gao, M., Han, Z., Tao, Z., Li, J., Kang, J.-E., Huang, K., Dong, X., Zhuang, B., Li, S., Ge, B., Wu, Q., Lee, H.-J., Kim, C.-H., Fu, J. S., Wang, T., Chin, M., Li, M., Woo, J.-H., Zhang, Q., Cheng, Y., Wang, Z., and Carmichael, G. R.: Air quality and climate change, Topic 3 of the Model Inter-Comparison Study for Asia Phase III (MICS-Asia III) – Part 2: aerosol radiative effects and aerosol feedbacks, Atmos. Chem. Phys., 20, 1147–1161, https://doi.org/10.5194/acp-20-1147-2020, 2020.
Ge, B., Itahashi, S., Sato, K., Xu, D., Wang, J., Fan, F., Tan, Q., Fu, J. S., Wang, X., Yamaji, K., Nagashima, T., Li, J., Kajino, M., Liao, H., Zhang, M., Wang, Z., Li, M., Woo, J.-H., Kurokawa, J., Pan, Y., Wu, Q., Liu, X., and Wang, Z.: Model Inter-Comparison Study for Asia (MICS-Asia) phase III: multimodel comparison of reactive nitrogen deposition over China, Atmos. Chem. Phys., 20, 10587–10610, https://doi.org/10.5194/acp-20-10587-2020, 2020.
Ge, B. Z, Wang, Z. F., Xu, X. B., Wu, J. B., Yu, X. L., and Li, J.: Wet deposition of acidifying substances in different regions of China and the rest of East Asia: Modeling with updated NAQPMS, Environ. Pollut., 187, 10–21, 2014.
Hayami, H., Sakurai, T., Han, Z., Ueda, H., Carmichael, G. R., Streets, D., Holloway, T., Wang, Z., Thongboonchoo, N., Engardt, M., Bennet, C., Fung, C., Chang, A., Park, S. U., Sartelet, K., Matsuda, K., and Amann, M.: MICS-Asia II: Model intercomparison and evaluation of particulate sulfate, nitrate and ammonium, Atmos. Environ., 42, 3510–3527, 2008.
Huffman, G. J., Adler, R. F., Bolvin, D. T., Gu, G., Nelkin, E. J., Bowman, K. P., Stocker, E. F., and Wolff, D. B.: The TRMM multi-satellite precipitation analysis: Quasi-global, Multi-year, Combined-sensor precipitation estimates at fine scale, J. Hydrometeor., 8, 38–55, 2007.
Itahashi, S.: Toward synchronous evaluation of source apportionments for atmospheric concentration and deposition of sulfate aerosol over East Asia, J. Geophys. Res., 123, 2927–2953, 2018.
Itahashi, S., Uno, I., Irie, H., Kurokawa, J., and Ohara, T.: Impacts of biomass burning emissions on tropospheric NO2 vertical column density over continental Southeast Asia, in: Land-Atmospheric Research Applications in South and Southeast Asia, Springer Remote Sensing/Photogrammetry, edited by: Vadrevu K., Ohara T., and Justice C., Springer, Cham, 67–81, https://doi.org/10.1007/978-3-319-67474-2_4, 2018.
Itahashi, S., Ge, B., Sato, K., Fu, J. S., Wang, X., Yamaji, K., Nagashima, T., Li, J., Kajino, M., Liao, H., Zhang, M., Wang, Z., Li, M., Kurokawa, J., Carmichael, G. R., and Wang, Z.: MICS-Asia III: overview of model intercomparison and evaluation of acid deposition over Asia, Atmos. Chem. Phys., 20, 2667–2693, https://doi.org/10.5194/acp-20-2667-2020, 2020.
Janjic, Z.: The step-mountain eta coordinate model: Further developments of the convection, viscous sublayer, and turbulence closure schemes, Mon. Weather Rev., 122, 927–945, 1994.
Kajino, M., Deushi, M., Sekiyama, T. T., Oshima, N., Yumimoto, K., Tanaka, T. Y., Ching, J., Hashimoto, A., Yamamoto, T., Ikegami, M., Kamada, A., Miyashita, M., Inomata, Y., Shima, S., Takami, A., Shimizu, A., Hatakeyama, S., Sadanaga, Y., Irie, H., Adachi, K., Zaizen, Y., Igarashi, Y., Ueda, H., Maki, T., and Mikami, M.: NHM-Chem, the Japan Meteorological Agency's regional meteorology – chemistry model: model evaluations toward the consistent predictions of the chemical, physical and optical properties of aerosols, J. Meteor. Soc. Jpn., 97, 337–374, https://doi.org/10.2151/jmsj.2019-020, 2019a.
Kajino, M., Sekiyama, T. T., Igarashi, Y., Katata, G., Sawada, M., Adachi, K., Zaizen, Y., Tsuruta, H., and Nakajima, T.: Deposition and dispersion of radio-cesium released due to the Fukushima nuclear accident: Sensitivity to meteorological models and physical modules, J. Geophys. Res. Atmos., 124, 1823–1845, https://doi.org/10.1029/2018JD028998, 2019b.
Kong, L., Tang, X., Zhu, J., Wang, Z., Fu, J. S., Wang, X., Itahashi, S., Yamaji, K., Nagashima, T., Lee, H.-J., Kim, C.-H., Lin, C.-Y., Chen, L., Zhang, M., Tao, Z., Li, J., Kajino, M., Liao, H., Wang, Z., Sudo, K., Wang, Y., Pan, Y., Tang, G., Li, M., Wu, Q., Ge, B., and Carmichael, G. R.: Evaluation and uncertainty investigation of the NO2, CO and NH3 modeling over China under the framework of MICS-Asia III, Atmos. Chem. Phys., 20, 181–202, https://doi.org/10.5194/acp-20-181-2020, 2020.
Li, J., Wang, Z., Wang, X., Yamaji, K., Takigawa, M., Kanaya, Y., Pochanart, P., Liu, Y., Irie, H., Hu B., Tanimoto, H., and Akimoto, H.: Impacts of aerosols on summertime tropospheric photolysis frequencies and photochemistry over Central Eastern China, Atmos. Environ., 45, 1817–1829, 2011.
Li, J., Yang, W., Wang, Z., Chen, H., Hu, B., Li, J., Sun, Y., Fu, P., and Zhang, Y.: Modeling study of surface ozone source-receptor relationships in East Asia, Atmos. Res., 167, 77–88, 2016.
Li, J., Nagashima, T., Kong, L., Ge, B., Yamaji, K., Fu, J. S., Wang, X., Fan, Q., Itahashi, S., Lee, H.-J., Kim, C.-H., Lin, C.-Y., Zhang, M., Tao, Z., Kajino, M., Liao, H., Li, M., Woo, J.-H., Kurokawa, J., Wang, Z., Wu, Q., Akimoto, H., Carmichael, G. R., and Wang, Z.: Model evaluation and intercomparison of surface-level ozone and relevant species in East Asia in the context of MICS-Asia Phase III – Part 1: Overview, Atmos. Chem. Phys., 19, 12993–13015, https://doi.org/10.5194/acp-19-12993-2019, 2019.
Li, M., Zhang, Q., Kurokawa, J.-I., Woo, J.-H., He, K., Lu, Z., Ohara, T., Song, Y., Streets, D. G., Carmichael, G. R., Cheng, Y., Hong, C., Huo, H., Jiang, X., Kang, S., Liu, F., Su, H., and Zheng, B.: MIX: a mosaic Asian anthropogenic emission inventory under the international collaboration framework of the MICS-Asia and HTAP, Atmos. Chem. Phys., 17, 935–963, https://doi.org/10.5194/acp-17-935-2017, 2017.
Lin, N.-H., Tsay, S. C., and Maring, H. B.: An overview of regional experiments on biomass burning aerosols and related pollutants in Southeast Asia: from BASE-ASIA and the Dongsha Experiment to 7-SEAS, Atmos. Environ., 78, 1–19, 2013.
Liu, X. J., Zhang, Y., Han, W. X., Tang, A. H., Shen, J. L., Cui, Z. L., Vitousek, P., Erisman, J. W., Goulding, K., Christie, P., Fangmeier, A., and Zhang, F. S.: Enhanced nitrogen deposition over China, Nature, 494, 459–462, 2013.
Nenes, A., Pandis, S. N., and Pilinis, C.: ISORROPIA: A new thermodynamic equilibrium model for multiphase multicomponent inorganic aerosols, Aquat. Geoch., 4, 123–152, 1998.
Pleim, J. E.: A combined local and nonlocal closure model for the atmospheric boundary layer, Part I: Model description and testing, J. Appl. Meteor. Climatol., 46, 1383–1395, 2007a.
Pleim, J. E.: A combined local and nonlocal closure model for the atmospheric boundary layer. Part II: Application and evaluation in a mesoscale meteorological model, J. Appl. Meteorol. Clim., 46, 1396–1409, 2007b.
Pleim, J. E., Xiu, A., Finkelstein, P. L., and Otte, T. L.: A coupled land-surface and dry deposition model and comparison to field measurements of surface heat, moisture, and ozone fluxes, Water Air Soil Pollut. Focus, 1, 243–252, https://doi.org/10.1023/A:1013123725860, 2001.
Reid, J. S., Hyer, E. J., Johnson R. S., Holben, B. N., Yokelson, R. J., Zhang, J., Campbell, J. R., Christopher, S. A., Girolamo, L. D., Giglio, L., Holz, R. E., Kearney, C., Miettinen, J., Reid, E. A., Turk, F. J., Wang, J., Xian, P., Zhao, G., Balasubramanian, R., Chew, B. N., Janjai, S., Lagrosas, N., Lestari, P., Lin, N.-H., Mahmud, M., Nguyen, A. X., Norris, B., Oanh, N. T. K., Oo, M., Salinas, S. V., Welton, E. J., and Liew, S. C.: Observing and understanding the Southeast Asian aerosol system by remote sensing: an initial review and analysis for the Seven Southeast Asian Studies (7SEAS) program, Atmos. Res., 122, 403–468, 2013.
Ross, Z., Jerrett, M., Ito, K., Tempalski, B., and Thurston, G. D.: A land regression for predicting fine particulate matter concentrations in the New York City region, Atmos. Environ., 41, 2255–2269, 2007.
Saya, A., Yoshikane, T., Chang, E.-C., Yoshimura, K., and Oki, T.: Precipitation redistribution method for regional simulations of radioactive material transport during the Fukushima Daiichi Nuclear Power Plant accident, J. Geophys. Res.-Atmos., 123, 10248–10259, https://doi.org/10.1029/2018JD028531, 2018.
Skamarock, W. C., Klemp, J. B., Dudhia, J., Gill, D. D., Barker, D. M., Duda, M. G., Huang, X.-Y., Wang, W., and Powers, J. G.: A description of the advanced research WRF version 3, Nat. Cent. Atmos. Res., Boulder, CO, NCAR Technical Note, NCAR/TN-475+STR, 113 pp., 2008.
Solazzo, E., Bianconi, R., Pirovano, G., Matthias, V., Vautard, R., Appel, K. W., Bessagnet, B., Brandt, J., Christensen, J. H., Chemel, C., Coll, I., Ferreira, J., Forkel, R., Francis, X. V., Grell, G., Grossi, P., Hansen, A., Miranda, A. I., Moran, M. D., Nopmongco, U., Parnk, M., Sartelet, K. N., Schaap, M., D. Silver, J., Sokhi, R. S., Vira, J., Werhahn, J., Wolke, R., Yarwood, G., Zhang, J., Rao, S. T., and Galmarin, S.: Model evaluation and ensemble modelling of surface-level ozone in Europe and North America in the context of AQMEII, Atmos. Environ., 53, 60–74, 2012.
Sudo, K., Takahashi, M., and Akimoto, H.: CHASER: A global chemical model of the troposphere 2. Model results and evaluation, J. Geophys. Res., 107, 4586, https://doi.org/10.1029/2001JD001114, 2002a.
Sudo, K., Takahashi, M., Kurokawa, J. I., and Akimoto, H.: CHASER: A global chemical model of the troposphere 1. Model description, J. Geophys. Res., 107, 4339, https://doi.org/10.1029/2001JD001113, 2002b.
Tan, J., Fu, J. S., Carmichael, G. R., Itahashi, S., Tao, Z., Huang, K., Dong, X., Yamaji, K., Nagashima, T., Wang, X., Liu, Y., Lee, H.-J., Lin, C.-Y., Ge, B., Kajino, M., Zhu, J., Zhang, M., Liao, H., and Wang, Z.: Why do models perform differently on particulate matter over East Asia? A multi-model intercomparison study for MICS-Asia III, Atmos. Chem. Phys., 20, 7393–7410, https://doi.org/10.5194/acp-20-7393-2020, 2020.
Tropical Rainfall Measuring Mission (TRMM): TRMM (TMPA/3B43) Rainfall Estimate L3 1 month 0.25 degree × 0.25 degree V7, Greenbelt, MD [dataset], Goddard Earth Sciences Data and Information Services Center (GES DISC), https://doi.org/10.5067/TRMM/TMPA/MONTH/7, 2011.
Vadrevu, K. P. and Justice, C. O.: Vegetation fires in the Asian region: satellite observational needs and priorities, Global Environ. Res., 15, 65–76, 2011.
Vet, R., Artz, R. S., Carou, S., Shaw, M., Ro, C. -U., Aas, W., Baker, A., Bowersox, V. C., Dentener, F., Galy-Lacaux, C., Hou, A., Pienaar, J. J., Gillett, R., Forti, M. C., Gromov, S., Hara, H., Khodzher, T., Mahowald, N. M., Nickovic, S., Rao, P. S. P., and Reid, N. W.: A global assessment of precipitation chemistry and deposition of sulfur, nitrogen, sea salt, base cations, organic acids, acidity and pH, and phosphorous, Atmos. Environ., 93, 3–100, https://doi.org/10.1016/j.atmosenv.2013.10.060, 2014.
Walcek, C. J. and Aleksic, N. M.: A simple but accurate mass conservative peak-preserving, mixing ratio bounded advection algorithm with FORTRAN code, Atmos. Environ., 32, 3863–3880, 1998.
Wang, Z., Xie, F., Sakurai, T., Ueda, H., Han, Z., Carmichael, G. R., Streets, D., Engardt, M., Holloway, T., Hayami, H., Kajino, M., Thongboonchoo, N., Bennet, C., Park, S. U., Fung, C., Chang, A., Sartelet, K., and Amann, M.: MICS-Asia II: Model inter-comparison and evaluation of acid deposition, Atmos. Environ., 42, 3528–3542, https://doi.org/10.1016/j.atmosenv.2007.12.071, 2008.
Wesely, M. L.: Parameterization of surface resistance to gaseous dry deposition in regional numerical models, Atmos. Environ., 16, 1293–1304, 1989.
World Meteorological Organization Global Atmosphere Watch (WMO GAW): Global Atmosphere Watch Workshop on Measurement-Model Fusion for Global Total Atmospheric Deposition (MMF-GTAD), World Meteorological Organization, Geneva, Switzerland, GAW Report No. 234, 2017.
World Meteorological Organization Global Atmosphere Watch (WMO GAW): Global Atmosphere Watch Expert Meeting on Measurement-Model Fusion for Global Total Atmospheric Deposition, World Meteorological Organization, Geneva, Switzerland, GAW Report No. 250, 2019.
Yamartino, R. J.: Nonnegative, conserved scalar transport using grid-cell-centered, spectrally constrained Blackman cubics for applications on a variable-thickness mesh, Mon. Weather Rev., 121, 753–763, 1993.
Zaveri, R. A. and Peters, L. K.: A new lumped structure photochemical mechanism for large-scale applications, J. Geophys. Res., 104, 30387–30415, 1999.
Zhang, Y., Mathur, R., Bash, J. O., Hogrefe, C., Xing, J., and Roselle, S. J.: Long-term trends in total inorganic nitrogen and sulfur deposition in the US from 1990 to 2010, Atmos. Chem. Phys., 18, 9091–9106, https://doi.org/10.5194/acp-18-9091-2018, 2018.