the Creative Commons Attribution 4.0 License.
the Creative Commons Attribution 4.0 License.
 | 27 May 2021
Contribution of the world's main dust source regions to the global cycle of desert dust
Adeyemi A. Adebiyi
Samuel Albani
Yves Balkanski
Ramiro Checa-Garcia
Mian Chin
Peter R. Colarco
Douglas S. Hamilton
Yue Huang
Akinori Ito
Martina Klose
Longlei Li
Natalie M. Mahowald
Ron L. Miller
Vincenzo Obiso
Carlos Pérez García-Pando
Adriana Rocha-Lima
Jessica S. Wan
Even though desert dust is the most abundant aerosol by mass in Earth's atmosphere, the relative contributions of the world's major source regions to the global dust cycle remain poorly constrained. This problem hinders accounting for the potentially large impact of regional differences in dust properties on clouds, the Earth's energy balance, and terrestrial and marine biogeochemical cycles. Here, we constrain the contribution of each of the world's main dust source regions to the global dust cycle. We use an analytical framework that integrates an ensemble of global aerosol model simulations with observationally informed constraints on the dust size distribution, extinction efficiency, and regional dust aerosol optical depth (DAOD). We obtain a dataset that constrains the relative contribution of nine major source regions to size-resolved dust emission, atmospheric loading, DAOD, concentration, and deposition flux. We find that the 22–29 Tg (1 standard error range) global loading of dust with a geometric diameter up to 20 µm is partitioned as follows: North African source regions contribute ∼ 50 % (11–15 Tg), Asian source regions contribute ∼ 40 % (8–13 Tg), and North American and Southern Hemisphere regions contribute ∼ 10 % (1.8–3.2 Tg). These results suggest that current models on average overestimate the contribution of North African sources to atmospheric dust loading at ∼ 65 %, while underestimating the contribution of Asian dust at ∼ 30 %. Our results further show that each source region's dust loading peaks in local spring and summer, which is partially driven by increased dust lifetime in those seasons. We also quantify the dust deposition flux to the Amazon rainforest to be ∼ 10 Tg yr−1, which is a factor of 2–3 less than inferred from satellite data by previous work that likely overestimated dust deposition by underestimating the dust mass extinction efficiency. The data obtained in this paper can be used to obtain improved constraints on dust impacts on clouds, climate, biogeochemical cycles, and other parts of the Earth system.
- Article
(8399 KB) - Full-text XML
- Companion paper
-
Supplement
(28987 KB) - BibTeX
- EndNote


Desert dust is likely the most abundant aerosol type by mass (Kinne et al., 2006; Kok et al., 2017) and produces a range of important impacts on the Earth system, including on clouds, the Earth's energy and water budgets, and biogeochemical cycles (Shao et al., 2011; Mahowald et al., 2014; Miller et al., 2014). These impacts are spatially heterogeneous, not only because dust loading itself varies substantially between regions, but also because the properties of dust depend on mineralogy, which varies with the region of origin (Claquin et al., 1999; Grousset and Biscaye, 2005; Journet et al., 2014). Consequently, determining dust impacts on the Earth system requires not only constraints on global dust loading (Huneeus et al., 2011; Kok et al., 2017), but also on the emission, loading, and deposition generated by individual source regions. However, estimates of the contributions of the world's major source regions to the global dust cycle diverge widely. For instance, model estimates of emissions from the main source regions vary by up to an order of magnitude between different global aerosol model simulations (Huneeus et al., 2011; Wu et al., 2020).
There are several reasons why this poor understanding of the contribution of each source region to the global dust cycle hinders quantification of dust impacts on the Earth system. First, since dust loading is spatially heterogeneous, constraining regional dust loading is a prerequisite to constraining dust impacts on regional climate, weather, air quality, and the hydrological cycle (Seinfeld et al., 2004; Engelstaedter et al., 2006; Huang et al., 2014; Vinoj et al., 2014; Sharma and Miller, 2017; Kok et al., 2018). Second, dust deposition records indicate that atmospheric dust loading has been highly variable between glacial and interglacial periods and from pre-industrial to modern times (Petit et al., 1999; McConnell et al., 2007; Albani et al., 2018; Hooper and Marx, 2018). Inferring the impacts of these large changes in dust loading on the Earth system requires knowledge of the origin of dust deposited to each measurement site (Mahowald et al., 2010). Finally, many dust impacts on the Earth system are sensitive to dust mineralogy, which varies both within and between major source regions (Biscaye, 1965; Claquin et al., 1999; Di Biagio et al., 2017). Examples of dust impacts that are sensitive to mineralogy include dust direct radiative effects (Balkanski et al., 2007; Perlwitz et al., 2015b; Scanza et al., 2015; Di Biagio et al., 2019), dust interactions with clouds through dust serving as ice-nucleating particles (Atkinson et al., 2013; Shi and Liu, 2019), and dust impacts on biogeochemistry through the deposition of micronutrients such as iron and phosphorus (Swap et al., 1992; Jickells et al., 2005; Journet et al., 2008; Schroth et al., 2009). Since dust has potentially doubled since pre-industrial times (Mahowald et al., 2010; Hooper and Marx, 2018), some of these effects might have produced a marine biogeochemical response (Hamilton et al., 2020; Ito et al., 2020) that might have resulted in a substantial global indirect radiative forcing (Mahowald, 2011). As such, constraining source-specific dust emissions and loading is critical to constraining global climate sensitivity (Andreae et al., 2005; Kiehl, 2007).
Many past studies of the contributions of the main dust source regions to the global dust cycle have been based on global aerosol model simulations (Tanaka and Chiba, 2006; Chin et al., 2007; Huneeus et al., 2011; Wu et al., 2020). These simulations exhibit substantial biases when compared to observations of dust abundance and of dust microphysical properties like size distribution and mass extinction efficiency (Kok et al., 2014a; Ansmann et al., 2017; Adebiyi et al., 2020; Checa-Garcia et al., 2020). Recognizing this problem, Ginoux et al. (2012) made an important advance towards more accurate constraints on the regional contributions to the global dust cycle by using extensive dust aerosol optical depth data from the Moderate Resolution Imaging Spectroradiometer (MODIS) Deep Blue algorithm to obtain a fine-grained map of the frequency of activation of dust sources. They then used this result to scale emissions in a global aerosol model simulation tuned to a specific global emission rate (1223 Tg yr−1 for dust up to 12 µm diameter) obtained in a previous modeling study (Ginoux et al., 2001), thereby obtaining results for the emission rate generated by each main source region. Another recent study by Albani et al. (2014) regionally tuned model sources to match concentration, deposition, and aerosol optical depth observations using optimal estimation combined with expert opinion to incorporate geochemical tracer information in dust deposition measurements. Although both these studies are steps towards obtaining more reliable constraints on the contribution of each main source region to the global dust cycle, remaining deficiencies include (1) substantial biases in dust microphysical properties such as size distribution and extinction efficiency (Adebiyi and Kok, 2020; Adebiyi et al., 2020), (2) the use of a single model to represent dust transport and emission even though the spread in predictions between models is large (Huneeus et al., 2011; Checa-Garcia et al., 2020; Wu et al., 2020), and (3) the lack of robust uncertainty estimates in the contributions of the different source regions that can be propagated into calculated dust impacts such as dust radiative forcing. As such, although progress has been made in understanding the relative contributions of the world's source regions to the global dust cycle, current knowledge is not yet sufficient to constrain regionally varying dust impacts or to reliably inform the provenance of dust in deposition records.
Here we obtain improved constraints on the contributions from the world's main dust source regions to the global cycle of desert dust. We do so in Sect. 2 by building on the improved representation of the global dust cycle obtained in a companion paper (Kok et al., 2021a). We obtain a dataset that constrains the contributions of nine major source regions to size-resolved dust emission, loading, dust aerosol optical depth (DAOD), concentration, and deposition. Our results in Sect. 3 suggest that most models overestimate the contribution of African dust to the global dust cycle, while they underestimate the contribution of Asian dust. As discussed in Sect. 4, our dataset can be used to improve global dust cycle simulations and to constrain dust impacts on the Earth system, including on regional and global climate, weather, air quality, ecosystems, and the hydrological cycle.
We seek to constrain the contributions of the world's major source regions to the global dust cycle. We do so by analyzing constraints obtained in our companion paper (Kok et al., 2021a) on the dust loading, concentration, emission flux, wet and dry deposition fluxes, and DAOD generated by each source region. These constraints were obtained through an analytical framework that used an inverse model to integrate an ensemble of model simulations with observational constraints on dust properties and abundance. Briefly, we used simulations from six different global models of dust emitted by nine major source regions (Fig. 1) and for each model particle bin (or mode) extending to a maximum diameter of 20 µm. These emissions implicitly include both natural and anthropogenic dust and together account for over 99 % of global low-latitude desert dust emissions (our methodology excludes high-latitude dust). We then used optimal estimation to determine how many units of dust loading from each source region and particle bin produces the best agreement against observational constraints on the dust size distribution, extinction efficiency, and regional dust aerosol optical depth. This approach yielded constraints on the dust loading, optical depth, concentration, and emission and deposition fluxes that are resolved by location, season, and particle size. These constraints include uncertainties propagated from the spread in model simulation results and in the observationally informed constraints on dust microphysical properties and regional DAOD. The companion paper (Kok et al., 2021a) showed that this approach resulted in a representation of the Northern Hemisphere dust cycle that is substantially more accurate than obtained from a large number of climate and chemical transport model simulations and the dust product of the Modern-Era Retrospective analysis for Research and Applications Version 2 (MERRA-2; Buchard et al., 2017), with modest improvements for the Southern Hemisphere dust cycle.
Below, we first describe how we used the results from this inverse model to obtain the fractional contribution to dust loading, concentration, emission flux, wet and dry deposition fluxes, and DAOD generated by each source region (Sect. 2.1). For the remainder of this paper, we refer to these results as the “inverse model results”. We then describe our analysis of the dust emission, dust loading, and DAOD generated by each source region in the ensemble of AeroCom Phase I global aerosol model simulations (Huneeus et al., 2011) (Sect. 2.2).
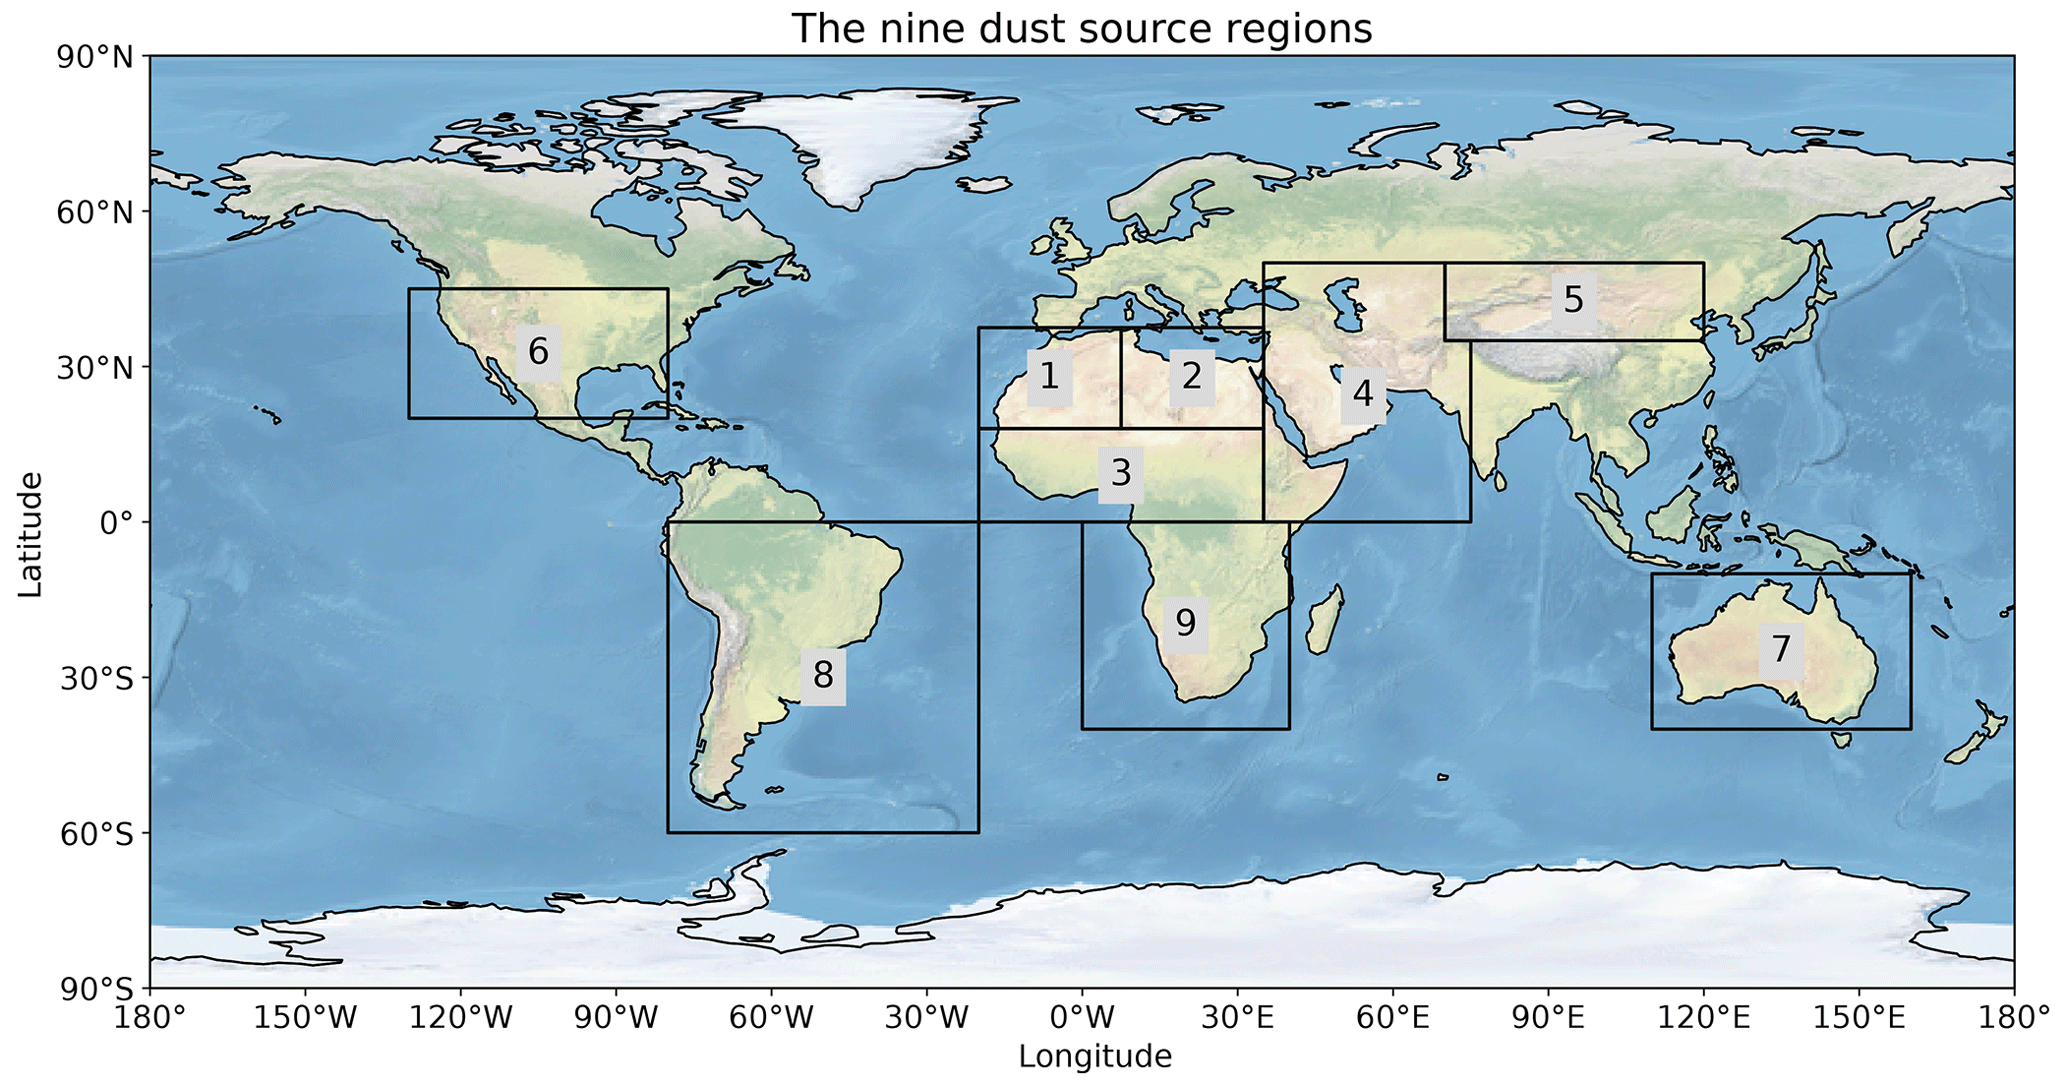
Figure 1Coordinates of the nine main source regions used in this study. The nine source regions are (1) western North Africa, (2) eastern North Africa, (3) the southern Sahara and Sahel, (4) the Middle East and central Asia (which includes the Horn of Africa), (5) East Asia, (6) North America, (7) Australia, (8) South America, and (9) southern Africa. Exact coordinates for these regions are given in Kok et al. (2021a). After Kok et al. (2021a); made with Natural Earth.
2.1 Attribution of the global dust cycle to the different dust source regions
The analysis in Kok et al. (2021a) integrated an ensemble of global aerosol model simulations with observational constraints on dust properties and abundance to obtain the size-resolved dust optical depth, column loading, emission flux, deposition flux, and concentration for each season and source region. Here we used these inverse modeling results to constrain the fractional contribution of each source region to DAOD (), column loading (), dust concentration (), and dust deposition flux (). These fields are a function of longitude, latitude, pressure level (P; in the case of dust concentration), and season (subscript s):
where , , , and are respectively the spatially resolved bulk DAOD, dust loading, concentration, and total (wet and dry) deposition flux generated by dust from source season r in season s, obtained from the analysis in Kok et al. (2021a). These four products account for bulk dust with a geometric diameter up to 20 µm (PM20). We also obtained the corresponding size-resolved fields for different particle diameter bins k, namely for 0.2–0.5, 0.5–1.0, 1.0–2.5, 2.5–5.0, 5.0–10, and 10–20 µm (see the Supplement for details).
The DAOD, column loading, concentration, and deposition fields used in Eqs. (1)–(4) are probability distributions that account for the propagation of errors in the observational constraints and modeling results that were used as inputs to generate these fields (see Sect. 2.5 in Kok et al., 2021a). The fractional contributions of each source region to DAOD, column loading, concentration, and deposition flux obtained by Eqs. (1)–(4) are thus also probability distributions. We added the mean and median, the upper and lower 1 standard error estimates, and the upper and lower 2 standard error estimates to the Dust Constraints from joint Experimental–Modeling–Observational Analysis (DustCOMM) dataset (Adebiyi et al., 2020), which is available at https://dustcomm.atmos.ucla.edu/ (last access: 13 May 2020).
2.2 Obtaining emission, loading, and DAOD per source region from AeroCom models
As described in more detail in the companion paper (Kok et al., 2021a), we analyzed 13 AeroCom Phase I simulations of the dust cycle in the year 2000 (Huneeus et al., 2011) for comparison against the inverse model results of the contribution of each source region to the global dust cycle. Although newer global aerosol model ensembles are available, such as the AeroCom Phase III (Gliß et al., 2021) and CMIP5 model ensembles (Wu et al., 2020), only the dust component of AeroCom Phase I models has been analyzed in sufficient detail (Huneeus et al., 2011) for comparison against the results of our study. However, the error of newer model ensembles relative to various measurements appears to be similar to those for AeroCom Phase I models (see further discussion in Kok et al., 2021a), and emissions per source region of CMIP5 models are relatively similar to those of the AeroCom Phase I models analyzed here (see Table 4 in Wu et al., 2020).
Since AeroCom simulations did not track the source region of atmospheric dust after emission, we used our ensemble of model simulations (see Table 1 in Kok et al., 2021a) to estimate regional differences in the conversion of source-specific dust emission to source-specific global loading and the conversion of source-specific global loading to source-specific global DAOD. Specifically, we estimated the global loading (Tg) generated by dust emitted from source region r as simulated by an AeroCom model as
where is the bulk emission flux generated by source region r simulated by a given AeroCom model, is the global bulk (mass-weighted) dust lifetime simulated by the AeroCom model (obtained from Table 3 in Huneeus et al., 2011), and and are respectively the mean bulk lifetimes for source region r and for dust from all source regions (both obtained from our inverse model results; see Fig. 3a). As such, estimates the ratio of the lifetime of dust from source region r to the global dust lifetime. This ratio is used in Eq. (5) to correct the global dust lifetime simulated by an AeroCom model to the lifetime for dust emitted from source region r, which in turn is used to calculate the dust loading generated by source region r from its emission flux.
We furthermore obtain the DAOD generated by the dust emitted from source region r as simulated by an AeroCom model as
where AEarth is the Earth's surface area (m2) and is the bulk dust mass extinction efficiency (MEE) simulated by a given AeroCom model (obtained from Table 3 in Huneeus et al., 2011). Similar to the approach used in Eq. (5), and are respectively the bulk dust MEE for source region r and for dust from all source regions (both also obtained from our inverse model results; see Table 3 in Kok et al., 2021a). Note that using and from our model ensemble to approximate the lifetime and MEE per source region in AeroCom models will introduce some error; however, because and are dimensionless ratios, we expect these errors to be relatively small compared to other errors. This is also indicated by the limited differences between the fractional contributions to emission, loading, and DAOD for the different source regions (Fig. 2).
We report each source region's contributions to the global dust cycle on annual and seasonal timescales in Sect. 3.1 and 3.2, respectively. We then report the spatial distribution of dust column loading and DAOD in Sect. 3.3 and the spatial distribution of dust deposition fluxes in Sect. 3.4.
3.1 Constraints on each source region's contribution to the global dust cycle
We obtained each source region's absolute and fractional contributions to the annual global dust emission and deposition flux, the global dust loading, and the global DAOD (see Table 1 and Fig. 2). For comparison, we also obtained these properties for our ensemble of simulations and for the AeroCom Phase I model ensemble (see Sect. 2.2).
Our inverse model results on each source region's contribution to the global dust cycle show some notable differences from our model ensemble and the AeroCom Phase I ensemble. First, the inverse model results indicate that PM20 dust emission fluxes for all source regions are substantially greater than most models include (Table 1; also see Kok et al., 2021a). This is in part because many models simulate dust up to a maximum geometric diameter smaller than 20 µm (see further discussion in Kok et al., 2021a) and in part because most models that do simulate dust with a diameter larger than 10 µm substantially underestimate dust emission and loading in the 10–20 µm diameter range (Adebiyi and Kok, 2020; Huang et al., 2021). Accounting for this additional coarse dust in the atmosphere is important because it produces a substantial direct radiative forcing (Ryder et al., 2019; Adebiyi and Kok, 2020; Di Biagio et al., 2020) and because it accounts for a large fraction of dust deposition fluxes to marine and terrestrial ecosystems (see below).
A second important difference between our results and that of the two model ensembles is in the fractional contributions per source region to the global dust cycle. However, both multi-model ensemble means show that ∼ 60 %–65 % of dust loading and DAOD is generated by North African source regions, ∼ 20 %–25 % from the Middle East and central Asia, ∼ 5 %–9 % from East Asia, < 1 % from North America, and ∼ 5 % from the Southern Hemisphere source regions (Fig. 2b). In contrast, we find that North African dust contributes only about half of the global dust loading (1 standard error range of 11–15 Tg) and DAOD (0.013–0.015). Specifically, we find that the southern Sahara and Sahel source region contributes ∼ 15 % of global dust loading (with a large one standard error range of 1.6–5.4 Tg) and that western North Africa (∼ 20 %; 4.2–7.1 Tg) likely contributes substantially more dust than eastern North Africa (∼ 15 %; 2.2–6.0 Tg). These fractional contributions of western and eastern North Africa are substantially less than the average for models in our ensemble and in the AeroCom ensemble, both of which obtained a ∼ 25 %–30 % contribution for both regions. These findings that most models overestimate the fractional contribution of North Africa to global dust loading and that western North Africa generates a larger dust loading than eastern North Africa appear to be consistent with satellite observations (Engelstaedter et al., 2006; Shindell et al., 2013). We furthermore find that the ∼ 15 % contribution of the southern Sahara and Sahel to global dust loading is similar to that simulated by models in our ensemble but that AeroCom models simulated a contribution of on average only ∼ 6 %, thereby possibly underestimating the contribution from the southern Sahara and Sahel by about a factor of 2. Our finding of a larger contribution to global dust loading from the southern Sahara and Sahel is consistent with the fact that this source region includes the Bodélé Depression, which is a major dust source (Warren et al., 2007). Nonetheless, our results add to an emerging consensus (Glaser et al., 2015; Bozlaker et al., 2018; Yu et al., 2020) that dust from the Bodélé Depression accounts for much less than the previously proposed ∼ 50 % of North African dust transported across the Atlantic (Koren et al., 2006; Washington et al., 2009; Evan et al., 2015).
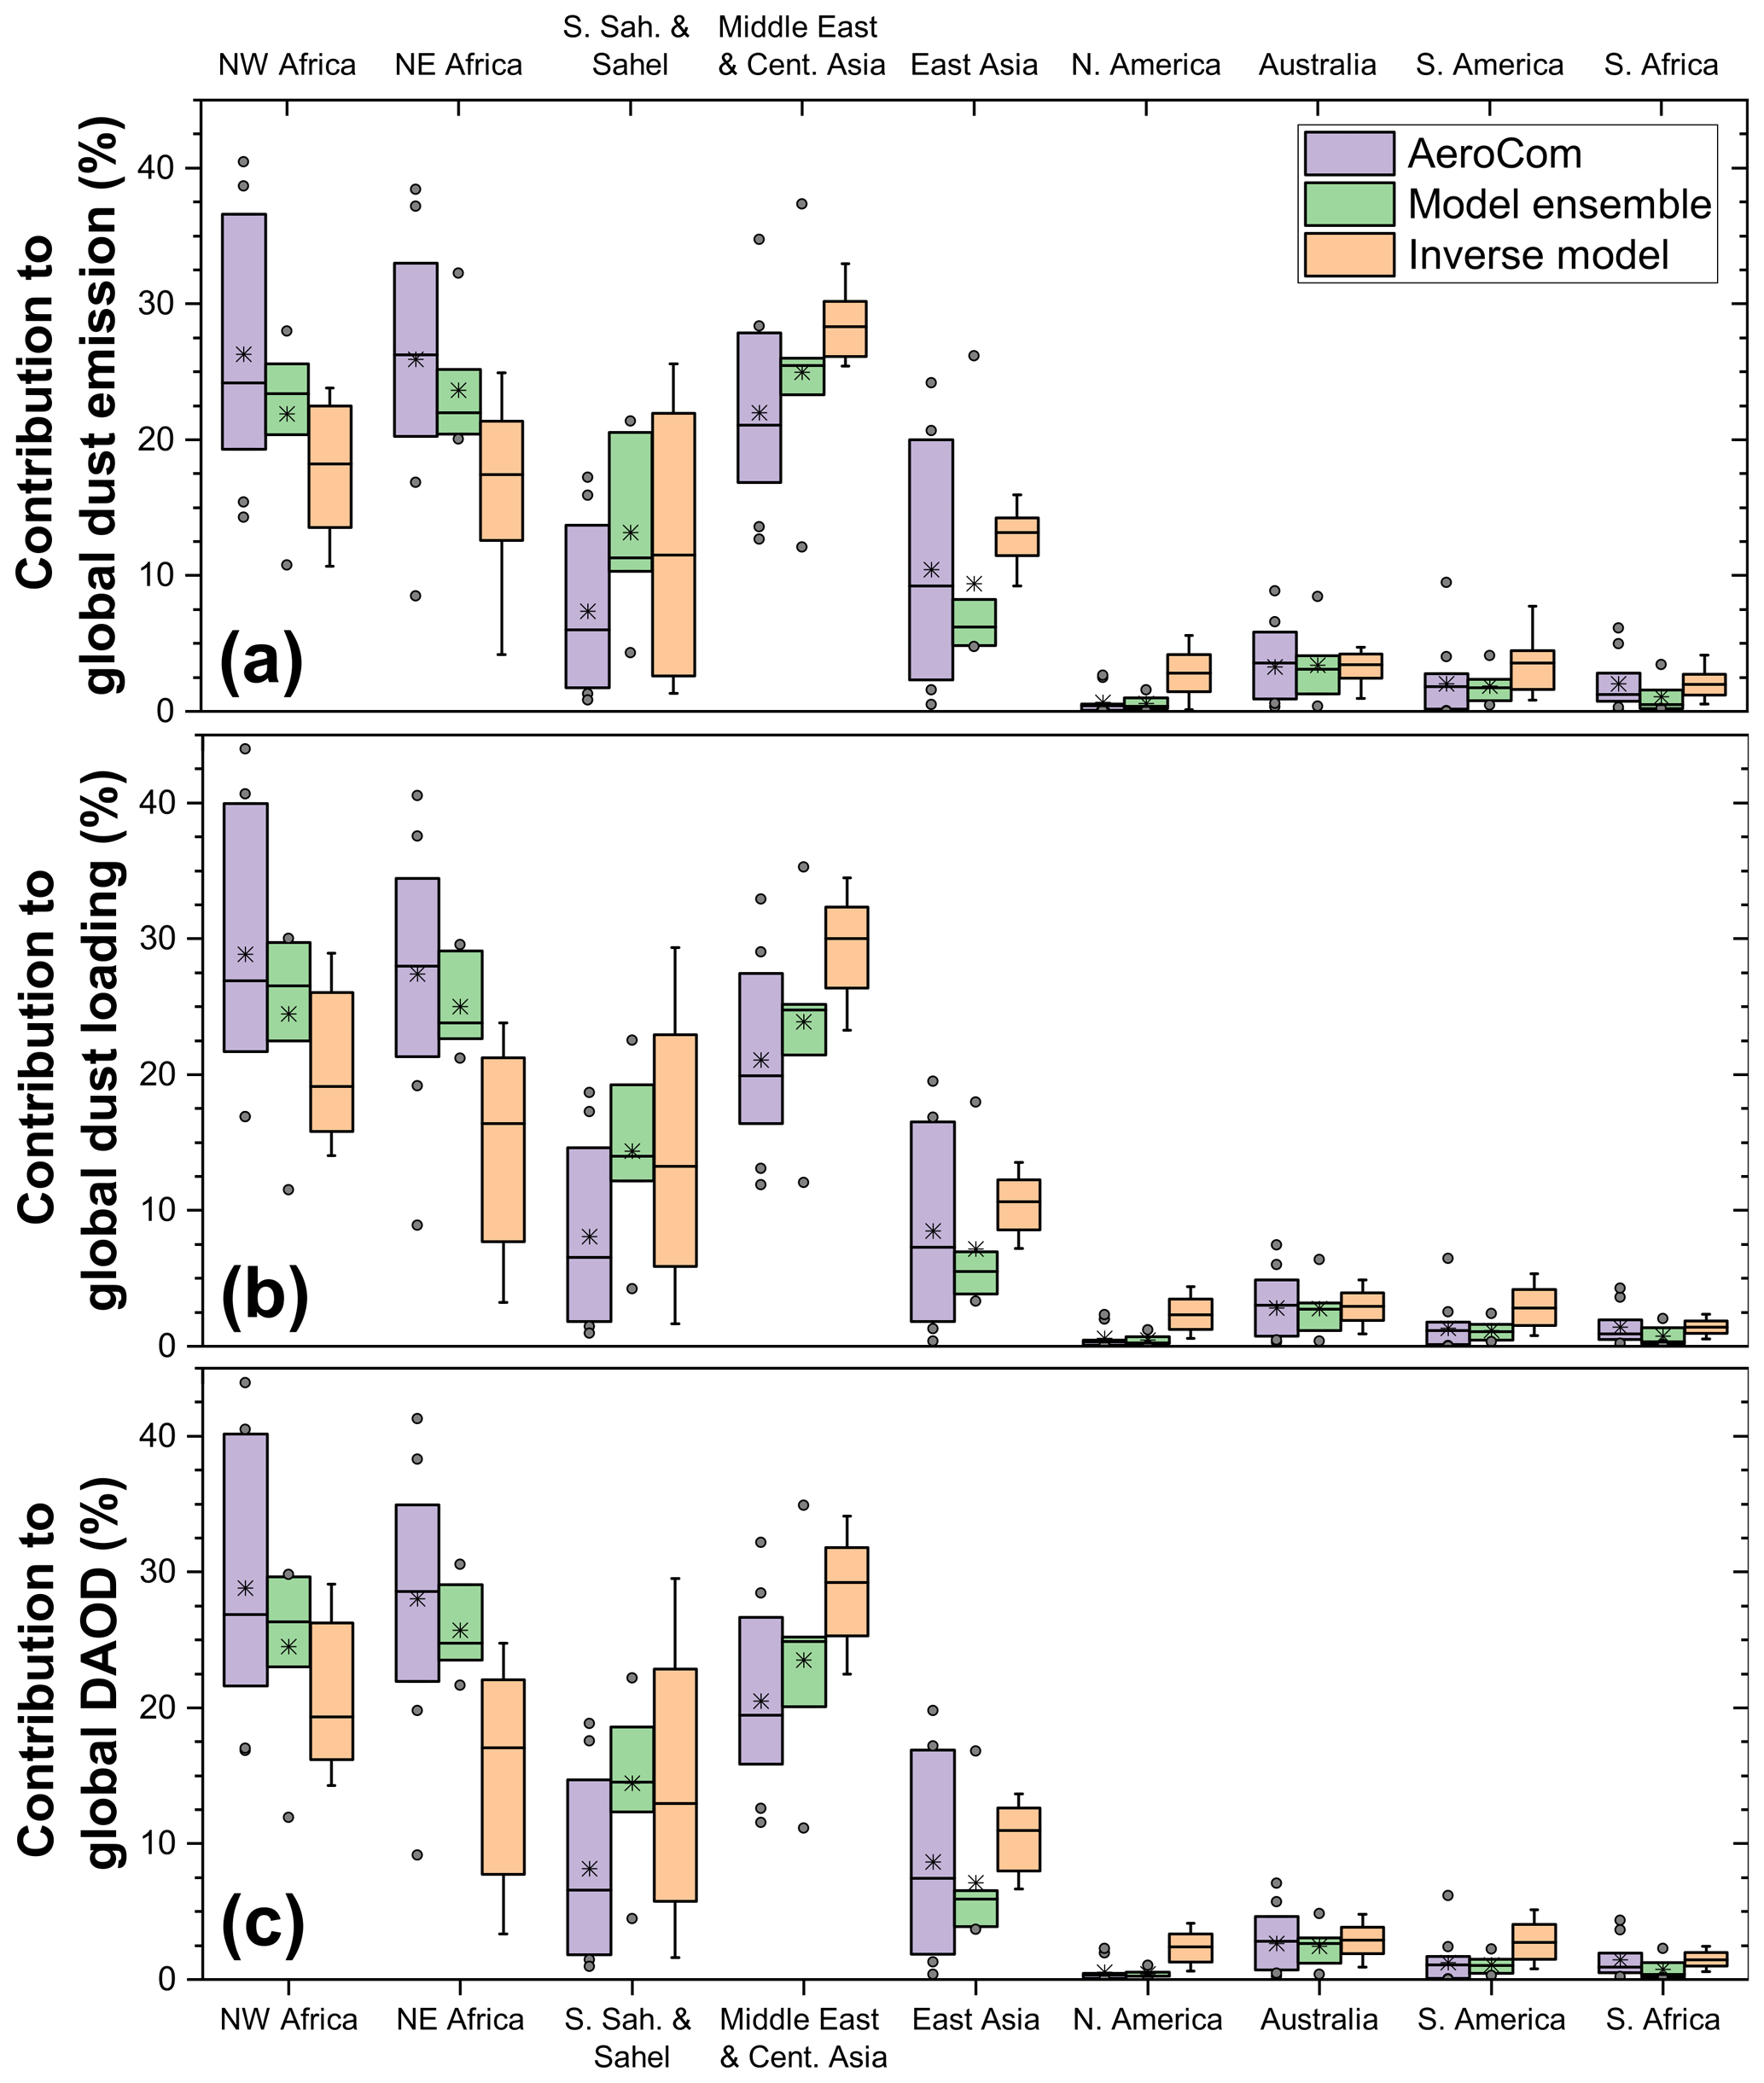
Figure 2Fractional contribution of each source region to the global dust cycle. Shown are the fractional contributions to the annual global dust emission (and deposition) flux (a), the global dust loading (b), and the global DAOD (c) for the AeroCom ensemble (purple boxes; see Sect. 2.2), our model ensemble (green boxes), and for the inverse model (orange boxes). Box boundaries approximately denote the one standard error range (i.e., boxes contain 9 out of 13 AeroCom simulations, 4 out of 6 model ensemble members, and the 68 % probability range for the inverse model results), gray circles denote the individual simulation results outside this range, whiskers denote the 95 % confidence interval for the inverse model results, horizontal solid lines denote the median result, and stars denote the mean result. Results for each season are shown in Figs. S1–S4.
We find that, after the North African source regions, the Asian source regions account for the bulk of the remainder of global dust emissions, loading, and DAOD. In particular, the Middle Eastern and central Asian source regions account for ∼ 30 % of global dust loading (6.1–9.4 Tg), which is more than the ∼ 20 %–25 % estimated from the AeroCom ensemble and our model ensemble. We further find that East Asian source regions account for another ∼ 11 % of global dust loading (2.0–3.4 Tg), which is more than the ∼ 7 % estimated from the two model ensembles. Overall, we find that Asian dust accounts for ∼ 40 % of global dust loading.
Table 1Contributions of the world's nine major source regions to the global dust cycle. Listed are median values for the AeroCom Phase I ensemble and the inverse model results, with 1 standard error intervals listed in parentheses. For the AeroCom ensemble, the 1 standard range was obtained from the range spanned by the 9 central model results out of the 13 total model results, which corresponds to the central 69 % of model results. For the inverse model results, the 1 error range was obtained from the central 68 % of results from a large number (103) of bootstrap iterations (see Kok et al., 2021a). Note that inverse model results are for dust with D≤20 µm, whereas the size range accounted for by AeroCom models differs for each model (see Huneeus et al., 2011).
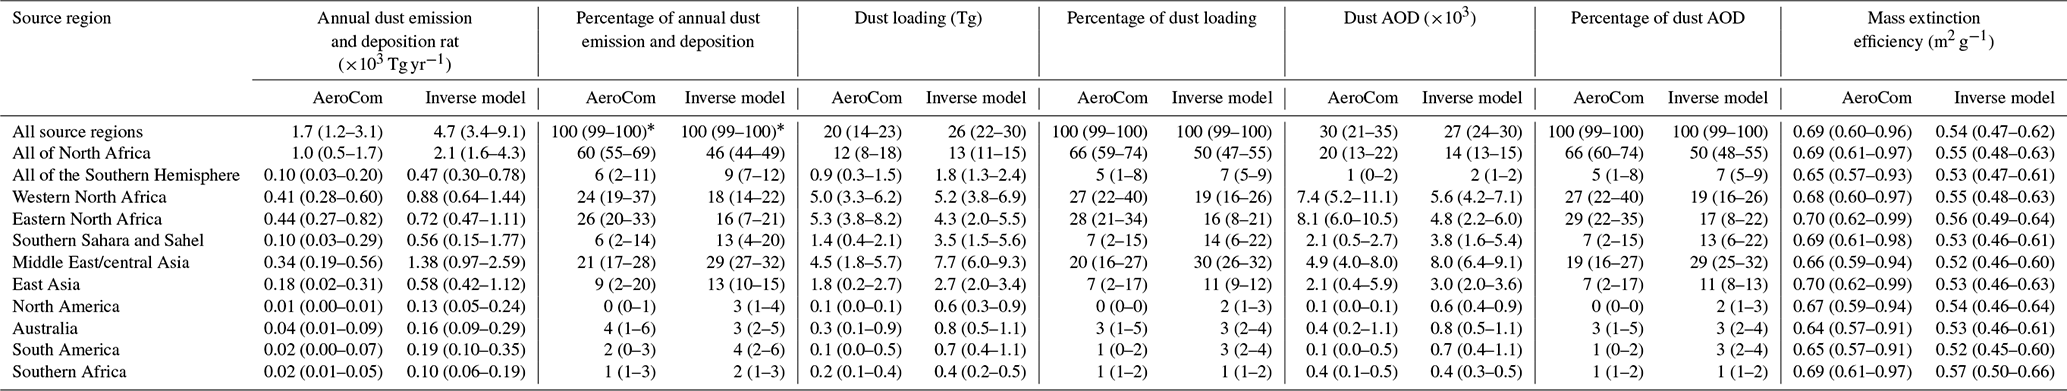
* The fraction of global emissions of desert dust accounted for by the nine source regions is calculated by using simulated global emissions in the latitude band of 50∘ S–50∘ N. This was done to exclude high-latitude dust emissions, which the inverse model does not account for.
We find that the lesser source regions of North and South America, Australia, and southern Africa account for ∼ 10 % of the global dust loading (1.8–3.2 Tg). This is substantially more than the ∼ 5 %–6 % of the global dust loading that both model ensembles estimate for these minor source regions. In particular, we find that the relative contribution of North America to global dust loading is ∼ 2.5 % (0.3–0.9 Tg), or ∼ 5 times greater than estimated by both model ensembles (see further discussion in Sect. 3.4.1). Similarly, the relative contribution of South America is approximately twice as large (∼ 3 % of global dust loading; 0.4–1.1 Tg). However, there are large uncertainties in our estimates for these minor source regions because it is difficult to obtain accurate constraints on the DAOD over those regions. In particular, the contributions of other aerosol species (e.g., sea spray) to total AOD can be larger than that due to dust (Ridley et al., 2016), which propagates into large uncertainties for our constraint on dust emissions, loading, and DAOD generated by these source regions (see Table 1). Nonetheless, our results further confirm that the global dust cycle is dominated by Northern Hemisphere dust, with Southern Hemisphere dust accounting for less than 10 % of global dust loading.
The moderate differences between each source region's fractional contribution to global dust loading and emission–deposition fluxes (Fig. 2) are due to differences in the lifetimes of dust from each source region (Fig. 3). We find that atmospheric lifetimes are largest for dust emitted from the world's main source regions in North Africa and the Middle East–central Asia. As discussed in more detail in Sect. 3.2, this likely occurs because dust emitted from these regions experiences strong convection, lofting the dust to greater heights in the atmosphere (Cakmur et al., 2004). The relatively large lifetime of North African dust causes it to account for half (∼ 50 %) of the global dust loading and DAOD, even though it accounts for somewhat less than half (∼ 46 %) of the global PM20 dust emissions (Fig. 2 and Table 1). Differences in size-resolved lifetimes between different source regions (Fig. S5) also drive small differences in the MEE between the different source regions (Table 1; note that we do not account for possible regional differences in MEE due to differences in dust mineralogy; Perlwitz et al., 2015a; Scanza et al., 2015).
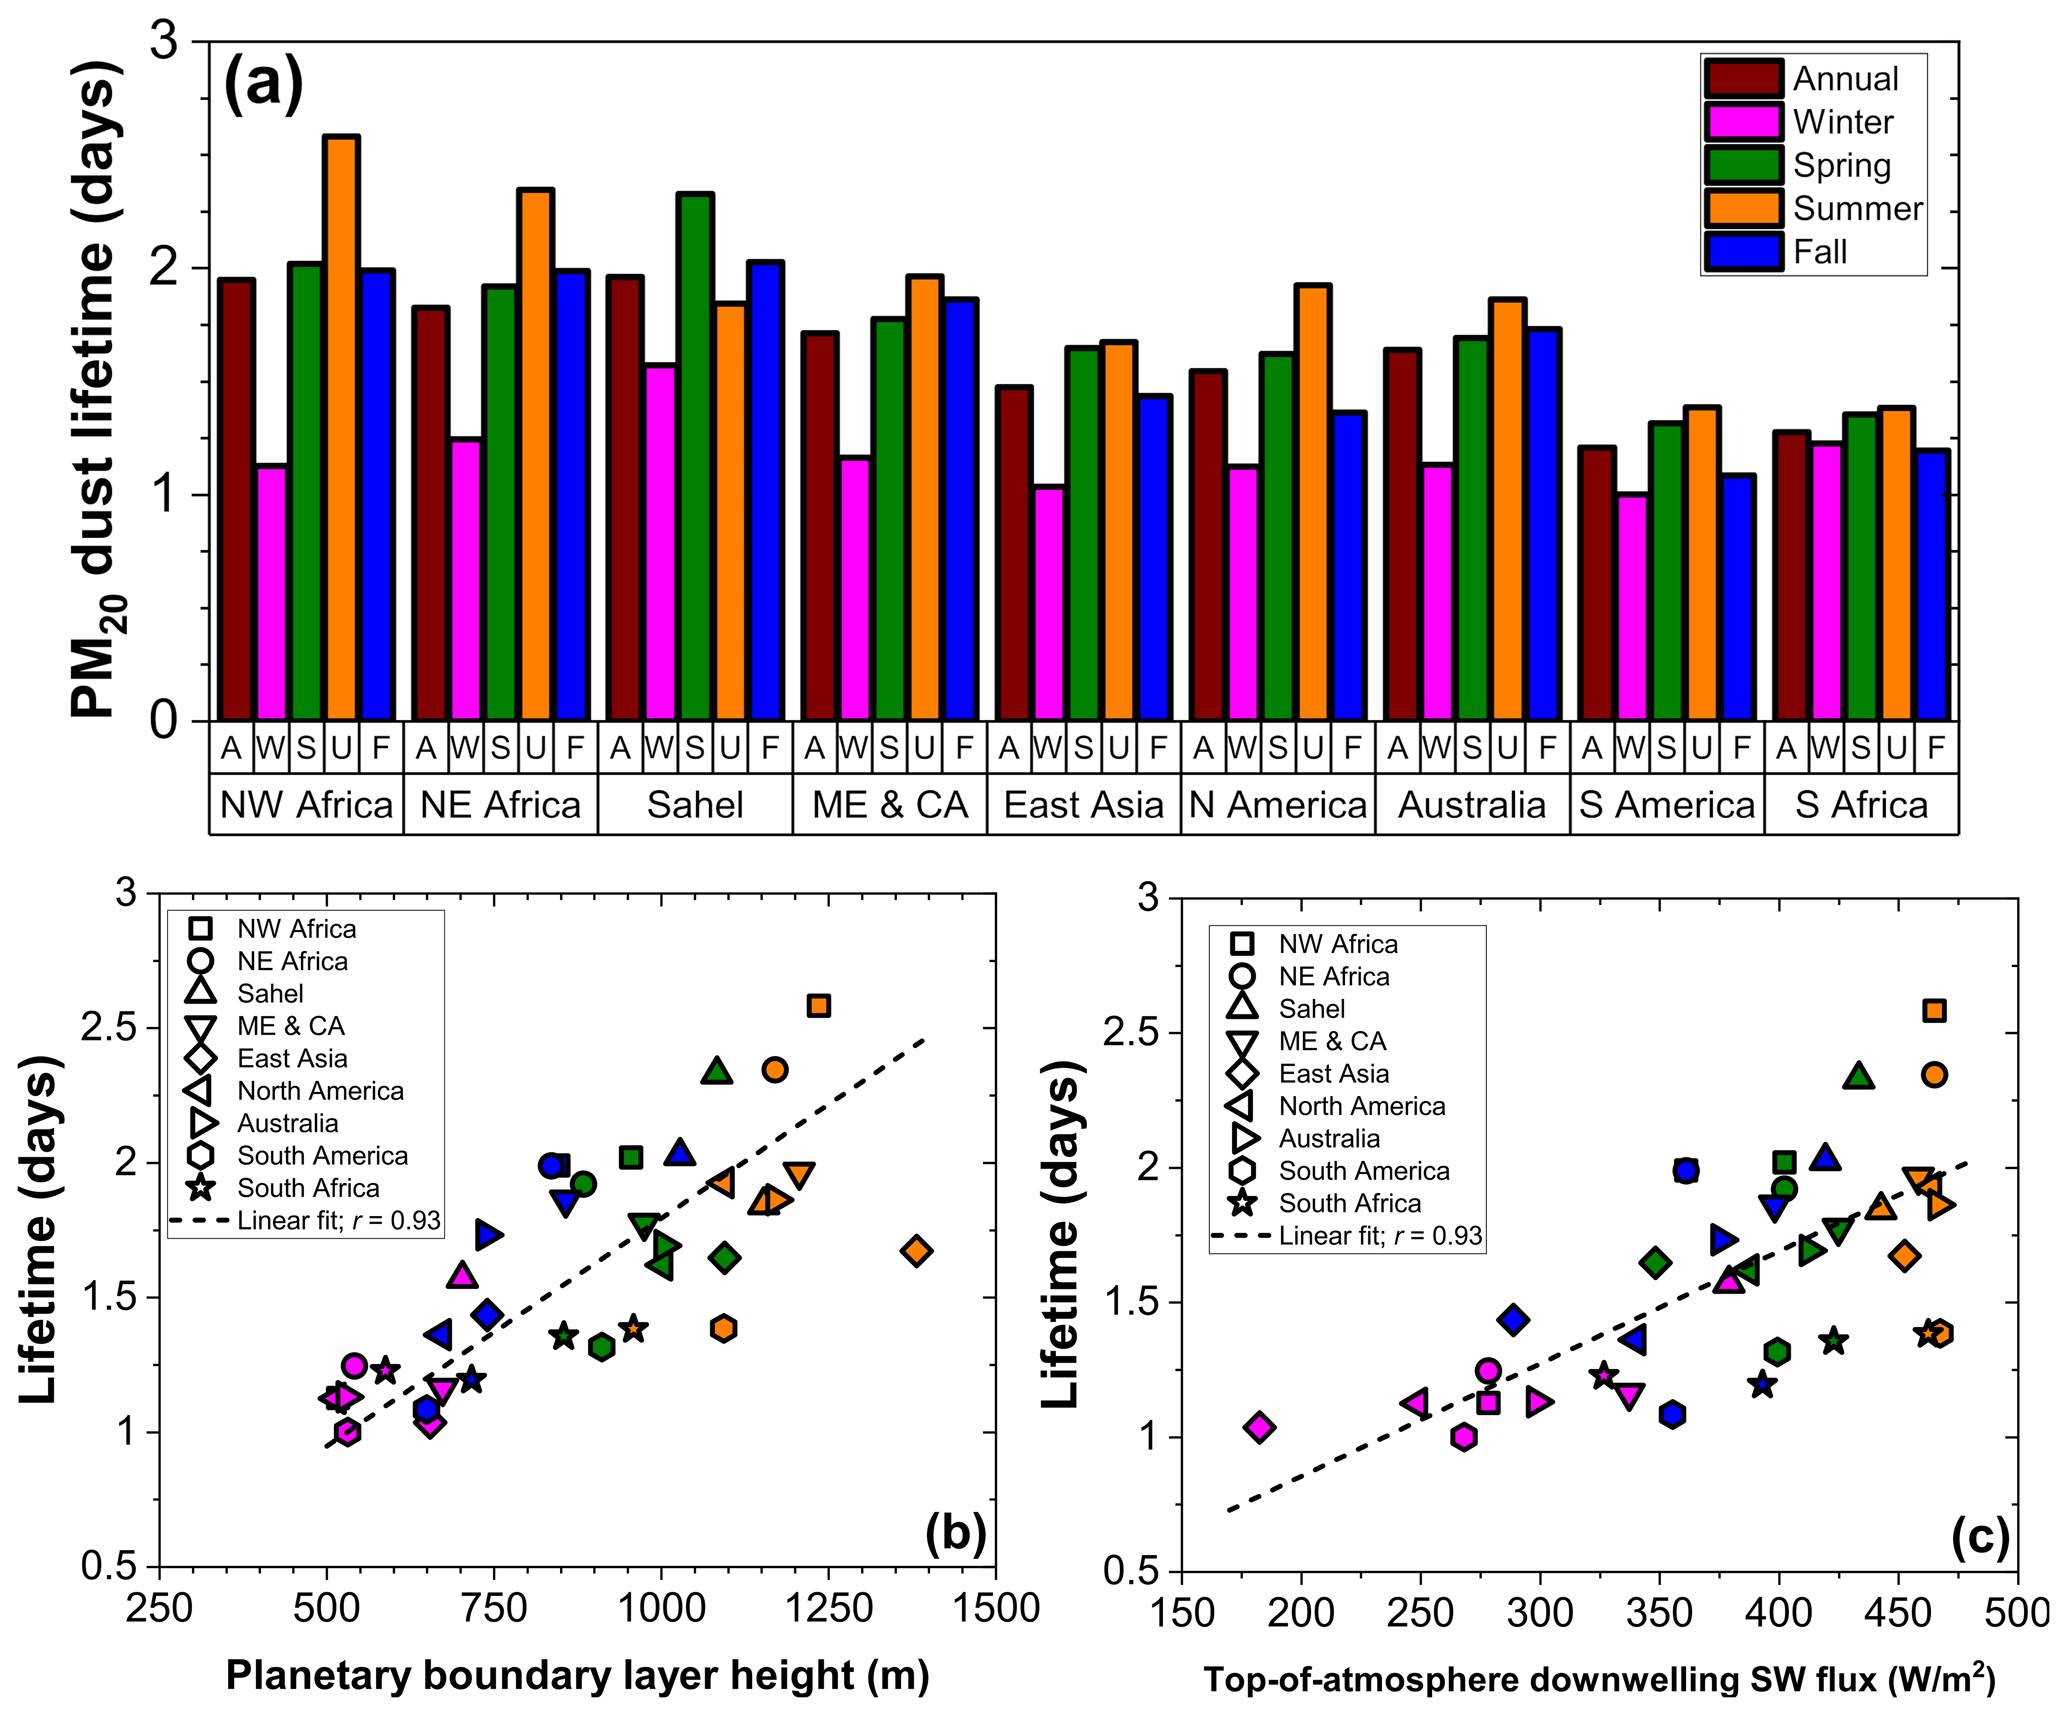
Figure 3Seasonal variation of dust lifetime for the different source regions. (a) Mass-weighted lifetime of PM20 dust for each source region on an annual basis (A; brown bars) and for each source region's local winter (W), spring (S), summer (U), and fall (F) seasons (magenta, green, orange, and blue bars). Variations in dust lifetime are largely explained by differences in downwelling SW flux (panel b) and planetary boundary layer (PBL) height (panel c). This indicates that the increased modeled dust lifetime in spring and summer is due to increased convection, which lofts dust to greater altitudes. The colors of the symbols in panels (b) and (c) denote the season per the color scheme in panel (a). The TOA downwelling SW flux was obtained from Wong and Chow (2001), the seasonally averaged PBL height was obtained from the GISS Model E2.1 simulation (Kelley et al., 2020), and the mass-weighted dust lifetimes were obtained from the ratio of the PM20 dust loading to the deposition flux for each source region and season. Size-resolved annual and seasonal dust lifetimes of the individual model ensemble simulations used in the inverse model are shown in Figs. S5–S9.
3.2 Seasonality of each source region's dust cycle
We further analyzed our results to obtain the seasonality of each source region's dust cycle (Fig. 4). We find that only ∼ 15 %–30 % of the total PM20 deposition flux is due to wet deposition, with some variability with season and source region. This dominance of deposition fluxes by dry deposition in all seasons occurs because coarse dust dominates the total emission flux and those particles are predominantly removed through dry deposition (e.g., Miller et al., 2006). However, most of this dry deposition flux is due to coarse dust depositing close to source regions, and wet deposition remains dominant further from source regions (Yu et al., 2019; van der Does et al., 2020). All source regions show peaks in dust loading and DAOD in spring or summer, and these seasons are substantially dustier than the fall and winter seasons for both the Northern and the Southern Hemisphere. Our results are consistent with well-known features of the seasonality of the dust cycle, such as spring and summertime peaks in Saharan dust loading, springtime peaks in Sahelian and East Asian dust loading, and spring and summertime peaks in Australian dust loading (Goudie and Middleton, 2001; Prospero et al., 2002; Ekstrom et al., 2004; Ginoux et al., 2012; Knippertz and Todd, 2012; Xu et al., 2016).
We find that an important contributor to the peaks in dustiness in spring and summer is an enhanced dust lifetime during those seasons (Fig. 3). A multi-linear regression analysis shows that, on average, approximately one-quarter of the variance in seasonal dust loading is explained by the seasonal variability in lifetime, approximately one-third is explained by the seasonal variability in emissions, and the rest of the variance is explained by the correlation between emissions and lifetime. In fact, several source regions do not show a clear peak in emissions during spring and summer (i.e., western and eastern North Africa and southern Africa) but nonetheless show clear peaks in loading and DAOD that are driven by the increased lifetime in those seasons. This seasonality in the lifetime is likely driven by the stronger convection in spring and summer, lofting emitted dust to greater heights in those seasons when solar insolation is largest. One exception might be the Sahel, for which the lifetime in fall is longer than in summer (Fig. 3a), which appears to be due to increased wet deposition (Fig. 4f), presumably due to proximity to the Intertropical Convergence Zone and the West African monsoon in summer (Glaser et al., 2015). Nonetheless, we find that most of the variance in dust lifetime between seasons and source regions is explained by differences in the planetary boundary layer depth (R2=0.86; Fig. 3b), which in turn are largely due to differences in the top-of-atmosphere shortwave downwelling flux (R2=0.86; Fig. 3c).

Figure 4Seasonal contributions of each source region to the global dust cycle. Shown are the seasonal cycles of the wet deposition flux (blue bars and left axis), dry deposition flux (orange bars and left axis), dust loading (green circles and right axis), and DAOD (magenta diamonds and right axis) generated by (a) all source regions, (b) all North African source regions, (c) all Southern Hemisphere source regions, and (d–l) each of the nine individual source regions. The sum of the seasonal wet and dry deposition fluxes is approximately equal (within a few percent) to the seasonal dust emission flux generated by each source region. Results for loading and DAOD are slightly offset horizontally for clarity. Seasons refer to boreal seasons for global results (a) and to local seasons for all other panels. Note that the vertical axis scale differs between source regions. Error bars denote 1 standard error from the median; error bars on deposition fluxes usually exceeded 100 % and are not included for clarity.
3.3 Spatial distribution of each source region's contribution to DAOD, column loading, and concentration
Consistent with the ∼ 50 % fractional contribution of North African source regions to the global DAOD, we find that North African dust contributes substantially to DAOD and loading in most of the Northern Hemisphere, with dust from East Asia and the Middle East–central Asia also contributing substantially in several regions (Figs. 5 and S11). However, the Intertropical Convergence Zone (ITCZ) poses a formidable barrier to the interhemispheric transport of dust from these major Northern Hemisphere source regions (see also the seasonal DAOD and loading results in Figs. S12–S19). Even though Northern Hemisphere dust accounts for ∼ 93 % of the global dust loading, it contributes only up to ∼ 10 % to the dust loading south of the ITCZ. Note that this result depends sensitively on the ability of models to represent interhemispheric transport. Although other modeling studies have found somewhat different contributions of Northern Hemisphere source regions to Southern Hemisphere dust (e.g., Li et al., 2008; Albani et al., 2012), our results support the conclusion that dust in the Southern Hemisphere is overwhelmingly supplied by the Australian, South American, and southern African source regions.
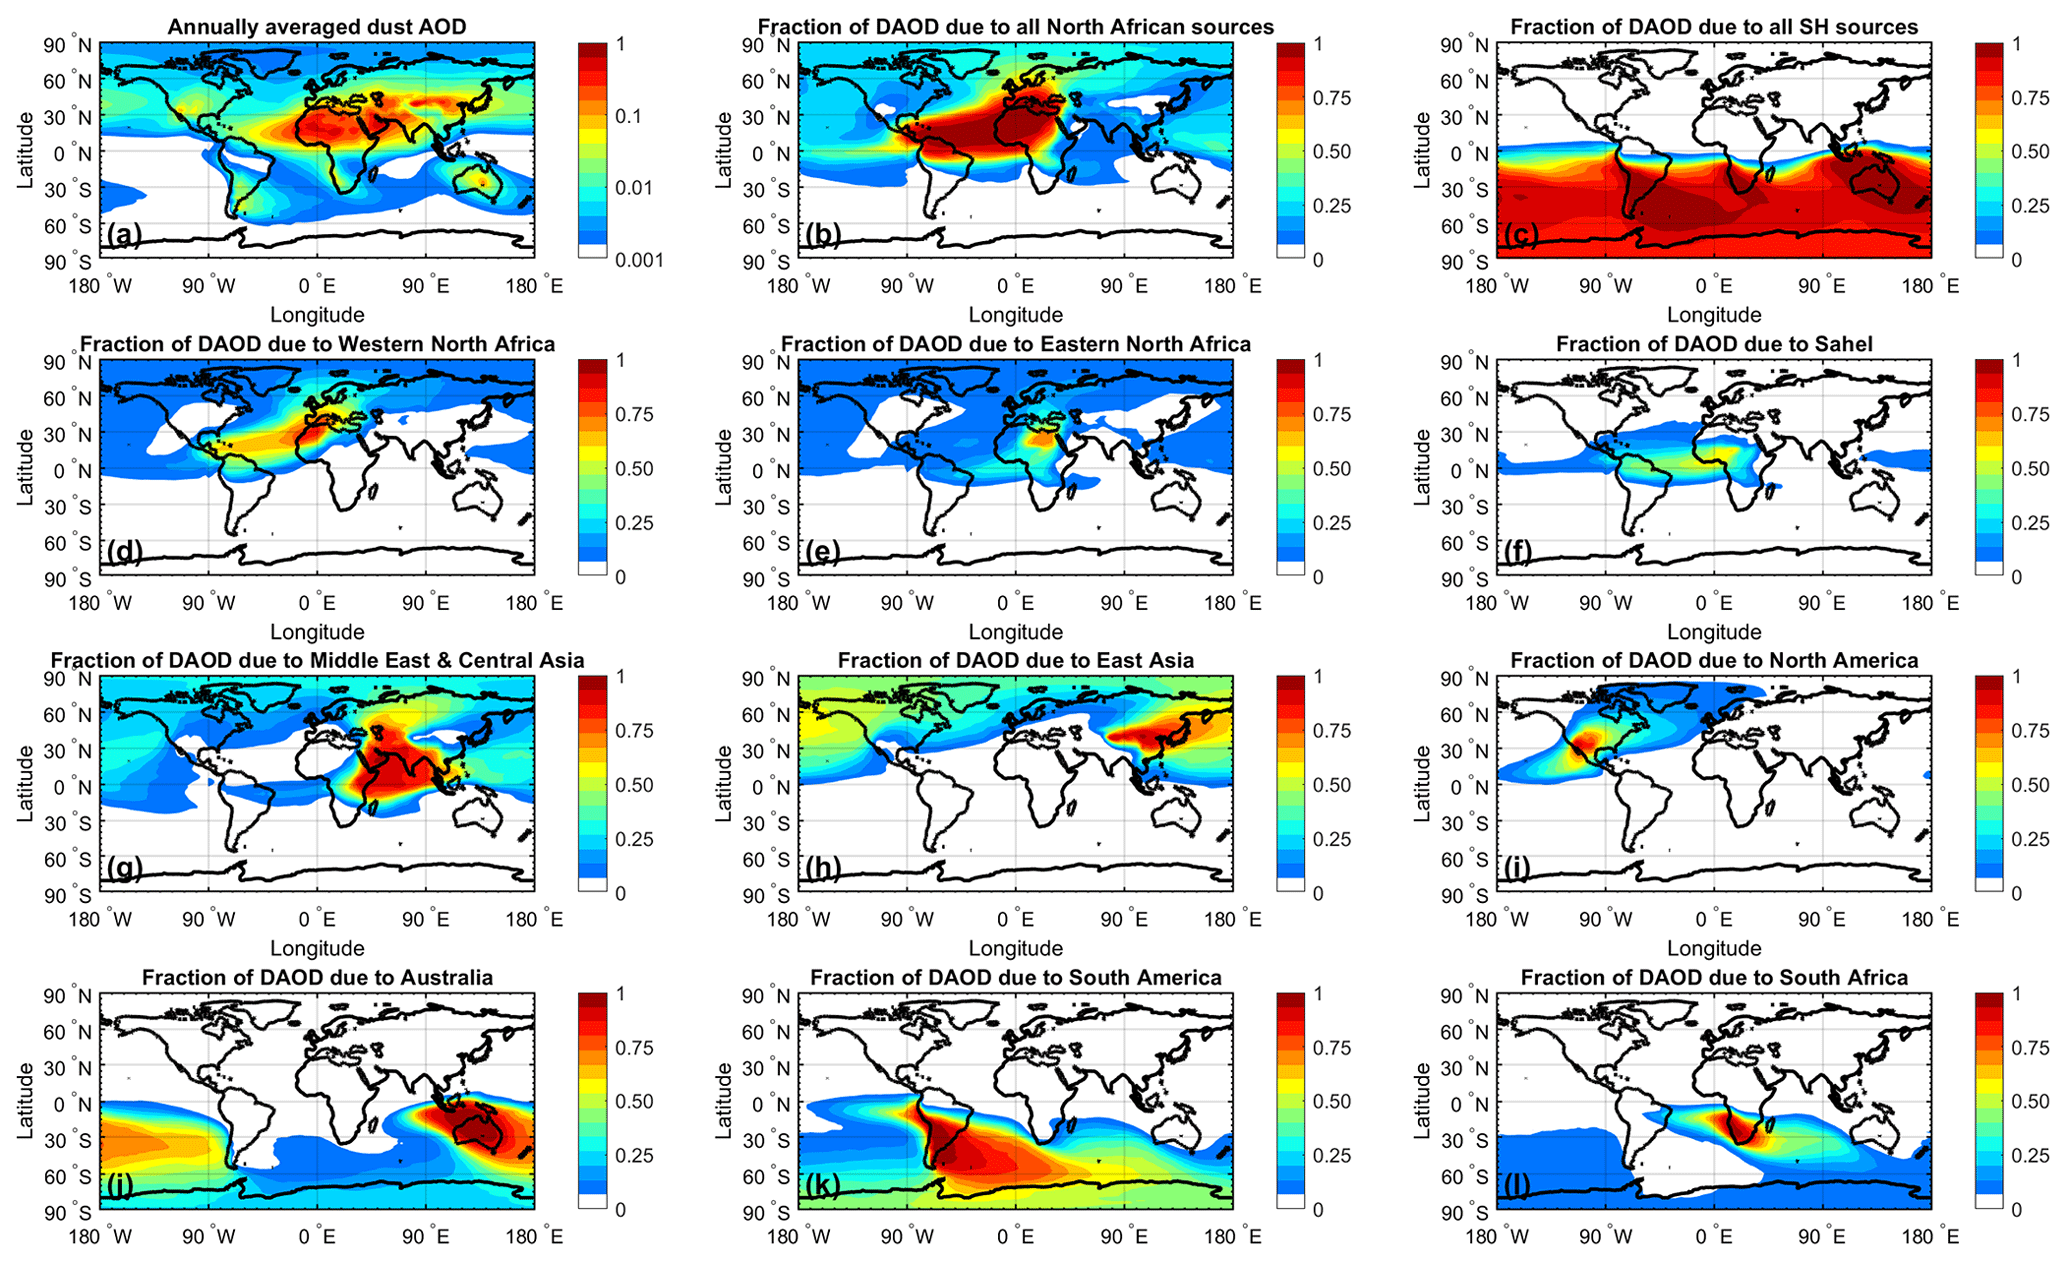
Figure 5Attribution of the annually averaged DAOD to the world's main dust source regions. Shown first is (a) the annually averaged DAOD produced from all source regions combined, followed by the fraction of DAOD that is due to (b) all North African and (c) all Southern Hemisphere source regions. The fraction of DAOD due to each of the three North African source regions is shown in panels (d)–(f), and the fraction of DAOD due to the other three Northern Hemisphere source regions of the Middle East and central Asia, East Asia, and North America is shown in panels (g)–(i). Finally, the fraction of DAOD due to the three Southern Hemisphere source regions of Australia, South America, and southern Africa is shown in panels (j)–(l). Attributions of seasonal DAOD to the different source regions are shown in Figs. S12–S15.
Constraints on the zonally averaged dust concentration provide further insight into the contribution of the different source regions throughout the three-dimensional (3D) atmosphere (Fig. 6). We find that the interhemispheric transport of Northern Hemisphere (NH) dust is likely facilitated by strong vertical transport shown by dust emitted from the arid North African and Asian deserts (Fig. 6d–h), which probably drives the longer lifetimes of dust emitted from those regions (Fig. 3). Consequently, the cross-equatorial transport of dust originating from the NH makes the largest fractional contribution to the concentration in the SH stratosphere (< 200 hPa; Fig. 6d–h), although transport into this region could be distorted by model errors in the middle atmosphere circulation that result from insufficient vertical resolution and an artificially low upper boundary (e.g., Rind et al., 2020). In the SH upper troposphere, dust originates mainly from austral sources (Fig. 6c). Although dust concentrations are small at this altitude (Fig. 6a), dust there could be critical for the heterogeneous nucleation of cirrus (Cziczo et al., 2013) and mixed-phase clouds (Vergara-Temprado et al., 2018), which could have important impacts on climate (Storelvmo, 2017). Overall, we find that ∼ 0.4 % of PM20 dust emitted in the NH is transported to the SH, whereas only ∼ 0.2 % of PM20 dust emitted in the SH is transported to the NH. As such, interhemispheric dust transport is quite rare, and transport of dust from the SH to the NH is even less efficient than from the NH to the SH (Fig. 6c, j, k, l). Likely reasons for this include the fact that SH dust has a lower average lifetime than NH dust (Fig. 3) and is emitted further from the Equator and the summer ITCZ than dust from, for instance, North Africa and the Middle East.
It is important to note that the inverse model's vertical distribution of dust is largely determined by that simulated by the models in our ensemble as we have not incorporated observational constraints on dust vertical profiles. Since comparisons of model simulations against data from the Cloud–Aerosol Lidar with Orthogonal Polarization (CALIOP) and the Cloud–Aerosol Transport System (CATS) airborne lidars indicate substantial discrepancies (Yu et al., 2010; Kim et al., 2014; Koffi et al., 2016; O'Sullivan et al., 2020), results presented here likely suffer from similar biases. A future version of this product could thus use dust extinction profiles retrieved from CALIOP (Omar et al., 2010; Song et al., 2021), CATS (Yorks et al., 2014) or in situ measurements (Brock et al., 2019) to constrain the vertical distribution of dust.
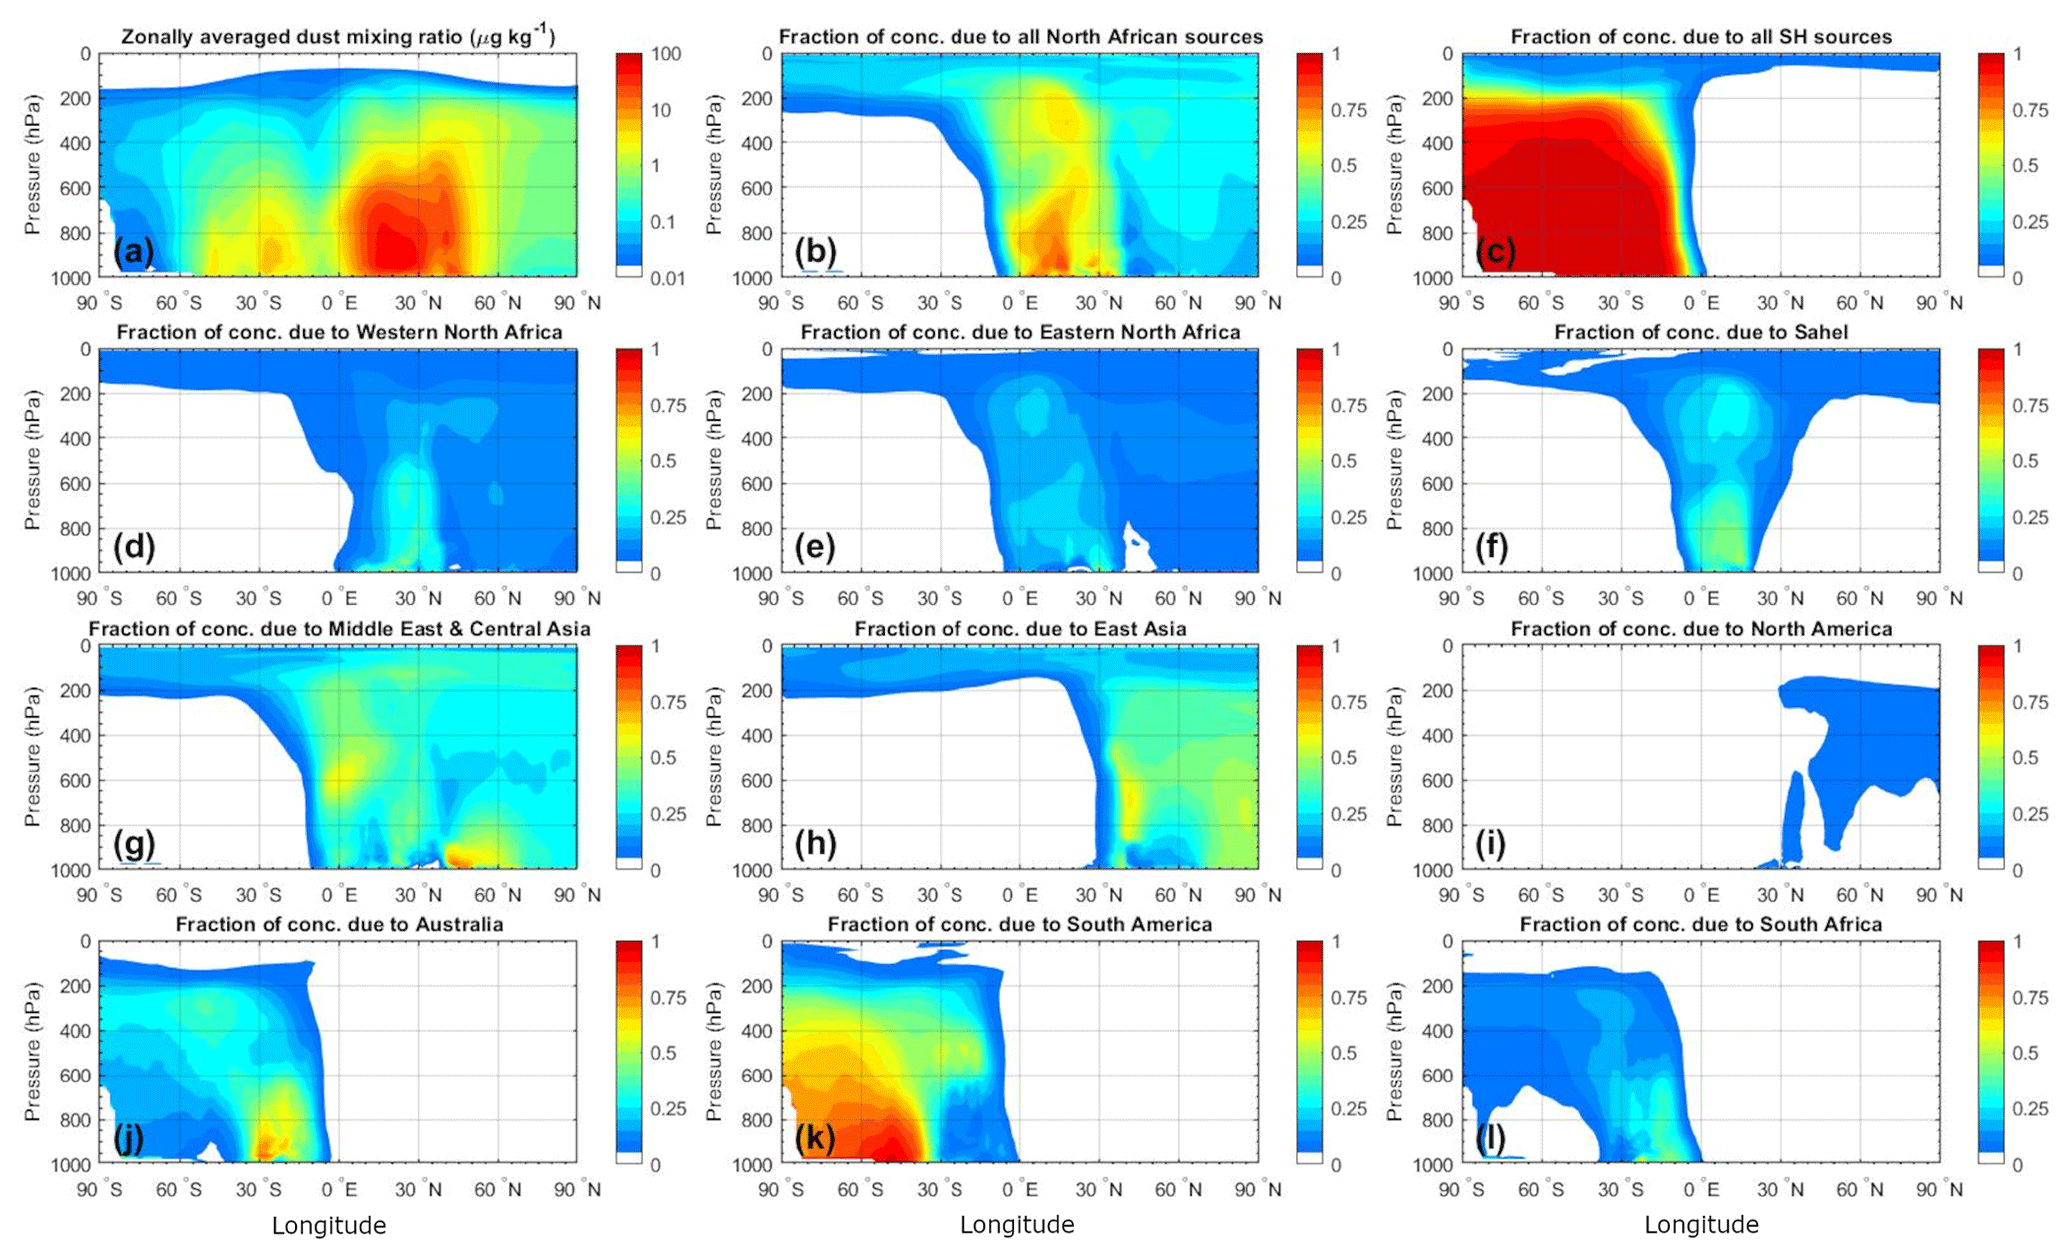
Figure 6Attribution of the zonally averaged and annually averaged PM20 dust concentration to the world's main source regions. Panel (a) shows the zonally averaged dust mixing ratio (dust concentration normalized by air density) as a function of latitude (horizontal axis) and pressure (hPa; vertical axis). Panels (b)–(l) show the partition of the dust concentration per source region, with panel ordering identical to Fig. 5. The seasonally resolved attribution of the zonally averaged dust concentration is shown in Figs. S20–S23.
3.4 Constraints on each source region's contribution to dust deposition fluxes
We used our results to attribute the dust deposition flux to the different major source regions (Figs. 7 and 8a). These results strongly mirror the attribution of dust loading and DAOD. For instance, North African dust accounts for ∼ 20 %–100 % of dust deposition in much of the Northern Hemisphere (Fig. 7b). Dust from East Asia and the Middle East–central Asia accounts for the bulk of the remaining dust deposition and dominates in large regions near the respective source regions (Figs. 7g, h, 8a). We also find that Northern Hemisphere dust contributes only a few percent of dust deposition fluxes throughout most of the Southern Hemisphere (Fig. 7c; Tables 2 and 3).
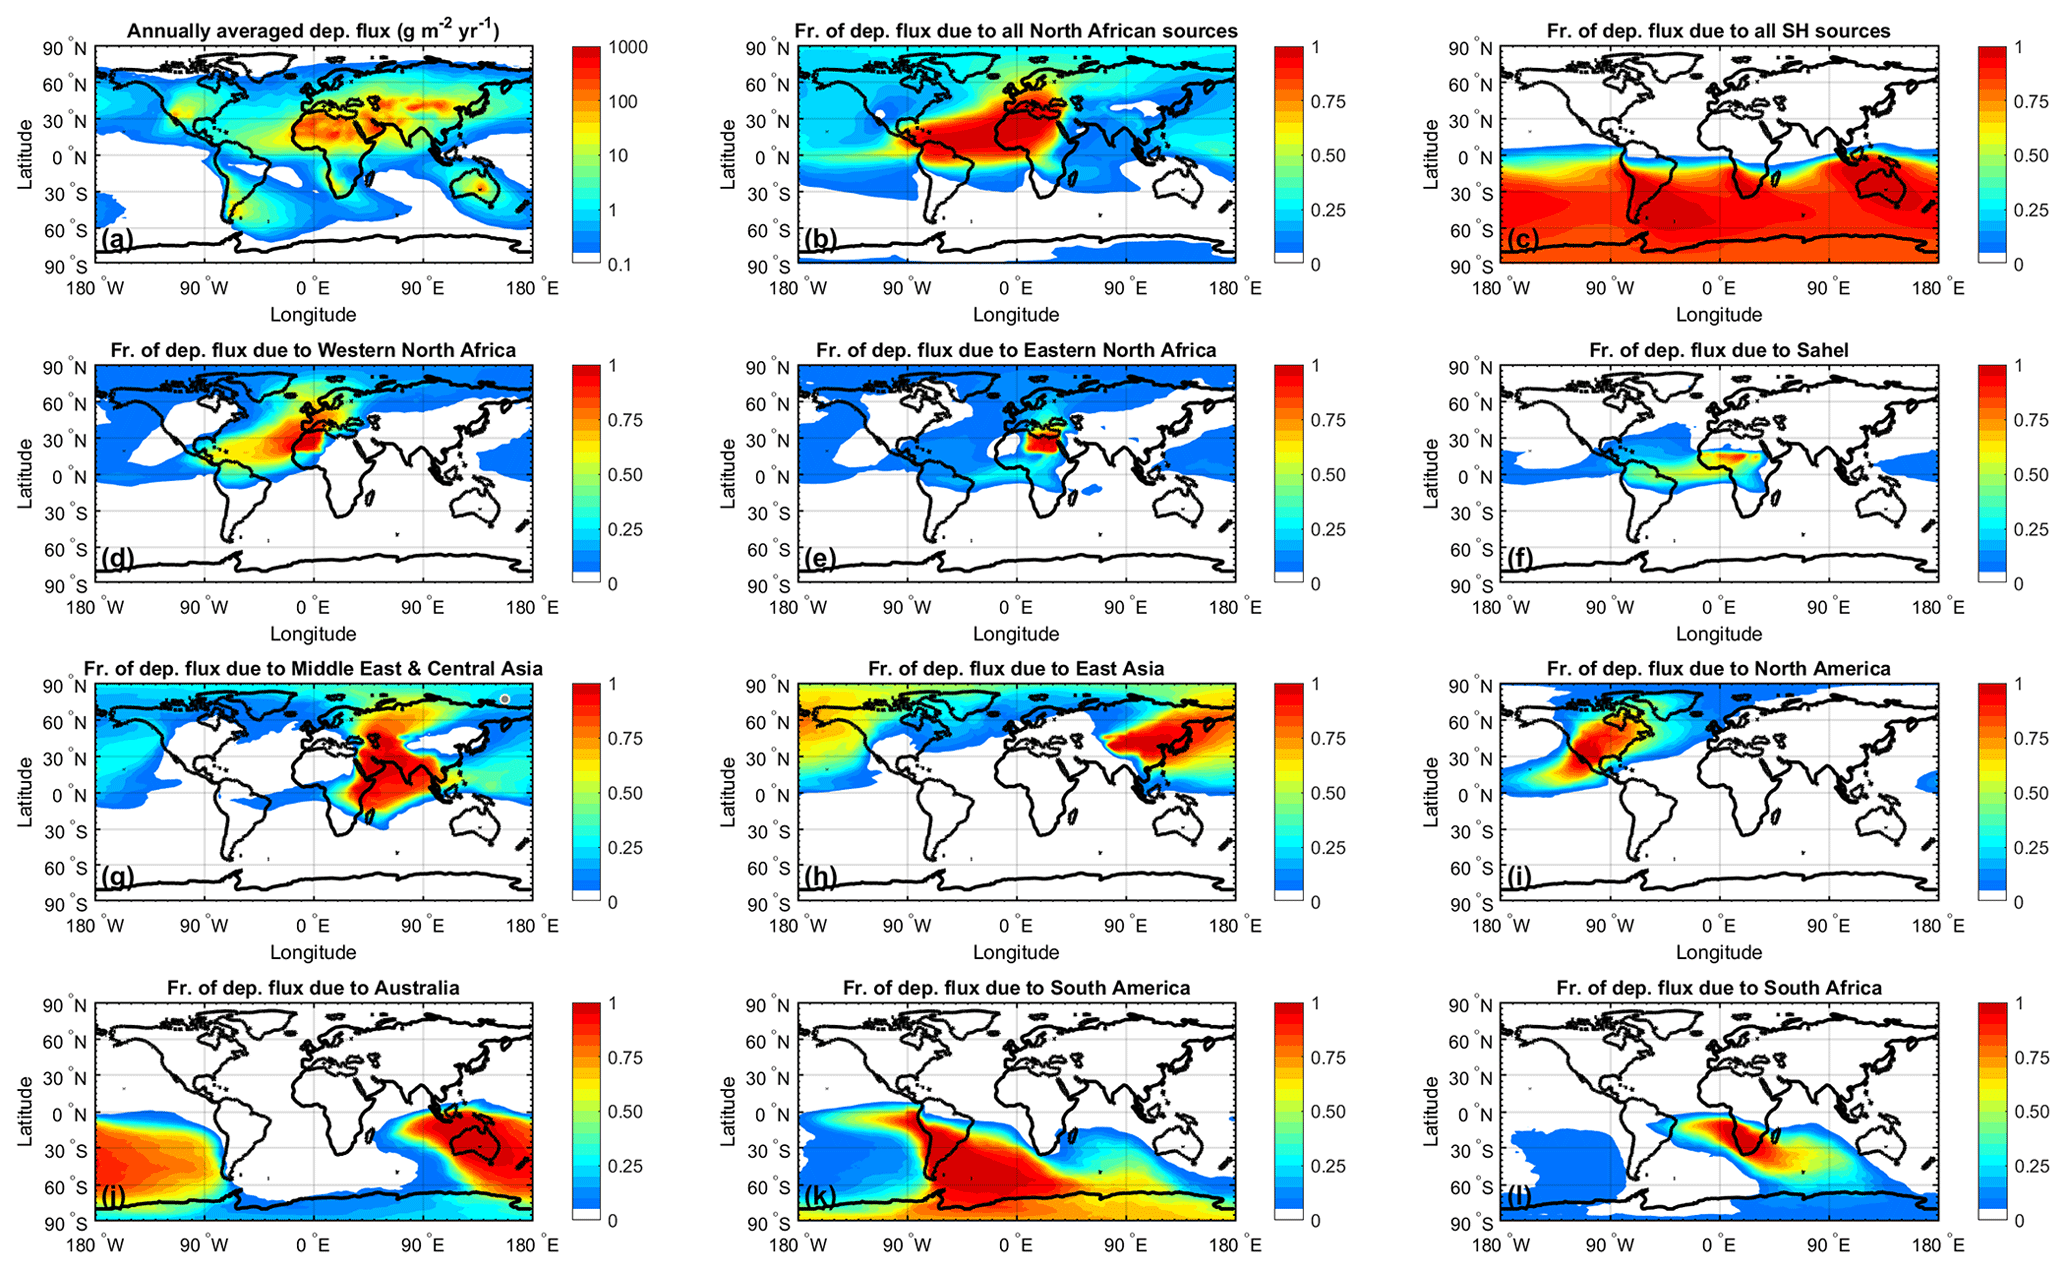
Figure 7Attribution of the annually averaged deposition flux of PM20 dust to the world's main source regions. Panel ordering is identical to Fig. 5, and the seasonally resolved attribution of the dust deposition flux is shown in Figs. S25–S28.
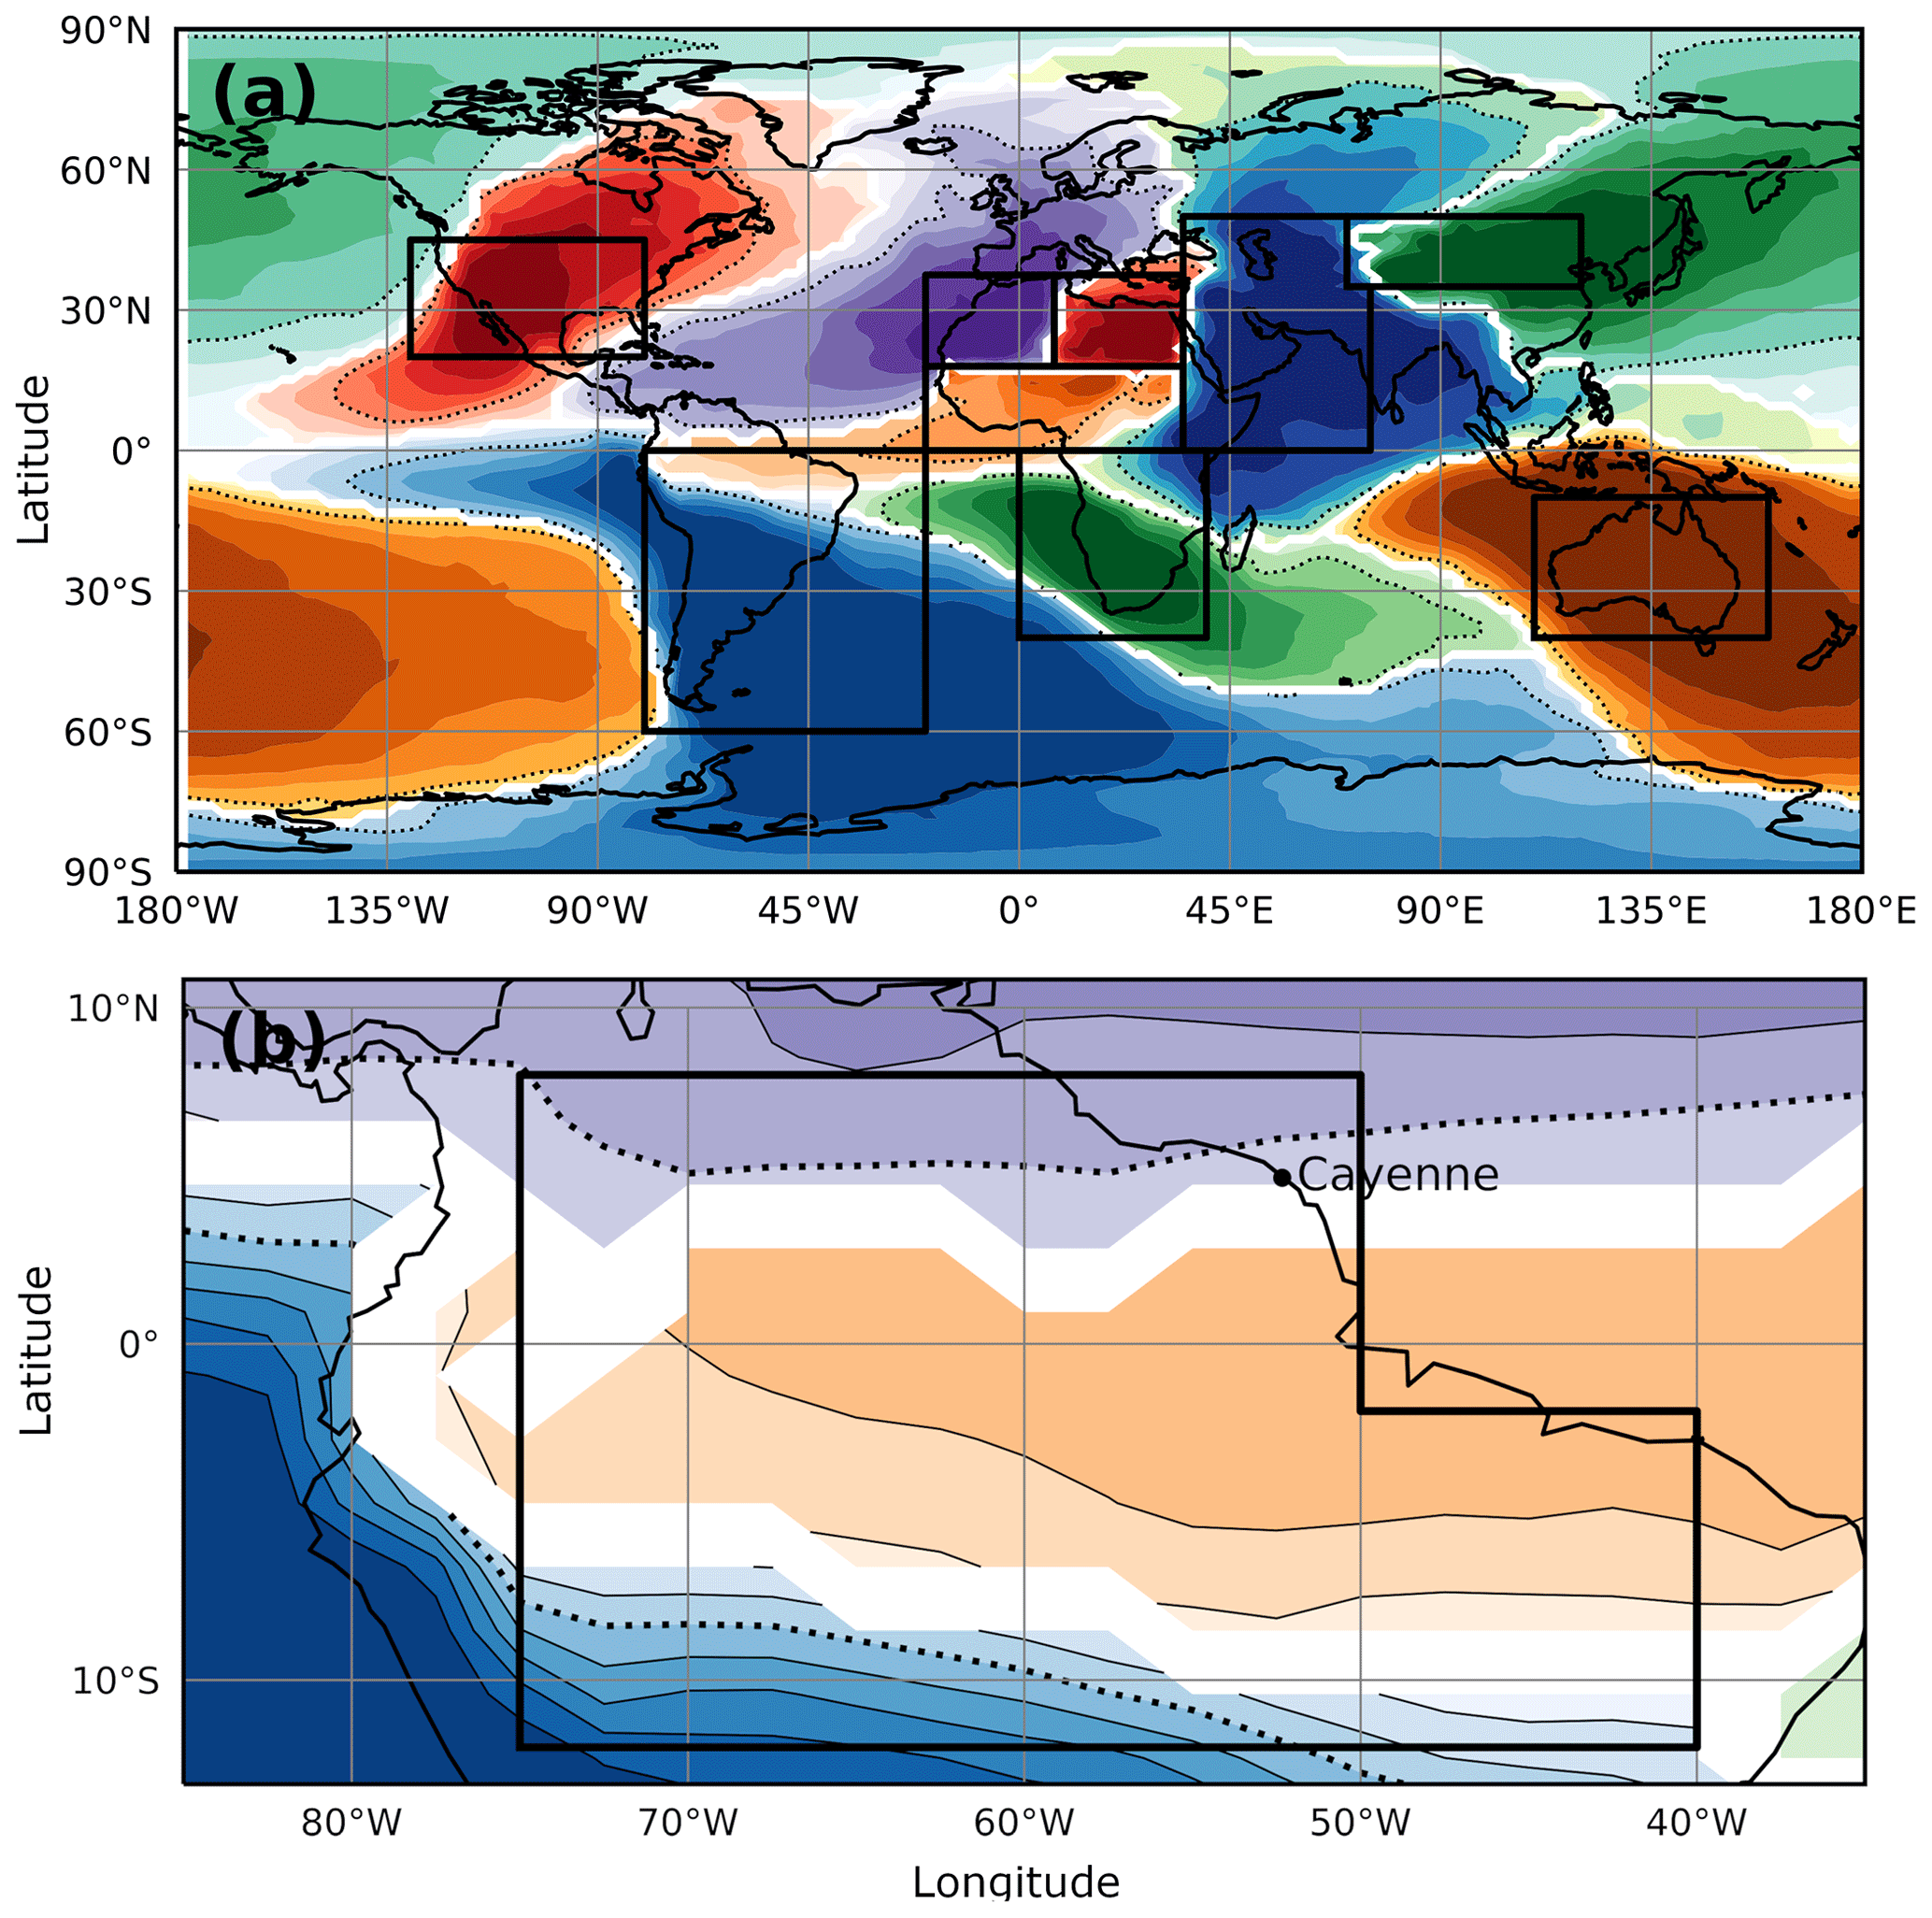
Figure 8Percentage of dust deposition supplied by the dominant source region at each location for (a) the entire globe and (b) the Amazon rainforest. Different colors represent different dominant source regions, with shading decreasing in 10 % increments from a maximum of 100 % to a minimum of 20 %. The 50 % contour is identified by a black dotted line, and white shading denotes areas where two or more dust source regions contribute similarly to the deposition flux. The black boxes in panel (a) denote the nine major source regions, and the black box in panel (b) denotes the boundaries of the Amazon rainforest used here based on Yu et al. (2015). Also shown is (b) Cayenne, the location of the field site where Prospero et al. (2020) obtained dust measurements (see text).
3.4.1 Dust deposition to high-albedo regions
We also constrained the deposition fluxes to land regions for which dust deposition produces important impacts (Table 2). This includes the snow- and ice-covered regions of Antarctica, the Arctic, and the Tibetan Plateau (Lee et al., 2017; Kylling et al., 2018; Sarangi et al., 2020). Dust deposition to these high-albedo regions can darken snow and ice packs, thereby producing warming and accelerating melting (Painter et al., 2010; Shao et al., 2011; Mahowald et al., 2014; Skiles et al., 2018). We find that the Tibetan Plateau, being adjacent to major East Asian source regions (e.g., the Taklimakan Desert), receives a large deposition flux of 16 (11–25) Tg yr−1. This is consistent with findings that snowpack darkening from increasing dust deposition has played an important role in the regional warming of this region (Lau et al., 2010; Sarangi et al., 2020).
Greenland receives a relatively smaller dust deposition flux of 0.19 (0.07–0.52) Tg that is supplied by several different source regions, namely Northern Africa (30 (19–45) %), East Asia (26 (14–32) %), and North America (26 (11–50) %) (note that we constrain deposition of desert dust only and thus do not include deposition of dust from high-latitude sources supplied by glacial sediments, which is likely an important contributor at the coastal margins of Greenland; Bory et al., 2003; Bullard et al., 2016). Our finding that North American dust contributes substantially to dust deposited to Greenland (Figs. 7i, 8a) seems to disagree with geochemical data, which thus far have not identified a clear contribution from North American dust (Bory et al., 2003). This suggests that our results might overestimate North American dust emission, which is approximately a factor of 5 larger than predicted by most models in both the AeroCom Phase I ensemble and in our own model ensemble (Fig. 2 and Table 1). This overestimation would most likely be due to an overestimate of the DAOD over North America that we used to constrain regional emissions (Kok et al., 2021a). This regional DAOD was obtained from an ensemble of aerosol reanalysis products (Adebiyi et al., 2020), which might thus overestimate DAOD over North America. Furthermore, the inverse model finding of roughly equal contributions of the East Asian and North African source regions to dust deposition to Greenland is in mixed agreement with geochemical data. These data indicate that East Asia is the main source of dust deposited to several ice core sites in the interior of Greenland (Bory et al., 2002, 2003), with dust from North Africa probably contributing as a secondary source (Lupker et al., 2010). This possible disagreement between the inverse model results and geochemical data is noteworthy, as the inverse model shows a substantially greater contribution from East Asian dust and a smaller contribution from North African dust than most models in both model ensembles (see Fig. 2 and Table 1). As such, the underestimation of Asian dust and overestimation of African dust relative to results from geochemical studies would be larger for models in the two ensembles than for the inverse model. This finding suggests that current models either substantially underestimate transport of East Asian dust or overestimate transport of North African dust to Greenland.
Table 2Constraints on the contribution of dust deposition from each source region to land areas where dust deposition produces important impacts, namely the high-albedo regions of Antarctica, Greenland, and the Tibetan Plateau, as well as the Amazon rainforest. Listed are median values, with 1 standard error intervals listed in parentheses. The coordinates of the Amazon rainforest follow the definition given in Yu et al. (2015), and the Tibetan Plateau was taken as the region with elevation over 4000 m between 26–40∘ N and 75–105∘ E based on Easter et al. (2004). These regions are plotted in Fig. S24.
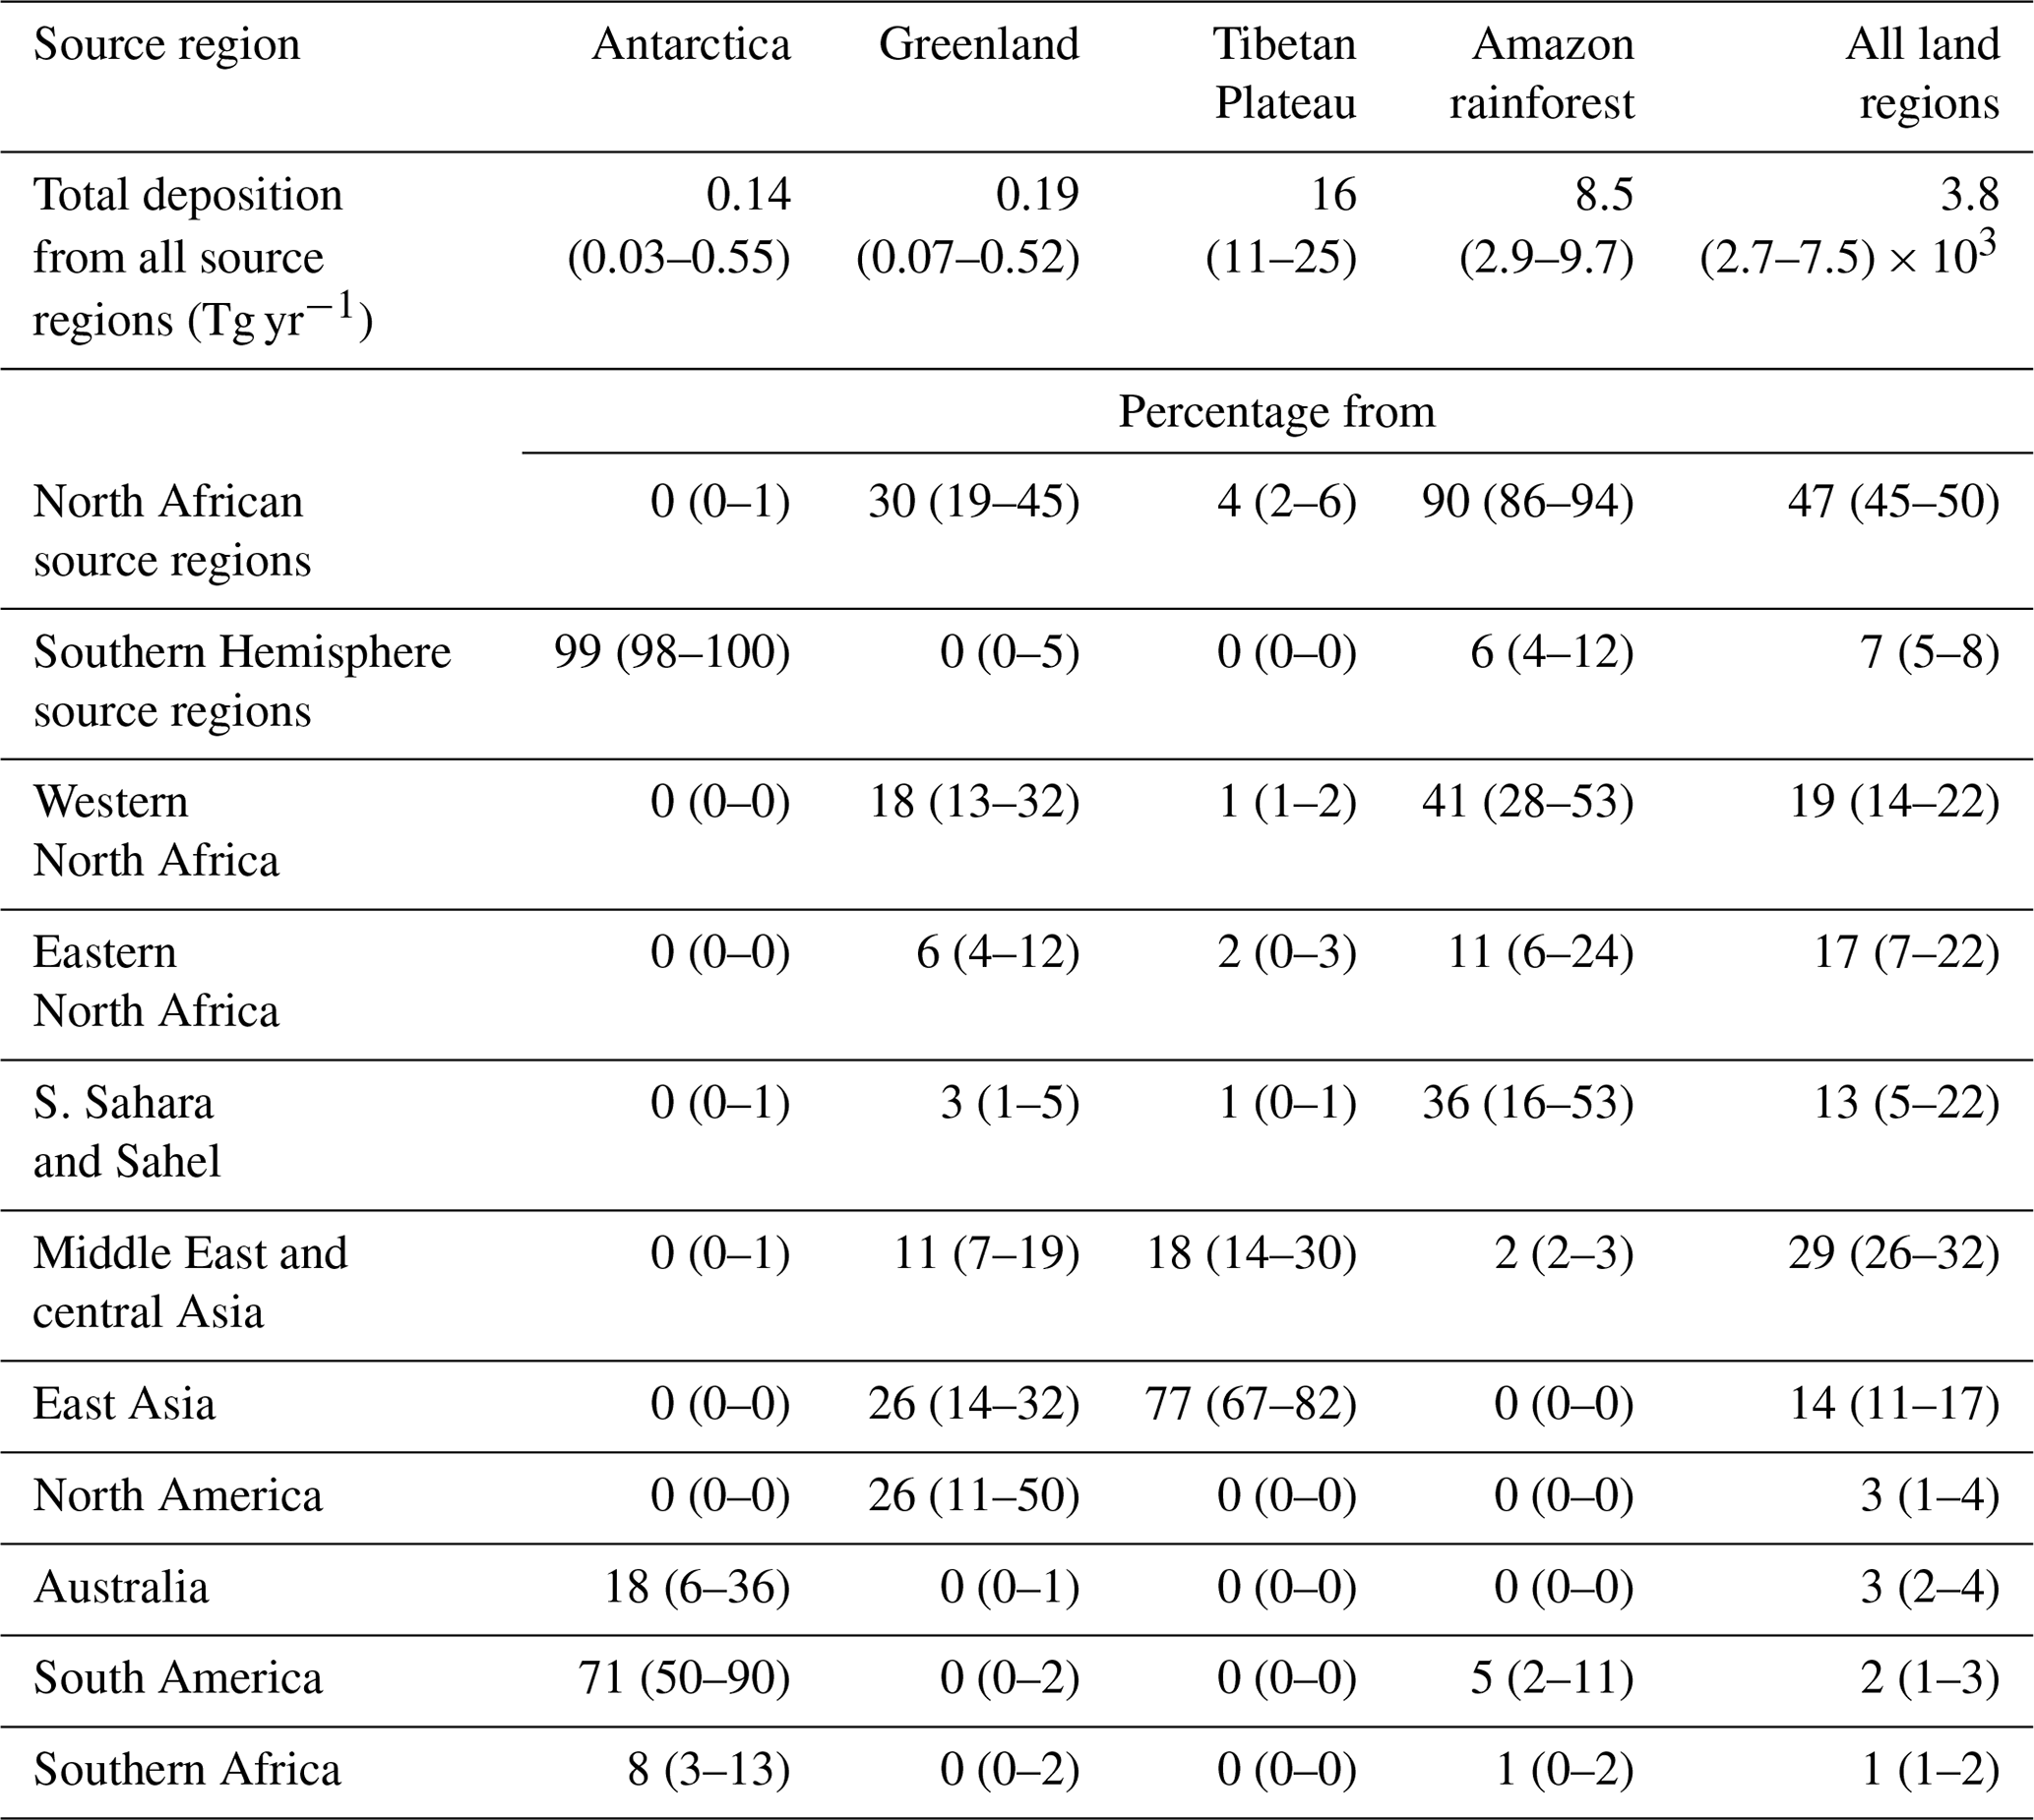
We also quantified each source region's contribution to dust deposited to Antarctica. We find that the total dust deposition flux to Antarctica equals 0.14 (0.03–0.55) Tg, the bulk of which is provided by South America (∼ 70 %), with smaller contributions from Australia (∼ 20 %) and southern Africa (∼ 10 %) and almost no contribution from NH dust (Fig. 7 and Table 2). As such, South America is the dominant dust source region for almost the entire continent of Antarctica (Fig. 8a). These findings are in good agreement with ice core records, for which geochemical fingerprinting has indicated that most present-day deposited dust originates from South America, with a smaller contribution from Australia (Mosley-Thompson et al., 1990; Souney et al., 2002; McConnell et al., 2007; Delmonte et al., 2008; Bory et al., 2010; Delmonte et al., 2019).
3.4.2 Dust deposition to the Amazon rainforest
We also obtained the dust deposition flux to the Amazon rainforest, for which the productivity on timescales of decades to millennia is partially controlled by delivery of phosphorus by settling dust (Swap et al., 1992; Okin et al., 2004). We find that the Amazon rainforest receives an average annual dust flux of 0.9 (0.3–1.1) g m−2 yr−1, which corresponds to a total annual dust deposition flux of 8.5 (2.9–9.7) Tg yr−1 (Table 3). This is similar to results from the (unmodified) simulations in our ensemble, which predict a median Amazon deposition flux of 11.0 Tg and a range of 4.4–14.8 Tg. Further, our results are quantitatively similar to the Amazon dust deposition flux of 8–10 Tg yr−1 obtained by Prospero et al. (2020) based on dust measurements at Cayenne (French Guiana) and the MERRA-2 dust product (Buchard et al., 2017; Randles et al., 2017). Note that these results might somewhat underestimate deposition fluxes because most current models are unable to simulate the long-range transport of super-coarse dust with D>10 µm (Ansmann et al., 2017; Weinzierl et al., 2017).
The Amazon deposition fluxes found here (for the years 2004–2008) and in Prospero et al. (2020) are a factor of ∼ 2–3 less than the 28 (8–50) Tg yr−1 obtained from an analysis of 2007–2013 data from the CALIOP satellite instrument by Yu et al. (2015). Our lower estimate of dust deposition for the Amazon rainforest is expected because the CALIOP study substantially underestimated the dust extinction efficiency far from source regions. Indeed, the CALIOP estimates used a mass extinction efficiency (MEE) of 0.37 m2 g−1 after Kaufman et al. (2005), which is less than the globally integrated mass extinction efficiencies of ∼ 0.68 and ∼ 0.54 m2 g−1 predicted by AeroCom models and obtained here (Table 1), respectively. Furthermore, the MEE for dust near the Amazon rainforest is larger than the globally integrated MEE (Fig. S10) because most coarse particles deposit during long-range transport across the Atlantic. Indeed, the recent DustCOMM dataset (Adebiyi et al., 2020), which explicitly accounts for the enhancement of dust extinction due to particle asphericity, shows an MEE of ∼ 0.8–1.0 m2 g−1 after trans-Atlantic transport of North African dust. This is in good agreement with available measurements (Li et al., 1996; Denjean et al., 2016; Figs. 8 and 9 in Adebiyi et al., 2020). We similarly find that the MEE over the Amazon rainforest is 0.86 (0.76–1.05) m2 g−1 such that the CALIOP-derived results likely underestimate the MEE by a factor of ∼ 2–3, thereby overestimating deposition fluxes by the same factor. Taking this bias in the assumed MEE into account would bring the CALIOP-derived deposition fluxes into agreement with our results. These results emphasize the need for accurate and spatially varying constraints on the MEE, such as provided here and in Adebiyi et al. (2020) as part of the DustCOMM dataset. Overall, our results add to a growing consensus that, although the dust-borne delivery of phosphorus is likely critical for the long-term productivity of the Amazon rainforest, these fluxes are substantially less than previously thought and are rivaled by the delivery of more soluble phosphorus by biomass burning aerosols from southern Africa (Barkley et al., 2019; Prospero et al., 2020).
Our finding of a substantially lower deposition flux to the Amazon rainforest illustrates the advantages of integrating observational, experimental, and modeling constraints. Results from analyses of model simulations and satellite data are subject to possibly substantial biases due to a number of required assumptions, including regarding the optical properties and size distribution of dust. In our approach, dust properties are instead based on observational constraints for which the uncertainties have been propagated into our results (Kok et al., 2017; Adebiyi and Kok, 2020) and for which quantitative predictions can be evaluated against independent measurements (see Kok et al., 2021a). In addition, our approach integrates a variety of regional measurements ranging from AOD to dust size distributions along with model estimates of transport, in contrast to observational estimates of nutrient supply based upon a more limited range of observations or retrievals. A further advantage of the constraints presented here is that they are source-region-resolved and available globally. This former factor is particularly important for accounting for the effects of regional differences in soil mineralogy on dust impacts on radiation (Perlwitz et al., 2015a; Scanza et al., 2015), clouds (Liu et al., 2012; Atkinson et al., 2013; Shi and Liu, 2019), and biogeochemistry (Zhang et al., 2015), as well as for interpreting records of dust deposition from natural archives (Albani et al., 2015).
Our results also provide insight into the source regions that provide dust to the Amazon rainforest (Fig. 8b). Previous studies have argued that either the Bodélé Depression (Koren et al., 2006) or El Djouf (Yu et al., 2020) are dominant contributors to dust deposition to the Amazon. However, we find that the western North Africa source region (containing El Djouf) and the southern Sahara and Sahel source region (containing the Bodélé Depression) contribute roughly equally to the Amazonian dust deposition flux. Indeed, western North Africa contributes 41 (28–53) % and dominates the deposition flux in the northern part of the Amazon rainforest, whereas the southern Sahara and Sahel contribute 36 (16–53) % and dominate in the central and eastern parts of the Amazon rainforest. The contribution of both the western North Africa and the southern Sahara and Sahel source regions peak in boreal spring, with smaller contributions in winter and summer (Figs. S25–S28). Most of the remainder of the dust deposition flux is supplied by eastern North African dust (11 (6–24) %) and notably by South American dust (5 (2–11) %), which dominates in the southwestern part of the Amazon. Overall, our results thus indicate that a large number of different source regions make important contributions to dust deposition to the Amazon rainforest.
3.4.3 Dust deposition to oceanic regions
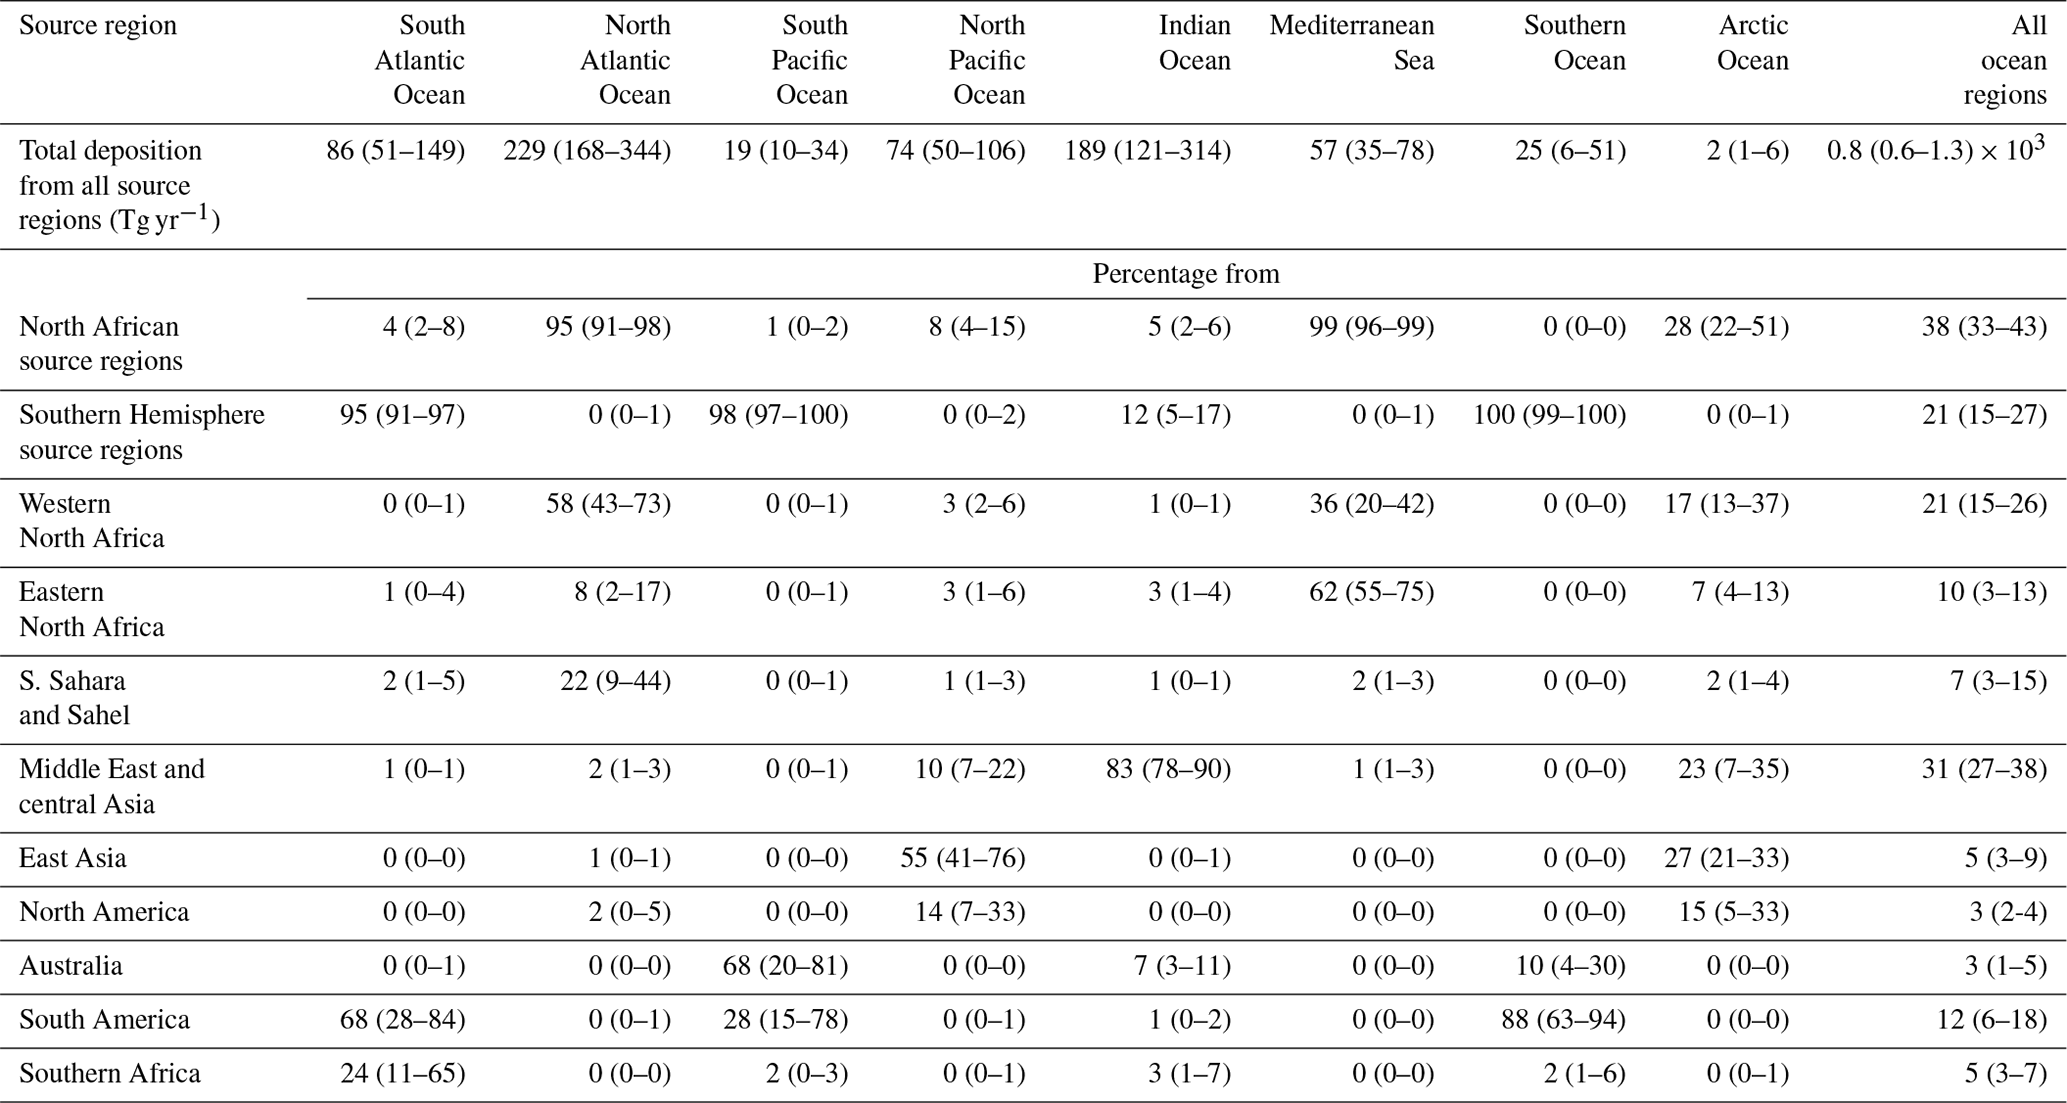
We further used our results to quantitatively constrain the PM20 dust deposition flux of each source region to each ocean basin (Table 3). Dust deposition provides critical nutrients, such as phosphorus and iron, to open-ocean regions such as the Southern Ocean and the North Pacific where primary productivity can be limited by the supply of these dust-borne nutrients (Jickells et al., 2005; Myriokefalitakis et al., 2018). Consequently, glacial–interglacial variations in atmospheric dust deposition flux to the oceans are hypothesized to have modulated atmospheric CO2 concentrations (Martin, 1990; Ridgwell and Watson, 2002; Lambert et al., 2008). We constrain the total flux of PM20 dust deposited to oceans to be 0.8 (0.6–1.3) × 103 Tg. This is approximately double the median deposition flux to oceans that was obtained in recent model ensemble studies (Table 5 in Checa-Garcia et al., 2020; Tables 8 and 9 in Wu et al., 2020). This larger dust deposition flux to oceanic regions likely occurs because we correct the underestimation (or omission) by current models of dust with geometric diameters between 10 and 20 µm (Adebiyi and Kok, 2020), which we find makes up approximately half (46 (35–66) %) of this deposition flux to oceans. Although the bulk of this dust deposition to oceans occurs in oceanic basins surrounding major source regions (Fig. 7a), especially for coarse dust, we also find significant fluxes into more remote nutrient-limited ocean basins, such as a deposition flux of 25 (6–51) Tg yr−1 to the Southern Ocean (Table 3), much of which originates from South America.
Table 3Constraints on the contribution of dust deposition from each source region to the world's main ocean basins. Listed are median values, with 1 standard error intervals listed in parentheses. Coordinates of ocean basins are based on NOAA's World Ocean Atlas (Locarnini et al., 2010). All regions are plotted in Fig. S24 for clarity.
4.1 Limitations of the methodology
We consider the results presented in the previous section to be more accurate constraints on the source-region-resolved dust loading, concentration, DAOD, and deposition flux than results obtained directly from regional and global model simulations (e.g., Tanaka and Chiba, 2006; Mahowald, 2007; Huneeus et al., 2011; Wu et al., 2020). Nonetheless, our results are subject to a number of important limitations. Critically, the results obtained here depend on a number of previous products, including the analytical framework to join observational and modeling constraints on the global dust cycle developed in our companion paper (Kok et al., 2021a), the ensemble of climate and atmospheric chemistry model simulations, and constraints on the globally averaged dust size distribution (Adebiyi and Kok, 2020) and the regional DAOD (Ridley et al., 2016). The results presented here are therefore subject to the limitations of these studies, which are discussed in detail in the corresponding papers.
Some limitations from these previous studies are of particular relevance in the interpretation of our results. In particular, Ridley et al. (2016) obtained the regional DAOD in dust-dominated regions by taking the total AOD – which was calculated from satellite-retrieved AOD that was bias-corrected using ground-based aerosol optical depth measurements from the AErosol RObotic NETwork (AERONET) – and subtracting the AOD from non-dust aerosol species simulated by an ensemble of four model simulations. Although the error quantified by the spread in the model-simulated non-dust AOD for each region was propagated into the results here, a systematic bias in model simulations of non-dust AOD would cause a systematic bias in the regional DAOD in the Ridley et al. (2016) product. Such a bias could arise in particular for regions in which insufficient observations are available to constrain models and in which biomass burning and anthropogenic aerosols supply a large fraction of AOD, as models rely on emission inventories to simulate those (Lamarque, 2010; Feng et al., 2020). Errors in emission inventories would thus affect most or all models and cause a potentially substantial bias in the regional DAOD that is not accounted for in our error analysis. Such a bias could in particular affect our constraints on Asian source regions, for which there are also fewer in situ dust measurements available than for North African dust (e.g., Mahowald et al., 2009; Kok et al., 2021a). Furthermore, our constraints on the lesser source regions of North America, Australia, South America, and southern Africa rely on regional DAOD constraints obtained from an ensemble of aerosol reanalysis products (Adebiyi et al., 2020) that assimilate ground- and satellite-based AOD retrievals. These products could similarly be biased because of difficulties distinguishing dust from other aerosol species (see further discussion in Kok et al., 2021a). It is thus possible that some of the differences between our results and model simulations, for instance the larger contribution of North American and Asian sources found here than in model ensembles, could be due to such a bias in our results, model results, or both.
An additional limitation arises from possible systematic biases in dust transport simulated by the ensemble of models. If models in our ensemble have consistent biases in representing dust transport from different source regions, then this would cause dust from one source region to erroneously be assigned to another source region. For instance, if models systematically underestimate the long-range transport of North African dust across East Asia and the North Pacific (Hsu et al., 2012b), then this could cause our results to overestimate the contribution of East Asian dust. Such an underestimation of long-range transport could be due to a systematic overestimation of dust deposition, as indicated by some studies (Ridley et al., 2012; Yu et al., 2019).
Finally, the climatology of the contributions of different source regions to the global dust cycle obtained here is based mostly on model data and regional DAOD constraints for the period 2004–2008 (Ridley et al., 2016; Kok et al., 2021a). As such, differences in the relative contributions of the main source regions before or after that period are not reflected in our results. This includes an increase in dust loading in the Middle East (Hsu et al., 2012a; Kumar et al., 2019) and a decrease in dust loading in East Asia (Shao et al., 2013; Shimizu et al., 2017; An et al., 2018; Tai et al., 2021).
Although our methodology accounts for and propagates a large number of (quantifiable) errors in our analysis (Kok et al., 2021a), the limitations above raise the possibility that our analysis nonetheless underestimates the true errors in the contribution of different source regions to the global dust cycle. We found in our companion paper that errors in results summed over all source regions are likely realistic for the NH because the inverse model reproduced independent measurements of surface concentration and deposition flux (well) within the combined uncertainties of the experimental data and the inverse model (see Figs. 7 and 10 in Kok et al., 2021a). For the SH, errors were only slightly smaller than needed to reproduce measurements within the uncertainties. However, these findings do not necessarily mean that errors in the relative contribution per source region are realistic. For instance, the limitations discussed above could produce biases that differ between source regions and that may partially cancel out in comparisons against measurements of surface concentration and deposition flux.
To gain information on whether our errors in the contribution to the global dust cycle per source region are realistic, we calculated the optimal contribution of each source region that minimizes errors with respect to compilations of surface concentration and dust deposition flux measurements. This procedure is detailed in the Supplement and is similar to using DAOD constraints in the inverse model (Sect. 2.3 in Kok et al., 2021a). We expect the optimization using surface concentration and deposition flux to yield a larger range of possible values (i.e., larger errors) than the optimization using DAOD constraints because model simulations of surface concentration and deposition flux are subject to greater model errors. This is because these results depend to a larger extent on correctly simulating deposition and the dust vertical profile, which models struggle with (Huneeus et al., 2011; Yu et al., 2019; O'Sullivan et al., 2020). Furthermore, dust deposition flux measurements are subject to large experimental and representation errors (see Sect. 3.1 in Kok et al., 2021a) such that these measurements are less potent in constraining simulations of the global dust cycle than DAOD constraints. This is shown by the greater than half-an-order-of-magnitude error in comparisons of inverse model and individual simulation results against deposition flux measurements (Figs. 7, 10, S10, and S13 in Kok et al., 2021a).
We find that the optimization against surface concentration data yields median results consistent with those of the inverse model's optimization against DAOD constraints for both NH and SH source regions, but with a larger 95 % confidence interval, as expected (Fig. 9). The optimization against deposition flux measurements shows differences from the inverse model results using DAOD constraints, with on average a larger fractional contribution of Asian source regions and a smaller fractional contribution of North African source regions, thereby reinforcing our finding that some models overestimate North African dust and underestimate Asian dust. In the SH, we find that larger contributions from Australian and South American dust are needed to match deposition flux measurements, particularly in Antarctica (see Fig. 10 in Kok et al., 2021a). Overall, these comparisons do not show that errors in the fractional contributions of the Northern Hemisphere are underestimated, though we nonetheless interpret these errors as lower bounds in light of the limitations discussed above. Conversely, errors in the contributions of the Southern Hemisphere source regions are likely underestimated, presumably for the reasons reviewed above.
An important finding in Fig. 9 is that using deposition flux measurements to constrain models yields substantially different results than using DAOD and surface concentration data. This likely occurs in part because deposition flux measurements are subject to much greater experimental and representation errors and in part because model errors in deposition are substantially larger than model errors in DAOD and surface concentration (Cakmur et al., 2006; Huneeus et al., 2011; Albani et al., 2014; Stanelle et al., 2014; Kok et al., 2021a). In turn, these larger model errors likely occur in part because of substantial errors in parameterizations of dry and wet deposition (van der Does et al., 2018; Yu et al., 2019; Emerson et al., 2020) and in part because deposition occurs at the end of the dust life cycle such that model simulations of deposition are also affected by model errors in simulating dust emission as well as horizontal and vertical transport. Consequently, using deposition flux datasets to constrain the modern-day dust cycle could result in large errors, whereas using surface concentration and DAOD data likely results in more accurate constraints on the dust cycle. Reconstructions of dust in the Last Glacial Maximum and other previous climates usually rely only on deposition flux datasets and are thus more susceptible to these substantial errors in measurements and model simulations of dust deposition (e.g., Albani et al., 2016; Ohgaito et al., 2018).
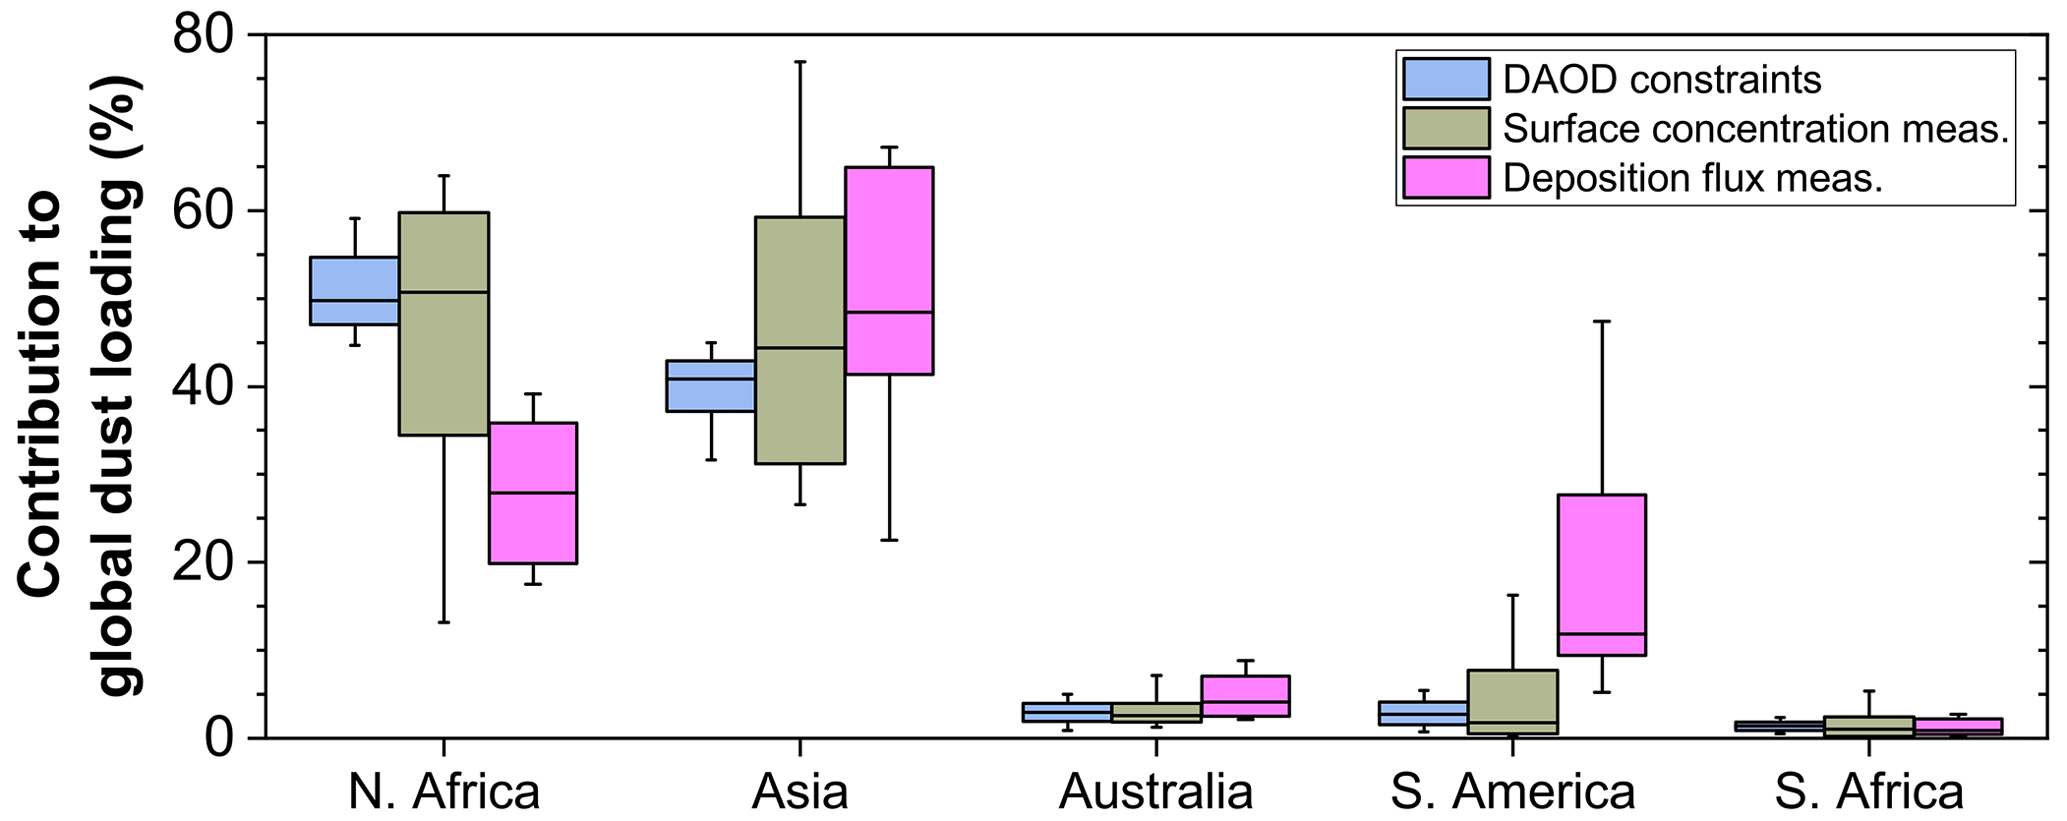
Figure 9Optimal fractional loading per source region that optimizes agreement against constraints on DAOD (blue bars; these are the inverse model results reported in this paper and in Kok et al., 2021a) and against measurement compilations of surface concentration (dark yellow bars) and deposition flux (pink bars). Box boundaries and whiskers respectively denote the 68 % and 95 % probability range, and horizontal solid lines denote the median result. The North American source region was omitted, and the three North African source regions (western North Africa, eastern North Africa, and southern Sahara and Sahel) and the two Asian source regions (Middle East–central Asia and East Asia) were grouped together to avoid overfitting (see the Supplement for further details).
Note that (ensembles of) model simulations are affected by biases similar to those described above. Indeed, although our errors likely underestimate the true errors for at least the SH source regions, our methodology mitigates model errors by drawing from an ensemble and by using constraints on dust abundance and dust microphysical properties to correct model biases, resulting in substantially improved agreement against independent data (Kok et al., 2021a). As such, our approach here, though subject to important limitations and biases, is likely more accurate than (ensembles of) model simulations. Overall, these issues underscore the need to better constrain model simulations and aerosol reanalysis products by obtaining more measurements of dust and other aerosol species outside the regions affected by North African dust and by obtaining more accurate constraints on speciated AOD (Kahn and Gaitley, 2015).
4.2 Implications for improving global dust cycle models and constraining dust impacts on the Earth system
Our constraints on each dust source region's size-resolved contribution to the global dust cycle can be used to constrain a variety of important dust impacts on the Earth system. For instance, combining our results with spatially resolved and particle-size-resolved soil surface mineralogy (Claquin et al., 1999; Journet et al., 2014) can help constrain the regionally varying mineralogy of dust aerosols (Kok, 2011; Perlwitz et al., 2015a; Scanza et al., 2015; Pérez García-Pando et al., 2016; Li et al., 2021). This has the potential to advance our understanding of a variety of important dust impacts that depend on mineralogy, including dust impacts on the radiation budget (Scanza et al., 2015), on cirrus and mixed-phase clouds (Atkinson et al., 2013), on atmospheric chemistry (Cwiertny et al., 2008), and on biogeochemical cycles (Mahowald, 2011; Ito et al., 2019; Hamilton et al., 2020). Of particular note in this regard is the synergy with the data on surface mineralogy of dust source regions, such as from the upcoming launch of the NASA Earth Surface Mineral Dust Source Investigation (EMIT) mission (Green et al., 2020).
A second important implication of our results is that our data can be used to inform the interpretation of dust deposition records from natural archives in the modern climate (Mahowald et al., 2010; Albani et al., 2012; Delmonte et al., 2013; Hooper and Marx, 2018). In particular, the constraints on the relative contribution of each source region to the deposition flux at measurement sites could inform the interpretation of changes in dust deposition fluxes through time.
Our results raise the question of why models produce a biased ranking of dust sources that needs to be corrected by observationally informed constraints. Part of the cause of model biases is likely the limited knowledge of the emission environment. For instance, models may not correctly characterize the effects of topography, roughness, and vegetation that partially absorb the force of the wind and shield soil particles from erosion (King et al., 2005; Okin, 2008; Menut et al., 2013; Ito and Kok, 2017). Models also are limited by inadequate information on soil properties, such as soil size distribution and aggregation state, and how those vary in space and time (Shao, 2001; Kok et al., 2014b). In addition, the relation between wind speed on the scale of the grid box and a dust source is difficult to parameterize (Lunt and Valdes, 2002; Cakmur et al., 2004; Ridley et al., 2013; Comola et al., 2019), yet it has a substantial effect because dust emissions are threshold-dependent and scale nonlinearly with wind speed (Shao, 2008; Kok et al., 2012). Furthermore, the mismatch between the wind speed at the resolved grid-box scale and that at the local dust source scale will vary regionally, partly as a result of sub-grid variations in topography. For instance, the gap between the Tibesti and Ennedi mountains upwind of the Bodélé Depression is below the resolution of many global dust models but enhances the wind over the dust source compared to a grid-box average: a strengthening that is endemic and does not extend to most other grid boxes. Furthermore, models do not correctly capture some of the mesoscale meteorological events that might play an important role in the dust cycle (Schepanski et al., 2009), including haboobs (Pantillon et al., 2015) and possibly dust devils (Koch and Renno, 2005; Jemmett-Smith et al., 2015; Klose and Shao, 2016). Finally, one other key reason for the difference between model simulations and the contributions of different source regions to the global dust cycle obtained here could be that models simulate mostly natural dust and commonly omit or underestimate anthropogenic dust such as from agricultural sources and fugitive dust, whereas the results obtained here inherently account for mineral dust from all natural and anthropogenic sources (see Kok et al., 2021a). As such, differences between our results and model results could also be due to the contribution of anthropogenic (agricultural and fugitive) dust, which could be substantial (Tegen et al., 2004; Ginoux et al., 2012).
The results obtained here can address these weaknesses of models in accurately simulating emissions per source region by allowing models to tune each source region's dust cycle to match our observationally informed constraints. One approach is for models to scale their emissions such that a multiyear simulation, ideally over the period 2004–2008 to match the regional DAOD constraints used in our inverse model (Ridley et al., 2016), matches our constraints on the size-resolved yearly emission flux per source region. A preferable approach would be to scale model emissions to match either the loading or DAOD per source region to our constraints. This would be more difficult as the emission flux to generate a certain loading or DAOD depends on the model's simulated dust lifetimes, but this approach would be more accurate as it ties directly to our main observational constraint, namely on regional DAOD. Although these approaches could substantially improve simulations of the present-day global dust cycle, it would be preferable to improve model physics so that such tuning is no longer necessary. This is particularly important for model predictions of interannual variability and of the global dust cycle for climates other than the present day. For instance, simulations of future changes in the global dust cycle diverge widely (Stanelle et al., 2014; Kok et al., 2018) and might be substantially biased (Evan et al., 2016). In this context, the accuracy of model upgrades to improve global dust cycle simulations could be verified through comparison against the observationally informed constraints on dust emissions and loading per source region obtained here.
We have constrained the contribution of the world's main dust source regions to the global cycle of desert dust. We did so by building on the improved representation of the global dust cycle that was obtained in the companion paper (Kok et al., 2021a). That work used an analytical framework with inverse modeling to integrate observational constraints on the properties and abundance of atmospheric dust with an ensemble of global aerosol model simulations. Here, we analyzed those inverse modeling results to constrain each source region's contribution to particle-size-resolved dust loading, concentration, DAOD, and deposition flux.
We find that the global dust loading is partitioned as follows: North African dust contributes ∼ 50 %, including ∼ 15 % from the southern Sahara and Sahel; Asian source regions contribute ∼ 40 %, with three-quarters from the Middle East and central Asia and one-quarter from East Asia; and minor source regions contribute ∼ 10 %, with one-quarter from North America and three-quarters from the Southern Hemisphere source regions in Australia, South America, and southern Africa (Fig. 2). Models in both the AeroCom Phase I ensemble and in our model ensemble (Kok et al., 2021a) on average estimate a larger contribution of North African dust (∼ 65 %) and a smaller contribution of Asian dust (∼ 30 %) to atmospheric loading. These differences could be due to various factors (see Sect. 4.1 and 4.2), including errors in representing dust emission and the relative contributions of different source regions in models, biases in the regional DAOD used in our analytical framework, and the underestimation or omission of anthropogenic dust by models. We further find that Northern Hemisphere dust contributes only a small fraction (< 10 %) to atmospheric loading and DAOD in the Southern Hemisphere (Figs. 5 and S11), but this fraction increases with altitude and thus might be important for heterogeneous nucleation of ice crystals in mixed-phase and cirrus clouds (Shi and Liu, 2019). We also find that the deposition flux of dust to the Amazon basin is ∼ 10 Tg and thereby a factor of 2–3 less than obtained by previous work.
Our results indicate that dust loading in all source regions peaks in local spring or summer (Fig. 4). This is partially due to increased emissions for some source regions and partially due to an increased dust lifetime in spring and summer for all source regions (Fig. 3a). In turn, this increased lifetime is likely caused by increased convection and thus increased boundary layer depth in the spring and summer seasons (Fig. 3b and c).
The dust source apportionment datasets obtained here are publicly available as part of the DustCOMM dataset (Adebiyi et al., 2020; Kok et al., 2021a) at http://dustcomm.atmos.ucla.edu (last access: 13 May 2020). These data include the size-resolved contributions of each source region to dust emission and deposition fluxes, dust column loading, DAOD, and 3D dust concentration. All these gridded datasets are resolved by season and include realistic error bounds propagated from experimental and modeling uncertainties in the observational constraints on dust properties and abundance. As such, these data can be used to constrain the various impacts of dust on the Earth system, particularly those impacts that depend on particle size or the source-dependent dust mineralogy. This includes dust direct radiative effects and dust impacts on clouds, the hydrological cycle, and biogeochemical cycles.
Data are available at https://dustcomm.atmos.ucla.edu/data/K21b/ (https://doi.org/10.15144/S4RP4Z, Kok et al., 2021b).
The supplement related to this article is available online at: https://doi.org/10.5194/acp-21-8169-2021-supplement.
JFK designed the study, analyzed model data, and wrote the paper. DSH, LL, NMM, and JSW performed CESM/CAM4 simulations; AI performed IMPACT simulations; RLM performed GISS ModelE2 simulations and produced Fig. 8; PRC and ARL performed GEOS/GOCART simulations; MK, VO, and CPGP performed MONARCH simulations; and SA, YB, and RCG performed INCA simulations. YH analyzed results from AeroCom Phase I models. AAA provided observational DAOD constraints. MC and NMM provided valuable comments on study design. All authors edited and commented on the paper.
The authors declare that they have no conflict of interest.
The views and conclusions contained in this document are those of the authors and should not be interpreted as representing the official policies, either expressed or implied, of the Army Research Laboratory or the U.S. Government.
Martina Klose and Carlos Pérez García-Pando acknowledge PRACE for granting access to MareNostrum at the Barcelona Supercomputing Center to run MONARCH. We acknowledge high-performance computing support from Cheyenne (https://doi.org/10.5065/D6RX99HX, last access: 12 May 2021) provided by NCAR's Computational and Information Systems Laboratory, sponsored by the National Science Foundation. We further thank Anna Benedictow for assistance in accessing the AeroCom modeling data, the AeroCom modeling groups for making their simulations available, Joseph Prospero and Nicolas Huneeus for providing dust surface concentration data from in situ measurements from the University of Miami Ocean Aerosol Network, and the investigators of the Sahelian Dust Transect for making their dust concentration measurements available. The MERRA-2 data used in this study have been provided by the Global Modeling and Assimilation Office (GMAO) at NASA Goddard Space Flight Center. This work was granted access to the HPC resources of TGCC under allocations 2019-A0010102201 and 2020-A0010102201 made by GENCI.
This research has been supported by the National Science Foundation (NSF) (grant nos. 1552519 and 1856389) and the Army Research Office (cooperative agreement number W911NF-20-2-0150). This research was further support by the University of California President's Postdoctoral Fellowship awarded to Adeyemi A. Adebiyi and the European Union's Horizon 2020 research and innovation program under Marie Skłodowska-Curie grant agreement no. 708119 awarded to Samuel Albani and no. 789630 awarded to Martina Klose. Ramiro Checa-Garcia received funding from the European Union's Horizon 2020 research and innovation under grant 641816 (CRESCENDO). Akinori Ito received support from JSPS KAKENHI grant number 20H04329 and Integrated Research Program for Advancing Climate Models (TOUGOU) grant number JPMXD0717935715 from the Ministry of Education, Culture, Sports, Science and Technology (MEXT), Japan. Peter R. Colarco and Adriana Rocha-Lima were supported by the NASA Atmospheric Composition: Modeling and Analysis Program (Richard Eckman, program manager) and the NASA Center for Climate Simulation (NCCS) for computational resources. Yue Huang was supported by NASA grant 80NSSC19K1346 awarded under the Future Investigators in NASA Earth and Space Science and Technology (FINESST) program. Ron L. Miller and Vincenzo Obiso received support from the NASA Modeling, Analysis and Prediction Program (NNG14HH42I) along with the NASA EMIT project and the Earth Venture Instrument program, with computational resources from the NASA Center for Climate Simulation (NCCS). Samuel Albani received funding from MIUR (Progetto Dipartimenti di Eccellenza 2018-2022). Carlos Pérez García-Pando received support from the European Research Council (grant no. 773051, FRAGMENT), the EU H2020 project FORCES (grant no. 821205), the AXA Research Fund, and the Spanish Ministry of Science, Innovation and Universities (RYC-2015-18690 and CGL2017-88911-R). Longlei Li received support from the NASA EMIT project and the Earth Venture – Instrument program (grant no. E678605). Yves Balkanski and Ramiro Checa-Garcia received funding from the PolEASIA ANR project under allocation ANR-15-CE04-0005.
This paper was edited by Susannah Burrows and reviewed by two anonymous referees.
Adebiyi, A. A. and Kok, J. F.: Climate models miss most of the coarse dust in the atmosphere, Science Advances, 6, eaaz9507, https://doi.org/10.1126/sciadv.aaz9507 2020.
Adebiyi, A. A., Kok, J. F., Wang, Y., Ito, A., Ridley, D. A., Nabat, P., and Zhao, C.: Dust Constraints from joint Observational-Modelling-experiMental analysis (DustCOMM): comparison with measurements and model simulations, Atmos. Chem. Phys., 20, 829–863, https://doi.org/10.5194/acp-20-829-2020, 2020.
Albani, S., Mahowald, N. M., Delmonte, B., Maggi, V., and Winckler, G.: Comparing modeled and observed changes in mineral dust transport and deposition to Antarctica between the Last Glacial Maximum and current climates, Clim. Dynam., 38, 1731–1755, 2012.
Albani, S., Mahowald, N. M., Perry, A. T., Scanza, R. A., Zender, C. S., Heavens, N. G., Maggi, V., Kok, J. F., and Otto-Bliesner, B. L.: Improved dust representation in the Community Atmosphere Model, J. Adv. Model. Earth Sy., 6, 541–570, 2014.
Albani, S., Mahowald, N. M., Winckler, G., Anderson, R. F., Bradtmiller, L. I., Delmonte, B., François, R., Goman, M., Heavens, N. G., Hesse, P. P., Hovan, S. A., Kang, S. G., Kohfeld, K. E., Lu, H., Maggi, V., Mason, J. A., Mayewski, P. A., McGee, D., Miao, X., Otto-Bliesner, B. L., Perry, A. T., Pourmand, A., Roberts, H. M., Rosenbloom, N., Stevens, T., and Sun, J.: Twelve thousand years of dust: the Holocene global dust cycle constrained by natural archives, Clim. Past, 11, 869–903, https://doi.org/10.5194/cp-11-869-2015, 2015.
Albani, S., Mahowald, N. M., Murphy, L. N., Raiswell, R., Moore, J. K., Anderson, R. F., McGee, D., Bradtmiller, L. I., Delmonte, B., Hesse, P. P., and Mayewski, P. A.: Paleodust variability since the Last Glacial Maximum and implications for iron inputs to the ocean, Geophys. Res. Lett., 43, 3944–3954, 2016.
Albani, S., Balkanski, Y., Mahowald, N., Winckler, G., Maggi, V., and Delmonte, B.: Aerosol-Climate Interactions During the Last Glacial Maximum, Curr. Clim. Change Rep., 4, 99–114, 2018.
An, L. C., Che, H. Z., Xue, M., Zhang, T. H., Wang, H., Wang, Y. Q., Zhou, C. H., Zhao, H. J., Gui, K., Zheng, Y., Sun, T. Z., Liang, Y. X., Sun, E. W., Zhang, H. D., and Zhang, X. Y.: Temporal and spatial variations in sand and dust storm events in East Asia from 2007 to 2016: Relationships with surface conditions and climate change, Sci. Total Environ., 633, 452–462, 2018.
Andreae, M. O., Jones, C. D., and Cox, P. M.: Strong present-day aerosol cooling implies a hot future, Nature, 435, 1187–1190, 2005.
Ansmann, A., Rittmeister, F., Engelmann, R., Basart, S., Jorba, O., Spyrou, C., Remy, S., Skupin, A., Baars, H., Seifert, P., Senf, F., and Kanitz, T.: Profiling of Saharan dust from the Caribbean to western Africa – Part 2: Shipborne lidar measurements versus forecasts, Atmos. Chem. Phys., 17, 14987–15006, https://doi.org/10.5194/acp-17-14987-2017, 2017.
Atkinson, J. D., Murray, B. J., Woodhouse, M. T., Whale, T. F., Baustian, K. J., Carslaw, K. S., Dobbie, S., O'Sullivan, D., and Malkin, T. L.: The importance of feldspar for ice nucleation by mineral dust in mixed-phase clouds, Nature, 498, 355–358, 2013.
Balkanski, Y., Schulz, M., Claquin, T., and Guibert, S.: Reevaluation of Mineral aerosol radiative forcings suggests a better agreement with satellite and AERONET data, Atmos. Chem. Phys., 7, 81–95, https://doi.org/10.5194/acp-7-81-2007, 2007.
Barkley, A. E., Prospero, J. M., Mahowald, N., Hamilton, D. S., Popendorf, K. J., Oehlert, A. M., Pourmand, A., Gatineau, A., Panechou-Pulcherie, K., Blackwelder, P., and Gaston, C. J.: African biomass burning is a substantial source of phosphorus deposition to the Amazon, Tropical Atlantic Ocean, and Southern Ocean, P. Natl. Acad. Sci. USA, 116, 16216–16221, 2019.
Biscaye, P. E.: Mineralogy and sedimentation of recent deep-sea clay in atlantic ocean and adjacent seas and oceans, Geol. Soc. Am. Bull., 76, 803–832, https://doi.org/10.1130/0016-7606(1965)76[803:masord]2.0.co;2, 1965.
Bory, A., Wolff, E., Mulvaney, R., Jagoutz, E., Wegner, A., Ruth, U., and Elderfield, H.: Multiple sources supply eolian mineral dust to the Atlantic sector of coastal Antarctica: Evidence from recent snow layers at the top of Berkner Island ice sheet, Earth Planet. Sc. Lett., 291, 138–148, 2010.
Bory, A. J. M., Biscaye, P. E., Svensson, A., and Grousset, F. E.: Seasonal variability in the origin of recent atmospheric mineral dust at NorthGRIP, Greenland, Earth Planet. Sc. Lett., 196, 123–134, 2002.
Bory, A. J. M., Biscaye, P. E., Piotrowski, A. M., and Steffensen, J. P.: Regional variability of ice core dust composition and provenance in Greenland, Geochem. Geophy. Geosy., 4, 1107, https://doi.org/10.1029/2003gc000627, 2003.
Bozlaker, A., Prospero, J. M., Price, J., and Chellam, S.: Linking Barbados Mineral Dust Aerosols to North African Sources Using Elemental Composition and Radiogenic Sr, Nd, and Pb Isotope Signatures, J. Geophys. Res.-Atmos., 123, 1384–1400, 2018.
Brock, C. A., Williamson, C., Kupc, A., Froyd, K. D., Erdesz, F., Wagner, N., Richardson, M., Schwarz, J. P., Gao, R.-S., Katich, J. M., Campuzano-Jost, P., Nault, B. A., Schroder, J. C., Jimenez, J. L., Weinzierl, B., Dollner, M., Bui, T., and Murphy, D. M.: Aerosol size distributions during the Atmospheric Tomography Mission (ATom): methods, uncertainties, and data products, Atmos. Meas. Tech., 12, 3081–3099, https://doi.org/10.5194/amt-12-3081-2019, 2019.
Buchard, V., Randles, C. A., da Silva, A. M., Darmenov, A., Colarco, P. R., Govindaraju, R., Ferrare, R., Hair, J., Beyersdorf, A. J., Ziemba, L. D., and Yu, H.: The MERRA-2 Aerosol Reanalysis, 1980 Onward, Part II: Evaluation and Case Studies, J. Climate, 30, 6851–6872, 2017.
Bullard, J. E., Baddock, M., Bradwell, T., Crusius, J., Darlington, E., Gaiero, D., Gasso, S., Gisladottir, G., Hodgkins, R., McCulloch, R., McKenna-Neuman, C., Mockford, T., Stewart, H., and Thorsteinsson, T.: High-latitude dust in the Earth system, Rev. Geophys., 54, 447–485, 2016.
Cakmur, R. V., Miller, R. L., and Torres, O.: Incorporating the effect of small-scale circulations upon dust emission in an atmospheric general circulation model, J. Geophys. Res.-Atmos., 109, D07201, https://doi.org/10.1029/2003JD004067, 2004.
Cakmur, R. V., Miller, R. L., Perlwitz, J., Geogdzhayev, I. V., Ginoux, P., Koch, D., Kohfeld, K. E., Tegen, I., and Zender, C. S.: Constraining the magnitude of the global dust cycle by minimizing the difference between a model and observations, J. Geophys. Res.-Atmos., 111, D06207, https://doi.org/10.1029/2005JD005791, 2006.
Checa-Garcia, R., Balkanski, Y., Albani, S., Bergman, T., Carslaw, K., Cozic, A., Dearden, C., Marticorena, B., Michou, M., van Noije, T., Nabat, P., O'Connor, F., Olivié, D., Prospero, J. M., Le Sager, P., Schulz, M., and Scott, C.: Evaluation of natural aerosols in CRESCENDO-ESMs: Mineral Dust, Atmos. Chem. Phys. Discuss. [preprint], https://doi.org/10.5194/acp-2020-1147, in review, 2020.
Chin, M., Diehl, T., Ginoux, P., and Malm, W.: Intercontinental transport of pollution and dust aerosols: implications for regional air quality, Atmos. Chem. Phys., 7, 5501–5517, https://doi.org/10.5194/acp-7-5501-2007, 2007.
Claquin, T., Schulz, M., and Balkanski, Y. J.: Modeling the mineralogy of atmospheric dust sources, J. Geophys. Res.-Atmos., 104, 22243–22256, 1999.
Comola, F., Kok, J. F., Chamecki, M., and Martin, R. L.: The Intermittency of Wind-Driven Sand Transport, Geophys. Res. Lett., 46, 13430–13440, 2019.
Cwiertny, D. M., Young, M. A., and Grassian, V. H.: Chemistry and photochemistry of mineral dust aerosol, Annu. Rev. Phys. Chem., 59, 27–51, 2008.
Cziczo, D. J., Froyd, K. D., Hoose, C., Jensen, E. J., Diao, M. H., Zondlo, M. A., Smith, J. B., Twohy, C. H., and Murphy, D. M.: Clarifying the Dominant Sources and Mechanisms of Cirrus Cloud Formation, Science, 340, 1320–1324, 2013.
Delmonte, B., Andersson, P. S., Hansson, M., Schoberg, H., Petit, J. R., Basile-Doelsch, I., and Maggi, V.: Aeolian dust in East Antarctica (EPICA-Dome C and Vostok): Provenance during glacial ages over the last 800 kyr, Geophys. Res. Lett., 35, L07703, https://doi.org/10.1029/2008GL033382, 2008.
Delmonte, B., Baroni, C., Andersson, P. S., Narcisi, B., Salvatore, M. C., Petit, J. R., Scarchilli, C., Frezzotti, M., Albani, S., and Maggi, V.: Modern and Holocene aeolian dust variability from Tabs Dome (Northern Victoria Land) to the interior of the Antarctic ice sheet, Quaternary Sci. Rev., 64, 76–89, 2013.
Delmonte, B., Winton, H., Baroni, M., Baccolo, G., Hansson, M., Andersson, P., Baroni, C., Salvatore, M. C., Lanci, L., and Maggi, V.: Holocene dust in East Antarctica: Provenance and variability in time and space, Holocene, 30, 546–558, https://doi.org/10.1177/0959683619875188, 2019.
Denjean, C., Formenti, P., Desboeufs, K., Chevaillier, S., Triquet, S., Maille, M., Cazaunau, M., Laurent, B., Mayol-Bracero, O. L., Vallejo, P., Quinones, M., Gutierrez-Molina, I. E., Cassola, F., Prati, P., Andrews, E., and Ogren, J.: Size distribution and optical properties of African mineral dust after intercontinental transport, J. Geophys. Res.-Atmos., 121, 7117–7138, 2016.
Di Biagio, C., Formenti, P., Balkanski, Y., Caponi, L., Cazaunau, M., Pangui, E., Journet, E., Nowak, S., Caquineau, S., Andreae, M. O., Kandler, K., Saeed, T., Piketh, S., Seibert, D., Williams, E., and Doussin, J.-F.: Global scale variability of the mineral dust long-wave refractive index: a new dataset of in situ measurements for climate modeling and remote sensing, Atmos. Chem. Phys., 17, 1901–1929, https://doi.org/10.5194/acp-17-1901-2017, 2017.
Di Biagio, C., Formenti, P., Balkanski, Y., Caponi, L., Cazaunau, M., Pangui, E., Journet, E., Nowak, S., Andreae, M. O., Kandler, K., Saeed, T., Piketh, S., Seibert, D., Williams, E., and Doussin, J.-F.: Complex refractive indices and single-scattering albedo of global dust aerosols in the shortwave spectrum and relationship to size and iron content, Atmos. Chem. Phys., 19, 15503–15531, https://doi.org/10.5194/acp-19-15503-2019, 2019.
Di Biagio, C., Balkanski, Y., Albani, S., Boucher, O., and Formenti, P.: Direct Radiative Effect by Mineral Dust Aerosols Constrained by New Microphysical and Spectral Optical Data, Geophys. Res. Lett., 47, e2019GL086186, https://doi.org/10.1029/2019GL086186, 2020.
Easter, R. C., Ghan, S. J., Zhang, Y., Saylor, R. D., Chapman, E. G., Laulainen, N. S., Abdul-Razzak, H., Leung, L. R., Bian, X. D., and Zaveri, R. A.: MIRAGE: Model description and evaluation of aerosols and trace gases, J. Geophys. Res.-Atmos., 109, D20210, https://doi.org/10.1029/2004JD004571, 2004.
Ekstrom, M., McTainsh, G. H., and Chappell, A.: Australian dust storms: Temporal trends and relationships with synoptic pressure distributions (1960–99), Int. J. Climatol., 24, 1581–1599, 2004.
Emerson, E. W., Hodshire, A. L., DeBolt, H. M., Bilsback, K. R., Pierce, J. R., McMeeking, G. R., and Farmer, D. K.: Revisiting particle dry deposition and its role in radiative effect estimates, P. Natl. Acad. Sci. USA, 117, 26076–26082, 2020.
Engelstaedter, S., Tegen, I., and Washington, R.: North African dust emissions and transport, Earth-Sci. Rev., 79, 73–100, 2006.
Evan, A. T., Fiedler, S., Zhao, C., Menut, L., Schepanski, K., Flamant, C., and Doherty, O.: Derivation of an observation-based map of North African dust emission, Aeolian Res., 16, 153–162, 2015.
Evan, A. T., Flamant, C., Gaetani, M., and Guichard, F.: The past, present and future of African dust, Nature, 531, 493–495, 2016.
Feng, L., Smith, S. J., Braun, C., Crippa, M., Gidden, M. J., Hoesly, R., Klimont, Z., van Marle, M., van den Berg, M., and van der Werf, G. R.: The generation of gridded emissions data for CMIP6, Geosci. Model Dev., 13, 461–482, https://doi.org/10.5194/gmd-13-461-2020, 2020.
Ginoux, P., Chin, M., Tegen, I., Prospero, J. M., Holben, B., Dubovik, O., and Lin, S. J.: Sources and distributions of dust aerosols simulated with the GOCART model, J. Geophys. Res., 106, 20255–20273, 2001.
Ginoux, P., Prospero, J. M., Gill, T. E., Hsu, N. C., and Zhao, M.: Global-scale attribution of anthropogenic and natural dust sources and their emission rates based on MODIS Deep Blue aerosol products, Rev. Geophys., 50, Rg3005, https://doi.org/10.1029/2012RG000388, 2012.
Glaser, G., Wernli, H., Kerkweg, A., and Teubler, F.: The transatlantic dust transport from North Africa to the Americas – Its characteristics and source regions, J. Geophys. Res.-Atmos., 120, 11231–11252, 2015.
Gliß, J., Mortier, A., Schulz, M., Andrews, E., Balkanski, Y., Bauer, S. E., Benedictow, A. M. K., Bian, H., Checa-Garcia, R., Chin, M., Ginoux, P., Griesfeller, J. J., Heckel, A., Kipling, Z., Kirkevåg, A., Kokkola, H., Laj, P., Le Sager, P., Lund, M. T., Lund Myhre, C., Matsui, H., Myhre, G., Neubauer, D., van Noije, T., North, P., Olivié, D. J. L., Rémy, S., Sogacheva, L., Takemura, T., Tsigaridis, K., and Tsyro, S. G.: AeroCom phase III multi-model evaluation of the aerosol life cycle and optical properties using ground- and space-based remote sensing as well as surface in situ observations, Atmos. Chem. Phys., 21, 87–128, https://doi.org/10.5194/acp-21-87-2021, 2021.
Goudie, A. S. and Middleton, N. J.: Saharan dust storms: nature and consequences, Earth-Sci. Rev., 56, 179–204, 2001.
Green, R. O., Mahowald, N. M., Ung, C., Thompson, D. R., Bator, L., Bennet, M., Bernas, M., Blackway, N., Bradley, C., Cha, J., Clark, P., Clark, R., Cloud, D., Diaz, E., Dor, E. B., Duren, R., Eastwood, M., Ehlmann, B. L., Fuentes, L., Ginoux, P., Gross, J., He, Y., Kalashnikova, O., Kert, W., Keymeulen, D., Klimesh, M., Ku, D., Kwong-Fu, H., Liggett, E., Li, L., Lundeen, S., Makowski, M. D., Mazer, A., Miller, R., Mouroulis, P., Oaida, B., Okin, G. S., Ortega, A., Oyake, A., Nguyen, H., Pace, T., Painter, T. H., Pempejian, J., Garcia-Pando, C. P., Pham, T., Phillips, B., Pollock, R., Purcell, R., Realmuto, V., Schoolcraft, J., Sen, A., Shin, S., Shaw, L., Soriano, M., Swayze, G., Thingvold, E., Vaid, A., and Zan, J.: The Earth Surface Mineral Dust Source Investigation: An Earth Science Imaging Spectroscopy Mission, Big Sky, Montana, USA, 1–15, 2020.
Grousset, F. E. and Biscaye, P. E.: Tracing dust sources and transport patterns using Sr, Nd and Pb isotopes, Chem. Geol., 222, 149–167, 2005.
Hamilton, D. S., Moore, J. K., Arneth, A., Bond, T. C., Carslaw, K. S., Hantson, S., Ito, A., Kaplan, J. O., Lindsay, K., Nieradzik, L., Rathod, S. D., Scanza, R. A., and Mahowald, N. M.: Impact of Changes to the Atmospheric Soluble Iron Deposition Flux on Ocean Biogeochemical Cycles in the Anthropocene, Global Biogeochem. Cy., 34, e2019GB006448, https://doi.org/10.1029/2019GB006448, 2020.
Hooper, J. and Marx, S.: A global doubling of dust emissions during the Anthropocene?, Global Planet. Change, 169, 70–91, 2018.
Hsu, N. C., Gautam, R., Sayer, A. M., Bettenhausen, C., Li, C., Jeong, M. J., Tsay, S.-C., and Holben, B. N.: Global and regional trends of aerosol optical depth over land and ocean using SeaWiFS measurements from 1997 to 2010, Atmos. Chem. Phys., 12, 8037–8053, https://doi.org/10.5194/acp-12-8037-2012, 2012a.
Hsu, S. C., Huh, C. A., Lin, C. Y., Chen, W. N., Mahowald, N. M., Liu, S. C., Chou, C. C. K., Liang, M. C., Tsai, C. J., Lin, F. J., Chen, J. P., and Huang, Y. T.: Dust transport from non-East Asian sources to the North Pacific, Geophys. Res. Lett., 39, L12804, https://doi.org/10.1029/2012GL051962, 2012b.
Huang, J. P., Wang, T. H., Wang, W. C., Li, Z. Q., and Yan, H. R.: Climate effects of dust aerosols over East Asian arid and semiarid regions, J. Geophys. Res.-Atmos., 119, 11398–11416, 2014.
Huang, Y., Adebiyi, A. A., Formenti, P., and Kok, J. F.: Linking the different diameter types of aspherical desert dust indicates that models underestimate coarse dust emission, Geophys. Res. Lett., 48, e2020GL092054, https://doi.org/10.1029/2019GL086592, 2021.
Huneeus, N., Schulz, M., Balkanski, Y., Griesfeller, J., Prospero, J., Kinne, S., Bauer, S., Boucher, O., Chin, M., Dentener, F., Diehl, T., Easter, R., Fillmore, D., Ghan, S., Ginoux, P., Grini, A., Horowitz, L., Koch, D., Krol, M. C., Landing, W., Liu, X., Mahowald, N., Miller, R., Morcrette, J.-J., Myhre, G., Penner, J., Perlwitz, J., Stier, P., Takemura, T., and Zender, C. S.: Global dust model intercomparison in AeroCom phase I, Atmos. Chem. Phys., 11, 7781–7816, https://doi.org/10.5194/acp-11-7781-2011, 2011.
Ito, A. and Kok, J. F.: Do dust emissions from sparsely vegetated regions dominate atmospheric iron supply to the Southern Ocean?, J. Geophys. Res.-Atmos., 122, 3987–4002, 2017.
Ito, A., Myriokefalitakis, S., Kanakidou, M., Mahowald, N. M., Scanza, R. A., Hamilton, D. S., Baker, A. R., Jickells, T., Sarin, M., Bikkina, S., Gao, Y., Shelley, R. U., Buck, C. S., Landing, W. M., Bowie, A. R., Perron, M. M. G., Guieu, C., Meskhidze, N., Johnson, M. S., Feng, Y., Kok, J. F., Nenes, A., and Duce, R. A.: Pyrogenic iron: The missing link to high iron solubility in aerosols, Science Advances, 5, eaau7671, https://doi.org/10.1126/sciadv.aau7671, 2019.
Ito, A., Ye, Y., Yamamoto, A., Watanabe, M., and Aita, M. N.: Responses of ocean biogeochemistry to atmospheric supply of lithogenic and pyrogenic iron-containing aerosols, Geol. Mag., 157, 741–756, 2020.
Jemmett-Smith, B. C., Marsham, J. H., Knippertz, P., and Gilkeson, C. A.: Quantifying global dust devil occurrence from meteorological analyses, Geophys. Res. Lett., 42, 1275–1282, 2015.
Jickells, T. D., An, Z. S., Andersen, K. K., Baker, A. R., Bergametti, G., Brooks, N., Cao, J. J., Boyd, P. W., Duce, R. A., Hunter, K. A., Kawahata, H., Kubilay, N., laRoche, J., Liss, P. S., Mahowald, N., Prospero, J. M., Ridgwell, A. J., Tegen, I., and Torres, R.: Global iron connections between desert dust, ocean biogeochemistry, and climate, Science, 308, 67–71, 2005.
Journet, E., Desboeufs, K. V., Caquineau, S., and Colin, J. L.: Mineralogy as a critical factor of dust iron solubility, Geophys. Res. Lett., 35, L07805, https://doi.org/10.1029/2007GL031589, 2008.
Journet, E., Balkanski, Y., and Harrison, S. P.: A new data set of soil mineralogy for dust-cycle modeling, Atmos. Chem. Phys., 14, 3801–3816, https://doi.org/10.5194/acp-14-3801-2014, 2014.
Kahn, R. A. and Gaitley, B. J.: An analysis of global aerosol type as retrieved by MISR, J. Geophys. Res.-Atmos., 120, 4248–4281, 2015.
Kaufman, Y. J., Koren, I., Remer, L. A., Tanre, D., Ginoux, P., and Fan, S.: Dust transport and deposition observed from the Terra-Moderate Resolution Imaging Spectroradiometer (MODIS) spacecraft over the Atlantic ocean, J. Geophys. Res.-Atmos., 110, D10S12, https://doi.org/10.1029/2003JD004436, 2005.
Kelley, M., Schmidt, G. A., Nazarenko, L., Miller, R. L., Bauer, S. E., Ruedy, R., Russell, G. L., Aleinov, I., Bauer, M., Bleck, R., Canuto, V., Cesana, G., Cheng, Y., Clune, T. L., Cook, B., Cruz, C. A., Del Genio, A. D., Elsaesser, G. S., Faluvegi, G., Kiang, N. Y., Kim, D., Lacis, A. A., Leboissetier, A., LeGrande, A. N., Lo, K. K., Marshall, J. C., McDermid, S., Matthews, E. E., Mezuman, K., Murray, L. T., Oinas, V., Orbe, C., Pérez García-Pando, C., Perlwitz, J. P., Puma, M. J., Rind, D., Romanou, A., Shindell, D. T., Sun, S., Tausnev, N., Tsigaridis, K., Tselioudis, G., Weng, E., Wu, J., and Yao, M.: GISS-E2.1: Configurations and climatology, J. Adv. Model. Earth Sy., 12, e2019MS002025, https://doi.org/10.1029/2019MS002025, 2020.
Kiehl, J. T.: Twentieth century climate model response and climate sensitivity, Geophys. Res. Lett., 34, L22710, https://doi.org/10.1029/2007GL031383, 2007.
Kim, D., Chin, M., Yu, H. B., Diehl, T., Tan, Q., Kahn, R. A., Tsigaridis, K., Bauer, S. E., Takemura, T., Pozzoli, L., Bellouin, N., Schulz, M., Peyridieu, S., Chedin, A., and Koffi, B.: Sources, sinks, and transatlantic transport of North African dust aerosol: A multimodel analysis and comparison with remote sensing data, J. Geophys. Res.-Atmos., 119, 6259–6277, 2014.
King, J., Nickling, W. G., and Gillies, J. A.: Representation of vegetation and other nonerodible elements in aeolian shear stress partitioning models for predicting transport threshold, J. Geophys. Res.-Earth, 110, F04015, https://doi.org/10.1029/2004JF000281, 2005.
Kinne, S., Schulz, M., Textor, C., Guibert, S., Balkanski, Y., Bauer, S. E., Berntsen, T., Berglen, T. F., Boucher, O., Chin, M., Collins, W., Dentener, F., Diehl, T., Easter, R., Feichter, J., Fillmore, D., Ghan, S., Ginoux, P., Gong, S., Grini, A., Hendricks, J., Herzog, M., Horowitz, L., Isaksen, I., Iversen, T., Kirkevåg, A., Kloster, S., Koch, D., Kristjansson, J. E., Krol, M., Lauer, A., Lamarque, J. F., Lesins, G., Liu, X., Lohmann, U., Montanaro, V., Myhre, G., Penner, J., Pitari, G., Reddy, S., Seland, O., Stier, P., Takemura, T., and Tie, X.: An AeroCom initial assessment – optical properties in aerosol component modules of global models, Atmos. Chem. Phys., 6, 1815–1834, https://doi.org/10.5194/acp-6-1815-2006, 2006.
Klose, M. and Shao, Y. P.: A numerical study on dust devils with implications to global dust budget estimates, Aeolian Res., 22, 47–58, 2016.
Knippertz, P. and Todd, M. C.: Mineral dust aerosols over the sahara: Meteorological controls on emission and transport and implications for modeling, Rev. Geophys., 50, RG1007, https://doi.org/10.1029/2011RG000362, 2012.
Koch, J. and Renno, N. O.: The role of convective plumes and vortices on the global aerosol budget, Geophys. Res. Lett., 32, L18806, https://doi.org/10.1029/2005GL023420, 2005.
Koffi, B., Schulz, M., Breon, F. M., Dentener, F., Steensen, B. M., Griesfeller, J., Winker, D., Balkanski, Y., Bauer, S. E., Bellouin, N., Berntsen, T., Bian, H. S., Chin, M., Diehl, T., Easter, R., Ghan, S., Hauglustaine, D. A., Iversen, T., Kirkevag, A., Liu, X. H., Lohmann, U., Myhre, G., Rasch, P., Seland, O., Skeie, R. B., Steenrod, S. D., Stier, P., Tackett, J., Takemura, T., Tsigaridis, K., Vuolo, M. R., Yoon, J., and Zhang, K.: Evaluation of the aerosol vertical distribution in global aerosol models through comparison against CALIOP measurements: AeroCom phase II results, J. Geophys. Res.-Atmos., 121, 7254–7283, 2016.
Kok, J. F.: A scaling theory for the size distribution of emitted dust aerosols suggests climate models underestimate the size of the global dust cycle, P. Natl. Acad. Sci. USA, 108, 1016–1021, 2011.
Kok, J. F., Parteli, E. J. R., Michaels, T. I., and Karam, D. B.: The physics of wind-blown sand and dust, Rep. Prog. Phys., 75, 106901, https://doi.org/10.1088/0034-4885/75/10/106901, 2012.
Kok, J. F., Albani, S., Mahowald, N. M., and Ward, D. S.: An improved dust emission model – Part 2: Evaluation in the Community Earth System Model, with implications for the use of dust source functions, Atmos. Chem. Phys., 14, 13043–13061, https://doi.org/10.5194/acp-14-13043-2014, 2014a.
Kok, J. F., Mahowald, N. M., Fratini, G., Gillies, J. A., Ishizuka, M., Leys, J. F., Mikami, M., Park, M.-S., Park, S.-U., Van Pelt, R. S., and Zobeck, T. M.: An improved dust emission model – Part 1: Model description and comparison against measurements, Atmos. Chem. Phys., 14, 13023–13041, https://doi.org/10.5194/acp-14-13023-2014, 2014b.
Kok, J. F., Ridley, D. A., Zhou, Q., Miller, R. L., Zhao, C., Heald, C. L., Ward, D. S., Albani, S., and Haustein, K.: Smaller desert dust cooling effect estimated from analysis of dust size and abundance, Nat. Geosci., 10, 274–278, 2017.
Kok, J. F., Ward, D. S., Mahowald, N. M., and Evan, A. T.: Global and regional importance of the direct dust-climate feedback, Nat. Commun., 9, 241, https://doi.org/10.1038/s41467-017-02620-y, 2018.
Kok, J. F., Adebiyi, A. A., Albani, S., Balkanski, Y., Checa-Garcia, R., Chin, M., Colarco, P. R., Hamilton, D. S., Huang, Y., Ito, A., Klose, M., Leung, D. M., Li, L., Mahowald, N. M., Miller, R. L., Obiso, V., Pérez García-Pando, C., Rocha-Lima, A., Wan, J. S., and Whicker, C. A.: Improved representation of the global dust cycle using observational constraints on dust properties and abundance, Atmos. Chem. Phys., 21, 8127–8167, https://doi.org/10.5194/acp-21-8127-2021, 2021a.
Kok, J. F., Adebiyi, A. A., Albani, S., Balkanski, Y., Checa-Garcia, R., Chin, M., Colarco, P. R., Hamilton, D. S., Huang, Y., Ito, A., Klose, M., Li, L., Mahowald, N. M., Miller, R. L., Obiso, V., García-Pando, C. P., Rocha-Lima, A., and Wan, J. S.: DustCOMM data of size-resolved contributions of each of the world's main dust source regions to the global cycle of desert dust, available at: https://dustcomm.atmos.ucla.edu/data/K21b/, https://doi.org/10.15144/S4RP4Z, last access: 12 May 2021b.
Koren, I., Kaufman, Y. J., Washington, R., Todd, M. C., Rudich, Y., Martins, J. V., and Rosenfeld, D.: The Bodele depression: a single spot in the Sahara that provides most of the mineral dust to the Amazon forest, Environ. Res. Lett., 1, 014005, https://doi.org/10.1088/1748-9326/1/1/014005, 2006.
Kumar, K. R., Attada, R., Dasari, H. P., Vellore, R. K., Abualnaja, Y. O., Ashok, K., and Hoteit, I.: On the Recent Amplification of Dust Over the Arabian Peninsula During 2002–2012, J. Geophys. Res.-Atmos., 124, 13220–13229, 2019.
Kylling, A., Zwaaftink, C. D. G., and Stohl, A.: Mineral Dust Instantaneous Radiative Forcing in the Arctic, Geophys. Res. Lett., 45, 4290–4298, 2018.
Lamarque, J.-F., Bond, T. C., Eyring, V., Granier, C., Heil, A., Klimont, Z., Lee, D., Liousse, C., Mieville, A., Owen, B., Schultz, M. G., Shindell, D., Smith, S. J., Stehfest, E., Van Aardenne, J., Cooper, O. R., Kainuma, M., Mahowald, N., McConnell, J. R., Naik, V., Riahi, K., and van Vuuren, D. P.: Historical (1850–2000) gridded anthropogenic and biomass burning emissions of reactive gases and aerosols: methodology and application, Atmos. Chem. Phys., 10, 7017–7039, https://doi.org/10.5194/acp-10-7017-2010, 2010.
Lambert, F., Delmonte, B., Petit, J. R., Bigler, M., Kaufmann, P. R., Hutterli, M. A., Stocker, T. F., Ruth, U., Steffensen, J. P., and Maggi, V.: Dust-climate couplings over the past 800 000 years from the EPICA Dome C ice core, Nature, 452, 616–619, 2008.
Lau, W. K. M., Kim, M. K., Kim, K. M., and Lee, W. S.: Enhanced surface warming and accelerated snow melt in the Himalayas and Tibetan Plateau induced by absorbing aerosols, Environ. Res. Lett., 5, 025204, https://doi.org/10.1088/1748-9326/5/2/025204, 2010.
Lee, W. L., Liou, K. N., He, C. L., Liang, H. C., Wang, T. C., Li, Q. B., Liu, Z. X., and Yue, Q.: Impact of absorbing aerosol deposition on snow albedo reduction over the southern Tibetan plateau based on satellite observations, Theor. Appl. Climatol., 129, 1373–1382, 2017.
Li, F., Ginoux, P., and Ramaswamy, V.: Distribution, transport, and deposition of mineral dust in the Southern Ocean and Antarctica: Contribution of major sources, J. Geophys. Res.-Atmos., 113, D10207, https://doi.org/10.1029/2007JD009190, 2008.
Li, L., Mahowald, N. M., Miller, R. L., Pérez García-Pando, C., Klose, M., Hamilton, D. S., Gonçalves Ageitos, M., Ginoux, P., Balkanski, Y., Green, R. O., Kalashnikova, O., Kok, J. F., Obiso, V., Paynter, D., and Thompson, D. R.: Quantifying the range of the dust direct radiative effect due to source mineralogy uncertainty, Atmos. Chem. Phys., 21, 3973–4005, https://doi.org/10.5194/acp-21-3973-2021, 2021.
Li, X., Maring, H., Savoie, D., Voss, K., and Prospero, J. M.: Dominance of mineral dust in aerosol light-scattering in the North Atlantic trade winds, Nature, 380, 416–419, 1996.
Liu, X., Shi, X., Zhang, K., Jensen, E. J., Gettelman, A., Barahona, D., Nenes, A., and Lawson, P.: Sensitivity studies of dust ice nuclei effect on cirrus clouds with the Community Atmosphere Model CAM5, Atmos. Chem. Phys., 12, 12061–12079, https://doi.org/10.5194/acp-12-12061-2012, 2012.
Locarnini, R. A., Mishonov, A. V., Antonov, J. I., Boyer, T. P., Garcia, H. E., Baranova, O. K., Zweng, M. M., and Johnson, D. R.: World Ocean Atlas 2009, Volume 1: Temperature, U.S. Government Printing Office, Washington, D.C., 184 pp., 2010.
Lunt, D. J. and Valdes, P. J.: The modern dust cycle: Comparison of model results with observations and study of sensitivities, J. Geophys. Res.-Atmos., 107, 4669, https://doi.org/10.1029/2002JD002316, 2002.
Lupker, M., Aciego, S. M., Bourdon, B., Schwander, J., and Stocker, T. F.: Isotopic tracing (Sr, Nd, U and Hf) of continental and marine aerosols in an 18th century section of the Dye-3 ice core (Greenland), Earth Planet. Sc. Lett., 295, 277–286, 2010.
Mahowald, N.: Aerosol Indirect Effect on Biogeochemical Cycles and Climate, Science, 334, 794–796, 2011.
Mahowald, N., Albani, S., Kok, J. F., Engelstaeder, S., Scanza, R., Ward, D. S., and Flanner, M. G.: The size distribution of desert dust aerosols and its impact on the Earth system, Aeolian Res., 15, 53–71, 2014.
Mahowald, N. M.: Anthropocene changes in desert area: Sensitivity to climate model predictions, Geophys. Res. Lett., 34, L18817, https://doi.org/10.1029/2007GL030472, 2007.
Mahowald, N. M., Engelstaedter, S., Luo, C., Sealy, A., Artaxo, P., Benitez-Nelson, C., Bonnet, S., Chen, Y., Chuang, P. Y., Cohen, D. D., Dulac, F., Herut, B., Johansen, A. M., Kubilay, N., Losno, R., Maenhaut, W., Paytan, A., Prospero, J. A., Shank, L. M., and Siefert, R. L.: Atmospheric Iron Deposition: Global Distribution, Variability, and Human Perturbations, Annu. Rev. Mar. Sci., 1, 245–278, 2009.
Mahowald, N. M., Kloster, S., Engelstaedter, S., Moore, J. K., Mukhopadhyay, S., McConnell, J. R., Albani, S., Doney, S. C., Bhattacharya, A., Curran, M. A. J., Flanner, M. G., Hoffman, F. M., Lawrence, D. M., Lindsay, K., Mayewski, P. A., Neff, J., Rothenberg, D., Thomas, E., Thornton, P. E., and Zender, C. S.: Observed 20th century desert dust variability: impact on climate and biogeochemistry, Atmos. Chem. Phys., 10, 10875–10893, https://doi.org/10.5194/acp-10-10875-2010, 2010.
Martin, J. H.: Glacial-interglacial CO2 change: The iron hypothesis, Paleoceanography, 5, 1–13, 1990.
McConnell, J. R., Aristarain, A. J., Banta, J. R., Edwards, P. R., and Simoes, J. C.: 20th-Century doubling in dust archived in an Antarctic Peninsula ice core parallels climate change and desertification in South America, P. Natl. Acad. Sci. USA, 104, 5743–5748, 2007.
Menut, L., Perez, C., Haustein, K., Bessagnet, B., Prigent, C., and Alfaro, S.: Impact of surface roughness and soil texture on mineral dust emission fluxes modeling, J. Geophys. Res.-Atmos., 118, 6505–6520, 2013.
Miller, R. L., Cakmur, R. V., Perlwitz, J., Geogdzhayev, I. V., Ginoux, P., Koch, D., Kohfeld, K. E., Prigent, C., Ruedy, R., Schmidt, G. A., and Tegen, I.: Mineral dust aerosols in the NASA goddard institute for Space Sciences ModelE atmospheric general circulation model, J. Geophys. Res.-Atmos., 111, D06208, https://doi.org/10.1029/2005JD005796, 2006.
Miller, R. L., Knippertz, P., Pérez García-Pando, C., Perlwitz, J. P., and Tegen, I.: Impact of Dust Radiative Forcing upon Climate, in: Mineral Dust: A Key Player in the Earth System, edited by: Knippertz, P. and Stuut, J.-B. W., Springer, Dordrecht, The Netherlands, 2014.
Mosley-Thompson, E., Thompson, L. G., Grootes, P., and Gundestrup, N.: Little ice age (neoglacial) paleoenvironmental conditions at siple station, Antarctica, J. Glaciol., 14, 199–204, 1990.
Myriokefalitakis, S., Ito, A., Kanakidou, M., Nenes, A., Krol, M. C., Mahowald, N. M., Scanza, R. A., Hamilton, D. S., Johnson, M. S., Meskhidze, N., Kok, J. F., Guieu, C., Baker, A. R., Jickells, T. D., Sarin, M. M., Bikkina, S., Shelley, R., Bowie, A., Perron, M. M. G., and Duce, R. A.: Reviews and syntheses: the GESAMP atmospheric iron deposition model intercomparison study, Biogeosciences, 15, 6659–6684, https://doi.org/10.5194/bg-15-6659-2018, 2018.
O'Sullivan, D., Marenco, F., Ryder, C. L., Pradhan, Y., Kipling, Z., Johnson, B., Benedetti, A., Brooks, M., McGill, M., Yorks, J., and Selmer, P.: Models transport Saharan dust too low in the atmosphere: a comparison of the MetUM and CAMS forecasts with observations, Atmos. Chem. Phys., 20, 12955–12982, https://doi.org/10.5194/acp-20-12955-2020, 2020.
Ohgaito, R., Abe-Ouchi, A., O'ishi, R., Takemura, T., Ito, A., Hajima, T., Watanabe, S., and Kawamiya, M.: Effect of high dust amount on surface temperature during the Last Glacial Maximum: a modelling study using MIROC-ESM, Clim. Past, 14, 1565–1581, https://doi.org/10.5194/cp-14-1565-2018, 2018.
Okin, G. S.: A new model of wind erosion in the presence of vegetation, J. Geophys. Res.-Earth, 113, F02s10, https://doi.org/10.1029/2007JF000758, 2008.
Okin, G. S., Mahowald, N., Chadwick, O. A., and Artaxo, P.: Impact of desert dust on the biogeochemistry of phosphorus in terrestrial ecosystems, Global Biogeochem. Cy., 18, Gb2005, https://doi.org/10.1029/2003GB002145, 2004.
Omar, A., Liu, Z. Y., Vaughan, M., Thornhill, K., Kittaka, C., Ismail, S., Hu, Y. X., Chen, G., Powell, K., Winker, D., Trepte, C., Winstead, E., and Anderson, B.: Extinction-to-backscatter ratios of Saharan dust layers derived from in situ measurements and CALIPSO overflights during NAMMA, J. Geophys. Res.-Atmos., 115, D24217, https://doi.org/10.1029/2010JD014223, 2010.
Painter, T. H., Deems, J. S., Belnap, J., Hamlet, A. F., Landry, C. C., and Udall, B.: Response of Colorado River runoff to dust radiative forcing in snow, P. Natl. Acad. Sci. USA, 107, 17125–17130, 2010.
Pantillon, F., Knippertz, P., Marsham, J. H., and Birch, C. E.: A Parameterization of Convective Dust Storms for Models with Mass-Flux Convection Schemes, J. Atmos. Sci., 72, 2545–2561, 2015.
Pérez García-Pando, C., Miller, R. L., Perlwitz, J. P., Rodriguez, S., and Prospero, J. M.: Predicting the mineral composition of dust aerosols: Insights from elemental composition measured at the Izana Observatory, Geophys. Res. Lett., 43, 10520–10529, 2016.
Perlwitz, J. P., Pérez García-Pando, C., and Miller, R. L.: Predicting the mineral composition of dust aerosols – Part 1: Representing key processes, Atmos. Chem. Phys., 15, 11593–11627, https://doi.org/10.5194/acp-15-11593-2015, 2015a.
Perlwitz, J. P., Pérez García-Pando, C., and Miller, R. L.: Predicting the mineral composition of dust aerosols – Part 2: Model evaluation and identification of key processes with observations, Atmos. Chem. Phys., 15, 11629–11652, https://doi.org/10.5194/acp-15-11629-2015, 2015b.
Petit, J. R., Jouzel, J., Raynaud, D., Barkov, N. I., Barnola, J. M., Basile, I., Bender, M., Chappellaz, J., Davis, M., Delaygue, G., Delmotte, M., Kotlyakov, V. M., Legrand, M., Lipenkov, V. Y., Lorius, C., Pepin, L., Ritz, C., Saltzman, E., and Stievenard, M.: Climate and atmospheric history of the past 420 000 years from the Vostok ice core, Antarctica, Nature, 399, 429–436, 1999.
Prospero, J. M., Ginoux, P., Torres, O., Nicholson, S. E., and Gill, T. E.: Environmental characterization of global sources of atmospheric soil dust identified with the Nimbus 7 Total Ozone Mapping Spectrometer (TOMS) absorbing aerosol product, Rev. Geophys., 40, 1002, https://doi.org/10.1029/2000RG000095, 2002.
Prospero, J. M., Barkley, A. E., Gaston, C. J., Gatineau, A., Sansano, A. C. Y., and Panechou, K.: Characterizing and Quantifying African Dust Transport and Deposition to South America: Implications for the Phosphorus Budget in the Amazon Basin, Global Biogeochem. Cy., 34, e2020GB006536, https://doi.org/10.1029/2020GB006536, 2020.
Randles, C. A., da Silva, A. M., Buchard, V., Colarco, P. R., Darmenov, A., Govindaraju, R., Smirnov, A., Holben, B., Ferrare, R., Hair, J., Shinozuka, Y., and Flynn, C. J.: The MERRA-2 Aerosol Reanalysis, 1980 Onward, Part I: System Description and Data Assimilation Evaluation, J. Climate, 30, 6823–6850, 2017.
Ridgwell, A. J. and Watson, A. J.: Feedback between aeolian dust, climate, and atmospheric CO2 in glacial time, Paleoceanography, 17, 1059, https://doi.org/10.1029/2001PA000729, 2002.
Ridley, D. A., Heald, C. L., and Ford, B.: North African dust export and deposition: A satellite and model perspective, J. Geophys. Res.-Atmos., 117, D02202, https://doi.org/10.1029/2011JD016794, 2012.
Ridley, D. A., Heald, C. L., Pierce, J. R., and Evans, M. J.: Toward resolution-independent dust emissions in global models: Impacts on the seasonal and spatial distribution of dust, Geophys. Res. Lett., 40, 2873–2877, 2013.
Ridley, D. A., Heald, C. L., Kok, J. F., and Zhao, C.: An observationally constrained estimate of global dust aerosol optical depth, Atmos. Chem. Phys., 16, 15097–15117, https://doi.org/10.5194/acp-16-15097-2016, 2016.
Rind, D., Orbe, C., Jonas, J., Nazarenko, L., Zhou, T., Kelley, M., Lacis, A., Shindell, D., Faluvegi, G., Romanou, A., Russell, G., Tausnev, N., Bauer, M., and Schmidt, G.: GISS Model E2.2: A Climate Model Optimized for the Middle Atmosphere-Model Structure, Climatology, Variability, and Climate Sensitivity, J. Geophys. Res.-Atmos., 125, e2019JD032204, https://doi.org/10.1029/2019JD032204, 2020.
Ryder, C. L., Highwood, E. J., Walser, A., Seibert, P., Philipp, A., and Weinzierl, B.: Coarse and giant particles are ubiquitous in Saharan dust export regions and are radiatively significant over the Sahara, Atmos. Chem. Phys., 19, 15353–15376, https://doi.org/10.5194/acp-19-15353-2019, 2019.
Sarangi, C., Qian, Y., Rittger, K., Leung, L. R., Chand, D., Bormann, K. J., and Painter, T. H.: Dust dominates high-altitude snow darkening and melt over high-mountain Asia, Nat. Clim. Change, 10, 1045–1051, https://doi.org/10.1038/s41558-020-00909-3, 2020.
Scanza, R. A., Mahowald, N., Ghan, S., Zender, C. S., Kok, J. F., Liu, X., Zhang, Y., and Albani, S.: Modeling dust as component minerals in the Community Atmosphere Model: development of framework and impact on radiative forcing, Atmos. Chem. Phys., 15, 537–561, https://doi.org/10.5194/acp-15-537-2015, 2015.
Schepanski, K., Tegen, I., Todd, M. C., Heinold, B., Bonisch, G., Laurent, B., and Macke, A.: Meteorological processes forcing Saharan dust emission inferred from MSG-SEVIRI observations of subdaily dust source activation and numerical models, J. Geophys. Res.-Atmos., 114, D10201, https://doi.org/10.1029/2008JD010325, 2009.
Schroth, A. W., Crusius, J., Sholkovitz, E. R., and Bostick, B. C.: Iron solubility driven by speciation in dust sources to the ocean, Nat. Geosci., 2, 337–340, 2009.
Seinfeld, J. H., Carmichael, G. R., Arimoto, R., Conant, W. C., Brechtel, F. J., Bates, T. S., Cahill, T. A., Clarke, A. D., Doherty, S. J., Flatau, P. J., Huebert, B. J., Kim, J., Markowicz, K. M., Quinn, P. K., Russell, L. M., Russell, P. B., Shimizu, A., Shinozuka, Y., Song, C. H., Tang, Y. H., Uno, I., Vogelmann, A. M., Weber, R. J., Woo, J. H., and Zhang, X. Y.: ACE-ASIA – Regional climatic and atmospheric chemical effects of Asian dust and pollution, B. Am. Meteorol. Soc., 85, 367–380, 2004.
Shao, Y.: A model for mineral dust emission, J. Geophys. Res.-Atmos., 106, 20239–20254, 2001.
Shao, Y. P.: Physics and Modelling of Wind Erosion, Springer, Heidelberg, Germany, 2008.
Shao, Y. P., Wyrwoll, K. H., Chappell, A., Huang, J. P., Lin, Z. H., McTainsh, G. H., Mikami, M., Tanaka, T. Y., Wang, X. L., and Yoon, S.: Dust cycle: An emerging core theme in Earth system science, Aeolian Res., 2, 181–204, 2011.
Shao, Y. P., Klose, M., and Wyrwoll, K. H.: Recent global dust trend and connections to climate forcing, J. Geophys. Res.-Atmos., 118, 11107–11118, 2013.
Sharma, D. and Miller, R. L.: Revisiting the observed correlation between weekly averaged Indian monsoon precipitation and Arabian Sea aerosol optical depth, Geophys. Res. Lett., 44, 10006–10016, 2017.
Shi, Y. and Liu, X. H.: Dust Radiative Effects on Climate by Glaciating Mixed-Phase Clouds, Geophys. Res. Lett., 46, 6128–6137, 2019.
Shimizu, A., Nishizawa, T., Jin, Y., Kim, S. W., Wang, Z. F., Batdorj, D., and Sugimoto, N.: Evolution of a lidar network for tropospheric aerosol detection in East Asia, Opt. Eng., 56, 031219, https://doi.org/10.1117/1.OE.56.3.031219, 2017.
Shindell, D. T., Lamarque, J.-F., Schulz, M., Flanner, M., Jiao, C., Chin, M., Young, P. J., Lee, Y. H., Rotstayn, L., Mahowald, N., Milly, G., Faluvegi, G., Balkanski, Y., Collins, W. J., Conley, A. J., Dalsoren, S., Easter, R., Ghan, S., Horowitz, L., Liu, X., Myhre, G., Nagashima, T., Naik, V., Rumbold, S. T., Skeie, R., Sudo, K., Szopa, S., Takemura, T., Voulgarakis, A., Yoon, J.-H., and Lo, F.: Radiative forcing in the ACCMIP historical and future climate simulations, Atmos. Chem. Phys., 13, 2939–2974, https://doi.org/10.5194/acp-13-2939-2013, 2013.
Skiles, S. M., Flanner, M., Cook, J. M., Dumont, M., and Painter, T. H.: Radiative forcing by light-absorbing particles in snow, Nat. Clim. Change, 8, 964–971, https://doi.org/10.1038/s41558-018-0296-5, 2018.
Song, Q., Zhang, Z., Yu, H., Ginoux, P., and Shen, J.: Global Dust Optical Depth Climatology Derived from CALIOP and MODIS Aerosol Retrievals on Decadal Time Scales: Regional and Interannual Variability, Atmos. Chem. Phys. Discuss. [preprint], https://doi.org/10.5194/acp-2021-1, in review, 2021.
Souney, J. M., Mayewski, P. A., Goodwin, I. D., Meeker, L. D., Morgan, V., Curran, M. A. J., van Ommen, T. D., and Palmer, A. S.: A 700-year record of atmospheric circulation developed from the Law Dome ice core, East Antarctica, J. Geophys. Res.-Atmos., 107, 4608, https://doi.org/10.1029/2002JD002104, 2002.
Stanelle, T., Bey, I., Raddatz, T., Reick, C., and Tegen, I.: Anthropogenically induced changes in twentieth century mineral dust burden and the associated impact on radiative forcing, J. Geophys. Res.-Atmos., 119, 13526–13546, 2014.
Storelvmo, T.: Aerosol Effects on Climate via Mixed-Phase and Ice Clouds, Annu. Rev. Earth Pl. Sc., 45, 199–222, 2017.
Swap, R., Garstang, M., Greco, S., Talbot, R., and Kallberg, P.: Saharan dust in the amazon basin, Tellus B, 44, 133–149, 1992.
Tai, A., Ma, P. H. L., Chan, Y.-C., Chow, M.-K., Ridley, D. A., and Kok, J. F.: Impacts of climate and land cover variability and trends on springtime East Asian dust emission over 1982–2010: A modeling study, Atmos. Environ., 254, 118348, https://doi.org/10.1016/j.atmosenv.2021.118348, 2021.
Tanaka, T. Y. and Chiba, M.: A numerical study of the contributions of dust source regions to the global dust budget, Global Planet. Change, 52, 88–104, 2006.
Tegen, I., Werner, M., Harrison, S. P., and Kohfeld, K. E.: Relative importance of climate and land use in determining present and future global soil dust emission, Geophys. Res. Lett., 31, L05105, https://doi.org/10.1029/2003GL019216, 2004.
van der Does, M., Knippertz, P., Zschenderlein, P., Harrison, R. G., and Stuut, J. B. W.: The mysterious long-range transport of giant mineral dust particles, Science Advances, 4, eaau2768, https://doi.org/10.1126/sciadv.aau2768, 2018.
van der Does, M., Brummer, G. J. A., van Crimpen, F. C. J., Korte, L. F., Mahowald, N. M., Merkel, U., Yu, H. B., Zuidema, P., and Stuut, J. W.: Tropical Rains Controlling Deposition of Saharan Dust Across the North Atlantic Ocean, Geophys. Res. Lett., 47, e2019GL086867, https://doi.org/10.1029/2019GL086867, 2020.
Vergara-Temprado, J., Miltenberger, A. K., Furtado, K., Grosvenor, D. P., Shipway, B. J., Hill, A. A., Wilkinson, J. M., Field, P. R., Murray, B. J., and Carslaw, K. S.: Strong control of Southern Ocean cloud reflectivity by ice-nucleating particles, P. Natl. Acad. Sci. USA, 115, 2687–2692, 2018.
Vinoj, V., Rasch, P. J., Wang, H. L., Yoon, J. H., Ma, P. L., Landu, K., and Singh, B.: Short-term modulation of Indian summer monsoon rainfall by West Asian dust, Nat. Geosci., 7, 308–313, 2014.
Warren, A., Chappell, A., Todd, M. C., Bristow, C., Drake, N., Engelstaedter, S., Martins, V., M'Bainayel, S., and Washington, R.: Dust-raising in the dustiest place on earth, Geomorphology, 92, 25–37, 2007.
Washington, R., Bouet, C., Cautenet, G., Mackenzie, E., Ashpole, I., Engelstaedter, S., Lizcano, G., Henderson, G. M., Schepanski, K., and Tegen, I.: Dust as a tipping element: The Bodele Depression, Chad, P. Natl. Acad. Sci. USA, 106, 20564–20571, 2009.
Weinzierl, B., Ansmann, A., Prospero, J., Althausen, D., Benker, N., Chouza, F., Dollner, M., Farrell, D., Fomba, W., Freudenthaler, V., Gasteiger, J., Groß, S., Haarig, M., Heinold, B., Kandler, K., Kristensen, T., Mayol-Bracero, O., Müller, T., Reitebuch, O., Sauer, D., Schäfler, A., Schepanski, K., Spanu, A., Tegen, I., Toledano, C., and Walser, A.: The Saharan Aerosol Long-range Transport and Aerosol-Cloud Interaction Experiment (SALTRACE): overview and selected highlights, B. Am. Meteorol. Soc., 98, 1427–1451, 2017.
Wong, L. T. and Chow, W. K.: Solar radiation model, Appl. Energ., 69, 191–224, 2001.
Wu, C., Lin, Z., and Liu, X.: The global dust cycle and uncertainty in CMIP5 (Coupled Model Intercomparison Project phase 5) models, Atmos. Chem. Phys., 20, 10401–10425, https://doi.org/10.5194/acp-20-10401-2020, 2020.
Xu, H., Zheng, F. J., and Zhang, W. H.: Variability in Dust Observed over China Using A-Train CALIOP Instrument, Adv. Meteorol., 11, 1246590, https://doi.org/10.1155/2016/1246590, 2016.
Yorks, J. E., McGill, M. J., Scott, V. S., Wake, S. W., Kupchock, A., Hlavka, D. L., Hart, W. D., and Selmer, P. A.: The Airborne Cloud-Aerosol Transport System: Overview and Description of the Instrument and Retrieval Algorithms, J. Atmos. Ocean. Tech., 31, 2482–2497, 2014.
Yu, H. B., Chin, M., Winker, D. M., Omar, A. H., Liu, Z. Y., Kittaka, C., and Diehl, T.: Global view of aerosol vertical distributions from CALIPSO lidar measurements and GOCART simulations: Regional and seasonal variations, J. Geophys. Res.-Atmos., 115, 7975–7996, https://doi.org/10.1029/2019JD030574, 2010.
Yu, H. B., Chin, M., Yuan, T. L., Bian, H. S., Remer, L. A., Prospero, J. M., Omar, A., Winker, D., Yang, Y. K., Zhang, Y., Zhang, Z. B., and Zhao, C.: The fertilizing role of African dust in the Amazon rainforest: A first multiyear assessment based on data from Cloud-Aerosol Lidar and Infrared Pathfinder Satellite Observations, Geophys. Res. Lett., 42, 1984–1991, 2015.
Yu, H. B., Tan, Q., Chin, M., Remer, L. A., Kahn, R. A., Bian, H. S., Kim, D., Zhang, Z. B., Yuan, T. L., Omar, A. H., Winker, D. M., Levy, R. C., Kalashnikova, O., Crepeau, L., Capelle, V., and Chedin, A.: Estimates of African Dust Deposition Along the Trans-Atlantic Transit Using the Decadelong Record of Aerosol Measurements from CALIOP, MODIS, MISR, and IASI, J. Geophys. Res.-Atmos., 124, 7975–7996, 2019.
Yu, Y., Kalashnikova, O. V., Garay, M. J., Lee, H., Notaro, M., Campbell, J. R., Marquis, J., Ginoux, P., and Okin, G. S.: Disproving the Bodele Depression as the Primary Source of Dust Fertilizing the Amazon Rainforest, Geophys. Res. Lett., 47, e2020GL088020, https://doi.org/10.1029/2020GL088020, 2020.
Zhang, Y., Mahowald, N., Scanza, R. A., Journet, E., Desboeufs, K., Albani, S., Kok, J. F., Zhuang, G., Chen, Y., Cohen, D. D., Paytan, A., Patey, M. D., Achterberg, E. P., Engelbrecht, J. P., and Fomba, K. W.: Modeling the global emission, transport and deposition of trace elements associated with mineral dust, Biogeosciences, 12, 5771–5792, https://doi.org/10.5194/bg-12-5771-2015, 2015.