the Creative Commons Attribution 4.0 License.
the Creative Commons Attribution 4.0 License.
 | 20 May 2021
Variability of NO2 concentrations over China and effect on air quality derived from satellite and ground-based observations
Cheng Fan
Zhengqiang Li
Ying Li
Jiantao Dong
Ronald van der A
Gerrit de Leeuw
The variation of NO2 concentrations in mainland China is analyzed on different timescales, from decadal to weekly, using both satellite data and data from ground-based monitoring networks. TROPOMI (TROPOspheric Monitoring Instrument) data were used to study the spatial variations of tropospheric NO2 vertical column densities (TVCDs) over the study area during 16–20 weeks after the Chinese Spring Festival (25 January 2020). These data were used to select 11 regions for more detailed analysis of the variation of NO2 TVCDs on a decadal timescale. In this analysis, monthly and annual averaged NO2 TVCDs derived from OMI (Ozone Monitoring Instrument) observations were used for the years 2011 to 2019. The results show the NO2 TVCD trends for different regions, all decreasing in response to emission reduction policies but with a different onset and a possible halt of the decrease in recent years; trends and period in the south of the study area are different from those in the north. Variations of NO2 TVCDs on shorter timescales, monthly and weekly, were analyzed using TROPOMI data. In addition, the variations of weekly-averaged ground-based NO2 concentrations in 11 major cities were analyzed together with those for O3 and PM2.5. In particular these data were used to determine their effect on the air quality as expressed by the air quality index (AQI). For quantitative estimates, the use of weekly concentrations is more accurate than the use of monthly values, and the effects of long-term trends and their reversal needs to be taken into account for the separation of effects of the lockdown and the Spring Festival. Neglecting the possible reversal of the trends leads to overestimation of the lockdown effect in the south and underestimation in the north. The ground-based data confirm earlier reports, based on satellite observations, that the expected improvement of air quality due to the reduction of NO2 concentrations was offset by the increase of the concentrations of O3 and the different effects of the lockdown measures on PM2.5, as well as effects of meteorological influences and heterogeneous chemistry. The AQI seems to be mostly influenced by PM2.5 rather than NO2. A qualitative comparison between time series of satellite and ground-based NO2 observations shows both similarities and differences. The study further shows the different behaviors in city clusters in the north and south of China, as well as inland in the Sichuan and Guanzhong basins. Effects of other holidays and events are small, except in Beijing where the air quality in 2020 was notably better than in previous years. This study was undertaken for China, but the methodology and results have consequences for air quality studies in other areas, and part of the conclusions are generally applicable.
- Article
(13570 KB) - Full-text XML
- BibTeX
- EndNote


Concentrations of aerosols and trace gases in the atmosphere over China have been increasing in response to industrial development and urbanization and are among the highest worldwide. However, during the last decade, air pollution control strategies were implemented as part of a series of government plans to reduce the concentrations of pollutants (Jin et al., 2016; van der A et al., 2017; Zheng, 2018) and thus improve air quality. Indeed, the concentrations of SO2, NO2 and aerosols decreased and the trends, from the onset of the reduction until recent years, have been quantified using satellite observations (Krotkov et al., 2016; Koukouli et al., 2016; van der A et al., 2017; de Leeuw et al., 2018; Sogacheva et al., 2018; Zhao et al., 2017; Zhang et al., 2018). In addition, an unprecedented reduction of the concentrations of NO2 was observed at the end of January 2020, by the TROPOspheric Monitoring Instrument (TROPOMI), on board the Copernicus Sentinel-5 Precursor satellite, following the nationwide lockdown in response to the COVID-19 outbreak (e.g., Fan et al., 2020a; Liu et al., 2020; Bauwens et al., 2020). The decrease of anthropogenic NO2 emissions in early 2020 was quantified by, for example, Ding et al. (2020) and Zhang et al. (2020a). In response to the reduction of the NO2 emissions, observations at ground-based monitoring stations showed the increase of O3 concentrations (e.g., Fan et al., 2020a; Shi and Brasseur, 2020; Le et al., 2020), indicating the increase of the oxidizing capacity of the atmosphere (e.g., Huang et al., 2020; Diamond and Wood, 2020; Le et al., 2020; Zhao et al., 2020). The increased oxidizing capacity of the atmosphere resulted in the increase of secondary aerosol formation which in part explains the increase of the aerosol optical depth (AOD) over the North China Plain (NCP), observed from satellites (e.g., Fan et al., 2020a; Huang et al., 2020; Le et al., 2020; Diamond and Wood, 2020), and the concentrations of PM2.5 observed in situ by ground-based monitoring networks (e.g., Fan et al., 2020a; Shi and Brasseur, 2020; Le et al., 2020). Over the NCP, aerosol formation was further promoted by meteorological conditions like low wind speed and high relative humidity, which is conducive to the formation of haze (e.g., Zhao et al., 2020). Furthermore, aerosol emissions were much less affected by the lockdown than NO2 (Diamond and Wood, 2020). Hence, different species contributing to air pollution were affected by the lockdown in different ways. Several authors concluded that, in spite of the strong reduction of anthropogenic emissions, pollution still occurred over China due to the combination of meteorological influences, economic impacts and complex chemistry (e.g., Shi and Brasseur, 2020; Huang et al., 2020; Diamond and Wood, 2020; Le et al., 2020; Zhao et al., 2020; Li et al., 2020).
In the current study we examine the evolution of the concentrations of tropospheric NO2 in China over the last 10 years, until mid-2020. To this end, we extend satellite-derived time series of tropospheric NO2 vertical column densities (NO2 TVCDs) derived from satellite observations using the Ozone Monitoring Instrument (OMI) from 2011 to 2019, which provides insights into the effects of pollution control strategies in different parts of China during recent years. The sudden reduction of the concentrations of NO2 and other atmospheric constituents due to the unfortunate lockdown following the COVID-19 outbreak in China provided another way to look at emission reductions and the recovery of the concentrations when the lockdown was gradually relaxed. The latter extends earlier work presented in Fan et al. (2020a) on the concentrations of trace gases and aerosols during the Chinese Spring Festival (25 January 2020) and the initial phase of the lockdown during the following month. It is noted that the lockdown started during the Spring Festival holidays, during which concentrations of trace gases and aerosols usually change in response to changing socioeconomic conditions during 1–2 weeks. This Spring Festival holiday effect was enhanced and extended over a longer period of time due to the lockdown. In the current study we focus on the variations of NO2 concentrations both in the years before the 2020 Spring Festival and during an extended period of 16–20 weeks thereafter, for reasons explained below.
In Fan et al. (2020a) we considered all species contributing to the air quality index (AQI; see Appendix A for definition), a measure used in air quality management. However, air quality, or the AQI, was not directly considered in Fan et al. (2020a), so we only looked at the change of the concentrations of PM2.5, PM10, NO2, SO2, CO and O3 due to the lockdown. For all species, we used satellite data (TROPOMI), except for tropospheric O3 which is not available over China from TROPOMI, and ground-based monitoring observations. TROPOMI data were used for 2019 and 2020 as monthly averages for the period before and after the Spring Festival in these years. The changes resulting from reduced anthropogenic activities during the Spring Festival holidays in 2019 were used as reference to separate the lockdown effect from the overall reduction during the period including both the Spring Festival and the lockdown in the winter of 2020. We concluded that the use of 30 d averages leads to underestimation of the Spring Festival effect and overestimation of the COVID-19 lockdown effect and that for more reliable estimates shorter periods should be used. Therefore, in the current study, weekly maps of tropospheric NO2 vertical column densities (NO2 TVCDs) were produced as a compromise between increased time resolution, showing the progressive decrease of the concentrations, and data quality. In Fan et al. (2020a) we concluded that the TROPOMI SO2 data showed the reduction of SO2, but the signal was too noisy to deduce a clear quantitative effect, while we also showed that the lockdown did not have a clear effect on the CO TVCDs (except in the south of China). Therefore, and because of the interactions between NO2, O3 and aerosols, the current study focuses on these three species, using both satellite data and ground-based data from air quality monitoring stations. Instead of the 26 provincial capitals, 11 areas in different parts of China were selected where satellite data showed large changes in the NO2 TVCDs.
When the lockdown measures were gradually relaxed, the emissions and thus air pollution increased. Several studies reported that air quality was “back to normal” after 40 d (Bauwens et al., 2020; Filonchyk et al., 2020; Wang and Su, 2020). In the current study we address the question of what is “normal”, using satellite observations over the last decade over selected regions, extending to 16–20 weeks after the 2020 Spring Festival. In addition to satellite data, we use ground-based observations from the Chinese air quality monitoring network, providing detailed information in different regions, and compare those for 2020 with similar observations in the last 5 years (2015–2019). The reason for this study is the gradual decrease of NO2 TVCDs and AOD during extended periods in the last decade, as mentioned above, in response to policy measures by the Chinese Government to reduce emissions and improve air quality. In the estimates of the lockdown effects on air pollution such trends were accounted for by comparison of 2020 with the previous year or years. However, the NO2 TVCDs in early 2020, before the Spring Festival, were much lower than those in 2019, and the question of whether the trends derived in earlier studies were continued in more recent years arose. In other words, how well can the expected baseline concentrations, serving as reference to determine the reduction of the concentrations during the lockdown period with respect to the normal situation, be determined?
Another question was whether air quality (AQ) was really improved, in spite of the enormous reduction of NO2 as observed by satellites and confirmed by ground-based monitoring networks. As discussed above, in response to the reduced NO2 concentrations shifting the oxidizing capacity, surface O3 concentrations increased, and also aerosol concentrations were affected or even increased over the NCP. Taking into account the different behavior of NO2, O3 and PM2.5, the question arose what the effect of the lockdown was on the air quality, as expressed by the air quality index and how AQ or AQI reacted to the gradual release of the socioeconomic restrictions.
The objectives of the current study are thus (1) to extend the time series from previous studies to evaluate whether earlier trends continued and can be used to determine baseline concentrations; (2) to determine whether the air quality was indeed improved as much as anticipated from the reduction of NO2 TVCDs deduced from satellite observations; and (3) to evaluate whether the pollutant concentrations had returned to normal levels during the study period of 16–20 weeks after the COVID-19 outbreak, i.e., during the gradual relaxation of the lockdown measures when socioeconomic life returned to normal. During these 19 weeks, two significant events occurred in China: the Tomb-Sweeping Festival (4–6 April) and the May holidays (1–5 May). In addition the National Congress of the Chinese Communist Party (referred to as Party Congress hereafter) took place in Beijing (21–28 May). How did these events influence the air quality?
These objectives are addressed by studying satellite measurements of NO2 TVCDs and ground-based monitoring data of PM2.5, NO2 and O3, as well as the air quality index (AQI). Differences between satellite observations and ground-based monitoring NO2 data are discussed based on weekly time series during early 2020. Time series of monthly-averaged NO2 TVCDs for the period 2011–2020 are used, as well as weekly averages in 2020. The study focuses on 11 regions in China, mainly around provincial capitals, selected based on the NO2 TVCD levels at about 3 months after the 2020 Spring Festival. It is noted that the methodology and part of the ensuing results have generally applicability and do not only apply over China.
2.1 Study area
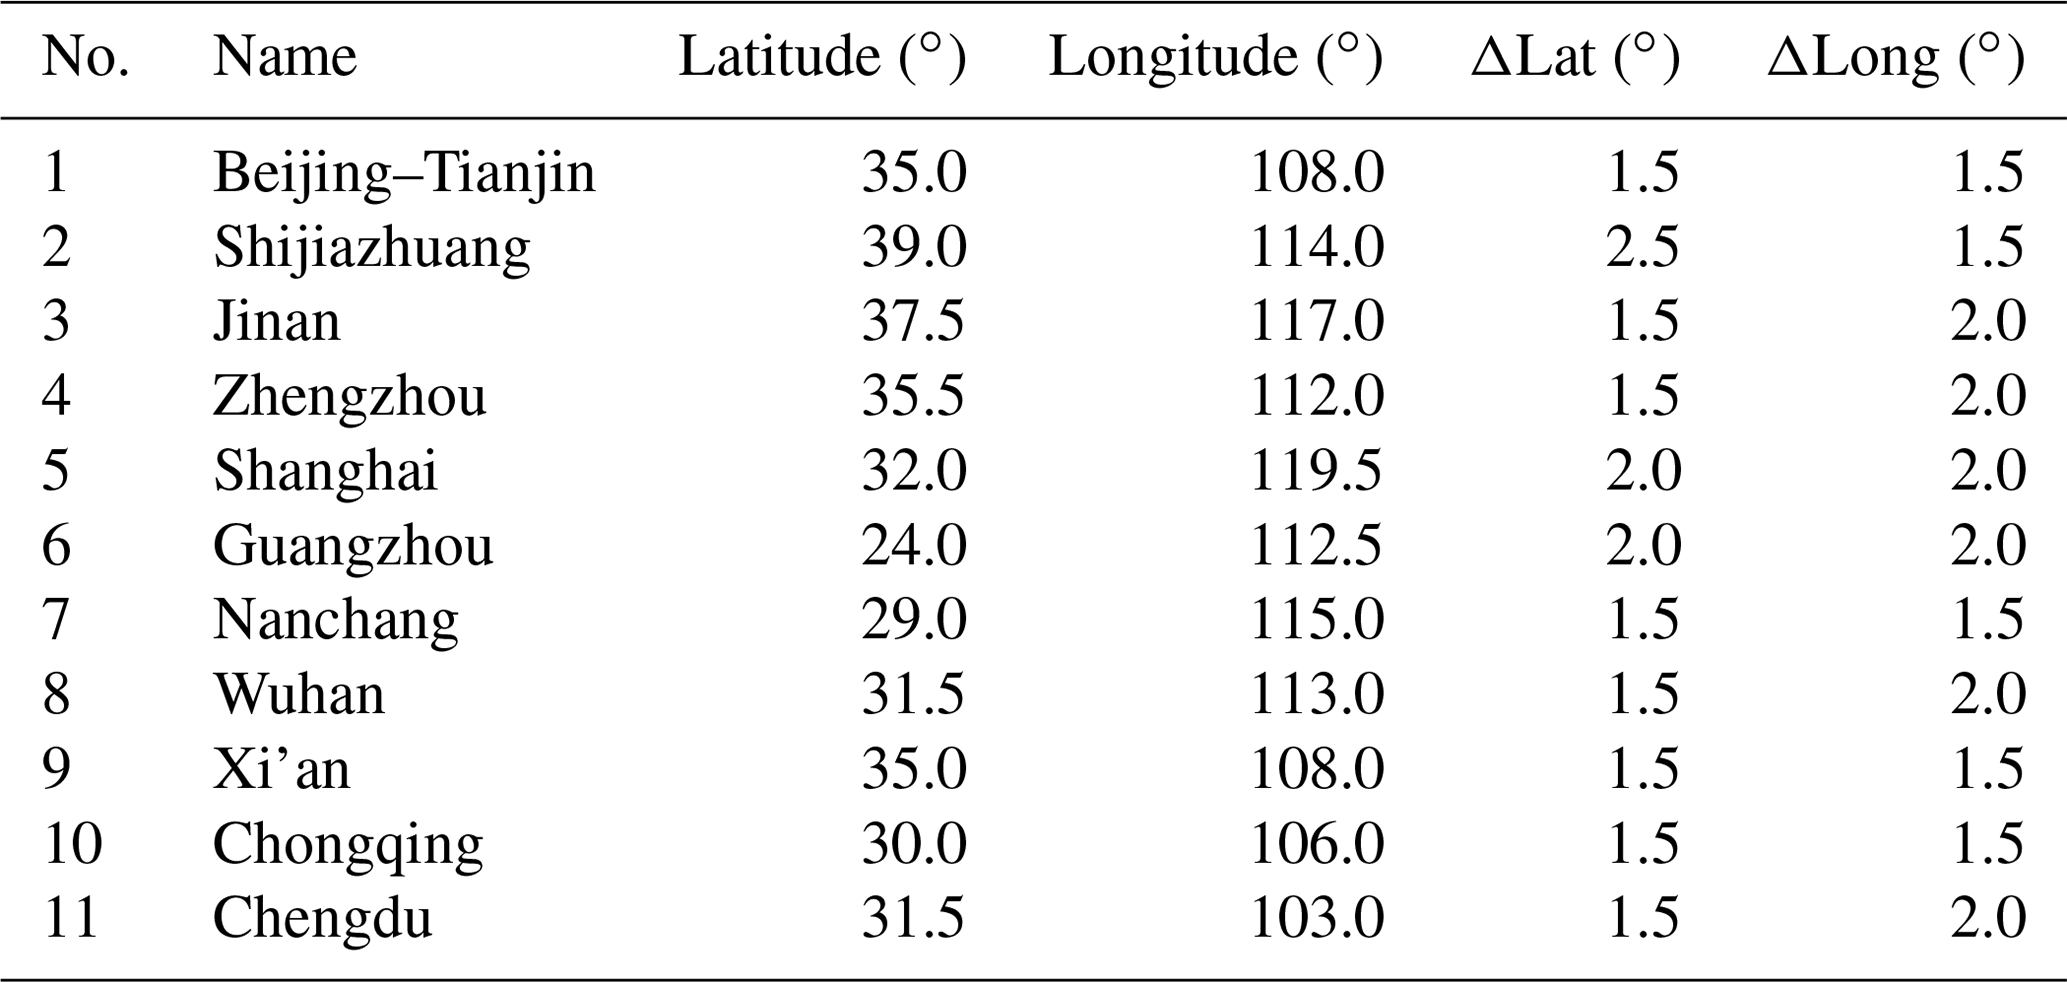
In the current study we focus on the part of mainland China east of the Hu line (Fig. 1), further referred to in this paper as east China, where 94 % of the Chinese population lives (Chen et al., 2016). This part of China is one of the most polluted regions in the world, for which the air quality was much improved during the COVID-19 lockdown. To monitor the rebound of the concentrations when the lockdown measures were gradually released, maps were used of weekly averages of NO2 TVCDs derived from TROPOMI (see Sect. 3.1.2, Fig. 5) and their differences with respect to week 0, i.e., the Spring Festival week from 25 to 31 January, 2020 (week numbers are listed in Table A1; difference maps are presented in Fig. A3). The difference map for week 12 is shown in Fig. 1 (week 12 was somewhat arbitrarily selected at the end of a period of 5 weeks when concentrations seemed to be stabilized and undisturbed by other festivals, as discussed in Sect. 3.1.2). The yellow background in this map indicates no changes with respect to week 0, red indicates an increase and green indicates a decrease of the NO2 TVCD. Based on the occurrence of a strong increase or decrease, 11 regions were selected for the study on regional differences in which satellite data are complemented with ground-based data. The names of the regions shown in Fig. 1 are listed in Table 1, together with their geographical locations. These regions include well-known centers such as the Beijing–Tianjin area, Shijiazhuang in west Hebei, and Jinan in Shandong, all in the North China Plain (NCP); Shanghai in the Yangtze River Delta (YRD); Guangzhou in the Pearl River Delta (PRD); Chongqing and Chengdu; and Wuhan. Each region includes a large city for which monitoring data are available for comparison with the satellite data (Fan et al., 2020a). The selected regions provide a reasonable geographical spread across the study area with the NCP, the YRD and the PRD, as well as mountain areas with large basins such as the Chongqing/Sichuan and the Guanzhong basins, all with high pollution levels, high population density and high level of industrialization but with different climatological and meteorological influences on air quality.
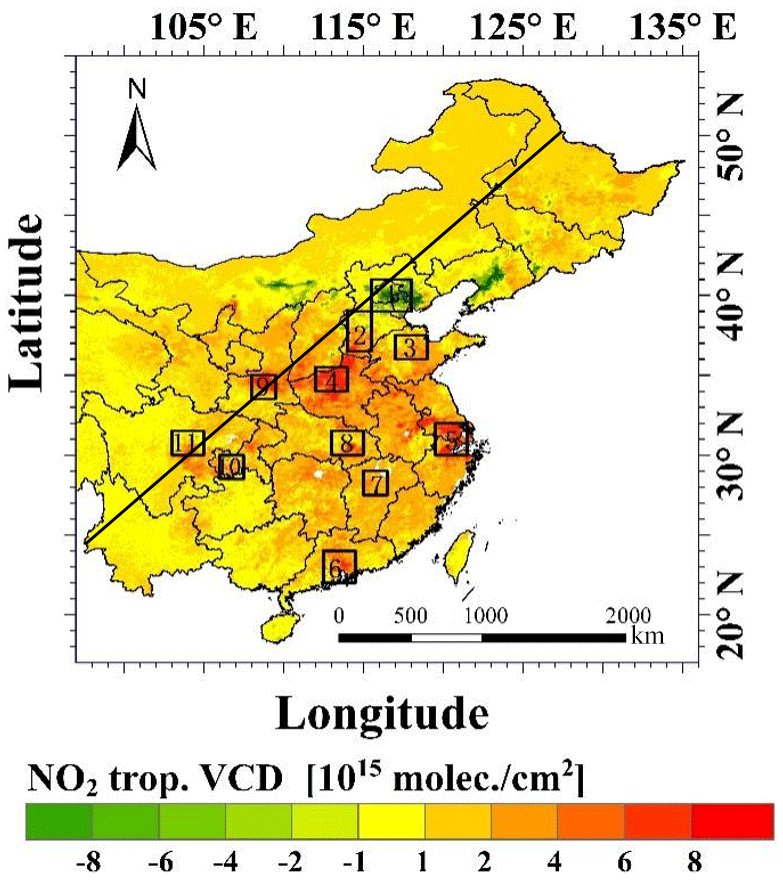
Figure 1Study area showing the NO2 TVCD difference map for week 12 (i.e., NO2 TVCD for week 12 minus NO2 TVCD for week 0). The 11 focus regions are indicated with numbers, corresponding to their names and coordinates which are listed in Table 1. The black diagonal line is the Hu line (Chen et al., 2016).
Table 1Focus regions of the current study. The locations corresponding to the numbers in the first column are shown on the map in Fig. 1. Coordinates in columns 3 and 4 are for the upper left corner of each region; the size around the corner of each region is indicated in columns 5 and 6. Regions are indicated with the name of the central city.
2.2 Satellite data
Two satellite products were used in this study, i.e., the tropospheric NO2 vertical column densities (NO2 TVCDs) from OMI and TROPOMI. These products are briefly discussed in the following subsections. The OMI NO2 TVCDs were used for time series analysis over the period 2011–2019, during most of which TROPOMI data were not yet available. The TROPOMI NO2 TVCDs, with better spatial resolution, were used to visualize weekly-averaged spatial variations and calculate time series over selected regions, which together show the evolution of NO2 TVCDs over the study area. OMI and TROPOMI products thus provide complementary information for different periods of time and were used for different purposes.
2.2.1 OMI
The Ozone Monitoring Instrument (OMI) on board NASA's Aura satellite was launched in July 2004 (Schoeberl et al., 2006; Levelt et al., 2018). Aura is in a Sun-synchronous polar orbit with an Equator-crossing time at 13:30 LT (local time). The OMI instrument employs hyperspectral imaging in a push-broom mode to observe solar radiation backscattered by the Earth's atmosphere and surface at 740 wavelengths over the entire range from 270 to 500 nm with a spectral resolution of about 0.5 nm (https://projects.knmi.nl/omi/research/instrument/index.php, last access: 30 January 2021). With a 2600 km wide swath, OMI provides daily global coverage in 14 orbits. In this study the OMI Quality Assurance for Essential Climate Variance (QA4ECV) version 1.1 product (https://doi.org/10.21944/qa4ecv-no2-omi-v1.1) with a 13 km×24 km spatial resolution is used (Boersma et al., 2018). This product was validated by, for example, Lorente et al. (2017) and Zara et al. (2018). The measurement of NO2 is one of the explicit objectives of the Aura OMI mission. The monthly-mean tropospheric NO2 column density data are derived from satellite observations based on slant column NO2 retrievals with the differential optical absorption spectroscopy (DOAS) technique and the KNMI combined modeling/retrieval/assimilation approach (Boersma et al., 2011). NO2 TVCDs for the years 2011–2019 were downloaded from the following website: http://www.temis.nl/airpollution/no2.html (last access: 30 January 2021).
2.2.2 TROPOMI
TROPOMI is a passive hyperspectral nadir-viewing imager on board the Sentinel-5 Precursor satellite (also known as Sentinel-5P) launched on 13 October 2017 (Veefkind et al., 2012). Sentinel-5P is a near-polar orbiting Sun-synchronous satellite flying at an altitude of 817 km in an ascending node with an Equator-crossing time at 13:30 LT and a repeat cycle of 17 d. The swath width is approximately 2600 km, resulting in daily global coverage, with an along-track resolution of 7 km (Veefkind et al., 2012). TROPOMI products used in this study are L3 offline (OFFL) version products (see http://www.TROPOMI.eu/data-products/ for more detail), in particular tropospheric NO2 vertical column density data for the period around the 2020 Spring Festival. The spatial resolution at nadir for most products used in this study is 1 km (https://developers.google.com/earth-engine/guides/scale; last access: 30 January 2021).
The operational validation results are reported every 3 months at the S5P-MPC-VDAF website (http://mpc-vdaf.TROPOMI.eu/, last access: 30 January 2021). The TROPOMI/S5P tropospheric NO2 column is operationally validated by the S5P-MPC-VDAF (S5P – Mission Performance Centre – Validation Data Analysis Facility) using the Pandora NO2 total columns from the Pandonia Global Network (PGN). The comparison shows a negative bias of roughly 30 %.
2.3 Ground-based data
The ground-based data used in this study were downloaded from http://www.pm25.in/ (last access: 30 January 2021), which is the National Real-time Air Quality Publishing Platform public website for air quality monitoring data maintained by the China National Environmental Monitoring Center (CNEMC) of the Ministry of Ecology and Environment of China (MEE; see http://www.mee.gov.cn/, last access: 30 January 2021, for more detail). This website provides PM2.5, PM10, SO2, NO2, O3 and CO hourly and 24 h moving averages for each site or city. Measurement techniques used at the stations, reliability of the data and quality control were briefly described by Silver et al. (2018) and Zhai et al. (2019); see also Ministry of Environmental Protection of People's Republic of China (MEE, 2012). The data from these websites are provided by local governments and have been used in several studies related to air pollution, air quality and other aspects in China (Xue et al., 2020; Fan et al., 2020a, b) (http://www.pm25.in/sharer, last access: 30 January 2021). For the current study, we collected hourly PM2.5, NO2 and O3 data for the large cities in the 11 study regions indicated in Sect. 2.1 (Fig. 1, Table 1), for up to 20 weeks after the Spring Festival during the years 2015–2020. In the current study, the data collected at different locations in each city were averaged to get a spatially representative number for the whole city, as daily (24 h) averages, which subsequently were averaged to weekly values.
3.1 Satellite observations
3.1.1 NO2 TVCD time series and trends for different regions between 2011 and 2019
Monthly-mean NO2 TVCD time series
Time series of monthly-mean TVCDs for tropospheric NO2 derived from OMI data over the 11 regions defined in Table 1 are presented in Fig. 2, for the period from 1 January 2011 until 31 December 2019. The NO2 TVCDs varied strongly by region, with the highest TVCDs in Shijiazhuang, Zhengzhou and Jinan (in 2012), although the relative differences changed from year to year. For each region, the time series show the strong seasonal variations with sharp peaks in the winter and shallow minima in the summer. The winter TVCD maxima were about a factor of 5 larger than the summer minima, with the ratio varying somewhat by region, with higher values in Shijiazhuang (7.2) and Zhengzhou (6.0) and lowest values of about 2.5 in Guangzhou and Chengdu. These numbers are in reasonable agreement with the factor of 3 reported by Shah et al. (2020) for the NO2 TVCD averaged over central-east China.
On a monthly scale, the TVCD maximum varies a little between regions and years, but in general the peaks occur in the winter. For the study of lockdown effects (Sect. 3.1.2), the fast decrease of the NO2 TVCDs from December/January toward the summer implies that, if there would be no restrictions, the NO2 TVCDs would have decreased by a factor of 2.5–7, depending on the region, from the pre-lockdown period to the time when all measures were released. This needs to be taken into account in any study on the effect on air quality during different stages of the COVID-19 lockdown.
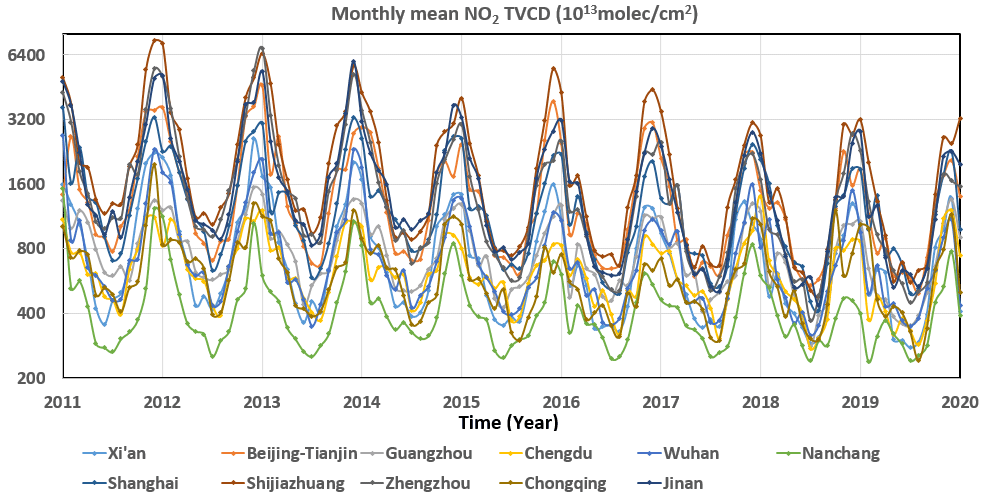
Figure 2Time series of monthly-mean NO2 TVCDs derived from OMI data, for 11 regions from January 2011 to December 2019. The NO2 TVCDs are plotted on a logarithmic scale to better visualize the differences between different regions as well as the gradual variation of the TVCDs during the summer months.
Trends of annually-averaged tropospheric NO2 TVCDs
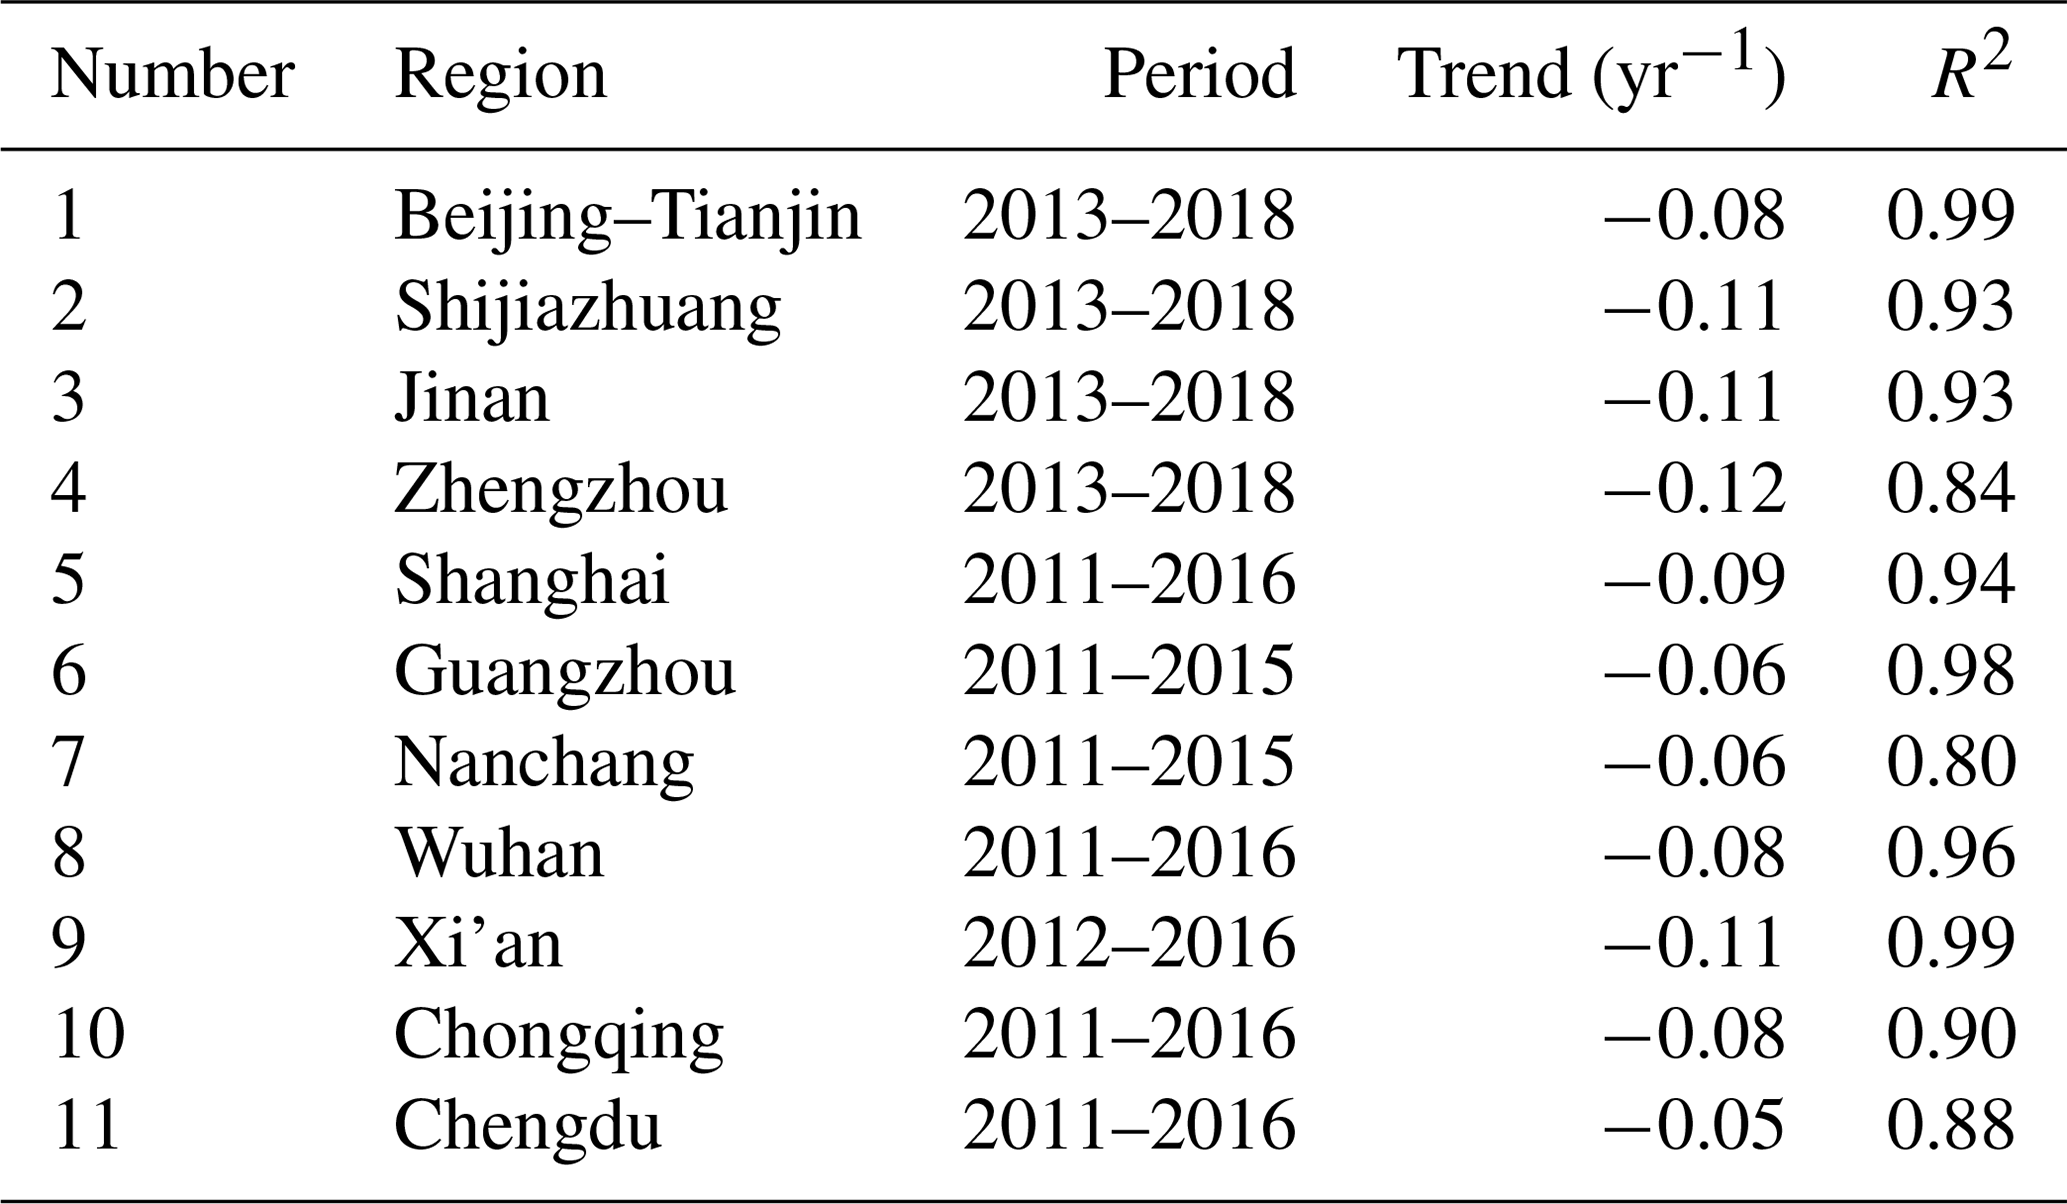
Figure 2 shows an overall decrease of the winter-peak TVCDs between 2012 and 2017, whereas in the years 2017–2019 they are of similar magnitude, i.e., the decrease seems to have come to a halt. Similar behavior is observed in the summer months. However, the time series suggest that the period of decreasing NO2 TVCDs and the occurrence of the maximum and minimum values was not the same for all regions. To further investigate trends in different regions and the differences between them, the time series were de-seasonalized using a centered moving average with a period of 12 months, and, to reduce effects of variations due to other influences than the seasonal effects (e.g., due to meteorological conditions), the de-seasonalized data were averaged to annual mean NO2 TVCDs. Time series of annual mean NO2 TVCDs are presented in Fig. A1. The data in Fig. A1 show a grouping with high NO2 TVCDs in the north of the study area and Shanghai and a clear separation from the other regions where the TVCDs are lower, as also expected from the maps in, for example, Fig. 4a. Another noticeable difference between the regions is the clear distinction between the temporal behavior in the north and in the south. In each of the regions in the north, i.e., in the NCP (Shijiazhuang, Beijing, Jinan and Zhengzhou), the TVCDs were similar in 2011, 2012 and 2013; from 2013 they decreased exponentially until 2018. In the other regions, i.e., Shanghai and those in the south and west, the TVCDs decreased exponentially from 2011 until they reached a minimum value in 2015 or 2016 after which they remained low (e.g., Shanghai, Nanchang, Xi'an) or even increased somewhat (Chongqing). Overall, after 2016 the TVCDs in these regions fluctuated from year to year but remained within 10 % of the values in 2015 (except in Chongqing). In view of these differences, trend lines fitted to the annual mean NO2 TVCD data in regions in the north were fitted for the years 2013–2018, whereas for the other regions trend lines were fitted for the years 2011–2015 or 2016. The trend lines were added to Fig. A1, and the result is presented in Fig. 3. The trend lines were plotted for the whole period 2011–2019 rather than only for their period of validity, to illustrate that beyond the fit interval the TVCDs do not follow the trend for the region under consideration and level off as discussed above. The trends are presented in Table 2, where the trend (yr−1) describes an exponential decrease of the TVCDs following the relationship , where y = TVCD, a is the intercept (TVCD in first year of the fitting period, i.e., year1 = 2011 or 2013), b is the trend (yr−1) and t is the number of years after year1. Coefficients of determination (R2) are all high and the trend lines in Fig. 3 show the good fit.

Figure 3Time series of annual mean NO2 TVCDs, derived from de-seasonalized monthly OMI data, for each of the 11 regions, which are plotted on a semilogarithmic scale and fitted with exponential trend lines (solid lines, ). The periods and trends are listed in Table 2. The data points for each region are connected with dashed lines for easy identification. Note that the trend lines strictly apply only to the different periods as described in the text and listed in Table 2 but were plotted over the whole period 2011–2019 to demonstrate the deviations from the trends beyond the period of validity.
Tropospheric NO2 TVCD time series during the winter months
Having established that the annually-averaged TVCDs decrease exponentially during a certain period of time and change little during more recent years (after 2015/2016, in the southern regions) or the last year (2019, in the northern regions), we need to determine whether these conclusions also apply to shorter periods of time during which effects of the lockdown on the concentrations of atmospheric trace gases are studied. As a compromise between high time resolution and reducing meteorological effects on concentration differences, monthly-averaged NO2 TVCDs were selected and plotted as time series for the 11 study areas. Because in China the lockdown started in the winter and ended on 8 April 2020, and because the signals in the summer months are relatively weak, this was only done for the winter months. Furthermore, to exclude the effect of the Spring Festival on the NO2 TVCDs, January and February were not used. This left November, December, March and April for 2011–2019, and the results are presented in Fig. A2. The data in Fig. A2 show the overall decline of the NO2 TVCDs, following the yearly trends and variations of the annual mean TVCDs in Figs. A1 and A3 and the differences between the 11 regions for different periods. Overall, the periods when the NO2 TVCDs decreased are similar to those indicated in Table 2. For Beijing and Shijiazhuang, a strong minimum is observed in 2014 which may be associated with emission reduction because of the Asia-Pacific Economic Cooperation (APEC) meeting in Beijing in November 2014 and the China Victory Day Parade in September 2015. Interannual variability is stronger in the monthly-mean data than in the annual means, as expected. Because of these variations, trend lines for monthly-mean NO2 TVCDs were not computed. The main message is that the TVCDs follow the tendencies in the annual means with leveling toward the end of the study period.
Table 2NO2 TVCD trends determined for the period indicated in the third column. Trends are determined using exponential fits () to time series of the annual mean NO2 TVCDs as shown in Fig. 3 and described in the text.
3.1.2 Evolution of NO2 spatial distributions after the 2020 Spring Festival
For the evaluation of the spatial distributions and the short-term time series of NO2 TVCDs over small regions, TROPOMI data were used because of their improved spatial resolution as compared to OMI data (Sect. 2.2). NO2 TVCDs derived from TROPOMI observations, averaged over 30 d before and after the 2020 Spring Festival, are presented in Fig. 4. Figure 4 shows the large difference in the NO2 TVCDs before and after the 2020 Spring Festival, similar to those used in Fan et al. (2020a) for all China to illustrate and analyze the effect of the COVID-19 containment policy measures. Fan et al. (2020a) concluded that the use of 30 d averages leads to underestimation of the Spring Festival effect and overestimation of the COVID-19 lockdown effect and that for more reliable estimates shorter periods should be used. Therefore, in the current study, weekly NO2 TVCD maps were produced as shown in Fig. 5. Here week numbers relate to the Spring Festival which was on Saturday 25 January 2020, i.e., week 0 is 25–31 January, week 1 is 1–7 February, etc. (see Table A1 for an overview of week numbers and dates). Weeks −1 to −3 are included as references for the NO2 TVCDs during the period before the Spring Festival. The comparison of the monthly TVCDs in Fig. 4 with the weekly TVCDs in Fig. 5 (top row, weeks −3 to −1) clearly illustrates the advantage of using better time resolution to show the advancing decline of the NO2 TVCDs in east China before the Spring Festival. The first lockdown in Wuhan was on 23 January, toward the end of week −1; therefore, the decline was mainly due to the decreasing economic activity associated with the Spring Festival. The combined effects of the Spring Festival and progressive lockdown in east China (Bao and Zhang, 2020) is visible in weeks 1–3, when the NO2 TVCDs were lowest. The slight recovery in week 2 in the south of the study area may reflect the progressive nature of the lockdowns in different areas in China, i.e., toward the end of the Spring Festival holidays when people traveled back to their work places when it was still possible.
The maps in Fig. 5, and the difference plots with respect to week 0 in Fig. A3, show that overall the NO2 TVCDs remained low over the whole study area during the first 2 weeks. Also in week 3 the NO2 TVCDs were low, although some increase occurred over industrialized and populated areas north of the Yangtze River and in the Guangzhou area, which intensified every week from week 4 until week 8. In week 8 the NO2 TVCDs reached high values and the spatial distributions and concentrations changed little during the next 5 weeks, except in week 10 when the NO2 TVCDs were lower (although not in the YRD and Guangzhou). These reduced concentrations may be a sign of reduced emissions during the Tomb-Sweeping Festival on 4–6 April. In week 13 the NO2 concentrations were substantially lower than in the weeks before, and this continued in week 14. These weeks encompass the May festival holiday (1–5 May), another very large national festival in China when many people travel home to their families: the associated change in socioeconomic activities may explain the lower NO2 concentrations during that time. After week 14 the NO2 TVCDs increased in the southern provinces like Hunan and Guizhou as well as in the east around Shanghai, Jiangsu and Shandong, whereas in the northeast the NO2 TVCDs first decreased and then decreased in week 18. Overall, the spatial patterns during these weeks were similar, but the TVCDs changed, likely due to changes in economic activity and meteorological influences, but they did not reach values similar to those before the Spring Festival. However, this would not be expected as discussed in Sect. 3.1.1.
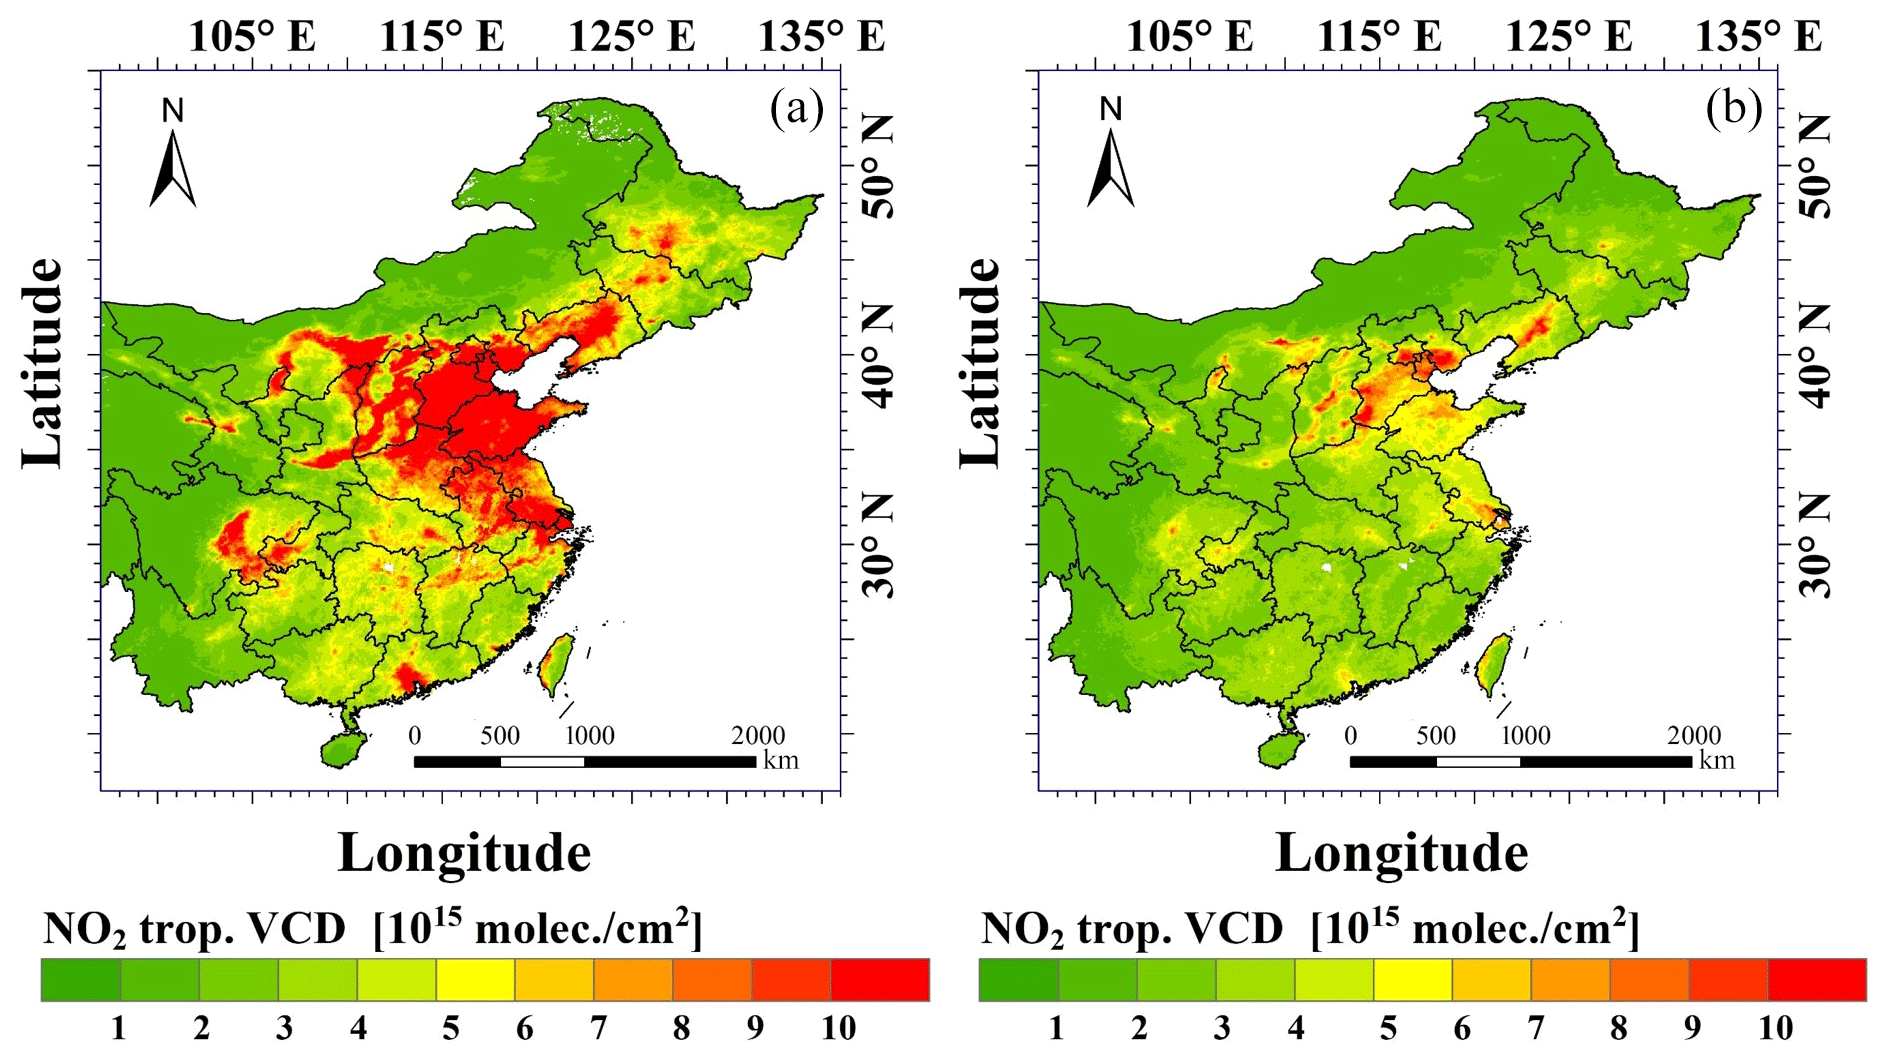
Figure 4NO2 tropospheric vertical column densities derived from TROPOMI data over east China, averaged over 30 d before (a) and after (b) the 2020 Spring Festival. The 2020 Spring Festival was on 25 January 2020 and thus the 30 d period before started on 26 December 2019 and the 30 d period after ended on 24 February 2020.
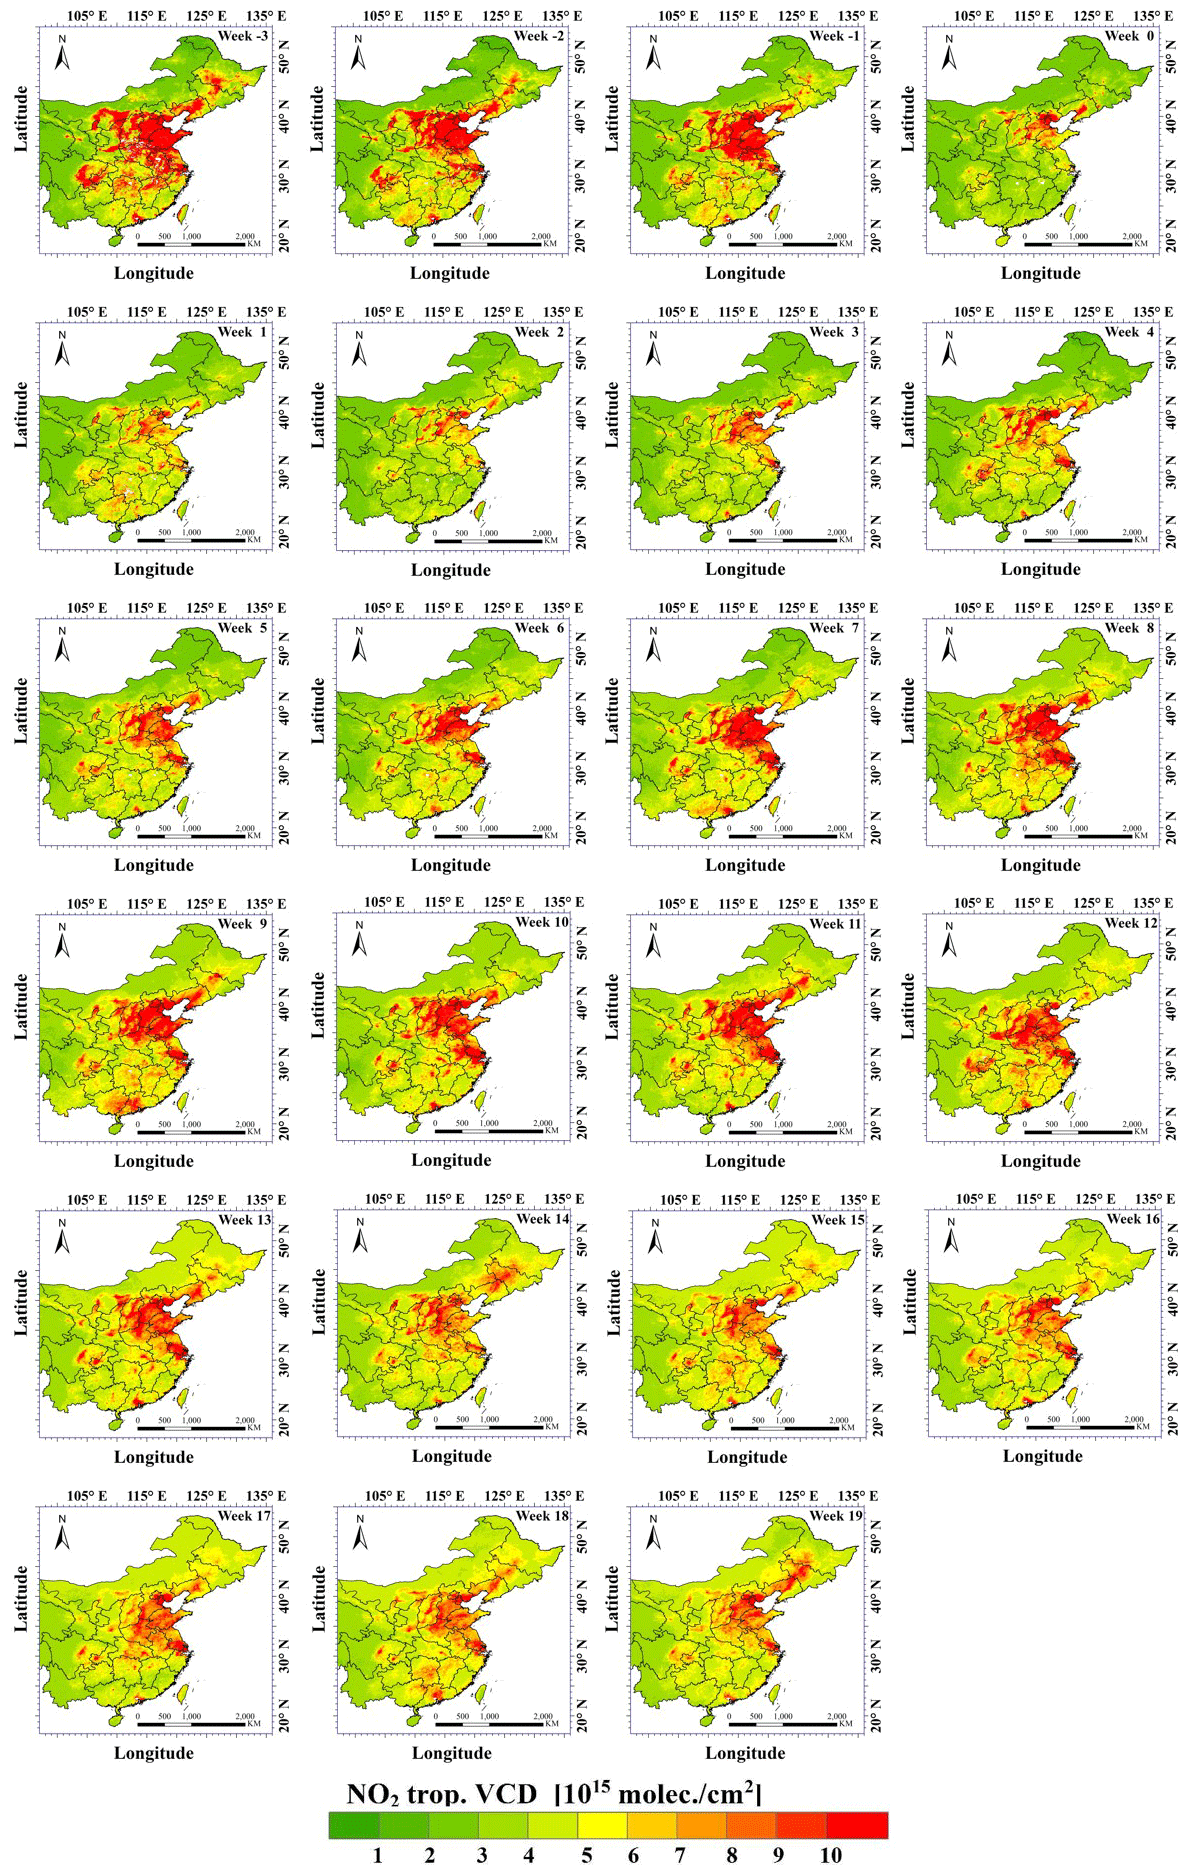
Figure 5Maps of weekly averages of NO2 TVCDs derived from TROPOMI data, for weeks −3 to −1 and week 0 (top row) and weeks 1–19 in the following rows. Note that week number refers to the 2020 Spring Festival, i.e., week 0 starts on Saturday 25 January 2020 (see also Table A1).
3.2 Effects on air quality: ground-based observations
3.2.1 Time series of air quality index for 11 regions
The air quality index (AQI) is based on the mass concentrations of PM2.5, PM10, NO2, SO2, CO and O3 as described in Appendix A. AQI is determined by only one pollutant, i.e., the pollutant with the highest AQI. Time series for the AQI in the 11 cities identified in Table 1 were plotted for the first 16 weeks (weeks 0–15) after the Spring Festival in 2020. Tianjin was added as a second megacity in the metropolitan agglomeration because of its potentially different air quality due to large industrial activities as opposed to the capital city (Beijing). AQI time series for the same weeks in the five previous years (2015–2019) were plotted to form a plume which serves as reference for the 2020 time series. The results are presented in Fig. A4, which shows that there are large variations between the years and that there is no specific ordering, indicating a systematic temporal variation (tendency). Hence the plume is representative of the range of variations that can be expected in 2020 from other factors influencing the AQI than the lockdown, such as meteorological factors (provided that 2020 is not an exceptional year in regard to these other factors). It is noted that the AQI values are weekly averages over all measurements in each city, created from 24 h averages at each site.
Figure A4 shows the similarity between the AQI time series in the five cities in the NCP (Beijing, Tianjin, Shijiazhuang, Jinan and Zhengzhou); for the cities Shanghai, Guangzhou, and Wuhan; and for Nanchang, Xi'an, Chongqing, and Chengdu. In view of these similarities, one city was selected to represent each group for further analysis, i.e., Shijiazhuang represents the first group (group 1), Wuhan represents group 2 and Chongqing represents group 3. It is noted that in the selection of these cities not only the AQI was considered but also time series of six individual pollutants (see below). The AQI time series for these three cities are included in Figs. 6–8.
In 2020, the AQI in the cities in group 1 fluctuated in the first 3 weeks and then stayed low until week 9; they increased toward the plume in week 10 and then stayed at the bottom of the plume. Except in the first 3 weeks, the AQI is smaller than 100, indicating good air quality. For group 2, the AQI fluctuated, and the values indicate excellent to good AQ until week 10 when the AQI moved into the plume or occasionally above (Guangzhou) but still indicating good AQ. For group 3, the AQI indicated good AQ, except in Xi'an (moderate) and decreased somewhat (Xi'an became “good”) but remained in the plume throughout the whole study period. In other words, the AQI did not indicate better AQ for these cities in response to COVID-19 containment measures.
3.2.2 Time series of aerosols and trace gases affecting air quality
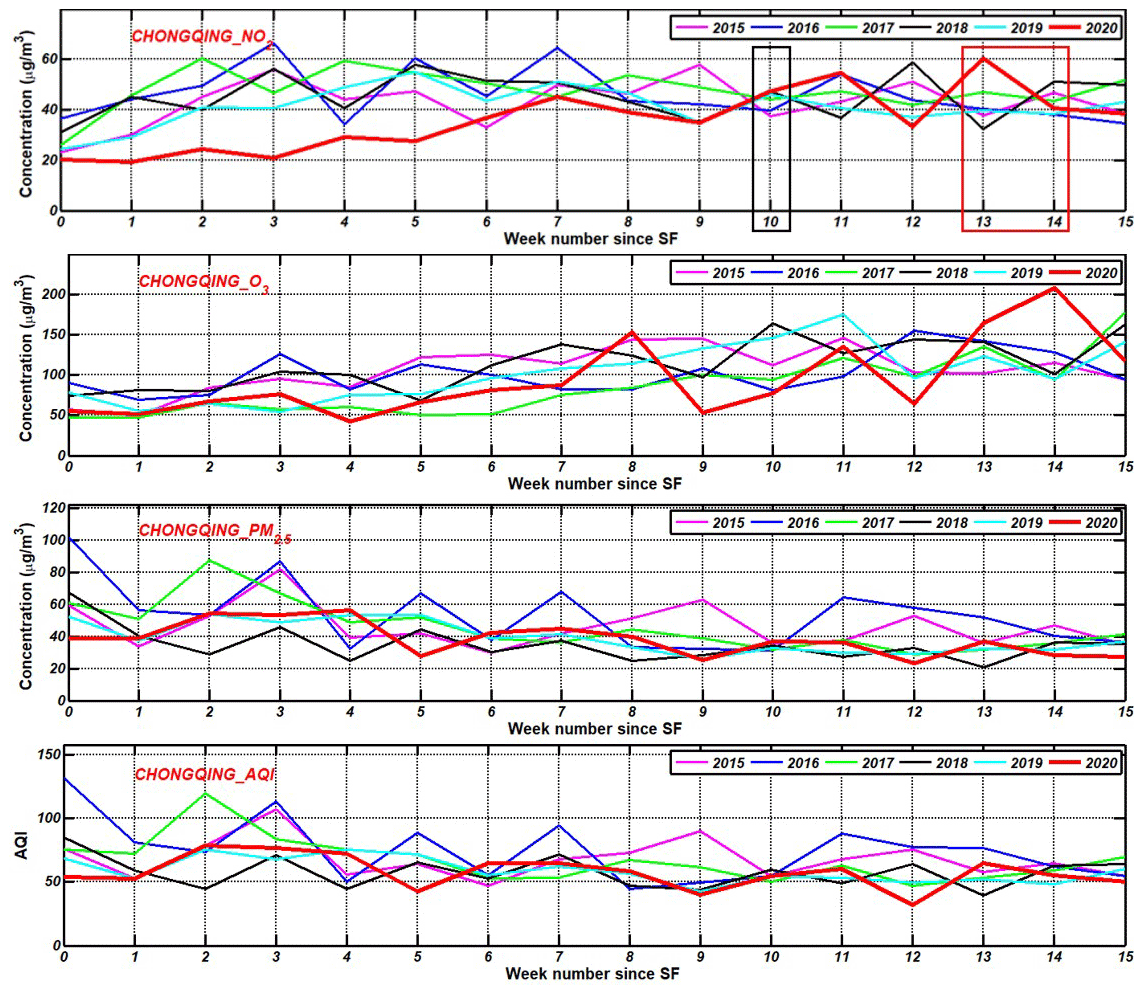
With the AQI determined by the pollutant with the highest AQI, which may not necessarily be the species observed from satellites such as NO2, the behavior of individual pollutants contributing to the AQI will be considered using time series similar to those for the AQI. As discussed in the Introduction section, we focus here on NO2, O3 and PM2.5 as the species which were most affected by the lockdown. Time series of the weekly-averaged concentrations of these species in Shijiazhuang, Wuhan and Chongqing are presented in Figs. 6, 7 and 8, respectively. Note that for some species the vertical scales may be different between the three cities. The concentrations during the five reference years (2015–2019) (further referred to as the plume) are used as reference to determine how the concentrations in 2020 were influenced by the lockdown. Overall, the concentrations of most pollutants in the plume were higher in Shijiazhuang than in Wuhan and Chongqing. This applies to PM2.5 (as well as for PM10, SO2 and CO which are not shown here) but not for NO2 and O3 for which the concentrations in the plumes in these three cities were similar. This is remarkable because the satellite NO2 TVCDs in 2016 were about a factor of 3 higher in Shijiazhuang than in Wuhan, which in turn were about 30 % higher than in Chongqing (Figs. 2 and 3), whereas in 2019 the NO2 TVCDs were a factor of 2.3 higher in Shijiazhuang than in the other two regions where the TVCDs were similar. However, for an adequate comparison between satellite data and surface concentrations, and thus effects on AQ, factors influencing the relation between near-surface concentrations and TVCDs need to be accounted for, such as meteorological factors driving vertical mixing. Also long-term trends, interannual variations, seasonal variations, local emissions and meteorological effects influencing (photo)chemical reactions determining the overall concentrations need to be considered. However, such detailed quantitative comparison is out of the scope of the current study; a qualitative comparison between TROPOMI-derived NO2 TVCDs and surface concentrations of NO2 will be presented in Sect. 3.3.
In all three cities the surface NO2 concentrations are overall decreasing during the study period, following the seasonal variation which is also observed in the satellite data (Fig. 2). However, in the satellite data the decrease is largest when concentrations are highest, but, as discussed above, for the ground-based data the concentration differences between the three cities are not large. Yet, the seasonal effect seems more pronounced in Shijiazhuang compared to Wuhan and more pronounced in Wuhan compared to Chongqing. This is also different from the satellite data (see Fig. 2) and may be a lifetime effect related to lower temperatures in Shijiazhuang than in Wuhan and Chongqing.
Another difference between the three cities is the effect of the lockdown on the evolution of the surface NO2 concentrations. In Shijiazhuang the plume decreased after week 3, whereas the 2020 concentrations increased steadily from week 0, and the curve joined the plume in week 6 although remaining near the bottom of the plume. In Wuhan the 2020 concentrations were far below the plume (20 vs. 40–60 µg m−3) until week 9 after which they suddenly increased in week 10 to remain just below the plume (∼ 40 µg m−3). In Chongqing the NO2 concentrations were low (20 µg m−3) during the first 3 weeks, then increased and remained close to the plume in weeks 6 to 9 and merged into the plume from week 10.
When NO2 concentrations decreased, O3 concentrations increased as observed for all three cities. However, there was no substantial difference between the temporal variation of the O3 concentrations in 2020 and the other years. The 2020 concentrations were inside the plume during the whole study period, and no anomalous behavior was observed in spite of the reduced NO2 concentrations during the first 6–10 weeks. Rather, in Shijiazhuang and Chongqing both the NO2 and O3 concentrations were low in the plume. The O3 concentrations in Shijiazhuang and Wuhan were similar and a bit higher than in Chongqing.
For aerosols, the situation was different than for the trace gases. The data in Fig. 6 show that in Shijiazhuang PM2.5 was relatively high during the first 3–4 weeks during all 5 years, and those in 2020 were well inside the plume. Thereafter the PM2.5 concentrations dropped and, apart from some fluctuations, remained low (on average about half of those in the first weeks), and those in 2020 were almost every week near the bottom of the plume. It is noted that the PM2.5 concentrations in 2017 and 2019 were substantially higher than in other years. In contrast, the 2020 concentrations of PM2.5 in Wuhan were lower in weeks 2 and 3 than in any other week during the study period and also lower than in all 5 years before (about of the plume average). In Chongqing the PM2.5 concentrations were well inside the plume (around the average), and the plume decreased gradually as expected from the common seasonal behavior of PM2.5. Hence in Chongqing the COVID-19 lockdown measures did not have an evident effect on the aerosol concentrations, in spite of the strong reduction of NO2 concentrations. The PM2.5 concentrations in week 0 were 150 µg m−3 in Shijiazhuang, 50 µg m−3 in Wuhan and 40 µg m−3 in Chongqing.
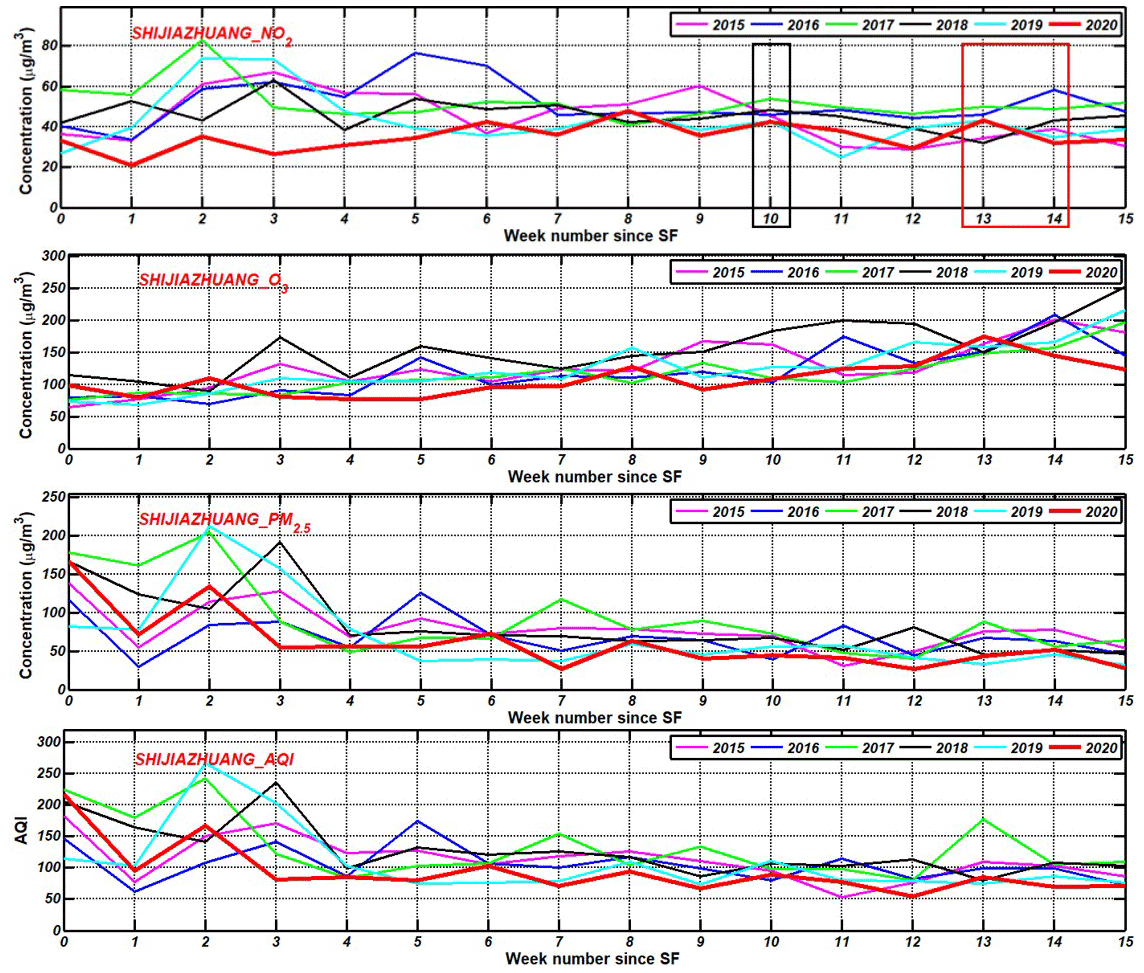
Figure 6Time series of the concentrations of NO2, O3 and PM2.5 in Shijiazhuang for weeks 0 to 15 starting from the Spring Festival in 2020 (red line), together with time series for these pollutants for the same weeks in 2015–2019. See legend for identification. Rectangles in the NO2 time series were added for easy identification of the Tomb-Sweeping Festival (4 and 5 April, in week 10; red) and the May festival (1–5 May, in weeks 13–14; black) which are discussed in the text. The Spring Festival date and thus week 0 is determined by the Lunar Calendar, therefore these dates apply only to 2020, and in the other years they may fall in different weeks.

3.3 Comparison of satellite and ground-based weekly observations in 2020 (NO2)
For the comparison of the temporal evolution of the TROPOMI NO2 TVCDs (Fig. 5) to ground-based observations (Figs. 6–8), the satellite data over each of the 11 selected regions were spatially and temporally integrated to weekly values. The results for the three representative regions discussed above, i.e., Shijiazhuang, Wuhan and Chongqing, are plotted in Fig. 9a as time series for week −3 to week 20 (where week 0 is the Spring Festival in 2020, as above and in Table A1). Beijing data, which are discussed below and presented in Fig. 10, are included as well. For easy comparison, the weekly-averaged concentrations of NO2 in 2020 are replotted from Figs. 6–8 and 10, in Fig. 9b, and the time series was extended to cover the same period as the satellite data. The data in Fig. 9a and b represent different quantities, i.e., column integrated vs. near-surface local concentrations of NO2 which experience different influences of, for example, meteorological conditions (cf. Sect. 4.2) and thus cannot be quantitatively compared. Hence the comparison here is merely meant to qualitatively discuss the use of satellite data to evaluate the reduction of concentrations near the surface, where they are most important for air quality.
The data in Fig. 9a and b show that overall the temporal behavior of the satellite NO2 TVCDs and the surface NO2 concentrations in 2020 was similar, with a strong drop before the Spring Festival (for the ground-based data continuing another week in Shijiazhuang and Beijing), followed by an overall increase. However, where the satellite data show different concentrations before the Spring Festival, the ground-based concentrations were similar, except in Shijiazhuang where they were a factor of 2 higher, and the factors by which the concentrations were reduced are also different. The satellite data for Shijiazhuang show a reduction to a value of 33 % from the maximum before the Spring Festival, whereas the ground-based data show a reduction to 24 %. For Beijing, these values are 55 % and 35 %, for Wuhan they are 77 % and 40 %, and for Chongqing they are 53 % and 43 %. Hence, overall, the reductions derived from satellite data are stronger than those from local monitoring measurements. However, effects of varying meteorological conditions are not included in these estimates, and these effects may be different for satellite observations than for local ground-based measurements. It is further noted that these numbers reflect the combined effect of the Spring Festival and the COVID-19 lockdown.
After the Spring Festival, both the satellite and ground-based data show that the concentrations increased, with similar rates in Shijiazhuang (factor of 2 between week 0 and week 9) but with much stronger fluctuations in the surface concentrations. However, in other regions the different types of observations show quite different behavior. For instance, in Chongqing the ground-based observations behaved similar to those in Shijiazhuang, whereas the satellite observations show a very small increase. The reverse is true for Beijing, with a rather small increase in the surface concentrations as opposed to a larger increase in the satellite observations. In Wuhan, both types of observations show the strong effect of the strict lockdown with NO2 concentrations remaining near the lowest values until week 10. However, after the end of the lockdown, the satellite data in Wuhan show a very modest increase, whereas the ground-based data show a sudden increase by about a factor 2. Also in other regions, post-lockdown large differences are observed in the satellite-derived and ground-based time series.
It is noted that the earlier-observed separation in behavior of long-term NO2 TVCD time series between the north and the south of the study area (Sect. 3.1.1) is also reflected in the weekly time series in early 2020; i.e., there is a separation between the NO2 TVCD values over Beijing and Shijiazhuang (north) and those over Wuhan and Chongqing (south). This separation is also reflected in the temporal behavior but to a lesser extent. However, although in the ground-based time series a separation can also be observed, it is rather due to stronger industrialization (Shijiazhuang and Chongqing) than in the capital city of Beijing. The time series in Wuhan may have been influenced by the strict lockdown during 10 weeks, whereas after its release many activities suddenly increased which is reflected in the doubling of the ground-based NO2 concentrations.
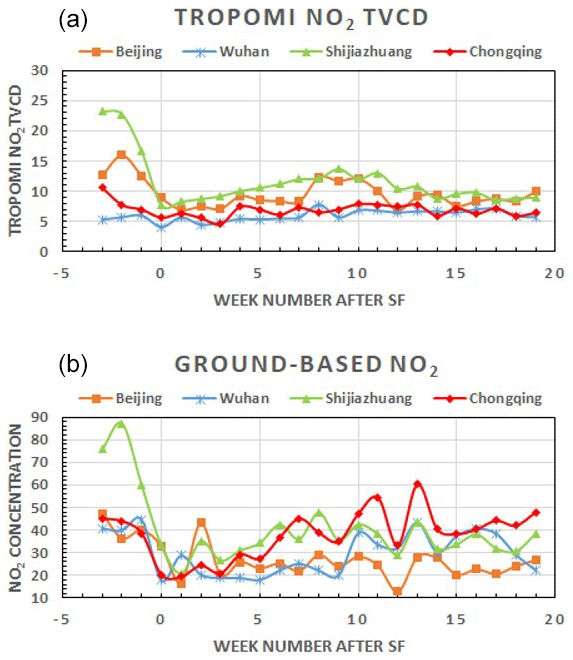
Figure 9Time series of weekly averages of (a) TROPOMI-derived NO2 TVCDs (1013 molec. cm−3) over Shijiazhuang, Wuhan, Chongqing and Beijing for weeks −3 to 19 and (b) surface concentrations of NO2 (µg m−3) over these cities, plotted together in one plot from Figs. 6–8 and 10.
The satellite data on tropospheric NO2 VCDs and ground-based monitoring data for the concentrations of NO2, O3, PM2.5 and AQI all indicate the different behavior of atmospheric composition in the north and south of China, and the selected regions have been grouped to discuss the characteristic behavior within each group. This relates both to long-term variations (trends in the satellite data) and the influence of the COVID-19 lockdown. Hence the answers to the questions we set out for this study at the end of Sect. 1 will be different for each of the regional clusters which emerged in the course of the study.
4.1 Estimation of lockdown effects: effects of temporal resolution
Many studies on the COVID-19 lockdown effect on atmospheric concentrations are based on comparison of a period before and after the start of the lockdown or on comparison with the same period in previous years. The lockdown occurred during the Spring Festival holidays during which the concentrations of NO2, often used in studies on the effect of the COVID-19 lockdown, were substantially reduced. Hence, in many studies the Spring Festival effect was separated from the total effect to determine the effect of the lockdown only. One way to do this was presented in Fan et al. (2020a) for tropospheric NO2 VCDs. In contrast, AOD was observed to increase. The AOD increase was anticipated to be due to meteorological factors conducive to the formation of haze. Also the ratio of the PM2.5 concentrations before the Spring Festival to those thereafter was higher than in previous years (in Beijing PM2.5 even increased by a factor of 2.2), and these ratios were higher in northern China than in the south. In their estimates of the lockdown effects from satellite data, Fan et al. (2020a) (and others) used averages over the months before and after the Spring Festival. The current study clearly shows that during the weeks before the lockdown the NO2 TVCDs gradually decreased and varied also after the lockdown. The post-Spring Festival variations are also observed in the surface concentrations of NO2 which varied by more than a factor of 2. This also applies to aerosols and to a lesser extend to O3. Hence the actual effect of the lockdown on the concentrations of aerosols and trace gases will be influenced by the separation from the Spring Festival effect, the temporal resolution chosen for the data analysis, and the correction for meteorological and other factors such as reduction of emissions and related concentration trends, as well as chemistry. The influence of emissions and the impact of the lockdown on different economic sectors on NO2 and aerosol concentrations was discussed by Diamond et al. (2020).
4.2 Long-term trends, trend reversal and meteorological influences on the estimation of lockdown effects
Decadal time series of monthly- and annual-mean NO2 TVCDs for the 11 regions and the annual trends derived from these were presented in Sect. 3.1.1 (Figs. 2, 3 and A1, Table 2). For the calculation of the baseline concentrations in 2020, i.e., the concentrations expected if there would not have been a lockdown, the seasonal variation needs to be taken into account. However, monthly trend lines are difficult to determine with some accuracy due to interannual variations and due to the Spring Festival effect which occurs at different dates in the solar calendar. Therefore, trends for January and February were not considered. Furthermore, as Figs. 2 and 3 show, the decline in the NO2 TVCDs seems to level off in recent years, i.e., from 2015/2016 in the south of China and possibly after 2018 in the north. The years when the trends were changing are similar for the monthly and annual mean data. Hence the baseline could be determined using an average over the years after the trend change. The uncertainty in these averages is about 10 % (Fig. 3). Ignoring the trend change, i.e., assuming that the trend would continue to 2020, would result in an underestimation of the baseline for 2020. Extrapolation of the trend for Wuhan to 2020 would result in an estimated baseline of 4.4×10¹⁵ molec. cm−2 and for Chongqing 3.6×10¹⁵ molec. cm−2, whereas using the average over 2016–2019 for 2020, i.e., assuming that the decrease has halted as suggested by the data in Fig. 3, would provide a baseline of 6.6×10¹⁵ molec. cm−2 for Wuhan and 5.6×10¹⁵ molec. cm−2 for Chongqing. In other words, ignoring the trend change would result in a baseline lower by about 35 % and thus in an overestimation of the lockdown effect on the NO2 TVCD. Similar considerations may apply to Shijiazhuang, but considering that a change in the annual trend did not occur until 2018, the variation in following years is difficult to estimate.
In view of this discussion, the use of a climatology over recent years for comparison with the 2020 concentrations may be a good strategy for regions in the south of China, whereas for the north, where concentrations were decreasing until 2018, the climatological concentrations may be too high. The use of ground-based data leads to larger uncertainties. As the ground-based data in Figs. 7 and 8 for Wuhan and Chongqing show, the NO2 concentrations in the plumes vary strongly from week to week, and the plume width is therefore rather large, with an uncertainty which is much larger than the 10 % uncertainty in the trend since 2015/2016.
Meteorological influences may be twofold. Meteorological conditions may be conducive to the formation of haze in stagnant air as often observed in northern China during the winter (e.g., Li et al., 2018; Wang et al., 2019, 2018a, 2020a). On the other hand, large-scale weather systems influence the transport of air masses from different origins transporting either clean air or pollution contributing to local air quality (e.g., Wang et al., 2019; Li et al., 2018; Hou et al., 2020). Another aspect to be considered are the influences of air temperature, humidity and radiation on chemistry, which affects NO2, O3 and aerosols, in particular for the situation during the COVID-19 lockdown with the strong reduction of NO2 concentrations. A reduction of NO2 (or NOx = NO + NO2, where NO is only a small fraction of NOx) leads to an increase in O3, as observed in the ground-based data. The enhanced O3 concentrations result in the increase of the oxidizing capacity of the atmosphere which in turn leads to the production of secondary organic aerosol (SOA) as explained in, for example, Diamond et al. (2020) and Le et al. (2020). The increased aerosol concentrations result in the attenuation of solar irradiation due to more scattering and absorption which in turn may further influence the meteorology (Zhong et al., 2018) and photochemical reactions.
In view of the decisive role of meteorology in haze formation in northern China (Le et al., 2020), it is surprising that both Le et al. (2020) and Diamond et al. (2020) used meteorological data averaged over 1 month (February 2020). Haze occurs episodically and less than 25 % of the episodes last longer than 4 d (Wang et al., 2018b, 2020b).
4.3 Lockdown effect on air quality and rebound
The similarity in the temporal behavior of the air quality index (Fig. A4) was the basis for the subdivision of the regions in three groups. In group 1 (NCP), the AQI fluctuated in the first 3 weeks and reached a peak value in week 2 and then remained low. The peak was highest (170, moderately polluted) in Beijing where it exceeded the value of previous years. Obviously, this was due to a haze episode with strongly enhanced PM2.5 with respect to the period before the Spring Festival (Fan et al., 2020a) and a concentration of ca. 140 µg m−3, almost double the 24 h class 2 (for cities) air quality standard in China specified in GB 3095-2012 (https://www.transportpolicy.net/standard/china-air-quality-standards/, last access 30 January 2021). In other cities in group 1 (not shown), the peak values were lower, decreased with distance to Beijing, and were also lower than in 2017 and 2019. Only in Jinan and Zhengzhou the PM2.5 values were within the 24 h class 2 (for cities) air quality standard. After week 3 the PM2.5 concentrations were within air quality standard limits, and the AQI was between 50 and 100 (good) and lower than in the previous years, for all cities in group 1. However, closer inspection shows that the O3 concentrations exceeded the air quality standard of 100 µg m−3 (1 h mean value) between weeks 5 (in the south of the NCP) and 7 (in the north). Furthermore, in all cities in the NCP the O3 concentrations in 2020 were well inside the plume. Hence, in the NCP the strong emission reduction during the lockdown and the strong decrease of NO2 concentrations, observed both from space and from the surface monitoring network, were offset by the increase of other pollutants. Early in the lockdown the aerosol concentrations were high due to meteorological conditions and complex chemical influences, and later the O3 concentrations exceeded the limiting values. However, the latter were not reflected in the AQI, which followed the variations in PM2.5 but remained low when O3 concentrations were high. In fact, for all cities in the NCP the AQI was below or just inside the plume during the whole study period, whereas the NO2 concentrations moved into the plume toward the end, except in Beijing. The relatively low NO2 concentrations might be expected based on both the decreasing trends in the NO2 TVCDs until 2018 in the north of China and from the seasonal decrease. With these considerations, it is hard to determine whether the pollutant concentrations in the NCP returned to their normal levels, which in regard to seasonal variations are expected to be lower than before the lockdown and in regard to their decreasing trends are expected to be lower than in other years or, considering that the trends level off, similar to those in the last couple of years.
For the group 2 cities, Shanghai, Guangzhou and Wuhan, the AQI during the lockdown varied, and AQ was good until week 10, with the largest effect in Wuhan. NO2 concentrations in Wuhan were very low with 20 µg m−3 during the first 9 weeks (3 times lower than the plume average). In Shanghai and Guangzhou the concentrations were initially similar but increased slowly. In all three cities the NO2 concentrations merged into the plumes after week 10, more or less coincident with the end of the lockdown after 76 d, on 8 April 2020. PM2.5 was not reduced as much as NO2 but was also below the plume and overall traced the NO2 concentrations, moving into the plume after week 10. Being further south than the NCP, O3 concentrations were close to the air quality standard of 100 µg m−3 and exceeded that limit around week 5, as in the NCP. Hence, also in the group 2 cities the reduction of other pollutant concentrations was offset by the increase of O3 which is not reflected in the AQI. The rebound at the end of the lockdown period is clear with all indicators returning to levels similar to those in the earlier years, i.e., inside or close to the plume.
Group 3 includes three cities in the Sichuan/Chongqing and Guanzhong basins and Nanchang. In these cities the AQI was not substantially affected by the lockdown, except in the very beginning when it was low inside (or even below) the plume but overall remained inside the plume. Yet, the NO2 concentrations were around 20 µg m−3 during the first 3 weeks, initially some 40 %–60 % lower than the plume for which the concentrations actually increased during these 3 weeks and then gradually decreased. Between week 3 and 7 the NO2 concentrations in 2020 increased in all 4 cities to about 50 µg m−3 in week 7, close to the plume, and later merged into the plume. PM2.5 was not much different from the plume throughout the whole period and in all three cities. Decreasing somewhat in the basins and fluctuating around 40 µg m−3 in Nanchang. O3 concentrations were lower than 100 µg m−3 (50 µg m−3 in Chongqing) and gradually increased to above 100 µg m−3 around week 7. Overall, the lockdown had little effect on the air quality in group 3 cities in spite of the significant reduction of the NO2 concentrations. The latter returned to normal levels after about 9 weeks.
The differences between the lockdown effects on the air quality in the three clusters have not been analyzed in detail. In general, the reduction of concentrations of pollutants such as NO2 was offset by the increase of O3 which is not reflected in the AQI which seems to be mostly influenced by PM2.5. The duration of the lockdown was not exactly the same in each city. For instance, in Xi'an the lives of people gradually returned to normal during a period of 1 month ending on 27 March (Zhang et al., 2020b), whereas in Wuhan the lockdown ended on 8 April. The effects of the gradual increase of activities depends on the kind of activity and resulting emissions. The effect of the emissions on the concentrations depends on meteorological conditions and other factors influencing dispersion of the pollutants such as the local topography in the basin area which limits transport as well as effects on atmospheric chemistry.
4.4 Effects of national holidays and other events
The 16-week study period covered the lockdown from the beginning (week 0) to the end of the lockdown in Wuhan on 8 April (week 10), and the last weeks were included to monitor the rebound of the pollutant concentrations. For Beijing, 4 more weeks were included because of the Party Congress which took place during 21–28 May 2020 (i.e., during weeks 16–17). During the study period, also two national holidays occurred, the Tomb-Sweeping Festival (4–6 April, i.e., in week 10) and the May holidays (1–5 May, i.e., during weeks 13–14). These periods are marked in Figs. 6–8 with rectangles for easy identification. The Tomb-Sweeping Festival was just before the end of the lockdown in Wuhan when NO2 concentrations were observed to rise from very low to close to the values observed in previous years (Fig. 7) and also concentrations of other pollutants as well as AQI peaked, as discussed in Sect. 3.2. As shown in Figs. 6–8, in most other cities the AQI was a little higher in week 10, but the effect was not strong. Also during the May holidays in weeks 13–14 the AQI and the concentrations of other pollutants did not stand out. Although during these holidays families usually get together, there was no significant effect on AQ, possibly because the concentrations were already lower and had not fully recovered, while also travel was still restricted.
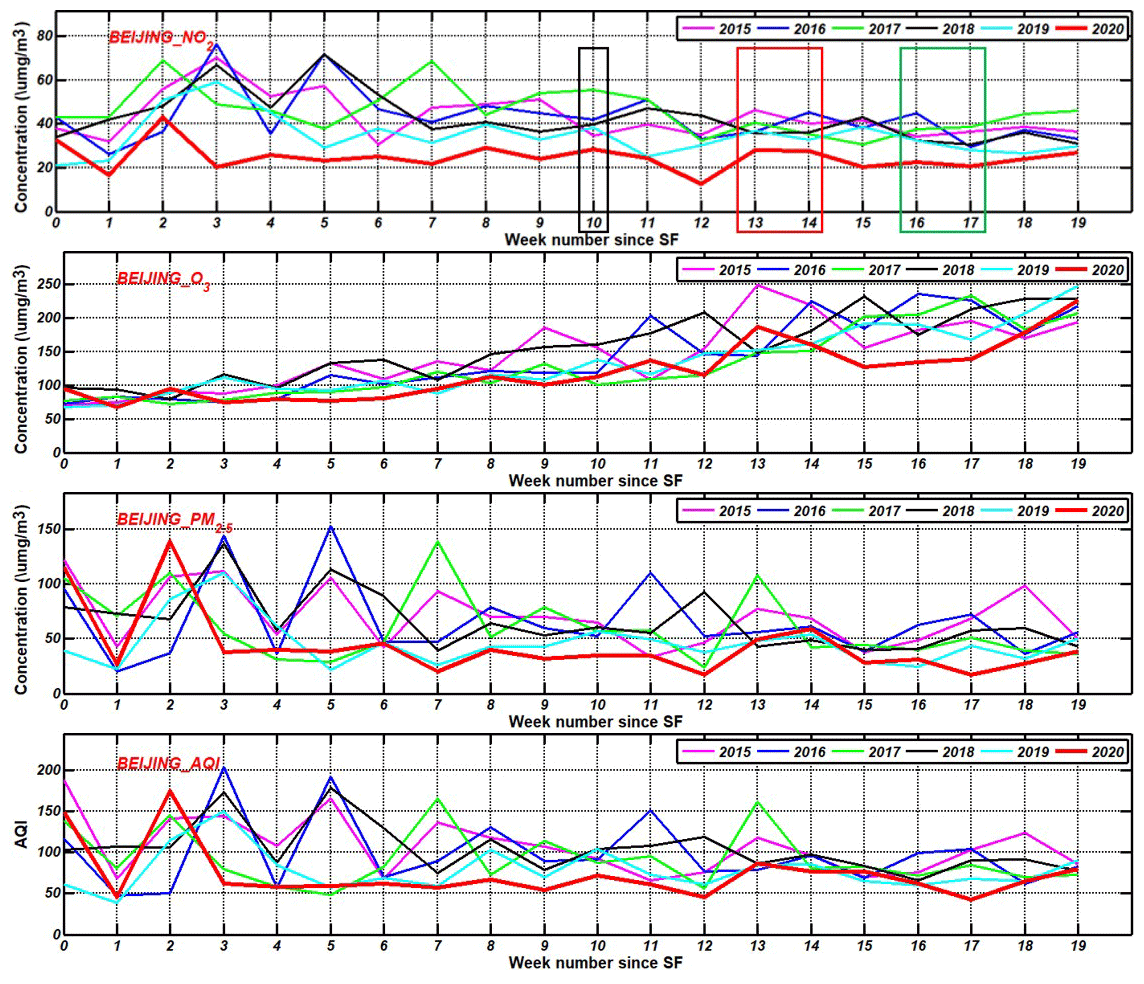
The situation in Beijing was different. With the regular occurrence of large (inter)national meetings, emission control measures are often enforced in Beijing and, except during the haze event in the first weeks of the lockdown, the AQI was low (around 50), well below the plume, until week 13 (Fig. 10). In weeks 13 and 14 the AQI merged into the plume as did the concentrations of some of the contributing pollutants (only shown for PM2.5; O3 was already inside the plume), except NO2 which, however, also increased in that period. The subsequent decrease of the concentrations resulted in minima in the concentrations in week 17. This is illustrated in Fig. 10, showing time series of the AQI and ground-based concentrations of NO2, O3 and PM2.5 in Beijing from week 0 to week 19.
China is a fast-developing country with a high degree of urbanization and industrialization, especially in the east of China (here defined as east of the Hu line, Fig. 1). China also offers a large variety of meteorological, climatic and geographical conditions with vast plains, large mountainous terrain and desert areas. The country can roughly be divided by the Yangtze River, with different influences on atmospheric processes in the north than in the south. These effects came out in the analysis of both the satellite and ground-based monitoring data of trace gases and aerosols affecting air quality. In addition, the Sichuan and Guanzhong basins have their own characteristics due to the influence of the surrounding mountains. The focus of the current study was the evolution of the concentrations of the pollutants during the last decade in response to emission reduction policies, and in particular the effect of the sudden reduction in economic activity and the mobility of people during the lockdown in response to the COVID-19 outbreak in China in January 2020. The study area was mainland China east of the Hu line (Fig. 1). On a decadal scale, column-integrated concentrations of tropospheric NO2 were analyzed, using OMI TVCD data, showing the difference in both the variation of the concentrations and the response to emission reduction policies in regions north and south of the Yangtze River. This analysis was made for 11 regions (Fig. 1, Table 1) selected using weekly-averaged TROPOMI NO2 TVCD data, showing the spatial variations over the whole study area during the first 16–20 weeks after the Chinese New Year (25 January 2020). Ground-based monitoring data were collected for a large city in each of the 11 study areas, i.e., NO2, O3 and PM2.5, which were most affected by the lockdown as shown in our earlier study (Fan et al., 2020a). Differences between these two types of observations were qualitatively discussed based on weekly time series of NO2 TVCDs and surface concentrations encompassing a short period before the Spring Festival and 20 weeks thereafter. Based on the similarities in the evolution of the AQI and pollutant concentrations, the 11 regions were divided into three groups: group 1 in the NCP, group 2 in the south and group 3 including two major basin areas. The large reduction of the concentrations of NO2 was observed, in both the surface and satellite data, whereas the concentrations of O3 were observed to increase and for the concentrations of PM2.5 the behavior varied by region. Hence the question came up whether the air quality was really improved as much as suggested from the NO2 data or whether this reduction was offset by the increase of the concentrations of other pollutants? To answer these questions, satellite and ground-based data were analyzed for the selected 11 regions in east China, leading to the following conclusions.
-
The effect of the lockdown is often determined by comparison of the concentrations before and after the lockdown, averaged over a certain period of time, which often is taken as 1 month, to average out short-term effects. However, as shown in Fig. 5, the concentrations evolved over much shorter timescales and, for NO2, decreased from week to week, both before and after the lockdown. A complicating factor for the determination of the lockdown effect was that the lockdown happened during the Spring Festival holidays during which the NO2 concentrations already decreased substantially. The lockdown added more severe reductions during a much extended period of time. Hence, for a proper determination of the evolution of the concentrations a temporal resolution of 1 week is more suitable than 1 month. The choice of shorter timescales is even more important when episodical events occur, such as the haze event early in the lockdown in the north of China and for the use of meteorological data.
-
Time series of annual mean tropospheric NO2 VCDs for 2011–2019 for the 11 regions show the decreasing trend in the north between 2013 and 2018 and in the south between 2011 and 2015/2016. After these periods, the decrease was halted and concentrations fluctuated but remained within 10 % of the 2015 values. Trends vary between −0.05 and −0.14 per year (see Table 2).
-
To determine the effect of the lockdown on the concentrations, a baseline must be determined. This baseline depends on both long-term trends and short-term variations. Ignoring the trend change in the south would result in an underestimation of the baseline concentrations of the order of 35 % as compared to using the average of the concentrations in 2016–2019 as baseline. In the north the baseline is difficult to determine, because the NO2 TVCDs continued to decrease until 2018. Using the average of the concentrations in 2016–2019 as baseline would result in an overestimate of the baseline concentrations.
-
The effect of the strong reduction of the NO2 concentrations on the air quality is offset by the increase of O3 concentrations and, in some part of China, aerosols (PM2.5). The increase of aerosols in the north of China has two reasons: the meteorological conditions conducive to the formation of haze and the complicated chemistry involving NO2 and O3, leading to the formation of secondary aerosols (e.g., Huang et al., 2020; Diamond and Wood, 2020; Le et al., 2020; Zhao et al., 2020).
The effect of the lockdown is different in cities in groups 1, 2 and 3, with an AQI increase in the first weeks in group 1 (NCP) and improved AQ later. The concentrations did not return to the levels in the previous four years (the plume). In group 2 the AQ was substantially improved during about 10 weeks, although after week 5 the effect of the reduced concentrations was offset by the increase of O3 exceeding national ambient air quality standards. After the lockdown, the concentrations returned to levels similar to those in the plume. For group 3 cities, the concentrations were initially reduced but after a few weeks increased to inside the plume. Hence, apart from the first weeks, the lockdown did not have a significant effect on the AQ in the group 3 cities, in spite of the substantial reduction of the NO2 concentrations which returned to normal levels after about 9 weeks. The AQI seems to be mostly influenced by PM2.5. The use of AQI is questionable because its definition is not following a physical quantity: even when AQI indicates good AQ, limits may be exceeded.
-
Holidays like the Tomb-Sweeping Festival and the May holidays are expected to have some effect on the air quality, but in 2020 this was hardly noticeable. However, in Beijing the air quality during the Party Congress, at the end of May, was better than during the weeks before. It is noted that throughout the whole study period of 19 weeks, the NO2 concentrations in Beijing were strongly reduced with respect to those in the preceding 4 years.
This study was undertaken for China, but the methodology and results can in part also be applied to other areas. In particular this applies to the temporal resolution, which in this study was taken as 1 week, as opposed to 1 d or 1 month in earlier studies such as Fan et al. (2020a). As discussed above, meteorological variations influencing air quality, such as formation and dissipation of haze, take place on rather short timescales. Although, for the determination of effects of sudden changes in emissions on pollutant concentrations, such short-term meteorological effects need to be considered, as well as interannual changes. The baseline correction using multiannual data also needs to account for (changes in) long-term trends and seasonal variations as discussed in detail for NO2.
The air quality index (AQI) is based on measured mass concentrations of aerosols and trace gases. The method to determine the AQI is described in (Yuan and Yang, 2019) and is calculated according to the National Standards on Air Quality Measurement published by the Chinese Ministry of Environmental Protection on 29 February 2012 – Ambient air quality standards (GB 3095-2012) (Ministry of Environmental Protection of the People's Republic of China, MEE, 2012) and the Technical Regulation on Ambient Air Quality Index (on trial) (HJ 633-2012) (MEE, 2012) that became effective on 1 January 2016). The aerosol mass concentrations considered are PM2.5 and PM10, and the trace gases are NO2, SO2, O3 and CO. The AQI is calculated using the method described in (MEE, 2012). The individual AQI of each of these six pollutants (IAQIP) is calculated using the following (Yuan and Yang, 2019):
where CP is the mass concentration of pollutant P, and BPHi and BPLo are the higher and lower thresholds of pollutant concentration near CP corresponding to specified IAQI (Individual Air Quality Index) regulated by government policy. IAQIHi and IAQILo are the corresponding IAQI to BPHi and BPLo, respectively. The AQI is the highest of the six individual IAQIP values:
Equation (A2) shows that the AQI reflects only one pollutant, with the highest IAQI, and is not a combination of all six (Yuan and Yang, 2019).
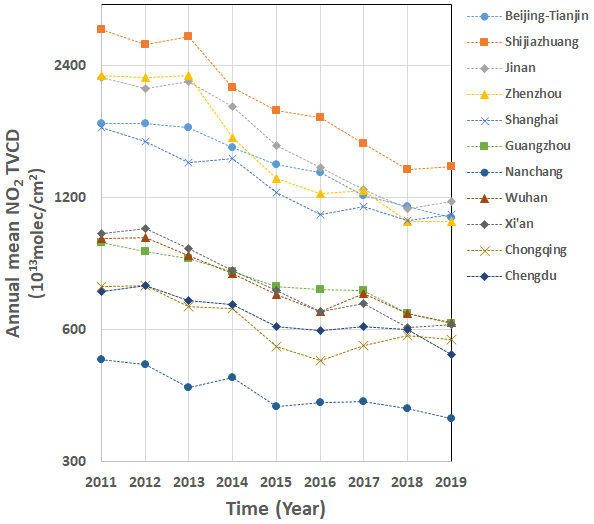
Figure A1Time series of annual mean NO2 TVCDs, derived from de-seasonalized monthly OMI data, for each of the 11 regions, plotted on a semilogarithmic scale.
An AQI of 50 means that the air quality is excellent, and AQI between 50 and 100 means it is good. When 100 < AQI < 150 the AQ is lightly polluted, for 150 < AQI < 200 AQ is moderately polluted and for 200 < AQI < 300 AQ is heavily polluted. AQI > 300 indicates severe pollution (MEE, 2012).
Table A1Definition of the weeks around the Chinese Spring Festival, as used in this study, from 2015 to 2020. The first day of week 0 in each year is defined as the first day of the Lunar New Year, which in the solar calendar changes from year to year.
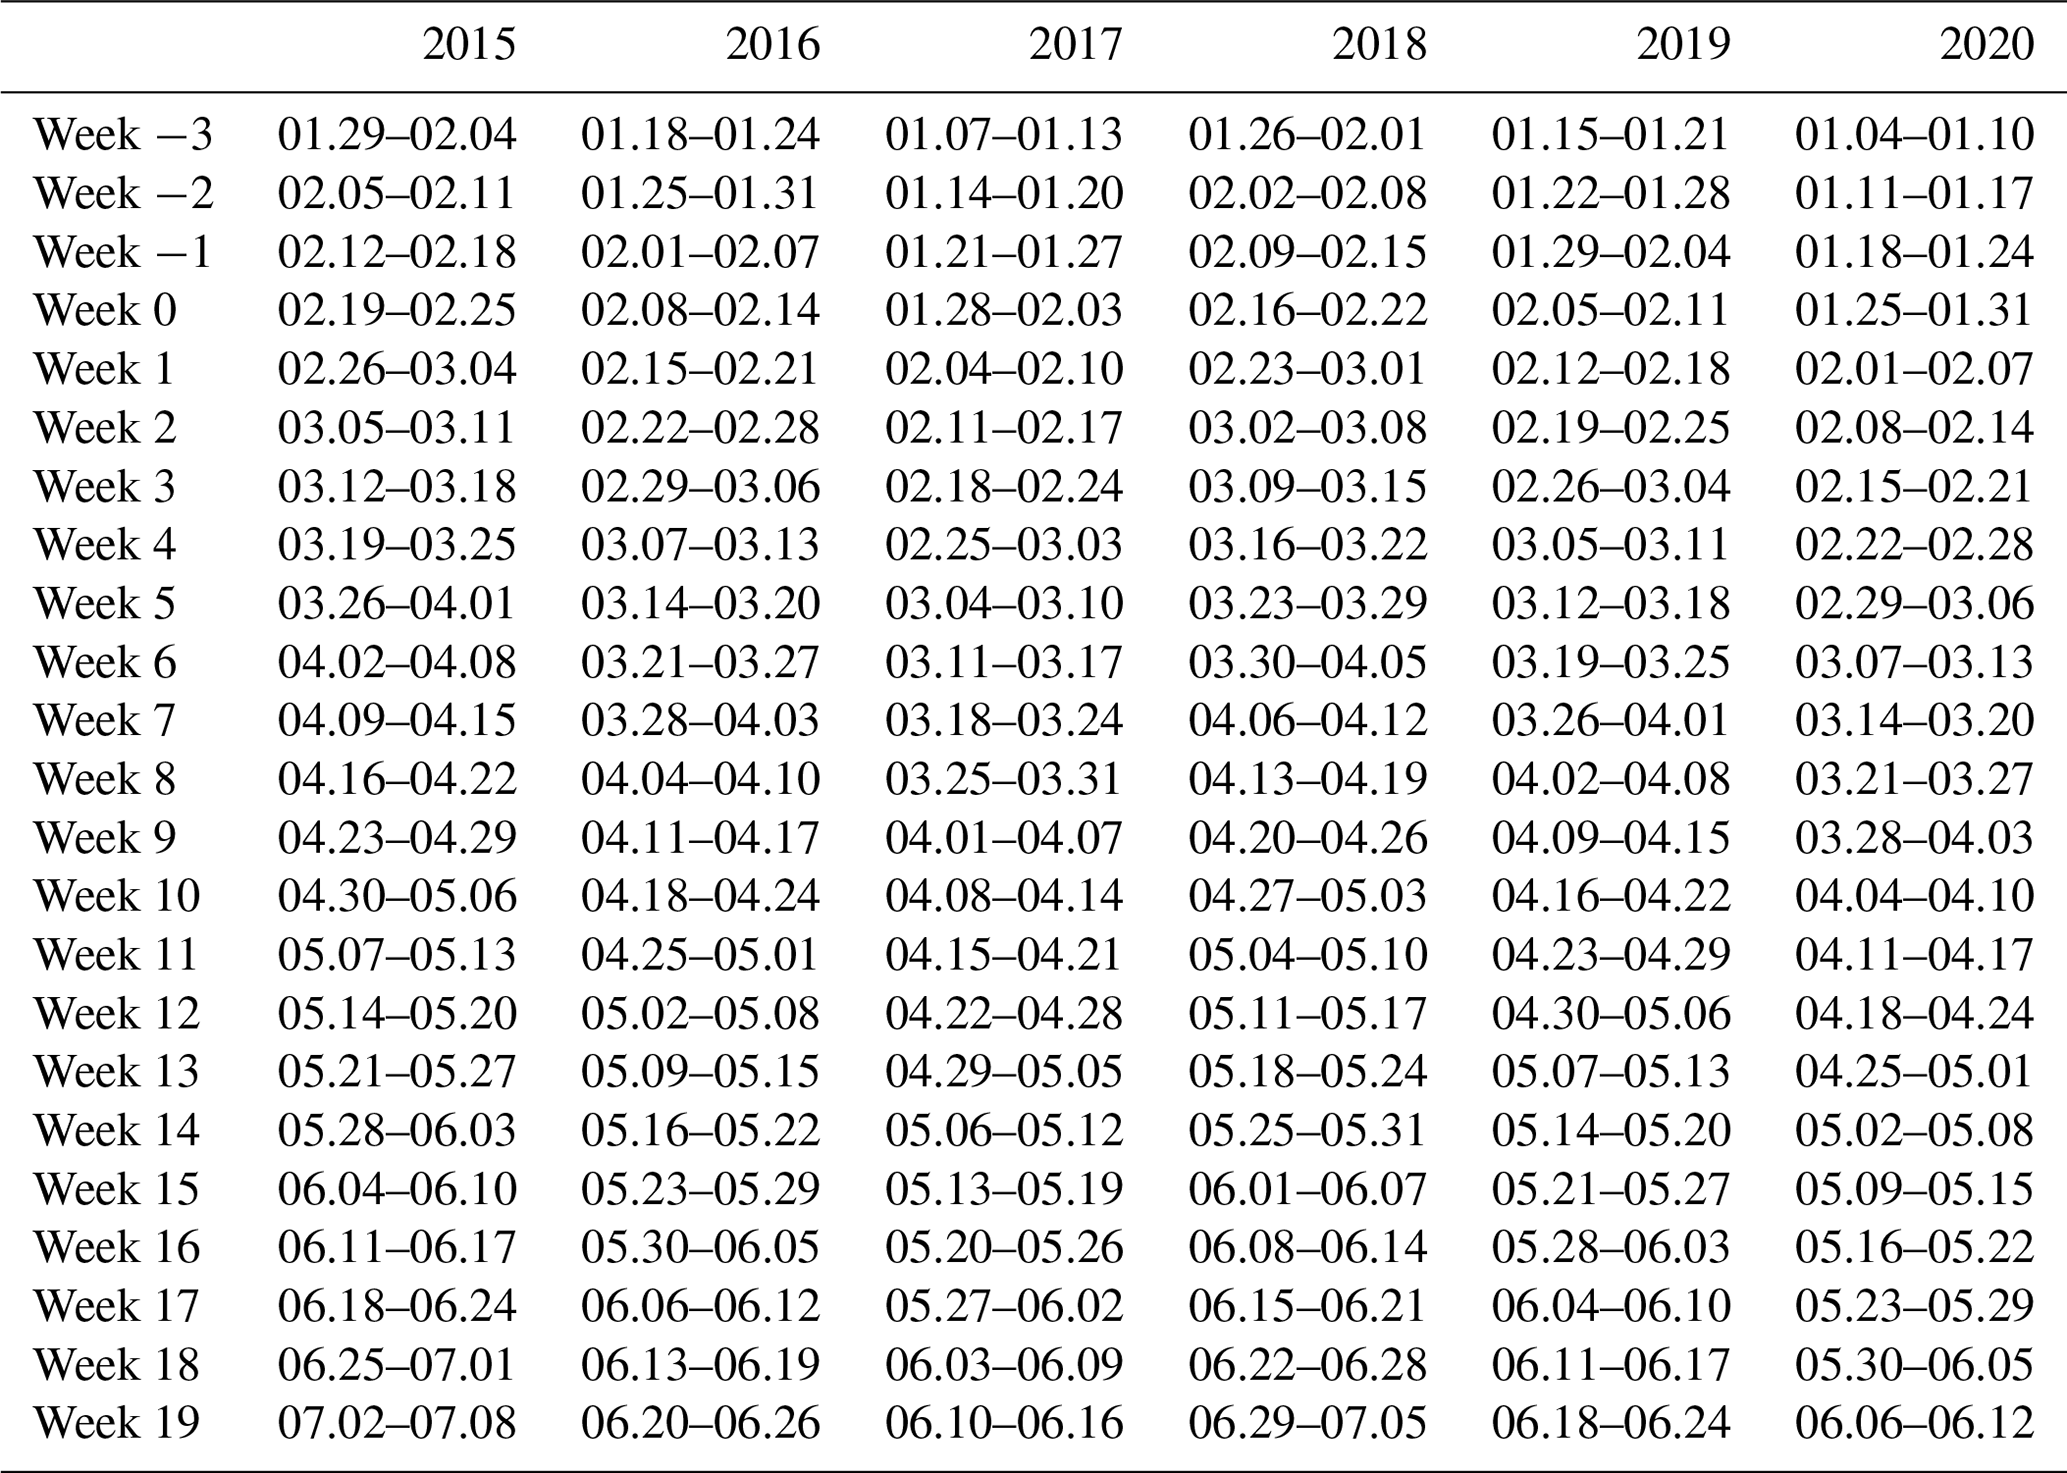
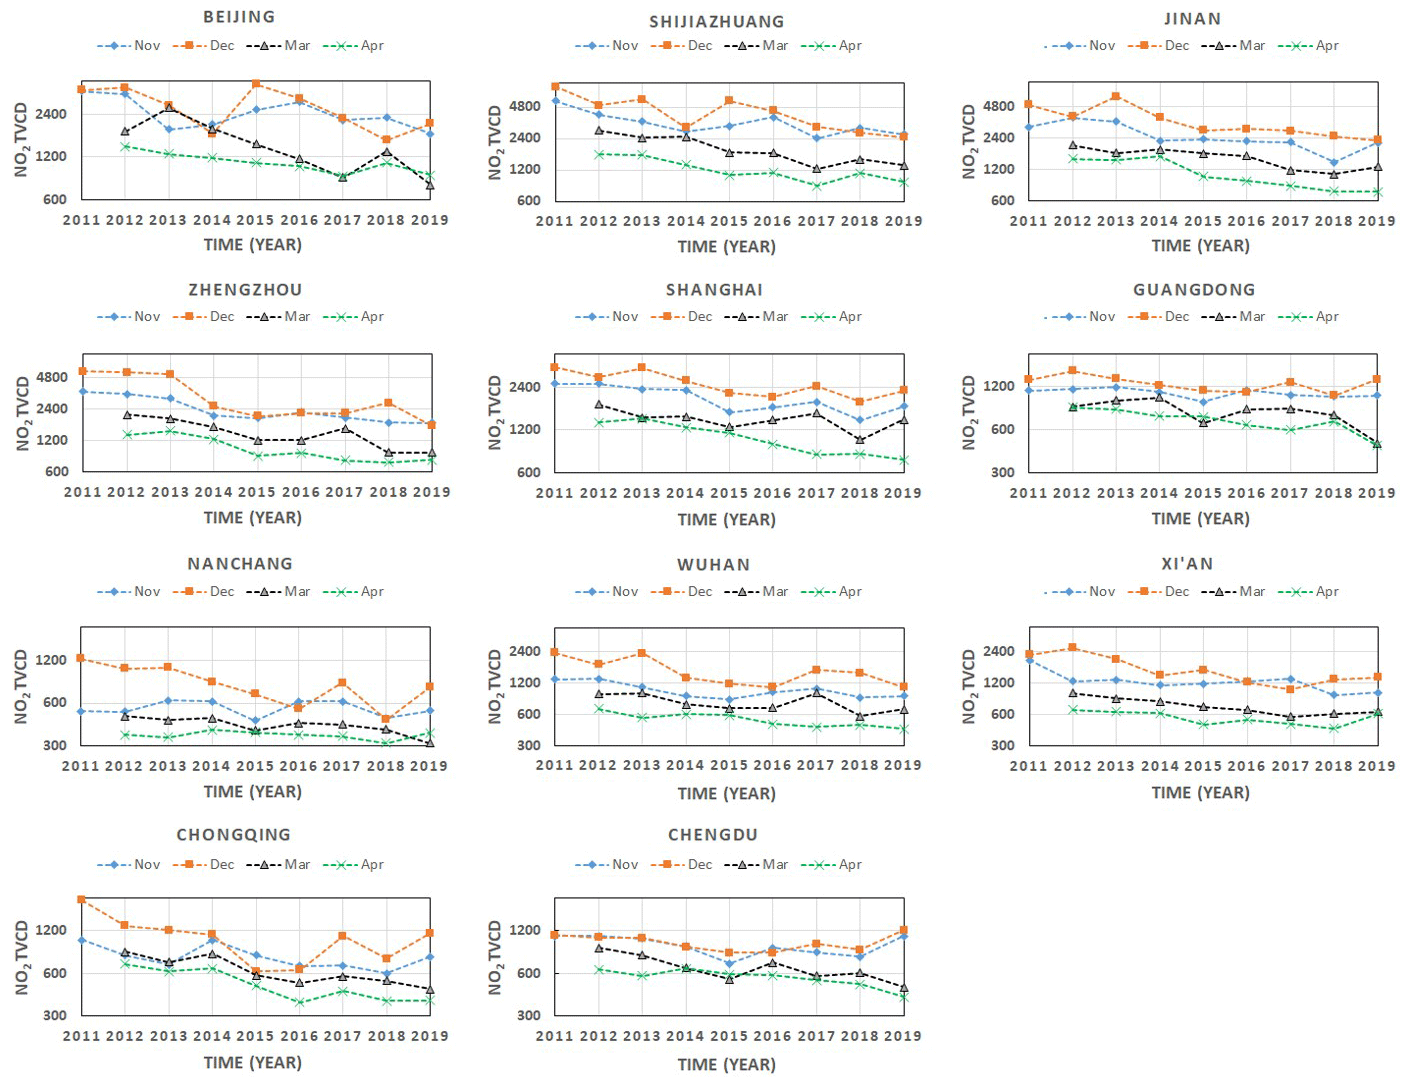
Figure A2Time series of monthly-averaged NO2 TVCDs over each of the 11 regions, for each of the months November, December, March and April from 2011 to 2019. The data points for each month are connected with dotted lines for easy identification.
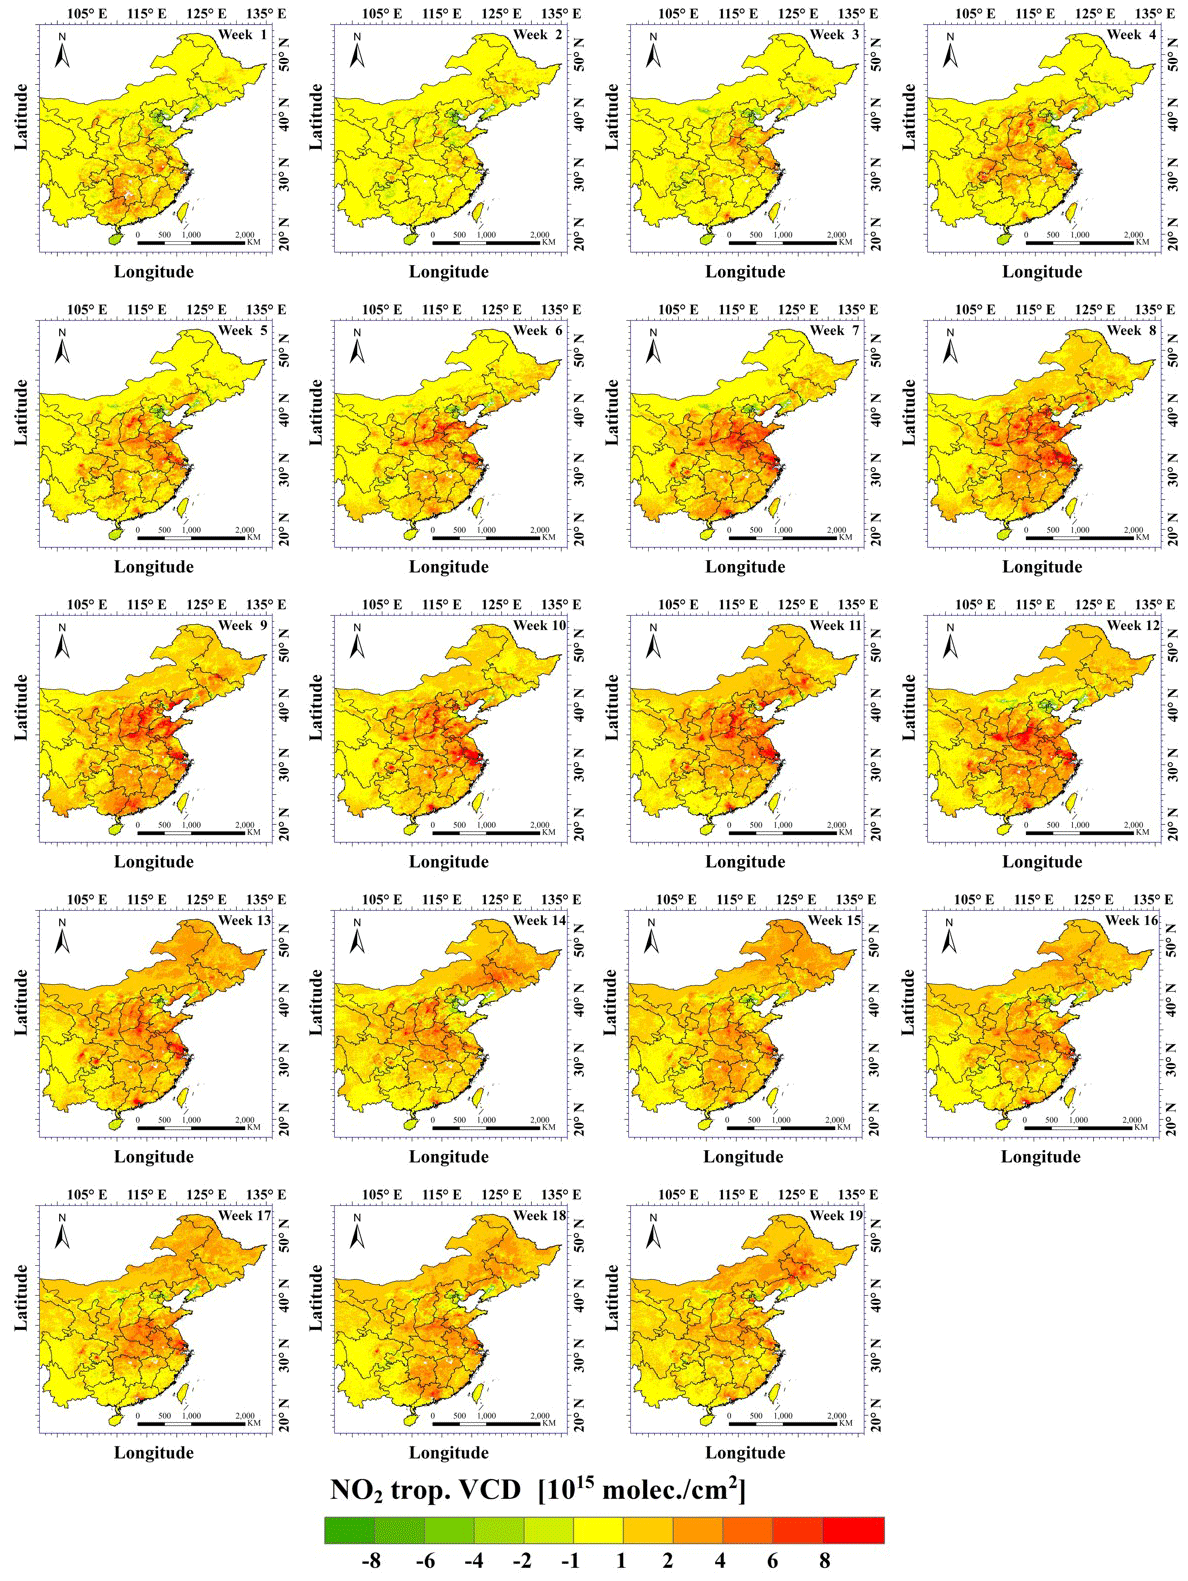
Figure A3Difference plots for weekly averages of NO2 TVCDs minus that for week 0 (Fig. 5) for weeks 1–19. Note that week number refers to the 2020 Spring Festival, i.e., week 0 starts on Saturday 25 January 2020. As explained in Sect. 2.1, the yellow background in the maps indicates no changes with respect to week 0, red indicates an increase and green indicates a decrease of the NO2 TVCD.
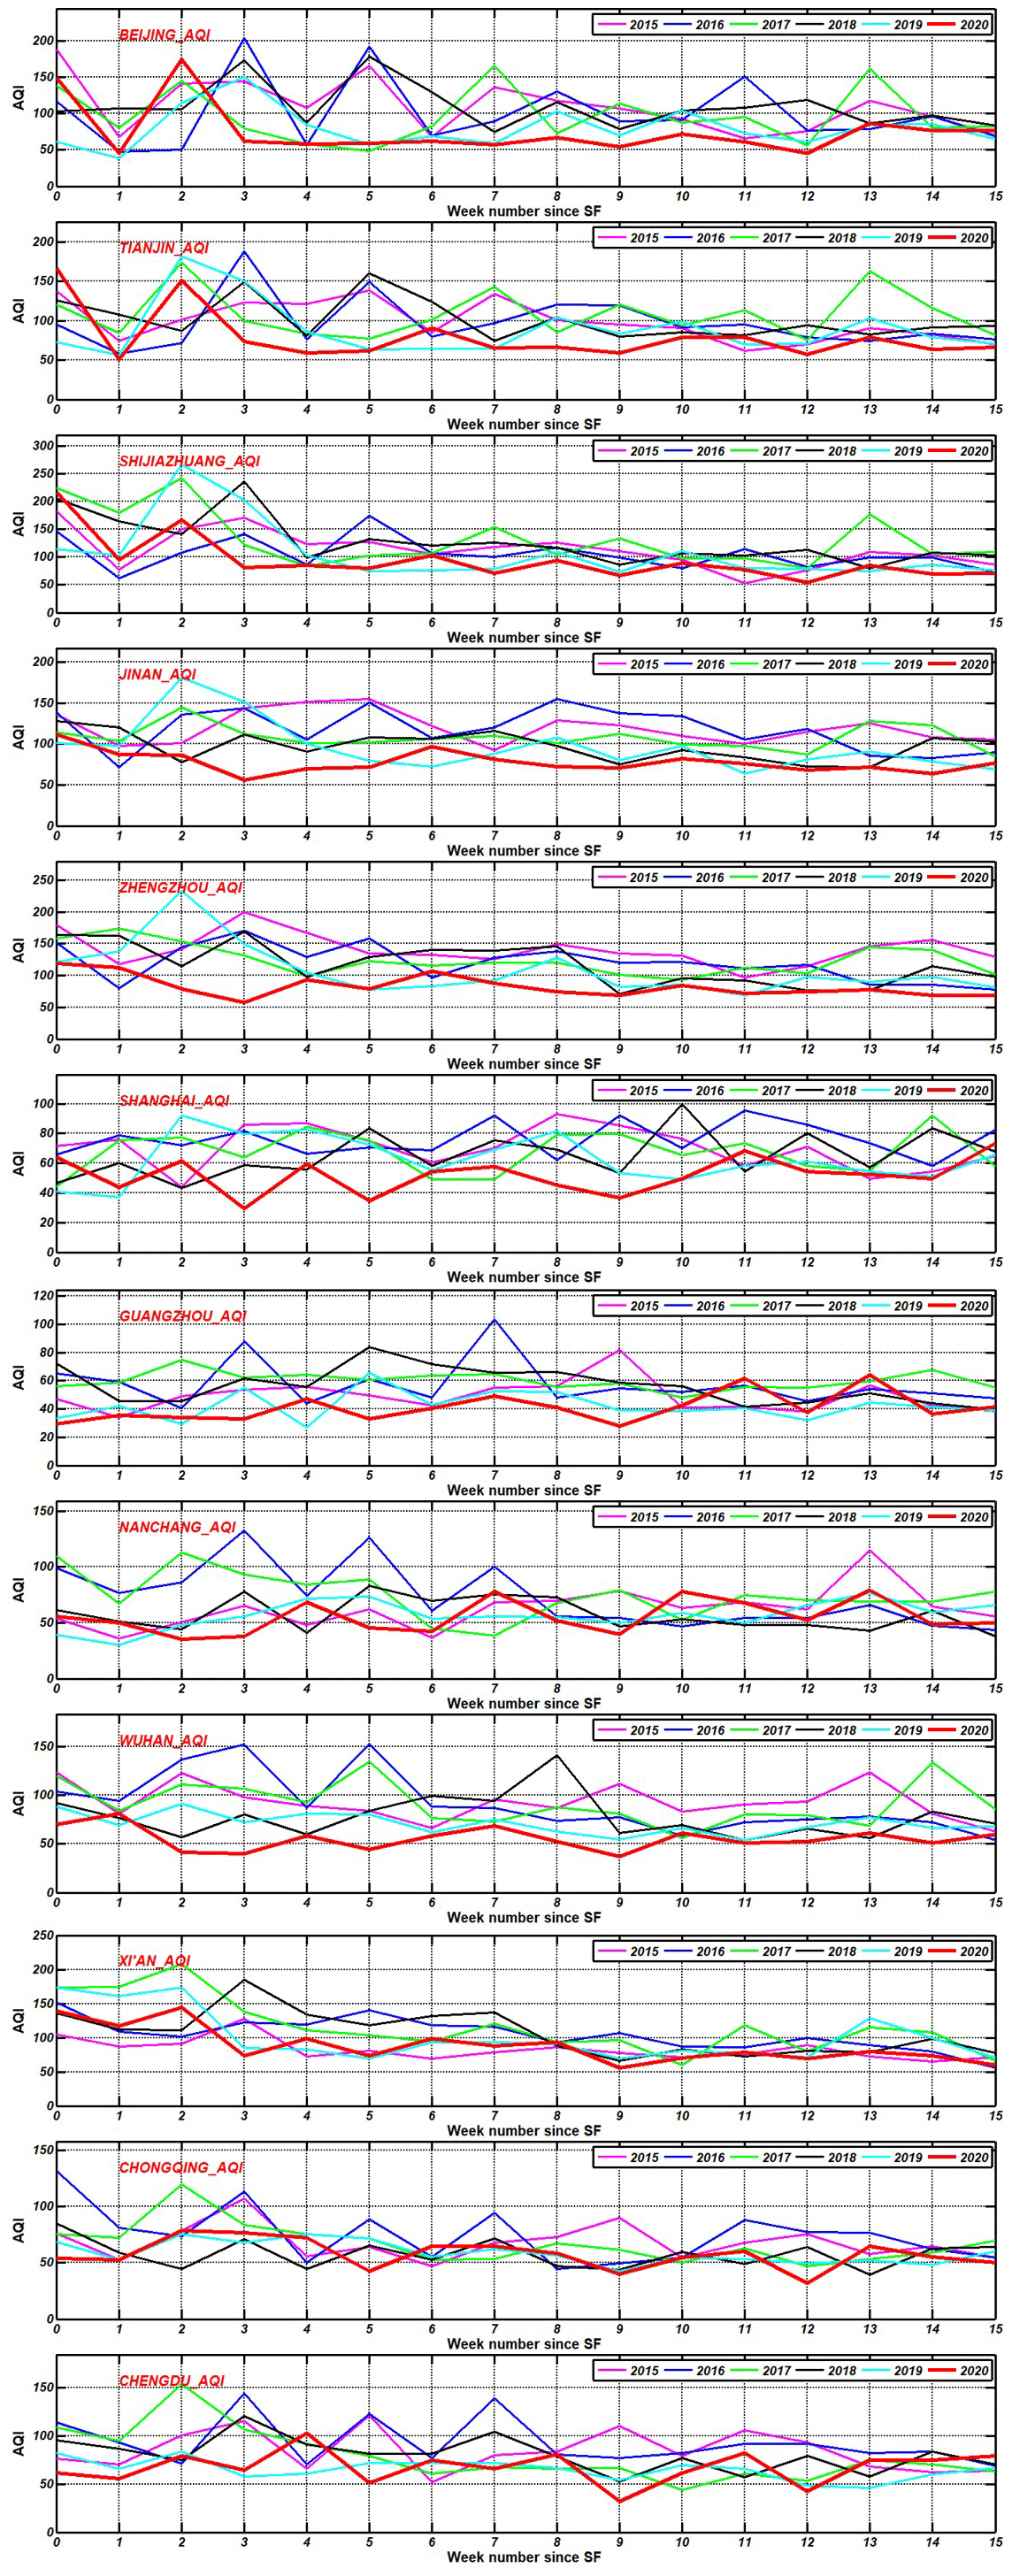
Figure A4Time series of the AQI in 12 cities for the first 16 weeks (week 0 to week 15) after the Spring Festival in 2020, together with AQI time series for the same weeks in 2015–2019. See legend for identification. Note that the vertical scales vary between different cities.
QA4ECV data were prepared in the framework of the EU FP7-SPACE-2013-1 project no. 607405 (Quality Assurance for Essential Climate Variables (QA4ECV); Boersma et al., 2018) and are available at https://doi.org/10.21944/qa4ecv-no2-omi-v1.1 (last access: 4 May 2021). The OMI data are available via the Tropospheric Emission Monitoring Internet Service (TEMIS) https://www.temis.nl/index.php (last access: 4 May 2021) hosted by KNMI (Boersma et al., 2011). The TROPOMI data are available via http://www.5tropomi.eu/data-products/ (last access: 4 May 2021) maintained by KNMI R&D Satellite Observation (van Geffen et al., 2019, 2020). The ground-based monitoring data were downloaded from the National Real-time Air Quality Publishing Platform public website for air quality monitoring data maintained by the China National Environmental Monitoring Center (CNEMC) of the Ministry of Ecology and Environment of China (http://www.mee.gov.cn/; last access: 4 May 2021) (MEE, 2012; Silver et al., 2018; Zhai et al., 2019).
CF, YL and GdL designed the study which was conducted by CF and YL. JD contributed to the data presentation. CF, YL and GdL prepared the article, and ZL and RvdA provided extensive comments and suggestions for the article. All authors discussed the results and read and commented on the paper.
The authors declare that they have no conflict of interest.
This article is part of the special issue “Satellite and ground-based remote sensing of aerosol optical, physical, and chemical properties over China”. It is not associated with a conference.
The authors thank the TEMIS team (Tropospheric Emission Monitoring Internet Service) for maintaining the website and the free use of tropospheric NO2 column data from the OMI sensor from https://www.temis.nl/index.php (last access: 25 April 2021) and the NASA Earth Science Division for the free use of tropospheric products from the TROPOMI (Sentinel-5P) sensor. We also acknowledge the China National Environmental Monitoring Center (CNEMC) of the Ministry of Ecology and Environment of China (MEE) for the provision of the ground-based monitoring data at http://www.mee.gov.cn/ (last access: 25 April 2021). We thank Abdelrazek Elnashar of Cairo University for the Google Earth Engine technical support. The authors thank anonymous reviewers for their effort to critically review the manuscript and for providing constructive comments.
This work was supported by the National Outstanding Youth Foundation of China (grant no. 41925019) and the National Natural Science Foundation of China (grant no. 41671367).
This paper was edited by Stefania Gilardoni and reviewed by two anonymous referees.
Bao, R. and Zhang, A.: Does lockdown reduce air pollution? Evidence from 44 cities in northern China, Sci. Tot. Environ., 731, 139052, https://doi.org/10.1016/j.scitotenv.2020.139052, 2020.
Bauwens, M., Compernolle, S., Stavrakou, T., Müller, J.-F., van Gent, J., Eskes, H., Levelt, P. F., van der A, R., Veefkind, J. P., Vlietinck, J., Yu, H., and Zehner, C.: Impact of Coronavirus Outbreak on NO2 Pollution Assessed Using TROPOMI and OMI Observations, Geophys. Res. Lett., 47, e2020GL087978, https://doi.org/10.1029/2020gl087978, 2020.
Boersma, K. F., Eskes, H. J., Dirksen, R. J., van der A, R. J., Veefkind, J. P., Stammes, P., Huijnen, V., Kleipool, Q. L., Sneep, M., Claas, J., Leitão, J., Richter, A., Zhou, Y., and Brunner, D.: An improved tropospheric NO2 column retrieval algorithm for the Ozone Monitoring Instrument, Atmos. Meas. Tech., 4, 1905–1928, https://doi.org/10.5194/amt-4-1905-2011, 2011.
Boersma, K. F., Eskes, H. J., Richter, A., De Smedt, I., Lorente, A., Beirle, S., van Geffen, J. H. G. M., Zara, M., Peters, E., Van Roozendael, M., Wagner, T., Maasakkers, J. D., van der A, R. J., Nightingale, J., De Rudder, A., Irie, H., Pinardi, G., Lambert, J.-C., and Compernolle, S. C.: Improving algorithms and uncertainty estimates for satellite NO2 retrievals: results from the quality assurance for the essential climate variables (QA4ECV) project, Atmos. Meas. Tech., 11, 6651–6678, https://doi.org/10.5194/amt-11-6651-2018, 2018.
Chen, M., Gong, Y., Li, Y., Lu, D., and Zhang, H.: Population distribution and urbanization on both sides of the Hu Huanyong Line: Answering the Premier's question, J. Geogr. Sci., 26, 1593–1610, https://doi.org/10.1007/s11442-016-1346-4, 2016.
de Leeuw, G., Sogacheva, L., Rodriguez, E., Kourtidis, K., Georgoulias, A. K., Alexandri, G., Amiridis, V., Proestakis, E., Marinou, E., Xue, Y., and van der A, R.: Two decades of satellite observations of AOD over mainland China using ATSR-2, AATSR and MODIS/Terra: data set evaluation and large-scale patterns, Atmos. Chem. Phys., 18, 1573–1592, https://doi.org/10.5194/acp-18-1573-2018, 2018.
Diamond, M. and Wood, R.: Limited Regional Aerosol and Cloud Microphysical Changes Despite Unprecedented Decline in Nitrogen Oxide Pollution During the February 2020 COVID-19 Shutdown in China, Geophys. Res. Lett., 47, 1–12, https://doi.org/10.1029/2020GL088913, 2020.
Ding, J., van der A, R. J., Eskes, H. J., Mijling, B., Stavrakou, T., van Geffen, J. H. G. M., and Veefkind, J. P.: NOx Emissions Reduction and Rebound in China Due to the COVID-19 Crisis, Geophys. Res. Lett., 47, e2020GL089912, https://doi.org/10.1029/2020gl089912, 2020.
Fan, C., Li, Y., Guang, J., Li, Z., Elnashar, A., Allam, M., and de Leeuw, G.: The Impact of the Control Measures during the COVID-19 Outbreak on Air Pollution in China, Remote Sens., 12, 1613, https://doi.org/10.3390/rs12101613, 2020a.
Fan, H., Zhao, C. F., and Yang, Y. K.: A comprehensive analysis of the spatio-temporal variation of urban air pollution in China during 2014-2018, Atmos. Environ., 220, 1–12, https://doi.org/10.1016/j.atmosenv.2019.117066, 2020b.
Filonchyk, M., Hurynovich, V., Yan, H., Gusev, A., and Shpilevskaya, N.: Impact Assessment of COVID-19 on Variations of SO2, NO2, CO and AOD over East China, Aerosol Air Qual. Res., 20, 1530–1540, https://doi.org/10.4209/aaqr.2020.05.0226, 2020.
Hou, X., Zhu, B., Kumar, K. R., de Leeuw, G., Lu, W., Huang, Q., and Zhu, X.: Establishment of conceptual schemas of surface synoptic meteorological situations affecting fine particulate pollution across eastern China in the winter, J. Geophys. Res.-Atmos., 125, e2020JD033153. https://doi.org/10.1029/2020JD033153, 2020.
Huang, X., Ding, A., Gao, J., Zheng, B., Zhou, D., Qi, X., Tang, R., Wang, J., Ren, C., and Nie, W.: Enhanced secondary pollution offset reduction of primary emissions during COVID-19 lockdown in China, National Science Review, 8, nwaa137, https://doi.org/10.1093/nsr/nwaa137, 2020.
Jin, Y., Andersson, H., and Zhang, S.: Air Pollution Control Policies in China: A Retrospective and Prospects, Int. J. Environ. Res. Publ. Health, 12, 1219, https://doi.org/10.3390/ijerph13121219, 2016.
Koukouli, M., Balis, D., van der A, R., Theys, N., Hedelt, P., Richter, A., Krotkov, N., Li, C., and Taylor, M.: Anthropogenic sulphur dioxide load over China as observed from different satellite sensors, Atmos. Environ., 145, 10.1016/j.atmosenv.2016.09.007, 2016.
Krotkov, N. A., McLinden, C. A., Li, C., Lamsal, L. N., Celarier, E. A., Marchenko, S. V., Swartz, W. H., Bucsela, E. J., Joiner, J., Duncan, B. N., Boersma, K. F., Veefkind, J. P., Levelt, P. F., Fioletov, V. E., Dickerson, R. R., He, H., Lu, Z., and Streets, D. G.: Aura OMI observations of regional SO2 and NO2 pollution changes from 2005 to 2015, Atmos. Chem. Phys., 16, 4605–4629, https://doi.org/10.5194/acp-16-4605-2016, 2016.
Le, T., Wang, Y., Liu, L., Yang, J., Yung, Y., Li, G., and Seinfeld, J.: Unexpected air pollution with marked emission reductions during the COVID-19 outbreak in China, Science, 369, eabb7431, https://doi.org/10.1126/science.abb7431, 2020.
Levelt, P. F., Joiner, J., Tamminen, J., Veefkind, J. P., Bhartia, P. K., Stein Zweers, D. C., Duncan, B. N., Streets, D. G., Eskes, H., van der A, R., McLinden, C., Fioletov, V., Carn, S., de Laat, J., DeLand, M., Marchenko, S., McPeters, R., Ziemke, J., Fu, D., Liu, X., Pickering, K., Apituley, A., González Abad, G., Arola, A., Boersma, F., Chan Miller, C., Chance, K., de Graaf, M., Hakkarainen, J., Hassinen, S., Ialongo, I., Kleipool, Q., Krotkov, N., Li, C., Lamsal, L., Newman, P., Nowlan, C., Suleiman, R., Tilstra, L. G., Torres, O., Wang, H., and Wargan, K.: The Ozone Monitoring Instrument: overview of 14 years in space, Atmos. Chem. Phys., 18, 5699–5745, https://doi.org/10.5194/acp-18-5699-2018, 2018.
Li, K., Liao, H., Cai, W., and Yang, Y.: Attribution of Anthropogenic Influence on Atmospheric Patterns Conducive to Recent Most Severe Haze Over Eastern China, Geophys. Res. Lett., 45, 2072-2081, https://doi.org/10.1002/2017gl076570, 2018.
Li, M., Wang, T., Xie, M., Li, S., Zhuang, B., Fu, Q., Zhao, M., Wu, H., Liu, J., Saikawa, E., and Liao, K.: Drivers for the poor air quality conditions in North China Plain during the COVID-19 outbreak, Atmos. Environ., 246, 118103, https://doi.org/10.1016/j.atmosenv.2020.118103, 2020.
Liu, F., Page, A., Strode, S. A., Yoshida, Y., Choi, S., Zheng, B., Lamsal, L. N., Li, C., Krotkov, N. A., Eskes, H., van der A, R., Veefkind, P., Levelt, P. F., Hauser, O. P., and Joiner, J.: Abrupt decline in tropospheric nitrogen dioxide over China after the outbreak of COVID-19, Sci. Adv., 6, 1–6, https://doi.org/10.1126/sciadv.abc2992, 2020.
Lorente, A., Folkert Boersma, K., Yu, H., Dörner, S., Hilboll, A., Richter, A., Liu, M., Lamsal, L. N., Barkley, M., De Smedt, I., Van Roozendael, M., Wang, Y., Wagner, T., Beirle, S., Lin, J.-T., Krotkov, N., Stammes, P., Wang, P., Eskes, H. J., and Krol, M.: Structural uncertainty in air mass factor calculation for NO2 and HCHO satellite retrievals, Atmos. Meas. Tech., 10, 759–782, https://doi.org/10.5194/amt-10-759-2017, 2017.
MEP (Ministry of Environmental Protection of the People's Republic of China): Technical Regulation on Ambient Air Quality Index (on Trial): HJ 633-2012, 2012.
Ministry of Environmental Protection of the People's Republic of China: Ambient Air Quality Standards (GB3095-2012), MEE, 2012.
Schoeberl, M., Douglass, A., Hilsenrath, E., Bhartia, P., Beer, R., Waters, J., Gunson, M., Froidevaux, L., Gille, J., Barnett, J., Levelt, P., and DeCola, P.: Overview of the EOS Aura mission, Geoscience and Remote Sensing, IEEE Transactions on, 44, 1066–1074, https://doi.org/10.1109/TGRS.2005.861950, 2006.
Shah, V., Jacob, D. J., Li, K., Silvern, R. F., Zhai, S., Liu, M., Lin, J., and Zhang, Q.: Effect of changing NOx lifetime on the seasonality and long-term trends of satellite-observed tropospheric NO2 columns over China, Atmos. Chem. Phys., 20, 1483–1495, https://doi.org/10.5194/acp-20-1483-2020, 2020.
Shi, X. and Brasseur, G. P.: The Response in Air Quality to the Reduction of Chinese Economic Activities During the COVID-19 Outbreak, Geophys. Res. Lett., 47, e2020GL088070, https://doi.org/10.1029/2020gl088070, 2020.
Silver, B., Reddington, C., Arnold, S., and Spracklen, D.: Substantial changes in air pollution across China during 2015 to 2017, Environ. Res. Lett., 13, 1–2, https://doi.org/10.1088/1748-9326/aba3a2, 2018.
Sogacheva, L., Rodriguez, E., Kolmonen, P., Virtanen, T. H., Saponaro, G., de Leeuw, G., Georgoulias, A. K., Alexandri, G., Kourtidis, K., and van der A, R. J.: Spatial and seasonal variations of aerosols over China from two decades of multi-satellite observations – Part 2: AOD time series for 1995–2017 combined from ATSR ADV and MODIS C6.1 and AOD tendency estimations, Atmos. Chem. Phys., 18, 16631–16652, https://doi.org/10.5194/acp-18-16631-2018, 2018.
van der A, R. J., Mijling, B., Ding, J., Koukouli, M. E., Liu, F., Li, Q., Mao, H., and Theys, N.: Cleaning up the air: effectiveness of air quality policy for SO2 and NOx emissions in China, Atmos. Chem. Phys., 17, 1775–1789, https://doi.org/10.5194/acp-17-1775-2017, 2017.
van Geffen, J., Eskes, H. J., Boersma, K. F., Maasakkers, J. D., and Veefkind, J. P.: TROPOMI ATBD of the total and tropospheric NO2 data products, Royal Netherlands Meteorological Institute, #S5P-KNMI-L2-0005-RP, issue 1.4.0, 6 February 2019, 2019.
van Geffen, J., Boersma, K. F., Eskes, H., Sneep, M., ter Linden, M., Zara, M., and Veefkind, J. P.: S5P TROPOMI NO2 slant column retrieval: method, stability, uncertainties and comparisons with OMI, Atmos. Meas. Tech., 13, 1315–1335, https://doi.org/10.5194/amt-13-1315-2020, 2020.
Veefkind, J. P., Aben, I., McMullan, K., Förster, H., de Vries, J., Otter, G., Claas, J., Eskes, H. J., de Haan, J. F., Kleipool, Q., van Weele, M., Hasekamp, O., Hoogeveen, R., Landgraf, J., Snel, R., Tol, P., Ingmann, P., Voors, R., Kruizinga, B., Vink, R., Visser, H., and Levelt, P. F.: TROPOMI on the ESA Sentinel-5 Precursor: A GMES mission for global observations of the atmospheric composition for climate, air quality and ozone layer applications, Remote Sens Environ, 120, 70–83, https://doi.org/10.1016/j.rse.2011.09.027, 2012.
Wang, H., Jianghao, L., Yue, P., Meng, Z., Huizheng, C., and Xiaoye, Z.: The impacts of the meteorology features on PM2.5 levels during a severe haze episode in central-east China, Atmos. Environ., 197, 1–13, https://doi.org/10.1016/j.atmosenv.2018.10.001, 2018a.
Wang, X., Wei, W., Cheng, S., Li, J., Zhang, H., and Lv, Z.: Characteristics and classification of PM2.5 pollution episodes in Beijing from 2013 to 2015, Sci. Tot. Environ., 612, 170–179, https://doi.org/10.1016/j.scitotenv.2017.08.206, 2018b.
Wang, H., Li, J., Peng, Y., Zhang, M., Che, H., and Zhang, X.: The impacts of the meteorology features on PM2.5 levels during a severe haze episode in central-east China, Atmos. Environ., 197, 177-189, https://doi.org/10.1016/j.atmosenv.2018.10.001, 2019.
Wang, Q. and Su, M.: A preliminary assessment of the impact of COVID-19 on environment – A case study of China, Sci. Tot. Environ., 728, 138915, https://doi.org/10.1016/j.scitotenv.2020.138915, 2020.
Wang, Y., Yu, M., Wang, Y., Tang, G., Song, T., Zhou, P., Liu, Z., Hu, B., Ji, D., Wang, L., Zhu, X., Yan, C., Ehn, M., Gao, W., Pan, Y., Xin, J., Sun, Y., Kerminen, V.-M., Kulmala, M., and Petäjä, T.: Rapid formation of intense haze episodes via aerosol-boundary layer feedback in Beijing, Atmos. Chem. Phys., 20, 45–53, https://doi.org/10.5194/acp-20-45-2020, 2020a.
Wang, P., Chen, K., Zhu, S., Wang, P., and Zhang, H.: Severe air pollution events not avoided by reduced anthropogenic activities during COVID-19 outbreak, Resources, Conserv. Recycl., 158, 104814, https://doi.org/10.1016/j.resconrec.2020.104814, 2020b.
Xue, Y., Li, Y., Guang, J., Tugui, A., She, L., Qin, K., Fan, C., Che, Y., Xie, Y., Wen, Y., and Wang, Z.: Hourly PM2.5 Estimation over Central and Eastern China Based on Himawari-8 Data, Remote Sens., 12, 1–15, https://doi.org/10.3390/rs12050855, 2020.
Yuan, G. and Yang, W.: Evaluating China's Air Pollution Control Policy with Extended AQI Indicator System: Example of the Beijing-Tianjin-Hebei Region, Sustainability, 11, 939, https://doi.org/10.3390/su11030939, 2019.
Zara, M., Boersma, K. F., De Smedt, I., Richter, A., Peters, E., van Geffen, J. H. G. M., Beirle, S., Wagner, T., Van Roozendael, M., Marchenko, S., Lamsal, L. N., and Eskes, H. J.: Improved slant column density retrieval of nitrogen dioxide and formaldehyde for OMI and GOME-2A from QA4ECV: intercomparison, uncertainty characterisation, and trends, Atmos. Meas. Tech., 11, 4033–4058, https://doi.org/10.5194/amt-11-4033-2018, 2018.
Zhai, S., Jacob, D. J., Wang, X., Shen, L., Li, K., Zhang, Y., Gui, K., Zhao, T., and Liao, H.: Fine particulate matter (PM2.5) trends in China, 2013–2018: separating contributions from anthropogenic emissions and meteorology, Atmos. Chem. Phys., 19, 11031–11041, https://doi.org/10.5194/acp-19-11031-2019, 2019.
Zhang, J., Reid, J. S., Alfaro-Contreras, R., and Xian, P.: Has China been exporting less particulate air pollution over the past decade?, Geophys. Res. Lett., 44, 2941–2948, https://doi.org/10.1002/2017GL072617, 2017.
Zhang, R., Zhang, Y., Lin, H., Feng, X., Fu, T.-M., and Wang, Y.: NOx Emission Reduction and Recovery during COVID-19 in East China, Atmosphere-Basel, 11, 1–15, https://doi.org/10.3390/atmos11040433, 2020a.
Zhang, K., de Leeuw, G., Yang, Z., Chen, X., and Jiao, J.: The Impacts of the COVID-19 Lockdown on Air Quality in the Guanzhong Basin, China, Remote Sens., 12, 3042, https://doi.org/10.3390/rs12183042, 2020b.
Zhao, B., Jiang, J. H., Gu, Y., Diner, D., Worden, J., Liou, K.- N., Su, H., Xing, J., Garay, M., and Huang, L.: Decadalscale trends in regional aerosol particle properties and their linkage to emission changes, Environ. Res. Lett., 12, 054021, https://doi.org/10.1088/1748-9326/aa6cb2, 2017.
Zhao, N., Wang, G., Li, G., Lang, J., and Zhang, H.: Air pollution episodes during the COVID-19 outbreak in the Beijing–Tianjin–Hebei region of China: An insight into the transport pathways and source distribution, Environ. Pollut., 267, 1–11, https://doi.org/10.1016/j.envpol.2020.115617, 2020.
Zheng, B., Tong, D., Li, M., Liu, F., Hong, C., Geng, G., Li, H., Li, X., Peng, L., Qi, J., Yan, L., Zhang, Y., Zhao, H., Zheng, Y., He, K., and Zhang, Q.: Trends in China's anthropogenic emissions since 2010 as the consequence of clean air actions, Atmos. Chem. Phys., 18, 14095–14111, https://doi.org/10.5194/acp-18-14095-2018, 2018.
Zhong, J., Zhang, X., Dong, Y., Wang, Y., Liu, C., Wang, J., Zhang, Y., and Che, H.: Feedback effects of boundary-layer meteorological factors on cumulative explosive growth of PM2.5 during winter heavy pollution episodes in Beijing from 2013 to 2016, Atmos. Chem. Phys., 18, 247–258, https://doi.org/10.5194/acp-18-247-2018, 2018.