the Creative Commons Attribution 4.0 License.
the Creative Commons Attribution 4.0 License.
 | 18 May 2021
Future changes in Beijing haze events under different anthropogenic aerosol emission scenarios
Lixia Zhang
Laura J. Wilcox
Nick J. Dunstone
David J. Paynter
Shuai Hu
Massimo Bollasina
Donghuan Li
Jonathan K. P. Shonk
Liwei Zou
Air pollution is a major issue in China and one of the largest threats to public health. We investigated future changes in atmospheric circulation patterns associated with haze events in the Beijing region and the severity of haze events during these circulation conditions from 2015 to 2049 under two different aerosol scenarios: a maximum technically feasible aerosol reduction (MTFR) and a current legislation aerosol scenario (CLE). In both cases greenhouse gas emissions follow the Representative Concentration Pathway 4.5 (RCP4.5). Under RCP4.5 with CLE aerosol the frequency of circulation patterns associated with haze events increases due to a weakening of the East Asian winter monsoon via increased sea level pressure over the North Pacific. The rapid reduction in anthropogenic aerosol and precursor emissions in MTFR further increases the frequency of circulation patterns associated with haze events, due to further increases in the sea level pressure over the North Pacific and a reduction in the intensity of the Siberian high. Even with the aggressive aerosol reductions in MTFR periods of poor visibility, represented by above-normal aerosol optical depth (AOD), still occur in conjunction with haze-favorable atmospheric circulation. However, the winter mean intensity of poor visibility decreases in MTFR, so that haze events are less dangerous in this scenario by 2050 compared to CLE and relative to the current baseline. This study reveals the competing effects of aerosol emission reductions on future haze events through their direct contribution to pollutant source and their influence on the atmospheric circulation. A compound consideration of these two impacts should be taken in future policy making.
- Article
(10861 KB) - Full-text XML
-
Supplement
(3682 KB) - BibTeX
- EndNote


The increases in aerosol and precursor emissions in China due to the rapid economic development and urbanization in recent decades have caused more frequent and severe haze events. Beijing and the surrounding area is the most polluted region in China (Niu et al., 2010; Ding and Liu, 2014; An et al., 2019; Chen and Wang, 2015). Air pollution has become one of the major issues in China and the greatest threat to public health. Since the implementation of the “Atmospheric Pollution Prevention and Control Action Plan” in 2013 (China State Council, 2013), aerosol emissions have dramatically decreased, with sulfur dioxide (SO2) reduced by 59 % in 2017 compared to 2013 (Zheng et al., 2018). However, haze events have still occurred regularly in recent years, as, in addition to being influenced by aerosol emissions, meteorological conditions, including limited scavenging, dispersion and ventilation, have been found to play important roles in the variation in air quality in northern China (An et al., 2019; Pei et al., 2018; Cai et al., 2017). Such events are typically associated with the occurrence of large-scale atmospheric circulation patterns favoring the accumulation of pollutants (Chen and Wang, 2015; Zhang et al., 2014). Locally, a strong temperature inversion in the lower troposphere, weak surface winds, and subsiding air in the planetary boundary layer are favorable for the development and persistence of haze events (Wu et al., 2017; Feng et al., 2018). As anthropogenic aerosol has the potential to induce changes in the atmospheric circulation, in addition to making a direct contribution to the chemical composition of haze, it is crucial to understand how changes in aerosol emissions might contribute to the frequency and intensity of haze events in future.
On interannual timescales, the East Asian winter monsoon (EAWM) is significantly negatively correlated with aerosol concentrations in Beijing, due to the associated high frequency of extreme anomalous southerly episodes in North China, a weakened East Asian trough in the mid-troposphere and a northward shift of the East Asian jet stream in the upper troposphere (Jeong and Park, 2017; Li et al., 2016; Pei et al., 2018). The cold air process over Beijing is favorable for pollutant dispersion and transport outside because of the accompanying large near-surface wind speed and deep mixing layer. A low occurrence of cold air processes in the recent winters of 2013, 2014 and 2017 has resulted in severe pollution (He et al., 2018). In the past decades, the weakening of the EAWM was found to contribute to the increased frequency of haze events over North China (Chen and Wang, 2015; An et al., 2019). Arctic sea ice extent also has been linked to increased stability over eastern China, explaining 45 %–67 % of the interannual to interdecadal variability of winter haze days over eastern China (Wang et al., 2015). Overall, around half of the variability in the frequency of haze events in Beijing is controlled by meteorological conditions, while both meteorological conditions and aerosol emissions contribute to the intensity (Pei et al., 2020). Internal climate variability has contributed to the rapid increase in early winter haze days in North China since 2010 (Zhang et al., 2020).
Anthropogenic forcing, estimated by using large-ensemble runs with and without anthropogenic forcings, has also increased the probability of the atmospheric patterns conducive to severe haze in Beijing by weakening the EAWM (Li et al., 2018). Projections based on Coupled Model Intercomparison Project Phase 5 (CMIP5) models showed that weather conditions conducive to haze events in Beijing or eastern China will increase with global warming (Horton et al., 2012, 2014), due to an increased occurrence of stagnation days in response to both accelerated Arctic ice melting (Cai et al., 2017; Liu et al., 2019a) and a continued weakening of EAWM (Pei and Yan, 2018; Liu et al., 2019a). If there is no change in aerosol emission in future, increased stagnation days and decreased light-precipitation days associated with global warming would also cause an increase in air pollution days in eastern China (Chen et al., 2019). Regional climate model simulations under the Representative Concentration Pathway 4.5 (RCP4.5) scenario showed that the air environment carrying capacity, a combined metric measuring the capacity of the atmosphere to transport and dilute pollutants, tends to decrease in the 21st century across China (Han et al., 2017). However, there is a large uncertainty in future aerosol emission pathways, with uncertainty around the sign of the change in global emission rate as well as choice of haze index and internal climate variability (Scannell et al., 2019; Callahan et al., 2019; Callahan and Mankin, 2020). Furthermore, changes in aerosol emission may influence the haze-favorable atmospheric circulation, in addition to their role in haze composition.
The interplay between the role of aerosol as a constituent of haze and as a potential driver of changes in the circulation patterns conducive to haze has yet to be explored. If the rapid reductions in aerosol and precursor emissions currently underway in China continue in future, understanding the balance between the different influences of anthropogenic aerosol forcing on haze events is a key question. Typically, anthropogenic aerosol (AA) and greenhouse gases (GHGs) both vary in the future (e.g., those following the RCPs or shared socioeconomic pathways), which can make their relative contributions difficult to determine. In this work, we examine future scenarios with the same GHGs emission pathway but different aerosol pathways in order to separate the role of AA forcing. We address the following two questions. (1) Do the atmospheric conditions conducive to haze events change differently under different AA scenarios? (2) If so, how does AA forcing modulate the frequency of haze-favorable circulation and how does the severity of the haze events change?
The remainder of the paper is organized as follows: we briefly introduce the experiment design and methods in Sect. 2 and show the atmospheric circulation patterns conducive to Beijing haze events in Sect. 3. Projected Beijing haze events under two different aerosol emissions and the underlying mechanism of projected circulation changes will be given in Sect. 4. We will finally provide the summary and discussion in Sect. 5.
2.1 Data and experiment design
We use observed daily visibility, relative humidity and wind speed from 1974 to 2013 from the National Climatic Data Center (NCDC) Global Surface Summary of the Day (GSOD) database (Fig. S1a). Haze days are defined as days with daily visibility less than 10 km, relative humidity less than 90 % and surface wind speed less than 7 m s−1 (Chen and Wang, 2015). The observed haze occurrence is the number of haze days, and observed haze intensity is defined as the minimum 3 d consecutive visibility (VN3day). Spatial distributions of winter mean haze occurrence and VN3day are shown in Fig. S1b and c. Data from the Japanese 55-year Reanalysis (JRA55; Kobayashi et al., 2015) dataset for the period 1958–2013 are used in this study to evaluate the model representations of the present-day climate. The variations in haze index derived from JRA-55 are highly consistent with those from NCEP–NCAR reanalysis (not shown). We only use JRA-55 in this study.
Simulations with the Met Office Unified Model (Global Coupled configuration 2) HadGEM3-GC2 (Williams et al., 2015) and the NOAA Geophysical Fluid Dynamics Laboratory (GFDL) Climate Model version 3 (GFDL-CM3; Donner et al., 2011; Griffies et al., 2011) are used to investigate the impact of different aerosol forcing scenarios. HadGEM3-GC2 is run with a horizontal resolution of N216 (∼60 km) in the atmosphere and ∘ in the ocean. GFDL-CM3 has a horizontal resolution of ∼200 km in the atmosphere and 1∘ in the ocean. Both models include a representation of aerosol–cloud interactions (Ming et al., 2006; Bellouin et al., 2011).
Three sets of experiments were carried out with each model (Table S1): a historical experiment from 1965 to 2014 and two experiments for the future (2015–2050). In the historical experiment, greenhouse gases and anthropogenic aerosol and precursor emissions are taken from CMIP5 (Lamarque et al., 2010; Taylor et al., 2012). The future experiments have common GHG emissions following the RCP4.5 scenario but different aerosol emission pathways. The aerosol pathways are the current legislation emissions (CLEs) and the maximum technically feasible reduction (MTFR) taken from the ECLIPSE V5a global emission dataset (Amann et al., 2015, https://iiasa.ac.at/web/home/research/researchPrograms/air/ECLIPSEv5a.html, last access: 9 May 2021). In CLE, anthropogenic aerosol emissions are assumed to evolve following the current legislation, resulting in a moderate global increase by 2050. In contrast, MTFR assumes a full implementation of the most advanced technology presently available to reduce aerosol emissions by 2030, which results in their rapid global decrease over this period. The regional changes in AA for the baseline (His), CLE and MTFR can be found in Scannell et al. (2019) and Luo et al. (2020).
We use 1984–2013 as His and 2015–2049 as the future period and display anomalies between the two. Compared with His, CLE shows a dramatic increase in SO2 over Asia, with peak values over India (not shown) and eastern China (Fig. S2a). MTFR has similar changes over Europe to CLE, negligible changes over India (not shown) and a dipole over China, with a weak increase to the north and a decrease to the south (Fig. S2b). Thus, a dramatic decrease in SO2 in MTFR relative to CLE is seen over the whole Asian continent, particularly over the Beijing region (Fig. S2c).
2.2 Haze weather index and East Asian winter monsoon index
We focus on haze events during the winter (December–February) around Beijing, where Chinese haze events are most frequent and severe (Niu et al., 2010; Chen and Wang, 2015). In this study, we use the haze weather index (HWI) proposed by Cai et al. (2017) as it has also been shown to have a strong relationship with PM2.5 concentrations in Beijing.
The HWI comprises three constituent terms representing the vertical temperature gradient in the troposphere (ΔT), the 850 hPa meridional wind (V850) and the north–south shear in the 500 hPa zonal wind (U500) (see boxes and lines in Fig. 1). ΔT is calculated as the difference between the 850 hPa temperature averaged over 32.5∘–45∘ N, 112.5∘–132.5∘ E and the 250 hPa temperature averaged over 37.5∘–45∘ N, 122.5∘–137.5∘ E. V850 is the 850 hPa meridional wind averaged over the broader Beijing region (30∘–47.5∘ N, 115∘–130∘ E), and U500 is a latitudinal difference between the 500 hPa zonal wind averaged over a region to the north of Beijing (42.5∘–52.5∘ N, 110∘–137.5∘ E) and a region to the south (27.5∘–37.5∘ N, 110∘–137.5∘ E). Each of the three terms is normalized by their standard deviation over the reference period (here 1984–2013). The three variables are added together to create the HWI, which is then normalized again by its standard deviation over the reference period. A positive HWI represents conditions that are unfavorable to air-pollutant dispersion, and days with HWI >0 are regarded as “haze events”. The HWI defined by Cai et al. (2017) made use of daily data. Due to the unavailability of model data at daily resolution, we instead used monthly data. The reliability of using HWI calculated from monthly mean variables will be discussed in Sect. 3 based on reanalysis.

Figure 1Composite circulation anomalies from JRA-55 with HWI-daily >0 (a, c, e) and HWI-month ≥1 (b, d, f) for 1958–2013. (a, b) Temperature (K) along 40∘ N; (c, d) 500 hPa winds (vector, m s−1) and their zonal component (shading, m s−1). Panels (e, f): 850 hPa winds (vector, m s−1) and their meridional component (shading, m s−1). The green boxes and lines indicate the regions used to calculate the three components of HWI.
The strength of the EAWM is quantified using the index defined by Wang and Chen (2014). This index takes into account both the east–west and the north–south pressure gradients and is defined as
where SLP1, SLP2 and SLP3 represent normalized sea level pressure (SLP) averaged over Siberia (40–60∘ N, 70–120∘ E), the North Pacific (30–50∘ N, 140∘ E–170∘ W) and the Maritime Continent (20∘ S–10∘ N, 110–160∘ E), respectively (see the boxes in Fig. S3). The three components are converted to anomalies and normalized by their standard deviation over the reference period (here 1984–2013). As the EAWM is directly linked to the occurrence of favorable conditions for haze in Beijing (Pei et al., 2018; Liu et al., 2019b; Hori et al., 2006), we therefore use this index as an additional metric to assess the potential changes in future haze events under the CLE and MTFR scenarios and confirm the robustness of the changes indicated by HWI.
2.3 Significance test
To test whether projected winter mean HWI change and frequency of month with HWI ≥1 are statistically significant, we estimated internal variability by performing a Monte Carlo approach (Zhang and Delworth, 2018). We first randomly select a 90-month (to mimic the December–January–February, DJF, months for 1984–2013) period from all simulations of the baseline and calculate the time-mean HWI and frequency of months with HWI ≥1 of this sample. Then, we calculate differences between this sample and the ensemble mean of the baseline. The differences result only from internal climate variability. We repeat the first step 5000 times, and the 5000 bootstrapped samples can be viewed as internal variability of the baseline. For the future projections, we did a similar calculation as for the baseline but by randomly selecting a 105-month period (to mimic DJF months for 2015–2049) from the projection and calculate its difference with the baseline. We then compare the medium anomalies of the future projection with the ranges of the bootstrapped samples. When the median from the future projection falls outside the interquartile range of the baseline, we then claim that the projected changes are statistically significant (Wilcox et al., 2020). We also employed a two-sample Kolmogorov–Smirnov test to determine if the probability density function (PDF) distributions are significantly different (Chakravarti et al., 1967).
The circulation anomalies averaged over the days with daily HWI >0 are shown in Fig. 1a, c and e. The vertical temperature profile shows warmer air at the lower to mid-levels, centered around 850 hPa, and cold anomalies aloft 250 hPa (Fig. 1a). Thus, the atmosphere is stable and unfavorable for the vertical dispersion of pollutants. In the midlatitudes (500 hPa), we see northward-shifted mid-level westerly jets (Fig. 1c). The weakened westerly winds along 30∘ N inhibit the horizontal dispersion of pollutants in Beijing. At the lower-level, the anomalous southerly winds at 850 hPa along the East Asian coast lead to a reduction in the prevailing surface cold northerlies in winter (Fig. 1e). This reduction favors warmer conditions at lower levels and increased moisture over Beijing, thus increasing the likelihood of haze formation and maintenance.
The HWI was defined based on daily data. Due to limitations in data availability, we instead used monthly data to calculate HWI. To determine the reliability of this approach, we first examined the relationship between the magnitude of HWI calculated from monthly data (HWI-month) and the number of days with daily HWI (HWI-daily) >0 in the JRA-55 reanalysis during the period 1958–2013 (Fig. 2a, b). The variability of HWI-month is highly consistent with that of the number of days with HWI-daily >0 (r=0.97). When HWI-month is greater than 0, about 50 % days in that month are recognized with HWI-daily >0 and up to 62 % days with HWI-daily >0 when HWI-month ≥1. In this study, we define favorable climatic conditions of haze events around Beijing as a month where HWI-month ≥1.
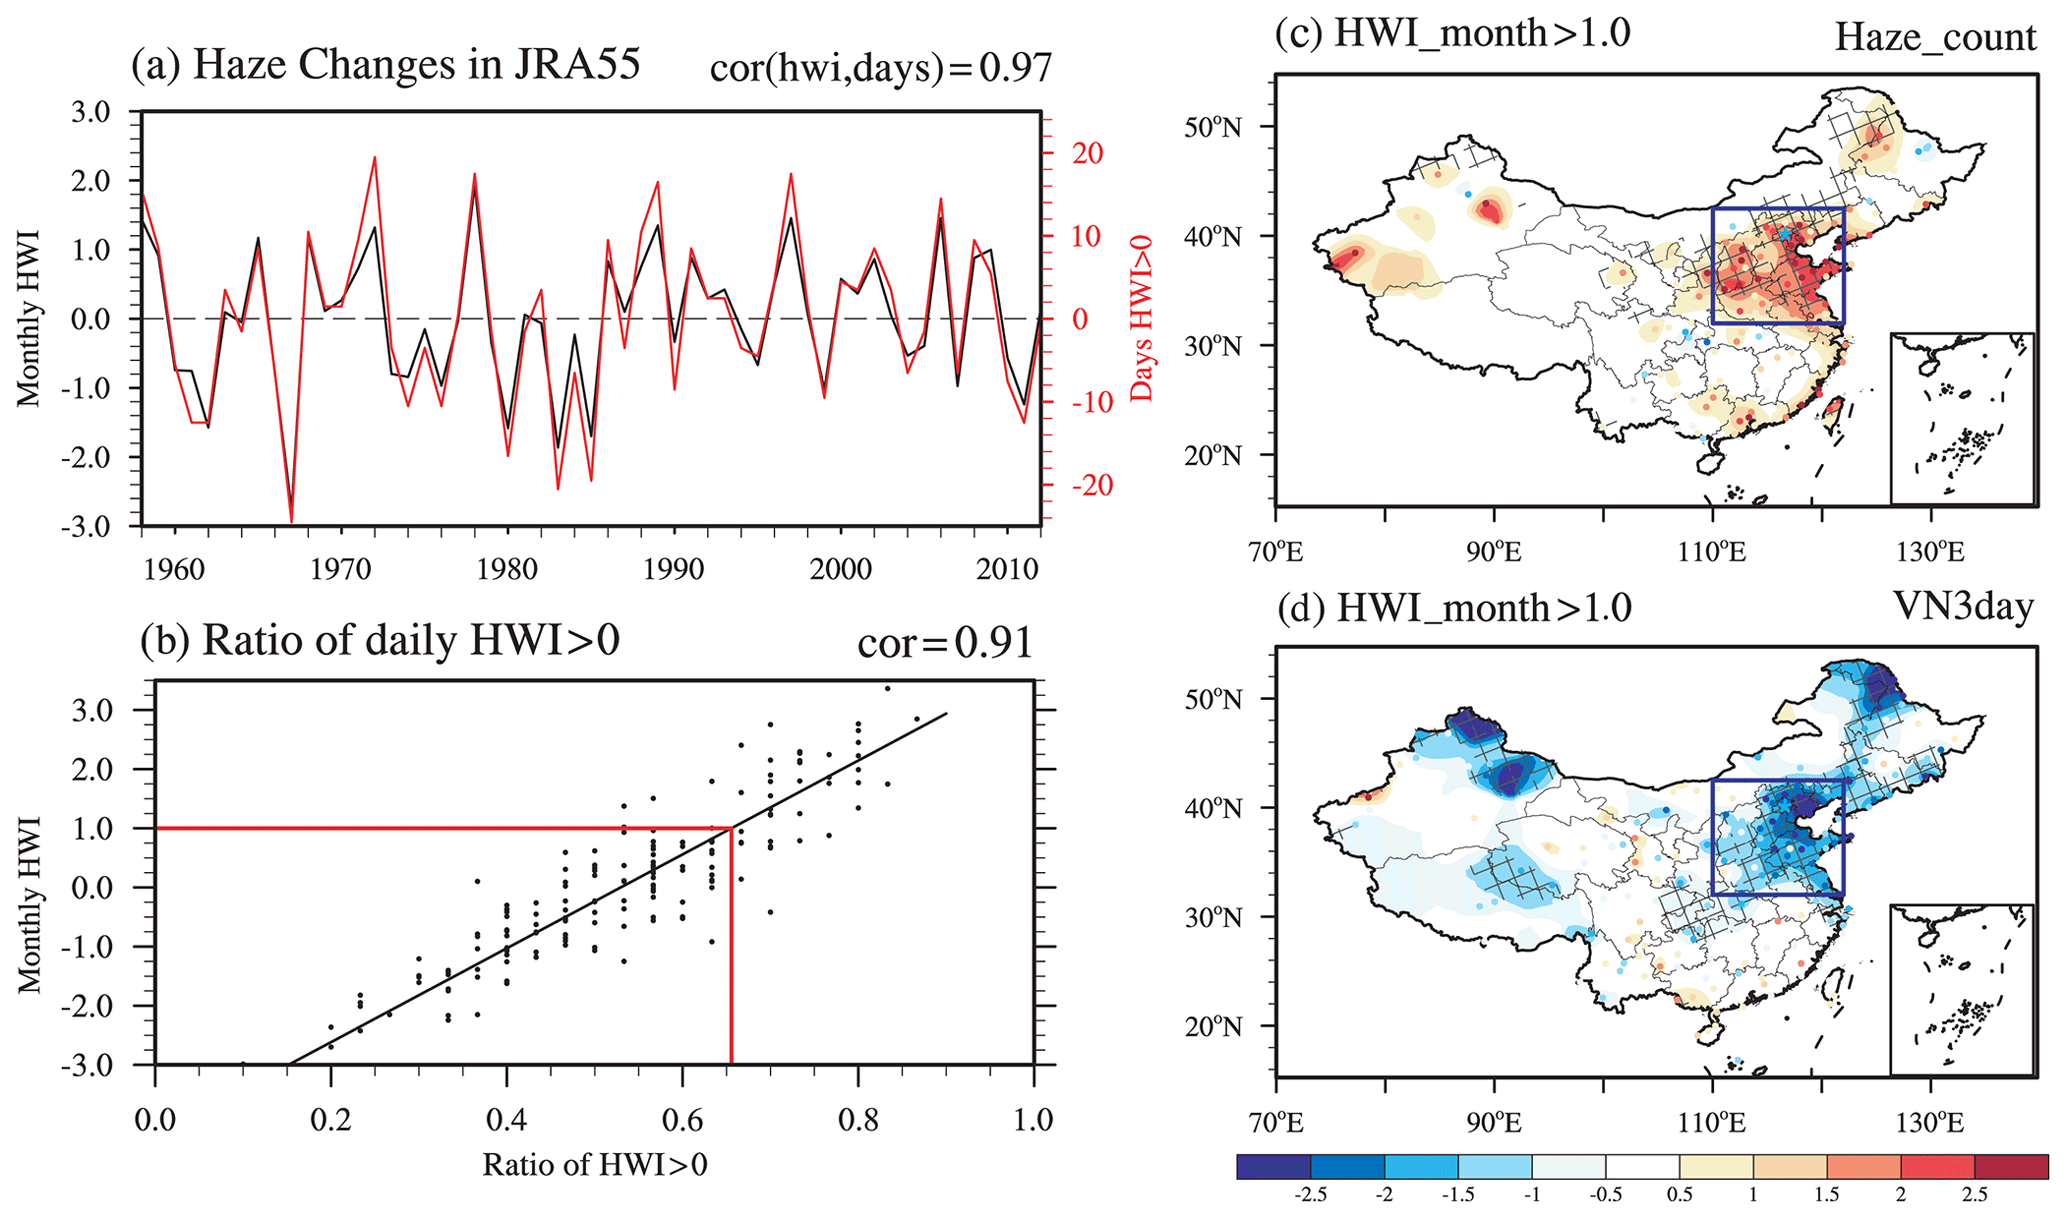
Figure 2Changes in winter HWI from 1958 to 2013 in JRA-55 reanalysis relative to 1958–2013 winter mean. (a) DJF mean monthly-based HWI (HWI-month, black line) and the anomalous days with daily based HWI >0 (HWI-daily; red line; unit: day); (b) scatterplot of HWI-month of December, January and February (y axis) and the ratio of days with HWI-daily >0 (x axis) in each winter month. HWI-month and HWI-daily are the HWI calculated from monthly data and daily data, respectively. Panels (c–d) show the anomalies of haze occurrence and the VN3day when HWI ≥1, where VN3day is the minimum 3 d consecutive visibility. Hatched area in (c–d) is statistically significant at the 10 % level using a Student's t test.
We also checked the observed winter haze occurrence and intensity (VN3day) anomalies when HWI-month ≥1. More haze occurrence and reduced visibility are observed over North China, indicating the reliability of using HWI-month ≥1 as a proxy of the favorable climatic conditions for the haze events in Beijing and the surrounding region. The selection of a higher threshold of HWI-month (e.g., 1.5) does not make a great difference to our results (not shown). The circulation anomalies averaged over HWI-month ≥1 (Fig. 1b, d, f) and HWI-daily >0 (Fig. 1a, c, e) are also consistent with each other, except that the anomalies for HWI-month ≥1 are weaker, as would be expected. The spatial and temporal consistency of HWI anomalies calculated from monthly and daily data confirms the suitability of our use of monthly data to explore changes in the frequency of Beijing haze events associated circulation. In the following sections, we will use the term HWI to indicate HWI-month for brevity.
4.1 Changes in the frequency of haze-favorable circulation patterns
Both HadGEM3-GC2 and GFDL-CM3 simulate well the key spatial features of the large-scale atmospheric circulation in winter when compared to JRA-55 for 1984–2013 (Fig. S4). Key features include the westerly jet along 30∘ N, the East Asian trough and northerly winds along the East Asian coast, which are caused by the zonal thermal contrast and subsequent pressure gradient between the North Pacific and the Eurasian continent. The models can also reliably capture the vertical temperature difference, the weaker East Asian trough and the anomalous 850 hPa southerly winds associated with haze events (Figs. S5 and 1). The good performance of HadGEM3-GC2 and GFDL-CM3 in simulating the winter monsoon and haze-favorable circulation justifies the use of these two models to estimate HWI changes.
There is a large interannual variability in HWI and no significant trend in HWI either in His, CLE or MTFR (not shown). However, the two models both show an increase in the mean HWI with no consistent change in the standard deviation (Fig. 3a, c). The mean HWI in His (1984–2013), CLE (2015–2049) and MTFR (2015–2049) is 0.00, 0.26 and 0.50 in HadGEM3-GC2. In GFDL-CM3 it is 0, 0.32 and 0.41. There is a slight increase in the standard deviation of HWI in HadGEM3-GC2 from His (1.0) and CLE (1.0) to MTFR (1.06), while no change is seen in GFDL-CM3. The occurrence of positive HWI in CLE and MTFR increases relative to His in both models. In both models, the PDF distributions of HWI in His and CLE are significantly different at the 1 % level using a Kolmogorov–Smirnov test. For the distributions of HWI in CLE and MTFR, they are also significantly different at the 1 % level in HadGEM3-GC2 but not in GFDL-CM3. The changes in the frequency of different HWI can be found from the cumulative distribution function (CDF) of HWI (Fig.3b, d). The frequency of HWI ≥1 for His, CLE and MTFR is ∼16 % (16 %), 22 % (25 %) and 30 % (29 %) in HadGEM3-GC2 (GFDL-CM3), respectively. If AA emissions follow the CLE scenario, the frequency of month with HWI ≥1 will increase by 6 % and 9 % in HadGEM3-GC2 and GFDL-CM3, respectively. The rapid reduction in AA emissions in MTFR contributes to an extra 4 %–8 % increase in HWI relative to CLE in both models.
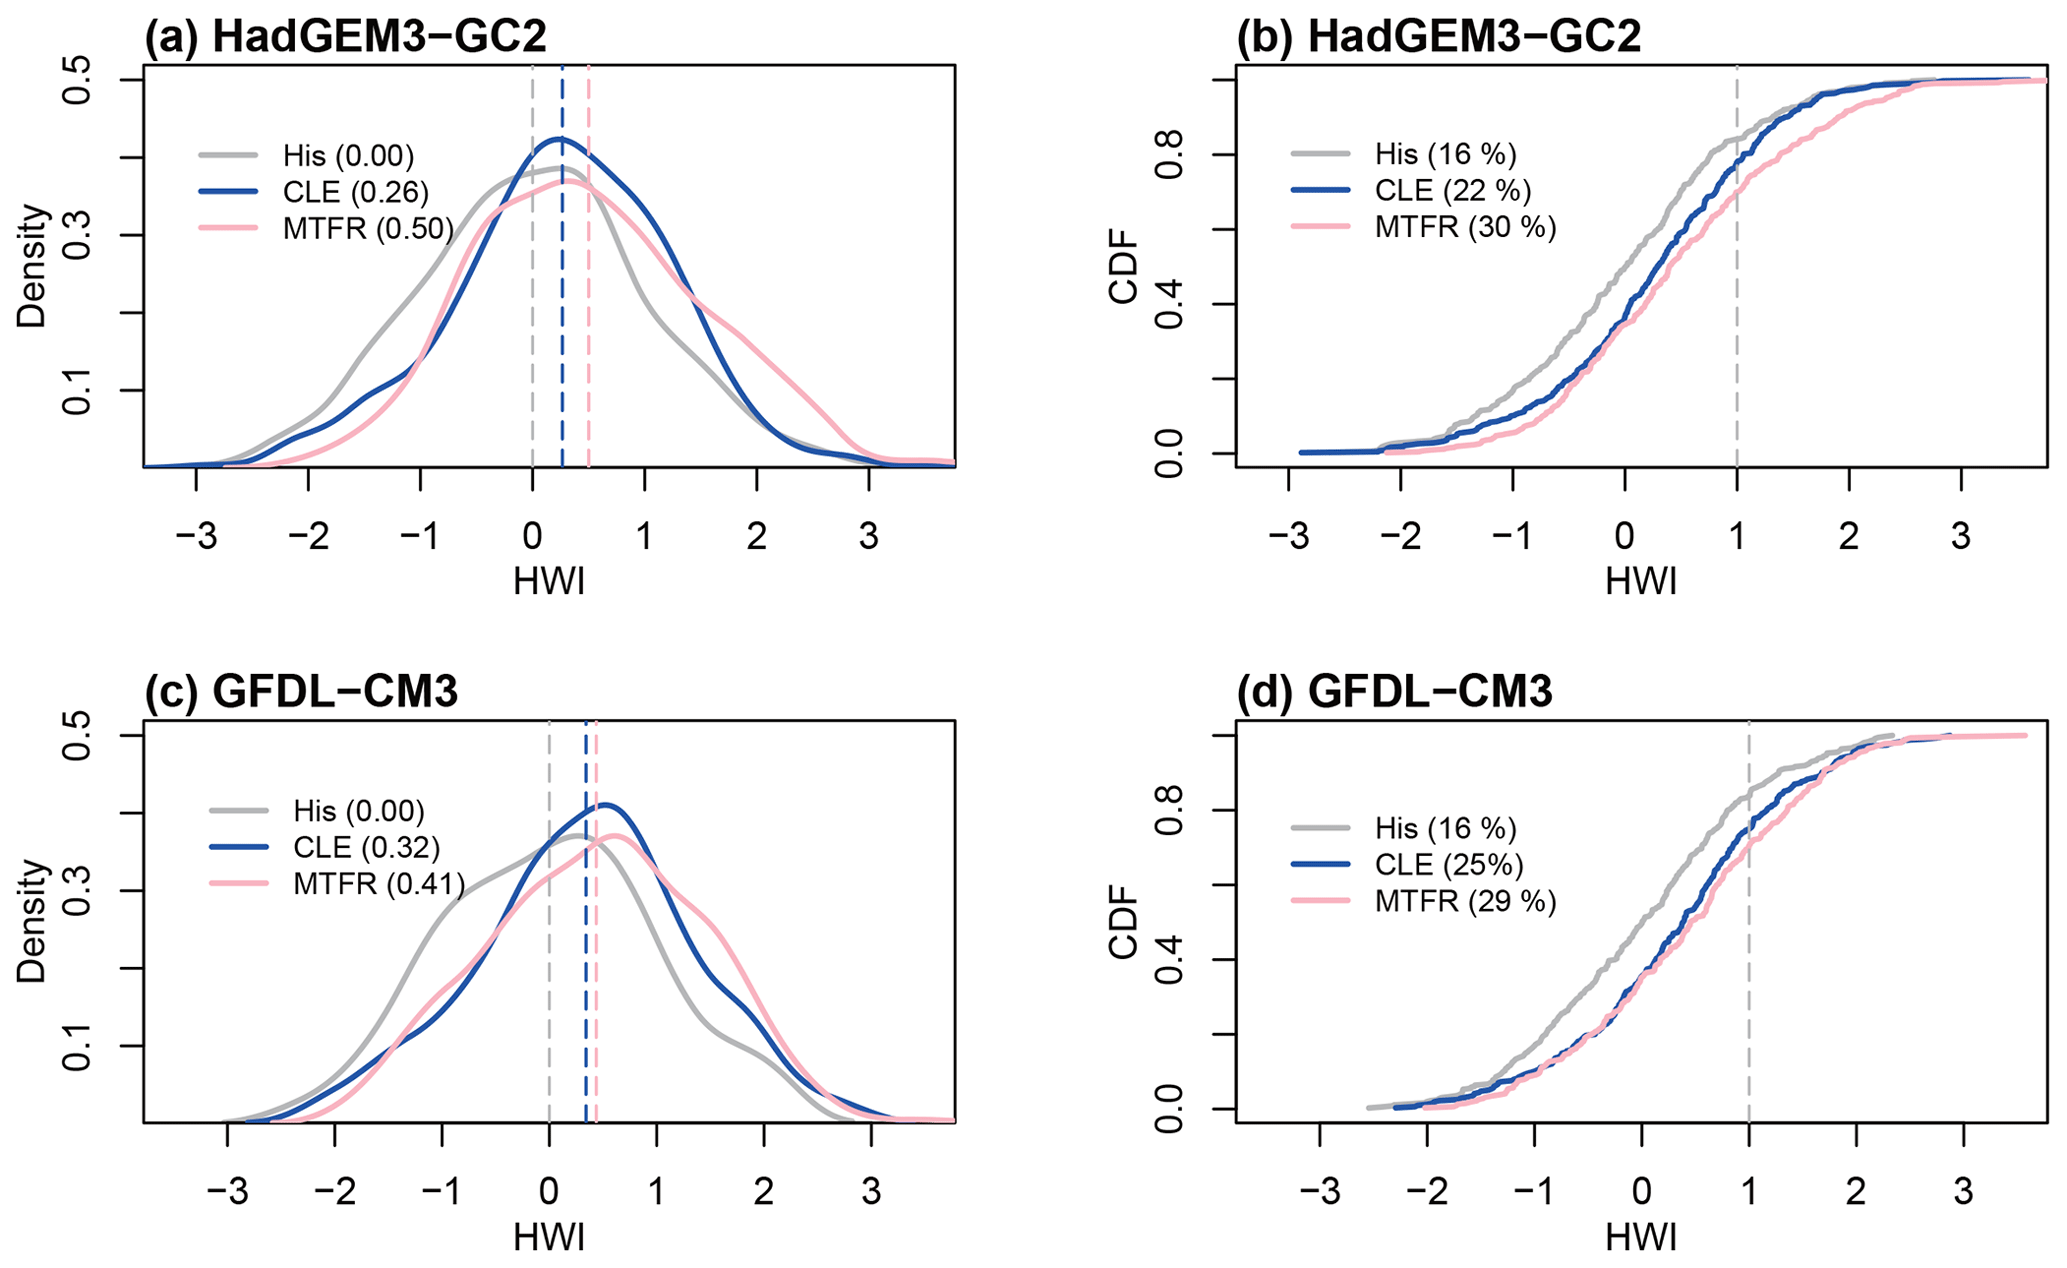
Figure 3(a) Probability density function (PDF) via a non-parametric density estimation, kernel density estimation and (b) cumulative distribution function (CDF) distributions of HWI in winters of His (1984–2013, grey), CLE (2015–2049, blue) and MTFR (2015–2049, pink) simulated by HadGEM3-GC2. Panels (c–d) show results for GFDL-CM3. The numbers in (a) and (c) are the climate mean of HWI, and in (b) and (d) they are the frequency of month with HWI ≥1, respectively.
We used a Monte Carlo approach to test whether the changes in winter mean HWI and frequency of months with HWI ≥1 among His, CLE and MTFR are significantly different from each other (Fig. 4). The time-mean HWI and frequency (HWI ≥1) in CLE and MTFR are both statistically different from that in His in the two models. We also see samples in CLE and MTFR change beyond the range of His in both models, although only in HadGEM3-GC2 simulations is the time-mean HWI in MTFR statistically significant from that in CLE (Fig. 4a). An examination of the future changes in each component of the HWI is shown in Fig. S6. Similar changes with HWI are found in all three components except in V850 in GFDL-CM3. The PDF distributions of all the component terms of the His are statistically different from CLE and from MTFR at the 5 % level in both models by using a two-sample Kolmogorov–Smirnov test, while the distributions in CLE and MTFR are significantly different in HadGEM3-GC2 only, consistent with our conclusion based on the Monte Carlo approach (figures not shown). The changes in the three components of HWI demonstrate the atmospheric conditions favoring haze events all become more likely with global warming and that future AA reductions may further increase their likelihood.
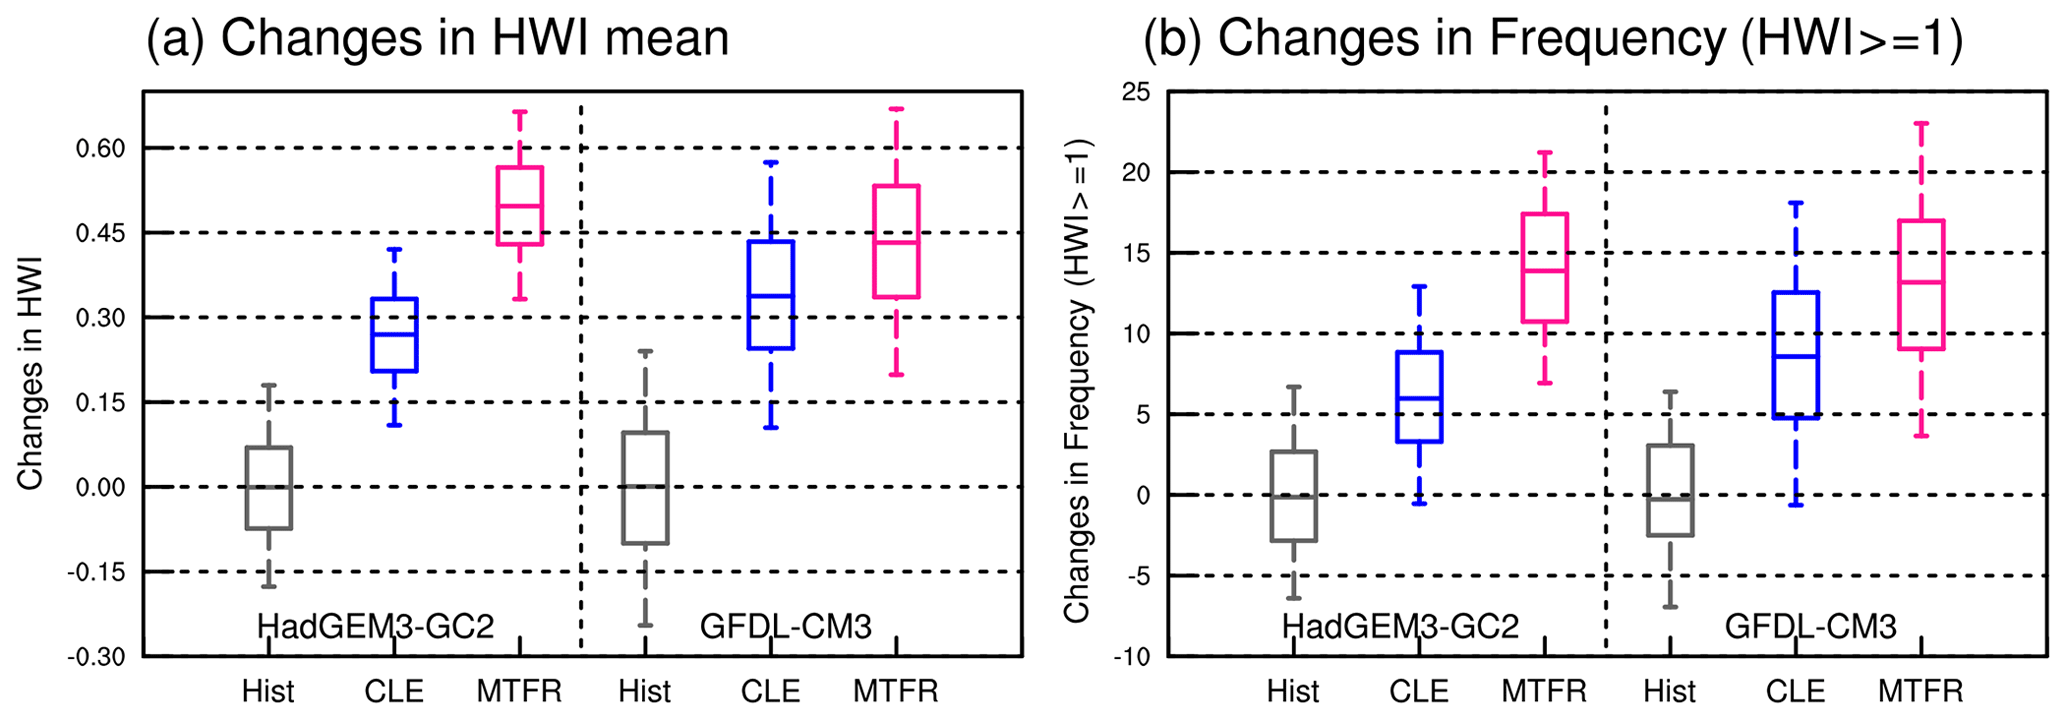
Figure 4Box plots for the 5000 bootstrapped samples of (a) changes in winter mean HWI and (b) frequency of month with HWI ≥1 in HadGEM3-GC2 and GFDL-CM3. The grey, blue and pink boxes are results estimated from His, CLE and MTFR, respectively. Boxes show the interquartile ranges of the 5000 bootstrapped samples, and black lines show the median. End points are the 5th and 95th percentiles. A significant difference is seen when the median from one experiment falls outside the interquartile range of another.
4.2 Possible mechanism for atmospheric circulation changes
To investigate the mechanism underlying these changes in Beijing haze-favorable circulation frequency, we present the changes in the vertical temperature profile, and spatial patterns of 850 and 500 hPa winds in Figs. 5–7. The lower- and mid-troposphere displays an incremental warming from His to MTFR compared to the upper levels in both models. The peak warming is at 700 hPa and over 120∘–130∘ E. Conversely, both models simulate an upper-tropospheric cooling at 250 hPa in CLE compared to His, albeit of smaller magnitude than the warming below (Fig. S7). However, the 250 hPa temperature changes between MTFR and CLE differ in the two models (Figs. 5b, d and S7g, h). Thus, the increase in tropospheric stability in MTFR relative to CLE is mainly driven by low-level warming.
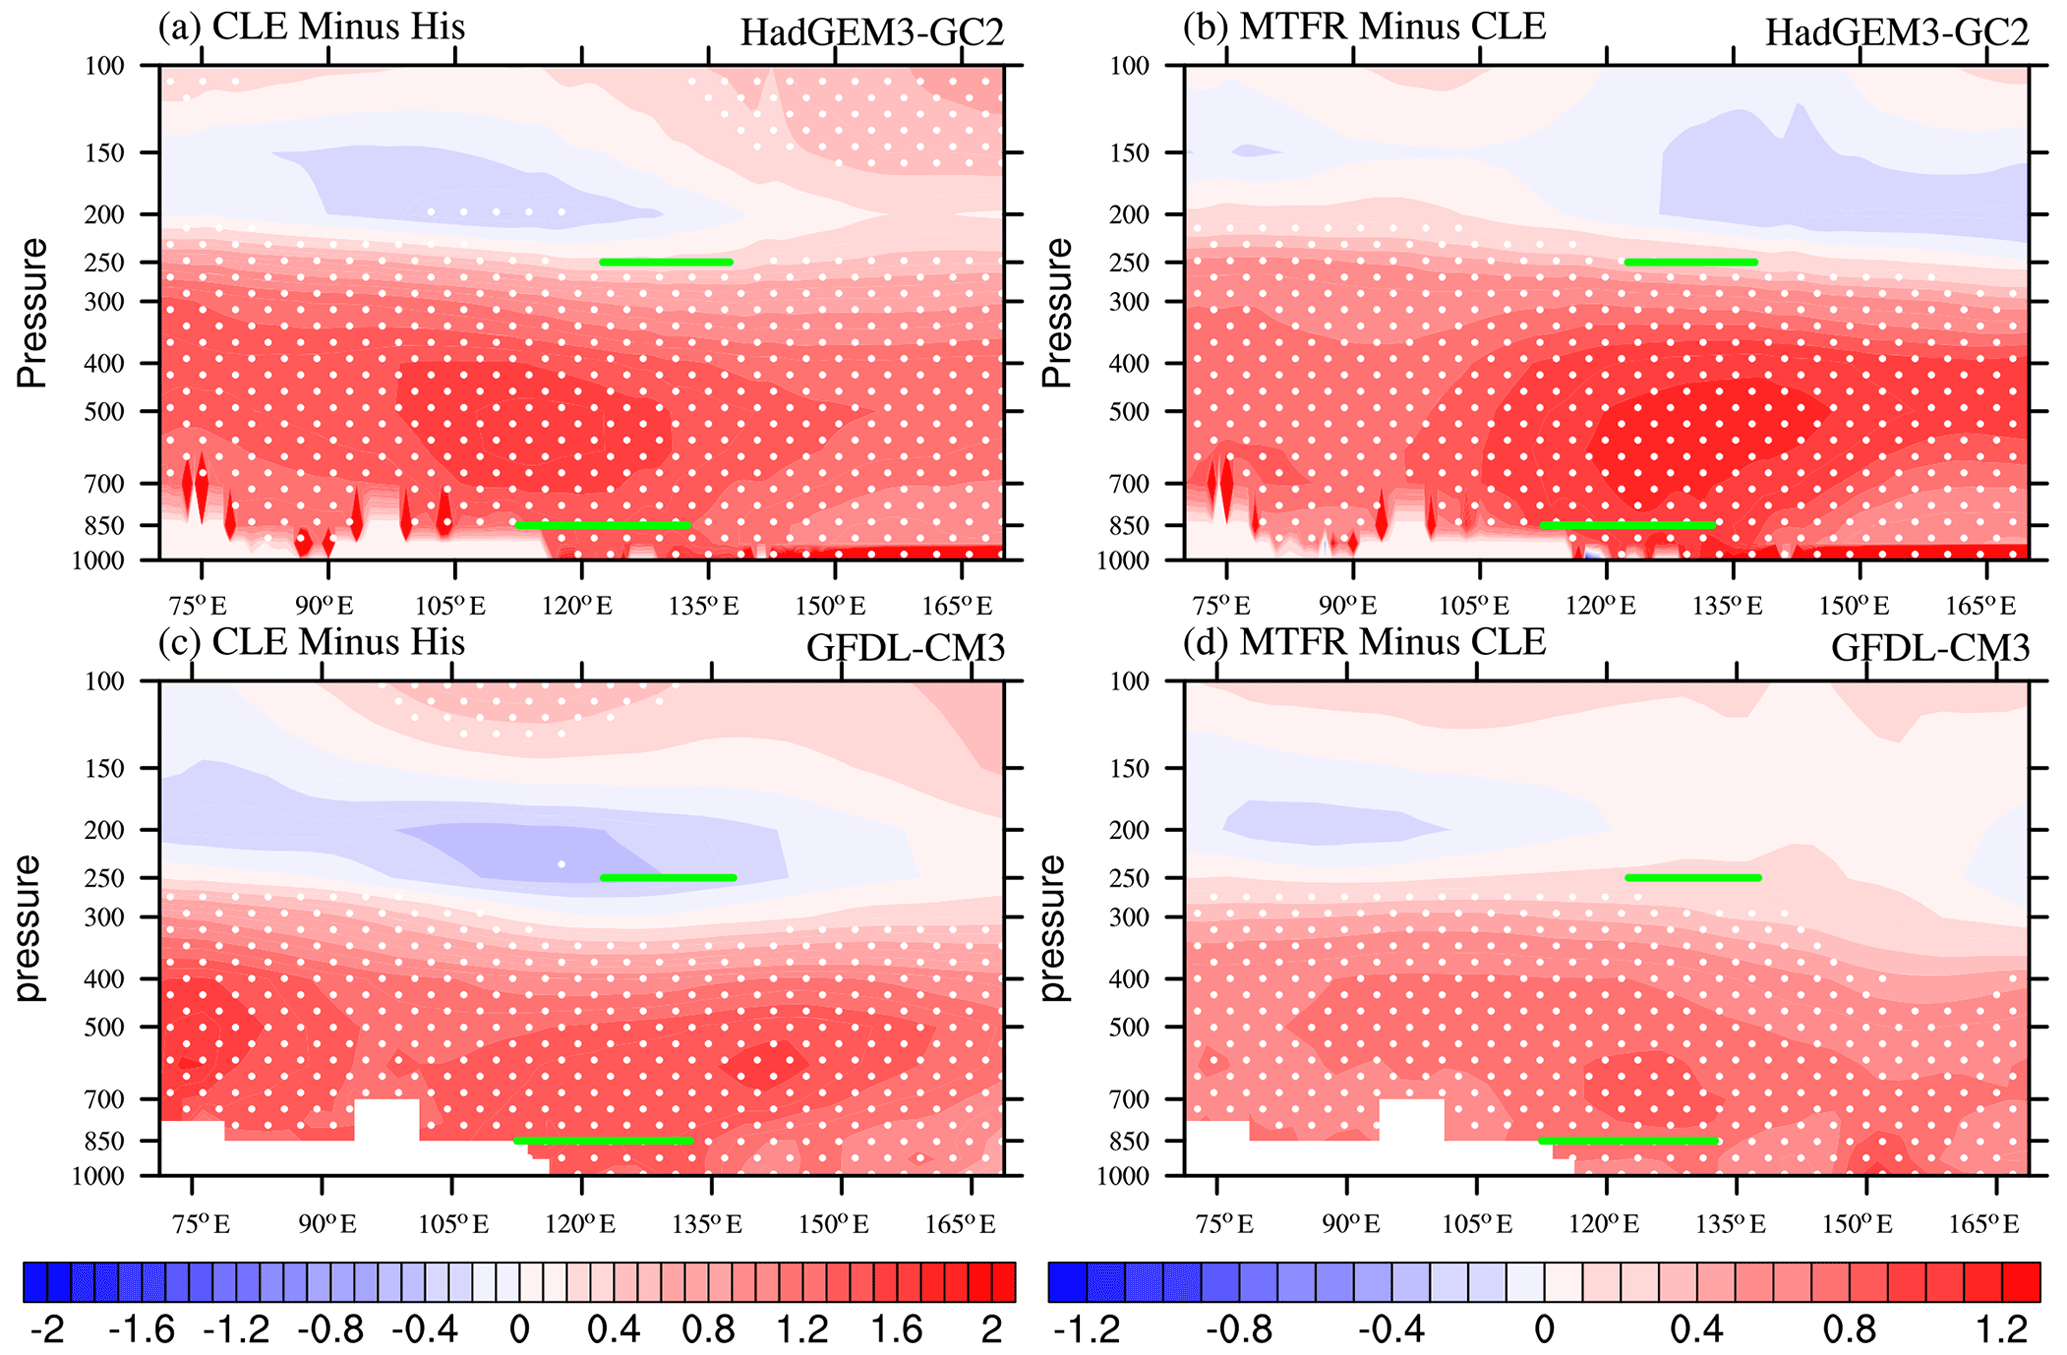
Figure 5The difference in winter mean temperature (K) along 40∘ N (a, c) between CLE (2015–2049) and His (1984–2013) and (b, d) between MTFR (2015–2049) and CLE (2015–2049). The dotted areas are statistically significant at the 10 % level using a Student's t test. The green lines indicate the level and longitude used in the calculation of ΔT.

Figure 6Spatial distribution for the difference in winter mean 850 hPa winds (vector, m s−1) and 850 hPa meridional component (shading, m s−1) (a, c) between CLE (2015–2049) and His (1984–2013) and (b, d) between MTFR (2015–2049) and CLE (2015–2049). The dotted areas denote the 850 hPa meridional winds statistically significant at the 10 % level using a Student's t test. The black box indicates the region used in the calculation of V850.
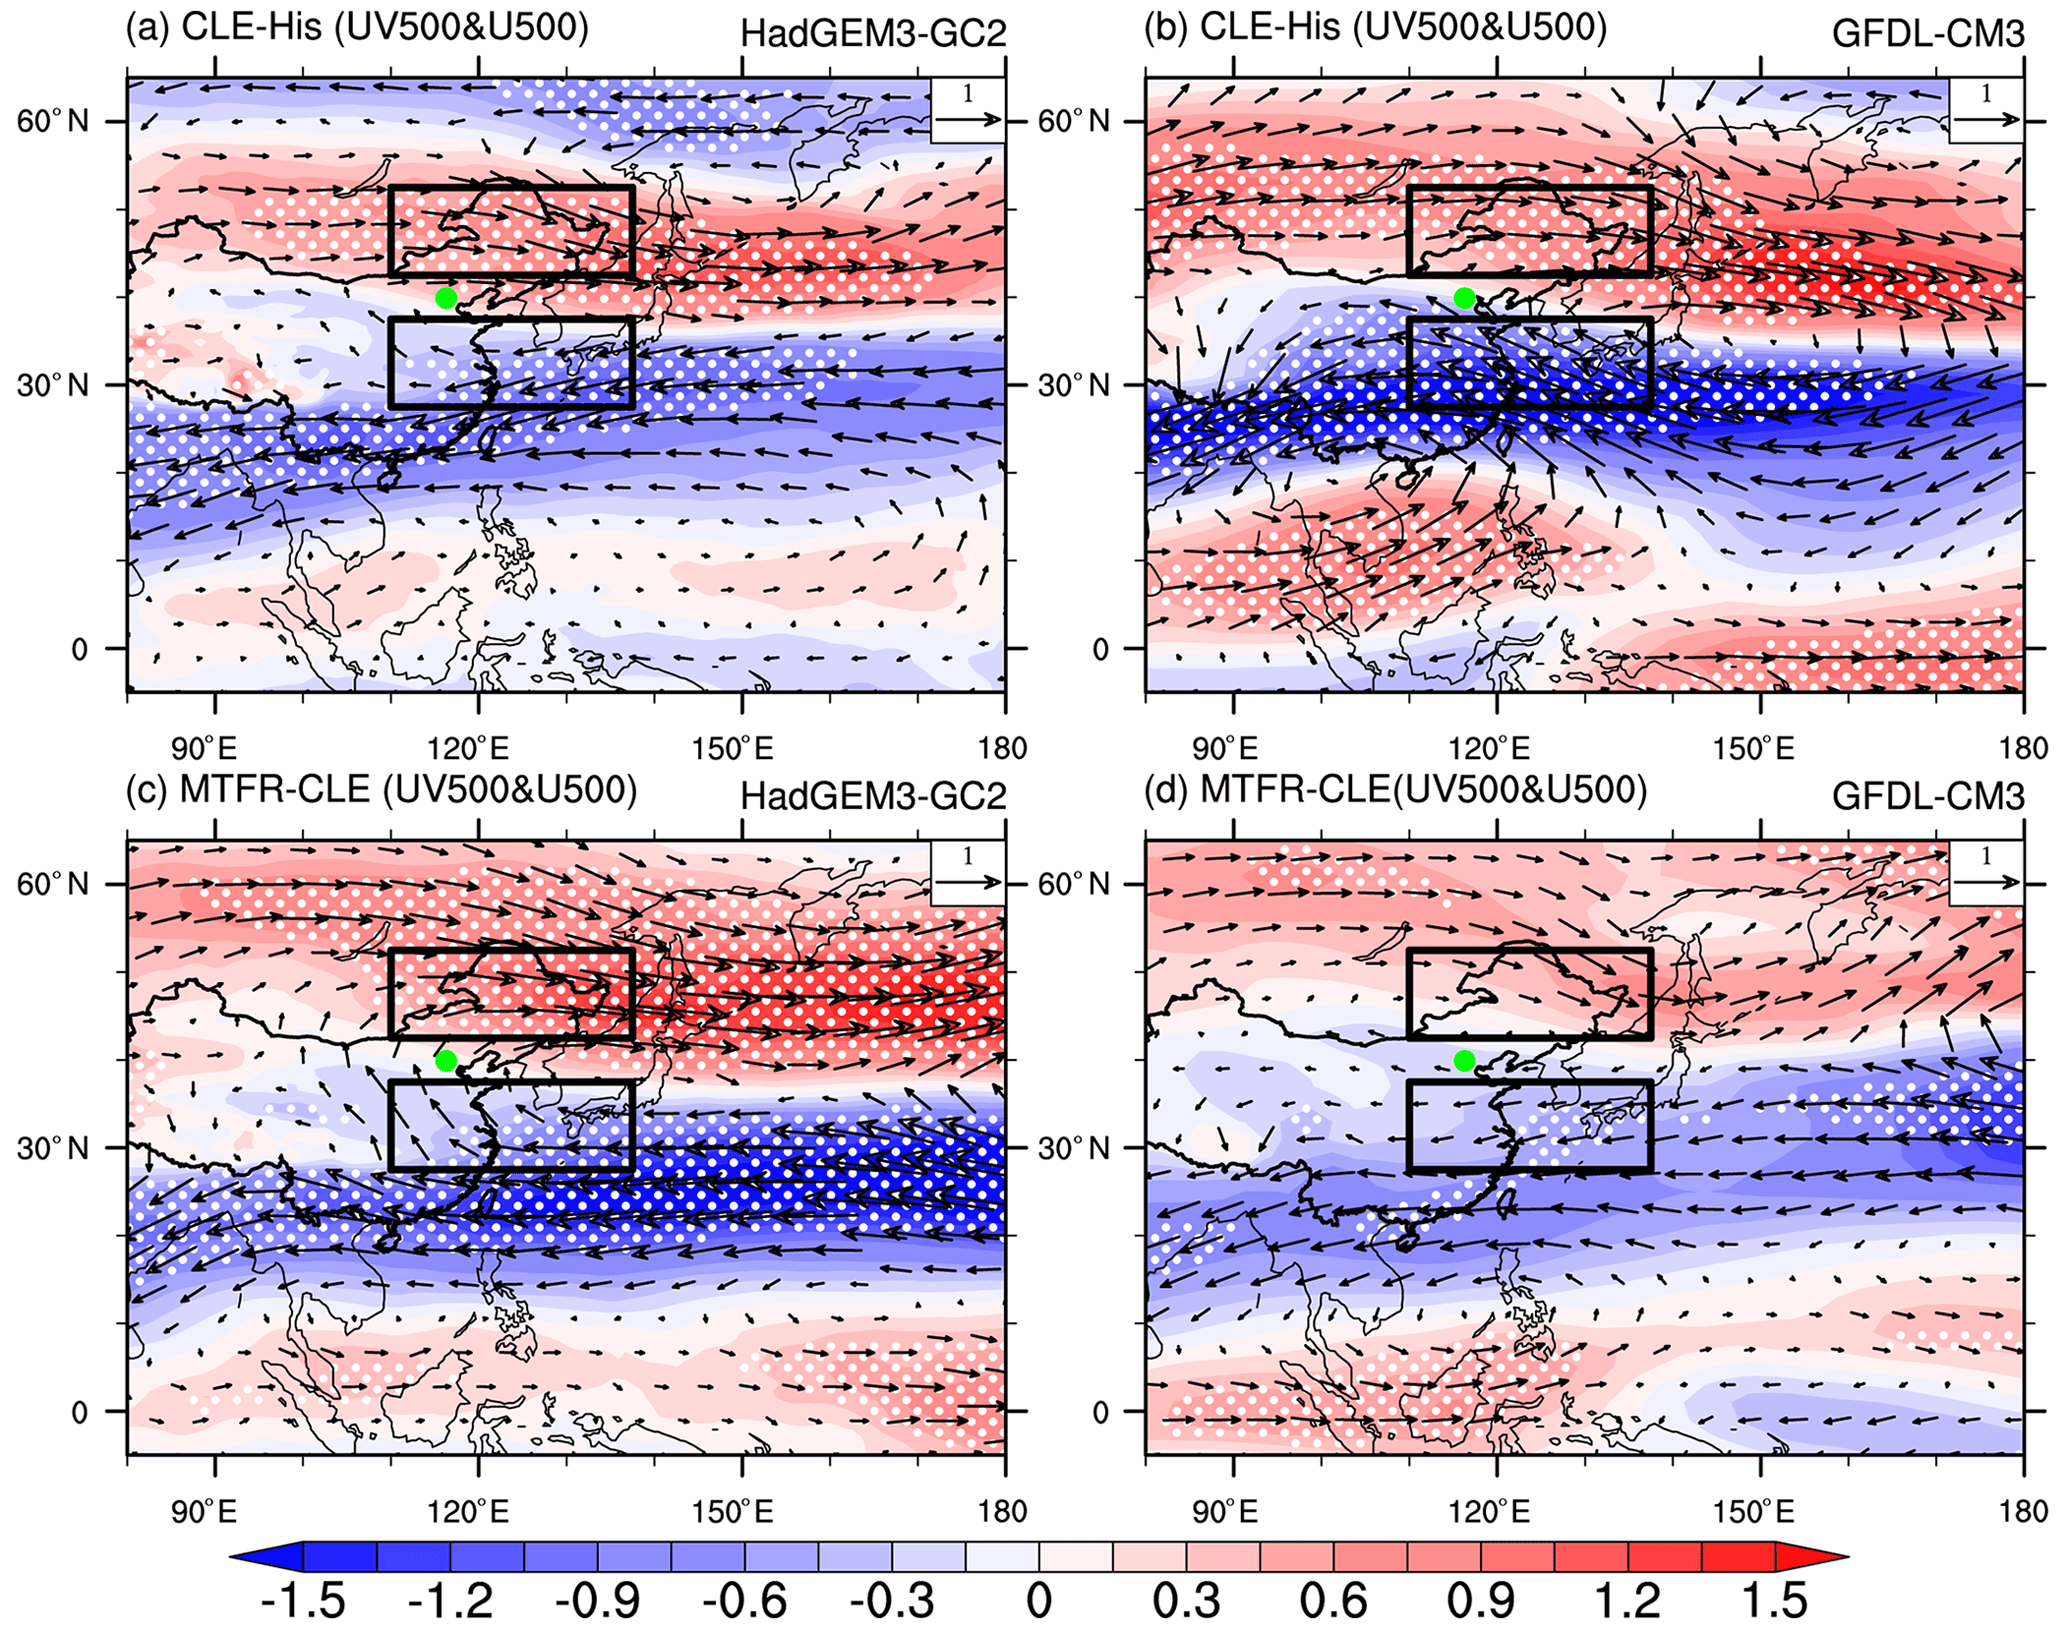
Figure 7Same as Fig. 6 but for the difference in 500 hPa winds (vector, m s−1) and 500 hPa zonal component (shading, m s−1). The black boxes indicate the regions used in the calculation of U500.
Following the CLE aerosol pathway, both HadGEM3-GC2 and GFDL-CM3 project an anomalous 850 hPa cyclonic circulation over the northwestern Pacific (0-20∘ N, 120–180∘ E) relative to His and an anticyclonic anomaly to its north (20–50∘ N, 120–180∘ E) (Fig. 6a, b). This pattern bears some resemblance to the anomalous circulation associated with a positive phase of the Arctic Oscillation, which may be due to melting Arctic sea ice (Shindell et al., 1999; Fyfe et al., 1999; Wang et al., 2020). The southerly wind anomalies over eastern China, on the western flank of the anomalous anticyclone, act to weaken the East Asian winter monsoon and reduce its low-level winds, making conditions favorable for air-pollutant transport from south to north and air-pollutant accumulation more likely. With the addition of rapid AA reductions following MTFR, the 850 hPa circulation anomalies are reinforced further (Fig. 6c, d), especially in HadGEM3-GC2, which simulates much stronger southerly wind anomalies along the East Asian coast. GFDL-CM3 shows similar anomalies over the North Pacific in CLE vs. His and MTFR vs. His but distinct responses over China (Fig. 6d), which likely explains why GFDL-CM3 does not simulate the further shift in HWI seen in HadGEM3-GC2 between CLE and MTFR (Fig. S6c, f). A northeasterly anomaly is seen over southeast China in GFDL-CM3 in both CLE relative to His and MTFR relative to CLE. However, the onshore flow over Beijing seen in CLE relative to His, which is likely to be a key contributor to an increase in haze weather events, is not enhanced further by the rapid aerosol reductions in MTFR (Fig. 6d).
At 500 hPa, a northward shift of the westerly jet stream is projected in CLE relative to the current baseline, with significant positive zonal wind anomalies along 50∘ N and negative anomalies along 30∘ N in both models (Fig. 7a, b). This shift is consistent with the increase in the meridional temperature gradient over the North Pacific (Fig. S7). Thus, the East Asian winter trough is weakened, bringing less cold and dry air to the Beijing area and favoring the formation and maintenance of haze events. The reductions in AA emissions in MTFR relative to CLE significantly strengthen the abovementioned circulation anomalies at 500 hPa in both models (Fig. 7c, d) and further increase the frequency of positive U500 differences in the regions used to calculate the HWI, as seen in Fig. 7c and d. The changes in 500 hPa zonal winds are consistent between the two models, demonstrating the robustness of the results.
The changes in the three components of HWI in CLE relative to His indicate a weakened EAWM with increased GHGs, with reductions in AA emissions further amplifying this effect and increasing the frequency of large-scale circulation conditions conducive to Beijing haze events. To explore how the EAWM circulation responds to reductions in AA emissions, we show surface temperature and sea level pressure changes in MTFR relative to CLE (Fig. 8). Reduced AA emissions generally amplify the impact of greenhouse gases, with more warming over the Arctic, the Eurasian continent and the northwestern Pacific. Thus, the Aleutian low is further weakened in MTFR. In addition, more warming over the Eurasian continent and northwestern Pacific leads to an SLP decrease over Siberia and the northwestern Pacific, respectively. The main difference between the two models is found from the SLP changes over the Eurasian continent in the midlatitudes, where large negative SLP anomalies are presented in HadGEM3-GC2, while there are no changes in GFDL-CM3. This may lead to the less westward shift of the North Pacific anomalous anticyclonic circulation in GFDL-CM3 in Fig. 6d.
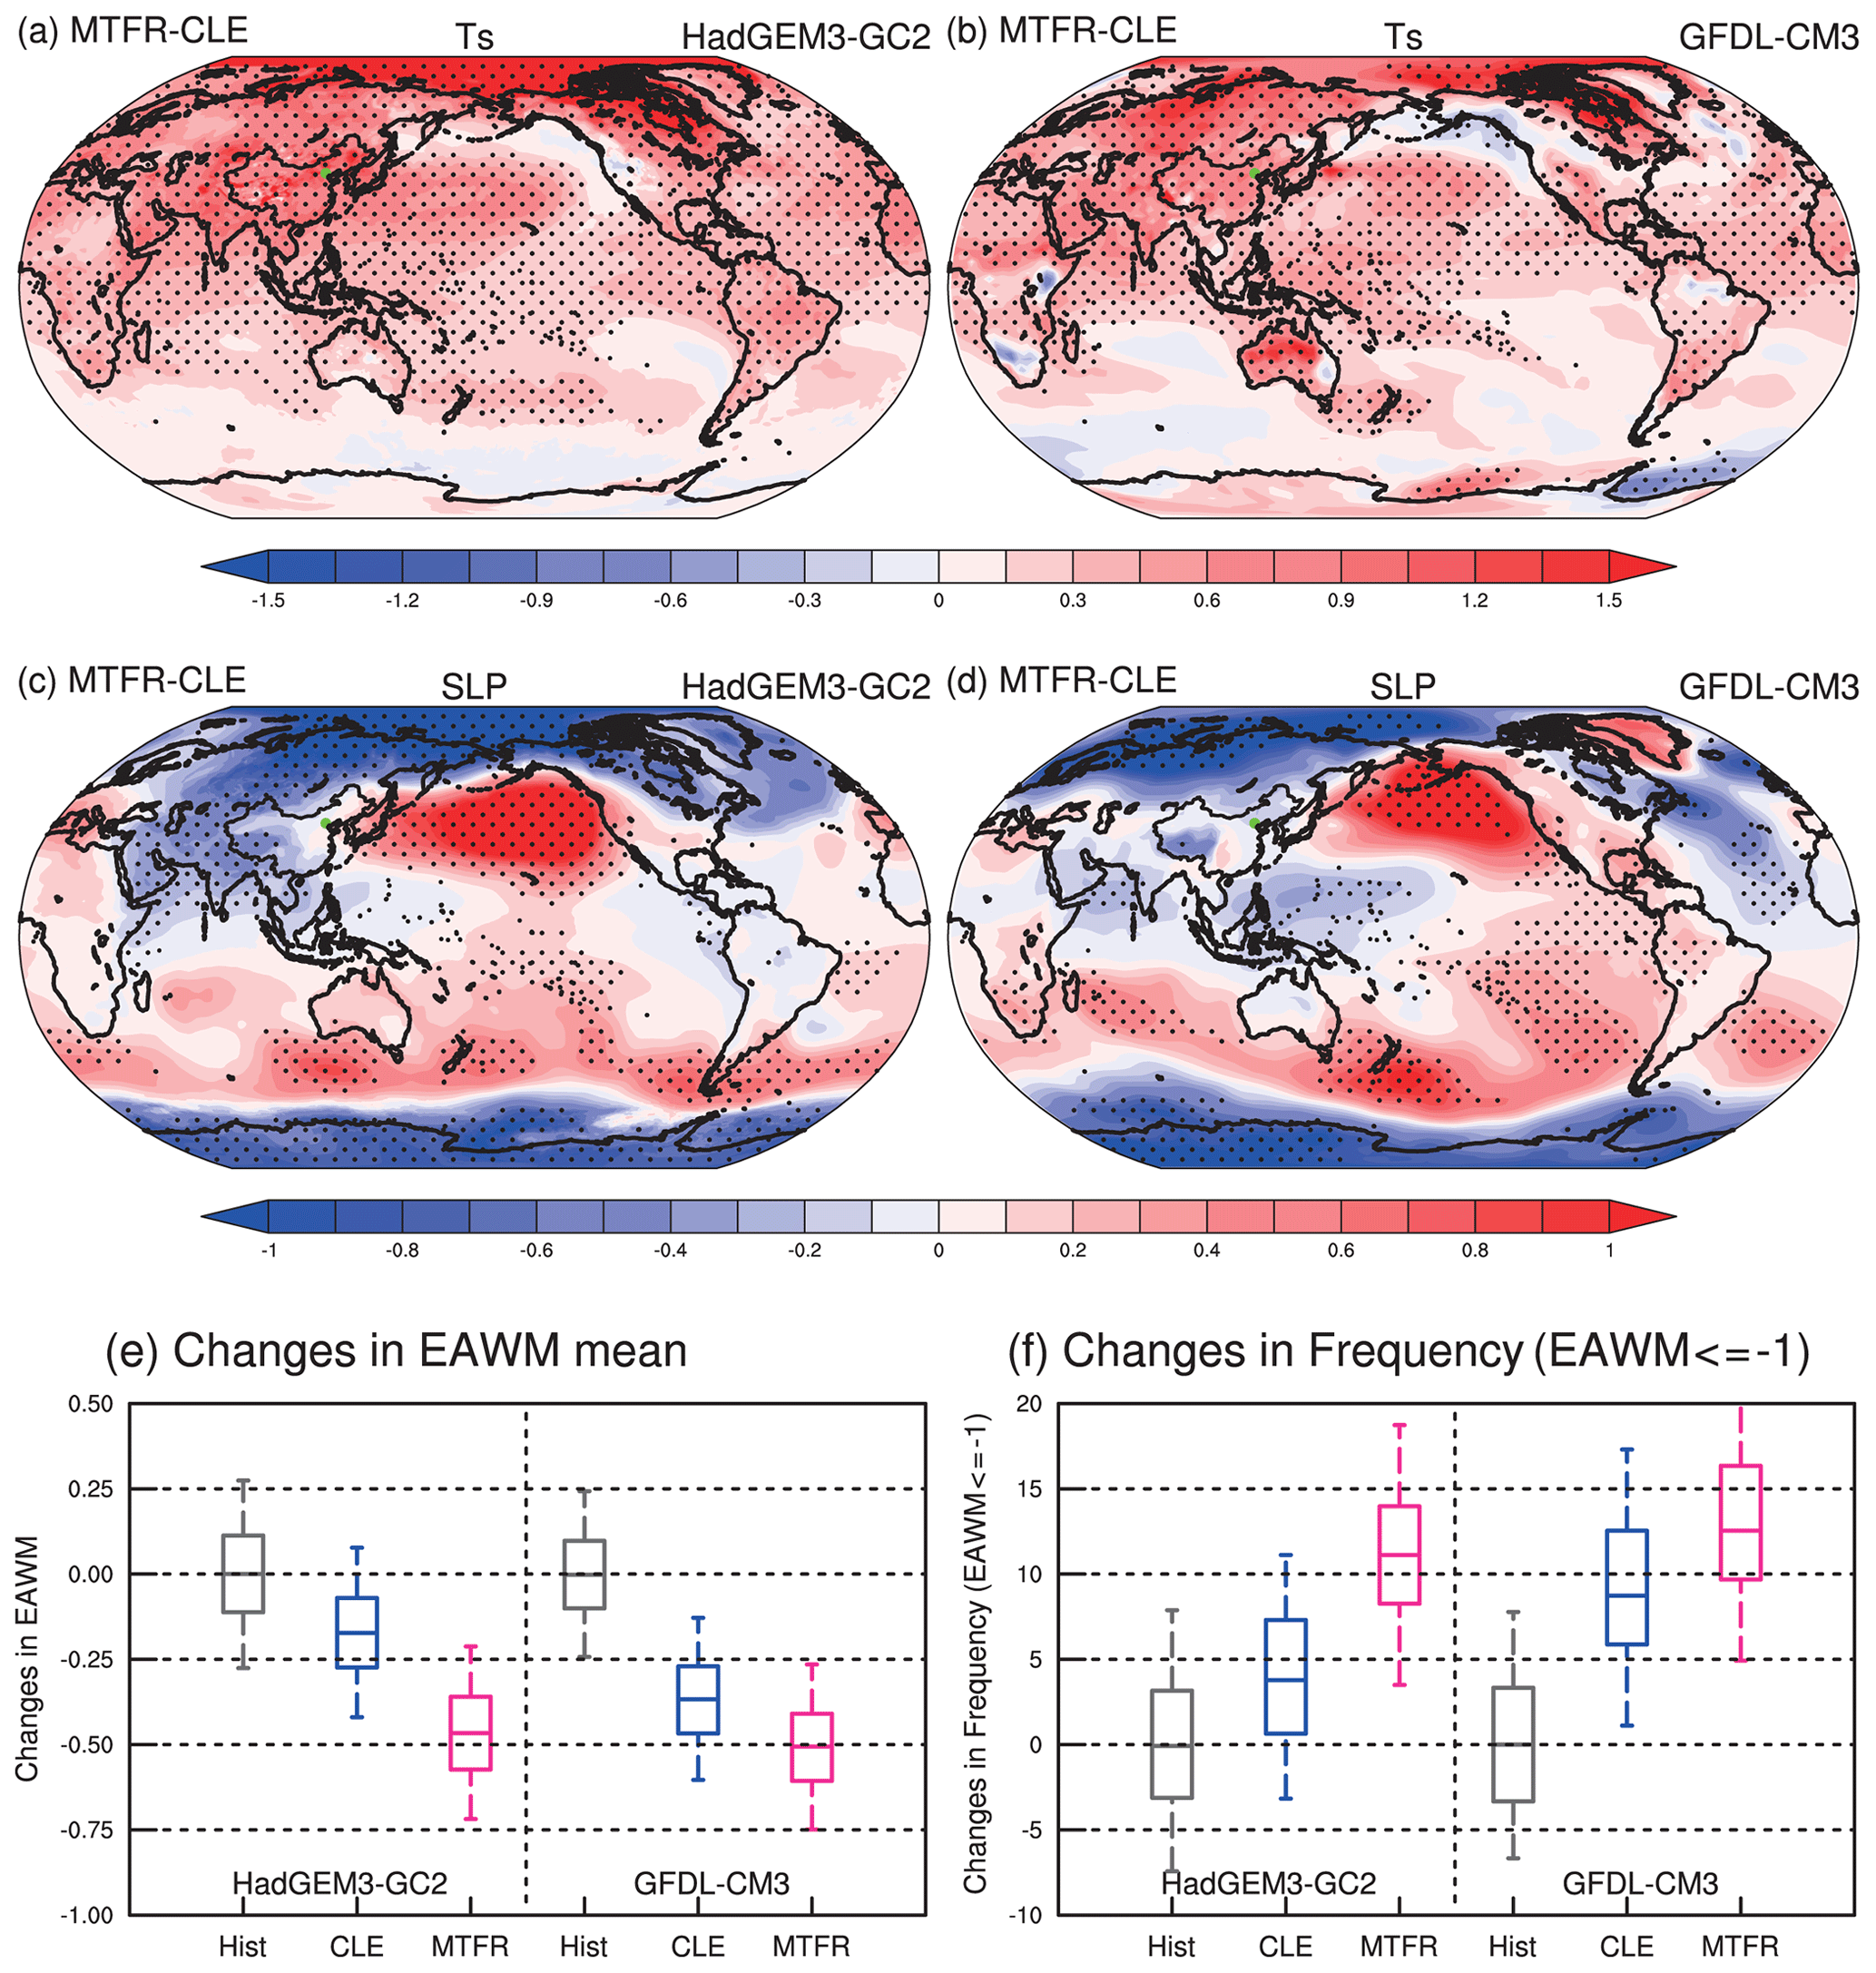
Figure 8The difference of the climate mean surface temperature (a, c, e, K) and sea level pressure (b, d, f, hPa) between MTFR and CLE simulated by (a, b) HadGEM3-GC2 and (c, d) GFDL-CM3. The dotted areas in (a–d) are statistically significant at the 10 % level using a Student's t test. Panels (e, f) are same as Fig. 4 but for changes in the climate mean EAWM and the frequency of EAWM in His (1984–2013, grey), CLE (2015–2049, blue) and MTFR (2015–2049, pink).
The changes in EAWM, using the Wang and Chen (2014) index, in His, CLE and MTFR are shown in Fig. 8e and f. The EAWM weakens in CLE compared to His (blue and grey boxes in Fig. 8e, f), mainly due to increased SLP over the North Pacific (SLP2, Fig. S8b), with no systematic or significant changes in SLP over Siberia (SLP1) and the Maritime Continent (SLP3) (Fig. S8a, c). The rapid AA reductions in MTFR cause the SLP over Siberia to decrease consistently in both models alongside a further increase in SLP2. The changes in SLP2 (SLP1) are statistically significant at the 5 % (10 %) level in both models tested by performing bootstrapped samples (Fig. S8a, b). This further weakens the east–west contrast, leading to a weaker EAWM in MTFR relative to CLE, consistent with the differences between CLE and His and between MTFR and CLE seen in the HWI. The response of SLP over the Maritime Continent (SLP3) to AA reductions differs between the two models, indicating a large uncertainty in the SLP3 changes. Thus, the AA forcing reduction predominantly weakens the EAWM through reducing the zonal thermal contrast.
4.3 Changes in haze intensity associated with favoring circulation
Occurrence of a haze event requires stagnant atmospheric conditions and also a pollution source. Although future aerosol reductions may cause further increases in the frequency of atmospheric circulation patterns currently linked with haze events, such events may become less severe in the absence of large aerosol emissions. In this section, we will examine the projected changes in the intensity of Beijing haze events using the aerosol optical depth (AOD) at 550 nm as a metric for aerosol-induced poor visibility. The simulated baseline winter mean AOD around the Beijing area is shown in Fig. 9a and c. To account for model differences in historical AOD, we used the ratio of AOD at 550 nm (hereafter AOD_ratio) relative to a baseline winter mean to represent the air-pollution severity. When AOD_ratio is greater than 1.0, the air-pollution intensity is higher than the baseline climate mean. HadGEM3-GC2 and GFDL-CM3 both simulate elevated AOD around Beijing when circulation conditions are favorable (HWI ≥1) (Fig. 9b, d): 1.5 and 1.3 times the baseline climate mean in HadGEM3-GC2 and GFDL-CM3, respectively. Aerosol and precursor emission increases under CLE (Fig. S1) result in a significant increase in climate winter mean AOD around Beijing in HadGEM3-GC2 (1.1 times) but no significant change in GFDL-CM3, and climate mean AOD in MTFR decreases to 0.84 and 0.90 of the baseline climate mean around Beijing in HadGEM3-GC2 and GFDL-CM3, respectively, due to aerosol emissions reduction (Fig. S9).

Figure 9Winter mean (a, c) AOD at 550 nm in (a) HadGEM3-GC2 and (c) GFDL-CM3 averaged over 1984–2013. Panels (b, d) are the same as (a, c) but for the mean AOD_ratio in the winter months with HWI ≥1 (hereafter AOD_ratio(HWI ≥1)) in His. Blue and red shadings in (b) and (d) are decreased and elevated AOD relative to the climate winter mean of His, respectively.
To check whether poor-air-quality events still occur even with reduced future aerosol emissions, we show the projected AOD_ratio with HWI ≥1 in Fig. 10. In CLE, when HWI ≥1, AOD_ratio is elevated compared to the baseline climatology, to 1.5 times the baseline winter mean in HadGEM3-GC2 and 1.1 times that in GFDL-CM3 (Fig. 10a, c). It is consistent with the increase in aerosol loadings and climate mean AOD in CLE (Figs. S2a and S9a, b). However, in MTFR, when HWI ≥1, AOD is slightly higher (AOD_ratio is around 1.1) or comparable with that of the baseline climatology, albeit with a decrease in climate mean AOD in MTFR (Fig. 10b, d). So, even with the aggressive aerosol reductions in MTFR, periods of poor visibility still occur in conjunction with atmospheric circulation patterns associated with haze in the current climate.
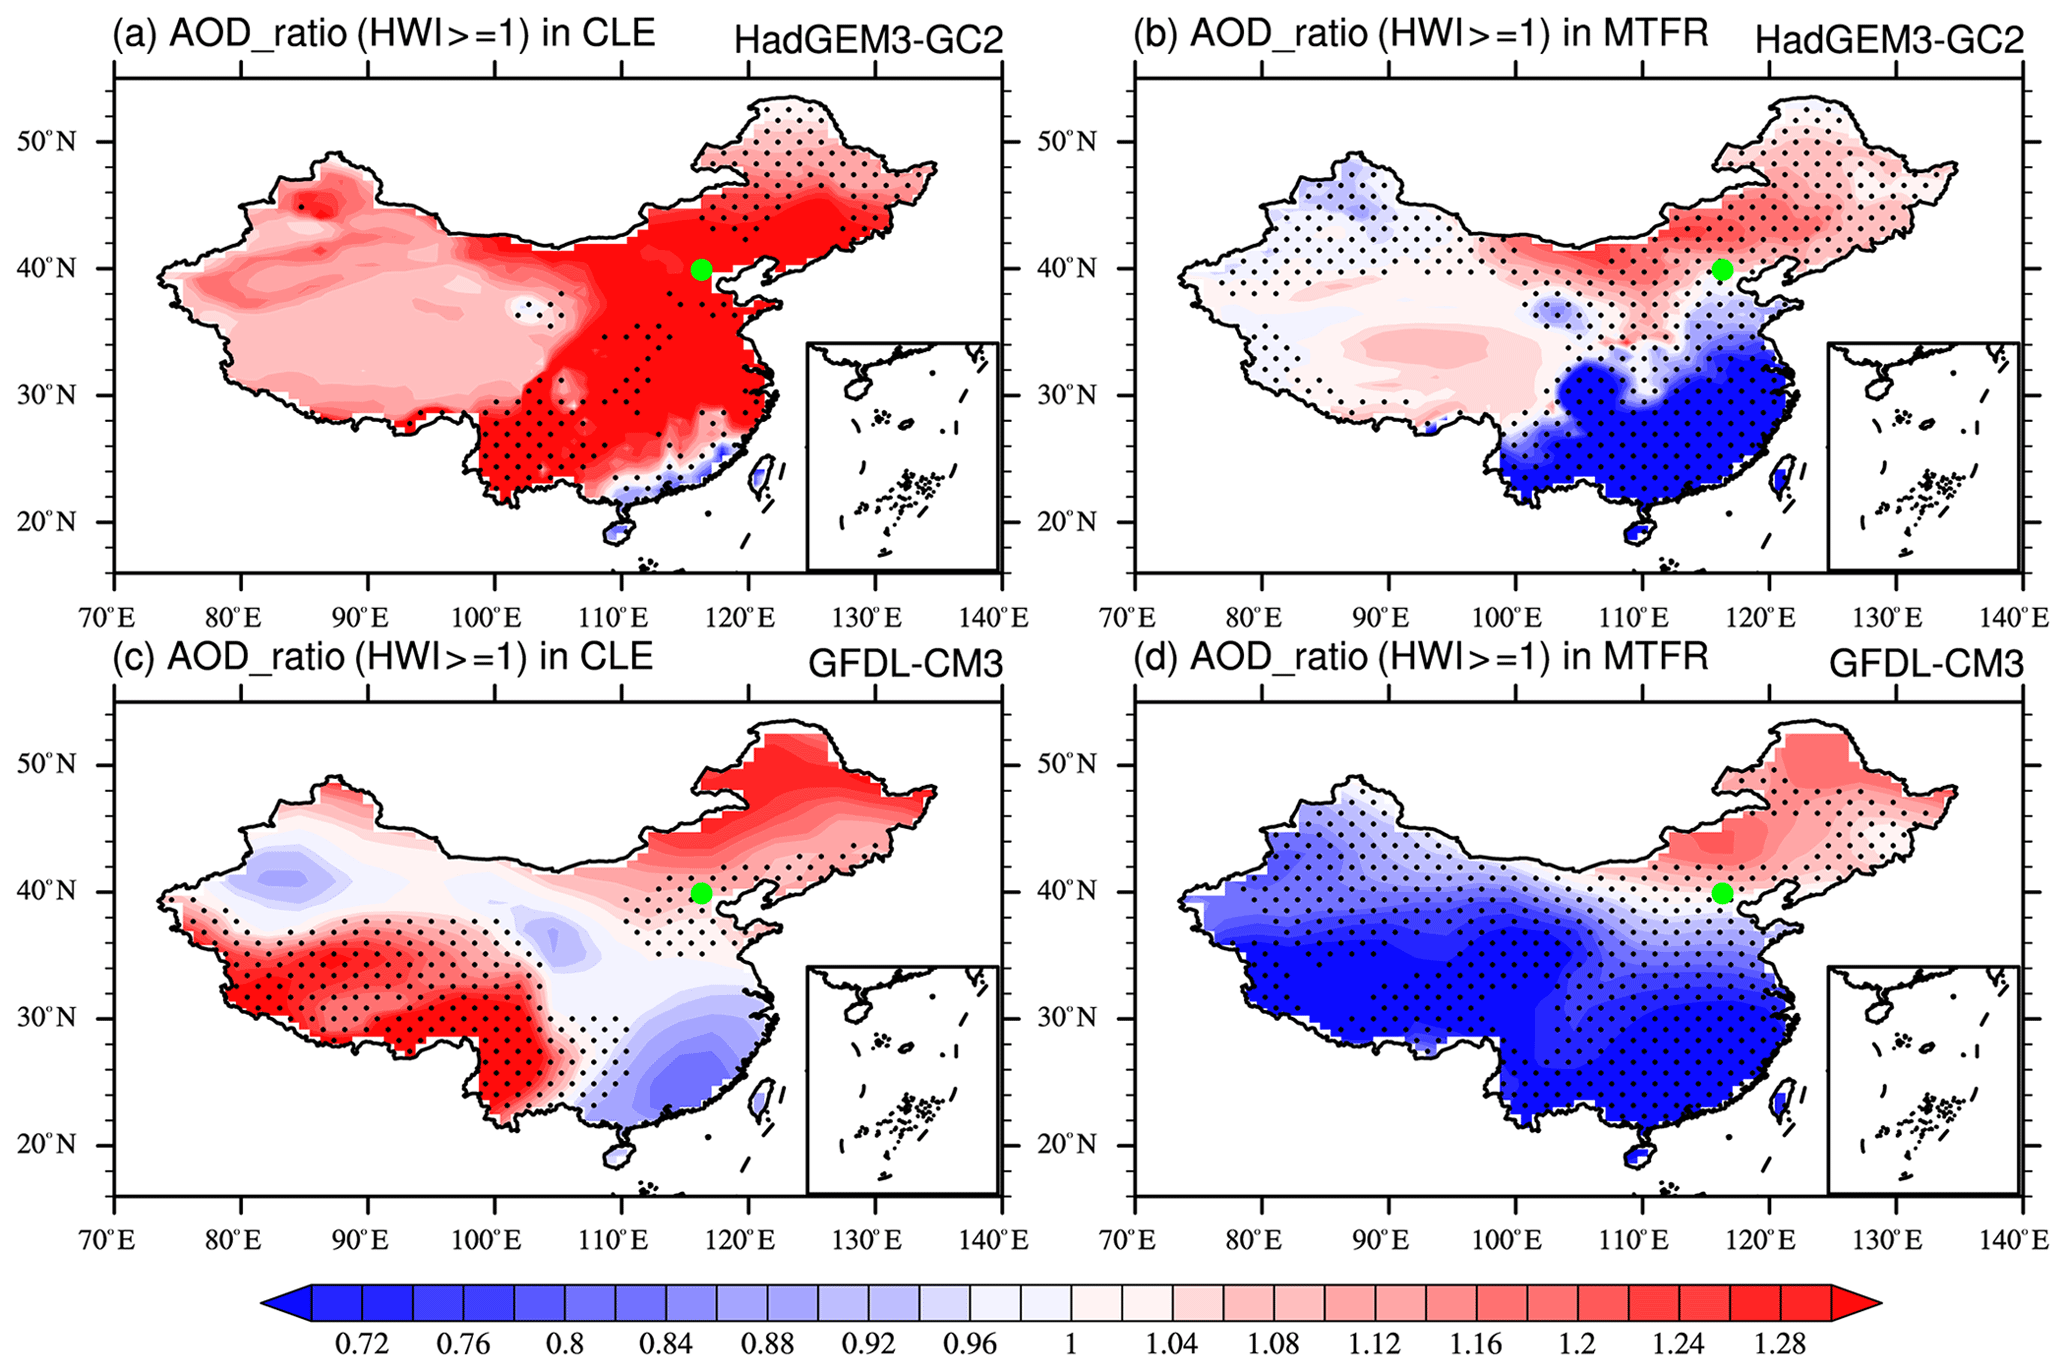
Figure 10Same as Fig. 9b and d but for the results projected in CLE and MTFR. The dotted areas are statistically significant at the 10 % level using a Student's t test.
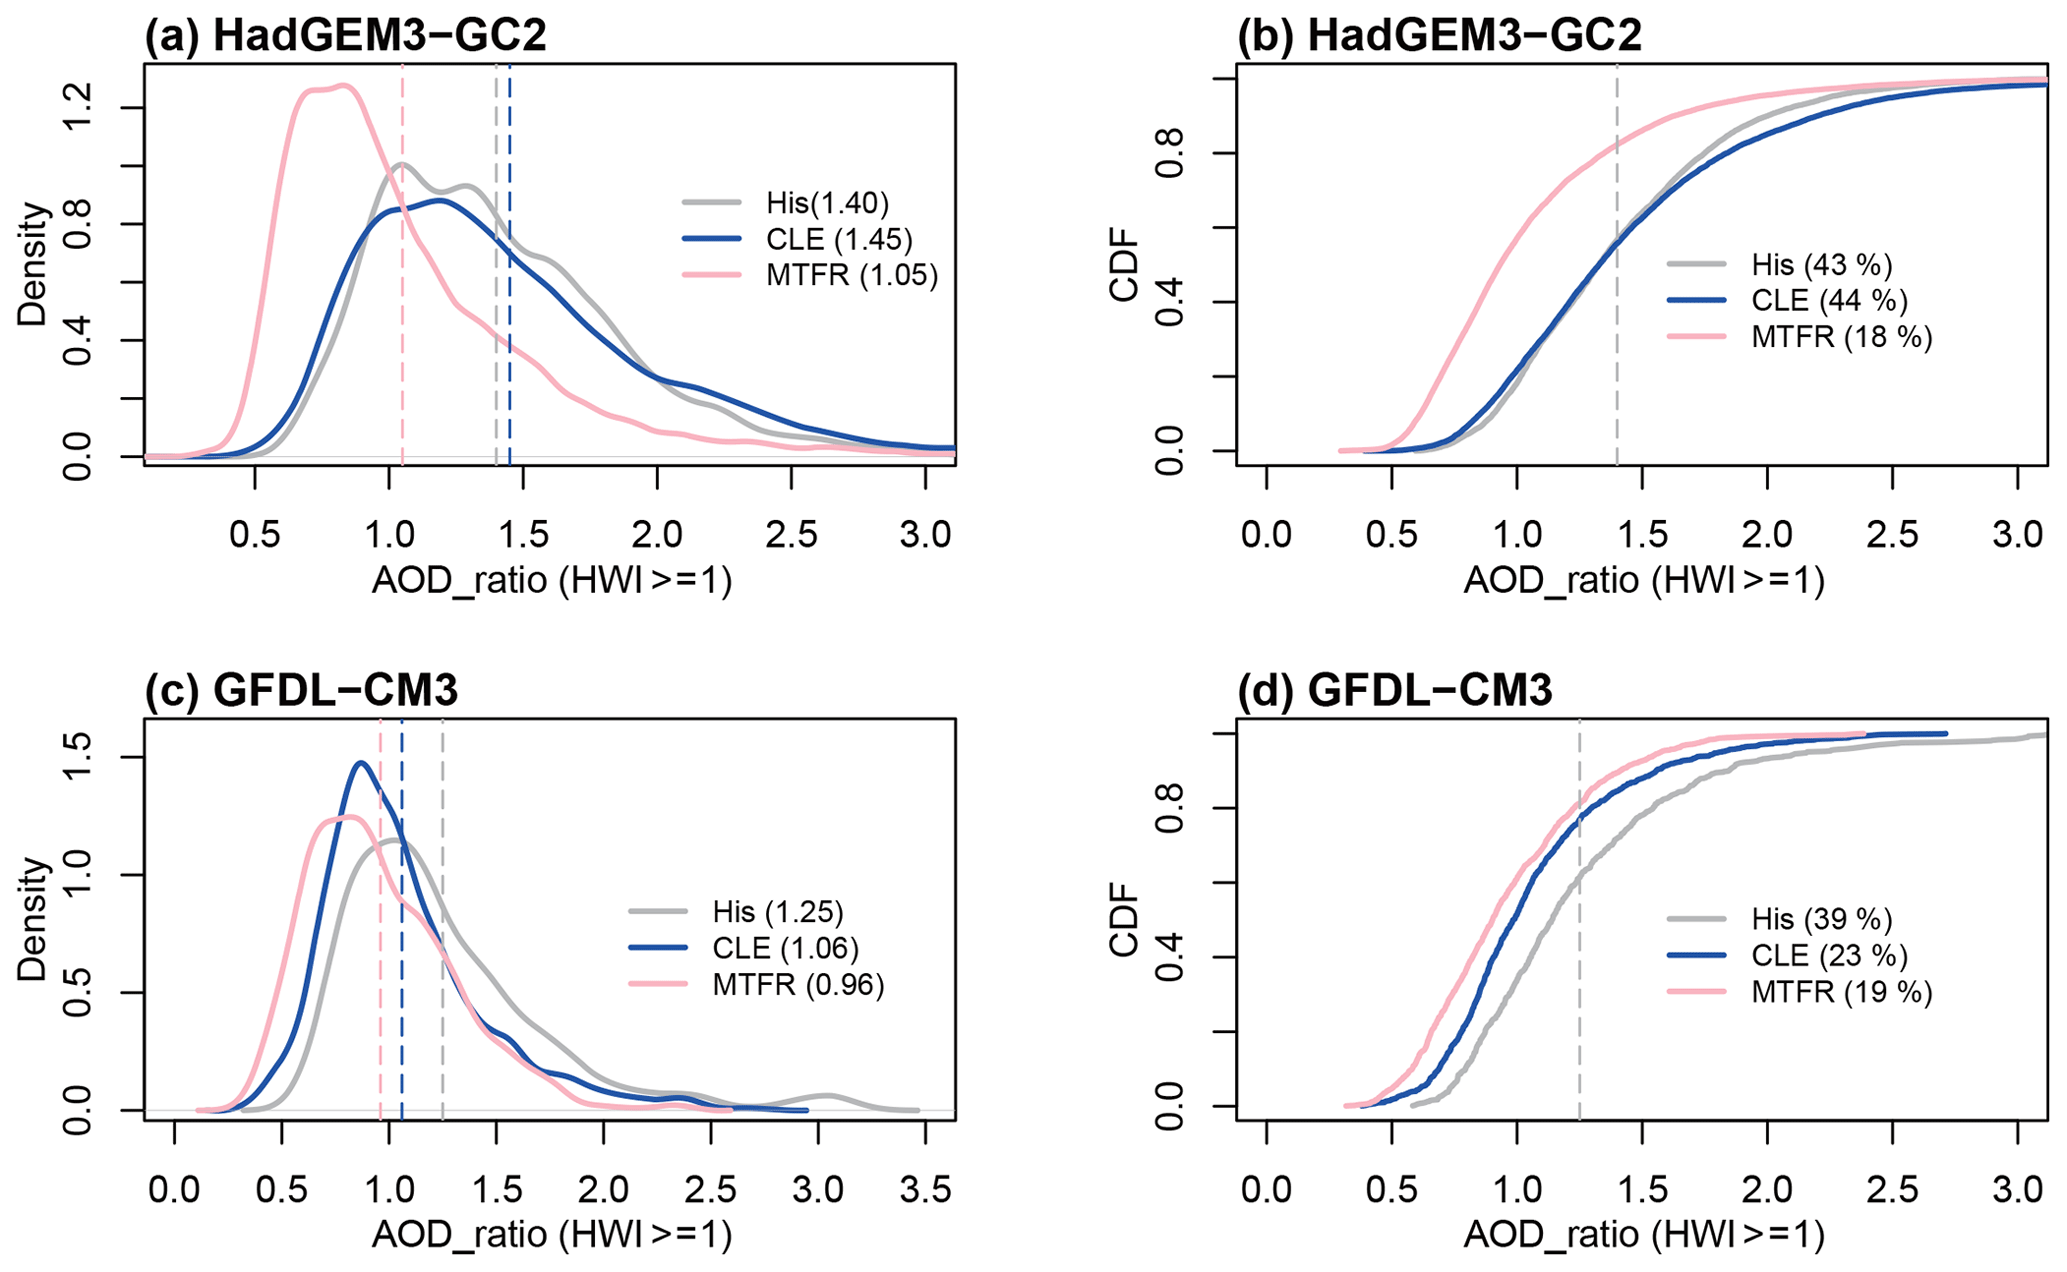
Figure 11(a) PDF and (b) CDF distributions of AOD_ratio(HWI ≥1) over North China (33–45∘ N, 105–122∘ E, box in Fig. 2) in HadGEM3-GC2. Panels (c, d) are the results from GFDL-CM3. The grey, blue and pink vertical lines and numbers in (a) and (c) are the winter mean AOD_ratio(HWI ≥1) of His, CLE and MTFR, respectively. The numbers in (b) and (d) are the cumulative probability of AOD_ratio(HWI ≥1) higher than the winter mean AOD_ratio(HWI ≥1) of His.
We calculated the PDF distributions of AOD_ratio surrounding the Beijing region (box region in Fig. 2) in the months with HWI ≥1 in His, CLE and MTFR (Fig. 11). In His, the area-averaged AOD_ratio around the Beijing region when HWI ≥1 is elevated to 1.40 (1.24) times the baseline climate mean in HadGEM-GC2 (GFDL-CM3) (Fig. 11a, b). The change in AOD_ratio with HWI ≥1 under CLE relative to His is different between the two models. It increases to 1.45 in HadGEM3-GC2 but decreases to 1.06 in GFDL-GC3. As expected, the AOD_ratio with HWI ≥1 in MTFR reduces in both models due to the dramatic reduction in anthropogenic aerosols. Thus, the mean air-pollution intensity with the favorable circulation conditions for haze under MTFR will be greatly relieved. This reduction in GFDL-CM3 under CLE relative to His may be a reflection of the model's bias. In JRA-55 when HWI ≥1, there are southerly anomalies over southern China. However, in the baseline in GFDL-CM3 there is an anomalous cyclonic circulation, which may act to reduce pollutant accumulation in Beijing (Fig. S5). As shown in Fig. 6b and d, this anomaly is strengthened in both CLE and MTFR.
To check whether extreme air pollution events would still occur, the probability of AOD_ratio when HWI ≥1 in the three scenarios are examined (Fig. 11b, d). In this study, the mean AOD_ratio across all months when HWI ≥1 in His is regarded as the winter mean intensity of baseline haze events, i.e., the grey vertical lines in Fig.11a and c. The probability of haze event intensity exceeding this threshold is about 44 % and 39 % in HadGEM3-GC2 and GFDL-CM3, respectively (Fig. 11b, d). Under CLE, it increases to 44 % in HadGEM3-GC2, while decreases to 23 % in GFDL-CM3, consistent with Fig. 10a and c. In MTFR, a lower probability is projected in both models: 18 % in HadGEM3-GC2, and 19 % in GFDL-CM3. This demonstrates that severe events (i.e., higher AOD_ratio) would still happen in MTFR, albeit with a dramatic reduction in anthropogenic aerosol, even though the mean intensity of haze events themselves will become less dangerous if aerosol emissions are reduced.
During recent decades, with rapid increases in aerosol and precursor emissions in China, air pollution has become one of the greatest threats to public health. Anthropogenic aerosol contributes not only to the chemical composition of haze but also has the potential to modulate atmospheric circulation changes. Thus, this paper aims to quantify the incidences of haze events in a future climate and the influence of aerosol mitigation efforts. In this study, we examined the changes in the frequency of atmospheric conditions conducive to haze events around the Beijing region, and the changes in aerosol optical depth (AOD) during these circulation conditions through the mid-21st century under two different anthropogenic aerosol scenarios using two climate models: HadGEM3-GC2 and GFDL-CM3. We also investigated the mechanism for the changes in the large-scale atmospheric circulation.
We found that future greenhouse gases (GHG) increases and anthropogenic aerosol (AA) increases following a current legislation aerosol scenario (CLE) will increase the frequency of haze-favorable atmospheric circulation conditions surrounding the Beijing region. The frequency of the haze weather index (HWI)≥1 derived from monthly data in HadGEM3-GC2 (GFDL-GCM3) increases from ∼16 % (16 %) at the baseline to ∼22 % (25 %) for 2015–2049 under the CLE scenario. By comparing the scenario with a maximum technically feasible aerosol reduction (MTFR), which has the same GHG increases but rapid aerosol reductions, we show that future aerosol reductions may further amplify the increase in the frequency of such circulation patterns. Rapid reductions in AA emissions in MTFR contribute to an extra increase in HWI ≥1 in two models.
The increase in haze frequency in CLE is mainly due to a weakening of the East Asian winter monsoon, warming of the lower troposphere and weakening of the East Asian trough, which is likely to be predominantly driven by the GHG increases. Reduced AA forcing in MTFR could further enhance the above circulation anomalies and amplify the impact of greenhouse gases. Because the AA emission reductions in MTFR relative to CLE mainly occur over continental Asia, the Asian landmass receives more shortwave radiation, leading to a warmer surface temperature there. This leads to a weaker Siberian high and further contributes to the weakening of the East Asian winter monsoon in MTFR.
The analysis of haze intensity based on AOD at 550 nm shows that visibility with HWI ≥1 is always lower than the baseline winter mean under both CLE and MTFR. With more reduction in aerosol emissions following the MTFR, the mean intensity of haze events in the haze-favorable atmospheric circulation will become less dangerous compared to that in His and CLE in both models. Meanwhile, the probability of haze event with intensity exceeding the baseline mean also decreases in MTFR, demonstrating that severe haze events would also occur in MTFR.
This paper reveals the competing impacts of AA emission reductions on haze-favorable circulation and haze intensity surrounding Beijing. AA reductions cause an increased frequency of atmospheric circulation patterns conducive to haze events but a reduction in the haze intensity when these circulation patterns do occur. Internal variability may not be fully sampled because of the limited number of realizations and models used in this study. In addition, the role of single forcing is not discussed here due to both changes in AA and GHGs in the CLE and MTFR experiments. We thus further tested the roles of AA forcing in driving the HWI changes during 2015–2050 using “all-but-one-forcing” initial-condition large ensembles (LEs) with the Community Earth System Model (CESM1) (Deser et al., 2020; Kay et al., 2015, Table S2 and Fig. S10 in the Supplement). The large number of ensemble members enables an estimation of internal variability and an estimation of the signals of regional response to AA or GHG forcing from the noise of model's internal variability. Comparing the winter mean HWI of the baseline, it increases under RCP8.5, and both the decrease in AA and the increase in GHG contribute to the projected higher HWI and more frequent HWI ≥1.0 (Fig. S10). The response to the decrease in AA is significant, as seen from the medium of changes in the projected winter-mean HWI and frequency of month, with HWI ≥1 falling outside the upper quartile of internal variability (Fig. S10). The signal-to-noise ratio (SNR), defined as the ratio of changes in the multi-member ensemble (MME) mean relative to spread across the changes in ensemble members, is higher than 1.0 (1.44) for HWI change when only AA forcing changes in the future (XGHG: ensemble without time-evolving greenhouse gases), consistent with the results derived from HadGEM3-GC2 and GFDL-CM3. The results from CESM LEs give additional support for the main findings of this study, highlighting the substantial impacts of aerosol forcing for future changes in the atmospheric conditions favoring haze events. A detailed examination of the role of single anthropogenic forcing and of the impact of internal variability is needed in the future.
We revealed that the capability of the models in representing haze-favorable large-scale circulations may impact the simulation of AOD, which introduces further uncertainties in the future projection of AOD. Model evaluation on haze-favorable circulation and associated AOD is necessary for future projections. Our results are consistent with previous studies that global warming and more reduction in aerosol forcing causing extra warming will make haze-favorable conditions around the Beijing area more frequent (Callahan and Markin, 2020). Large uncertainty also exists in the projection of AOD and pollutants associated with haze events. Better representation in aerosol parameters and processes could provide a more reliable way to project haze event.
The National Climatic Data Center (NCDC) Global Surface Summary of the Day (GSOD) database can be downloaded from the GSOD website (https://catalog.data.gov/dataset/global-surface-summary-of-the-day-gsod; GSOD, 2021). The JRA-55 reanalysis data can be freely downloaded from the rda.ucar.edu website (https://rda.ucar.edu/datasets/ds628.0/; JRA-55, 2021). Requests for outputs of the His, CLE and MTFR experiments, or any questions regarding the data, can be directed to the corresponding author, Lixia Zhang (lixiazhang@mail.iap.ac.cn).
The supplement related to this article is available online at: https://doi.org/10.5194/acp-21-7499-2021-supplement.
LZ designed and wrote the paper with support from all authors. LJW and MAB helped design the analysis and supervised the work. NJD and DJP ran the simulations. SH analyzed the reanalysis data. DL and LZ contributed to the validation of observational metrics.
The authors declare that they have no conflict of interest.
This work was jointly supported by the Ministry of Science and Technology of China under grant 2018YFA0606501 and the National Natural Science Foundation of China under grant no. 41675076. Laura J. Wilcox, Massimo Bollasina and Jonathan K. P. Shonk were supported by the UK-China Research & Innovation Partnership Fund through the Met Office Climate Science for Service Partnership (CSSP) China as part of the Newton Fund. Liwei Zou is supported by National Natural Science Foundation of China under grant no. 41830966.
This research has been supported by the Ministry of Science and Technology of China under grant 2018YFA0606501, the National Natural Science Foundation of China (grant nos. 41675076 and 41830966) and the Newton Fund (UK–China Research & Innovation Partnership Fund through the Met Office Climate Science for Service Partnership – CSSP, China).
This paper was edited by Toshihiko Takemura and reviewed by two anonymous referees.
Amann, M., Bertok, I., Borken-Kleefeld, J., Cofala, J., Heyes, C., Hoglund-Isaksson, L., Kiesewetter, G., Klimont, Z., Schöpp, W., Vellinga, N., and Winiwarter, W.: Adjusted historic emission data, projections, and optimized emission reduction targets for 2030 – A comparison with COM data 2013, Part A: Results for EU-28, TSAP Report #16A, version 1.1., IIASA, Laxenburg, Austria, 2015.
An, Z., Huang, R., Zhang, R., Tie, X., Li, G., Cao, J., Zhou, W., Shi, Z., Han, Y., Gu, Z., and Ji, Y.: Severe haze in northern China: A synergy of anthropogenic emissions and atmospheric processes, P. Natl. Acad. Sci. USA, 116, 8657–8666, https://doi.org/10.1073/pnas.1900125116, 2019.
Bellouin, N., Rae, J., Jones, A., Johnson, C., Haywood, J., and Boucher, O.: Aerosol forcing in the Climate Model Intercomparison Project (CMIP5) simulations by HadGEM2-ES and the role of ammonium nitrate, J. Geophys. Res., 116, D20206, https://doi.org/10.1029/2011JD016074, 2011.
Cai, W., Li, K., Liao, H., Wang, H., and Wu, L.: Weather conditions conducive to Beijing severe haze more frequent under climate change, Nat. Clim. Change., 7, 257–62, 2017.
Callahan, C. W. and Mankin, J. S.: The influence of internal climate variability on projections of synoptically driven Beijing haze, Geophys. Res. Lett., 46, e2020GL088548. https://doi.org/10.1029/2020GL088548, 2020.
Callahan, C. W., Schnell, J. L., and Horton, D. E.: Multi-index attribution of extreme winter air quality in Beijing, China, J. Geophys. Res.-Atmos., 124, 4567–4583. https://doi.org/10.1029/2018JD029738, 2019.
Chakravarti, I. M., Laha, R. G., and Roy, J.: Handbook of Methods of Applied Statistics, Volume I, John Wiley and Sons, New York, 392–394, 1967.
Chen, H. and Wang H.: Haze Days in North China and the associated atmospheric circulations based on daily visibility data from 1960 to 2012. J. Geophys. Res.-Atmos., 120, 5895–5909, https://doi.org/10.1002/2015JD023225, 2015.
Chen, H., Wang, H., Sun, J., Xu, Y., and Yin, Z.: Anthropogenic fine particulate matter pollution will be exacerbated in eastern China due to 21st century GHG warming, Atmos. Chem. Phys., 19, 233–243, https://doi.org/10.5194/acp-19-233-2019, 2019.
China State Council: Action Plan on Prevention and Control of Air Pollution, China State Council, Beijing, China, available at: http://www.gov.cn/zwgk/2013-09/12/content_2486773.htm (last access: 17 January 2021), 2013.
Deser, C., Phillips, A., Simpson, I., Rosenbloom, N., Coleman D., Lehner, F., and Pendeergrass, A.: Isolating the Evolving Contributions of Anthropogenic Aerosols and Greenhouse Gases: A New CESM1 Large Ensemble Community Resource, J. Clim., 33, 7835–7858, 2020.
Ding, Y. and Liu, Y.: Analysis of long-term variations of fog and haze in China in recent 50 years and their relations with atmospheric humidity, Sci. China Earth Sci., 57, 36–46, 2014.
Donner, L., Wyman, B., Hemler, R., Horowitz, L., Ming, Y., Zhao, M., Golaz, J., Ginoux, P., Lin, S.-J., Schwarzkopf, M., Austin, J., Alaka, G., Cooke, W., Delworth, T., Freidenreich, S., Gordon, C., Griffies, S., Held, I., Hurlin, W., Klein, S., Knutson, T., Langenhorst, A., Lee,H.-C., Lin, Y., Magi, B., Malyshev, S., Milly, P., Naik, V., Nath, M., Pincus, R., Ploshay, J., Ramaswamy, V., Seman, C., Shevliakova, E., Sirutis, J., Stern, W., Stouffer, R., Wilson, R., Winton, M., Wittenberg, A., and Zeng, F.: The dynamical core, physical parameterizations, and basic simulation characteristics of the atmospheric component of the GFDL global coupled model CM3, J. Clim., 24, 3484–3519, https://doi.org/10.1175/2011JCLI3955.1, 2011.
Feng, J., Quan, J., Liao, H., Li, Y., and Zhao, X.: An Air Stagnation Index to Qualify Extreme Haze Events in Northern China, J. Atmos. Sci., 75, 3489–3505, https://doi.org/10.1175/JAS-D-17-0354.1, 2018.
Fyfe, J., Boer, G., and Flato, G.: The Arctic and Antarctic oscillations and their projected changes under global warming, J. Geophys. Res., 26, 1601–1604, 1999.
Griffies, S., Winton, M., Donner, L., Horowitz, L., Downes, S., Farneti, R., Gnanadesikan, A., Hurlin, W., Lee, H.-C., Liang, Z., Palter, J., Samuels, B., Wittenberg, A., Wyman, B., Yin, J., and Zadeh, N.: The GFDL CM3 Coupled Climate Model: Characteristics of the Ocean and Sea Ice Simulations, J. Clim., 24, 3520–3544, 2011.
GSOD: The National Climatic Data Center (NCDC) Global Surface Summary of the Day (GSOD) database, available at: https://catalog.data.gov/dataset/global-surface-summary-of-the-day-gsod, last access: 9 May 2021.
Han, Z., Zhou, B., Xu, Y., Wu, J., and Shi, Y.: Projected changes in haze pollution potential in China: an ensemble of regional climate model simulations, Atmos. Chem. Phys., 17, 10109–10123, https://doi.org/10.5194/acp-17-10109-2017, 2017.
He, J., Gong, S., Zhou, C., Lu, S., Wu, L., Chen, Y., Yu, Y., Zhao, S., Yu, L., and Yin, C.: Analyses of winter circulation types and their impacts on haze pollution in Beijing, Atmos. Environ., 192, 94–103, 2018.
Horton, D., Harshvardhan, and Diffenbaugh, N.: Response of air stagnation frequency to anthropogenically enhanced radiative forcing, Environ. Res. Lett., 7, 044034, https://doi.org/10.1088/1748-9326/7/4/044034, 2012.
Horton, D., Skinner, C. B., Singh, D., and Diffenbaugh, N.: Occurrence and persistence of future atmospheric stagnation events, Nat. Clim. Change, 4, 698–703, https://doi.org/10.1038/NCLIMATE2272, 2014.
Hori, M. E. and Ueda, H.: Impact of global warming on the East Asian winter monsoon as revealed by nine coupled atmosphere-ocean GCMs, Geophys. Res. Lett., 33, L03713, 2006.
Jeong, J. and Park, R.: Winter monsoon variability and its impact on aerosol concentrations in East Asia, Environ. Pollut., 221, 285–292, https://doi.org/10.1016/j.envpol.2016.11.075, 2017.
JRA-55: JRA-55 reanalysis data, available at: https://rda.ucar.edu/datasets/ds628.0/, last access: 9 May 2021.
Kay, J. E., Deser, C., Phillips, A., Mai, A., Hannay, C., Strand, G., Arblaster, J. M., Bates, S.C., Danabasoglu, G., Edwards, J., Holland, M., Kushner, P., Lamarque, J.-F., Lawrence, D., Lindsay, K., Middleton, A., Munoz, E., Neale, R., Oleson, K., Polvani, L., and Vertenstein, M.: The community Earth system model (CESM) large ensemble project: a community resource for studying climate change in the presence of internal climate variability, B. Am. Meteorol. Soc., https://doi.org/10.1175/BAMS-D-13-00255.1, 2015.
Kobayashi, S., Ota, Y., Harada, Y., Ebita, A., Moriya, M., Onoda, H., Onogi, K., Kamahori, H., Kobayashi, C., Endo, H., Miyaoka, K., and Takahashi, K.: The JRA-55 reanalysis: general specifications and basic characteristics, J. Meteorol. Soc. Jpn., 93, 5–48, https://doi.org/10.2151/jmsj.2015-001, 2015.
Lamarque, J.-F., Bond, T. C., Eyring, V., Granier, C., Heil, A., Klimont, Z., Lee, D., Liousse, C., Mieville, A., Owen, B., Schultz, M. G., Shindell, D., Smith, S. J., Stehfest, E., Van Aardenne, J., Cooper, O. R., Kainuma, M., Mahowald, N., McConnell, J. R., Naik, V., Riahi, K., and van Vuuren, D. P.: Historical (1850–2000) gridded anthropogenic and biomass burning emissions of reactive gases and aerosols: methodology and application, Atmos. Chem. Phys., 10, 7017–7039, https://doi.org/10.5194/acp-10-7017-2010, 2010.
Li, Q., Zhang, R., and Wang, Y.: Interannual variation of the wintertime fog-haze days across central and eastern China and its relation with East Asian winter monsoon, Int. J. Climatol., 36, 346–354, 2016.
Li, K., Liao, H., Cai, W., and Yang, Y.: Attribution of anthropogenic influence on atmospheric patterns conducive to recent most severe haze over eastern China, Geophys. Res. Lett., 45, 2072–2081. https://doi.org/10.1002/2017GL076570, 2018.
Liu, C., Zhang, F., Miao, L., Lei, Y., and Yang, Q: Future haze events in Beijing, China: When climate warms by 1.5 and 2.0 ∘C, Int. J. Climatol., 40, 3689–3700, 2019a.
Liu, Z., Ming, Y., Wang, L., Bollasina, M., Luo, M., Lau, N.-C., and Yim, S.: A Model Investigation of Aerosol Induced Changes in the East Asian Winter Monsoon, Geophys. Res. Lett., 46, 10186–10195, 2019b.
Luo, F., Wilcox, L., Dong, B., Su, Q., Chen, W., Dunstone, N., Li, S., and Gao, Y.: Projected near-term changes of temperature extremes in Europe and China under different aerosol emissions, Environ. Res. Lett., 15, 034013, https://doi.org/10.1088/1748-9326/ab6b34, 2020.
Ming, Y., Ramaswamy, V., Donner, L., and Phillips, V.: A robust parameterization of cloud droplet activation, J. Atmos. Sci., 63, 1348–1356, 2006.
Niu, F., Li Z., Li, C., Lee, K.-H., and Wang, M.: Increase of wintertime fog in China: Potential impacts of weakening of the eastern Asian monsoon circulation and increasing aerosol loading, J. Geophys. Res., 115, D00K20, https://doi.org/10.1029/2009JD013484, 2010.
Pei, L. and Yan, Z.: Diminishing clear winter skies in Beijing towards a possible future, Environ. Res. Lett., 13, 124029, https://doi.org/10.1088/1748-9326/aaf032, 2018.
Pei, L., Yan, Z., Sun, Z., Miao, S., and Yao, Y.: Increasing persistent haze in Beijing: potential impacts of weakening East Asian winter monsoons associated with northwestern Pacific sea surface temperature trends, Atmos. Chem. Phys., 18, 3173–3183, https://doi.org/10.5194/acp-18-3173-2018, 2018.
Pei, L., Yan, Z., Chen, D., and Miao, S.: Climate variability or anthropogenic emissions: which caused Beijing Haze?, Environ. Res. Lett., 15, 034004, https://doi.org/10.1088/1748-9326/ab6f11, 2020.
Scannell, C., Booth, B., Dunstone, N., Rowell, D., Bernie, D., Kasoar, M., Voulgarakis, A., Wilcox, L., Navarro, J., Selan, Ø., and Paynter, D.: The Influence of Remote Aerosol Forcing from Industrialized Economies on the Future Evolution of East and West African Rainfall, J. Clim., 32, 8335–8354, https://doi.org/10.1175/JCLI-D-18-0716.1, 2019.
Shindell, D., Miller, R., Schmidt, G., and Pandolfo, L.: Simulation of recent northern winter climate trends by greenhouse-gas forcing. Nature, 399, 452–455, 1999.
Taylor, K., Stouffer, B., and Meehl, G.: An overview of CMIP5 and the experiment design, B. Am. Meteorol. Soc., 93, 485–498, 2012.
Wang, H., Chen, H., and Liu, J.: Arctic sea ice decline intensified haze pollution in eastern China, Atmospheric and Oceanic Science Letters, 8, 1–9, https://doi.org/10.3878/AOSL20140081, 2015. 2015.
Wang, L. and Chen, W.: An intensity index for the east Asian winter monsoon, J. Clim., 27, 2361, https://doi.org/10.1175/JCLI-D-13-00086.1, 2014.
Wang, Y., Le, T., Chen, G., Yung, Y., Su, H., Seinfeld, J., and Jiang, J.: Reduced European aerosol emissions suppress winter extremes over northern Eurasia, Nat. Clim. Change, 10, 225–230, 2020.
Wilcox, L. J., Liu, Z., Samset, B. H., Hawkins, E., Lund, M. T., Nordling, K., Undorf, S., Bollasina, M., Ekman, A. M. L., Krishnan, S., Merikanto, J., and Turner, A. G.: Accelerated increases in global and Asian summer monsoon precipitation from future aerosol reductions, Atmos. Chem. Phys., 20, 11955–11977, https://doi.org/10.5194/acp-20-11955-2020, 2020.
Williams, K. D., Harris, C. M., Bodas-Salcedo, A., Camp, J., Comer, R. E., Copsey, D., Fereday, D., Graham, T., Hill, R., Hinton, T., Hyder, P., Ineson, S., Masato, G., Milton, S. F., Roberts, M. J., Rowell, D. P., Sanchez, C., Shelly, A., Sinha, B., Walters, D. N., West, A., Woollings, T., and Xavier, P. K.: The Met Office Global Coupled model 2.0 (GC2) configuration, Geosci. Model Dev., 8, 1509–1524, https://doi.org/10.5194/gmd-8-1509-2015, 2015.
Wu, P., Ding, Y., and Liu, Y.: Atmospheric circulation and dynamic mechanism for persistent haze events in the Beijing–Tianjin–Hebei region, Adv. Atmos. Sci., 34, 429–40, https://doi.org/10.1007/s00376-016-6158-z, 2017.
Zhang, H. and Delworth, T. L.: Robustness of anthropogenically forced decadal precipitation changes projected for the 21st century, Nat. Commun., 9, 1150, https://doi.org/10.1038/s41467-018-03611-3, 2018.
Zhang, R., Li, Q., and Zhang, R.: Meteorological conditions for the persistent severe fog and haze event over eastern China in January, Science China Earth Sciences, 57, 26–35, https://doi.org/10.1007/s11430-013-4774-3, 2014.
Zhang, Y., Yin, Z., and Wang, H.: Roles of climate variability on the rapid increases of early winter haze pollution in North China after 2010, Atmos. Chem. Phys., 20, 12211–12221, https://doi.org/10.5194/acp-20-12211-2020, 2020.
Zheng, B., Tong, D., Li, M., Liu, F., Hong, C., Geng, G., Li, H., Li, X., Peng, L., Qi, J., Yan, L., Zhang, Y., Zhao, H., Zheng, Y., He, K., and Zhang, Q.: Trends in China's anthropogenic emissions since 2010 as the consequence of clean air actions, Atmos. Chem. Phys., 18, 14095–14111, https://doi.org/10.5194/acp-18-14095-2018, 2018.
- Abstract
- Introduction
- Experiments and methods
- Favorable climatic conditions for Beijing haze events in reanalysis
- Changes in Beijing haze events under two AA emission scenarios
- Summary and discussion
- Code availability
- Author contributions
- Competing interests
- Acknowledgements
- Financial support
- Review statement
- References
- Supplement