the Creative Commons Attribution 4.0 License.
the Creative Commons Attribution 4.0 License.
 | 05 May 2021
Dilution impacts on smoke aging: evidence in Biomass Burning Observation Project (BBOP) data
Anna L. Hodshire
Emily Ramnarine
Ali Akherati
Matthew L. Alvarado
Delphine K. Farmer
Shantanu H. Jathar
Sonia M. Kreidenweis
Chantelle R. Lonsdale
Timothy B. Onasch
Stephen R. Springston
Jian Wang
Yang Wang
Lawrence I. Kleinman
Arthur J. Sedlacek III
Jeffrey R. Pierce
Biomass burning emits vapors and aerosols into the atmosphere that can rapidly evolve as smoke plumes travel downwind and dilute, affecting climate- and health-relevant properties of the smoke. To date, theory has been unable to explain observed variability in smoke evolution. Here, we use observational data from the Biomass Burning Observation Project (BBOP) field campaign and show that initial smoke organic aerosol mass concentrations can help predict changes in smoke aerosol aging markers, number concentration, and number mean diameter between 40–262 nm. Because initial field measurements of plumes are generally >10 min downwind, smaller plumes will have already undergone substantial dilution relative to larger plumes and have lower concentrations of smoke species at these observations closest to the fire. The extent to which dilution has occurred prior to the first observation is not a directly measurable quantity. We show that initial observed plume concentrations can serve as a rough indicator of the extent of dilution prior to the first measurement, which impacts photochemistry, aerosol evaporation, and coagulation. Cores of plumes have higher concentrations than edges. By segregating the observed plumes into cores and edges, we find evidence that particle aging, evaporation, and coagulation occurred before the first measurement. We further find that on the plume edges, the organic aerosol is more oxygenated, while a marker for primary biomass burning aerosol emissions has decreased in relative abundance compared to the plume cores. Finally, we attempt to decouple the roles of the initial concentrations and physical age since emission by performing multivariate linear regression of various aerosol properties (composition, size) on these two factors.
- Article
(1600 KB) - Full-text XML
-
Supplement
(14581 KB) - BibTeX
- EndNote


Smoke from biomass burning is a major source of atmospheric primary aerosol and vapors (Akagi et al., 2011; Gilman et al., 2015; Hatch et al., 2015, 2017; Jen et al., 2019; Koss et al., 2018; Reid et al., 2005; Yokelson et al., 2009), influencing air quality, local radiation budgets, cloud properties, and climate (Carrico et al., 2008; O'Dell et al., 2019; Petters et al., 2009; Ramnarine et al., 2019; Shrivastava et al., 2017) as well as the health of impacted communities (Ford et al., 2018; Gan et al., 2017; Reid et al., 2016). Dilution of a smoke plume occurs as the plume travels downwind, mixing with regional “background” air, reducing the concentrations of smoke aerosols and vapors, and potentially driving changes in the physical and chemical properties of the emissions (Adachi et al., 2019; Akagi et al., 2012; Bian et al., 2017; Cubison et al., 2011; Hecobian et al., 2011; Hodshire et al., 2019a, b; Jolleys et al., 2012, 2015; Konovalov et al., 2019; May et al., 2015; Noyes et al., 2020; Sakamoto et al., 2015, Palm et al., 2020). Fires span an immense range in size, from small agricultural burns, which may be only a few square meters in total area and last a few hours, to massive wildfires, which may burn tens of thousands of kilometers over the course of weeks (Andela et al., 2019). This range in size leads to variability in initial plume size and extent of dilution by the time of the first measurement. Plumes can dilute unevenly, with edges of the plume mixing in with surrounding air more rapidly than the core of the plume. Hence overall, these large, thick plumes dilute more slowly than small, thin plumes for similar atmospheric conditions as the cores of larger plumes are at a greater physical distance to the background air, shielding them from dilution for longer (Akagi et al., 2012; Bian et al., 2017; Cubison et al., 2011; Hecobian et al., 2011; Hodshire et al., 2019a, b; Jolleys et al., 2012, 2015; Konovalov et al., 2019; May et al., 2015; Sakamoto et al., 2015; Lee et al., 2020; Garofalo et al., 2019). Variability in dilution leads to variability in the evolution of smoke emissions as instantaneous plume aerosol concentrations will control shortwave radiative fluxes (and thus photolysis rates and oxidant concentrations), gas-particle partitioning, and particle coagulation rates (Akagi et al., 2012; Bian et al., 2017; Cubison et al., 2011; Hecobian et al., 2011; Hodshire et al., 2019a, b; Jolleys et al., 2012, 2015; Konovalov et al., 2019; May et al., 2015; Sakamoto et al., 2015; Garofalo et al., 2019; Ramnarine et al., 2019; Sakamoto et al., 2016). Thus, capturing variability in plume aerosol concentrations and dilution between fires and within fires can aid in understanding how species change within the first few hours of emission for a range of plume sizes.
The evolution of total particulate matter (PM) or organic aerosol (OA) mass from smoke has been the focus of many studies as PM influences both human health and climate. Secondary organic aerosol (SOA) production occurs through oxidation of gas-phase volatile organic compounds (VOCs) that can form lower-volatility products that partition to the condensed phase (Jimenez et al., 2009; Kroll and Seinfeld, 2008). SOA formation may also arise from heterogeneous and multi-phase reactions in both the organic and aqueous phases (Jimenez et al., 2009; Volkamer et al., 2009). In turn, oxidant concentrations depend on shortwave fluxes (Tang et al., 1998; Tie, 2003; Yang et al., 2009) and the composition of the plume (Yokelson et al., 2009; Akagi et al., 2012; Hobbs et al., 2003; Alvarado et al., 2015). Smoke particles contain semivolatile organic compounds (SVOCs) (Eatough et al., 2003; May et al., 2013), which may evaporate off of particles as the plume becomes more dilute (Huffman et al., 2009; May et al., 2013; Garofalo et al., 2019; Grieshop et al., 2009), leading to losses in total aerosol mass. Field observations of smoke PM and OA mass normalized for dilution (e.g., through a long-lived tracer such as CO) report that for near-field (<24 h) physical aging, net PM or OA mass can increase (Cachier et al., 1995; Formenti et al., 2003; Liu et al., 2016; Nance et al., 1993; Reid et al., 1998; Vakkari et al., 2014, 2018; Yokelson et al., 2009), decrease (Akagi et al., 2012; Hobbs et al., 2003; Jolleys et al., 2012, 2015; May et al., 2015), or remain nearly constant (Brito et al., 2014; Capes et al., 2008; Collier et al., 2016; Cubison et al., 2011; Forrister et al., 2015; Garofalo et al., 2019; Hecobian et al., 2011; Liu et al., 2016; May et al., 2015; Morgan et al., 2020; Sakamoto et al., 2015; Sedlacek et al., 2018; Zhou et al., 2017). It is theorized that both losses and gains in OA mass are likely happening concurrently in most plumes through condensation and evaporation (May et al., 2015; Hodshire et al., 2019a, 2019b; Bian et al., 2017; Palm et al., 2020), with the balance between the two determining whether net increases or decreases or no change in mass occurs during near-field aging. However, there is currently no reliable predictor of how smoke aerosol mass concentration (normalized for dilution) may change for a given fire.
Evolution of total aerosol number, size, and composition is critical for improving quantitative understanding of how biomass burning smoke plumes impact climate. These impacts include smoke aerosols' abilities to both act as cloud condensation nuclei (CCN) and to scatter or absorb solar radiation (Albrecht, 1989; Petters and Kreidenweis, 2007; Seinfeld and Pandis, 2006; Twomey, 1974; Wang et al., 2008). Particles can increase or decrease in size as well as undergo compositional changes through condensation or evaporation of more volatile compounds. In contrast, coagulation always decreases total number concentrations and increases average particle diameter. Plumes with higher aerosol number concentrations will undergo more coagulation than those with lower concentrations (Sakamoto et al., 2016).
Fires in the western United States region are predicted to increase in size, intensity, and frequency (Dennison et al., 2014; Ford et al., 2018; Spracklen et al., 2009; Yue et al., 2013). In response, several large field campaigns have taken place in the last 7 years examining wildfires in this region (Kleinman et al., 2020; Garofalo et al., 2019; Palm et al., 2020). Here, we present smoke plume observations from the Biomass Burning Observation Project (BBOP) campaign of aerosol properties from five research flights sampling wildfires downwind in seven pseudo-Lagrangian sets of transects to investigate the evolution of OA mass and oxidation state, aerosol number, and aerosol number mean diameter. A range of initial (at the time of the first plume pass in the aircraft) plume OA mass concentrations were captured within these flights, and fast (1 s) measurements of aerosols and key vapors were taken. The time resolution of the data was fast enough to segregate each transect into edge, core, or intermediate regions of the plume and examine aerosol properties within the context of both the location within the plume (edge, core, or intermediate) and the initial OA mass loading of the given location. The differences in aerosol loading serve as a proxy for differences in initial fire and plume sizes, mass fluxes, and subsequent amount of dilution. The extent to which dilution has occurred prior to the first observation is not a measurable quantity, and fire sizes and mass fluxes were not estimated as a part of the BBOP campaign. We create mathematical fits for predicting OA oxidation markers and mean particle diameter given initial plume OA mass concentration and physical age (time) of the smoke. These fits may be used to evaluate other smoke datasets and assist in building parameterizations for regional and global climate models to better predict smoke aerosol climate and health impacts.
The BBOP field campaign occurred in 2013 and included a deployment of the United States Department of Energy Gulfstream 1 (G-1) research aircraft in the Pacific Northwest region of the United States (Kleinman and Sedlacek, 2016; Sedlacek et al., 2018) from 15 June to 13 September. We analyze five cloud-free BBOP research flights that had seven total sets of across-plume transects that followed the smoke plume downwind in a Lagrangian manner (see Figs. S1–S6 for examples; Table S1) from approximately 15 min after emission to 2–4 h downwind (Kleinman and Sedlacek, 2016). The G-1 sampling setup is described in Kleinman and Sedlacek (2016), Sedlacek et al. (2018), and Kleinman et al. (2020).
Number size distributions were obtained with a fast-integrating mobility spectrometer (FIMS), providing particle size distributions nominally from approximately 20–350 nm (Kulkarni and Wang, 2006; Olfert and Wang, 2009); data were available between 20–262 nm for the flights used in this study. A soot photometer aerosol mass spectrometer (SP-AMS) provided organic and inorganic (sulfate, chlorine, nitrate, ammonium) aerosol mass concentration of PM1 (sub-micron aerosol) (Canagaratna et al., 2007), select fractional components (the fraction of the AMS OA spectra at a given mass-to-charge ratio) (Onasch et al., 2012), and elemental analysis ( and ) (Aiken et al., 2008; Canagaratna et al., 2015). Extended details on the SP-AMS are provided in Sect. S1 in the Supplement, and a brief overview is given here. The SP-AMS had its highest sensitivity between 70–500 nm, dropping to 50 % of peak sensitivity by 1000 nm (Liu et al., 2007). It was characterized to have a collection efficiency of 0.5 when the instrument's laser was off and 0.76 when the instrument's laser was on during the BBOP campaign, and these corrections have been applied to the data. There is evidence from other studies that the collection efficiency (CE) of the tungsten vaporizer (laser-off mode) (Lim et al., 2019) and the laser vaporizer (laser-on mode, run nominally at 600 ∘C) (Willis et al., 2014) changes as a function of chemical composition, refractory black carbon (rBC) coating thickness, size, and sphericity in laboratory studies (Middlebrook et al., 2012; Willis et al., 2014; Corbin et al., 2015; Massoli et al., 2015; Collier et al., 2018) and in aircraft observations (Kleinman et al., 2007). Results pertinent to changes in CE due to aging (including physical aging as well as chemical changes including oxidation, coating thickness, and sphericity) in smoke plumes are scarce (see discussion in Kleinman et al., 2020). We assume these CEs for the laser-on and laser-off modes are constant in space and time, which is a limitation of this study. We use the calculated f60 and f44 fractions (the unit mass resolution mass concentration ratios of and 44 normalized by the total OA mass concentration) and and elemental ratios of OA as tracers of smoke and oxidative aging. Elevated f60 values are indicative of “levoglucosan-like” species (levoglucosan and other molecules that similarly fragment in the AMS) (Aiken et al., 2009; Cubison et al., 2011; Lee et al., 2010) that are known tracers of smoke primary organic aerosol (POA) (Cubison et al., 2011); f44, the OA fractional component observed by the SP-AMS as the high-resolution ion fragment CO2+ as well as some acid groups, is a proxy for SOA arising from oxidative aging (Alfarra et al., 2004; Cappa and Jimenez, 2010; Jimenez et al., 2009; Volkamer et al., 2006). Fractional components f60 and f44 have been shown to decrease and increase with photochemical aging, respectively, likely due to both evaporation and/or oxidation of semivolatile species that contribute to in the SP-AMS and addition of oxidized species that contribute to in the SP-AMS (Alfarra et al., 2004; Huffman et al., 2009). tends to increase with oxidative aging (Decarlo et al., 2008), whereas ranges from increasing to decreasing with oxidative aging, depending on the types of reactions occurring (Heald et al., 2010). Changes in and (as well as changes in total OA mass, number, f44, and f60) are also influenced by mixing of different air masses and co-oxidation of different VOC precursors (Chen et al., 2015). Tracking with aging may provide clues on the types of reactions that may be occurring; however, variable oxidation timescales can make inferences of this type difficult (Chen et al., 2015). A single-particle soot photometer (SP2; Droplet Measurement Technologies) was used to measure refractory black carbon (BC) between 80–500 nm (Schwarz et al., 2010) through laser-induced incandescence (Moteki and Kondo, 2010; Schwarz et al., 2006). An off-axis integrated-cavity output spectroscopy instrument (Los Gatos, Model 907) measured CO concentrations. An SPN1 radiometer (Badosa et al., 2014; Long et al., 2010) measured total shortwave irradiance. Kleinman et al. (2020) provides extensive details for the BBOP instruments used in this work. The supporting information also includes more details on the instruments used.
To determine the contribution to the concentration of species X from smoke emissions (ΔX), the background concentration of X is subtracted from the measured in-plume species concentrations. To correct for dilution, we normalize ΔX by background-corrected CO (ΔCO), which is inert on timescales of near-field aging (Yokelson et al., 2009). Increases or decreases in CO along the Lagrangian flight path indicate whether the total amount of X in the plume has increased or decreased (implying production or removal) since time of emission. The background concentration of X is determined as a regional average of the observed out-of-plume concentrations of X. To avoid using smoke-impacted measurements we apply a threshold of only using measurements of X that occur in regions that correspond to the lowest 10 % of CO data. We determine the lowest 10 % of CO concentrations for each flight during time periods with a similar altitude, latitude, and longitude as the smoke plume. We perform sensitivity calculations on our assumptions of background regions and discuss them in Sect. 3.
Mass concentrations of O, H, and C are calculated using the and and OA data from the SP-AMS (assuming all of the OA mass is from O, C, and H, and we acknowledge that omitting lower-abundance atoms, such as S and N, contributes to some errors in this assumption), allowing us to calculate the background-corrected OA atomic ratios, , and , following Eq. (1) (where X=O or H):
We note that any non-linear changes in chemistry and composition between the plume and background will not perfectly isolate the elemental factors in smoke. We also background-correct fractional f60 and f44 (using the mass concentrations of , , and OA inside and outside of the plume), but we do not normalize by CO due to these values already being normalized by OA, following Eq. (2) (where f=f60 or f44):
We only consider data to be in-plume if the absolute CO≥150 ppbv. This threshold appears to be capturing clear plume features as seen in the number concentration while excluding background air (Figs. S7–S11). We note that we use different definitions of in-plume and background (i.e., the lowest 10 % of absolute CO measurements) in order to provide a buffer between the plume and background to ensure to the best of our abilities that we are capturing non-smoke-impacted air for the background and smoke-impacted air for in-plume cases. The regions of the lowest 10 % of CO measurements always fall under 150 ppbv (Figs. S7–S11). Similarly, we exclude the lowest 5 % of CO data in the in-plume measurements in our analyses to provide a further buffer between smoke-impacted and background air. We perform sensitivity analyses of our results to our assumptions about background and in-plume values in Sect. 3. Figures S2–S6 indicate the locations of the lowest 10 % of CO for each flight.
From the FIMS, we examine the background-corrected, normalized number concentrations of particles with mobility diameters between 40–262 nm, . This size range allows us to exclude potential influence of fresh nucleation upon the total number concentrations. Occasionally, the background-corrected, normalized number concentration in the FIMS size range between 20–40 nm increases by 1–2 orders of magnitude relative to typical plume conditions, indicating possible nucleation events, primarily at the edges or in between smoke plumes (Figs. S7–S11). Smoke plumes contain particles with diameters larger than 262 nm (Janhäll et al., 2010); thus, we cannot provide total number concentrations, but we can infer how within our observed size range evolves. We also obtain an estimate of how the number mean diameter between 40–262 nm, , changes with aging through
where Ni and Dp, i are the number concentration and geometric mean diameter within each FIMS size bin, respectively.
All of the data are provided at 1 Hz, and all but the SP-AMS fractional component data are available on the US Department of Energy (DOE) Atmospheric Radiation Measurement (ARM) web archive (https://www.arm.gov/research/campaigns/aaf2013bbop, last access 29 April 2021). As the plane traveled at approximately 100 m s−1 on average, the approximate spatial resolution of the data is every 100 m across the plume. The plumes spanned from approximately 5–50 km wide (Figs. S2–S6). The instruments used here had a variety of time lags (all <10 s) relative to a TSI 3563 nephelometer used as a reference. The FIMS also showed additional smearing in flushing smoky air with cleaner air when exiting the plume, with maximum observed flushing timescales around 30 s but generally less (Fig. S12). To test if these lags impact our results, we perform an additional analysis where we only consider the first half of each in-plume transect, when concentrations are generally rising with time (Figs. S12, S13), and our main conclusions are unaffected. We do not test the impacts of other time lags and do not attempt to further correct the data for any time lags. Kleinman et al. (2020) provide further information on instrument time delays during BBOP.
We use MODIS Terra and Aqua fire and thermal anomaly detection data to determine fire locations (Giglio et al., 2006, 2008). We estimate the fire center to be the approximate center of all clustered MODIS detection points for a given sampled fire (Figs. S1–S6). The true fire location at the time of sampling is likely different than the MODIS estimates, depending on the speed of the fire front. To estimate the physical age of the plume, we use the estimated fire center as well as the total FIMS number concentration to determine an approximate centerline of the plume as the smoke travels downwind (an example is provided in Fig. S1). The centerline is subjectively chosen to approximately capture the most-concentrated portion of each plume pass (as estimated using total aerosol number concentrations). We use the mean wind speed and this estimated centerline to calculate an estimated physical age for each transect, and this physical age is assumed to be constant across the transect as plume crossings took between 50–500 s; however, transects that were not perfectly tangential to the mean wind would have sampled different plume ages on the opposite sides of the plume. We did not propagate uncertainty in fire location, wind speed, or centerline through to the physical age, which is a limitation of this study.
As a case example, we examine the aging profiles of smoke from the Colockum fire during the first set of pseudo-Lagrangian transects for flight 730b (Table S1). Figure 1 provides , , Δf60, Δf44, , , , and as a function of the estimated physical age; Figs. S14–S18 provides this information for the other pseudo-Lagrangian transect flight sets studied. (Here, BC represents the refractory BC from the SP2; Sect. 2.) We have divided each transect into four regions: between the 5th–15th (edge), 15th–50th (intermediate, outer), 50th–90th (intermediate, inner), and 90th–100th (core) percentile of ΔCO within each transect. (As discussed above, we exclude the lowest 5 % in order to provide a buffer between the plume edge and background air.) Note that in Fig. 1 (and Figs. S14–S18), the points represent the mean values for each transect and percentile and do not include error bars for uncertainty in the mean or measurement uncertainty as characterization of systematic variance (within plume percentiles) with age is beyond the scope of this study. Figures S2–S6 show the locations of these CO percentile bins for each transect of individual flights. Figure 1 shows the edge and core data, both averaged per transect, and Figs. S14–S18 provide all four percentile bins for each flight. These percentile bins correspond with the thinnest (lowest CO mixing ratio) to thickest (highest CO mixing ratio) portions of the plume, respectively. If a fire has uniform emissions ratios across all regions and dilutes evenly downwind, these percentile bins would correspond to the edges, intermediate outer and intermediate inner regions, and the core of the diluting plume. We use this terminology in this study but note that uneven emissions, mixing, and/or dilution lead to the percentile bins not physically corresponding to our defined regions in some cases. We note that some plumes show more than one maxima in CO concentrations within a given plume crossing, which implies that there may be more than one fire or fire front and that these plumes from separate fires or fronts are not mixing perfectly. Multiple maxima could also imply vertical variations in the location of the core of the plumes that the flights did not capture. Additionally, in at least one of the fires (in flights “730a” and “730b”), the fuels vary between different sides of the fire, as discussed in Kleinman et al. (2020). However, the lowest two ΔCO bins tend towards the physical edges of the plume, and the highest two tend more towards the physical center of the plume (Figs. S2–S6). We do not know where the plane is vertically in the plume, which is a limitation as vertical location will also impact the amount of solar flux able to penetrate through the plume.
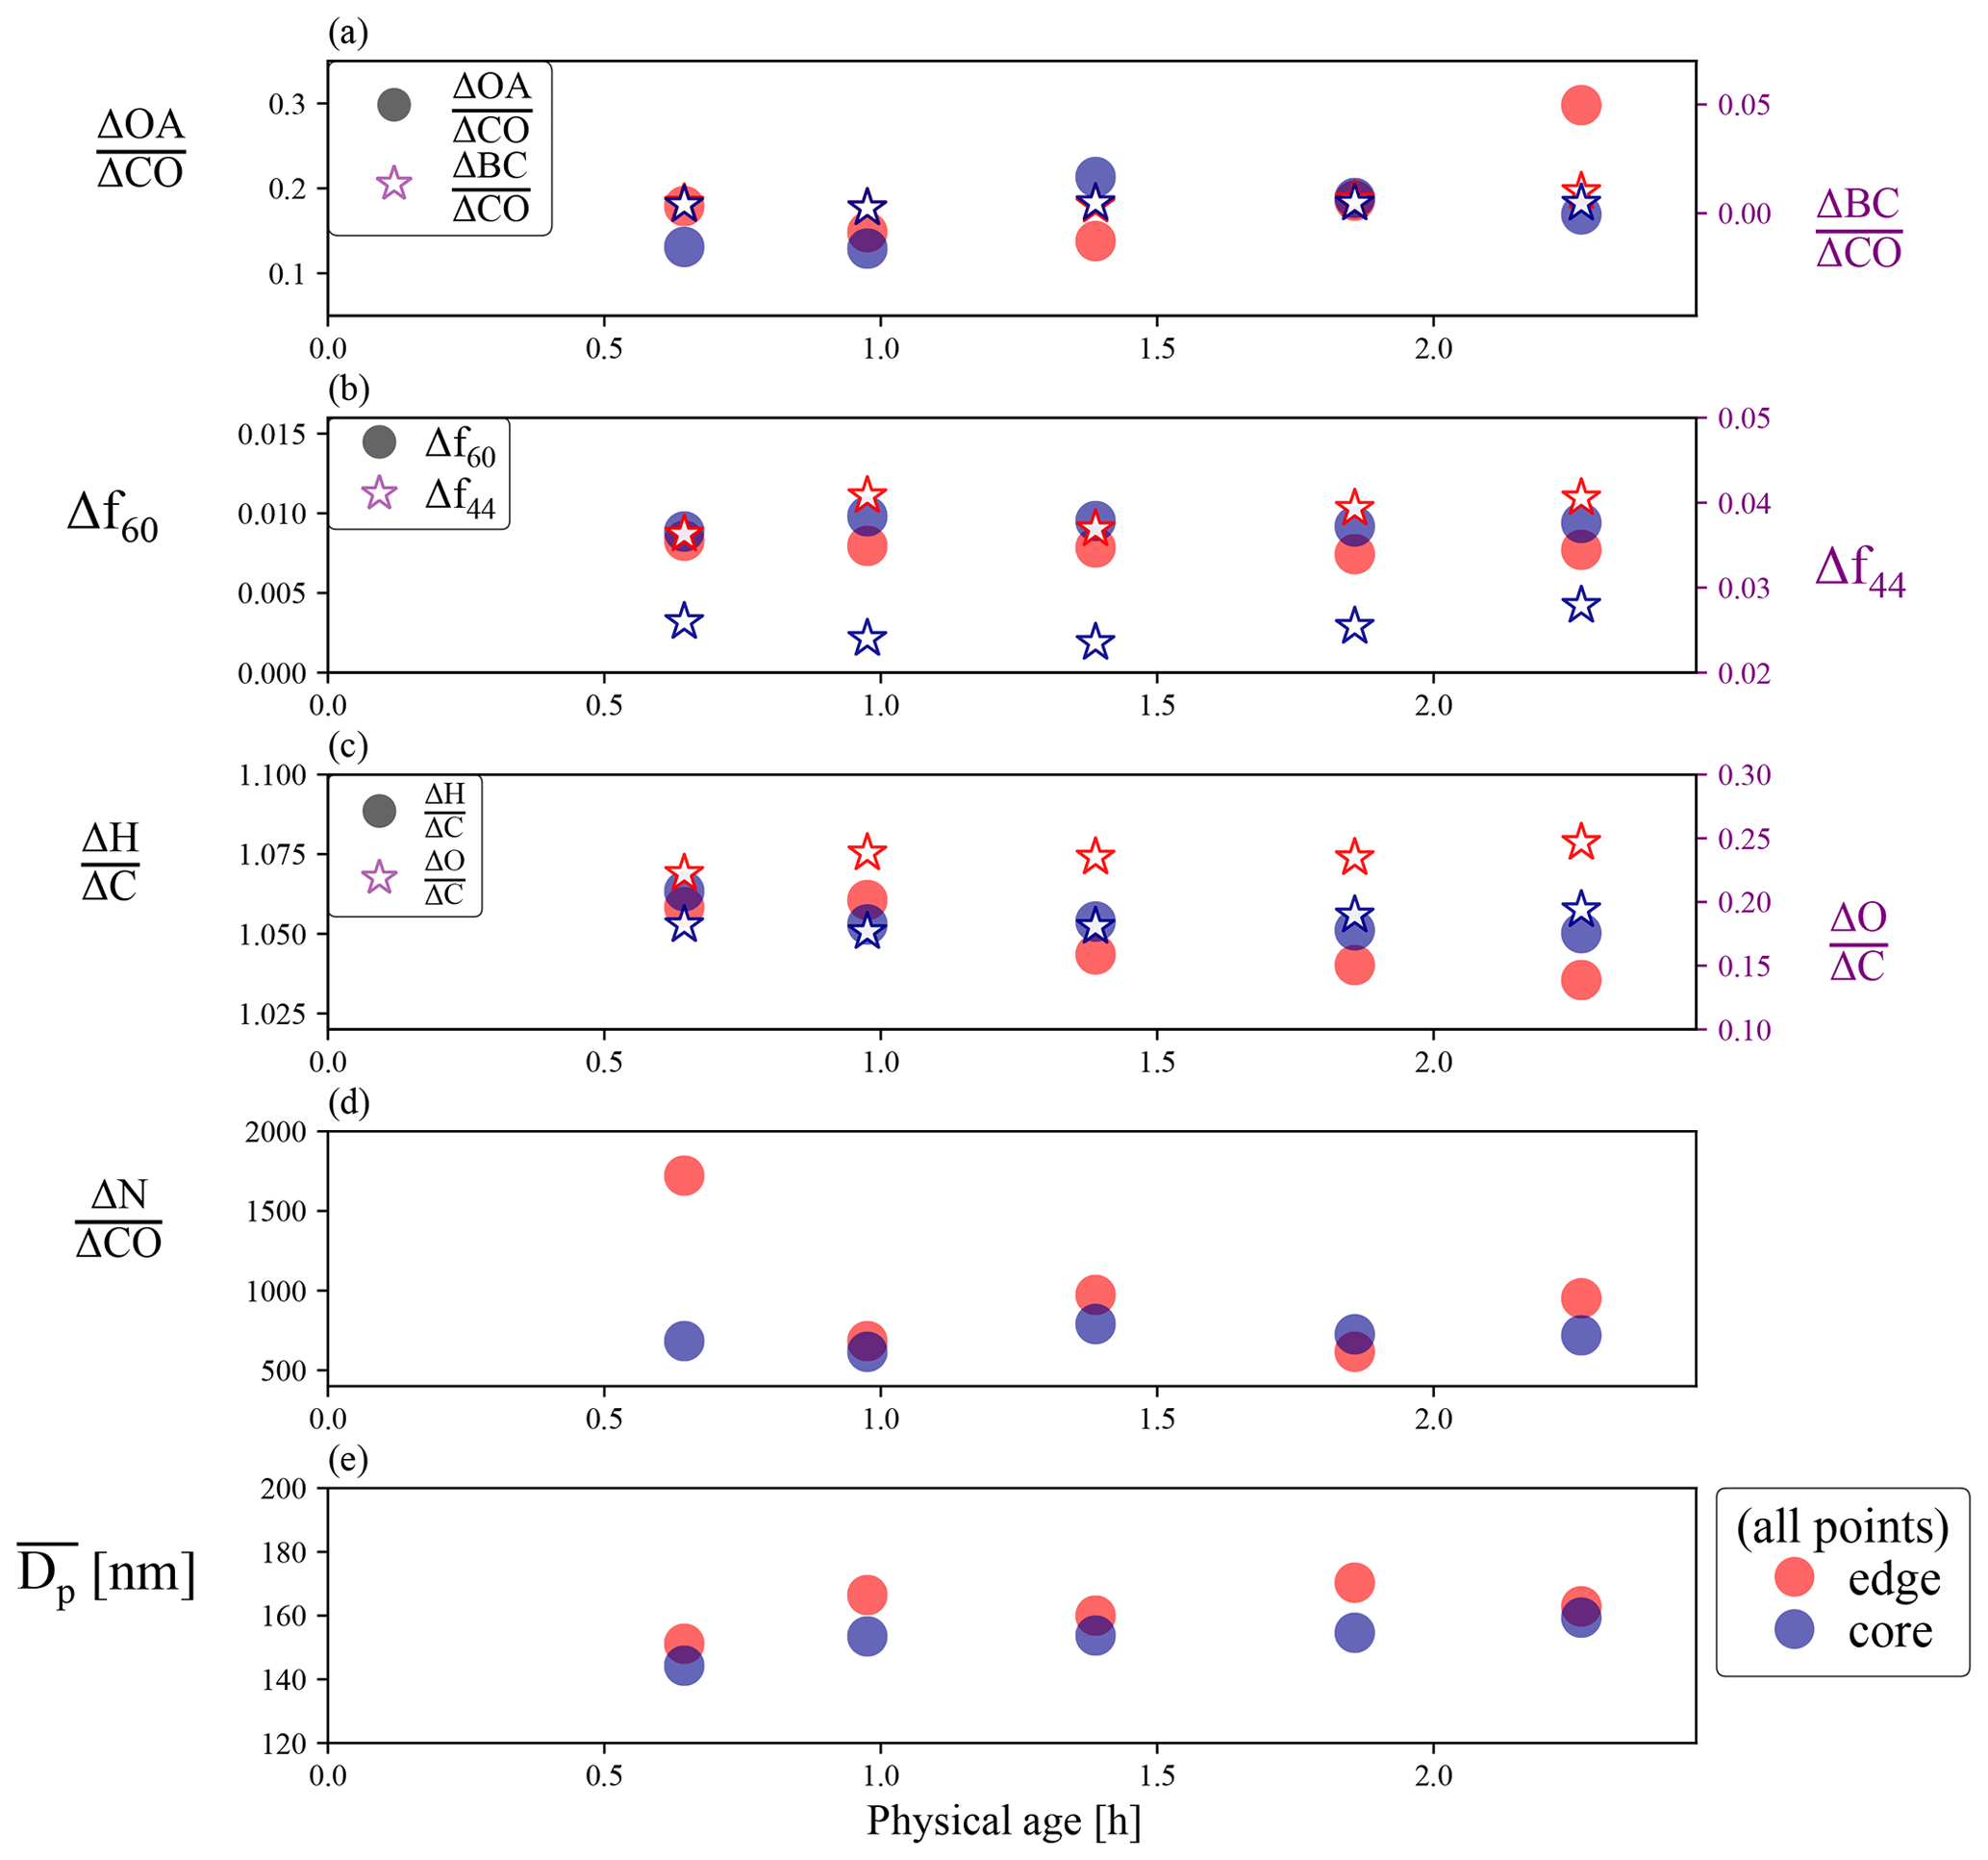
Figure 1Aerosol properties from the first set of pseudo-Lagrangian transects from the Colockum fire on flight “730b”: (a) (right y axis) and (left y axis), (b) Δf60 (right y axis) and Δf44 (left y axis), (c) (right y axis) and (left y axis), (d) , and (e) against physical age. For each transect, the data are divided into edge (the lowest 5 %–15 % of ΔCO data; red points) and core (90 %–100 % of ΔCO data; blue points).
Figure 1 shows that for this specific plume, and systematically vary little with age for both the 5th–15th and 90th–100th percentile of ΔCO (p values >0.5), yet both show non-systematic variability between transects. A true Lagrangian flight with the aircraft sampling the same portion of the plume and no measurement artifacts (e.g., coincidence errors at high concentrations) would have a constant for each transect set. This flight and other flights studied here have variations in (Figs. 1, S14–S18), which may be indicative of deviations from a Lagrangian flight path with temporal variations in emission and/or measurement uncertainties. The remaining variables plotted also show some noise and few clear trends, but it is apparent that the transect-mean values' 5th–15th and 90th–100th percentiles do show a separation for some of the individual metrics, in particular Δf44 and . In order to determine the existence or lack of trends for these metrics, we spend the remainder of this study examining each metric from all of the pseudo-Lagrangian flights together.
3.1 Organic aerosol aging: , Δf60, Δf44, , and
Figure 2a–e show available , Δf60, , and edge and core data versus physical age for each transect for each flight of this study. We color each line by the mean ΔOA within a ΔCO percentile bin from the transect closest to the fire, ΔOAinitial, in order to examine whether each variable (, Δf60, Δf44, , and ) varies with ΔOAinitial. (Some transects do not have data available for specific instruments.) As with Fig. 1, the points in Fig. 2 represent the mean values for each transect and percentile, and we do not include error bars as we do not attempt to characterize systematic variance (within plume percentiles) with age in this study. We note that ΔOAinitial does not actually represent the true initial emitted OA from each fire but instead serves as a proxy for the general fire size, intensity, and emission rate (as larger fires and fires with faster rates of fuel consumption per area will have larger mass fluxes than smaller fires or fires with less fuel consumption per area, all else equal). Thus, ΔOAinitial and other “initial” metrics referred to in this study are not to be taken as emission values, and direct comparison to studies with direct emissions values is not appropriate as dilution and chemistry may occur before the initial flight transect, which we discuss further below. We show the 5th–15th (edge) and 90th–100th (core) ΔCO percentile bins in Fig. 2; Fig. S19 shows the same information for all four ΔCO percentiles. We use the simple “edge” and “core” terminology throughout the following discussion but note that the 5th–15th and 90th–100th ΔCO percentile bins do not necessarily correspond to the physical (spatial) edges and cores of each plume. They instead correspond to the most CO-dense and least CO-dense portions of the plume. We also note that although some of the physical ages appear to start at approximately 0 h (e.g., over the fire), this is from a limitation of our physical age estimation method (Sect. 2) as no flights captured data before approximately 15 min after emission (Kleinman et al., 2016). Flights with two sets of pseudo-Lagrangian transects (“726a” and “730b”) have two separate lines in Fig. 2, one for each set. Additionally, two transects for flight “809a” nearly overlap (Fig. S5), with the transect that is farther from the fire occurring first in the flight path, leading to an apparent slight decrease in physical age for the sequential transect (see, e.g., the white dashed line in Fig. 2a).
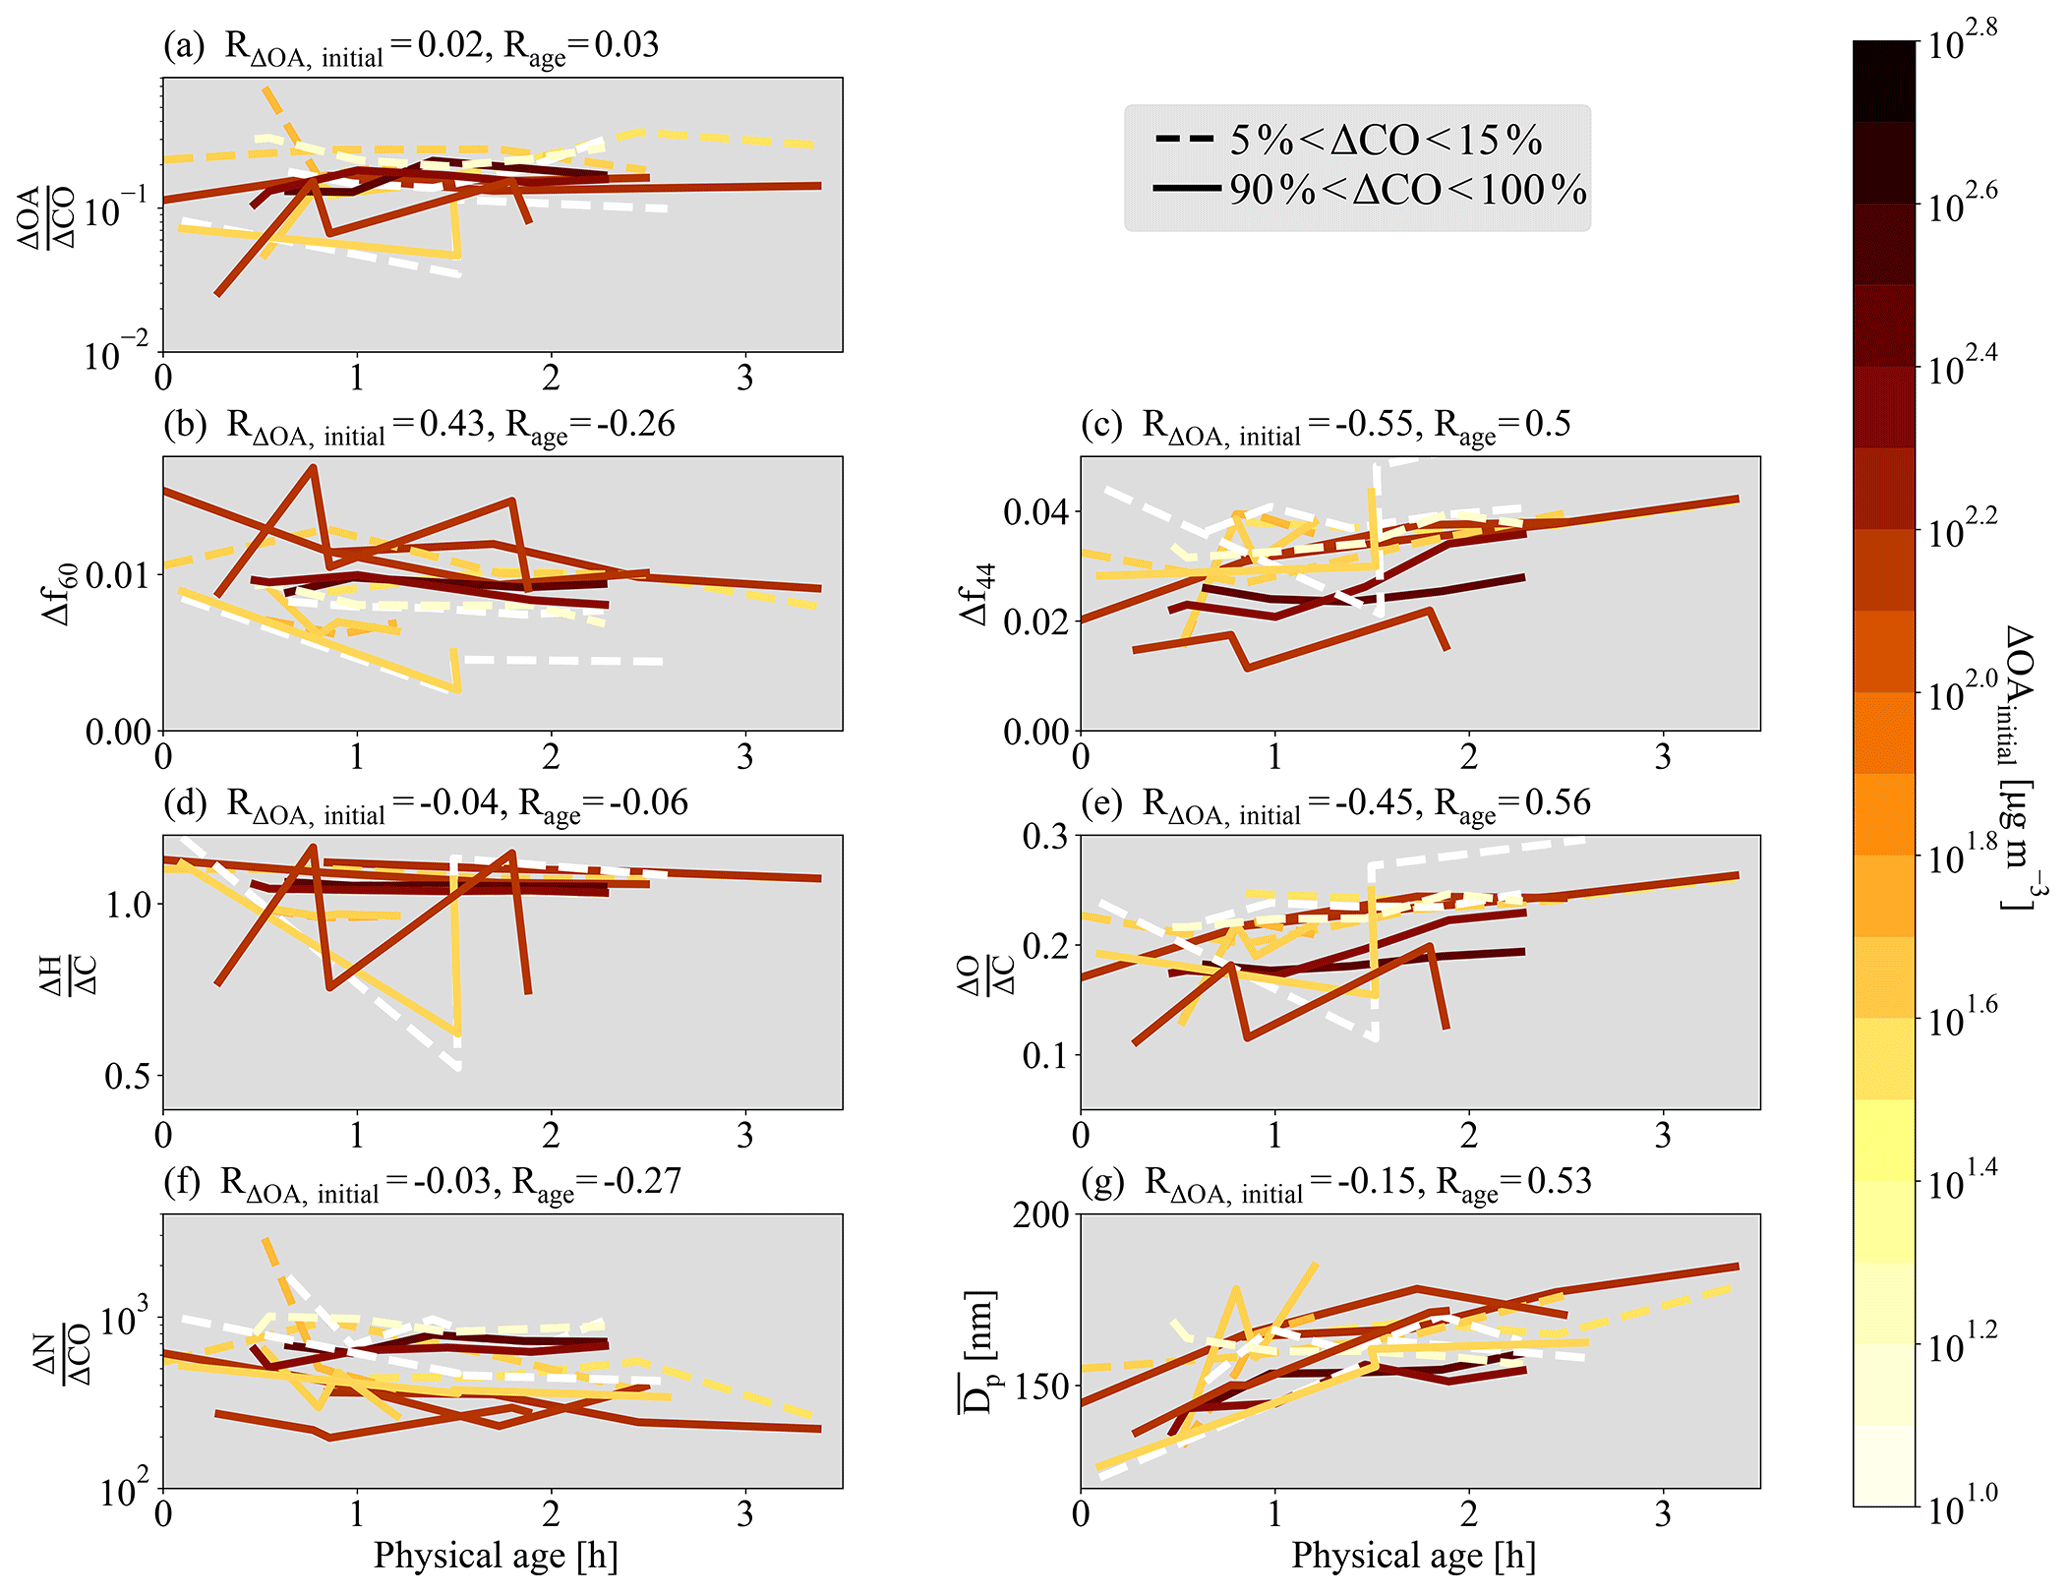
Figure 2Various normalized parameters as a function of physical age for the seven sets of pseudo-Lagrangian transects. Separate lines are shown for the edges (lowest 5 %–15 % of ΔCO; dashed lines) and cores (highest 90 %–100 % of ΔCO; solid lines). (a) , (b) Δf60, (c) Δf44, (d) , (e) , (f) , and (g) between 40–262 nm against physical age for all flights, colored by ΔOAinitial. Some flights have missing data. Also provided is the Spearman correlation coefficient, R, between each variable and ΔOAinitial and physical age for each variable. Note that panels (a) and (f) have a log y axis.
Also included in Fig. 2 are the Spearman rank-order correlation tests (hereafter Spearman tests), which are tests for monotonicity. The Spearman tests show correlation coefficients for each flight set (Table S1) with the initial ΔOA of a flight set (ΔOAinitial) against , Δf60, Δf44, , and as the smoke aerosol ages downwind. We also include Spearman tests for the calculated physical age of the smoke for each flight set against these same variables. The R values are labeled RΔOA, initial and Rage, respectively, in Fig. 2. We calculate these correlation coefficients separately for Fig. 2 to determine the strength and direction of association for each variable from ΔOAinitial or age alone (and whether the data are correlated vs. anticorrelated with these predictors). To complement these independent correlation coefficients, we also perform multivariate linear regressions (Eqs. 4 and 5 and Fig. 3, discussed later) to explicitly decouple the influence of the two predictors. For the correlations with ΔOAinitial, all transects in a given pseudo-Lagrangian set of transects have the same ΔOAinitial value; for flights with two pseudo-Lagrangian sets of transects, each set has its own ΔOAinitial value. Correlating to ΔOAinitial provides an estimate of how the plume aerosol concentrations at the time of the initial transect impact plume aging (aging both before and after this initial transect). We define the following categories of correlation for the absolute value of R: 0.0–0.19 is “very weak”, 0.2–0.39 is “weak”, 0.4–0.59 is “moderate”, 0.6–0.79 is “strong”, and 0.8–1.0 is “very strong” (Evans, 1996).
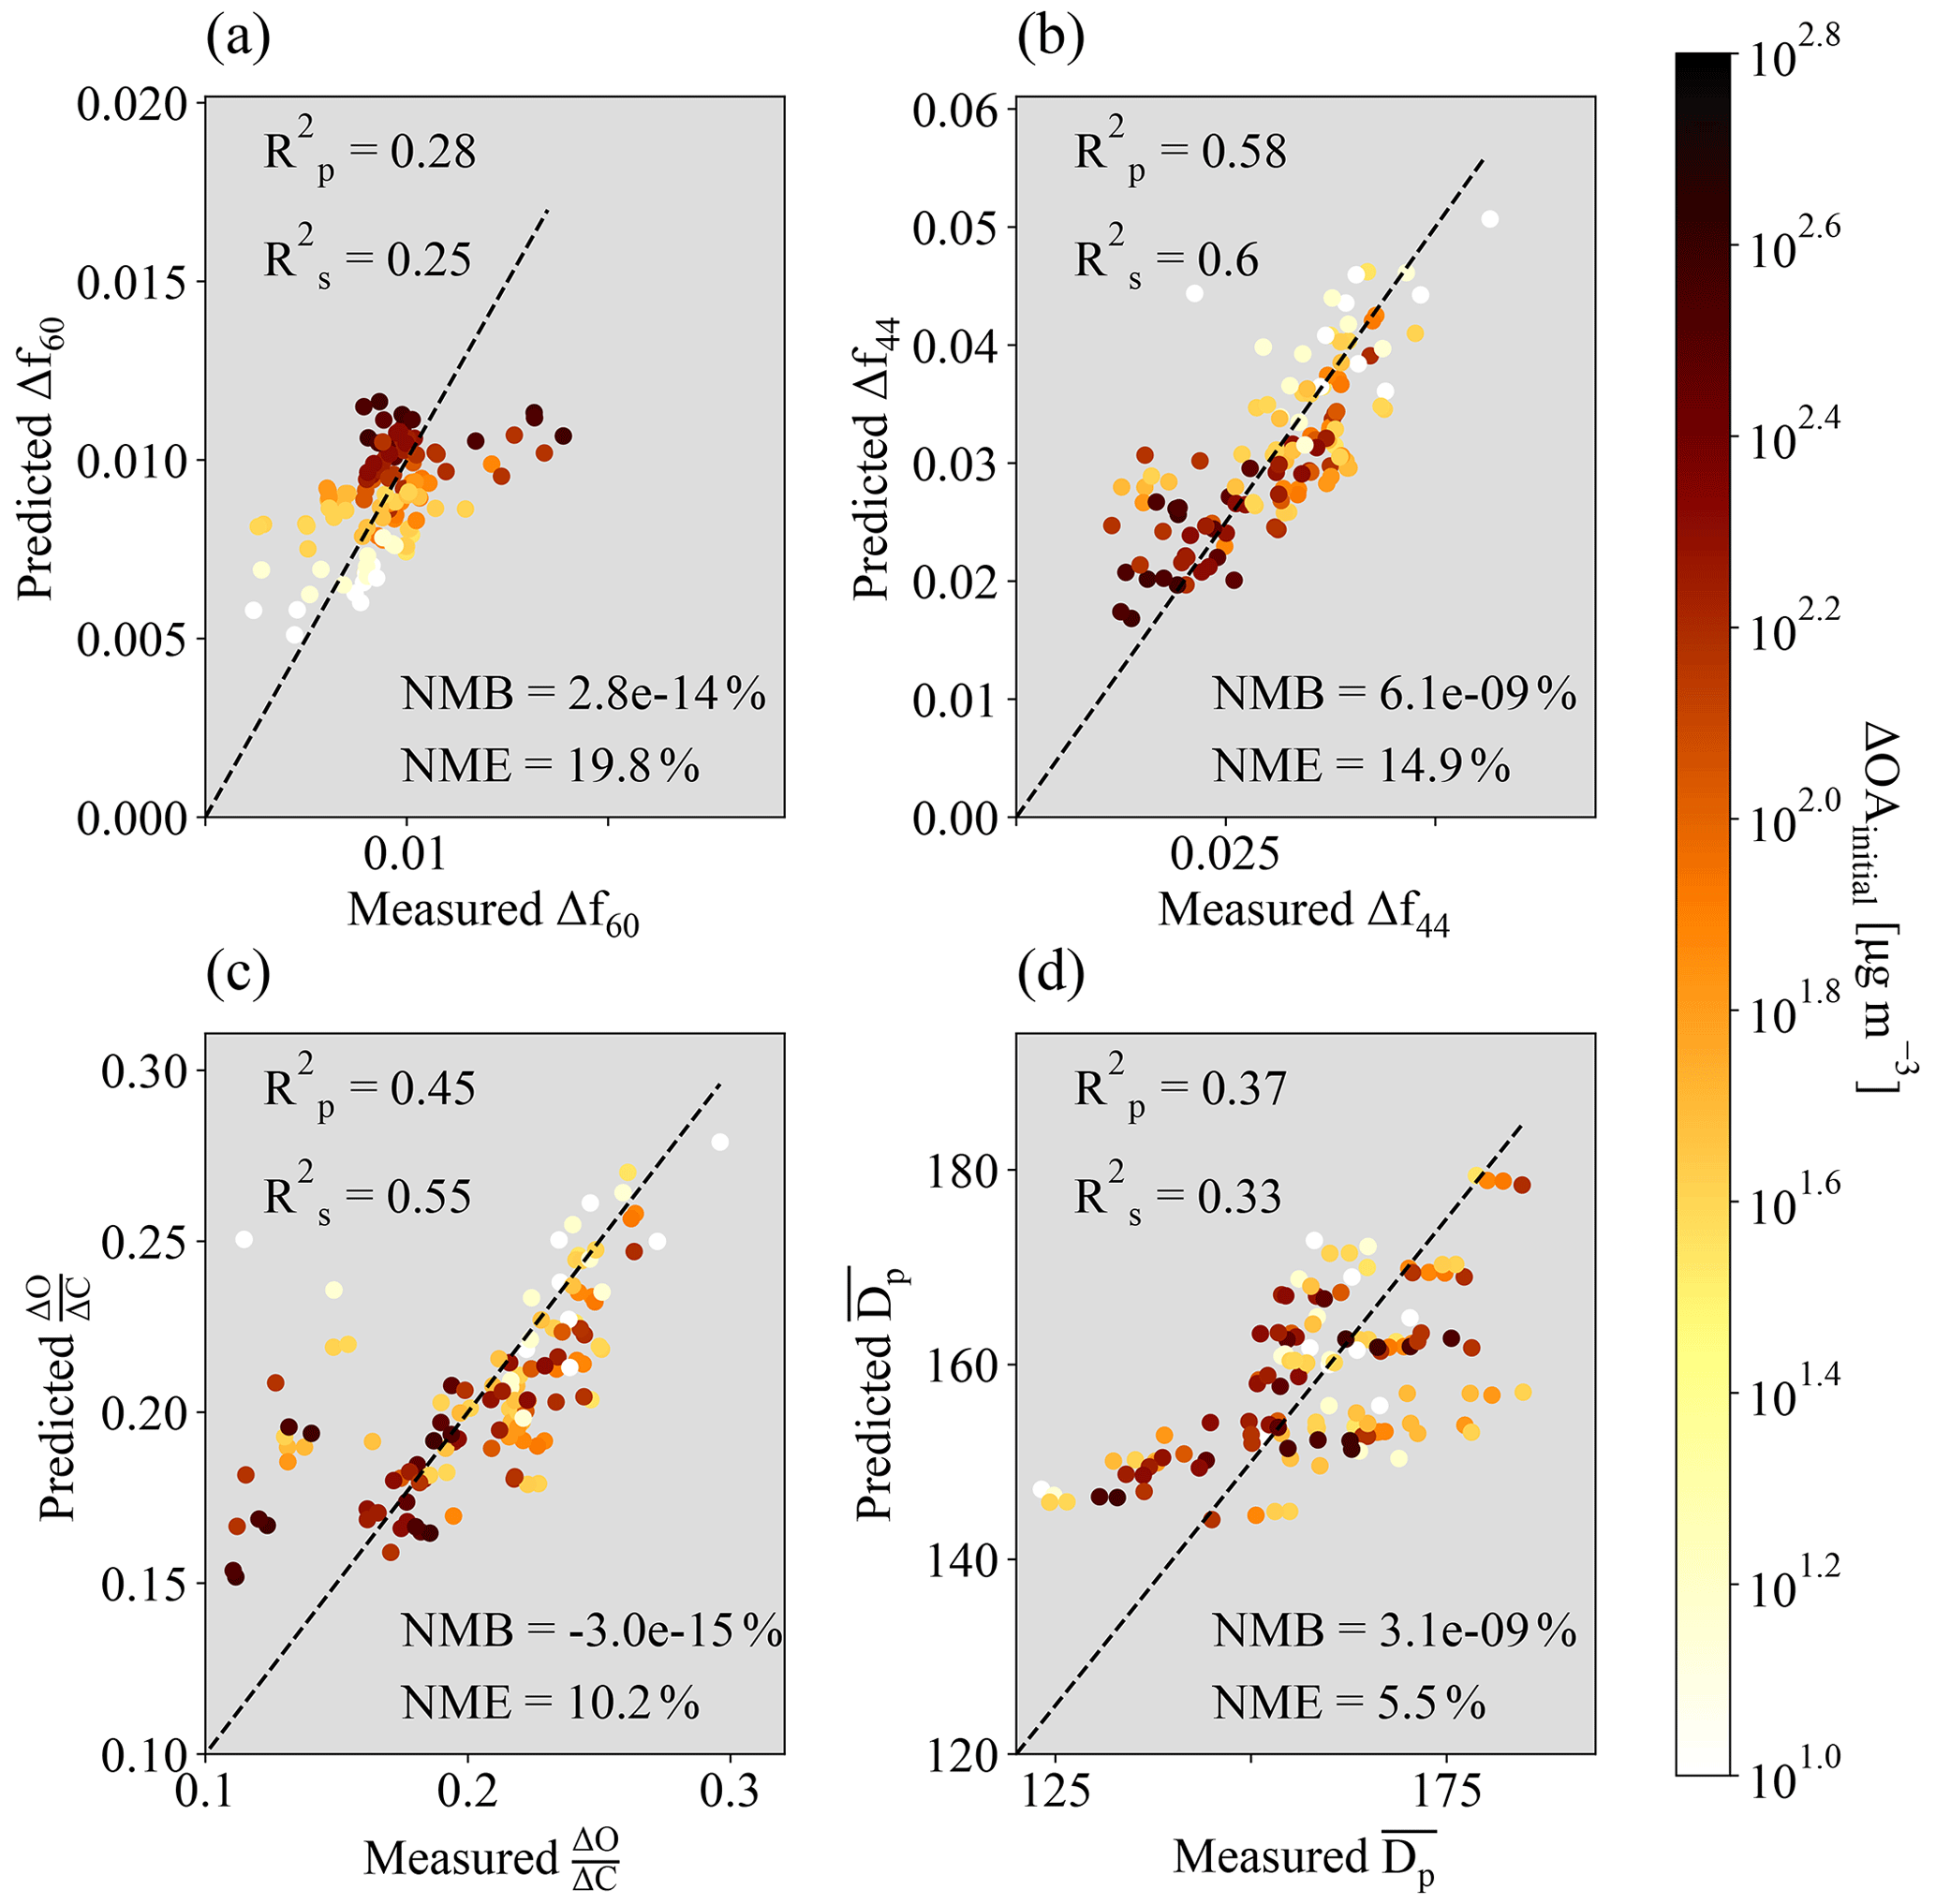
Figure 3Measured versus predicted (a) Δf60, (b) Δf44, (c) , and (d) between 40–262 nm. The predicted values are from the equation , where X=Δf60, Δf44, , or . The values of a, b, and c are provided in Table S3. The Pearson and Spearman coefficients of determination ( and , respectively) are provided in each panel, along with the normalized mean bias (NMB) and normalized mean error (NME). Note that Fig. 2 provides R values rather than R2 to provide information on the trend of the correlation. Included in the fit and figure are points from all four ΔCO regions within the plume (the 5 %–15 %, 15 %–50 %, 50 %–90 %, and 90 %–100 % of ΔCO), all colored by the mean ΔOAinitial of each ΔCO percentile range.
As individual flights show scatter in the metrics of Fig. 2 (Figs. 1, S14–S18), we also include RΔOA, initial and Rage for each metric of Fig. 2, sequentially removing one flight from the statistical analysis. These results are summarized in Table S2. In general, removing single flights does not change our conclusions, particularly when correlations are moderate or stronger. Scatter in ΔOAinitial leads to weaker Rage values than would be obtained if we normalized changes with aging to the first (normalized) value. However, as plume-density-dependent aging prior to the first transect is one of the potentially interesting findings of this study, we feel that it is important to not normalize our changes further. Figures S13 and S19–S22 show the same details as Fig. 2 but provide sensitivity tests to our methodology. Figure S13 examines potential FIMS measurement artifacts by only using data from the first 50 % of each flight leg when particle concentrations are increasing, which lessons response time artifacts of the FIMS during transitions from high- to low-concentration regions. Figure S20 tests our assumed in-plume CO threshold value by increasing it from 150 to 200 pbbv (Fig. S19). Figure S21 tests ΔCO percentile spacing by changing the bins from 5 %–15 %, 15 %–50 %, 50 %–90 %, and 90 %–100 % to 5 %–25 %, 25 %–75 %, and 75 %–100 %. Figure S22 tests assumed background region by increasing data used from the lowest 10 % to the lowest 25 % of CO measurements. Although these figures show slight variability, the findings discussed below remain robust, and we constrain the rest of our discussion to the original assumptions made for the FIMS measurements, in-plume CO threshold value, and ΔCO percentiles used in Fig. 2.
In general, both the cores and edges do not show any positive or negative trend in with respect to physical aging. The correlation coefficients, RΔOA,initial and Rage, show very weak correlations of 0.02 and +0.03 (with RΔOA,initial and Rage ranging between −0.25 and +0.17 and between 0 and 0.07, respectively, when individual flights are left out sequentially; Table S2). The absolute variability in is dominated by differences between plumes. Many previous field campaigns similarly show little change in with aging (Hodshire et al., 2019a and references therein; Palm et al., 2020). This may be due to a balance between evaporation and condensation over the period of time that the plume is observed (Hodshire et al., 2019a). This hypothesis is supported by the observed Δf60 and Δf44: the fractional components Δf60 and Δf44 show clear signs of changes with aging, consistent with previous studies (Cubison et al., 2011; May et al., 2015; Garofalo et al., 2019; Forrister et al., 2015; Lee et al., 2020); Δf60 generally decreases with plume age (; a weak correlation), consistent with the hypothesis that compounds containing species that can fragment to in the SP-AMS may be evaporating because of dilution, undergoing heterogeneous oxidation to new forms that do not appear at and/or having a decreasing fractional contribution due to condensation of other compounds. In contrast, Δf44 generally increases with age (; a moderate correlation) for all plumes with available data. It appears for the plumes in this study that although there is little change in , loss of compounds such as those that contribute to f60 fragments (as captured by the SP-AMS) is roughly balanced by condensation of more oxidized compounds, including those that contain compounds with f44 fragments, such as carboxylic acids. This observation also suggests the possibility of heterogeneous or particle-phase oxidation that would alter the balance of Δf60 and Δf44. However, estimates of heterogeneous mass losses indicate that after 3 h of aging (the range of time the BBOP measurements were taken in) for a range of OH concentrations and reactive uptake coefficients, less than 10 % of aerosol mass is lost to heterogeneous reactions (Fig. S23; see Sect. S2 for more details on the calculation). These calculations indicate that heterogeneous loss has a limited effect on aerosol composition or mass. Hence, the evaporation of compounds that contribute to in the SP-AMS being balanced by gas-phase production of compounds that contribute to in the SP-AMS may be the more likely pathway. When individual flights are left out sequentially, Rage ranges from −0.21 to −0.38 and +0.4 to +0.57 for Δf60 and Δf44, respectively (Table S2).
Two more important features of Δf60 and Δf44 can be seen within Fig. 2: (1) Δf60 and Δf44 depend on ΔOAinitial (moderate correlations of and −0.55, respectively), with plumes with higher ΔOAinitial having consistently higher Δf60 and lower Δf44. (2) The differences in Δf60 and Δf44 are apparent even for the nearest-to-source measurements that are ∼15 min after the time of emission. Prior studies have shown that f60 and f44 at the time of emissions correlate with OA emissions factors through variability in burn conditions (Hennigan et al., 2011; Cubison et al., 2011; McClure et al., 2020), and this relationship might also contribute to our observed correlation between Δf60 and Δf44 with ΔOAinitial. For this emissions relationship to be an important factor, the variability in the OA emission factor needs to be a significant contributor to the variability in ΔOAinitial. The relative variability in the OA emission factor is much smaller than the relative variability in ΔOAinitial, and other factors contributing to variability in ΔOAinitial will negate an emissions-based covariance between ΔOAinitial with Δf60 and Δf44. While our observed ΔOAinitial in Fig. 2 spans nearly a factor of 100, Andreae (2019) shows that the OA emission factors have a −1σ to +1σ range of around a factor 3. Hence, variability in fuel consumption rates and dilution prior to the first transect likely dominate the variability in ΔOAinitial, and the relationships of Δf60 and Δf44 with ΔOAinitial are unlikely to be influenced much by variability in burn conditions. We conclude that evaporation and/or chemistry prior to the first measurement appears to drive the initial relationship between Δf60 and Δf44 with ΔOAinitial, consistent with (1) the theoretical work of Hodshire et al. (2019a); (2) an analysis of what chemistry would be missed in laboratory experiments if the initial 10–60 min of chemistry was not considered, following field experiments (Hodshire et al., 2019b); and (3) recent field analysis indicating that up to one-third of primary OA from biomass burning evaporates and subsequently reacts to form biomass burning SOA (Palm et al., 2020). We include in the Supplement scatterplots of each parameter of Fig. 1 as a function of ΔOAinitial (Fig. S24) and observe no trends other than the cores of the plumes generally having a higher ΔOAinitial than the edges of the plumes, as expected. The amount of evaporation and/or chemistry appears to depend on ΔOAinitial, with higher rates of evaporation and chemistry occurring for lower values of ΔOAinitial. This result is consistent with the hypothesis that aircraft observations are missing evaporation and chemistry prior to the first aircraft observation (Hodshire et al., 2019b). The differences in ΔOAinitial between plumes may be due to different emissions fluxes (e.g., due to different fuels or combustion phases) or plume widths, where larger and/or thicker plumes dilute more slowly than smaller and/or thinner plumes. These larger plumes have been predicted to have less evaporation and may undergo relatively less photooxidation (Bian et al., 2017; Hodshire et al., 2019a, b). When individual flights are left out sequentially, RΔOA,initial ranges from +0.3 to +0.58 and −0.42 to −0.63 for Δf60 and Δf44, respectively (Table S2).
Garofalo et al. (2019) segregated smoke data from the WE-CAN field campaign by distance from the center of a given plume and showed that the edges of one of the fires studied have less fractional f60 and more fractional f44 (not background-corrected) than the core of the plume. Lee et al. (2020) saw similar patterns in a southwestern United States wildfire. Similarly, we find that the 730b flight shows a very similar pattern in f60 and f44 (Figs. S25–S26) to that shown in Fig. 6 of Garofalo et al. (2019). The 821b and 809a flights also hint at elevated f44 and decreased f60 at the edges, but the remaining plumes do not show a clear trend from the physical edges to cores in f60 and f44. This could be because CO concentrations (and thus presumably other species) do not evenly increase from the edge to the core for many of the plume transects studied (Figs. S2–S6). To more clearly see this, Fig. S27 provides the same style of figure as Figs. S26–S27 for in-plume CO concentrations. Generally CO peaks around the centerline and is highest in the most fresh transect but shows variability across transects. We do not have UV measurements that allow us to calculate photolysis rates, but the in-plume SPN1 shortwave measurements in the visible show a dimming in the fresh cores that has a similar pattern to f44 and the inverse of f60 (Fig. S28; the rapid oscillations in this figure could be indicative of sporadic cloud cover above the plumes). Lee et al. (2020) similarly saw indications of enhanced photochemical bleaching at the edges of a southwestern United States wildfire when examining aerosol optical properties.
We also plot core and edge and as a function of physical age (Fig. 2d, e). Similar to Δf44, increases with physical age and is moderately correlated to both physical age and ΔOAinitial (moderate correlations of and ). When individual flights are left out sequentially, Rage for ranges between +0.46 and +0.63, and RΔOA,initial ranges between −0.21 and −0.54 (Table S2). Given that Δf44 and are both metrics for OA aging (Sect. 2), it is unsurprising that we see similar trends between them. Conversely, is poorly correlated to physical age and ΔOAinitial.
Both physical age and ΔOAinitial appear to influence Δf60, Δf44, and : oxidation reactions and evaporation promoted by dilution occur with aging, and the extent of photochemistry and dilution should depend on plume thickness. Being able to predict biomass burning aerosol aging parameters can provide a framework for interstudy comparisons and can aid in modeling efforts. We construct mathematical fits for predicting Δf60, Δf44, and :
where X is Δf60, Δf44, or ; physical age is in hours; and a, b, and c are fit coefficients. The measured versus fit data are shown in Fig. 3a–c. The values of a, b, and c are provided in Table S3. The Pearson and Spearman coefficients of determination ( and , respectively) are also summarized in Fig. 3 and indicate weak–moderate goodness of fits ( and of 0.28 and 0.25 for Δf60, and of 0.58 and 0.6 for Δf44, and and of 0.45 and 0.55 for ). We show R2 here to indicate the fraction of variability captured by these fits, whereas calculating R for the trends in Fig. 2 indicates the direction of the correlation. We do not constrain our fits to go through the origin. To provide further metrics of goodness of fit, we also include the normalized mean bias (NMB) and normalized mean error (NME) in percent for each metric of Fig. 3. The NMB values are very close to zero (which is anticipated as linear fits seek to minimize the sum of squared residuals). The NME is larger, at 19.8 % for Δf60, 14.9 % for Δf44, and 10.2 % for . The p values for each fit are less than 0.01. Although no models that we are aware of currently predict aerosol fractional components (e.g., f60 or f44), and are predicted by some models (e.g., Cappa and Wilson (2012), and these fit parameters may assist in modeling of aging biomass burning aerosol. Other functional forms for fits were explored, with the following form showing similar results as Eq. (4):
(see Fig. S29 and Table S4 for the fit coefficients). We also explored substituting ΔNinitial for ΔOAinitial in Eq. (4) (see Fig. S30 and Table S5 for the fit coefficients). Results from Eq. (5) and substitution of ΔNinitial in Eq. (5) provide similar correlation values and NMB and NME values for Δf60,Δf44, and .
The aging values of Δf60, Δf44, and show scatter in time (Figs. S14–18), which likely contributes to the limited predictive power of our mathematical fits. The scatter is likely due to variability in emissions due to source fuel or combustion conditions, instrument noise and responses under the large concentration ranges encountered in these smoke plumes, inhomogeneous mixing within the plume, variability in background concentrations not captured by our background correction method, inaccurate characterizations of physical age due to variable wind speed, and/or deviations from a true Lagrangian flight path. Equations (4)–(5) performed the best out of the mathematical fits that we tested. These equations do not have a direct physical interpretation due to their indirect relations to age and initial aerosol mass. But they may be used as a starting point for modeling studies as well as for constructing a more physically based fit. There may be another variable not available to us in the BBOP measurements that can improve these mathematical fits, such as photolysis rates. We do not know whether these fits may well represent fires in other regions around the world, given variability in fuels and burn conditions. We also do not know how these fits will perform under nighttime conditions as our fits were made for daytime conditions with different chemistry than would happen at night. We encourage researchers to test these fits with further datasets and modeling. These equations are a first step towards parameterizations appropriate for regional and global modeling and need extensive testing to separate influences of oxidation versus dilution-driven evaporation.
3.2 Aerosol size distribution properties: and
The observations of the normalized number concentration between 40–262 nm, (Fig. 2f), show that plume edges and cores generally show decreases in with physical age, with a weak correlation of (−0.13 to −0.43 when individual flights are left out, sequentially; Table S2). Although we would anticipate that plume regions with higher initial ΔOA would have lower normalized number concentrations due to coagulation (Sakamoto et al., 2016), a few dense cores have normalized number concentrations comparable to or higher than the thinner edges, leading to no correlation with ΔOAinitial. We note that variability in number emissions (e.g., due to burn conditions) adds unexplained variability not captured by the R values.
The mean particle size between 40–262 nm, (Eq. 3), is shown to statistically increase with aging when considered across the BBOP dataset (Fig. 2g) (a moderate correlation of , with Rage ranging between +0.43 and +0.63 when individual flights are left out sequentially; Table S2). Coagulation and SOA condensation will increase . OA evaporation will decrease if the particles are in quasi-equilibrium (where evaporation is independent of surface area) (Hodshire et al., 2019b). However, if evaporation is kinetically limited, smaller particles will preferentially evaporate more rapidly than larger particles, which may lead to an increase in if the smallest particles evaporate below 40 nm (Hodshire et al., 2019b). The plumes do not show significant changes in (Fig. 2a), indicating that coagulation is likely responsible for the majority of increases in . (We acknowledge that may be impacted by measurement artifacts as discussed in Sect. 2. For instance, if the collection efficiency of the AMS is actually decreasing with age, then would be increasing, and the increases in number mean diameter will be due to SOA condensation as well as coagulation.) We do not have measurements for the volatility of the smoke aerosol, and so we cannot refine these conclusions further. We also perform the functional-fit analysis following Sect. 3.1 (Eq. 4; where X is in this case). The fit can also predict more than 30 % of the variance in ( and of 0.37 and 0.33, NME of 5.5 %, and p value less than 0.01; Fig. 3d) but does not predict well (not shown). We show the functional fit for for the alternative fit equation (Eq. 5) in Fig. S29 and Table S4. We also show the functional fit for for Eq. (4) with ΔNinitial in place of ΔOAinitial in Fig. 30 and Table S5. Sakamoto et al. (2016) provide fit equations for modeled as a function of age, but they include a known initial at the time of emission in their parameterization (rather than 15 min or greater, as available to us in this study), which is not available here. ΔNinitial in the place of ΔOAinitial in Eq. (4) predicts similarly (Fig. S30). As discussed in Sect. 3.1, scatter in number concentrations limits our prediction skill.
Particles appear in the 20–40 nm size range in the FIMS measurements independently of plume OA concentrations (Figs. S7–S11), implying that nucleation events may be occurring for some of the transects. Some pseudo-Lagrangian sets of transects also show nucleation-mode particles downwind of fires in between transects (Figs. S7, S8, S9, and S11). Nucleation-mode particles appear to be approximately 1 order of magnitude less concentrated than the larger particles and primarily occur in the outer portion of plumes, although one set of transects did show nucleation-mode particles within the core of the plume (Fig. S11). Nucleation at edges could be due to increased photooxidation from higher total irradiance relative to the core (Fig. S26). Additionally, nucleation is more favorable when the total condensation sink is lower (e.g., reduced particle surface area; Dal Maso et al., 2002), which may occur for outer portions of plumes with little aerosol loading. However, given the relatively small number of data points showing nucleation mode particles and limited photooxidation and gas-phase information, we do not have confidence in the underlying source of the nucleation-mode particles.
The BBOP field campaign provided high-time-resolution (1 s) measurements of gas- and particle-phase smoke measurements downwind of western US wildfires along pseudo-Lagrangian transects. These flights have allowed us to examine near-field (<4 h) aging of smoke particles to provide analyses on how select species vary across a range of initial organic aerosol mass loadings (ΔOAinitial; a proxy for the relative rates at which the plume is anticipated to dilute as dilution before the first observation is not a measurable quantity). We have also examined how the species studied vary between the edges and cores of each plume. We find that although does not correlate with ΔOAinitial or physical age, Δf60 (a marker for evaporation) is moderately correlated with ΔOAinitial (Spearman rank-order correlation test correlation coefficient, RΔOA,initial, of +0.43) and weakly correlated with physical age (Spearman rank-order correlation test correlation coefficient, Rage, of −0.26); Δf44 and (markers for photochemical aging) increase with physical aging (moderate correlations of Rage of +0.5 and +0.56, respectively) and are inversely related to ΔOAinitial (moderate correlations of RΔOA,initial of −0.55 and −0.45, respectively). decreases with physical aging, likely through coagulation. Mean aerosol diameter increases with age primarily due to coagulation as normalized organic aerosol mass does not change significantly and is moderately correlated with physical age (). Nucleation is observed within a few of the fires and appears to occur primarily on the edges of the plumes. Differences in initial values of Δf60, Δf44, and are evidence that evaporation and/or chemistry has occurred before the time of initial measurement and that plumes or plume regions with lower initial aerosol loading can undergo these changes more rapidly than thicker plumes. We have developed fit equations that can weakly to moderately predict Δf60, Δf44, , and mean aerosol diameter given a known initial (at the time of first measurement) total organic aerosol mass loading and physical age. We were unable to quantify the impact on potential inter-fire variability in the emission values of the metrics studied here (such as variable emissions of species that can contribute to and ). We anticipate that being able to capture this additional source of variability may lead to stronger fits and correlation. We encourage researchers to attempt to quantify these chemical and physical changes in future studies before the initial measurement using combinations of modeling and laboratory measurements, where sampling is possible at the initial stages of the fire and smoke. We also suggest further refinement of our fit equations as additional variables (such as photolysis rates) and better quantification of inter-fire variability (such as variable emission rates) are anticipated to improve these fits. We finally suggest future near-field (<24 h) analyses of recent and future biomass burning field campaigns to include differences in initial plume mass concentrations and location within the plume as considerations for understanding chemical and physical processes in plumes.
BBOP data except for the SP-AMS fractional component data used in this paper are available at the US Department of Energy (DOE) Atmospheric Radiation Measurement (ARM) web archive (https://www.arm.gov/research/campaigns/aaf2013bbop, BBOP Biomass Burning Observations Project, 2021). The data products are stored under https://adc.arm.gov/discovery/#/results/iopShortName::aaf2013bbop (Data Discovery, 2021). The SP-AMS fractional component data are available upon request from coauthor Timothy B. Onasch.
The supplement related to this article is available online at: https://doi.org/10.5194/acp-21-6839-2021-supplement.
ALH, JRP, ER, MAL, SMK, and SHJ defined the scientific questions and scope of this work. TBO, SRS, JW, YW, LIK, and AJS carried out primary measurements, data processing, and campaign supervision and design for the BBOP field campaign. ALH and ER performed all new data analysis of BBOP data. AA performed heterogeneous chemistry calculations. ALH prepared the primary text with substantial contributions from JRP, SHJ, TBO, LIK, and DKF. All coauthors contributed to the text, framing, and discussions of the results.
The authors declare that they have no conflict of interest.
We would like to thank Lauren Garofalo, Emily Fischer, Jakob Lindaas, and Ilana Pollack for useful conversations. We thank Charles Long for use of irradiation data. This work is supported by the US NOAA, an Office of Science, Office of Atmospheric Chemistry, Carbon Cycle, and Climate program, under the cooperative agreement awards NA17OAR4310001 and NA17OAR4310003; the US NSF Atmospheric Chemistry program, under grants AGS-1559607 and AGS-1950327; and the US Department of Energy's (DOE) Atmospheric System Research, an Office of Science, Office of Biological and Environmental Research program, under grant DE-SC0019000. Work conducted by Lawrence I. Kleinman, Arthur J. Sedlacek, and Jian Wang was performed under sponsorship of the US DOE Office of Biological and Environmental Research (OBER) Atmospheric System Research Program (ASR) under contracts DE-SC0012704 (BNL; Lawrence I. Kleinman, Arthur J. Sedlacek) and DE-SC0020259 (Jian Wang). Researchers recognize the DOE Atmospheric Radiation Measurement (ARM) Climate Research program and facility for both the support to carry out the BBOP campaign and for use of the G-1 research aircraft. Timothy B. Onasch acknowledges support from the DOE ARM program during BBOP and the DOE ASR program for BBOP analysis (contract DE-SC0014287). Delphine K. Farmer acknowledges funding from the NOAA Climate Program Office's Atmospheric Chemistry, Carbon Cycle, and Climate program (grant NA17OAR4310010). We thank the anonymous reviewers for their constructive feedback.
This research has been supported by the National Oceanic and Atmospheric Administration Climate Program Office (grant nos. NA17OAR4310001, NA17OAR4310003, and NA17OAR4310010), the National Science Foundation (grant nos. AGS‐1559607 and AGS-1950327), and the US Department of Energy Office of Science (grant nos. DE-SC0019000, DE-SC0012704, DE-SC0014287, and DE-SC0020259).
This paper was edited by Barbara Ervens and reviewed by two anonymous referees.
Adachi, K., Sedlacek, A. J., Kleinman, L., Springston, S. R., Wang, J., and Chand, D.: Spherical tarball particles form through rapid chemical and physical changes of organic matter in biomass-burning smoke, P. Natl. Acad. Sci. USA, 16, 19336–19341, https://doi.org/10.1073/pnas.1900129116, 2019.
Aiken, A. C., Decarlo, P. F., Kroll, J. H., Worsnop, D. R., Huffman, J. A., Docherty, K. S., Ulbrich, I. M., Mohr, C., Kimmel, J. R., Sueper, D., Sun, Y., Zhang, Q., Trimborn, A., Northway, M., Ziemann, P. J., Canagaratna, M. R., Onasch, T. B., Alfarra, M. R., Prevot, A. S. H., Dommen, J., Duplissy, J., Metzger, A., Baltensperger, U., and Jimenez, J. L.: and ratios of primary, secondary, and ambient organic aerosols with high-resolution time-of-flight aerosol mass spectrometry, Environ. Sci. Technol., 42, 4478–4485, 2008.
Aiken, A. C., Salcedo, D., Cubison, M. J., Huffman, J. A., DeCarlo, P. F., Ulbrich, I. M., Docherty, K. S., Sueper, D., Kimmel, J. R., Worsnop, D. R., Trimborn, A., Northway, M., Stone, E. A., Schauer, J. J., Volkamer, R. M., Fortner, E., de Foy, B., Wang, J., Laskin, A., Shutthanandan, V., Zheng, J., Zhang, R., Gaffney, J., Marley, N. A., Paredes-Miranda, G., Arnott, W. P., Molina, L. T., Sosa, G., and Jimenez, J. L.: Mexico City aerosol analysis during MILAGRO using high resolution aerosol mass spectrometry at the urban supersite (T0) – Part 1: Fine particle composition and organic source apportionment, Atmos. Chem. Phys., 9, 6633–6653, https://doi.org/10.5194/acp-9-6633-2009, 2009.
Akagi, S. K., Yokelson, R. J., Wiedinmyer, C., Alvarado, M. J., Reid, J. S., Karl, T., Crounse, J. D., and Wennberg, P. O.: Emission factors for open and domestic biomass burning for use in atmospheric models, Atmos. Chem. Phys., 11, 4039–4072, https://doi.org/10.5194/acp-11-4039-2011, 2011.
Akagi, S. K., Craven, J. S., Taylor, J. W., McMeeking, G. R., Yokelson, R. J., Burling, I. R., Urbanski, S. P., Wold, C. E., Seinfeld, J. H., Coe, H., Alvarado, M. J., and Weise, D. R.: Evolution of trace gases and particles emitted by a chaparral fire in California, Atmos. Chem. Phys., 12, 1397–1421, https://doi.org/10.5194/acp-12-1397-2012, 2012.
Albrecht, B. A.: Aerosols, cloud microphysics, and fractional cloudiness, Science, 245, 1227–1230, 1989.
Alfarra, M. R., Coe, H., Allan, J. D., Bower, K. N., Boudries, H., Canagaratna, M. R., Jimenez, J. L., Jayne, J. T., Garforth, A. A., Li, S.-M., and Worsnop, D. R.: Characterization of urban and rural organic particulate in the Lower Fraser Valley using two Aerodyne Aerosol Mass Spectrometers, Atmos. Environ., 38, 5745–5758, 2004.
Alvarado, M. J., Lonsdale, C. R., Yokelson, R. J., Akagi, S. K., Coe, H., Craven, J. S., Fischer, E. V., McMeeking, G. R., Seinfeld, J. H., Soni, T., Taylor, J. W., Weise, D. R., and Wold, C. E.: Investigating the links between ozone and organic aerosol chemistry in a biomass burning plume from a prescribed fire in California chaparral, Atmos. Chem. Phys., 15, 6667–6688, https://doi.org/10.5194/acp-15-6667-2015, 2015.
Andela, N., Morton, D. C., Giglio, L., Paugam, R., Chen, Y., Hantson, S., van der Werf, G. R., and Randerson, J. T.: The Global Fire Atlas of individual fire size, duration, speed and direction, Earth Syst. Sci. Data, 11, 529–552, https://doi.org/10.5194/essd-11-529-2019, 2019.
Andreae, M. O.: Emission of trace gases and aerosols from biomass burning – an updated assessment, Atmos. Chem. Phys., 19, 8523–8546, https://doi.org/10.5194/acp-19-8523-2019, 2019.
Badosa, J., Wood, J., Blanc, P., Long, C. N., Vuilleumier, L., Demengel, D., and Haeffelin, M.: Solar irradiances measured using SPN1 radiometers: uncertainties and clues for development, Atmos. Meas. Tech., 7, 4267–4283, https://doi.org/10.5194/amt-7-4267-2014, 2014.
Bian, Q., Jathar, S. H., Kodros, J. K., Barsanti, K. C., Hatch, L. E., May, A. A., Kreidenweis, S. M., and Pierce, J. R.: Secondary organic aerosol formation in biomass-burning plumes: theoretical analysis of lab studies and ambient plumes, Atmos. Chem. Phys., 17, 5459–5475, https://doi.org/10.5194/acp-17-5459-2017, 2017.
BBOP Biomass Burning Observations Project: https://www.arm.gov/research/campaigns/aaf2013bbop, last access: 4 May 2021.
Brito, J., Rizzo, L. V., Morgan, W. T., Coe, H., Johnson, B., Haywood, J., Longo, K., Freitas, S., Andreae, M. O., and Artaxo, P.: Ground-based aerosol characterization during the South American Biomass Burning Analysis (SAMBBA) field experiment, Atmos. Chem. Phys., 14, 12069–12083, https://doi.org/10.5194/acp-14-12069-2014, 2014.
Cachier, H., Liousse, C., Buat-Menard, P., and Gaudichet, A.: Particulate content of savanna fire emissions, J. Atmos. Chem., 22, 123–148, 1995.
Canagaratna, M. R., Jimenez, J. L., Kroll, J. H., Chen, Q., Kessler, S. H., Massoli, P., Hildebrandt Ruiz, L., Fortner, E., Williams, L. R., Wilson, K. R., Surratt, J. D., Donahue, N. M., Jayne, J. T., and Worsnop, D. R.: Elemental ratio measurements of organic compounds using aerosol mass spectrometry: characterization, improved calibration, and implications, Atmos. Chem. Phys., 15, 253–272, https://doi.org/10.5194/acp-15-253-2015, 2015.
Capes, G., Johnson, B., McFiggans, G., Williams, P. I., Haywood, J., and Coe, H.: Aging of biomass burning aerosols over West Africa: Aircraft measurements of chemical composition, microphysical properties, and emission ratios, J. Geophys. Res.-Atmos., 113, 0–15, 2008.
Cappa, C. D. and Jimenez, J. L.: Quantitative estimates of the volatility of ambient organic aerosol, Atmos. Chem. Phys., 10, 5409–5424, https://doi.org/10.5194/acp-10-5409-2010, 2010.
Cappa, C. D. and Wilson, K. R.: Multi-generation gas-phase oxidation, equilibrium partitioning, and the formation and evolution of secondary organic aerosol, Atmos. Chem. Phys., 12, 9505–9528, https://doi.org/10.5194/acp-12-9505-2012, 2012.
Carrico, C. M., Petters, M. D., Kreidenweis, S. M., Collett, J. L., Jr., Engling, G., and Malm, W. C.: Aerosol hygroscopicity and cloud droplet activation of extracts of filters from biomass burning experiments, J. Geophys. Res., 113, D08206, https://doi.org/10.1029/2007JD009274, 2008.
Canagaratna, M., Jayne, J., Jimenez, J., Allan, J., Alfarra, M., Zhang, Q., Onasch, T., Drewnick, F., Coe, H., Middlebrook, A., Delia, A., Williams, L., Trimborn, A., Northway, M., DeCarlo, P., Kolb, C., Davidovits, P., and Worsnop, D.: Chemical and microphysical characterization of ambient aerosols with the aerodyne aerosol mass spectrometer, Mass Spectrom. Rev., 26, 185–222, https://doi.org/10.1002/mas.20115, 2007.
Chen, Q., Heald, C. L., Jimenez, J. L., Canagaratna, M. R., Qi, Z., Ling-Yan, H., Xiao- Feng, H., Campuzano-Jost, P., Palm, B. B., Poulain, L., Kuwata, M., Martin, S. T., Abbatt, J. P. D., Lee, A. K. Y., and Liggio, J.: Elemental composition of organic aerosol: the gap between ambient and laboratory measurements, Geophys. Res. Lett., 42, 4182–4189, https://doi.org/10.1002/2015gl063693, 2015
Collier, S., Zhou, S., Onasch, T. B., Jaffe, D. A., Kleinman, L., Sedlacek, A. J., Briggs, N. L., Hee, J., Fortner, E., Shilling, J. E., Worsnop, D., Yokelson, R. J., Parworth, C., Ge, X., Xu, J., Butterfield, Z., Chand, D., Dubey, M. K., Pekour, M. S., Springston, S., and Zhang, Q.: Regional Influence of Aerosol Emissions from Wildfires Driven by Combustion Efficiency: Insights from the BBOP Campaign, Environ. Sci. Technol., 50, 8613–8622, 2016.
Collier, S., Williams, L. R., Onasch, T. B., Cappa, C. D., Zhang, X., Russell, L. M., Chen, C. L., Sanchez, K. J., Worsnop, D. R., and Zhang, Q.: Influence of Emissions and Aqueous Processing on Particles Containing Black Carbon in a Polluted Urban Environment: Insights From a Soot Particle-Aerosol Mass Spectrometer, J. Geophys. Res.-Atmos., 123, 6648–6666, https://doi.org/10.1002/2017JD027851, 2018.
Corbin, J. C., Lohmann, U., Sierau, B., Keller, A., Burtscher, H., and Mensah, A. A.: Black carbon surface oxidation and organic composition of beech-wood soot aerosols, Atmos. Chem. Phys., 15, 11885–11907, https://doi.org/10.5194/acp-15-11885-2015, 2015.
Cubison, M. J., Ortega, A. M., Hayes, P. L., Farmer, D. K., Day, D., Lechner, M. J., Brune, W. H., Apel, E., Diskin, G. S., Fisher, J. A., Fuelberg, H. E., Hecobian, A., Knapp, D. J., Mikoviny, T., Riemer, D., Sachse, G. W., Sessions, W., Weber, R. J., Weinheimer, A. J., Wisthaler, A., and Jimenez, J. L.: Effects of aging on organic aerosol from open biomass burning smoke in aircraft and laboratory studies, Atmos. Chem. Phys., 11, 12049–12064, https://doi.org/10.5194/acp-11-12049-2011, 2011.
Dal Maso, M., Kulmala, M., Lehtinen, K. E. J., Mäkelä, J. M., Aalto, P., and O'Dowd, C. D.: Condensation and coagulation sinks and formation of nucleation mode particles in coastal and boreal forest boundary layers, J. Geophys. Res., 107, https://doi.org/10.1029/2001JD001053, 2002.
Data Discovery: https://adc.arm.gov/discovery/#/results/iopShortName::aaf2013bbop, last access: 4 May 2021.
DeCarlo, P. F., Dunlea, E. J., Kimmel, J. R., Aiken, A. C., Sueper, D., Crounse, J., Wennberg, P. O., Emmons, L., Shinozuka, Y., Clarke, A., Zhou, J., Tomlinson, J., Collins, D. R., Knapp, D., Weinheimer, A. J., Montzka, D. D., Campos, T., and Jimenez, J. L.: Fast airborne aerosol size and chemistry measurements above Mexico City and Central Mexico during the MILAGRO campaign, Atmos. Chem. Phys., 8, 4027–4048, https://doi.org/10.5194/acp-8-4027-2008, 2008.
Dennison, P. E., Brewer, S. C., Arnold, J. D., and Moritz, M. A.: Large wildfire trends in the western United States, 1984–2011, Geophys. Res. Lett., 41, 2928–2933, https://doi.org/10.1002/2014gl059576, 2014.
Eatough, D. J., Eatough, N. L., Pang, Y., Sizemore, S., Kirchstetter, T. W., Novakov, T., and Hobbs, P. V.: Semivolatile particulate organic material in southern Africa during SAFARI 2000, J. Geophys. Res., 108, 8479, https://doi.org/10.1029/2002JD002296, 2003.
Evans, J. D.: Straightforward statistics for the behavioral sciences, Thomson Brooks/Cole Publishing Co., Washington, DC, 1996.
Ford, B., Val Martin, M., Zelasky, S. E., Fischer, E. V., Anenberg, S. C., Heald, C. L., and Pierce, J. R.: Future Fire Impacts on Smoke Concentrations, Visibility, and Health in the Contiguous United States, GeoHealth, 2, 229–247, https://doi.org/10.1029/2018GH000144, 2018.
Formenti, P., Elbert, W., Maenhaut, W., Haywood, J., Osborne, S., and Andreae, M. O.: Inorganic and carbonaceous aerosols during the Southern African Regional Science Initiative (SAFARI 2000) experiment: Chemical characteristics, physical properties, and emission data for smoke from African biomass burning, J. Geophys. Res.-Atmos., 108, 8488, https://doi.org/10.1029/2002JD002408, 2003.
Forrister, H., Liu, J., Scheuer, E., Dibb, J., Ziemba, L., Thornhill, K. L., Anderson, B., Diskin, G., Perring, A. E., Schwarz, J. P., Campuzano-Jost, P., Day, D. A., Palm, B. B., Jimenez, J. L., Nenes, A., and Weber, R. J.: Evolution of brown carbon in wildfire plumes, Geophys. Res. Lett., 42, 4623–4630, 2015.
Gan, R. W., Ford, B., Lassman, W., Pfister, G., Vaidyanathan, A., Fischer, E., Volckens, J., Pierce, J. R., and Magzamen, S.: Comparison of wildfire smoke estimation methods and associations with cardiopulmonary-related hospital admissions, GeoHealth, 1, 122–136, 2017.
Garofalo, L. A., Pothier, M. A., Levin, E. J. T., Campos, T., Kreidenweis, S. M., and Farmer, D. K.: Emission and Evolution of Submicron Organic Aerosol in Smoke from Wildfires in the Western United States, ACS Earth Sp. Chem., 3, 1237–1247, https://doi.org/10.1021/acsearthspacechem.9b00125, 2019.
Giglio, L., Csiszar, I., and Justice, C. O.: Global distribution and seasonality of active fires as observed with the Terra and Aqua Moderate Resolution Imaging Spectroradiometer (MODIS) sensors, J. Geophys. Res.-Biogeo., 111, https://doi.org/10.1029/2005JG000142, 2006.
Giglio, L., Csiszar, I., Restás, Á., Morisette, J. T., Schroeder, W., Morton, D., and Justice, C. O.: Active fire detection and characterization with the advanced spaceborne thermal emission and reflection radiometer (ASTER), Remote Sens. Environ., 112, 3055–3063, https://doi.org/10.1016/j.rse.2008.03.003, 2008.
Gilman, J. B., Lerner, B. M., Kuster, W. C., Goldan, P. D., Warneke, C., Veres, P. R., Roberts, J. M., de Gouw, J. A., Burling, I. R., and Yokelson, R. J.: Biomass burning emissions and potential air quality impacts of volatile organic compounds and other trace gases from fuels common in the US, Atmos. Chem. Phys., 15, 13915–13938, https://doi.org/10.5194/acp-15-13915-2015, 2015.
Grieshop, A. P., Logue, J. M., Donahue, N. M., and Robinson, A. L.: Laboratory investigation of photochemical oxidation of organic aerosol from wood fires 1: measurement and simulation of organic aerosol evolution, Atmos. Chem. Phys., 9, 1263–1277, https://doi.org/10.5194/acp-9-1263-2009, 2009.
Hatch, L. E., Luo, W., Pankow, J. F., Yokelson, R. J., Stockwell, C. E., and Barsanti, K. C.: Identification and quantification of gaseous organic compounds emitted from biomass burning using two-dimensional gas chromatography–time-of-flight mass spectrometry, Atmos. Chem. Phys., 15, 1865–1899, https://doi.org/10.5194/acp-15-1865-2015, 2015.
Hatch, L. E., Yokelson, R. J., Stockwell, C. E., Veres, P. R., Simpson, I. J., Blake, D. R., Orlando, J. J., and Barsanti, K. C.: Multi-instrument comparison and compilation of non-methane organic gas emissions from biomass burning and implications for smoke-derived secondary organic aerosol precursors, Atmos. Chem. Phys., 17, 1471–1489, https://doi.org/10.5194/acp-17-1471-2017, 2017.
Heald, C. L., Kroll, J. H., Jimenez, J. L., Docherty, K. S., DeCarlo, P. F., Aiken, A. C., Chen, Q., Martin, S. T., Farmer, D. K., and Artaxo, P.: A simplified description of the evolution of organic aerosol composition in the atmosphere, Geophys. Res. Lett., 37, L08803, https://doi.org/10.1029/2010GL042737, 2010.
Hecobian, A., Liu, Z., Hennigan, C. J., Huey, L. G., Jimenez, J. L., Cubison, M. J., Vay, S., Diskin, G. S., Sachse, G. W., Wisthaler, A., Mikoviny, T., Weinheimer, A. J., Liao, J., Knapp, D. J., Wennberg, P. O., Kürten, A., Crounse, J. D., Clair, J. St., Wang, Y., and Weber, R. J.: Comparison of chemical characteristics of 495 biomass burning plumes intercepted by the NASA DC-8 aircraft during the ARCTAS/CARB-2008 field campaign, Atmos. Chem. Phys., 11, 13325–13337, https://doi.org/10.5194/acp-11-13325-2011, 2011.
Hennigan, C. J., Miracolo, M. A., Engelhart, G. J., May, A. A., Presto, A. A., Lee, T., Sullivan, A. P., McMeeking, G. R., Coe, H., Wold, C. E., Hao, W.-M., Gilman, J. B., Kuster, W. C., de Gouw, J., Schichtel, B. A., Collett Jr., J. L., Kreidenweis, S. M., and Robinson, A. L.: Chemical and physical transformations of organic aerosol from the photo-oxidation of open biomass burning emissions in an environmental chamber, Atmos. Chem. Phys., 11, 7669–7686, https://doi.org/10.5194/acp-11-7669-2011, 2011.
Hobbs, P. V., Sinha, P., Yokelson, R. J., Christian, T. J., Blake, D. R., Gao, S., Kirchstetter, T. W., Novakov, T., and Pilewskie, P.: Evolution of gases and particles from a savanna fire in South Africa, J. Geophys. Res.-Atmos., 108, 8485, https://doi.org/10.1029/2002JD002352, 2003.
Hodshire, A. L., Akherati, A., Alvarado, M. J., Brown-Steiner, B., Jathar, S. H., Jimenez, J. L., Kreidenweis, S. M., Lonsdale, C. R., Onasch, T. B., Ortega, A. M., and Pierce, J. R.: Aging Effects on Biomass Burning Aerosol Mass and Composition: A Critical Review of Field and Laboratory Studies, Environ. Sci. Technol., 53, 10007–10022, 2019a.
Hodshire, A. L., Bian, Q., Ramnarine, E., Lonsdale, C. R., Alvarado, M. J., Kreidenweis, S. M., Jathar, S. H., and Pierce, J. R.: More than emissions and chemistry: Fire size, dilution, and background aerosol also greatly influence near-field biomass burning aerosol aging, J. Geophys. Res.-Atmos., 124, 5589–5611, 2018JD029674, 2019b.
Huffman, J. A., Docherty, K. S., Aiken, A. C., Cubison, M. J., Ulbrich, I. M., DeCarlo, P. F., Sueper, D., Jayne, J. T., Worsnop, D. R., Ziemann, P. J., and Jimenez, J. L.: Chemically-resolved aerosol volatility measurements from two megacity field studies, Atmos. Chem. Phys., 9, 7161–7182, https://doi.org/10.5194/acp-9-7161-2009, 2009.
Janhäll, S., Andreae, M. O., and Pöschl, U.: Biomass burning aerosol emissions from vegetation fires: particle number and mass emission factors and size distributions, Atmos. Chem. Phys., 10, 1427–1439, https://doi.org/10.5194/acp-10-1427-2010, 2010.
Jen, C. N., Hatch, L. E., Selimovic, V., Yokelson, R. J., Weber, R., Fernandez, A. E., Kreisberg, N. M., Barsanti, K. C., and Goldstein, A. H.: Speciated and total emission factors of particulate organics from burning western US wildland fuels and their dependence on combustion efficiency, Atmos. Chem. Phys., 19, 1013–1026, https://doi.org/10.5194/acp-19-1013-2019, 2019.
Jimenez, J. L., Canagaratna, M. R., Donahue, N. M., Prevot, A. S. H., Zhang, Q., Kroll, J. H., DeCarlo, P. F., Allan, J. D., Coe, H., Ng, N. L., Aiken, A. C., Docherty, K. S., Ulbrich, I. M., Grieshop, A. P., Robinson, A. L., Duplissy, J., Smith, J. D., Wilson, K. R., Lanz, V. A., Hueglin, C., Sun, Y. L., Tian, J., Laaksonen, A., Raatikainen, T., Rautiainen, J., Vaattovaara, P., Ehn, M., Kulmala, M., Tomlinson, J. M., Collins, D. R., Cubison, M. J., Dunlea, E. J., Huffman, J. A., Onasch, T. B., Alfarra, M. R., Williams, P. I., Bower, K., Kondo, Y., Schneider, J., Drewnick, F., Borrmann, S., Weimer, S., Demerjian, K., Salcedo, D., Cottrell, L., Griffin, R., Takami, A., Miyoshi, T., Hatakeyama, S., Shimono, A., Sun, J. Y., Zhang, Y. M., Dzepina, K., Kimmel, J. R., Sueper, D., Jayne, J. T., Herndon, S. C., Trimborn, A. M., Williams, L. R., Wood, E. C., Middlebrook, A. M., Kolb, C. E., Baltensperger, U., and Worsnop, D. R.: Evolution of organic aerosols in the atmosphere, Science, 326, 1525–1529, 2009.
Jolleys, M. D., Coe, H., McFiggans, G., Capes, G., Allan, J. D., Crosier, J., Williams, P. I., Allen, G., Bower, K. N., Jimenez, J. L., Russell, L. M., Grutter, M., and Baumgardner, D.: Characterizing the aging of biomass burning organic aerosol by use of mixing ratios: A meta-analysis of four regions, Environ. Sci. Technol., 46, 13093–13102, 2012.
Jolleys, M. D., Coe, H., McFiggans, G., Taylor, J. W., O'Shea, S. J., Le Breton, M., Bauguitte, S. J.-B., Moller, S., Di Carlo, P., Aruffo, E., Palmer, P. I., Lee, J. D., Percival, C. J., and Gallagher, M. W.: Properties and evolution of biomass burning organic aerosol from Canadian boreal forest fires, Atmos. Chem. Phys., 15, 3077–3095, https://doi.org/10.5194/acp-15-3077-2015, 2015.
Kleinman, L. and Sedlacek III, A. J.: Biomass Burning Observation Project (BBOP) Final Campaign Report, https://doi.org/10.2172/1236490, Washington DC, 2016.
Kleinman, L. I., Daum, P. H., Lee, Y. N., Senum, G. I., Springston, S. R., Wang, J., Berkowitz, C., Hubbe, J., Zaveri, R. A., Brechtel, F. J., Jayne, J., Onasch, T. B., and Worsnop, D.: Aircraft observations of aerosol composition and ageing in New England and Mid-Atlantic States during the summer 2002 New England Air Quality Study field campaign, J. Geophys. Res. Atmos., 112, 1–18, https://doi.org/10.1029/2006JD007786, 2007.
Kleinman, L. I., Sedlacek III, A. J., Adachi, K., Buseck, P. R., Collier, S., Dubey, M. K., Hodshire, A. L., Lewis, E., Onasch, T. B., Pierce, J. R., Shilling, J., Springston, S. R., Wang, J., Zhang, Q., Zhou, S., and Yokelson, R. J.: Rapid evolution of aerosol particles and their optical properties downwind of wildfires in the western US, Atmos. Chem. Phys., 20, 13319–13341, https://doi.org/10.5194/acp-20-13319-2020, 2020.
Konovalov, I. B., Beekmann, M., Golovushkin, N. A., and Andreae, M. O.: Nonlinear behavior of organic aerosol in biomass burning plumes: a microphysical model analysis, Atmos. Chem. Phys., 19, 12091–12119, https://doi.org/10.5194/acp-19-12091-2019, 2019.
Koss, A. R., Sekimoto, K., Gilman, J. B., Selimovic, V., Coggon, M. M., Zarzana, K. J., Yuan, B., Lerner, B. M., Brown, S. S., Jimenez, J. L., Krechmer, J., Roberts, J. M., Warneke, C., Yokelson, R. J., and de Gouw, J.: Non-methane organic gas emissions from biomass burning: identification, quantification, and emission factors from PTR-ToF during the FIREX 2016 laboratory experiment, Atmos. Chem. Phys., 18, 3299–3319, https://doi.org/10.5194/acp-18-3299-2018, 2018.
Kroll, J. H. and Seinfeld, J. H.: Chemistry of secondary organic aerosol: Formation and evolution of low-volatility organics in the atmosphere, Atmos. Environ., 42, 3593–3624, 2008.
Kulkarni, P. and Wang, J.: New fast integrated mobility spectrometer for real-time measurement of aerosol size distribution – I: Concept and theory, J. Aerosol Sci., 37, 1303–1325, 2006.
Lee, J. E., Dubey, M. K., Aiken, A. C., Chylek, P., and Carrico, C. M.: Optical and chemical analysis of absorption enhancement by mixed carbonaceous aerosols in the 2019 Woodbury, AZ fire plume, J. Geophys. Res.-Atmos, 125, e2020JD032399. https://doi.org/10.1029/2020JD032399, 2020.
Lee, T., Sullivan, A. P., Mack, L., Jimenez, J. L., Kreidenweis, S. M., Onasch, T. B., Worsnop, D. R., Malm, W., Wold, C. E., Hao, W. M., and Collett, J. L.: Chemical Smoke Marker Emissions During Flaming and Smoldering Phases of Laboratory Open Burning of Wildland Fuels, Aerosol Sci. Technol., 44, i-v, https://doi.org/10.1080/02786826.2010.499884, 2010.
Lim, C. Y., Hagan, D. H., Coggon, M. M., Koss, A. R., Sekimoto, K., de Gouw, J., Warneke, C., Cappa, C. D., and Kroll, J. H.: Secondary organic aerosol formation from the laboratory oxidation of biomass burning emissions, Atmos. Chem. Phys., 19, 12797–12809, https://doi.org/10.5194/acp-19-12797-2019, 2019.
Liu, X., Zhang, Y., Huey, L. G., Yokelson, R. J., Wang, Y., Jimenez, J. L., Campuzano-Jost, P., Beyersdorf, A. J., Blake, D. R., Choi, Y., St. Clair, J. M., Crounse, J. D., Day, D. A., Diskin, G. S., Ried, A., Hall, S. R., Hanisco, T. F., King, L. E., Meinardi, S., Mikoviny, T., Palm, B. B., Peischl, J., Perring, A. E., Pollack, I. B., Ryerson, T. B., Sachse, G., Schwarz, J. P., Simpson, I. J., Tanner, D. J., Thornhil, K. L., Ullmann, K., Weber, R. J., Wennberg, P. O., Wisthaler, A., Wolfe, G. M., and Ziemba, L. D.: Agricultural fires in the southeastern U.S. during SEAC4RS: Emissions of trace gases and particles and evolution of ozone, reactive nitrogen, and organic aerosol, J. Geophys. Res., 121, 7383–7414, 2016.
Liu, P. S. K., Deng, R., Smith, K. A., Williams, L. R., Jayne, J. T., Canagaratna, M. R., Moore, K., Onasch, T. B., Worsnop, D. R., and Deshler, T.: Transmission Efficiency of an Aerodynamic Focusing Lens System: Comparison of Model Calculations and Laboratory Measurements for the Aerodyne Aerosol Mass Spectrometer, Aerosol Sci. Technol., 41, 721–733, 2007
Long, C. N., Bucholtz, A., Jonsson, H., Schmid, B., Vogelmann, A., and Wood, J.: A Method of Correcting for Tilt from Horizontal in Downwelling Shortwave Irradiance Measurements on Moving Platforms, The Open Atmospheric Science Journal, 4, 78–87, https://doi.org/10.2174/1874282301004010078, 2010.
Massoli, P., Onasch, T. B., Cappa, C. D., Nuamaan, I., Hakala, J., Hayden, K., Li, S., Sueper, D. T., Bates, T. S., Quinn, P. K., Jayne, J. T., and Worsnop, D. R.: Characterization of black carbon-containing particles from soot particle aerosol mass spectrometer measurements on the R/V Atlantis during CalNex 2010. J. Geophys. Res.-Atmos., 120, 2575–2593, https://doi.org/10.1002/2014JD022834, 2015.
May, A. A., Levin, E. J. T., Hennigan, C. J., Riipinen, I., Lee, T., Collett, J. L., Jimenez, J. L., Kreidenweis, S. M., and Robinson, A. L.: Gas-particle partitioning of primary organic aerosol emissions: 3. Biomass burning, J. Geophys. Res.-Atmos., 118, 11327–11338, 2013.
May, A. A., Lee, T., McMeeking, G. R., Akagi, S., Sullivan, A. P., Urbanski, S., Yokelson, R. J., and Kreidenweis, S. M.: Observations and analysis of organic aerosol evolution in some prescribed fire smoke plumes, Atmos. Chem. Phys., 15, 6323–6335, https://doi.org/10.5194/acp-15-6323-2015, 2015.
McClure, C. D., Lim, C. Y., Hagan, D. H., Kroll, J. H., and Cappa, C. D.: Biomass-burning-derived particles from a wide variety of fuels – Part 1: Properties of primary particles, Atmos. Chem. Phys., 20, 1531–1547, https://doi.org/10.5194/acp-20-1531-2020, 2020.
Middlebrook, A. M., Bahreini, R., Jimenez, J. L., and Canagaratna, M. R.: Evaluation of composition-dependent collection efficiencies for the Aerodyne aerosol mass spectrometer using field data, Aerosol Sci. Technol., 46, 258–271, https://doi.org/10.1080/02786826.2011.620041, 2012.
Morgan, W. T., Allan, J. D., Bauguitte, S., Darbyshire, E., Flynn, M. J., Lee, J., Liu, D., Johnson, B., Haywood, J., Longo, K. M., Artaxo, P. E., and Coe, H.: Transformation and ageing of biomass burning carbonaceous aerosol over tropical South America from aircraft in situ measurements during SAMBBA, Atmos. Chem. Phys., 20, 5309–5326, https://doi.org/10.5194/acp-20-5309-2020, 2020.
Moteki, N. and Kondo, Y.: Dependence of Laser-Induced Incandescence on Physical Properties of Black Carbon Aerosols: Measurements and Theoretical Interpretation, Aerosol Sci. Technol., 44, 663–675, 2010.
Nance, J. D., Hobbs, P. V., and Radkel, L. F.: Airborne Measurements of Gases and Particles From an Alaskan Wildfire, J. Geophys. Res.-Atmos., 98, 873–882, 1993.
Noyes, K. J., Kahn, R., Sedlacek, A., Kleinman, L., Limbacher, J., and Li, Z.: Wildfire Smoke Particle Properties and Evolution, from Space-Based Multi-Angle Imaging, Remote Sens., 12, 769, https://doi.org/10.3390/rs12050769, 2020.
O'Dell, K., Ford, B., Fischer, E. V., and Pierce, J. R.: Contribution of Wildland-Fire Smoke to US PM2.5 and Its Influence on Recent Trends, Environ. Sci. Technol., 53, 1797–1804, https://doi.org/10.1021/acs.est.8b05430, 2019.
Olfert, J. S. and Wang, J.: Dynamic Characteristics of a Fast-Response Aerosol Size Spectrometer, Aerosol Sci. Technol., 43, 97–111, 2009.
Onasch, T. B., Trimborn, A., Fortner, E. C., Jayne, J. T., Kok, G. L., Williams, L. R., Davidovits, P. and Worsnop, D. R.: Soot Particle Aerosol Mass Spectrometer: Development, Validation, and Initial Application, Aerosol Sci. Tech., 46, 804–817, https://doi.org/10.1080/02786826.2012.663948, 2012.
Palm, B. B., Peng, Q., Fredrickson, C. D., Lee, B. H., Garofalo, L. A., and Pothier, M. A.: Quantification of organic aerosol and brown carbon evolution in fresh wildfire plumes, 117, 29469–29477, https://doi.org/10.1073/pnas.2012218117, 2020.
Petters, M. D. and Kreidenweis, S. M.: A single parameter representation of hygroscopic growth and cloud condensation nucleus activity, Atmos. Chem. Phys., 7, 1961–1971, https://doi.org/10.5194/acp-7-1961-2007, 2007.
Petters, M. D., Carrico, C. M., Kreidenweis, S. M., Prenni, A. J., DeMott, P. J., Collett, J. L., and Moosmüller, H.: Cloud condensation nucleation activity of biomass burning aerosol, J. Geophys. Res., 114, D22205, https://doi.org/10.1029/2009JD012353, 2009.
Ramnarine, E., Kodros, J. K., Hodshire, A. L., Lonsdale, C. R., Alvarado, M. J., and Pierce, J. R.: Effects of near-source coagulation of biomass burning aerosols on global predictions of aerosol size distributions and implications for aerosol radiative effects, Atmos. Chem. Phys., 19, 6561–6577, https://doi.org/10.5194/acp-19-6561-2019, 2019.
Reid, C. E., Brauer, M., Johnston, F. H., Jerrett, M., Balmes, J. R., and Elliott, C. T.: Critical review of health impacts of wildfire smoke exposure, Environ. Health Persp., 124, 1334–1343, https://doi.org/10.1289/ehp.1409277, 2016.
Reid, J. S., Hobbs, P. V., Ferek, R. J., Blake, D. R., Martins, J. V., Dunlap, M. R., and Liousse, C.: Physical, chemical, and optical properties of regional hazes dominated by smoke in Brazil, J. Geophys. Res.-Atmos., 103, 32059–32080, 1998.
Reid, J. S., Eck, T. F., Christopher, S. A., Koppmann, R., Dubovik, O., Eleuterio, D. P., Holben, B. N., Reid, E. A., and Zhang, J.: A review of biomass burning emissions part III: intensive optical properties of biomass burning particles, Atmos. Chem. Phys., 5, 827–849, https://doi.org/10.5194/acp-5-827-2005, 2005.
Sakamoto, K. M., Allan, J. D., Coe, H., Taylor, J. W., Duck, T. J., and Pierce, J. R.: Aged boreal biomass-burning aerosol size distributions from BORTAS 2011, Atmos. Chem. Phys., 15, 1633–1646, https://doi.org/10.5194/acp-15-1633-2015, 2015.
Sakamoto, K. M., Laing, J. R., Stevens, R. G., Jaffe, D. A., and Pierce, J. R.: The evolution of biomass-burning aerosol size distributions due to coagulation: dependence on fire and meteorological details and parameterization, Atmos. Chem. Phys., 16, 7709–7724, https://doi.org/10.5194/acp-16-7709-2016, 2016.
Schwarz, J. P., Gao, R. S., Fahey, D. W., Thomson, D. S., Watts, L. A., Wilson, J. C., Reeves, J. M., Darbeheshti, M., Baumgardner, D. G., Kok, G. L., Chung, S. H., Schulz, M., Hendricks, J., Lauer, A., Kärcher, B., Slowik, J. G., Rosenlof, K. H., Thompson, T. L., Langford, A. O., Loewenstein, M., and Aikin, K. C.: Single-particle measurements of midlatitude black carbon and light-scattering aerosols from the boundary layer to the lower stratosphere, J. Geophys. Res., 111, D16207, https://doi.org/10.1029/2006JD007076, 2006.
Schwarz, J. P., Spackman, J. R., Gao, R. S., Perring, A. E., Cross, E., Onasch, T. B., Ahern, a., Wrobel, W., Davidovits, P., Olfert, J., Dubey, M. K., Mazzoleni, C., and Fahey, D. W.: The Detection Efficiency of the Single Particle Soot Photometer, Aerosol Sci. Technol., 44, 612–628, 2010.
Sedlacek III, A. J., Buseck, P. R., Adachi, K., Onasch, T. B., Springston, S. R., and Kleinman, L.: Formation and evolution of tar balls from northwestern US wildfires, Atmos. Chem. Phys., 18, 11289–11301, https://doi.org/10.5194/acp-18-11289-2018, 2018.
Seinfeld, J. H. and Pandis, S. N.: Atmospheric chemistry and physics: From air pollution to climate change, John Willey & Sons, Inc., New York, 2006.
Shrivastava, M., Cappa, C. D., Fan, J., Goldstein, A. H., Guenther, A. B., Jimenez, J. L., Kuang, C., Laskin, A., Martin, S. T., Ng, N. L., Petaja, T., Pierce, J. R., Rasch, P. J., Roldin, P., Seinfeld, J. H., Shilling, J., Smith, J. N., Thornton, J. A., Volkamer, R., Wang, J., Worsnop D. R., Zaveri, R. A., Zelenyuk, A., and Zhang, Q.: Recent advances in understanding secondary organic aerosol: Implications for global climate forcing, Rev. Geophys., 55, 509–559, 2017.
Spracklen, D. V., Mickley, L. J., Logan, J. A., Hudman, R. C., Yevich, R., Flannigan, M. D., and Westerling, A. L.: Impacts of climate change from 2000 to 2050 on wildfire activity and carbonaceous aerosol concentrations in the western United States, J. Geophys. Res., 114, D20301, https://doi.org/10.1029/2008JD010966, 2009.
Tang, X., Madronich, S., Wallington, T. and Calamari, D.: Changes in tropospheric composition and air quality, J. Photochem. Photobiol. B, 46, 83–95, 1998.
Tie, X., Madronich, S., Walters, S., Zhang, R., Rasch, P., and Collins, W.: Effect of clouds on photolysis and oxidants in the troposphere, J. Geophys. Res.-Atmos., 108, https://doi.org/10.1029/2003JD003659, 2003.
Twomey, S.: Pollution and the planetary albedo, Atmos. Environ., 8, 1251–1256, 1974.
Vakkari, V., Kerminen, V.-M., Beukes, J. P., Titta, P., van Zyl, P. G., Josipovic, M., Wnter, A. D., Jaars, K., Worsnop, D. R., Kulmala, M., and Laakso, L.: Rapid changes in biomass burning aerosols by atmospheric oxidation, Geophys. Res. Lett., 41, 2644–2651, https://doi.org/10.1002/2014GL059396, 2014.
Vakkari, V., Beukes, J. P., Dal Maso, M., Aurela, M., Josipovic, M., and van Zyl, P. G.: Major secondary aerosol formation in southern African open biomass burning plumes, Nat. Geosci., 11, 580–583, 2018.
Volkamer, R., Jimenez, J. L., San Martini, F., Dzepina, K., Zhang, Q., Salcedo, D., Molina, L. T., Worsnop, D. R., and Molina, M. J.: Secondary organic aerosol formation from anthropogenic air pollution: Rapid and higher than expected, Geophys. Res. Lett., Geophys. Res. Lett., 33, L17811, https://doi.org/10.1029/2006GL026899, 2006.
Volkamer, R., Ziemann, P. J., and Molina, M. J.: Secondary Organic Aerosol Formation from Acetylene (C2H2): seed effect on SOA yields due to organic photochemistry in the aerosol aqueous phase, Atmos. Chem. Phys., 9, 1907–1928, https://doi.org/10.5194/acp-9-1907-2009, 2009.
Wang, J., Lee, Y.-N., Daum, P. H., Jayne, J., and Alexander, M. L.: Effects of aerosol organics on cloud condensation nucleus (CCN) concentration and first indirect aerosol effect, Atmos. Chem. Phys., 8, 6325–6339, https://doi.org/10.5194/acp-8-6325-2008, 2008.
Willis, M. D., Lee, A. K. Y., Onasch, T. B., Fortner, E. C., Williams, L. R., Lambe, A. T., Worsnop, D. R., and Abbatt, J. P. D.: Collection efficiency of the soot-particle aerosol mass spectrometer (SP-AMS) for internally mixed particulate black carbon, Atmos. Meas. Tech., 7, 4507–4516, https://doi.org/10.5194/amt-7-4507-2014, 2014.
Yang, M., Blomquist, B. W., and Huebert, B. J.: Constraining the concentration of the hydroxyl radical in a stratocumulus-topped marine boundary layer from sea-to-air eddy covariance flux measurements of dimethylsulfide, Atmos. Chem. Phys., 9, 9225–9236, https://doi.org/10.5194/acp-9-9225-2009, 2009.
Yokelson, R. J., Crounse, J. D., DeCarlo, P. F., Karl, T., Urbanski, S., Atlas, E., Campos, T., Shinozuka, Y., Kapustin, V., Clarke, A. D., Weinheimer, A., Knapp, D. J., Montzka, D. D., Holloway, J., Weibring, P., Flocke, F., Zheng, W., Toohey, D., Wennberg, P. O., Wiedinmyer, C., Mauldin, L., Fried, A., Richter, D., Walega, J., Jimenez, J. L., Adachi, K., Buseck, P. R., Hall, S. R., and Shetter, R.: Emissions from biomass burning in the Yucatan, Atmos. Chem. Phys., 9, 5785–5812, https://doi.org/10.5194/acp-9-5785-2009, 2009.
Yue, X., Mickley, L. J., Logan, J. A., and Kaplan, J. O.: Ensemble projections of wildfire activity and carbonaceous aerosol concentrations over the western United States in the mid-21st century, Atmos. Environ., 77, 767–780, https://doi.org/10.1016/j.atmosenv.2013.06.003, 2013.
Zhou, S., Collier, S., Jaffe, D. A., Briggs, N. L., Hee, J., Sedlacek III, A. J., Kleinman, L., Onasch, T. B., and Zhang, Q.: Regional influence of wildfires on aerosol chemistry in the western US and insights into atmospheric aging of biomass burning organic aerosol, Atmos. Chem. Phys., 17, 2477–2493, https://doi.org/10.5194/acp-17-2477-2017, 2017.