the Creative Commons Attribution 4.0 License.
the Creative Commons Attribution 4.0 License.
 | 05 May 2021
Impact of regional Northern Hemisphere mid-latitude anthropogenic sulfur dioxide emissions on local and remote tropospheric oxidants
Daniel M. Westervelt
Arlene M. Fiore
Colleen B. Baublitz
Gustavo Correa
The unintended consequences of reductions in regional anthropogenic sulfur dioxide (SO2) emissions implemented to protect human health are poorly understood. SO2 decreases began in the 1970s in the US and Europe and are expected to continue into the future, while recent emissions decreases in China are also projected to continue. In addition to the well-documented climate effects (warming) from reducing aerosols, tropospheric oxidation is impacted via aerosol modification of photolysis rates and radical sinks. Impacts on the hydroxyl radical and other trace constituents directly affect climate and air quality metrics such as surface ozone levels. We use the Geophysical Fluid Dynamics Laboratory Atmospheric Model version 3 nudged towards National Centers for Environmental Prediction (NCEP) reanalysis wind velocities to estimate the impact of SO2 emissions from the US, Europe, and China by differencing a control simulation with an otherwise identical simulation in which 2015 anthropogenic SO2 emissions are set to zero over one of the regions. Springtime sulfate aerosol changes occur both locally to the emission region and also throughout the Northern Hemispheric troposphere, including remote oceanic regions and the Arctic. Hydroperoxy (HO2) radicals are directly removed via heterogeneous chemistry on aerosol surfaces, including sulfate, in the model, and we find that sulfate aerosol produced by SO2 emissions from the three individual northern mid-latitude regions strongly reduces both HO2 and hydroxyl (OH) by up to 10 % year-round throughout most of the troposphere north of 30∘ N latitude. Regional SO2 emissions significantly increase nitrogen oxides (NOx) by about 5 %–8 % throughout most of the free troposphere in the Northern Hemisphere by increasing the NOx lifetime as the heterogeneous sink of HO2 on sulfate aerosol declines. Despite the NOx increases, tropospheric ozone decreases at northern mid-latitudes by 1 %–4 % zonally averaged and by up to 5 ppbv in summertime surface air over China, where the decreases in HO2 and OH suppress O3 production. Since 2015 anthropogenic SO2 emissions in China exceed those in the US or Europe, the oxidative response is greatest for the China perturbation simulation. Chemical effects of aerosols on oxidation (reactive uptake) dominate over radiative effects (photolysis rates), the latter of which are only statistically significant locally for the large perturbation over China. We find that the SO2 emissions decrease in China, which has yet to be fully realized, will have the largest impact on oxidants and related species in the Northern Hemisphere free troposphere compared to future decreases in Europe or the US. Our results bolster previous calls for a multipollutant strategy for air pollution mitigation to avoid the unintended consequence of aerosol removal leading to surface ozone increases that offset or mask surface ozone gains achieved by regulation of other pollutants, especially in countries where current usage of high-sulfur emitting fuels may be phased out in the future.
- Article
(3628 KB) - Full-text XML
-
Supplement
(12430 KB) - BibTeX
- EndNote


Understanding and constraining tropospheric oxidants such as the hydroxyl radical (OH) remains a key challenge of direct relevance to understanding the oxidizing power of the atmosphere, radiative forcing, and surface air quality. Despite the critical role in atmospheric chemistry, OH abundances differ widely among chemistry–climate and chemical transport models (Stevenson et al., 2020; Zhao et al., 2019). In addition, global annual mean OH response to historical anthropogenic emission changes (all species) between the preindustrial and the present-day ranged from a 12.7 % decrease to a 14.6 % increase across 17 global models (Naik et al., 2013b), with similar discrepancies across simulations of future composition and climate (Voulgarakis et al., 2013). These differences between model estimates of OH suggest major knowledge gaps in our understanding of the drivers of OH. One potential driver of tropospheric oxidant changes that has not received sufficient study is aerosols, which can uptake radical species (chemical effect) and scatter or absorb incoming solar radiation (radiative effect), thereby impacting OH and other important chemical species (Jacob, 2000; Wild et al., 2000).
Anthropogenic emissions of sulfur dioxide (SO2), a precursor to sulfate aerosol, have significantly decreased in the US and Europe for the last several decades and are projected to continue to decline (Riahi et al., 2011; Vuuren et al., 2011; Westervelt et al., 2015). In China, emissions of anthropogenic aerosols began to decline in about 2013 after increasing for decades (Fontes et al., 2017; Li et al., 2017; Samset et al., 2018). Previous research has indicated that these past and forthcoming emission changes have the potential to influence the tropospheric oxidation capacity on both a regional and global basis (Dentener and Crutzen, 1993; Dickerson et al., 1997; Martin et al., 2003). The aerosol decreases in China were associated with subsequent increases in summertime surface ozone (O3) in China, attributed to a reduction in the sink of radical species such as the hydroperoxyl radical (HO2) that promote O3 production (Li et al., 2019b). Using a model and observations, the authors found that a 40 % decrease in fine particulate matter (PM2.5) in China between 2013 and 2017 led to an increasing ozone trend of up to 3 ppb per year in eastern China and was a more important factor than NOx emissions reductions over the same time period (Li et al., 2019a, b). These findings confirm earlier modeling work and point to an important role for aerosol impacts on tropospheric oxidation with implications for surface O3 concentrations, especially over China (Li et al., 2018; Lou et al., 2014).
On a global scale, the impact of aerosols on tropospheric oxidants has received little attention. Often, aerosol impacts are assumed to be negligible in constraining present and future OH concentrations (Voulgarakis et al., 2013). Primary production of OH depends on the amount of water vapor and O(1D) present (formed via O3 photolysis) and is the dominant pathway of OH formation in most locations except for high latitudes (Spivakovsky et al., 2000). Secondary production involves reactions of HO2 or RO2 (organic peroxy) radicals generated from oxidation of volatile organic compounds (VOCs) or carbon monoxide (CO) with nitric oxide (NO), which regenerates OH. Concentrations of these atmospheric constituents and certain meteorological factors such as absolute humidity, temperature, and ultraviolet radiation are thought to predominantly control OH abundance (Spivakovsky et al., 2000). However, by differencing a Goddard Earth Observing System Chemistry Transport Model (GEOS-Chem) control simulation of late 1990s atmospheric composition with a sensitivity simulation in which the offline global aerosols are excluded, Martin et al. (2003) find that the presence of all aerosols decreases OH by 9 % globally and 5 %–35 % in the Northern Hemisphere boundary layer. The authors also find 15–45 ppbv decreases in boundary layer O3 over India in March associated with the presence of all aerosols compared to all aerosols removed. In a similar global study, Tie et al. (2005) use the Model for Ozone and Related Chemical Tracers version 2 (MOZART-2) to show that the net effect of all aerosols (natural and anthropogenic) reduces HOx (defined as OH + HO2) and O3 by 30 % and 20 %, respectively, improving on past methodology (e.g., Martin et al., 2003) by calculating aerosol abundances interactively. Past studies only considered global distributions of aerosols and often focused on natural aerosols such as dust or sea salt (Bian and Zender, 2003; Liao et al., 2003). The impact of rapidly changing spatially heterogeneous anthropogenic aerosol abundances on tropospheric OH and O3 in response to regional air pollution control programs is thus an open question.
We expand on past studies by considering sulfate aerosol decrease via SO2 emissions reductions within individual regions (China, Europe, and the US), and quantify the local and remote impacts of changing these emissions on atmospheric HOx, NOx, and O3 concentrations on a seasonal basis within a chemistry–climate model nudged to observed meteorology. We focus on anthropogenic SO2 emissions, which have decreased most dramatically in many regions compared to anthropogenically sourced carbonaceous aerosols or natural aerosols such as dust and sea salt. We seek mechanistic understanding of the interactions between aerosols, oxidants, and radical species and photolysis rates over different regions and in different seasons. We consider two main pathways through which aerosols can affect oxidation: modification of photolysis rates via extinction of incoming solar radiation (radiative effect) and heterogeneous uptake of radical species onto aerosol surfaces (chemical effect). Finally, we consider the impact of anthropogenic SO2 emissions reductions on boreal summertime surface O3 concentrations in China, Europe, and the US.
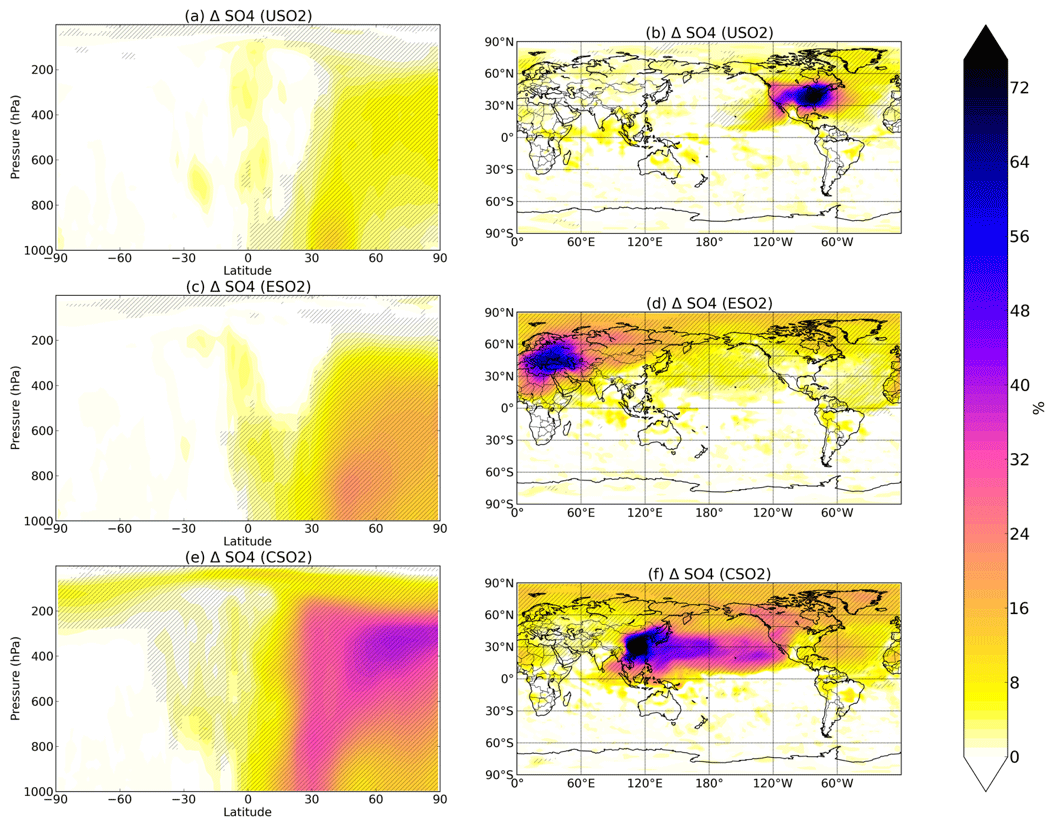
Figure 1Boreal springtime (MAM) mean percent change in sulfate concentration between a control simulation and a perturbation simulation in which anthropogenic SO2 emissions are removed over a certain region: (a, b) US, (c, d) Europe, and (e, f) China. Hatching denotes statistical significance according to a Student's t test at the 95 % confidence level.
Table 1Heterogeneous reactive uptake coefficients for several reactions in GFDL-AM3.
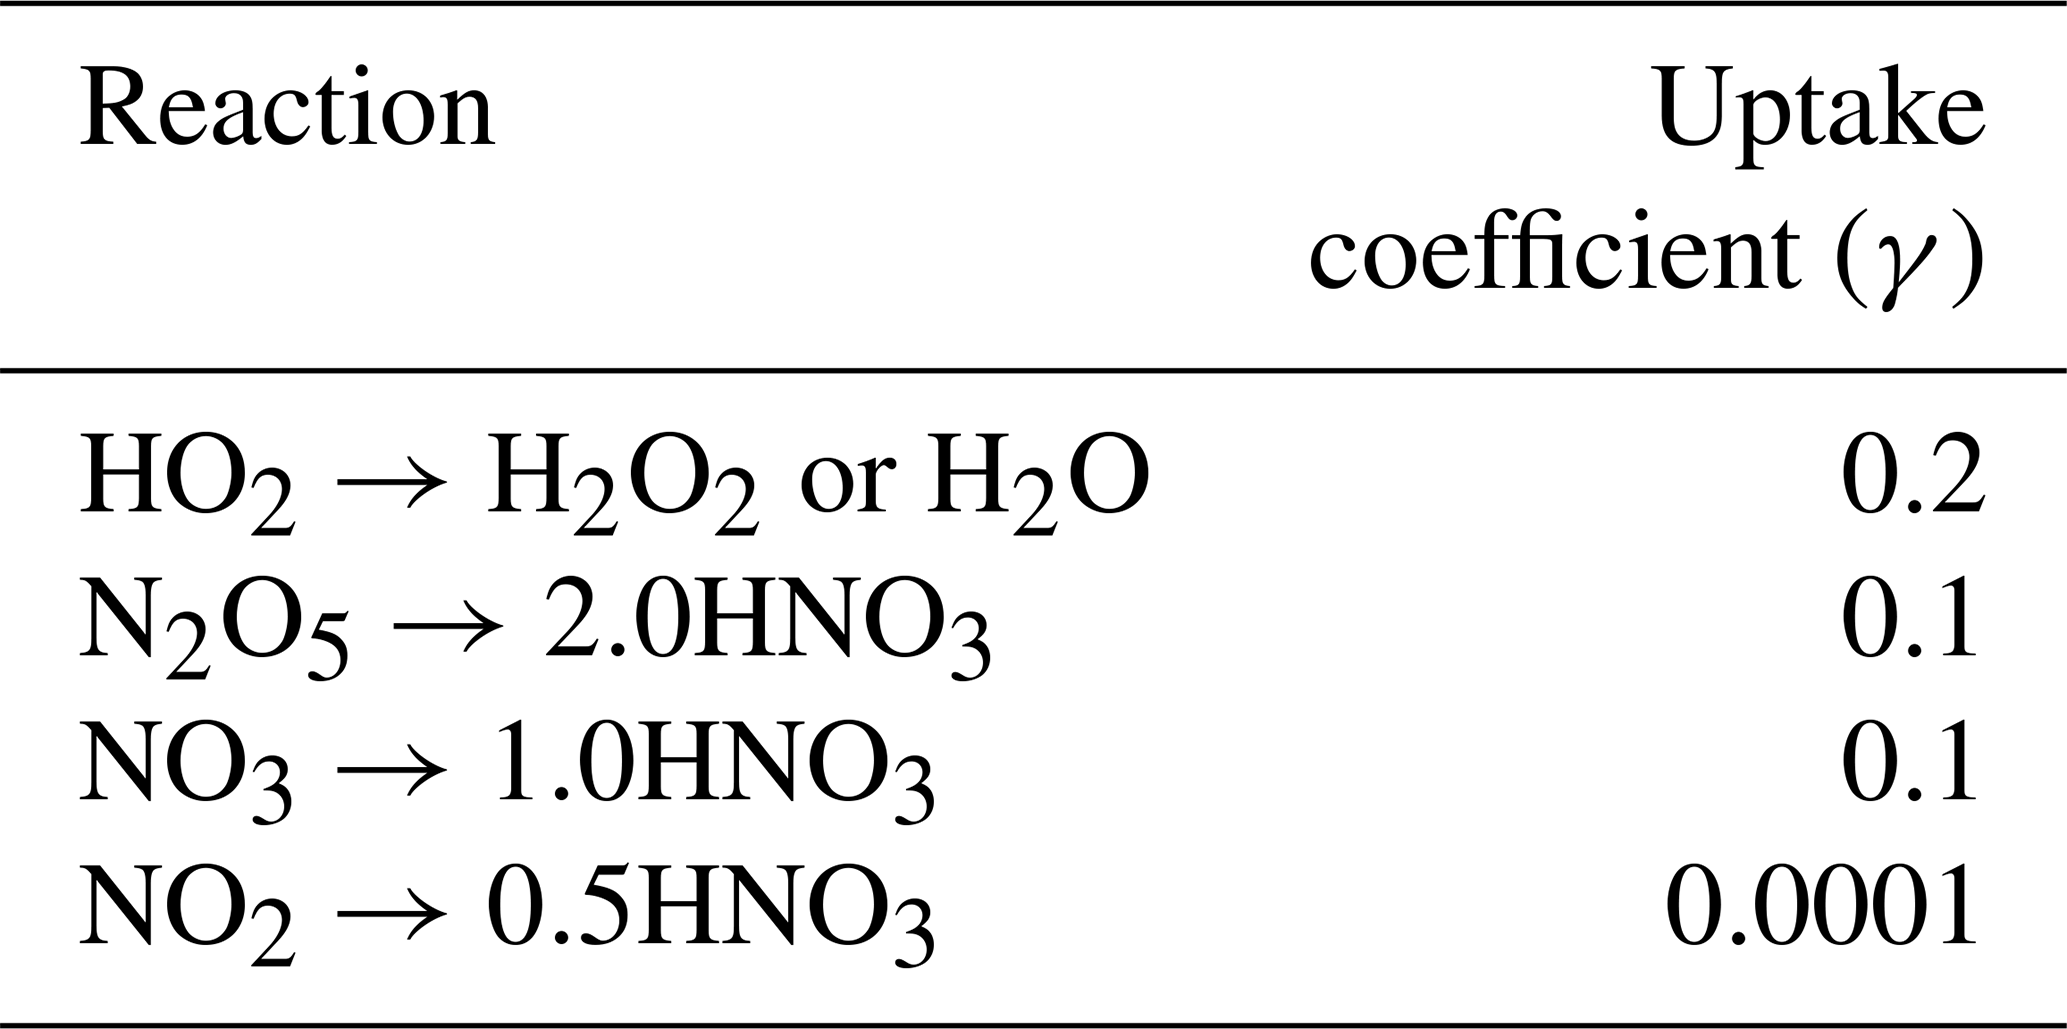
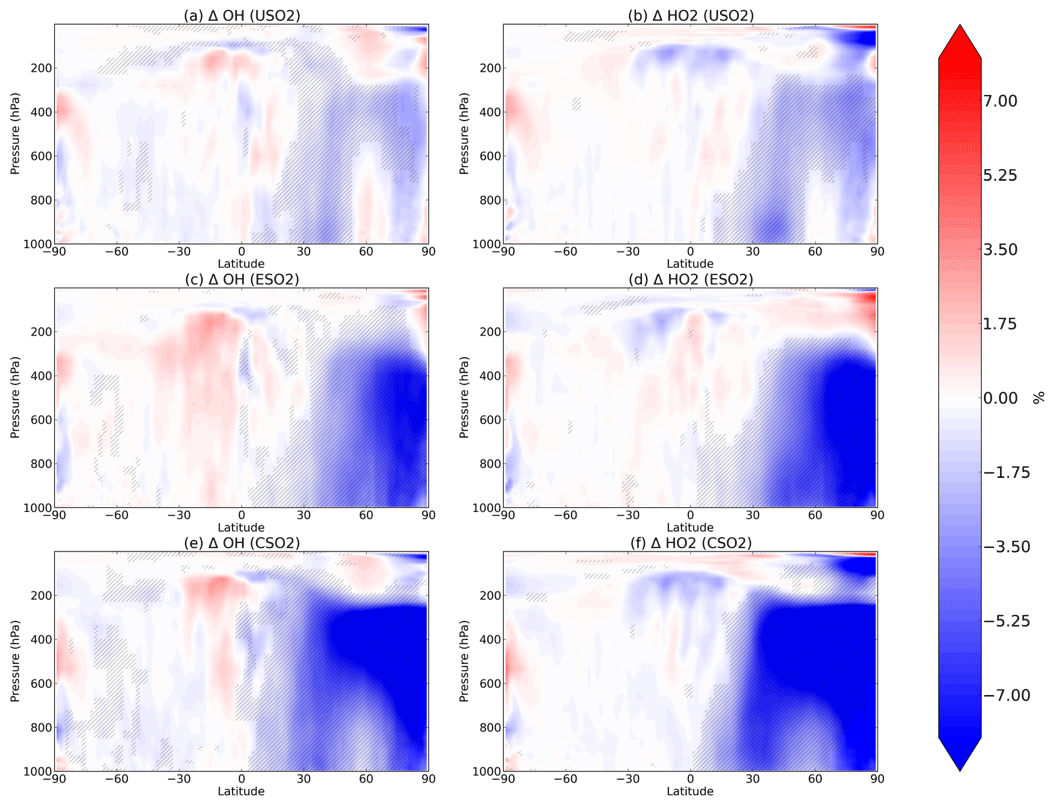
Figure 2Boreal springtime (MAM) mean percent change in OH (a, c, e) and HO2 (b, d, f) between a control simulation and a perturbation simulation in which anthropogenic SO2 emissions are removed over a certain region: (a, b) US, (c, d) Europe, and (e, f) China. Hatching denotes statistical significance according to a Student's t test at the 95 % confidence level.
We use the National Oceanic and Atmospheric Administration Geophysical Fluid Dynamics Laboratory Atmospheric Model version 3 (GFDL-AM3), which is the atmosphere-only component of the GFDL-coupled climate model, CM3 (Donner et al., 2011). The model has been rigorously evaluated against observations in previous work, including against surface observations of O3 over the US, Europe, and China (Donner et al., 2011; Naik et al., 2013a, Westervelt et al., 2019). Paulot et al. (2016) evaluate sulfate concentrations in GFDL-AM3 over the US (Interagency Monitoring of Protected Visual Environments, IMPROVE) and Europe (European Monitoring and Evaluation Programme, EMEP) and find a normalized mean bias of 0.07 in model surface concentrations compared against IMPROVE and a −0.43 mean normalized bias over Europe against EMEP. The model has 48 vertical layers from the surface up to about 0.01 hPa and a six-face cubed-sphere grid with 48 cells along each edge (C48), which is regridded to a 2∘ latitude by 2.5∘ longitude Cartesian grid. Emissions of anthropogenic trace gases and aerosols for year 2015 emissions are from the Representative Concentration Pathway 8.5 (RCP8.5) scenario (Riahi et al., 2011). The tropospheric chemical mechanism for aerosols and gas-phase species follows the work of Horowitz et al. (2003, 2007) with updates to photolysis, radical uptake by aerosols and convective wet scavenging of aerosols. The Fast-JX module (Bian et al., 2003; Wild et al., 2000) calculates the impact of online aerosols and clouds on photolysis rates and actinic fluxes implemented into GFDL-AM3 according to Mao et al. (2013b). Heterogeneous uptake of radical species is simulated according to Mao et al. (2013b) and Mao et al. (2013a) using a first order reactive uptake rate constant k (Eq. 1):
where re is the aerosol effective radius (m), Dg is the gas-phase molecular diffusion coefficient, ν is the mean molecular speed of the gas, and A is the aerosol surface area per unit volume of air. Here we set the heterogeneous reactive uptake coefficient (γ) of HO2 to 0.2 instead of the value of 1.0 in Mao et al. (2013a). Though estimates of γ are uncertain, recent literature suggests such high values of 1.0 are not supported by observations and that the parameter is likely closer to 0.2 (Abbatt et al., 2012; Li et al., 2019a, b; Taketani et al., 2012). Taketani et al. (2012) recommend a middle γ value of 0.24 based on measurements at two high-altitude sites in China. Reactive uptake coefficients for all other reactions including N2O5, NO3, and NO2 are shown in Table 1, taken from Jacob (2000). We allow uptake of HO2, N2O5, NO3, and NO2 onto all aerosol types, including sulfate, black carbon, organic carbon, sea salt, and dust using the same coefficients for each composition. We also include updates to convective wet scavenging of aerosols in the form of finer vertical discretization of convective updraft plumes, resulting in improvements in aerosol budgets (Paulot et al., 2016). Horizontal wind velocities are nudged using a pressure-dependent technique towards reanalysis values from the National Centers for Environmental Prediction Global Forecast System (NCEP GFS; Lin et al., 2012). Further model description and model evaluation against observations can be found in Donner et al. (2011), Naik et al. (2013a), and Rasmussen et al. (2012).
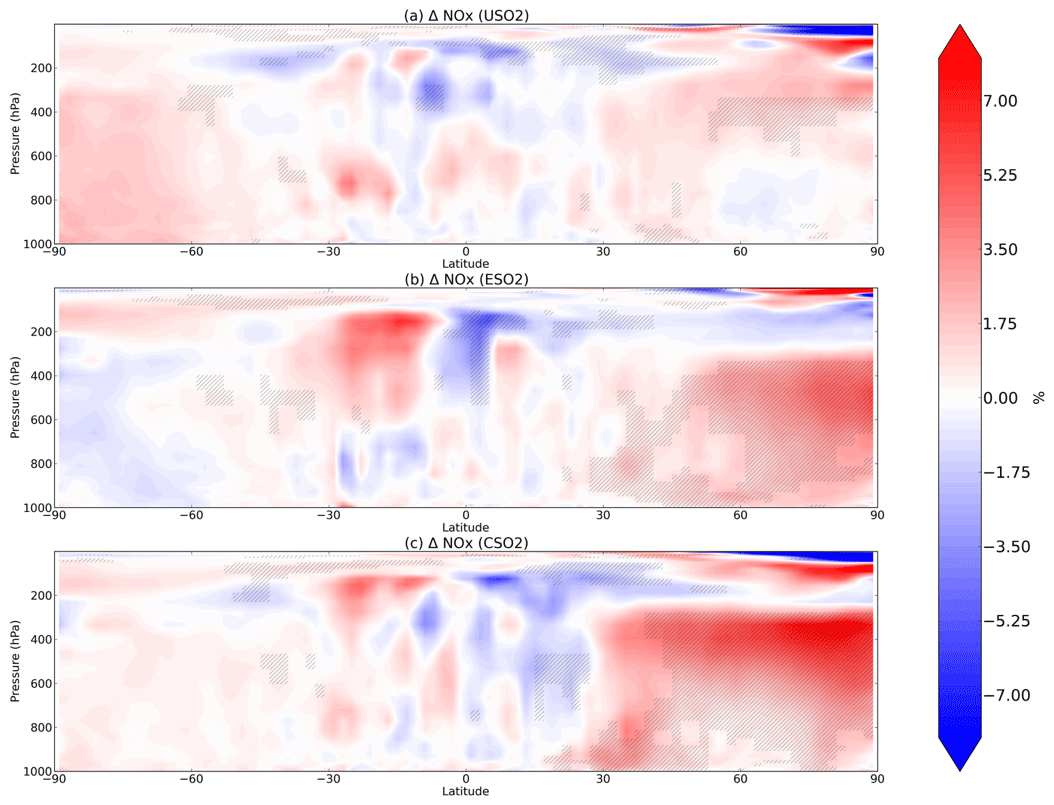
Figure 3Boreal springtime (MAM) mean percent change in NOx between a control simulation and a perturbation simulation in which anthropogenic SO2 emissions are removed over a certain region: (a) US, (b) Europe, and (c) China. Hatching denotes statistical significance according to a Student's t test at the 95 % confidence level.
We conduct a two-year (2014–2015) nudged control simulation in which emissions of aerosols and their precursors follow RCP8.5 and contrast it with three perturbations: one in which all anthropogenic SO2 emissions are set to zero over the US (30–50∘ N, 70–125∘ W) , all anthropogenic SO2 emissions are set to zero over Europe (35–70∘ N, 15∘ W–55∘ E), and all anthropogenic SO2 emissions are set to zero over China (15–50∘ N, 95–130∘ E). SO2 is oxidized by the hydroxyl radical in the gas phase and by ozone and hydrogen peroxide in clouds to form sulfate aerosol, which is a dominant component of total aerosol in GFDL-AM3 (Westervelt et al., 2015, 2017). We separately subtract each regional SO2 perturbation simulation from the control simulation, thereby isolating the impact of regional SO2 emissions (and subsequent sulfate formation) on tropospheric oxidants and related species. We test for statistical significance using a Student's t test on seasonal mean responses with the null hypothesis being that the difference between the control and the perturbation simulation is zero. Only the full year of 2015 is used for analysis to allow for a full year of initialization. SO2 perturbations from our simulations are 10.8, 12.4, and 16.2 Tg SO2 y−1 for US, Europe, and China, respectively.
The global annual mean OH for the 2015 control simulation is 7.0×10⁵ molecules cm−3, which is within the range of the 14 Atmospheric Chemistry and Climate Model Intercomparison Project (ACCMIP) for year 2000 and 14 Chemistry Climate Model Initiative (CCMI) models (Voulgarakis et al., 2013; Zhao et al., 2019) for years 2000–2010. The global annual tropospheric burden of O3 in the 2015 control simulation is 356 Tg, which compares well to the year 2000 O3 burden mean across the ACCMIP models of 337±23 Tg (Young et al., 2013).
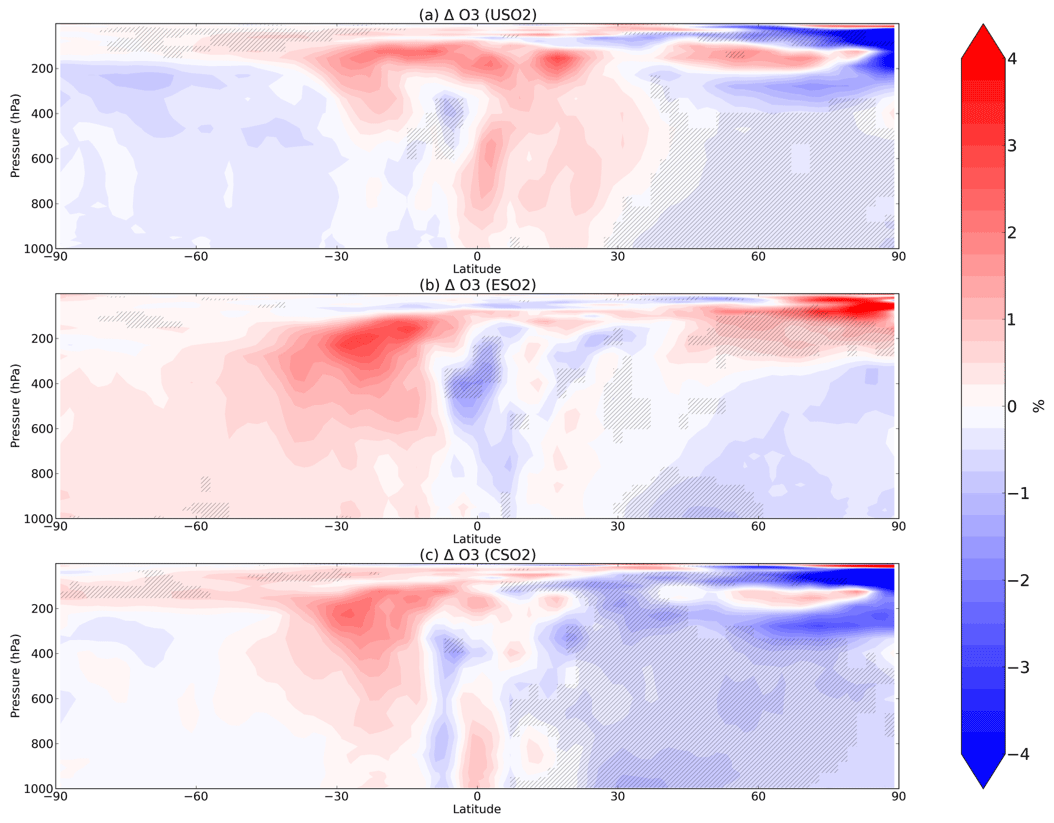
Figure 4Boreal springtime (MAM) mean percent change in O3 between a control simulation and a perturbation simulation in which anthropogenic SO2 emissions are removed over a certain region: (a) US, (b) Europe, and (c) China. Hatching denotes statistical significance according to a Student's t test at the 95 % confidence level.
Figure 1 shows the percent increase in seasonal (March–April–May, MAM) sulfate concentrations at the surface (right column) and at altitude (left column) due to the presence of all anthropogenic US SO2 (first row), all European SO2 (second row), and all Chinese SO2 (third row) based on year 2015 anthropogenic emissions. Additional seasons are shown in the Supplement (Figs. S1–S3). The zeroing of 2015 SO2 emissions in each location results in the largest relative perturbation in China, where emissions are highest, followed by Europe and the US. Sulfate increases are largest closest to the source region, but all three regional simulations show statistically significant remote impacts both horizontally and vertically in the atmosphere, as evidenced by the spatial and zonal plots in Fig. 1. Emissions from US, Europe, and China perturbations all significantly increase sulfate throughout the troposphere up to 200 hPa and higher towards the North Pole, with the largest increases of up to 30 %–40 % resulting from the China SO2 perturbation. Transport to the Arctic is a common feature in all three perturbations and is consistent with previous studies on aerosol transport to the Arctic (Shindell et al., 2008; Stohl, 2006, Yang et al., 2017, 2018; Ren et al., 2020). The US perturbation impacts sulfate concentrations significantly at the surface and at altitude over the North Atlantic Ocean, while emissions from China exert a heavy influence over the Pacific reaching all of the way to the western US. European SO2 emissions have widespread influence on the Northern Hemisphere, but especially in the Arctic, the Mediterranean, and northern Africa. In all cases, sulfate changes are nearly entirely confined to the Northern Hemisphere.
We analyze the impact of sulfate changes on atmospheric oxidation capacity, starting in Fig. 2 with OH (left column) and HO2 (right column) for each of the three regional perturbations (rows of Fig. 2). Sulfate aerosol surfaces directly uptake HO2 radicals as described in Sect. 2, resulting in significant decreases of HO2 and OH (via their rapid cycling). For each perturbation, decreases in both OH and HO2 occur throughout most of the Northern Hemisphere up to about 200 hPa vertically during the boreal spring (MAM). The largest decreases in OH and HO2 occur in spring for each of the perturbations, followed by winter (December–January–February, DJF), autumn (September–October–November, SON), and summer (June–July–August, JJA). These additional seasons are plotted in Figs. S4–S6 in the Supplement. In MAM, SO2 emissions over the US decrease OH and HO2 by about 5 % within the US planetary boundary layer. In the mid-troposphere (400–600 hPa), OH decreases are 5 % or greater and are located spatially above the Arctic. For the Europe SO2 and China SO2 cases during MAM, the Arctic middle troposphere OH decreases are larger in percent change (>10 %) than the local changes near the surface (∼8 %). The presence of 2015 China SO2 emissions also decreases OH and HO2 by about 10 % over the North Pacific Ocean middle troposphere (about 400–600 hPa) in the model. By comparing the first row of Fig. 2 with the second and third rows, we find that the zonal structure of the OH and HO2 response to anthropogenic SO2 emissions is very similar across the three regional perturbations, while the magnitude is largest in response to China SO2 emissions, followed by Europe SO2 and US SO2. We conclude that regional SO2 emissions may have stronger impacts remotely than locally, and OH may be relatively more sensitive to aerosol changes in the Arctic and remote oceans at higher altitudes where its production is more limited.
In Fig. 3 we plot spring (MAM) changes in NOx (defined as NO + NO2) concentrations in response to anthropogenic SO2 emissions in the US, Europe, and China. While HO2 and OH strongly decreased in response to SO2 emissions, NOx significantly increases throughout most of the Northern Hemisphere. In the model, aerosols can take up NO2 directly but with a very low reaction probability (0.0001; Table 1), such that little uptake actually occurs and is easily offset by feedbacks onto other chemical reactions involving NOx. Instead, reduction in the sinks of NOx via OH (nitric acid formation) during the day and uptake of NO3 at night dominates the response to SO2 emission changes, increasing NOx in the model as OH decreases. At night, NOx is removed by reaction with the nitrate radical (NO3), which forms dinitrogen pentoxide (N2O5) (Chang et al., 2011; Jacob, 2000). Sulfate aerosols are effective at removing NO3 via reactive uptake (reaction probability of 0.1), slowing down this nighttime NOx sink and thus increasing NOx abundance. This hindering of day and night NOx sinks is most effective during MAM and DJF in the Northern Hemisphere mid-troposphere (Fig. 3a–c for MAM; additional seasons shown in Figs. S7–S9 in the Supplement). Mid-tropospheric Northern Hemisphere NOx increases reach about 7 %–8 % in response to Chinese SO2 emissions specifically, with smaller effects for both US and Europe SO2 perturbations. NOx at the surface increases slightly less at about 5 %–7 % depending on the regional emissions perturbation, though these changes are still statistically significant. N2O5 is removed by aerosols also with a reaction probability of 0.1, although several previous studies have used smaller reactive uptake coefficients for N2O5 (Evans and Jacob, 2005; Holmes et al., 2019; Macintyre and Evans, 2010; McDuffie et al., 2019) based on more recent laboratory experiments, but only find impacts on mean tropospheric O3 burden of 2 %–4 %. Using a box modeling approach, McDuffie et al. (2019) find a median γ for N2O5 of 0.076, reasonably close to our assumed value of 0.1.
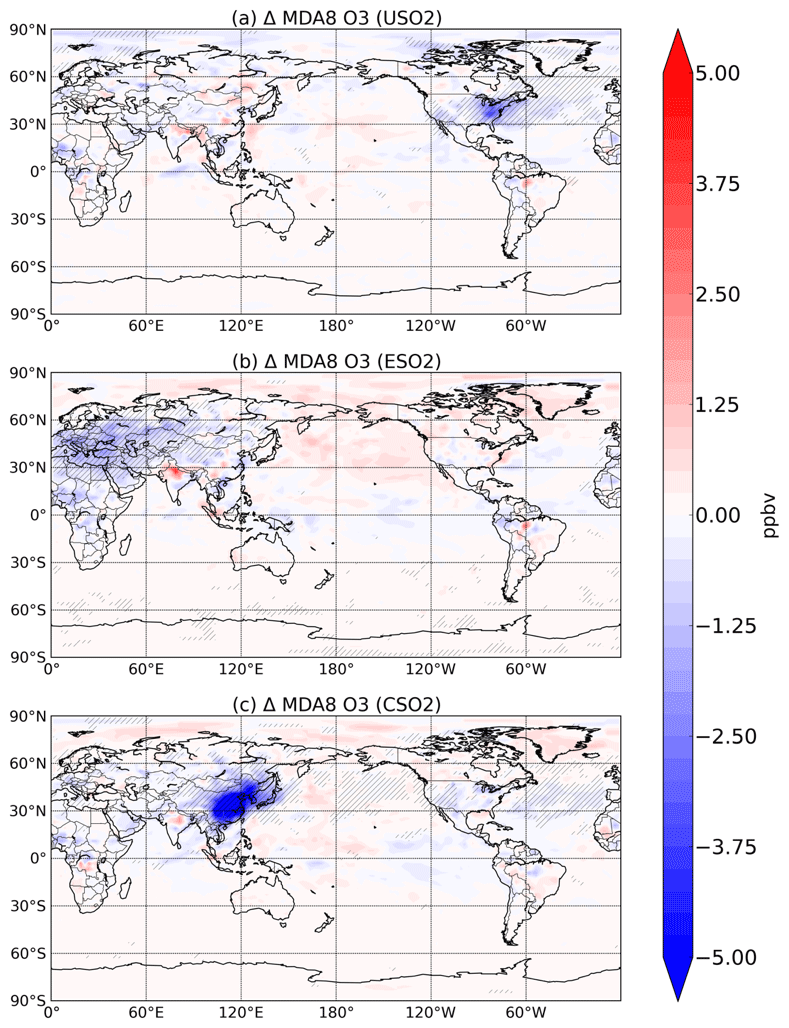
Figure 5Summertime (JJA) surface O3 change (in ppbv) between a control simulation and a perturbation simulation in which anthropogenic SO2 emissions are removed over a certain region: (a) US, (b) Europe, and (c) China. Hatching denotes statistical significance according to a Student's t test at the 95 % confidence level.
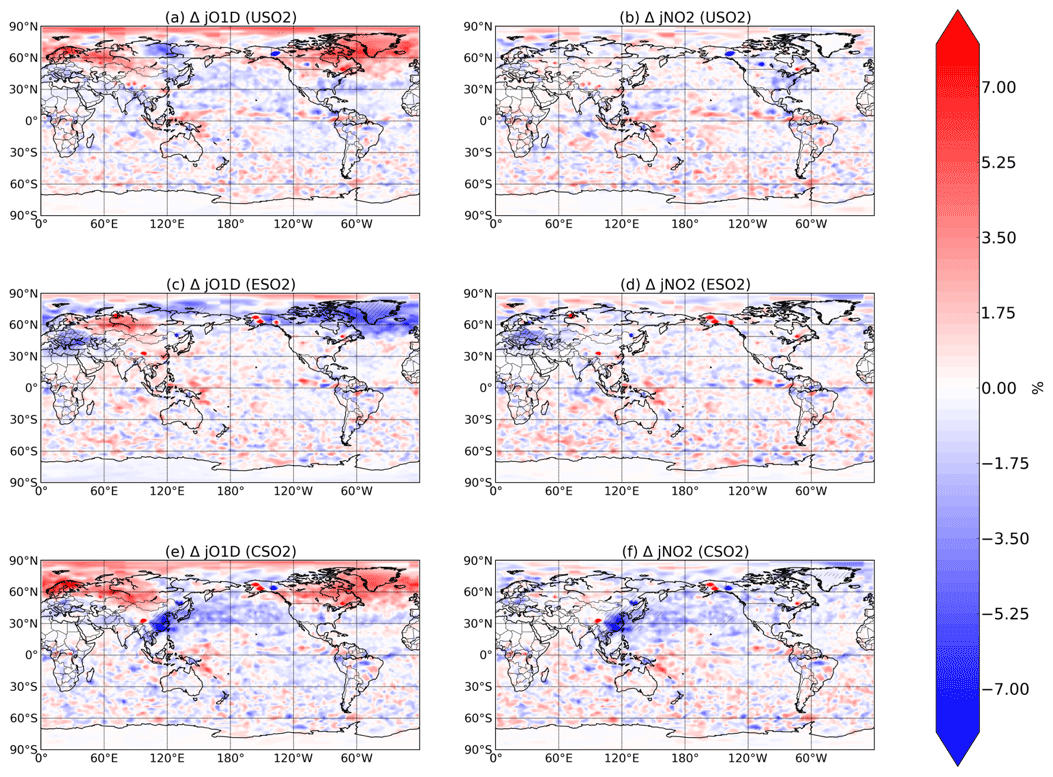
Figure 6Boreal springtime (MAM) mean percent change in photolysis rates (, left column; , right column) between a control simulation and a perturbation simulation in which anthropogenic SO2 emissions are removed over a certain region: (a, b) US, (c ,d) Europe, and (e, f) China. Hatching denotes statistical significance according to a Student's t test at the 95 % confidence level.
In most of the Northern Hemisphere troposphere, O3 decreases in MAM by up to 4 % in response to US, European, or Chinese SO2 emissions increases in the model (Fig. 4), mostly coinciding with regions of large HOx decreases (Fig. 2), despite the increase in NOx (Fig. 3). O3 decreases are the largest in response to Chinese anthropogenic SO2 emissions, owing to the larger SO2 perturbation compared to the US and Europe emissions perturbations. The O3 increases in the upper troposphere are mostly not significant. We examine model diagnostics of gross ozone production (the sum of HO2+NO and all RO2+NO reaction pathways) and O3 loss (which includes reaction of O3 with HOx and with alkenes, plus O3 photolysis followed by O1D+H2O) to interpret further the O3 decrease. While both O3 production (P) and loss (L) rates decline (Figs. S10 and S11 in the Supplement), production decreases more strongly than loss, lowering O3 concentrations. We confirm that transport of O3 from other latitudes is unlikely to contribute much to the modeled O3 response as the change in zonal mean advective or convective tendency in O3 (Fig. S12 in the Supplement) is far smaller than the chemical production and loss terms (Fig. S10 in the Supplement). The O3 production and loss rates decrease most strongly in the lower troposphere over the source regions (Figs. S10 and S11 in the Supplement) while the O3 decreases (Fig. 4) propagate more widely through the free troposphere, indicating reduced export from these source regions. Additional seasons for O3 change are shown in Figs. S13–S15 in the Supplement.
We find here that the decline in HOx and its impact on P outweighs the aerosol-induced increases in NOx and decreases in O3–HOx sinks, even during summer in all three source regions. We show the response of summertime surface 8 h maximum daily average (MDA) O3 to increasing anthropogenic SO2 emissions in the US, Europe, and China in Fig. 5. Increasing sulfate aerosol increases the sink of HO2 radicals and thus slows down O3 production (Fig. S11 in the Supplement), resulting in surface O3 concentration decreases, which are largest and mostly confined to the emissions source region. Sulfate aerosol can also reduce NO2 and O3 photolysis rates. The combined effect of sulfate aerosol on changes in photolysis rates and heterogeneous chemistry is a statistically significant decrease of about 5 ppbv over most of eastern China, Korea, and Japan when Chinese SO2 emissions are introduced, a decrease of about 3 ppbv over the eastern US for US SO2 emissions, and a decrease of about 3 ppbv over Eurasia for the Europe SO2 emissions perturbation. Changes in similar magnitude have been reported over China using both a chemistry transport model and observations (Li et al., 2019). Large sulfate decreases have occurred since the 1970s in both Europe and the US. The SO2 perturbation in our study (zero-out 2015 level emissions) is 10.8, 12.4, and 16.2 Tg SO2 y−1 in the US, Europe, and China, respectively. These results imply that the sulfate decreases from clean air regulations and technologies have had the unintended consequence of driving O3 up by a few ppb during the summertime in the US and Europe. While this may be a small amount of the total surface O3 concentration and not entirely outside the range of typical variability, our study only considers the impact of sulfate aerosol and not carbonaceous aerosols, which make up greater than 50 % of the total aerosol mass in many environments (Jiminez et al., 2009). Additionally, even O3 changes on the order of 3–5 ppbv may be important for holistically meeting tightening air quality standards. NOx emissions have also decreased dramatically over roughly the same time period and have likely more than offset any O3 increase from decreasing sulfate. However, the full potential of possible O3 improvement via NOx and anthropogenic volatile organic carbon (VOC) decreases may have been partially masked by sulfate decreases. These findings highlight the importance of a multipollutant strategy for effective clean air regulation.
Finally, in Fig. 6 we plot the relative change in MAM O3→O(1D) and NO2 photolysis rates, denoted and in response to SO2 emissions in each region. Photolysis of both species is slightly influenced by changing SO2 emissions, especially over China in response to China's SO2 emissions, where decreases in both photolysis rates are about 7 %. For each of the perturbations, especially the US and Europe cases, changes in photolysis rates rarely rise above the noise, which is likely caused by meteorological factors such as slight changes in cloud cover. We conclude that while radiative effects via photolysis are non-negligible, they are significantly less important than chemical effects for aerosol impacts on oxidation, consistent with previous findings (Li et al., 2019).
Using the updated GFDL-AM3 nudged chemistry–climate model with online aerosol heterogeneous chemistry and interactions with radiation, we estimate the impact of Northern Hemisphere mid-latitude regional anthropogenic SO2 emissions on tropospheric OH, HO2, O3, and NOx. Regional SO2 emissions perturbations lead to significant changes to sulfate aerosol in far-reaching regions of the world, particularly in the Arctic and the mid- and upper troposphere. OH and HO2 decrease throughout the northern hemisphere mid-troposphere by up to 10 %, which in turn increase NOx concentrations by at least 5 %. NOx is not efficiently removed by heterogeneous reactions on aerosols, while species that contribute to NOx sinks such as OH (via HO2 uptake) and NO3 are efficiently removed, slowing down the NOx sink and increasing NOx concentrations. However, any influence of NOx increases on tropospheric O3 are overwhelmed by HO2 decreases, and the resulting decrease in O3 production offsets decreases in O3 sinks, resulting in up to 4 % decrease in O3 in the free troposphere and at the surface. Aerosols impact oxidation primarily through heterogeneous reactive uptake pathways over photolysis pathways.
Surface ozone decreases by 3 to 5 ppbv in response to the introduction of regional SO2 emissions. If SO2 emissions decline in developing regions of the world such as South Asia and sub-Saharan Africa, a goal attained through air quality improvements to protect human health, there could be an unintended increase in surface O3 concentrations. Decreasing surface O3 in these regions will require a multipollutant approach in which NOx and VOCs are simultaneously decreased with aerosols in order to offset the effect of decrease in aerosols and their precursors. While SO2 and NOx emissions decreases coincided to some extent in the US, end-of-pipe technologies at power plants allow for control of SO2 and NOx individually, and other sources of fine particulate matter (PM2.5) such as waste burning and vehicle emissions will have a similar effect on ozone as sulfate aerosols. PM2.5 and SO2 have decreased dramatically in recent years in the US and Europe, such that O3 improvements may have been partially masked by the aerosol impact. SO2 perturbations from our simulations are 10.8, 12.4, and 16.2 Tg yr−1 for US, Europe, and China, respectively, which result in a 3 ppbv surface ozone response over the US and Europe, and a 5 ppbv surface ozone response over China, where SO2 emissions are the largest in 2015. Model overprediction of surface O3 over urban areas in China (Westervelt et al., 2019) likely make this 5 ppbv change an upper estimate of the surface O3 response to China SO2 emissions.
Future work is needed to improve estimates of reactive uptake of HO2 and other radical species by aerosols, as great uncertainty still exists surrounding this parameter as well as the dependence of aerosol composition on reactive uptake parameters (George et al., 2013). We focus here on anthropogenic aerosols as they are changing rapidly and expected to continue to change. Previous work finds a large influence of Saharan dust aerosols on oxidation (Tie et al., 2005). Regions of biomass burning such as Africa and South America are also potential contributors to aerosol-driven oxidation changes. In order to avoid trading one problem for another in areas of the world that are experiencing both rapid emissions changes and high exposures to air pollutants, we must better understand the impact of aerosols on atmospheric photochemistry.
The code for GFDL-AM3 is available here: https://www.gfdl.noaa.gov/am3/ (Geophysical Fluid Dynamics Lab, 2021).
Data are available here: https://figshare.com/articles/dataset/Concentration_data_for_aerosol_impact_on_oxidants/13331066 (Westervelt, 2020).
The supplement related to this article is available online at: https://doi.org/10.5194/acp-21-6799-2021-supplement.
DMW wrote the manuscript, created all figures, and conducted all simulations. AMF and DMW originally conceived the project. CBB assisted with model setup and output analysis. GC developed the model for use at LDEO. All authors contributed to editing the manuscript.
The authors declare that they have no conflict of interest.
We thank Bryan Duncan and Melanie Follette-Cook of NASA GSFC for their helpful conversations.
This research has been supported by the National Aeronautics and Space Administration, Earth Sciences Division (grant no. NNX17AG40G).
This paper was edited by Qiang Zhang and reviewed by two anonymous referees.
Abbatt, J. P. D., Lee, A. K. Y., and Thornton, J. A.: Quantifying trace gas uptake to tropospheric aerosol: Recent advances and remaining challenges, Chem. Soc. Rev., 41, 6555–6581, https://doi.org/10.1039/c2cs35052a, 2012.
Bian, H. and Zender, C. S.: Mineral dust and global tropospheric chemistry: Relative roles of photolysis and heterogeneous uptake, J. Geophys. Res.-Atmos., 108, D21, https://doi.org/10.1029/2002jd003143, 2003.
Bian, H., Prather, M. J. and Takemura, T.: Tropospheric aerosol impacts on trace gas budgets through photolysis, J. Geophys. Res.-Atmos., 108, D8, https://doi.org/10.1029/2002jd002743, 2003.
Chang, W. L., Bhave, P. V, Brown, S. S., Riemer, N., Stutz, J. and Dabdub, D.: Heterogeneous Atmospheric Chemistry, Ambient Measurements, and Model Calculations of N2O5: A Review, Aerosol Sci. Technol., 45, 665–695, https://doi.org/10.1080/02786826.2010.551672, 2011.
Dentener, F. J. and Crutzen, P. J.: Reaction of N2O5 on tropospheric aerosols: impact on the global distributions of NOx, O3, and OH, J. Geophys. Res., 98, 7149–7163, https://doi.org/10.1029/92JD02979, 1993.
Dickerson, R. R., Kondragunta, S., Stenchikov, G., Civerolo, K. L., Doddridge, B. G., and Holben, B. N.: The impact of aerosols on solar ultraviolet radiation and photochemical smog, Science, 278, 827–830, https://doi.org/10.1126/science.278.5339.827, 1997.
Donner, L. J., Wyman, B. L., Hemler, R. S., Horowitz, L. W., Ming, Y., Zhao, M., Golaz, J.-C., Ginoux, P., Lin, S.-J., Schwarzkopf, M. D., Austin, J., Alaka, G., Cooke, W. F., Delworth, T. L., Freidenreich, S. M., Gordon, C. T., Griffies, S. M., Held, I. M., Hurlin, W. J., Klein, S. a., Knutson, T. R., Langenhorst, A. R., Lee, H.-C., Lin, Y., Magi, B. I., Malyshev, S. L., Milly, P. C. D., Naik, V., Nath, M. J., Pincus, R., Ploshay, J. J., Ramaswamy, V., Seman, C. J., Shevliakova, E., Sirutis, J. J., Stern, W. F., Stouffer, R. J., Wilson, R. J., Winton, M., Wittenberg, A. T., and Zeng, F.: The Dynamical Core, Physical Parameterizations, and Basic Simulation Characteristics of the Atmospheric Component AM3 of the GFDL Global Coupled Model CM3, J. Clim., 24, 3484–3519, https://doi.org/10.1175/2011JCLI3955.1, 2011.
Evans, M. J. and Jacob, D. J.: Impact of new laboratory studies of N2O5 hydrolysis on global model budgets of tropospheric nitrogen oxides, ozone, and OH, Geophys. Res. Lett., 32, 1–4, https://doi.org/10.1029/2005GL022469, 2005.
Fontes, T., Li, P., Barros, N., and Zhao, P.: Trends of PM2.5 concentrations in China: A long term approach, J. Environ. Manage., 196, 719–732, https://doi.org/10.1016/J.JENVMAN.2017.03.074, 2017.
George, I. J., Matthews, P. S. J., Whalley, L. K., Brooks, B., Goddard, A., Baeza-Romero, M. T., and Heard, D. E.: Measurements of uptake coefficients for heterogeneous loss of HO2 onto submicron inorganic salt aerosols, Phys. Chem. Chem. Phys., 15, 12829–12845, https://doi.org/10.1039/c3cp51831k, 2013.
Geophysical Fluid Dynamics Lab: Atmospheric Model 3, available at: https://www.gfdl.noaa.gov/am3/, last access: 12 January 2021.
Holmes, C. D., Bertram, T. H., Confer, K. L., Graham, K. A., Ronan, A. C., Wirks, C. K., and Shah, V.: The Role of Clouds in the Tropospheric NOx Cycle: A New Modeling Approach for Cloud Chemistry and Its Global Implications, Geophys. Res. Lett., 46, 4980–4990, https://doi.org/10.1029/2019GL081990, 2019.
Horowitz, L. W., Walters, S., Mauzerall, D. L., Emmons, L. K., Rasch, P. J., Granier, C., Tie, X., Lamarque, J.-F., Schultz, M. G., Tyndall, G. S., Orlando, J. J., and Brasseur, G. P.: A global simulation of tropospheric ozone and related tracers: Description and evaluation of MOZART, version 2, J. Geophys. Res.-Atmos., 108, D24, https://doi.org/10.1029/2002JD002853, 2003.
Horowitz, L. W., Fiore, A. M., Milly, G. P., Cohen, R. C., Perring, A., Wooldridge, P. J., Hess, P. G., Emmons, L. K., and Lamarque, J.-F.: Observational constraints on the chemistry of isoprene nitrates over the eastern United States, J. Geophys. Res., 112, D12S08, https://doi.org/10.1029/2006JD007747, 2007.
Jacob, D. J.: Heterogeneous chemistry and tropospheric ozone, Atmos. Environ., 34, 2131–2159, https://doi.org/10.1016/S1352-2310(99)00462-8, 2000.
Jimenez, J. L., Canagaratna, M. R., Donahue, N. M., Prevot, A. S H., Zhang, Q., Kroll, J. H., DeCarlo, P. F., Allan, J. D., Coe, H., Ng, N. L., Aiken, A. C., Docherty, K. S., Ulbrich, I. M., Grieshop, A. P., Robinson, A. L., Duplissy, J., Smith, J. D., Wilson, K. R., Lanz, V. A., Hueglin, C., Sun, Y. L., Tian, J., Laaksonen, A., Raatikainen, T., Rautiainen, J., Vaattovaara, P., Ehn, M., Kulmala, M., Tomlinson, J. M., Collins, D. R., Cubison, M. J., Dunlea, E. J., Huffman, J. A., Onasch, T. B., Alfarra, M. R., Williams, P. I., Bower, K., Kondo, Y., Schneider, J., Drewnick, F., Borrmann, S., Weimer, S., Demerjian, K., Salcedo, D., Cottrell, L., Griffin, R., Takami, A., Miyoshi, T., Hatakeyama, S., Shimono, A., Sun, J. Y., Zhang, Y. M., Dzepina, K., Kimmel, J. R., Sueper, D., Jayne, J. T., Herndon, S. C., Trimborn, A. M., Williams, L. R., Wood, E. C., Middlebrook, A. M., Kolb, C. E., Baltensperger, U., and Worsnop, D. R.: Evolution of organic aerosols in the atmosphere, Science, 326, 5959, 1525–1529, https://doi.org/10.1126/science.1180353, 2009.
Li, C., McLinden, C., Fioletov, V., Krotkov, N., Carn, S., Joiner, J., Streets, D., He, H., Ren, X., Li, Z., and Dickerson, R. R.: India Is Overtaking China as the World's Largest Emitter of Anthropogenic Sulfur Dioxide, Sci. Rep., 7, 14304, https://doi.org/10.1038/s41598-017-14639-8, 2017.
Li, J., Chen, X., Wang, Z., Du, H., Yang, W., Sun, Y., Hu, B., Li, J., Wang, W., Wang, T., Fu, P., and Huang, H.: Radiative and heterogeneous chemical effects of aerosols on ozone and inorganic aerosols over East Asia, Sci. Total Environ., 622–623, 1327–1342, https://doi.org/10.1016/j.scitotenv.2017.12.041, 2018.
Li, K., Jacob, D. J., Liao, H., Zhu, J., Shah, V., Shen, L., Bates, K. H., Zhang, Q., and Zhai, S.: A two-pollutant strategy for improving ozone and particulate air quality in China, Nat. Geosci., 12, 906–910, https://doi.org/10.1038/s41561-019-0464-x, 2019a.
Li, K., Jacob, D. J., Liao, H., Shen, L., Zhang, Q., and Bates, K. H.: Anthropogenic drivers of 2013–2017 trends in summer surface ozone in China, P. Natl. Acad. Sci. USA, 116, 422–427, https://doi.org/10.1073/pnas.1812168116, 2019b.
Liao, H., Adams, P. J., Chung, S. H., Seinfeld, J. H., Mickley, L. J., and Jacob, D. J.: Interactions between tropospheric chemistry and aerosols in a unified general circulation model, J. Geophys. Res.-Atmos., 108, AAC 1-1, https://doi.org/10.1029/2001jd001260, 2003.
Lin, M., Fiore, A. M., Cooper, O. R., Horowitz, L. W., Langford, A. O., Levy, H., Johnson, B. J., Naik, V., Oltmans, S. J., and Senff, C. J.: Springtime high surface ozone events over the western United States: Quantifying the role of stratospheric intrusions, J. Geophys. Res.-Atmos., 117, D00V22, 2012.
Lou, S., Liao, H., and Zhu, B.: Impacts of aerosols on surface-layer ozone concentrations in China through heterogeneous reactions and changes in photolysis rates, Atmos. Environ., 85, 123–138, https://doi.org/10.1016/j.atmosenv.2013.12.004, 2014.
Macintyre, H. L. and Evans, M. J.: Sensitivity of a global model to the uptake of N2O5 by tropospheric aerosol, Atmos. Chem. Phys., 10, 7409–7414, https://doi.org/10.5194/acp-10-7409-2010, 2010.
Mao, J., Fan, S., Jacob, D. J., and Travis, K. R.: Radical loss in the atmosphere from Cu-Fe redox coupling in aerosols, Atmos. Chem. Phys., 13, 509–519, https://doi.org/10.5194/acp-13-509-2013, 2013a.
Mao, J., Horowitz, L. W., Naik, V., Fan, S., Liu, J., and Fiore, A. M.: Sensitivity of tropospheric oxidants to biomass burning emissions: implications for radiative forcing, Geophys. Res. Lett., 40, 1241–1246, https://doi.org/10.1002/grl.50210, 2013b.
Martin, R. V., Jacob, D. J., Yantosca, R. M., Chin, M., and Ginoux, P.: Global and regional decreases in tropospheric oxidants from photochemical effects of aerosols, J. Geophys. Res.-Atmos., 108, https://doi.org/10.1029/2002JD002622, 2003.
McDuffie, E. E., Womack, C. C., Fibiger, D. L., Dube, W. P., Franchin, A., Middlebrook, A. M., Goldberger, L., Lee, B. H., Thornton, J. A., Moravek, A., Murphy, J. G., Baasandorj, M., and Brown, S. S.: On the contribution of nocturnal heterogeneous reactive nitrogen chemistry to particulate matter formation during wintertime pollution events in Northern Utah, Atmos. Chem. Phys., 19, 9287–9308, https://doi.org/10.5194/acp-19-9287-2019, 2019.
Naik, V., Horowitz, L. W., Fiore, A. M., Ginoux, P., Mao, J., Aghedo, A. M., and Levy, H.: Impact of preindustrial to present-day changes in short-lived pollutant emissions on atmospheric composition and climate forcing, J. Geophys. Res.-Atmos., 118, https://doi.org/10.1002/jgrd.50608, 2013a.
Naik, V., Voulgarakis, A., Fiore, A. M., Horowitz, L. W., Lamarque, J.-F., Lin, M., Prather, M. J., Young, P. J., Bergmann, D., Cameron-Smith, P. J., Cionni, I., Collins, W. J., Dalsøren, S. B., Doherty, R., Eyring, V., Faluvegi, G., Folberth, G. A., Josse, B., Lee, Y. H., MacKenzie, I. A., Nagashima, T., van Noije, T. P. C., Plummer, D. A., Righi, M., Rumbold, S. T., Skeie, R., Shindell, D. T., Stevenson, D. S., Strode, S., Sudo, K., Szopa, S., and Zeng, G.: Preindustrial to present-day changes in tropospheric hydroxyl radical and methane lifetime from the Atmospheric Chemistry and Climate Model Intercomparison Project (ACCMIP), Atmos. Chem. Phys., 13, 5277–5298, https://doi.org/10.5194/acp-13-5277-2013, 2013b.
Paulot, F., Ginoux, P., Cooke, W. F., Donner, L. J., Fan, S., Lin, M.-Y., Mao, J., Naik, V., and Horowitz, L. W.: Sensitivity of nitrate aerosols to ammonia emissions and to nitrate chemistry: implications for present and future nitrate optical depth, Atmos. Chem. Phys., 16, 1459–1477, https://doi.org/10.5194/acp-16-1459-2016, 2016.
Rasmussen, D. J., Fiore, A. M., Naik, V., Horowitz, L. W., McGinnis, S. J., and Schultz, M. G.: Surface ozone-temperature relationships in the eastern US: A monthly climatology for evaluating chemistry-climate models, Atmos. Environ., 47, 142–153, https://doi.org/10.1016/J.ATMOSENV.2011.11.021, 2012.
Ren, L., Yang, Y., Wang, H., Zhang, R., Wang, P., and Liao, H.: Source attribution of Arctic black carbon and sulfate aerosols and associated Arctic surface warming during 1980–2018, Atmos. Chem. Phys., 20, 9067–9085, https://doi.org/10.5194/acp-20-9067-2020, 2020.
Riahi, K., Rao, S., Krey, V., Cho, C., Chirkov, V., Fischer, G., Kindermann, G., Nakicenovic, N., and Rafaj, P.: RCP 8.5 – A scenario of comparatively high greenhouse gas emissions, Clim. Change, 109, 33–57, https://doi.org/10.1007/s10584-011-0149-y, 2011.
Samset, B. H., Sand, M., Smith, C. J., Bauer, S. E., Forster, P. M., Fuglestvedt, J. S., Osprey, S., and Schleussner, C.-F.: Climate Impacts From a Removal of Anthropogenic Aerosol Emissions, Geophys. Res. Lett., 45, 1020–1029, https://doi.org/10.1002/2017GL076079, 2018.
Shindell, D. T., Chin, M., Dentener, F., Doherty, R. M., Faluvegi, G., Fiore, A. M., Hess, P., Koch, D. M., MacKenzie, I. A., Sanderson, M. G., Schultz, M. G., Schulz, M., Stevenson, D. S., Teich, H., Textor, C., Wild, O., Bergmann, D. J., Bey, I., Bian, H., Cuvelier, C., Duncan, B. N., Folberth, G., Horowitz, L. W., Jonson, J., Kaminski, J. W., Marmer, E., Park, R., Pringle, K. J., Schroeder, S., Szopa, S., Takemura, T., Zeng, G., Keating, T. J., and Zuber, A.: A multi-model assessment of pollution transport to the Arctic, Atmos. Chem. Phys., 8, 5353–5372, https://doi.org/10.5194/acp-8-5353-2008, 2008.
Spivakovsky, C. M., Logan, J. A., Montzka, S. A., Balkanski, Y. J., Foreman-Fowler, M., Jones, D. B. A., Horowitz, L. W., Fusco, A. C., Brenninkmeijer, C. A. M., Prather, M. J., Wofsy, S. C., and McElroy, M. B.: Three-dimensional climatological distribution of tropospheric OH: Update and evaluation, J. Geophys. Res.-Atmos., 105, 8931–8980, https://doi.org/10.1029/1999JD901006, 2000.
Stevenson, D. S., Zhao, A., Naik, V., O'Connor, F. M., Tilmes, S., Zeng, G., Murray, L. T., Collins, W. J., Griffiths, P. T., Shim, S., Horowitz, L. W., Sentman, L. T., and Emmons, L.: Trends in global tropospheric hydroxyl radical and methane lifetime since 1850 from AerChemMIP, Atmos. Chem. Phys., 20, 12905–12920, https://doi.org/10.5194/acp-20-12905-2020, 2020.
Stohl, A.: Characteristics of atmospheric transport into the Arctic troposphere, J. Geophys. Res.-Atmos., 111, D11306, https://doi.org/10.1029/2005JD006888, 2006.
Taketani, F., Kanaya, Y., Pochanart, P., Liu, Y., Li, J., Okuzawa, K., Kawamura, K., Wang, Z., and Akimoto, H.: Measurement of overall uptake coefficients for HO2 radicals by aerosol particles sampled from ambient air at Mts. Tai and Mang (China), Atmos. Chem. Phys., 12, 11907–11916, https://doi.org/10.5194/acp-12-11907-2012, 2012.
Tie, X., Madronich, S., Walters, S., Edwards, D. P., Ginoux, P., Mahowald, N., Zhang, R. Y., Lou, C., and Brasseur, G.: Assessment of the global impact of aerosols on tropospheric oxidants, J. Geophys. Res.-Atmos., 110, 1–32, D03204, https://doi.org/10.1029/2004JD005359, 2005.
Voulgarakis, A., Naik, V., Lamarque, J.-F., Shindell, D. T., Young, P. J., Prather, M. J., Wild, O., Field, R. D., Bergmann, D., Cameron-Smith, P., Cionni, I., Collins, W. J., Dalsøren, S. B., Doherty, R. M., Eyring, V., Faluvegi, G., Folberth, G. A., Horowitz, L. W., Josse, B., MacKenzie, I. A., Nagashima, T., Plummer, D. A., Righi, M., Rumbold, S. T., Stevenson, D. S., Strode, S. A., Sudo, K., Szopa, S., and Zeng, G.: Analysis of present day and future OH and methane lifetime in the ACCMIP simulations, Atmos. Chem. Phys., 13, 2563–2587, https://doi.org/10.5194/acp-13-2563-2013, 2013.
Vuuren, D. P., Edmonds, J., Kainuma, M., Riahi, K., Thomson, A., Hibbard, K., Hurtt, G. C., Kram, T., Krey, V., Lamarque, J.-F., Masui, T., Meinshausen, M., Nakicenovic, N., Smith, S. J., and Rose, S. K.: The representative concentration pathways: an overview, Clim. Change, 109, 5–31, https://doi.org/10.1007/s10584-011-0148-z, 2011.
Westervelt, D.: Concentration data for aerosol impact on oxidants, figshare, Dataset, https://doi.org/10.6084/m9.figshare.13331066.v1, 2020.
Westervelt, D. M., Horowitz, L. W., Naik, V., Golaz, J.-C., and Mauzerall, D. L.: Radiative forcing and climate response to projected 21st century aerosol decreases, Atmos. Chem. Phys., 15, 12681–12703, https://doi.org/10.5194/acp-15-12681-2015, 2015.
Westervelt, D. M., Conley, A. J., Fiore, A. M., Lamarque, J.-F., Shindell, D., Previdi, M., Faluvegi, G., Correa, G., and Horowitz, L. W.: Multimodel precipitation responses to removal of U.S. sulfur dioxide emissions, J. Geophys. Res., 122, 5024–5038, https://doi.org/10.1002/2017JD026756, 2017.
Westervelt, D. M., Ma, C., He, M., Fiore, A. M., Kinney, P. L., Kioumourtzoglou, M.-A., Wang, S., Xing, J., Ding, D., and Correa, G.: Mid-21st century ozone air quality and health burden in China under emissions scenarios and climate change, Environ. Res. Lett., 14, 074030, https://doi.org/10.1088/1748-9326/ab260b, 2019.
Wild, O., Zhu, X., and Prather, M. J.: Fast-J: Accurate simulation of in- and below-cloud photolysis in tropospheric chemical models, J. Atmos. Chem., 37, 245–282, https://doi.org/10.1023/A:1006415919030, 2000.
Yang, Y., Wang, H., Smith, S. J., Easter, R., Ma, P.-L., Qian, Y., Yu, H., Li, C., and Rasch, P. J.: Global source attribution of sulfate concentration and direct and indirect radiative forcing, Atmos. Chem. Phys., 17, 8903–8922, https://doi.org/10.5194/acp-17-8903-2017, 2017.
Yang, Y., Wang, H., Smith, S. J., Easter, R. C., and Rasch, P. J.: Sulfate aerosol in the Arctic: Source attribution and radiative forcing, J. Geophys. Res., 123, 1899–1918, https://doi.org/10.1002/2017JD027298, 2018.
Young, P. J., Archibald, A. T., Bowman, K. W., Lamarque, J.-F., Naik, V., Stevenson, D. S., Tilmes, S., Voulgarakis, A., Wild, O., Bergmann, D., Cameron-Smith, P., Cionni, I., Collins, W. J., Dalsøren, S. B., Doherty, R. M., Eyring, V., Faluvegi, G., Horowitz, L. W., Josse, B., Lee, Y. H., MacKenzie, I. A., Nagashima, T., Plummer, D. A., Righi, M., Rumbold, S. T., Skeie, R. B., Shindell, D. T., Strode, S. A., Sudo, K., Szopa, S., and Zeng, G.: Pre-industrial to end 21st century projections of tropospheric ozone from the Atmospheric Chemistry and Climate Model Intercomparison Project (ACCMIP), Atmos. Chem. Phys., 13, 2063–2090, https://doi.org/10.5194/acp-13-2063-2013, 2013.
Zhao, Y., Saunois, M., Bousquet, P., Lin, X., Berchet, A., Hegglin, M. I., Canadell, J. G., Jackson, R. B., Hauglustaine, D. A., Szopa, S., Stavert, A. R., Abraham, N. L., Archibald, A. T., Bekki, S., Deushi, M., Jöckel, P., Josse, B., Kinnison, D., Kirner, O., Marécal, V., O'Connor, F. M., Plummer, D. A., Revell, L. E., Rozanov, E., Stenke, A., Strode, S., Tilmes, S., Dlugokencky, E. J., and Zheng, B.: Inter-model comparison of global hydroxyl radical (OH) distributions and their impact on atmospheric methane over the 2000–2016 period, Atmos. Chem. Phys., 19, 13701–13723, https://doi.org/10.5194/acp-19-13701-2019, 2019.