the Creative Commons Attribution 4.0 License.
the Creative Commons Attribution 4.0 License.
 | 27 Apr 2021
Air quality and health benefits from ultra-low emission control policy indicated by continuous emission monitoring: a case study in the Yangtze River Delta region, China
Yan Zhang
Yu Zhao
Xin Bo
Chris P. Nielsen
To evaluate the improved emission estimates from online monitoring, we applied the Models-3/CMAQ (Community Multiscale Air Quality) system to simulate the air quality of the Yangtze River Delta (YRD) region using two emission inventories with and without incorporated data from continuous emission monitoring systems (CEMSs) at coal-fired power plants (cases 1 and 2, respectively). The normalized mean biases (NMBs) between the observed and simulated hourly concentrations of SO2, NO2, O3, and PM2.5 in case 2 were −3.1 %, 56.3 %, −19.5 %, and −1.4 %, all smaller in absolute value than those in case 1 at 8.2 %, 68.9 %, −24.6 %, and 7.6 %, respectively. The results indicate that incorporation of CEMS data in the emission inventory reduced the biases between simulation and observation and could better reflect the actual sources of regional air pollution. Based on the CEMS data, the air quality changes and corresponding health impacts were quantified for different implementation levels of China's recent “ultra-low” emission policy. If the coal-fired power sector met the requirement alone (case 3), the differences in the simulated monthly SO2, NO2, O3, and PM2.5 concentrations compared to those of case 2, our base case for policy comparisons, would be less than 7 % for all pollutants. The result implies a minor benefit of ultra-low emission control if implemented in the power sector alone, which is attributed to its limited contribution to the total emissions in the YRD after years of pollution control (11 %, 7 %, and 2 % of SO2, NOX, and primary particle matter (PM) in case 2, respectively). If the ultra-low emission policy was enacted at both power plants and selected industrial sources including boilers, cement, and iron and steel factories (case 4), the simulated SO2, NO2, and PM2.5 concentrations compared to the base case would be 33 %–64 %, 16 %–23 %, and 6 %–22 % lower, respectively, depending on the month (January, April, July, and October 2015). Combining CMAQ and the Integrated Exposure Response (IER) model, we further estimated that 305 deaths and 8744 years of life loss (YLL) attributable to PM2.5 exposure could be avoided with the implementation of the ultra-low emission policy in the power sector in the YRD region. The analogous values would be much higher, at 10 651 deaths and 316 562 YLL avoided, if both power and industrial sectors met the ultra-low emission limits. In order to improve regional air quality and to reduce human health risk effectively, coordinated control of multiple sources should be implemented, and the ultra-low emission policy should be substantially expanded to major emission sources in industries other than the power industry.
- Article
(12210 KB) - Full-text XML
-
Supplement
(176 KB) - BibTeX
- EndNote


Due to swift economic development and associated growth in demand for electricity, coal-fired power plants have played an important role in energy consumption and air pollutant emissions for a long time in China. For example, Zhao et al. (2008) for the first time developed a “unit-based” emission inventory of primary air pollutants from the coal-fired power sector in China and found that the sector contributed 53 % and 36 % to the national total emissions of SO2 and NOX, respectively, in 2005. Subsequently, SO2 and NOX emissions from the power sector were estimated to account, respectively, for 28 %–53 % and 29 %–31 % of the total annual emissions in China during 2006–2010 according to the Multi-resolution Emission Inventory for China (MEIC; http://www.meicmodel.org, last access: 19 April 2021). To reduce high emissions and improve air quality in China, advanced air pollutant control devices (APCDs) have been gradually applied in the power sector including flue gas desulfurization (FGD) for SO2 control, selective catalytic reduction (SCR) for NOX control, and high-efficiency dust collectors for primary particulate matter (PM) control. In recent years, moreover, an ultra-low emission retrofitting policy has been widely implemented, seeking to reduce the emission levels of coal-fired power plants to those of gas-fired ones (i.e., 35, 50, and 5 mg m−3 for SO2, NOX, and PM concentrations in the flue gas). The expanded use of associated technologies has induced great changes in the magnitude and spatiotemporal distribution of emissions from the power sector, which have been analyzed and quantified by a series of studies (Y. Zhao et al., 2013; Zhang et al., 2018; Liu et al., 2019; Tang et al., 2019; Y. Zhang et al., 2019). With the updated unit-level information, for example, MEIC estimated that the power sector shares of national total emissions declined from 28 % to 22 % and from 29 % to 21 % for SO2 and NOX during 2010–2015, respectively. Incorporating data from continuous emission monitoring systems (CEMSs), Tang et al. (2019) found that China's annual power sector emissions of SO2, NOX, and PM declined by 65 %, 60 %, and 72 %, respectively, during 2014–2017, due to the enhanced control measures. With a method of collecting, examining, and applying CEMS data, similarly, our previous work indicated that the estimated emissions from the power sector would be 75 %, 63 %, and 76 % smaller than those calculated without CEMS data for SO2, NOX, and PM, respectively (Y. Zhang et al., 2019).
Evaluations of emission estimates and the changed air quality from emission abatement provide useful information on the sources of air pollution and the effectiveness of pollution control measures. Air quality modeling is an important tool for evaluating emission inventories, by comparing simulation results with available observation data. Developed by the US Environmental Protection Agency (US EPA), the Models-3/Community Multiscale Air Quality (CMAQ) system has been widely used in China (Li et al., 2012; An et al., 2013; Wang et al., 2014; Han et al., 2015; Zheng et al., 2017; Zhou et al., 2017; Chang et al., 2019). Han et al. (2015) conducted CMAQ simulations with different emission inventories for East Asia and found that the simulated NO2 columns using the emission inventory for the Intercontinental Chemical Transport Experiment Phase B (INTEX-B; Zhang et al., 2009) agreed better with the satellite observations of the Ozone Monitoring Instrument (OMI) than the simulations using the Regional Emission Inventory in Asia (REAS v1.11; Ohara et al., 2007). Zhou et al. (2017) applied CMAQ to evaluate the national, regional, and provincial emission inventories for the Yangtze River Delta (YRD) region, and the best model performance with the provincial inventory confirmed that the emission estimate with more detailed information incorporated on individual power and industrial plants helped improve the air quality simulation at relatively high horizontal resolution. With air quality modeling, moreover, many studies have explored the environmental benefits of emission control measures taken in recent years (B. Zhao et al., 2013; Huang et al., 2014; Li et al., 2015; Wang et al., 2015; Tan et al., 2017). Wang et al. (2015) found that the implementation of the new Emission Standard of Air Pollutants for Thermal Power Plants (GB13223-2011) could effectively reduce pollutant emissions in China, and the ambient concentrations of SO2, NO2, and PM2.5 would decrease by 31.6 %, 24.3 %, and 14.7 %, respectively, in 2020 compared with a baseline scenario for 2010. Li et al. (2015) found that the simulated concentrations of PM2.5 in the YRD region would decrease by 8.7 %, 15.9 %, and 24.3 % from 2013 to 2017 in three scenarios with weak, moderate, and strong emission reduction assumptions in the Clean Air Action Plan, respectively.
Besides air quality, the health risk caused by air pollution exposures in China is a major concern, especially to PM2.5, a dominant pollutant in haze conditions. Lim et al. (2012) has identified air pollution as a primary cause of global burden of disease, especially in low- and middle-income countries, and PM2.5 pollution was ranked the fourth leading cause of death in China. Studies have shown that PM2.5 is closely related to several causes of death (Dockery et al., 1993; Hoek et al., 2013; Lelieveld et al., 2015; Butt et al., 2017; Gao et al., 2018; Maji et al., 2018). For example, Lelieveld et al. (2015) estimated that nearly 1.4 million people died each year due to PM2.5 exposure in China, 18 % of which were related to the emissions from the power sector. Based on simulated PM2.5 using WRF-Chem (Weather Research and Forecasting (WRF) model coupled with chemistry) and the Integrated Exposure Response (IER) model, Gao et al. (2018) estimated that emissions from the power sector results in 15 million years of life lost per year in China. In addition to assessment of health risk based on observations of actual air pollution levels, studies have also analyzed the health benefits of emission control policies (Lei et al., 2015; Li and Li, 2018; Dai et al., 2019; Q. Zhang et al., 2019; X. Zhang et al., 2019). Combining available observation and CMAQ modeling, Q. Zhang et al. (2019) identified improved emission controls on industrial and residential pollution sources as the main drivers of reductions in PM2.5 concentrations from 2013 to 2017 in China and estimated an annual reduction of PM2.5-related deaths at 0.41 million. Lei et al. (2015) evaluated the health benefit of the Air Pollution Prevention and Control Action Plan of China and found that full realization of the air quality goal in this plan could avoid 89 000 premature deaths of urban residents and reduce 120 000 inpatient cases and 9.4 million outpatient service and emergency cases. Focusing more regionally, X. Zhang et al. (2019) estimated the health impact of a “coal-to-electricity” policy for residential energy use in the Beijing-Tianjin-Hebei (BTH) region. They projected that the reduction in PM2.5 concentrations from the policy would avoid nearly 22 200 cases of premature death and 607 800 cases of disease in the region in 2020. For areas with strong, industry-based economies, the impact of air quality on public health can be more significant, attributed both to relatively large and dense populations and to high pollution levels. Until now, however, there have been few studies focusing on air quality improvement and corresponding health benefits attributed to the implementation of the latest emission control policies, notably China's ultra-low emission policy introduced above, at a regional scale.
As one of the most densely populated and economically developed regions, the YRD region encompassing Shanghai and Anhui, Jiangsu, and Zhejiang provinces is a key area for air pollution prevention and control in China (Huang et al., 2011; Li et al., 2011, 2012). It is also one of the regions with the earliest implementation of the ultra-low emission policy on the power sector in the country. Quantification of emission reductions as well as subsequent changes in air quality is crucial for full understanding of the environmental benefits of the policy. To test the possible improvement in the regional emission inventory, this study evaluated the air quality modeling performance without and with CEMS data incorporated in the estimation of emissions of the coal-fired power sector for the YRD region. The changes in regional air quality and health risk resulting from the implementation of the ultra-low emission policy for key industries were quantified combining the air quality modeling and the health risk model. The results provide scientific support for incorporation of online monitoring data to improve the estimation of air pollutant emissions and for better design of emission control policies based on their simulated environmental effects.
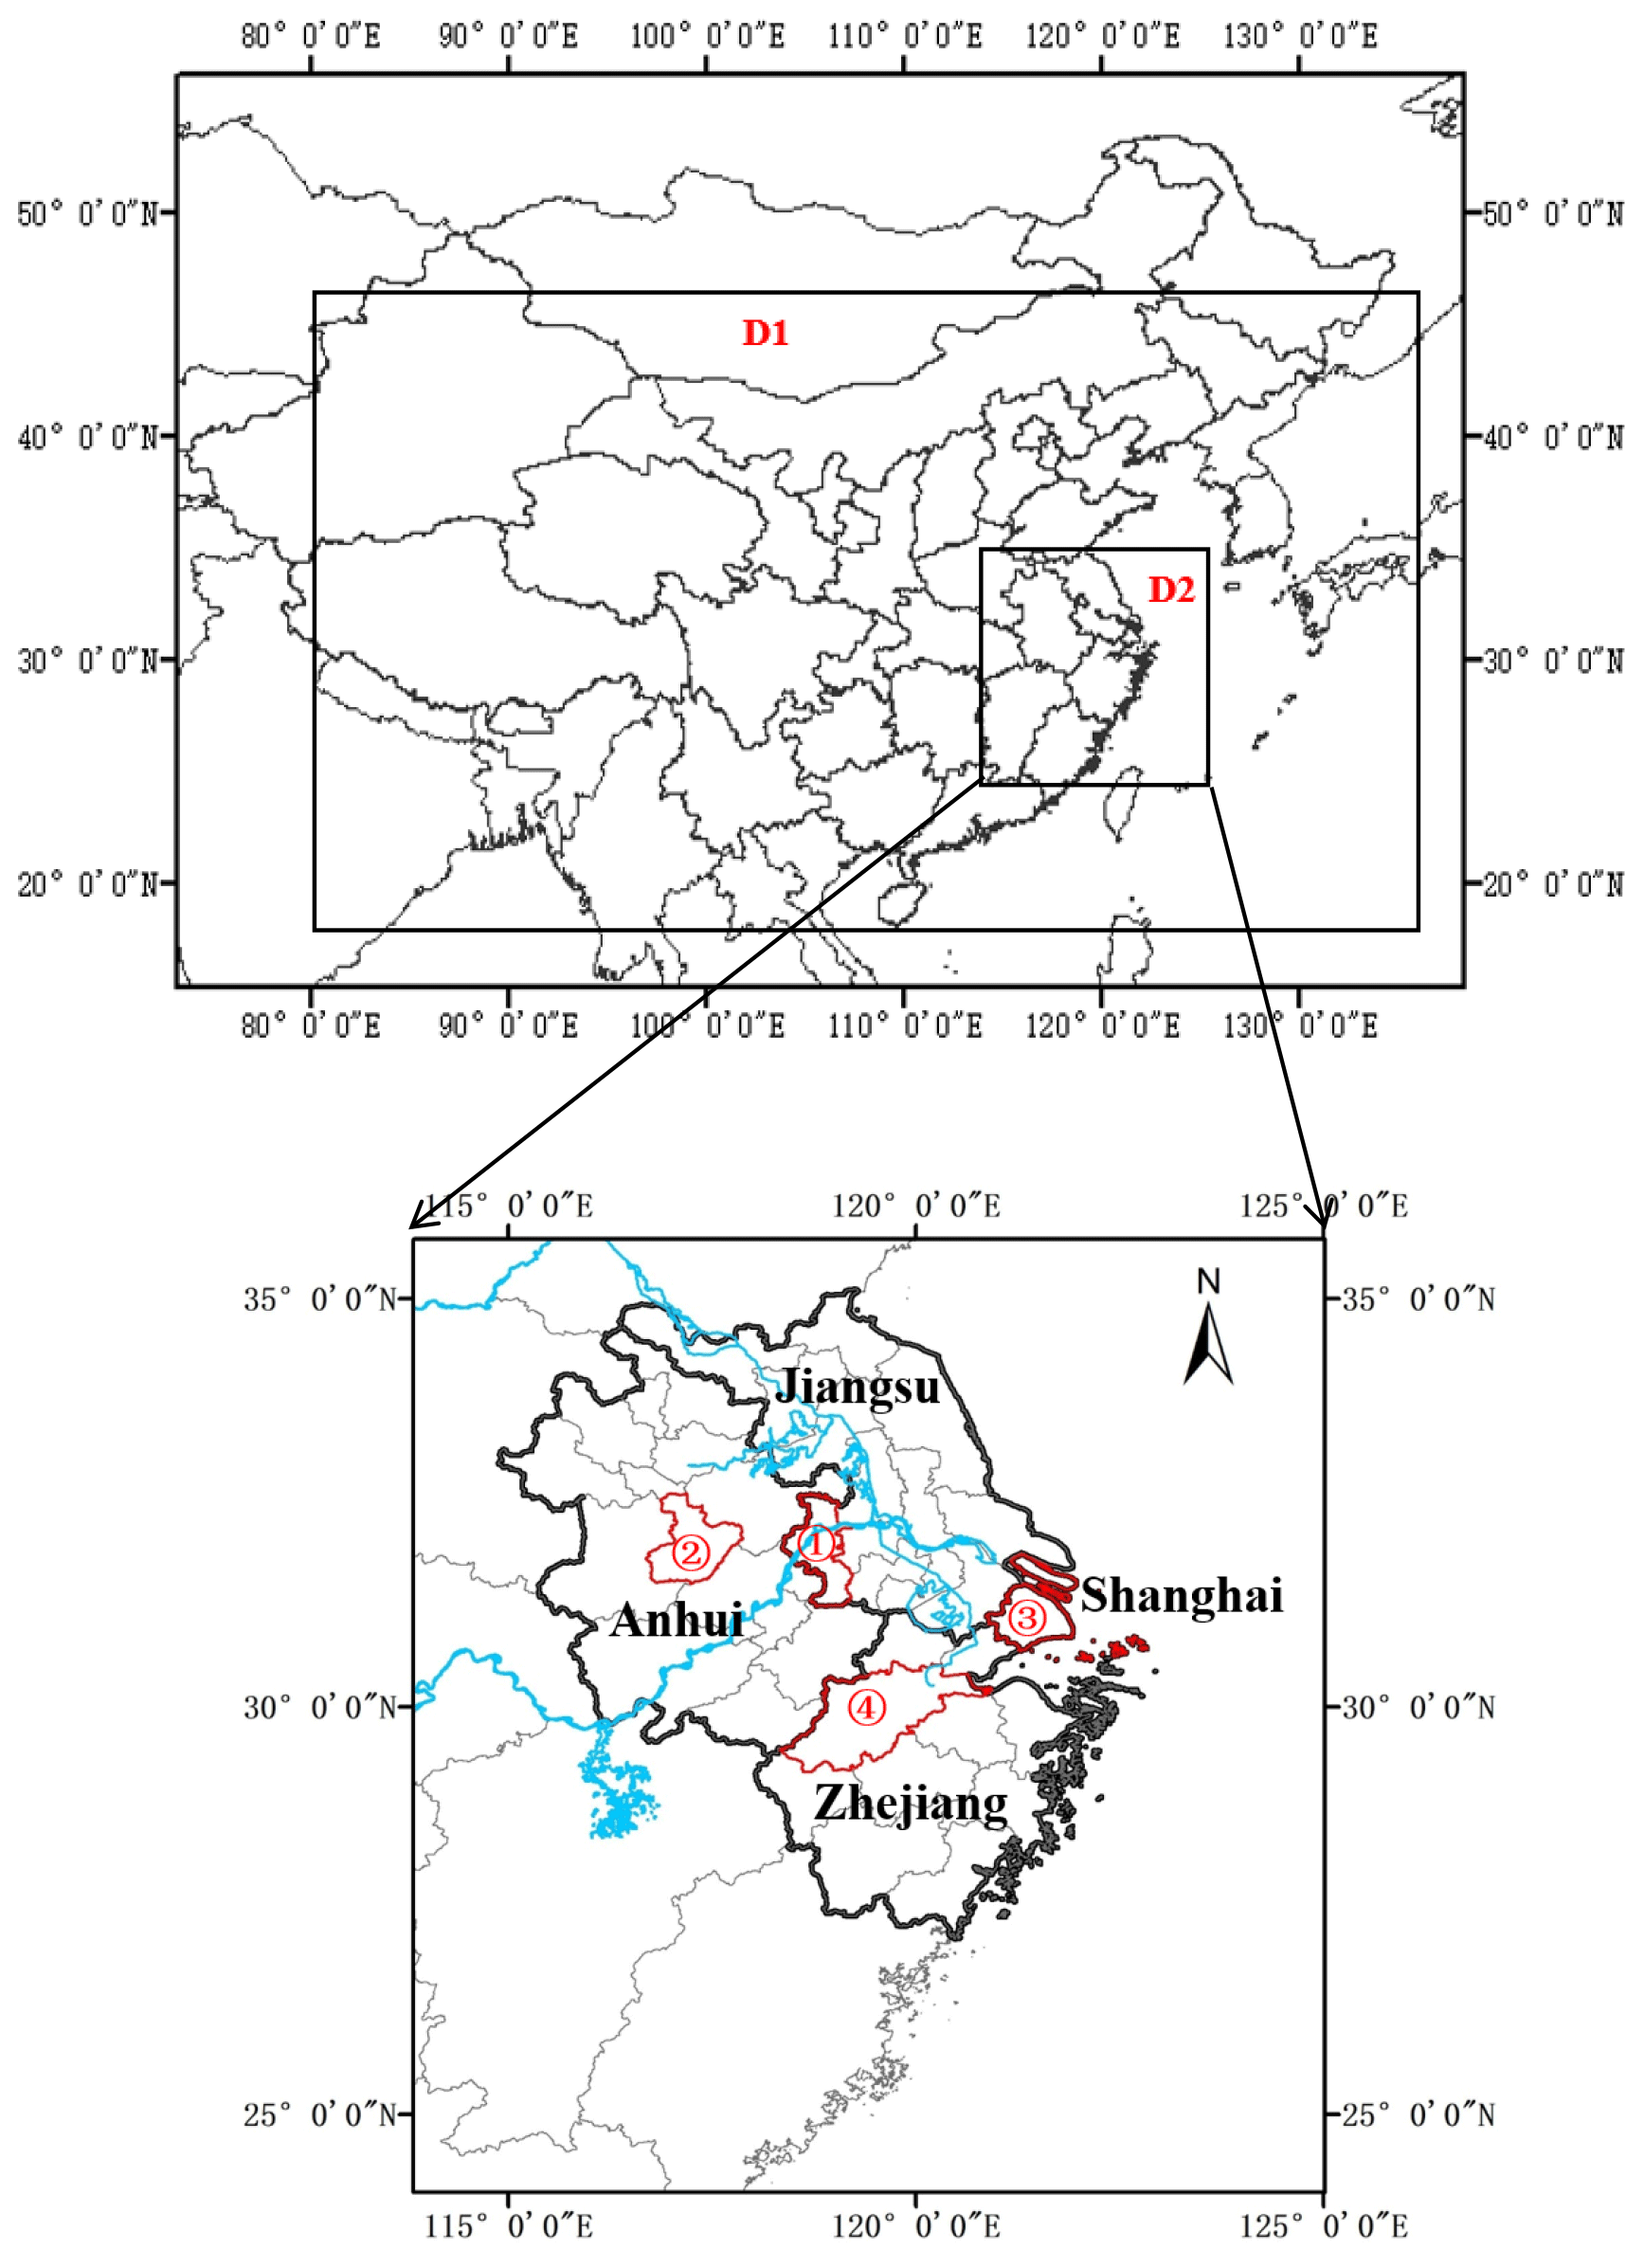
Figure 1The modeling domain and the locations of the concerned provinces and their capital cities. The numbers 1–4 represent the cities of Nanjing, Hefei, Shanghai, and Hangzhou, respectively. The map data, provided by the Resource and Environment Data Cloud Platform, are freely available for academic use (http://www.resdc.cn/data.aspx?DATAID=201, last access: 19 April 2021), © Institute of Geographic Sciences & Natural Resources Research, Chinese Academy of Sciences.
2.1 Air quality modeling
In this study, we adopted CMAQ version 4.7.1 (UNC, 2010) to conduct air quality simulations and to evaluate various emission inventories for the YRD region. The model has performed well in Asia (Zhang et al., 2006; Uno et al., 2007; Fu et al., 2008; Wang et al., 2009). Two one-way nested domains were adopted for the simulations, and the horizontal resolutions were set at 27 and 9 km square grid cells, respectively, as shown in Fig. 1. The mother domain (D1, 177 × 127 cells) covered most of China and all or parts of surrounding countries in east, southeast, and south Asia. The second modeling region (D2, 118 × 121 cells) covered the YRD region, including Jiangsu, Zhejiang, Shanghai, Anhui, and parts of surrounding provinces. Lambert conformal conic projection was applied for the entire simulation area centered at 34∘ N, 110∘ E with two true latitudes (40∘ N and 25∘ N). The simulated periods were January, April, July, and October 2015, as representative of the four seasons. The first 5 d in each month were set as a spin-up period to provide initial conditions for later simulations. The Carbon Bond gas-phase mechanism (CB05) and AERO5 aerosol module were adopted in all the CMAQ modules, with details of the model configuration found in Zhou et al. (2017). The initial concentrations and boundary conditions for the D1 mother domain were the default clean profile, while they were extracted from CMAQ outputs of D1 simulations for the nested D2 domain. Normalized mean bias (NMB), normalized mean error (NME), and the correlation coefficient (R) between the simulations and observations were selected to evaluate the performance of CMAQ modeling (Yu et al., 2006). The hourly concentrations of SO2, NO2, O3, and PM2.5 were observed at 230 state-operated ground stations of the national monitoring network in the YRD region and were collected from Qingyue Open Environmental Data Center (https://data.epmap.org, last access: 19 April 2021).
The Weather Research and Forecasting (WRF) Model version 3.4 (http://www.wrf-model.org/index.php, last access: 19 April 2021; Skamarock et al., 2008) was applied to provide meteorological fields for CMAQ. Terrain and land-use data were taken from global data of the US Geological Survey (USGS), and the first-guess fields of meteorological modeling were obtained from the final operational global analysis data (ds083.2) by the National Centers for Environmental Prediction (NCEP). Statistical indicators including bias, index of agreement (IOA), and root mean squared error (RMSE) were chosen to evaluate the performance of WRF modeling against observations (Baker et al., 2004; Zhang et al., 2006). Ground observations at 3 h intervals of four meteorological parameters including temperature at 2 m (T2), relative humidity at 2 m (RH2), and wind speed and direction at 10 m (WS10 and WD10) of 42 surface meteorological stations in the YRD region were downloaded from the National Climatic Data Center (NCDC). The statistical indicators for WS10, WD10, T2, and RH2 in the YRD region are summarized by month in Table S1 in the Supplement. The discrepancies between WRF simulations and observations of these meteorological parameters were generally acceptable (Emery et al., 2001). Better agreements were found for T2 and RH2 with their biases ranging −0.62 to +0.12∘ and −3.20 % to +6.60 %, respectively, and their IOA values were all within the benchmarks (Emery et al., 2001). In general, WRF captured well the characteristics of main meteorological conditions for the region.
2.2 Emission inventories and cases
The anthropogenic emissions from industry, residential, and transportation sectors for D1 and D2 were obtained from the national emission inventory developed in our previous work (Xia et al., 2016). The total emissions excluding those of the power sector of SO2, NOX, and PM for the YRD region were estimated at 1501.0, 3468.4, and 2711.2 Gg for 2015, respectively. The emission inventory in Xia et al. (2016) was developed using activity data at the provincial level, and the spatial distribution of emissions by sector was conducted according to that of MEIC with the original spatial resolution of 0.25∘ × 0.25∘ in this study. The gridded emissions were further downscaled to horizontal resolutions of 27 and 9 km in D1 and D2, respectively, based on the spatial distribution of population (for residential sources), industrial gross domestic product (for industrial sources), and the road network (for on-road vehicles). The monthly variations of emissions from each sector were assumed to be the same as in MEIC. Constrained by available ground observation, a larger monthly variation in the emissions of black carbon aerosols was found for the central YRD region than that in MEIC. Limited improvement in air quality model performance was consequently achieved, implying that the bias from the temporal variation was insignificant (Zhao et al., 2019). In addition, the Model Emissions of Gases and Aerosols from Nature modeling system developed under the Monitoring Atmospheric Composition and Climate project (MEGAN-MACC; Guenther et al., 2012; Sindelarova et al., 2014) was applied as the biogenic emission inventory, and the emissions of Cl, HCl, and lightning NOX were obtained from the Global Emissions InitiAtive (GEIA; Price et al., 1997).
Table 1The air pollutant emissions by sector for cases 1–5 in the YRD (unit: Gg).
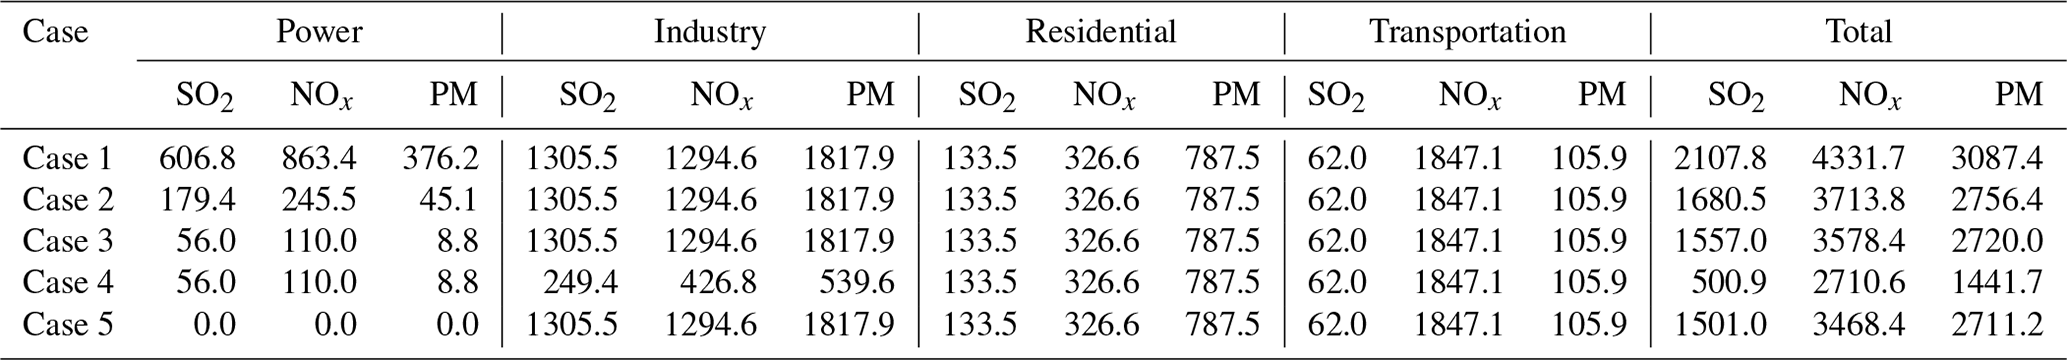
Note that for case 1, the emissions of coal-fired power sector were estimated based on the emission factor method without CEMS data. For case 2, the emissions of coal-fired power sector were estimated based on the improved method by Y. Zhang et al. (2019), with CEMS data incorporated. For case 3, all the coal-fired power plants in the YRD region were assumed to meet the requirement of the ultra-low emission policy. For case 4, all the coal-fired power plants and certain industrial sources including boilers, cement, and iron and steel factories in the YRD region were assumed to meet the requirement of the ultra-low emission policy. For case 5, the emissions of all coal-fired power plants were set at zero.
For the power sector in the YRD region specifically, we adopted the unit-level emission estimates from our previous study and allocated the emissions according to the actual locations of individual units (Y. Zhang et al., 2019). As described in that study, the detailed information at the power unit level was compiled based on official environmental statistics including the geographic location, installed capacity, fossil fuel consumption, combustion technology, and APCDs. Besides the commonly used method, Y. Zhang et al. (2019) developed a new method of examining, screening and applying CEMS data to improve the estimates of power sector emissions. CEMS data were collected for over 1000 power units, including operation condition; monitoring time; flue gas flow; and hourly concentrations of SO2, NOx, and PM. The emissions of individual units were calculated based on the hourly concentrations of air pollutants obtained from CEMSs and the theoretical flue gas volume estimated based on the unit-level information mentioned above. Compared to MEIC, a larger monthly variation in emissions was found based on the online emission monitoring. More details can be found in Y. Zhang et al. (2019). In this work, five emission cases were set for the air quality simulation. Cases 1 and 2 used estimates of power sector emissions with and without incorporation of CEMS data and were compared against each other to evaluate the benefit of online emission monitoring information in air quality simulation. Note that case 2 was set as the base case for further analysis of the effects of emission controls. Based on the unit-level information from CEMSs, case 3 assumed that only power plants would meet the requirement of the ultra-low emission policy, while case 4 assumed both power plants and selected industrial sources including boilers, cement, and iron and steel factories would meet the requirement. As summarized in Table S2 in the Supplement, the ultra-low emission limits for the flue gas concentrations were obtained from the most recent national or local standards by sector (Yang et al., 2021). The model performances were compared with the base case to quantify the air quality improvements that result from the policy. Case 5 removed all the emissions from the power sector and thus helped to specify the contribution of the power sector to air pollution in the YRD region.
The air pollutant emissions for all the cases are summarized by sector in Table 1. With the CEMS data for the power sector incorporated, the total emissions of SO2, NOX, and PM for the YRD region in case 2 were estimated as 427, 618, and 331 Gg smaller than those in case 1, with relative reductions of 20 %, 14 %, and 11 %, respectively. Benefiting from the implementation of the ultra-low emission policy in the coal-fired power sector, the total emissions of anthropogenic SO2, NOX, and PM in case 3 would further decline 123, 135, and 36 Gg compared to case 2, respectively. The analogous numbers for case 4 were 1180, 1003, and 1315 Gg, and the reduction rates compared to case 2 were 70 %, 27 %, and 48 % for SO2, NOX and PM, respectively. The implementation of the ultra-low emission policy for both power and industrial sectors would significantly reduce the primary pollutant emissions for the YRD region. In case 5 where the emissions from the power sector were set as zero, the total emissions of SO2, NOX, and PM were estimated to decrease by 11 %, 7 %, and 2 %, respectively, compared to case 2.
2.3 Health effect analysis
We applied the IER model of the Global Burden of Disease (GBD) study 2015 (Cohen et al., 2017) and quantified the impact of emission control policy on the human health risk due to long-term exposure of PM2.5 in the YRD region. The model has been well developed and widely applied in quantifying the impact of air pollution control policies on health burden (Li et al., 2019; Yue et al., 2020; Zheng et al., 2019). Compared to another widely used model Global Exposure Mortality Model (GEMM; Burnett et al., 2018), IER was expected to provide relatively conservative estimates for China (Yang et al., 2021). The number of attributable deaths and years of life lost (YLL) caused by long-term PM2.5 exposure for selected emission cases were calculated for various diseases in this study. In particular, YLL represents the years of life lost because of premature death from a particular cause or disease. As the number of deaths alone could not provide a comprehensive picture of the burden that deaths impose on the population, we calculated YLL caused by PM2.5 exposure to help describe the extent to which the lives of people exposed to air pollution were cut short. We considered the four adult diseases of the GBD study, including ischemic heart disease (IHD), stroke (STK, including ischemic and hemorrhagic stroke), lung cancer (LC), and chronic obstructive pulmonary disease (COPD), as well as acute lower respiratory infection (LRI), which is a common disease among young children.
The health risks in the different emission cases were estimated following Gao et al. (2018) with the updated information for 2015. First, the relative risk (RR) for each disease was calculated using Eq. (1):
where i, j, and k represent the age, gender, and disease type, respectively; “Cl” is the annual average PM2.5 concentration simulated with WRF-CMAQ (the average of January, April, July, and October in this work); C0 is the counterfactual concentration; and ∂, β, and γ are the parameters that describe the IER functions, as reported by Cohen et al. (2017).
Secondly, the population attributable fractions (PAFs) were calculated with RR following Eq. (2) by disease, age, and gender subgroup:
Moreover, the mortality attributable to PM2.5 exposure (ΔM) was calculated using Eq. (2), where y0 is the current age–gender-specific mortality rate, and “Pop” represents the exposed population in the age–gender-specific group in grid cell l:
The population data of the four provinces and cities in the YRD region were obtained from statistical yearbooks (AHBS, 2016; JSBS, 2016; SHBS, 2016; ZJBS, 2016), and the gender distribution by province is shown in Table S3 in the Supplement. As the high-resolution spatial pattern of age structure was unavailable, we assumed the same age structure for all the model grids according to Gao et al. (2018). The baseline age–gender–disease-specific mortality rates for the five diseases in China for 2015 were obtained from the Global Health Data Exchange database (GHDx, https://vizhub.healthdata.org, last access: 19 April 2021), as shown in Table S4 in the Supplement, and those by province were calculated based on the provincial proportions in Xie et al. (2016). The national population with the spatial resolution at 1 km× 1 km in 2015 was provided by the LandScan global demographic dynamic analysis database developed by Oak Ridge National Laboratory (ORNL) of the US Department of Energy. As shown in Fig. S1 in the Supplement, the population densities in the YRD region are larger in Shanghai, southern Jiangsu, and northern Zhejiang.
Finally, the year of life lost (YLL) due to PM2.5 exposure was calculated from the number of deaths multiplied by a standard life expectancy at the age at which death occurs, as shown in Eq. (4), where N represents the number of deaths in each age–gender-specific group, and L reflects the remaining life expectancy of the group:
The remaining life expectancies by age data were obtained from the life tables from the World Health Organization (WHO, https://www.who.int, last access: 19 April 2021), as summarized in Table S5 in the Supplement. The life expectancies at birth of Chinese males and females in 2015 were 74.8 and 77.7 years, respectively.
3.1 Evaluation of emission estimates with air quality simulation
3.1.1 Model performances with and without CEMS data
Air quality simulations based on emission inventories with and without incorporation of CEMS data for the coal-fired power sector (cases 1 and 2, respectively) were conducted to test the improvement of emission estimates. Because of the combined influences of regional transport and chemical reactions of air pollutants in the atmosphere, nonlinear relationships were found between the changes of primary emissions and ambient concentrations of air pollutants. Compared to case 1, the simulated annual average concentrations of SO2, NO2, and PM2.5 in the YRD region were 10 %, 7 %, and 6 % lower, respectively, in case 2, while that of O3 was 7 % higher, due to combined effects of emissions of volatile organic compounds (VOCs) and NOX precursors (Gao et al., 2005; Yang et al., 2012). Previous studies have shown that O3 formation in most of the YRD region is under the “VOCs-limited” regime, i.e., the generation and removal of O3 is more sensitive to VOCs and would be inhibited with high NOX concentrations in the atmosphere (Zhang et al., 2008; Liu et al., 2010; Wang et al., 2010; Xing et al., 2011). Therefore, the simulated reduced NO2 concentrations from greater NOX emission control could elevate the O3 concentration.
Table 2Comparison of the observed and simulated hourly SO2, NO2, O3, and PM2.5 concentrations by month for cases 1 and 2 in the YRD region. In total, 230 state-operated observation sites were included in the comparison.
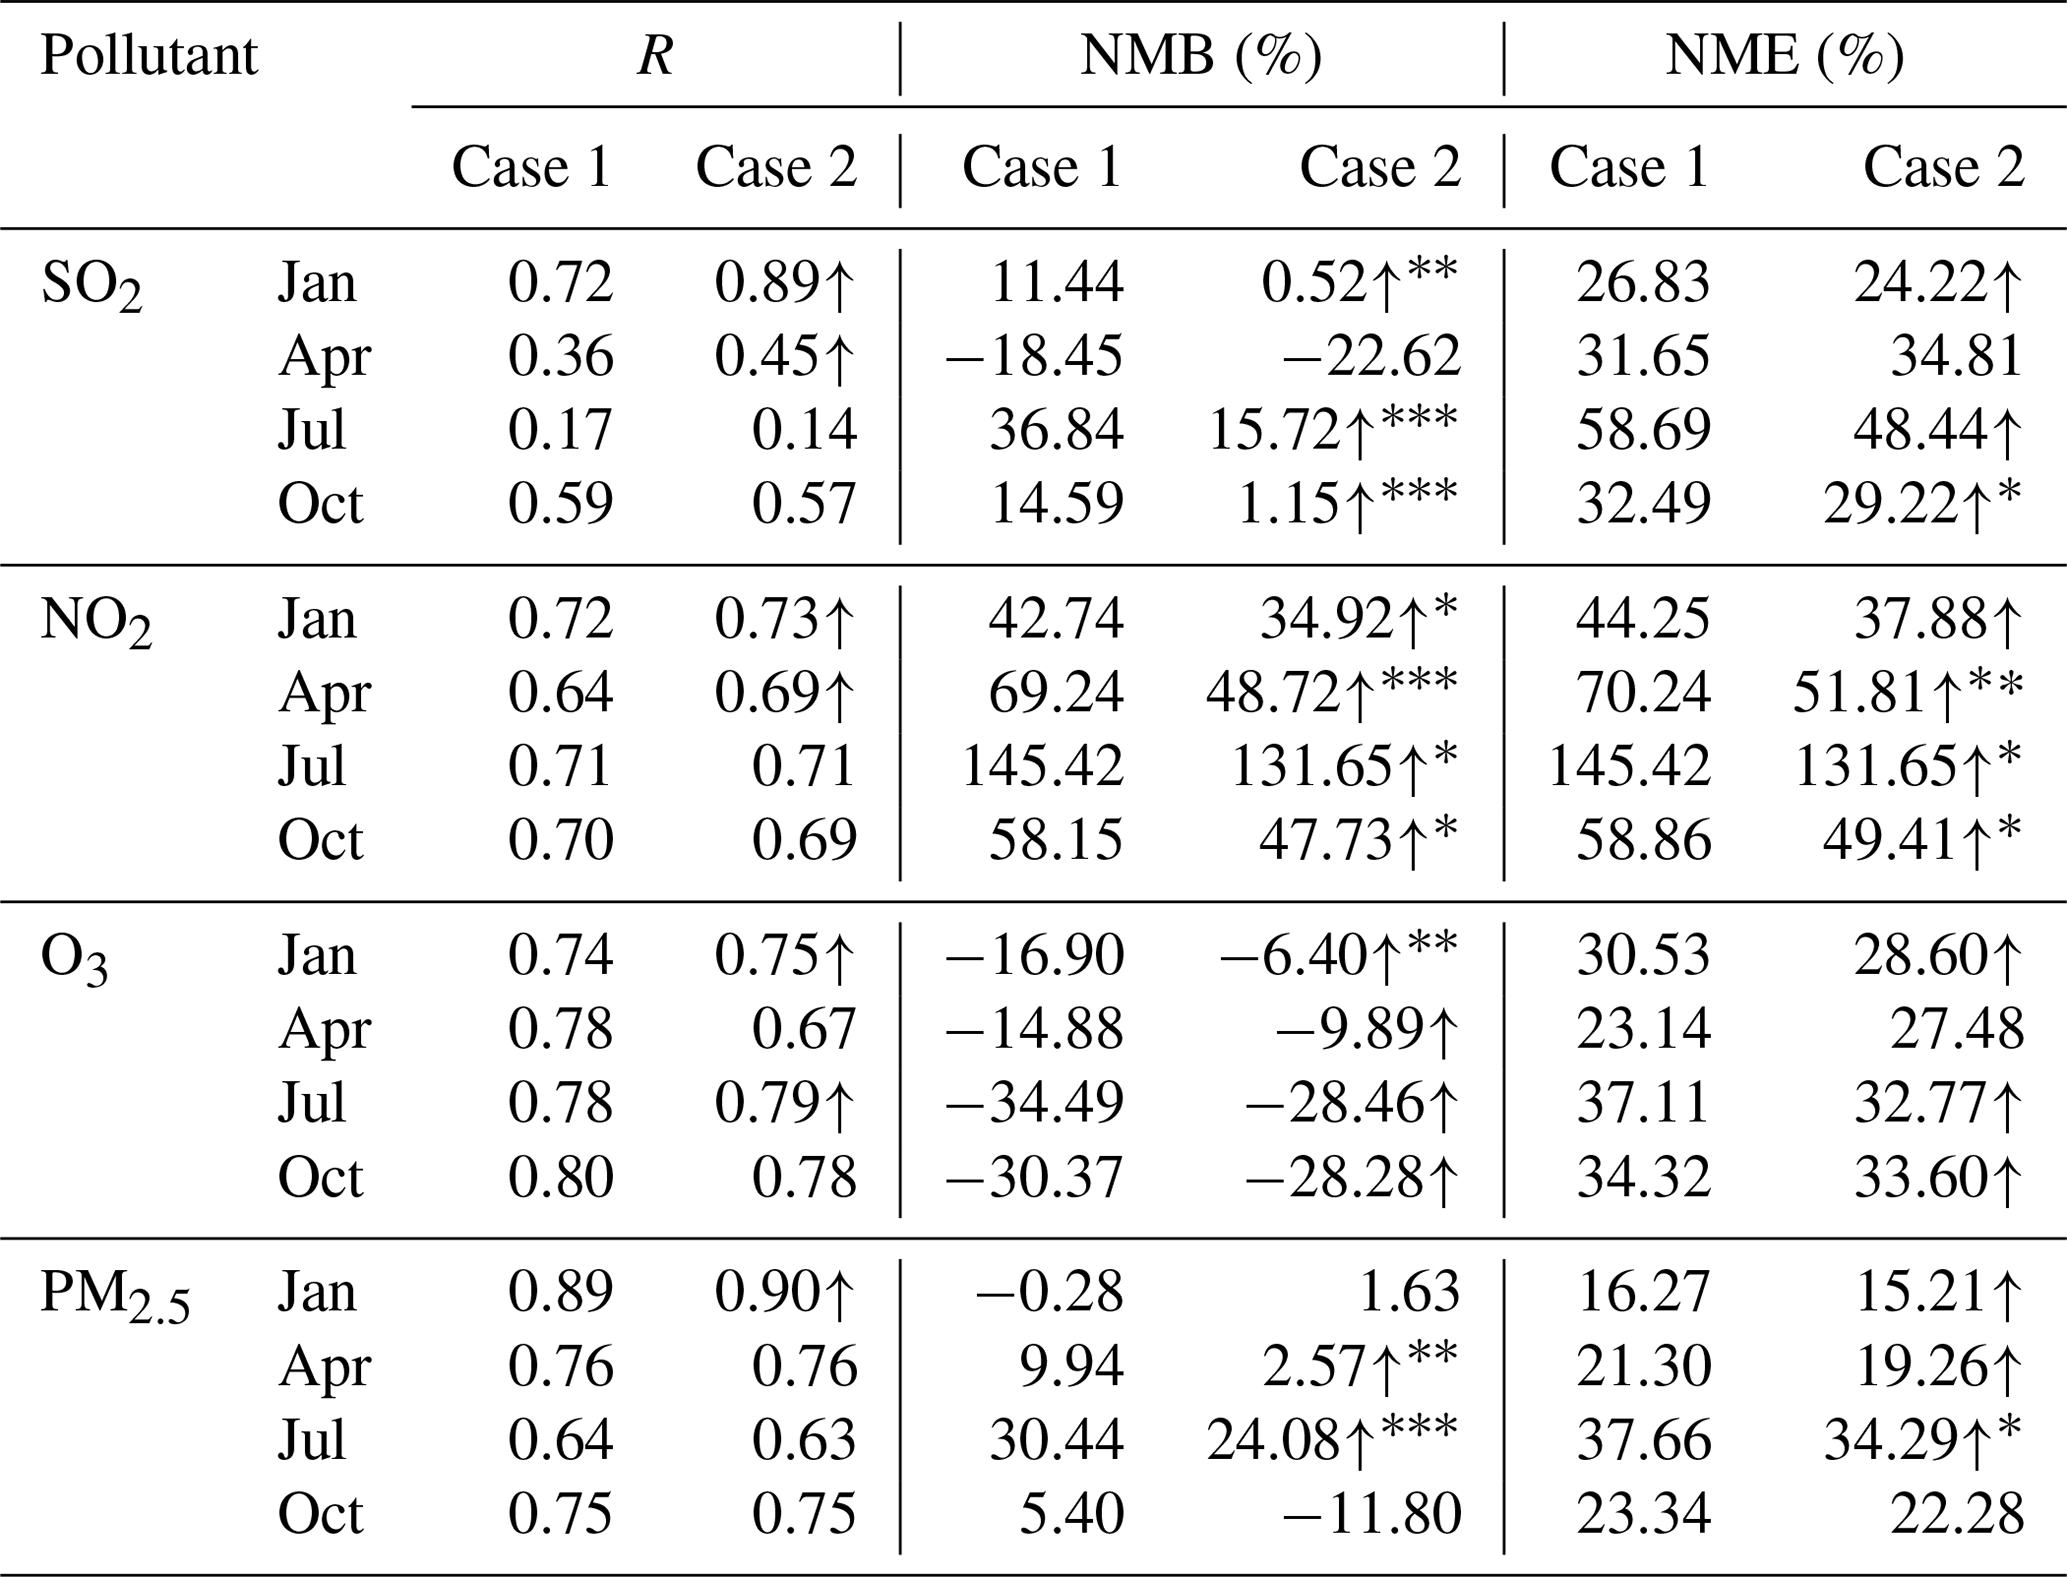
Note that the arrows indicate that the simulation values in case 2 were improved compared to case 1. The *, , and symbols indicate the improvements are statistically significant with confidence levels of 90 %, 95 %, and 99 %, respectively. The R, NMB, and NME were calculated using the following equations (where P, O, , and represent the simulation, observation, averaged simulation, and averaged observation values, respectively): ; ; .
The model performance was evaluated with available ground observation. The hourly concentrations were observed at 230 state-operated air quality monitoring stations within YRD, and the averages of hourly concentrations of those sites were compared with the simulations in cases 1 and 2, as summarized in Table 2. Similar model performances were found for the two emission cases, with overestimation of SO2, NO2, and PM2.5 as well as underestimation of O3. The NMEs between the simulated and observed SO2, O3, and PM2.5 concentrations were all smaller than 50 % for both cases and slightly worse simulation performances were found in July compared to the other 3 months. In particular, the correlation coefficients (R) between the simulated and observed SO2 in July were only 0.17 and 0.14 for cases 1 and 2, respectively, and the NMEs between the simulated and observed NO2 were larger than 100 %. In addition, greater overestimation of SO2 and PM2.5 by the model was found in July compared to other months, likely attributable to the bias of WRF modeling. On the one hand, the simulated WS10 in the YRD region in July (2.67 m s−1) was slightly lower than the observation (2.75 m s−1). The underestimation in wind speed could weaken the horizontal diffusion and lead to overestimation in air pollutant concentrations. Compared with the results from the European Centre for Medium-Range Weather Forecasts (ECMWF, https://apps.ecmwf.int/datasets, last access: 19 April 2021), on the other hand, the simulated boundary layer height (BLH) was lower in WRF for all months. The NMBs of the WRF and ECMWF BLH in January, April, and October were around −15 %, while that in July reached −24 %. The lower BLH would limit the vertical convection and diffusion of pollutants and thereby increase the surface concentrations of air pollutants. Similar to previous studies (An et al., 2013; Liao et al., 2015; Tang et al., 2015; Gao et al., 2016; Wang et al., 2016; Zhou et al., 2017), underestimation of O3 was commonly found. The NMBs between the simulation and observation for the two cases ranged from −34.5 % to −6.4 % and NMEs from 23.1 % to 37.1 %, respectively. The underestimation in O3 likely resulted from bias in the estimation of precursor emissions. Suggested by the positive NMBs of NO2 modeling in Table 2, the NOX emissions were expected to be overestimated in the two cases, even for case 2 with the CEMS data incorporated (which reflect the emission control benefits in recent years, as discussed in Y. Zhang et al., 2019). In addition, underestimation of VOC emissions is likely due to incomplete accounting of emission sources, particularly for uncontrolled or fugitive leakage (Zhao et al., 2017). As most of YRD was identified as a VOC-limited region for O3 formation (Wang et al., 2019; Yang et al., 2021), the overestimation of NOX and underestimation of VOCs could contribute to the underestimation in O3 concentrations with air quality modeling. The simulations of both cases captured well the temporal variations of PM2.5 concentrations, with the R between the observed and simulated concentrations around 0.9.
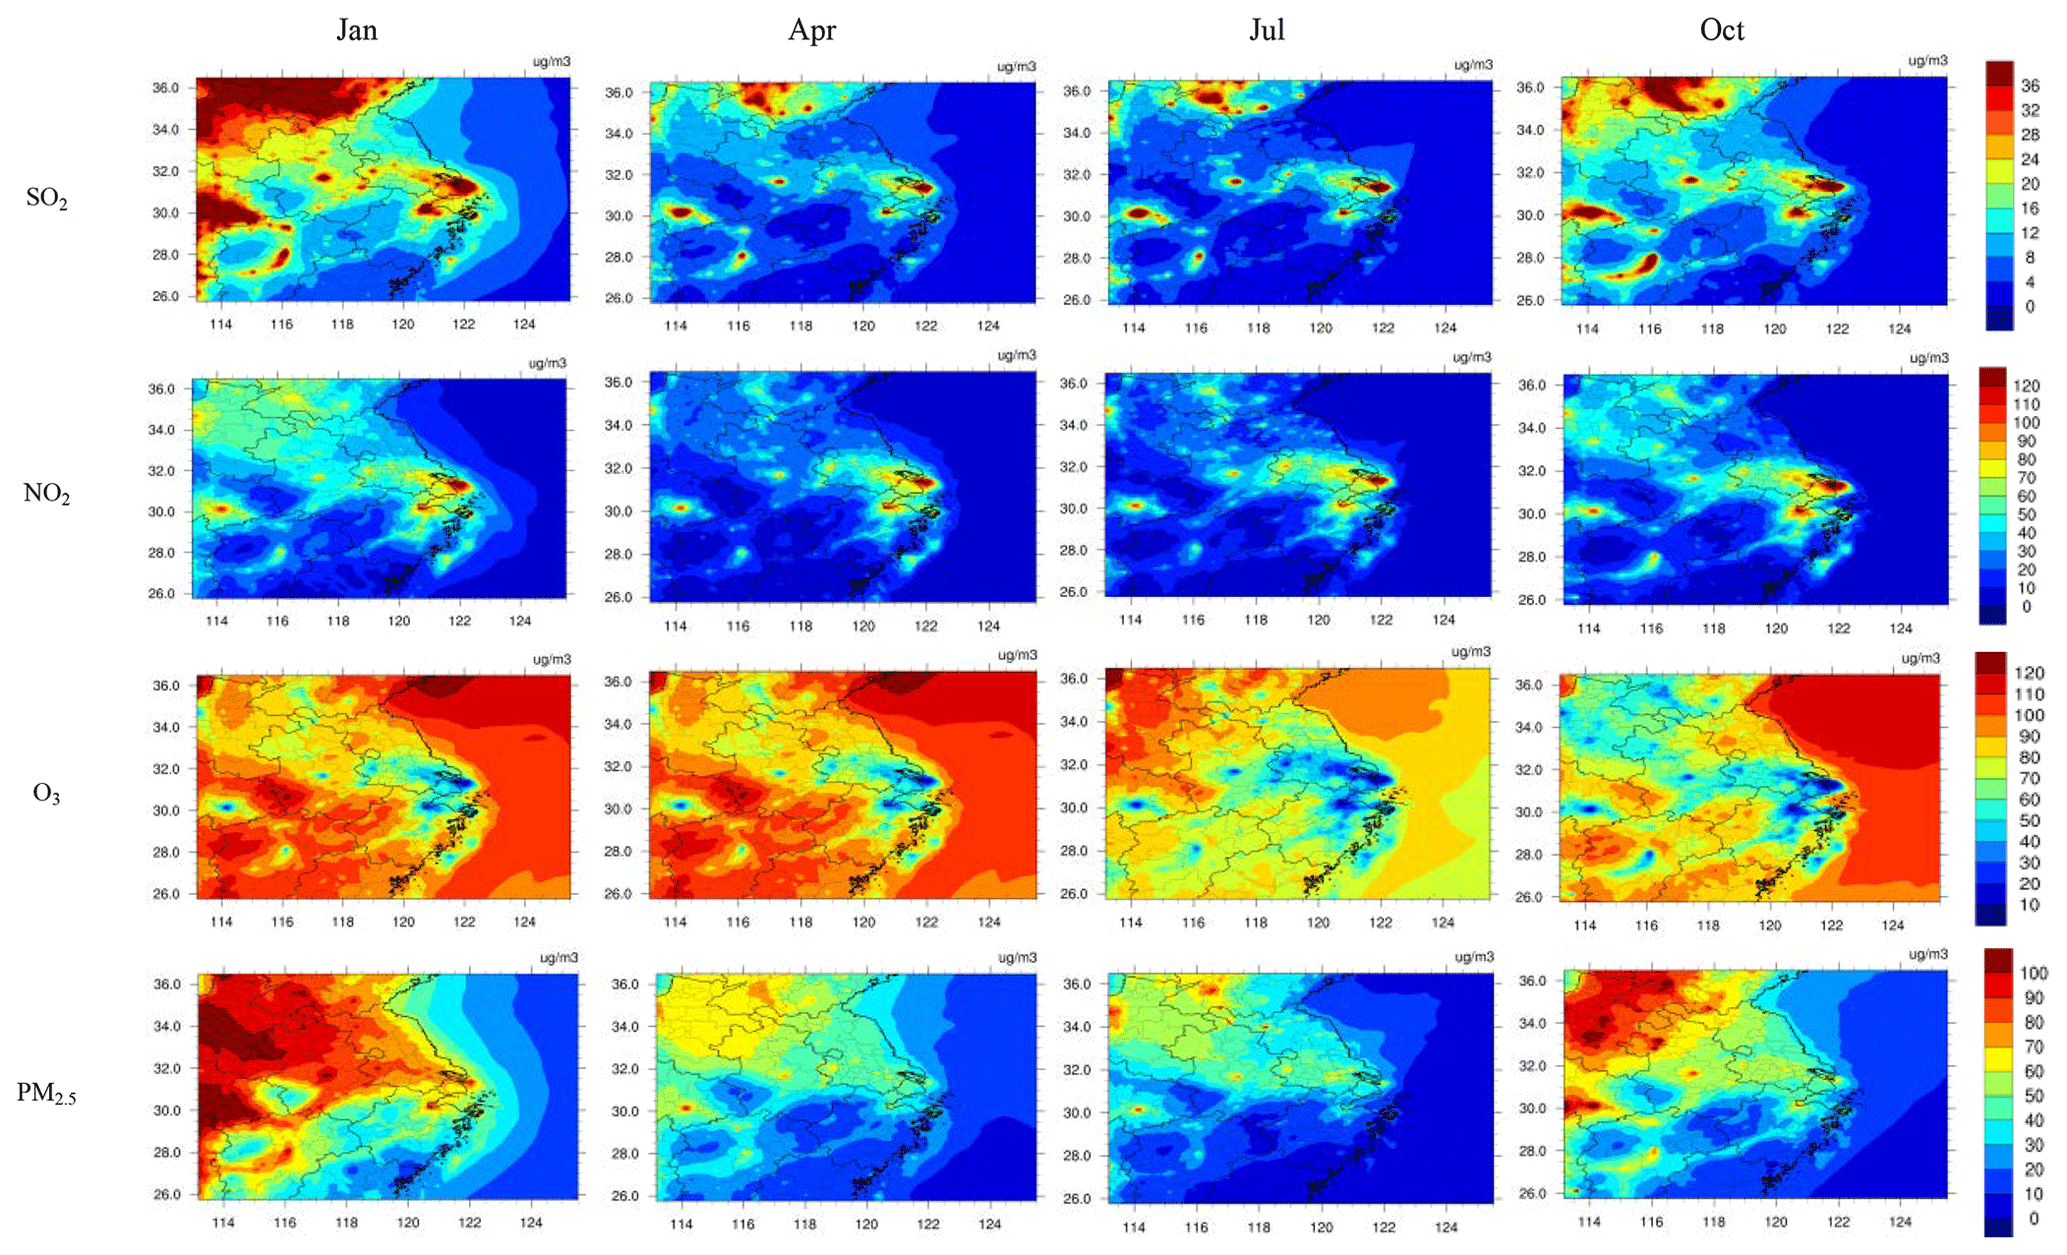
Figure 2The spatial distributions of the simulated monthly SO2, NO2, O3, and PM2.5 concentrations for case 2 in D2 (unit: µg m−3).
In general, better modeling performance in the YRD region was found in case 2 than case 1. The NMBs between the simulated and observed concentrations of SO2, NO2, O3, and PM2.5 for the whole simulation period were −3.1 %, 56.3 %, −19.5 %, and −1.4 % for case 2, which were smaller in absolute value than those for case 1 at 8.2 %, 68.9 %, −24.6 %, and 7.6 %, respectively. The bootstrap sampling (Gleser et al., 1996; He et al., 2017) was further applied to test the significance of the improvements of case 2 over case 1. (A significant difference is demonstrated if the confidence intervals of given statistical indices sampled from the two cases do not overlap.) As can be seen in Table 2, the modeling performances of the concerned species in case 2 were improved significantly in most instances compared to case 1. For example, the improvement of NMB for the SO2 simulation was significant at the 99 % confidence level for July and October and 95 % for January. The improvement of NMB and NME for NO2 was significant at confidence levels of 99 % and 95 %, respectively, for April. The improvement of NMB for O3 was significant at the 95 % confidence level for January and that of PM2.5 at 95 % for April and 99 % for July. The statistical test confirms that incorporation of online monitoring data in the emission inventory can improve the regional air quality modeling for the YRD region. Besides the emission data, it should also be noted that the changes in model schemes would affect the model performance. For example, the newer version of CMAQ incorporated the chemistry schemes of bromine and iodine and was expected to influence the O3 simulation importantly. According to our recent test in the YRD region (Lu et al., 2020), the impact of CMAQ version on the simulation of difference species was inconclusive, implying the necessity of further intercomparison and evaluation studies for the region.
Figure 2 illustrates the spatial patterns of the simulated monthly SO2, NO2, O3 and PM2.5 concentrations for case 2. For a given species, similar patterns were found for different months. In general, the simulated concentrations of SO2, NO2, and PM2.5 were larger in central and northern Anhui, southern Jiangsu, Shanghai, and coastal areas in Zhejiang, where large power and industrial plants are concentrated, as shown in Fig. S2 in the Supplement. In the highly populated cities (Shanghai, Nanjing, Hangzhou, and Hefei; see their locations in Fig. 1), the simulated concentrations of pollutants were significantly larger than their surrounding areas. For example, the simulated SO2, NO2, and PM2.5 concentrations in Nanjing were 1.4, 1.3, and 1.2 times of those in its nearby cities. The analogous numbers for Hangzhou were 2.5, 1.5, and 1.3. In contrast, the simulated O3 concentrations were smaller in urban areas and larger in suburban ones. For instance, the simulated O3 in Nanjing, Shanghai, Hefei, and Hangzhou were 0.7, 0.4, 0.6, and 0.6 times of those in their surrounding areas, respectively. The spatial distributions of the simulated NO2 and O3 concentrations in Fig. 2 also indicated that O3 concentrations were less in the regions with higher NO2 concentrations, such as the megacity of Shanghai. The simulated high concentrations of NO2 in urban areas promotes titration of O3, reducing its concentrations. In addition, O3 concentrations could remain relatively high after transport from urban to the suburban areas due to relatively small emissions of NOX in the latter.
Table 3The relative (%) and absolute changes (µg m−3, in parentheses) of the simulated monthly pollutant concentrations in different cases relative to case 2 in the YRD region.
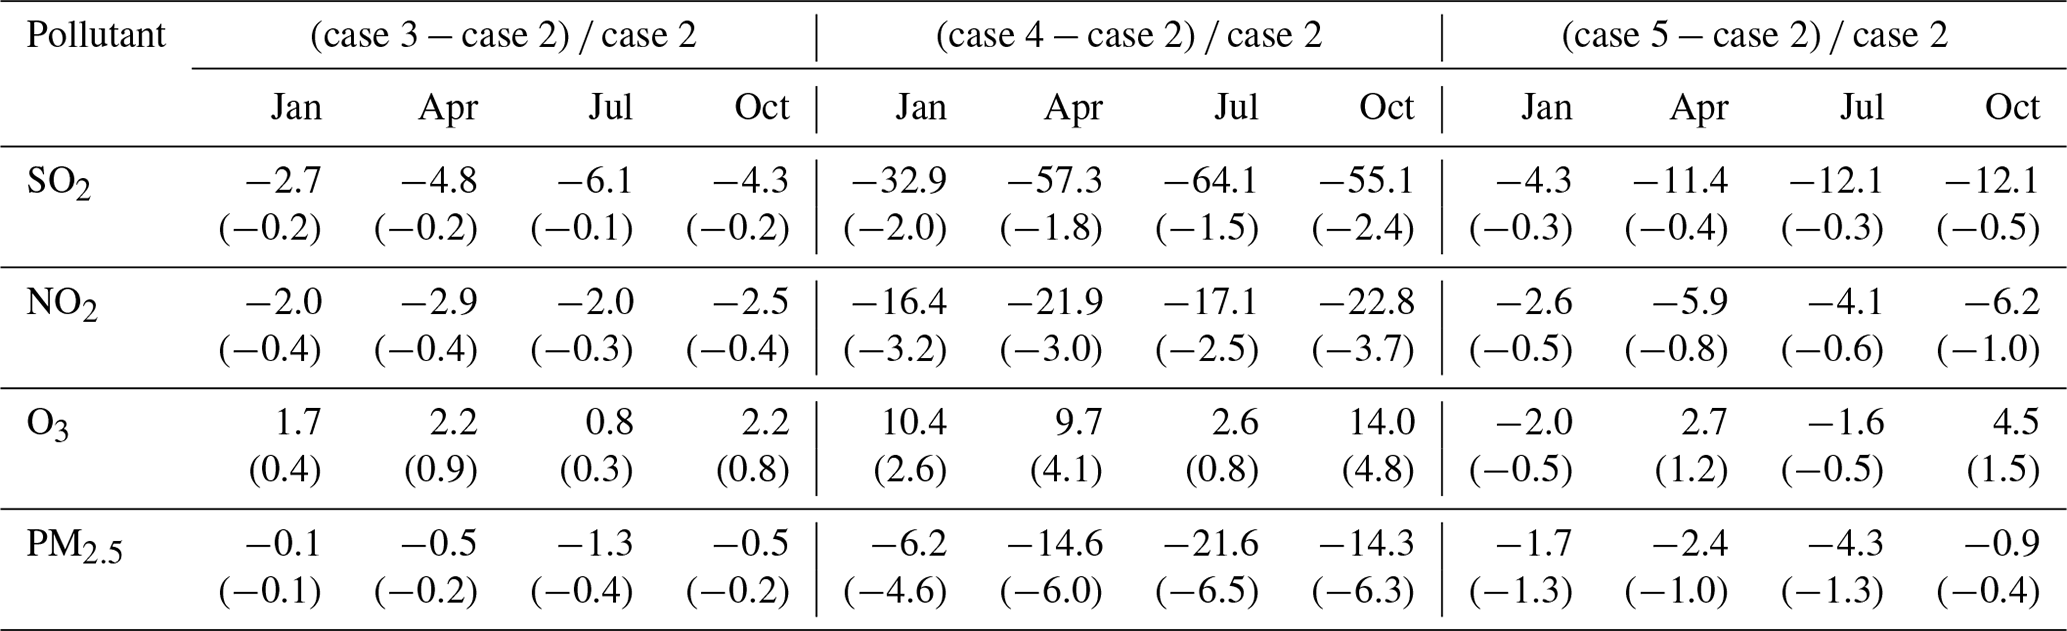
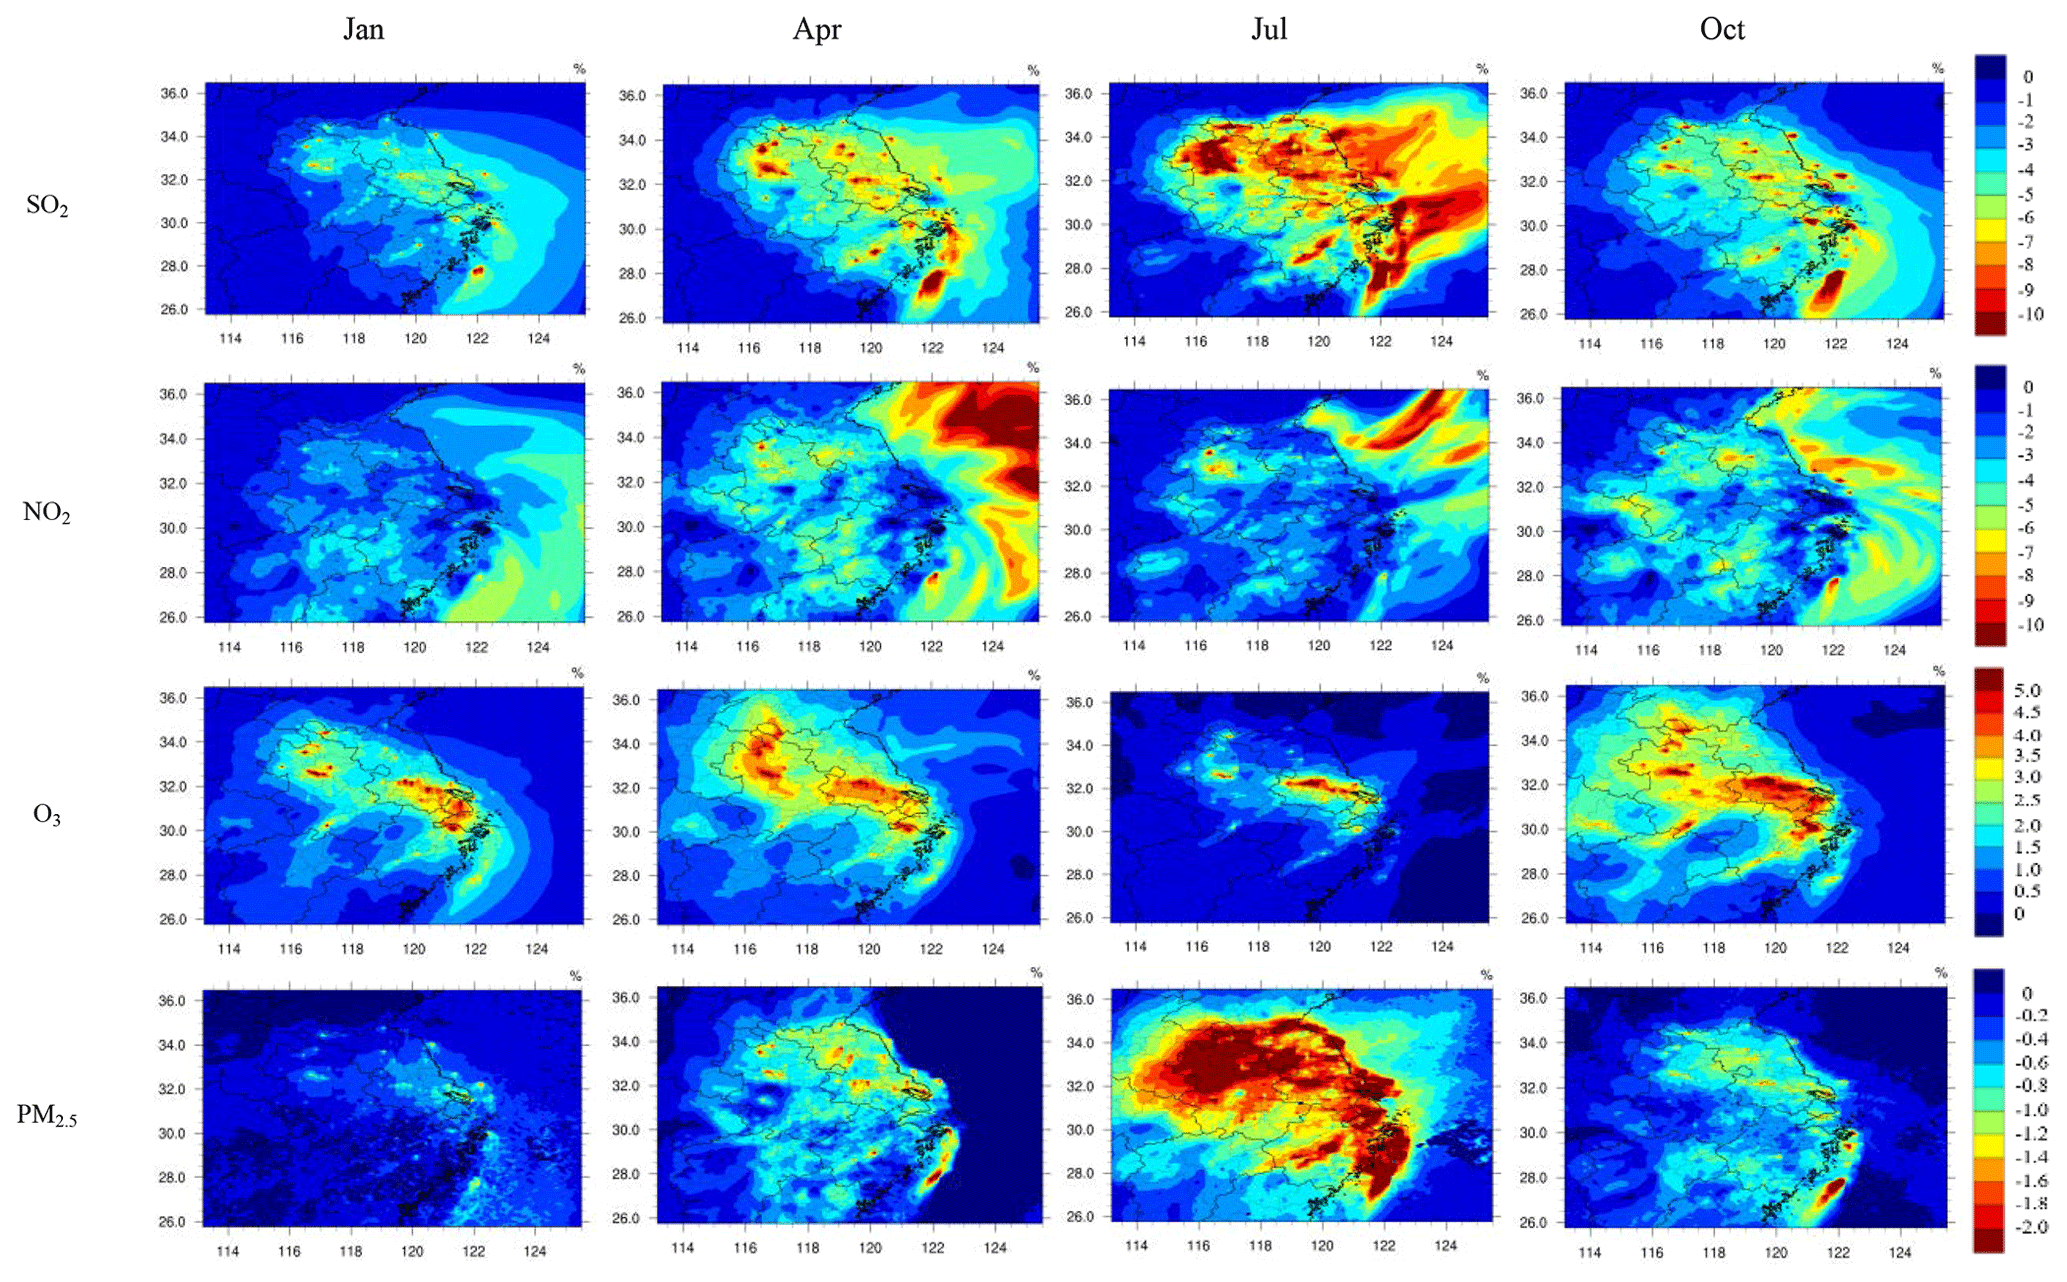
Figure 3The spatial distributions of the relative changes (%) in the simulated monthly SO2, NO2, O3, and PM2.5 concentrations between cases 2 and 3 in D2 ((case 3 − case 2) case 2).
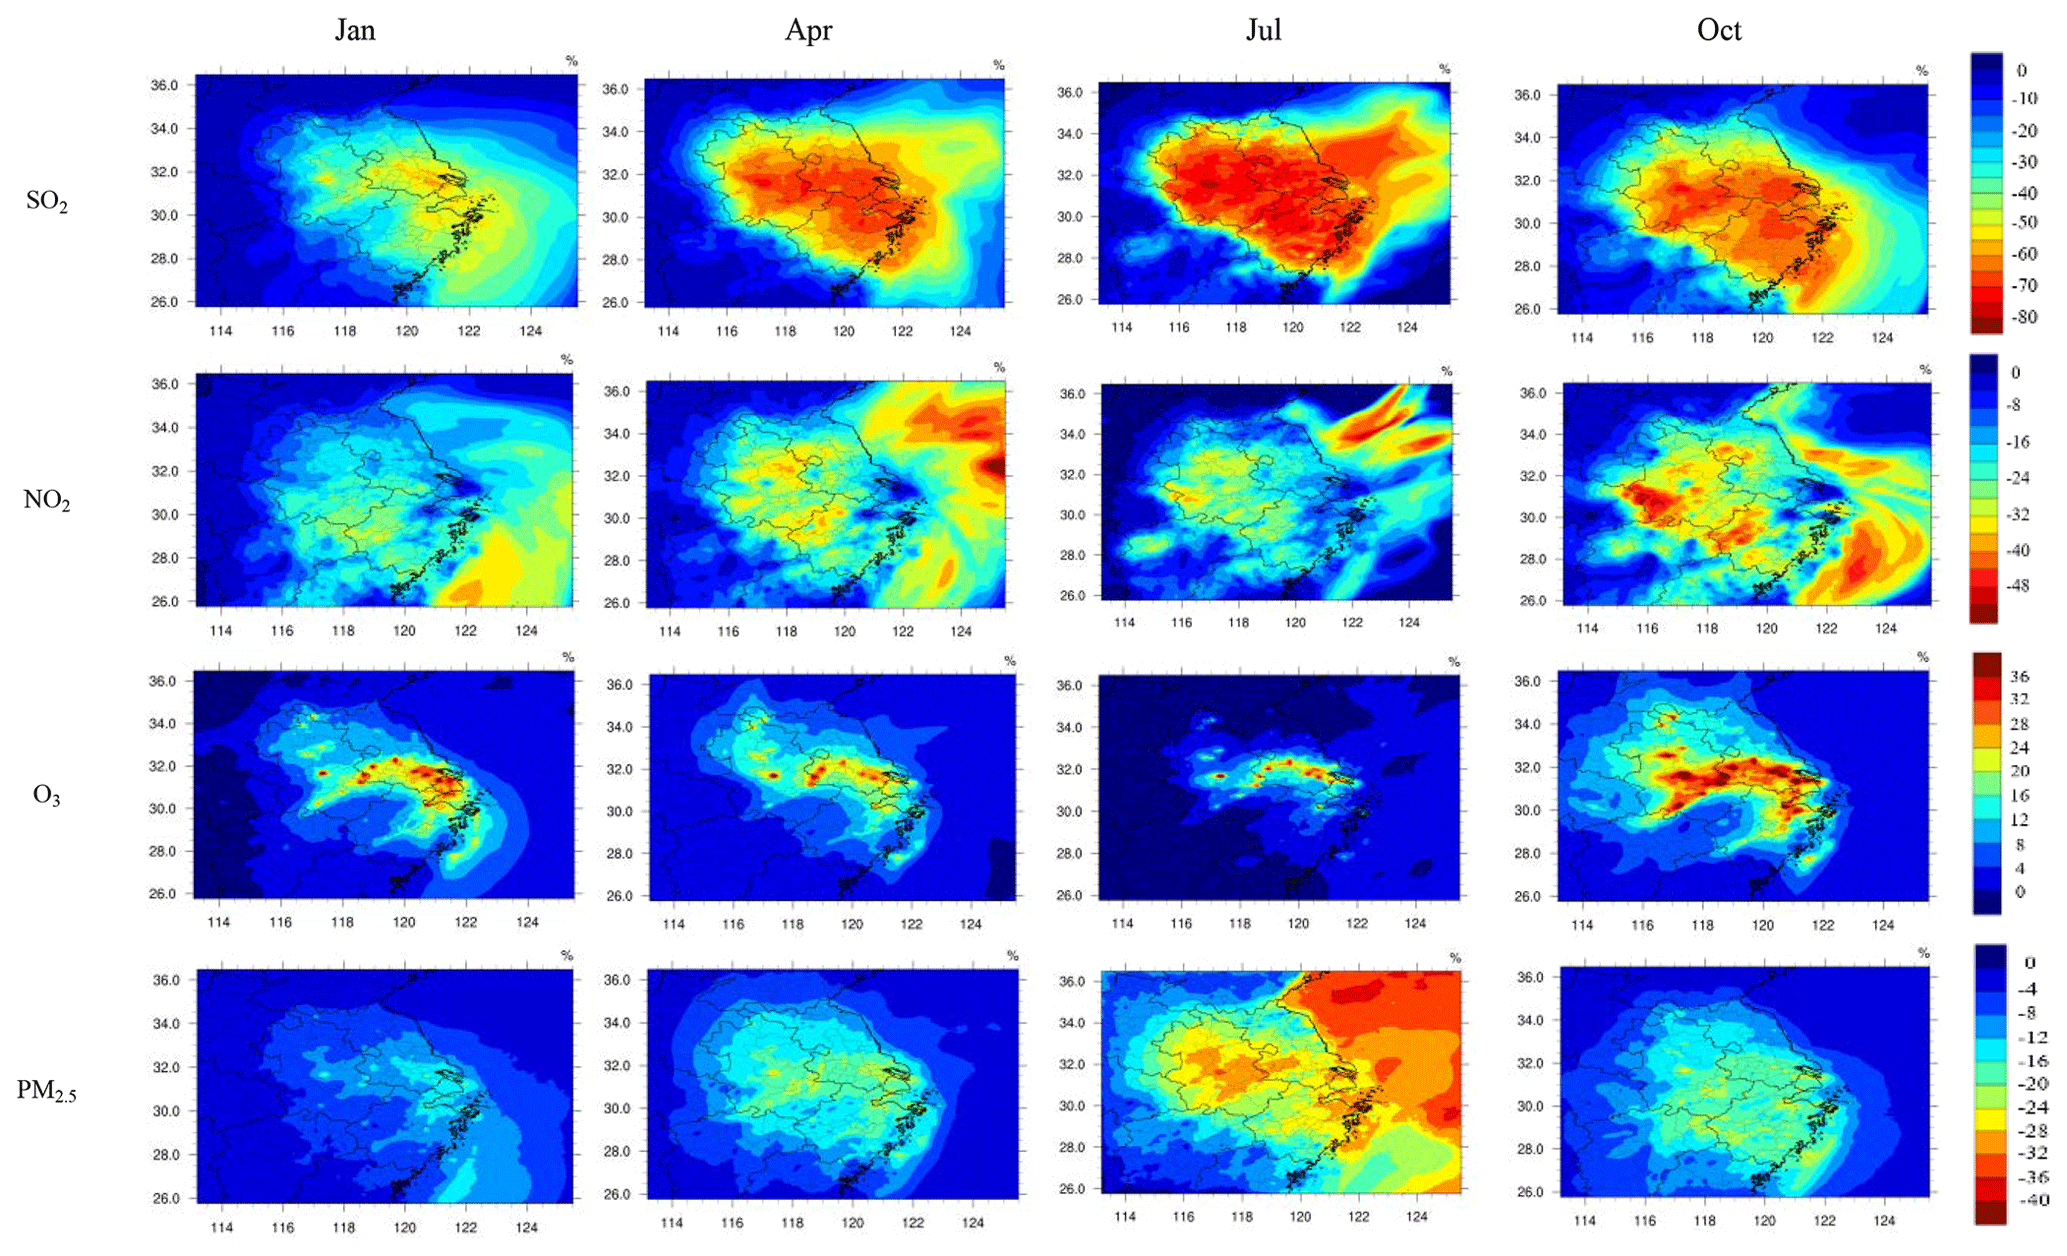
Figure 4The spatial distributions of the relative changes (%) in the simulated monthly SO2, NO2, O3, and PM2.5 concentrations between cases 2 and 4 in D2 ((case 4 − case 2) case 2).
3.1.2 Benefits of the ultra-low emission controls on air quality
Table 3 summarizes the absolute and relative changes of the simulated monthly concentrations of the concerned air pollutants in cases 3–5 compared to the base case (case 2). The average contributions of the power sector to the total ambient concentrations of SO2, NO2, and PM2.5 for the four simulated months are estimated at 10.0 %, 4.7 %, and 2.3 %, respectively, based on comparison of cases 2 and 5. The contributions to the concentrations were close to those of emissions at 10.7 %, 6.6 %, and 1.6 % for the three species (as indicated in Table 1), respectively. The larger power sector contribution to the ambient PM2.5 concentrations than to primary PM emissions reflects high emissions of precursors of secondary sulfate and nitrate aerosols. In general, limited contributions from the power sector were found for all concerned species except SO2, which is attributed to the gradually improved controls in the sector. The further implementation of the ultra-low emission policy in the sector, therefore, is expected to result in limited additional benefits for air quality. As shown in Table 3, the absolute changes of the simulated SO2, NO2, O3, and PM2.5 concentrations in case 3 compared to case 2 were all smaller than 1 µg m−3 for the 4 months. Larger changes were found for primary pollutants (SO2 and NO2) than for those of secondary ones (O3 and PM2.5): the simulated monthly concentrations of SO2 and NO2 were 2.7 %–6.1 % and 2.0 %–2.9 % lower, while PM2.5 was only 0.1 %–1.3 % lower and O3 0.8 %–2.2 % higher, respectively. Much larger benefits were found when the ultra-low emission policy was broadened from the power sector to the industrial sector (case 4), which is attributed to the dominant role of industry in air pollutant emissions in the YRD region (Table 1). The simulated monthly concentrations of SO2, NO2 and PM2.5 were 1.5–2.0, 2.5–3.7, and 4.6–6.5 µg m−3 lower compared to the base case, respectively, or reduction rates of 32.9 %–64.1 %, 16.4 %–22.8 %, and 6.2 %–21.6 %. In contrast, the simulated O3 concentration was 0.8–4.8 µg m−3 higher, with growth rates ranging 2.6 %–14.0 %. As mentioned earlier, the YRD was identified as a VOC-limited region, and reducing NOX emissions without any VOC controls would enhance O3 concentrations. Currently, CEMSs do not report VOC concentrations in the flue gas, and the ultra-low emission policy does not include a VOC limit, either. In order to alleviate regional air pollution including O3, coordinated controls of NOX and VOC emissions are urgently required. These would include measures to reduce large sources of VOCs, notably in industries other than the power industry such as the chemicals and refining industry and in solvent use (Zhao et al., 2017).
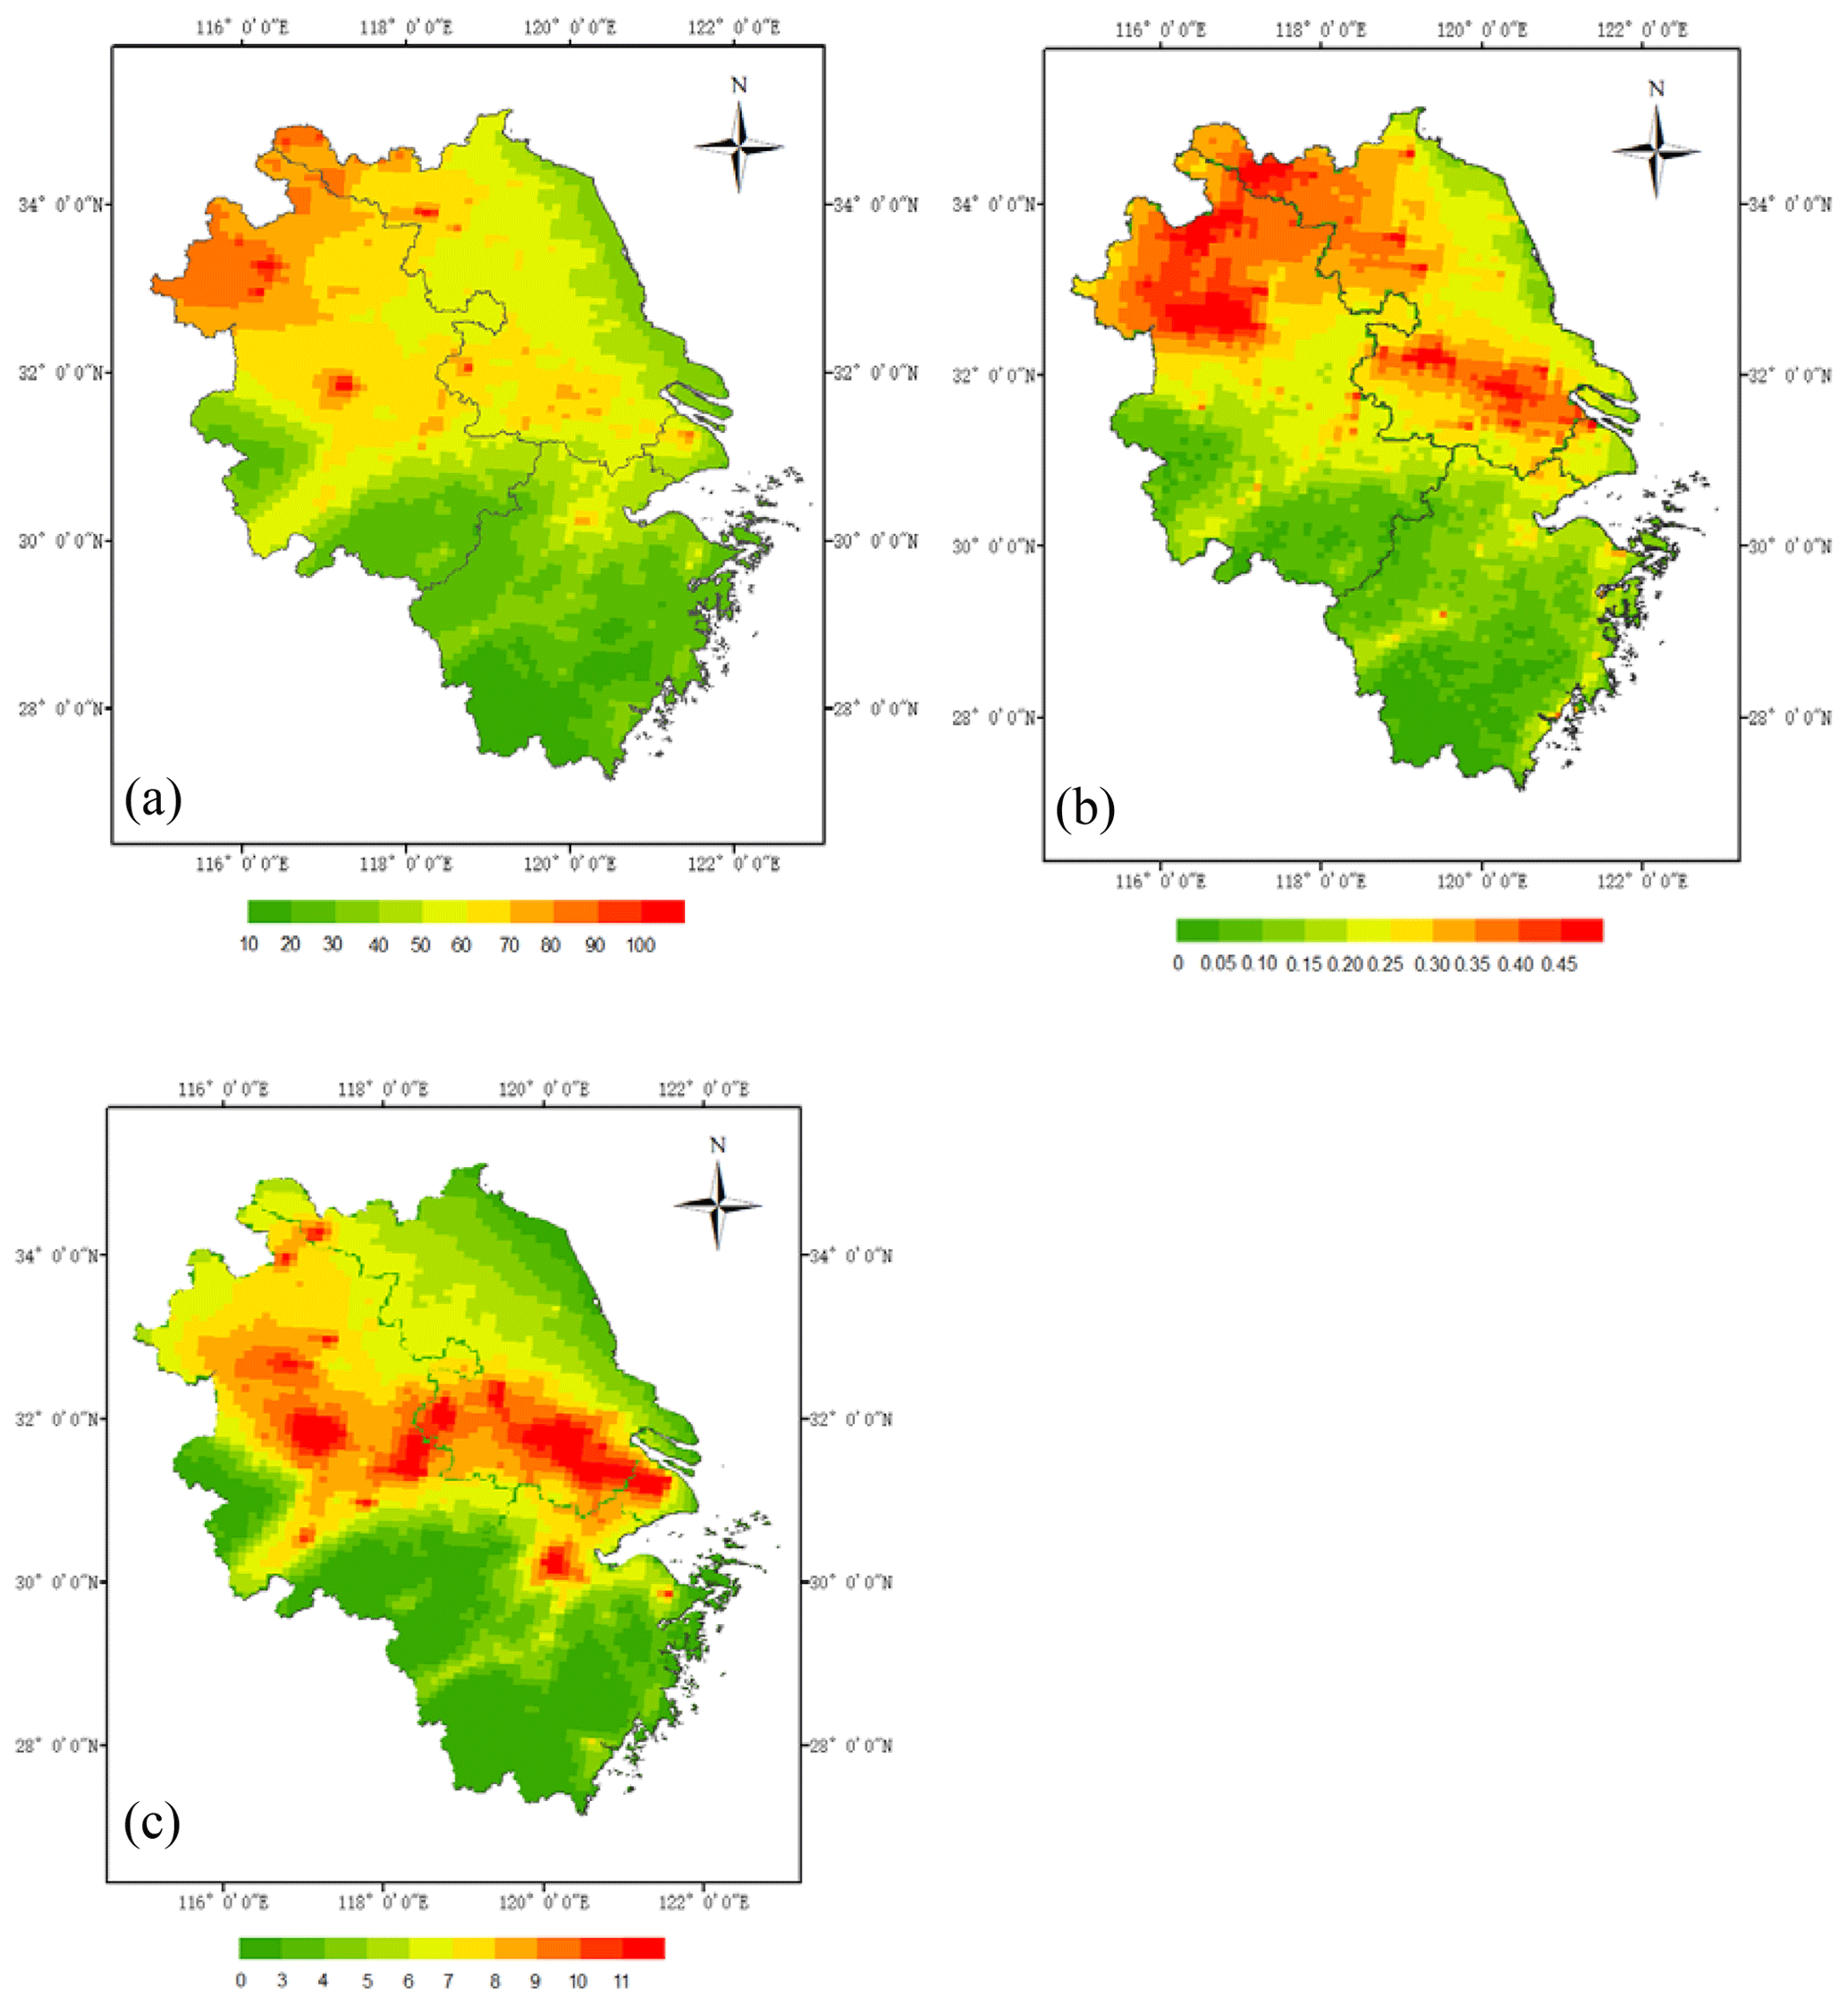
Figure 5The spatial distributions of the annual PM2.5 concentrations (average of January, April, July, and October) for case 2 (a) and the reduced annual PM2.5 concentrations for cases 3 (b) and 4 (c) in the YRD region (unit: µg m−3). Note the different color ranges in the panels for easier visualization.
The relative changes in the simulated pollutant concentrations varied by month, due to the combined influences of meteorology and secondary chemistry, and larger relative changes were found for SO2 and PM2.5 in summer. As shown in Table 3, for example, the average simulated PM2.5 concentrations in July were 0.4 and 6.5 µg m−3 lower, respectively, under cases 3 and 4 compared to case 2, with the larger reduction than other 3 months. This could result partly from the faster response of ambient concentrations to the changed emissions of air pollutants with shorter lifetimes in summer. The formation of secondary pollutants like PM2.5 would be enhanced in summer, with more oxidative atmospheric conditions under high temperature and strong sunlight. Moreover, the relatively low concentrations in summer also contributed to the largest percentage changes in SO2 and PM2.5 simulation for the season.
Figures 3 and 4 illustrate the spatial distributions of the relative changes of simulated pollutant concentrations in cases 3 and 4 compared to case 2, respectively. As shown in Fig. 3, the overall changes across the region due to ultra-low emission controls in the power sector only were less than 10 % for primary pollutants SO2 and NO2 and 5 % for secondary pollutants PM2.5 and O3. Larger changes in simulated SO2 concentrations were found in central and northern Anhui as well as central and southern Jiangsu, with relatively concentrated distribution of coal-fired power plants. The changes of simulated SO2 and NO2 in Shanghai were tiny, due to few remaining power plants subject to the ultra-low emission policy and thus few emission reductions. Compared to case 2, the SO2 and NOX emissions in case 3 were estimated to be 2.2 % and 0.8 % lower, respectively, for Shanghai, i.e., much smaller than for other provinces (6.1 % and 2.5 % for Anhui, 9.5 % and 4.4 % for Jiangsu, and 5.5 % and 2.7 % for Zhejiang). The results suggest that the potential of emission reduction and air quality improvement is limited from implementation of more stringent control measures in the power sector alone, particularly in highly developed cities where air pollution controls have already reached a relatively high level.
In case 4, where both power plants and selected industrial sources meet the ultra-low emission requirement, the average reduction rates of simulated SO2 and NO2 concentrations compared to case 2 were above 40 % and 25 %, respectively, for the whole region, and the changes of secondary pollutants O3 and PM2.5 were also significantly larger than those of case 3 in most of the region. The relative changes of SO2 were found to be more significant than other species, as the SO2 concentrations are greatly affected by primary emissions. Due to the large number and wide distribution of industrial plants throughout the YRD, moreover, there was little regional disparity in the changed ambient SO2 levels. Compared to other areas, the relatively less reduction in the simulated NO2 in central YRD resulted in significant enhancement of O3 concentrations (note that much more reduction in NO2 resulted in similar enhancement of O3 in southern Anhui for October). The comparison implies that the O3 formation in central YRD was more sensitive to NOX emission abatement than other VOC-limited regions in the YRD. The result suggests a particularly great challenge of O3 pollution control in central YRD, and more efforts on VOC emission abatement would be required for those developed areas.
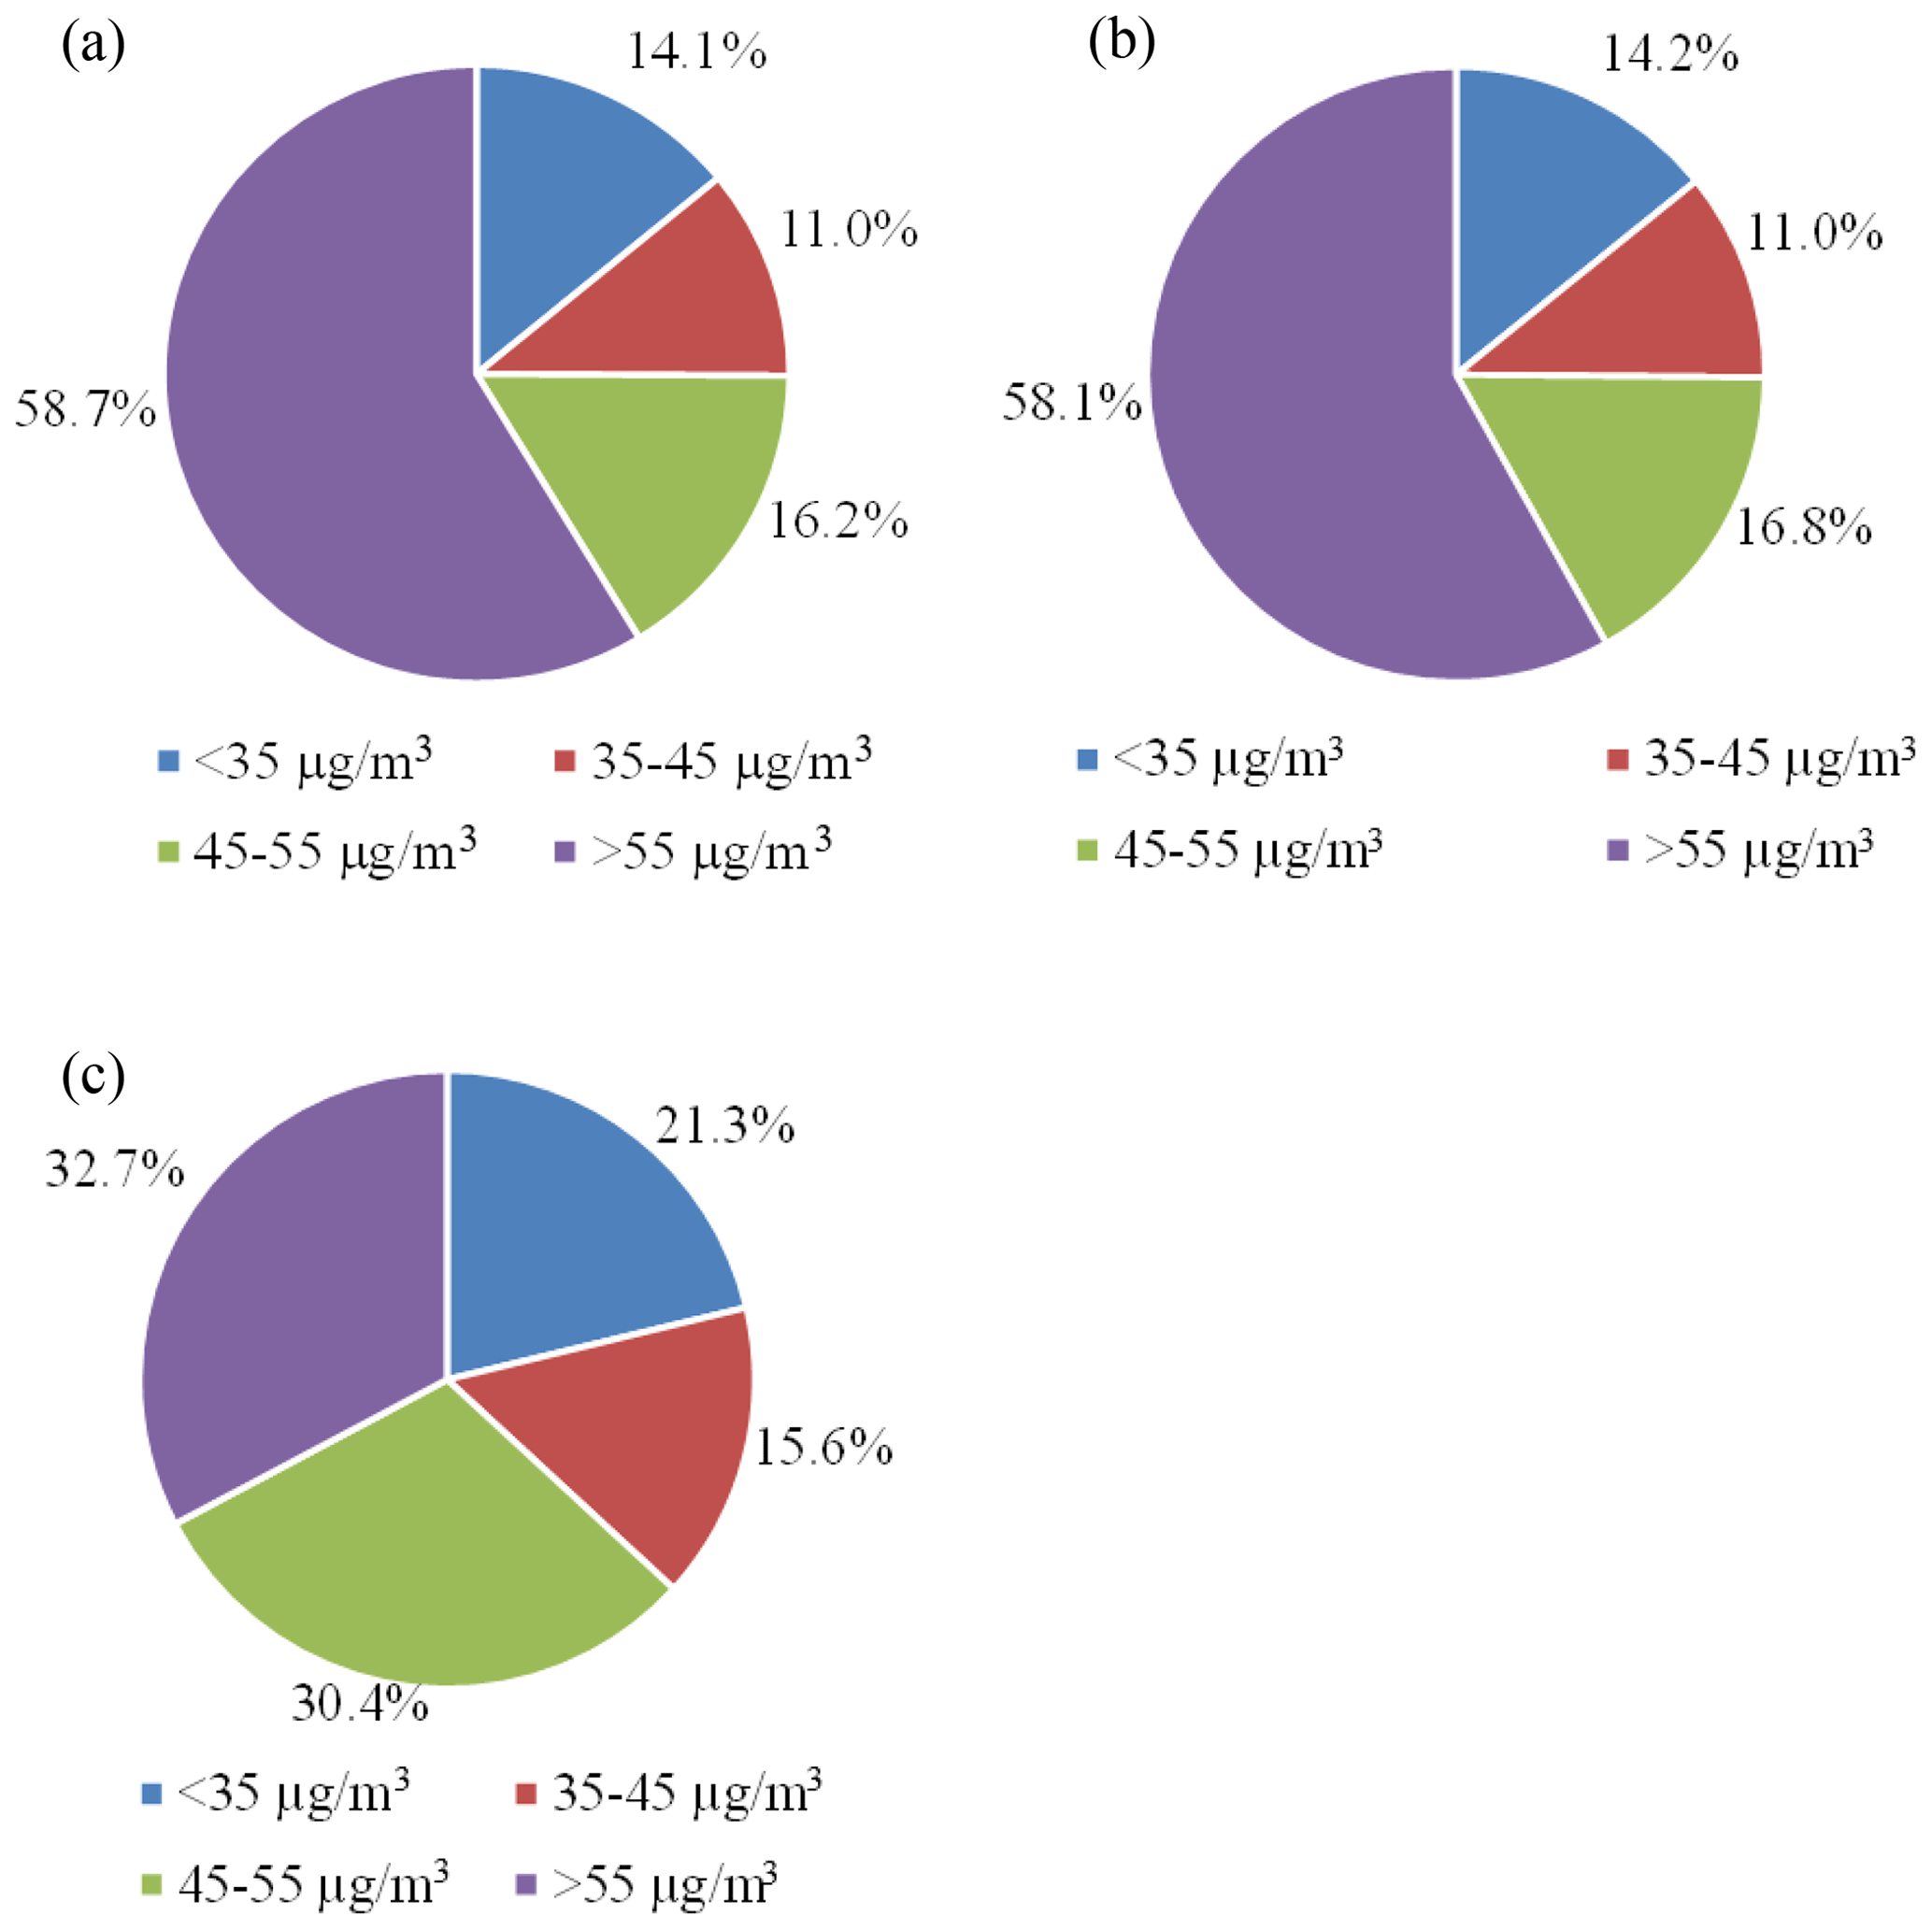
Figure 6The population fractions exposed to different levels of PM2.5 in the YRD region for cases 2 (a), 3 (b), and 4 (c).
3.2 Evaluation of health benefits
3.2.1 PM2.5 exposures in the YRD region
Figure 5 illustrates the spatial distributions of PM2.5 concentrations for the base case (case 2) and the differences of cases 3 and 4 compared to the base case. The reduction of PM2.5 concentrations from the implementation of the ultra-low emission policy in the power sector was less than 1 µg m−3 over the YRD region (Fig. 5b). Larger reductions (above 0.4 µg m−3) were found in northern Anhui and northern and southern Jiangsu provinces, as those regions are the energy base of eastern China, with abundant coal mines and power plants with large installed capacities. With the policy expanded to certain industrial sectors, the simulated average PM2.5 concentrations were 5.8 µg m−3 lower for the whole region (Fig. 5c). In particular, the difference was greater than 10 µg m−3 along the Yangtze River, as there are many industrial parks located along the river containing a large number of big cement, iron and steel, and chemical industry plants. Stringent emission controls at those plants would result in significant benefits in air quality for local residents.
We further calculated the fractions of the population with different annual average PM2.5 exposure levels in cases 2–4, as shown in Fig. 6. Compared to case 2, slight differences in the population distribution by exposure level were found in case 3, while the differences were much more significant in case 4. The population fractions exposed to the average annual concentrations of PM2.5 smaller than 35, 35–45, and 45–55 µg m−3 were estimated to grow from 14 % in case 2 to 21 % in case 4, from 11 % to 16 %, and from 16 % to 30 %, respectively (note that 35 µg m−3 is the annual PM2.5 concentration limit in the current National Ambient Air Quality Standard for China). Accordingly, the fraction exposed to PM2.5 concentrations larger than 55 µg m−3 declined from 59 % to 33 %. The implementation of ultra-low emission policy on both power plants and industry sources thus proved an effective way in limiting the population exposed to high PM2.5 levels.
Table 4The estimated mortality and YLL attributable to PM2.5 exposures in case 2 over the YRD region.
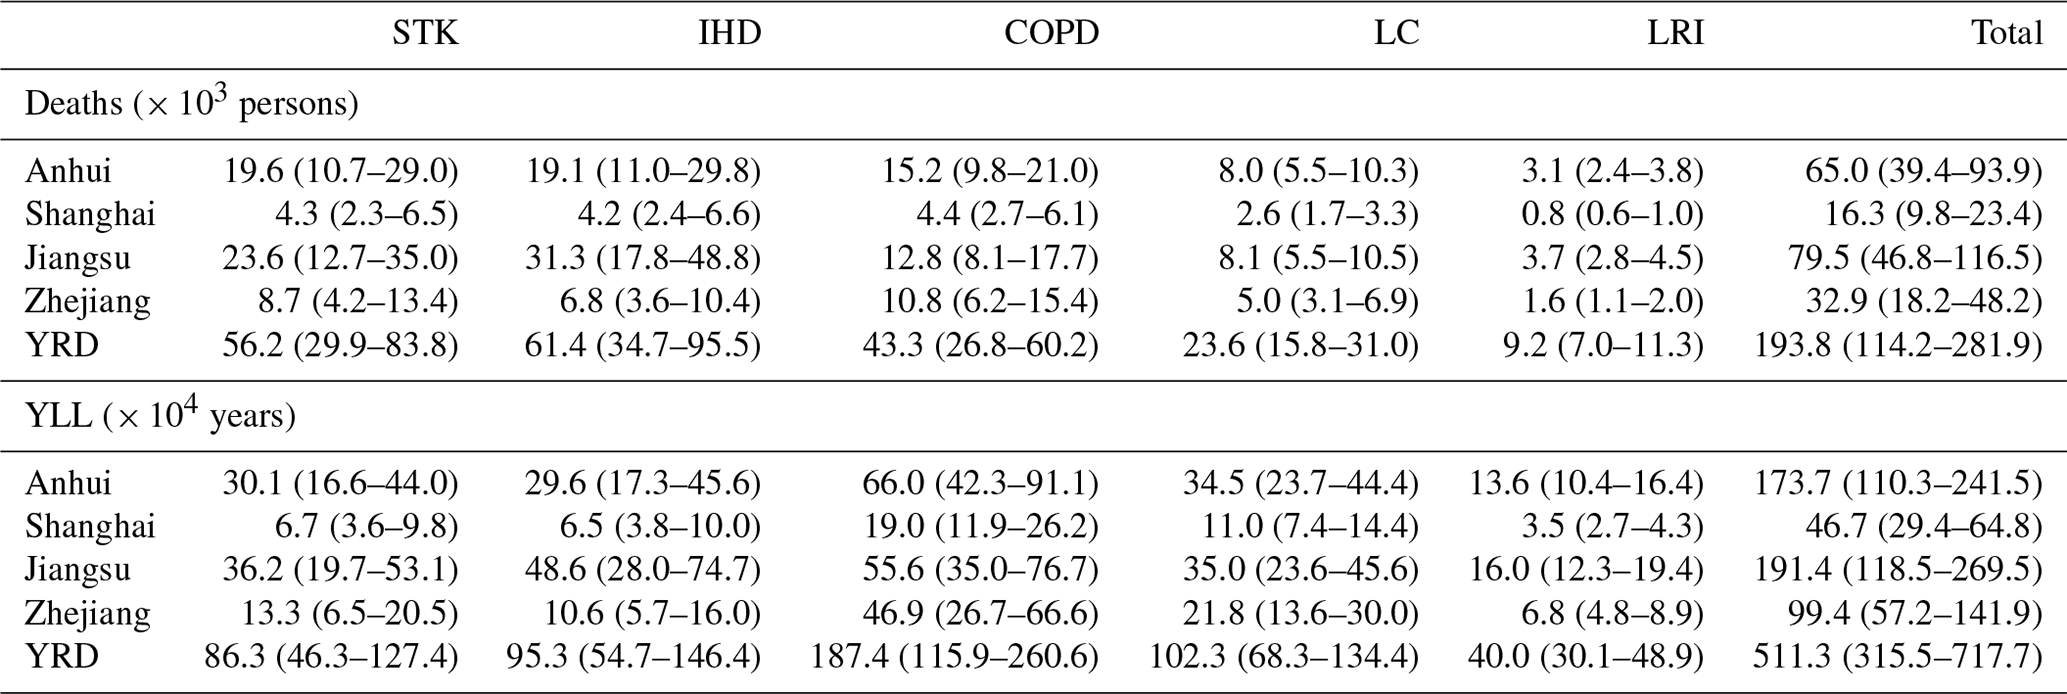
Figure 7The spatial distributions of the mortality (a) and YLL (b) attributable to PM2.5 exposure in case 2 at a horizontal resolution of 9 km.
3.2.2 Human health risk with base case emissions
The mortality and YLL caused by atmospheric PM2.5 exposure with the base case emissions (case 2) in the YRD region are shown in Table 4. The values in brackets represent the 95 % confidence interval (CI) attributed to the uncertainty of IER curves (i.e., uncertainties from other sources were excluded in the 95 % CI estimation such as air quality model mechanisms, emission inventories, and population data). With the base case emissions, the NMB of the simulated and observed annual PM2.5 concentrations (based on the four representative months) was calculated at −1.4 % for the YRD region. Therefore, the influence of the biases between the simulations and observations on the estimated health risks was negligible and thus not considered in this study. The total attributable deaths due to all diseases caused by PM2.5 exposure in the YRD region were estimated at 194 000 (114 000–282 000), with STK, IHD, and COPD causing the most deaths, accounting for 29 %, 32 %, and 22 % of the total, respectively. With larger populations in Anhui and Jiangsu (32 % and 37 % of the regional total, respectively), more deaths caused by PM2.5 exposure were found in these two provinces, at 34 % and 41 % of the total deaths, respectively. Among all the diseases, STK was found to cause the largest number of mortalities (19 600) in Anhui with PM2.5 exposure, IHD in Jiangsu (31 300), and COPD in Shanghai (4400) and Zhejiang (10 800). The total YLL caused by PM2.5 exposure in the YRD region was 5.11 million years (3.16–7.18 million years). More YLL caused by PM2.5 exposure was found in Anhui and Jiangsu, accounting for 34 % and 37 % of the total in the YRD region, respectively. YLL values caused by COPD were the largest in all the provinces, with 0.66 million, 0.19 million, 0.56 million, and 0.47 million years estimate for Anhui, Shanghai, Jiangsu, and Zhejiang, respectively. The spatial distribution of attributable deaths and YLL caused by PM2.5 exposure was basically consistent with that of population in the YRD region, with correlation coefficients of 0.94 and 0.96, respectively. As shown in Fig. 7, higher health risks attributed to PM2.5 pollution in the base case (case 2) were commonly found in the areas with larger population densities, including the areas along the Yangtze River, central Shanghai and some urban areas in Anhui. We further compared the population deaths attributable to PM2.5 exposure calculated in this study with the reported total deaths in provincial statistical yearbooks (AHBS, 2016; JSBS, 2016; SHBS, 2016; ZJBS, 2016) and found that the deaths caused by PM2.5 exposure accounted for 18 %, 14 %, 15 %, and 11 % of the total deaths in Anhui, Jiangsu, Shanghai, and Zhejiang, respectively, for 2015. The numbers were larger than the estimate (6.9 %) by Maji et al. (2018), which focused on 161 cities in China. As one of the most developed and industrialized regions in China, the YRD suffered higher PM2.5 pollution level than the national average, leading to the larger fraction of premature death due to PM2.5 exposure. Moreover, the baseline disease-specific mortality rates applied in this study (from GHDx) were commonly higher than those in Maji et al. (2018) except for LRI, resulting in the larger estimate of death rates exposed to PM2.5.
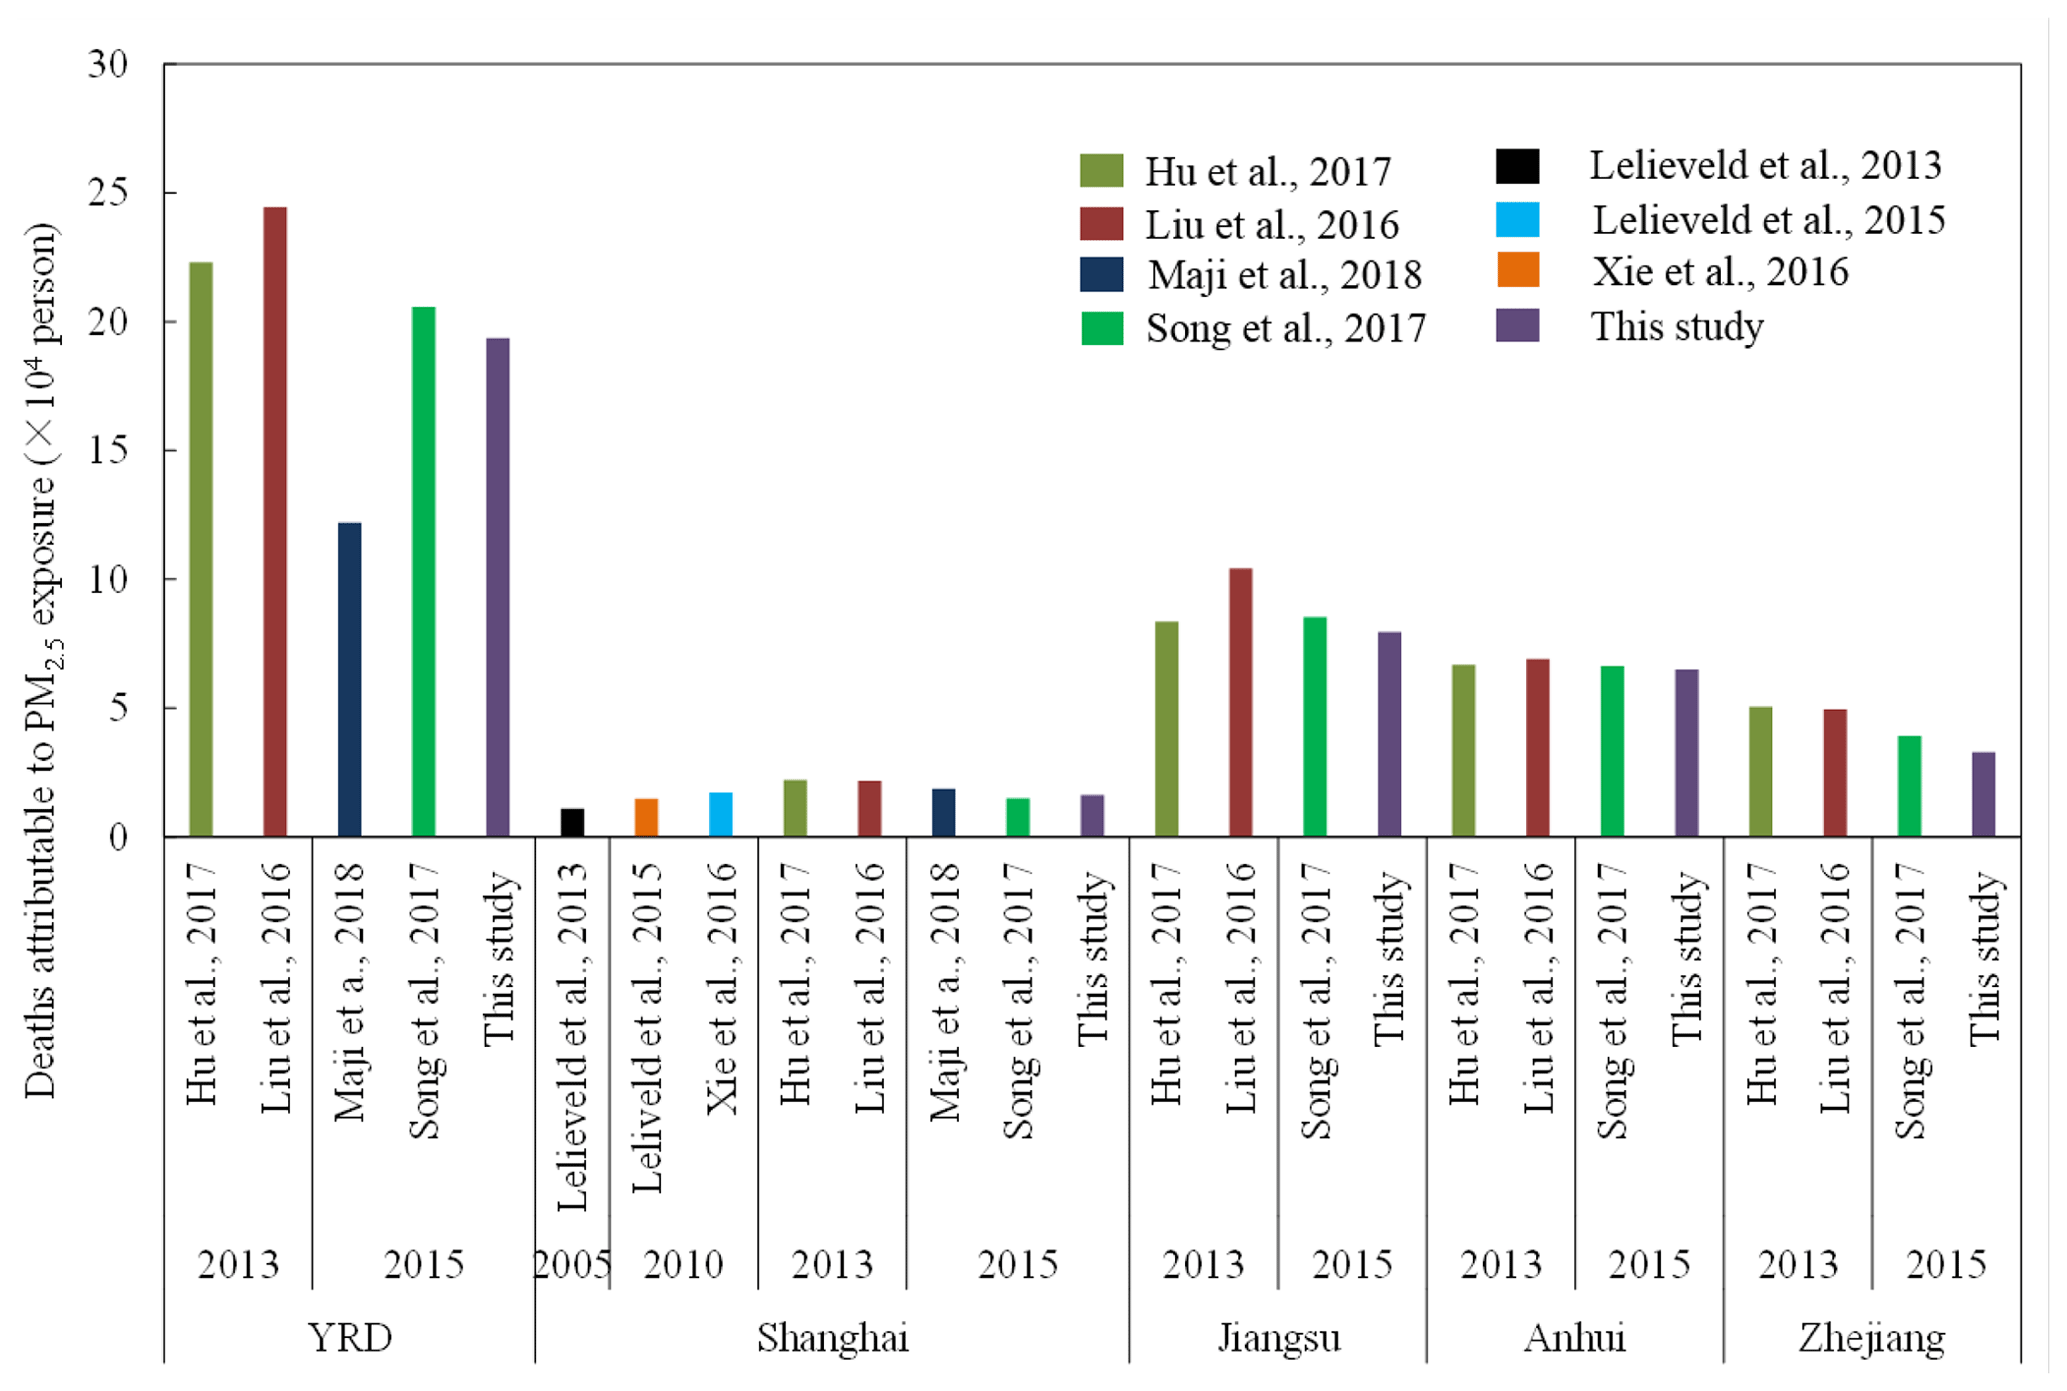
Figure 8Comparisons of the estimated mortality attributable to PM2.5 exposure in various studies for the YRD region.
Many studies have focused on the human health risks attributable to air pollution in China, with considerable disparities between them due to different estimation methods and health endpoints selected. Figure 8 compares the estimates of premature deaths caused by PM2.5 exposure in the YRD region in this and previous studies. Relatively close results are found between studies for the same regions and periods. For example, Hu et al. (2017) and Liu et al. (2016) estimated that the premature deaths of adults (> 30 years old) due to PM2.5 exposure were 223 000 and 245 000, respectively, in 2013 in the YRD region. However, the health endpoints in these two studies were not completely consistent. COPD, LC, IHD, and CEV (cerebrovascular disease) were selected in Hu et al. (2017), while COPD, LC, IHD, and STK were chosen by Liu et al. (2016). The deaths caused by PM2.5 exposure in Shanghai were estimated at 19 000, 15 000, and 16 000 in Maji et al. (2018), Song et al. (2017), and this study, respectively. The IER model and the same health endpoints were adopted in all three studies, while the PM2.5 concentrations were derived from ground observations in the former two studies instead of air quality simulation in this study. The premature deaths attributable to PM2.5 exposure in the YRD region in 2015 were estimated at 122 000 in Maji et al. (2018) and 194 000 in this study, respectively. Besides the different baseline mortality rates adopted in the two studies as mentioned earlier, the smaller estimate by Maji et al. (2018) could also result partly from inclusion of only typical cities instead of all cities in the YRD region. There are clear disparities in estimates of premature deaths for different years. For example, the death estimates caused by PM2.5 exposure in 2015 were generally smaller than those in 2013. As the population and age distributions remained relatively stable over the 2 years (AHBS, 2016; JSBS, 2016; SHBS, 2016; ZJBS, 2016), the reduced estimated premature deaths result to some extent from emission abatement and air quality improvement. According to relevant studies of Shanghai in particular (Lelieveld et al., 2013, 2015; Liu et al., 2016; Xie et al., 2016; Hu et al., 2017; Song et al., 2017; Maji et al., 2018), the premature deaths attributable to PM2.5 exposure increased from 2005 to 2013 and then declined afterwards, reflecting the health benefit of air pollution control measures in Shanghai in recent years.
Table 5The reduced attributable deaths (persons) and rates (in parentheses) resulting from implementation of the ultra-low emission policy in the YRD region.
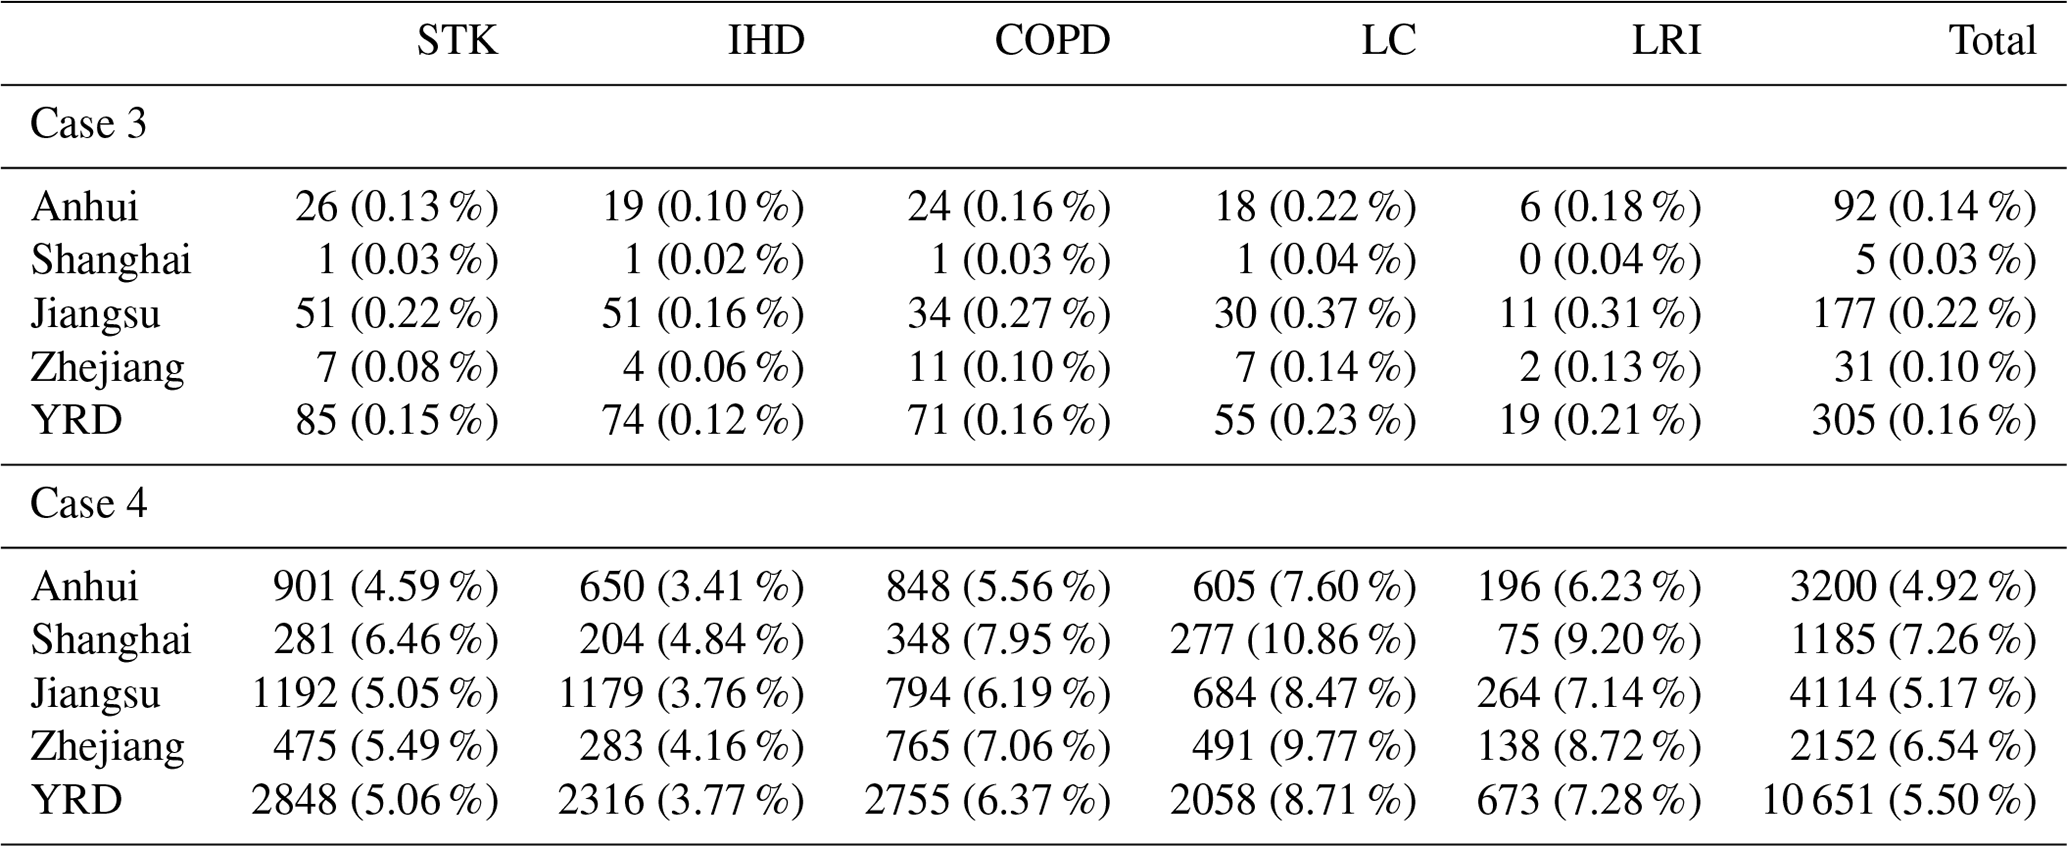
Table 6The reduced cases and rates (in parentheses) of YLL resulting from implementation of the ultra-low emission policy in the YRD region.

3.2.3 Benefits of emission controls on human health
Tables 5 and 6, respectively, summarize the avoided premature deaths and YLL by disease and region that would result from implementation of the ultra-low emission control policy and thereby reduced PM2.5 pollution in the YRD region. If only the coal-fired power sector met the ultra-low emission limits (case 3), nearly 305 premature deaths would be avoided compared to the base case emissions in 2015, with a tiny reduction rate of only 0.16 %. If the policy is strictly implemented for selected industrial sectors as well (case 4), 10 651 premature deaths could be avoided with a reduction rate at 5.50 %. The largest numbers of avoided premature deaths were found in Anhui and Jiangsu, accounting collectively for 88.2 % and 68.7 % of the total avoided deaths in cases 3 and 4, respectively. The greatest impacts from reduced PM2.5 concentrations were found for STK, of which the avoided deaths were calculated at 85 and 2848 in cases 3 and 4, respectively. The health effects of emission control policies in the YRD region have been investigated in previous studies. Using the IER model, Dai et al. (2019) chose the premature deaths from IHD, CEV, COPD, and LC as health endpoints and found that the Clean Air Action Plan would avoid 3439 deaths caused by PM2.5 exposure in Shanghai, which is more than those in both case 3 and case 4 in this study (5 and 1185, respectively). Applying environmental health risk and valuation methods, Li and Li (2018) found that 15 709 premature deaths attributable to air pollution could be avoided in 2015 if the PM2.5 concentrations in Jiangsu province were assumed to meet the National Ambient Air Quality Standard (GB3095-2012, 35 µg m−3 as the annual average). The estimate is much more than those calculated in case 3 and case 4 (177 and 4114 deaths, respectively). The larger health benefits estimated in those two studies result from their assumption of emission control measures covering a much wider range of sectors including energy, industry, transportation, construction, and agriculture, while only the ultra-low emission policy was assumed for the power and industry sectors in this study. The comparisons illustrate that the health benefits from emission control in the power sector alone is limited, and that controls in other sectors are essential. In addition, the different methods and inconsistent data sources partly led to the discrepancies. For the particle exposure estimation, as an example, Dai et al. (2019) adopted the BENMAP-CE model (Environmental Benefits Mapping and Analysis Program – Community Edition; Yang et al., 2013) to simulate the ambient PM2.5 concentrations, while Li and Li (2018) used the average of monitored PM2.5 concentrations. As shown in Table 6, the avoided YLL values for case 3 and case 4 were estimated at 8744 and 316 562 years, respectively, compared to the base case, confirming again the greatly improved health benefits from implementation of ultra-low emission policy for the industry sector in addition to the power sector. The largest avoided YLL values were found in Anhui and Jiangsu in the YRD region, accounting collectively for 86 % and 65 % of the total avoided YLL in cases 3 and 4, respectively. Compared to case 3, the fractions of Shanghai and Zhejiang to total YRD for both avoided deaths (Table 5) and YLL (Table 6) values were clearly higher in case 4, implying a greater health benefit of emission controls at industry sources in these relatively industrialized urban regions. The reduced PM2.5 concentrations led to the largest avoided YLL of COPD in both cases (3118 and 119 300 years in cases 3 and 4, respectively).
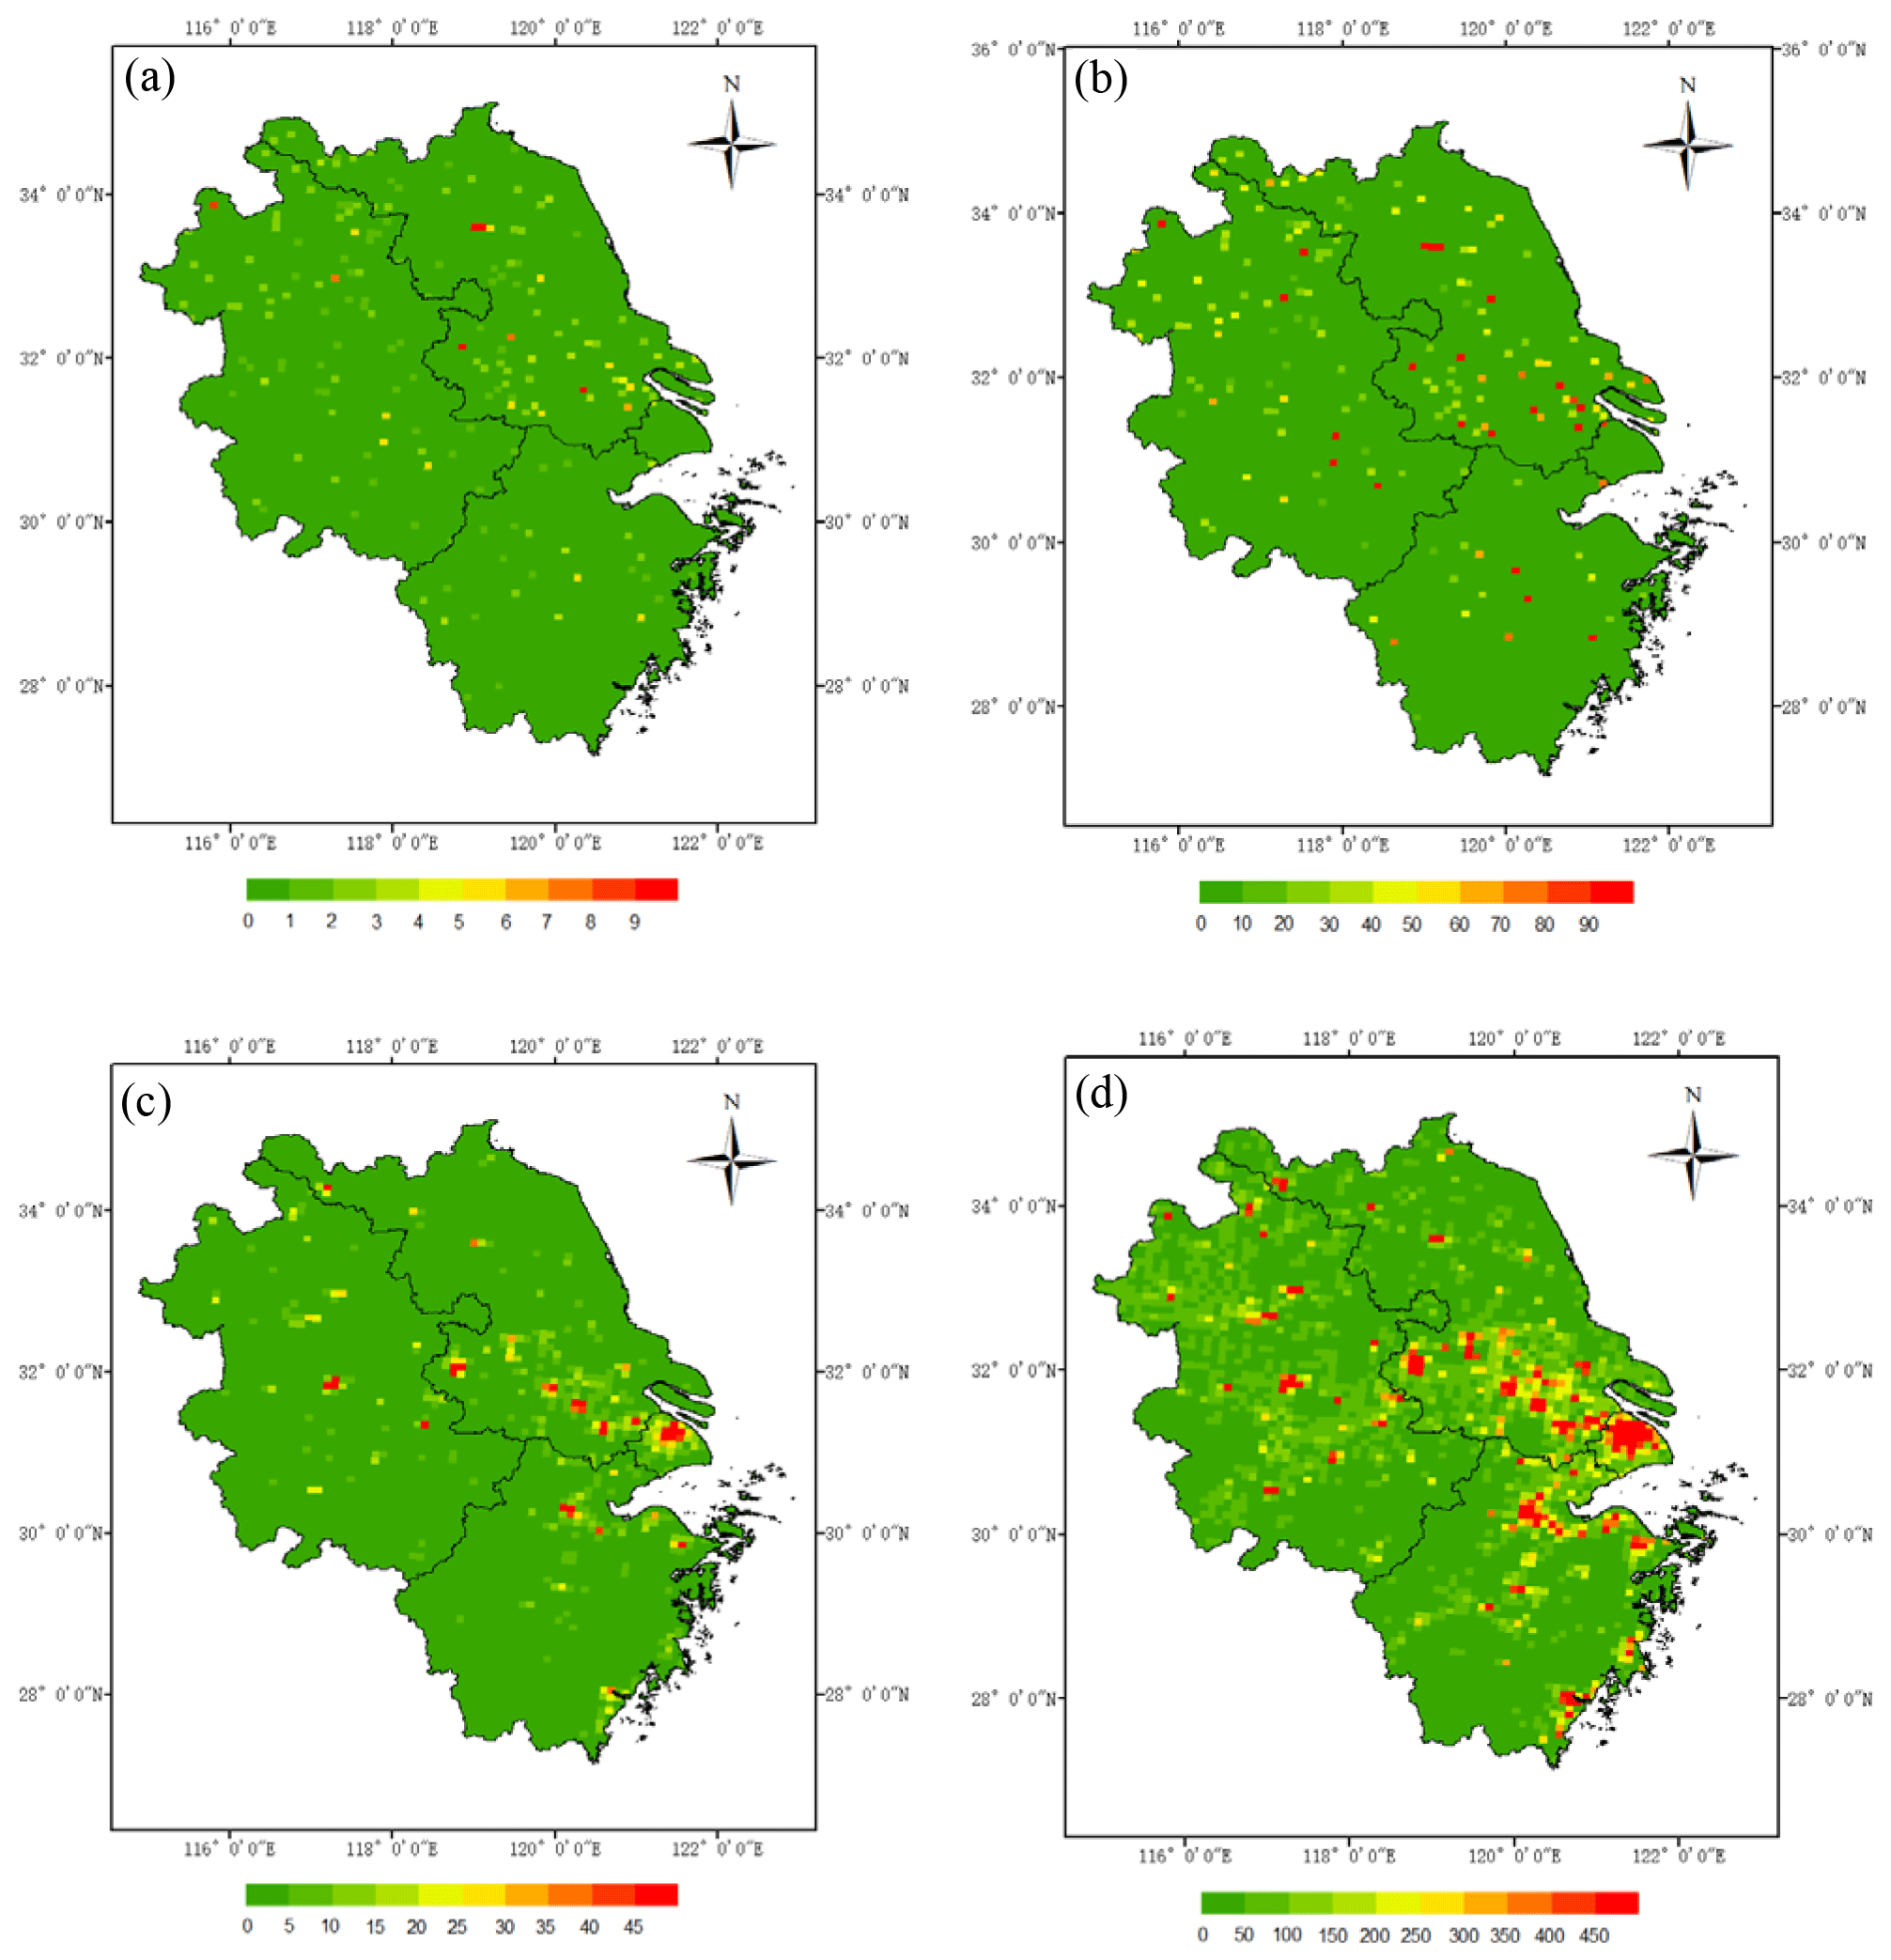
Figure 9The spatial distributions of the avoided deaths and YLL attributable to the reduced PM2.5 exposure with ultra-low emission policy implementation at a horizontal resolution of 9 km. Note the different color ranges in the panels for easier visualization.
Figure 9 illustrates the spatial distributions of the avoided deaths and YLL from the ultra-low emission policy in the YRD region. When the policy was implemented only for coal-fired power plants, the health benefits were small and the regional differences relatively insignificant, with the avoided deaths and YLL smaller than 10 persons and 100 years, respectively, for all of the grid cells (Fig. 9a and b). When the policy was implemented both in power and industry sectors, more avoided deaths (> 40 person per grid cell) and YLL (> 400 years per grid cell) were found in northern Anhui, southern Jiangsu, central Shanghai, and northern Zhejiang (Fig. 9c and d). The spatial correlation coefficient between the avoided YLL in case 4 and population was 0.93, indicating that the implementation of the emission control policy would lead to greater health benefits for areas with intensive economic activity and dense populations.
We evaluated the improvement of emission estimation by incorporating CEMS data for the power sector, and we explored the air quality and health benefits from the ultra-low emission control policy for the YRD region through air quality modeling. In general, the bias between ground observations and simulations based on the emission inventory with CEMS data incorporated was smaller than that without, suggesting that appropriate use of online monitoring information helped improve the emission estimation and model performance. Compared to the base case in which CEMS data were incorporated in emission estimation, the simulated monthly concentrations of all the concerned species (SO2, NO2, O3, and PM2.5) differed less than 7 % when the ultra-low emission policy was enacted only in the coal-fired power sector, given its small fraction of total emissions. When the policy was implemented for selected industrial sectors as well, larger differences in air quality from the base case were found, with the simulated concentrations of SO2, NO2, and PM2.5, respectively, 33 %–64 %, 16 %–23 %, and 6 %–22 % lower with O3 3 %–14 % higher, depending on the month.
Nearly 305 premature deaths and 8744 years of YLL would be avoided if the policy were implemented for the power sector alone, and benefits would reach 10 651 premature deaths and 316 562 YLL avoided with the policy enacted for both power and industrial sectors. The study revealed the limited potential for further emission reduction and air quality improvement via controls in the power sector alone. Along with stringent emission control in that sector, the coordinated control of emissions from industrial sources (other than the power industry) would be essential to effectively improve air quality and reduce associated human health risks. Moreover, more attention needs to be paid to control of VOCs to limit O3 formation resulting from reduction of NOX in the region.
All data in this study are available from the authors upon request.
The supplement related to this article is available online at: https://doi.org/10.5194/acp-21-6411-2021-supplement.
YZhang developed the strategy and methodology of the work and wrote the draft. YZhao improved the methodology and revised the article. MG provided useful comments on the health risk analysis. XB provided emission monitoring data. CPN revised the article.
The authors declare that they have no conflict of interest.
This work was sponsored by the Natural Science Foundation of China (41922052 and 91644220), National Key Research and Development Program of China (2017YFC0210106), a Harvard Global Institute award to the Harvard-China Project on Energy, Economy and Environment, and the Key Program for Coordinated Control of PM2.5 and Ozone for Jiangsu Province (2019023). We would also like to thank Tsinghua University for the free use of national emissions data (MEIC).
This research has been supported by the National Natural Science Foundation of China (grant nos. 41922052 and 91644220), the National Key Research and Development Program of China (grant no. 2017YFC0210106), and the Key Program for Coordinated Control of PM2.5 and Ozone for Jiangsu Province (2019023).
This paper was edited by Min Shao and reviewed by three anonymous referees.
An, X., Sun, Z., Lin, W., Jin, M., and Li, N.: Emission inventory evaluation using observations of regional atmospheric background stations of China, J. Environ. Sci., 25, 537–536, 2013.
AHBS (Anhui Bureau of Statistics): Statistical Yearbook of Anhui, China Statistics Press, Beijing, 2016 (in Chinese).
Baker, K., Johnson, M., and King, S.: Meteorological modeling performance summary for application to PM2.5/haze/ozone modeling projects, Lake Michigan Air Directors Consortium, Midwest Regional Planning Organization, Des Plaines, Illinois, USA, 57 pp., 2004.
Burnett, R., Chen, H., Szyszkowicz, M., Fann, N., Hubbell, B., Pope III, C. A., Apte, J. S., Brauer, M., Cohen, A., Weichenthal, S., Coggins, J., Di, Q., Brunekreef, B., Frostad, J., Lim, S. S., Kan, H., Walker, K. D., Thurston, G. D., Hayes, R. B., Lim, C. C., Turner, M. C., Jerrett, M., Krewski, D., Gapstur, S. M., Diver, W. R., Ostro, B., Goldberg, D., Crouse, D. L., Martin, R. V., Peters, P., Pinault, L., Tjepkema, M., van Donkelaar, A., Villeneuve, P. J., Miller, A. B., Yin, P., Zhou, M., Wang, L., Janssen, N. A. H., Marra, M., Atkinson, R. W., Tsang, H., Thach, T. Q, Cannon, J. B., Allen, R. T., Hart, J. E., Laden, F., Cesaroni, G., Forastiere, F., Weinmayr, G., Jaensch, A., Nagel, G., Concin, H., and Spadaro, J. V.: Global estimates of mortality associated with long-term exposure to outdoor fine particulate matter, P. Natl. Acad. Sci. USA, 115, 9592–9597, https://doi.org/10.1073/pnas.1803222115, 2018.
Butt, E. W., Turnock, S. T., Rigby, R., Reddington, C. L., Yoshioka, M., Johnson, J. S., Regayre, L. A., Pringle, K. J., Mann, G. W., and Spracklen, D. V.: Global and regional trends in particulate air pollution and attributable health burden over the past 50 years, Environ. Res. Lett., 12, 104017, https://doi.org/10.1088/1748-9326/aa87be, 2017.
Chang, X., Wang, S., Zhao, B., Xing, J., Liu, X., Wei, L., Song, Y., Wu, W., Cai, S., Zheng, H., Ding, D., and Zheng, M.: Contributions of inter-city and regional transport to PM2.5 concentrations in the Beijing-Tianjin-Hebei region and its implications on regional joint air pollution control, Sci. Total. Environ., 660, 1191–1200, https://doi.org/10.1016/j.scitotenv.2018.12.474, 2019.
Cohen, A. J., Brauer, M., Burnett, R., Anderson, H. R., Frostad, J., Estep, K., Balakrishnan, K., Brunekreef, B., Dandona, L., Dandona, R., Feigin, V., Freedman,G., Hubbell, B., Jobling, A., Kan, H., Knibbs, L., Liu, Y., Randall M; Morawska, L., Pope, C. A., Shin, H., Straif, K., Shaddick, G., Thomas, M., Dingenen, R. V., Donkelaar, A. V., Vos, T., Murray, C. J. L., and Forouzanfar, M. H.: Estimates and 25-year trends of the global burden of disease attributable to ambient air pollution: an analysis of data from the Global Burden of Diseases Study 2015, Lancet, 389, 1907–1918, 2017.
Dai, H. X., An, J. Y., Li, L., Huang, C., Yan, R. S., Zhu, S. H., Ma, Y. G., Song, W. M., and Kan, H. D.: Health Benefit Analyses of the Clean Air Action Plan Implementation in Shanghai, Huan Jing Ke Xue, 40, 24–32, https://doi.org/10.13227/j.hjkx.201804201, 2019 (in Chinese).
Dockery, D. W., Pope, C. A., Xu, X. P., Spengler, J. D., Ware, J. H., Fay, M. E., Ferris, B. G., and Speizer, F. E.: An Assocation between air-pollution and mortality in 6 United-States cities, N. Engl. J. Med., 329, 1753–1759, https://doi.org/10.1056/nejm199312093292401, 1993.
Emery, C., Tai, E., and Yarwood, G.: Enhanced meteorological modeling and performance evaluation for two Texas episodes, Report to the Texas Natural Resources Conservation Commission, prepared by ENVIRON, International Corp, Novato, CA, 2001.
Fu, J. S., Jang, C. J., Streets, D. G., Li, Z., Kwok, R., Park, R., and Han, Z.: MICS-Asia II: Modeling gaseous pollutants and evaluating an advanced modeling system over East Asia, Atmos. Environ., 42, 3571–3583, https://doi.org/10.1016/j.atmosenv.2007.07.058, 2008.
Gao, J., Wang, T., Ding, A. J., and Liu, C. B.: Observational study of ozone and carbon monoxide at the summit of mount Tai (1534 m a.s.l.) in central-eastern China, Atmos. Environ., 39, 4779–4791, https://doi.org/10.1016/j.atmosenv.2005.04.030, 2005.
Gao, J. H., Zhu, B., Xiao, H., Kang, H. Q., Hou, X. W., and Shao, P.: A case study of surface ozone source apportionment during a high concentration episode, under frequent shifting wind conditions over the Yangtze River Delta, China, Sci. Total Environ., 544, 853–863, 2016.
Gao, M., Beig, G., Song, S., Zhang, H., Hu, J., Ying, Q., Liang, F., Liu, Y., Wang, H., Lu, X., Zhu, T., Carmichael, G. R., Nielsen, C. P., and McElroy, M. B.: The impact of power generation emissions on ambient PM2.5 pollution and human health in China and India, Environ. Int., 121, 250–259, https://doi.org/10.1016/j.envint.2018.09.015, 2018.
Gleser, L. J.: Bootstrap confidence intervals, Stat. Sci., 11, 219–221, 1996.
Guenther, A. B., Jiang, X., Heald, C. L., Sakulyanontvittaya, T., Duhl, T., Emmons, L. K., and Wang, X.: The Model of Emissions of Gases and Aerosols from Nature version 2.1 (MEGAN2.1): an extended and updated framework for modeling biogenic emissions, Geosci. Model Dev., 5, 1471–1492, https://doi.org/10.5194/gmd-5-1471-2012, 2012.
Han, K. M., Lee, S., Chang, L. S., and Song, C. H.: A comparison study between CMAQ-simulated and OMI-retrieved NO2 columns over East Asia for evaluation of NOx emission fluxes of INTEX-B, CAPSS, and REAS inventories, Atmos. Chem. Phys., 15, 1913–1938, https://doi.org/10.5194/acp-15-1913-2015, 2015.
He, J. J., Yu, Y., Yu, L. J., Liu, N., and Zhao, S. P.: Impacts of uncertainty in land surface information on simulated surface temperature and precipitation over China, Int. J. Climatol., 37, 829–847, https://doi.org/10.1002/joc.5041, 2017.
Hoek, G., Krishnan, R. M., Beelen, R., Peters, A., Ostro, B., Brunekreef, B., and Kaufman, J. D.: Long-term air pollution exposure and cardio- respiratory mortality: a review, Environ. Health, 12, 43, https://doi.org/10.1186/1476-069x-12-43, 2013.
Hu, J., Huang, L., Chen, M., Liao, H., and Ying, Q.: Premature mortality attributable to particulate matter in China: source contributions and responses to reductions, Environ. Sci. Technol., 51, 9950–9959, 2017.
Huang, C., Chen, C. H., Li, L., Cheng, Z., Wang, H. L., Huang, H. Y., Streets, D. G., Wang, Y. J., Zhang, G. F., and Chen, Y. R.: Emission inventory of anthropogenic air pollutants and VOC species in the Yangtze River Delta region, China, Atmos. Chem. Phys., 11, 4105–4120, https://doi.org/10.5194/acp-11-4105-2011, 2011.
Huang, K., Fu, J., Gao, Y., Dong, X., Zhuang, G., Yang, G., and Lin, Y.: Role of sectoral and multi-pollutant emission control strategies in improving atmospheric visibility in the Yangtze river delta, china, Environ. Pollut., 184, 426–434, 2014.
JSBS (Jiangsu Bureau of Statistics): Statistical Yearbook of Jiangsu, China Statistics Press, Beijing, 2016 (in Chinese).
Lei, Y., Xue, W. B., Zhang, Y. S., and Xu, Y. L.: Health benefit evaluation for air pollution prevention and control action plan in China, Chinese Environ. Manage., 5, 50–53, https://doi.org/10.16868/j.cnki.1674-6252.2015.05.009, 2015 (in Chinese).
Lelieveld, J., Barlas, C., Giannadaki, D., and Pozzer, A.: Model calculated global, regional and megacity premature mortality due to air pollution, Atmos. Chem. Phys., 13, 7023–7037, https://doi.org/10.5194/acp-13-7023-2013, 2013.
Lelieveld, J., Evans, J. S., Fnais, M., Giannadaki, D., and Pozzer, A.: The contribution of outdoor air pollution sources to premature mortality on a global scale, Nature, 525, 367-371, https://doi.org/10.1038/nature15371, 2015.
Li, H. J. and Li, M. Q.: Assessment on health benefit of air pollution control in Jiangsu province, Chinese Public Health, 34, 12, https://doi.org/10.11847/zgggws1117789, 2018 (in Chinese).
Li, L., Chen, C. H., Fu, J. S., Huang, C., Streets, D. G., Huang, H. Y., Zhang, G. F., Wang, Y. J., Jang, C. J., Wang, H. L., Chen, Y. R., and Fu, J. M.: Air quality and emissions in the Yangtze River Delta, China, Atmos. Chem. Phys., 11, 1621–1639, https://doi.org/10.5194/acp-11-1621-2011, 2011.
Li, L., Chen, C. H., Huang, C., Huang, H. Y., Zhang, G. F., Wang, Y. J., Wang, H. L., Lou, S. R., Qiao, L. P., Zhou, M., Chen, M. H., Chen, Y. R., Streets, D. G., Fu, J. S., and Jang, C. J.: Process analysis of regional ozone formation over the Yangtze River Delta, China using the Community Multi-scale Air Quality modeling system, Atmos. Chem. Phys., 12, 10971–10987, https://doi.org/10.5194/acp-12-10971-2012, 2012.
Li, L., An, J. Y., and Lu, Q.: Modeling Assessment of PM2.5 Concentrations Under implementation of Clean Air Action Plan in the Yangtze River Delta Region, Res. Environ. Sci., 28, 1653–1661, https://doi.org/10.13198/j.issn.1001-6929.2015.11.01, 2015 (in Chinese).
Li, M., Zhang, D., Li, C.-T., Selin, N. E., and Karplus, V. J.: Co-benefits of China's climate policy for air quality and human health in China and transboundary regions in 2030, Environ. Res. Lett., 14, 084006, https://doi.org/10.1088/1748-9326/ab26ca, 2019.
Liao, J. B., Wang, T. J., Jiang, Z. Q., Zhuang, B. L., Xie, M., Yin, C. Q., Wang, X. M.., Zhu, J. L., Fu, Y., and Zhang, Y.: WRF/Chem modeling of the impacts of urban expansion on regional climate and air pollutants in Yangtze River Delta, China, Atmos. Environ., 106, 204–214, https://doi.org/10.1016/j.atmosenv.2015.01.059, 2015.
Lim, S. S., Vos, T., Flaxman, A. D., Danaei, G., Shibuya, K., Adair-Rohani, H., AlMazroa, M. A., Amann, M., Anderson, H. R., Andrews, K. G., Aryee, M., Atkinson, C., Bacchus, L. J., Bahalim, A. N., Balakrishnan, K., Balmes, J., Barker-Collo, S., Baxter, A., Bell, M. L., Blore, J. D., Blyth, F., Bonner, C., Borges, G., Bourne, R., Boussinesq, M., Brauer, M., Brooks, P., Bruce, N. G., Brunekreef, B., Bryan-Hancock, C., and Buc, C.: A comparative risk assessment of burden of disease and injury attributable to 67 risk factors and risk factor clusters in 21 regions, 1990–2010: a systematic analysis for the Global Burden of Disease Study 2010, Lancet, 380, 2224–2260, 2012.
Liu, J., Han, Y., Tang, X., Zhu, J., and Zhu, T.: Estimating adult mortality attributable to PM2.5 exposure in China with assimilated PM2.5 concentrations based on a ground monitoring network, Sci. Total Environ., 568, 1253–1262, 2016.
Liu, X., Gao, X., Wu, X., Yu, W., Chen, L., Ni, R., Zhao, Y., Duan, H., Zhao, F., Chen, L., Gao, S., Xu, K., Lin, J., and Ku, A. Y.: Updated Hourly Emissions Factors for Chinese Power Plants Showing the Impact of Widespread Ultralow Emissions Technology Deployment, Environ. Sci. Technol., 53, 2570–2578, https://doi.org/10.1021/acs.est.8b07241, 2019.
Liu, X. H., Zhang, Y., Xing, J., Zhang, Q., Wang, K., Streets, D. G., Jiang, C., Wang, W. X., and Hao, J. M.: Understanding of regional air pollution over China using CMAQ, part II. Process analysis and sensitivity of ozone and particulate matter to precursor emissions, Atmos. Environ., 44, 3719–3727, https://doi.org/10.1016/j.atmosenv.2010.03.036, 2010.
Lu, Y., Zhao, X., and Zhao, Y.: The comparison and evaluation of air pollutant simulation for the Yangtze River Delta region with different versions of air quality model. Environ. Monit. Forewarn., 12, 6–14, https://doi.org/10.3969/j.issn.1674-6732.2020.03.001, 2020 (in Chinese).
Maji, K. J., Dikshit, A. K., Arora, M., and Deshpande, A.: Estimating premature mortality attributable to PM2.5 exposure and benefit of air pollution control policies in China for 2020, Sci. Total Environ., 612, 683–693, https://doi.org/10.1016/j.scitotenv.2017.08.254, 2018.
Ohara, T., Akimoto, H., Kurokawa, J., Horii, N., Yamaji, K., Yan, X., and Hayasaka, T.: An Asian emission inventory of anthropogenic emission sources for the period 1980–2020, Atmos. Chem. Phys., 7, 4419–4444, https://doi.org/10.5194/acp-7-4419-2007, 2007.
Price, C., Penner, J., and Prather, M.: NOX from lightning: 1. Global distribution based on lightning physics, J. Geophys. Res.-Atmos., 102, 5929–5941, https://doi.org/10.1029/96jd03504, 1997.
Shanghai Bureau of Statistics (SHBS): Statistical Yearbook of Shanghai, China Statistics Press, Beijing, 2016 (in Chinese).
Sindelarova, K., Granier, C., Bouarar, I., Guenther, A., Tilmes, S., Stavrakou, T., Müller, J.-F., Kuhn, U., Stefani, P., and Knorr, W.: Global data set of biogenic VOC emissions calculated by the MEGAN model over the last 30 years, Atmos. Chem. Phys., 14, 9317–9341, https://doi.org/10.5194/acp-14-9317-2014, 2014.
Skamarock, W. C., Klemp, J. B., Dudhia, J., Gill, D. O., Barker, D. M., Duda, M. G., Huang, X.-Y., Wang, W., and Powers, J. G.: A Description of the Advanced Research WRF Version 3, NCAR Tech. Note NCAR/TN-475+STR, 113 pp., https://doi.org/10.5065/D68S4MVH, 2008.
Song, C., He, J., Wu, L., Jin, T., Chen, X., Li, R., Ren, P., Zhang, L., and Mao, H.: Health burden attributable to ambient PM2.5 in China, Environ. Pollut., 223, 575–586, 2017.
Tan, J., Fu, J. S., Huang, K., Yang, C.-E., Zhuang, G., and Sun, J.: Effectiveness of SO2 emission control policy on power plants in the Yangtze River Delta, China-post-assessment of the 11th Five-Year Plan, Environ. Sci. Pollut. R., 24, 8243–8255, https://doi.org/10.1007/s11356-017-8412-z, 2017.
Tang, L., Qu, J. B., Mi, Z. F., Bo, X., Chang, X. Y., Anadon, L. D., Wang, S. Y., Xue, X. D., Li, S. B., Wang, X., and Zhao, X. H.: Substantial emission reductions from Chinese power plants after the introduction of ultra-low emissions standards, Nat. Energy, 4, 929–938, https://doi.org/10.1038/s41560-019-0468-1, 2019.
Tang, Y., An, J., Wang, F., Li, Y., Qu, Y., Chen, Y., and Lin, J.: Impacts of an unknown daytime HONO source on the mixing ratio and budget of HONO, and hydroxyl, hydroperoxyl, and organic peroxy radicals, in the coastal regions of China, Atmos. Chem. Phys., 15, 9381–9398, https://doi.org/10.5194/acp-15-9381-2015, 2015.
University of North Carolina at Chapel Hill (UNC): Operational Guidance for the Community Multiscale Air Quality (CMAQ) Modeling System Version 4.7.1 (June 2010 Release), available at: http://www.cmaq-model.org (last access: 10 February 2020), 2010.
Uno, I., He, Y., Ohara, T., Yamaji, K., Kurokawa, J.-I., Katayama, M., Wang, Z., Noguchi, K., Hayashida, S., Richter, A., and Burrows, J. P.: Systematic analysis of interannual and seasonal variations of model-simulated tropospheric NO2 in Asia and comparison with GOME-satellite data, Atmos. Chem. Phys., 7, 1671–1681, https://doi.org/10.5194/acp-7-1671-2007, 2007.
Wang, G., Zhang, R., Gomez, M. E., Yang, L., Levy, Zamora, M., Hu, M.; Lin, Y., Peng, J., Guo, S., Meng, J., Li, J., Cheng, C., Hu, T., Ren, Y., Wang, Y., Gao, J., Cao, J., An, Z., Zhou, W., Li, G., Wang, J., Tian, P., MarreroOrtiz, W., Secrest, J., Du, Z., Zheng, J., Shang, D., Zeng, L., Shao, M., Wang, W., Huang, Y., Wang, Y., Zhu, Y., Li, Y., Hu, J., Pan, B., Cai, L., Cheng, Y., Ji, Y., Zhang, F., Rosenfeld, D., Liss, P. S., Duce, R. A., Kolb, C. E., and Molina, M. J.: Persistent sulfate formation from London Fog to Chinese haze. P. Natl. Acad. Sci., 48, 13630–13635, https://doi.org/10.1073/pnas.1616540113, 2016.
Wang, K., Zhang, Y., Jang, C., Phillips, S., and Wang, B.: Modeling intercontinental air pollution transport over the trans-Pacific region in 2001 using the Community Multiscale Air Quality modeling system, J. Geophys. Res.-Atmos., 114, D04307, https://doi.org/10.1029/2008jd010807, 2009.
Wang, L. T., Jang, C., Zhang, Y., Wang, K., Zhang, Q., Streets, D. G., Fu, J., Lei, Y., Schreifels, J., He, K. B., Hao, J. M., Lam, Y, Lin, J., Meskhidze, N., Voorhees, S., Evarts, D., and Phillips, S.: Assessment of air quality benefits from national air pollution control policies in China. Part II: Evaluation of air quality predictions and air quality benefits assessment, Atmos. Environ., 44, 3449–3457, https://doi.org/10.1016/j.atmosenv.2010.05.051, 2010.
Wang, L. T., Wei, Z., Yang, J., Zhang, Y., Zhang, F. F., Su, J., Meng, C. C., and Zhang, Q.: The 2013 severe haze over southern Hebei, China: model evaluation, source apportionment, and policy implications, Atmos. Chem. Phys., 14, 3151–3173, https://doi.org/10.5194/acp-14-3151-2014, 2014.
Wang, N., Lyu, X., Deng, X., Huang, X., Jiang, F., and Ding, A.: Aggravating O3 pollution due to NOx emission control in eastern China, Sci. Total Environ., 677, 732–744, 2019.
Wang, Z., Pan, L., Li, Y., Zhang, D., Ma, J., Sun, F., Xu, W., and Wang, X.: Assessment of air quality benefits from the national pollution control policy of thermal power plants in China: A numerical simulation, Atmos. Environ., 106, 288–304, https://doi.org/10.1016/j.atmosenv.2015.01.022, 2015.
Xia, Y., Zhao, Y., and Nielsen, C. P.: Benefits of of China's efforts in gaseous pollutant control indicated by the bottom-up emissions and satellite observations 2000–2014, Atmos. Environ., 136, 43–53, https://doi.org/10.1016/j.atmosenv.2016.04.013, 2016.
Xie, R., Sabel, C. E., Lu, X., Zhu, W., Kan, H., Nielsen, C. P., and Wang, H.: Long-term trend and spatial pattern of PM2.5 induced premature mortality in China, Environ. Int., 97, 180–186, https://doi.org/10.1016/j.envint.2016.09.003, 2016.
Xing, J., Wang, S. X., Jang, C., Zhu, Y., and Hao, J. M.: Nonlinear response of ozone to precursor emission changes in China: a modeling study using response surface methodology, Atmos. Chem. Phys., 11, 5027–5044, https://doi.org/10.5194/acp-11-5027-2011, 2011.
Yang, C. F. O., Lin, N. H., Sheu, G. R., Lee, C. T., and Wang, J. L.: Seasonal and diurnal variations of ozone at a high-altitude mountain baseline station in East Asia, Atmos. Environ., 46, 279–288, https://doi.org/10.1016/j.atmosenv.2011.09.060, 2012.
Yang, J., Zhao, Y., Cao, J., and Nielsen, C.: Co-benefits of carbon and pollution control policies on air quality and health till 2030 in China, Environ. Int., 152, 106482, https://doi.org/10.1016/j.envint.2021.106482, 2021.
Yang, Y., Zhao, Y., Zhang, L., Zhang, J., Huang, X., Zhao, X., Zhang, Y., Xi, M., and Lu, Y.: Improvement of the satellite-derived NOx emissions on air quality modeling and its effect on ozone and secondary inorganic aerosol formation in the Yangtze River Delta, China, Atmos. Chem. Phys., 21, 1191–1209, https://doi.org/10.5194/acp-21-1191-2021, 2021.
Yang, Y., Zhu, Y., Jang, C., Xie, J. P., Wang, S. X., Fu, J., Lin, C. J., Ma, J., Ding, D., Qiu, X. Z., and Lao, Y. W.: Research and development of environmental benefits mapping and analysis program: Community edition, Acta Scientiae Circumstantiae, 33, 2395–2401, https://doi.org/10.13671/j.hjkxxb.2013.09.022, 2013 (in Chinese).
Yue, H., He, C., Huang, Q., Yin, D., and Bryan, B. A.: Stronger policy required to substantially reduce deaths from PM2.5 pollution in China, Nat. Commun., 11, 1462, https://doi.org/10.1038/s41467-020-15319-4, 2020.
Yu, S., Mathur, R., Kang, D., Schere, K., Eder, B., and Pleirn, J.: Performance and diagnostic evaluation of ozone predictions by the eta-community multiscale air quality forecast system during the 2002 New England Air Quality Study, J. Air Waste Manage., 56, 1459–1471, https://doi.org/10.1080/10473289.2006.10464554, 2006.
Zhang, L., Zhao, T., Gong, S., Kong, S., Tang, L., Liu, D., Wang, Y., Jin, L., Shan, Y., Tan, C., Zhang, Y., and Guo, X.: Updated emission inventories of power plants in simulating air quality during haze periods over East China, Atmos. Chem. Phys., 18, 2065–2079, https://doi.org/10.5194/acp-18-2065-2018, 2018.
Zhang, M., Uno, I., Zhang, R., Han, Z., Wang, Z., and Pu, Y.: Evaluation of the Models-3 Community Multi-scale Air Quality (CMAQ) modeling system with observations obtained during the TRACE-P experiment: Comparison of ozone and its related species, Atmos. Environ., 40, 4874–4882, https://doi.org/10.1016/j.atmonsenv.2005.06.063, 2006.
Zhang, Q., Streets, D. G., Carmichael, G. R., He, K. B., Huo, H., Kannari, A., Klimont, Z., Park, I. S., Reddy, S., Fu, J. S., Chen, D., Duan, L., Lei, Y., Wang, L. T., and Yao, Z. L.: Asian emissions in 2006 for the NASA INTEX-B mission, Atmos. Chem. Phys., 9, 5131–5153, https://doi.org/10.5194/acp-9-5131-2009, 2009.
Zhang, Q., Zheng, Y., Tong, D., Shao, M., Wang, S., Zhang, Y., Xu, X., Wang, J., He, H., Liu, W., Ding, Y., Lei, Y., Li, J., Wang, Z., Zhang, X., Wang, Y., Cheng, J., Liu, Y., Shi, Q., Yan, L., Geng, G., Hong, C., Li, M., Liu, F., Zheng, B., Cao, J., Ding, A., Gao, J., Fu, Q., Huo, J., Liu, B., Liu, Z., Yang, F., He, K., and Hao, J.: Drivers of improved PM2.5 air quality in China from 2013 to 2017, P. Natl. Acad. Sci., 116, 24463–24469, 2019.
Zhang, X., Dai, H. C., Jin, Y. N., and Zhang, S. Q.: Evaluation of health and economic benefits from “Coal to Electricity” Policy in the residential sector in the Jing-Jin-Ji Region, Acta Scientiarum Naturalium Universitatis Pekinensis, 55, 2, https://doi.org/10.13209/j.0479-8023.2018.098, 2019 (in Chinese).
Zhang, Y., Bo, X., Zhao, Y., and Nielsen, C. P.: Benefits of current and future policies on emissions of China's coal-fired power sector indicated by continuous emission monitoring, Environ. Pollut., 251, 415–424, 2019.
Zhang, Y. H., Su, H., Zhong, L. J., Cheng, Y. F., Zeng, L. M., and Wang, X. S.: Regional ozone pollution and observation-based approach for analyzing ozone–precursor relationship during the PRIDE-PRD2004 campaign, Atmos. Environ., 42, 6203–6218, https://doi.org/10.1016/j.atmosenv.2008.05.002, 2008.
Zhao, B., Wang, S. X., Dong, X. Y., Wang, J. D., Duan, L., Fu, X., Hao, J. M., and Fu, J.: Environmental effects of the recent emission changes in China: implications for particulate matter pollution and soil acidification, Environ. Res. Lett., 8, 024031, https://doi.org/10.1088/1748-9326/8/2/024031, 2013.
Zhao, X., Zhao, Y., Chen, D., Li, C., and Zhang, J.: Top-down estimate of black carbon emissions for city clusters using ground observations: a case study in southern Jiangsu, China, Atmos. Chem. Phys., 19, 2095–2113, https://doi.org/10.5194/acp-19-2095-2019, 2019.
Zhao, Y., Wang, S., Duan, L., Lei, Y., Cao, P., and Hao, J.: Primary air pollutant emissions of coal-fired power plants in China: Current status and future prediction, Atmos. Environ., 42, 8442–8452, https://doi.org/10.1016/j.atmosenv.2008.08.021, 2008.
Zhao, Y., Zhang, J., and Nielsen, C. P.: The effects of recent control policies on trends in emissions of anthropogenic atmospheric pollutants and CO2 in China, Atmos. Chem. Phys., 13, 487–508, https://doi.org/10.5194/acp-13-487-2013, 2013.
Zhao, Y., Mao, P., Zhou, Y., Yang, Y., Zhang, J., Wang, S., Dong, Y., Xie, F., Yu, Y., and Li, W.: Improved provincial emission inventory and speciation profiles of anthropogenic non-methane volatile organic compounds: a case study for Jiangsu, China, Atmos. Chem. Phys., 17, 7733–7756, https://doi.org/10.5194/acp-17-7733-2017, 2017.
Zheng, B., Zhang, Q., Tong, D., Chen, C., Hong, C., Li, M., Geng, G., Lei, Y., Huo, H., and He, K.: Resolution dependence of uncertainties in gridded emission inventories: a case study in Hebei, China, Atmos. Chem. Phys., 17, 921–933, https://doi.org/10.5194/acp-17-921-2017, 2017.
Zheng, H., Zhao, B., Wang, S., Wang, T., Ding, D., Chang, X., Liu, K., and Xing, J.: Transition in source contributions of PM2.5 exposure and associated premature mortality in China during 2005–2015, Environ. Int. 132, 105111, https://doi.org/10.1016/j.envint.2019.105111, 2019.
Zhou, Y., Zhao, Y., Mao, P., Zhang, Q., Zhang, J., Qiu, L., and Yang, Y.: Development of a high-resolution emission inventory and its evaluation and application through air quality modeling for Jiangsu Province, China, Atmos. Chem. Phys., 17, 211–233, https://doi.org/10.5194/acp-17-211-2017, 2017.
ZJBS (Zhejiang Bureau of Statistics): Statistical Yearbook of Zhejiang, China Statistics Press, Beijing, 2016 (in Chinese).