the Creative Commons Attribution 4.0 License.
the Creative Commons Attribution 4.0 License.
 | 23 Apr 2021
Measurement report: Firework impacts on air quality in Metro Manila, Philippines, during the 2019 New Year revelry
Genevieve Rose Lorenzo
Paola Angela Bañaga
Maria Obiminda Cambaliza
Melliza Templonuevo Cruz
Mojtaba AzadiAghdam
Avelino Arellano
Grace Betito
Rachel Braun
Andrea F. Corral
Hossein Dadashazar
Eva-Lou Edwards
Edwin Eloranta
Robert Holz
Gabrielle Leung
Lin Ma
Alexander B. MacDonald
Jeffrey S. Reid
James Bernard Simpas
Connor Stahl
Shane Marie Visaga
Fireworks degrade air quality, reduce visibility, alter atmospheric chemistry, and cause short-term adverse health effects. However, there have not been any comprehensive physicochemical and optical measurements of fireworks and their associated impacts in a Southeast Asia megacity, where fireworks are a regular part of the culture. Size-resolved particulate matter (PM) measurements were made before, during, and after New Year 2019 at the Manila Observatory in Quezon City, Philippines, as part of the Cloud, Aerosol, and Monsoon Processes Philippines Experiment (CAMP2Ex). A high-spectral-resolution lidar (HSRL) recorded a substantial increase in backscattered signal associated with high aerosol loading ∼440 m above the surface during the peak of firework activities around 00:00 (local time). This was accompanied by PM2.5 concentrations peaking at 383.9 µg m−3. During the firework event, water-soluble ions and elements, which affect particle formation, growth, and fate, were mostly in the submicrometer diameter range. Total (>0.056 µm) water-soluble bulk particle mass concentrations were enriched by 5.7 times during the fireworks relative to the background (i.e., average of before and after the firework). The water-soluble mass fraction of PM2.5 increased by 18.5 % above that of background values. This corresponded to increased volume fractions of inorganics which increased bulk particle hygroscopicity, kappa (κ), from 0.11 (background) to 0.18 (fireworks). Potassium and non-sea-salt (nss) SO contributed the most (70.9 %) to the water-soluble mass, with their mass size distributions shifting from a smaller to a larger submicrometer mode during the firework event. On the other hand, mass size distributions for NO, Cl−, and Mg2+ (21.1 % mass contribution) shifted from a supermicrometer mode to a submicrometer mode. Being both uninfluenced by secondary aerosol formation and constituents of firework materials, a subset of species were identified as the best firework tracer species (Cu, Ba, Sr, K+, Al, and Pb). Although these species (excluding K+) only contributed 2.1 % of the total mass concentration of water-soluble ions and elements, they exhibited the highest enrichments (6.1 to 65.2) during the fireworks. Surface microscopy analysis confirmed the presence of potassium/chloride-rich cubic particles along with capsule-shaped particles in firework samples. The results of this study highlight how firework emissions change the physicochemical and optical properties of water-soluble particles (e.g., mass size distribution, composition, hygroscopicity, and aerosol backscatter), which subsequently alters the background aerosol's respirability, influence on surroundings, ability to uptake gases, and viability as cloud condensation nuclei (CCN).
- Article
(2922 KB) - Full-text XML
-
Supplement
(1116 KB) - BibTeX
- EndNote


Fireworks affect local populations through visibility reduction and increased health risks due to briefly elevated particulate matter (PM) levels. Total PM mass concentrations during local celebrations in the following cities exceeded the 24 h US National Ambient Air Quality Standard (NAAQS) for PM10 of 150 µg m−3: Leipzig, Germany, (Wehner et al., 2000); Brownsville, Texas, United States (US) (Karnae, 2005); Montreal, Canada (Joly et al., 2010), and New Delhi, India, (Mönkkönen et al., 2004). Firework emissions from at least 19 studies have also been linked to exceedance of the 24 h US NAAQS limit for PM2.5 of 35 µg m−3 (Lin, 2016, and references therein). Higher PM concentrations from fireworks have been reported more frequently in Asia (i.e., India, China, and Taiwan) compared to western countries (Lin, 2016; Sarkar et al., 2010).
Health effects are of major concern during firework periods based on both short- and long-term exposure. For example, Diwali is a major firework festival in India, and it was shown that chronic exposure to three of the most prominent tracer species (Sr, K, and Ba) translated to a 2 % increase in health effects based on the non-carcinogenic hazard index (Sarkar et al., 2010). On the other hand, short-term exposure to firework pollutants increases asthma risk, eye allergies, cardiovascular and pulmonary issues, cough, and fever (Moreno et al., 2010; Singh et al., 2019; Barman et al., 2008; Becker et al., 2000; Beig et al., 2013; Hirai et al., 2000). Firework pollutants also impact clouds and the hydrological cycle, owing to associated aerosols serving as cloud condensation nuclei (CCN) (Drewnick et al., 2006) and subsequently impacting surface ecosystems after wet deposition (Wilkin et al., 2007). Although fireworks emit particles with various sizes into the atmosphere, fine particles associated with PM2.5 are most relevant to public health effects, scattering efficiency, and CCN activation (Vecchi et al., 2008; Perry, 1999). Knowing the various effects of firework emissions depends on knowing their physical, chemical, and optical properties.
Measurements of the chemical composition of firework emissions are important in order to understand how they affect local air quality. The main components of fireworks are fuels (metals and alloys, metalloids, and non-metals), oxidizers (nitrates, perchlorates, and chlorates), and coloring agents (metal salts) (Steinhauser and Klapotke, 2010). Previous studies have relied on tracer species to establish confidence in distinguishing the firework source from background air and other sources (Sarkar et al., 2010). Potassium historically has been the most observable tracer for fireworks emissions (Wang et al., 2007; Drewnick et al., 2006; Perry, 1999), with concentrations reaching 58 µg m−3 during the Diwali festival in India (Kulshrestha et al., 2004). Firework color is created by metal salts such as Sr for red, Ba for green, and Cu for blue-violet, all three of which have been found to be effective tracers of fireworks (Walsh et al., 2009; Vecchi et al., 2008). Strontium in particular is an indicator of the spatial and temporal extent of firework smoke plumes (Perry, 1999) because of the high prevalence of red in fireworks, and it is not affected by traffic emissions (Moreno et al., 2010). Other components measured in the air that have been attributed to fireworks include metals (Al, Cd, Cu, Ti, Mg, Mn, Ni, Zn, As, Bi, Co, Ga, Hg, Cr, Pb, Rb, Sb, P, Tl, Ag) and their salt anion counterparts (S, P, Cl). Thallium makes a green flame. Potassium and Ag (as AgCNO or silver fulminate) are propellants, Al is fuel, and Pb provides steady burn and is also used as an igniter for firework explosions. Chromium is a catalyst for propellants, Mg is a fuel, and Mg2+ is a neutralizer or oxygen donor (U.S. Department of Labor, 2015). Manganese is either a fuel or oxidizer, and Zn is used for sparks (Licudine et al., 2012; Martín-Alberca and García-Ruiz, 2014; Shimizu, 1981; Wang et al., 2007; Ennis and Shanley, 1991). Also from fuel and oxidizer combustion are species such as NO, SO, and organics including oxaloacetic acid (Alpert and Hopke, 1981; Barman et al., 2008; Carranza et al., 2001; Dorado et al., 2001; Drewnick et al., 2006; Joly et al., 2010; Joshi et al., 2016; Kulshrestha et al., 2004; Kumar et al., 2016; Lin et al., 2016; Moreno et al., 2010; Sarkar et al., 2010; Tanda et al., 2019; Thakur et al., 2010; Joshi et al., 2019). Firework-derived chloride in Taiwan has been attributed to raw materials such as KClO3, ClO3, and ClO4 with Cl− : Na+ ratios reaching approximately 3 (Tsai et al., 2012). Black carbon mass concentrations during firework events can either increase due to firework emissions or decrease owing to fewer vehicles on the road (Kumar et al., 2016; Yadav et al., 2019). In both cases, the black carbon mass fraction decreases due to a greater contribution of other constituents in firework emissions. Organic mass concentrations and mass fractions have been noted to increase and decrease, respectively, with fireworks (Zhang et al., 2019). Governed largely by composition, particulate hygroscopicity and solubility have also been found to be altered by fireworks depending on the emitted species. Inorganic salts (K2SO4, KCl) dominated the aerosol hygroscopicity in Xi'an, China, during fireworks (Wu et al., 2018). In the Netherlands, enhancements in salt mixtures containing SO, Cl−, Mg2+, and K+ were noted to enhance hygroscopicity (ten Brink et al., 2018). Copper and Mg were observed to become more soluble in firework emissions in Delhi, India, while Mn, As, Ba, and Pb became less soluble (Perrino et al., 2011). The water-soluble aerosol components from fireworks in the Sichuan Basin (China) were internally mixed and enhanced the hygroscopicity of submicrometer aerosols, especially the larger particles (Yuan et al., 2020).
In addition to composition, a necessary aspect of characterizing impacts of firework emissions is to measure aerosol size distributions within the short timeframe of an event (Joshi et al., 2019). Owing to combustion during firework events, PM concentrations are dominated by particles in the submicrometer range (Vecchi et al., 2008; Nicolás et al., 2009; Joshi et al., 2019; Pirker et al., 2020; Do et al., 2012). Particle number concentration maxima have been noted for the nucleation (0.01 to 0.02 µm) and Aitken (0.02 to 0.05 µm) modes (Yadav et al., 2019; Yuan et al., 2020), in addition to both the small (0.1 to 0.5 µm) (Wehner et al., 2000; Zhang et al., 2010) and large (0.5 to 1.0 µm) ends of the accumulation mode (Vecchi et al., 2008) during firework events. In Nanning, China, SO peaked at 0.62 µm during fireworks (Li et al., 2017). The mass diameter of K+ was 0.7 µm due to firework emissions after transport in Washington state (Perry, 1999). There are a few studies with observed particle mass concentration increases in the coarser but still respirable (<10 µm) mode (Tsai et al., 2011). In terms of dynamic behavior in the size distributions, past work has shown a shift in number concentration from nucleation and Aitken modes to the smaller end of the accumulation mode (0.1 to 0.5 µm), due to increased coagulation sinks (Zhang et al., 2010). Finer-temporal-scale monitoring has revealed steep increases in nucleation-mode and Aitken-mode particle concentrations associated with firework emissions followed by a growth in accumulation-mode particle number concentrations due to coagulation (Yadav et al., 2019). An opposite shift to a smaller size distribution has been observed for certain species (Mg, Al, Cu, Sr, and Ba) from the coarse mode to accumulation mode (Tanda et al., 2019). Other work has shown that while there is usually a quick drop in particle concentration to background values after firework events (Joly et al., 2010), elevated number concentrations of accumulation-mode particles are maintained for up to 3 h after peak firework activity (Hussein et al., 2005). New particle formation events with fireworks have also been reported in Mumbai, India (Joshi et al., 2016), with enrichments of primary and secondary particles for up to 30 min after peak firework activity. Particle aging due to distance from the source and meteorology alter firework emission particle concentrations (Joly et al., 2010) and size distributions (Khaparde et al., 2012).
Meteorological and dynamic parameters such as wind speed, level of mixing (turbulent kinetic energy), and mixing layer height (Lai and Brimblecombe, 2020) influence peak concentration and composition of aerosols after fireworks, as well as particle residence time in the atmosphere and transport to nearby regions (Vecchi et al., 2008). Although firework activities are episodic, their particulate emissions, especially in the submicrometer mode (Do et al., 2012), reside in the atmosphere for as long as several days to weeks (Liu et al., 1997; Lin et al., 2016; Kong et al., 2015; Do et al., 2012). Dispersion of the particles under low wind speed (1 m s−1) for particles between 0.4 and 1 µm is estimated at 12 h (Vecchi et al., 2008) and can reach distances as far as a hundred kilometers (Perry, 1999). Aitken-mode and larger particles are dispersed by wind more than nucleation-mode particles (Agus et al., 2008). Meteorological conditions, such as rainfall, can also decrease firework particle loading in the air, and relative humidity can change the hygroscopicity of firework emissions (Hussein et al., 2005), thereby affecting their size and radiative properties.
Studies on aerosol properties are limited for the rapidly developing region of Southeast Asia (Tsay et al., 2013). This compounds the challenge to understand the interactions between aerosols and the complex hydro-meteorological and geological environment in Southeast Asia (Reid et al., 2013). Increased local and transported emissions (Hopke et al., 2008; Oanh et al., 2006) in Southeast Asia add to the complexity and affect air quality in the region. Firework emissions are an example of extreme and regular local emissions in Southeast Asia. Even while several studies exist in the neighboring regions of East Asia (e.g., China) and South Asia (e.g., India), there currently is no in-depth analysis of the chemical, physical, and optical properties of firework emissions in a Southeast Asian megacity where fireworks are culturally significant (Dela Piedra, 2018). This study is additionally novel because it includes the following combination of data types to investigate fireworks: size-resolved measurements (ionic/elemental composition, morphology), vertically resolved data from a high-spectral-resolution lidar (HSRL), PM2.5, and meteorology. This work reports these data during the 2019 New Year celebrations in Metro Manila, Philippines, one of the most populated cities, with a population of 12.88 million (PSA, 2015). We address the following questions in order. (i) What are the conditions of the atmosphere during the study period in relation to aerosols, and how are these affected by firework emissions? (ii) What are the concentrations, mass size distributions, and morphological characteristics of different elemental and ionic species specific to fireworks, and how do these affect bulk aerosol hygroscopicity? The results of this work provide new data that can help address how past and ongoing firework emissions impact health, visibility, regional air quality, and biogeochemical cycling of nutrients and contaminants in the Philippines, Southeast Asia, and, more broadly, for all other cities with major firework events. It also contributes to the growing body of firework research findings (Devara et al., 2015).
2.1 Hourly PM2.5 mass concentration
Hourly PM2.5 mass concentrations were obtained to assess the evolution of and the temporal characteristics of fine particulates due to fireworks and their relation to meteorology and aerosol optical properties. The hourly PM2.5 mass concentrations were collected at the Manila Observatory, Quezon City, Philippines (14.64∘ N, 121.08∘ E, ∼70 m a.s.l.) (Fig. S1), with a beta attenuation monitor (DKK-TOA Corporation) as part of the Acid Deposition Monitoring Network in East Asia (EANET) (Totsuka et al., 2005). The beta attenuation monitor collects PM2.5 samples on a ribbon filter, which are irradiated with beta particles. The attenuation of the beta particles through the sample and the filter is exponentially proportional to the mass loading on the filter. These hourly data were then averaged over 48 h periods coinciding with water-soluble aerosol composition measurements (Sect. 2.5) before, during, and after the firework event.
2.2 Meteorological data
Rainfall, temperature, relative humidity, and wind data were collected at the Manila Observatory with a Davis Vantage Pro2 Plus weather station (∼90 m a.s.l.) before, during, and after the firework period. Hourly precipitation accumulation and 10 min averaged temperature, relative humidity, and wind were used for the analysis.
2.3 Back trajectories
Three-day back trajectories with 6 h resolution were generated using the National Oceanic and Atmospheric Administration's (NOAA) Hybrid Single-Particle Lagrangian Integrated Trajectory (HYSPLIT) model (Rolph et al., 2017; Stein et al., 2015) using the Global Data Assimilation System (GDAS) with a resolution of 1∘ and vertical wind setting of “model vertical velocity”. To ascertain the impact of fireworks on surface particulate concentrations, back trajectories were chosen to end at the beginning times of the sampling periods before, during, and after the firework event. Trajectories were computed for an end point being at the Manila Observatory at an altitude of 500 m because it represents the mixed layer as done in other works examining surface air quality (Mora et al., 2017; Aldhaif et al., 2020; Crosbie et al., 2014; Schlosser et al., 2017).
2.4 Remote sensing
Vertical profiles of aerosol backscatter cross section measured with the University of Wisconsin high-spectral-resolution lidar (HSRL), which was deployed at the Manila Observatory in support of CAMP2EX. The HSRL instrument transmitting laser (Table S1) operates at 532 nm with 250 mW average power and pulse repetition rate of 4 kHz. The HSRL technique measures and separates the returned signal into the molecular and aerosol backscatter by using a beam splitter and an iodine absorption cell filter. The separated molecular signal allows for optical depth and backscatter cross section measurements in contrast to a standard backscatter lidar that requires assumption related to the particulate lidar ratio (Razenkov, 2010). The HSRL also measures the particulate depolarization ratio, an indicator of aerosol or cloud particle shape with low depolarization indicative of spherical particles, while intermediate values (10 %) indicate a mix of spherical and nonspherical particles (Burton et al., 2014; Reid et al., 2017). HSRL data were uploaded and processed at the University of Wisconsin–Madison Space Science and Engineering Center server for periods before, during, and after the fireworks.
To verify the height values based on the vertical profiles of aerosol backscatter, the surface-attached aerosol layer height is estimated using the maximum variance method more commonly used for daytime convective boundary layer detection (Hooper and Eloranta, 1986). The height detection method is limited by the complexity of the firework event case due, however, to pertinent rain signals. The surface-attached aerosol layer is derived from a 15 min moving window average based on the 30 s values.
2.5 Aerosol composition and morphology measurements
Size-speciated PM (cut-point diameters: 18, 10, 5.6, 3.2, 1.8, 1.0, 0.56, 0.32, 0.18, 0.10, and 0.056 µm) was collected on Teflon substrates (PTFE membrane, 2 µm pores, 46.2 mm diameter, Whatman) with two Micro-Orifice Uniform Deposition Impactor (MOUDI II 120R, MSP Corporation) (Marple et al., 2014) samplers from the third floor of the main building (∼85 m a.s.l.) at the Manila Observatory. Sample collection for each of the three MOUDI sets lasted 48 h before (13:30 on 24 December 2018 to 13:30 on 26 December 2018), during (14:45 on 31 December 2018 to 14:45 on 2 January 2019), and after (13:30 on 1 January 2019 to 13:30 on 3 January 2019) firework activities. Note that all times refer to local time (UTC+8). Although there were no fireworks released from the sampling site, there was firework activity in the immediate vicinity (∼500 m from the sampling in all directions and all throughout the city in general). Firework activity around the sampling site began around ∼ 19:00 on 31 December 2018, peaked at 00:00 of 1 January 2019, and dropped drastically after. Based on PM2.5 data there was no evidence of sustained firework activity past midnight. MOUDI samples collected before (24 to 26 December) and after (1 to 3 January) the firework event (31 December to 2 January) were considered as background samples. Although there is some firework activity that is expected in the evening of 24 December (before the firework event), this is minimal compared to that which is the focus of this study (Dela Piedra, 2018; Santos et al., 2010; Roca et al., 2015). The samples were covered with aluminum foil, sealed, and stored in the freezer before being shipped to the University of Arizona for elemental and ionic analysis.
Each sample substrate was cut in half. One half of each sample was extracted in 8 mL Milli-Q water (18.2 MΩcm), sonicated, and analyzed for ions (ion chromatography (IC): Thermo Scientific Dionex ICS-2100 system) and elements (triple quadrupole inductively coupled plasma mass spectrometer: ICP-QQQ; Agilent 8800 Series). The remaining substrate halves were stored. Sample ionic and elemental concentrations were corrected by subtracting concentrations from background control samples. More information about the sampling and analysis is detailed in recent work (Stahl et al., 2020b). Limits of detection of the 41 reported species are summarized in Table S3. Potassium (K+) was reported based on ICP-QQQ measurements rather than IC due to possible contamination from the KOH eluent used in the latter instrument. Non-sea-salt SO was calculated by subtracting 0.2517 × Na+ from the total SO concentration (Prospero et al., 2003).
High-resolution scanning electron microscopy (SEM) combined with energy dispersive X-ray analysis (EDX) was used for examining particle morphology and chemical composition on a portion of the substrates collected during the firework event. Analyses were performed with a Hitachi S-4800 high-resolution SEM and a Thermo Fisher Scientific Noran Six X-ray Microanalysis System in the Kuiper Imaging cores at the University of Arizona. Approximately 1 cm2 was cut from the center of substrate halves and placed on double-sided carbon tape mounted on an aluminum stub. A thin layer (1.38 nm) of carbon was coated on the sample surface using a Leica EM ACE600 sputter coater to improve the sample's conductivity. SEM images were obtained at 15 and 30 keV acceleration voltages and with a 20 µA probe current in high-magnification mode. The percentage contributions and the spatial distribution of the elements were obtained from the EDX analysis. Carbon, F, and Al should be ignored in the discussion of SEM-EDX results since C and F are present in the Teflon substrates, and the sample stub is an Al-rich substrate.
A total of 41 water-soluble species were detected in the 48 h size-differentiated particulate samples collected before, during, and after the firework event. The total bulk mass concentration is defined as the sum of the concentrations of all the measured species across MOUDI's 11 stages (≥0.056 µm).
2.6 Enrichment factor calculations
To identify which species are most enhanced during fireworks, enrichment values are typically calculated using speciated concentrations during the fireworks relative to baseline periods (Tanda et al., 2019). We calculate water-soluble mass enrichment factors for each of the 41 measured species by dividing their total bulk (≥0.056 µm) mass concentrations during the firework event by the average of the total mass concentration of the species measured before and after the firework event. Size-resolved enrichments were similarly calculated using measured mass concentrations for individual MOUDI stages. In a case when the mass concentration of a species during the firework event was non-zero but the mass concentrations during and after were zero (e.g., succinate), half of the detection limit was used in place of zero values.
2.7 Hygroscopicity calculations
Hygroscopicity was calculated for particles ranging in size between 0.056–3.2 µm before, during, and after the firework event. This size range was chosen to most closely be aligned with separate measurements of PM2.5 in the study (Sect. 2.1) that were used to account for the remaining mass not speciated in this study. We specifically calculate values for the single hygroscopicity parameter kappa, κ (Petters and Kreidenweis, 2007).
The water-soluble compound mass concentrations before, during, and after the firework event were calculated using an ion-pairing scheme (Gysel et al., 2007) for each MOUDI stage between diameters of 0.056 and 3.2 µm and then summed to achieve a total mass concentration for each compound in this size range. Black carbon mass concentrations in PM2.5 before and after the firework event were calculated based on their long-term (2001–2007) average contribution (32 %) to PM2.5 mass in December and January (Cohen et al., 2009). Black carbon or elemental carbon (EC) concentrations during the firework event were assumed to be the average of the black carbon concentrations before and after the firework event. This was done because black carbon concentrations have been observed to not increase (Santos et al., 2007) as much as organic carbon (OC) (Lin, 2016), such that OC : EC mass ratios during fireworks have been observed to increase. Total non-water-soluble content between 0.056 and 3.2 µm was calculated as the difference between the total PM2.5 mass concentration and the sum of the water-soluble species and black carbon mass concentrations. The mass of each species was divided by its density, and each of these volumes were added to quantify the volume of the measured aerosol (water-soluble compounds, black carbon, and organic matter) between 0.056 and 3.2 µm. Volume fractions were then computed for each species. The Zdanovskii, Stokes, and Robinson (ZSR) mixing rule (Stokes and Robinson, 1966) was used to obtain the total hygroscopicity (total κ) of the mixed aerosols by weighting κ values for the individual non-interacting compounds by their respective volume fractions and summing linearly. Densities and κ values for the individual compounds are based on those used elsewhere (AzadiAghdam et al., 2019), repeated in Table S4.
3.1 Hourly PM2.5, meteorological, and transport patterns
We begin with hourly PM2.5 mass concentration results for the study period to provide context for the spatiotemporal characteristics of fine particulates due to fireworks, their interaction with meteorology, and effects on aerosol optical properties. Hourly PM2.5 (Fig. 1) began to increase from 44.0 µg m−3 (shortly after rising above the 24 h Philippine Provisional National Ambient Air Quality Guideline Values (NAAQGV) of 50.0 µg m−3) after 18:00 on 31 December 2018 with the beginning of firework activity and calm meteorological conditions. There was moderate (3 mm) rainfall from 22:00 to 23:00 that night as the firework activity began to increase. Rain is a sink for particles (Perry, 1999) and could have washed out some of the particulates in the air, thus potentially causing a slight dip in the hourly PM2.5 around midnight. PM2.5 peaked at 383.9 µg m−3 between 01:00 and 02:00 on 1 January 2019. The PM2.5 peak was delayed by approximately an hour from the peak firework activity at midnight possibly due to rainfall, relative humidity, and wind (Vecchi et al., 2008), in addition to aerosol dynamical processes requiring time for secondary aerosol formation and growth (Li et al., 2017). Minimal rain (0.2 mm in an hour) with high relative humidity (between 93 % ± 4 % to 94 % ± 4 %) was conducive to aerosol growth and/or secondary particle formation. High relative humidity is related to aqueous-phase oxidation of SO2 (Sun et al., 2013) and NO2 (Cheng et al., 2014) as well as metal-catalyzed heterogeneous reactions (Wang et al., 2007) to form SO. Aqueous oxidation has been found to be a predominant mechanism for the secondary formation of SO during fireworks (Li et al., 2017), in addition to promoting secondary organic aerosol formation (Wonaschuetz et al., 2012; Youn et al., 2013). Light wind (∼1 m s−1) after midnight from the northeast could also have transported more emissions from the populated Marikina Valley, located in the northeast, to the Manila Observatory, contributing to the delay of the PM2.5 peak.

Figure 1(a) PM2.5 mass concentrations and rain accumulation at hourly resolution (the time shown is local time (UTC+8); dashed vertical line indicates midnight) as measured from the Manila Observatory main building third floor rooftop (∼88 m a.s.l.) at the same period as the MOUDI size-speciated samples during the firework event. Ten-minute-averaged values of (b) temperature and relative humidity, in addition to (c) wind speed and direction. The wind barb legend in panel (c) shows how flags are added to the staff with increasing wind speed and in the direction where the wind comes from. Figures S2 and S3 show the hourly PM2.5 mass concentrations and 10 min meteorological data before and after the firework event, respectively.
Particulate levels were enhanced for approximately 14 h from the beginning of the firework activity (Fig. 1) during which the average PM2.5 (143.4 µg m−3) exceeded the 24 h Philippine NAAQGV between 18:00 on 31 December 2018 and 08:00 on 1 January 2019. After 02:00 on 1 January 2019, PM2.5 dropped quickly to 122.0 µg m−3 between 03:00 and 04:00 (Fig. 1). The PM2.5 decrease was less pronounced after 04:00 but continued decreasing steadily along with slight rain (0.4 mm in an hour) and light breeze (1–2 m s−1) from the northwest to southwest directions. Firework activity in other countries has been documented to last from 2–6 h in a day, and elevated particulate levels can be maintained for up to 6–18 h (Thakur et al., 2010; Crespo et al., 2012; Chatterjee et al., 2013; Kong et al., 2015; Tsai et al., 2012). The 48 h average PM2.5 during (49.9 µg m−3) the firework event was 1.9 and 3.3 times more, respectively, than before (25.8 µg m−3) (Fig. S2) and after (15.2 µg m−3) (Fig. S3) the firework event. Increases in PM mass concentration of 2- to 3-folds due to fireworks have also been observed in other countries (Rao et al., 2012; Ravindra et al., 2003; Tsai et al., 2011; Shen et al., 2009). Greater increases (>5 times) in particulate mass concentrations elsewhere were related to more intense and prolonged (lasting several days) firework activity (Tian et al., 2014).
Three-day back trajectories for the period before the firework event were from the northeast to east directions coming from the Philippine Sea (Fig. 2a). For the periods (Fig. 2b) during and (Fig. 2c) after the firework event, back trajectories were from the northeast to east/northeast directions. The general wind directions from the back trajectories are consistent with the climatologically prevailing northeasterly monsoonal winds in December and January for the Philippines (Villafuerte et al., 2014). The origin of the air parcels did not have any major emission events that could have impacted the measurements after long-range transport. This is important to note because the tracers for fireworks are also tracers for transported emissions due to biomass burning (K+) (Braun et al., 2020) and industrial activities (Cohen et al., 2009). Thus, enriched particulate concentrations during the firework activity were most likely locally produced. One factor impacting surface PM concentrations is the vertical structure of the lower troposphere, which is addressed in the next section based on HSRL data.

Figure 2Three-day back trajectories with 6 h resolution for the periods (a) before, (b) during, and (c) after the firework event, ending at the point of the Manila Observatory at 500 m.
3.2 Optical aerosol properties
Heavy aerosol loading at the surface was observed up to 8 h after the fireworks peak (00:00) with high HSRL 532 nm backscatter cross section and depolarization (Fig. 3a) reaching ∼440 m above the ground. Prior to the firework peak, the surface aerosol layer had lower backscatter (before 22:00, Fig. 3a), and this cleaner condition is shown by the 16:16 local time vertical profile of the aerosol backscatter (Fig. 3b). Rainfall (Fig. 1a) contributed to columns of high backscatter (Fig. 3a) after 22:00 and before the firework peak with a measurable decrease in the aerosol backscatter for a short time after the precipitation (23:00 and 00:00).
As confirmed by height detection, aerosols reached up to ∼440 m (Fig. 3a and b) at 00:00 (1 January 2019). It persisted for at least an hour and then dropped to 118 ± 20 m with higher aerosol backscatter retained until 1 January 2019 08:00. Some of the smoke is above the detected height (i.e., 01:00).
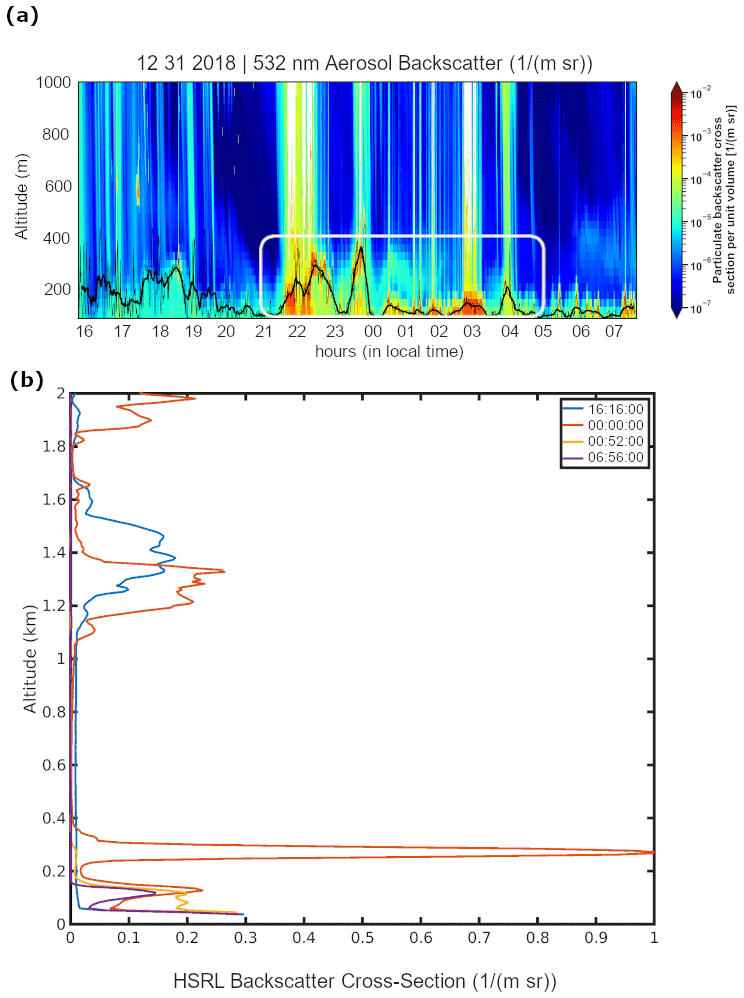
Figure 3(a) Time series of the aerosol backscatter vertical profile from the high-spectral-resolution lidar (HSRL). The time shown is local time (UTC+8) at the Manila Observatory. The times circled by the white oval correspond to the peak of aerosol backscatter in the mixing layer due to firework activity. The approximate surface-attached aerosol layer height is shown as a thick black line. It is derived from a 30 min moving window average based on the 1 min values shown as a thin black line. (b) Vertical profiles of aerosol backscatter at specific UTC times of interest before, during, and after the fireworks.
3.3 Mass size distributions
Building on the previous results describing the general environmental conditions during the study period, now we focus on the detailed size-resolved measurements. The total water-soluble bulk mass concentration (Table 1) during the firework event (16.74 µg m−3) was 5.71 times and 4.73 times higher than the total bulk mass concentrations before (2.93 µg m−3) and after (3.54 µg m−3) the firework event, respectively. Assuming the average of the water-soluble mass concentrations before and after the firework event represents background values, this translates to an 80.66 % increase in water-soluble mass during the firework event.
Table 1Summary of total and speciated concentrations before, during, and after the firework event. Species are divided based on units (total to Zn: µg m−3; succinate to Se: ng m−3).
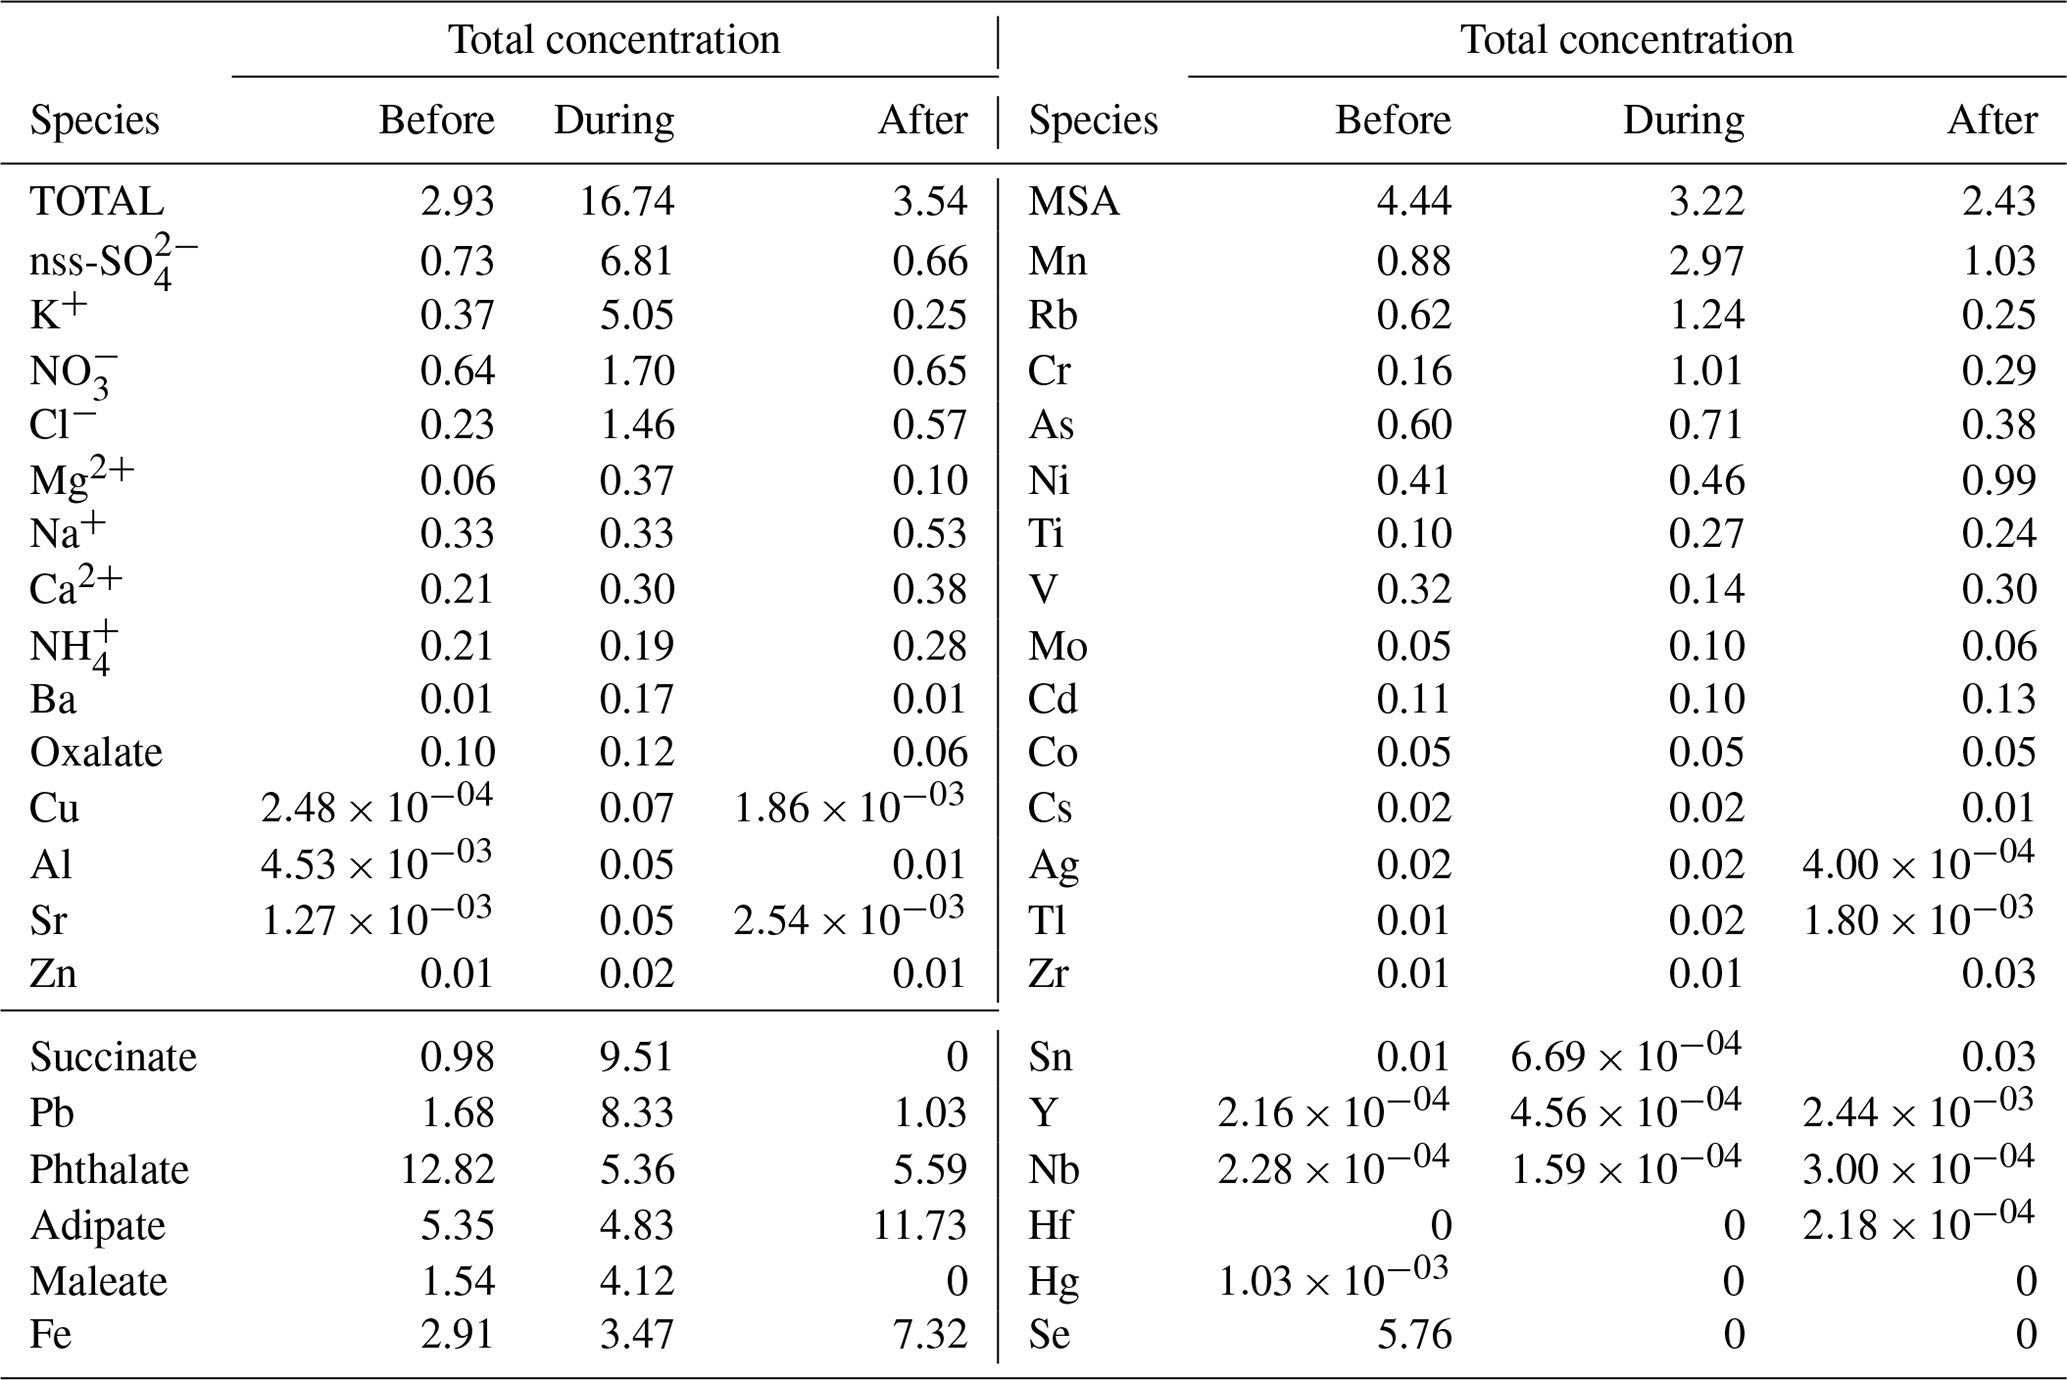
The firework event was associated with increased total water-soluble mass fraction (32.33 %) (0.056–3.2 µm size range, Sect. 3.1) in PM2.5 (Fig. S4) compared to before (9.90 %) and after (17.79 %) the firework event. The water-soluble particulate mass fraction in PM2.5 similarly increased in other firework events (Yang et al., 2014). The highest total water-soluble mass concentrations during the firework event were from the following ions: non-sea-salt (nss) SO (6.81 µg m−3), K+ (5.05 µg m−3), NO (1.70 µg m−3), Cl− (1.46 µg m−3), Mg2+ (0.37 µg m−3), Na+ (0.33 µg m−3), and Ca2+ (0.30 µg m−3). These contributed to 95.75 % of the total detected bulk water-soluble mass concentration then.
Total water-soluble bulk mass concentration during the firework event was dominated by submicrometer particles, which accounted for 77.4 % of the total water-soluble bulk mass (Fig. 4b). Supermicrometer mass fractions were greater before (Fig. 4a) and after (Fig. 4c) the firework event (43.7 % and 57.5 % of the water-soluble bulk mass concentration) compared to during the firework event (22.6 %). The increase in submicrometer mass fractions is typical with firework emissions (Crespo et al., 2012; Do et al., 2012). In New York, fireworks contributed to 77 % of PM1 due to potassium salts and oxidized organic aerosol (Zhang et al., 2019).
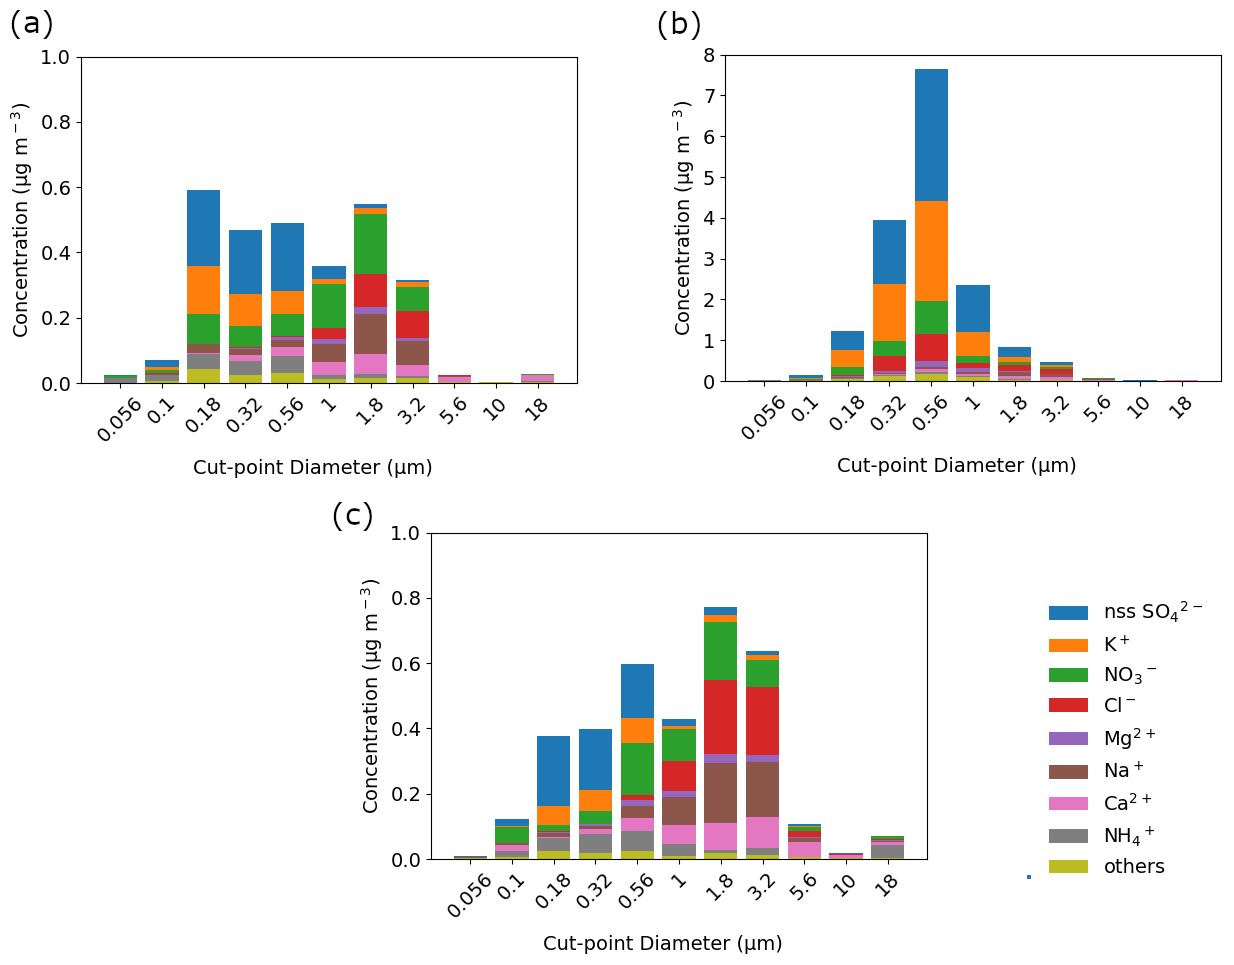
Figure 4Speciated mass size distributions of the major aerosol constituents measured (a) before, (b) during, and (c) after the firework event. Table 1 lists the bulk (≥0.056 µm) mass concentrations of these ions and elements, including those labeled here as “others” (Ba, oxalate, Cu, Al, Sr, Zn, succinate, Pb, phthalate, adipate, maleate, Fe, MSA, Mn, Rb, Cr, As, Ni, Ti, V, Mo, Cd, Co, Cs, Ag, Tl, Zr, Sn, Y, Nb, Hf, Hg, and Se).
Non-sea-salt SO had the highest contribution (40.7 %) to total water-soluble bulk mass concentration during the firework event (Table 1). Sulfate exhibited a shift in its mass size distribution to a slightly larger size during firework activity (Fig. 4b). During the firework event, 87.13 % of the nss-SO was in the 0.32 to 1.8 µm size fraction. Before and after the firework event, 87.28 % and 85.14 % of the nss-SO mass concentration, respectively, was distributed in a finer size fraction (0.18 to 1 µm) (Fig. 4a and c).
Potassium contributed 30.19 % to the total water-soluble mass concentration during the firework event (Table 1), presumably in the form of KNO3. This compound is associated with black powder used as a propellant (Li et al., 2017). Potassium's mass concentration distribution similarly shifted to a slightly larger size during the firework event (Fig. 4b). Most (87.6 %) of the bulk K+ mass concentration during the firework event was between 0.32 and 1.8 µm, compared to 85.4 % and 79.4 % between 0.18 and 1 µm before and after the firework event, respectively (Fig. 4a and c).
The shift in the mass size distribution of K+ and nss-SO can be due to the removal of nucleation-mode particles as a result of increased coagulation in the accumulation mode (Zhang et al., 2010). Relatively larger SO particles can also be due to secondary sources rather than primary sources, and aging could have also contributed to particle growth as has been suggested for firework particles in Nanning, China (Li et al., 2017). Firework emissions include gases like SO2 which undergo aqueous uptake and oxidation onto particles to form SO. Furthermore, enhanced secondary formation is aided by metals emitted during fireworks that help convert SO2 to SO (Feng et al., 2012; Wang et al., 2007).
Nitrate, Cl−, and Mg2+ mass size distributions all exhibited pronounced peaks in the submicrometer range during the firework event (Fig. 5). The mass sum concentration of the aforementioned ions peaked (46.39 % of the total mass concentration of the three species) between 0.56 and 1.0 µm. On the other hand, their mode appeared between 1.8 and 3.2 µm before and after the firework event (33.02 % and 32.91 % of the total mass concentration of the three species, respectively) (Fig. 5). Nitrate, Cl−, and Mg2+ are emitted during fireworks (Zhang et al., 2017) as finer-sized submicrometer particles (Tsai et al., 2011) compared to background conditions when these species are mostly associated with coarser supermicrometer particles (AzadiAghdam et al., 2019; Cruz et al., 2019; Hilario et al., 2020). Nitrate can also be formed secondarily (Yang et al., 2014) from firework emissions. Firework emissions are associated with lower NO : SO ratios (Feng et al., 2012) compared to days dominated by mobile sources (Arimoto et al., 1996) due to different formation mechanisms (Tian et al., 2014). Consistent with the literature, low NO : SO ratios were also observed during the firework event (before: 0.79, during: 0.25, after: 0.82). A low NO : SO ratio is related to decreased pH of the particles (Cao et al., 2020), which may impact not just air quality and health but also nearby waterbodies where the particles may deposit. It is important to note that background supermicrometer Cl− and Mg2+ in Manila are most likely associated with sea salt, while background supermicrometer NO possibly in the form of NaNO3 (de Leeuw et al., 2001) or NH4NO3 likely stems from partitioning of nitric acid gas onto surfaces (de Leeuw et al., 2001) of coarse particles such as sea salt and dust (AzadiAghdam et al., 2019; Cruz et al., 2019). The Cl− : Na+ mass ratio during the firework event increased to 4.44 (from 0.69 and 1.08 before and after, respectively) and was higher than the typical Cl− : Na+ ratio in seawater of 1.81 (Braun et al., 2017). These ratio results confirm that the increase in Cl− concentrations during the firework event is not driven by sea salt but instead linked to firework emissions. The lack of increased sea salt influence during the firework event, which is not to be expected, is further confirmed by relatively small changes in the amount of observed Na+, as will be discussed subsequently.
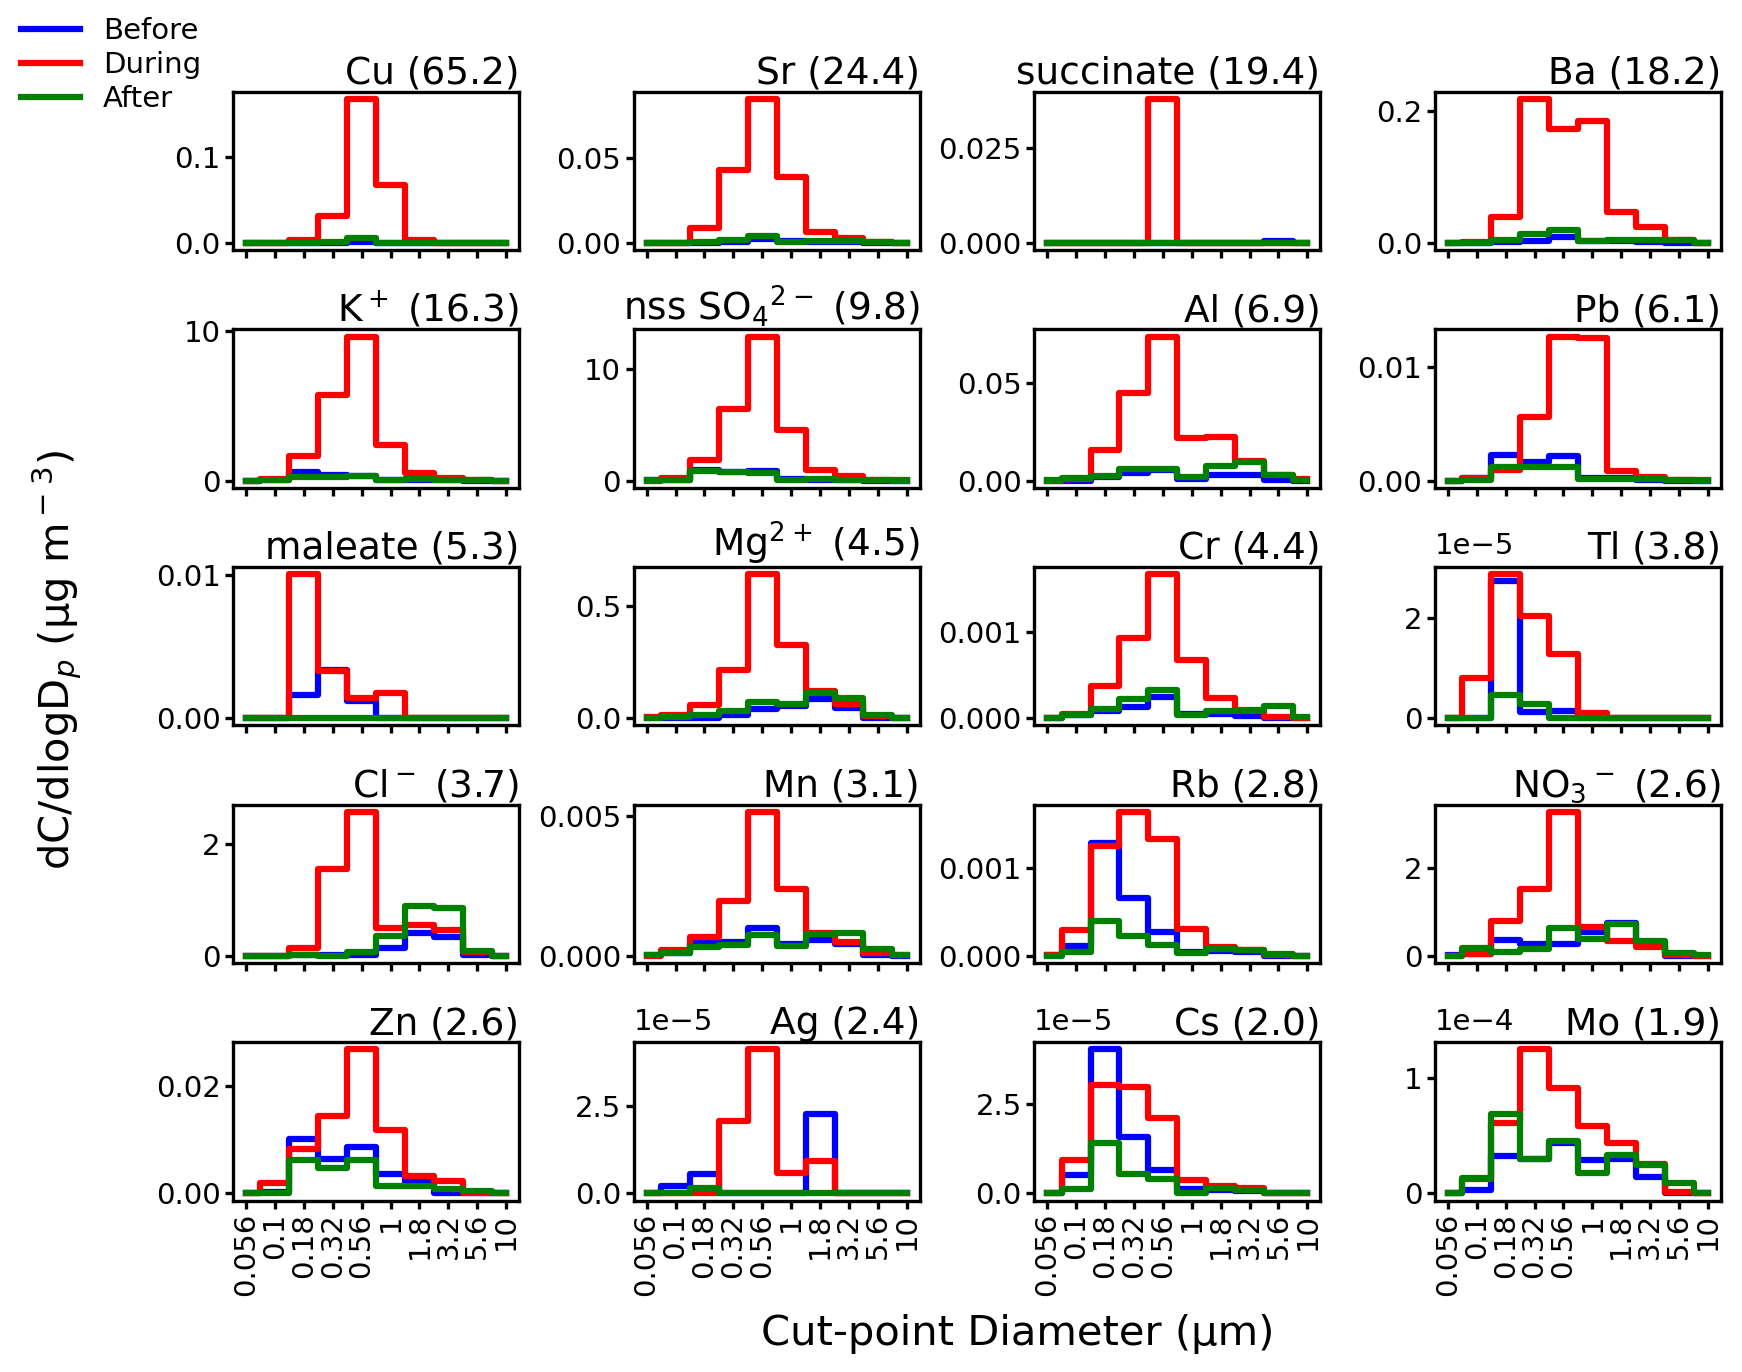
Figure 5Speciated mass size distributions before (blue line), during (red line), and after (green line) the firework event. Next to species labels are bulk (≥0.056 µm) mass concentration enrichment values due to the firework event; species are shown with enrichments ≥1.9. Figure S5 shows similar results for all other species.
The Na+, Ca2+, and NH mass size distributions peak in the supermicrometer range (1.8 to 3.2 µm) (Fig. S5), and total mass concentrations (Table 1) varied minimally, relative to the earlier mentioned species, before (0.33, 0.21, 0.21 µg m−3, respectively), during (0.33, 0.30, 0.19 µg m−3) and after (0.53, 0.38, 0.28 µg m−3) the firework event. The minimal change in NH mass concentration is most likely due to little or no variation of its precursor gas (e.g., NH3) due to firework activities and the fact that firework materials are commonly composed of K-rich salts rather than NH salts (Zhang et al., 2019). The latter seems probable because the K : S mass ratios of 2.75 and 2.71, observed from 0.18–0.32 µm and 0.32–0.56 µm, respectively, during the firework event suggest a firework-related source of K and S. This ratio is similar to the K : S ratio of 2.75 (Dutcher et al., 1999) of black powder (Perry, 1999), a type of pyrotechnic comprised of K and S.
The mass size distribution for the sum of the rest of the species (“others” in Fig. 4) shifted from having a peak at the smaller end of the accumulation mode (0.18–0.32 µm) before and after the firework event to larger sizes in the accumulation mode (0.56–1.0 µm) during the firework event. The shift in mode to slightly larger particles during the firework event may be due to increased coagulation sinks (Zhang et al., 2010) and secondary production (Retama et al., 2019). An additional coarse peak (3.2–5.6 µm) observed after the firework event is mainly attributed to sea salt constituents (e.g., Cl−, Na+) and likely unrelated to firework emission aging and processing. The mass contribution of the “others” to the total measured water-soluble mass concentration decreased during the firework event to 4.3 % from 12.5 % before and 11.6 % after the firework event due to the prevalence of the ionic species (nss-SO, K+, NO, Cl−, Mg2+, Na+, Ca2+, and NH) discussed earlier (Table 1).
3.4 Enriched tracers in firework emissions
Here we more closely examine how much concentrations of species changed during the firework event. Bulk mass concentrations of 18 of the 41 measured species were enriched during the firework event by more than 2 times compared to the average of their bulk mass concentrations before and after the firework event (Fig. 5). Enrichments for Cu (65.2), Sr (24.4), succinate (19.4), Ba (18.2), K+ (16.3), nss-SO (9.8), Al (6.9), Pb (6.1), and maleate (5.3) were highest (>5) among the species measured (Fig. 5). Potassium and nss-SO together contributed to 70.9 % of the total measured species during the firework event (Table 1). However, Cu, Sr, succinate, Ba, Al, Pb, and maleate contributed a total of only 2.1 % to the total measured species mass concentration. This reinforces the importance of looking at enrichments rather than absolute mass concentrations for identifying which aerosol constituents are firework tracers. Tracer metals in firework emissions were previously shown to contribute a small fraction (∼<2 %) to total PM mass (Jiang et al., 2014).
Of the 18 species with observed enrichments exceeding two (Fig. 5), only those which are firework components and that are uninfluenced by secondary formation are considered tracers. The identified 14 firework tracers based on these criteria are as follows: Cu, Sr, Ba, K+, Al, Pb, Mg2+, Cr, Tl, Cl−, Mn, Rb, Zn, and Ag. Metals are usually in the form of Cl− salts in fireworks (Wang et al., 2007). In this study, the enrichment of Cl− during the firework event was found to be 3.7. Some of the identified tracer metals are regulated, and their detection is of concern. Magnesium is not recommended as a firework component because it is sensitive to heat and can easily ignite in storage (Do et al., 2012). Lead is highly toxic and thus regulated (Moreno et al., 2010) as its occurrence in fireworks is a serious health hazard. Although SO, maleate (fuel), and NO (oxidant) were also enriched by more than 2 times during the firework event and are also firework components (Zhang et al., 2019), they can be formed secondarily via gas-to-particle conversion processes (Yang et al., 2014) and are not considered as firework tracers. Succinate is likewise formed secondarily and is not considered a firework tracer (Wang et al., 2007). The identified firework tracers with the highest enrichments (>5) (excluding K+), including Cu, Sr, Ba, Al, and Pb, together contributed 2.1 % to the total measured species mass concentration during the firework event (Table 1).
Size-resolved enrichments (Fig. 6) were highest in the submicrometer range for most measured species. This is consistent with past studies such as in Italy (Vecchi et al., 2008), Taiwan (Do et al., 2012), and Spain (Crespo et al., 2012) where elemental concentrations due to pyrotechnics increased in the submicrometer mode. The peak size-differentiated enrichments of the first five firework tracers Sr (45.08), Ba (57.82), K+ (48.70), Al (18.75), and Pb (69.07) were in the 1.0–1.8 µm size range. Copper (49.85) peaked between 0.56–1.0 µm because it did not have valid data for diameters exceeding 1.0 µm. Strontium and Ba had very high enrichments (254.40 and 195.84) from 0.1–0.18 µm due to very low concentrations before and after the firework event in that size range. Enrichments of up to ∼ 1000 (Crespo et al., 2012) for Sr and Ba have been observed due to pyrotechnics, and both are known firework tracers (Kong et al., 2015).
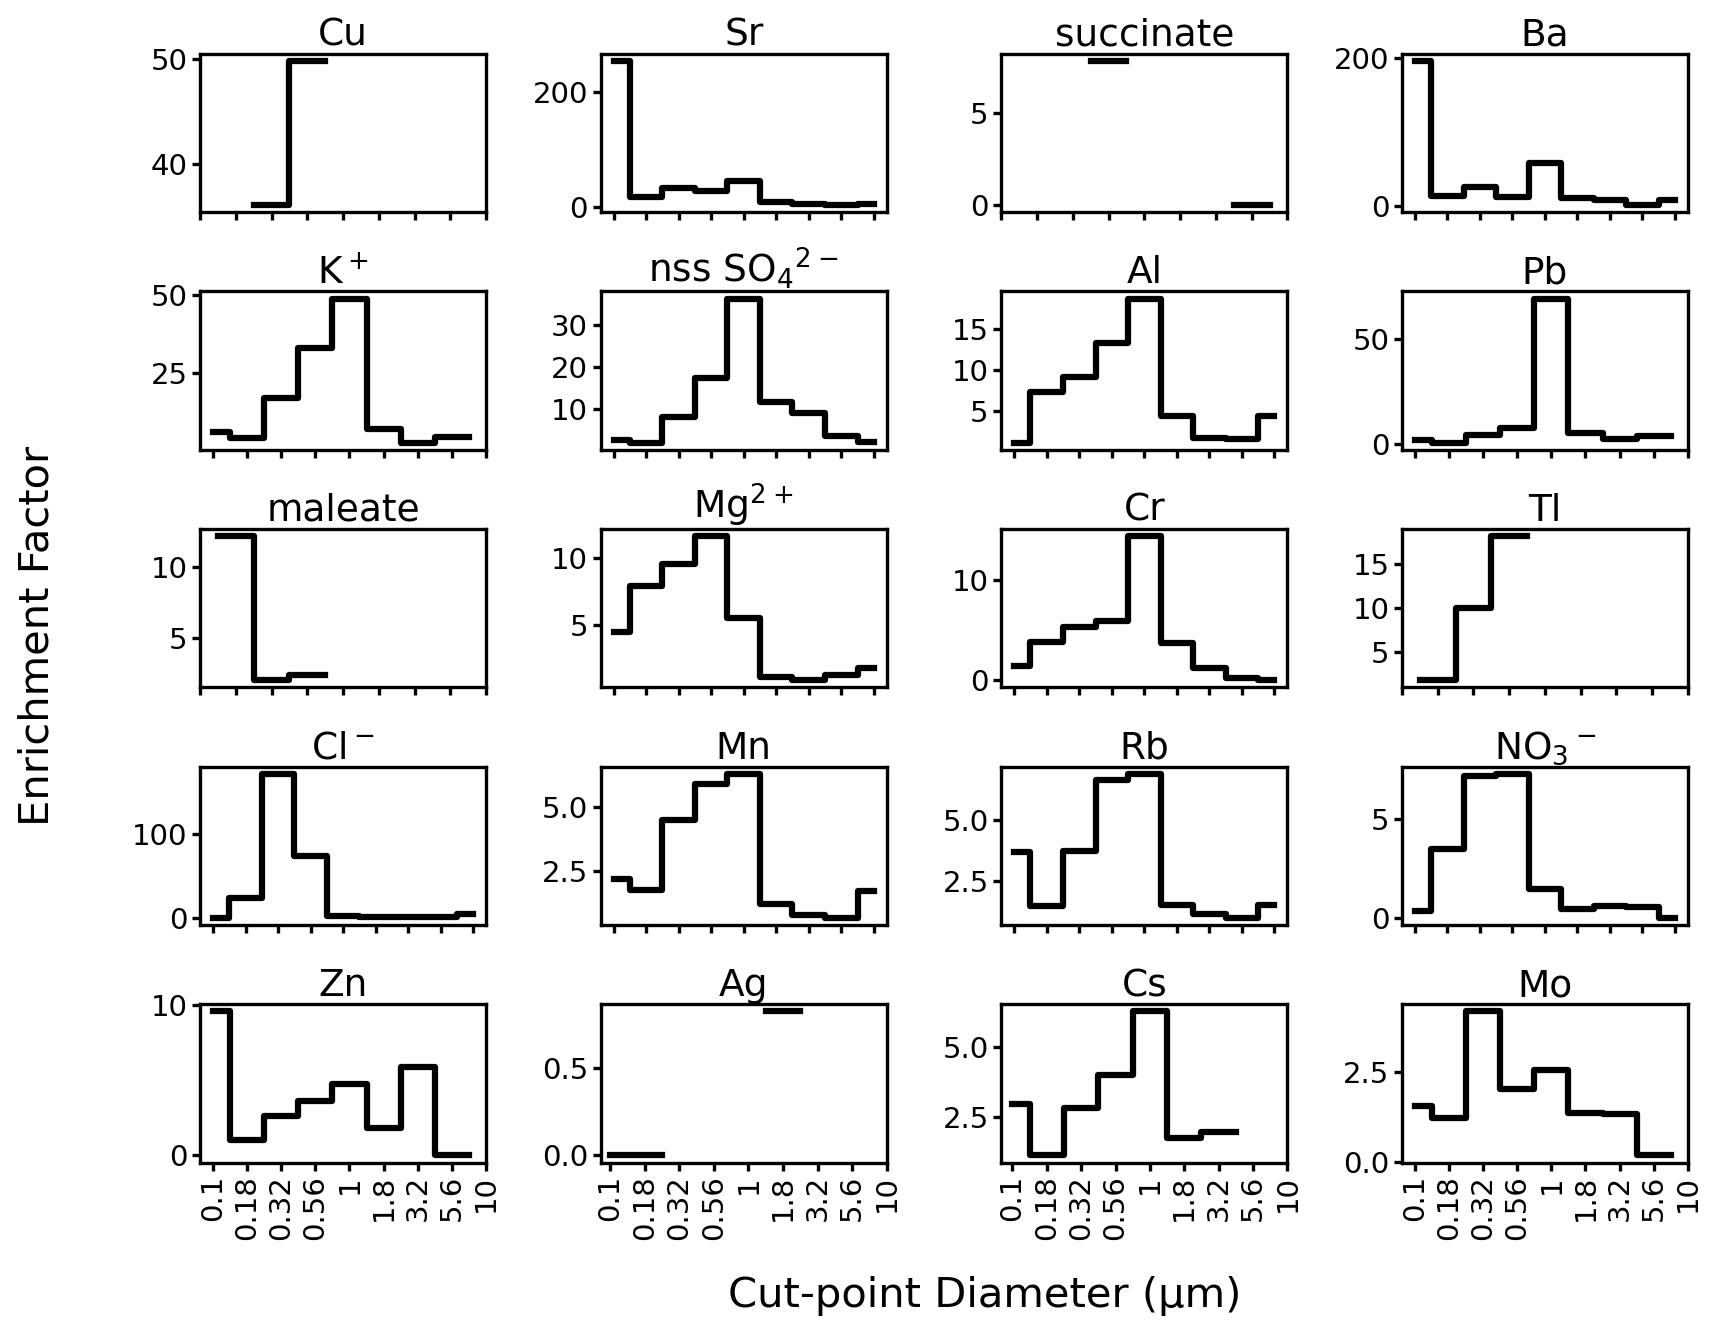
Figure 6Size-resolved enrichments for individual firework tracer species in order of decreasing total bulk mass concentration enrichment (species from Fig. 5). Cut-point diameters with no valid data are left blank. The y axis of Sr and Ba is truncated to more easily show enrichments in the larger size fractions. Figure S6 shows similar results for all other species.
The size-resolved enrichments of other notable species (Figs. 6 and S6) peaked at specific size ranges between 0.32–1.8 µm: Mg2+ (18.93, 0.056–0.1 µm), Cr (14.37, 1.0–1.8 µm), Tl (18.12, 0.56–1.0 µm), Cl− (170.94, 0.32–0.56 µm), Mn (6.29, 1.0–1.8 µm), Rb (6.87, 1.0–1.8 µm), NO (7.26, 0.56–1.0 µm), Cs (6.28, 1.0–1.8 µm), Mo (4.15, 0.32–0.56 µm), Ti (6.63, 0.32–0.56 µm), Co (17.94, 0.56–1.0 µm), and methanesulfonate (MSA) (6.66, 0.56–1.0 µm). Among all the measured water-soluble species, Cl− had the highest size-resolved enrichment, followed by Sr, Ba, K+, Pb, and Cu. This is expected because inorganic salts comprise an enormous percentage of firework emissions (Martín-Alberca et al., 2016).
3.5 SEM-EDX
In addition to size-resolved species concentrations, the morphology of particles is important with regard to their optical properties, hygroscopicity, and their transport behavior. Five SEM images from the different stages (0.18–1 µm) of the MOUDI sampler with possible firework influence are highlighted (Fig. 7). There were signs of nanoscale aggregation that were chain-like and reminiscent of soot particles from pyrolysis and combustion (Pirker et al., 2020; Pósfai et al., 2003; D'Anna and Sirignano, 2015) in all of the images, and especially distinct in the 0.1–0.18 µm (Fig. 4b) and 0.18–0.32 µm (Fig. 7c) stages. Images for larger sizes revealed relatively larger particles appearing as a translucent crystal-shaped rectangle in the 0.32–0.56 µm image (Fig. 7d), in addition to a capsule-shaped particle (Fig. 7e) and a cubic–shaped particle (Fig. 7f) in the two 0.56–1.0 µm images. The presence of such non-spherical shapes including chain aggregates points to the potential for particle collapse and shrinking associated with humidified conditions as noted in past work (Shingler et al., 2016, and references therein).

Figure 7Scanning electron microscope (SEM) images of (a) a blank PTFE (Teflon) substrate and (b–f) particles in different diameter ranges with firework influence: (b) 0.1–0.18 µm, (c) 0.18–0.32 µm, (d) 0.32–0.56 µm, and (e–f) 0.56–1.0 µm.
The chemical composition of the blank Teflon substrate (Fig. 7a) was examined first by EDX to determine the background signals before the actual samples were analyzed. The color intensity of the element maps (Fig. S7) relates the concentration of the analyzed element relative to the backscattered electron image (grayscale) of the sample. The background substrate was dominated by C, F, and Al (bright yellow, bright blue, and bright blue-green, respectively, in Fig. S7-a1/a2/a3). Metallic elements were distributed in each of the five featured SEM images. Molybdenum and K were present in all of the substrate stages (bright red in Fig. S7-b3/b4/c3/c8/d7/d8/e6/e7/f6/f9). Other metals were also found in the different stages such as K, Mg, Al, Ru, Pd, Ba, Hf, and Tl. The identified heavy metals in the particles are commonly used in firework as fuel components, colorants, and oxidants (Singh et al., 2019). Potassium, Mg, Al, Ba, and Tl are in the group of firework tracers that were already identified (Sect. 3.4 and Fig. 5) to have mass bulk concentration enrichments exceeding two. Molybdenum exhibited a reduced mass bulk concentration enrichment of 1.93 (Fig. 5) but had size-resolved enrichments between 1.21 and 4.15 (Fig. 6) in the substrate cutouts analyzed for EDX. The cube-shaped feature in the 0.56–1.0 µm substrate appears to be KCl because of the high color density of K and Cl in the elemental maps (bright red and bright blue-green in Fig. S7-f6/f8) and because the shape of KCl is cubic (Pirker et al., 2020). The crystal-shaped rectangle in the 0.32–0.56 µm range appears to be enriched by Cl (bright blue-green in Fig. S7-d6). The same applies to the capsule-shaped particle in 0.56–1.0 µm image (bright blue-green in Fig. S7-e5). The chloride ion (Cl−) is a component of metal salts, usually in the form of ClO or ClO (Tian et al., 2014) used to color fireworks (Shimizu, 1981).
These results of the sampled portions of the substrate stages are consistent with the results of the size-resolved submicrometer enrichments measured by IC and ICP-QQQ (Sect. 3.4) for Mo, K, Mg, Al, Ba, and Tl. Molybdenum was brightest red in the 0.32–0.56 µm image (Fig. S7-d8), consistent with the highest enrichments (4.15 in Fig. 6) for that size range. Potassium was brightest red in the 0.56–1.0 µm image (Fig. S7-e6/f6), consistent with highest enrichments (33.04 in Fig. 6). Magnesium was brightest yellow from 0.32–1.0 µm (Fig. S7-d4/e3/f4), consistent with highest enrichments (9.50 and 11.58 in Fig. 6). Aluminum had a high signal in the blank Teflon substrate but also was brightest blue-green (Fig. S7-d5/e4/f5) in between 0.32–1.0 µm in the sample during the firework event, consistent with highest enrichments (9.22 and 13.32 in Fig. 6). Barium was detected by EDX between 0.56–1.0 µm (Fig. S7-f11), where its enrichment was 12.39 (Fig. 6). Thallium was detected between 0.56 and 1.0 µm (Fig. S7-f13) by EDX, where its enrichment was highest (18.12 in Fig. 7) as detected by ICP-QQQ. The submicrometer metal salts due to fireworks can uptake water at high humidity (ten Brink et al., 2018).
3.6 Hygroscopicity analysis
As fireworks alter the chemical profile of ambient PM, we estimate how aerosol hygroscopicity responded during fireworks relative to periods before and after. For reference, typical κ values range from 0.1 to 0.5 for diverse air mass types such as urban, marine, biogenic, biomass burning, and free troposphere (Dusek et al., 2010; Hersey et al., 2013; Shingler et al., 2016; Shinozuka et al., 2009). AzadiAghdam et al. (2019) reported size-resolved values ranging from 0.02 to 0.31 using data from the same field site in Metro Manila but for a different time period and without any firework influence (July–December 2018). They found the highest values to be coincident with MOUDI stages with most sea salt influence (3.2–5.6 µm).
For this study, a bulk κ value is reported for the size range between 0.056–3.2 µm as noted in Sect. 2.7, and subsequent references to composition data are for this size range. Kappa was enhanced during the firework event (0.18) compared to before (0.11), due mostly to increased contributions from K2SO4 and Mg(NO3)2 (Fig. 8a). This is expected because based on the ZSR mixing rule (Stokes and Robinson, 1966) the bulk hygroscopicity (κ) is dependent on the sum of the κ values for individual non-interacting compounds weighted by their respective volume fractions. More specifically, the volume fractions of K2SO4 and Mg(NO3)2 increased from 0.01 to 0.10 and 0.01 to 0.03, respectively (Fig. 8b). Notable reductions in volume fraction during the firework event were for NaNO3 (0.01 to 0.00), black carbon (0.26 to 0.12), and (NH4)2SO4 (0.02 to 0.01) (Fig. 8b). All three species are not associated with primary firework emissions. Although NaNO3 and (NH4)2SO4 are hygroscopic, their decreased volume fractions happened alongside a decreased volume fraction of non-hygroscopic black carbon and increased volume fractions of the firework-related and hygroscopic K2SO4 and Mg(NO3)2, which increased bulk aerosol hygroscopicity during the firework event.
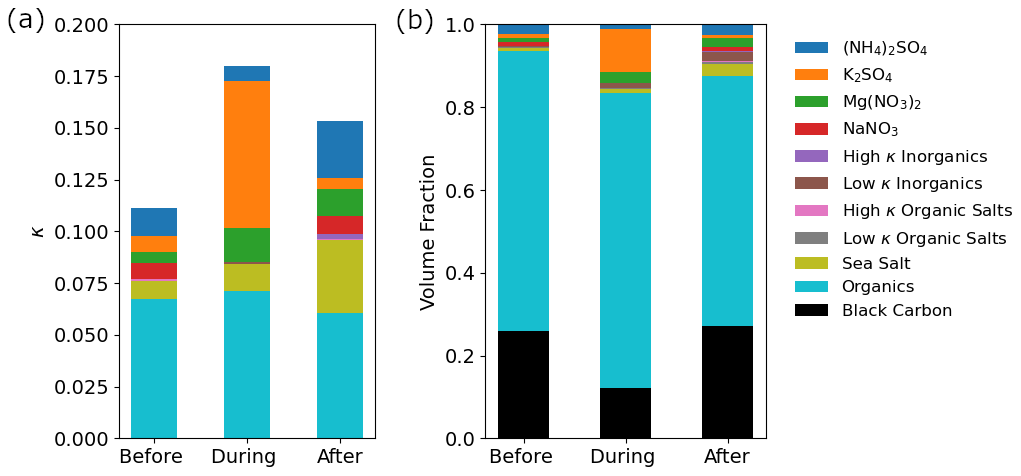
Figure 8(a) Kappa (κ) values for the aerosol fraction between 0.056–3.2 µm before, during, and after the firework event. The speciated contributions to the overall κ values (represented by the colors) are categorized based on the classes of compounds in the legend following past work (AzadiAghdam et al., 2019). Ammonium sulfate, K2SO4, Mg(NO3)2, and NaNO3 are high κ inorganics but are plotted separately because of their large contributions. The speciated contributions were calculated by multiplying the (b) volume fraction of each compound class by its intrinsic κ value (Table S4).
Kappa decreased to an intermediate value after the firework event (0.15) (Fig. 8a); this value exceeds that from before the fireworks owing partly to more sea salt influence that was unrelated to fireworks. The change in volume fraction of sea salt from before and during fireworks (0.01) to after the fireworks (0.03) (Fig. 8b) translated to an increase of 0.03 in bulk κ (Fig. 8a) from before to after the firework event. Although fireworks emit extensive amounts of inorganic species, the calculated κ values were still relatively low because the background air is dominated by organics and black carbon, which are relatively hydrophobic species (Table S4) (Cohen et al., 2009; Oanh et al., 2006; Cruz et al., 2019).
This study reports on important aerosol characteristics measured during the 2019 New Year fireworks in Metro Manila. Notable results of this work, following the order of questions raised at the end of Sect. 1, are as follows.
-
Firework activities caused significant enhancement of PM2.5, reaching a maximum of 383.9 µg m−3 between 01:00 and 02:00 on 1 January 2019. Surface aerosol loading increased over a period of 8 h during the firework event, coincident with peak PM2.5 levels. The heaviest aerosol layer measured by the HSRL lidar was observed for at least an hour and reached ∼440 m above the surface, after which the aerosol layer dropped to 118 ± 20 m. Aerosol backscatter during the firework activity decreased noticeably for short periods after rainfall. Furthermore, rainfall, wind, and relative humidity also possibly contributed to washout, local dispersion, and secondary formation of particles, respectively. There was no significant influence from long-range transport to the sampling site, confirming that the sample data were most representative of the local nature of particulate enhancements observed during the firework event.
-
The firework event enhanced bulk concentrations of water-soluble aerosol species, especially in the submicrometer range. Mass size distributions of the water-soluble species shifted to slightly larger accumulation-mode sizes most likely due to increased coagulation sinks and secondary formation. Potassium and nss-SO were the major water-soluble contributors. Cubic and capsule-shaped Cl−-rich particles were prominent in submicrometer particles collected during the firework event, suggesting the presence of KCl. Inorganic species including Cu, Sr, Ba, K+, Al, Pb, Mg2+, Cr, Tl, Cl−, Mn, Rb, Zn, and Ag were enriched by more than 2 times by mass during the firework event as compared to before and after the event. While the most enriched inorganic firework tracers, including Cu, Sr, Ba, Al, and Pb (excluding K+), comprised only 2.1 % of the total water-soluble mass, their contribution is significant because they support findings that the samples represent firework emissions. The increased volume fractions of inorganics increased aerosol hygroscopicity (κ) between 0.056 and 3.2 µm from 0.11 (before the fireworks) to 0.18 during the firework event.
Fireworks caused unhealthy levels of PM2.5 that exceeded the Philippine (50.0 µg m−3), US (35.0 µg m−3), and World Health Organization (WHO, 25.0 µg m−3) standards for PM2.5 over 24 h. The brief but sharply enhanced concentrations of water-soluble species in the submicrometer size range, especially for K+ and SO, have implications for both public health and the environment, the former of which is owing to how smaller particles can penetrate more deeply into the human respiratory system. Some of the components detected during the fireworks were submicrometer Pb and Mg2+, which is of concern because these are banned substances due to their being health and fire hazards, respectively. The presence of Pb in the firework emissions exacerbates the presence of submicrometer Pb in Metro Manila (Gonzalez et al., 2021). The results show the opportunity that improved quality and management of fireworks can have for better local air quality.
Higher concentrations of secondary particles in the accumulation mode from fireworks are related to increased mass extinction efficiency and therefore decreased visibility (Jiang et al., 2014), as was observed in this study. The increased water-soluble fraction, especially in the submicrometer mode, during firework events coincides with elevated particle hygroscopicity, which is related to CCN activity (Drewnick et al., 2006) at smaller diameters (Yuan et al., 2020), with implications that can be better assessed in a future study. The atmospheric environment in Southeast Asia, coupled with increasing emissions and extreme sources such as fireworks, offers a unique field laboratory for the study of aerosol aqueous processes.
Size-resolved aerosols data collected at the Manila Observatory can be found in Stahl et al. (2020a) on figshare at https://doi.org/10.6084/m9.figshare.11861859 as well as on the NASA data repository at https://doi.org/10.5067/Suborbital/CAMP2EX2018/DATA001 (NASA, 2020).
The supplement related to this article is available online at: https://doi.org/10.5194/acp-21-6155-2021-supplement.
MTC, MOC, JBS, RB, ABMD, CS, and AS designed the experiments. All coauthors carried out various aspects of the data collection. MTC, ELE, SMV, RH, GL, LM, CS, and AS conducted analysis and interpretation of the data. ELE, LM, SMV, RH, GRL, and AS prepared the manuscript with contributions from the coauthors.
The authors declare that they have no conflict of interest.
This article is part of the special issue “Cloud Aerosol and Monsoon Processes Philippines Experiment (CAMP2Ex) (ACP/AMT inter-journal SI)”. It is not associated with a conference.
The authors acknowledge support from NASA grant 80NSSC18K0148 in support of the NASA CAMP2Ex project. Rachel Braun acknowledges support from the ARCS Foundation. Melliza Templonuevo Cruz acknowledges support from the Philippine Department of Science and Technology's ASTHRD Program. Alexander B. MacDonald acknowledges support from the Mexican National Council for Science and Technology (CONACYT). We acknowledge Agilent Technologies for their support and Shane Snyder's laboratories for ICP-QQQ data. We thank the Department of Environment and Natural Resources Environmental Management Bureau (DENR-EMB) Central Office Air Quality Management Section in the Philippines and the Air Center for Air Pollution Research in Japan of EANET for the hourly PM2.5 data. The tradition of sampling the New Year air quality in Metro Manila was instilled by Dan McNamara, SJ, Jett Villarin, SJ, and Gemma Narisma, and for this we are grateful.
This research has been supported by the National Aeronautics and Space Administration (grant no. 80NSSC18K0148).
This paper was edited by Tuukka Petäjä and reviewed by two anonymous referees.
Agus, E. L., Lingard, J. J., and Tomlin, A. S.: Suppression of nucleation mode particles by biomass burning in an urban environment: a case study, J. Environ. Monitor., 10, 979–988, 2008.
Aldhaif, A. M., Lopez, D. H., Dadashazar, H., and Sorooshian, A.: Sources, frequency, and chemical nature of dust events impacting the United States East Coast, Atmos. Environ., 231, 117456, https://doi.org/10.1016/j.atmosenv.2020.117456, 2020.
Alpert, D. J. and Hopke, P. K.: A determination of the sources of airborne particles collected during the regional air pollution study, Atmos. Environ., 15, 675–687, 1981.
Arimoto, R., Duce, R., Savoie, D., Prospero, J., Talbot, R., Cullen, J., Tomza, U., Lewis, N., and Ray, B.: Relationships among aerosol constituents from Asia and the North Pacific during PEM-West A, J. Geophys. Res.-Atmos., 101, 2011–2023, 1996.
AzadiAghdam, M., Braun, R. A., Edwards, E.-L., Bañaga, P. A., Cruz, M. T., Betito, G., Cambaliza, M. O., Dadashazar, H., Lorenzo, G. R., and Ma, L.: On the nature of sea salt aerosol at a coastal megacity: Insights from Manila, Philippines in Southeast Asia, Atmos. Environ., 216, 116922, https://doi.org/10.1016/j.atmosenv.2019.116922, 2019.
Barman, S., Singh, R., Negi, M., and Bhargava, S.: Ambient air quality of Lucknow City (India) during use of fireworks on Diwali Festival, Environ. Monit. Assess., 137, 495–504, 2008.
Becker, J. M., Iskandrian, S., and Conkling, J.: Fatal and near-fatal asthma in children exposed to fireworks, Ann. Allerg. Asthma Im., 85, 512–513, 2000.
Beig, G., Chate, D., Ghude, S. D., Ali, K., Satpute, T., Sahu, S., Parkhi, N., and Trimbake, H.: Evaluating population exposure to environmental pollutants during Deepavali fireworks displays using air quality measurements of the SAFAR network, Chemosphere, 92, 116–124, 2013.
Braun, R. A., Dadashazar, H., MacDonald, A. B., Aldhaif, A. M., Maudlin, L. C., Crosbie, E., Aghdam, M. A., Hossein Mardi, A., and Sorooshian, A.: Impact of wildfire emissions on chloride and bromide depletion in marine aerosol particles, Environ. Sci. Technol., 51, 9013–9021, 2017.
Braun, R. A., Aghdam, M. A., Bañaga, P. A., Betito, G., Cambaliza, M. O., Cruz, M. T., Lorenzo, G. R., MacDonald, A. B., Simpas, J. B., Stahl, C., and Sorooshian, A.: Long-range aerosol transport and impacts on size-resolved aerosol composition in Metro Manila, Philippines, Atmos. Chem. Phys., 20, 2387–2405, https://doi.org/10.5194/acp-20-2387-2020, 2020.
Burton, S. P., Vaughan, M. A., Ferrare, R. A., and Hostetler, C. A.: Separating mixtures of aerosol types in airborne High Spectral Resolution Lidar data, Atmos. Meas. Tech., 7, 419–436, https://doi.org/10.5194/amt-7-419-2014, 2014.
Cao, Y., Zhang, Z., Xiao, H., Xie, Y., Liang, Y., and Xiao, H.: How aerosol pH responds to nitrate to sulfate ratio of fine-mode particulate, Environ. Sci. Pollut. R., 27, 1–9, 2020.
Carranza, J., Fisher, B., Yoder, G., and Hahn, D.: On-line analysis of ambient air aerosols using laser-induced breakdown spectroscopy, Spectrochim. Acta B, 56, 851–864, 2001.
Chatterjee, A., Sarkar, C., Adak, A., Mukherjee, U., Ghosh, S., and Raha, S.: Ambient air quality during Diwali Festival over Kolkata-a mega-city in India, Aerosol Air Qual. Res., 13, 1133–1144, 2013.
Cheng, Y., Engling, G., He, K.-B., Duan, F.-K., Du, Z.-Y., Ma, Y.-L., Liang, L.-L., Lu, Z.-F., Liu, J.-M., and Zheng, M.: The characteristics of Beijing aerosol during two distinct episodes: Impacts of biomass burning and fireworks, Environ. Pollut., 185, 149–157, 2014.
Cohen, D. D., Stelcer, E., Santos, F. L., Prior, M., Thompson, C., and Pabroa, P. C.: Fingerprinting and source apportionment of fine particle pollution in Manila by IBA and PMF techniques: A 7-year study, X-Ray Spectrom., 38, 18–25, 2009.
Crespo, J., Yubero, E., Nicolás, J. F., Lucarelli, F., Nava, S., Chiari, M., and Calzolai, G.: High-time resolution and size-segregated elemental composition in high-intensity pyrotechnic exposures, J. Hazard. Mater., 241, 82–91, 2012.
Crosbie, E., Sorooshian, A., Monfared, N. A., Shingler, T., and Esmaili, O.: A multi-year aerosol characterization for the greater Tehran area using satellite, surface, and modeling data, Atmosphere, 5, 178–197, 2014.
Cruz, M. T., Bañaga, P. A., Betito, G., Braun, R. A., Stahl, C., Aghdam, M. A., Cambaliza, M. O., Dadashazar, H., Hilario, M. R., Lorenzo, G. R., Ma, L., MacDonald, A. B., Pabroa, P. C., Yee, J. R., Simpas, J. B., and Sorooshian, A.: Size-resolved composition and morphology of particulate matter during the southwest monsoon in Metro Manila, Philippines, Atmos. Chem. Phys., 19, 10675–10696, https://doi.org/10.5194/acp-19-10675-2019, 2019.
D'Anna, A. and Sirignano, M.: Detailed kinetic mechanisms of PAH and soot formation, in: Computer Aided Chemical Engineering, Elsevier, https://doi.org/10.1016/B978-0-444-64087-1.00012-7, 647–672 pp., 2019.
Dela Piedra, M. C.: A Filipino Tradition: The Role of Fireworks and Firecrackers in the Philippine Culture, TALA, 1, 141–153, 2018.
de Leeuw, G., Cohen, L., Frohn, L. M., Geernaert, G., Hertel, O., Jensen, B., Jickells, T., Klein, L., Kunz, G. J., and Lund, S.: Atmospheric input of nitrogen into the North Sea: ANICE project overview, Cont. Shelf Res., 21, 2073–2094, 2001.
Devara, P. C., Vijayakumar, K., Safai, P. D., Made, P. R., and Rao, P. S.: Celebration-induced air quality over a tropical urban station, Pune, India, Atmos. Pollut. Res., 6, 511–520, 2015.
Do, T.-M., Wang, C.-F., Hsieh, Y.-K., and Hsieh, H.-F.: Metals present in ambient air before and after a firework festival in Yanshui, Tainan, Taiwan, Aerosol Air Qual. Res., 12, 981–993, 2012.
Dorado, S. V., Holdsworth, J. L., Lagrosas, N. C., Villarin, J. R., Narisma, G., Ellis, J., and Perez, R.: Characterization of urban atmosphere of Manila with lidar, filter sampling, and radiosonde, P. Soc. Photo.-Opt. Ins., 4153, 591–598, 2001.
Drewnick, F., Hings, S. S., Curtius, J., Eerdekens, G., and Williams, J.: Measurement of fine particulate and gas-phase species during the New Year's fireworks 2005 in Mainz, Germany, Atmos. Environ., 40, 4316–4327, 2006.
Dusek, U., Frank, G., Curtius, J., Drewnick, F., Schneider, J., Kürten, A., Rose, D., Andreae, M. O., Borrmann, S., and Pöschl, U.: Enhanced organic mass fraction and decreased hygroscopicity of cloud condensation nuclei (CCN) during new particle formation events, Geophys. Res. Lett., 37, L03804, https://doi.org/10.1029/2009GL040930, 2010.
Dutcher, D. D., Perry, K. D., Cahill, T. A., and Copeland, S. A.: Effects of indoor pyrotechnic displays on the air quality in the Houston Astrodome, JAPCA J. Air Waste Ma., 49, 156–160, 1999.
Ennis, J. L. and Shanley, E. S.: On hazardous silver compounds, J. Chem. Educ., 68, A6, https://doi.org/10.1021/ed068pA6, 1991.
Feng, J., Sun, P., Hu, X., Zhao, W., Wu, M., and Fu, J.: The chemical composition and sources of PM2.5 during the 2009 Chinese New Year's holiday in Shanghai, Atmos. Res., 118, 435–444, 2012.
Gonzalez, M. E., Stahl, C., Cruz, M. T., Bañaga, P. A., Betito, G., Braun, R. A., Aghdam, M. A., Cambaliza, M. O., Lorenzo, G. R., MacDonald, A. B., Simpas, J. B., Csavina, J., Sáez, E. A., Betterton, E., and Sorooshian, A.: Contrasting the size-resolved nature of particulate arsenic, cadmium, and lead among diverse regions, Atmos. Pollut. Res., 12, 352–361, https://doi.org/10.1016/j.apr.2021.01.002, 2021.
Gysel, M., Crosier, J., Topping, D. O., Whitehead, J. D., Bower, K. N., Cubison, M. J., Williams, P. I., Flynn, M. J., McFiggans, G. B., and Coe, H.: Closure study between chemical composition and hygroscopic growth of aerosol particles during TORCH2, Atmos. Chem. Phys., 7, 6131–6144, https://doi.org/10.5194/acp-7-6131-2007, 2007.
Hersey, S. P., Craven, J. S., Metcalf, A. R., Lin, J., Lathem, T., Suski, K. J., Cahill, J. F., Duong, H. T., Sorooshian, A., and Jonsson, H. H.: Composition and hygroscopicity of the Los Angeles aerosol: CalNex, J. Geophys. Res.-Atmos., 118, 3016–3036, 2013.
Hilario, M. R. A., Cruz, M. T., Bañaga, P. A., Betito, G., Braun, R. A., Stahl, C., Cambaliza, M. O., Lorenzo, G. R., MacDonald, A. B., and AzadiAghdam, M.: Characterizing weekly cycles of particulate matter in a coastal megacity: The importance of a seasonal, size-resolved, and chemically-speciated analysis, J. Geophys. Res.-Atmos., 125, e2020JD032614, https://doi.org/10.1029/2020JD032614, 2020.
Hirai, K., Yamazaki, Y., Okada, K., Furuta, S., and Kubo, K.: Acute eosinophilic pneumonia associated with smoke from fireworks, Internal Med., 39, 401–403, 2000.
Hooper, W. P. and Eloranta, E. W.: Lidar measurements of wind in the planetary boundary layer: the method, accuracy and results from joint measurements with radiosonde and kytoon, J. Clim. Appl. Meteorol., 25, 990–1001, 1986.
Hopke, P. K., Cohen, D. D., Begum, B. A., Biswas, S. K., Ni, B., Pandit, G. G., Santoso, M., Chung, Y.-S., Davy, P., and Markwitz, A.: Urban air quality in the Asian region, Sci. Total Environ., 404, 103–112, 2008.
Hussein, T., Dal Maso, M., Petaja, T., Koponen, I. K., Paatero, P., Aalto, P. P., Hameri, K., and Kulmala, M.: Evaluation of an automatic algorithm for fitting the particle number size distributions, Boreal Environ. Res., 10, 337, 2005.
Jiang, Q., Sun, Y. L., Wang, Z., and Yin, Y.: Aerosol composition and sources during the Chinese Spring Festival: fireworks, secondary aerosol, and holiday effects, Atmos. Chem. Phys., 15, 6023–6034, https://doi.org/10.5194/acp-15-6023-2015, 2015.
Joly, A., Smargiassi, A., Kosatsky, T., Fournier, M., Dabek-Zlotorzynska, E., Celo, V., Mathieu, D., Servranckx, R., D'amours, R., and Malo, A.: Characterisation of particulate exposure during fireworks displays, Atmos. Environ., 44, 4325–4329, 2010.
Joshi, M., Khan, A., Anand, S., and Sapra, B.: Size evolution of ultrafine particles: Differential signatures of normal and episodic events, Environ. Pollut., 208, 354–360, 2016.
Joshi, M., Nakhwa, A., Khandare, P., Khan, A., and Sapra, B.: Simultaneous measurements of mass, chemical compositional and number characteristics of aerosol particles emitted during fireworks, Atmos. Environ., 217, 116925, https://doi.org/10.1016/j.atmosenv.2019.116925, 2019.
Karnae, S.: Analysis of aerosol composition and characteristics in a semi arid coastal urban area, Master of Science, Kingsville, ProQuest Dissertations Publishing, Texas A&M University-Kingsville, USA, 88 pp., 2005.
Khaparde, V. V., Pipalatkar, P. P., Pustode, T., Rao, C. C., and Gajghate, D. G.: Influence of burning of fireworks on particle size distribution of PM10 and associated barium at Nagpur, Environ. Monit. Assess., 184, 903–911, 2012.
Kong, S. F., Li, L., Li, X. X., Yin, Y., Chen, K., Liu, D. T., Yuan, L., Zhang, Y. J., Shan, Y. P., and Ji, Y. Q.: The impacts of firework burning at the Chinese Spring Festival on air quality: insights of tracers, source evolution and aging processes, Atmos. Chem. Phys., 15, 2167–2184, https://doi.org/10.5194/acp-15-2167-2015, 2015.
Kulshrestha, U., Rao, T. N., Azhaguvel, S., and Kulshrestha, M.: Emissions and accumulation of metals in the atmosphere due to crackers and sparkles during Diwali festival in India, Atmos. Environ., 38, 4421–4425, 2004.
Kumar, M., Singh, R., Murari, V., Singh, A., Singh, R., and Banerjee, T.: Fireworks induced particle pollution: a spatio-temporal analysis, Atmos. Res., 180, 78–91, 2016.
Lai, Y. and Brimblecombe, P.: Changes in air pollution and attitude to fireworks in Beijing, Atmos. Environ., 231, 117549, https://doi.org/10.1016/j.atmosenv.2020.117549, 2020.
Li, J., Xu, T., Lu, X., Chen, H., Nizkorodov, S. A., Chen, J., Yang, X., Mo, Z., Chen, Z., and Liu, H.: Online single particle measurement of fireworks pollution during Chinese New Year in Nanning, J. Environ. Sci., 53, 184–195, 2017.
Licudine, J. A., Yee, H., Chang, W. L., and Whelen, A. C.: Hazardous metals in ambient air due to New Year fireworks during 2004–2011 celebrations in Pearl City, Hawaii, Public Health Rep., 127, 440–450, 2012.
Lin, C.-C.: A review of the impact of fireworks on particulate matter in ambient air, J. Air Waste Ma., 66, 1171–1182, 2016.
Lin, C.-C., Yang, L.-S., and Cheng, Y.-H.: Ambient PM2.5, black carbon, and particle size-resolved number concentrations and the Ångström exponent value of aerosols during the firework display at the lantern festival in southern Taiwan, Aerosol Air Qual. Res, 16, 373–387, 2016.
Liu, D.-Y., Rutherford, D., Kinsey, M., and Prather, K. A.: Real-time monitoring of pyrotechnically derived aerosol particles in the troposphere, Anal. Chem., 69, 1808–1814, 1997.
Marple, V., Olson, B., Romay, F., Hudak, G., Geerts, S. M., and Lundgren, D.: Second generation micro-orifice uniform deposit impactor, 120 MOUDI-II: Design, evaluation, and application to long-term ambient sampling, Aerosol Sci. Tech., 48, 427–433, 2014.
Martín-Alberca, C. and García-Ruiz, C.: Analytical techniques for the analysis of consumer fireworks, TrAC-Trend. Anal. Chem., 56, 27–36, 2014.
Martín-Alberca, C., Zapata, F., Carrascosa, H., Ortega-Ojeda, F. E., and García-Ruiz, C.: Study of consumer fireworks post-blast residues by ATR-FTIR, Talanta, 149, 257–265, 2016.
Mönkkönen, P., Uma, R., Srinivasan, D., Koponen, I., Lehtinen, K., Hämeri, K., Suresh, R., Sharma, V., and Kulmala, M.: Relationship and variations of aerosol number and PM10 mass concentrations in a highly polluted urban environment – New Delhi, India, Atmos. Environ., 38, 425–433, 2004.
Mora, M., Braun, R. A., Shingler, T., and Sorooshian, A.: Analysis of remotely sensed and surface data of aerosols and meteorology for the Mexico Megalopolis Area between 2003 and 2015, J. Geophys. Res.-Atmos., 122, 8705–8723, 2017.
Moreno, T., Querol, X., Alastuey, A., Amato, F., Pey, J., Pandolfi, M., Kuenzli, N., Bouso, L., Rivera, M., and Gibbons, W.: Effect of fireworks events on urban background trace metal aerosol concentrations: is the cocktail worth the show?, J. Hazard. Mater., 183, 945–949, 2010.
NASA: Clouds, Aerosol and Monsoon Processes – Philippines Experiment, Size Resolved Aerosol Composition observed at Manila Observatory from July 19, 2018 to October 2, 2019, NASA [data set], https://doi.org/10.5067/Suborbital/CAMP2EX2018/DATA001, 2020.
Nicolás, J., Yubero, E., Galindo, N., Giménez, J., Castañer, R., Carratalá, A., Crespo, J., and Pastor, C.: Characterization of events by aerosol mass size distributions, J. Environ. Monitor., 11, 394–399, 2009.
Oanh, N. K., Upadhyay, N., Zhuang, Y.-H., Hao, Z.-P., Murthy, D., Lestari, P., Villarin, J., Chengchua, K., Co, H., and Dung, N.: Particulate air pollution in six Asian cities: Spatial and temporal distributions, and associated sources, Atmos. Environ., 40, 3367–3380, 2006.
Perrino, C., Tiwari, S., Catrambone, M., Dalla Torre, S., Rantica, E., and Canepari, S.: Chemical characterization of atmospheric PM in Delhi, India, during different periods of the year including Diwali festival, Atmos. Pollut. Res., 2, 418–427, 2011.
Perry, K. D.: Effects of outdoor pyrotechnic displays on the regional air quality of Western Washington State, J. Air Waste Ma., 49, 146–155, 1999.
Petters, M. D. and Kreidenweis, S. M.: A single parameter representation of hygroscopic growth and cloud condensation nucleus activity, Atmos. Chem. Phys., 7, 1961–1971, https://doi.org/10.5194/acp-7-1961-2007, 2007.
Philippines, DENR: Establishing the Provisional National Ambient Air Quality Guideline Values for Particulate Matter 2.5 (PM2.5), edited by: Department of Environment and Natural Resources, Quezon City, available at: https://air.emb.gov.ph/wp-content/uploads/2017/04/DAO-2013-13-PM2.5.pdf (last access: 1 April 2021), 2013.
Pirker, L., Gradišek, A., Višić, B., and Remškar, M.: Nanoparticle exposure due to pyrotechnics during a football match, Atmos. Environ., 233, 117567, https://doi.org/10.1016/j.atmosenv.2020.117567, 2020.
Pósfai, M., Simonics, R., Li, J., Hobbs, P. V., and Buseck, P. R.: Individual aerosol particles from biomass burning in southern Africa: 1. Compositions and size distributions of carbonaceous particles, J. Geophys. Res., 108, 8483, https://doi.org/10.1029/2002JD002291, 2003.
Prospero, J. M., Savoie, D. L., and Arimoto, R.: Long-term record of nss-sulfate and nitrate in aerosols on Midway Island, 1981–2000: Evidence of increased (now decreasing?) anthropogenic emissions from Asia, J. Geophys. Res., 108, 4019, https://doi.org/10.1029/2001JD001524, 2003.
PSA: NCR Statistics, available at: http://rssoncr.psa.gov.ph/ (last access: 13 February 2021), 2015.
Rao, P. S., Gajghate, D., Gavane, A., Suryawanshi, P., Chauhan, C., Mishra, S., Gupta, N., Rao, C., and Wate, S.: Air quality status during Diwali Festival of India: A case study, B. Environ. Contam. Tox., 89, 376–379, 2012.
Ravindra, K., Mor, S., and Kaushik, C.: Short-term variation in air quality associated with firework events: a case study, J. Environ. Monitor., 5, 260–264, 2003.
Razenkov, I.: Characterization of a Geiger-mode avalanche photodiode detector for high spectral resolution lidar, Master of Science University of Wisconsin–Madison, USA, 72 pp., 2010.
Reid, J. S., Hyer, E. J., Johnson, R. S., Holben, B. N., Yokelson, R. J., Zhang, J., Campbell, J. R., Christopher, S. A., Di Girolamo, L., and Giglio, L.: Observing and understanding the Southeast Asian aerosol system by remote sensing: An initial review and analysis for the Seven Southeast Asian Studies (7SEAS) program, Atmos. Res., 122, 403–468, 2013.
Reid, J. S., Kuehn, R. E., Holz, R. E., Eloranta, E. W., Kaku, K. C., Kuang, S., Newchurch, M. J., Thompson, A. M., Trepte, C. R., and Zhang, J.: Ground‐based High Spectral Resolution Lidar observation of aerosol vertical distribution in the summertime Southeast United States, J. Geophys. Res.-Atmos., 122, 2970–3004, 2017.
Retama, A., Neria-Hernández, A., Jaimes-Palomera, M., Rivera-Hernández, O., Sánchez-Rodríguez, M., López-Medina, A., and Velasco, E.: Fireworks: a major source of inorganic and organic aerosols during Christmas and New Year in Mexico city, Atmos. Environ., 2, 100013, 2019.
Roca, J. B., de Los Reyes, V. C., Racelis, S., Deveraturda, I., Sucaldito, M. N., Tayag, E., and O'Reilly, M.: Fireworks-related injury surveillance in the Philippines: trends in 2010–2014, Western Pacific surveillance and response journal: WPSAR, 6, 1–6, https://doi.org/10.5365/WPSAR.2015.6.1.014, 2015.
Rolph, G., Stein, A., and Stunder, B.: Real-time environmental applications and display system: READY, Environ. Modell. Softw., 95, 210–228, 2017.
Santos, F. L., Pabroa, P. C. B., Morco, R. P., and Racho, J. M. D.: Elemental characterization of New Year's Day PM10 and PM2.2 particulates matter at several sites in Metro Manila, Philippine chemistry congress, Tagaytay City (Philippines), 10–13 April 2007, 2007.
Santos F. L., Pabroa, C. B., Morco, R. P., and Racho, J. M. D.: Elemental characterization of inhalable particulate emissions on New Year's day in Metro Manila, Philippines Nuclear Journal, 15, 35–43, 2010.
Sarkar, S., Khillare, P. S., Jyethi, D. S., Hasan, A., and Parween, M.: Chemical speciation of respirable suspended particulate matter during a major firework festival in India, J. Hazard. Mater., 184, 321–330, 2010.
Schlosser, J. S., Braun, R. A., Bradley, T., Dadashazar, H., MacDonald, A. B., Aldhaif, A. A., Aghdam, M. A., Mardi, A. H., Xian, P., and Sorooshian, A.: Analysis of aerosol composition data for western United States wildfires between 2005 and 2015: Dust emissions, chloride depletion, and most enhanced aerosol constituents, J. Geophys. Res.-Atmos., 122, 8951–8966, 2017.
Shen, Z., Cao, J., Arimoto, R., Han, Z., Zhang, R., Han, Y., Liu, S., Okuda, T., Nakao, S., and Tanaka, S.: Ionic composition of TSP and PM2.5 during dust storms and air pollution episodes at Xi'an, China, Atmos. Environ., 43, 2911–2918, 2009.
Shimizu, T.: Fireworks: the art, science, and technique, Pyrotechnica publications, Tokyo, Japan, 1981.
Shingler, T., Crosbie, E., Ortega, A., Shiraiwa, M., Zuend, A., Beyersdorf, A., Ziemba, L., Anderson, B., Thornhill, L., and Perring, A. E.: Airborne characterization of subsaturated aerosol hygroscopicity and dry refractive index from the surface to 6.5km during the SEAC4RS campaign, J. Geophys. Res.-Atmos., 121, 4188–4210, 2016.
Shinozuka, Y., Clarke, A., DeCarlo, P., Jimenez, J., Dunlea, E., Roberts, G., Tomlinson, J., Collins, D., Howell, S., Kapustin, V., McNaughton, C., and Zhou, J.: Aerosol optical properties relevant to regional remote sensing of CCN activity and links to their organic mass fraction: airborne observations over Central Mexico and the US West Coast during MILAGRO/INTEX-B, Atmos. Chem. Phys, 9, 6727–6742, https://doi.org/10.5194/acp-9-6727-2009, 2009.
Singh, A., Pant, P., and Pope, F. D.: Air quality during and after festivals: Aerosol concentrations, composition and health effects, Atmos. Res., 227, 220–232, https://doi.org/10.1016/j.atmosres.2019.05.012, 2019.
Stahl, C., Cruz, M. T., Bañaga, P. A., Betito, G., Braun, R. A., Aghdam, M. A., Cambaliza, M. O., Lorenzo, G. R., MacDonald, A. B., Pabroa, P. C., Yee, H., Simpas, J. B., and Sorooshian, A.: An Annual Time Series of Weekly Size-Resolved Aerosol Properties in the Megacity of Metro Manila, Philippines, Figshare [data set], https://doi.org/10.6084/m9.figshare.11861859, 2020a.
Stahl, C., Cruz, M. T., Bañaga, P. A., Betito, G., Braun, R. A., Aghdam, M. A., Cambaliza, M. O., Lorenzo, G. R., MacDonald, A. B., Pabroa, P. C., Yee, J. R., Simpas, J. B., and Sorooshian, A.: An annual time series of weekly size-resolved aerosol properties in the megacity of Metro Manila, Philippines, Scientific Data, 7, 128, https://doi.org/10.1038/s41597-020-0466-y, 2020b.
Stein, A., Draxler, R. R., Rolph, G. D., Stunder, B. J., Cohen, M., and Ngan, F.: NOAA's HYSPLIT atmospheric transport and dispersion modeling system, B. Am. Meteorol. Soc., 96, 2059–2077, 2015.
Steinhauser, G. and Klapotke, T. M.: Using the chemistry of fireworks to engage students in learning basic chemical principles: a lesson in eco-friendly pyrotechnics, J. Chem. Educ., 87, 150–156, 2010.
Stokes, R. and Robinson, R.: Interactions in aqueous nonelectrolyte solutions. I. Solute-solvent equilibria, J. Phys. Chem., 70, 2126–2131, 1966.
Sun, Y., Wang, Z., Fu, P., Jiang, Q., Yang, T., Li, J., and Ge, X.: The impact of relative humidity on aerosol composition and evolution processes during wintertime in Beijing, China, Atmos. Environ., 77, 927–934, 2013.
Tanda, S., Ličbinský, R., Hegrová, J., and Goessler, W.: Impact of New Year's Eve fireworks on the size resolved element distributions in airborne particles, Environ. Int., 128, 371–378, 2019.
ten Brink, H., Henzing, B., Otjes, R., and Weijers, E.: Visibility in the Netherlands during New Year's fireworks: The role of soot and salty aerosol products, Atmos. Environ., 173, 289–294, 2018.
Thakur, B., Chakraborty, S., Debsarkar, A., Chakrabarty, S., and Srivastava, R.: Air pollution from fireworks during festival of lights (Deepawali) in Howrah, India – a case study, Atmosfera, 23, 347–365, 2010.
Tian, Y. Z., Wang, J., Peng, X., Shi, G. L., and Feng, Y. C.: Estimation of the direct and indirect impacts of fireworks on the physicochemical characteristics of atmospheric PM10 and PM2.5, Atmos. Chem. Phys., 14, 9469–9479, https://doi.org/10.5194/acp-14-9469-2014, 2014.
Totsuka, T., Sase, H., and Shimizu, H.: Major activities of acid deposition monitoring network in East Asia (EANET) and related studies, in: Plant Responses to Air Pollution and Global Change, edited by: Omasa, K., Nouchi, I., and De Kok, L. J., Springer, Tokyo, Japan, 251–259 pp., 2005.
Tsai, J.-H., Lin, J.-H., Yao, Y.-C., and Chiang, H.-L.: Size distribution and water soluble ions of ambient particulate matter on episode and non-episode days in Southern Taiwan, Aerosol Air Qual. Res., 12, 263–274, 2011.
Tsai, H.-H., Chien, L.-H., Yuan, C.-S., Lin, Y.-C., Jen, Y.-H., and Ie, I.-R.: Influences of fireworks on chemical characteristics of atmospheric fine and coarse particles during Taiwan's Lantern Festival, Atmos. Environ., 62, 256–264, 2012.
Tsay, S.-C., Hsu, N. C., Lau, W. K.-M., Li, C., Gabriel, P. M., Ji, Q., Holben, B. N., Welton, E. J., Nguyen, A. X., and Janjai, S.: From BASE-ASIA toward 7-SEAS: A satellite-surface perspective of boreal spring biomass-burning aerosols and clouds in Southeast Asia, Atmos. Environ., 78, 20–34, 2013.
U.S. Department of Labor: Compliance Policy for Manufacture, Storage, Sale, Handling, Use and Display of Pyrotechnics, available at: https://www.osha.gov/OshDoc/Directive_pdf/CPL_02-01-053.pdf (last access: 12 April 2021), 2015.
Vecchi, R., Bernardoni, V., Cricchio, D., D'Alessandro, A., Fermo, P., Lucarelli, F., Nava, S., Piazzalunga, A., and Valli, G.: The impact of fireworks on airborne particles, Atmos. Environ., 42, 1121–1132, 2008.
Villafuerte II, M. Q., Matsumoto, J., Akasaka, I., Takahashi, H. G., Kubota, H., and Cinco, T. A.: Long-term trends and variability of rainfall extremes in the Philippines, Atmos. Res., 137, 1–13, 2014.
Walsh, K. J., Milligan, M., and Sherwell, J.: Synoptic evaluation of regional PM2.5 concentrations, Atmos. Environ., 43, 594–603, 2009.
Wang, Y., Zhuang, G., Xu, C., and An, Z.: The air pollution caused by the burning of fireworks during the lantern festival in Beijing, Atmos. Environ., 41, 417–431, 2007.
Wehner, B., Wiedensohler, A., and Heintzenberg, J.: Submicrometer aerosol size distributions and mass concentration of the millennium fireworks 2000 in Leipzig, Germany, J. Aerosol Sci., 12, 1489–1493, 2000.
Wilkin, R. T., Fine, D. D., and Burnett, N. G.: Perchlorate behavior in a municipal lake following fireworks displays, Environ. Sci. Technol., 41, 3966–3971, 2007.
Wonaschuetz, A., Sorooshian, A., Ervens, B., Chuang, P. Y., Feingold, G., Murphy, S. M., De Gouw, J., Warneke, C., and Jonsson, H. H.: Aerosol and gas re-distribution by shallow cumulus clouds: An investigation using airborne measurements, J. Geophys. Res.-Atmos., 117, D17202, https://doi.org/10.1029/2012JD018089, 2012.
Wu, C., Wang, G., Wang, J., Li, J., Ren, Y., Zhang, L., Cao, C., Li, J., Ge, S., and Xie, Y.: Chemical characteristics of haze particles in Xi'an during Chinese Spring Festival: Impact of fireworks burning, J. Environ. Sci., 71, 179–187, 2018.
Yadav, S. K., Kumar, M., Sharma, Y., Shukla, P., Singh, R. S., and Banerjee, T.: Temporal evolution of submicron particles during extreme fireworks, Environ. Monit. Assess., 191, 576, https://doi.org/10.1007/s10661-019-7735-2, 2019.
Yang, L., Gao, X., Wang, X., Nie, W., Wang, J., Gao, R., Xu, P., Shou, Y., Zhang, Q., and Wang, W.: Impacts of firecracker burning on aerosol chemical characteristics and human health risk levels during the Chinese New Year Celebration in Jinan, China, Sci. Total Environ., 476, 57–64, 2014.
Youn, J. S., Wang, Z., Wonaschütz, A., Arellano, A., Betterton, E. A., and Sorooshian, A.: Evidence of aqueous secondary organic aerosol formation from biogenic emissions in the North American Sonoran Desert, Geophys. Res. Lett., 40, 3468–3472, 2013.
Yuan, L., Zhang, X., Feng, M., Liu, X., Che, Y., Xu, H., Schaefer, K., Wang, S., and Zhou, Y.: Size-resolved hygroscopic behaviour and mixing state of submicron aerosols in a megacity of the Sichuan Basin during pollution and fireworks episodes, Atmos. Environ., 226, 117393, https://doi.org/10.1016/j.atmosenv.2020.117393, 2020.
Zhang, J., Yang, L., Chen, J., Mellouki, A., Jiang, P., Gao, Y., Li, Y., Yang, Y., and Wang, W.: Influence of fireworks displays on the chemical characteristics of PM2.5 in rural and suburban areas in Central and East China, Sci. Total Environ., 578, 476–484, 2017.
Zhang, J., Lance, S., Freedman, J. M., Sun, Y., Crandall, B. A., Wei, X., and Schwab, J. J.: Detailed Measurements of Submicron Particles from an Independence Day Fireworks Event in Albany, New York Using HR-ToF-AMS, ACS Earth Space Chem., 3, 1451–1459, 2019.
Zhang, M., Wang, X., Chen, J., Cheng, T., Wang, T., Yang, X., Gong, Y., Geng, F., and Chen, C.: Physical characterization of aerosol particles during the Chinese New Year's firework events, Atmos. Environ., 44, 5191–5198, 2010.