the Creative Commons Attribution 4.0 License.
the Creative Commons Attribution 4.0 License.
 | 21 Apr 2021
Volatile organic compound emissions from solvent- and water-borne coatings – compositional differences and tracer compound identifications
Chelsea E. Stockwell
Matthew M. Coggon
Georgios I. Gkatzelis
John Ortega
Brian C. McDonald
Jeff Peischl
Kenneth Aikin
Jessica B. Gilman
Michael Trainer
Carsten Warneke
The emissions of volatile organic compounds (VOCs) from volatile chemical products (VCPs) – specifically personal care products, cleaning agents, coatings, adhesives, and pesticides – are emerging as the largest source of petroleum-derived organic carbon in US cities. Previous work has shown that the ambient concentration of markers for most VCP categories correlates strongly with population density, except for VOCs predominantly originating from solvent- and water-borne coatings (e.g., parachlorobenzotrifluoride (PCBTF) and Texanol®, respectively). Instead, these enhancements were dominated by distinct emission events likely driven by industrial usage patterns, such as construction activity. In this work, the headspace of a variety of coating products was analyzed using a proton-transfer-reaction time-of-flight mass spectrometer (PTR-ToF-MS) and a gas chromatography (GC) preseparation front end to identify composition differences for various coating types (e.g., paints, primers, sealers, and stains). Evaporation experiments of several products showed high initial VOC emission rates, and for the length of these experiments, the majority of the VOC mass was emitted during the first few hours following application. The percentage of mass emitted as measured VOCs (<1 % to 83 %) mirrored the VOC content reported by the manufacturer (<5 to 550 g L−1). Ambient and laboratory measurements, usage trends, and ingredients compiled from architectural coatings surveys show that both PCBTF and Texanol account for ∼10 % of the total VOC ingredient sales and, therefore, can be useful tracers for solvent- and water-borne coatings.
- Article
(9067 KB) - Full-text XML
-
Supplement
(238 KB) - BibTeX
- EndNote


After decades of declining mixing ratios of volatile organic compounds (VOCs) in urban areas from combustion-related processes (Warneke et al., 2012), emissions from volatile chemical products (VCPs are coatings, adhesives, inks, personal care products, pesticides, and cleaning agents) have emerged as a major source of VOCs in the urban atmosphere (McDonald et al., 2018a). Measurement and modeling efforts have already shown that VCP emissions and their contribution to urban ozone formation are comparable to those for fossil fuel VOCs in Los Angeles and other cities in the United States (McDonald et al., 2018a; Coggon et al., 2021). Reductions in tailpipe emissions of VOCs from gasoline vehicles are slowing, and diminishing returns from emission control technologies have been reported for on-road vehicles (Bishop and Haugen, 2018). With slowing trends in ozone precursors and shifts in ozone production regimes, decreases in ozone design values may have slowed as well (Parrish et al., 2017).
A fuel-based inventory by McDonald et al. (2018a) showed that about 18 % of the petrochemical VOC emissions in Los Angeles in 2010 were from personal care products. Coggon et al. (2018) found that D5 siloxane (decamethylcyclopentasiloxane), which is a unique tracer for personal care product emissions, is emitted in urban areas in similar amounts as benzene from vehicles, indicating a significant emission source from personal care products. The next largest emission source was from coatings, accounting for approximately 13 % of the VOC inventory in Los Angeles. Coatings in emission inventories are defined as paints, varnishes, primers, stains, sealers, lacquers, and other solvents associated with coatings (e.g., thinners, cleaners, and additives). This includes both industrial and architectural coatings, which each comprise half of the coating fraction. Architectural coatings are defined as products applied to stationary structures and their accessories, whereas coatings applied in shop applications or to nonstationary structures are categorized as industrial coatings. Both coating types can be utilized in industrial applications (e.g., construction or manufacturing activities). The impact of VOC emissions from coatings has been investigated in the indoor environment (Corsi and Lin, 2009; Weschler and Nazaroff, 2012; Schieweck and Bock, 2015; Kozicki et al., 2018), but few measurements have been reported in the outdoor environment. Urban air is likely impacted from coating emissions from the indoor and outdoor exchange and from architectural and industrial coating usage outdoors. To quantify VCP coating emissions in urban air, it is important to identify VOC tracers that are uniquely linked to water- and solvent-borne usage, analogous to the emissions of D5 siloxane from personal care products. Although there is a lack of detailed analysis of coatings emissions in the ambient atmosphere, emissions suspected from coatings have been measured in ambient air. Goliff et al. (2012) measured 2,2,4-trimethyl-1,3-pentanediol monoisobutyrate (TPM; also known as Texanol®), a common solvent in water-borne coatings, in southern California at mixing ratios of up to 20 ppt (parts per trillion), with the largest values in summer, when coating activities are typically the highest.
The composition and emissions of chemical products have changed significantly in recent decades in an effort to reduce the ozone (O3) and secondary organic aerosol (SOA) formation potential (Weschler, 2009; CARB, 2015; Shin et al., 2016). For example, water-borne paints are increasingly replacing solvent-borne paints, while, simultaneously, many VOC ingredients are being replaced with water (Matheson, 2002), “exempt” VOCs, or low-vapor-pressure VOCs (LVP-VOCs; Li et al., 2018). The California Air Resources Board (CARB) defines exempt VOCs as compounds that are not expected to meaningfully contribute to ozone formation due to their low reactivity in the atmosphere. Examples include acetone, ethane, perchloroethylene, methyl acetate, and parachlorobenzotrifluoride (PCBTF). CARB also exempts several LVP-VOCs, which are defined as chemical compounds containing at least one carbon atom and a vapor pressure less than 0.1 mm Hg at 20 ∘C, organic compounds with more than 12 carbon atoms, compounds with boiling points greater than 216 ∘C, chemical mixtures comprised solely of compounds with more than 12 carbon atoms, or as the weight percent of a chemical mixture that boils above 216 ∘C (Li et al., 2018). As a result of product reformulations and VOC exemptions, many paints can now be classified as “zero VOC” paints that fall below the government-regulated permissible amounts, even though they emit compounds that are more broadly defined within the category of VOC. Compounds classified as intermediate-volatility and semi-volatile organic compounds (IVOCs and SVOCs) are often excluded from inventories and regulations due to measurement limitations or long emission timescales, yet many are key SOA precursors that can be emitted by coating products or processes (Khare and Gentner, 2018).
Presented here are ambient and laboratory measurements of vapors emitted from coatings using proton-transfer-reaction time-of-flight mass spectrometry (PTR-ToF-MS) to evaluate potential tracer compounds. It will be shown that PCBTF and Texanol are detected at ambient levels, are VOCs emitted primarily by coatings products, and are unique VOCs prevalent in emissions inventories. Ambient measurements show the spatial and temporal trends of PCBTF and Texanol emissions in New York City (NYC), Chicago, Pittsburgh, and Denver. These ambient measurements are linked to coatings using a series of laboratory measurements sampling various architectural coatings. First, we compare VOC composition from coating headspace samples analyzed using PTR-ToF-MS with gas chromatograph (GC) preseparation. These measurements highlight the differences in VOC composition for a variety of coating products and help to unambiguously identify VOC tracers linked to solvent- and water-borne coatings. Emission factors (in grams per kilogram) of VOC mass are measured via controlled evaporation experiments to quantify key VOC emissions from coating use. Lastly, ingredient compilations from architectural coatings surveys from CARB are compared with the laboratory measurements to confirm usage trends. Coating surveys generally agree with the ambient and laboratory measurements and support the assignment of Texanol and PCBTF as atmospheric tracers for water-borne and solvent-borne coatings, respectively.
2.1 Instrumentation
Mixing ratios of VOCs in ambient and laboratory measurements were determined using a proton-transfer-reaction time-of-flight mass spectrometer (PTR-ToF-MS; hereafter referred to as PTR-ToF; Yuan et al., 2016, 2017). The PTR-ToF measures a large range of aromatics, alkenes, nitrogen-containing species, and oxygenated VOCs. Instrument backgrounds were determined for laboratory measurements before and after every experiment for short duration experiments, or every 2 h for longer duration experiments and ambient measurements, by passing air through a platinum catalyst heated to 350 ∘C. Data were processed following the recommendations of Stark et al. (2015) using the Tofware package in Igor Pro (WaveMetrics). The PTR-ToF was calibrated using gravimetrically prepared gas standards for typical water-borne solvents, such as acetone and methyl ethyl ketone, and solvent-borne compounds, such as toluene and C8 aromatics. Texanol and PCBTF were calibrated by liquid calibration methods, as described by Coggon et al. (2018). The sensitivities for Texanol and PCBTF for 1 s measurements were 9 and 69 normalized counts per second per parts per billion (ncps ppbv−1), respectively, and the detection limits for both were <10 pptv (parts per trillion by volume; Gkatzelis et al. 2021a). Texanol (C12H24O3) was measured as a dehydrated fragment at 199.169 (C12H22O2 ⋅ H+) and PCBTF (C7H4ClF3) was detected at 160.996 (C7H4ClF2) from the loss of fluorine. The sensitivity of compounds that were not calibrated were calculated according to Sekimoto et al. (2017).
The PTR-ToF is less sensitive to smaller hydrocarbons (de Gouw and Warneke, 2007; Sekimoto et al., 2017) and substantially underestimates their mixing ratios. PTR-ToF sensitivities to alkanes and alkenes are typically only a few percent of those for oxygenates (Warneke et al., 2003), and the sensitivities calculated using methods outlined in Sekimoto et al. (2017) are likely overestimated. Theoretical calibration factors from reaction rate coefficients have been shown to be highly biased for alkanes and alkenes (Warneke et al., 2003). In order to more accurately quantify the contributions of hydrocarbons (HCs), the calculated sensitivities for low molecular weight HCs (< C5) were assumed to have the same sensitivity as low molecular weight alkanes (10 ncps ppbv−1). This results in an estimated uncertainty in total VOC emissions of about a factor of 2.
PTR-ToF only resolves VOC molecular formulae. Gas chromatography (GC) preseparation has been used previously to identify structural isomers (Warneke et al., 2003; Koss et al., 2016). Here, a custom-built GC described by Kuster et al. (2004) was updated and redesigned specifically as a PTR-ToF front end to analyze the complex headspace mixture of select coating formulations. Details describing the setup and performance of the GC interface are provided in the Supplement, and only a brief description is provided here.
The GC consists of a 30 m DB-624 column (Agilent Technologies; 30 m, 0.25 mm internal diameter (ID), and 1.4 µm film thickness) and oven combination identical to the system described by Lerner et al. (2017), a liquid nitrogen cryotrap, and a two-position, 10-port valve (Valco Instruments Co. Inc.) to direct gas flows. The column was selected to measure polar and nonpolar VOCs in the approximate range of C3–C10. The effluent of the GC column is injected into the PTR-ToF inlet. Depending on the application, 1–5 min samples can be collected, and chromatogram lengths of 10–20 min can be chosen such that the total trapping and analysis time is between 15 and 30 min. LabVIEW (National Instruments) software controls the sequence of events, hot and cold trap temperatures, valve switching, sample flow, and carrier gas flow. The detection limit for commonly detected VOCs (e.g., isoprene, benzene, and xylenes) using this cryofocusing system is ∼5 pptv.
2.2 Mobile and ground site measurements
The field measurements used to evaluate ambient measurements of coatings are described in detail by Coggon et al. (2021) and Gkatzelis et al. (2021a). Briefly, measurements were conducted during the New York Investigation of Consumer Emissions (NYICE) campaign in winter (5–28 March 2018) and the Long Island Sound Tropospheric Ozone Study (LISTOS) in summer (5–24 July 2018) to characterize the emission profile, strength, and seasonality of VOCs emitted from VCPs.
Ground site measurements were performed at the City College of New York (CCNY) campus. Mobile VOC measurements were conducted throughout NYC and other urban regions (Pittsburgh, Chicago, and Denver) using the NOAA Chemical Sciences Laboratory (CSL) mobile laboratory to characterize the spatial distribution of VCP emissions. The mobile laboratory was driven through the boroughs of New York City, Long Island, and eastern New Jersey, and multiple drives were performed in Chicago (2) and Denver (3). In each case, the mobile laboratory was driven downwind, upwind, and through the city center to evaluate urban VOC enhancements. Drive routes were selected to sample regions of both high and low population density to investigate differences in VCP emissions.
2.3 FIVE-VCP emission inventory
The Fuel-based Inventory of Vehicle Emissions and Volatile Chemical Products (FIVE-VCP) emission inventory used in this work has been described in detail by Coggon et al. (2021). Briefly, VCP emissions were estimated from chemical production data determined from a “bottom-up” mass balance of the petrochemical industry. The VOC speciation profiles were updated for the coatings category to include more recent architectural coating surveys by the California Air Resources Board (CARB; CARB, 2018). The per capita use of VCPs specific to the coating sector was estimated and combined with VOC emission factors (in grams of VOC per kilogram of the product) reported by McDonald et al. (2018a) that is based on a review of indoor air quality literature. The VCP emissions were spatially apportioned using US Census block population data (Bureau USC, 2020a), and the temporal patterns are taken from the National Emissions Inventory (NEI) 2014 (EPA, 2017).
Mobile source emissions are estimated utilizing a fuel-based approach based on fuel sale reports for on-road and off-road engines. CO and VOC emission factors (in grams of VOC per kilogram of fuel) were taken from the compilation by McDonald et al. (2018a) and updated to 2018 by Coggon et al. (2021). The emission factors include tailpipe emissions from running exhaust, enhanced emissions associated with cold-starting engines, and evaporative gasoline VOC sources. The spatial and temporal emission patterns of mobile source engines are taken from the 2014 NEI (EPA, 2017).
2.4 Laboratory measurements
Laboratory measurements were performed to qualitatively evaluate the headspace VOCs emitted from commonly used coatings. A total of 19 different solvent- or water-borne formulas were tested, and these ranged in applications, including paints, stains, primers, sealers, and preservatives. It is worth noting that industrial maintenance coatings formulated to withstand extreme environmental conditions were not a part of this survey. The variability in product formulation and usage is significant, and the coatings in this study were selected based on availability, total VOC content, and similarity between other products tested; therefore, the results do not fully capture the emissions variability of all coatings. Each product was mixed thoroughly in its original container, and an aliquot was transferred into a glass vial. The headspace VOCs were sampled by placing the product container that was open to the atmosphere within a few centimeters of the PTR-ToF inlet. The instrument inlet tubing was a short piece of perfluoroalkoxy (PFA) Teflon to limit losses or delays (Deming et al., 2019). The container was closed between GC sample intervals (20 min), and zero air was sampled between runs. The GC front end was used to aid in the specific identification of VOC isomers emitted from different coating types, which were compared to the ingredient lists or CARB coating surveys.
Several representative products were sampled over longer periods to investigate their evaporative behavior, i.e., a solvent-borne polyurethane stain, a latex paint, a primer and/or sealer paint, and a zero VOC low-odor paint. These evaporation experiments were performed at room temperature by flowing synthetic air (2 L min−1) through a Teflon-coated chamber enclosing a microbalance scale (OHAUS) for a minimum of 19 h. Prior to each experiment, the chamber was flushed until background VOC concentration was <50 ppt. Experiments were initialized by depositing small (<50 mg) samples of the coating product through a septum and onto a small piece of Teflon plastic placed on the scale. The PTR-ToF monitored VOCs from the exhaust of the Teflon chamber while changes to the product mass were recorded by the scale. VOC emission factors (grams per kilogram) were determined by dividing the integrated VOC signal measured by PTR-ToF over the course of the experiment by the initial mass on the scale and the percentage of mass emitted as VOCs are determined by dividing by the total change in mass on the scale.
The NYC ambient measurements of PCBTF and Texanol from the mobile laboratory in 2018 are summarized in Fig. 1. In Fig. 1a, the drive tracks overlay a map of the population density in the region and are color-coded with summertime PCBTF and Texanol. The population density is highest in Manhattan, with more than 28 000 people per square kilometer. Generally, the highest mixing ratios of PCBTF and Texanol were found in the areas with the highest population density but were mostly dominated by short, spatially isolated plumes. The median mixing ratios of PCBTF and Texanol were binned along the east–west transects together with the population density, as shown in Fig. 1a. Multiple drives across the two seasons were conducted, and longitudinally overlapping drives were averaged. The correlations with population density for both compounds (R2 is equal to 0.23 and 0.57) were lower than what was found for most other VCP tracer compounds (R2>0.8; Gkatzelis et al., 2021a). This is consistent with PCBTF and Texanol being from construction activities rather than being correlated with population like other VCP tracers (e.g., D5 siloxane for personal care products). The mobile sampling strategy relied on either no repeat visits or a relatively small number of repeat visits in both seasons and, therefore, does not represent long-term spatial patterns (Messier et al., 2018; Robinson et al., 2019); however, we might expect emissions from coatings to not show strong long-term spatial patterns, as construction activities are generally not permanently located. In Fig. 1b, the time series from the ground site measurements in winter and summer for PCBTF and Texanol are shown together with CO, a combustion tracer, and D5 siloxane, a personal care product tracer (Coggon et al., 2018). At the end of the winter, ground site measurements in late March, a stagnation period, marked in Fig. 1b with the orange box, increased the mixing ratios of all VOCs and CO. The correlations with CO for the winter measurements are also shown in Fig. 1c. Throughout the entire campaign, the correlation of PCBTF and Texanol with CO is low, except for the time period at the end of March (orange), where the urban emissions of nearby sources accumulated at the measurement site. PCBTF and Texanol are also poorly correlated with D5 siloxane, except during the stagnation period (R2 is equal to 0.50, and R2 is equal to 0.76). This suggests that PCBTF and Texanol have sources other than combustion and personal care products, and the large spikes in PCBTF observed during the drives show that high emissions are from distinct point sources and not from dispersed sources like traffic. Enhancements of PCBTF do not necessarily coincide with Texanol enhancements. The poor correlation between PCBTF and Texanol (R2<0.1) is not unexpected since the primary source varies by product formulation and usage (e.g., water borne or solvent borne). Even though PCBTF and Texanol have different sources than CO, the correlation with CO during the stagnation event can be used to estimate the PCBTF and Texanol emissions in NYC following the method described by Coggon et al. (2021), which uses the slope from the correlation together with CO emissions from the bottom-up FIVE mobile source inventory (McDonald et al., 2018b). The resulting emissions for PCBTF and Texanol in NYC were approximately 1 and 0.1 mg per person per day, respectively.
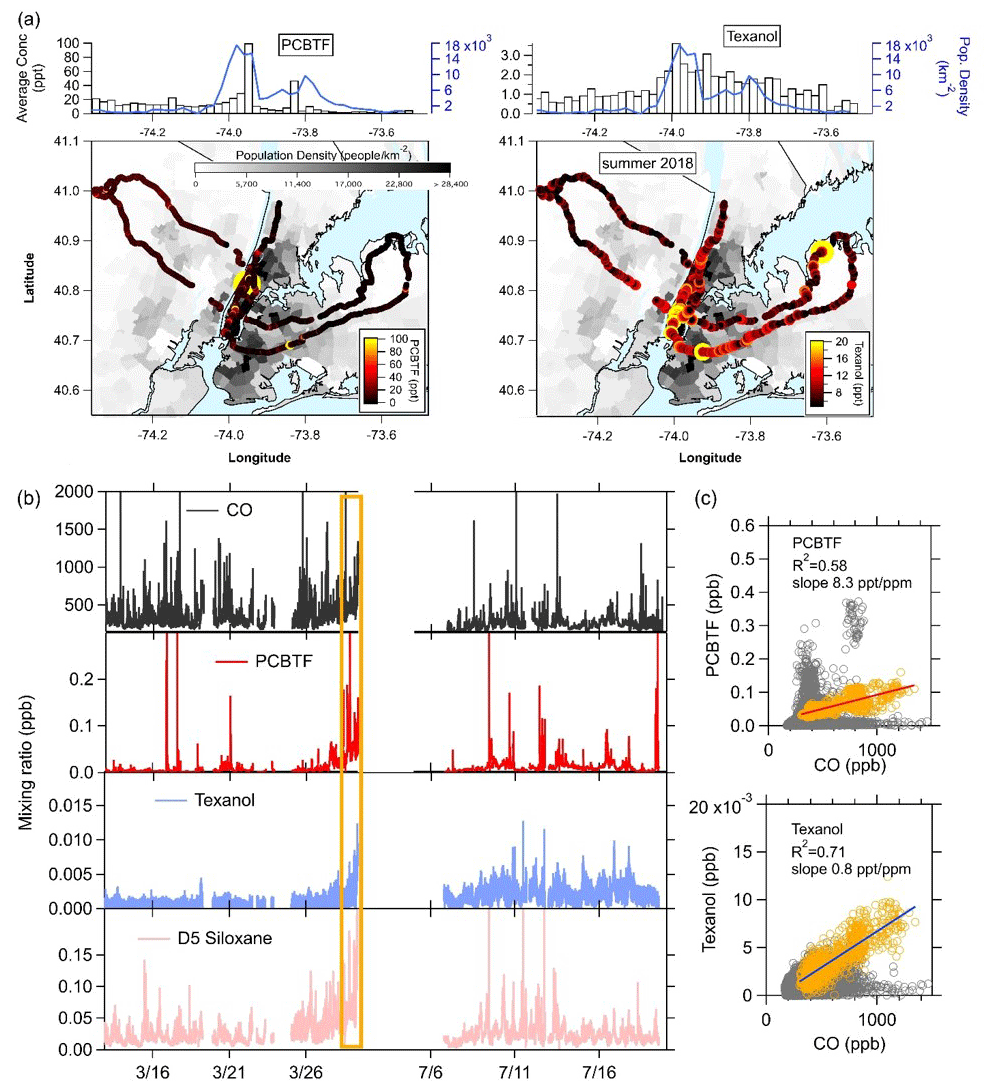
Figure 1Summary of the PCBTF and Texanol measurements in New York City. The maps show the color-coded NOAA Mobile Laboratory drive track overlain on a map of the population density. (a) Binned population density and mixing ratios. (b) Time series of CO, PCBTF, Texanol, and D5 siloxane for the winter and summer months. The stagnation period during winter measurements is highlighted in orange. (c) The correlation plots of PCBTF and Texanol with CO for winter measurements. Slopes are calculated for the stagnation period at the end of the winter measurements (orange shading).
Figure 2 summarizes the mobile laboratory measurements in Chicago, Pittsburgh, Denver, and the transit in between the cities, where the drive tracks close to the downtown areas in each city are color coded by PCBTF mixing ratio and plotted on top of the population density. Like NYC, PCBTF and Texanol were generally enhanced in urban regions but not well correlated with urban population density. PCBTF was significantly enhanced in Chicago in distinct locations and not well correlated with D5 siloxane (R2<0.1). The population density dependence of PCBTF and Texanol for winter and summer is shown in Fig. 3a as the ratio of the respective tracer with benzene, which is used as a tracer for mobile source emissions. This ratio controls for meteorology between cities and also reflects differences in the proportion of VCP and traffic emissions across urban regions. As population density increases, mobile source emissions plateau because of roadway capacity and increased mass transit usage (Gately et al., 2015), while emissions from personal care products and other daily use VCPs driven by human activity scale linearly with the number of people. Consequently, the ratio of a VCP markers (e.g., D5 siloxane) with benzene is higher in more densely populated regions (Gkatzelis et al., 2021a). PCBTF and Texanol do not exhibit a population density dependence (R2<0.2), especially compared to D5 siloxane (R2 is equal to 0.82; Fig. 1 in Gkatzelis et al., 2021a). This likely indicates that emissions from coatings are influenced by industrial usage patterns, such as construction or manufacturing activity, rather than consumer product usage patterns, which impact the spatial and temporal variability of D5 siloxane (Coggon et al., 2018; Gkatzelis et al., 2021a).
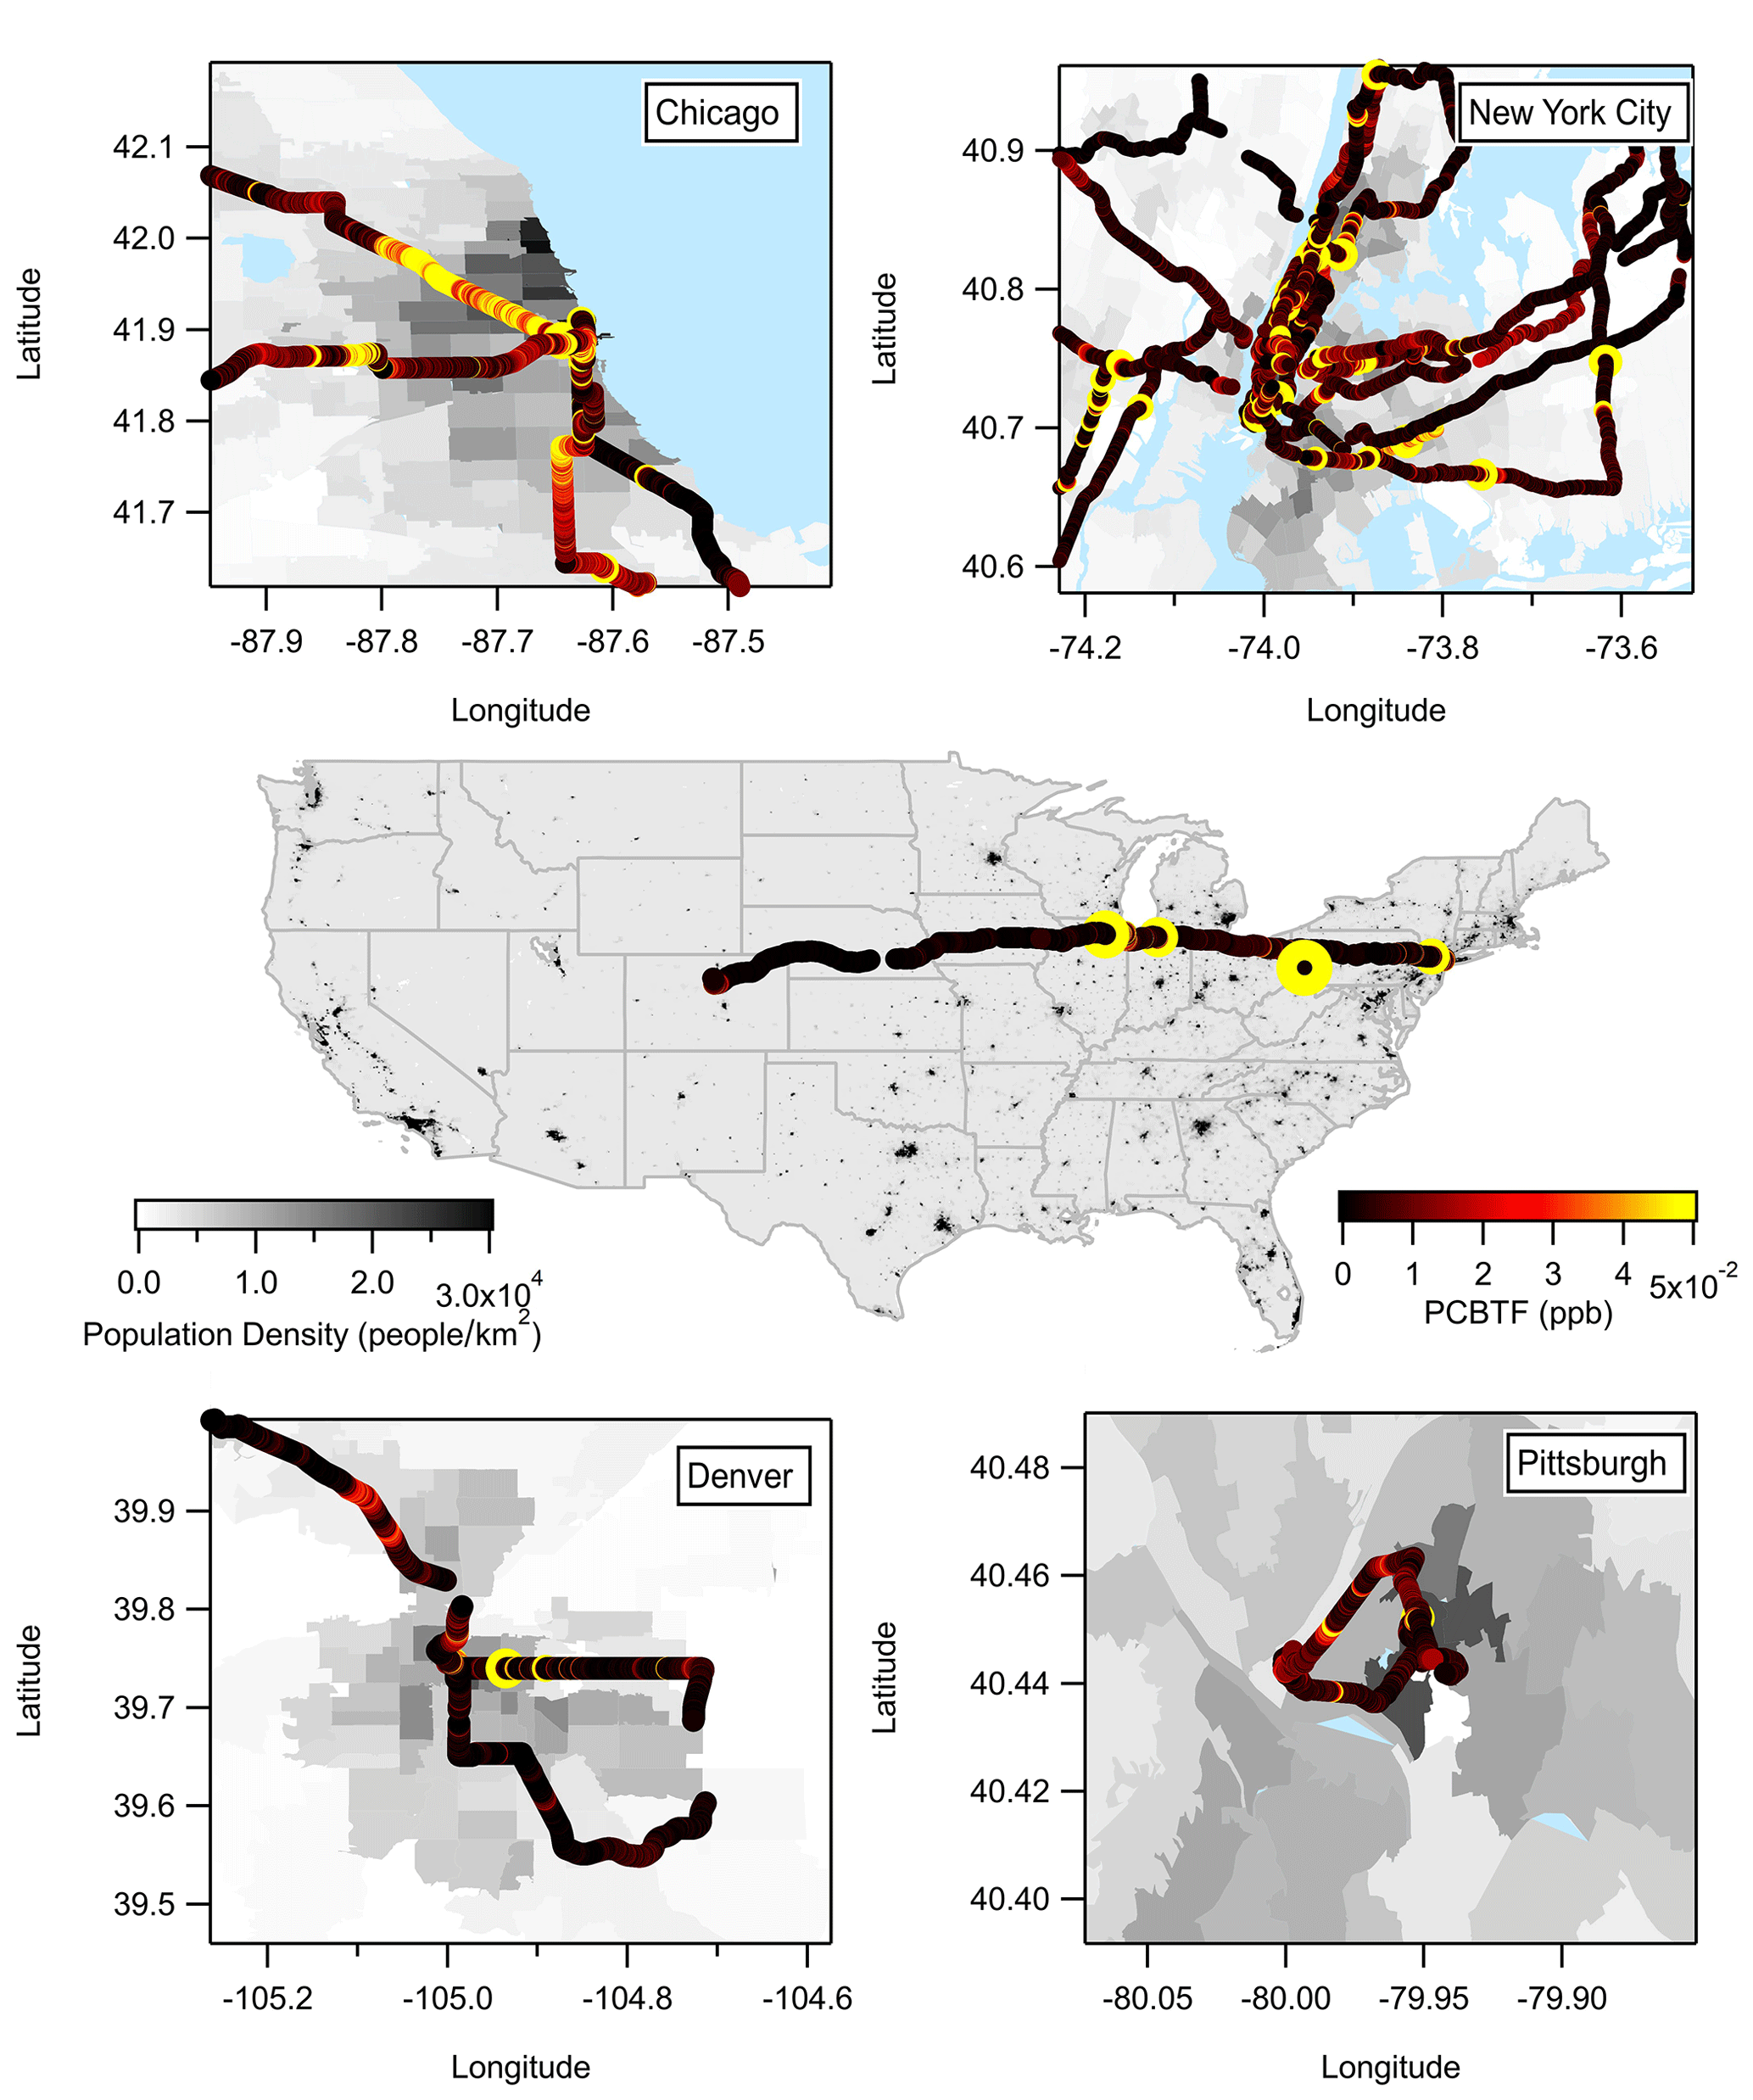
Figure 2Summary of the PCBTF measurements from Chicago, New York City, Denver, Pittsburgh, and the transition drives between the cities.
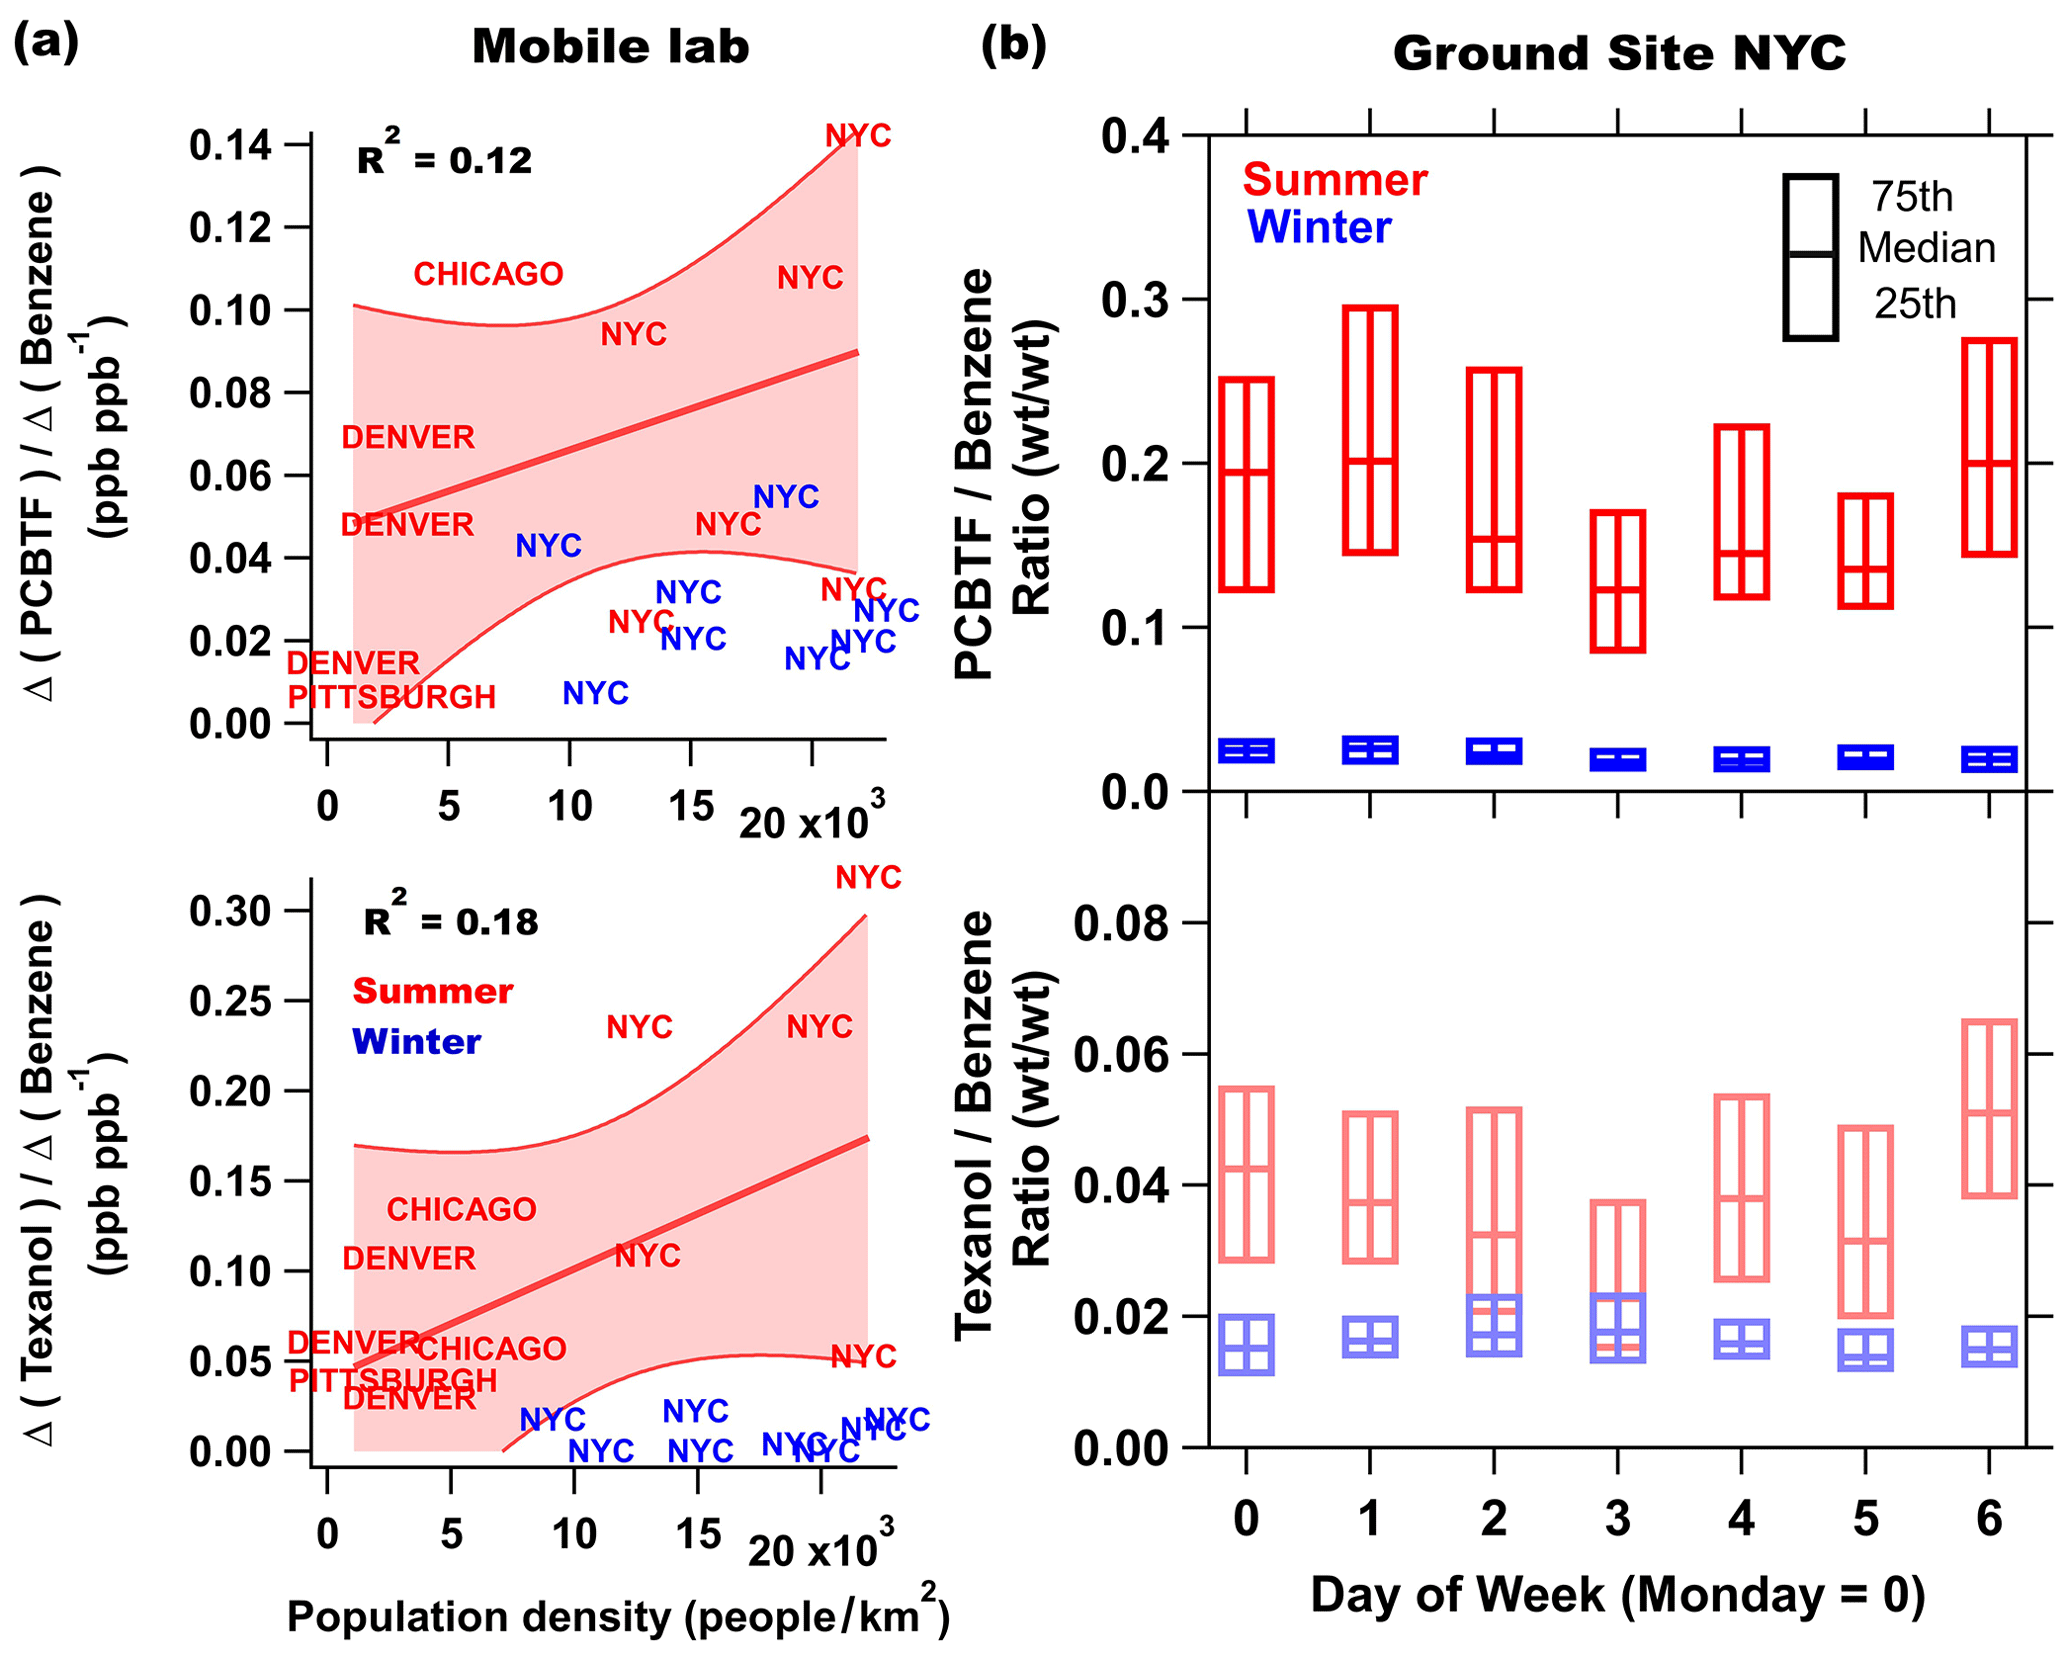
Figure 3(a) The enhancement of PCBTF and Texanol relative to the enhancement of benzene versus the population density in summer (red) and winter (blue) in various cities. Enhancements were calculated by subtracting the background median taken from measurements upwind of cities with the lowest mixing ratios from median concentrations from regions where population density was the highest. Denver and Chicago are represented by multiple drives. NYC is an average of all drives throughout the city but separated by regions with high (19 000–23 000 people per square kilometer), medium (14 000–19 000 people per square kilometer), and low (9000–14 000 people per square kilometer) population densities. (b) The summer and winter weekly profile of the PCBTF and Texanol versus benzene ratio.
The weekly profiles of the PCBTF and Texanol ratios for summer and winter NYC ground site measurements are shown in Fig. 3b. Winter ratios are lower than those in summer, which likely indicates a seasonal change in emissions due to relatively fewer coating projects in the wintertime. The same was observed in the other cities, as can be seen in Fig. 3a, where the winter data show a much smaller correlation with the population density compared to summer. In addition to usage trends, it is also likely that meteorology accounts for some of changes in emissions between seasons and further complicates interpretation. Texanol (C12H24O3) is detected as a fragment at 199 (C12H22O2). It has been suggested that compounds formed via chemical processes are a potential interference at that mass during summer months (Gkatzelis et al., 2021a). A positive matrix factorization (PMF) analysis of the ambient data set used herein is described in detail in Gkatzelis et al. (2021b), and it noted that the majority of 199 was attributed to the VCP emissions in summer NYC (>60 %), while the remaining fraction was attributed to daytime and/or morning chemical processes influenced by VOC oxidation. Therefore, photochemistry might contribute to the larger Texanol ratio observed in summer compared to winter and complicates the use of PTR-ToF-measured Texanol as a tracer for paints during the summer months. Nevertheless, Goliff et al. (2012) observed the highest mean ambient concentrations of Texanol from sorbent tube collection during summer months in multiple cities, which are unaffected by interferences to other compounds. The mean concentration of benzene does not decrease significantly from weekdays to weekend days; therefore, changes in the emission ratios to benzene by day of week should reflect changes in the usage of coatings products that use PCBTF and Texanol as ingredients. It might also be expected that coatings emissions are smaller on the weekends compared to weekdays, but this difference is not clearly observed in Fig. 3b and, alternatively, suggests that coating usage persists into the weekend in New York City, though these trends likely vary by city. Currently, the FIVE-VCP does not take the seasonality of VCP emissions into account and, therefore, likely overestimates coatings emissions during winter.
Gkatzelis et al. (2021a) used the population density dependence of various VOCs to identify specific tracers for VCP emissions. Although PCBTF and Texanol ambient mixing ratios did not show a strong population dependence, they met additional criteria for selection as VCP tracers, i.e., they were regularly measured at significant mixing ratios in ambient air and are uniquely represented in the FIVE-VCP emission inventory as a component of coatings. To demonstrate the prevalence and efficacy of these compounds as markers in the coating VCP category, laboratory measurements were performed to sample VOCs from the headspaces of commonly used architectural coatings and to quantify the fraction of PCBTF and Texanol associated with the measured VOC mass.
To understand the composition of the emissions from coating products in greater detail, the vapors from the headspace of 19 different coatings were measured by PTR-ToF. To capture the two ends of the spectrum, both a water-borne zero VOC low-odor paint and a solvent-borne polyurethane stain were tested with the GC front-end preseparation method described above (GC-PTR-ToF-MS). The GC-PTR-ToF-MS chromatograms of selected (a) small oxygenates, (b) hydrocarbons (HC), and (c) aromatics are shown in Fig. 4. For the zero VOC paint, the main oxygenate emitted was acetone, with smaller emissions from other solvents, including methanol, ethanol, and methylethylketone (MEK). The compounds identified in the zero VOC GC hydrocarbon panel are primarily fragments of oxygenated compounds, and generally, oxygenated compounds were the dominant emission from zero VOC paint. Emissions from aromatics were negligible. The mass for Texanol and its fragments were observed in the direct PTR-ToF sampling of the headspace of several water-borne products, but pure Texanol injections into the GC-PTR-ToF-MS demonstrated that Texanol does not elute from the GC column either because it is lost to the water trap or has too low of a vapor pressure to elute from the column under the selected temperature program. As a stand-alone instrument, the PTR-ToF-MS has the distinct advantage of having a rapid sampling time (∼0.1–5 s). The GC inlet system requires ∼10–15 min for the sequence of sample preconcentration, injection, GC separation, and detection. It was originally developed to collect a sample in the GC during sampling with the PTR-ToF-MS followed by interrupting normal sampling to analyze the chromatogram and take advantage of chromatographic separation. This setup still maintains >75 % of the time dedicated to in situ PTR-ToF sampling. The GC system is capable of detecting C3–C10 compounds, and development included calibration standards in that range, which keeps the sampling and analysis times relatively short, while capturing the majority of typical VOCs observed in ambient air. Further characterization of larger and less volatile compounds, such as Texanol, would have required a different GC system with significantly longer cycle times.
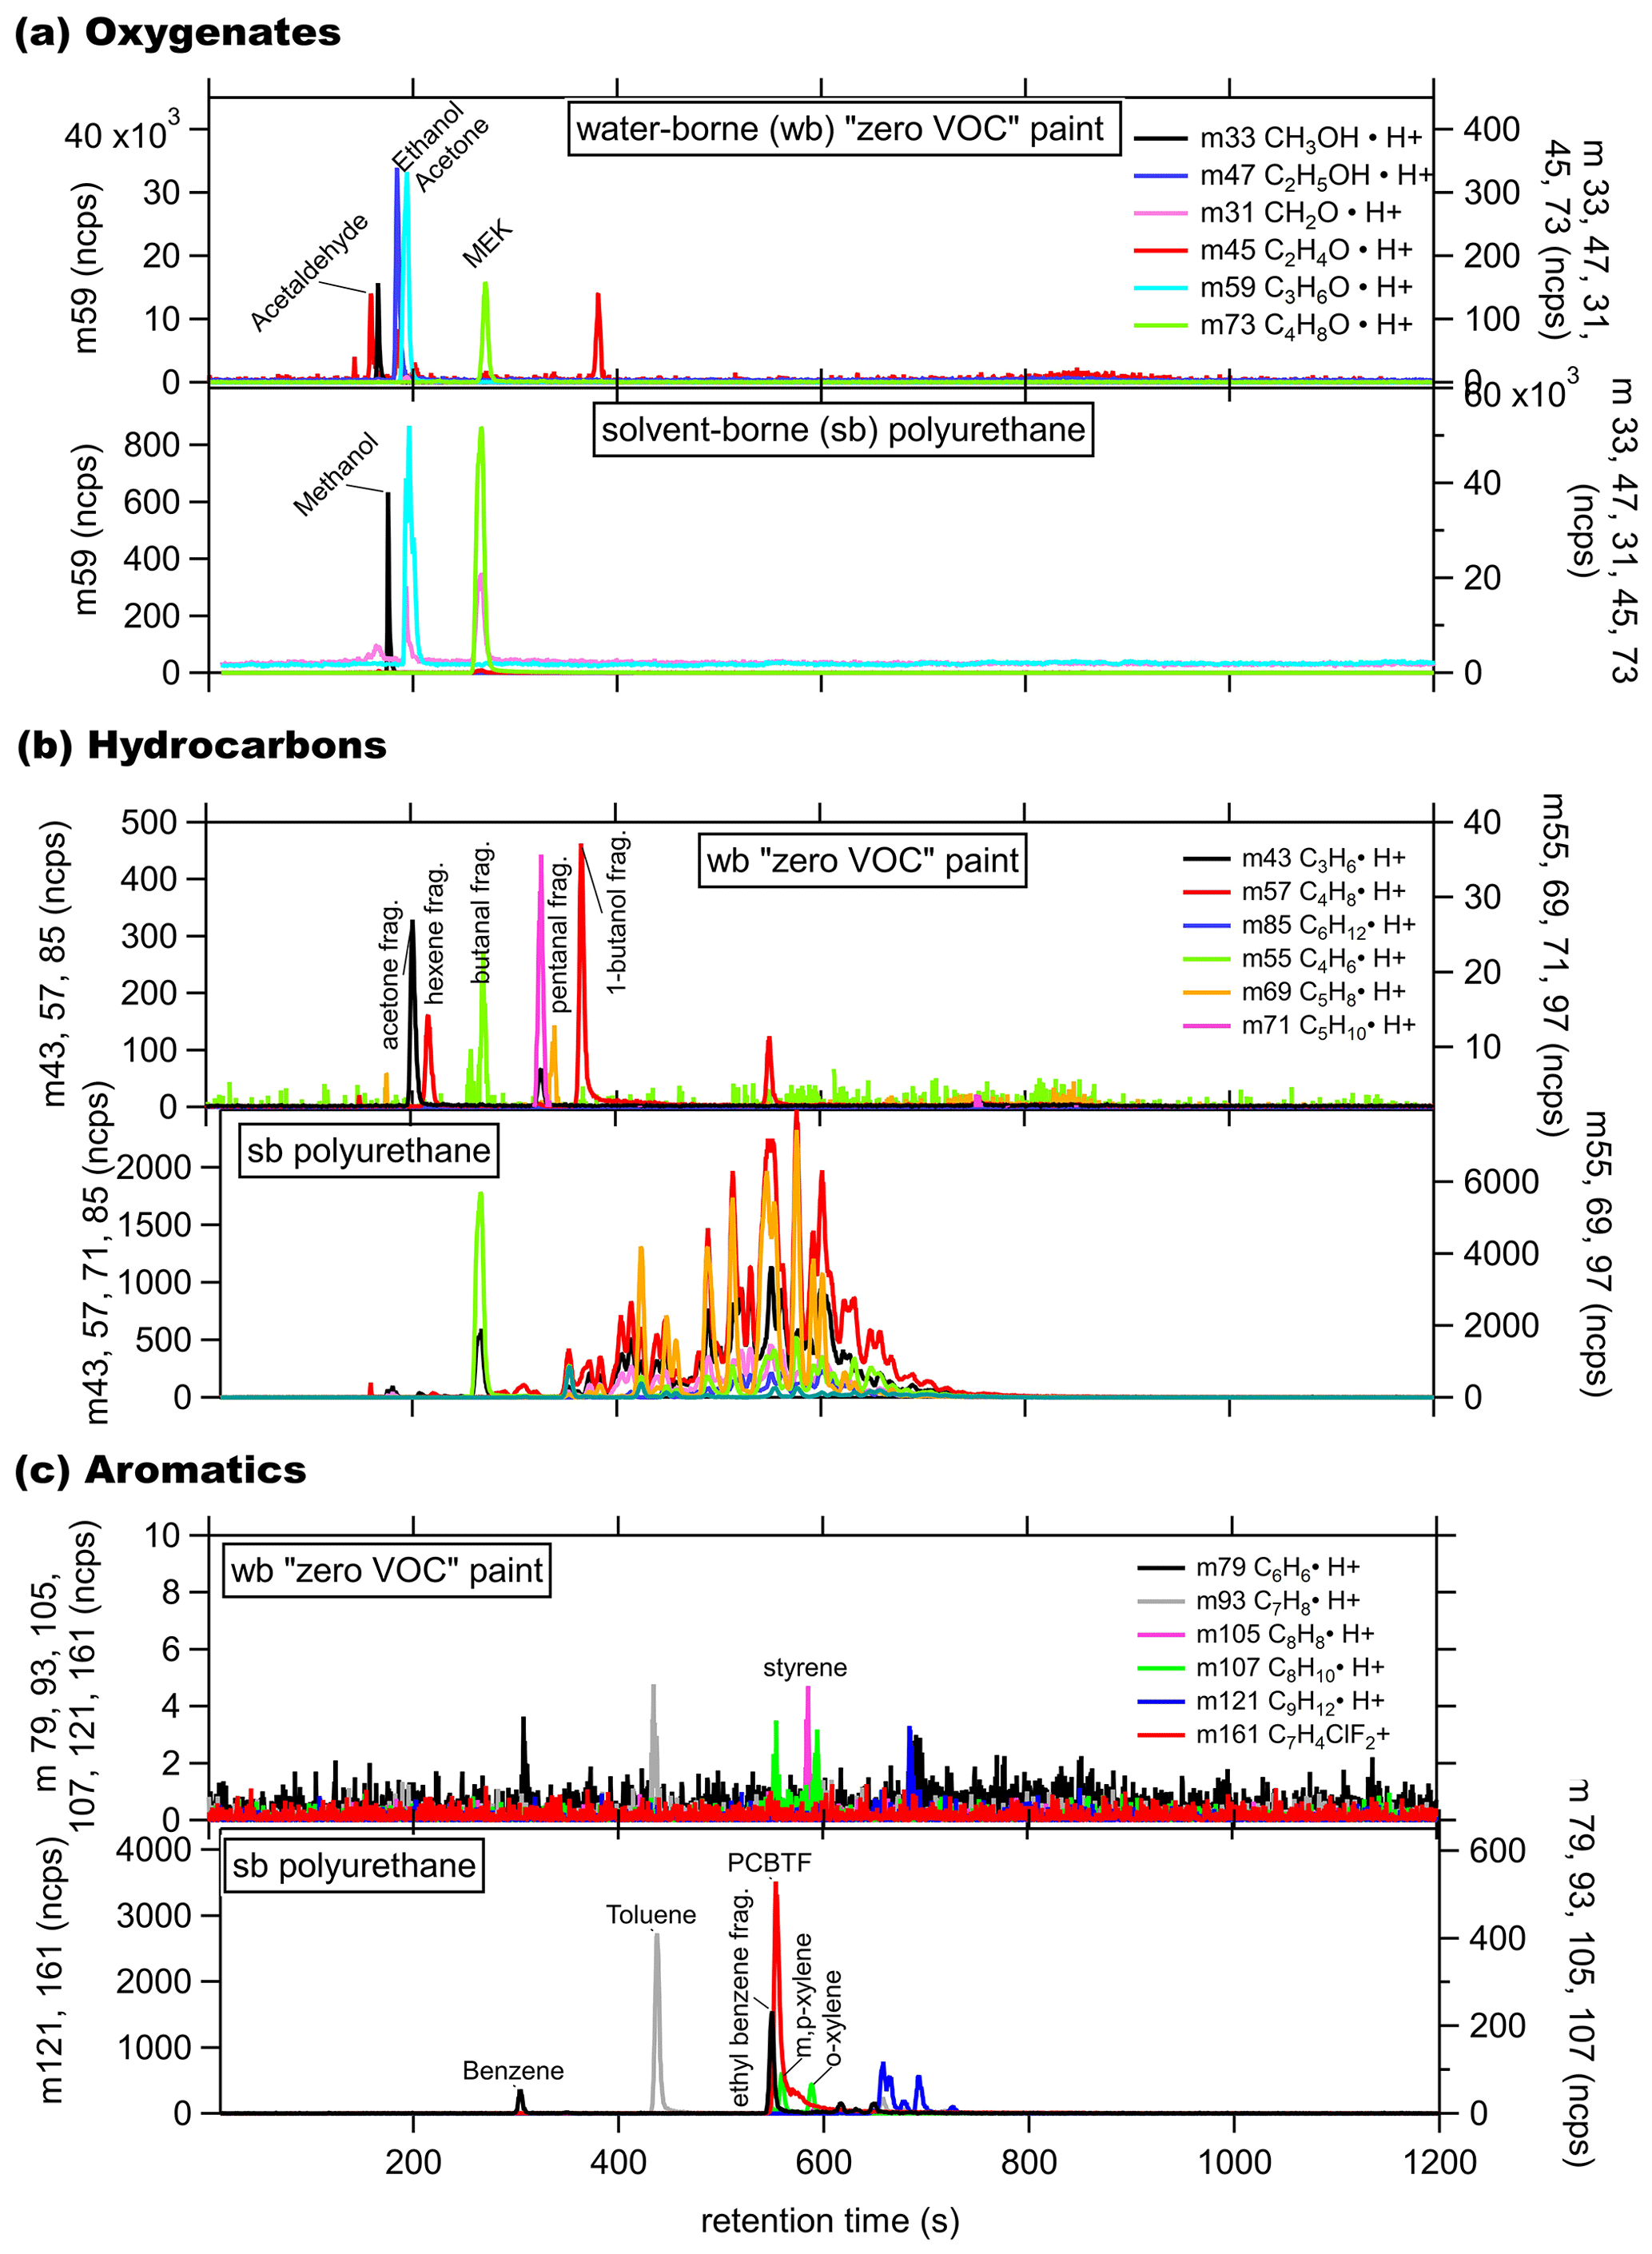
Figure 4GC-PTR-ToF chromatogram from the headspace of a water-borne (wb), “zero VOC” low-odor paint with ink and a solvent-borne (sb) polyurethane stain for (a) small oxygenates, (b) hydrocarbons, and (c) aromatics.
The GC peaks of the solvent-borne polyurethane in the chromatograms were several orders of magnitude larger than those for the water-borne product. Acetone and MEK were the most abundant small oxygenates, while ethanol and methanol emissions were negligible. Over 30 distinct hydrocarbon peaks were detected, with retention times over 300 s and with 55 (C4H6⋅H+) and 69 (C5H8⋅H+) dominating, which indicates C4− and larger hydrocarbons as being the primary constituents. The Stoddard solvent is commonly listed as an ingredient in solvent-borne coatings and mainly consists of < C10 alkanes, cycloalkanes, and aromatics (Censullo et al., 2002), which are clearly evident in the mass spectrum. These hydrocarbons are likely not useful unique tracers for coatings products due to overlapping contributions from gasoline and diesel fuel emission in urban areas (Gentner et al., 2012, 2013), and therefore, a detailed discussion of all the hydrocarbon peaks is beyond the scope of this work. Benzene ( 79) is one of the aromatics with minor emissions, but most other C7–C12 aromatics, including toluene ( 93), were more significant. Benzene is often reduced in coating formulations due to its toxicity. The largest aromatic peak is PCBTF, which is completely absent in all water-borne products that were tested.
During evaporation experiments, products were introduced into an enclosed chamber and sampled over longer periods to investigate changes in evaporative emissions. Figure 5a shows PTR-ToF-MS mass spectra during the evaporation experiments of a zero VOC low-odor paint, a primer and/or sealer paint, a latex paint, and a solvent-borne polyurethane stain. The mass spectra were taken when highly volatile compounds were evaporating early, following the initial application of the paint onto the balance, and later, when most of the volatile compounds had already evaporated (beyond 3 h). The mass spectra are given in parts per billion by volume (ppbv) and normalized to the weight loss of the product on the scale in the evaporation chamber. Select major peaks in each product are labeled by the most likely compound identification, as determined from fragmentation patterns, headspace analysis, and GC separation. The sums of all the measured PTR-ToF signals in the “early” mass scan are identified by the labels for all measured VOCs, which includes regulation-exempt species such as acetone. The pie charts in Fig. 5b show the distribution of VOC mass emitted during each complete evaporation experiment, with the largest 10 species labeled.
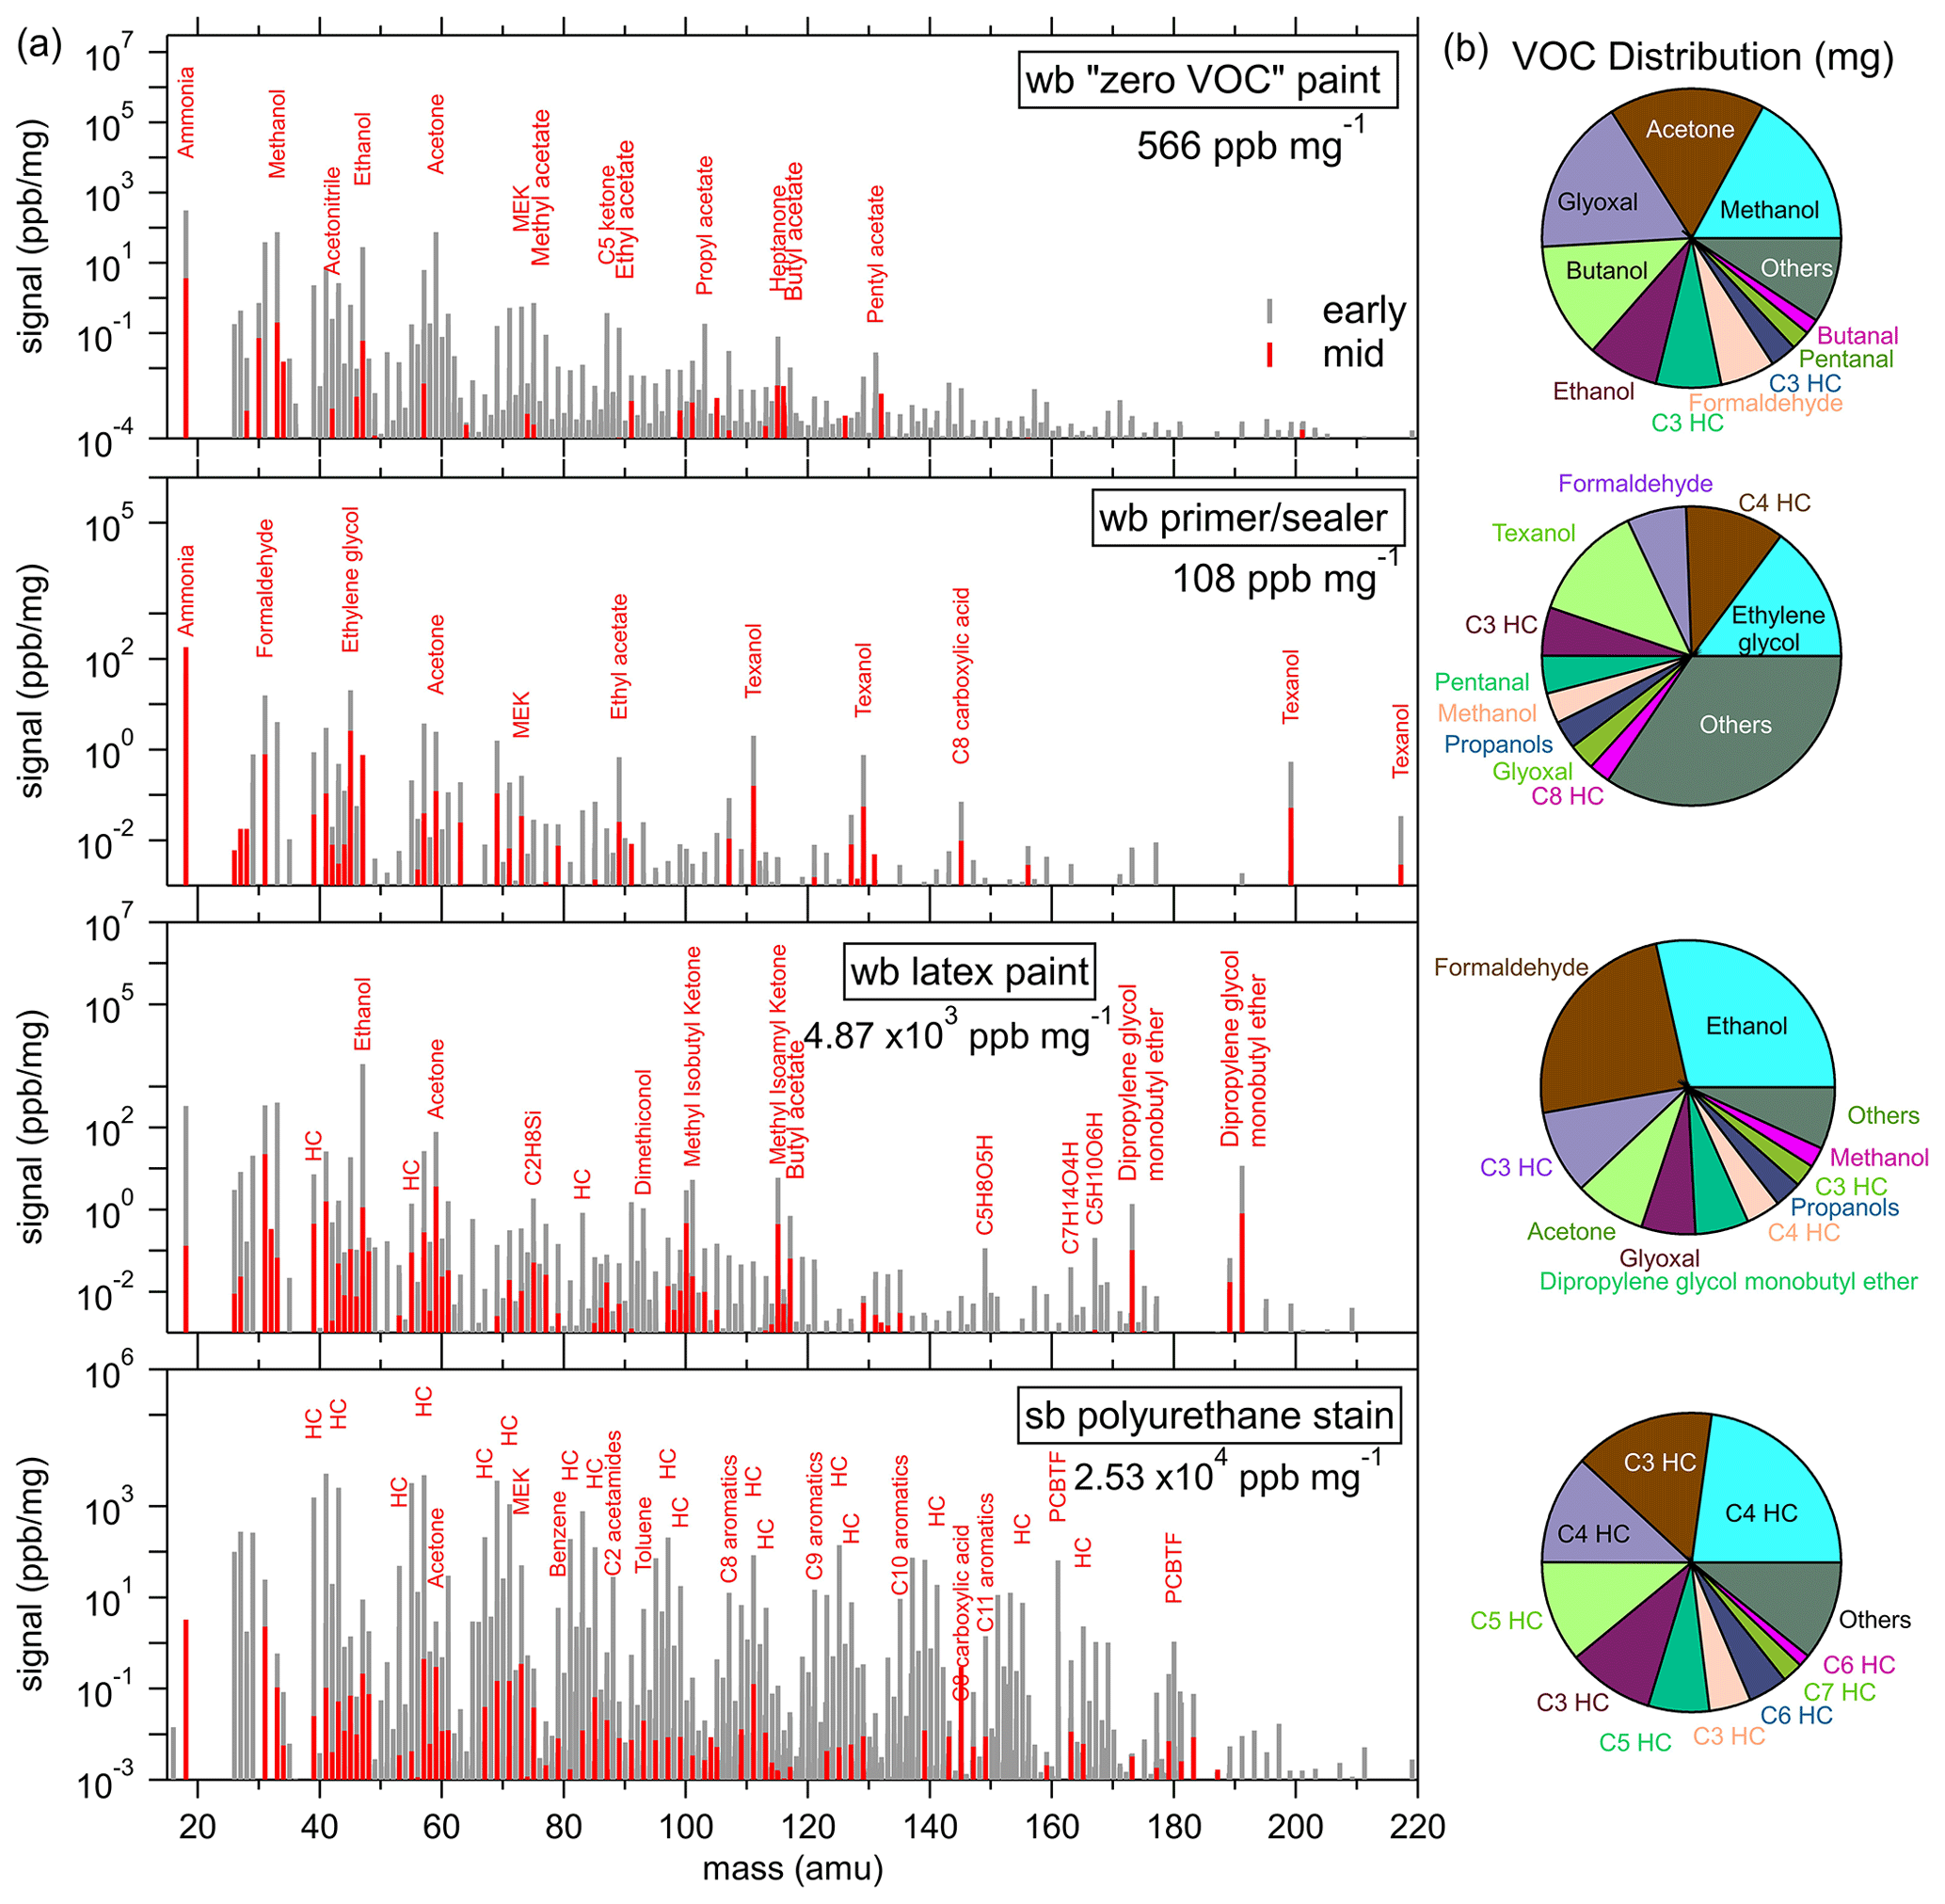
Figure 5(a) PTR-ToF-MS mass spectra of a water-borne (wb) low VOC paint, a wb primer and/or sealer paint, a wb latex paint, and a solvent-borne (sb) polyurethane stain, where the major peaks are labeled by their most likely identification. The values (in ppbv) are normalized to the weight loss of the product on the scale during the evaporation experiment. In each panel, a mass spectra in the early part (gray) of the experiment and one in the middle part (red) is shown. The total VOC signal taken from the early mass scan per milligram of product is indicated in the legend. (b) Pie charts of the total mass emitted by individual VOCs during evaporation experiments. Several small hydrocarbon masses could not be explicitly identified due to the fragmentation of larger masses and are instead labeled by their carbon number.
The zero VOC, low-odor paint and the primer and/or sealer paint have relatively low emissions, which were dominated by small oxygenated VOCs (methanol, ethanol, formaldehyde, and acetone). The primer and/or sealer paint also emitted Texanol, which can be expected from the ingredients of many water-borne products. The Texanol signal measured in the laboratory experiments has no contribution from the oxidation products that were identified as potential interferences during ambient summer sampling (Gkatzelis et al., 2021a, b). Methanol, ethanol, and acetone emissions are expected ingredients, as listed in the FIVE-VCP inventory. Formaldehyde is not an ingredient but emissions might be expected from the use of preservatives that include formaldehyde condensate compounds that rely on the release of free formaldehyde from the hydrolysis of a parent structure, such as dimethylol glycol and dimethylol urea. Dimethylol glycol and dimethylol urea are routinely used as biocides in water-borne paints and fungicidal products but have now been widely replaced by other compounds such as isothiazolinones (Salthammer et al., 2010). Ethylene glycol is an abundant ingredient in architectural coatings sales surveys (CARB, 2018) and has been observed in an indoor air study during a painting event (Pagonis et al., 2019). The signal at 45 (C2H4O ⋅ H+) is typically attributed in PTR-MS studies to acetaldehyde (de Gouw and Warneke, 2007), but ethylene glycol fragments mostly to 45. Acetaldehyde was present in the GC experiments, and although ethylene glycol was not observed, as it is likely lost in the water trap, its dominance in architectural coatings and paints suggests it may be a dominant species at that mass.
The total VOC signal was significantly larger, by an order of magnitude, for water-borne latex paint than for the two other water-borne paint products, with ethanol being the biggest emission. In addition to the small oxygenated VOCs, larger compounds such as dipropylene glycol monobutylether and other ketones and acetates were emitted. Several species listed as ingredients in CARB coatings surveys were tentatively identified in the paint emissions as ethylene glycol, methyl-n-amyl ketone, 1-methyl-2-pyrrolidinone, and methyl-, vinyl-, ethyl-, and butyl acetate. For butyl acetate, the major peak in the GC chromatogram at 117 correlated strongly with peaks at 61 and 43, which are known fragments of the parent ion (Buhr et al., 2002).
As was expected from the GC analysis, the VOC emissions of the solvent-borne polyurethane were markedly different and ∼5 times larger than the water-borne paint. Hydrocarbons and aromatics are clearly evident in the mass spectrum. Small masses (C < 5) are known to be affected by fragmentation, which adds to quantification uncertainty, and most hydrocarbon masses had multiple peaks in the GC chromatograms. As was noted in the headspace GC experiments, the solvent-borne polyurethane also emitted PCBTF.
The weight loss recorded on the scale during the evaporation experiments equals the mass emitted as VOCs, water (which was not measured), and other compounds undetectable by PTR-ToF. Each measured VOC (milligrams per cubic meter) was converted to an emission rate (milligrams per second) by multiplying with the gas flow rate and integrated across the length of the experiment to determine the total mass emitted by each individual species. Figure 6 shows the time series of mass emitted as the sum of all measured VOCs overlaid with the weight change measured on the Teflon-covered scale for each evaporation experiment.
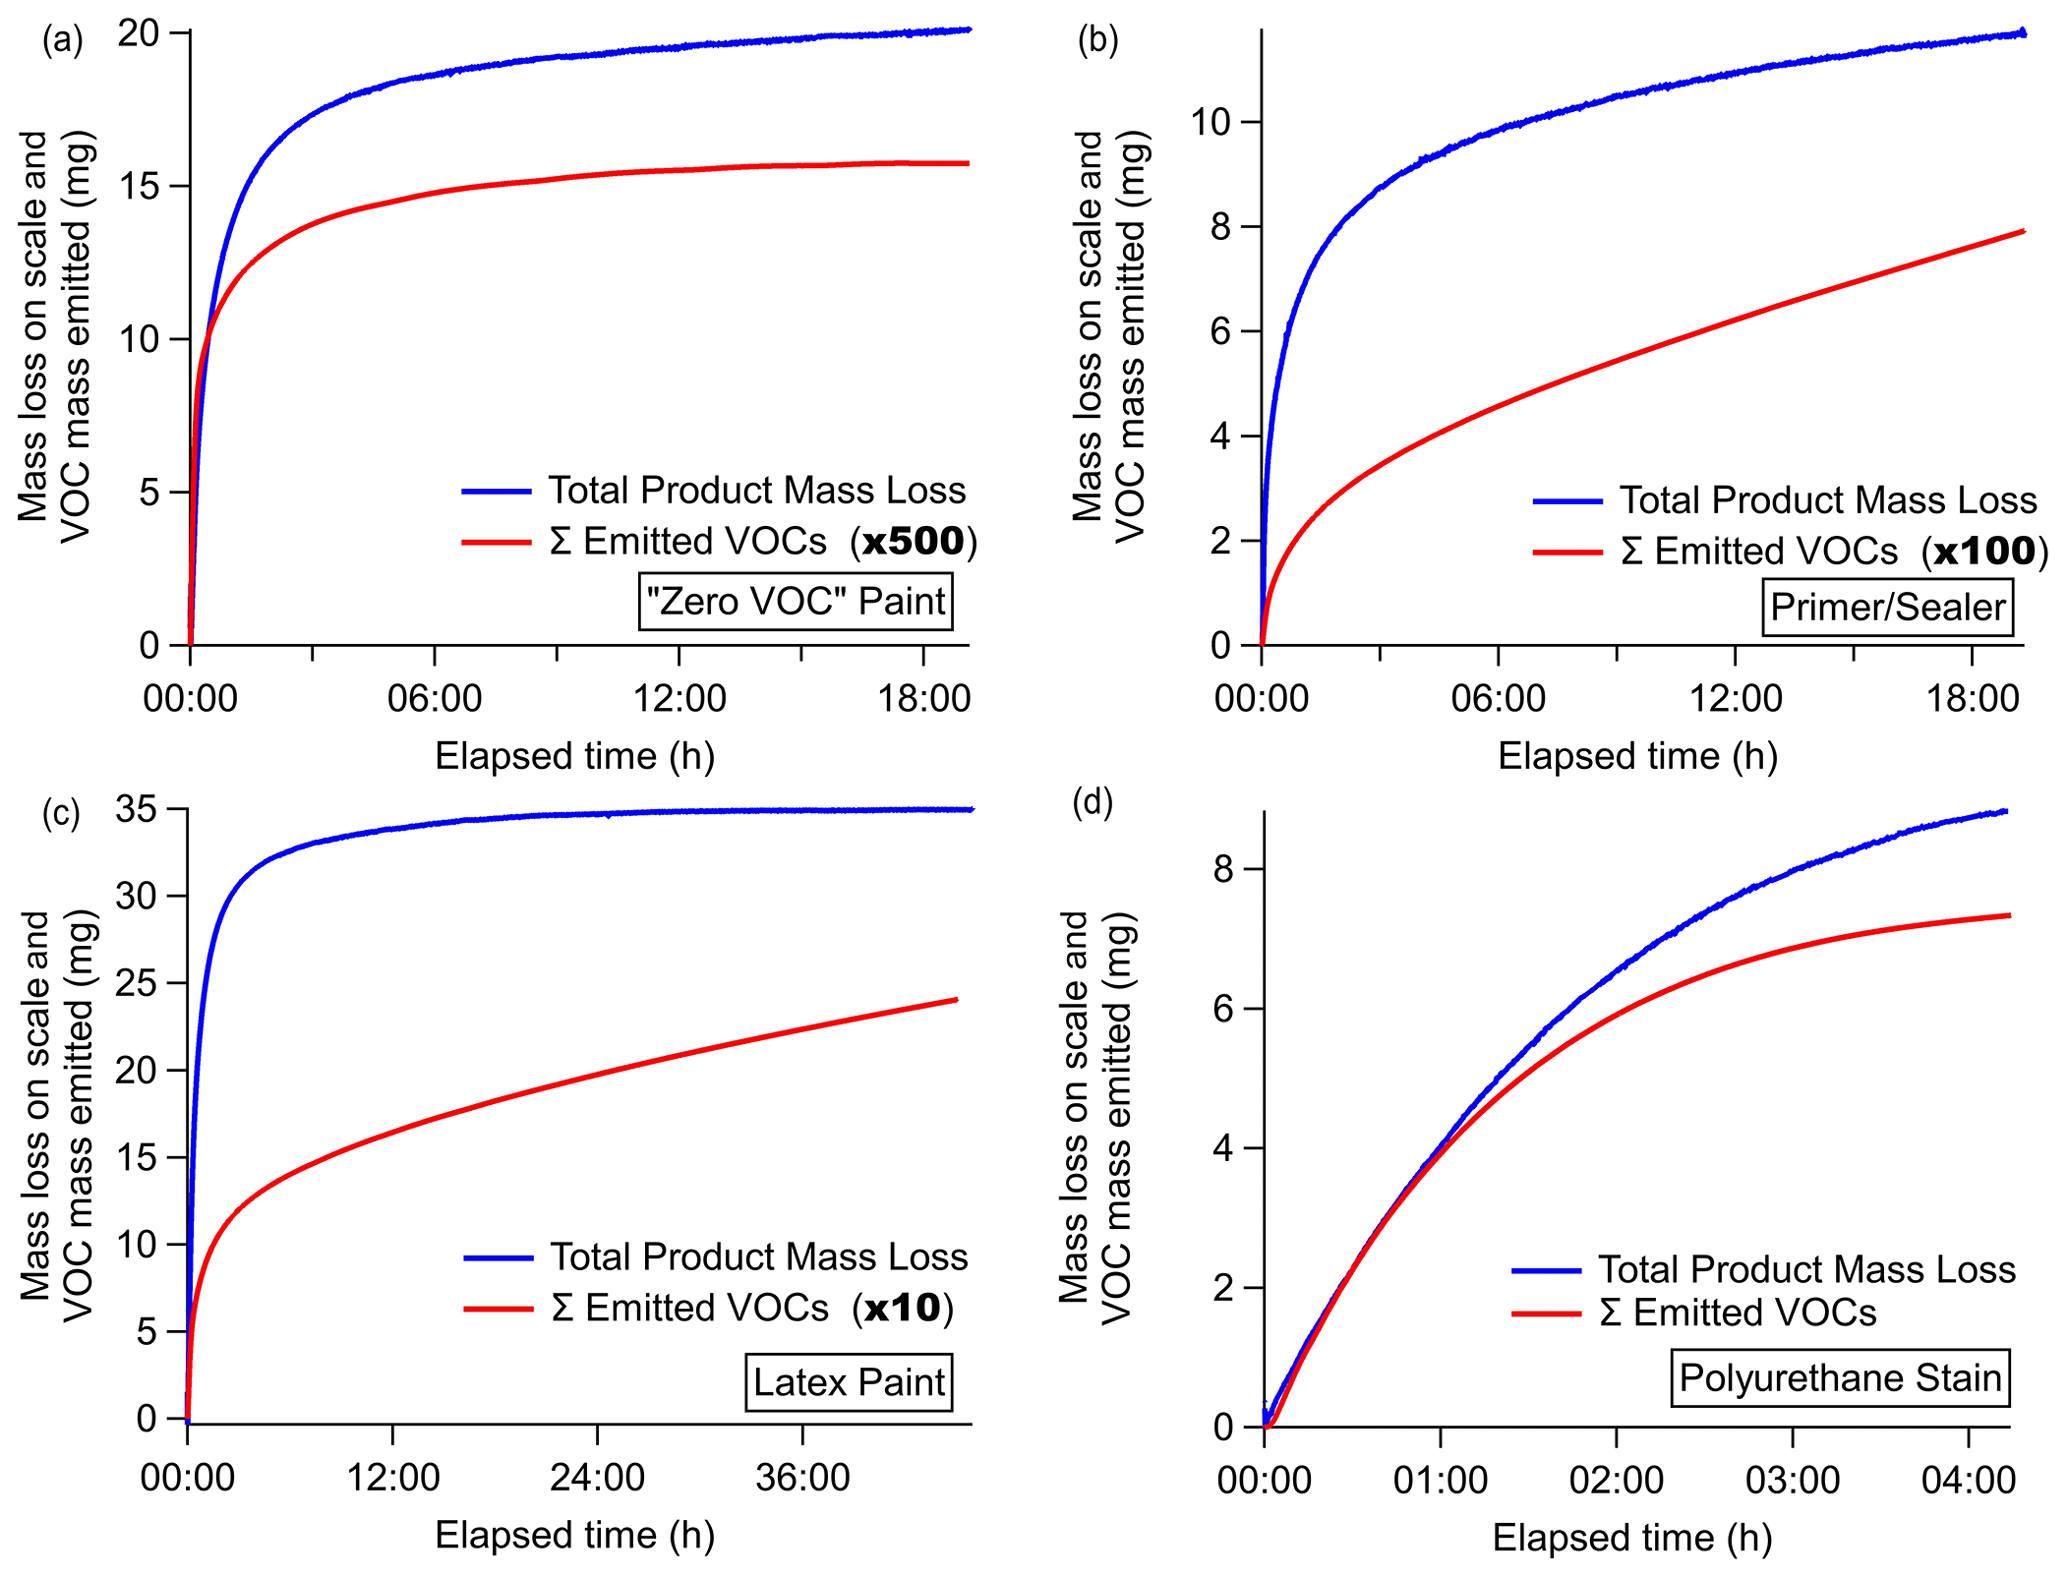
Figure 6Total product mass loss measured on the scale (blue) overlaid with the total mass emitted as VOCs (red) measured by the PTR-ToF-MS as a function of elapsed time. The emitted VOC scalar is indicated in the legend of each panel.
For the water-borne products in Fig. 6a–c, the mass emitted as VOCs is a very small fraction of the mass lost from the coatings product (<1 % to 7 %), and the main weight loss is attributed to water. Figure 6b shows the time series for the primer and/or sealer paint, which was the product with the largest difference in VOC emission rate and mass lost. This mass loss rate gradually leveled off, while the total VOC emission continued to increase at a steady rate. This was largely driven by only a few compounds (e.g., ethylene glycol), and therefore, the estimated mass loss and emission factors reported herein represent lower-end estimates. Latex paint showed a similar behavior, with VOCs steadily rising even at the conclusion of the experiment. These results are not unexpected, as emissions of Texanol from paints have been observed for periods as long as 15 months (Lin and Corsi, 2007), and these experiments were stopped after 19 h. The VOC mass emitted, as detected by PTR-ToF, is related to the VOC content of the product, where the latex paint clearly has the largest VOC emission and the zero VOC paint the lowest.
For the solvent-borne polyurethane coating in Fig. 6d, the mass emitted as VOCs exhibited a temporal profile that more closely mirrored the mass loss recorded by the scale. The similarity between the emission profile and weight loss indicates that the majority of the weight loss from the solvent-borne stain is due to VOC emissions, with only a small fraction of weight loss from other undetected compounds, or underestimation due to poor sensitivity to hydrocarbons. The mass remaining on the scale indicated that about 40 % of the weight remained as solids or unevaporated VOCs, which is within 5 % of what is expected from the manufacturer-reported VOC content of 550 g L−1. Figure 6b and d represent two extremes, and it is likely each product will have different evaporative properties, depending on the overall composition and atmospheric conditions. Figure 6 also shows that, for the (Fig. 6a) zero VOC paint and (Fig. 6d) polyurethane stain, the VOCs emitted in the first hour account for over 50 % of the total mass emitted as measured VOCs over the course of this experiment. Latex paint (Fig. 6c) takes an additional hour, and the primer and/or sealer (Fig. 6b) takes nearly 6 h for the majority of the measured VOCs to evaporate. The experiment did not complete to dryness; thus, the total mass measured is likely an underestimate and potentially under-accounts for semi- and intermediate-volatility VOCs that have a lower volatility. Continued emissions from dry paint have been observed following complete water evaporation (Clausen et al., 1991; Hodgson et al., 2000), though emissions from the dry film were not investigated here.
Figure 7a shows the time series of the emission rates of the sum of all measured VOCs for each product (milligrams per hour). The solvent-borne polyurethane had a maximum VOC emission rate (6.7 mg h−1) that was more than a factor of 2 greater than the highest-emitting water-borne coating. For each product, the highest total VOC emission rate peaked within the first 6 min. The time to reach the maximum emission rate varied to within a few minutes, and this likely reflects the different volatilities of the ingredients. For the coatings tested here, the majority of the measured VOC mass is emitted within the first few hours, and therefore, the most significant atmospheric implications for ozone formation likely occur during and shortly following application, though the changes in the VOC emissions over longer timescales and the effects of environmental and application parameters were not systematically investigated in this study.
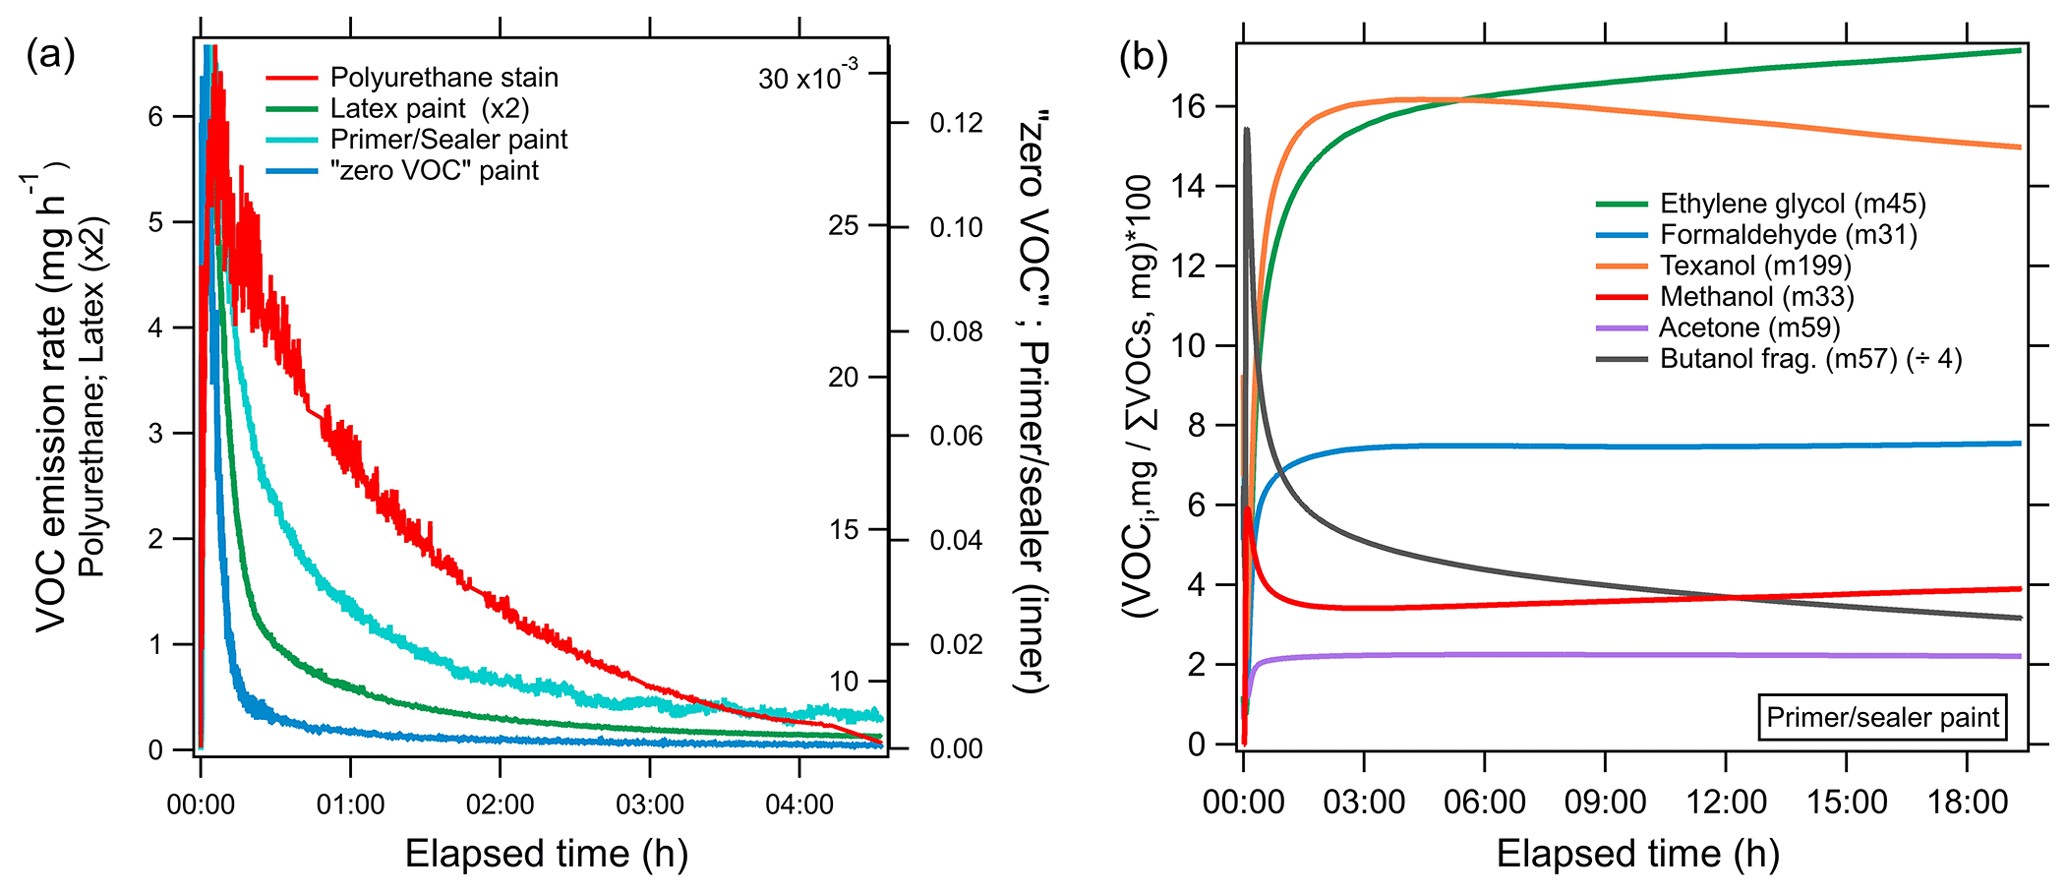
Figure 7(a) Emission rates (milligrams per hour) of all measured VOCs summed during evaporation experiments of different coating types, i.e., polyurethane stain (red), latex paint (green), primer and/or sealer paint (cyan), and zero VOC paint (blue). (b) Time series showing the percent of integrated mass emitted as an individual VOC (VOCi) to the total measured integrated VOC mass for the evaporation of the primer and/or sealer paint. The most likely identity and detected mass of individual VOCs are indicated in the legend.
Figure 7b shows the relative contribution of select VOCs to the total VOC mass as a function of time during the evaporation of the primer and/or sealer paint. Emissions of methanol and 1-butanol fragments dominated at the start of the experiment, followed by other species, including ethylene glycol and Texanol, which all peaked in a sequence that paralleled the reported saturation vapor concentrations (NIST Chemistry WebBook). The volatilities of candidate species at 45 suggest ethylene glycol (C0 ∼105 µg m−3) is the dominant compound, since the emissions of acetaldehyde (C0 ∼109 µg m−3) would have peaked before methanol (C0 ∼108 µg m−3). The emissions of acetone and formaldehyde are more complicated. Although the reported saturation vapor pressures are higher than methanol, the maximum emission rate peaked later and changed more gradually, resulting in more prolonged emissions. Fragmentation of larger compounds with a range of volatilities, including glycols, to the mass of acetone and formaldehyde is one possible explanation for these discrepancies. It is clear that the contribution of specific compounds to the total mass emitted can vary significantly over time and likely depends on volatility (C0), the initial composition of the product, and other factors such as drying time, temperature, humidity, and substrate interaction and/or properties. Texanol has a lower saturation vapor concentration (105 µg m−3), and the maximum emission rate occurred ∼11 min into the experiment, but the amount of mass emitted as Texanol during the first hour only accounted for 34 % of the total Texanol emitted during the entire experiment (∼19 h). It took over 6 h to account for 75 % of the total emitted Texanol, demonstrating that certain species can emit considerably across several hours to days. The majority of the Texanol emission does occur within the first several hours, and the fast evaporation supports its use as a tracer. Lin and Corsi (2007) showed that emissions of Texanol decreased by 90 % within the first 100 h following paint application, and mass closure assessments showed that airborne emissions of Texanol were greater than recovery from material components for thin film flat paints. The VOC speciation in each evaporation experiment is shown in Fig. 5b.
The PTR-ToF also detects several inorganic species such as ammonia, though the signal at 18 suffers from high background signal and has only been quantified for large emission sources such as biomass burning (Karl et al., 2007; Müller et al., 2014; Koss et al., 2018). There was a clear enhancement of ammonia in all water-borne coatings that was absent in the solvent-borne coatings, and it is likely that mass emitted as ammonia can be important in water-borne products as it is commonly used as a pH stabilizer. The ammonia PTR-ToF sensitivity derived from a comparison with a Fourier transform infrared (FTIR) spectrometer during biomass burning sampling (Koss et al., 2018) was used to estimate the mass emitted as ammonia for the latex paint. The total mass emitted as ammonia (2.1 mg) rivaled the VOC mass (2.3 mg) and shows that ammonia emissions can be significant from certain water-borne products. There was no direct calibration of ammonia during these experiments, and therefore, the discussion focuses on VOCs only.
Table 1 summarizes the results of the evaporation experiments. As expected, the solvent-borne polyurethane VOC emissions accounted for the greatest amount of total mass detected (83 %), which is likely a lower limit estimate since the PTR-ToF is less sensitive to hydrocarbons. The trend in the VOC emissions qualitatively tracks the VOC content reported on the product labels (grams per liter). The zero VOC paint data sheet reported <5 g L−1 VOCs and emitted very few VOCs with an emission factor (in grams of VOC emitted per initial weight of the product) of 0.7 g of VOC per kilogram of paint, followed by the primer and/or sealer (2.8 g per kilogram), latex paint (43.1 g per kilogram), and, finally, polyurethane (495 g per kilogram), with a reported VOC content of <550 g L−1. We note that the emission factors are underestimated since the experiments did not complete to dryness. The actual density of each product would need to be known to calculate the VOC mass emitted from the content labels; thus, the comparisons described above are qualitative. The VOC emission rates for each product, averaged during the 19 h experiments, also mirror the VOC content.
Table 1Summary of the evaporation experiments for four coating types, including percentage of mass lost as measured VOCs (%), VOC emission factors (grams per kilogram of paint), reported product label VOC content (grams per liter), and the average and maximum total VOC emission rates.
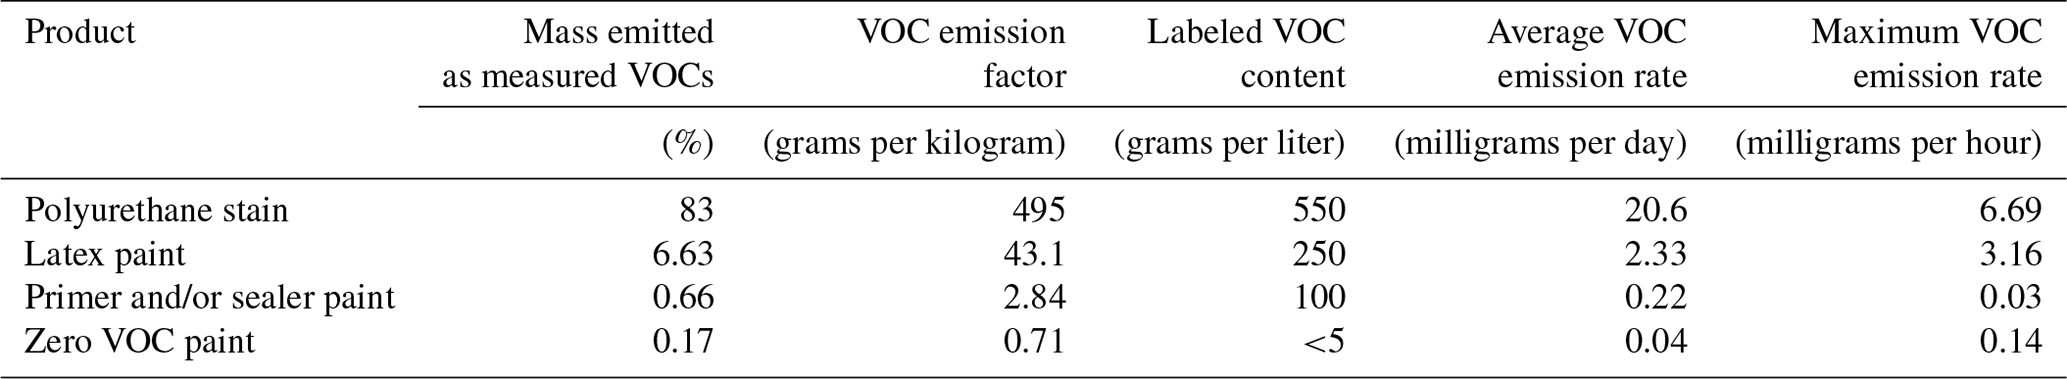
Note: emission factors are lower-end estimates calculated based on the length of these experiments.
Every 4 to 5 years, CARB conducts comprehensive surveys of architectural coatings sold in California to gather information about the ingredients and sales with the goal of updating emission inventories. The response to the surveys is mandatory, and CARB ensures the validity of the data following extensive quality assurance and quality control measures, and the results accurately represent the sales volume in California and are made publicly available (CARB, 2018). These sales, product formulations, and reactivity data are combined together with fate and transport adjustments to account for nonatmospheric loss processes to estimate the total emissions of reactive organic gases.
Figure 8a shows the trend in sales and emission estimates for the last five surveys from 1990 to 2014. The sales volume increased significantly from 1990 to 2004 but was lower in 2014 as the industry was still recovering from the economic recession in 2007–2009 that led to a sharp decline in construction spending (Bureau USC, 2020b). During this time, coating emissions continuously decreased from 126 to <27 t d−1 in California. Most of the sale volume was associated with water-borne coatings, and the fraction increased from ∼75 % of the total in 1990 to ∼93 % in 2013. The emissions, on the other hand, were dominated by solvent-borne coatings with >72 % of the total in 1990 and half solvent borne and water borne each in 2014. This shows that the VOC content, and therefore the emissions, of coatings in total have significantly decreased since the 1990s. Furthermore, the higher-emitting solvent-borne coatings are increasingly being replaced by water-borne products, which together resulted in this significant emission reduction. The CARB survey also separates the sale and emissions into the different product categories (not shown). Common water-borne paints, such as flat or low-gloss coatings and the accompanying primer, make up the bulk of the total sales but only about half of the emissions. In contrast, solvent-borne products such as stains, varnishes, or rust preventative coatings are sold in lower volumes but contribute the other half of the coating emissions.
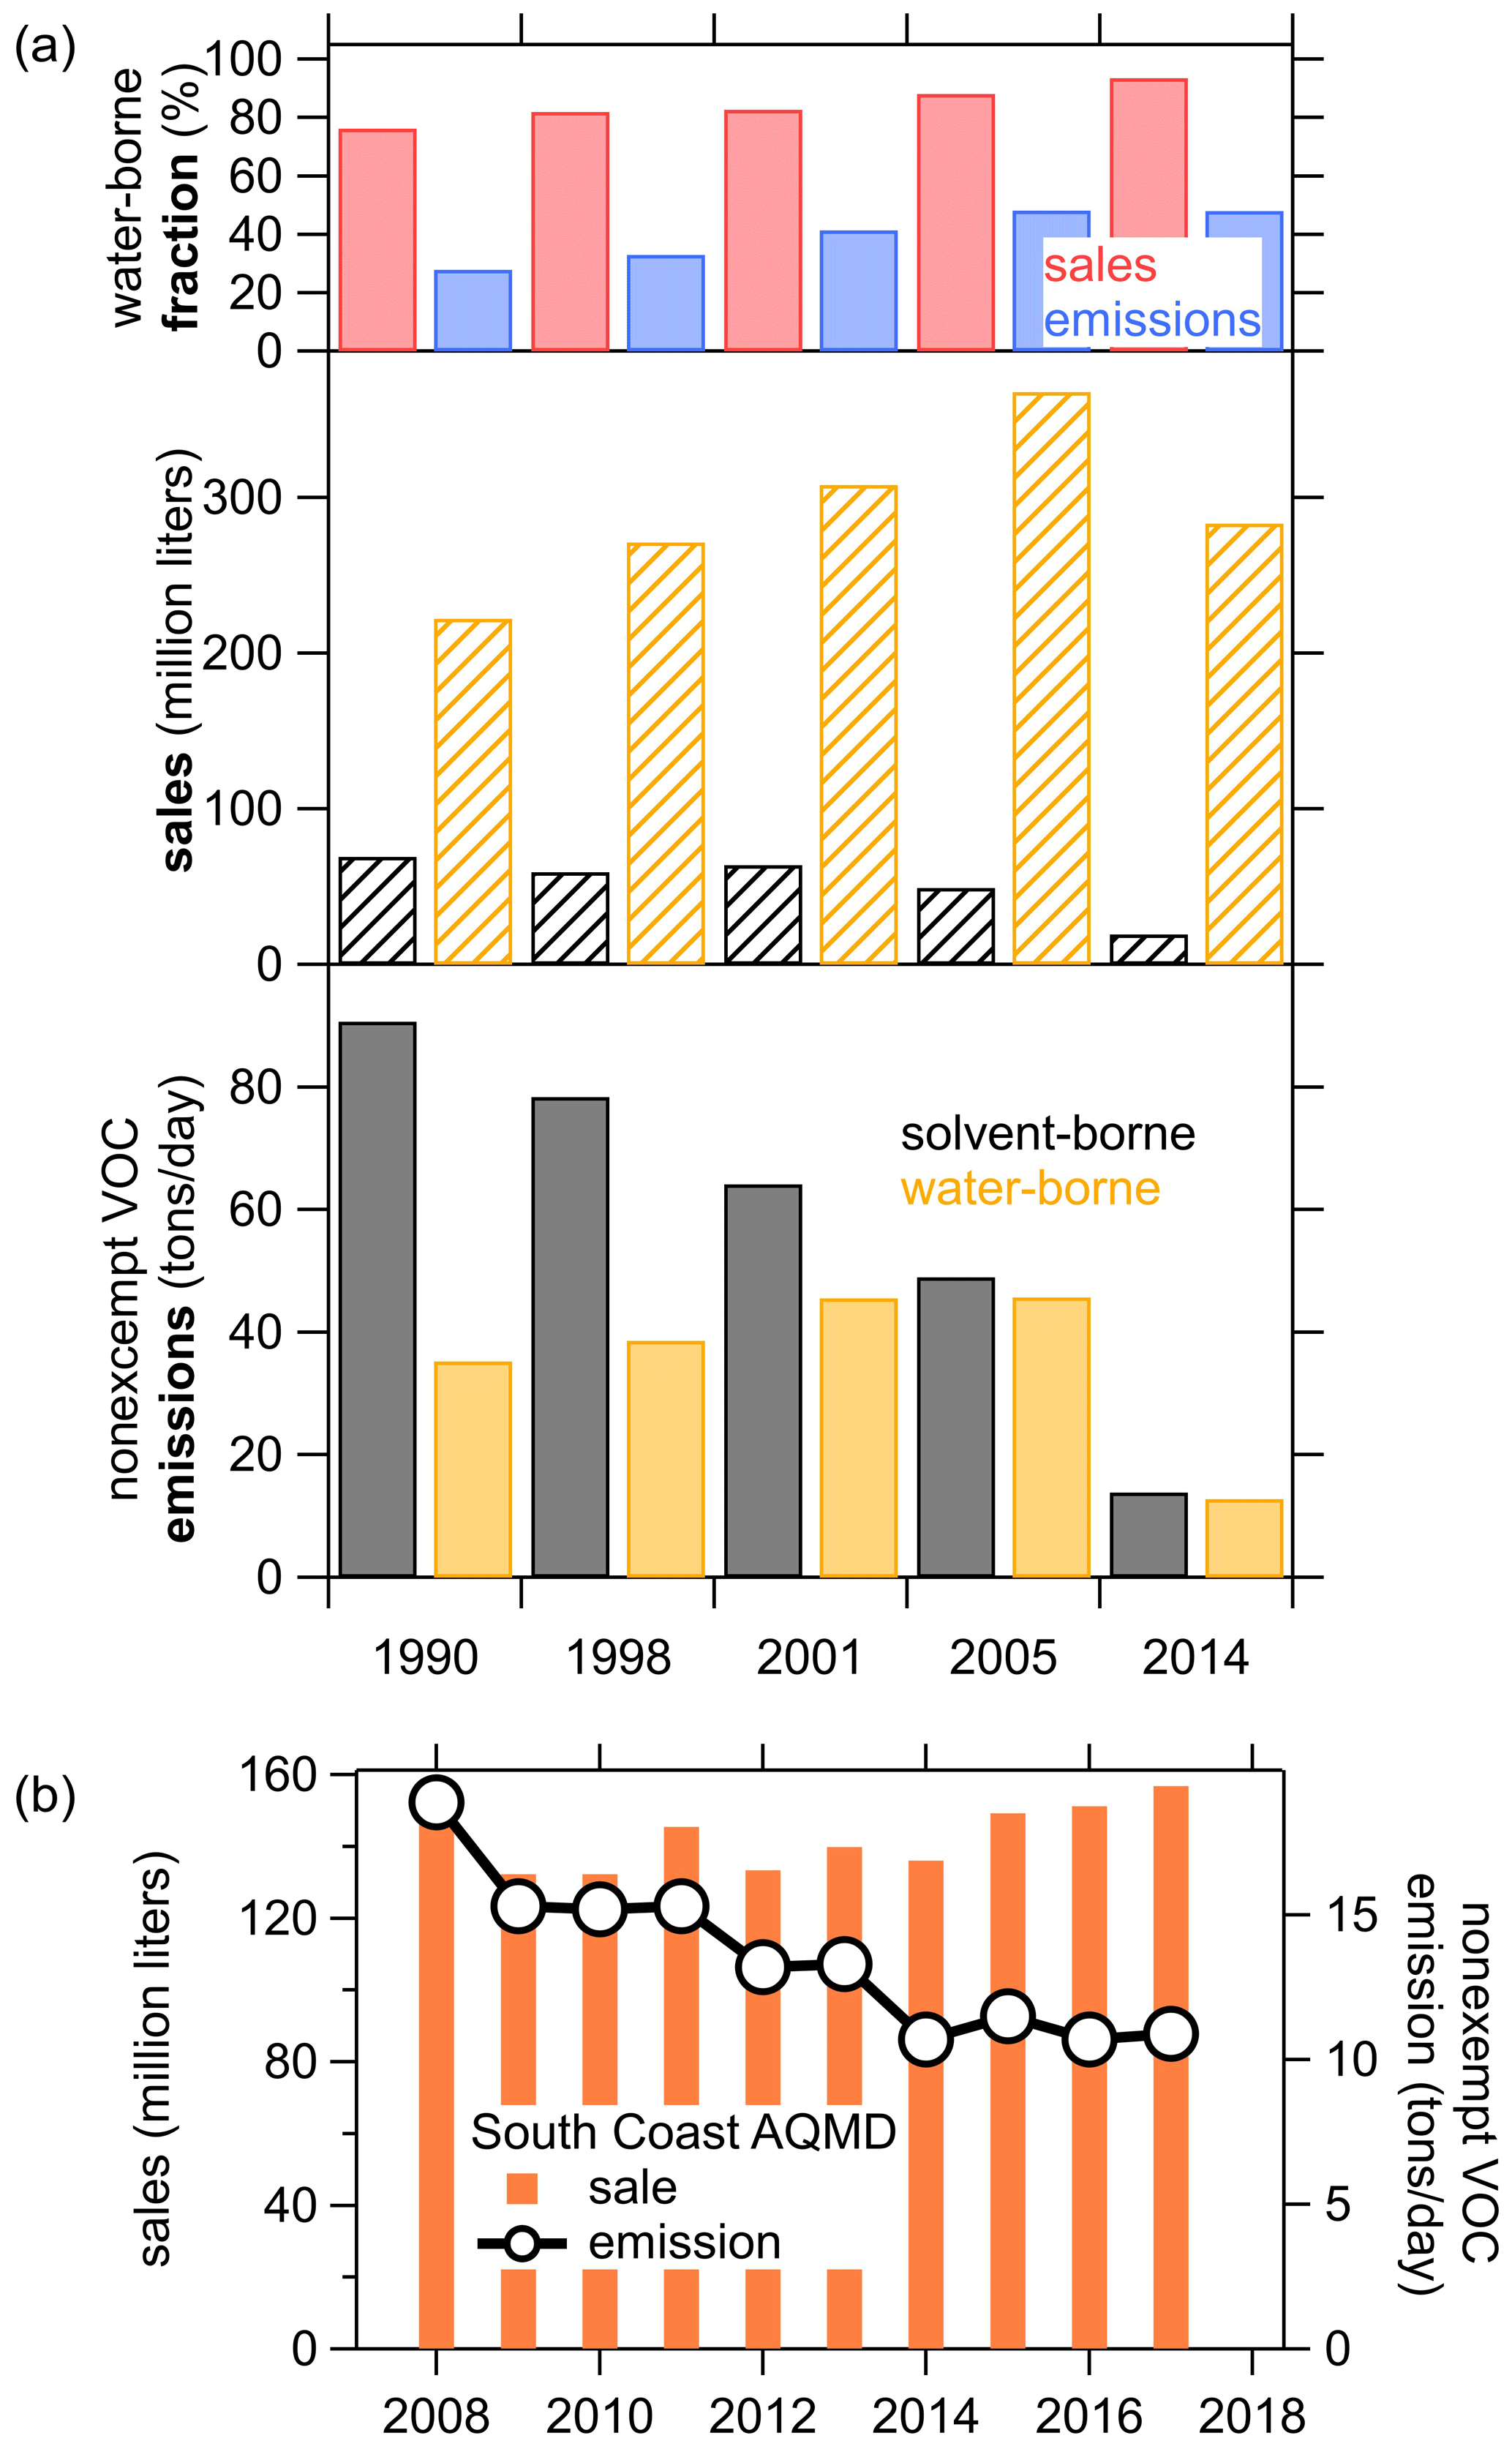
Figure 8(a) Trends in paints and coatings sales and VOC emissions from the CARB coating surveys since 1990. (b) South Coast Air Quality Management District (SCAQMD) trend of coatings (reproduced from http://www.aqmd.gov/home/rules-compliance/compliance/vocs/architectural-coatings, last access: 10 October 2020).
The South Coast Air Quality Management District (SCAQMD) also reports data from coatings sales and emissions from 2008 to 2017 (reproduced in Fig. 8b). These data are part of the CARB survey and represent half of the California-wide emissions. The sales in SCAQMD have been relatively steady, ranging from 132 million–159 million L with only slight increases since 2009, while the emissions have decreased significantly from 2008 to 2014 and were constant around 11 t d−1 from 2014 until 2017. This data set extends the CARB surveys and might indicate that the overall emissions have not continued the steep decease after 2014, so the 2014 CARB data might still be representative of the 2018 ambient measurements presented above.
The VOC ingredients of coatings reported in the CARB surveys have also changed significantly from 2005 to 2014. The left panels of Fig. 9a show the top 35 nonexempt VOC ingredients, out of over 300 in the survey, together with the exempt ingredients for 2005 and 2014 in the right panel. As was already clear from Fig. 8, the total amount of VOC ingredients significantly decreased from 33 000 t in 2005 to 11 000 t in 2014 but the composition has also changed. For example, in 2005 xylene was still a major ingredient of coatings but does not show up in the top 35 ingredients in 2014. Even though the total amount of exempt ingredients stayed almost constant, the relative amount has increased to almost 20 % in 2014 from about 7 % in 2005. The hydrocarbons from solvents are generally the largest emissions, but small oxygenated VOCs, such as ethylene glycol, propylene glycol, acetone, and ethanol, are also strongly emitted by paints and coatings and were detected as significant emitters in the laboratory experiments. The ingredients measured as emissions in the ambient or laboratory experiments by the PTR-ToF are indicated as solid bars in Fig. 9a for the 2014 data.
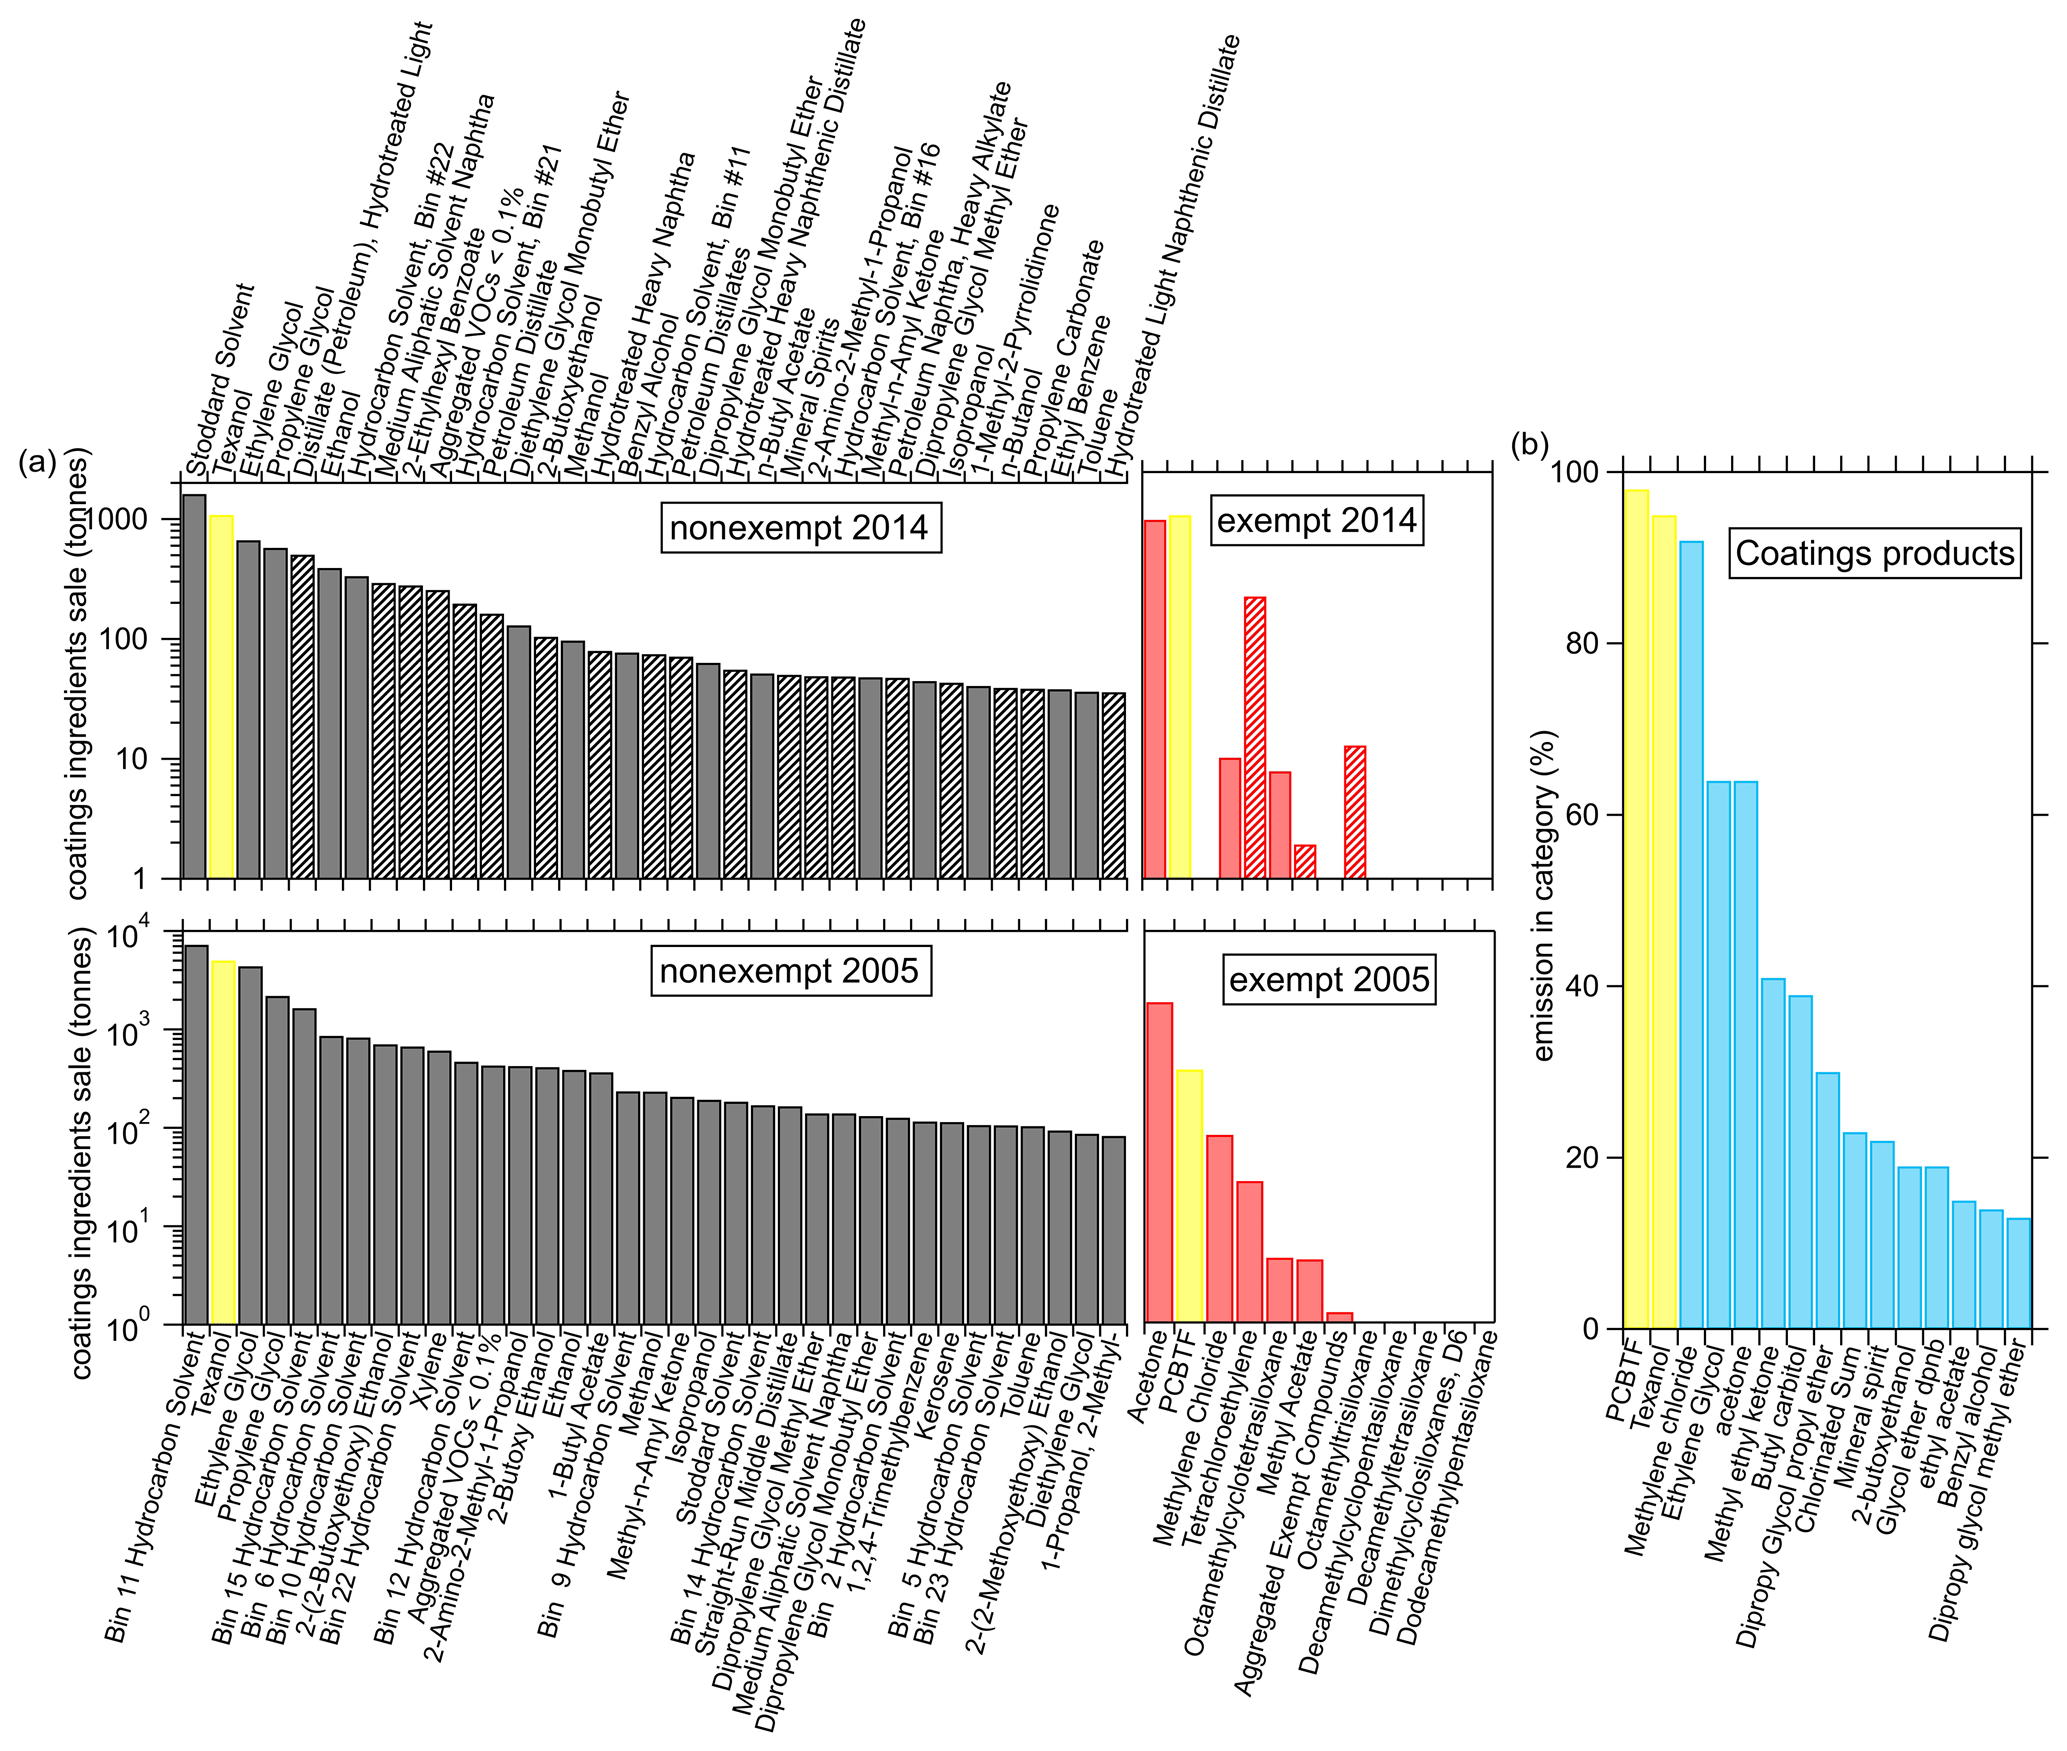
Figure 9(a) The sale of top 35 nonexempt and exempt VOC ingredients for coatings in 2005 and 2014 in California, together with the (b) fraction of emissions in the coatings category of the 15 highest VOCs as determined by the FIVE-VCP inventory (calculated using the method of McDonald et al., 2018a). The solid bars in the 2014 data indicate compounds that were detected in ambient or product testing.
Most of the VOC ingredients shown in Fig. 9a are not unique to coatings products, but Texanol and PCBTF are two compounds that are used only in coatings products as can be seen in Fig. 9b, where the fractions of VCP emissions in the coatings category of various VOCs are shown. The compounds are sorted by their contribution to the coatings category according to the FIVE-VCP inventory (calculated using the method of McDonald et al., 2018a). The only other compound, besides Texanol and PCBTF, that is predominantly attributed to coatings in the FIVE-VCP is methylene chloride, but the amount used is too small to be a useful atmospheric tracer.
All the VOC ingredients collected by the CARB survey might not necessarily be emitted by the products; for example, Texanol airborne recoveries were between 25 % and 90 %, depending on the paint and the substrate (Lin and Corsi, 2007), and in addition, reactions and polymerization will occur in the production of the chemical products. The ingredients that have been detected in either the evaporation experiments or the ambient measurements with the PTR-ToF are indicated as solid bars for the 2014 data in Fig. 9a. Texanol emitted during evaporation of the primer and/or sealer paint accounted for 13 % of the measured VOC emissions. The ingredients reported in the CARB 2014 survey indicate that Texanol was 10 % of the total VOC ingredient sales, including exempt VOCs. The agreement between the laboratory measurement of Texanol and the ingredients summary is reasonable considering the range in airborne recoveries. PCBTF in the solvent-borne polyurethane only accounted for 0.2 % of the total VOC mass as compared to the reported ingredient sales contribution of 9 %. These results demonstrate the challenges in generating a representative emissions inventory from product sales, as each product has a unique composition, and ingredient sales do not necessarily equal emissions. It is also possible that uses of PCBTF could differ between formulations available to consumers and those used for professional applications. Only a small selection of commercially available coatings were tested here.
More details of the use of PCBTF and Texanol are shown in Fig. 10, where Fig. 10b shows that the use of Texanol has strongly declined, while the use of PCBTF has increased such that it had comparable ingredients sales in 2014. Both were around 10 % of the total sale each. The pie charts in Fig. 10a show that PCBTF is mainly used as a solvent in solvent-borne products such as sealers, stains, and polyurethane finishers. Texanol is used in water-borne products as a coalescent for latex and other paints (Lin and Corsi, 2007). In summary, the CARB survey results in Figs. 8, 9, and 10 indicate that PCBTF might be a good atmospheric tracer for solvent-borne coatings and Texanol for water-borne coatings, even though the use of Texanol is rapidly declining.
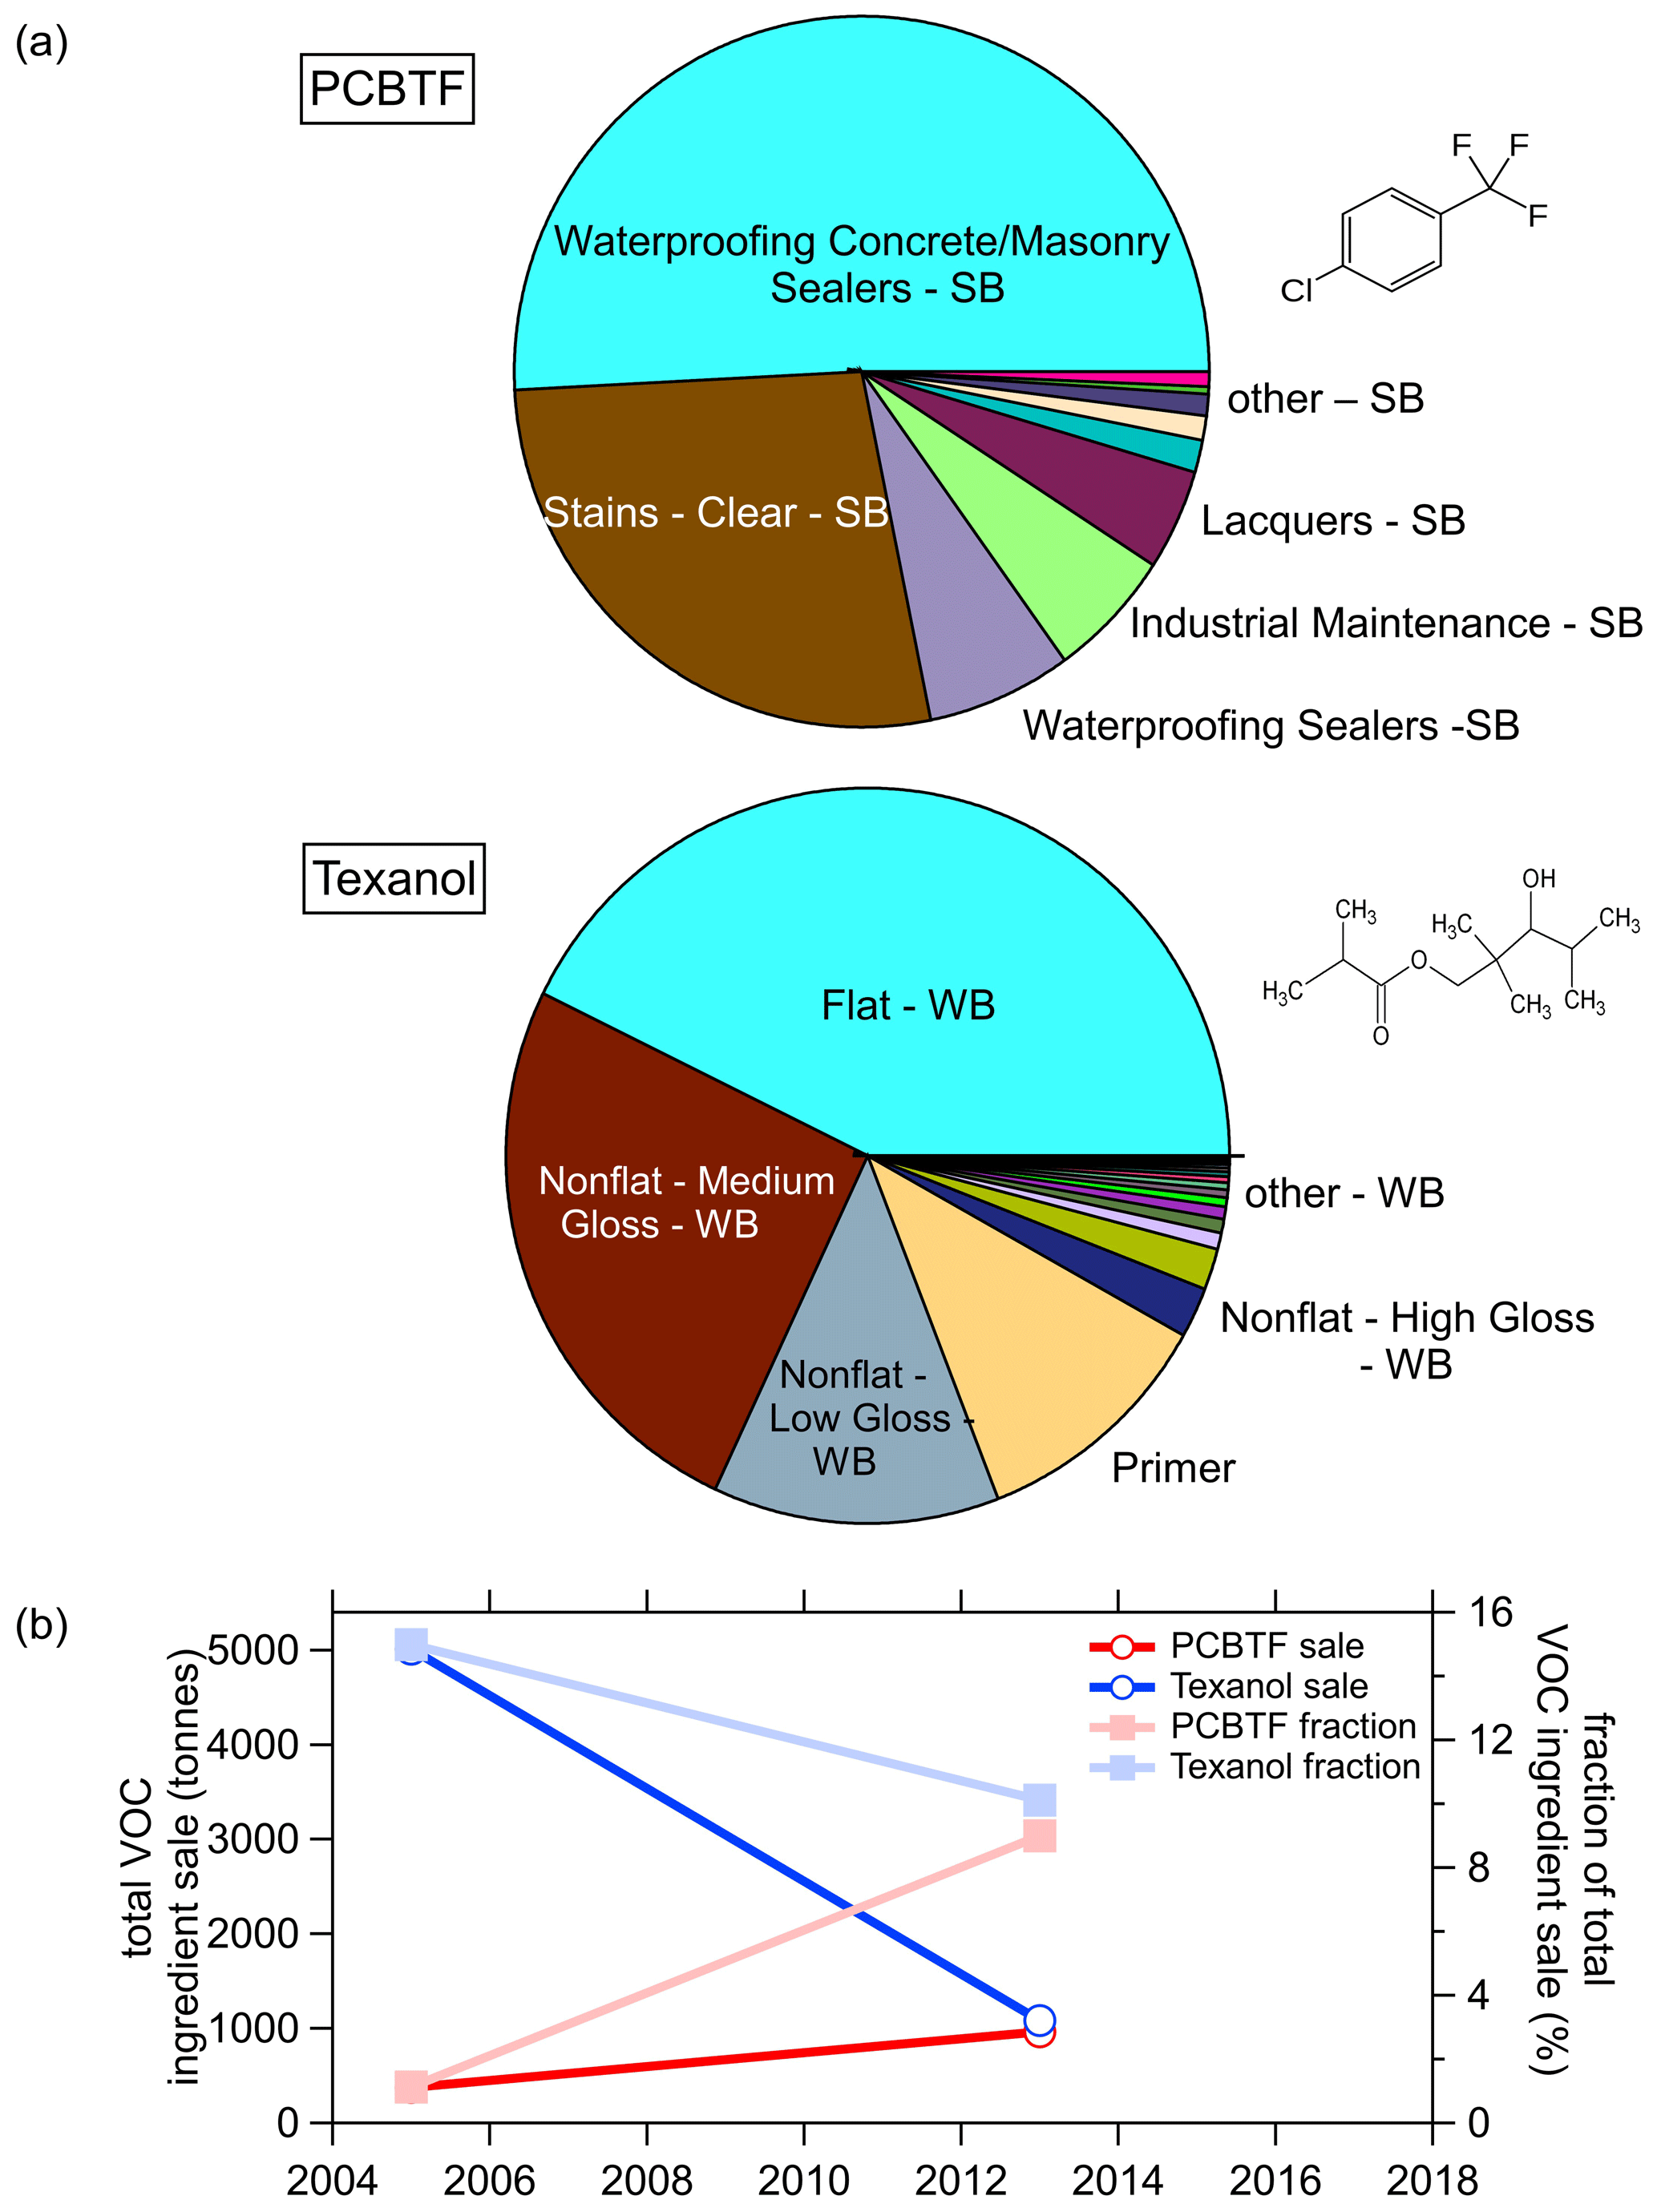
Figure 10(a) PCBTF and Texanol use in solvent-borne (SB) and water-borne (WB) product categories in California and their (b) trends in sales and emissions.
Mobile field measurements in urban areas show that compounds largely associated with architectural coatings, such as PCBTF and Texanol, were observed from point source locations near and around construction activity. Unlike other VCP emissions previously described by Gkatzelis et al. (2021a), these molecules do not correlate strongly with population density, which suggests that their emissions are not driven by widespread, individual usage. In contrast, the spatial and temporal patterns suggest that coating emissions are from discrete applications, such as architectural and construction projects.
Headspace analysis measured with a PTR-ToF and GC front end confirmed the identity of many VOCs cataloged as ingredients in inventories compiled by CARB from architectural coating surveys. The zero VOC paint analyzed had low VOC emissions dominated by small oxygenates including methanol, ethanol, and acetone, with negligible emissions from smaller hydrocarbons and aromatics. The solvent-borne polyurethane stain emissions were compositionally different, with the distribution shifted largely towards hydrocarbons and aromatics with a clear enhancement of PCBTF. The emission rates (milligrams per second) were calculated for each VOC, and the total mass emitted as VOCs was calculated for the length of a controlled evaporation experiment and compared to total product mass emitted. The VOCs accounted for a range of 0.2–83 % of the total mass emitted, with the relative contribution mirroring the VOC content (grams per liter) reported by the manufacturer. Inorganic species, such as ammonia, were detected in water-borne coatings and likely contribute to some evaporative mass loss, though their contribution was not quantified in this study. The total VOC emission rates were highest within the first 6 min of application, and for three of the four products, over 50 % of the total VOC mass was emitted within the first 2 h. These results highlight the importance of the initial evaporative emissions of coatings following application events, as they likely have important impacts on ozone.
Finally, reported sales and usage trends were compared to ingredients compiled in architectural coatings surveys, and show Texanol and PCBTF are unique to coatings. Although Texanol use has strongly declined and PCBTF has increased, they had comparable ingredients sales in 2014 at around 10 % of the total. The prevalence and distinct usage of these VOCs support the assignment of PCBTF and Texanol as tracers for solvent- and water-borne coatings, respectively.
The data from the laboratory tests are available on request. Ambient data from the NYICE 2018 are available at https://csl.noaa.gov/groups/csl7/measurements/mobilelab/MobileLabNYICE/DataDownload/ (National Oceanic and Atmospheric Administration Chemical Sciences Laboratory, 2021).
The supplement related to this article is available online at: https://doi.org/10.5194/acp-21-6005-2021-supplement.
MMC, CW, JBG, GIG, and JO carried out the laboratory experiments. JO designed and built the GC inlet system. Ambient measurements were collected by MMC, GIG, JBG, KA, and JP. FIVE-VCP inventory work was completed by BCM and MT. CES and CW conducted data analysis and wrote the paper. All authors contributed to the discussion and interpretation of the results.
The authors declare that they have no conflict of interest.
Mention of commercial products is for identification purposes only and does not imply endorsements.
The authors thank William Kuster for the valuable conversations and assistance with the GC inlet system.
This research has been supported by the CIRES Innovative Research Program and NOAA Cooperative Institute Agreement (grant no. NA17OAR4320101).
This paper was edited by Yafang Cheng and reviewed by three anonymous referees.
Bishop, G. A. and Haugen, M. J.: The story of ever diminishing vehicle tailpipe emissions as observed in the Chicago, Illinois Area, Environ. Sci. Technol., 52, 7587–7593, https://doi.org/10.1021/acs.est.8b00926, 2018.
Buhr, K., van Ruth, S., and Delahunty, C.: Analysis of volatile flavour compounds by Proton Transfer Reaction-Mass Spectrometry: fragmentation patterns and discrimination between isobaric and isomeric compounds, Int. J. Mass Spectrom., 221, 1–7, https://doi.org/10.1016/S1387-3806(02)00896-5, 2002.
Bureau USC, United States Census Bureau: Demographic Data, available at: https://www.census.gov/programs-surveys/ces/data/restricted-use-data/demographic-data.html, last access: 10 October 2020a.
Bureau USC, United States Census Bureau: Construction Spending, available at: https://www.census.gov/construction/c30/historical_data.html, last access: 10 October 2020b.
California Air Resources Board (CARB): 2014 Architectural Coatings Survey, available at: https://ww2.arb.ca.gov/our-work/programs/coatings/architectural-coatings/architectural-coatings-survey (last access: 15 September 2020), 2018.
California Air Resources Board (CARB): 2015 Consumer & Commercial Products Survey, available at: https://ww2.arb.ca.gov/our-work/programs/consumer-products-program/consumer-commercial-product-surveys (last access: 15 September 2020), 2015.
Censullo, A. C., Jones, D. R., and Wills, M. T.: Investigation of low reactivity solvents, Final Report to California Air Resources Board Research Division, Contract No. 98-310, 2002.
Clausen, P. A., Wolkoff, P., Holst, E., and Nielsen, P. A.: Long-term emission of volatile organic compounds from waterborne paints- methods of comparison, Indoor Air, 4, 562–576, https://doi.org/10.1111/j.1600-0668.1991.00019.x, 1991.
Coggon, M. M., McDonald, B. C., Vlasenko, A., Veres, P. R., Bernard, F., Koss, A. R., Yuan, B., Gilman, J. B., Peischl, J., Aikin, K. C., DuRant, J., Warneke, C., Li, S-M., and de Gouw, J. A.: Diurnal variability and emission pattern of decamethylcyclopentasiloxane (D5) from the application of personal care products in two north American cities, Environ. Sci. Technol., 52, 5610–5618, https://doi.org/10.1021/acs.est.8b00506, 2018.
Coggon, M. M., Gkatzelis, G. I., McDonald, B. C., Gilman, J. B., Schwantes, R., Abuhassan, N., Aiken, K. C., Arend, M., Berkoff, T., Brown, S., Campos, T., Dickerson, R. R., Gronoff, G., Hurley, J., Isaacman-VanWertz, G., Koss, A. R., Li, M., McKeen, S. A., Moshary, F., Peischl, J., Pospisilova, V., Ren, X., Wilson, A., Wu, Y., Trainer, M., and Warneke, C.: The human forest: Volatile chemical products enhance urban ozone, P. Natl. Acad. Sci. USA, submitted, 2021.
Corsi, R. L. and Lin, C.-C.: Emissions of 2,2,4-Trimethyl-1,3-Pentanediol Monoisobutyrate (TMPD-MIB) from Latex paint: A critical review, Crit. Rev. in Environ. Sci. Technol., 39, 1052–1080, https://doi.org/10.1080/10643380801977925, 2009.
de Gouw, J. A. and Warneke, C.: Measurements of volatile organic compounds in the earth's atmosphere using proton-transfer-reaction mass spectrometry, Mass Spectrom. Rev., 26, 223–257, https://doi.org/10.1002/mas.20119, 2007.
Deming, B. L., Pagonis, D., Liu, X., Day, D. A., Talukdar, R., Krechmer, J. E., de Gouw, J. A., Jimenez, J. L., and Ziemann, P. J.: Measurements of delays of gas-phase compounds in a wide variety of tubing materials due to gas–wall interactions, Atmos. Meas. Tech., 12, 3453–3461, https://doi.org/10.5194/amt-12-3453-2019, 2019.
EPA: National Emissions Inventory (NEI) 2014, version 1. ed Research Triangle Park NC, Office of Air Quality Planning and Standards, U.S. Environmental Protection Agency, available at: https://www.epa.gov/air-emissions-inventories/2014-national-emissions-inventory-nei-data (last access: 10 October 2020), 2017.
Gately, C. K., Hutyra, L. R., and Sue Wing, I.: Cities, traffic, and CO2: A multidecadal assessment of trends, drivers, and scaling relationships, P. Natl. Acad. Sci. USA, 112, 4999–5004, https://doi.org/10.1073/pnas.1421723112, 2015.
Gentner, D. R., Isaacman, G., Worton, D. R., Chan, A. W., Dallmann, T. R., Davis, L., Liu, S., Day, D. A., Russell, L. M., Wilson, K. R., Weber, R., Guha, A., Harley, R. A., and Goldstein, A. H.: Elucidating secondary organic aerosol from diesel and gasoline vehicles through detailed characterization of organic carbon emissions, P. Natl. Acad. Sci. USA, 109, 18318–18323, https://doi.org/10.1073/pnas.1212272109, 2012.
Gentner, D. R., Worton, D. R., Isaacman, G., Davis, L., Dallmann, T. R. Wood, E. C. Herndon, S. C, Goldstein, A. H., and Harley, R. A.: Chemical speciation of gas-phase organic carbon emissions from motor vehicles and implications for ozone production potential, Environ. Sci. Technol., 47, 11837–11848, https://doi.org/10.1021/es401470e, 2013.
Gkatzelis, G. I., Coggon, M. M., McDonald, B. C., Peischl, J., Aiken, K. C., Gilman, J. B., Trainer, M., and Warneke, C.: Identifying volatile chemical product tracer compounds in U.S. cities, Environ. Sci. Technol., 55, 188–199, https://doi.org/10.1021/acs.est.0c05467, 2021a.
Gkatzelis, G. I., Coggon, M. M., McDonald, B. C., Peischl, J., Gilman, J. B., Aiken, K. C., Robinson, M. A., Canonaco, F., Prevot, A. S. H., Trainer, M., and Warneke, C.: Observations confirm that volatile chemical products are a major source of petrochemical emissions in U.S. cities, Environ. Sci. Technol., https://doi.org/10.1021/acs.est.0c05471, accepted, 2021b.
Goliff, W. S., Fitz, D. R., Cocker, K., Bumiller, K., Bufalino, C., and Switzer, D.: Ambient measurements of 2,2,4-trimethyl, 1,3-pentanediol monoisobutyrate in Southern California, J. Air Waste Manag. Assoc., 62, 680–685, https://doi.org/10.1080/10962247.2012.666223, 2012.
Hodgson, A. T., Rudd, A. F., Beal, D., and Chandra, S.: Volatile organic compound concentrations and emission rates in new manufactured and site-build houses, Indoor Air, 10, 178–192, https://doi.org/10.1034/j.1600-0668.2000.010003178.x, 2000.
Karl, T. G., Christian, T. J., Yokelson, R. J., Artaxo, P., Hao, W. M., and Guenther, A.: The Tropical Forest and Fire Emissions Experiment: method evaluation of volatile organic compound emissions measured by PTR-MS, FTIR, and GC from tropical biomass burning, Atmos. Chem. Phys., 7, 5883–5897, https://doi.org/10.5194/acp-7-5883-2007, 2007.
Khare, P. and Gentner, D. R.: Considering the future of anthropogenic gas-phase organic compound emissions and the increasing influence of non-combustion sources on urban air quality, Atmos. Chem. Phys., 18, 5391–5413, https://doi.org/10.5194/acp-18-5391-2018, 2018.
Koss, A. R., Warneke, C., Yuan, B., Coggon, M. M., Veres, P. R., and de Gouw, J. A.: Evaluation of NO+ reagent ion chemistry for online measurements of atmospheric volatile organic compounds, Atmos. Meas. Tech., 9, 2909–2925, https://doi.org/10.5194/amt-9-2909-2016, 2016.
Koss, A. R., Sekimoto, K., Gilman, J. B., Selimovic, V., Coggon, M. M., Zarzana, K. J., Yuan, B., Lerner, B. M., Brown, S. S., Jimenez, J. L., Krechmer, J., Roberts, J. M., Warneke, C., Yokelson, R. J., and de Gouw, J.: Non-methane organic gas emissions from biomass burning: identification, quantification, and emission factors from PTR-ToF during the FIREX 2016 laboratory experiment, Atmos. Chem. Phys., 18, 3299–3319, https://doi.org/10.5194/acp-18-3299-2018, 2018.
Kozicki, M., Piasecki, M., Goljan, A., Deptula, H., and Nieslochowski, A.: Emission of Volatile Organic Compounds (VOCs) from dispersion and cementitious waterproofing products, Sustainability, 10, 2178, https://doi.org/10.3390/su10072178, 2018.
Kuster, W. C., Jobson, B. T., Karl, T., Riemer, D., Apel, E., Goldan, P. D., and Fehsenfeld, F. C.: Intercomparison of volatile organic carbon measurement techniques and data at la porte during the TexAQS2000 Air Quality Study, Enivron. Sci. Technol., 38, 221–228, https://doi.org/10.1021/es034710r, 2004.
Lerner, B. M., Gilman, J. B., Aikin, K. C., Atlas, E. L., Goldan, P. D., Graus, M., Hendershot, R., Isaacman-VanWertz, G. A., Koss, A., Kuster, W. C., Lueb, R. A., McLaughlin, R. J., Peischl, J., Sueper, D., Ryerson, T. B., Tokarek, T. W., Warneke, C., Yuan, B., and de Gouw, J. A.: An improved, automated whole air sampler and gas chromatography mass spectrometry analysis system for volatile organic compounds in the atmosphere, Atmos. Meas. Tech., 10, 291–313, https://doi.org/10.5194/amt-10-291-2017, 2017.
Li, W., Li, L., Chen, C.-L., Kacarab, M., Peng, W., Price, D., Xu J., and Cocker III, D. R.: Potential of select intermediate-volatility organic compounds and consumer products for secondary organic aerosol and ozone formation under relevant urban conditions, Atmos. Environ., 178, 109–117, https://doi.org/10.1016/j.atmosenv.2017.12.019, 2018.
Lin, C. C. and Corsi, R. L.: Texanol® ester alcohol emissions from latex paints: Temporal variations and multi-component recoveries, Atmos. Environ., 41, 3225–3234, https://doi.org/10.1016/j.atmosenv.2006.07.057, 2007.
Matheson, R. R.: 20th- to 21st-century technological challenges in soft coatings, Science, 297, 976–979, https://doi.org/10.1126/science.1075707, 2002.
McDonald, B. C., de Gouw, J. A., Gilman, J. B., Jathar, S. H., Akherati, A., Cappa, C. D., Jimenez, J. L., Lee-Taylor, J., Hayes, P. L., McKeen, S. A., Cui, Y. Y., Kim, S. W., Gentner, D. R., Isaacman-VanWertz, G., Goldstein, A. H., Harley, R. A., Frost, G. J., Roberts, J. M., Ryerson, T. B., and Trainer, M.: Volatile chemical products emerging as largest petrochemical source of urban organic emissions, Science, 359, 760–764, https://doi.org/10.1126/science.aaq0524, 2018a.
McDonald, B. C., McKeen, S. A., Cui, Y. Y., Ahmadov, R., Kim, S.-W., Frost, G. J., Pollack, I. B., Peischl, J., Ryerson, T. B., Holloway, J. S., Graus, M., Warneke, C., Gilman, J. B., de Gouw, J. A., Kaiser, J., Keutsch, F. N., Hanisco, T. F., Wolfe, G. M., and Trainer, M.: Modeling ozone in the Eastern U.S. using a fuel-based mobile source emissions inventory, Environ. Sci. Technol., 52, 7360–7370, https://doi.org/10.1021/acs.est.8b00778, 2018b.
Messier, K. P., Chambliss, S. E., Gani, S., Alvarez, R., Brauer M., Choi, J. J., Hamburg, S. P., Kerckhoffs, J., LaFranchi, B., Lunden, M. M., Marshall, J. D., Portier, C. J., Roy, A., Szpiro, A. A., Vermeulen, R. C. H., and Apte, J. S.: Mapping air pollution with Google Street View cars: Efficient approaches with mobile monitoring and land use regression, Environ. Sci. & Technol., 52, 12563–12572, https://doi.org/10.1021/acs.est.8b03395, 2018.
Müller, M., Mikoviny, T., Feil, S., Haidacher, S., Hanel, G., Hartungen, E., Jordan, A., Märk, L., Mutschlechner, P., Schottkowsky, R., Sulzer, P., Crawford, J. H., and Wisthaler, A.: A compact PTR-ToF-MS instrument for airborne measurements of volatile organic compounds at high spatiotemporal resolution, Atmos. Meas. Tech., 7, 3763–3772, https://doi.org/10.5194/amt-7-3763-2014, 2014.
National Oceanic and Atmospheric Administration Chemical Sciences Laboratory: NYICE Mobile Laboratory Data Download, available at: https://csl.noaa.gov/groups/csl7/measurements/mobilelab/MobileLabNYICE/DataDownload/, last access: 16 April 2021.
Pagonis, D., Price, D. J., Algrim, L. B., Day, D. A., Handschy, A. V., Stark, H., Miller, S. L., de Gouw, J., Jimenez, J. L., and Ziemann, P. J.: Time-resolved measurements of indoor chemical emissions, deposition, and reactions in a university art museum, Environ. Sci. Technol., 53, 4794–4802, https://doi.org/10.1021/acs.est.9b00276, 2019.
Parrish, D. D., Young, L. M., Newman, M. H., Aikin, K. C., and Ryerson, T. B.: Ozone design values in southern California's air basins: Temporal evolution and US background contribution, J. Geophys. Res.-Atmos., 122, 11166–11182, https://doi.org/10.1002/2016jd026329, 2017.
Robinson, E. S., Shah, R. U., Messier, K., Gu, P., Li, H. Z., Apte, J. S., Robinson, A. L., Presto, A. A.: Land-Use regression modeling of source-resolved fine particulate matter components from mobile sampling, Environ. Sci. & Technol., 53, 8925–8937, https://doi.org/10.1021/acs.est.9b01897, 2019.
Salthammer, T., Mentese, S., and Marutzky, R.: Formaldehyde in the indoor environment, Chem. Rev., 110, 2536–2572, https://doi.org/10.1021/cr800399g, 2010.
Schieweck, A. and Bock, M.-C.: Emissions from low-VOC and zero-VOC paints – Valuable alternatives to conventional formulations also for use in sensitive environments?, Build. and Environ., 85, 243–252, https://doi.org/10.1016/j.buildenv.2014.12.001, 2015.
Sekimoto, K., Li, S.-M., Yuan, B., Koss, A., Coggon, M., Warneke, C., and de Gouw, J.: Calculation of the sensitivity of proton-transfer-reaction mass spectrometry (PTR-MS) for organic trace gases using molecular properties, Int. J. Mass Spectrom., 421, 71–94, https://doi.org/10.1016/j.ijms.2017.04.006, 2017.
Shin, H. M., McKone, T. E., and Bennett, D. H.: Volatilization of low vapor pressure – volatile organic compounds (LVP-VOCs) during three cleaning products-associated activities: Potential contributions to ozone formation, Chemosphere, 153, 130–137, https://doi.org/10.1016/j.chemosphere.2016.02.131, 2016.
Stark, H., Yatayelli, R. L. N., Thompson, S. L., Kimmel, J. R., Cubison, M. J., Chhabra, P. S., Canagaratna, M. R., Jayne, J. T., Worsnop, D. R., and Jimenez, J. L.: Methods to extract molecular and bulk chemical information from series of complex mass spectra with limited mass resolution, Int. J. Mass Spectrom, 389, 26–38, https://doi.org/10.1016/j.ijms.2015.08.011, 2015.
Warneke, C., De Gouw, J. A., Kuster, W. C., Goldan, P. D., and Fall, R.: Validation of atmospheric VOC measurements by proton-transfer-reaction mass spectrometry using a gas-chromatographic preseparation method, Environ. Sci. Technol., 37, 2494–2501, https://doi.org/10.1021/es026266i, 2003.
Warneke, C., de Gouw, J. A., Holloway, J. S., Peischl, J., Ryerson, T. B., Atlas, E., Blake, D., Trainer, M., and Parrish, D. D.: Multiyear trends in volatile organic compounds in Los Angeles, California: Five decades of decreasing emissions, J. Geophys. Res.-Atmos., 117, D00V17, https://doi.org/10.1029/2012jd017899, 2012.
Weschler, C. J.: Changes in indoor pollutants since the 1950s, Atmos. Environ., 43, 153–169, https://doi.org/10.1016/j.atmosenv.2008.09.044, 2009.
Weschler, C. J. and Nazaroff, W. W.: SVOC exposure indoors: fresh look at dermal pathways, Indoor Air, 22, 356–377, https://doi.org/10.1111/j.1600-0668.2012.00772.x, 2012.
Yuan, B., Koss, A., Warneke, C., Gilman, J. B., Lerner, B. M., Stark, H., and de Gouw, J. A.: A high-resolution time-of-flight chemical ionization mass spectrometer utilizing hydronium ions (H3O+ ToF-CIMS) for measurements of volatile organic compounds in the atmosphere, Atmos. Meas. Tech., 9, 2735–2752, https://doi.org/10.5194/amt-9-2735-2016, 2016.
Yuan, B., Koss, A. R., Warneke, C., Coggon, M., Sekimoto, K., and de Gouw, J. A.: Proton-Transfer-Reaction Mass Spectrometry: Applications in atmospheric sciences, Chem. Rev., 117, 13187–13229, https://doi.org/10.1021/acs.chemrev.7b00325, 2017.
- Abstract
- Introduction
- Experimental methods
- Ambient measurements of PCBTF and Texanol
- Headspace and evaporation measurements
- CARB architectural coatings survey data
- Conclusion
- Data availability
- Author contributions
- Competing interests
- Disclaimer
- Acknowledgements
- Financial support
- Review statement
- References
- Supplement