the Creative Commons Attribution 4.0 License.
the Creative Commons Attribution 4.0 License.
 | 20 Apr 2021
Coral-reef-derived dimethyl sulfide and the climatic impact of the loss of coral reefs
Matthew T. Woodhouse
Todd P. Lane
Robyn Schofield
Dimethyl sulfide (DMS) is a naturally occurring aerosol precursor gas which plays an important role in the global sulfur budget, aerosol formation and climate. While DMS is produced predominantly by phytoplankton, recent observational literature has suggested that corals and their symbionts produce a comparable amount of DMS, which is unaccounted for in models. It has further been hypothesised that the coral reef source of DMS may modulate regional climate. This hypothesis presents a particular concern given the current threat to coral reefs under anthropogenic climate change. In this paper, a global climate model with online chemistry and aerosol is used to explore the influence of coral-reef-derived DMS on atmospheric composition and climate. A simple representation of coral-reef-derived DMS is developed and added to a common DMS surface water climatology, resulting in an additional flux of 0.3 Tg yr−1 S, or 1.7 % of the global sulfur flux from DMS. By comparing the differences between both nudged and free-running ensemble simulations with and without coral-reef-derived DMS, the influence of coral-reef-derived DMS on regional climate is quantified. In the Maritime Continent–Australian region, where the highest density of coral reefs exists, a small decrease in nucleation- and Aitken-mode aerosol number concentration and mass is found when coral reef DMS emissions are removed from the system. However, these small responses are found to have no robust effect on regional climate via direct and indirect aerosol effects. This work emphasises the complexities of the aerosol–climate system, and the limitations of current modelling capabilities are highlighted, in particular surrounding convective responses to changes in aerosol. In conclusion, we find no robust evidence that coral-reef-derived DMS influences global and regional climate.


Marine organisms (phytoplankton, algae) are known to produce the chemical dimethyl sulfoniopropionate (DMSP). In the ocean, DMSP experiences enzymatic cleavage, forming dimethyl sulfide (DMS; Yoch, 2002; see Fig. 1, point 1), which can then be released into the atmosphere (2). Atmospheric DMS (DMSa) can undergo a series of chemical reactions to become a sulfate aerosol (3). When in sufficiently large abundance (4), these sulfate aerosols can impact aerosol loading and cloud properties, altering the radiation budget directly (5) and indirectly (6) and having a cooling effect (7). This effect has been hypothesised to form a short-term bioregulatory negative feedback system, known as the CLAW (Charlson, Lovelock, Andreae and Warren) hypothesis (Charlson et al., 1987), whereby marine organisms can alter their environment when stressed. This hypothesis remains unproven, and arguments against it cite the complexity and non-linearity of the DMS–climate system (Quinn and Bates, 2011; Green and Hatton, 2014). Nevertheless, at longer timescales, global modelling studies have shown that marine-derived DMS plays an important role in maintaining the current large-scale climate (Thomas et al., 2010; Woodhouse et al., 2010; Gabric et al., 2013; Mahajan et al., 2015), providing global cooling via direct and indirect aerosol effects of up to 0.45 ∘C (Fiddes et al., 2018) when compared to a world in which no marine DMS exists. Our previous paper (Fiddes et al., 2018) describes these studies, DMS surface water climatologies and flux parameterisations in more detail.

Figure 1Schematic diagram describing the DMS–climate system. The numbers are described in detail in the text. Graphics designed by Georgina Harmer.
Many global DMS–climate modelling studies have also considered DMS under future scenarios (Bopp et al., 2004; Gabric et al., 2004; Kloster et al., 2007; Cameron-Smith et al., 2011; Six et al., 2013; Grandey and Wang, 2015; Schwinger et al., 2017). However, considering our understanding of DMS in the current climate remains uncertain, the aforementioned studies do not provide a clear consensus on how DMS production may respond to a warming climate. With this in mind, better knowledge of current sources of DMS is important to further our understanding of DMS–climate interaction now and into the future.
One such source of DMS that is currently unaccounted for in climate modelling is coral reefs. Recent studies have shown that corals, coral symbionts, and coral by-products (e.g. mucus) produce large amounts of DMSP (Broadbent et al., 2002; Broadbent and Jones, 2004; Jones and Trevena, 2005; Jones et al., 2007; Burdett et al., 2015; Jackson et al., 2020a). Of note for this work, Jones et al. (2018) have summarised reports of fluxDMS values of 0–4906 µg m−2 d−1 and a mean of 205 µg m−2 d−1 in summer and 0.6–481 µg m−2 d−1 with a mean of 77 µg m−2 d−1 over winter over the Great Barrier Reef (GBR). Jones et al. (2018) also suggest that total emissions from the GBR are equivalent to 0.02 Tg yr−1 of sulfur, noting that total global sulfur flux from DMS is estimated to be between 9–35 Tg yr−1 (Belviso et al., 2004; Elliott, 2009; Woodhouse et al., 2010; Tesdal et al., 2016; Fiddes et al., 2018) and that DMS makes up approximately one-fifth of the global sulfur budget (Sheng et al., 2015). The Jones et al. (2018) coral reef flux estimation has been made from measurements both over coral reefs and in the GBR lagoon and also includes an estimate of the additional flux from tropical cyclones. The tropical cyclone emission has been calculated (not observed) using the Liss and Merlivat (1986) flux parameterisation, taking into account average wind speeds of tropical cyclones and accounting for approximately five cyclone days per year in the region. However, we note that many parameterisations overestimate the DMS flux (fluxDMS) at high wind speeds.
In addition, recent work has shown a sensitivity of DMS production by corals when stressed due to tidal exposure, warming temperatures, rainfall events and light exposure (Swan et al., 2012; Fischer and Jones, 2012; Hopkins et al., 2016; Swan et al., 2017). Of interest to this study are the findings from Hopkins et al. (2016), where the effect of tidal exposure on three Indo-Pacific coral species was studied in laboratory experiments. From their results, Hopkins et al. (2016) extrapolate a fluxDMS of 9–35 µmol m−2 d−1 over coral reefs from Acropora cf. horrida, while an additional 5 and 8 µmol m−2 d−1 can be estimated from two other species in their experiments (P. cylindrica and S. hystrix.). These estimates are equivalent to a total of 709–1548 µg m−2 d−1 of sulfur (if all species are present) and in this work is further extrapolated to global coral reef coverage (approximately 284 300 km2), giving 0.074–0.16 Tg yr−1 of sulfur. Whilst these extrapolations are highly speculative in terms of artificial laboratory experiments, estimated exposure time and coverage of coral reefs, and they account for just three Indo-Pacific species of coral and only DMS produced during tidal stress, the Hopkins et al. (2016) estimations were the first to attempt to quantify the large-scale flux of coral-reef-derived DMS.
Following these observed results, numerous studies have made links to coral DMS, aerosol formation, cloud cover and/or sea surface temperatures (SSTs) (Modini et al., 2009; Deschaseaux et al., 2012; Leahy et al., 2013; Swan et al., 2017; Jones et al., 2017; Cropp et al., 2018; Jackson et al., 2018, 2020b). Jones (2013), Jones et al. (2017) and Cropp et al. (2018) further suggest that coral reefs participate in bioregulatory feedback as suggested by the CLAW hypotheses. Most of these studies do not explicitly account for the complexity of the DMS–climate system and its significant non-linearities (see Thomas et al., 2011; Quinn and Bates, 2011; Green and Hatton, 2014; Fiddes et al., 2018). In addition, deducing a climatic impact of one aerosol species using observations alone is fraught with co-varying and confounding influences from other aerosol species. These complexities can only be addressed through modelling studies; however no modelling study has included coral-reef-derived DMS as a source of sulfur to date.
To add urgency to this problem, coral reef ecosystems globally are facing dire risk due to anthropogenic climate change (Hughes et al., 2017, 2018). The IPCC special report on climate change (IPCC, 2018) states that under 1.5 ∘C warming, 70 %–90 % of coral reefs will be extinct. The risk to coral reefs is twofold; increasing sea surface temperatures are causing more frequent mass coral bleaching events (Hughes et al., 2017; King et al., 2017), whilst increasing ocean acidification is causing reduced calcification and growth of coral species (Hoegh-Guldberg et al., 2017; Magnan et al., 2016). Whilst the death of global coral reefs due to anthropogenic climate change will have clear impacts on the ecosystems (Plaisance et al., 2011) and economies (Deloitte Access Economics, 2017; Spalding et al., 2017) they support, a lesser known, and as of yet unquantified, impact is on the climate itself.
In light of these recent studies and the current threat to coral reefs, we raise the following questions: what is the influence of coral-reef-derived DMS on climate, including its influence on aerosol production and cloud formation, and what implications does mass coral extinction have for the climate? To address these questions, we use a global climate–chemistry model to investigate whether coral-reef-derived DMS has an impact on climate. This is the first study to estimate what implications mass coral extinction may have for global and regional climate.
2.1 ACCESS-UKCA description
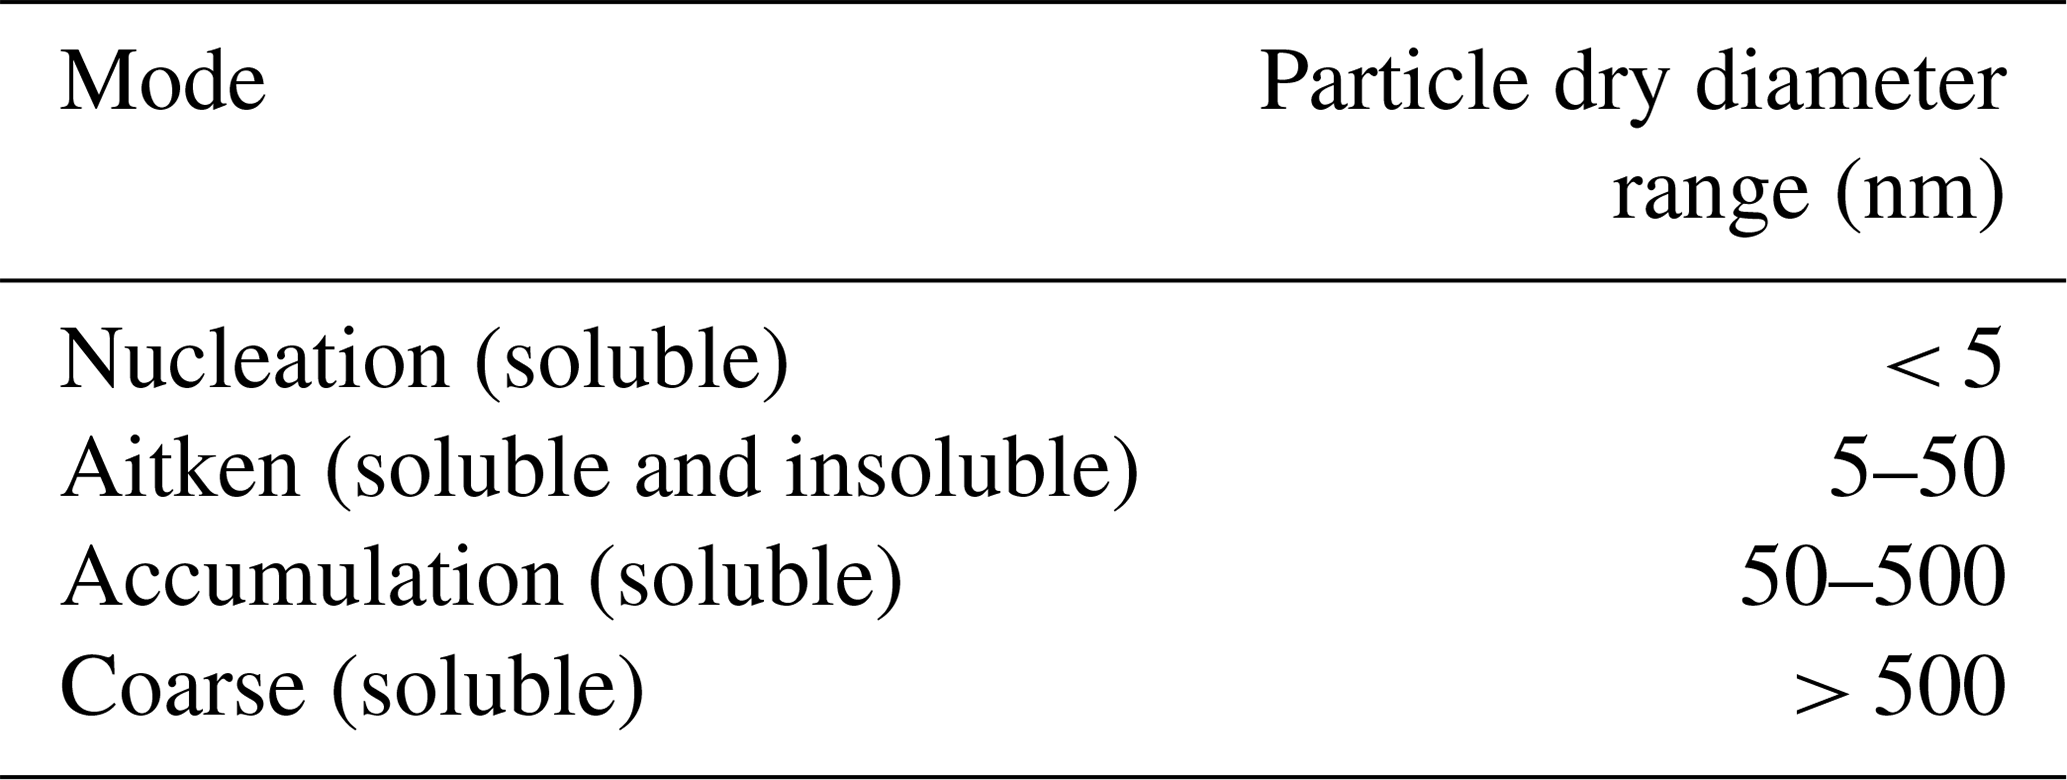
The coupled climate–chemistry model ACCESS-UKCA (Australian Community Climate and Earth System Simulator–United Kingdom Chemistry and Aerosol) is used in this work to quantify the importance of global coral-reef-derived sulfur. The ACCESS-UKCA physical atmospheric model is based on the Global Atmosphere 4.0 configuration of the Unified Model at Version 8.4 (Walters et al., 2014), and the UKCA model includes the state-of-the-art GLObal Model of Aerosol Processes (GLOMAP)-mode scheme (Mann et al., 2010, 2012). GLOMAP-mode is a two-moment microphysical aerosol scheme that simulates aerosol mass and number distributions across four soluble modes (corresponding to nucleation, Aitken, accumulation and coarse modes) and, in this work, one insoluble mode (Aitken) (Mann et al., 2010, 2012). The size distributions of these modes are shown in Table 1.
GLOMAP-mode simulates coagulation (Seinfeld and Pandis, 1998; Spracklen et al., 2005), condensation of H2SO4 and secondary organics (Fuchs and Sutugin, 1971), new particle formation of sulfate aerosol in the free troposphere via binary homogeneous nucleation (Kulmala et al., 1998) and organic-mediated boundary layer nucleation (Metzger et al., 2010). Aqueous chemistry calculates the dissolution of SO2 and H2O2 into cloud droplets within the soluble accumulation and coarse modes (Mann et al., 2010), and aerosol dry deposition is calculated following Slinn (1982), Zhang (2001) and Binkowski and Shankar (1995). GLOMAP-mode includes particle compositions of sulfate, sea salt and elemental and organic carbon (Mann et al., 2010).
The Lana et al. (2011) DMS surface water concentration (DMSw) climatology is used in this work. Lana et al. (2011) (and before that Kettle et al., 1999; Kettle and Andreae, 2000) used a global database of observations (Kettle et al., 1999) to derive a gridded global DMSw climatology via a piecewise cubic Hermite interpolation technique over 54 well-defined biogeographic ocean provinces. This climatology is the standard for most global climate modelling studies and is discussed in more detail in Fiddes et al. (2018).
In this work, as in Fiddes et al. (2018), the Liss and Merlivat (1986) fluxDMS parameterisation is used, and a full description of this scheme can be found in Fiddes et al. (2018). Detailed discussion about fluxDMS parameterisation choices and sensitivities can also be found in Fiddes et al. (2018). In short, the Liss and Merlivat (1986) scheme calculates the fluxDMS under three wind-induced sea states representing smooth (10 m wind speeds less than 3.6 m s−1) and rough (10 m wind speeds between 3.6 and 13 m s−1) gas transfer as well as wave breaking and bubble bursting (10 m wind speeds greater than 13 m s−1). Liss and Merlivat (1986) is considered a conservative parameterisation and was chosen for this work based on recommendations by Vlahos and Monahan (2009) and Bell et al. (2017) that suggest many parameterisation overestimate the fluxDMS.
With online chemistry, ACCESS-UKCA includes four key oxidative pathways to convert DMS into SO2, which are shown in Table 2. SO2 can then be further oxidised into H2SO4 (Table 2), after which it can contribute to aerosol growth or new particle formation. Description of these processes can be found in Mann et al. (2010).
Table 2The oxidative pathways relevant to DMS in ACCESS-UKCA as defined in Pham et al. (1995).

Anthropogenic emissions, pre- and post-2000 respectively, are provided by Lamarque et al. (2010) and van Vuuren et al. (2011) and biomass emissions by van der Werf et al. (2017). Emissions of other species (biogenic, primary aerosol) are described in Woodhouse et al. (2015). SSTs and sea ice are prescribed following the Atmospheric Model Intercomparison Project (AMIP) method (Taylor et al., 2015). The UKCA is coupled to the ACCESS model via the radiation scheme and the large-scale cloud and precipitation schemes; both the direct and indirect aerosol forcing are modelled. ACCESS-UKCA has a resolution of 1.25∘ latitude × 1.875∘ longitude with 85 vertical levels. Where the model is nudged, ERA-Interim (Dee et al., 2011) is used at 6-hourly intervals (via horizontal wind components and potential temperature; see Sect. 2.3 for more details). Further model details and evaluation are available in Fiddes et al. (2018).
2.2 DMS climatologies
We have developed a DMS surface water concentration (DMSw) climatology based on Lana et al. (2011), in which additional DMSw over coral reef regions is included. To determine the amount of DMSw to be added to the Lana et al. (2011) climatology, we first needed to know where coral reefs were located globally. The UNEP-WCMC et al. (2010) global coral reef distribution database was used to calculate the fraction of each ACCESS-UKCA grid box covered by coral reefs. The UNEP-WCMC et al. (2010) database is the most comprehensive global database of warm water coral reefs, 85 % of which was drawn from the Millennium Coral Reef Mapping Project, a remote sensing project at spatial resolutions of up to 30 m.
The gridded areal distribution drawn from the coral reef database, shown in Fig. 2, was then used to weight a fixed concentration of DMSw to be added to the Lana et al. (2011) DMSw climatology. For example, the maximum fraction in any grid box found in Fig. 2 is 15.6 % in the northern GBR. In this study, we used 50 nM as the fixed concentration (a number of different DMSw concentrations were tested, from 10 to 500 nM). Therefore, at this grid box, with the highest density of coral reefs, the amount of DMSw added to the Lana et al. (2011) climatology as a coral reef source is nM. The choice of 50 nM was somewhat subjective, in part due to the relatively few estimations of large-scale coral reef production of DMSw, as described in Sect. 1. Nevertheless, below we describe how this choice aligns with observations found in the literature. In addition, we made a conscious choice to create a climatology that represents a plausible maximum DMSw in an attempt to ensure a response to this perturbation. We note that at this initial stage, the DMSw climatology developed here does not vary in time beyond that of the monthly Lana et al. (2011) dataset.
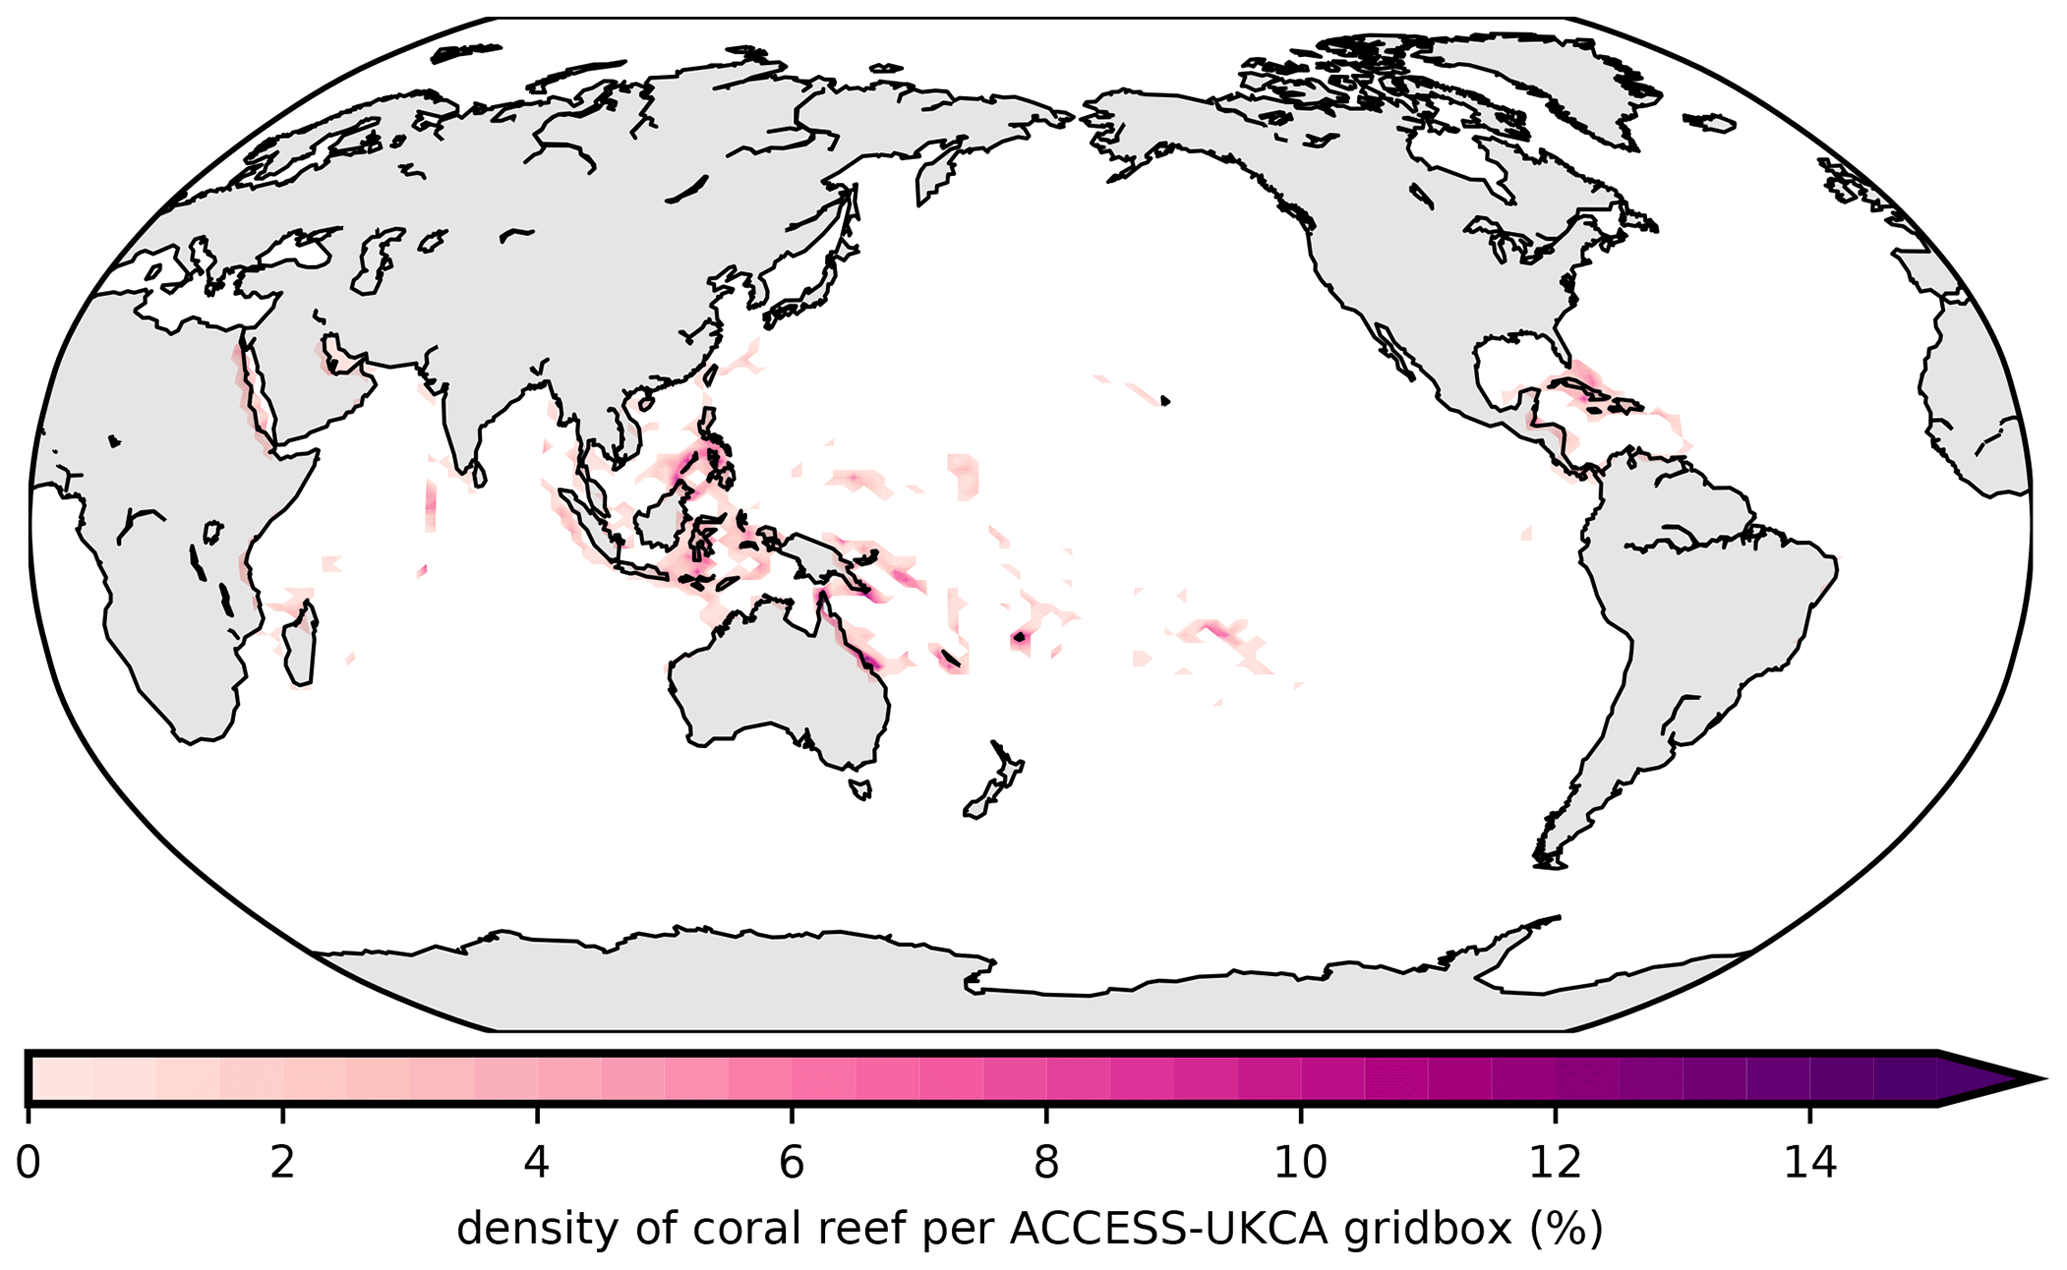
Figure 2The areal fraction of each ACCESS-UKCA grid box covered by warm water coral reefs as indicated by UNEP-WCMC et al. (2010).
The weighted addition of 50 nM of DMSw caused a global mean increase of 0.03 nM and an additional fluxDMS of 0.3 Tg yr−1 S. The fluxDMS of the Lana et al. (2011) climatology and the additional coral reef fluxDMS are shown in Fig. 3. These increases do not impact the global sulfur budget, contributing only 1.7 % of additional sulfur to the global fluxDMS. The 50 nM climatology adds a mean of 0.74 nM and a maximum of 7.8 nM to coral reef regions, values that are within those found in the literature. The additional daily fluxDMS simulated by ACCESS-UKCA over coral reefs, shown in Fig. 3b (maximum of 621.9 µg m−2 d−1 S), is similar to that of the Hopkins et al. (2016) estimations of fluxDMS due to three coral species in response to tidal stress (708.9–1547.6 µg m−2 d−1 S). Furthermore, Jones et al. (2018) suggest that the total fluxDMS from the GBR and surrounding lagoon is approximately 0.002 Tg yr−1 S. If this number is extrapolated to global coral reef regions, then an annual fluxDMS of 0.12 Tg yr−1 S is estimated. The values from the Hopkins et al. (2016) and Jones et al. (2018) estimations both suggest that the amount of DMSw attributed to coral reefs in this study is within the high end of what is currently observed.
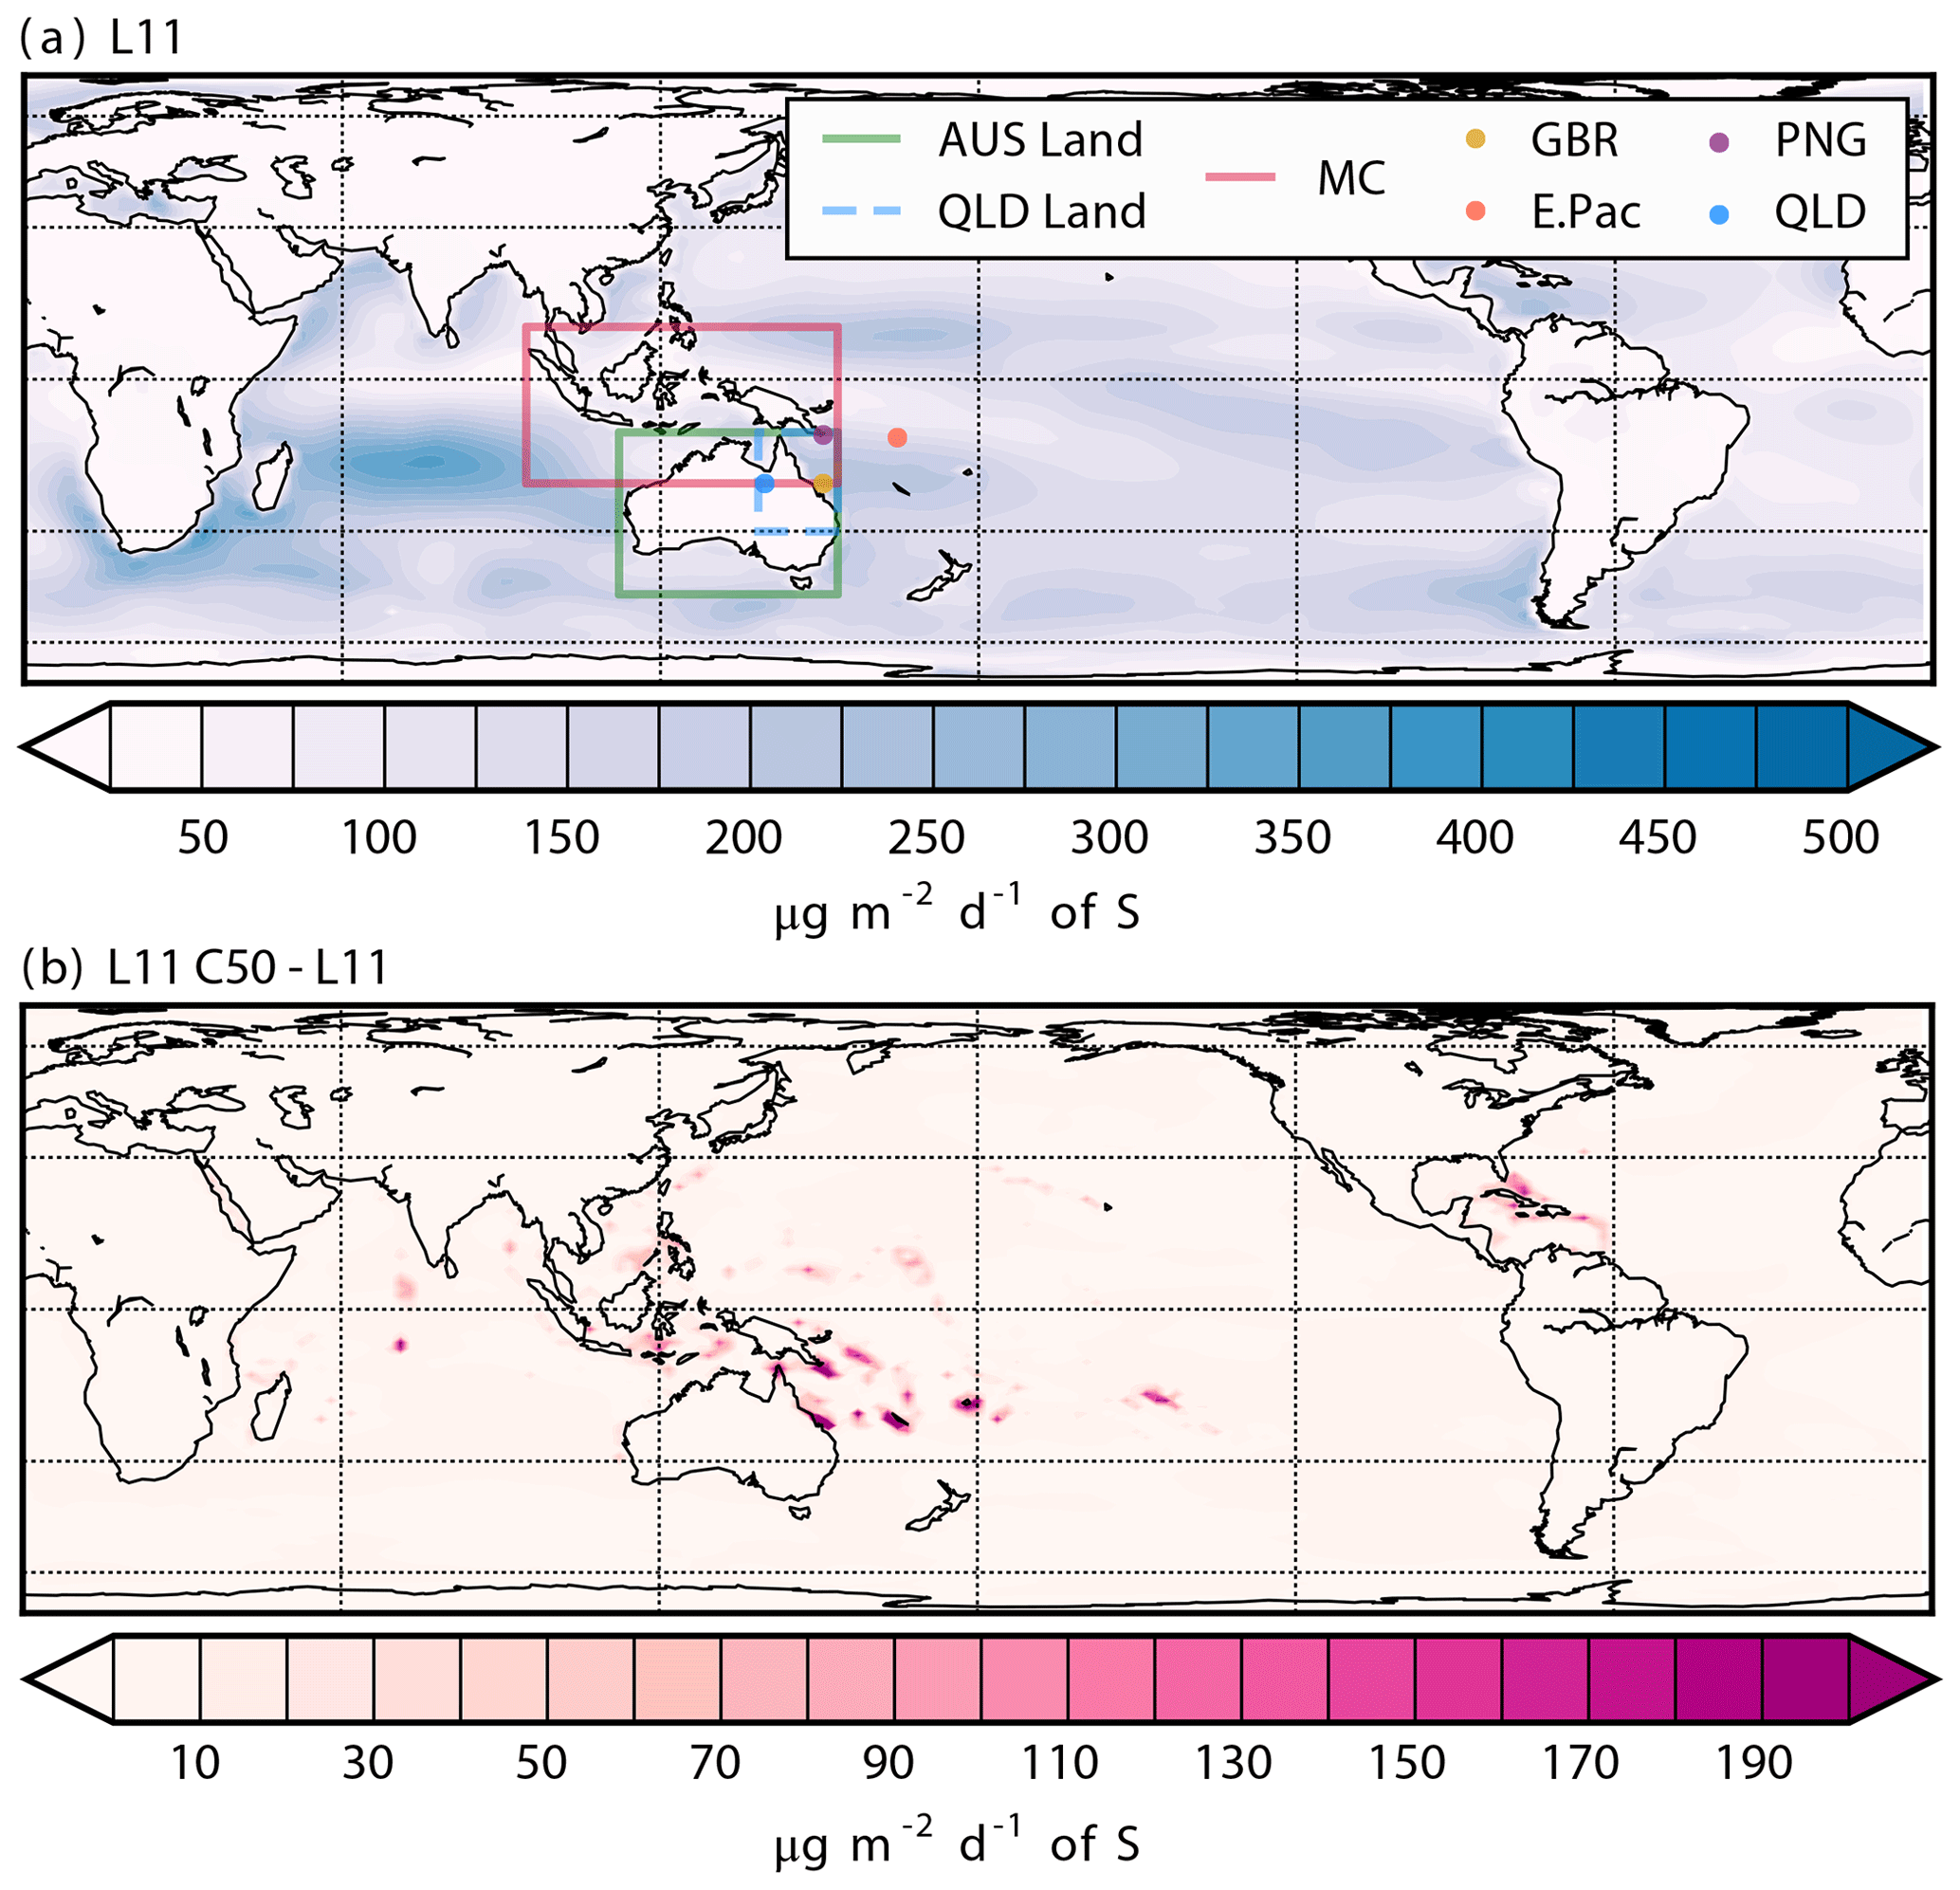
Figure 3(a) The fluxDMS (in µg m−2 d−1 S) based on the Lana et al. (2011) DMSw climatology and (b) the additional fluxDMS in the climatology with added coral-reef-derived DMSw. In panel (a) the Maritime Continent–Australian region is shown by a red box, the Australian land-only region by a green box and the Queensland (QLD) land-only region by a blue box. Additionally, four single points used for analysis are shown over the Great Barrier Reef (GBR – yellow), Papua New Guinea (PNG – pink), the eastern Pacific (E.Pac – orange) and QLD (blue).
However, it is noted that the values stated here are averages over large grid boxes and so likely overestimate the extent of coral reef influence. Nevertheless, the 50 nM perturbation was chosen in part to ensure that if no significant changes in the atmosphere were found, it would not be because the additional coral reef DMS was too small.
2.3 Experiment set-up
To study the impact of coral-reef-derived DMS in ACCESS-UKCA, two sets of simulations were performed: nudged and free-running. In both sets of simulations, a control (using the Lana et al., 2011, climatology, referred to as L11) and experimental simulation (using the Lana et al., 2011, climatology with additional coral and hereafter referred to as the L11C50 simulation) were completed. The nudged simulations follow the methods described by Fiddes et al. (2018), in which the control and coral simulations were nudged to the ERA-Interim dataset (Dee et al., 2011) in the free troposphere at 6-hourly intervals using horizontal winds and potential temperature. We note that by nudging the model, we limit the model's ability to respond to the DMS flux perturbations. However, nudged simulations, by restricting meteorological feedbacks, give us an indication as to which responses are purely dynamical as opposed to those that may in fact be caused directly by DMS perturbations.
In the second set-up, the model was allowed to freely run, with no nudging applied. In both sets of simulations, SSTs are prescribed. Without nudging, feedbacks from the meteorology, such as changes in wind fields, are able to manifest within the model. In the free-running simulations, much greater model variability manifested, and differentiating between a true signal from the perturbed DMS field and internal model variability was difficult. For this reason, seven simulations (for both the L11 and L11C50), each of 10 years, were performed with the free-running set-up to provide an ensemble. Each set of simulations used different atmospheric initial conditions from a previous nudged simulation, taken at 00:00 UTC on 1 January for 1996, 1998, 1999, 2000, 2001, 2002 and 2003 (noting that 1997 was excluded as it was a strong El Niño year). Whilst this exercise was computationally expensive, it was able to provide sufficient data to perform statistical analyses.
2.4 Statistical analysis
The following regions were defined for statistical analysis: the Maritime Continent–Australian (MC-Aus) region from 17.4∘ S to 10∘ N, 95.625 to 153.75∘ E; the Queensland (QLD) land-only region from 30 to 10∘ S, 138.75 to 153.75∘ E; and the Australian land-only region from 45 to 10∘ S, 112.5 to 153.75∘ E. Four grid points were selected for analysis of aerosol size distribution: a location off the coast of Papua New Guinea (PNG) at 10.5∘ S, 151∘ E; a point in the East Pacific (E.Pac) at 10.5∘ S, 165∘ E; a location over the GBR at 20∘ S, 151∘ E; and a point in inland QLD at 20∘ S, 140∘ E. These regions and points are shown in Fig. 3a. In addition the boundary of the South Pacific convergence zone (SPCZ) is defined as the area within the 6 mm d−1 or greater precipitation threshold (Vincent et al., 2011).
To test the significance of differences in a given field, the two-tailed Student T test (Wilks, 2011) and the respective field significance (Wilks, 2011) are used. Both of these methods have been evaluated at confidence levels of the 95th percentile (p<0.05) unless otherwise stated. In addition to this, ensemble agreement, where at least five out of the seven ensemble members agree on the change in sign, has been shown as stippling as a further indicator of confidence.
3.1 DMS and sulfur dioxide
This section describes the changes in atmospheric DMS (DMSa) when coral reefs are removed (L11 minus L11C50), noting that the results are presented this way in order to demonstrate what the impact of the loss of coral reefs may be on the climate system. The annual differences in DMSa (with respect to the L11C50 simulation, shown in Fig. 4a) for the nudged simulations (Fig. 4b) and the free-running ensemble (Fig. 4c) are spatially very similar to each other and to the respective change in fluxDMS (shown in Fig. 1b). Good agreement across the ensemble is found with the free-running simulations over reef regions. Figure 4d–g show, for both the free and nudged simulations, a strong seasonal signal over the MC-Aus region in terms of both mean value and the range of values. A seasonal signal is found in both the DMSa and fluxDMS (see Table 3) and is in part due to the variation of the L11 DMSw climatology. In DJF, the range of results from the ensemble is larger than that of any other season, and it appears that the free-running meteorology is actually dampening the response of DMSa compared to the nudged runs. This damped response is not surprising as surface wind speeds were found to be stronger in this region at this time in the free ensemble (not shown). Increased wind speeds in the free ensemble cause an increased fluxDMS, leading to a smaller decrease in fluxDMS and DMSa than in the nudged run. Such examples of wind-driven DMS responses are also found in other locations (and in other seasons), including over the Southern Ocean at around 60∘ E and 60∘ W (see annual plots in Fig. 4c). These responses highlight the complexity of the DMS–climate system. In addition, wind-driven responses in other aerosol sources are found in regions around the globe (e.g. from sea salt and dust) but are not discussed further here.
Table 3Seasonal changes over the Maritime Continent–Australian region as a percent (except for SW, SW and SW↓Surf which are an absolute change in W m−2 and w in cm s−1) for both the free-running ensemble (F) and the nudged simulations (N). Number density is abbreviated to ND and mass to MS for each of the four aerosol modes (nucleation, Aitken, accumulation and coarse).

95 Statistically significant at the 95th percentile, p<0.05.
90 Statistically significant at the 90th percentile, p<0.1.
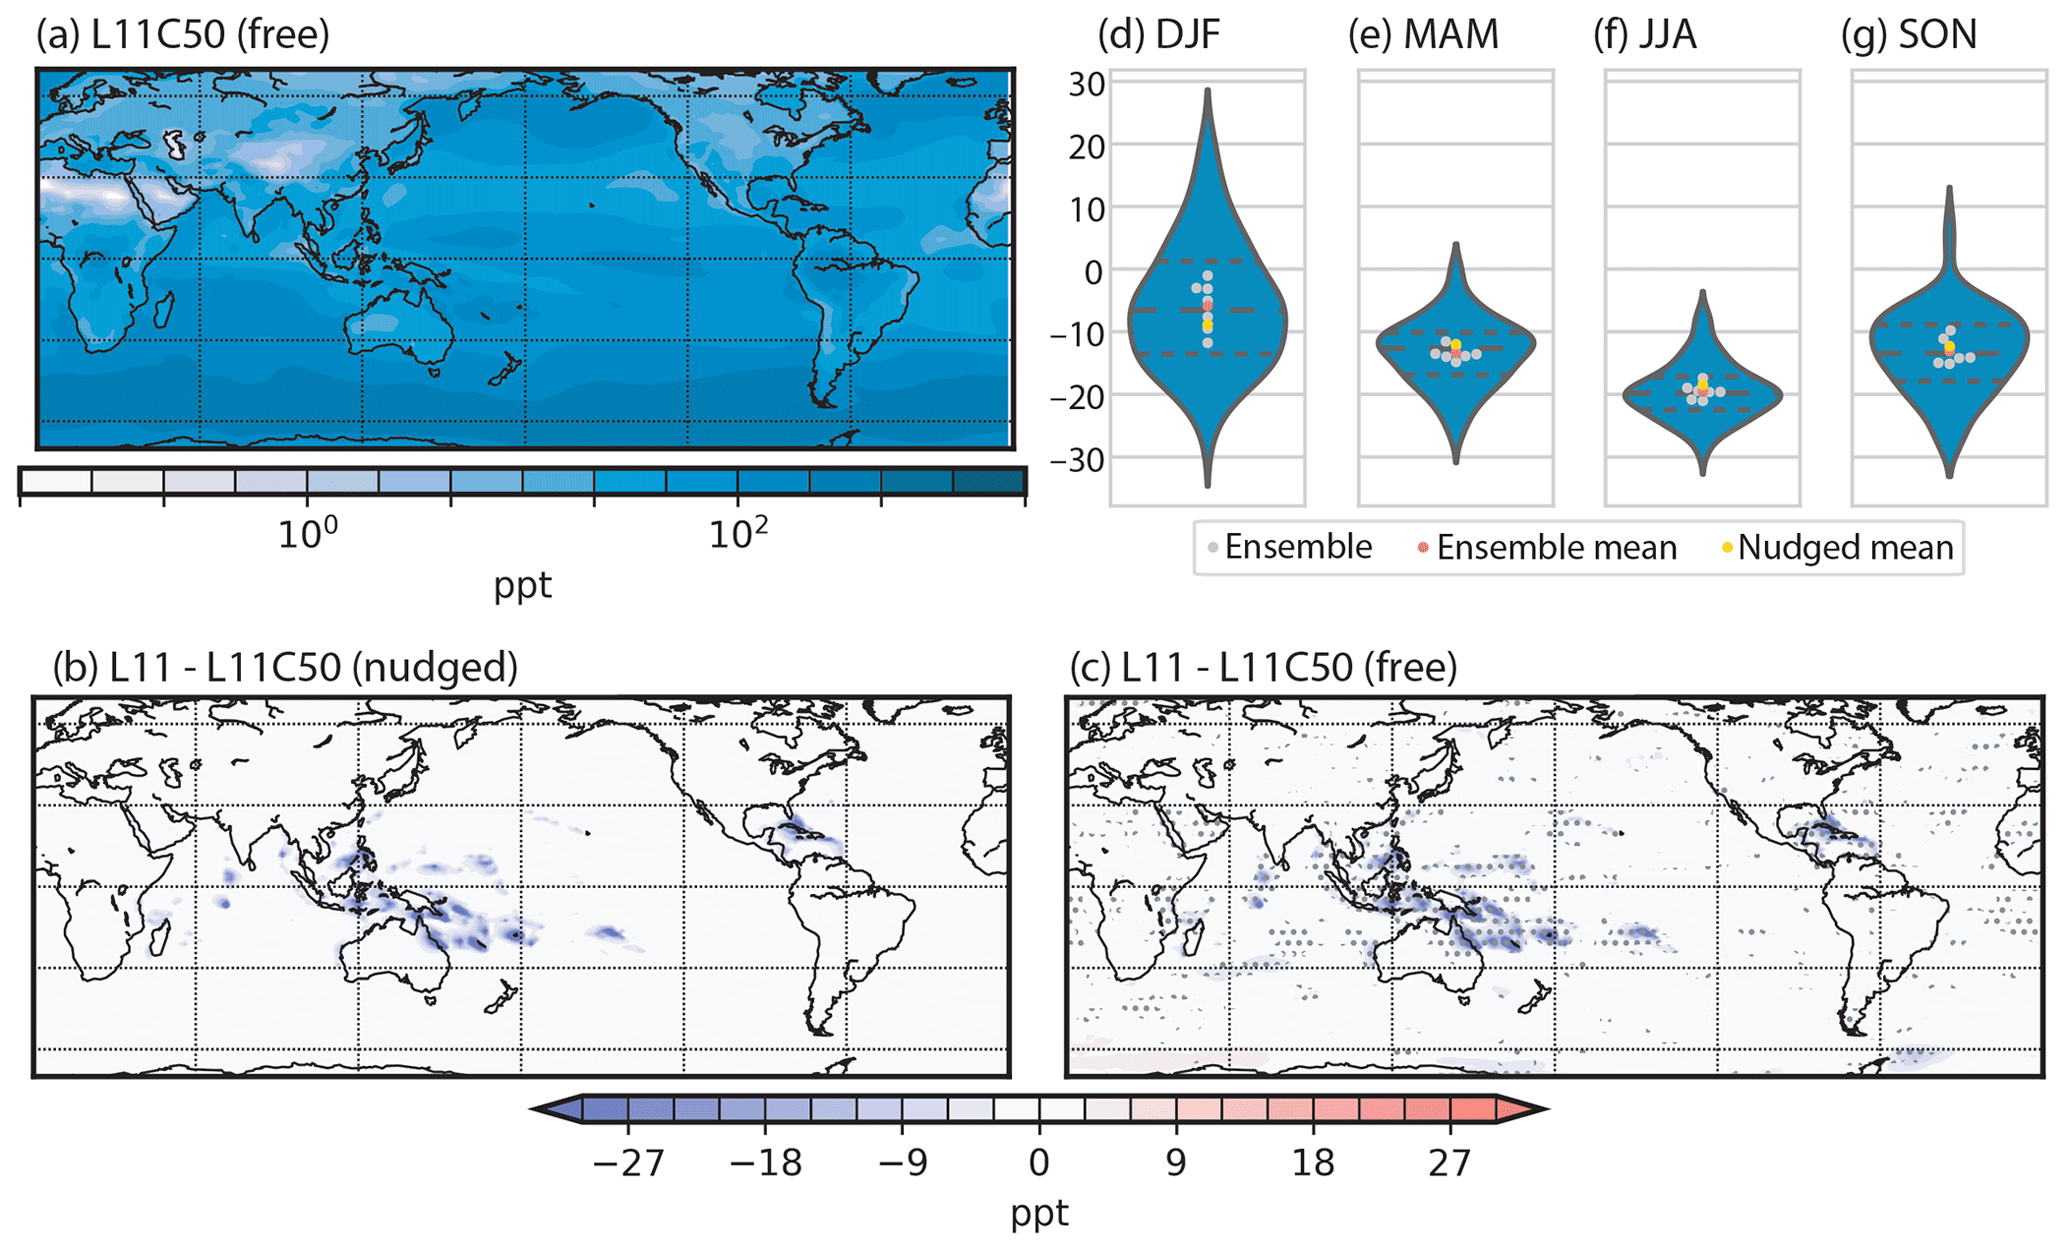
Figure 4The annual surface DMSa concentration (ppt) for the L11C50 simulation (a) and the L11–L11C50 difference for the nudged simulations (b) and free-running ensemble (c). In panel (c) the model agreement, where at least five of the seven ensemble pairs agree in the sign of the difference, is shown by stippling. Panels (d)–(g) show violin plots of the average seasonal difference (L11–L11C50) in DMSa over the MC-Aus region as a percentage, where all years in the ensemble are shown by the distribution, the dashed lines represent the 25, 50 and 75th percentiles, the grey dots show each pair of models mean difference, red represents the ensemble average and yellow represents the nudged average.
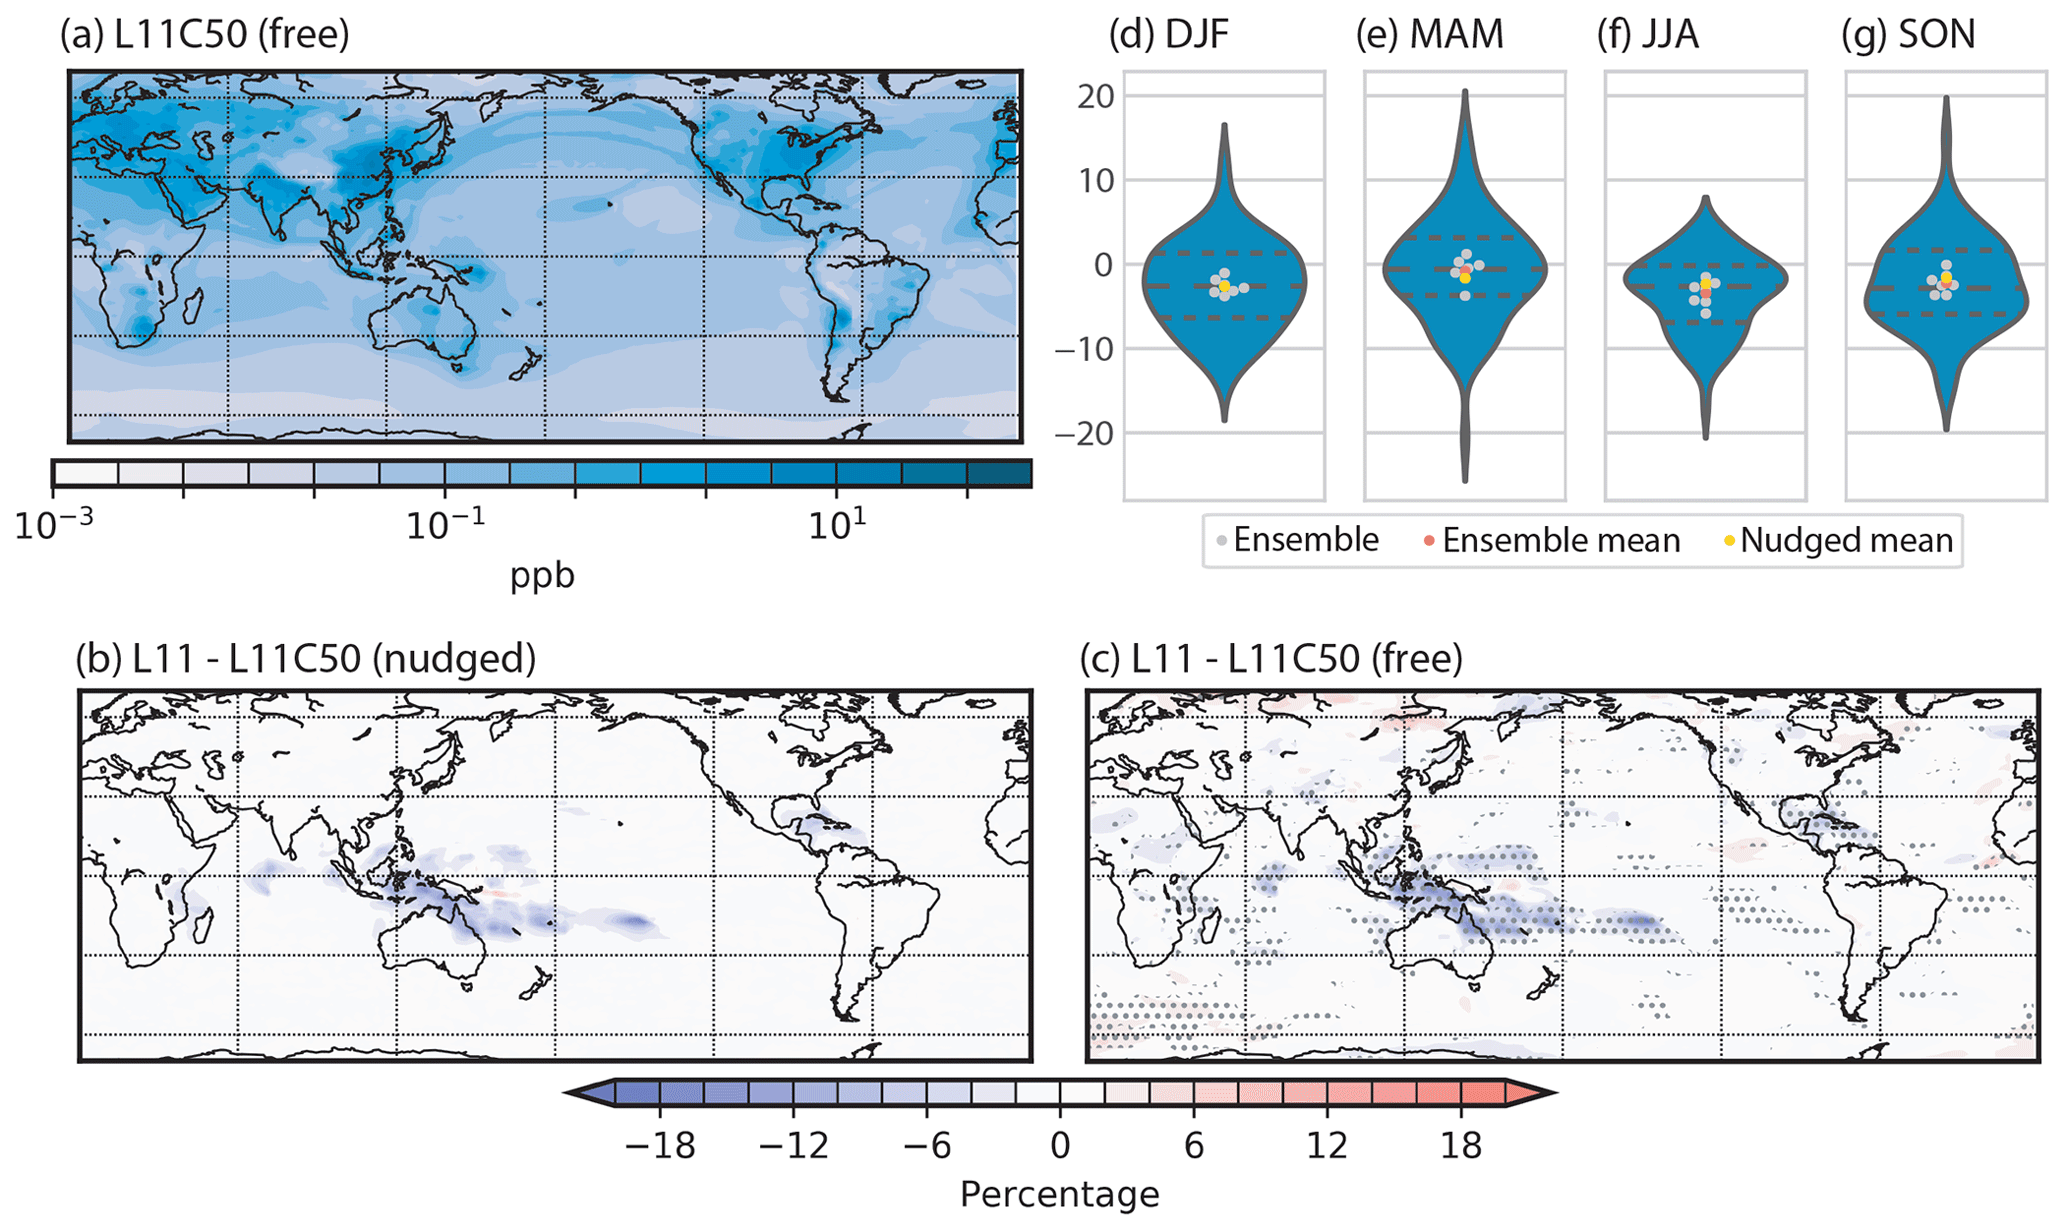
Figure 5As for Fig. 4 but for SO2 in parts per billion (ppb) (a) and percent (b–g).
Figure 5 shows changes in SO2 that are spatially similar to those of DMSa. However the reductions around smaller coral reefs, such as those in the central Pacific, Indian or Caribbean oceans, are of lesser magnitude than those of the coral reefs in the MC-Aus region. This is true for both the nudged (Fig. 5b) and the free simulations (Fig. 5c), which implies that these areas of lower reef density are unlikely to have a significant impact on regional climate. In terms of seasonality, Table 3 and Fig. 5d–g indicate less SO2 variability compared to DMSa throughout the year for both the free and nudged simulations. MAM (March, April, May) has the smallest, statistically insignificant change (−0.9 % and −1.3 % for the free and nudged simulations respectively), while DJF (December, January, February) and JJA (June, July, August) show larger changes over the MC-Aus region of −3.2 % and −3.8 % (p<0.05) in the free ensemble and −2.7 % and −2.2 % (p>0.1) for the nudged runs. The violin plots indicate there is a similar degree of variability for each of these seasons (compared to DMSa), and the influence of free-running meteorology is again noted where changes in SO2 are found outside of coral reef regions.
3.2 Nucleation- and Aitken-mode aerosol
The removal of coral-reef-derived DMS leads to a significant (p<0.05) decline in nucleation-mode aerosol number concentration of −5.1 %, −6.0 % and −6.2 % for MAM, JJA and SON respectively in the free ensemble over the MC-Aus region (see Table 3). In the nudged simulations, nucleation-mode number concentration decreases by 4.6 % (p<0.05) in SON and by 4.4 % (p<0.1) in MAM. Although not statistically significant, JJA continues to show the largest changes (−6.1 %) and DJF the smallest (−3.8 %) in the nudged runs. The changes in nucleation-mode number concentration are strongly reflected in the number concentrations of particles greater than 3 nm dry diameter (N3) which are shown annually in Fig. 6. The violin plots in Fig. 6d–g show a large range in the response in DJF while a much smaller range in SON, with many of the individual free-running pairs agreeing on the magnitude of the change.

Figure 6As for Fig. 4 but for N3 in number per cubic centimetre (cm−3) (a) and percent (b–g).
These small aerosols (nucleation-mode-sized) show a greater response to changes in DMS than the larger aerosol sizes (see Table 3) in both the free and nudged simulations, aligning with the results of Fiddes et al. (2018). This result indicates that fewer homogeneous nucleation events are occurring in the free troposphere as a result of removing coral-reef-derived DMS. Hence, fewer particles are being entrained back into the boundary layer. This process is confirmed by the vertical profile of N3 showing a decrease in the upper levels of the atmosphere (not shown).

Figure 7Aerosol dry diameter in nanometres (nm, x axis) and number concentration (as a function of number over the log of the diameter) in cubic centimetres (cm−3, y axis), both in log scales, for four regions: off the coast of PNG (blues), in the East Pacific (reds/oranges), over the GBR (green/turquoise) and inland QLD (yellow/brown), for the L11C50 (dashed lines) and L11 simulations (solid lines) (see Fig. 1b for regions), for four seasons: DJF (a), MAM (b), JJA (c) and SON (d). The lines show the ensemble mean for the free-running simulations, and the shaded regions show the range of results from all years in the ensemble.
The size distributions shown in Fig. 7 at four grid points also show the larger decreases are occurring in the nucleation mode and the Aitken mode. The range of locations shown by the size distribution, including directly over coral reefs (GBR and PNG) and remotely from coral reefs (East Pacific and QLD), demonstrates that the effect of coral-reef-derived DMS loss is not restricted to directly over coral reef regions. This is shown notably at the QLD location for JJA in both the nucleation and Aitken modes and SON for the Aitken mode. Over the MC-Aus region, decreases in the soluble Aitken aerosol number occur in MAM and JJA of 1.9 % and 2.1 % respectively (p<0.05). The changes in both the nucleation- and Aitken-mode number concentrations are accompanied by similar changes in aerosol mass at this size (see Table 3).
3.3 Accumulation- and coarse-mode aerosol
At the larger sizes (soluble accumulation and coarse modes) little change in aerosol number is found on average over the MC-Aus region. However, significant (p<0.05) decreases in aerosol mass are found in the coarse mode during DJF, JJA and SON and in the accumulation mode in DJF (p<0.1) and JJA (p<0.05) for the free-running ensemble (see Table 3). Declines of smaller magnitude (p>0.1) are found for the nudged runs. For the free ensemble, the larger change in mass instead of number suggests a reduction in aerosol growth at these sizes as the larger aerosol sizes rely on condensational growth and cloud processing to interact with DMS-derived sulfate. One exception to the observed change in mass instead of number is the region east of PNG, which varies by season (not shown). In this region, a small increase in accumulation-mode aerosol number is found, accompanied by a larger increase in the aerosol mass. This increase is more evident in the nudged runs.
So far we show that the largest response in aerosol due to loss of coral-reef-derived DMS occurs over the MC-Aus region. For this reason, all subsequent plots focus on the MC-Aus region. It is noted that there are impacts on aerosol from the free-running meteorology outside of this domain, but these can mostly be explained by changes in surface wind speeds due to variability in the free-running ensemble (not shown). In addition, the influence of the free-running meteorology is found to have a larger impact on the results in subsequent analysis, with greater seasonal variation.
3.4 Cloud condensation nuclei
Despite the removal of coral-reef-derived aerosol having the largest impact on the nucleation-mode aerosol, these small aerosols do not interact with model radiation via direct or indirect aerosol effects. While the changes are small in the larger sized aerosol number and mass, a cumulative response to the loss of coral-reef-derived sulfur has some interesting impacts. Figure 8 shows the column-integrated seasonal cloud condensation nuclei with a dry diameter greater than 70 nm (CCN70) response to removal of coral-reef-derived DMS. For the nudged simulations in Fig. 8b, f, j and n, a consistent, yet small and insignificant reduction in CCN70 is found over the MC-Aus region (between 0.6 % and 0.9 %). Interestingly, over the SPCZ region, decreases of 1.0 %, 0.3 %, 1.9 % and 1.1 % are also found in the nudged simulations for each season (DJF, MAM, JJA and SON) respectively. The SPCZ is a relatively clean region, with few CCN70-sized aerosols (see Fig. 8a) and also few coral reefs. This lack of direct aerosol source suggests that changes in aerosol from other regions are affecting this region via transport along the SPCZ.
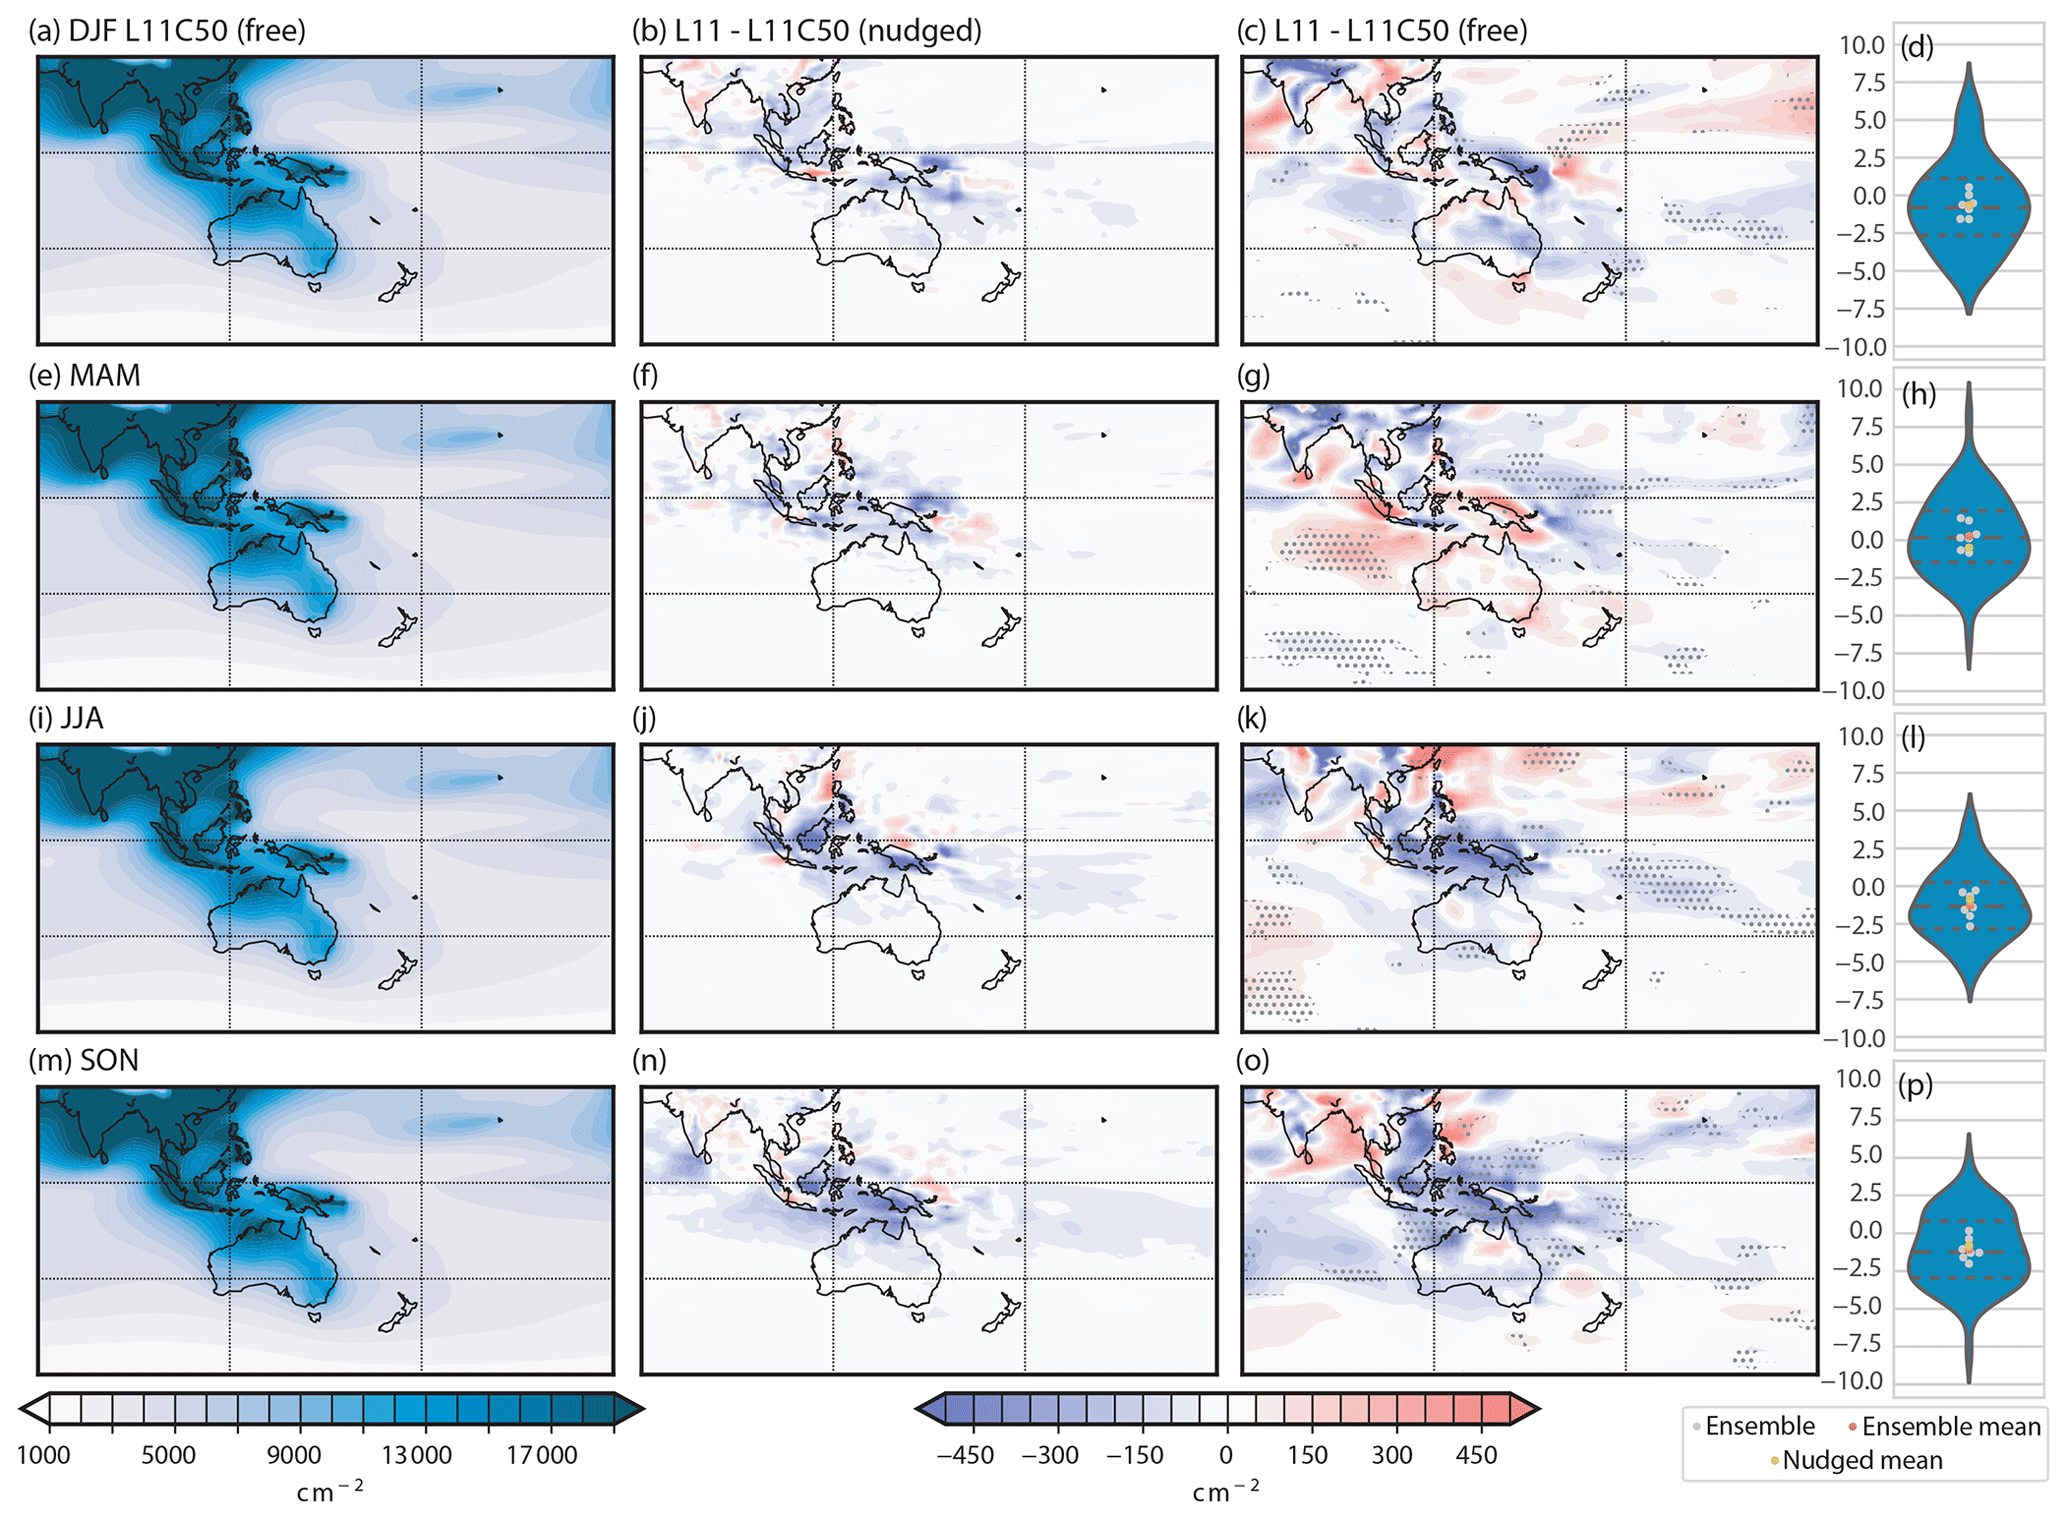
Figure 8The seasonal (DJF – first row, MAM – second row, JJA – third row and SON – fourth row) total-column CCN70 concentration (in cm−2) over the broad MC-Aus region for the free L11C50 simulation (first column); the L11–L11C50 difference for the nudged simulations (second column); and the L11–L11C50 difference for the free-running ensemble (third column) with the model agreement shown by stippling, where at least five of the seven ensemble pairs agree in the sign of the difference. The fourth column shows violin plots of the average seasonal difference (L11–L11C50) in total-column CCN70 over the MC-Aus region as a percentage, where all years in the ensemble are shown by the distribution, the dashed lines represent the 25, 50 and 75th percentiles, the grey dots show the mean of each pair of models, the red dots show the ensemble average and the yellow dots show the nudged average.
For the free ensemble, in Fig. 8c, g, k and o, the SPCZ region again stands out in MAM, JJA and SON, with decreases in CCN70 of 2.8 %, 2.2 % and 1.9 % for each season respectively (MAM and SON, p<0.1, and JJA, p<0.05). In this region, little change in surface wind speeds is found, suggesting that the changes found here are also likely due to loss of aerosol from coral reefs and their subsequent transport, as seen in the nudged runs.
Over the MC-Aus region in the free-running ensemble, JJA and SON have decreases in CCN70 of −1.4 % (p<0.1 and p>0.1 respectively). The violin plots in the far right column of Fig. 8 indicate large model spread in the CCN70 changes. SON (Fig. 8o) has the most ensemble agreement over the MC-Aus region, while little agreement is observed in other seasons. For this reason (and because the subsequent dynamical results to be discussed in Sect. 3.5 onwards were the largest in this season), the SON results will be shown and discussed from this point only (although the statistics for all seasons can be found in the continuation of Table 3).
Whilst the changes in aerosol discussed in this section are small, it is worth noting that in Fiddes et al. (2018), where all marine DMSw was removed, a global decrease of 8 % of all N3 (17 % for Australia) was found. For CCN70, a decrease of just 5 % was found globally (8 % for Australia). It is clear from the perturbation of total marine DMS that global DMS contributes only a small amount to the total aerosol number. Hence local differences from coral-reef-derived DMS found in this study could be considered to be relatively large.
3.5 Direct aerosol radiative effects
Aerosols in the Aitken, accumulation and coarse modes are used by the ACCESS-UKCA radiation scheme to calculate aerosol direct effects. In Fig. 9, the SON aerosol optical depth (AOD), clear-sky outgoing shortwave radiation at the top of the atmosphere (abbreviated to SW) and clear-sky incoming shortwave radiation at the surface (SW) are shown. The clear-sky radiation fields are examined in this section to allow for the detection of direct effects from aerosol without the influence of clouds. Changes in the all sky fields are dominated by the convective cloud response, which will be discussed in Sect. 4.
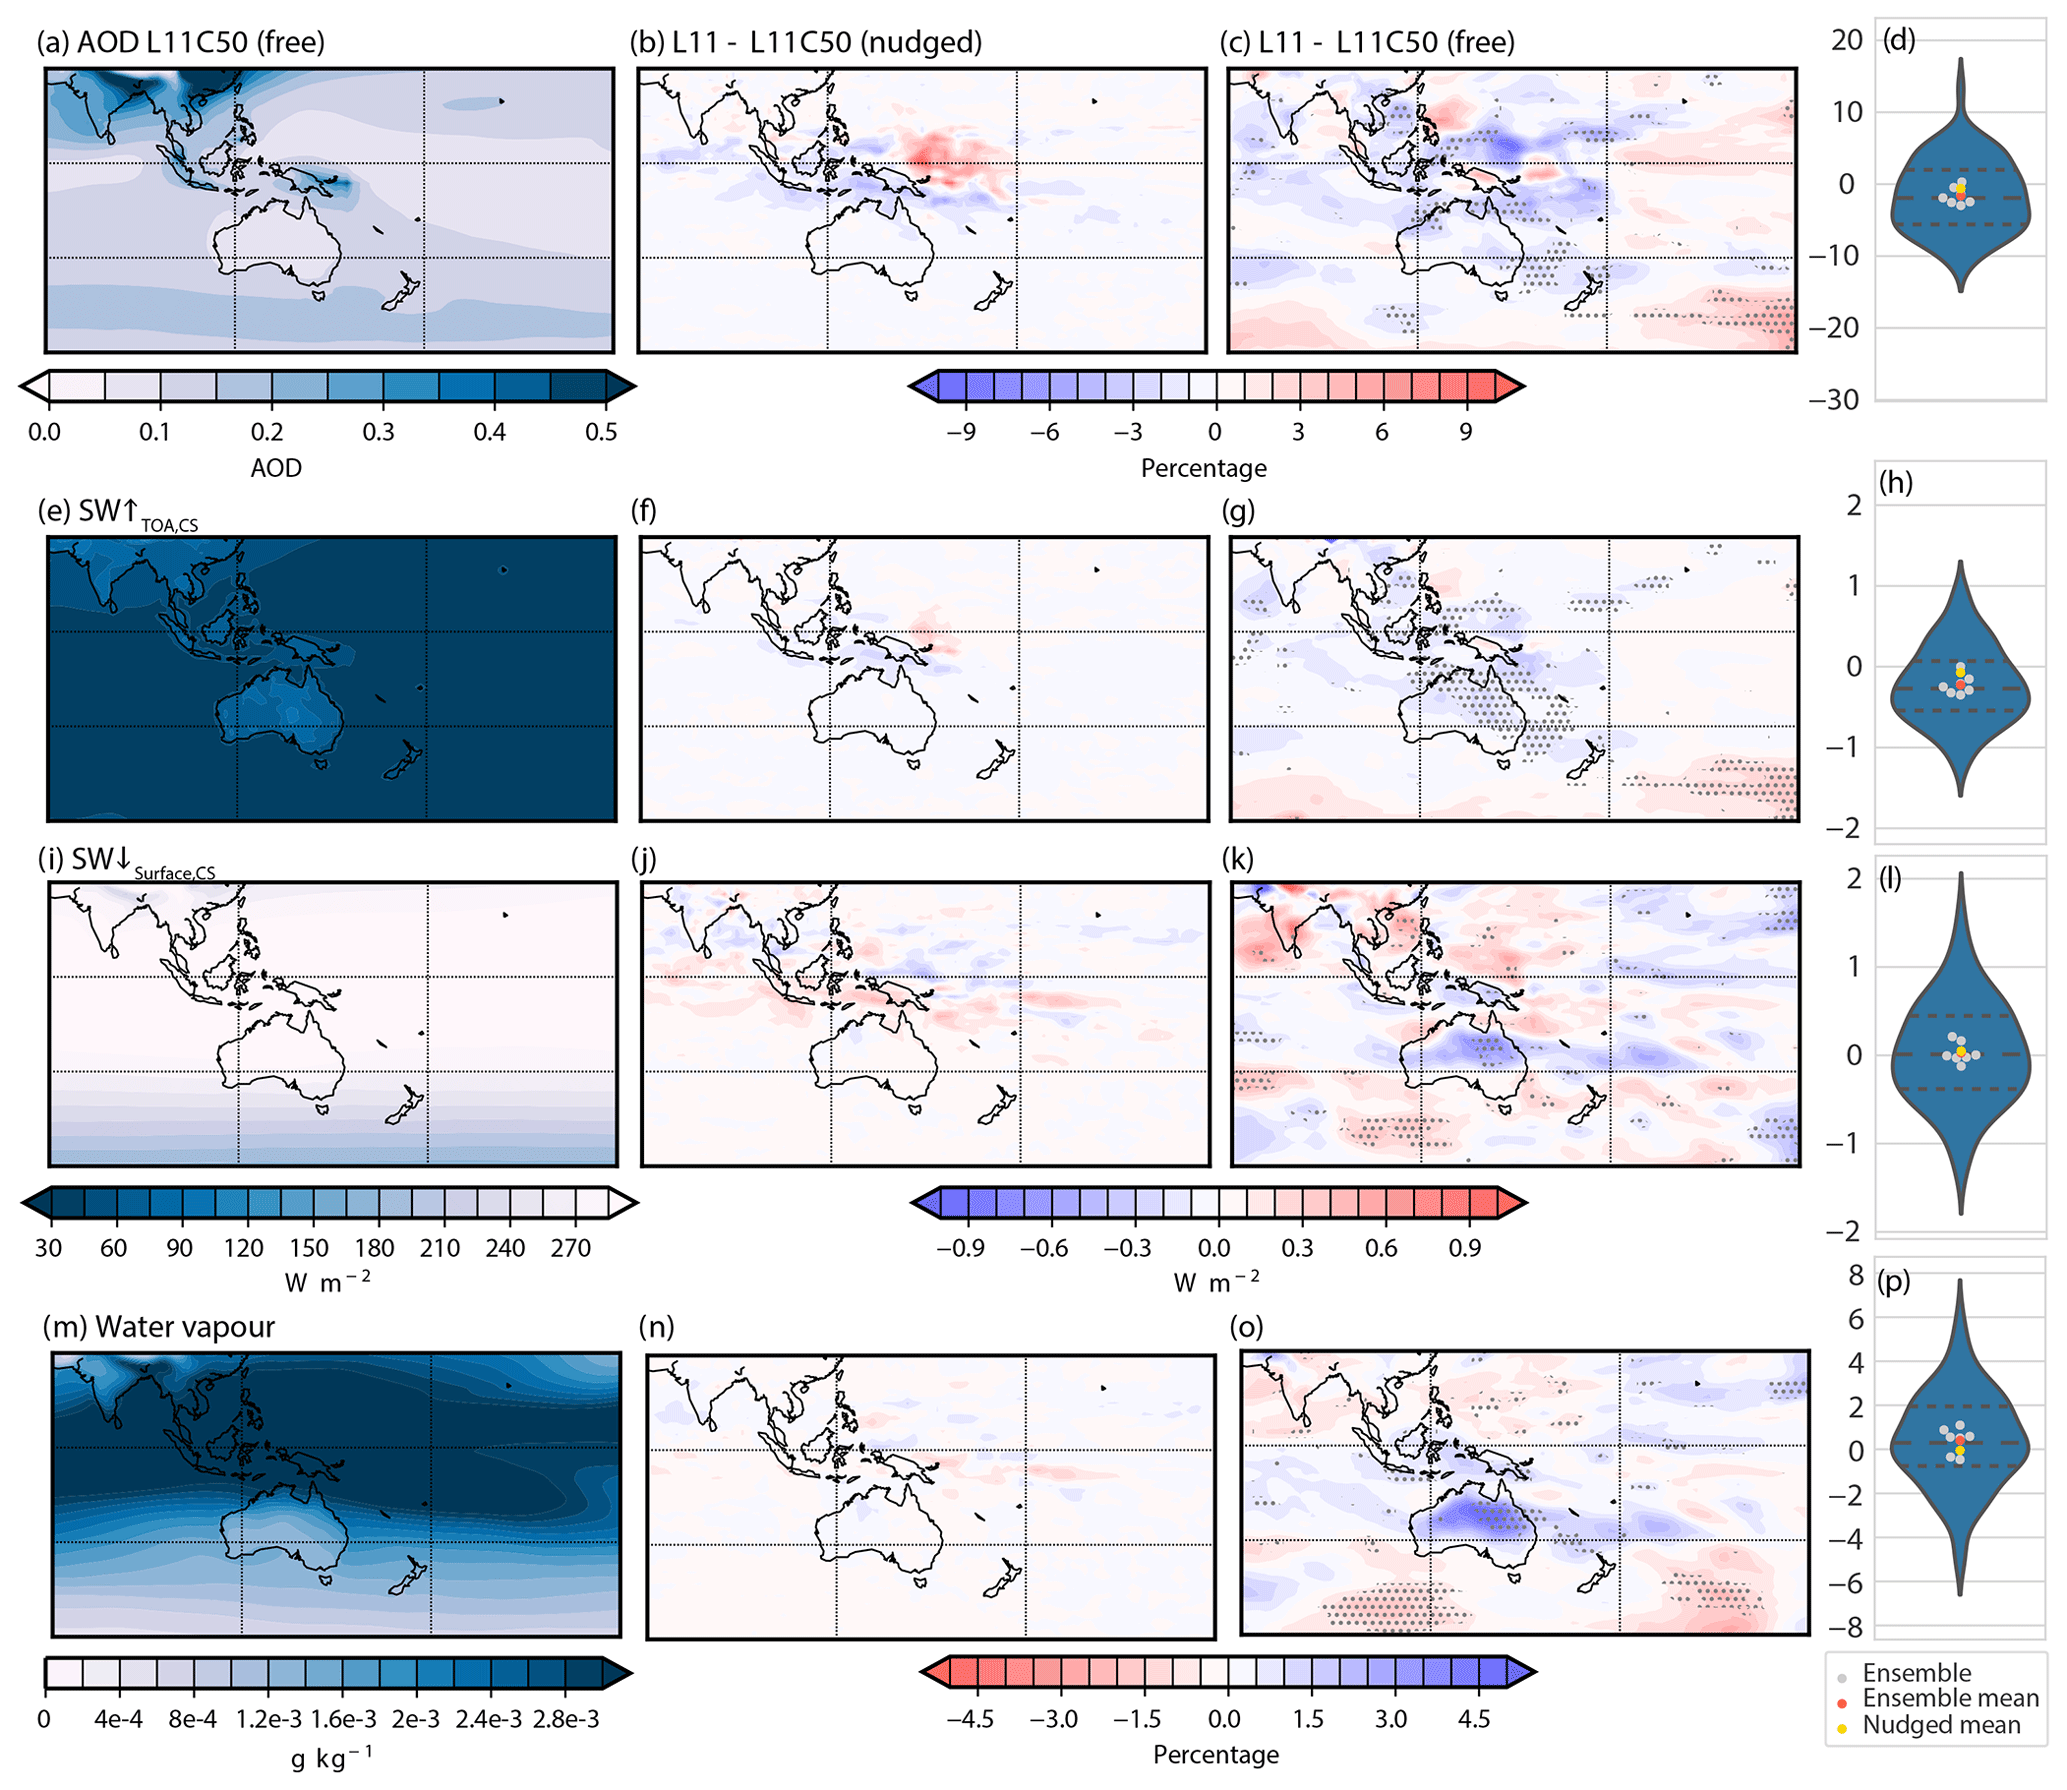
Figure 9SON averages over the MC-Aus region for first row: the AOD (unitless and changes in percentage); second row: SW (W m−2); third row: SW (W m−2); and fourth row: column-average specific humidity (g kg−1 and percent). The first column shows the free L11C50 simulation; the second column shows the L11–L11C50 difference for the nudged simulations; the third column shows the L11–L11C50 difference for the free-running ensemble with the model agreement shown by stippling, where at least five of the seven ensemble pairs agree in the sign of the difference; and the fourth column shows violin plots of the average seasonal differences (L11–L11C50) as a percentage for AOD and specific humidity and in watts per square metre (W m−2) for SW and SW, where all years in the ensemble are shown by the distribution; the dashed lines represent the 25, 50 and 75th percentiles; the grey dots show each pair of models mean, the red dots the ensemble average and the yellow dots the nudged average.
The spatial response of AOD to changes in aerosol in the nudged simulations (Fig. 9b) is broadly similar to the CCN70 changes (Fig. 8n). Decreasing AOD is found over most of the MC-Aus region, while the area to the east of PNG experiences an increase. The seemingly amplified aerosol response in the PNG region is due to the increased accumulation-mode sulfate mass. This increase is not believed to be associated with coral-reef-derived DMS removal but a function of complex non-linearities and model sensitivities. This anomaly is likely to be dampening the area averages over the MC-Aus region.
In Fig. 9f, the change in nudged SW is consistent with the change seen in AOD, indicating that there is a weak reduction in the amount of shortwave radiation being reflected out to space at the top of the atmosphere over significant coral reef regions. This decrease in SW suggests more shortwave radiation is passing through the atmosphere and reaching the surface. For the nudged runs, this is broadly true, as shown by the SW in Fig. 9j. These results indicate that when no interaction with meteorology is allowed, a weak, statistically insignificant direct aerosol effect is associated with certain regions over the MC under clear-sky conditions in austral spring.
For the free-running ensemble, however, the result is far less clear, primarily due to interactions with meteorology. The AOD response (Fig. 9c) is again broadly consistent with the changes in CCN70 (Fig. 8o), where over the MC-Aus region a decrease of 1.7 % (p<0.1) is found. The SW responds as expected with a decrease of 0.11 W m−2 over the MC-Aus region (p<0.1, with considerable model agreement). However, the subsequent SW response (Fig. 9k) is not as clear. While the SON MC-Aus average suggests a weak, insignificant increase in shortwave radiation reaching the surface, the spatial patterns are inconsistent with the AOD, aerosol fields or the SW.
In ACCESS-UKCA, the shortwave (defined as wavelengths between 0.2 and 5 µm) radiative transfer scheme considers not just the scattering and absorption of energy by aerosol and cloud droplets, but also the absorption of energy by water vapour (Edwards et al., 2013). Water vapour has an effect at wavelengths greater than 0.7 µm. In Fig. 9o, the mean change in water vapour throughout the column is shown, which is more spatially consistent with the free-running SW response than that of the AOD or SW. This consistency is particularly clear over the Australian region. An increase in water vapour in the column would suggest more absorption of radiation throughout the column, and hence less energy is received at the surface, as found in the SW results (Fig. 9k). Upper level warming over the tropics (not shown) is also found, and we note that changes in temperatures nearer the surface are limited due to the prescribed SSTs. It is emphasised that this interaction of energy with water vapour is only found in the free ensemble, when meteorology is allowed to vary.
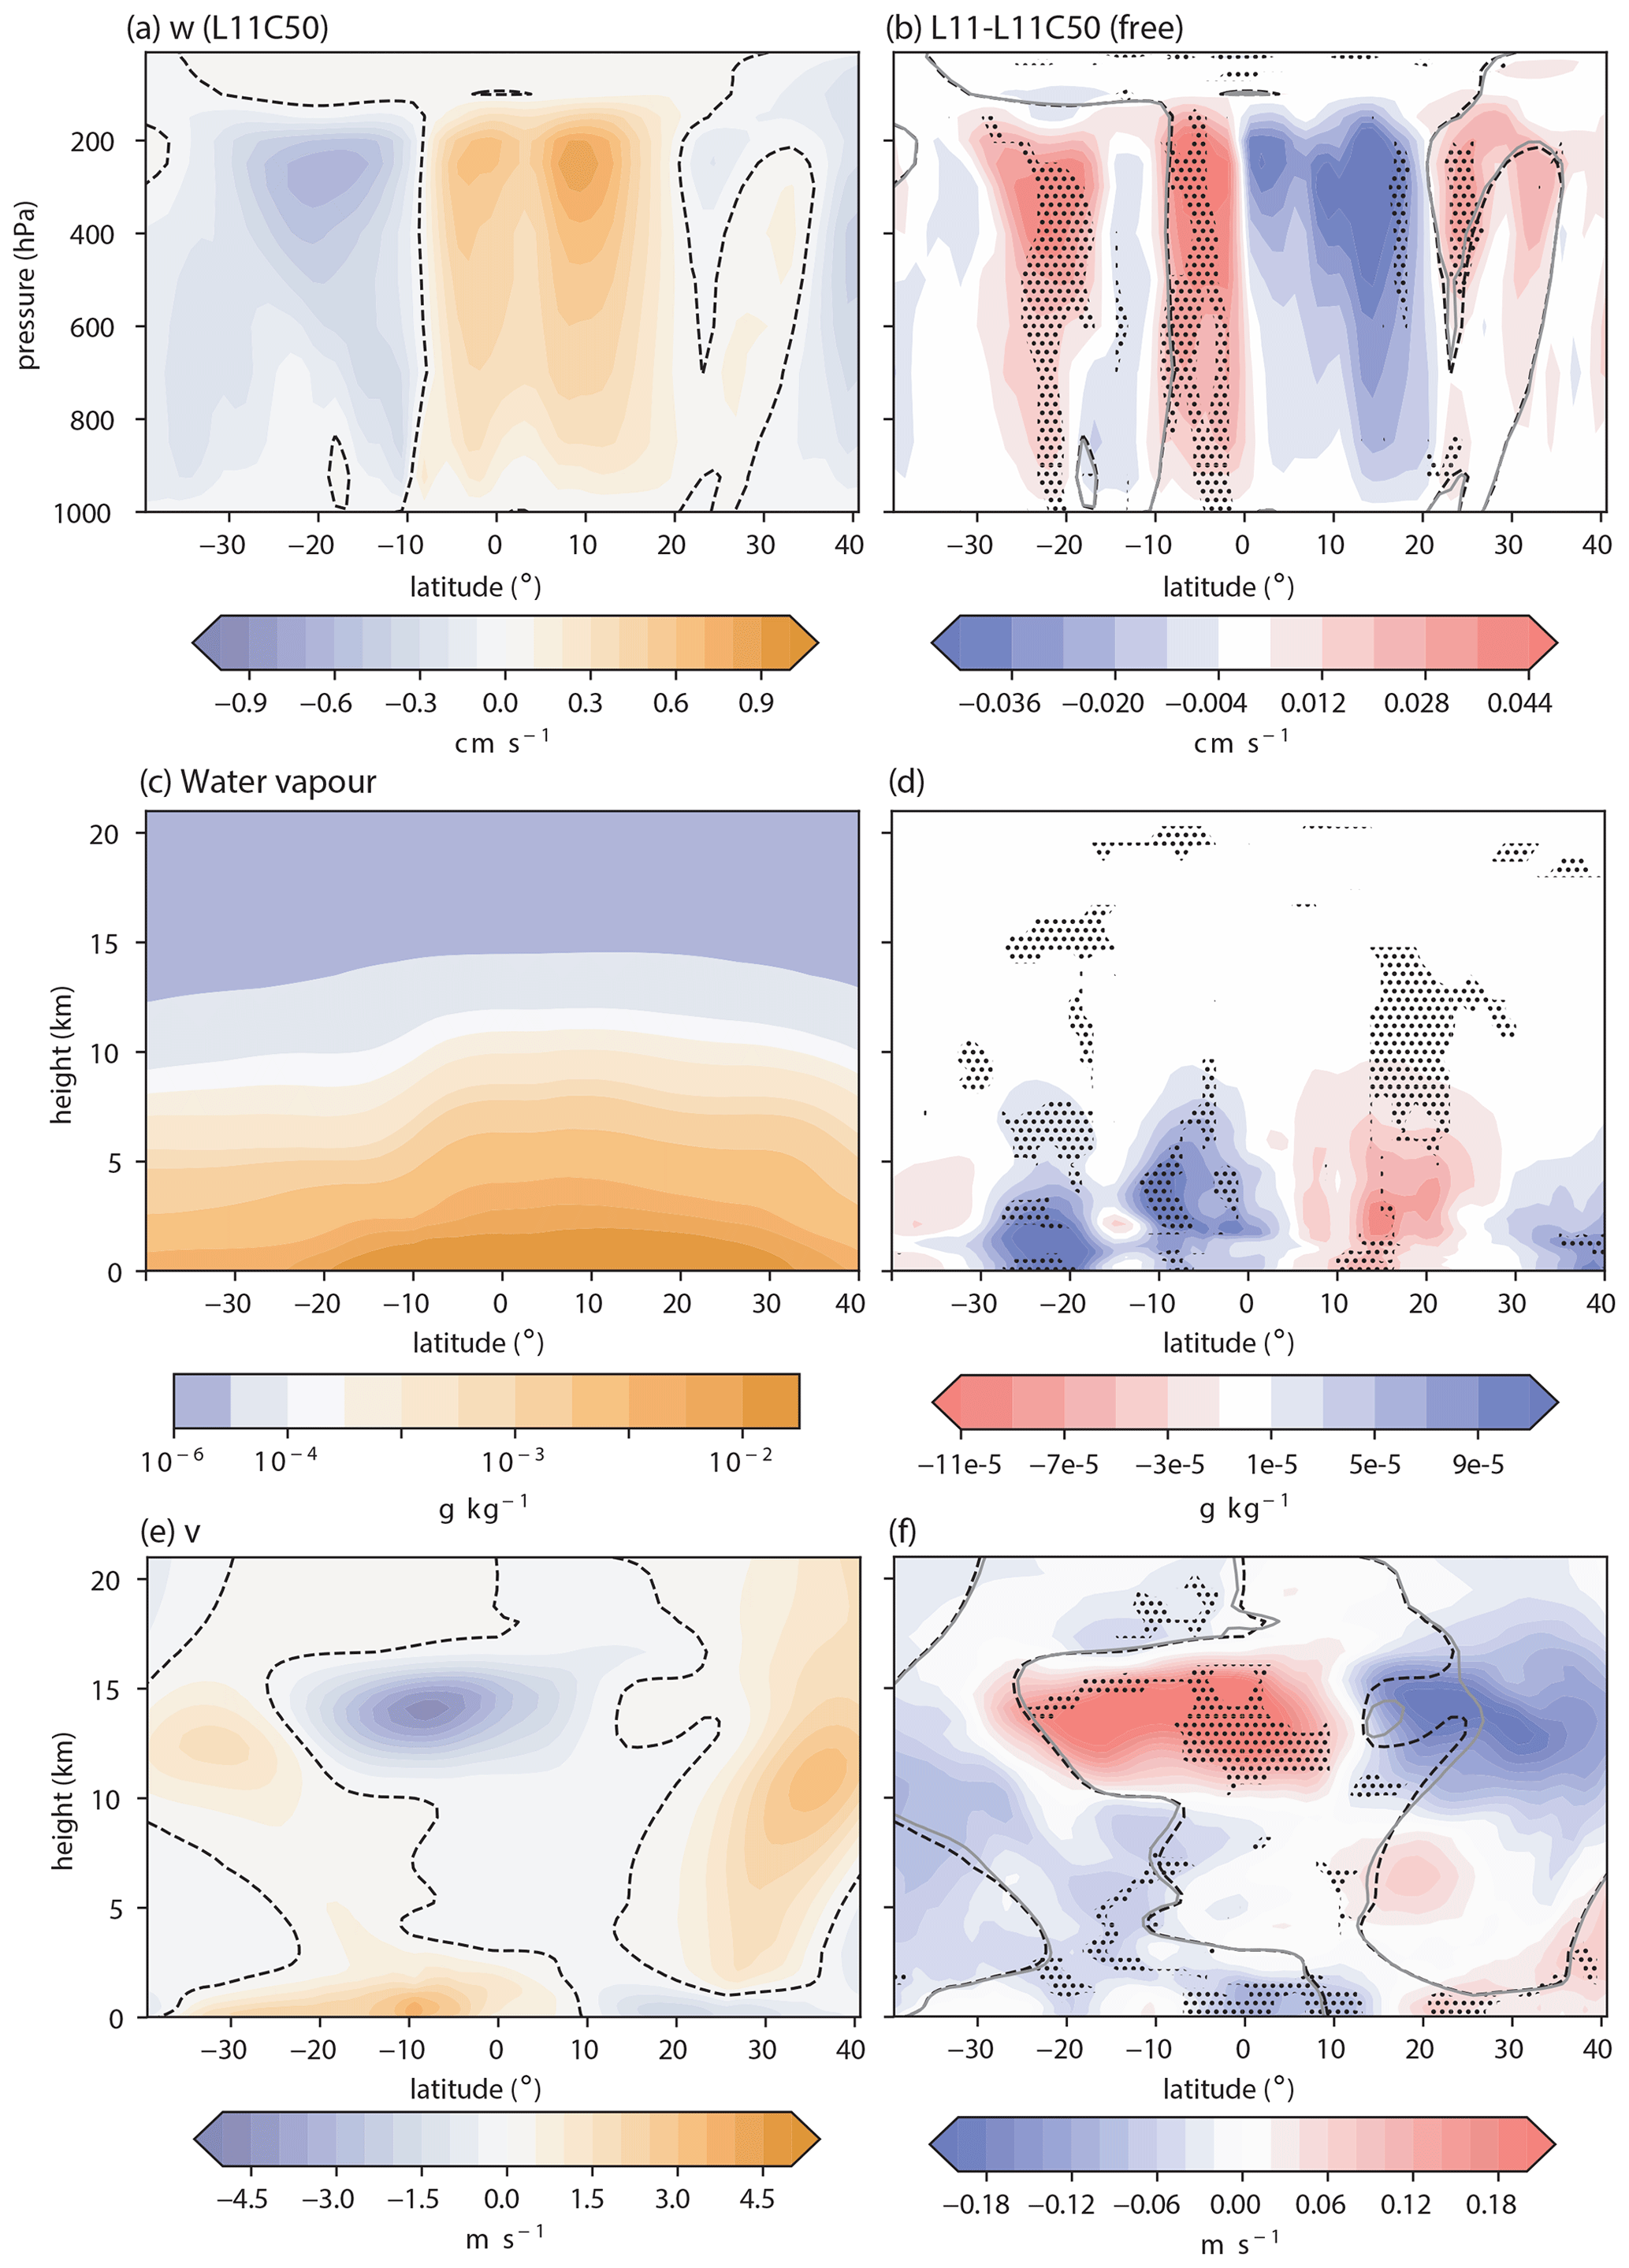
Figure 10The zonal mean vertical profiles over the MC-Aus longitudinal region for vertical velocity (w, a, b) in centimetres per second (cm s−1), water vapour (c, d) in grams per kilogram (g kg−1) and the v component of wind (e, f) in metres per second (m s−1) for the free-running L11C50 simulation (a, c, e) and the difference in L11-L11C50 the free ensemble (b, d, f), with the model agreement shown by stippling where at least five of the seven ensemble pairs agree in the sign of the difference. For panels (a)–(b) and (e)–(f), the dashed black lines in all plots represent the zero contour of the L11C50 field, while in panels (b) and (f) the solid grey line indicates the zero contour of the L11 field.
The cause of the change in water vapour is difficult to determine as it is intricately linked to both local- and large-scale climate processes. For example, meteorological effects found in this study that could explain the water vapour increase include the following:
-
warming at upper levels (15–20 km) of the atmosphere over the tropics (not shown), indicating more water vapour can be held in the atmosphere, but could also be a result of increased water vapour;
-
increased latent heat flux at the surface over the Australian region (not shown), suggesting increased evaporation;
-
a general increase in vertical motion found for the Southern Hemisphere tropics–mid-latitudes (Fig. 10b), aligning neatly with the regions of increased water vapour (Fig. 10d), and accompanied by decreased southwards transport at upper levels and decreased northwards transport at the surface (Fig. 10f), suggesting a weakening of the southern branch of the Hadley cell;
-
increased high-level cloud and convective precipitation found over the MC-Aus region, causing increased high cloud cover, an overall decrease in SW↓Surf and increased convective precipitation.
It is hypothesised that the small reduction in aerosol resulting from decreased DMSa has caused an increase in shortwave radiation passing through the atmospheric column, resulting in warming, which may cause increased evaporation, vertical transport and convective activity and subsequently increased water vapour. Despite many of the responses described above having good ensemble agreement, low confidence is attributed to this hypothesis for three reasons:
-
The top-of-the atmosphere direct radiative effect that is proposed to initiate these responses is small. Furthermore, the changes in aerosol and AOD that have caused the radiative effect are also small and insignificant. Hence it is unreasonable to suggest such small changes in aerosol could be causing a direct radiative effect.
-
Over the MC-Aus region as a whole, little statistical significance is found in these responses, and ensemble agreement can be found in regions that are seemingly not associated with coral-reef-derived DMS. Thus, internal model variability cannot be ruled out as the cause for these meteorological responses.
-
In Fiddes et al. (2018), where all marine DMS-derived aerosol was removed from the system, decreases in convective activity were found over the tropics, despite those simulations being nudged (nudging allows small differences in meteorology if the forcing is large enough). The change in convective activity induced by removing all DMS is of the opposite sign to that found here.
Therefore, despite a weak yet significant (p<0.1) decline in SW, it is concluded that over the MC-Aus region, no robust impact on climate via the direct radiative effect can be confidently detected. This result may be due to averaging over a large area, as the same processes are found over QLD with generally greater statistical significance and ensemble agreement. This is discussed further in Sect. 4.
3.6 Indirect aerosol radiative effects in the large-scale cloud and precipitation scheme
Indirect aerosol effects, such as cloud brightening or lifetime effects, take place as CCN particles activate and become cloud droplets. In ACCESS-UKCA, aerosol activation depends on the size and composition of aerosol as well as the atmospheric supersaturation, which is influenced by the vertical velocity. Thus, the significant increase in smaller size aerosol found in Sect. 3.2 may have some influence over indirect aerosol effects in certain conditions, although it is noted that larger aerosols have a much greater ability to influence indirect effects. Figure 11 shows the responses of cloud droplet number (CDN), cloud liquid water path (LWP) and low cloud fraction (noting that only the cloud microphysics scheme can respond to change in CDN, not the convective scheme). For both the nudged and free simulations, the changes found in CDN are consistent with, though weaker than, the changes observed in the CCN70 fields (noting again the vertical integral of CDN through the column is shown). No statistical significance is attributed to the changes in CDN over the MC-Aus region, although reasonable ensemble agreement is found in Fig. 11c. These weak changes suggest that the reductions in CDN are unlikely to have an effect on cloud properties or large-scale precipitation (via the second indirect effect where fewer CDN, given the same availability of liquid water, would increase rainfall).
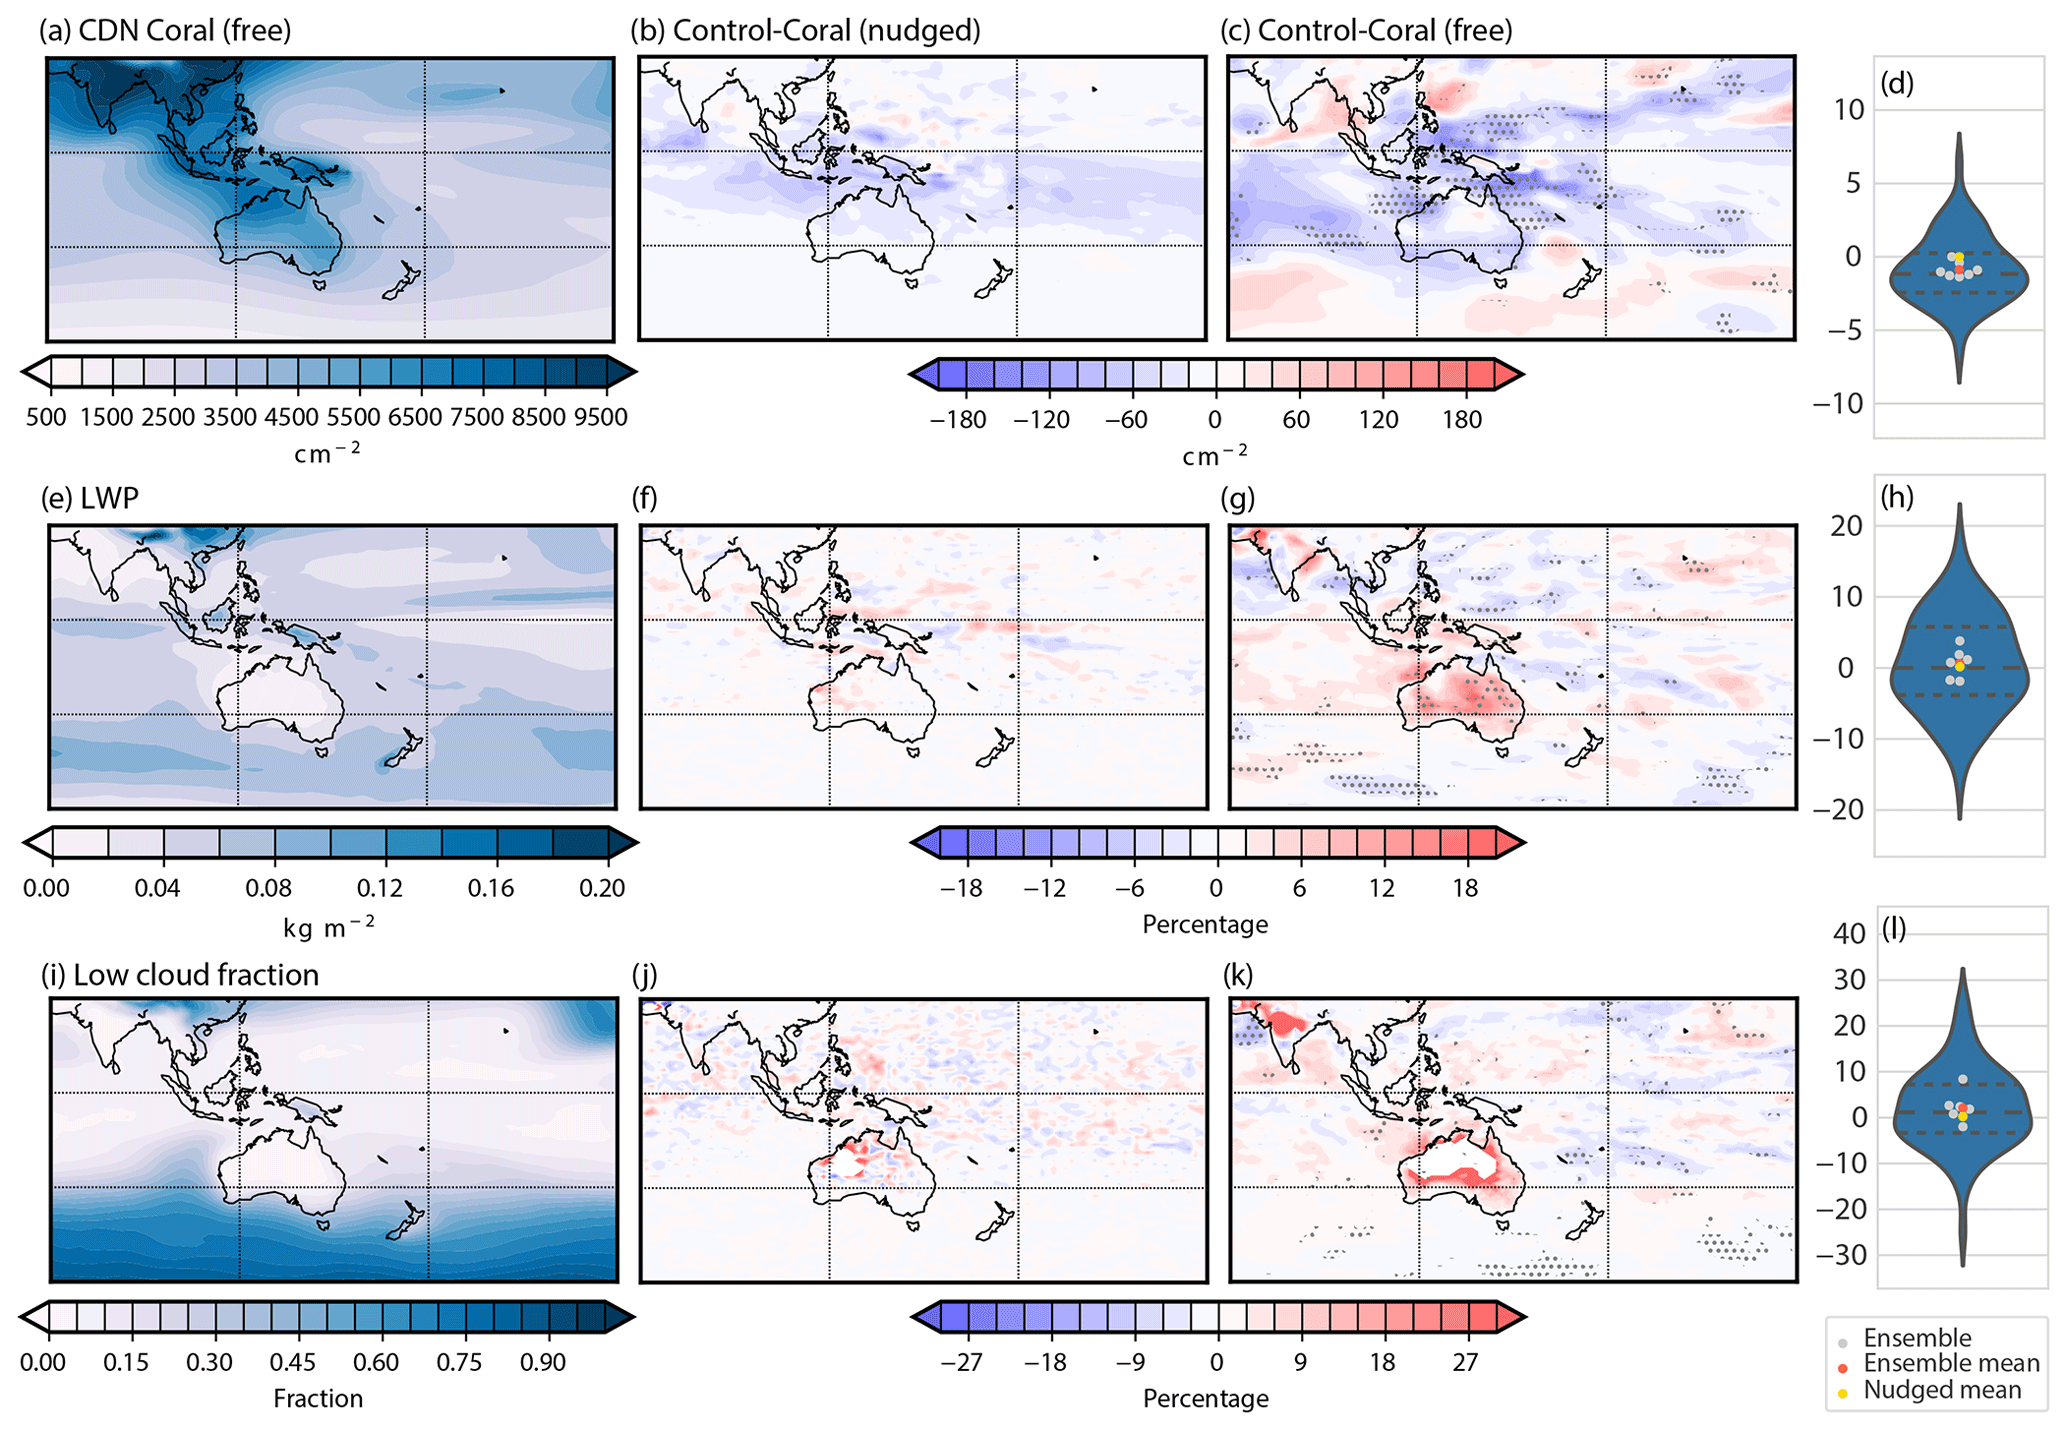
Figure 11As for Fig. 9 but for column integrals of CDN (first row) in square centimetres (cm−2), LWP (second row) in kilograms per square metre (kg m−2) and percent and low cloud fraction (third row) as a fraction and in percent.
A small increase in LWP is found on average over the MC-Aus region in the free simulations, although Fig. 11g–h show a large amount of variability in the region and little model agreement. This change in CDN and LWP has had little impact on properties such as low cloud fraction (Fig. 9k) or large-scale precipitation (not shown), as shown in Table 3, over the MC-Aus region for each season. In addition there is very little model agreement in these responses. For the nudged simulations, constrained meteorology has meant little response of cloud properties is allowed. Subsequently, these results suggest that the loss of coral-reef-derived aerosol has little or no impact on climate via the indirect aerosol effects.
A relatively large increase in precipitation, of 11 %, has been found over QLD in response to removal of DMS produced by coral. Although approximately equivalent increases were found in the large-scale and convective precipitation (10.9 %, p>0.1, and 9.4 %, p<0.1), very little large-scale precipitation occurs in this region, with convective precipitation by far the more important of the two. Furthermore, while CDN concentrations have decreased insignificantly (by 0.5 %) and the LWP has increased (7.4 % p<0.1) over the QLD region, resulting in more large-scale rainfall, attributing the change in LWP in particular to changes in aerosol is difficult, as discussed in the previous sections.
At this point, it is worth remembering that the convective scheme is not coupled to the aerosol scheme and thus has no knowledge of the removal of coral-reef-derived DMS. Hence the increased convective activity must be occurring dynamically, with possible causes discussed in Sect. 3.5. Specifically, over QLD, a significant decrease in N3 of 5 % is found (p<0.05). Although this does not translate into a meaningful decrease of CCN70 (0.5 %), a significant (p<0.1) decline in the AOD is found of 1.6 %, which has resulted in less SW of −0.16 W m−2, (p<0.05). As for the MC-Aus region, the increased radiation allowed through the atmospheric column has been absorbed by increased water vapour (see Fig. 9o), resulting in a significant reduction in SW↓Surf of −0.38 W m−2 (p<0.1). While high cloud cover has increased by 7.4 % (p<0.1), which in turn has caused a decrease in SW↓Surf of 1.61 W m−2 (p<0.1), linking these convective responses to the changes in direct aerosol effect at the top of the atmosphere is not able to be done with confidence.
Due to increased high cloud cover, the relatively large change in all sky surface solar radiation is of the opposite sign to what one would expect following the aerosol direct and indirect theories. Further, it is noted that the changes in the all-sky radiation are much larger than those of the clear-sky radiation and indicate that the response in cloud cover is much more important for radiative processes in this region than the direct aerosol effects.
Despite the changes presented in this section for QLD having greater statistical significance and more ensemble agreement than over the MC-Aus region, low confidence is attached to these results due to an unclear physical mechanism (Sect. 3.5) and the existence of similar responses elsewhere that are likely to be model noise (not shown). It is emphasised that the meteorological results discussed above are considered to be a response to a direct aerosol radiative effect, only possible when meteorological feedbacks are allowed. Nevertheless, these results were interesting and unexpected, demonstrating a clear example of how non-linear the DMS–climate system is and how important it is to consider the system as a whole, rather than isolating certain aspects.
This study set out to determine if the loss of coral-reef-derived DMS could impact global and regional climate. The ability of coral reefs to produce an aerosol precursor gas has been known for some time; however the impact of this source of sulfur on the climate has not been quantified until now. On the global scale, coral reefs appear to have little influence on the sulfur budget or global energy balance. At regional scales, however, this work has found some interesting and unexpected effects that highlight the complexity of this system.
The MC-Aus region has been found to have the largest aerosol response to removal of coral-reef-derived DMS across the globe. This is unsurprising given that this region has the highest density of coral reefs in the world. Over other coral reef regions, the effects of coral-reef-derived DMS are quickly diluted by other influencing factors, such as anthropogenic aerosol sources. Significant decreases in the free-running ensemble's small size aerosol (both number and mass) are found over the MC-Aus region when coral-reef-derived DMS is removed. For the larger sized aerosols, small, generally insignificant decreases in sulfate mass are found, while little change in number is noted. The nudged simulation shows a more consistent small decrease across all aerosol fields and seasons. The decreases in aerosol have cumulatively led to an insignificant decrease in SON of AOD in the MC-Aus region and a significant decrease of AOD over QLD. No significant or robust changes were detected in other seasons.
Despite the weak AOD response over the MC-Aus region, a significant reduction in SW of −0.11 W m−2 was found for SON in the free-running ensemble and is attributed, in part, to the reduction of aerosol (despite its statistical insignificance) in the region. This decrease is greater than the equivalent decrease in the nudged simulations. Much smaller (or no) reductions were found in all other seasons. In contrast to the nudged simulations, the free-running SON reduction in SW does not directly translate to similar increases in SW as expected. The most likely explanation is that interaction of shortwave radiation with water vapour causes the opposite SW effect, which is itself a result of complex meteorological feedbacks. The response of water vapour could not be confidently attributed to changes in aerosol (as opposed to model variability between ensemble members), and the direct effects at the top of the atmosphere are found to be weak. For these reasons, this work concludes that no robust direct aerosol effects can be confidently associated with coral-reef-derived DMS.
We have found little to no evidence of indirect aerosol effects in any region in response to coral reef DMS. This is unsurprising given the small and insignificant changes found in the CDN and also the results of Fiddes et al. (2018), where few indirect effects were observed outside of the clean marine regions of the Southern Hemisphere mid-latitudes. However, it may also be a result of the lack of coupling between the convective scheme and aerosol in the model. Coral reefs, by nature, are located in tropical regions that are dominated by convective processes. Hence, it is possible that no indirect effects were found in this work simply because such effects are only allowed to occur in the large-scale scheme, which is not particularly active in the regions of interest.
How convection may interact with changes in aerosol is currently a large source of uncertainty (Tao et al., 2012). Aerosol-induced convective invigoration theories suggest that with less aerosol, CDN would rain out more quickly, reducing the amount of latent heat release caused by condensation, thus inhibiting convection. This mechanism has been found in both simulations and observations with respect to increased anthropogenic ultrafine aerosol over the Amazon invigorating deep convection (Fan et al., 2018). However, Nishant et al. (2019) have demonstrated that while satellite observations correlate high aerosol loading to increased convection, the presence of aerosol may not be the cause of convective activity due to the co-variation of aerosol–wind and wind–cloud processes. Fan et al. (2016) summarise that the influence of aerosol on convection is highly dependent on different kinds of convective systems (e.g. the trigger mechanism, whether it is a super cell) and the environment (e.g. wind shear, cloud base temperature). The studies discussed above and the results of this work indicate that tropical aerosol interaction with climate is far from linear and requires significantly more work to integrate both the convective and large-scale responses in climate modelling.
Interestingly, this study has found some unexpected changes in convective processes, via dynamical mechanisms, including a significant increase of 10.9 % in convective rainfall over QLD, attributed to suppressed downwards motion in the region. However, low confidence is given to the physical cause (weak direct radiative effects) of the changes in vertical motion in this study.
It should be noted that the weak direct effects discussed above consider clear-sky processes only. The changes in convective processes result in significant changes in high-cloud fraction. Increased cloud cover subsequently has large impacts on the all-sky radiation response (decreased SW↓Surf), overwhelming any clear-sky responses. This again highlights the complexity of the system and issues a warning to the oversimplification, or perhaps more appropriately, the lack of detailed understanding surrounding the current limitations of aerosol effects in climate models, especially as aerosol schemes are more routinely used in climate models.
The tool used for this work, ACCESS-UKCA, is able to provide detailed diagnostics of the DMS–climate system; however, important model limitations remain. By conducting a global study, a limitation of this work is the model resolution, both with respect to model time steps (hourly) and output (monthly), as well as spatial resolution. Higher resolution aerosol–cloud interaction studies have been planned with respect to coral-reef-derived DMS to address this issue. In addition, by allowing the model to run freely, disentangling responses due to coral-reef-derived DMS as opposed to internal model variability has been difficult. While an effort to resolve this problem has been made by creating a seven-member ensemble (limited by computer resources) and comparing to nudged simulations, there remains a significant likelihood that some of the results presented in the work are purely from internal model variability. Despite this difficulty, we suggest that future aerosol–climate interaction studies use a large enough ensemble to reduce the signal due to internal variability and that significant analysis of the dynamical aspects of any aerosol response is performed to ensure a robust physical mechanism is found explaining meteorological changes. Double-call radiation diagnostics can also be a useful tool in this instance to diagnose model feedbacks if computer resources permit.
Further limitations of this model are the underlying biases in clouds and radiation (Fiddes et al., 2018) and the lack of representation of some microphysical processes, which can have important effects on how aerosols interact with the climate. In particular we note the single-moment cloud microphysics used in this version of ACCESS places a limitation on the modelling of indirect aerosol effects, despite the double-moment aerosol scheme. Of note, evaluation performed in Fiddes et al. (2018) showed that ACCESS-UKCA significantly underestimated cloud fractions at all levels, which led to overestimated SW↑TOA. The responses found here in cloud and radiation are well within the model uncertainties reported in the literature and are smaller than the model biases themselves (found in Fiddes et al., 2018). In effect, improved model representation of the climate system may have a larger impact on the energy balance than the small perturbation applied in this work. The sensitivity of global climate models to changes in model structure has been highlighted recently, where new-generation models reportedly have a higher climate sensitivity than previously, in part due to improved representation of cloud feedbacks (Zelinka et al., 2020).
The results presented here indicate that although the loss of coral-reef-derived DMS may have small impacts on nucleation- and Aitken-mode aerosol, the end result is not as straightforward as the aerosol effect theory suggests. This complexity is highlighted by the difference between the nudged simulations and the free ensemble, where in the latter, the impact of changing meteorology in response to a weak direct effect has subsequent impacts on the radiation budget often opposing what was expected. These results also demonstrate how interdependent this system is and suggests that not explicitly resolving all aspects of the DMS–climate cycle (chemistry, aerosol, dynamics, clouds, radiation, etc.) may result in misleading findings. These results further highlight the costs and benefits of the two modelling methods (free versus nudged simulation) when trying to separate climate responses from climate variability.
This has been the first study to include coral-reef-derived DMS in a global climate–chemistry model and to then determine what possible effect the loss of this DMS source may have on climate. It is noted that the amount of DMSw assumed to be produced by coral reefs in this work (an area weighted 50 nm) is likely larger than reality due to area averaging and the far more variable nature of DMS production. That said, no robust evidence of indirect effects and weak evidence of a direct effect over just one season (SON) has been found over the MC-Aus region. These results suggest that with smaller estimates of coral reef DMSw, little to no climatic forcing would be found. These results have significant implications for current coral–DMS–climate literature, effectively signalling that DMS produced by coral reefs has little importance for climate via sulfate aerosol radiative forcing. However, we note that we have not evaluated other coral reef links to the climate such as carbon uptake or ecosystem services. A future study, including simulations conducted with short (hourly) timescales, is planned to evaluate if coral-reef-derived DMS can have a local impact on meteorology, in order to assess the possibility of a bioregulatory feedback system.
Reflecting on the questions posed at the beginning of this study, we are now able to provide the first quantitative evidence that coral reefs likely play little role in regional climate modulation. As coral reefs globally face extinction due to anthropogenic climate change, it is unlikely that the subsequent reduction in precursor aerosols will have a noticeable impact on regional climate. Further modelling studies using future climate scenarios where anthropogenic aerosol dominate are unlikely to yield different results by the same reasoning. A more interesting question may be what the change in climate would be in a pre-industrial world, with no anthropogenic greenhouse gases and in particular, aerosol pollution. We speculate that under pre-industrial conditions coral reefs could possibly have a greater influence on climate.
The model used for this study is a licensed product of the UK Met Office and is available to specific users under a license agreement. Model simulation output can be made available upon request. Analysis of model output (plotting and statistical analysis) was performed using Python 2.7, and the code can be made available upon request for analysis.
SLF completed the model simulations, analysis and write-up presented in this study. MTW provided project guidance, specific model set-up and analysis advice and contributed to the subsequent revisions of this work. RS and TPL provided project guidance and analysis advice and provided comment on the revisions of this paper.
The authors declare that they have no conflict of interest.
Sonya L. Fiddes was supported by the Australian Research Council (ARC) Centre of Excellence for Climate System Science (CE110001028). Todd P. Lane is supported by the ARC Centre of Excellence for Climate Extremes (CE170100023). Sonya L. Fiddes and Robyn Schofield were supported by the ARC Discovery Project: Great Barrier Reef as a significant source of climatically relevant aerosol particles (DP150101649), and Robyn Schofield has funding from the ARC Discovery project: Tackling Atmospheric Chemistry Grand Challenges in the Southern Hemisphere (DP160101598). This research was undertaken with the assistance of resources and services from the National Computational Infrastructure (project q90 and w40), which is supported by the Australian Government. Sonya L. Fiddes was supported by the Australian Government Research Training Program Scholarship. Sonya L. Fiddes would like to thank Georgina Harmer for her help in the design of Fig. 1.
This research has been supported by the Australian Research Council Centre of Excellence for Climate System Science (grant no. CE110001028), the Australian Research Council (ARC) Centre of Excellence for Climate Extremes (grant no. CE170100023), the ARC Discovery Project: Great Barrier Reef as a significant source of climatically relevant aerosol particles (grant no. DP150101649) and the ARC Discovery project: Tackling Atmospheric Chemistry Grand Challenges in the Southern Hemisphere (grant no. DP160101598).
This paper was edited by Susannah Burrows and reviewed by two anonymous referees.
Bell, T. G., Landwehr, S., Miller, S. D., de Bruyn, W. J., Callaghan, A. H., Scanlon, B., Ward, B., Yang, M., and Saltzman, E. S.: Estimation of bubble-mediated air–sea gas exchange from concurrent DMS and CO2 transfer velocities at intermediate–high wind speeds, Atmos. Chem. Phys., 17, 9019–9033, https://doi.org/10.5194/acp-17-9019-2017, 2017. a
Belviso, S., Moulin, C., Bopp, L., and Stefels, J.: Assessment of a global climatology of oceanic dimethylsulfide (DMS) concentration based on SeaWiFS imagery (1998–2001), Can. J. Fish. Aquat. Sci., 61, 804–816, https://doi.org/10.1139/F04-001, 2004. a
Binkowski, F. S. and Shankar, U.: The Regional Particulate Matter Model: 1. Model description and preliminary results, J. Geophys. Res., 100, 26191, https://doi.org/10.1029/95JD02093, 1995. a
Bopp, L., Boucher, O., Aumont, O., Belviso, S., Dufresne, J.-L., Pham, M., and Monfray, P.: Will marine dimethylsulfide emissions amplify or alleviate global warming? A model study, Can. J. Fish. Aquat. Sci., 61, 826–835, https://doi.org/10.1139/f04-045, 2004. a
Broadbent, A. D. and Jones, G. B.: DMS and DMSP in mucus ropes, coral mucus, surface films and sediment pore waters from coral reefs in the Great Barrier Reef, Mar. Freshwater Res., 55, 849–855, https://doi.org/10.1071/MF04114, 2004. a
Broadbent, A. D., Jones, G. B., and Jones, R. J.: DMSP in Corals and Benthic Algae from the Great Barrier Reef, Estuar. Coast. Shelf Sci., 55, 547–555, https://doi.org/10.1006/ecss.2002.1021, 2002. a
Burdett, H. L., Hatton, A. D., and Kamenos, N. A.: Coralline algae as a globally significant pool of marine dimethylated sulfur, Global Biogeochem. Cy., 29, 1845–1853, https://doi.org/10.1002/2015GB005274, 2015. a
Cameron-Smith, P., Elliott, S., Maltrud, M., Erickson, D., and Wingenter, O.: Changes in dimethyl sulfide oceanic distribution due to climate change, Geophys. Res. Lett., 38, 1–5, https://doi.org/10.1029/2011GL047069, 2011. a
Charlson, R. J., Lovelock, J. E., Andreae, M. O., and Warren, S. G.: Oceanic phytoplankton, atmospheric sulphur, cloud albedo and climate, Nature, 326, 655–661, https://doi.org/10.1038/326655a0, 1987. a
Cropp, R., Gabric, A., van Tran, D., Jones, G., Swan, H., and Butler, H.: Coral reef aerosol emissions in response to irradiance stress in the Great Barrier Reef, Australia, Ambio, 47, 671–681, https://doi.org/10.1007/s13280-018-1018-y, 2018. a, b
Dee, D. P., Uppala, S. M., Simmons, A. J., Berrisford, P., Poli, P., Kobayashi, S., Andrae, U., Balmaseda, M. A., Balsamo, G., Bauer, P., Bechtold, P., Beljaars, A. C. M., van de Berg, L., Bidlot, J., Bormann, N., Delsol, C., Dragani, R., Fuentes, M., Geer, A. J., Haimberger, L., Healy, S. B., Hersbach, H., Hólm, E. V., Isaksen, L., Kållberg, P., Köhler, M., Matricardi, M., Mcnally, A. P., Monge-Sanz, B. M., Morcrette, J. J., Park, B. K., Peubey, C., de Rosnay, P., Tavolato, C., Thépaut, J. N., and Vitart, F.: The ERA-Interim reanalysis: Configuration and performance of the data assimilation system, Q. J. Roy. Meteor. Soc., 137, 553–597, https://doi.org/10.1002/qj.828, 2011. a, b
Deloitte Access Economics: The economic, social and icon value of the Great Barrier Reef Acknowledgement, Tech. rep., Deloitte Touche Tohmatsu, Brisbane, QLD, Australia, available at: https://www2.deloitte.com/au/en/pages/economics/articles/great-barrier-reef.html, last access: 28 June 2017. a
Deschaseaux, E., Jones, G. B., Miljevic, B., Ristovski, Z., and Swan, H.: Can corals form aerosol particles through volatile sulphur compound emissions?, in: Proceedings of the 12th International Coral Reef Symposium, edited by: Yellowlees, D. and Hughes, T., James Cook University, 9–13 July 2012, Cairns, QLD, Australia, 2012. a
Edwards, J. M., Manners, J., Thelen, J.-C., Ingram, W. J., and Hill, P. G.: Unified Model Documentation Paper No. 23: The Radiation Code, Tech. Rep. Model version 8.2, UK Met Office, Exeter, UK, 2013. a
Elliott, S.: Dependence of DMS global sea-air flux distribution on transfer velocity and concentration field type, J. Geophys. Res.-Biogeo., 114, 1–18, https://doi.org/10.1029/2008JG000710, 2009. a
Fan, J., Wang, Y., Rosenfeld, D., and Liu, X.: Review of aerosol-cloud interactions: Mechanisms, significance, and challenges, J. Atmos. Sci., 73, 4221–4252, https://doi.org/10.1175/JAS-D-16-0037.1, 2016. a
Fan, J., Rosenfeld, D., Zhang, Y., Giangrande, S. E., Li, Z., Machado, L. A., Martin, S. T., Yang, Y., Wang, J., Artaxo, P., Barbosa, H. M., Braga, R. C., Comstock, J. M., Feng, Z., Gao, W., Gomes, H. B., Mei, F., Pöhlker, C., Pöhlker, M. L., Pöschl, U., and De Souza, R. A.: Substantial convection and precipitation enhancements by ultrafine aerosol particles, Science, 359, 411–418, https://doi.org/10.1126/science.aan8461, 2018. a
Fiddes, S. L., Woodhouse, M. T., Nicholls, Z., Lane, T. P., and Schofield, R.: Cloud, precipitation and radiation responses to large perturbations in global dimethyl sulfide, Atmos. Chem. Phys., 18, 10177–10198, https://doi.org/10.5194/acp-18-10177-2018, 2018. a, b, c, d, e, f, g, h, i, j, k, l, m, n, o, p, q
Fischer, E. and Jones, G. B.: Atmospheric dimethysulphide production from corals in the Great Barrier Reef and links to solar radiation, climate and coral bleaching, Biogeochemistry, 110, 31–46, https://doi.org/10.1007/s10533-012-9719-y, 2012. a
Fuchs, N. and Sutugin, A.: Highly dispersed aerosols, in: Topics in Current Aerosol Research, US Army Foreign Science and Technology Centre, New York, USA, 1–86, 1971. a
Gabric, A. J., Simó, R., Cropp, R. A., Hirst, A. C., and Dachs, J.: Modeling estimates of the global emission of dimethylsulfide under enhanced greenhouse conditions, Global Biogeochem. Cy., 18, GB2014, https://doi.org/10.1029/2003GB002183, 2004. a
Gabric, A. J., Qu, B., Rotstayn, L., and Shephard, J.: Global simulations of the impact on contemporary climate of a perturbation to the sea-to-air flux of dimethylsulfide, Aust. Meteorol. Ocean., 63, 365–376, https://doi.org/10.22499/2.6303.002, 2013. a
Grandey, B. S. and Wang, C.: Enhanced marine sulphur emissions offset global warming and impact rainfall., Sci. Rep., 5, 13055, https://doi.org/10.1038/srep13055, 2015. a
Green, T. K. and Hatton, A. D.: The Claw Hypothesis: A New Perspective on the Role of Biogenic Sulphur in the Regulation of Global Climate, Oceanogr. Mar. Biol., 52, 315–336, https://doi.org/10.1201/b17143-7, 2014. a, b
Hoegh-Guldberg, O., Poloczanska, E. S., Skirving, W., and Dove, S.: Coral Reef Ecosystems under Climate Change and Ocean Acidification, Front. Mar. Sci., 4, 158, https://doi.org/10.3389/fmars.2017.00158, 2017. a
Hopkins, F. E., Bell, T. G., Yang, M., Suggett, D. J., and Steinke, M.: Air exposure of coral is a significant source of dimethylsulfide (DMS) to the atmosphere, Sci. Rep., 6, 36031, https://doi.org/10.1038/srep36031, 2016. a, b, c, d, e, f
Hughes, T. P., Kerry, J. T., Alvarez-Noriega, M., Alvarez-Romero, J. G., Anderson, K. D., Baird, A. H., Babcock, R. C., Beger, M., Bellwood, D. R., Berkelmans, R., Bridge, T. C., Butler, I. R., Byrne, M., Cantin, N. E., Comeau, S., Connolly, S. R., Cumming, G. S., Dalton, S. J., Diaz-Pulido, G., Eakin, C. M., Figueira, W. F., Gilmour, J. P., Harrison, H. B., Heron, S. F., Hoey, A. S., Hobbs, J.-P. A., Hoogenboom, M. O., Kennedy, E. V., Kuo, C.-Y., Lough, J. M., Lowe, R. J., Liu, G., McCulloch, M. T., Malcolm, H. A., McWilliam, M. J., Pandolfi, J. M., Pears, R. J., Pratchett, M. S., Schoepf, V., Simpson, T., Skirving, W. J., Sommer, B., Torda, G., Wachenfeld, D. R., Willis, B. L., and Wilson, S. K.: Global warming and recurrent mass bleaching of corals, Nature, 543, 373–377, https://doi.org/10.1038/nature21707, 2017. a, b
Hughes, T. P., Anderson, K. D., Connolly, S. R., Heron, S. F., Kerry, J. T., Lough, J. M., Baird, A. H., Baum, J. K., Berumen, M. L., Bridge, T. C., Claar, D. C., Eakin, C. M., Gilmour, J. P., Graham, N. A., Harrison, H., Hobbs, J. P. A., Hoey, A. S., Hoogenboom, M., Lowe, R. J., McCulloch, M. T., Pandolfi, J. M., Pratchett, M., Schoepf, V., Torda, G., and Wilson, S. K.: Spatial and temporal patterns of mass bleaching of corals in the Anthropocene, Science, 359, 80–83, https://doi.org/10.1126/science.aan8048, 2018. a
IPCC: Summary for Policy Makers, in: Global Warming of 1.5 ∘C. An IPCC Special Report on the impacts of global warming of 1.5 ∘C above pre-industrial levels and related global greenhouse gas emission pathways, in the context of strengthening the global response to the threat of climate change, edited by: Masson-Delmotte, V., Zhai, P., Pörtner, H.-O., Roberts, D., Skea, J., Shukla, P., Pirani, A., Moufouma-Okia, W., C. Péan, R. P., Connors, S., Matthews, J., Chen, Y., Zhou, X., Gomis, M., Lonnoy, E., Maycock, T., Tignor, M., and Waterfield, T., World Meteorological Organization, Geneva, Switzerland, p. 32, 2018. a
Jackson, R. L., Gabric, A., and Cropp, R.: Effects of ocean warming and coral bleaching on aerosol emissions in the Great Barrier Reef, Australia, Sci. Rep., 8, 1–11, https://doi.org/10.1038/s41598-018-32470-7, 2018. a
Jackson, R. L., Gabric, A. J., Cropp, R., and Woodhouse, M. T.: Dimethylsulfide (DMS), marine biogenic aerosols and the ecophysiology of coral reefs, Biogeosciences, 17, 2181–2204, https://doi.org/10.5194/bg-17-2181-2020, 2020a. a
Jackson, R. L., Gabric, A. J., Woodhouse, M. T., Swan, H. B., Jones, G. B., Cropp, R., and Deschaseaux, E. S.: Coral Reef Emissions of Atmospheric Dimethylsulfide and the Influence on Marine Aerosols in the Southern Great Barrier Reef, Australia, J. Geophys. Res.-Atmos., 125, e2019JD031837, https://doi.org/10.1029/2019JD031837, 2020b. a
Jones, G. B.: Coral animals combat stress with sulphur, Nature, 502, 634–635, https://doi.org/10.1038/nature12698, 2013. a
Jones, G. B. and Trevena, A. J.: The influence of coral reefs on atmospheric dimethylsulphide over the Great Barrier Reef, Coral Sea, Gulf of Papua and Solomon and Bismarck Seas, Mar. Freshwater Res., 56, 85–93, https://doi.org/10.1071/MF04097, 2005. a
Jones, G. B., Curran, M., Broadbent, A., King, S., Fischer, E., and Jones, R. J.: Factors affecting the cycling of dimethylsulfide and dimethylsulfoniopropionate in coral reef waters of the great barrier reef, Environ. Chem., 4, 310–322, https://doi.org/10.1071/EN06065, 2007. a
Jones, G. B., Curran, M., Swan, H., and Deschaseaux, E.: Dimethylsulfide and Coral Bleaching: Links to Solar Radiation, Low Level Cloud and the Regulation of Seawater Temperatures and Climate in the Great Barrier Reef, American Journal of Climate Change, 6, 328–359, https://doi.org/10.4236/ajcc.2017.62017, 2017. a, b
Jones, G. B., Curran, M., Deschaseaux, E., Omori, Y., Tanimoto, H., Swan, H., Eyre, B., Ivey, J., McParland, E., Gabric, A., and Cropp, R.: The flux and emission of dimethylsulfide from the Great Barrier Reef region and potential influence on the climate of NE Australia, J. Geophys. Res.-Atmos., 123, 13835–13856, https://doi.org/10.1029/2018JD029210, 2018. a, b, c, d, e
Kettle, A. J. and Andreae, M.: Flux of dimethylsulfide from the oceans : A comparison of updated data sets and flux models, J. Geophys. Res., 105, 26793–26808, https://doi.org/10.1029/2000JD900252, 2000. a
Kettle, A. J., Amouroux, D., Andreae, T. W., Bates, T. S., Berresheim, H., Bingemer, H., Boniforti, R., Helas, G., Leck, C., Maspero, M., Matrai, P., McTaggart, A. R., Mihalopoulos, N., Nguyen, B. C., Novo, A., Putaud, J. P., Rapsomanikis, S., Roberts, G., Schebeske, G., Sharma, S., Simó, R., Staubes, R., Turner, S., and Uher, G.: A global data base of sea surface dimethyl sulfide (DMS) measurements and a simple model to predict sea surface DMS as a function of latitude, longitude, and month, Global Biogeochem. Cycles, 13, 399–444, 1999. a, b
King, A. D., Karoly, D. J., and Henley, B. J.: Australian climate extremes at 1.5 ∘C and 2 ∘C of global warming, Nat. Clim. Change, 7, 412–416, https://doi.org/10.1038/nclimate3296, 2017. a
Kloster, S., Six, K. D., Feichter, J., Maier-Reimer, E., Roeckner, E., Wetzel, P., Stier, P., and Esch, M.: Response of dimethylsulfide (DMS) in the ocean and atmosphere to global warming, J. Geophys. Res.-Biogeo., 112, 1–13, https://doi.org/10.1029/2006JG000224, 2007. a
Kulmala, M., Laaksonen, A., and Pirjola, L.: Parameterizations for sulfuric acid/water nucleation rates, J. Geophys. Res., 103, 8301, https://doi.org/10.1029/97JD03718, 1998. a
Lamarque, J.-F., Bond, T. C., Eyring, V., Granier, C., Heil, A., Klimont, Z., Lee, D., Liousse, C., Mieville, A., Owen, B., Schultz, M. G., Shindell, D., Smith, S. J., Stehfest, E., Van Aardenne, J., Cooper, O. R., Kainuma, M., Mahowald, N., McConnell, J. R., Naik, V., Riahi, K., and van Vuuren, D. P.: Historical (1850–2000) gridded anthropogenic and biomass burning emissions of reactive gases and aerosols: methodology and application, Atmos. Chem. Phys., 10, 7017–7039, https://doi.org/10.5194/acp-10-7017-2010, 2010. a
Lana, A., Bell, T. G., Simó, R., Vallina, S. M., Ballabrera-Poy, J., Kettle, A. J., Dachs, J., Bopp, L., Saltzman, E. S., Stefels, J., Johnson, J. E., and Liss, P. S.: An updated climatology of surface dimethlysulfide concentrations and emission fluxes in the global ocean, Global Biogeochem. Cy., 25, 1–17, https://doi.org/10.1029/2010GB003850, 2011. a, b, c, d, e, f, g, h, i, j, k
Leahy, S. M., Kingsford, M. J., and Steinberg, C. R.: Do Clouds Save the Great Barrier Reef? Satellite Imagery Elucidates the Cloud-SST Relationship at the Local Scale, PLoS ONE, 8, e70400, https://doi.org/10.1371/journal.pone.0070400, 2013. a
Liss, P. S. and Merlivat, L.: Air-Sea Gas Exchange Rates: Introduction and Synthesis, in: The Role of Air-Sea Exchange in Geochemical Cycling, edited by Buat-Ménard, P., pp. 113–127, Springer Netherlands, Dordrecht, the Netherlands, https://doi.org/10.1007/978-94-009-4738-2_5, 1986. a, b, c, d
Magnan, A. K., Colombier, M., Billé, R., Joos, F., Hoegh-Guldberg, O., Pörtner, H.-O., Waisman, H., Spencer, T., and Gattuso, J.-P.: Implications of the Paris agreement for the ocean, Nat. Clim. Change, 6, 732–735, https://doi.org/10.1038/nclimate3038, 2016. a
Mahajan, A. S., Fadnavis, S., Thomas, M. a., Pozzoli, L., Gupta, S., Royer, S.-j., Saiz-Lopez, A., and Simó, R.: Quantifying the impacts of an updated global dimethyl sulfide climatology on cloud microphysics and aerosol radiative forcing, J. Geophys. Res.-Atmos., 120, 2524–2536, https://doi.org/10.1002/2014JD022687, 2015. a
Mann, G. W., Carslaw, K. S., Spracklen, D. V., Ridley, D. A., Manktelow, P. T., Chipperfield, M. P., Pickering, S. J., and Johnson, C. E.: Description and evaluation of GLOMAP-mode: a modal global aerosol microphysics model for the UKCA composition-climate model, Geosci. Model Dev., 3, 519–551, https://doi.org/10.5194/gmd-3-519-2010, 2010. a, b, c, d, e
Mann, G. W., Carslaw, K. S., Ridley, D. A., Spracklen, D. V., Pringle, K. J., Merikanto, J., Korhonen, H., Schwarz, J. P., Lee, L. A., Manktelow, P. T., Woodhouse, M. T., Schmidt, A., Breider, T. J., Emmerson, K. M., Reddington, C. L., Chipperfield, M. P., and Pickering, S. J.: Intercomparison of modal and sectional aerosol microphysics representations within the same 3-D global chemical transport model, Atmos. Chem. Phys., 12, 4449–4476, https://doi.org/10.5194/acp-12-4449-2012, 2012. a, b
Metzger, A., Verheggen, B., Dommen, J., Duplissy, J., Prevot, A. S. H., Weingartner, E., Riipinen, I., Kulmala, M., Spracklen, D. V., Carslaw, K. S., and Baltensperger, U.: Evidence for the role of organics in aerosol particle formation under atmospheric conditions., P. Natl. Acad. Sci. USA, 107, 6646–6651, https://doi.org/10.1073/pnas.0911330107, 2010. a
Modini, R. L., Ristovski, Z. D., Johnson, G. R., He, C., Surawski, N., Morawska, L., Suni, T., and Kulmala, M.: New particle formation and growth at a remote, sub-tropical coastal location, Atmos. Chem. Phys., 9, 7607–7621, https://doi.org/10.5194/acp-9-7607-2009, 2009. a
Nishant, N., Sherwood, S. C., and Geoffroy, O.: Aerosol-induced modification of organised convection and top-of-atmosphere radiation, npj Climate and Atmospheric Science, 2, 33, https://doi.org/10.1038/s41612-019-0089-1, 2019. a
Pham, M., Muller, J. F., Brasseur, G. P., Granier, C., and Megie, G.: A three-dimensional study of the tropospheric sulfur cycle, J. Geophys. Res., 100, 26061–26092, https://doi.org/10.1029/95jd02095, 1995. a
Plaisance, L., Caley, M. J., Brainard, R. E., and Knowlton, N.: The Diversity of Coral Reefs: What Are We Missing?, PLoS ONE, 6, e25026, https://doi.org/10.1371/journal.pone.0025026, 2011. a
Quinn, P. K. and Bates, T. S.: The case against climate regulation via oceanic phytoplankton sulphur emissions, Nature, 480, 51–56, https://doi.org/10.1038/nature10580, 2011. a, b
Schwinger, J., Tjiputra, J., Goris, N., Six, K. D., Kirkevåg, A., Seland, Ø., Heinze, C., and Ilyina, T.: Amplification of global warming through pH dependence of DMS production simulated with a fully coupled Earth system model, Biogeosciences, 14, 3633–3648, https://doi.org/10.5194/bg-14-3633-2017, 2017. a
Seinfeld, J. H. and Pandis, S. N.: Atmospheric Chemistry and Physics: From Air Pollution to Climate Change, 1st edn., Wiley, New York, USA, 1998. a
Sheng, J. X., Weisenstein, D. K., Luo, B. P., Rozanov, E., Stenke, A., Anet, J., Bingemer, H., and Peter, T.: Global atmospheric sulfur budget under volcanically quiescent conditions: Aerosol-chemistry-climate model predictions and validation, J. Geophys. Res.-Atmos., 120, 256–276, https://doi.org/10.1002/2014JD021985, 2015. a
Six, K. D., Kloster, S., Ilyina, T., Archer, S. D., Zhang, K., and Maier-Reimer, E.: Global warming amplified by reduced sulphur fluxes as a result of ocean acidification, Nat. Clim. Change, 3, 975–978, https://doi.org/10.1038/nclimate1981, 2013. a
Slinn, W. G.: Predictions for particle deposition to vegetative canopies, Atmos. Environ., 16, 1785–1794, https://doi.org/10.1016/0004-6981(82)90271-2, 1982. a
Spalding, M., Burke, L., Wood, S. A., Ashpole, J., Hutchison, J., and zu Ermgassen, P.: Mapping the global value and distribution of coral reef tourism, Mar. Policy, 82, 104–113, https://doi.org/10.1016/j.marpol.2017.05.014, 2017. a
Spracklen, D. V., Pringle, K. J., Carslaw, K. S., Chipperfield, M. P., and Mann, G. W.: A global off-line model of size-resolved aerosol microphysics: II. Identification of key uncertainties, Atmos. Chem. Phys., 5, 3233–3250, https://doi.org/10.5194/acp-5-3233-2005, 2005. a
Swan, H. B., Jones, G. B., and Deschaseaux, E.: Dimethylsulfide, Climate and Coral Reef Ecosystems, in: Proceedings of the 12th International Coral Reef Symposium, edited by: Yellowlees, D. and Hughes, T. P., James Cook University, 9–13 July 2012, Cairns, QLD, Australia, 2012. a
Swan, H. B., Jones, G. B., Deschaseaux, E. S. M., and Eyre, B. D.: Coral reef origins of atmospheric dimethylsulfide at Heron Island, southern Great Barrier Reef, Australia, Biogeosciences, 14, 229–239, https://doi.org/10.5194/bg-14-229-2017, 2017. a, b
Tao, W. K., Chen, J.-P., Li, Z., Wang, C., and Zhang, C.: Impact of Aerosols on boundary layer clouds and precipitation, Rev. Geophys., 50, 2011RG000369, https://doi.org/10.1029/2011RG000369, 2012. a
Taylor, K. E., Williamson, D., and Zwiers, F. W.: AMIP Sea Surface Temperature and Sea Ice Concentration Boundary Conditions, Program for Climate Model Diagnosis & Intercomparison, available at: https://pcmdi.llnl.gov/mips/amip/details/ (last access: 16 April 2021), 2015. a
Tesdal, J.-E., Christian, J. R., Monahan, A. H., and von Salzen, K.: Sensitivity of modelled sulfate aerosol and its radiative effect on climate to ocean DMS concentration and air–sea flux, Atmos. Chem. Phys., 16, 10847–10864, https://doi.org/10.5194/acp-16-10847-2016, 2016. a
Thomas, M. A., Suntharalingam, P., Pozzoli, L., Rast, S., Devasthale, A., Kloster, S., Feichter, J., and Lenton, T. M.: Quantification of DMS aerosol-cloud-climate interactions using the ECHAM5-HAMMOZ model in a current climate scenario, Atmos. Chem. Phys., 10, 7425–7438, https://doi.org/10.5194/acp-10-7425-2010, 2010. a
Thomas, M. A., Suntharalingam, P., Pozzoli, L., Devasthale, A., Kloster, S., Rast, S., Feichter, J., and Lenton, T. M.: Rate of non-linearity in DMS aerosol-cloud-climate interactions, Atmos. Chem. Phys., 11, 11175–11183, https://doi.org/10.5194/acp-11-11175-2011, 2011. a
UNEP-WCMC, WorldFish Centre, WRI, and TNC: Global distribution of coral reefs, compiled from multiple sources including the Millennium Coral Reef Mapping Project. Version 1.3. Includes contributions from IMaRS-USF and IRD (2005), IMaRS- USF (2005) and Spalding et al. (2001)., Tech. rep., UNEP World Conservation Monitoring Centre, Cambridge, UK, 2010. a, b, c
van der Werf, G. R., Randerson, J. T., Giglio, L., van Leeuwen, T. T., Chen, Y., Rogers, B. M., Mu, M., van Marle, M. J. E., Morton, D. C., Collatz, G. J., Yokelson, R. J., and Kasibhatla, P. S.: Global fire emissions estimates during 1997–2016, Earth Syst. Sci. Data, 9, 697–720, https://doi.org/10.5194/essd-9-697-2017, 2017. a
van Vuuren, D. P., Edmonds, J., Kainuma, M., Riahi, K., Thomson, A., Hibbard, K., Hurtt, G. C., Kram, T., Krey, V., Lamarque, J. F., Masui, T., Meinshausen, M., Nakicenovic, N., Smith, S. J., and Rose, S. K.: The representative concentration pathways: An overview, Climatic Change, 109, 5–31, https://doi.org/10.1007/s10584-011-0148-z, 2011. a
Vincent, E. M., Lengaigne, M., Menkes, C. E., Jourdain, N. C., Marchesiello, P., and Madec, G.: Interannual variability of the South Pacific Convergence Zone and implications for tropical cyclone genesis, Clim. Dynam., 36, 1881–1896, https://doi.org/10.1007/s00382-009-0716-3, 2011. a
Vlahos, P. and Monahan, E. C.: A generalized model for the air-sea transfer of dimethyl sulfide at high wind speeds, Geophys. Res. Lett., 36, L21605, https://doi.org/10.1029/2009GL040695, 2009. a
Walters, D. N., Williams, K. D., Boutle, I. A., Bushell, A. C., Edwards, J. M., Field, P. R., Lock, A. P., Morcrette, C. J., Stratton, R. A., Wilkinson, J. M., Willett, M. R., Bellouin, N., Bodas-Salcedo, A., Brooks, M. E., Copsey, D., Earnshaw, P. D., Hardiman, S. C., Harris, C. M., Levine, R. C., MacLachlan, C., Manners, J. C., Martin, G. M., Milton, S. F., Palmer, M. D., Roberts, M. J., Rodríguez, J. M., Tennant, W. J., and Vidale, P. L.: The Met Office Unified Model Global Atmosphere 4.0 and JULES Global Land 4.0 configurations, Geosci. Model Dev., 7, 361–386, https://doi.org/10.5194/gmd-7-361-2014, 2014. a
Wilks, D. S.: Statistical Methods in the Atmospheric Sciences, Elsevier, 3rd edn., https://doi.org/10.1016/B978-0-12-385022-5.00026-9, 2011. a, b
Woodhouse, M. T., Carslaw, K. S., Mann, G. W., Vallina, S. M., Vogt, M., Halloran, P. R., and Boucher, O.: Low sensitivity of cloud condensation nuclei to changes in the sea-air flux of dimethyl-sulphide, Atmos. Chem. Phys., 10, 7545–7559, https://doi.org/10.5194/acp-10-7545-2010, 2010. a, b
Woodhouse, M. T., Luhar, A. K., Stevens, L., Galbally, I., Thatcher, M., Uhe, P., Noonan, J., and Molloy, S.: Australian reactive-gas emissions in a global chemistry-climate model and initial results, Air Quality and Climate Change, 49, 31–38, 2015. a
Yoch, D. C.: Dimethylsulfoniopropionate : Its Sources , Role in the Marine Food Web , and Biological Degradation to Dimethylsulfide, Appl. Environ. Microb., 68, 5804–5815, https://doi.org/10.1128/AEM.68.12.5804-5815.2002, 2002. a
Zelinka, M. D., Myers, T. A., McCoy, D. T., Po-Chedley, S., Caldwell, P. M., Ceppi, P., Klein, S. A., and Taylor, K. E.: Causes of Higher Climate Sensitivity in CMIP6 Models, Geophys. Res. Lett., 47, 1–12, https://doi.org/10.1029/2019GL085782, 2020. a
Zhang, L.: A size-segregated particle dry deposition scheme for an atmospheric aerosol module, Atmos. Environ., 35, 549–560, https://doi.org/10.1016/S1352-2310(00)00326-5, 2001. a