the Creative Commons Attribution 4.0 License.
the Creative Commons Attribution 4.0 License.
 | 12 Apr 2021
Technical note: Measurement of chemically resolved volume equivalent diameter and effective density of particles by AAC-SPAMS
Long Peng
Xubing Du
Xinming Wang
Ping'an Peng
Guoying Sheng
Size and effective density (ρe) are important properties of aerosol particles and are related to their influences on human health and the global climate. The volume equivalent diameter (Dve) is an intrinsic property that is used to evaluate particle size. Three definitions of ρe are generally used to characterize the physical property of a particle as an alternative to particle density, in which only the , defined as the ratio of particle density (ρp) to a dynamic shape factor (χ), has the characteristic of being independent of particle size. However, it is still challenging to simultaneously characterize the Dve and of aspherical particles. Here, we present a novel system that classifies particles with their aerodynamic diameter (Da) by aerodynamic aerosol classifier (AAC) and determines their vacuum aerodynamic diameter (Dva) by single-particle aerosol mass spectrometry (SPAMS) to achieve a measurement of Dve and . The reliability of the AAC-SPAMS system for accurately obtaining Dve and is verified based on the result that the deviation between the measured and theoretical values is less than 6 % for the size-resolved spherical polystyrene latex (PSL). The AAC-SPAMS system was applied to characterize the Dve and of (NH4)2SO4 and NaNO3 particles, suggesting that these particles are aspherical and their is independent of particle size. Finally, the AAC-SPAMS system was deployed in a field measurement, showing that it is a powerful technique to characterize the chemically resolved Dve and of particles in real time.
- Article
(862 KB) - Full-text XML
-
Supplement
(528 KB) - BibTeX
- EndNote


Size and particle density (ρp) are critical parameters of aerosol particles in quantifying the impact of aerosols on air quality, human health and global climate change (Buseck and Posfai, 1999; Pöschl, 2005; Pitz et al., 2003). Effective density (ρe) has been adopted to characterize the physical property of a particle as an alternative to ρp, since ρp for aspherical aerosol particles is hardly measured (Sumlin et al., 2018; Katrib et al., 2005). Size and ρe govern the transport properties of a particle both in the atmosphere and in the human respiratory system (Seinfeld and Pandis, 1998; Liu and Daum, 2008) and directly and/or indirectly influence the potential of the particle to absorb or reflect solar radiation (Tang, 1997; Zhao et al., 2019; Liu and Daum, 2008). ρe can also provide information concerning particle morphology (Yon et al., 2015) and serve as a tracer for atmospheric processing (Guo et al., 2014; Yin et al., 2015; Liu et al., 2015). However, the quantitative relationship between aerosol properties, namely size and ρe, and their effects on air quality, human health, and global climate change are not yet well understood, which is partly because important aerosol properties cannot be measured by current techniques.
1.1 Size
Size is a fundamental property of particles and can be parameterized by the physical quantity of volume equivalent diameter (Dve). Defined as the diameter of a spherical particle with the same volume as the particle (DeCarlo et al., 2004), Dve is an intrinsic physical quantity that can be used to evaluate the actual size of the particle. However, to date, atmospheric science usually describes particle size by other diameter definitions, such as the electric mobility diameter (Dm), aerodynamic equivalent diameter (Da), and vacuum aerodynamic equivalent diameter (Dva), whose relationships with Dve are shown in Eqs. (1)–(3), respectively:
where Cc(D) is the Cunningham slip correction factor, χt and χv represent the aerosol dynamic shape factor (χ) in the transition regime and in the free-molecule regime, respectively, and ρ0 represents the unit density of 1.0 g/cm3. From these definitions, it can be seen that Dm, Da, and Dva are originally derived from Dve, but in actuality they do not reflect the actual size of the aspherical particle. Meanwhile, Dve of aspherical particles cannot be easily obtained, which limits its application in the scientific community.
1.2 Effective density
At present, three definitions of ρe are introduced in atmospheric science (DeCarlo et al., 2004): the first definition () is the ratio of the measured particle mass (mp) to the particle volume (V) calculated assuming a spherical particle with a diameter equal to the measured Dm, the second definition ( is the ratio of ρp to χ (Hand and Kreidenweis, 2002), and the third definition () is the ratio of Dm and Dva, expressed in Eqs. (4)–(6), respectively.
The definitions of and can be derived into their final forms, as shown in the Eqs. (7) and (8), respectively.
Equation (7) is derived from combining Eq. (1) with Eq. (4), in which mp is equal to . The detailed derivation of Eq. (8) is presented in Schneider et al. (2006). A variety of methods are developed to characterize and , among which the more advanced methods are to achieve the measurement of the chemically resolved effective density. Combining a single-particle soot photometer (SP2) with a (volatility) tandem differential mobility analyzer ((VT)DMA) can measure the of particles mixed with soot (Y. Zhang et al., 2016; Wu et al., 2019; Han et al., 2019). The measurement of chemically resolved can be achieved by coupling a DMA with an online aerosol mass spectrometer such as the Single-Particle Laser Ablation Time-of-Flight Mass Spectrometer (SPLAT) (Zelenyuk et al., 2005, 2006; Alexander et al., 2016), aerosol mass spectrometer (AMS) (Dinar et al., 2006; Schneider et al., 2006; Kiselev et al., 2010), aerosol time-of-flight mass spectrometer (ATOFMS) (Spencer and Prather, 2006; Spencer et al., 2007), and single-particle aerosol mass spectrometry (SPAMS) (G. Zhang et al., 2016; Zhai et al., 2017). However, the and are demonstrated to have the inherent characteristic of decreasing with increasing particle size, which will be presented in a separate publication. Therefore, it will introduce systemic error when assessing the particle's impact on visibility, human health, and climate change from the physical quantities in and . In contrast, is independent of particle size. For example, for soot particles with χ of 2.5 and ρp of 1.80 g/cm3, the calculated , , and are 0.43, 0.72, and 0.45 g/cm3 at Dm of 40 nm and 0.22, 0.72, and 0.36 g/cm3 at Dm of 550 nm, respectively. The big gap between the three definitions of effective density suggests that they should be carefully treated when characterizing the particles. However, the has not been widely applied in atmospheric sciences because of the lack of measurement techniques. Previous literature has tried to retrieve the and the real part in the refractive index (n) through a fitting procedure that compares the measured light-scattering intensity of particles (Rmeas) to the theoretical values (Rtheory,test) calculated by a series of n and values (Moffet and Prather, 2005; Moffet et al., 2008; G. Zhang et al., 2016). Moffet and Prather (2005) successfully obtained for spherical particles via single-particle mass spectrometry. However, subject to the accuracy of Mie theory for the aspherical particles, dry NaCl and calcium-rich dust particles failed to fit the Rtheory,test well to Rmeas (Moffet et al., 2008). Similarly, G. Zhang et al. (2016) failed to simultaneously retrieve and n for (NH4)2SO4 and NaNO3 particles. To the best of our knowledge, there is no appropriate technique to achieve the measurement of for aspherical particles.
The aim of the present work is to develop a method to simultaneously obtain Dve and for aspherical particles. For simplicity, the symbol ρe in the following text refers to the definition of . The established system of aerodynamic aerosol classifier single-particle aerosol mass spectrometry (AAC-SPAMS) is capable of characterizing the Da and Dva of particles, which can be applied to theoretically derive Dve and ρe. To verify the reliability of the AAC-SPAMS system, we apply it to measure the Dve and ρe of the spherical particles of polystyrene latex (PSL). The results are in good agreement with the theoretical values. Finally, the AAC-SPAMS system is applied to measure the Dve and ρe for (NH4)2SO4 and NaNO3 particles and for the chemically resolved atmospheric particles.
2.1 Measurement system
Figure 1 shows a schematic diagram of the AAC-SPAMS system. The particles are first dried by a diffusion drying tube (TSI 9302, USA), classified by AAC (Cambustion Ltd., UK) based on the Da, and then transported into SPAMS, where the Dva and the mass spectra of individual particles are obtained. The working principle of the AAC is described in detail elsewhere (Tavakoli and Olfert, 2013). AAC consists of two coaxial cylinders that rotate at the same rotational speed. Polydisperse particles enter into the space between the cylinders (i.e., the classification column) and experience a centrifugal force that causes them to move toward the outer cylinder. The particles to be classified can leave the classification column with the particle-free sheath flow and finally exit the AAC with the sample flow. Thus, the Da values of classified particles can be derived from their relationship with their relaxation time (τ), as shown in Eq. (9):
where μ is the gas dynamic viscosity. Particles with large relaxation times impact and adhere to the outer cylinder, while particles with small relaxation times exit the classifier with the exhaust flow. In this study, the exhaust flow from the AAC was about 0.3 L/min, and the size resolution parameter of the AAC was set as 40.
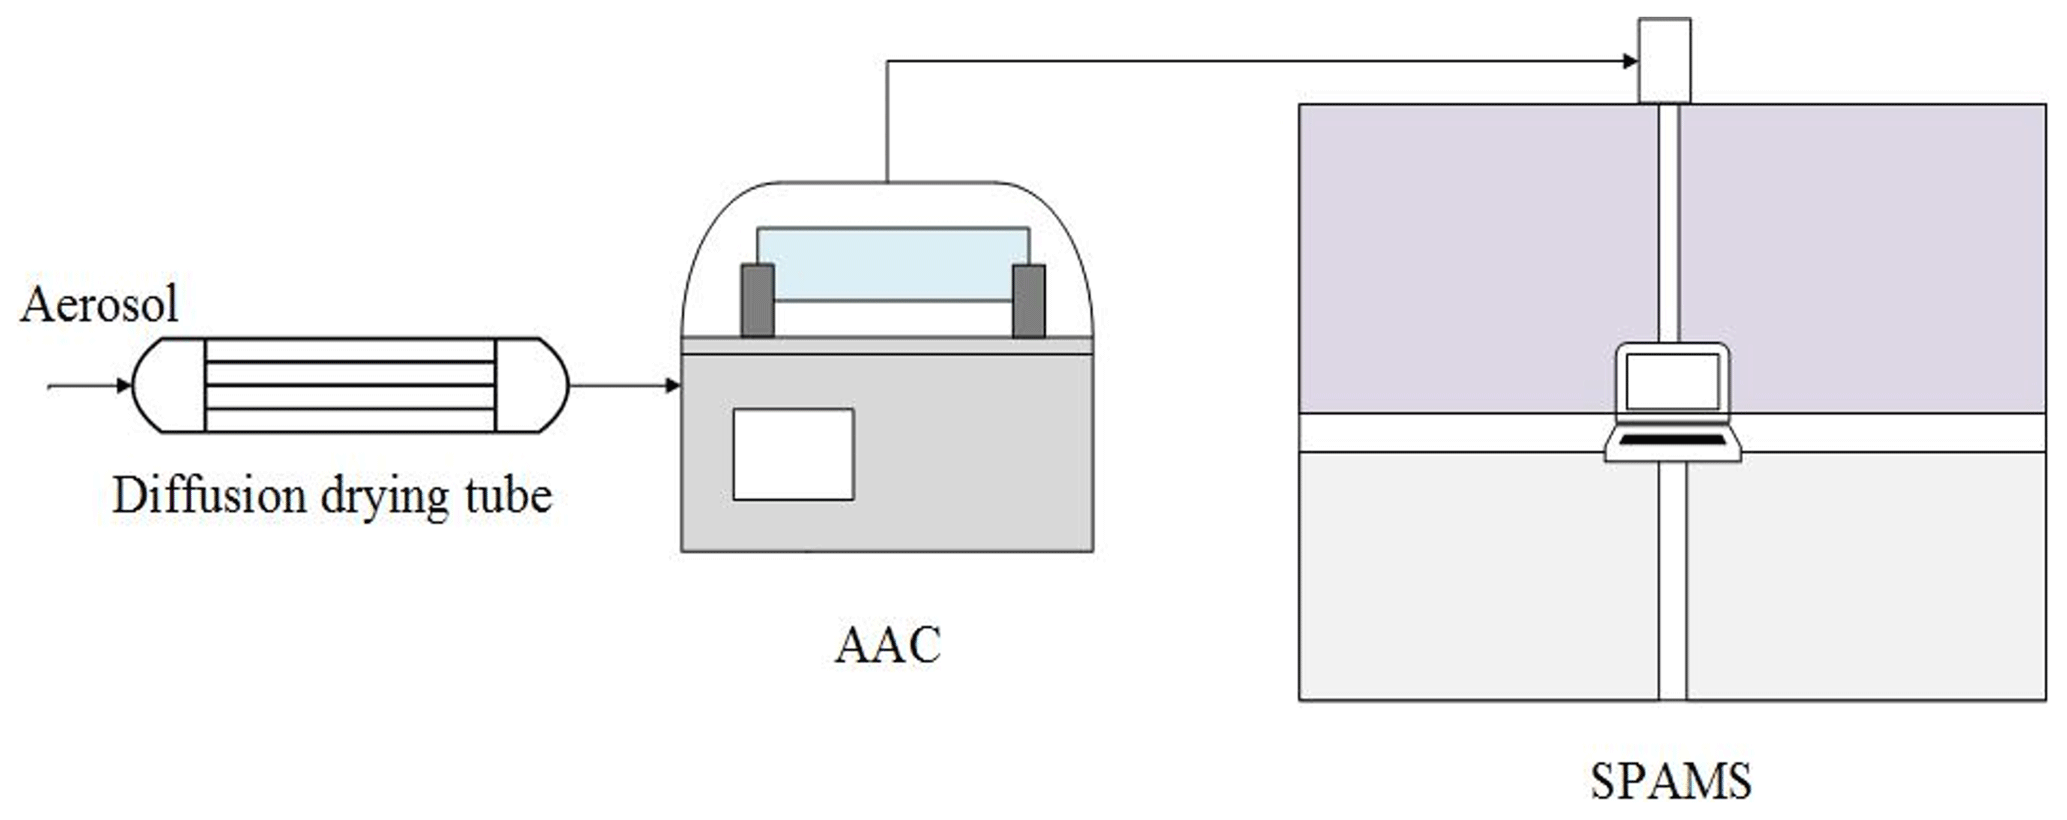
Figure 1Schematic diagram of the AAC-SPAMS system (0.3 L/min). The diffusion drying tube is filled with orange silica gel, which reduces the RH to 5 %–15 %.
Detailed information about the operation of SPAMS (Hexin Analytical Instrument Co., Ltd., China) is given elsewhere (Li et al., 2011). Briefly, the particles are introduced into the vacuum system through a 0.1 mm critical orifice and are gradually collimated into a beam in the aerodynamic lens. Two continuous diode Nd:YAG laser beams (532 nm) are used to aerodynamically size the particles, which are subsequently desorbed and ionized by a pulsed laser (266 nm) that is triggered based on the velocity of a specific particle. The generated positive and negative ions are recorded with the corresponding particle size. The Dva of the particle is related to the transit time between the two laser beams (532 nm) in SPAMS, which can be obtained by using a calibration curve generated from the measured transit times of a PSL series with predefined sizes (nominal diameters).
2.2 Laboratory experiments
Dried spherical PSL (Nanosphere Size Standards, Duke Scientific Corp., Palo Alto) (ρp=1.055 g/cm3 and χ=1.0) with Dve values of 203±5, 310±6, 510±5, and 740±6 nm were used in the AAC-SPAMS system, and the Dve was verified by Scanning Mobility Particle Sizer (Model 3938, TSI Inc., USA). The PSL particles were first classified by AAC, and then their Dva values were obtained by SPAMS. ACC-SPAMS was also applied to the particles of (NH4)2SO4 (ρp=1.77 g/cm3) and NaNO3 (ρp=2.26 g/cm3) with Da values of 250.0, 350.0, 450.0, and 550.0 nm. Besides, to obtain the measurement uncertainty of the AAC, the Da values of these PSL particles were measured to be 212.8±0.2, 324.7±0.4, 529.9±0.4, and 767.5±0.4 by the system of AAC condensation particle counter (CPC), respectively. It shows that the AAC has the deviations of 1.1 %, 1.3 %, 0.8 %, and 0.7 % for determining the Da values of the particles.
2.3 Ambient sampling
For field observations, the AAC-SPAMS system was deployed in Science and Technology Enterprise Accelerator A2 Block, Guangzhou, China, to characterize the Dve, ρe, and chemical compositions of aerosol particles. The sampling inlet was hung 2.5 m from the third floor (∼ 12 m above ground level). Ambient aerosol particles were introduced into the AAC through a 5 m long conductive silicone tube with an inner diameter of 6 mm and a PM2.5 cyclone inlet. The sampling flow from the PM2.5 cyclone inlet was 3 L/min, and the residence time in the conductive silicone tube was approximately 5 s. Particles with the Da of 250.0, 350.0, 450.0, and 550.0 nm were classified by the AAC. The sampling time for the particles of each Da was approximately 10 min. From 6–8 July 2019, approximately 129 869 ionized particles were obtained from nine rounds of measurement. The sampling details are shown in Table S1 in the Supplement. The number of ionized particles with the Da of 250.0, 350.0, 450.0, and 550.0 nm is 35 609, 38 374, 31 910, and 23 976, respectively. The sampled ∼ 100 000 particles are first classified by using an adaptive resonance theory neural network (ART-2a) (Song et al., 1999) with a vigilance factor of 0.75, a learning rate of 0.05, and 20 iterations.
2.4 Theoretical derivation of Dve and ρe from Da and Dva
In this study, the calculations of Dve and ρe for unknown particles are theoretically derived from Da and Dva. Combining Eqs. (2) and (3), we obtain Eq. (10):
Based on the approximation between χv and χt () (DeCarlo et al., 2004), Eq. (10) becomes Eq. (11):
The Cunningham slip correction factor is calculated by Eq. (12) (Peng and Bi, 2020):
where λ is the mean free path of the gas molecules and A, B, and C are empirically determined constants specific to the analysis system. The values of A, B ,and C are 2.33, 0.966, and −0.498 provided by the manual of the AAC, respectively. Substituting Eq. (12) into Eq. (11) obtains Eq. (13).
If the Da and Dva of an unknown particle can be measured, its Dve could be calculated according to Eq. (13). Finally, the ρe value of the particles is calculated by the Dva and Dve values according to Eq. (14), which is obtained by combining Eqs. (3) and (5):
Thus, we can obtain both the Dve and ρe values of unknown particles based on the Da and Dva values. Because the AAC and SPAMS instruments have the ability to determine Da and Dva, the AAC-SPAMS system developed in this study can be used to obtain the Dve and ρe values for unknown particles.
3.1 Verification of the AAC-SPAMS system to obtain Dve and ρe
The Dva distribution of PSL particles with predefined Dve values after being screened by the AAC is shown in Fig. S1 in the Supplement. Gaussian fitting is used to obtain the peak Dva for each size PSL with R2 fitting coefficient over 0.98. Each fitting has a full width at half maximum (FWHM) of 6.6 %, 4.4 %, 2.3 %, and 2.2 %, and the corresponding peaks are 215.8, 319.0, 532.1, and 803.5 nm, respectively. Substituting the Da and Dva values of PSL into Eq. (11), the measured Dve(Dve,me) of PSL from the AAC-SPAMS system is 203.6, 309.7, 511.6, and 737.2 nm, respectively (Fig. 2a). Thus, the deviations between the theoretical Dve (Dve,th) and Dve,me values are 0.3 %, −0.1 %, 0.3 %, and −0.4 %, respectively. On the other hand, the measured ρe(ρe,me) values of the particles, calculated from the Dva and Dve,me values with Eq. (14), are 1.1, 1.0, 1.0, and 1.1 g/cm3, respectively (Fig. 2b). Comparing to the theoretical ρe(ρe,th) (i.e., 1.055 g/cm3 of PSL particles), the deviations of ρe,me are determined to be 4.3 %, −5.2 %, −5.2 %, and 4.3 %, respectively. That is, the deviations of Dve,me and ρe,me obtained by the AAC-SPAMS system are within 1 % and 6 %, respectively.

Figure 2(a) Comparison between the measured Dve(Dve,me) and the theoretical Dve(Dve,th) of the PSL particles. (b) Comparison between the measured ρe (ρe,me) and the theoretical ρe (ρe,th) of the PSL particles.
3.2 Application of the AAC-SPAMS system for obtaining Dve and ρe of (NH4)2SO4 and NaNO3
Figure S2 shows the Dva distributions of (NH4)2SO4 and NaNO3 particles with Da values of 250.0, 350.0, 450.0, and 550.0 nm screened by the AAC. The Dva peaks are obtained by Gaussian fitting, with R2 values over 0.93 and FWHM values ranging from 7.6 % to 10.6 %. The (NH4)2SO4 particles have Dva values of 300.0, 418.0, 551.1, and 695.1 nm (Fig. S2), which correspond to particles possessing Dve,me values of 177.3, 254.4, 331.8, and 409.3 nm, respectively, according to Eq. (11). Substituting the values of Dva and Dve,me into Eq. (12), the ρe,me values are 1.7, 1.6, 1.6, and 1.7 g/cm3 (Fig. 3a), respectively. Similarly, the selected NaNO3 particles are determined to have Dva values of 321.0, 454.9, 599.8, and 755.3 nm (Fig. S2), corresponding to Dve,me values of 150.1, 218.2, 287.0, and 355.9 nm, respectively. The ρe,me values of the NaNO3 particles are 2.2, 2.0, 2.0, and 2.1 g/cm3 (Fig. 3b), respectively. Figure 3 also shows that the ρe,me values of the NaNO3 and (NH4)2SO4 particles with different Da deviate from their average values with the maximum of 5.9 % and 4.8 %, respectively, which are identical with the deviation for the ρe,me of PSL particles. These deviations may be derived from the calibration of particle Dva from the SPAMS. While the R2 of size calibration curve is 0.999, the curve of exponential function is found to slightly deviate from the data points measured by SPAMS. For example, the size calibration function produces the deviation of −4.4 % and 3.1 % from the data points of 310 and 740 nm, respectively.
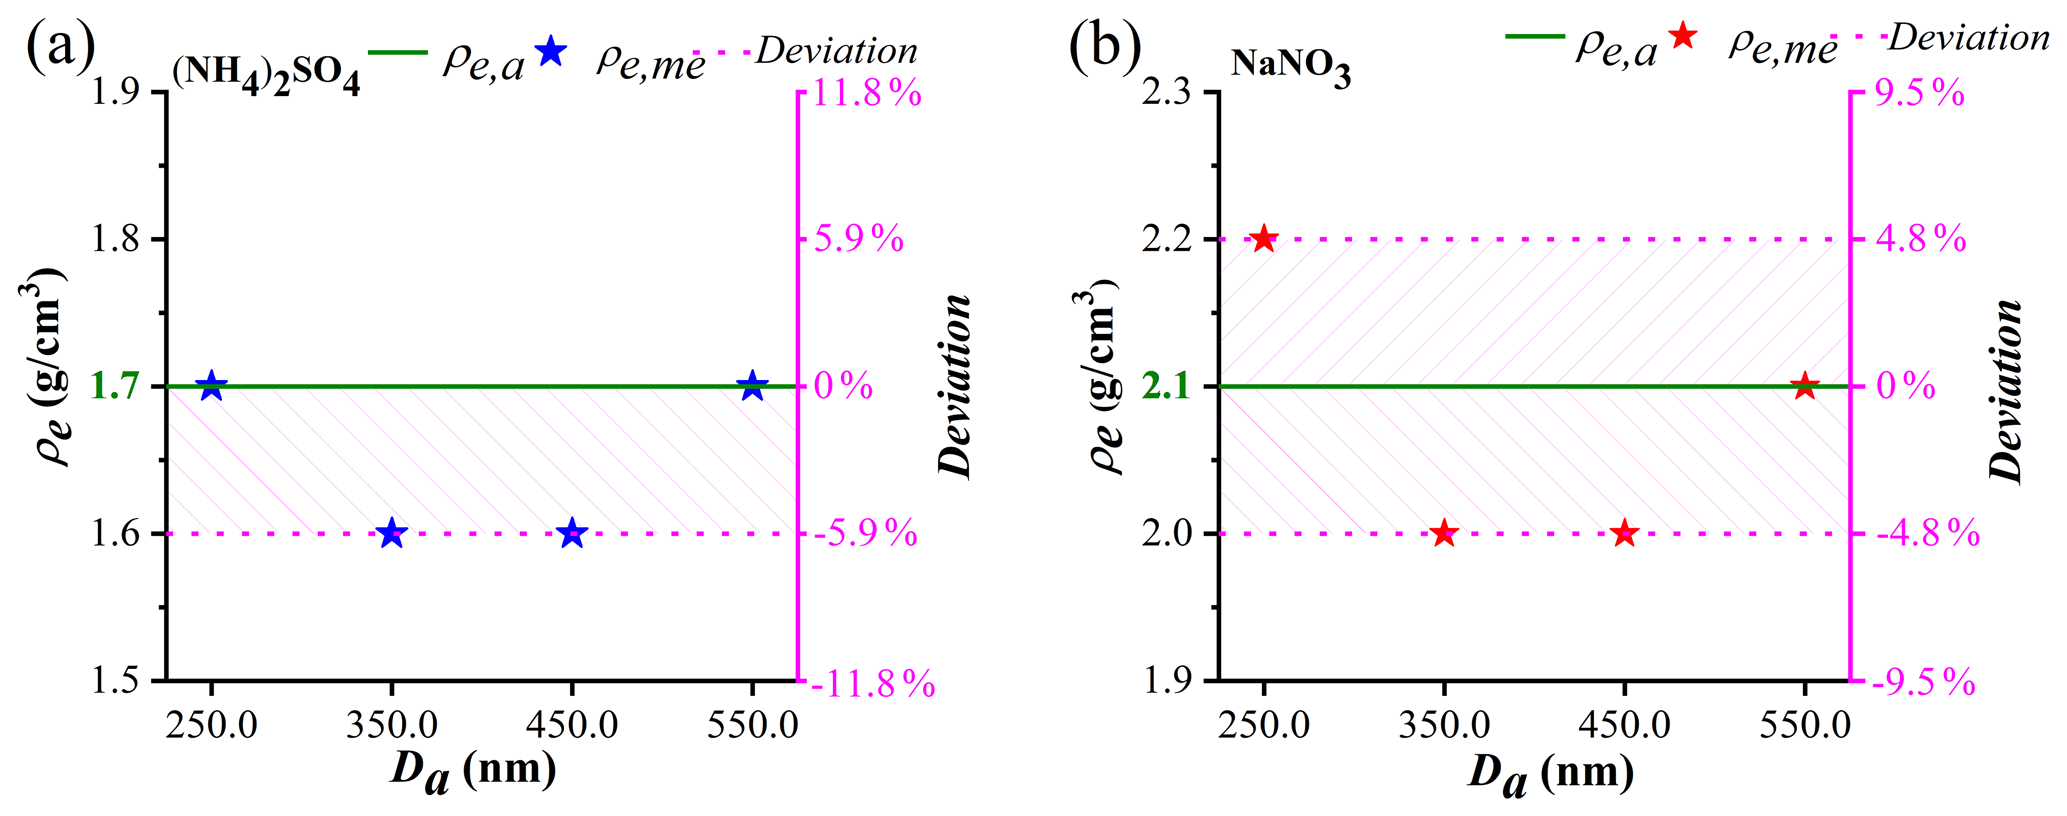
Figure 3(a) Comparison between the measured ρe (ρe,me) and average ρe (ρe,a) values of the (NH4)2SO4 particles. (b) Comparison between the measured ρe (ρe,me) and average ρe (ρe,a) values of the NaNO3 particles.
Taking the systematic error into account, the slight difference of the ρe,me values for the four sizes suggests that the ρe of (NH4)2SO4 and NaNO3 particles is independent of particle size from 250.0 to 550.0 nm. It is determined by the definition of effective density used in this study, which keeps constant as long as the χa of the particles does not change with particle size for pure compound. The average ρe,me values of (NH4)2SO4 and NaNO3 particles are calculated to be 1.7±0.1 and 2.1±0.1 g/cm3, which are lower than the ρp of (NH4)2SO4 (1.77 g/cm3) and NaNO3 (2.27 g/cm3). This is partly caused by the χa, which can be used to parameterize the morphology. According to Eq. (14), the χa with different Da are calculated to be 1.04, 1.11, 1.11, and 1.04 for (NH4)2SO4 particles and 1.03, 1.14, 1.14, and 1.08 for NaNO3 particles. Thus, the average χa values of the (NH4)2SO4 and NaNO3 particles are determined to be 1.07±0.04 and 1.10±0.05, respectively, indicating that these particles are aspherical.
The asphericity of (NH4)2SO4 determined by AAC-SPAMS system is consistent with the previous studies reporting that the χa of (NH4)2SO4 were larger than the value of 1.03 (Zelenyuk et al., 2006; Beranek et al., 2012; G. Zhang et al., 2016). However, previous studies found that the NaNO3 particles had different morphology. G. Zhang et al. (2016) observed that NaNO3 had the χa of 1.09–1.13, while Hoffman et al. (2004) found that NaNO3 particle had a round droplet-like shape even at 15 % RH, supported by the consistency between the measured value of “anhydrous” droplet density and the calculated value of “anhydrous” solution droplet (Zelenyuk et al., 2005). Eclectically, Tang and Munkelwitz (1994) studied that most of the NaNO3 particles crystallized between 20 % and 30 % RH but some persisted down to 10 % RH to keep solution droplets. Notably, the spherical NaNO3 particles at low RH observed by Hoffman et al. (2004) were dried in the sticky carbon tape, which might affect the phase transition of droplet-like NaNO3 particles. In this study, most NaNO3 particles might crystallize because the RH of the aerosol flow carrying the NaNO3 particles was reduced to below 20 % through the diffusion drying tube. The asphericity of the crystallized NaNO3 particles is supported by their FWHM values of the Dva distributions, which are consistent with that of aspherical (NH4)2SO4 (Figs. S1 and S2).
Table 1The measured mean Dve and its standard deviation for the eight particle types at Da values of 250.0, 350.0, 450.0, and 550.0 nm from nine rounds of measurements.
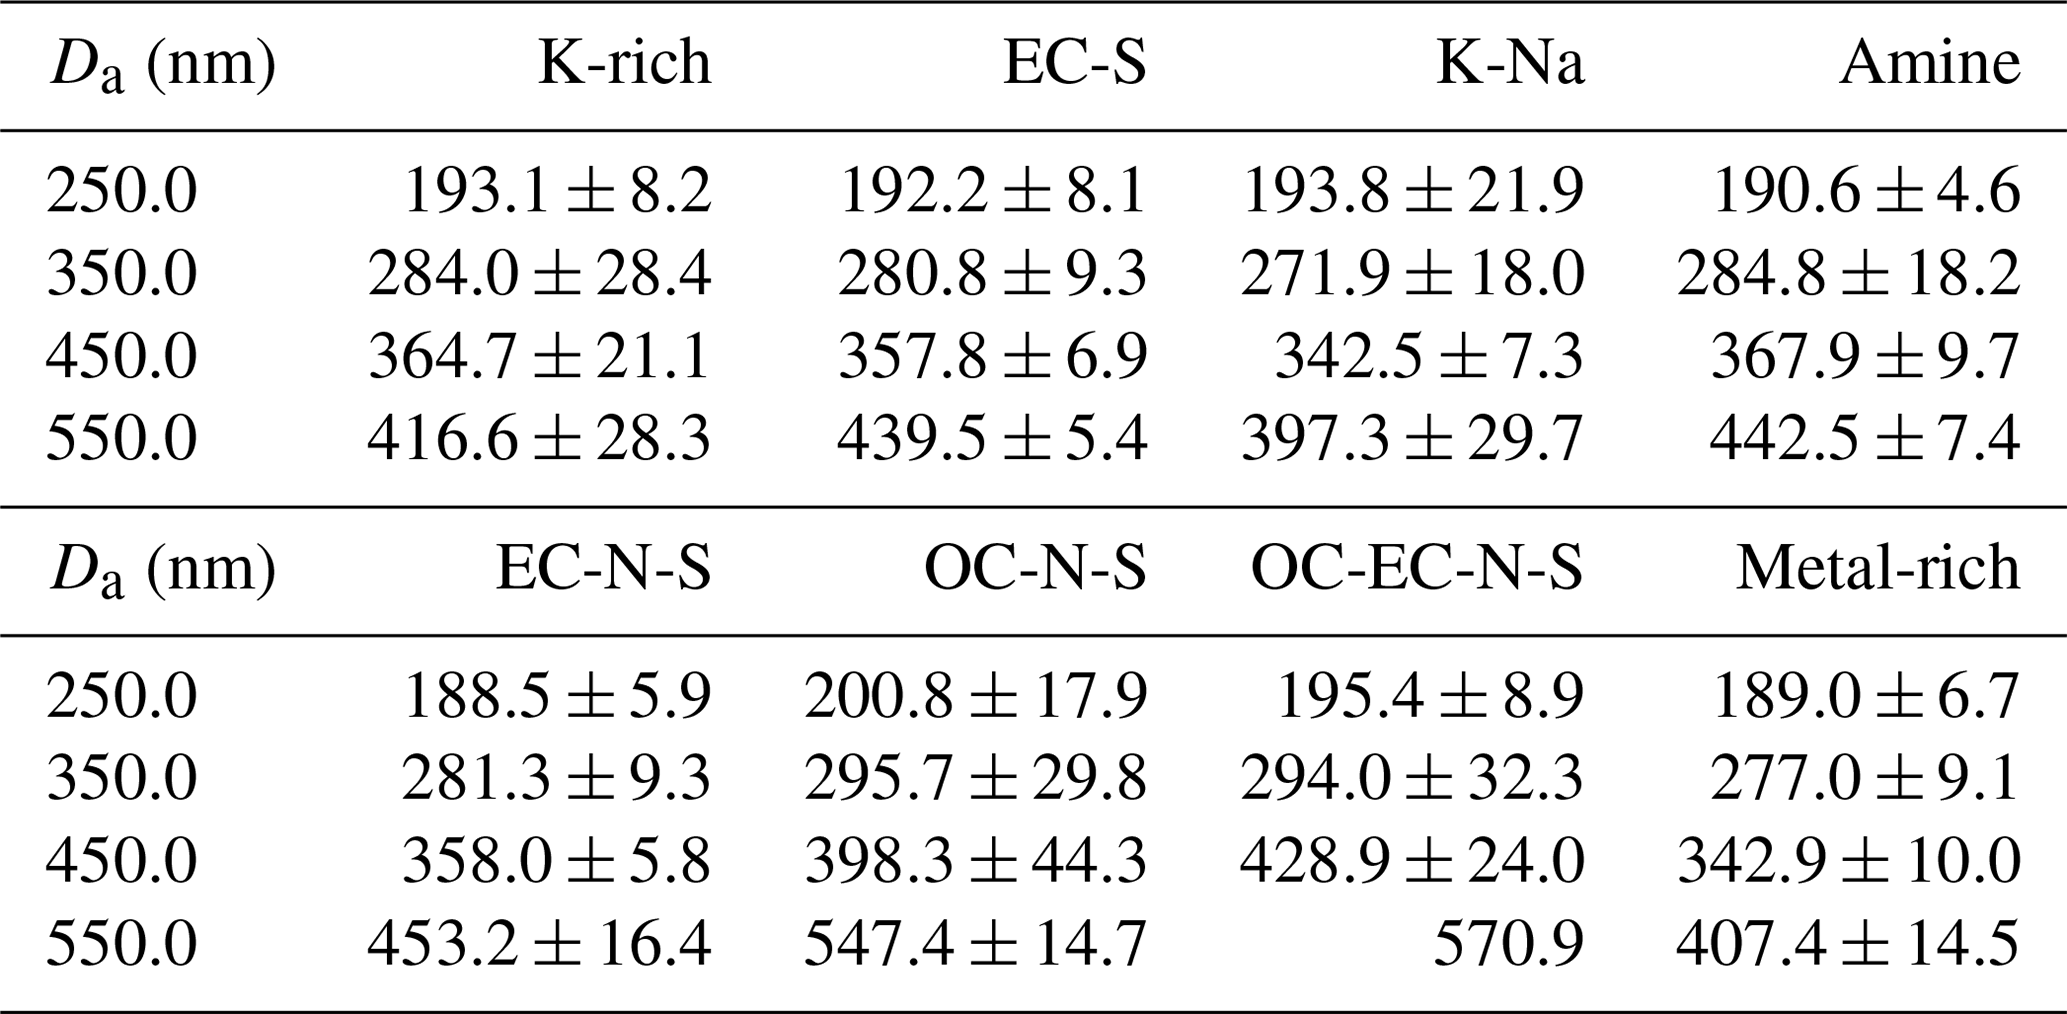
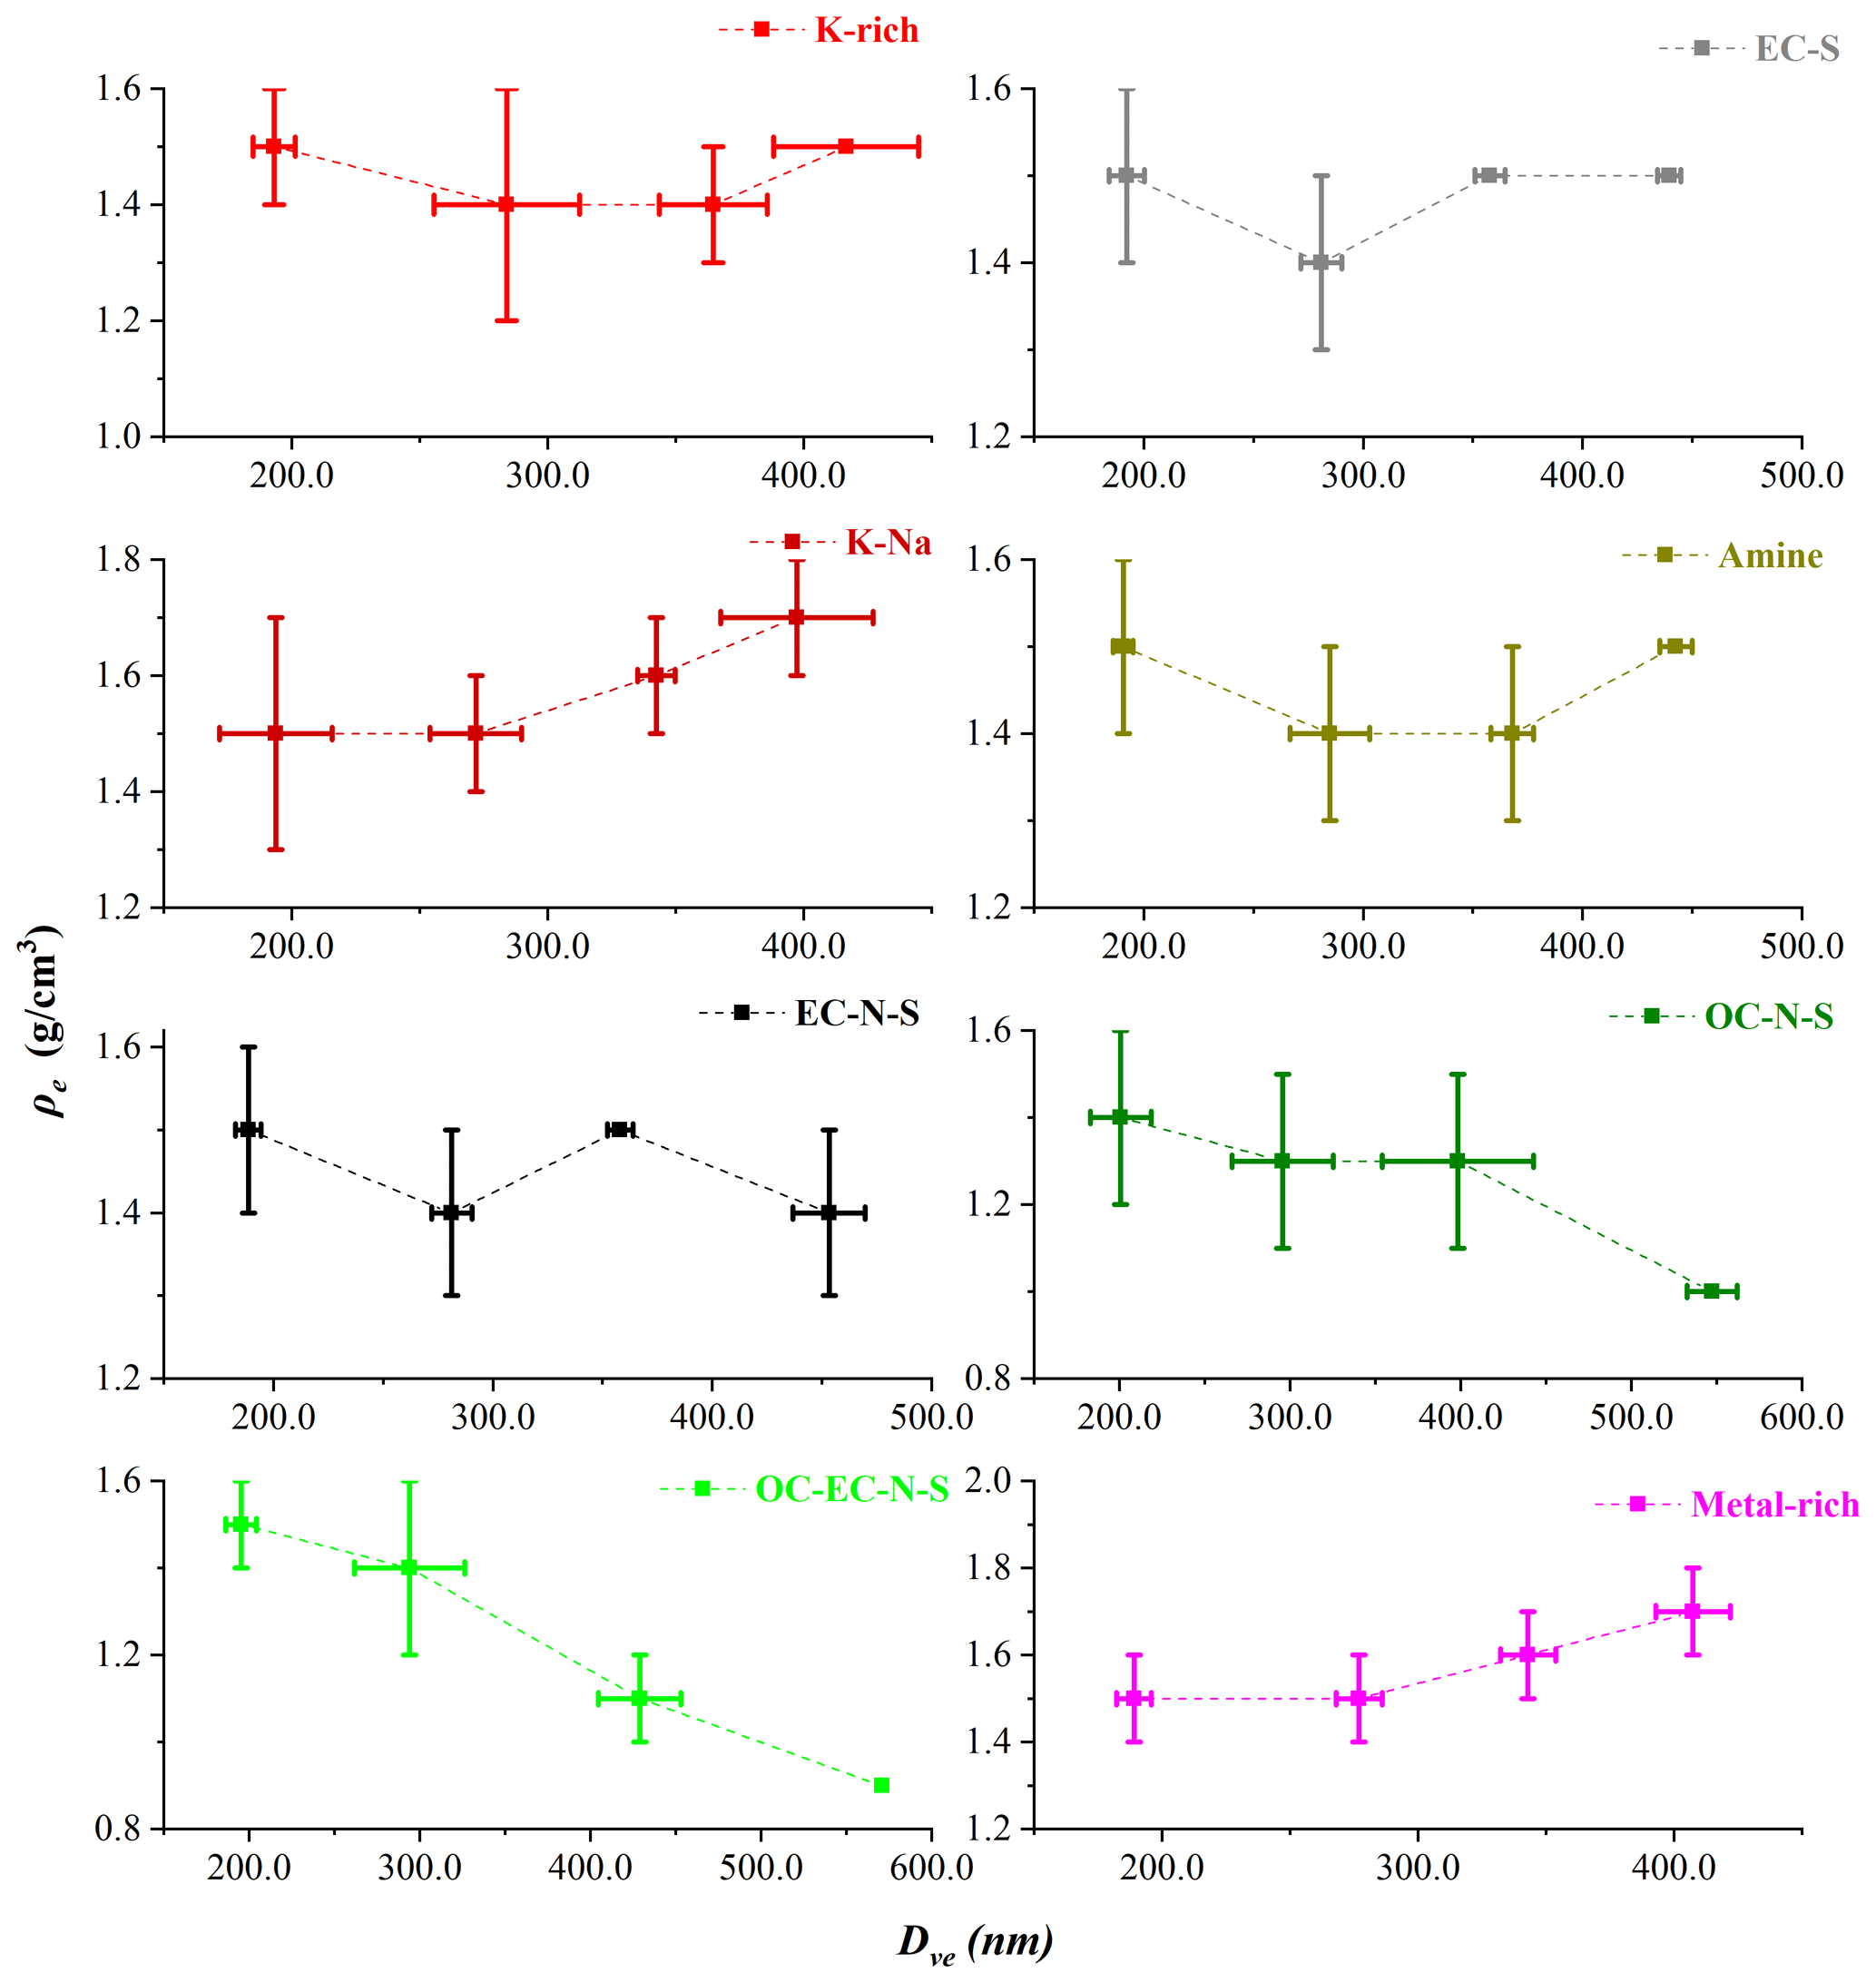
Figure 4Variation in ρe of the eight particle types with Dve. The solid lines represent the range of the ρe and Dve measured from nine rounds, and the data points stand for the average values.
3.3 Application of the AAC-SPAMS system for measuring the chemically resolved Dve and ρe
SPAMS can obtain information on the chemical composition of individual particles, implying that the AAC-SPAMS system has the ability to simultaneously characterize Dve, ρe, and the chemical compositions of particles in real time. It is worth noting that the freshly emitted soot particles exhibit the largest χ (∼ 2.5) in the actual atmosphere (Peng et al., 2016). It meets the upper limit for the approximation between the χt and χv (DeCarlo et al., 2004).
As an example, the AAC-SPAMS system was deployed in the field to obtain the chemically resolved Dve and ρe values for unknown aerosol particles. The sampled ∼ 100 000 particles are classified into eight major particle types with distinct chemical compositions: K-rich, EC-S, K-Na, amine, EC-N-S, OC-N-S and OC-EC-N-S, and Metal-rich, representing 97 % of the detected particle population. Details of the chemical composition and number fraction of the eight types of particles are presented in the Figs. S3 and S4, respectively, which are discussed in the Supplement.
We used Gaussian fitting to obtain the Dva peaks for each particle type with Da values of 250.0, 350.0, 450.0, and 550.0 nm. Following this, we calculated the Dve values of the atmospheric particles with Eq. (11). Table 1 presents the average Dve values of the eight particle types, for which the standard deviation is calculated based on nine samples. The average Dve at Da values of 250.0, 350.0, 450.0, and 550.0 nm shows wide ranges: from 188.5 to 200.8, 271.9 to 295.7, 342.5 to 428.9, and 397.3 to 570.9 nm, respectively, which are caused by the different chemical composition. The result indicates that particles with significantly different Dve might possess the same Da. Furthermore, the large standard deviation of Dve, such as 21.9 nm for K-Na at 250.0 nm, 32.3 nm for OC-EC-N-S at 350.0 nm, and 44.3 nm for OC-N-S at 450.0 nm, indicates that the Dve of particles is remarkably different even for particles with the same type and same Da.
According to Dve and Dva, we calculated the ρe of each particle type by Eq. (12). Figure 4 shows the variations of the ρe with Dve for nine particle samples. For pure compounds, such as (NH4)2SO4 and NaNO3 particle, ρe theoretically does not change with particle size. However, the sampled particles have experienced complex atmospheric processes. Therefore, ρe has a very wide distribution for each type of particles with a similar Dve. Specifically, the ρe of K-Na increases with Dve, while the ρe of OC-N-S and OC-EC-N-S decreases with Dve, which may be influenced by the particle shape or the material density. Additionally, the average ρe of each type of particle is in the order from small to large: 1.2±0.2 g/cm3 for OC-EC-N-S, 1.3±0.2 g/cm3 for OC-N-S, 1.4±0.1 g/cm3 for K-rich, 1.4±0.1 g/cm3 for amine, 1.5±0.1 g/cm3 for EC-N-S, 1.5±0.1 g/cm3 for EC-S, 1.6±0.1 g/cm3 for K-Na, and 1.6±0.1 g/cm3 for Metal-rich. It is reasonable to find that the average ρe of internally mixed particles distributes in the range of their material densities (ρm). For instance, the OC-EC-N-S, OC-N-S, K-rich, and amine particles, mainly comprised of internally mixed sulfate and organics, have the average ρe between that of sulfate with ρm of 1.77 g/cm3 and organic aerosols with ρm of 1.2 g/cm3 (Cross et al., 2007).
We develop an AAC-SPAMS system to first achieve the measurement of the Dve and ρe (defined as the ratio of ρp to χ) of the aspherical particles through characterizing their Da and Dva. The reliability of the AAC-SPAMS system is verified by accurately measuring the Dve and ρe of PSL. Applying the AAC-SPAMS system to determine theDve and ρe of (NH4)2SO4 and NaNO3 particles shows that these particles are aspherical and their ρe are independent of particle size. Coupled with the ability of SPAMS to characterize the chemical composition of individual particles, the AAC-SPAMS system is demonstrated to be capable of characterizing the Dve, and chemical compositions of atmospheric particles simultaneously, showing the potential application of this system in field observations. The approach achieves the measurement of chemically resolved Dve and and provides the possibility to determine their quantitative relationship with other particle properties, which would be a benefit for further reduction of the uncertainty associated with the effects of particles on air quality, human health, and radiative forcing.
Data in this study are available at https://doi.org/10.5281/zenodo.4655206 (Peng, 2021).
The supplement related to this article is available online at: https://doi.org/10.5194/acp-21-5605-2021-supplement.
The idea for the study was conceived by LP and GHZ. All experiments were performed by LP with the assistance of LL. LP wrote the paper, which was reviewed by GHZ and XHB. All co-authors discussed the results and commented on the manuscript.
The authors declare that they have no conflict of interest.
The authors gratefully acknowledge Cambustion Ltd., UK, for providing the AAC and Hexin Analytical Instrument Co., Ltd., China, for providing the SPAMS. This is contribution no. IS-2995 from CASGIG.
This research has been supported by the National Nature Science Foundation of China (grant nos. 41877307 and 41775124), the Natural Science Foundation of Guangdong Province (grant no. 2019B151502022), and the Guangdong Foundation for the Program of Science and Technology Research (grant nos. 2019B121205006 and 2020B1212060053).
This paper was edited by James Allan and reviewed by Johannes Schneider and one anonymous referee.
Alexander, J. M., Bell, D. M., Imre, D., Kleiber, P. D., Grassian, V. H., and Zelenyuk, A.: Measurement of size-dependent dynamic shape factors of quartz particles in two flow regimes, Aerosol Sci. Tech., 50, 870–879, https://doi.org/10.1080/02786826.2016.1200006, 2016.
Beranek, J., Imre, D., and Zelenyuk, A.: Real-time shape-based particle separation and detailed in situ particle shape characterization, Anal. Chem., 84, 1459–1465, https://doi.org/10.1021/ac202235z, 2012.
Buseck, P. R. and Posfai, M.: Airborne minerals and related aerosol particles: effects on climate and the environment, P. Natl. Acad. Sci. USA, 96, 3372–3379, https://doi.org/10.1073/pnas.96.7.3372, 1999.
Cross, E. S., Slowik, J. G., Davidovits, P., Allan, J. D., Worsnop, D. R., Jayne, J. T., Lewis, D. K., Canagaratna, M., and Onasch, T. B.: Laboratory and ambient particle density determinations using light scattering in conjunction with aerosol mass spectrometry, Aerosol Sci. Tech., 41, 343–359, https://doi.org/10.1080/02786820701199736, 2007.
DeCarlo, P. F., Slowik, J. G., Worsnop, D. R., Davidovits, P., and Jimenez, J. L.: Particle morphology and density characterization by combined mobility and aerodynamic diameter measurements. Part 1: Theory, Aerosol Sci. Tech., 38, 1185–1205, https://doi.org/10.1080/027868290903907, 2004.
Dinar, E., Mentel, T. F., and Rudich, Y.: The density of humic acids and humic like substances (HULIS) from fresh and aged wood burning and pollution aerosol particles, Atmos. Chem. Phys., 6, 5213–5224, https://doi.org/10.5194/acp-6-5213-2006, 2006.
Guo, S., Hu, M., Zamora, M. L., Peng, J. F., Shang, D. J., Zheng, J., Du, Z. F., Wu, Z., Shao, M., Zeng, L. M., Molina, M. J., and Zhang, R. Y.: Elucidating severe urban haze formation in China, P. Natl. Acad. Sci. USA, 111, 17373–17378, 2014.
Han, C., Li, S. M., Liu, P., and Lee, P.: Size dependence of the physical characteristics of particles containing refractory black carbon in diesel vehicle exhaust, Environ. Sci. Technol., 53, 137–145, https://doi.org/10.1021/acs.est.8b04603, 2019.
Hand, J. L. and Kreidenweis, S. M.: A new method for retrieving particle refractive index and effective density from aerosol size distribution data, Aerosol Sci. Tech., 36, 1012–1026, https://doi.org/10.1080/02786820290092276, 2002.
Hoffman, R. C., Laskin, A., and Finlayson-Pitts, B. J.: Sodium nitrate particles: physical and chemical properties during hydration and dehydration, and implications for aged sea salt aerosols, J. Aerosol Sci., 35, 869–887, 2004.
Katrib, Y., Martin, S. T., Rudich, Y., Davidovits, P., Jayne, J. T., and Worsnop, D. R.: Density changes of aerosol particles as a result of chemical reaction, Atmos. Chem. Phys., 5, 275–291, https://doi.org/10.5194/acp-5-275-2005, 2005.
Kiselev, A., Wennrich, C., Stratmann, F., Wex, H., Henning, S., Mentel, T. F., Kiendler-Scharr, A., Schneider, J., Walter, S., and Lieberwirth, I.: Morphological characterization of soot aerosol particles during LACIS Experiment in November (LExNo), J. Geophys. Res.-Atmos., 115, D11204, https://doi.org/10.1029/2009jd012635, 2010.
Li, L., Huang, Z. X., Dong, J. G., Li, M., Gao, W., Nian, H. Q., Fu, Z., Zhang, G. H., Bi, X. H., Cheng, P., and Zhou, Z.: Real time bipolar time-of-flight mass spectrometer for analyzing single aerosol particles, Int. J. Mass Spectrom., 303, 118–124, https://doi.org/10.1016/j.ijms.2011.01.017, 2011.
Liu, Y. and Daum, P. H.: Relationship of refractive index to mass density and self-consistency of mixing rules for multicomponent mixtures like ambient aerosols, J. Aerosol Sci., 39, 974–986, https://doi.org/10.1016/j.jaerosci.2008.06.006, 2008.
Liu, Z., Hu, B., Ji, D., Wang, Y., Wang, M., and Wang, Y.: Diurnal and seasonal variation of the PM2.5 apparent particle density in Beijing, China, Atmos. Environ., 120, 328–338, https://doi.org/10.1016/j.atmosenv.2015.09.005, 2015.
Moffet, R. C. and Prather, K. A.: Extending ATOFMS measurements to include refractive index and density, Anal. Chem. 77, 6535–6541, https://doi.org/10.1021/ac0503097, 2005.
Moffet, R. C., Qin, X., Rebotier, T., Furutani, H., and Prather, K. A.: Chemically segregated optical and microphysical properties of ambient aerosols measured in a single-particle mass spectrometer, J. Geophys. Res.-Atmos., 113, D12213, https://doi.org/10.1029/2007jd009393, 2008.
Peng, J. F., Hu, M., Guo, S., Du, Z. F., Zheng, J., Shang, D. J., Zamora, M., Zeng, L. M., Shao, M., Wu, Y. S., Zheng, J., Wang, Y., Glen, C., Collins, D., Molina, M., and Zhang, R. Y.: Markedly enhanced absorption and direct radiative forcing of black carbon under polluted urban environments, P. Natl. Acad. Sci. USA, 113, 4266–4271, https://doi.org/10.1073/pnas.1602310113, 2016.
Peng, L.: longer1217/All-figures-data: Data (Version V1), Zenodo, https://doi.org/10.5281/zenodo.4655206, 2021.
Peng, L. and Bi, X.: Comment on “Retrieval of atmospheric fine particulate density based on merging particle size distribution measurements: multi-instrument observation and quality control at Shouxian” by Li et al, J. Geophys. Res.-Atmos., 125, e2019JD031806, https://doi.org/10.1029/2019JD031806, 2020.
Pitz, M., Cyrys, J., Karg, E., Wiedensohler, A., Wichmann, H. E., and Heinrich, J.: Variability of apparent particle density of an urban aerosol, Environ. Sci. Technol., 37, 4336–4342, https://doi.org/10.1021/es034322p, 2003.
Pöschl, U.: Atmospheric aerosols: Composition, transformation, climate and health effects, Angew. Chem. Int. Edit., 44, 7520–7540, https://doi.org/10.1002/anie.200501122, 2005.
Schneider, J., Weimer, S., Drewnick, F., Borrmann, S., Helas, G., Gwaze, P., Schmid, O., Andreae, M. O., and Kirchner, U.: Mass spectrometric analysis and aerodynamic properties of various types of combustion-related aerosol particles, Int. J. Mass Spectrom., 258, 37–49, https://doi.org/10.1016/j.ijms.2006.07.008, 2006.
Seinfeld, J. and Pandis, S. N.: From air pollution to climate change, Atmospheric Chemistry and Physics, Wiley, New York, 429–443, 1998.
Song, X. H., Hopke, P. K., Fergenson, D. P., and Prather, K. A.: Classification of single particles analyzed by ATOFMS using an artificial neural network, ART-2A, Anal. Chem., 71, 860–865, https://doi.org/10.1021/ac9809682, 1999.
Spencer, M. T. and Prather, K. A.: Using ATOFMS to determine OC/EC mass fractions in particles, Aerosol Sci. Tech., 40, 585–594, https://doi.org/10.1080/02786820600729138, 2006.
Spencer, M. T., Shields, L. G., and Prather, K. A.: Simultaneous measurement of the effective density and chemical composition of ambient aerosol particles, Environ. Sci. Technol., 41, 1303–1309, https://doi.org/10.1021/es061425+, 2007.
Sumlin, B. J., Oxford, C. R., Seo, B., Pattison, R. R., Williams, B. J., and Chakrabarty, R. K.: Density and homogeneous internal composition of primary brown carbon Aerosol, Environ. Sci. Technol., 52, 3982–3989, https://doi.org/10.1021/acs.est.8b00093, 2018.
Tang, I. N.: Thermodynamic and optical properties of mixed-salt aerosols of atmospheric importance, J. Geophys. Res.-Atmos., 102, 1883–1893, 1997.
Tang, I. N. and Munkelwitz, H. R.: Water activities, densities, and refractive-indexes of aqueous sulfates and sodium-nitrate droplets of atmospheric importance, J. Geophys. Res.-Atmos., 99, 18801–18808, 1994.
Tavakoli, F. and Olfert, J. S.: An instrument for the classification of aerosols by particle relaxation time: theoretical models of the aerodynamic aerosol classifier, Aerosol Sci. Tech., 47, 916–926, https://doi.org/10.1080/02786826.2013.802761, 2013.
Wu, Y., Xia, Y., Huang, R., Deng, Z., Tian, P., Xia, X., and Zhang, R.: A study of the morphology and effective density of externally mixed black carbon aerosols in ambient air using a size-resolved single-particle soot photometer (SP2), Atmos. Meas. Tech., 12, 4347–4359, https://doi.org/10.5194/amt-12-4347-2019, 2019.
Yin, Z., Ye, X. N., Jiang, S. Q., Tao, Y., Shi, Y., Yang, X., and Chen, J. M.: Size-resolved effective density of urban aerosols in Shanghai, Atmos. Environ., 100, 133–140, https://doi.org/10.1016/j.atmosenv.2014.10.055, 2015.
Yon, J., Bescond, A., and Ouf, F. X.: A simple semi-empirical model for effective density measurements of fractal aggregates, J. Aerosol Sci., 87, 28–37, https://doi.org/10.1016/j.jaerosci.2015.05.003, 2015.
Zelenyuk, A., Cai, Y., Chieffo, L., and Imre, D.: High precision density measurements of single particles: The density of metastable phases, Aerosol Sci. Tech., 39, 972–986, https://doi.org/10.1080/02786820500380206, 2005.
Zelenyuk, A., Cai, Y., and Imre, D.: From agglomerates of spheres to irregularly shaped particles: Determination of dynamic shape factors from measurements of mobility and vacuum aerodynamic diameters, Aerosol Sci. Tech., 40, 197–217, https://doi.org/10.1080/02786820500529406, 2006.
Zhai, J., Lu, X., Li, L., Zhang, Q., Zhang, C., Chen, H., Yang, X., and Chen, J.: Size-resolved chemical composition, effective density, and optical properties of biomass burning particles, Atmos. Chem. Phys., 17, 7481–7493, https://doi.org/10.5194/acp-17-7481-2017, 2017.
Zhang, G., Bi, X., Han, B., Qiu, N., Dai, S., Wang, X., Sheng, G., and Fu, J.: Measurement of aerosol effective density by single particle mass spectrometry, Sci. China Earth Sci., 59, 320–327, https://doi.org/10.1007/s11430-015-5146-y, 2016.
Zhang, Y., Zhang, Q., Cheng, Y., Su, H., Kecorius, S., Wang, Z., Wu, Z., Hu, M., Zhu, T., Wiedensohler, A., and He, K.: Measuring the morphology and density of internally mixed black carbon with SP2 and VTDMA: new insight into the absorption enhancement of black carbon in the atmosphere, Atmos. Meas. Tech., 9, 1833–1843, https://doi.org/10.5194/amt-9-1833-2016, 2016.
Zhao, G., Zhao, W., and Zhao, C.: Method to measure the size-resolved real part of aerosol refractive index using differential mobility analyzer in tandem with single-particle soot photometer, Atmos. Meas. Tech., 12, 3541–3550, https://doi.org/10.5194/amt-12-3541-2019, 2019.