the Creative Commons Attribution 4.0 License.
the Creative Commons Attribution 4.0 License.
 | 12 Apr 2021
Atmospheric conditions and composition that influence PM2.5 oxidative potential in Beijing, China
Steven J. Campbell
Kate Wolfer
Battist Utinger
Joe Westwood
Zhi-Hui Zhang
Nicolas Bukowiecki
Sarah S. Steimer
Tuan V. Vu
Jingsha Xu
Nicholas Straw
Steven Thomson
Atallah Elzein
Di Liu
Linjie Li
Pingqing Fu
Alastair C. Lewis
Roy M. Harrison
William J. Bloss
Miranda Loh
Mark R. Miller
Zongbo Shi
Markus Kalberer
Epidemiological studies have consistently linked exposure to PM2.5 with adverse health effects. The oxidative potential (OP) of aerosol particles has been widely suggested as a measure of their potential toxicity. Several acellular chemical assays are now readily employed to measure OP; however, uncertainty remains regarding the atmospheric conditions and specific chemical components of PM2.5 that drive OP. A limited number of studies have simultaneously utilised multiple OP assays with a wide range of concurrent measurements and investigated the seasonality of PM2.5 OP. In this work, filter samples were collected in winter 2016 and summer 2017 during the atmospheric pollution and human health in a Chinese megacity campaign (APHH-Beijing), and PM2.5 OP was analysed using four acellular methods: ascorbic acid (AA), dithiothreitol (DTT), 2,7-dichlorofluorescin/hydrogen peroxidase (DCFH) and electron paramagnetic resonance spectroscopy (EPR). Each assay reflects different oxidising properties of PM2.5, including particle-bound reactive oxygen species (DCFH), superoxide radical production (EPR) and catalytic redox chemistry (DTT/AA), and a combination of these four assays provided a detailed overall picture of the oxidising properties of PM2.5 at a central site in Beijing. Positive correlations of OP (normalised per volume of air) of all four assays with overall PM2.5 mass were observed, with stronger correlations in winter compared to summer. In contrast, when OP assay values were normalised for particle mass, days with higher PM2.5 mass concentrations (µg m−3) were found to have lower mass-normalised OP values as measured by AA and DTT. This finding supports that total PM2.5 mass concentrations alone may not always be the best indicator for particle toxicity. Univariate analysis of OP values and an extensive range of additional measurements, 107 in total, including PM2.5 composition, gas-phase composition and meteorological data, provided detailed insight into the chemical components and atmospheric processes that determine PM2.5 OP variability. Multivariate statistical analyses highlighted associations of OP assay responses with varying chemical components in PM2.5 for both mass- and volume-normalised data. AA and DTT assays were well predicted by a small set of measurements in multiple linear regression (MLR) models and indicated fossil fuel combustion, vehicle emissions and biogenic secondary organic aerosol (SOA) as influential particle sources in the assay response. Mass MLR models of OP associated with compositional source profiles predicted OP almost as well as volume MLR models, illustrating the influence of mass composition on both particle-level OP and total volume OP. Univariate and multivariate analysis showed that different assays cover different chemical spaces, and through comparison of mass- and volume-normalised data we demonstrate that mass-normalised OP provides a more nuanced picture of compositional drivers and sources of OP compared to volume-normalised analysis. This study constitutes one of the most extensive and comprehensive composition datasets currently available and provides a unique opportunity to explore chemical variations in PM2.5 and how they affect both PM2.5 OP and the concentrations of particle-bound reactive oxygen species.
- Article
(3638 KB) - Full-text XML
-
Supplement
(6767 KB) - BibTeX
- EndNote


Large-scale epidemiological studies have consistently linked the exposure of airborne particulate matter (PM) with a range of adverse human health effects (Hart et al., 2015; Laden et al., 2006; Lepeule et al., 2012). A recent study by the World Health Organisation estimated that 1 in 8 deaths globally in 2014 were linked to air pollution exposure (World Health Organisation, 2016), with urban areas in India and China particularly affected (Lelieveld et al., 2020). However, large uncertainty remains regarding the physical and chemical characteristics of PM that result in adverse health outcomes upon exposure (Bates et al., 2019).
Studies have suggested that oxidative stress promoted by PM components in vivo could be a key mechanism that results in adverse health outcomes (Donaldson and Tran, 2002; Knaapen et al., 2004; Øvrevik et al., 2015). Oxidative stress occurs when excess concentrations of reactive oxygen species (ROS) overwhelm cellular anti-oxidant defences, resulting in an imbalance of the oxidant–antioxidant ratio in favour of the former, which can subsequently lead to inflammation and disease (Knaapen et al., 2004; Li et al., 2003, 2008). The term ROS typically refers to H2O2, in some cases including organic peroxides, the hydroxyl radical (•OH), superoxide (O) and organic oxygen-centred radicals. Particle-bound ROS is exogenously delivered into the lung through PM inhalation or can be produced in vivo via redox chemistry initiated by certain particle components, in addition to baseline tissue ROS produced by metabolic processes (Dellinger et al., 2001). The capability of PM to produce ROS with subsequent depletion of anti-oxidants upon inhalation is defined as oxidative potential (OP) (Bates et al., 2019).
OP is a fairly simple measure of PM redox activity but reflects a complex interplay of particle size, composition and chemistries which induce oxidative stress by free-radical generation, which triggers cellular signal transduction and damage. These effects can be both localised (to lung epithelial surfaces and alveoli, reviewed by Tao et al., 2003) and systemic, through immune system activation and cytokine release (Miyata and van Eeden, 2011), translocation of ultrafine particles into the circulatory system (Oberdorster et al., 1992), increased circulating monocytes (Tan et al., 2000), and propagation to other cells and organs (Laing et al., 2010; Meng and Zhang, 2006). Oxidative stress is implicated in the majority of toxicological effects related to air pollution (Ghio et al., 2012; Kelly, 2003; Pope and Dockery, 2006; Risom et al., 2005). A rapid and simple metric to capture the oxidative exposure burden which can be easily implemented for epidemiological studies will enable greater insight into the mechanisms of PM toxicity beyond total PM mass concentrations alone.
There are now a wide range of acellular chemical methods that attempt to quantify particle-bound ROS and the entire OP of PM, as typically acellular assays allow faster measurement and are less labour intensive compared to cell cultures or in vivo methods (Bates et al., 2019). These include, but are not limited to, the dithiothreitol assay (DTT), ascorbic acid assay (AA), 2,7-dichlorofluorescin/hydrogen peroxidase assay (DCFH), electron paramagnetic resonance (EPR) spectroscopy, glutathione assay (GSH) and 9-(1,1,3,3,tetramethylisoindolin-2-yloxyl-5-ethynyl)-10-(phenylethynyl)anthracene (BPEAnit). These acellular assays all have differing sensitivities to specific particle components that may contribute to increased particle-bound ROS concentrations and aerosol OP. For instance, DTT has been shown to be sensitive to soluble metals (Shinyashiki et al., 2009), including copper and manganese (Charrier et al., 2015; Charrier and Anastasio, 2012), as well as a range of organic particle components including water-soluble organic carbon (WSOC, a mixture of hundreds to thousands of compounds), oxidised polycyclic aromatic hydrocarbons (PAHs), e.g. quinones (Chung et al., 2006; McWhinney et al., 2013a), and humic-like substances (HULIS) (Dou et al., 2015; Verma et al., 2015a). AA is particularly sensitive to redox-active transition metals, most notably Fe (Godri et al., 2011) and Cu (Janssen et al., 2014; Pant et al., 2015), and has demonstrated sensitivity to organic carbon (Calas et al., 2018) including secondary organic aerosol (Campbell et al., 2019b). EPR is applied to speciate and quantify radical species bound to aerosol particles (Arangio et al., 2016; Campbell et al., 2019a; Chen et al., 2019; Gehling and Dellinger, 2013), so-called environmentally persistent free radicals (EPFR), or radicals formed upon suspension of particles into aqueous solution (Gehling et al., 2014; Tong et al., 2016, 2017) or in some cases into synthetic lung lining fluid (Tong et al., 2018) consisting of a mixture of AA, glutathione and uric acid. EPR has the advantage of not being influenced by the dark colour of particulate suspensions (detection is via magnetic excitation rather than magnetic absorbance), that it does not require extraction of the PM from the filter and that speciation of the free radical generated can be explored using spin-trap reagents that are selective for specific radicals (Miller et al., 2009). The DCFH assay has been shown to be particularly sensitive to hydrogen peroxide (H2O2) and organic peroxides (Venkatachari and Hopke, 2008; Wragg et al., 2016), also present in secondary organic aerosol (SOA) particles (Gallimore et al., 2017), and is a particularly useful assay for measuring particle-bound ROS (Wragg et al., 2016). The application of these four commonly used assays simultaneously allows different mechanisms of ROS generation to be assessed: the variability of particle-bound ROS (DCFH), the production of superoxide upon aqueous particle suspension (EPR) and the catalytic generation of ROS via redox-active components (DTT/AA). Therefore, these data provide a broad picture of the variability of both particle-bound ROS and OP, and comparison to a comprehensive compositional dataset provides a unique opportunity to probe the chemical changes in PM that affect the burden of particle-bound ROS and OP.
Despite several studies utilising the aforementioned assays, further exploratory work is required to determine specifically which sources, physical properties and chemical components influence aerosol OP variability. A limited number of investigations have explored the role of chemical composition on aerosol OP, and it is often unclear which specific chemical components are responsible for driving aerosol OP; for example, studies show transition metals such as Cu and Mn dominate DTT activity (Charrier et al., 2015; Charrier and Anastasio, 2012), whereas others highlight the enhanced role of organics, in particular water-soluble organic carbon (WSOC) such as HULIS, and quinones (Cho et al., 2005; Fang et al., 2016). Furthermore, several studies correlate volume-normalised OP measurements with compositional variability, but given the potential co-linearity of many aerosol components with overall mass, mass-normalised intrinsic OP values may provide additional insight into the effect of chemical composition on aerosol OP (Bates et al., 2019; Puthussery et al., 2020). Thus, a comprehensive characterisation of gas- and particle-phase pollution conditions combined with measurements utilising multiple OP assays simultaneously provides a wide range of information on particle-bound ROS and aerosol OP, allowing the identification of the most important components that drive aerosol OP. Ultimately, a greater understanding of the specific aerosol characteristics that influence OP, as well as specific sources that contribute more to aerosol OP, could allow the development of more targeted and efficient air pollution mitigation strategies. Further details of the selection of OP assays, their analytical scope, and biological and epidemiological applicability are described in Sect. S2 of the Supplement.
In this work, PM2.5 filter samples collected in winter 2016 and summer 2017 during the APHH campaign (Shi et al., 2019) were analysed using four acellular methods – AA, DCFH, DTT and EPR – providing a broad panel of data on the health-relevant properties of PM2.5, including particle-bound ROS, redox-active components contributing to aerosol OP and the formation of superoxide radicals upon sample extraction. As the APHH campaign simultaneously captured one of the most extensive and comprehensive atmospheric composition datasets, including a range of PM compositional data, we aimed to establish which individual PM components and meteorological and atmospheric conditions contributed to the increased OP assay response, whether these influences and compositions differed substantially between assays, and if the compositions confirmed previous observations and reflected particular PM sources. We included 107 different measurements, comprising transition metals, AMS measurements, total elemental and organic carbon, and a broad panel of organic species relating to biomass and fossil fuel burning, cooking emissions, vehicular markers, secondary organic aerosol compounds, and gaseous species and general atmospheric conditions. We also sought to investigate the differences between volume-based and mass-based responses, as mass-based analysis facilitates site and temporal comparisons more readily than volume measurements and provides details on intrinsic particle properties that influence OP. In order to highlight underlying trends in such a broad and complex dataset, we also applied multivariate statistical analysis and developed multiple linear regression models to fully characterise the compositional factors driving each assay response.
2.1 Air Pollution and Human Health in a Chinese Megacity (APHH) campaign
2.1.1 Site description
High-volume 24 h aerosol filter samples were collected at the Institute of Atmospheric Physics (IAP) in Beijing, China ( N, E) (Fig. S1). Winter PM was collected during the months of November–December 2016, and summer PM was collected during the months of May–June 2017. n=31 filters for winter 2016 and n=34 filters for summer 2017 were collected. A PM2.5 high-volume sampler (RE-6070VFC, TICSH, USA) was used at a flow rate of ∼ 1.06 m3 min−1. PM2.5 for subsequent OP analysis was collected onto quartz microfiber filters (Whatman, 20.3×25.4 cm) with a collection area of 405 cm2.
2.1.2 PM2.5 composition, gas-phase composition and meteorological data
Oxidative potential measurements were correlated with a range of additional particle-phase composition, gas-phase composition and meteorological measurements conducted concurrently during the APHH-Beijing campaign (Shi et al., 2019). Briefly, the following composition data were collated: total organic and elemental carbon (OC, EC), soluble inorganic ions (K+, Na+, Ca2+, NH, NO, SO and Cl−) measured using ion chromatography (IC), low-oxidised organic aerosol and more-oxidised organic aerosol (LOOOA/MOOOA) as well as total organic (ORG) fractions using aerosol mass spectrometry (AMS), biomass burning markers (galactosan, mannosan and levoglucosan), 16 polycyclic aromatic hydrocarbons (PAHs) (see Elzein et al., 2019, 2020), C24-C34 n-alkanes, aerosol cooking markers (palmitic acid, stearic acid, cholesterol), vehicle exhaust markers (17a(H)-22, 29,30-trisnorhopane (C27a) and 17b(H)-21a-norhopane (C30ba)), isoprene SOA markers (2-methylglyceric acid, 2-methylerythritol, 2-methylthreitol, 3-hydroxyglutaric acid), C5-alkene triols (cis-2-methyl-1,3,4-trihydroxy-1-butene, 3-methyl-2,3,4-trihydroxy-1-butene, trans-2-methyl-1,3,4-trihydroxy-1-butene), α-pinene SOA tracers (cis-pinonic acid, pinic acid, 3-methyl-1,2,3-butanetricarboxylic acid (MBTCA), 2,3-dihydroxy-4-oxopentanoic acid, aged α-pinene SOA marker), β-caryophyllene SOA tracer (β-caryophyllinic acid), and an aromatic volatile organic compound (VOC) SOA tracer (3-isopropylpentanedioic acid) (Liu et al., 2021). The following additional data were obtained from the Centre for Environmental Data Analysis (CEDA) archive: concentrations of inorganic elements Al, Ti, V, Cr, Mn, Fe, Co, Ni, Cu, Zn, Cd, Sb, Ba and Pb in PM2.5 using X-ray fluorescence (XRF) (Xu et al., 2020a); gas-phase concentrations of methanol, acetonitrile, acetaldehyde, acrolein, acetone, isoprene, methacrolein, methyl ethyl ketone, benzene, toluene, C2-benzenes and C3-benzenes measured using proton-transfer-reaction time-of-flight mass spectrometry (PTR-ToF-MS) (Acton et al., 2018); gas-phase concentrations of O3, CO, NO, NO2, NOy and SO2 as well as relative humidity (RH) and air temperature measurements (Shi et al., 2019); photolysis rates for JO1D and JNO2 (Whalley et al., 2021); and gas-phase concentrations of hydroxyl radicals (OH), peroxy radicals (HO2) and organic peroxy radicals (RO2) measured using fluorescence assay gas expansion (FAGE) (Whalley et al., 2021).
2.2 Oxidative potential measurements
2.2.1 Reagents
Chemicals and gases were obtained from Sigma-Aldrich unless otherwise indicated and were used without further purification: ascorbic acid (≥ 99.0 %), Chelex™ 100 sodium form, 0.1 M HCl solution, 0.1 M NaOH solution, dichlorofluorescin-diacetate (DCFH-DA), 1 M potassium phosphate buffer solution, horseradish peroxidase (HRP), methanol (HPLC grade), and o-phenylenediamine (≥ 99.5 %). H2O used for the DCFH, HRP and AA solution was obtained from a Milli-Q high-purity water unit (resistivity ≥ 18.2 M Ω cm−1, Merck Millipore, USA). For DTT analysis, 9,10-phenanthrenequinone (PQN) (≥ 99 %), 5,5'-dithiobis(2-nitrobenzoic acid) (DTNB) (99 %), DL-dithiothreitol (DTT) (≥ 98 %), potassium phosphate dibasic (≥ 98 %, Krebs buffer), potassium phosphate monobasic (≥ 98 %, Krebs buffer) and methanol (≥ 99.9 %) were all obtained from Fisher Chemical. Nitrogen (oxygen free) was obtained from BOC (Cambridge, UK).
2.2.2 Acellular oxidative potential assays
Four offline acellular methods for measuring PM2.5 oxidative potential and particle-bound ROS were utilised in this work. The DCFH/HRP assay (Fuller et al., 2014) quantifies the fluorescent product 2,7-dichlorofluorescein, an assay that is particularly sensitive to species which are likely particle-bound ROS. The ascorbic acid (AA) assay (Campbell et al., 2019b) quantifies the dominant product of AA oxidation, dehydroascorbic acid (DHA) via condensation with a dye and fluorescence spectroscopy. This is an AA-only assay and does not contain other components normally present in synthetic lung fluid (SLF); filter extracts are performed at pH 7, whereas the AA reaction with the filter extract is performed at pH 2 to improve assay stability and sensitivity (Campbell et al., 2019b). Electron paramagnetic resonance spectroscopy (EPR) (Miller et al., 2009) specifically targets the measurement of superoxide (O), and the dithiothreitol (DTT) assay (e.g. Cho et al., 2005) quantifies the rate of loss of DTT via absorbance measurements. These acellular methods have been widely applied in the literature to study particle OP and particle-bound ROS (Bates et al., 2019). For detailed descriptions of the assay protocols, see Sect. S3 in the Supplement. Assessing OP and particle-bound ROS in filters with the aforementioned assays is done offline. There is potential to underestimate PM OP and particle-bound ROS using offline filter-based analysis, as short-lived components which contribute to particle-bound ROS and OP may undergo degradation prior to analysis. However, using an offline method allows the opportunity to correlate with a wide range of additional composition measurements, allowing a more explicit characterisation of the chemical components of PM that contribute to observed acellular assay responses.
2.3 Statistical analysis
We aimed to analyse the data as thoroughly as possible with respect to characterising the OP measured by each assay and to robustly connect assays to both individual measurements and potential PM sources. As data were collated from several different experimental projects, and as analytical uncertainty values were not available for the majority of the data, the use of positive matrix factorisation (PMF) was not undertaken for source apportionment in this study and will be published subsequently for selected analyses (Xu et al., 2020a). Multiple analytical platforms were used for the acquisition of compositional data; uncertainty estimates for each measurement were not easily estimable; a factor-based chemical mass balance approach was not required specifically; and temperature, relative humidity, actinic flux and other non-mass measurements could also be influential on the OP response and are factors mainly independent of PM sources. On this basis we considered that PMF would not ultimately give useful models in the specific context of OP. However, these issues are managed adequately by principal component analysis (PCA), which is a useful general unsupervised method for examining underlying variance and latent effects in data and handles multicollinearity well, although it is not optimal for chemical mass balance source apportionment (Paatero and Tapper, 1994).
PCA and partial least squares regression (PLSR) models were produced in SIMCA+ 16.0 (Umetrics, Umeå, Sweden). Missing values were not altered prior to model construction, although measurements with more than 56 % missing values per season were discarded from models. R2 and Q2 values were used to assess the goodness of fit of the model and the goodness of prediction of the data through 7-fold cross-validation respectively. Data were unit-variance-scaled and mean-centred to remove effects related to absolute data magnitude. Models were allowed to optimise to the maximum number of latent variables (LVs) at which the cumulative Q2 value stabilised, which for most PLSR models was a single LV. PLSR model robustness was assessed through permutation testing, where the classifier (i.e. OP assay response) for all samples was randomly permuted 999 times and the PLSR model constructed for each permutation; the model was considered robust if the real model R2 and Q2 values outperformed those from all random permutation models. Negative Q2 values indicate no predictive power of the data in the model, and LVs with Q2 significantly lower than the R2 value (arbitrarily defined for this study as Q2 at more than 10 % below the R2) can be considered at least partially overfitted.
Spearman rank correlations (Rs) between OP measurements and PM2.5 were calculated using Origin 2020 (Originlab Corporation, USA) and R and were used to assess the relationships between assay responses and individual measurements, with Mann–Whitney U tests used for pairwise testing of the differences in seasonal response for both assays and individual measurements. All other multivariate analyses, multiple linear regression models and selected univariate analyses were produced in R 4.0.2 (R Core Team, Vienna, Austria), implemented in RStudio 1.3.959 (Boston, Massachusetts, USA).
For multiple linear regression models, outlier values were arbitrarily deemed to be those greater than 5 times the standard deviation and replaced with the season median where appropriate for analysis. Measurement subsets manually selected as relevant to source composition were then subjected to a variable selection process, whereby pairwise Spearman correlations for all measurements were calculated, and measurements removed from subsets if they were highly correlated with other measurements but predicted OP more poorly than the other co-correlated measurements to reduce the number of variables contributing identical information in the final models. Multiple linear regression models were then further optimised from this initial subset using the regsubsets function in the leaps R package to allow for between 4–8 variables, which best predicted the OP response (models could be constructed with fewer or even more measurements, but the aim was to examine a small panel of contributors to potential source compositions). The variable selection process precludes the use of linear regression mode performance indicators such as the Akaike or Bayesian information criteria, as the optimised model basis sets are not identical. The stability of model predictions and features were assessed using bootstrap resampling of data, by randomly splitting one-fifth of the data as a test set and using the remaining samples to construct the model and predict the left-out samples, for 500 random iterations. Stability was also assessed though overall variance in OP predictions, measurement feature coefficients and model residuals plots, and run order/date bias (not differentiable as samples were analysed in date order) was assessed in residuals plots. Although not all data distributions were strictly normal when examined in the univariate kernel density plots, data were not log-transformed for multiple linear regression models, as this creates non-linearity in the model component response, which can complicate interpretation. Model residuals were plotted for manual examination and were all generally normally distributed despite the relatively small number of samples, and biases were related to periods of missing measurements or samples with values below the limit of quantification. Code developed for analysis is publicly available at https://github.com/katewolfer/Beijing (last access: 6 April 2021).
Both volume-normalised (OPv, per m3 air) and particle-mass-normalised (OPm, per µg PM2.5) values are considered in this work, where the OP value of the specific assay and sample is normalised by the volume of air collected or by the total PM2.5 mass on the filter, respectively. OPv is useful when considering exposure or epidemiological outcomes, but OPm is likely a more informative metric when exploring how chemical composition influences PM2.5 OP, potentially enabling better OP response, site and composition inter-comparisons (Bates et al., 2019). Henceforth, OPv and OPm will be used when discussing the overall response of all four methods; specific discussion of the acellular methods will be referred to as AAv, DTTv, DCFHv, and EPRv for volume-normalised values and AAm, DTTm, DCFHm, and EPRm for mass-normalised values. For comparison of mass-normalised OPm values, PM2.5 composition measurements were also normalised for total PM mass (e.g. ng/µg per µg PM2.5)
3.1 Seasonal variation of OPm and OPv
The 24 h PM2.5 mass concentrations in winter 2016 (8 November–9 December 2016) ranged from 8.1–328.7 µg m−3, with an average PM2.5 mass of 98.7 ± 75 µg m−3, whereas in summer 2017 (21 May–24 June 2017) PM2.5 concentrations ranged between 13.6–85 µg m−3 with an average of 36.7 ± 16 µg m−3 (Fig. S7) (Shi et al., 2019; Xu et al., 2020a). Average seasonal values for each assay are summarised in Table S1 in the Supplement. An example data set showing 24 h average data, for AAv and PM2.5 mass in both the winter and summer campaign, is shown in Fig. 1 (for DCFHv, DTTv and EPRv; see Sect. S6 “Summary statistics for all measurements”).
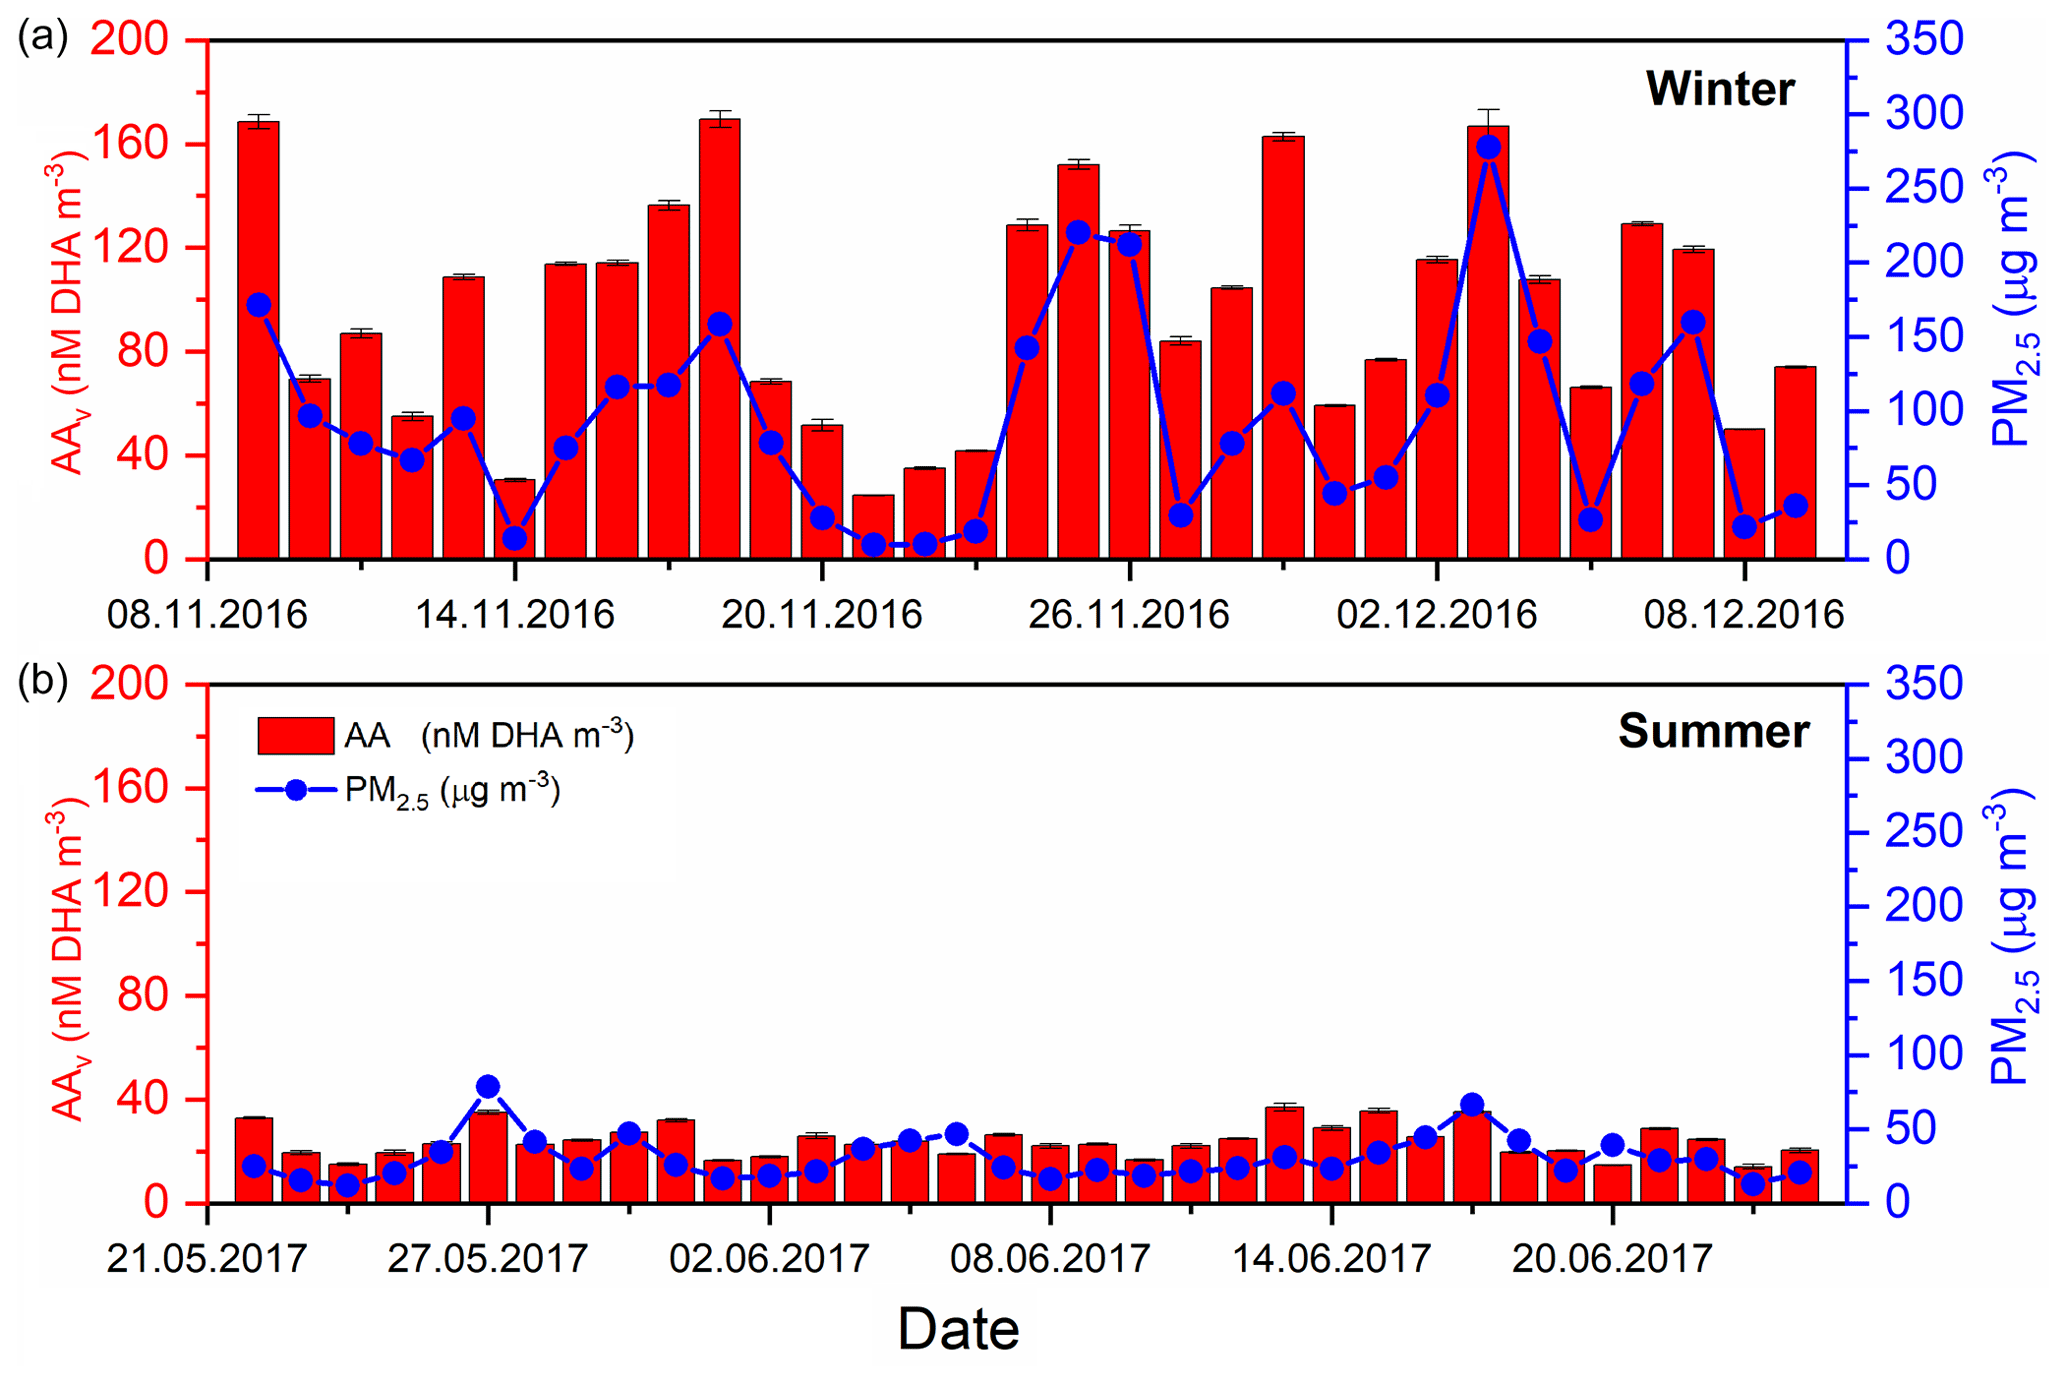
Figure 1Time-averaged (24 h) volume-normalised AAv (red bars) and PM2.5 mass (blue dots), analysed from 24 h high-volume filters, for both winter 2016 (8 November–8 December 2016) and summer 2017 (21 May–24 June 2017) (Shi et al., 2019; Xu et al., 2020a). Substantially higher average PM2.5 mass concentrations (µg m−3) and AAv were observed in the winter season compared to the summer (see Table S1 for summary). DCFHv, DTTv and EPRv 24 h averaged datasets can be found in Figs. S8–S10 respectively.
For all assays, a higher average was observed in the winter compared to the summer in Beijing (Table S1). The average AAv was 96.7±42.7 nM DHA m−3 in the winter, whereas a mean value of 24.1 ± 6.1 nM DHA m−3 was observed in the summer. Given the recent introduction of this AA-based assay, which measures the formation of the AA oxidation product DHA rather than measuring the decay of AA via UV absorbance, limited literature values are available for direct comparison (Campbell et al., 2019b). Average DCFHv in the winter was 0.71 ± 0.52 nmol H2O2 m−3 compared to 0.17 ± 0.11 nmol H2O2 m−3 in the summer, which is within the range of DCFHv values observed in previous studies in Taiwan, the United States and Singapore (OPDCFH 0.02–5.7 nmol H2O2 m−3) (Hasson and Paulson, 2003; Hewitt and Kok, 1991; Hung and Wang, 2001; See et al., 2007; Venkatachari et al., 2005). Mean observed values for DTTv in the winter and summer were 2.9 ± 0.11 nmol min−1 m−3 and 0.9 ± 0.40 nmol min−1 m−3, respectively. The mean values of DTTv observed in this study are greater than those measured in similar studies in Beijing (Liu et al., 2014) (0.11–0.49, mean = 0.19 nmol min−1 m−3) with similar mass concentrations of PM2.5 (mean = 140 µg m−3), although they are within the range of DTTv values observed in a number of previous studies in several locations, including Europe (Jedynska et al., 2017; Yang et al., 2015), the United States (Fang et al., 2015; Verma et al., 2014) and northern China (Liu et al., 2018) (0.1–14.7 nmol min−1 m−3). The mean EPRv values, relating to the specific detection of O, were 2.4×10⁶ ± 1.6×10⁶ and 5.8×10⁵ ± 4.1×10⁶ counts m−3 in the winter and summer campaign, respectively.
Spearman rank correlation coefficients (Rs) of aerosol OPv with PM2.5 vary between the winter and summer season, and also between OP assays, as illustrated in Fig. 2. All four assays, when normalised per volume (OPv), show a stronger correlation with PM2.5 mass concentration in the winter compared to the summer, consistent with results observed in Chamonix, France, by Calas et al. (2018). For example, DCFHv correlates well with 24 h average total PM2.5 mass concentration (µg m−3) in both winter (Rs=0.96) and summer (Rs=0.76) (Fig. 2b), whereas AAv correlates well in the winter (Rs=0.89) and poorly in summer (Rs=0.21). Similar correlations of DCFHv with PM2.5 mass concentrations in both winter and summer suggest that species influencing DCFHv variability (e.g. H2O2 and organic peroxides, likely particle-bound ROS) present in the particles are relatively consistent between both seasons. Similar to AAv, differences between the seasons are also observed for DTTv and EPRv, where correlations of aerosol OPv vs. PM2.5 are stronger in winter compared to summer (Fig. 2c and d), also generally consistent with previous studies, although in contrast to Calas et al. (2018), who observed no difference in EPRv between seasons in Chamonix, in that study the spin-trap 5,5-dimethyl-1-pyrroline-N-oxide (DMPO) was used to study hydroxyl radicals, whereas in this study we focus on the formation of superoxide upon particle suspension in aqueous solution. The differences in the correlation shown in Fig. 2 suggests that the four assays are sensitive to different PM components and that in winter and summer different PM sources or components are important for the assay's responses (Calas et al., 2018; Saffari et al., 2013; Verma et al., 2014). Figure 2 demonstrates that PM2.5 mass could be a reasonable predictor of total OPv in winter but the poorer correlations between all OPv assays and PM2.5 in the summer indicate that a more detailed understanding is necessary to elucidate and ultimately predict aerosol OP. However, the variability in the strength of correlation between OPv and PM2.5 mass as well as the seasonal difference indicates that compositional differences in PM2.5 or additional atmospheric processes influence PM2.5 OP.
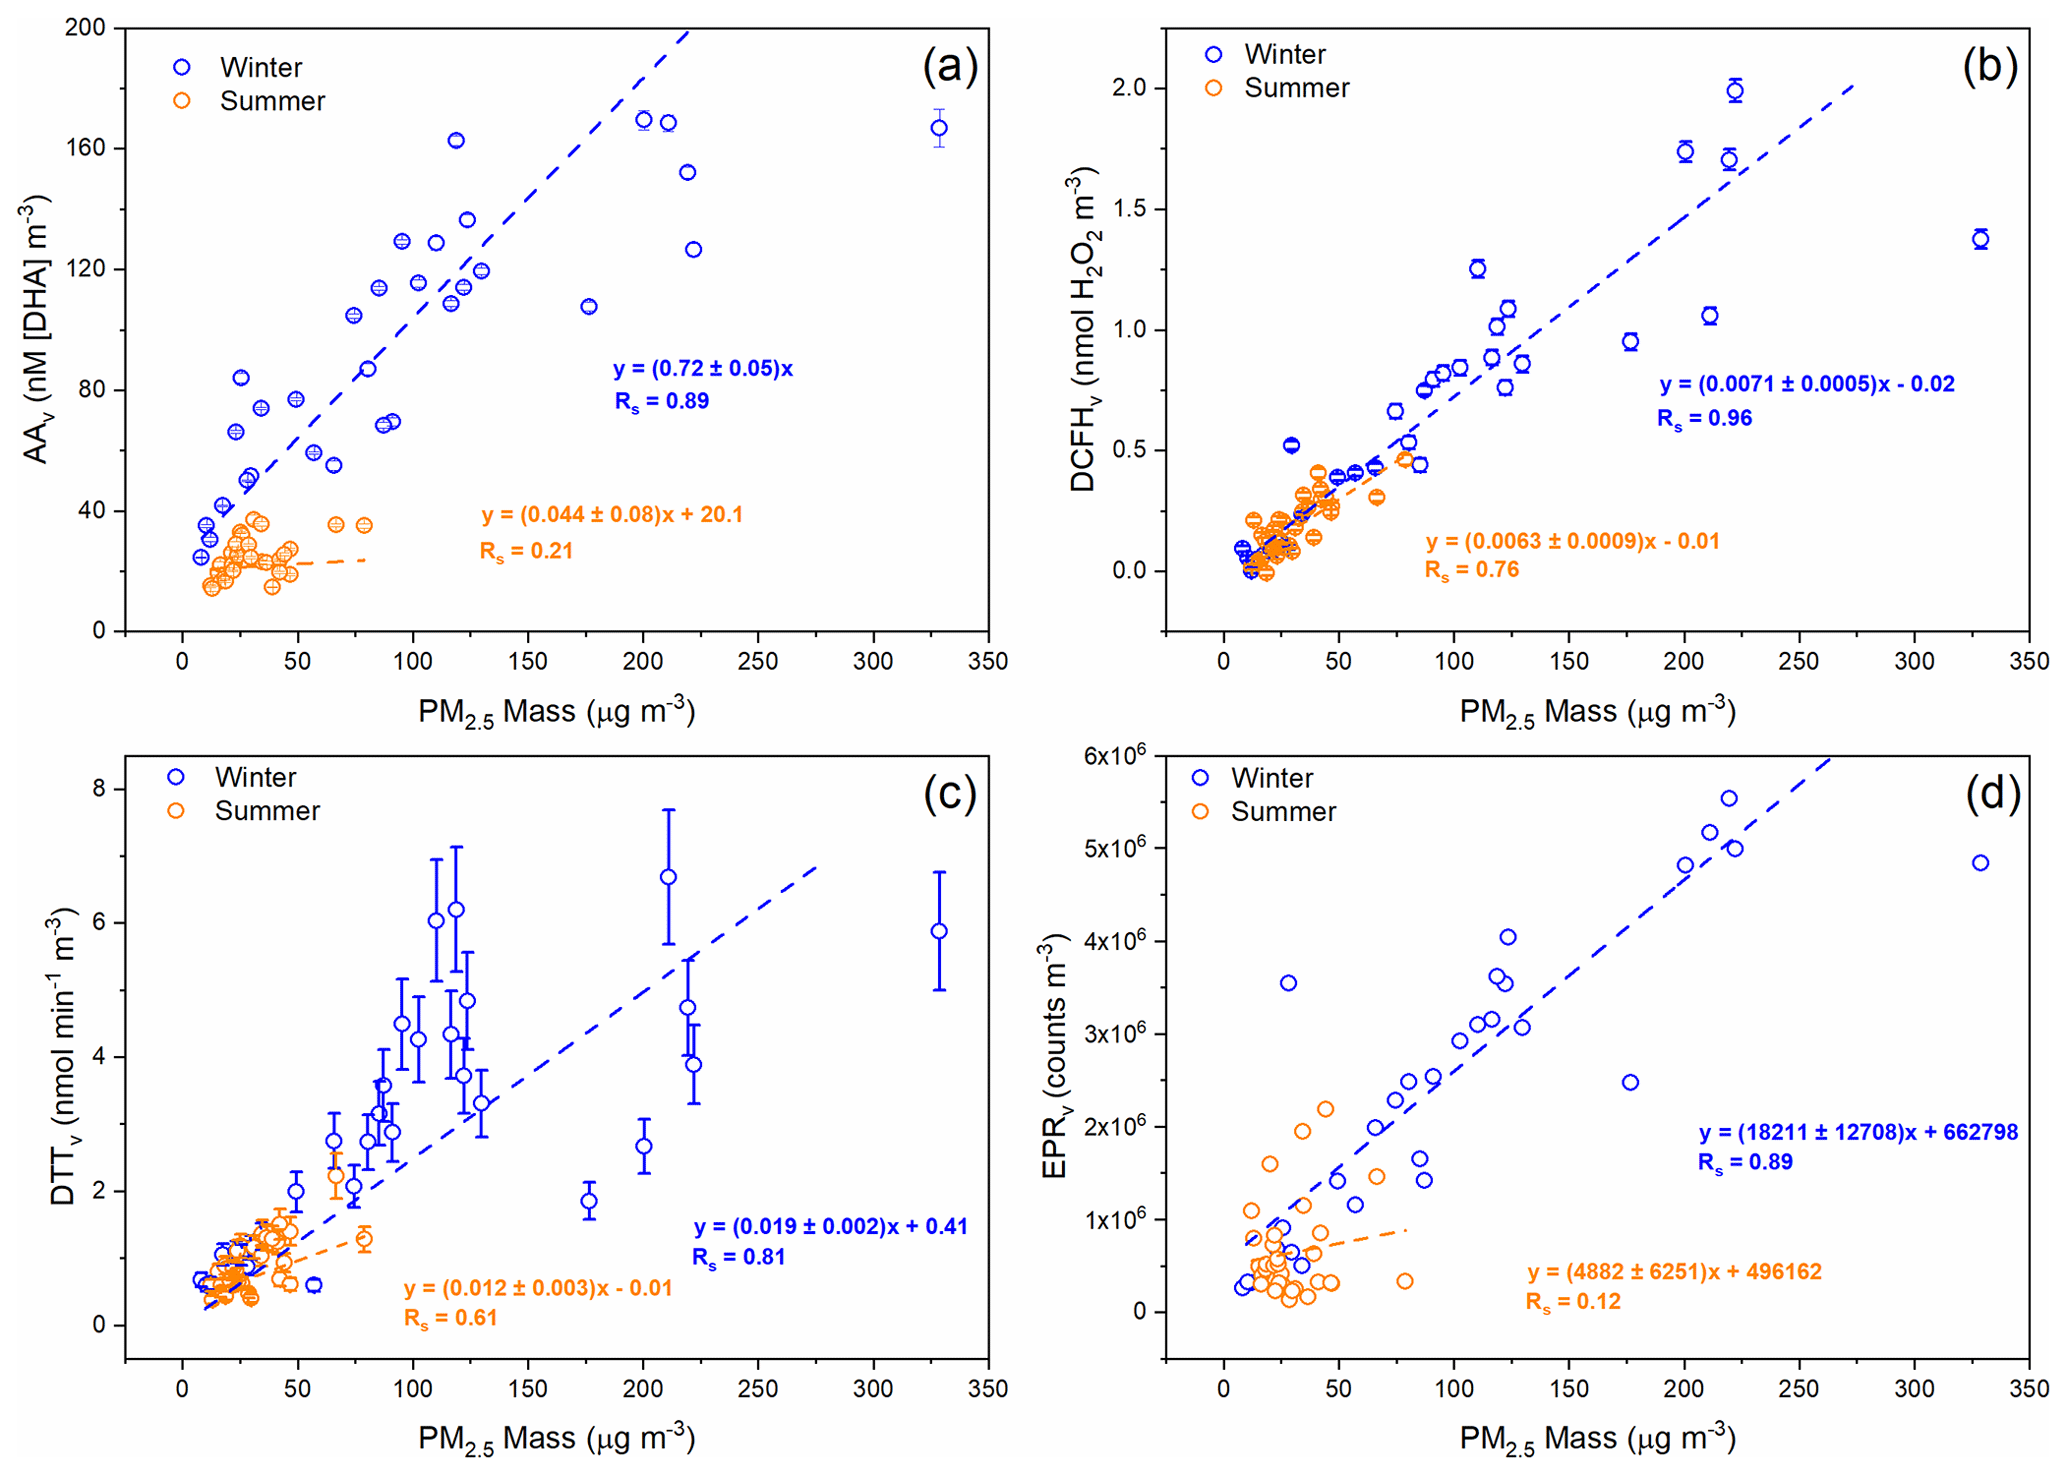
Figure 2Comparison of PM2.5 OPv during winter 2016 (blue) and summer 2017 (orange) vs. PM2.5 mass (µg m−3). (a) AAv, (b) DCFHv, (c) DTTv and (d) EPRv. Each data point represents a 24 h average for OP measurements and PM2.5 mass. Corresponding Rs and linear fit equations are included. For AAv, DCFHv and DTTv, error bars represent the standard deviation observed over three repeat measurements for each filter sample, and in some cases the error is smaller than the data point. Uncertainty values are unavailable for EPRv measurements.
To gain further insights into the potential particle-level compositional differences underlying assay OP response, the OP data for the four assays was normalised to the PM2.5 mass in each sample. As shown in Fig. 3, mass-normalised OPm values vary up to a factor of 10 within a single season. AAm, DCFHm, DTTm and EPRm for both winter and summer are also displayed in Fig. 3, with colour bars indicating the 24 h average total PM2.5 mass (µg m−3) for the corresponding OPm measurement. The average OPm response observed in this study shows a similar trend to OPv (Table S2), where higher OPm values are observed for winter compared to summer (Fig. 3), as observed previously (Liu et al., 2018; Saffari et al., 2014). This demonstrates that there are specific properties of PM2.5 in the winter that result in overall higher intrinsic OPm compared to the summer.
For AAm, an inverse relationship between total PM2.5 mass concentration and AAm is observed in both seasons, where days with high PM2.5 mass loadings have correspondingly low AAm values in both the winter and summer, with almost a factor of 6 difference between the AAm on the highest PM2.5 mass day (PM2.5=328 µg m−3, AAm=0.6 nM [DHA] µg−1) and lowest PM2.5 mass day observed during the winter campaign (PM2.5=8 µg m−3, AAm=3.53 nM [DHA] µg−1). A similar trend is observed for DTTm, where in general days with higher overall PM2.5 mass concentrations have correspondingly low DTTm values, which has also been observed previously (J. Wang et al., 2020). The DTTm response is also not correlated with Cu and Mn concentrations, despite the non-linear but monotonic relationship between these components being demonstrated in other studies (Charrier et al., 2016). These results indicate that on high-pollution days a large fraction of the PM mass might be OP-inactive, resulting in low intrinsic OPm values. In general, smaller particles have been observed to have higher DTTm values compared to larger particles (Bates et al., 2019; Janssen et al., 2014), an effect which may also play a role here. Another possibility is that on higher PM2.5 mass days, selected chemical species interact with or deactivate redox-active components present in PM2.5 (e.g. interaction of organics with metals (Tapparo et al., 2020), therefore reducing the observed OPm signal. It is also possible that components present in PM2.5 on higher PM2.5 mass concentration days interfere with the assay response. It is currently unclear which chemical components are responsible for the observed inverse relationship between PM2.5 mass with AAm and DTTm. However, statistically significant inverse correlations are observed between AAm and DTTm in both the winter and summer with the chemically undetermined “unknown” fraction of PM2.5 for DTTm (.81) and AAm (), implying that PM2.5 chemical components unaccounted for in this study are likely responsible for the lower intrinsic AAm and DTTm values on high PM2.5 mass days (see Sect. 3.2 “Univariate analysis of PM OP and additional measurements”, Figs. S11 and S12).
In contrast, higher DCFHm responses are observed on days with greater PM2.5 mass concentrations in both winter and summer. Increased DCFHm responses on more polluted days could indicate that the mass fraction of particle-bound ROS (e.g. organic peroxides from SOA) increases with increasing PM2.5 mass concentration or that the capacity of PM components to produce H2O2 upon extraction, as measured by DCFH, is enhanced. Despite the significant seasonal difference in EPRm, no obvious relationship between EPRm and PM2.5 mass was observed in our study. There is potential to underestimate PM OP and particle-bound ROS using offline filter-based analysis, as short-lived components which contribute to particle-bound ROS and OP may undergo degradation prior to analysis. However, using an offline-based method allows the opportunity to correlate with a wide range of additional composition measurements, allowing a more explicit characterisation of the chemical components of PM that contribute to observed acellular assay responses.
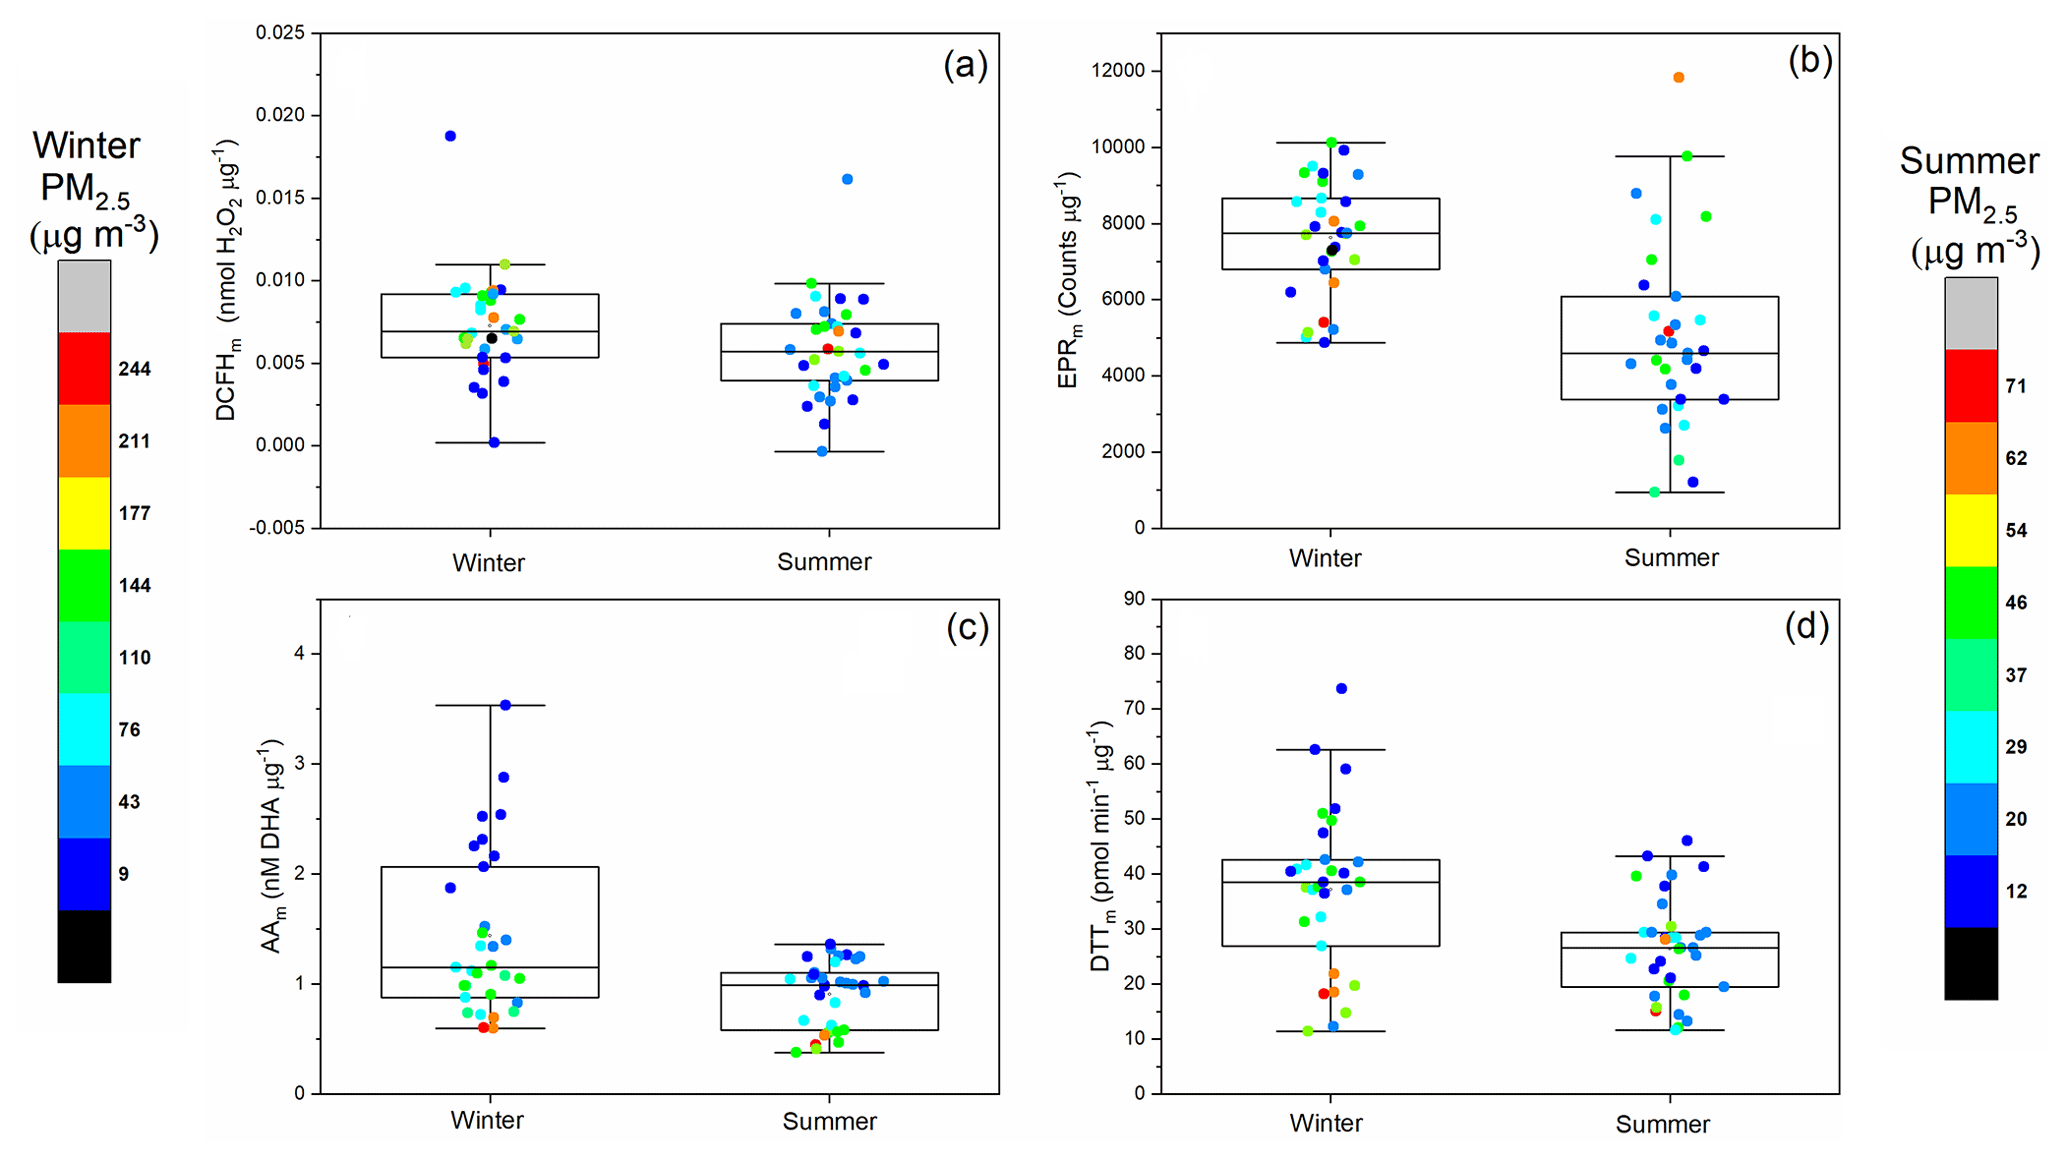
Figure 3Summer and winter 24 h averaged mass-normalised OPm (a) DCFHm (nmol H2O2 µg−1), (b) EPRm (counts µg−1), (c) AAm (µM DHA µg−1) and (d) DTTm (pmol min−1 µg−1). Box plots indicate the median, 25 % and 75 % percentiles, and the data range. Data points are colour coded with respect to the 24 h average PM2.5 mass (µg m−3), with a separate colour scale for winter and summer PM2.5 masses given the difference in total PM2.5 masses observed between the seasons.
Spearman rank correlations (Rs) between the four assays, for mass-normalised OPm and volume-normalised OPv, are presented in Table 1. In terms of OPv, all four assays show significantly strong correlations with each other in the winter season (Rs 0.72–0.89), but weaker correlations are observed between assays in the summer (Rs 0.01–0.58), a seasonal difference observed previously by Calas et al. (2018). In contrast, the only statistically significant correlation observed for OPm is between AAm and DTTm in the winter season only (Rs=0.58).
Seasonality of both OPv and OPm observed in the assays could be driven by changes in PM sources influencing overall OP, or a number of physical and chemical factors directly affecting particle composition. For instance, lower ambient temperatures in the winter may increase the partitioning of semi-volatile organic compounds, such as small quinones (e.g. anthracenequinone and 2,3-dimethylanthraquionone, Delgado-Saborit et al., 2013) and nitro-PAHs, which have been shown to influence DTT activity (Ntziachristos et al., 2007; Verma et al., 2011), observations which are supported by lab-based studies showing decreasing aerosol OP at higher temperatures (Biswas et al., 2009; Verma et al., 2011). Changing boundary layer height between the seasons may also contribute to higher concentrations of species which correlate with PM2.5 mass responsible for increasing aerosol OP during the winter, compared to summer, especially affecting OPv seasonality (H. Wang et al., 2020). Furthermore, air mass history may be an important contributor to the observed seasonality of OP. For instance, it was observed that winter days with high PM2.5 mass concentrations typically originate from regional sources south of Beijing, which is widely industrialised, whereas high mass days in the summer typically have more varied air mass histories (Panagi et al., 2020; Steimer et al., 2020). There are likely varying contributions between different sources in different seasons, e.g. more photochemistry in the summer driving oxidation and biogenic sources, and more contributions from residential heating combustion in the winter (Xu et al., 2020a). In order to gain further insight into what causes the observed variability of OP, relationships between particle chemical composition and aerosol OP will be explored in detail below.
Table 1Correlation of volume-normalised (OPv, top panel) and mass-normalised (OPm, bottom panel) assay responses in the winter (upper right values, regular font) and summer (lower left values, italic font) campaign. It should be noted that assay responses expressed as mass-normalised (OP per µg) are correlated with mass-normalised additional particle-phase composition measurements (i.e. µg or ng per µg PM2.5).
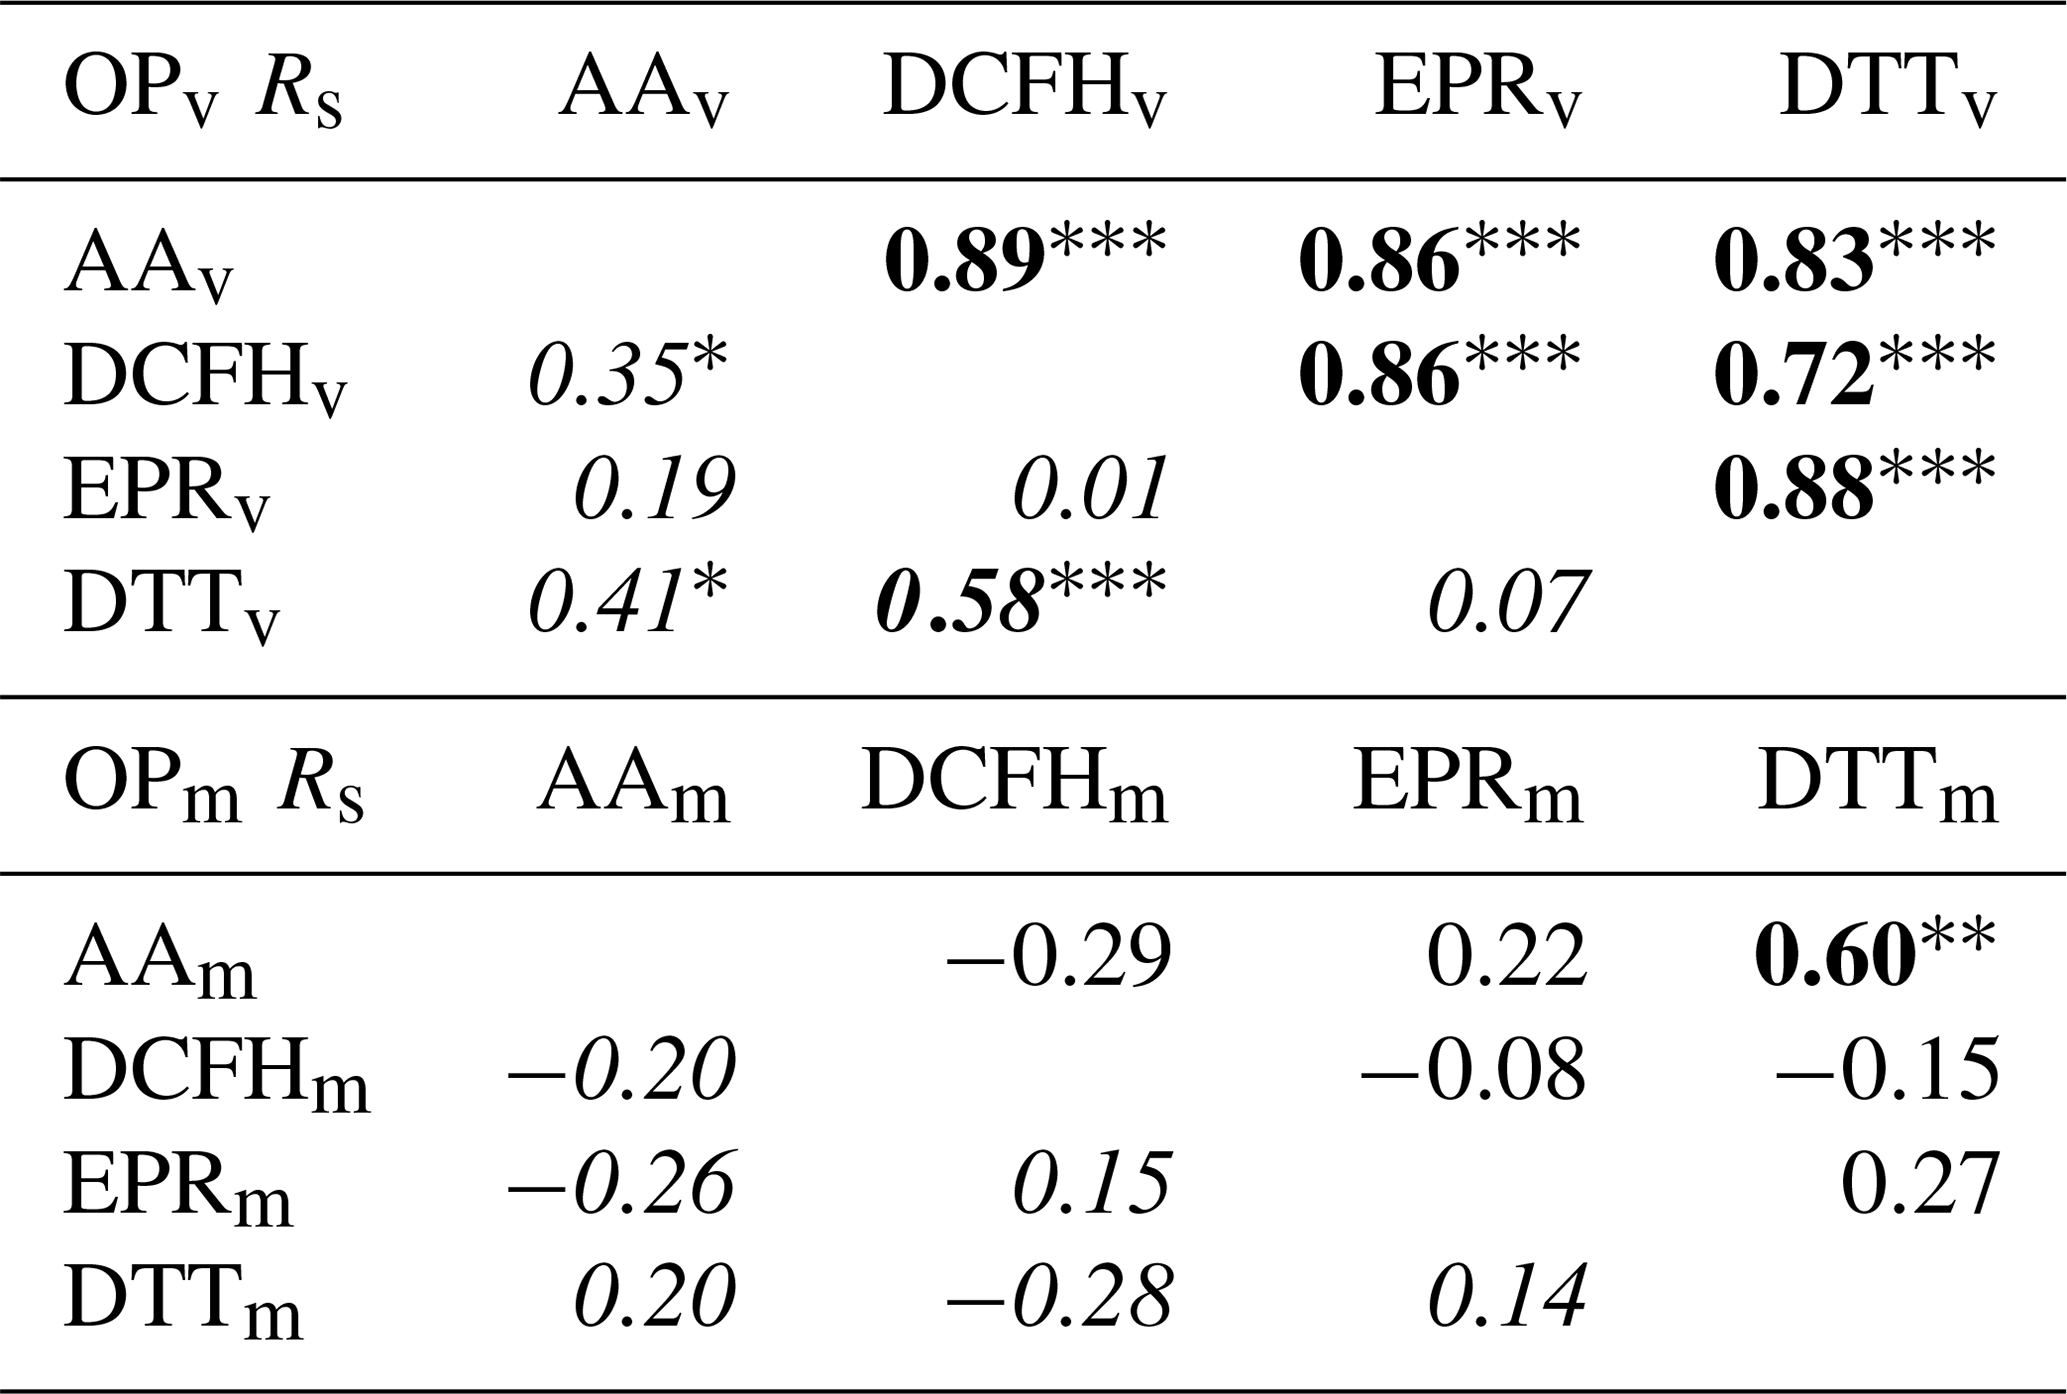
Bold font indicates Rs≥0.5; * p<0.05, p<0.01, p<0.001.
3.2 Univariate analysis of PM OPm and additional measurements
Spearman rank correlations between OPm of the four assays and 107 additional measurements conducted during the APHH campaign (see Sect. 2.1.2 “PM2.5 composition, gas-phase composition and meteorological data”) were calculated for both the winter (n=31) and summer (n=34). We focus on OPm in the forthcoming discussion; as mentioned previously, we consider it a particularly informative metric when determining the role of chemical composition on OP (Bates et al., 2019; Puthussery et al., 2020). All univariate statistical summaries are presented in Sect. S8.
The majority of additional particle-phase composition, gas-phase composition and meteorological measurements differed significantly by season. Exceptions included Al, V, Zn, Pb, Ca2+, Na+, NH, acetaldehyde, acetonitrile, methanol, methyl ethyl ketone, methyl vinyl ketone/methacrolein, trans-2-methyl-1,3,4-trihydroxy-1-butene, β-caryophyllinic acid, 3-hydroxyglutaric acid, C5-alkene triols, cholesterol, LOOOA and MOOOA. Stacked bar plots illustrating the total daily concentrations for both mass-normalised and volume-normalised data are shown in Figs. 4 and S13. Total concentrations of individual PM components (excluding all composite measures) account for approximately 0.3–0.8 µg µg−1, i.e. 30 %–80 % of the total PM mass (data not shown). Interestingly there were no marked or characteristic changes in mass composition associated with haze days; however, haze events were generally correlated with increased biomass burning marker concentration and total organic carbon in winter for the mass-normalised data (also observed during recent later winter haze events in Beijing (Li et al., 2019), as well as small inorganic ion concentrations in both seasons in the volume-normalised data (Fig. S13).
IC measurements (K+, Na+, Ca2+, NH NO
and SO) account for the greatest proportion of total particle
mass in both seasons, all of which are major components of secondary
inorganic PM mass (NH, NO, SO), mineral
dust (Ca2+, K+) and marine aerosols (Na+, Cl−). These
species were present at higher daily concentrations in summer than in
winter. Summer compositions for each category were generally consistent for
the whole sampling period, with a larger total proportion of SOA markers,
whereas winter compositions were more variable, with greater contributions
from elemental carbon, PAHs, n-alkanes and cooking-related compounds than for
summer samples. Although PAHs are not redox-active
(Charrier and Anastasio, 2012),
they are precursors to redox-active oxy-PAHs (quinones) and nitro-PAHs
(Atkinson and Arey, 2007) and have
well-established intrinsic cellular toxicity (reviewed in
Moorthy et al., 2015),
mediated by their conversion to hydroxy-PAHs, which exert mutagenic and
teratogenic effects and also induce transcriptional modifications and
oxidative stress. EC and n-alkanes are also non-redox-active, and the exact
mechanisms of their toxicities are unclear
(Levy et al., 2012); however, SOA
derived from the interaction of n-alkanes with NOx with photo-oxidation
(Lim and Ziemann,
2005; Presto et al., 2010) is likely both to contribute to the redox
activity of samples (Tuet et al., 2017) and to have more
toxic properties than its precursors (Xu et al., 2020b).
The sample from 22 November 2016 has a particularly high concentration of
cooking markers (palmitic acid, stearic acid and cholesterol). This could
reflect the fact that the traditional Chinese winter solar term Xiao Xue
(![]() , “light snow”) begins on this date (Li,
2006), a period associated with the preparation of warm foods as the ambient
temperatures in northern China drop; a similar elevation of palmitic acid
and stearic acid has been observed around the same week in a more recent
study in Shanghai (Q. Wang et al., 2020).
, “light snow”) begins on this date (Li,
2006), a period associated with the preparation of warm foods as the ambient
temperatures in northern China drop; a similar elevation of palmitic acid
and stearic acid has been observed around the same week in a more recent
study in Shanghai (Q. Wang et al., 2020).
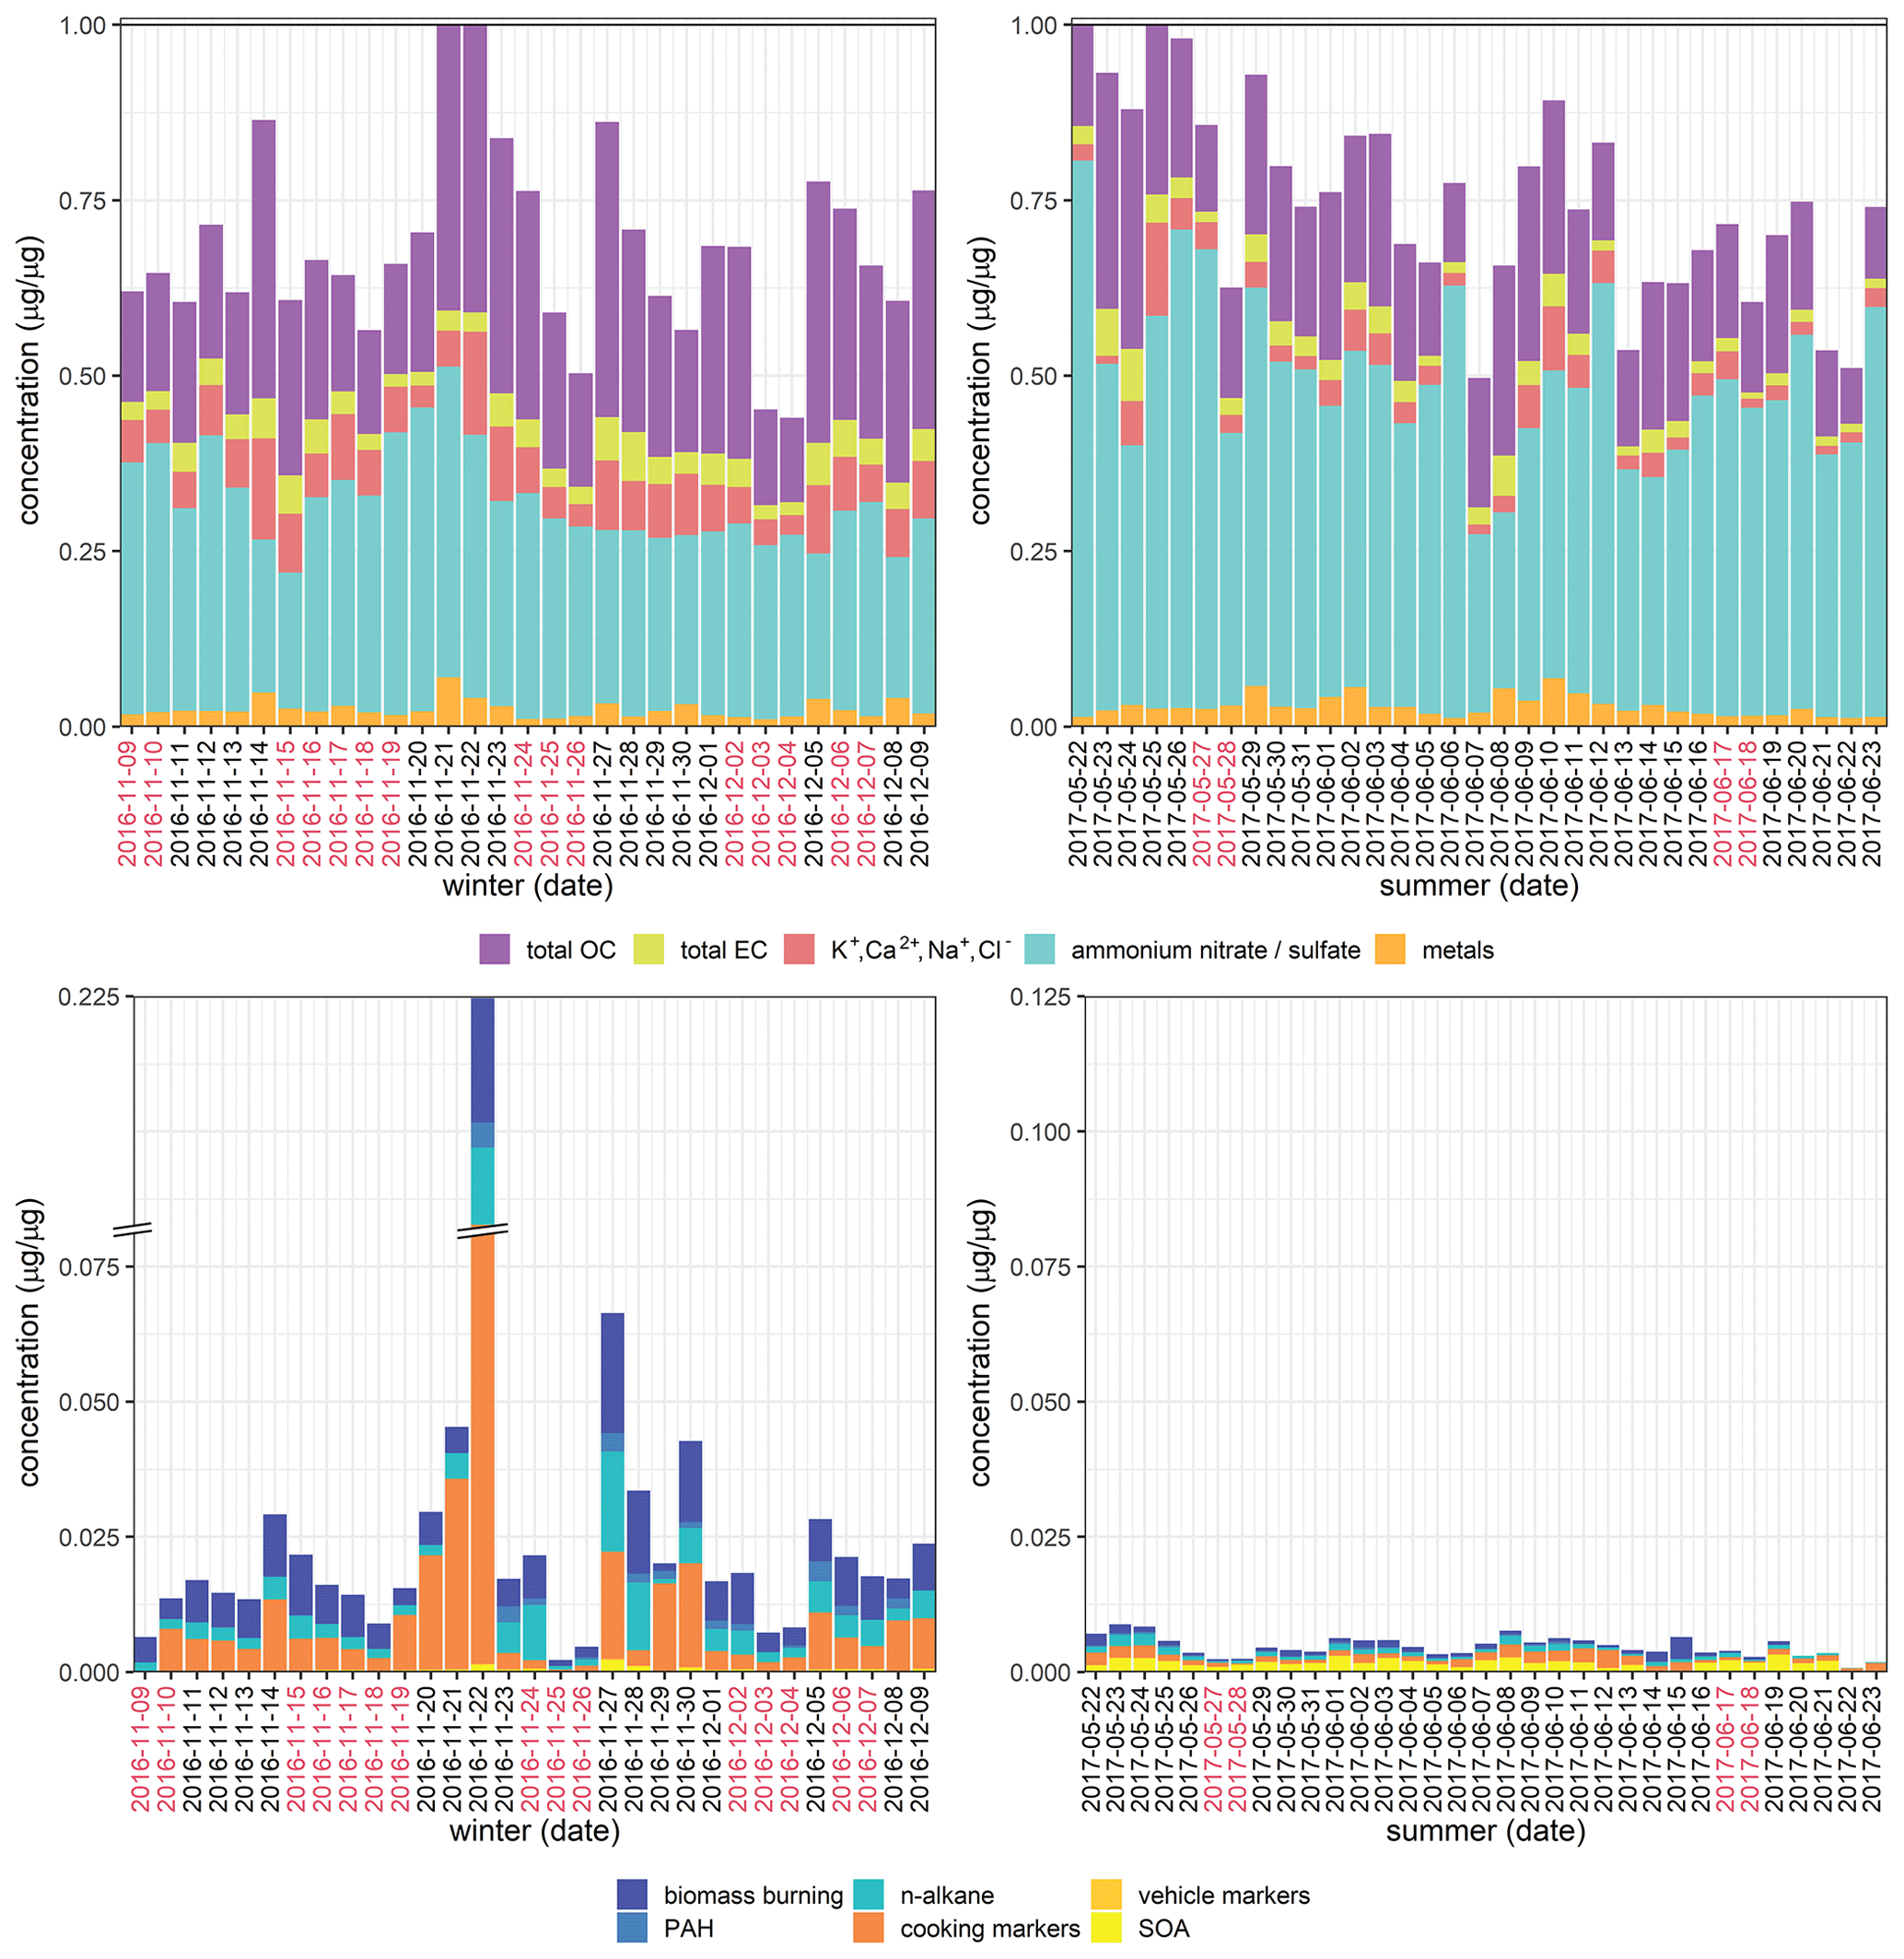
Figure 4Stacked bar plots of total concentrations for mass-normalised data. OC: organic carbon; EC: elemental carbon; PAH: polycyclic aromatic hydrocarbon; SOA: secondary organic aerosol. “Metals” is the summed concentrations of Al, Ti, V, Cr, Mn, Fe, Co, Ni, Cu, Zn, Cd, Sb, Ba, Pb; “biomass burning” is the summed concentrations of palmitic acid, stearic acid and cholesterol; “PAH” is the summed concentrations of naphthalene, acenaphthylene, acenaphthene, fluorene, phenanthrene, fluoranthene, pyrene, benzo(a)anthracene, chrysene, benzo(b)fluoranthene, benzo(k)fluoranthene, benzo(a)pyrene, indeno(1,2,3-cd)pyrene, dibenzo(a,h)anthracene and benzo(ghi)perylene; “n-alkane” is the summed concentrations of C24, C25, C26, C27, C28, C29, C30, C31, C32, C33 and C34; “cooking markers” is the summed concentrations of palmitic acid, stearic acid and cholesterol; “vehicle markers” is the summed concentrations of 17a(H)-22,29,30-trisnorhopane (C27a) and 17b(H),21a(H)-norhopane (C30ba); “SOA” is the summed concentrations of 2-methylthreitol, 2-methylerythritol, 2-methylglyceric acid, cis-2-methyl-1,3,4-trihydroxy-1-butene, 3-methyl-2,3,4-trihydroxy-1-butene, trans-2-methyl-1,3,4-trihydroxy-1-butene, C5-alkene triols, 2-methyltetrols, 3-hydroxyglutaric acid, cis-pinonic acid, acid, MBTCA, β-caryophyllinic acid, glutaric acid derivative, 3-acetylpentanedioic acid, 3-acetylhexanedioic acid, 3-isopropylpentanedioic acid and 2,3-dihydroxy-4-oxopentanoic acid. Dates marked in red indicate partial or total day haze events as described in Shi et al. (2019). Measurement uncertainty values were unavailable for most data types, and for selected dates in the upper plots, the sum of the total mass measurements is slightly more than 1 (i.e. more than 1 µg per µg); for these dates, the data have been proportionately scaled. It should be noted that the OC measurement in the upper plots incorporates the variety of organic carbon species represented in the lower plots.
Rs values calculated for OPv and OPm with individual compositional measurements have strikingly different univariate correlations, as illustrated in correlation heat maps (Fig. 5). Cumulative scores, referring to the number of Rs correlations ≥ 0.5 for OPm and OPv (Table S3), demonstrate that for all assays, considerably more significant correlations are observed for OPv in the winter compared to OPm. For both OPv and OPm, all assays show more statistically significant correlations in winter compared to summer, particularly for the AA response (AAm, n=54 winter, n=15 summer, AAv, n=67 winter, n=4 summer).
Volume-based correlation analysis (Fig. 5a) indicates that a very large number of the 107 atmospheric components measured in this study correlate statistically significantly with all four assays. The large number of correlations in the volume-normalised data indicate strong collinearity between concentrations of chemical components in PM2.5 and overall PM2.5 mass concentrations likely due to meteorological processes, complicating analysis of the sources and processes contributing to OP variability in particles. However, the mass-based analysis (Fig. 5b) reveals that the mass fractions of chemical components and sources to which the four assays are sensitive to differ significantly (further illustrated by the weaker inter-assay correlations shown in Table 1), which demonstrates that mass-based analysis of OP data is also important to elucidate atmospheric processes and particle sources responsible for the different OP metrics.

Figure 5Heat maps demonstrating the correlation of OP, expressed as volume-normalised OPv (a) and mass-normalised OPm (b) vs. a range of additional measurements conducted during the APHH campaign. Red indicates positive correlation; blue indicates inverse correlation. For OPm, particle-phase components are also mass-normalised (µg per µg PM2.5), and for OPv the components are volume-normalised (µg or ng per m3).
A range of transition metals were all positively correlated with AAm and DTTm, including V, Cr, Mn, Fe, Co, Ni, Zn, Cd and Pb (all Rs ≥ 0.5, p<0.05). This reinforces the importance of their contribution to urban PM2.5 and potential to substantially influence PM2.5 OP, particularly Fe, Cr, V and Co, which are commonly major components of vehicle emissions and which can undergo redox-cycling reactions producing ROS (Charrier et al., 2014; Shen and Anastasio, 2012; Valko et al., 2005) contributing to higher AAm and DTTm in the winter compared to the summer. Stronger correlations between Fe and AAm are observed in the winter (Rs 0.73) compared to summer (Rs 0.48) despite Fe concentrations (µg µg−1) being lower in winter samples than summer samples, again highlighting the enhanced role of redox-active transition metals in winter. It is not established whether this seasonal difference is related to the chemical availability (i.e. redox state, solubility, speciation) of Fe, to the variability of emission sources of Fe between the seasons or to some other important unknown additional contribution of Fe to AAm in the summer; complexation of Fe in PM may differ between seasons, and the ligands directly influence the redox state and thus the bioavailability of the metal (Ghio et al., 1999). Ultimately, the direct correlation of transition metals measured only by inductively coupled plasma mass spectrometry (ICP-MS) with OP does not adequately reflect the nuances in redox behaviour of these species when they are complexed with organic ligands (Calas et al., 2017), as well as their range of oxidation states; this represents further gaps in the standard chemical (and particularly the transition metal and TM complex) characterisation of PM. The epidemiological effects related to bioavailability of the metal when complexed (Costa and Dreher, 1997) in humans are also still not fully explored, although it is clear from multiple atmospheric and clinical studies that complexation affects transition metal uptake both in the atmosphere and in the body. Interestingly, a mild inverse correlation of Fe with DCFHm is observed (Table S8), which may be linked to the destruction of particle-bound organic peroxides by Fe via Fenton-type chemistry (Charrier et al., 2014), a process which the DCFH assay is specifically sensitive to (Gallimore et al., 2017; Wragg et al., 2016) and which has been observed in other recent studies (Paulson et al., 2019). No significant positive correlation between any metals measured in this study and DCFHm and EPRm was observed. Few EPR studies have looked specifically at superoxide formation, as is the case here, but those conducted so far show that EPR specifically detecting O is less sensitive to transition metal chemistry compared to traditional EPR methods focussing on OH formation.
In the summer, from the measured transition metals, only Fe correlated significantly positively (Spearman p value < 0.05) with DTTm and AAm response (Rs=0.48, 0.51 respectively), whereas in the winter, DTTm and AAm correlated with a number of transition metals, including V, Cr, Mn, Fe, Co, Ni, Zn and Cd. Of particular note, AAm is mildly correlated with Cu in winter samples (Rs 0.48), whereas no correlation is observed between DTTm and Cu in either winter or summer, in agreement with a recent online DTT study also (Puthussery et al., 2020). In contrast, previous reports from other locations have implicated Cu as a dominant contributor to DTT oxidation, considering volume-normalised and mass-normalised data (Calas et al., 2018; Charrier et al., 2015). Interestingly, in contrast with OPm, strong correlations (Rs>0.6) are observed in this study between AAv, EPRv, DCFHv, and DTTv and Cu in the winter, but poorer correlations are observed in the summer for all assays (Rs<0.39). Higher average Cu concentrations in winter compared to summer (winter = 17.7 ng m−3, summer = 4.9 ng m−3) may explain the higher Rs observed for Cu vs. OPv in winter compared to summer, whereas mass-normalised concentrations of Cu are more similar between the seasons. Poor correlation of Cu concentrations with AAm and DTTm response in winter may hint at more insoluble Cu complex formation observed at this site in Beijing, as predominantly water-soluble Cu participates in redox reactions; therefore the sensitivity of AA and DTT towards Cu probably depends on the soluble fraction of Cu (Bates et al., 2019; Charrier and Anastasio, 2012; Fang et al., 2016). Furthermore, the presence of organic chelating ligands in PM may reduce the redox activity of Cu and Fe (Charrier et al., 2014; Charrier and Anastasio, 2011; Shen and Anastasio, 2012).
Correlations between AAm and DTTm with total OC are observed in both summer and winter (Tables S6 and S7), and with total EC in the winter season, whereas DCFHm is negatively correlated with total OC (Table S8). In contrast, DCFHm is positively correlated with MOOOA and LOOOA, whereas DTTm and AAm show no correlation and even exhibit slight negative correlations with MOOOA and LOOOA in both summer and winter. This potentially indicates that the MOOOA and LOOOA AMS fractions, typically associated with water-soluble organic carbon content (Verma et al., 2015b), may contain higher concentrations of particle-bound ROS (i.e. organic peroxides) as measured by DCFHm, but on a per-mass basis these species may contribute less significantly to AAm and DTTm compared to redox-active transition metals and other organic components. Total OC and EC correlations with AAm and DTTm may relate to concentrations of redox-active organic components such as oxidised PAHs and quinones, which may not be represented by MOOOA and LOOOA factors and which have been shown to significantly contribute to DTTm (Chung et al., 2006; McWhinney et al., 2013b).
Significant correlations are also observed between AAm and a range of n-alkanes and hopanes (17a(H)-22, 29, 30-trisnorhopane (C27a) and 17b(H)-21a-norhopane (C30ba), Table S6), markers of primary organic aerosol emitted from vehicles (Schauer et al., 1999; Subramanian et al., 2006). Although these species are not redox-active, they are co-emitted with redox-active transition metals such as Fe, V and Cu from vehicle activity, either directly (Bates et al., 2019) or via dust resuspension, and other organics contributing to SOA (Platt et al., 2014) and highlight the potential importance of vehicular emissions on AAm. Vehicular emissions and dust resuspension have been previously shown to be the dominant sources of Cu and Fe in Beijing (Gao et al., 2014). EPRm, DTTm and DCFHm responses do not show any significant correlations with these organic traffic markers.
Notably, AAm correlates well with cis-pinonic acid, pinic acid and 3-methyl-2,3,4-butanetricarboxylic acid (MBTCA) in both seasons, all of which are biogenic SOA markers and products of α-pinene oxidation, with MBTCA a marker for OH-initiated ageing of first-generation α-pinene oxidation products (Müller et al., 2012). AA sensitivity towards α-pinene SOA has been demonstrated previously (Campbell et al., 2019b; Tong et al., 2016). Although these three carboxylic acids are also not redox-active, they may correlate with the formation of particle-bound ROS such as peroxides or peroxy acids in SOA (Steimer et al., 2018), or with species that decompose and liberate ROS upon extraction (e.g. Tong et al., 2017); these processes are highly likely to contribute to AAm, highlighting the assay's potential sensitivity to redox-active particle-phase components and particle-bound ROS. Generally, DTTm has been previously shown to be relatively insensitive to SOA as observed here (Bates et al., 2015; Verma et al., 2015b), and both DTTm and DCFHm correlate poorly with the SOA markers analysed in the present study (Tables S7 and S8).
Compared to the three other assays, few significant correlations are observed between EPRm and additional measurements, despite the much better correlations with the EPRv data, particularly for the summer samples. However, seasonality in the EPRm response is still observed, with substantial variability in the mass-normalised EPRm response (≈ factor of 10 in the summer, factor of 2 in the winter, Fig. 3). Therefore, we observe differences in aerosol composition influencing EPRm, but with the current comprehensive measurements we are unable to determine the specific PM2.5 components responsible for the observed EPRm. As an example, recent studies have found associations between peroxide-containing highly oxygenated molecules (HOMs) in PM2.5 and superoxide formation in water (Chowdhury et al., 2019; Tong et al., 2019; Wei et al., 2021); thus HOMs, which were not measured in this study, could have contributed towards the observed EPRm variability.
The univariate analysis presented here clearly shows that OPm enables a more nuanced identification of aerosol components influencing the oxidising properties of PM2.5 as compared to OPv. Many more correlations are observed when considering volume-normalised OPv, likely related to collinearity of species with overall PM2.5 mass concentration due to meteorological effects. Metal and organic tracers of traffic emissions (exhaust and non-exhaust) such as Fe, Cu, and hopanes and SOA markers show especially strong correlations with AAm, whereas the other three OPm metrics (DTTm, DCFHm and EPRm) provide a less clear picture.
3.3 Multivariate modelling of OP from measured components
To assess potential latent influences from the individual components on assay response and hence on OP, a systematic multivariate analysis was undertaken. Initially, principal component analysis was applied to the whole set of independent measurements excluding the OP assay responses (i.e. the values to be predicted by the models) to investigate which contributed most to the variation in the data, whether there were relationships between measurements which characterised OP and if the OPm response could be predicted from the individual component measurements.
In the PCA model, the seasonal variation within the samples was clearly apparent (Fig. 6). The first four principal components (PCs) accounted for 68.2 % of the observed variation in the dataset (R2 or goodness of fit), of which 50.5 % was stable through 7-fold cross-validation (Q2, or model variation accounted for through cross-validation), indicating about half of the variation in the model was robust with respect to sample score prediction. The loadings plot (Fig. 7) indicated that seasonality in the first principal component was related to increased PAHs (Feng et al., 2019), n-alkanes (He et al., 2006) and biomass burning markers (He et al., 2006) in winter, as well as increased ozone (Zhao et al., 2018), ambient temperature and selected SOA markers (including 2-methylerythritol (Liang et al., 2012), and 2-methylglyceric acid (Ding et al., 2016; Shen et al., 2018)) in summer, findings which are consistent with existing volume-based studies. When scores were coloured by OP, the AAm (Fig. 6a), DTTm (Fig. 6c) and DCFHm (Fig. 6d) assay responses could be observed in the second and sometimes also the first principal components (although the EPRm response demonstrated no specific trend, Fig. 6b). When loadings plots were examined by general measurement category (Fig. 7), it was observed that some categories of measurements cluster together (e.g. PAH, n-alkanes, NOx, temperature, relative humidity), but this appeared to be related to strong correlation of these species with the OPm measurement and known compound behaviour rather than to measurement bias, as other categories showed broader variation (e.g. inorganic and small organic ions, gases, metals and SOA markers).

Figure 6Principal component analysis score plot of all data. (a) Coloured by AAm response; (b) coloured by EPRm response; (c) coloured by DTTm response; (d) coloured by DCFHm response. Both principal component 1 and principal component 2 demonstrate variance associated with AA and DTT response, and there is greater variation associated with the winter response than the summer response (highlighted in panel a). PC 1 R2X 35.90 %, Q2 29.28 %; PC 2 R2X 19.34 %, Q2 23.73 %; the model included six principal components, with a cumulative R2X of 68.2 % and Q2 of 50.5 %.

Figure 7Principal component analysis loadings plot for all data points. Points are coloured by measurement category; fully labelled loadings are provided in Fig. S14. The plot is annotated with the same orientation as the score plot to indicate the direction of visualised trends for selected assays and for season from the latent variable origin as shown in Fig. 6. In PC 1, the winter classification is driven by increased gas radicals, n-alkanes, PAH, vehicle markers, biomass burning markers, total OC and selected metals and SOA markers; the summer classification is driven by increased temperature and photolysis, ozone (the single gas species in this section of the plot), selected SOA markers and metals, and selected VOCs. In PC 2, high AAm and DTTm response is associated with increased SOA, transition metals, cooking markers, n-alkanes and PAH concentrations in samples; low AAm and DTTm response associated with low VOCs, gases and selected meteorological parameters (relative humidity).
Partial least squares regression (PLSR) is a supervised regression extension of PCA, which models the variation in the data which is associated with a predefined sample classification (Eriksson et al., 2013). PLSR models were constructed for each individual OP assay and season to examine the most specific markers associated with seasonal assay response. Table 2 provides the performances for all PLSR models of OP assay response, and example PLSR score plots for all AAm and DTTm models are illustrated in Figs. 8 and 9 (analogous plots for other assays provided in Figs. S18 and S19). The performance indicators show that while the mass-normalised measurement data can be used to explain (R2) and predict (Q2) a large majority of the variation associated with AAm summer/winter and DTTm winter assay response, the other assay responses were less consistent; R2 and Q2 values for these models indicated that less than 70 % of the variance in response can be predicted from the individual component measurements, and the predictions were much less stable through cross-validation. These results could suggest either that assay responses are not as adequately sensitive at µg µg−1 concentrations as for the total PM per sample, or that a proportion of the OPm response is contributed to by species not measured directly in this campaign and which cannot also be inferred from total organic carbon measurements. As total OC is estimated from combustion properties of the sample rather than from a sum of individually validated component measurements, and as multiple organic and transition metal–organic complexed species contribute to the total OC measurements with unknown redox properties, these observations reiterate the need for more comprehensive chemical characterisation of PM. Similar to the univariate correlations, the summer samples were less well modelled in both mass-normalised and volume-normalised data, indicating either inadequate assay sensitivity (which may be compounded by the reduced collected filter PM mass in summer) or the influence of unmeasured components.
Table 2Performance assessment of PLSR models for all assays, for both mass-normalised and volume-normalised data. Models are considered to perform well when both cumulative (i.e. across all latent variables included in the model) R2 and Q2 values are high, or at a minimum where Q2 values are within 10 % of the R2 value, indicating that the variance is well accounted for in model cross-validation. Permutation tests were rejected for robustness if any single random permutation model performance surpassed the performance of the real cross-validated model; on this basis, the winter DCFHm and summer DTTv models were rejected (highlighted with *), although fewer than three random models outperformed the real model, and none of the permuted model Q2 values outperformed those of the real model.
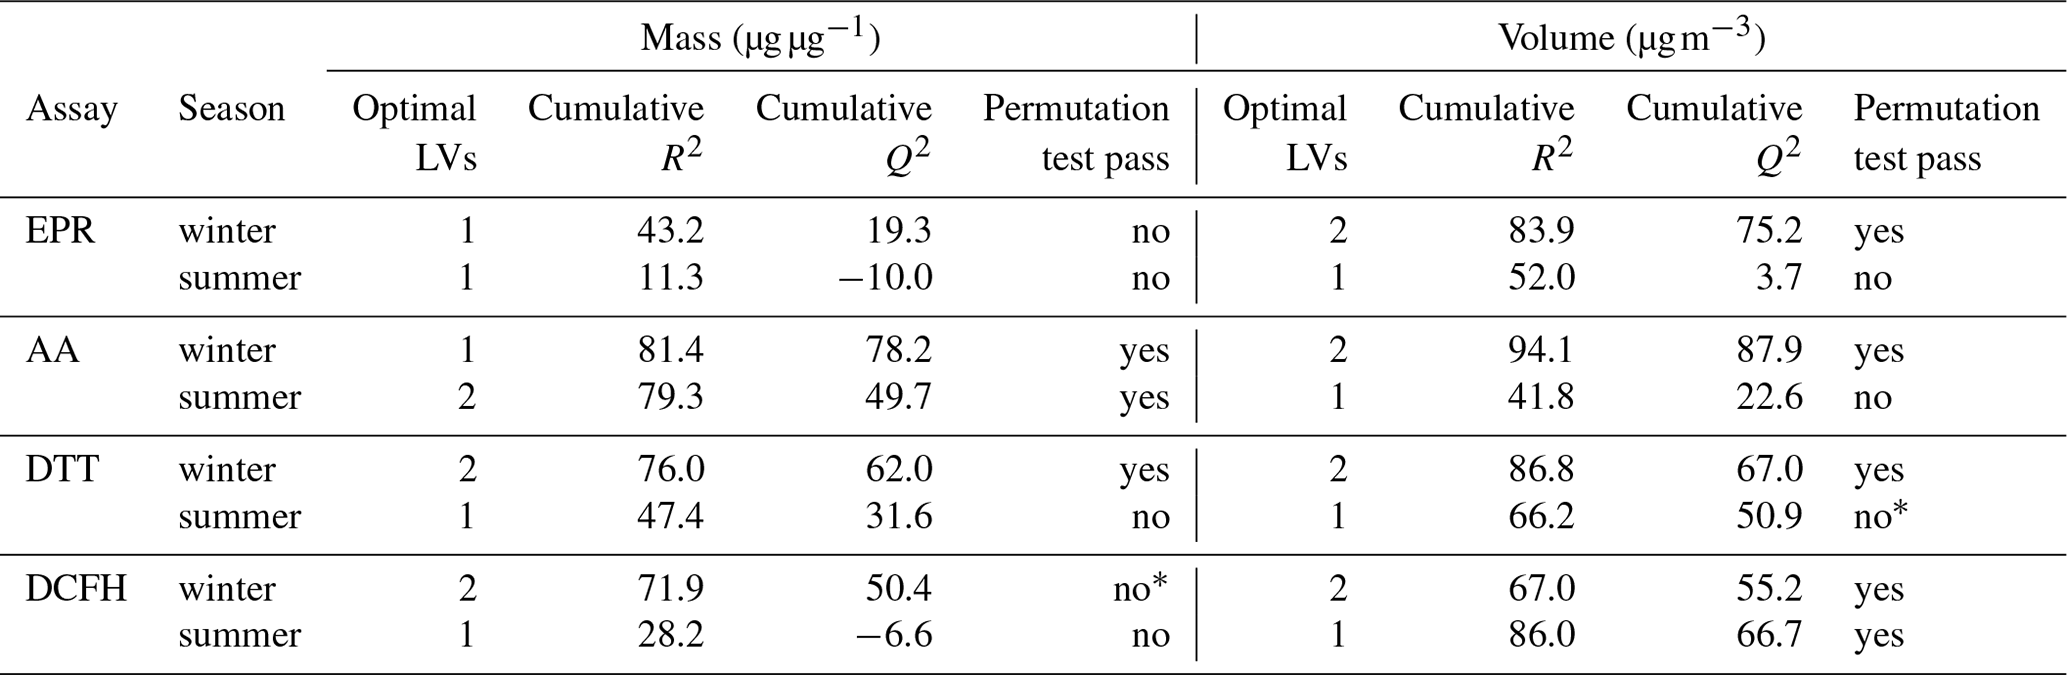

Figure 8PLSR score plot for AAm assay. Model performance parameters given in Table 2. (a) Winter samples; (b) summer samples. Points coloured by overall AA assay response for both seasons. Red bar indicates 2× SD for all scores; orange dotted line indicates 1× SD for all scores. Models which have only one latent variable have the x axis replaced by date for easier visualisation.
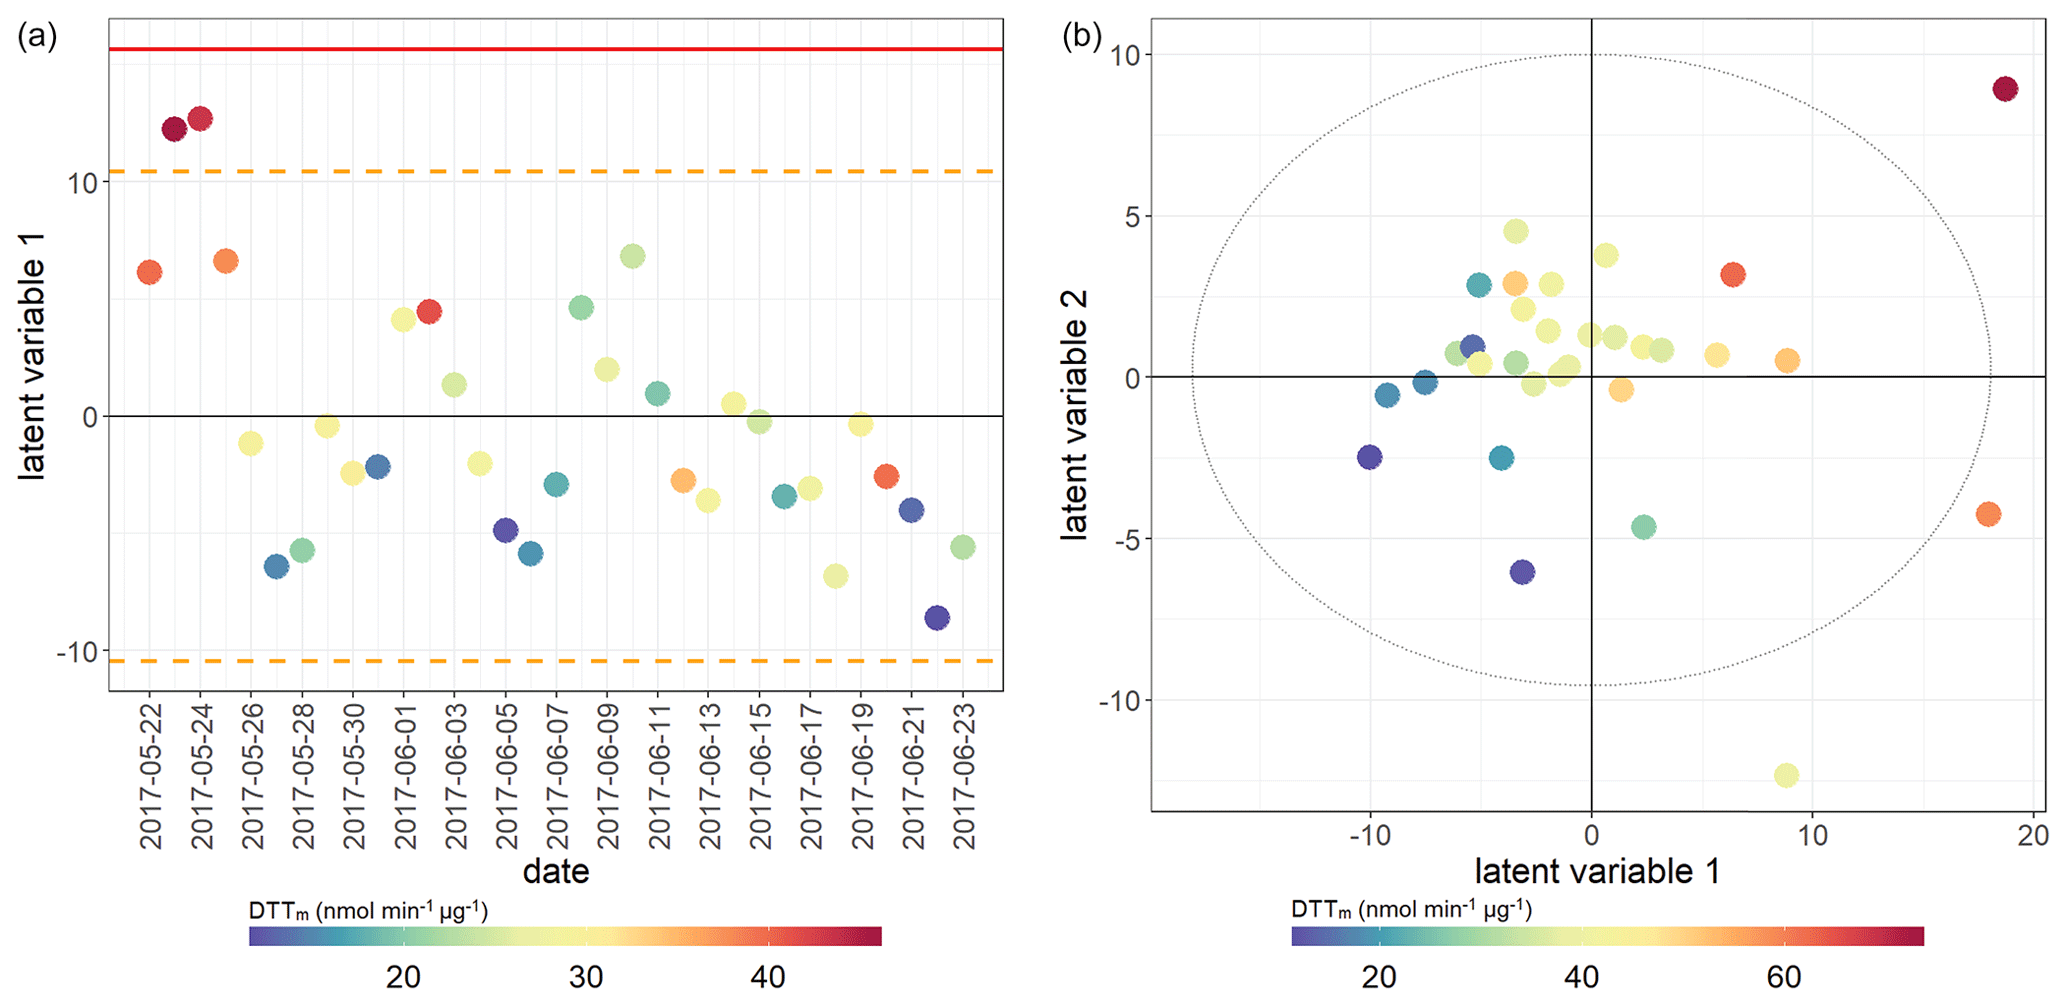
Figure 9PLSR score plot for DTTm assay. Model performance parameters given in Table 2. (a) Winter samples; (b) summer samples. Points coloured by overall DTT assay response for both seasons.
Table 3Characteristic loadings most influential in PLSR models of OPm as defined by ordered variable importance in projection for each model. Upward arrows indicate positive correlation with the assay measurement, downward arrows for inverse correlation and * for p<0.05 in Spearman correlation of the feature with the assay in the univariate analysis.
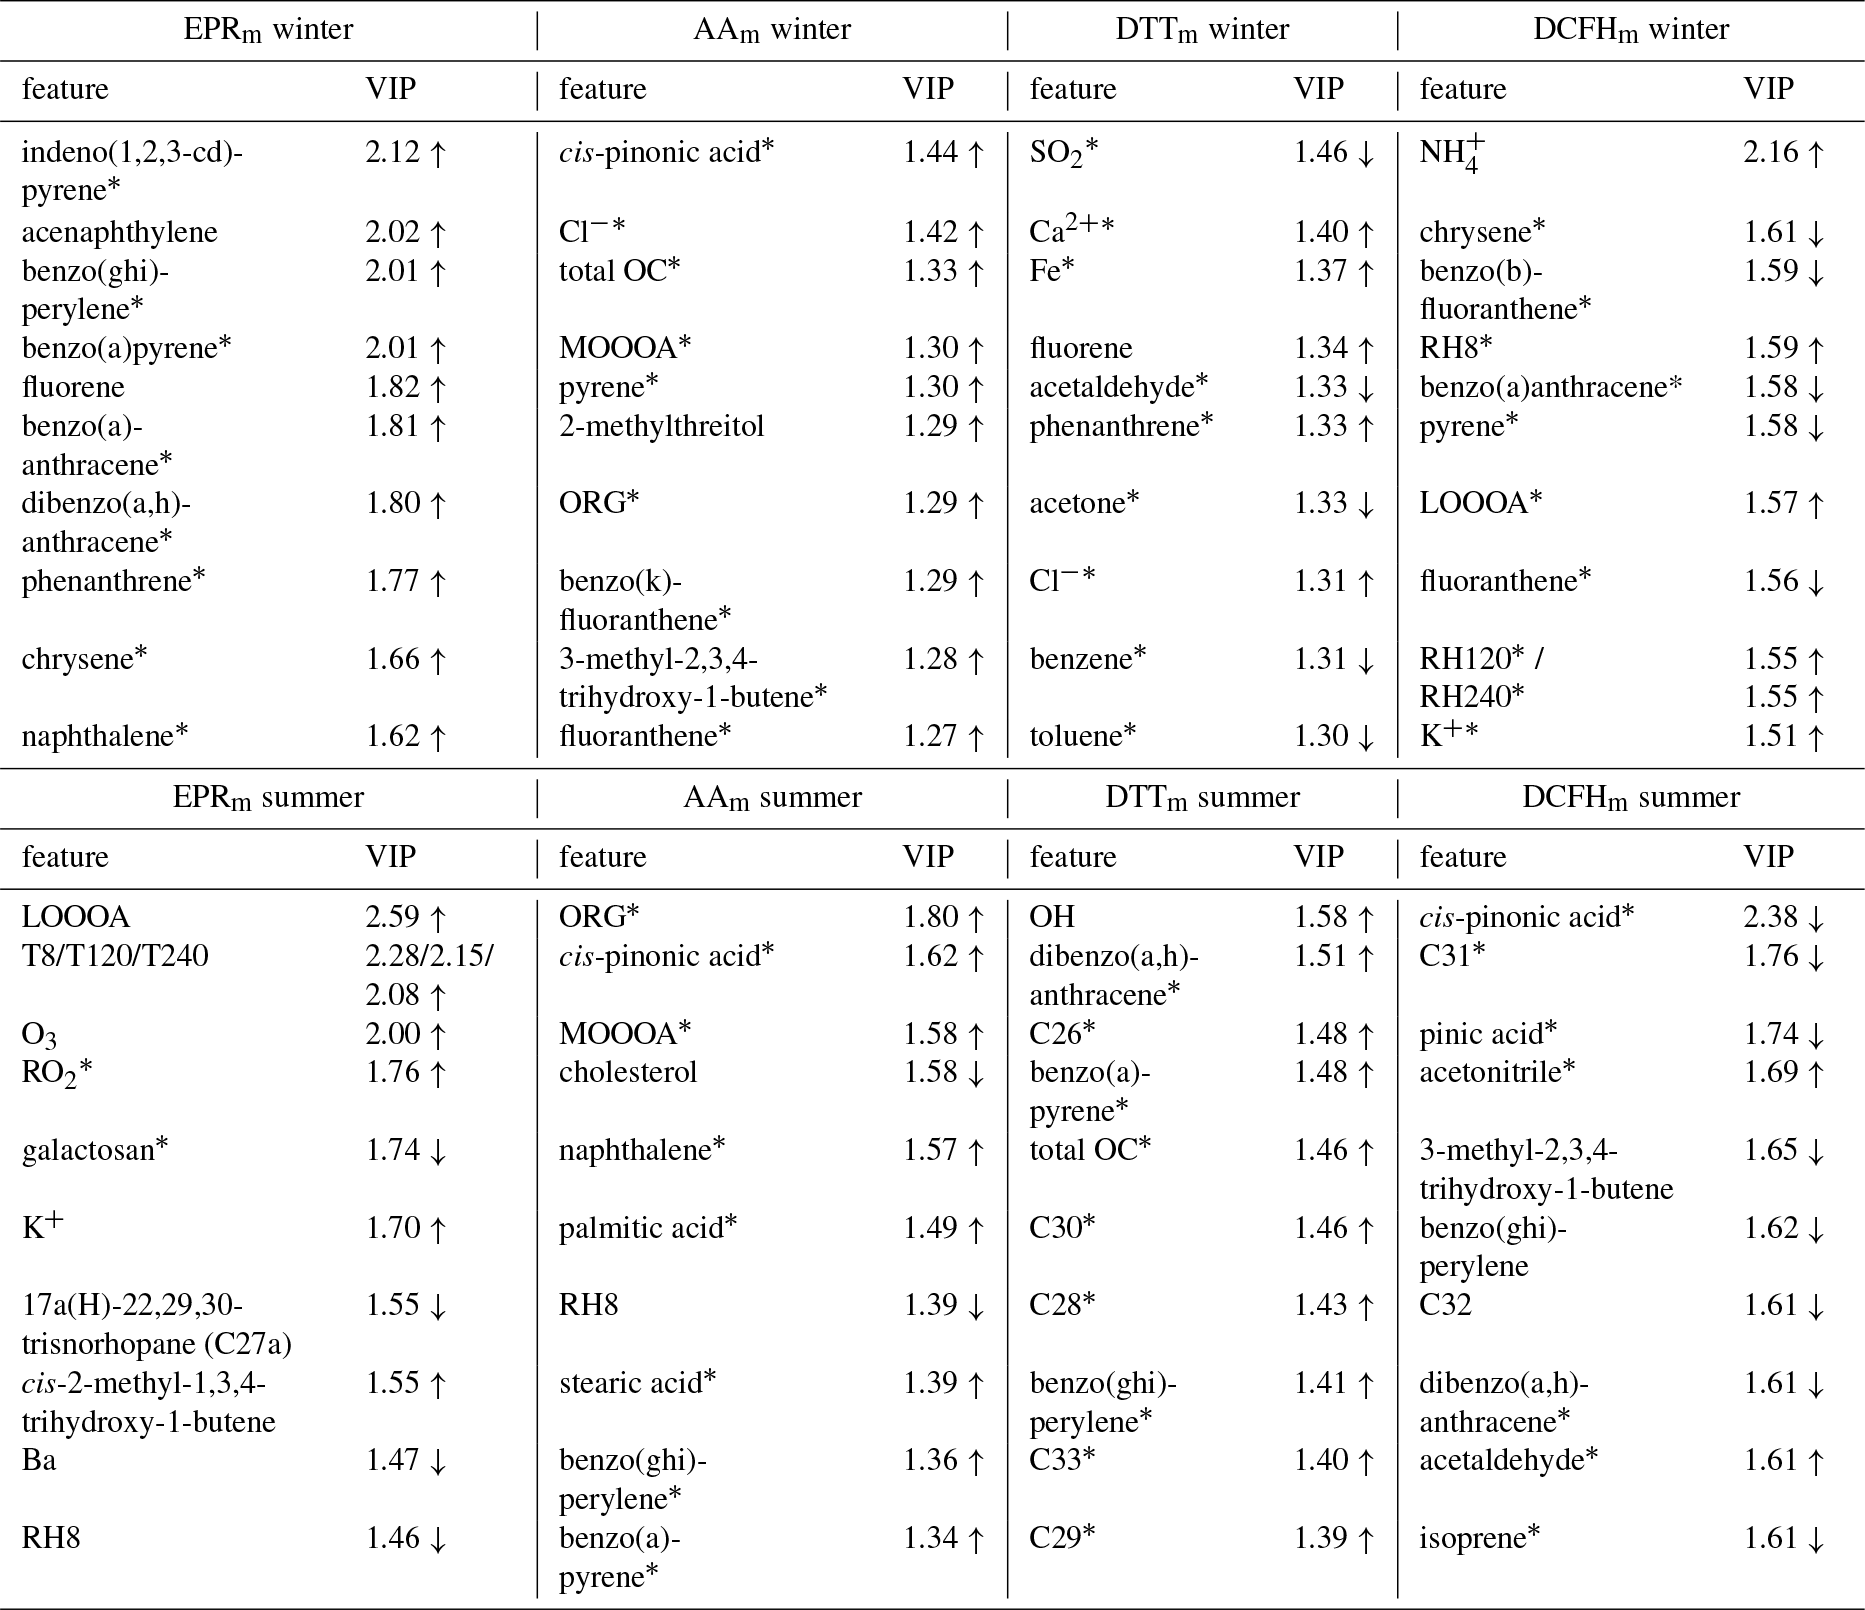
Table 3 shows the top 10 features in the variable importance in projection (VIP) for the PLSR loadings, which enable a ranking of the features which contribute most to the model (Naes and Martens, 1988). It is evident from these data that the features which best model the OPm seasonal response are derived from multiple particle sources and atmospheric ageing processes. For example, the AAm and DTTm responses show similar trends in the multivariate models, but the main contributors to their responses have little overlap, with AAm responses being more strongly associated with SOA tracers, PAHs, and general measures of organic carbon and the DTTm responses more characterised by combustion and vehicle emissions markers (Figs. S19–S22; Figs. S17–S24 list the top 50 contributors to each assay model response). Notably, compounds which are not generally recognised as being redox-active were frequently observed to be important in PLSR classification, and though they do not directly contribute to the OPm response, they are likely to be co-emitted with or be secondary products of redox-active particle components.
3.4 Multiple linear regression (MLR) modelling to predict OPm associated with specific sources
While multivariate model loadings highlighted the measurements most associated with assay response, multivariate models are not always amenable to variable selection, which is important to characterise the chemical profiles contributing to each assay OP response. Multiple linear regression modelling has been used in previous studies (Calas et al., 2018) to establish contributors to total OP response, rather than looking at source apportionment from PMF models in relation to OP, and only simple forward variable selection was used for model refinement. In the present study, relevant measurements were grouped into six categories of known contributors to Beijing PM (biogenic SOA, biomass burning, coal and fossil power generation, cooking, dust, and vehicle emissions). The full method description, references, model formulae and performance parameters for the mass-normalised data models are presented in the methods (Sect. 2.3 “Statistical analysis”) and in Sect. S10. Briefly, literature sources (Table S13, Sect. S10) and the SPECIEUROPE database (Pernigotti et al., 2016) were used to establish which individual chemical measurements were likely to be characteristic of each source, with several measurements appearing in multiple categories (e.g. total EC). All proxy and composite measurements (except total EC, as multiple organic carbon species are represented in the dataset, but elemental carbon should be independent of the majority of these), AMS measurements, and general atmospheric measurements including temperature, relative humidity and actinic flux measurements were excluded from models entirely. Composite measures duplicate selected individual measurements; atmospheric measurements complicate model interpretation and are more likely to be useful as random effects terms in a mixed effects model approach (not pursued in the present study due to the complexity of model parameterisation and measurement uncertainties). Multiple linear regression models were then constructed for each assay and season for each category, using both mass-normalised and volume-normalised data.
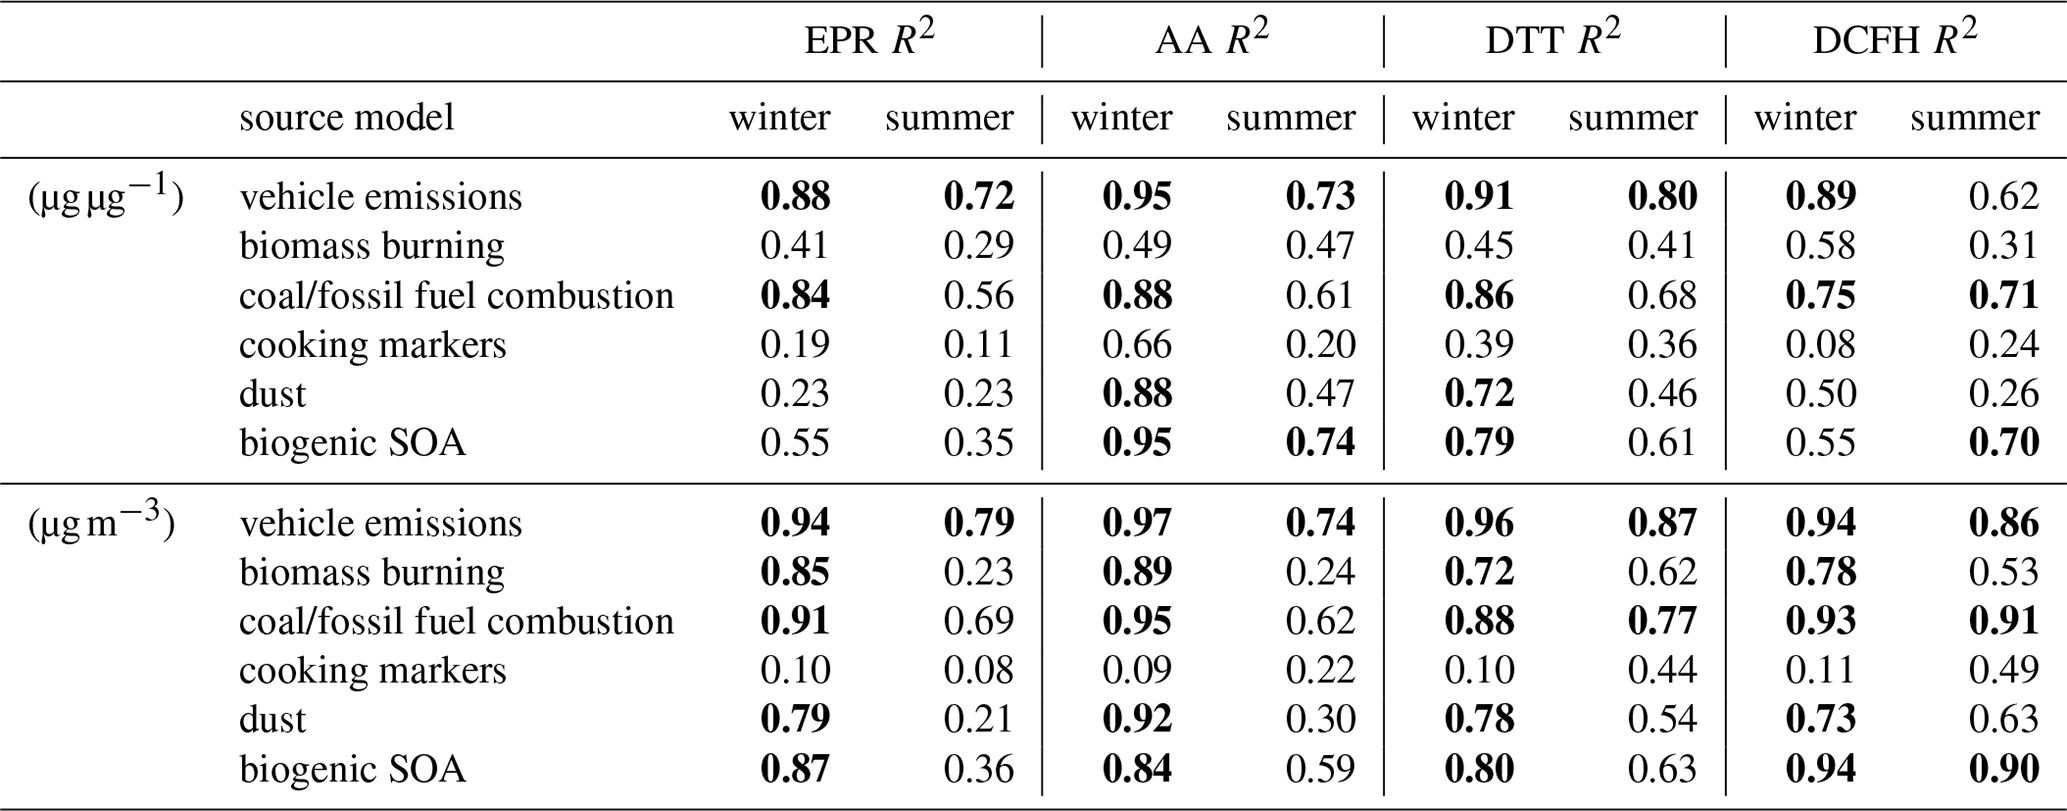
MLR models further reinforced that not all putative sources and components of PM2.5 contribute equally to OPm response (Table 4). OPm assay response models based on measurements characteristic of vehicle emissions, coal/fossil fuel combustion and biomass burning gave accurate and robust predictions of OPm, and these are important contributors to PM (reported as mass per volume) in Beijing urban background sites (Yu et al., 2013; Zheng et al., 2005). As expected, OPv models also gave very good predictions for these source profiles but additionally gave improved models of OPv for biogenic SOA and dust compared with the OPm data. Although the same base sets of predictors for each source were used for each model (season, OP assay and PM normalisation), there was only partial overlap of the final selected predictors between models from the same source and season, again illustrating the complex dynamic between OP and overall mass/volume composition. As with the PLSR models, the most important contributors to regression models were often not redox-active species, indicating that they are probably influencing or contributing to the oxidation state of the redox-active PM components. As observed in the univariate and multivariate analyses, the summer samples gave less robust linear regression models (and thus OP predictions) from both mass- and volume-normalised data. However, AA and DTT measurements produced the best models for all source contributions, indicating that these assays might be most optimal for measuring OP in an urban environment, as they appear to reflect the variety and composition of PM sources well.
Vehicle emissions, biogenic SOA and winter biomass burning contributions to AA and DTT response (as measured by the model R2 value) were generally comparable across both assays, contrasting with the findings of Fang et al. (2016), who observed greater OP response in positive matrix factorisation–chemical mass balance (PMF-CMB) models associated with traffic emissions for AAv over DTTv, as well as biomass burning for DTTv over AAv in multiple locations in the southeastern United States. However, a more recent study conducted in the coastal areas adjacent to Beijing (Liu et al., 2018) observed similar seasonality to the present study in the DTT OPm response. Vehicle emissions (Wang et al., 2016; Yu et al., 2019), coal combustion (Ma et al., 2018; Yu et al., 2019), biomass burning (Ma et al., 2018) and dust (Yu et al., 2019) sources have been shown in other studies using PMF models to contribute to OPv in Beijing, all using the DTT assay. Cooking markers (palmitic acid, stearic acid and cholesterol) contributed a substantial proportion of the known organic fraction of the PM mass and volume concentrations (see Fig. 4) but did not contribute robustly to the modelled OP response for either normalisation type, suggesting that either (i) they are not strongly contributing to or affected by oxidative conditions in PM or (ii) their variation over the sampling period cannot be linearly modelled. Similarly, biomass burning markers contribute a comparable number of variables in the model base sets but appear to contribute much more significantly to the OPv than to the OPm response. Biogenic SOA and dust models (which incorporate K+, Na+, Ca2+, Cl−, Al, Ti, Mn, Fe and Zn) explained a significant proportion of winter OPv responses but were only strongly correlated with winter AA and DTT for mass-normalised models. These observations suggest these sources contribute to PM OPv by total quantity rather than through their particularly high intrinsic OP – i.e. their mass as a proportion of the PM mass is smaller, but their concentration per volume is high – and the AA and DTT assays have a notable selectivity for these species over the EPR and DCFH assays.
It should be noted that the MLR models represent a sub-optimal prediction of the OP response from measured components, as numerous species which are known source components (e.g. PAHs from combustion processes and those which distinguish gasoline from diesel vehicle emissions, or VOCs relevant to biomass burning such as methanol or acrolein) could not be included in models. Not all measurements which were associated in the literature with a particular assay response passed the stages of variable selection for mass-normalised models, which could reflect a lower limit of detection either in the OPm assay responses or in the individual component measurements. Synergistic effects between individual measured components (e.g. transition metals with organic components such as quinones or carboxylic acids, Wang et al., 2018) cannot be interpreted from linear models when the complexation and oxidation states of the contributing compounds are essentially unknown. MLR models do not fully account for the proportion of each measurement which may originate from multiple emissions sources, and PMF-CMB or mixed effects models can address this issue more adequately. Validation of both the multivariate and MLR models using secondary datasets (both from Beijing and other locations) is also needed prior to their future implementation.
Table 4R2 values for optimised subset multiple linear regression models of relevant source contributions. R2 values greater than 0.7 are highlighted in bold. Full model performance indicators are provided in Sect. S11 of the Supplement, including all model terms, residuals, coefficients and p values.
This study presents a detailed and comprehensive analysis of PM2.5 oxidative potential and particle-bound ROS concentrations measured in winter 2016 and summer 2017 during the APHH-Beijing campaign at a central site in Beijing, China. Four acellular methods for measuring OP were applied, providing a broad assessment of the oxidative properties of particles including particle-bound ROS concentrations, superoxide radical production and catalytic redox activity. We correlated the acellular assay responses with an extensive and comprehensive dataset including 107 additional atmospheric measurements (particle components, trace gases, meteorological parameters) to delineate chemical particle components and atmospheric processes and sources responsible for driving PM2.5 OP. Higher volume-normalised and mass-normalised OP values across all assays were observed in the winter compared to the summer. An inverse correlation was observed between AAm and DTTm with overall PM2.5 mass concentrations; i.e. days with higher PM2.5 mass concentrations have lower intrinsic OP values. This is likely due to an increase in OP-inactive material in high PM2.5 mass days and/or a mass fraction that is at present undetermined and highlights that a focus on total PM exposure only does not necessarily capture accurately the oxidising properties and therefore certain toxicological effects of PM.
Univariate analysis with the additional 107 measurement parameters acquired during the APHH-Beijing campaign highlight significant assay-specific responses to chemical components of PM2.5, as well as a seasonal difference in what components drive aerosol OP. It also highlights the importance of considering both volume-normalised and mass-normalised OP metrics when drawing conclusions on the role of chemical composition on OP, as assay correlations vary significantly between the two metrics. The data presented in this study illustrate that mass-normalised OPm values provide a more nuanced picture of specific chemical components and sources that influence intrinsic OP, whereas many more correlations with OPv values are observed, likely due to collinearity of many chemical components with overall PM2.5 mass concentrations driven by changes in meteorological conditions. Both metrics, mass-normalised OPm as well as volume-normalised OPv, are important to consider with OPv a more relevant metric with respect to exposure and epidemiological studies, whereas OPm provides more insight into what sources and what composition drives OP concentrations in particles. Furthermore, OPm may allow easier study and site inter-comparisons.
The multivariate statistical analyses encapsulated the observations from the univariate analyses into comprehensive single models of OP relating to PM composition, mirroring the observations in the univariate analyses that OPm measured by each assay is related to different compounds present in the particle. It is clear from these differences that assay chemistry must contribute directly to its chemical selectivity, as the independent chemical measurements were given equal analytical weight with respect to each assay. The relationship between each assay and the independent measurements also confirmed that while there may exist a correlative relationship between an assay and non-redox-active compounds such as n-alkanes or PAHs, the assay is more likely to be measuring either secondary oxidation products of these primary compounds or species co-emitted that contribute to particle OP. This represents a gap in the chemical analysis of these samples, and more detailed redox-active compound speciation is required, especially for functionalised organics. Furthermore, variable selection of measurements and evaluation through multiple linear regression models indicated that OPm is well predicted by measurement panels characteristic of combustion sources, particularly (exhaust and non-exhaust) vehicle emissions and biogenic SOA. This study demonstrates further that these commonly applied acellular assays are sensitive to a wide and differing range of chemical components, highlighting the advantage of using these assays as a they encompass multiple chemical components and sources of aerosol into an integrated measurement. Further comprehensive work is needed to identify the direct links between these OP assays and biological and toxicology data.
All R code used for statistical data analysis and visualisation can be found at the Beijing GitHub repository, https://github.com/katewolfer/Beijing (last access: 6 April 2021, https://doi.org/10.5281/zenodo.4665696, Wolfer, 2021). All code was written by Kate Wolfer, except for the named package dependencies stated in the code.
All statistical analyses, processed data and model parameters are available in the Supplement. Raw data have not been made fully available as they will be used for additional publications. Selected raw data are available on request; please contact the authors.
The supplement related to this article is available online at: https://doi.org/10.5194/acp-21-5549-2021-supplement.
SJC collated data, analysed filters for AA and DCFH, performed data analysis and interpretation, and wrote the manuscript. KW performed univariate and multivariate statistical analysis, data interpretation and wrote the manuscript. BU, JW, ST and NS analysed filters for AA, DCFH, DTT and EPR respectively. TV provided XRF and additional data. AMS data were provided by YS. PAH data were provided by AE and AL. SOA tracer data were provided by DL, LL and PF. All other authors contributed to data analysis, interpretation and writing of the manuscript.
The authors declare that they have no conflict of interest.
This article is part of the special issue “In-depth study of air pollution sources and processes within Beijing and its surrounding region (APHH-Beijing) (ACP/AMT inter-journal SI)”. It is not associated with a conference.
We acknowledge the support from Pingqing Fu, Zifa Wang, Jie Li and Yele Sun from IAP for hosting the APHH-Beijing campaign at IAP. We thank Di Liu from the University of Birmingham; Siyao Yue, Liangfang Wei, Hong Ren, Qiaorong Xie, Wanyu Zhao, Linjie Li, Ping Li, Shengjie Hou and Qingqing Wang from IAP; Rachel Dunmore and James Lee from the University of York; Kebin He and Xiaoting Cheng from Tsinghua University; and James Allan and Hugh Coe from the University of Manchester for providing logistic and scientific support for the field campaigns.
This work was funded by the European Research Council (ERC grant 279405), the Natural Environment Research Council (NERC) (NE/K008218/1) and the Swiss National Science Foundation (200021_192192/1). This work has also received funding from the European Union's Horizon 2020 research and innovation programme through the EUROCHAMP-2020 Infrastructure Activity under grant agreement no. 730997. Sarah S. Steimer additionally acknowledges support from the Swiss National Science Foundation (fellowship P2EZP2_162258) and a 2017 LIFE postdoc fellowship by the AXA Research Fund. Zhi-Hui Zhang also acknowledges funding support from the Horizon 2020 Marie Sklowdoska-Curie Actions (MCSA) Grant (grant no. 792746).
This paper was edited by Maria Cristina Facchini and reviewed by two anonymous referees.
Acton, J., Hewitt, N., Huang, Z., and Wang, X.: APHH: Volatile organic compound (VOC) mixing ratios made at the IAP-Beijing site during the summer and winter campaigns, Centre for Environmental Data Analysis, available at: https://catalogue.ceda.ac.uk/uuid/de37c54e59a548ccb9f168ee724f3769 (last access: 18 June 2020), 2018.
Arangio, A. M., Tong, H., Socorro, J., Pöschl, U., and Shiraiwa, M.: Quantification of environmentally persistent free radicals and reactive oxygen species in atmospheric aerosol particles, Atmos. Chem. Phys., 16, 13105–13119, https://doi.org/10.5194/acp-16-13105-2016, 2016.
Atkinson, R. and Arey, J.: Mechanisms of the gas-phase reactions of aromatic hydrocarbons and pahs with oh and NO3 radicals, Polycycl. Aromat. Compd., 27, 15–40, https://doi.org/10.1080/10406630601134243, 2007.
Bates, J. T., Weber, R. J., Abrams, J., Verma, V., Fang, T., Klein, M., Strickland, M. J., Sarnat, S. E., Chang, H. H., Mulholland, J. A., Tolbert, P. E., and Russell, A. G.: Reactive Oxygen Species Generation Linked to Sources of Atmospheric Particulate Matter and Cardiorespiratory Effects, Environ. Sci. Technol., 49, 13605–13612, https://doi.org/10.1021/acs.est.5b02967, 2015.
Bates, J. T., Fang, T., Verma, V., Zeng, L., Weber, R. J., Tolbert, P. E., Abrams, J. Y., Sarnat, S. E., Klein, M., Mulholland, J. A., and Russell, A. G.: Review of Acellular Assays of Ambient Particulate Matter Oxidative Potential: Methods and Relationships with Composition, Sources, and Health Effects, Environ. Sci. Technol., 53, 4003–4019, https://doi.org/10.1021/acs.est.8b03430, 2019.
Biswas, S., Verma, V., Schauer, J. J., Cassee, F. R., Cho, A. K., and Sioutas, C.: Oxidative potential of semi-volatile and non volatile particulate matter (PM) from heavy-duty vehicles retrofitted with emission control technologies, Environ. Sci. Technol., 43, 3905–3912, https://doi.org/10.1021/es9000592, 2009.
Calas, A., Uzu, G., Martins, J. M. F., Voisin, Di., Spadini, L., Lacroix, T., and Jaffrezo, J. L.: The importance of simulated lung fluid (SLF) extractions for a more relevant evaluation of the oxidative potential of particulate matter, Sci. Rep., 7, 1–12, https://doi.org/10.1038/s41598-017-11979-3, 2017.
Calas, A., Uzu, G., Kelly, F. J., Houdier, S., Martins, J. M. F., Thomas, F., Molton, F., Charron, A., Dunster, C., Oliete, A., Jacob, V., Besombes, J.-L., Chevrier, F., and Jaffrezo, J.-L.: Comparison between five acellular oxidative potential measurement assays performed with detailed chemistry on PM10 samples from the city of Chamonix (France), Atmos. Chem. Phys., 18, 7863–7875, https://doi.org/10.5194/acp-18-7863-2018, 2018.
Campbell, S. J., Stevanovic, S., Miljevic, B., Bottle, S. E., Ristovski, Z. D., and Kalberer, M.: Quantification of Particle-bound Organic Radicals in Secondary Organic Aerosol, Environ. Sci. Technol., 53, 6729–6737, https://doi.org/10.1021/acs.est.9b00825, 2019a.
Campbell, S. J., Utinger, B., Lienhard, D. M., Paulson, S. E., Shen, J., Griffiths, P. T., Stell, A. C., and Kalberer, M.: Development of a physiologically relevant online chemical assay to quantify aerosol oxidative potential, Anal. Chem., 91, 13088–13095, https://doi.org/10.1021/acs.analchem.9b03282, 2019b.
Charrier, J. G. and Anastasio, C.: Impacts of antioxidants on hydroxyl radical production from individual and mixed transition metals in a surrogate lung fluid, Atmos. Environ., 45, 7555–7562, https://doi.org/10.1016/j.atmosenv.2010.12.021, 2011.
Charrier, J. G. and Anastasio, C.: On dithiothreitol (DTT) as a measure of oxidative potential for ambient particles: evidence for the importance of soluble transition metals, Atmos. Chem. Phys., 12, 9321–9333, https://doi.org/10.5194/acp-12-9321-2012, 2012.
Charrier, J. G., McFall, A. S., Richards-Henderson, N. K., and Anastasio, C.: Hydrogen peroxide formation in a surrogate lung fluid by transition metals and quinones present in particulate matter, Environ. Sci. Technol., 48, 7010–7017, https://doi.org/10.1021/es501011w, 2014.
Charrier, J. G., Richards-Henderson, N. K., Bein, K. J., McFall, A. S., Wexler, A. S., and Anastasio, C.: Oxidant production from source-oriented particulate matter – Part 1: Oxidative potential using the dithiothreitol (DTT) assay, Atmos. Chem. Phys., 15, 2327–2340, https://doi.org/10.5194/acp-15-2327-2015, 2015.
Charrier, J. G., McFall, A. S., Vu, K. K. T., Baroi, J., Olea, C., Hasson, A., and Anastasio, C.: A bias in the “mass-normalized” DTT response – An effect of non-linear concentration-response curves for copper and manganese, Atmos. Environ., 144, 325–334, https://doi.org/10.1016/j.atmosenv.2016.08.071, 2016.
Chen, Q., Sun, H., Wang, M., Wang, Y., Zhang, L., and Han, Y.: Environmentally Persistent Free Radical (EPFR) Formation by Visible-Light Illumination of the Organic Matter in Atmospheric Particles, Environ. Sci. Technol., 53, 10053–10061, https://doi.org/10.1021/acs.est.9b02327, 2019.
Cho, A. K., Sioutas, C., Miguel, A. H., Kumagai, Y., Schmitz, D. A., Singh, M., Eiguren-Fernandez, A., and Froines, J. R.: Redox activity of airborne particulate matter at different sites in the Los Angeles Basin, Environ. Res., 99, 40–47, https://doi.org/10.1016/j.envres.2005.01.003, 2005.
Chowdhury, P. H., He, Q., Carmieli, R., Li, C., Rudich, Y., and Pardo, M.: Connecting the Oxidative Potential of Secondary Organic Aerosols with Reactive Oxygen Species in Exposed Lung Cells, Environ. Sci. Technol., 53, 13949–13958, https://doi.org/10.1021/acs.est.9b04449, 2019.
Chung, M. Y., Lazaro, R. A., Lim, D., Jackson, J., Lyon, J., Rendulic, D., and Hasson, A. S.: Aerosol-borne quinones and reactive oxygen species generation by particulate matter extracts, Environ. Sci. Technol., 40, 4880–4886, https://doi.org/10.1021/es0515957, 2006.
Costa, D. L. and Dreher, K. L.: Bioavailable transition metals in particulate matter mediate cardiopulmonary injury in healthy and compromised animal models, Environ. Health Perspect., 105, 1053–1060, https://doi.org/10.1289/ehp.97105s51053, 1997.
Delgado-Saborit, J. M., Alam, M. S., Godri Pollitt, K. J., Stark, C., and Harrison, R. M.: Analysis of atmospheric concentrations of quinones and polycyclic aromatic hydrocarbons in vapour and particulate phases, Atmos. Environ., 77, 974–982, https://doi.org/10.1016/j.atmosenv.2013.05.080, 2013.
Dellinger, B., Pryor, W. A., Cueto, R., Squadrito, G. L., Hegde, V., and Deutsch, W. A.: Role of free radicals in the toxicity of airborne fine particulate matter, Chem. Res. Toxicol., 14, 1371–1377, https://doi.org/10.1021/tx010050x, 2001.
Ding, X., He, Q. F., Shen, R. Q., Yu, Q. Q., Zhang, Y. Q., Xin, J. Y., Wen, T. X., and Wang, X. M.: Spatial and seasonal variations of isoprene secondary organic aerosol in China: Significant impact of biomass burning during winter, Sci. Rep., 6, 1–10, https://doi.org/10.1038/srep20411, 2016.
Donaldson, K. and Tran, C. L.: Inflammation Caused By Particles and Fibers, Inhal. Toxicol., 14, 5–27, https://doi.org/10.1080/089583701753338613, 2002.
Dou, J., Lin, P., Kuang, B. Y., and Yu, J. Z.: Reactive oxygen species production mediated by humic-like substances in atmospheric aerosols: Enhancement effects by pyridine, imidazole, and their derivatives, Environ. Sci. Technol., 49, 6457–6465, https://doi.org/10.1021/es5059378, 2015.
Elzein, A., Dunmore, R. E., Ward, M. W., Hamilton, J. F., and Lewis, A. C.: Variability of polycyclic aromatic hydrocarbons and their oxidative derivatives in wintertime Beijing, China, Atmos. Chem. Phys., 19, 8741–8758, https://doi.org/10.5194/acp-19-8741-2019, 2019.
Elzein, A., Stewart, G. J., Swift, S. J., Nelson, B. S., Crilley, L. R., Alam, M. S., Reyes-Villegas, E., Gadi, R., Harrison, R. M., Hamilton, J. F., and Lewis, A. C.: A comparison of PM2.5-bound polycyclic aromatic hydrocarbons in summer Beijing (China) and Delhi (India), Atmos. Chem. Phys., 20, 14303–14319, https://doi.org/10.5194/acp-20-14303-2020, 2020.
Eriksson, L., Byrne, T., Johansson, E., Trygg, J. and Vikstrom, C.: Multi-and megavariate data analysis basic principles and applications, 3rd edn., Umetrics Academy, 2013.
Fang, T., Verma, V., Guo, H., King, L. E., Edgerton, E. S., and Weber, R. J.: A semi-automated system for quantifying the oxidative potential of ambient particles in aqueous extracts using the dithiothreitol (DTT) assay: results from the Southeastern Center for Air Pollution and Epidemiology (SCAPE), Atmos. Meas. Tech., 8, 471–482, https://doi.org/10.5194/amt-8-471-2015, 2015.
Fang, T., Verma, V., Bates, J. T., Abrams, J., Klein, M., Strickland, M. J., Sarnat, S. E., Chang, H. H., Mulholland, J. A., Tolbert, P. E., Russell, A. G., and Weber, R. J.: Oxidative potential of ambient water-soluble PM2.5 in the southeastern United States: contrasts in sources and health associations between ascorbic acid (AA) and dithiothreitol (DTT) assays, Atmos. Chem. Phys., 16, 3865–3879, https://doi.org/10.5194/acp-16-3865-2016, 2016.
Feng, B., Li, L., Xu, H., Wang, T., Wu, R., Chen, J., Zhang, Y., Liu, S., Ho, S. S. H., Cao, J., and Huang, W.: PM2.5-bound polycyclic aromatic hydrocarbons (PAHs) in Beijing: Seasonal variations, sources, and risk assessment, J. Environ. Sci., 77, 11–19, https://doi.org/10.1016/j.jes.2017.12.025, 2019.
Fuller, S. J., Wragg, F. P. H., Nutter, J., and Kalberer, M.: Comparison of on-line and off-line methods to quantify reactive oxygen species (ROS) in atmospheric aerosols, Atmos. Environ., 92, 97–103, https://doi.org/10.1016/j.atmosenv.2014.04.006, 2014.
Gallimore, P. J., Mahon, B. M., Wragg, F. P. H., Fuller, S. J., Giorio, C., Kourtchev, I., and Kalberer, M.: Multiphase composition changes and reactive oxygen species formation during limonene oxidation in the new Cambridge Atmospheric Simulation Chamber (CASC), Atmos. Chem. Phys., 17, 9853–9868, https://doi.org/10.5194/acp-17-9853-2017, 2017.
Gao, J., Tian, H., Cheng, K., Lu, L., Wang, Y., Wu, Y., Zhu, C., Liu, K., Zhou, J., Liu, X., Chen, J., and Hao, J.: Seasonal and spatial variation of trace elements in multi-size airborne particulate matters of Beijing, China: Mass concentration, enrichment characteristics, source apportionment, chemical speciation and bioavailability, Atmos. Environ., 99, 257–265, https://doi.org/10.1016/j.atmosenv.2014.08.081, 2014.
Gehling, W. and Dellinger, B.: Environmentally persistent free radicals and their lifetimes in PM2.5, Environ. Sci. Technol., 47, 8172–8178, https://doi.org/10.1021/es401767m, 2013.
Gehling, W., Khachatryan, L., and Dellinger, B.: Hydroxyl radical generation from environmentally persistent free radicals (EPFRs) in PM2.5, Environ. Sci. Technol., 48, 4266–4272, https://doi.org/10.1021/es401770y, 2014.
Ghio, A. J., Stonehuerner, J., Dailey, L. A., and Carter, J. D.: Metals associated with both the water-soluble and insoluble fractions of an ambient air pollution particle catalyze an oxidative stress, Inhal. Toxicol., 11, 37–49, https://doi.org/10.1080/089583799197258, 1999.
Ghio, A. J., Carraway, M. S., and Madden, M. C.: Composition of air pollution particles and oxidative stress in cells, tissues, and living systems, J. Toxicol. Environ. Heal., 15, 1–21, https://doi.org/10.1080/10937404.2012.632359, 2012.
Godri, K. J., Harrison, R. M., Evans, T., Baker, T., Dunster, C., Mudway, I. S., and Kelly, F. J.: Increased oxidative burden associated with traffic component of ambient particulate matter at roadside and Urban background schools sites in London, PLoS One, 6, e21961, https://doi.org/10.1371/journal.pone.0021961, 2011.
Hart, J. E., Liao, X., Hong, B., Puett, R. C., Yanosky, J. D., Suh, H., Kioumourtzoglou, M. A., Spiegelman, D., and Laden, F.: The association of long-term exposure to PM2.5 on all-cause mortality in the Nurses' Health Study and the impact of measurement-error correction, Environ. Heal., 14, 38, https://doi.org/10.1186/s12940-015-0027-6, 2015.
Hasson, A. S. and Paulson, S. E.: An investigation of the relationship between gas-phase and aerosol-borne hydroperoxides in urban air, J. Aerosol Sci., 34, 459–468, https://doi.org/10.1016/S0021-8502(03)00002-8, 2003.
He, L. Y., Hu, M., Huang, X. F., Zhang, Y. H., and Tang, X. Y.: Seasonal pollution characteristics of organic compounds in atmospheric fine particles in Beijing, Sci. Total Environ., 359, 167–176, https://doi.org/10.1016/j.scitotenv.2005.05.044, 2006.
Hewitt, C. N. and Kok, G. L.: Formation and occurrence of organic hydroperoxides in the troposphere: Laboratory and field observations, J. Atmos. Chem., 12, 181–194, https://doi.org/10.1007/BF00115779, 1991.
Hung, H. F. and Wang, C.-S.: Experimental determination of reactive oxygen species in Taipei aerosols, J. Aerosol Sci., 32, 1201–1211, https://doi.org/10.1016/S0021-8502(01)00051-9, 2001.
Janssen, N. A. H., Yang, A., Strak, M., Steenhof, M., Hellack, B., Gerlofs-Nijland, M. E., Kuhlbusch, T., Kelly, F., Harrison, R., Brunekreef, B., Hoek, G., and Cassee, F.: Oxidative potential of particulate matter collected at sites with different source characteristics, Sci. Total Environ., 472, 572–581, https://doi.org/10.1016/j.scitotenv.2013.11.099, 2014.
Jedynska, A., Hoek, G., Wang, M., Yang, A., Eeftens, M., Cyrys, J., Keuken, M., Ampe, C., Beelen, R., Cesaroni, G., Forastiere, F., Cirach, M., de Hoogh, K., De Nazelle, A., Nystad, W., Akhlaghi, H. M., Declercq, C., Stempfelet, M., Eriksen, K. T., Dimakopoulou, K., Lanki, T., Meliefste, K., Nieuwenhuijsen, M., Yli-Tuomi, T., Raaschou-Nielsen, O., Janssen, N. A. H., Brunekreef, B., and Kooter, I. M.: Spatial variations and development of land use regression models of oxidative potential in ten European study areas, Atmos. Environ., 150, 24–32, https://doi.org/10.1016/j.atmosenv.2016.11.029, 2017.
Kelly, F. J.: Oxidative stress: its role in air pollution and adverse health effects, Occup. Environ. Med., 60, 612–616, https://doi.org/10.1136/oem.60.8.612, 2003.
Knaapen, A. M., Borm, P. J. A., Albrecht, C., and Schins, R. P. F.: Inhaled particles and lung cancer. Part A: Mechanisms, Int. J. Cancer, 109, 799–809, https://doi.org/10.1002/ijc.11708, 2004.
Laden, F., Schwartz, J., Speizer, F. E., and Dockery, D. W.: Reduction in fine particulate air pollution and mortality: Extended follow-up of the Harvard Six Cities Study, Am. J. Respir. Crit. Care Med., 173, 667–672, https://doi.org/10.1164/rccm.200503-443OC, 2006.
Laing, S., Wang, G., Briazova, T., Zhang, C., Wang, A., Zheng, Z., Gow, A., Chen, A. F., Rajagopalan, S., Chen, L. C., Sun, Q., and Zhang, K.: Airborne particulate matter selectively activates endoplasmic reticulum stress response in the lung and liver tissues, Am. J. Physiol.-Cell Physiol., 299, 736–749, https://doi.org/10.1152/ajpcell.00529.2009, 2010.
Lelieveld, J., Pozzer, A., Pöschl, U., Fnais, M., Haines, A., and Münzel, T.: Loss of life expectancy from air pollution compared to other risk factors: a worldwide perspective, Cardiovasc. Res., 116, 1910–1917, https://doi.org/10.1093/cvr/cvaa025, 2020.
Lepeule, J., Laden, F., Dockery, D., and Schwartz, J.: Chronic exposure to fine particles and mortality: An extended follow-up of the Harvard six cities study from 1974 to 2009, Environ. Health Perspect., 120, 965–970, https://doi.org/10.1289/ehp.1104660, 2012.
Levy, J. I., Diez, D., Dou, Y., Barr, C. D., and Dominici, F.: A meta-analysis and multisite time-series analysis of the differential toxicity of major fine particulate matter constituents, Am. J. Epidemiol., 175, 1091–1099, https://doi.org/10.1093/aje/kwr457, 2012.
Li, N., Hao, M., Phalen, R. F., Hinds, W. C., and Nel, A. E.: Particulate air pollutants and asthma: A paradigm for the role of oxidative stress in PM-induced adverse health effects, Clin. Immunol., 109, 250–265, https://doi.org/10.1016/j.clim.2003.08.006, 2003.
Li, N., Xia, T., and Nel, A. E.: The Role of Oxidative Stess in Ambient Particulate Matter Induced Lung Diseases and its Implications in the Toxicity of Engineered Nanoparticles, Free Radic. Bio. Med., 9, 1689–1699, https://doi.org/10.1038/mp.2011.182.doi, 2008.
Li, X., Jiang, L., Bai, Y., Yang, Y., Liu, S., Chen, X., Xu, J., Liu, Y., Wang, Y., Guo, X., Wang, Y., and Wang, G.: Wintertime aerosol chemistry in Beijing during haze period: Significant contribution from secondary formation and biomass burning emission, Atmos. Res., 218, 25–33, https://doi.org/10.1016/j.atmosres.2018.10.010, 2019.
Li, Y.: Observational accuracy of sunrise and sunset times in the sixth century China, Chinese J. Astron. Astrophys., 6, 629, https://doi.org/10.1088/1009-9271/6/5/16, 2006.
Liang, L., Engling, G., Duan, F., Cheng, Y., and He, K.: Characteristics of 2-methyltetrols in ambient aerosol in Beijing, China, Atmos. Environ., 59, 376–381, https://doi.org/10.1016/j.atmosenv.2012.05.052, 2012.
Lim, Y. and Ziemann, P. J.: Products and mechanism of secondary organic aerosol formation from reactions of n-alkanes with OH radicals in the presence of NOx, Environ. Sci. Technol., 39, 9229–9236, https://doi.org/10.1021/es051447g, 2005.
Liu, D., Harrison, R. M., Vu, T., Xu, J., Shi, Z., Li, L., Sun, Y., and Fu, P.: Estimation of biogenic and anthropogenic precursor contributions to secondary organic aerosol in Beijing using molecular tracers, in preparation, 2021.
Liu, Q., Baumgartner, J., Zhang, Y., Liu, Y., Sun, Y., and Zhang, M.: Oxidative potential and inflammatory impacts of source apportioned ambient air pollution in Beijing, Environ. Sci. Technol., 48, 12920–12929, https://doi.org/10.1021/es5029876, 2014.
Liu, W. J., Xu, Y. S., Liu, W. X., Liu, Q. Y., Yu, S. Y., Liu, Y., Wang, X., and Tao, S.: Oxidative potential of ambient PM2.5 in the coastal cities of the Bohai Sea, northern China: Seasonal variation and source apportionment, Environ. Pollut., 236, 514–528, https://doi.org/10.1016/j.envpol.2018.01.116, 2018.
Ma, Y., Cheng, Y., Qiu, X., Cao, G., Fang, Y., Wang, J., Zhu, T., Yu, J., and Hu, D.: Sources and oxidative potential of water-soluble humic-like substances (HULISWS) in fine particulate matter (PM2.5) in Beijing, Atmos. Chem. Phys., 18, 5607–5617, https://doi.org/10.5194/acp-18-5607-2018, 2018.
McWhinney, R. D., Badali, K., Liggio, J., Li, S. M., and Abbatt, J. P. D.: Filterable redox cycling activity: A comparison between diesel exhaust particles and secondary organic aerosol constituents, Environ. Sci. Technol., 47, 3362–3369, https://doi.org/10.1021/es304676x, 2013a.
McWhinney, R. D., Zhou, S., and Abbatt, J. P. D.: Naphthalene SOA: redox activity and naphthoquinone gas–particle partitioning, Atmos. Chem. Phys., 13, 9731–9744, https://doi.org/10.5194/acp-13-9731-2013, 2013b.
Meng, Z. and Zhang, Q.: Oxidative damage of dust storm fine particles instillation on lungs, hearts and livers of rats, Environ. Toxicol. Pharmacol., 22, 277–282, https://doi.org/10.1016/j.etap.2006.04.005, 2006.
Miller, M. R., Borthwick, S. J., Shaw, C. A., McLean, S. G., McClure, D., Mills, N. L., Duffin, R., Donaldson, K., Megson, I. L., Hadoke, P. W. F., and Newby, D. E.: Direct impairment of vascular function by diesel exhaust particulate through reduced bioavailability of endothelium-derived nitric oxide induced by superoxide free radicals, Environ. Health Perspect., 117, 611–616, https://doi.org/10.1289/ehp.0800235, 2009.
Miyata, R. and van Eeden, S. F.: The innate and adaptive immune response induced by alveolar macrophages exposed to ambient particulate matter, Toxicol. Appl. Pharmacol., 257, 209–226, https://doi.org/10.1016/j.taap.2011.09.007, 2011.
Moorthy, B., Chu, C., and Carlin, D. J.: Polycyclic aromatic hydrocarbons: From metabolism to lung cancer, Toxicol. Sci., 145, 5–15, https://doi.org/10.1093/toxsci/kfv040, 2015.
Müller, L., Reinnig, M.-C., Naumann, K. H., Saathoff, H., Mentel, T. F., Donahue, N. M., and Hoffmann, T.: Formation of 3-methyl-1,2,3-butanetricarboxylic acid via gas phase oxidation of pinonic acid – a mass spectrometric study of SOA aging, Atmos. Chem. Phys., 12, 1483–1496, https://doi.org/10.5194/acp-12-1483-2012, 2012.
Naes, T. and Martens, H.: Principal component regression in NIR analysis: viewpoints, background details and selection of components, J. Chemom., 2, 155–167, 1988.
Ntziachristos, L., Froines, J. R., Cho, A. K., and Sioutas, C.: Relationship between redox activity and chemical speciation of size-fractionated particulate matter, Part. Fibre Toxicol., 4, 1–12, https://doi.org/10.1186/1743-8977-4-5, 2007.
Oberdorster, G., Ferin, J., Gelein, R., Soderholm, S. C., and Finkelstein, J.: Role of the alveolar macrophage in lung injury: Studies with ultrafine particles, Environ. Health Perspect., 97, 193–199, https://doi.org/10.1289/ehp.97-1519541, 1992.
Øvrevik, J., Refsnes, M., Låg, M., Holme, J. A., and Schwarze, P. E.: Activation of proinflammatory responses in cells of the airway mucosa by particulate matter: Oxidant- and non-oxidant-mediated triggering mechanisms, Biomolecules, 5, 1399–1440, https://doi.org/10.3390/biom5031399, 2015.
Paatero, P. and Tapper, U.: Postivie Matrix Factorisation: A non-negative factor model with optimal utilization of error estimates of data values, Environmetrics, 5, 111–126, 1994.
Panagi, M., Fleming, Z. L., Monks, P. S., Ashfold, M. J., Wild, O., Hollaway, M., Zhang, Q., Squires, F. A., and Vande Hey, J. D.: Investigating the regional contributions to air pollution in Beijing: a dispersion modelling study using CO as a tracer, Atmos. Chem. Phys., 20, 2825–2838, https://doi.org/10.5194/acp-20-2825-2020, 2020.
Pant, P., Baker, S. J., Shukla, A., Maikawa, C., Godri Pollitt, K. J., and Harrison, R. M.: The PM10 fraction of road dust in the UK and India: Characterization, source profiles and oxidative potential, Sci. Total Environ., 530–531, 445–452, https://doi.org/10.1016/j.scitotenv.2015.05.084, 2015.
Paulson, S. E., Gallimore, P. J., Kuang, X. M., Chen, J. R., Kalberer, M., and Gonzalez, D. H.: A light-driven burst of hydroxyl radicals dominates oxidation chemistry in newly activated cloud droplets, Sci. Adv., 5, 1–8, https://doi.org/10.1126/sciadv.aav7689, 2019.
Pernigotti, D., Belis, C. A., and Spano, L.: SPECIEUROPE: The European data base for PM source profiles, Atmos. Pollut. Res., 7, 307–314, 2016.
Platt, S. M., Haddad, I. El, Pieber, S. M., Huang, R. J., Zardini, A. A., Clairotte, M., Suarez-Bertoa, R., Barmet, P., Pfaffenberger, L., Wolf, R., Slowik, J. G., Fuller, S. J., Kalberer, M., Chirico, R., Dommen, J., Astorga, C., Zimmermann, R., Marchand, N., Hellebust, S., Temime-Roussel, B., Baltensperger, U., and Prévôt, A. S. H.: Two-stroke scooters are a dominant source of air pollution in many cities, Nat. Commun., 5, 1–7, https://doi.org/10.1038/ncomms4749, 2014.
Pope, C. A. and Dockery, D. W.: Health effects of fine particulate air pollution: Lines that connect, J. Air Waste Manag. Assoc., 56, 709–742, https://doi.org/10.1080/10473289.2006.10464485, 2006.
Presto, A. A., Miracolo, M. A., Donahue, N. M., and Robinson, A. L.: Secondary organic aerosol formation from high-NOx Photo-oxidation of low volatility precursors: N-alkanes, Environ. Sci. Technol., 44, 2029–2034, https://doi.org/10.1021/es903712r, 2010.
Puthussery, J. V., Singh, A., Rai, P., Bhattu, D., Kumar, V., Vats, P., Furger, M., Rastogi, N., Slowik, J. G., Ganguly, D., Prevot, A. S. H., Tripathi, S. N., and Verma, V.: Real-Time Measurements of PM2.5 Oxidative Potential Using a Dithiothreitol Assay in Delhi, India, Environ. Sci. Technol. Lett., 7, 504–510, https://doi.org/10.1021/acs.estlett.0c00342, 2020.
Risom, L., Møller, P., and Loft, S.: Oxidative stress-induced DNA damage by particulate air pollution, Mutat. Res., 592, 119–137, https://doi.org/10.1016/j.mrfmmm.2005.06.012, 2005.
Saffari, A., Daher, N., Shafer, M. M., Schauer, J. J., and Sioutas, C.: Seasonal and spatial variation in reactive oxygen species activity of quasi-ultrafine particles (PM0.25) in the Los Angeles metropolitan area and its association with chemical composition, Atmos. Environ., 79, 566–575, https://doi.org/10.1016/j.atmosenv.2013.07.058, 2013.
Saffari, A., Daher, N., Shafer, M. M., Schauer, J. J., and Sioutas, C.: Seasonal and spatial variation in dithiothreitol (DTT) activity of quasi-ultrafine particles in the Los Angeles Basin and its association with chemical species, J. Environ. Sci. Heal., 49, 441–451, https://doi.org/10.1080/10934529.2014.854677, 2014.
Schauer, J. J., Kleeman, M. J., Cass, G. R., and Simoneit, B. R. T.: Measurement of emissions from air pollution sources. 2. C1 through C30 organic compounds from medium duty diesel trucks, Environ. Sci. Technol., 33, 1578–1587, https://doi.org/10.1021/es980081n, 1999.
See, S. W., Wang, Y. H., and Balasubramanian, R.: Contrasting reactive oxygen species and transition metal concentrations in combustion aerosols, Environ. Res., 103, 317–324, https://doi.org/10.1016/j.envres.2006.08.012, 2007.
Shen, H. and Anastasio, C.: A comparison of hydroxyl radical and hydrogen peroxide generation in ambient particle extracts and laboratory metal solutions, Atmos. Environ., 46, 665–668, https://doi.org/10.1016/j.atmosenv.2011.10.006, 2012.
Shen, R., Liu, Z., Liu, Y., Wang, L., Li, D., Wang, Y., Wang, G., Bai, Y., and Li, X.: Typical polar organic aerosol tracers in PM2.5 over the North China Plain: Spatial distribution, seasonal variations, contribution and sources, Chemosphere, 209, 758–766, https://doi.org/10.1016/j.chemosphere.2018.06.133, 2018.
Shi, Z., Vu, T., Kotthaus, S., Harrison, R. M., Grimmond, S., Yue, S., Zhu, T., Lee, J., Han, Y., Demuzere, M., Dunmore, R. E., Ren, L., Liu, D., Wang, Y., Wild, O., Allan, J., Acton, W. J., Barlow, J., Barratt, B., Beddows, D., Bloss, W. J., Calzolai, G., Carruthers, D., Carslaw, D. C., Chan, Q., Chatzidiakou, L., Chen, Y., Crilley, L., Coe, H., Dai, T., Doherty, R., Duan, F., Fu, P., Ge, B., Ge, M., Guan, D., Hamilton, J. F., He, K., Heal, M., Heard, D., Hewitt, C. N., Hollaway, M., Hu, M., Ji, D., Jiang, X., Jones, R., Kalberer, M., Kelly, F. J., Kramer, L., Langford, B., Lin, C., Lewis, A. C., Li, J., Li, W., Liu, H., Liu, J., Loh, M., Lu, K., Lucarelli, F., Mann, G., McFiggans, G., Miller, M. R., Mills, G., Monk, P., Nemitz, E., O'Connor, F., Ouyang, B., Palmer, P. I., Percival, C., Popoola, O., Reeves, C., Rickard, A. R., Shao, L., Shi, G., Spracklen, D., Stevenson, D., Sun, Y., Sun, Z., Tao, S., Tong, S., Wang, Q., Wang, W., Wang, X., Wang, X., Wang, Z., Wei, L., Whalley, L., Wu, X., Wu, Z., Xie, P., Yang, F., Zhang, Q., Zhang, Y., Zhang, Y., and Zheng, M.: Introduction to the special issue “In-depth study of air pollution sources and processes within Beijing and its surrounding region (APHH-Beijing)”, Atmos. Chem. Phys., 19, 7519–7546, https://doi.org/10.5194/acp-19-7519-2019, 2019.
Shinyashiki, M., Eiguren-Fernandez, A., Schmitz, D. A., Di Stefano, E., Li, N., Linak, W. P., Cho, S. H., Froines, J. R. and Cho, A. K.: Electrophilic and redox properties of diesel exhaust particles, Environ. Res., 109, 239–244, https://doi.org/10.1016/j.envres.2008.12.008, 2009.
Steimer, S. S., Delvaux, A., Campbell, S. J., Gallimore, P. J., Grice, P., Howe, D. J., Pitton, D., Claeys, M., Hoffmann, T., and Kalberer, M.: Synthesis and characterisation of peroxypinic acids as proxies for highly oxygenated molecules (HOMs) in secondary organic aerosol, Atmos. Chem. Phys., 18, 10973–10983, https://doi.org/10.5194/acp-18-10973-2018, 2018.
Steimer, S. S., Patton, D. J., Vu, T. V., Panagi, M., Monks, P. S., Harrison, R. M., Fleming, Z. L., Shi, Z., and Kalberer, M.: Differences in the composition of organic aerosols between winter and summer in Beijing: a study by direct-infusion ultrahigh-resolution mass spectrometry, Atmos. Chem. Phys., 20, 13303–13318, https://doi.org/10.5194/acp-20-13303-2020, 2020.
Subramanian, R., Donahue, N. M., Bernardo-Bricker, A., Rogge, W. F., and Robinson, A. L.: Contribution of motor vehicle emissions to organic carbon and fine particle mass in Pittsburgh, Pennsylvania: Effects of varying source profiles and seasonal trends in ambient marker concentrations, Atmos. Environ., 40, 8002–8019, https://doi.org/10.1016/j.atmosenv.2006.06.055, 2006.
Tan, W. C., Qiu, D., Liam, B. L., Ng, T. P., Lee, S. H., Van Eeden, S. F., D'Yachkova, Y., and Hogg, J. C.: The human bone marrow response to acute air pollution caused by forest fires, Am. J. Respir. Crit. Care Med., 161, 1213–1217, https://doi.org/10.1164/ajrccm.161.4.9904084, 2000.
Tao, F., Gonzalez-Flecha, B., and Kobzik, L.: Reactive oxygen species in pulmonary inflammation by ambient particulates, Free Radic. Biol. Med., 35, 327–340, https://doi.org/10.1016/S0891-5849(03)00280-6, 2003.
Tapparo, A., Di Marco, V., Badocco, D., D'Aronco, S., Soldà, L., Pastore, P., Mahon, B. M., Kalberer, M., and Giorio, C.: Formation of metal-organic ligand complexes affects solubility of metals in airborne particles at an urban site in the Po valley, Chemosphere, 241, 1–13, https://doi.org/10.1016/j.chemosphere.2019.125025, 2020.
Tong, H., Arangio, A. M., Lakey, P. S. J., Berkemeier, T., Liu, F., Kampf, C. J., Brune, W. H., Pöschl, U., and Shiraiwa, M.: Hydroxyl radicals from secondary organic aerosol decomposition in water, Atmos. Chem. Phys., 16, 1761–1771, https://doi.org/10.5194/acp-16-1761-2016, 2016.
Tong, H., Lakey, P. S. J., Arangio, A. M., Socorro, J., Kampf, C. J., Berkemeier, T., Brune, W. H., Pöschl, U., and Shiraiwa, M.: Reactive oxygen species formed in aqueous mixtures of secondary organic aerosols and mineral dust influencing cloud chemistry and public health in the Anthropocene, Faraday Discuss., 200, 251–270, https://doi.org/10.1039/c7fd00023e, 2017.
Tong, H., Lakey, P. S. J., Arangio, A. M., Socorro, J., Shen, F., Lucas, K., Brune, W. H., Pöschl, U., and Shiraiwa, M.: Reactive Oxygen Species Formed by Secondary Organic Aerosols in Water and Surrogate Lung Fluid, Environ. Sci. Technol., 52, 11642–11651, https://doi.org/10.1021/acs.est.8b03695, 2018.
Tong, H., Zhang, Y., Filippi, A., Wang, T., Li, C., Liu, F., Leppla, D., Kourtchev, I., Wang, K., Keskinen, H. M., Levula, J. T., Arangio, A. M., Shen, F., Ditas, F., Martin, S. T., Artaxo, P., Godoi, R. H. M., Yamamoto, C. I., De Souza, R. A. F., Huang, R. J., Berkemeier, T., Wang, Y., Su, H., Cheng, Y., Pope, F. D., Fu, P., Yao, M., Pöhlker, C., Petäjä, T., Kulmala, M., Andreae, M. O., Shiraiwa, M., Pöschl, U., Hoffmann, T., and Kalberer, M.: Radical Formation by Fine Particulate Matter Associated with Highly Oxygenated Molecules, Environ. Sci. Technol., 53, 12506–12518, https://doi.org/10.1021/acs.est.9b05149, 2019.
Tuet, W. Y., Chen, Y., Xu, L., Fok, S., Gao, D., Weber, R. J., and Ng, N. L.: Chemical oxidative potential of secondary organic aerosol (SOA) generated from the photooxidation of biogenic and anthropogenic volatile organic compounds, Atmos. Chem. Phys., 17, 839–853, https://doi.org/10.5194/acp-17-839-2017, 2017.
Valko, M., Morris, H., and Cronin, M. T. D.: Metals, Toxicity and Oxidative Stress, Curr. Med. Chem., 12, 1161–1208, 2005.
Venkatachari, P. and Hopke, P. K.: Development and laboratory testing of an automated monitor for the measurement of atmospheric particle-bound reactive oxygen species (ROS), Aerosol Sci. Technol., 42, 629–635, 2008.
Venkatachari, P., Hopke, P. K., Grover, B. D., and Eatough, D. J.: Measurement of particle-bound reactive oxygen species in rubidoux aerosols, J. Atmos. Chem., 50, 49–58, https://doi.org/10.1007/s10874-005-1662-z, 2005.
Verma, V., Pakbin, P., Cheung, K. L., Cho, A. K., Schauer, J. J., Shafer, M. M., Kleinman, M. T., and Sioutas, C.: Physicochemical and oxidative characteristics of semi-volatile components of quasi-ultrafine particles in an urban atmosphere, Atmos. Environ., 45, 1025–1033, https://doi.org/10.1016/j.atmosenv.2010.10.044, 2011.
Verma, V., Fang, T., Guo, H., King, L., Bates, J. T., Peltier, R. E., Edgerton, E., Russell, A. G., and Weber, R. J.: Reactive oxygen species associated with water-soluble PM2.5 in the southeastern United States: spatiotemporal trends and source apportionment, Atmos. Chem. Phys., 14, 12915–12930, https://doi.org/10.5194/acp-14-12915-2014, 2014.
Verma, V., Wang, Y., El-Afifi, R., Fang, T., Rowland, J., Russell, A. G., and Weber, R. J.: Fractionating ambient humic-like substances (HULIS) for their reactive oxygen species activity – Assessing the importance of quinones and atmospheric aging, Atmos. Environ., 120, 351–359, https://doi.org/10.1016/j.atmosenv.2015.09.010, 2015a.
Verma, V., Fang, T., Xu, L., Peltier, R. E., Russell, A. G., Ng, N. L., and Weber, R. J.: Organic aerosols associated with the generation of reactive oxygen species (ROS) by water-soluble PM2.5, Environ. Sci. Technol., 49, 4646–4656, https://doi.org/10.1021/es505577w, 2015b.
Wang, G., Cheng, S., Wei, W., Zhou, Y., Yao, S., and Zhang, H.: Characteristics and source apportionment of VOCs in the suburban area of Beijing, China, Atmos. Pollut. Res., 7, 711–724, https://doi.org/10.1016/j.apr.2016.03.006, 2016.
Wang, H., Li, Z., Lv, Y., Zhang, Y., Xu, H., Guo, J., and Goloub, P.: Determination and climatology of the diurnal cycle of the atmospheric mixing layer height over Beijing 2013–2018: lidar measurements and implications for air pollution, Atmos. Chem. Phys., 20, 8839–8854, https://doi.org/10.5194/acp-20-8839-2020, 2020.
Wang, J., Jiang, H., Jiang, H., Mo, Y., Geng, X., Li, J., Mao, S., Bualert, S., Ma, S., Li, J., and Zhang, G.: Source apportionment of water-soluble oxidative potential in ambient total suspended particulate from Bangkok: Biomass burning versus fossil fuel combustion, Atmos. Environ., 235, 117624, https://doi.org/10.1016/j.atmosenv.2020.117624, 2020.
Wang, Q., He, X., Zhou, M., Huang, D., Qiao, L., Zhu, S., Ma, Y., Wang, H., Li, L., Huang, C., Huang, X. H. H., Xu, W., Worsnop, D. R., Goldstein, A. H., Guo, H., and Yu, J. Z.: Hourly Measurements of Organic Molecular Markers in Urban Shanghai, China: Primary Organic Aerosol Source Identification and Observation of Cooking Aerosol Aging, ACS Earth Sp. Chem., 4, 1670–1685, https://doi.org/10.1021/acsearthspacechem.0c00205, 2020.
Wang, Y., Plewa, M. J., Mukherjee, U. K., and Verma, V.: Assessing the cytotoxicity of ambient particulate matter (PM) using Chinese hamster ovary (CHO) cells and its relationship with the PM chemical composition and oxidative potential, Atmos. Environ., 179, 132–141, https://doi.org/10.1016/j.atmosenv.2018.02.025, 2018.
Wei, J., Fang, T., Wong, C., Lakey, P. S. J., Nizkorodov, S. A., and Shiraiwa, M.: Superoxide Formation from Aqueous Reactions of Biogenic Secondary Organic Aerosols, Environ. Sci. Technol., 55, 260–270, https://doi.org/10.1021/acs.est.0c07789, 2021.
Whalley, L. K., Slater, E. J., Woodward-Massey, R., Ye, C., Lee, J. D., Squires, F., Hopkins, J. R., Dunmore, R. E., Shaw, M., Hamilton, J. F., Lewis, A. C., Mehra, A., Worrall, S. D., Bacak, A., Bannan, T. J., Coe, H., Percival, C. J., Ouyang, B., Jones, R. L., Crilley, L. R., Kramer, L. J., Bloss, W. J., Vu, T., Kotthaus, S., Grimmond, S., Sun, Y., Xu, W., Yue, S., Ren, L., Acton, W. J. F., Hewitt, C. N., Wang, X., Fu, P., and Heard, D. E.: Evaluating the sensitivity of radical chemistry and ozone formation to ambient VOCs and NOx in Beijing, Atmos. Chem. Phys., 21, 2125–2147, https://doi.org/10.5194/acp-21-2125-2021, 2021.
Wolfer, K.: katewolfer/Beijing: Zenodo DOI (Version v0.1.1), Zenodo, https://doi.org/10.5281/zenodo.4657722, 2021.
World Health Organisation: Ambient Air Pollution: A Global Assessment of Exposure and Burden of Disease, Report, available at: https://www.who.int/phe/publications/air-pollution-global-assessment/en/ (last access: 26 March 2021), 2016.
Wragg, F. P. H., Fuller, S. J., Freshwater, R., Green, D. C., Kelly, F. J., and Kalberer, M.: An automated online instrument to quantify aerosol-bound reactive oxygen species (ROS) for ambient measurement and health-relevant aerosol studies, Atmos. Meas. Tech., 9, 4891–4900, https://doi.org/10.5194/amt-9-4891-2016, 2016.
Xu, J., Liu, D., Wu, X., Vu, T. V., Zhang, Y., Fu, P., Sun, Y., Xu, W., Zheng, B., Harrison, R. M., and Shi, Z.: Source Apportionment of Fine Aerosol at an Urban Site of Beijing using a Chemical Mass Balance Model, Atmos. Chem. Phys. Discuss. [preprint], https://doi.org/10.5194/acp-2020-1020, in review, 2020.
Xu, J., Hu, W., Liang, D., and Gao, P.: Photochemical impacts on the toxicity of PM2.5, Crit. Rev. Environ. Sci. Technol., https://doi.org/10.1080/10643389.2020.1816126, online first, 2020b.
Yang, A., Wang, M., Eeftens, M., Beelen, R., Dons, E., Leseman, D. L. A. C., Brunekreef, B., Cassee, F. R., Janssen, N. A. H., and Hoek, G.: Spatial variation and land use regression modeling of the oxidative potential of fine particles, Environ. Health Perspect., 123, 1187–1192, https://doi.org/10.1289/ehp.1408916, 2015.
Yu, L., Wang, G., Zhang, R., Zhang, L., Song, Y., Wu, B., Li, X., An, K., and Chu, J.: Characterization and source apportionment of PM2.5 in an urban environment in Beijing, Aerosol Air Qual. Res., 13, 574–583, https://doi.org/10.4209/aaqr.2012.07.0192, 2013.
Yu, S. Y., Liu, W. J., Xu, Y. S., Yi, K., Zhou, M., Tao, S., and Liu, W. X.: Characteristics and oxidative potential of atmospheric PM2.5 in Beijing: Source apportionment and seasonal variation, Sci. Total Environ., 650, 277–287, https://doi.org/10.1016/j.scitotenv.2018.09.021, 2019.
Zhao, H., Zheng, Y., and Li, C.: Spatiotemporal distribution of PM2.5 and O3 and their interaction during the summer and winter seasons in Beijing, China, Sustain., 10, 4519, https://doi.org/10.3390/su10124519, 2018.
Zheng, M., Salmon, L. G., Schauer, J. J., Zeng, L., Kiang, C. S., Zhang, Y., and Cass, G. R.: Seasonal trends in PM2.5 source contributions in Beijing, China, Atmos. Environ., 39, 3967–3976, https://doi.org/10.1016/j.atmosenv.2005.03.036, 2005.