the Creative Commons Attribution 4.0 License.
the Creative Commons Attribution 4.0 License.
 | 01 Apr 2021
Characterization of secondary organic aerosol from heated-cooking-oil emissions: evolution in composition and volatility
Manpreet Takhar
Yunchun Li
Arthur W. H. Chan
Cooking emissions account for a major fraction of urban organic aerosol. It is therefore important to understand the atmospheric evolution in the physical and chemical properties of organic compounds emitted from cooking activities. In this work, we investigate the formation of secondary organic aerosol (SOA) from oxidation of gas-phase organic compounds from heated cooking oil. The chemical composition of cooking SOA is analyzed using thermal desorption–gas chromatography–mass spectrometry (TD–GC–MS). While the particle-phase composition of SOA is a highly complex mixture, we adopt a new method to achieve molecular speciation of the SOA. All the GC-elutable material is classified by the constituent functional groups, allowing us to provide a molecular description of its chemical evolution upon oxidative aging. Our results demonstrate an increase in average oxidation state (from −0.6 to −0.24) and decrease in average carbon number (from 5.2 to 4.9) with increasing photochemical aging of cooking oil, suggesting that fragmentation reactions are key processes in the oxidative aging of cooking emissions within 2 d equivalent of ambient oxidant exposure. Moreover, we estimate that aldehyde precursors from cooking emissions account for a majority of the SOA formation and oxidation products. Overall, our results provide insights into the atmospheric evolution of cooking SOA, a majority of which is derived from gas-phase oxidation of aldehydes.
- Article
(1794 KB) - Full-text XML
-
Supplement
(994 KB) - BibTeX
- EndNote


Organic aerosol (OA) has important impacts on air quality, climate, and human health (Hallquist et al., 2009). OA is often composed of thousands of organic compounds formed from a variety of sources. In urban areas, particulate emissions from food cooking account for a significant fraction of OA (Allan et al., 2010; Crippa et al., 2013; Florou et al., 2017; Kostenidou et al., 2015; Lee et al., 2015; Mohr et al., 2012; Sun et al., 2011). Furthermore, volatile organic compounds (VOCs) are also emitted, and they can undergo oxidation and form secondary organic aerosol (SOA). Recent studies have reported the formation of SOA from meat charbroiling (Kaltsonoudis et al., 2017) and heated cooking oils (Liu et al., 2017a, c, 2018). Therefore, food cooking activities have substantial impacts on air quality in and downwind of urban areas.
The emission of VOCs from cooking is highly variable and depends on a number of factors such as cooking style, food, ingredients, and temperature (Fullana et al., 2004a, b; Klein et al., 2016a, b; Liu et al., 2017c; Schauer et al., 1999, 2002). Of the different classes of VOCs characterized in these studies, aldehydes have been shown to be the major group of VOCs emitted from cooking oils. These VOCs are chemically produced upon heating via peroxyl radical reactions of the fatty acids (Choe and Min, 2007; Gardner, 1989). Klein et al. (2016b) investigated the composition of nonmethane organic gas (NMOG) emissions from boiling, charbroiling, and shallow and deep frying of various vegetables, meats, and cooking oils heated under different temperature conditions. The authors reported that emissions from shallow frying, deep frying, and charbroiling are dominated by aldehydes, and the relative amounts depend on the type of oil used during cooking (Klein et al., 2016b). C7 aldehydes are the major species in emissions from canola oil, whereas C9 aldehydes are dominant from olive oil (Klein et al., 2016b). These differences in emission patterns of oils vary with composition of triglycerides present in the oil (Choe and Min, 2006). Katragadda et al. (2010) demonstrated an increase of up to an order of magnitude in emissions upon reaching the smoke point of cooking oils. In addition to emissions from cooking oil, the addition of condiments (herbs and peppers) to cooking leads to significant emissions of mono-, sesqui-, and diterpenes in the gas phase (Klein et al., 2016a). Liu et al. (2017b) showed an increase of an order of magnitude in the emissions of VOCs when stir-frying with spices. Therefore, factors like cooking style, food, cooking temperature, and ingredients play a significant role in the chemical profile of cooking emissions (Fullana et al., 2004a, b; Klein et al., 2016a, b; Liu et al., 2017b, c).
The VOCs emitted from cooking have been shown to produce a significant amount of SOA rapidly in recent flow tube (Liu et al., 2017a) and smog chamber studies (Kaltsonoudis et al., 2017; Liu et al., 2017c, 2018). Kaltsonoudis et al. (2017) and Liu et al. (2017a, 2018) showed an increase in O:C ratio upon a few hours of atmospheric aging, suggesting lightly oxidized cooking SOA. Furthermore, Liu et al. (2017a) showed significant production of SOA with increasing OH exposure for different cooking oils. Thus far studies have only focused on formation potential of SOA from cooking emissions. Despite high emission rates of VOCs from cooking, the understanding of SOA composition from these emissions remains limited.
Source apportionment using aerosol mass spectrometry (AMS) data in urban areas has often revealed a cooking organic aerosol (COA) factor, but it is unclear how this factor is related to cooking emissions. Many studies reported that the mass spectra associated with this factor resemble those of the hydrocarbon-like organic aerosol (HOA) factor from other non-cooking sources (Dall'Osto et al., 2015; Hayes et al., 2013; Huang et al., 2010; Mohr et al., 2009, 2012). In addition, it is often unclear whether ambient COA represents primary or secondary organic aerosol from cooking emissions (Dall'Osto et al., 2015; Florou et al., 2017; Kaltsonoudis et al., 2017; Kostenidou et al., 2015). Laboratory studies (Liu et al., 2017a, 2018) showed that the mass spectra for primary cooking organic aerosol exhibited strong correlation with ambient COA factor (Lee et al., 2015), but the cooking SOA mass spectra showed some similarities to ambient semi-volatile oxygenated OA (SV-OOA) factor. These measurements highlight the challenges in assigning COA factor without understanding the changes in chemical composition occurring during oxidation of cooking emissions.
In general, there is a need to better understand the molecular composition contributing to aged COA. In this study, we investigate detailed chemical composition of cooking SOA at the molecular level. The objectives of this study are to (i) understand the detailed chemical speciation of cooking SOA using TD–GC–MS (thermal desorption–gas chromatography–mass spectrometry), (ii) describe chemical evolution in SOA upon atmospheric aging, and (iii) attribute formation of SOA to different VOCs emitted from food cooking emissions. In this work we use heated cooking oil as a model for food cooking emissions. We show that the majority of the SOA is derived from oxidation of aldehydes, and the oxidation mechanisms are dominated by fragmentation reactions. Overall, our results provide useful insights into the evolution of cooking SOA, which may be incorporated into chemical transport models for better predicting OA formation from cooking emissions in the atmosphere.
2.1 Flow tube experiments
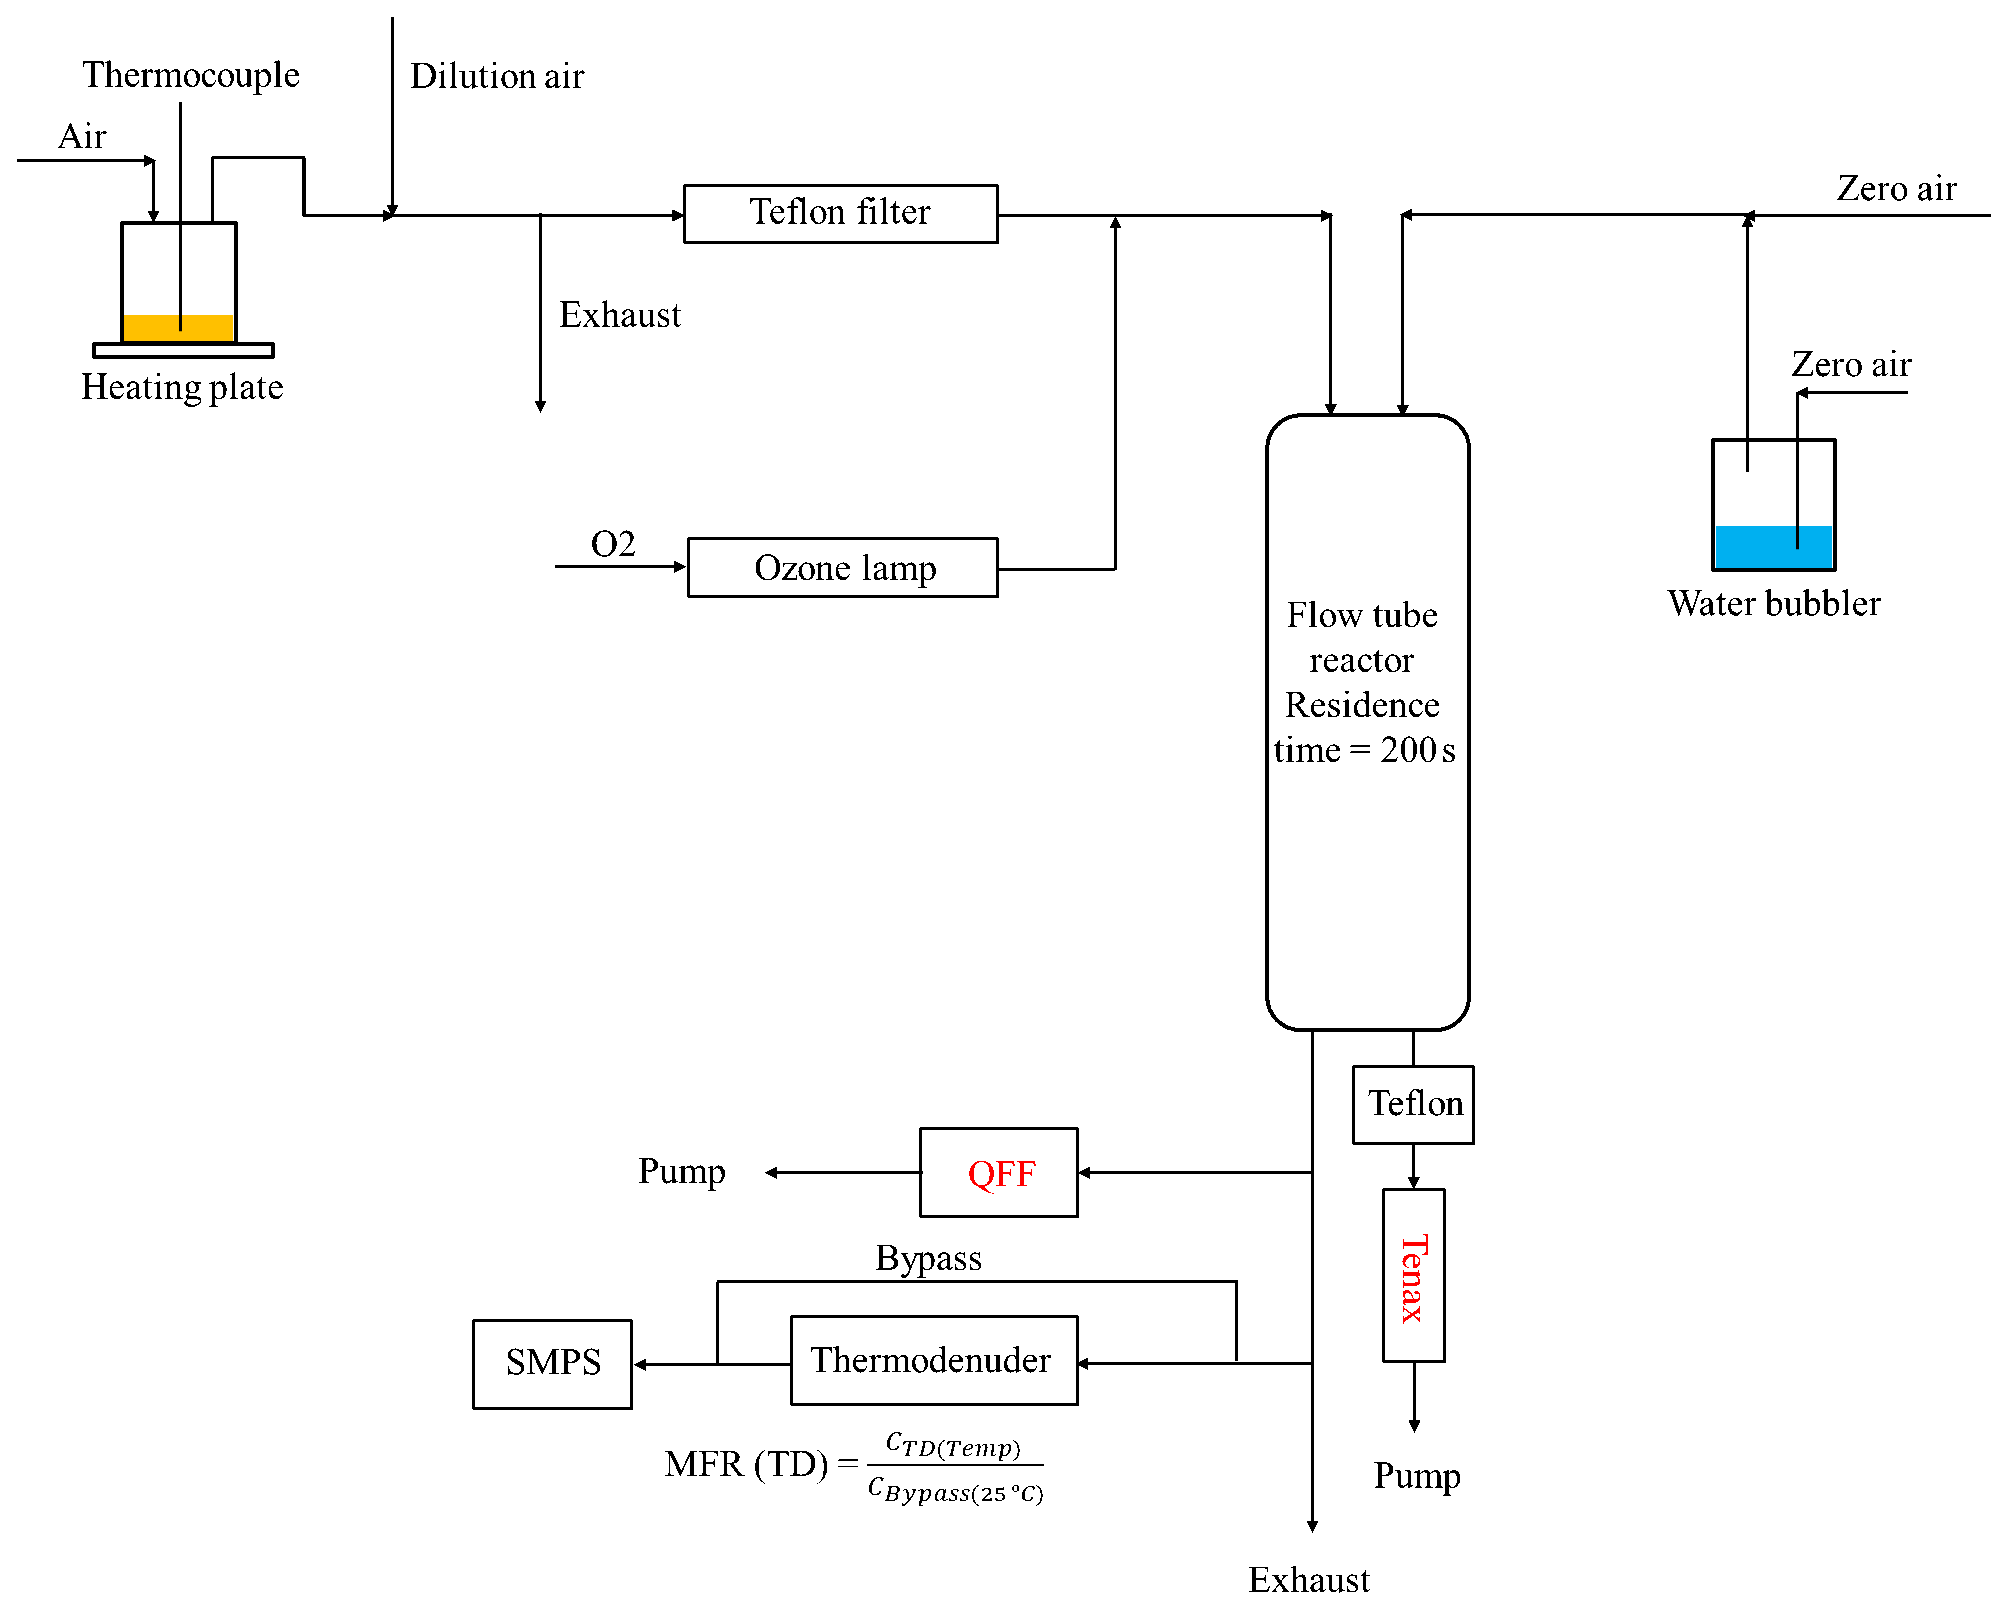
The experimental setup is shown in Fig. 1, and experimental conditions are listed in Table S1. For each experiment, 30–40 mL of canola oil was heated at 250 ∘C on an electric heating plate in a Pyrex bottle, resulting in an average cooking oil temperature of 180 ∘C, as measured by a thermocouple in direct contact with the heated oil. Purified air flowed over the headspace of the heated oil at a rate of 0.2 L min−1 and was then diluted by a factor of 50. A total of 0.2 L min−1 of the total diluted flow was passed through a Teflon filter to remove particles, and the oil vapors were introduced into a custom-built 10 L quartz flow tube reactor. A separate flow of oxygen (99.6 %) was irradiated in a UV ozone generator (UVP 97006601) to produce ozone and was also introduced into the flow tube reactor. In parallel, purified air was flowed through a water bubbler into the reactor to provide water vapor. The combined flow rate through the flow tube was set at 3 L min−1, resulting in an average residence time of approximately 200 s.
In the flow tube, hydroxyl radicals were produced through the photolysis of ozone irradiated by a UV lamp (λ=254 nm) in the presence of water vapor. The integrated OH exposure was measured indirectly from the loss of cyclopentane, which was monitored by a gas chromatography flame ionization detector (GC-FID; model 8610C, SRI Instruments Inc.) equipped with a Tenax TA trap sampling downstream of the flow tube at a rate of 0.15 L min−1. In this study, the experiments were conducted at different OH exposures ranging from 5.77×10¹⁰ to 2.2×10¹¹ molecules cm−3 s. OH exposure in this range is equivalent to ∼11 to 41 h of atmospheric oxidation, respectively, assuming a 24 h average atmospheric OH concentration of 1.5×10⁶ molecules cm−3 (Mao et al., 2009). The effect of ozone on the SOA formation was found to be negligible as the reaction timescales of aldehydes with ozone were calculated to be at least 100 times longer than those with OH. A sample calculation for methacrolein reaction timescales with OH and ozone is shown in the Supplement in Sect. S1.
Downstream of the flow tube, pre-baked quartz fiber filter and Tenax tube samples were collected for offline chemical analysis. The changes in the particle size distribution and volume concentration were monitored using a scanning mobility particle sizer (SMPS) with a differential mobility analyzer (TSI 3081) and a condensation particle counter (TSI 3781). A constant density of 1.4 g cm−3 was assumed to convert particle volume concentration into mass concentration (Chan et al., 2010). Relative humidity and temperature were monitored by an Omega HX94C RH/T transmitter and were maintained at 65 %–70 % and 19–20 ∘C, respectively, for all experiments. A fast stepping and scanning thermodenuder (TD; Aerodyne Inc. Billerica, USA) was also placed downstream of the flow tube to measure SOA evaporation rates. Details about TD operating conditions and analysis can be found in Takhar et al. (2019). The TD was only operated during one experiment in which the OH exposure was 9.23×10¹⁰ molecules cm−3 s. The SOA was systematically heated in a TD from 25 to 175 ∘C, and changes in particle volume concentrations and corresponding mass fraction remaining (MFR) were measured using an SMPS. The SOA size distribution during TD operation and volatility distribution are shown in Figs. S1 and S2, respectively. A kinetic mass transfer model developed by Riipinen et al. (2010) was used to interpret the TD data. The inputs to the model are volatility distribution of OA, enthalpy of vaporization, and mass accommodation coefficients. Compound groups are translated into volatility distributions by binning components according to their saturation concentrations (Donahue et al., 2006). Parameterization for enthalpy of vaporization was similar to that of Takhar et al. (2019). We assume a surface tension of 0.05 N m−1 and gas-phase diffusion coefficients of m2 s−1 for all simulations, similar to those reported in Riipinen et al. (2010).
2.2 Chemical characterization of SOA
Tenax tube and quartz filter samples were analyzed separately by thermal desorption–gas chromatography–mass spectrometry (TD–GC–MS) for detailed chemical speciation of gas- and particle-phase organic compounds. The analyses were performed using a thermal-desorption system (TDS 3, Gerstel) combined with a gas chromatography (7890B, Agilent)–mass spectrometer (5977A, Agilent). For gas-phase analysis, concentrations of aldehydes (C7 to C10 n-alkanals, alkenals, and alkadienals) collected on Tenax tube samples before photooxidation (downstream of the flow tube, with lights off) were quantified. For particle-phase analysis, thermal desorption of quartz filters was performed with in situ derivatization using N-trimethylsilyl-N-methyl trifluoroacetamide (MSTFA). A known amount of deuterated 3-hydroxy-1,5-pentanedioic-2,2,3,4,4-d5 acid, and n-pentadecane-d32 (CDN isotopes) was injected, respectively, onto quartz filter punches and Tenax tubes as internal standards before the samples were desorbed in the TDS. All GC–MS analysis was performed using a non-polar DB5 column (Rxi-5Sil MS, Restek). Details of the operating parameters (GC column, GC and TDS temperature ramps, MS parameters) can be found in Sect. S2 of the Supplement.
With in situ derivatization, polar organic compounds react rapidly with MSTFA at elevated temperatures during thermal desorption, and functional groups with acidic hydrogen atoms (such as –OH) are replaced by a less polar trimethylsilyl (TMS; [–OSi(CH3)3]) group. This reduction in polarity allows the derivatized analyte to elute from a non-polar column and be analyzed by subsequent electron impact (EI) at 70 eV. Derivatized compounds produce a signature fragment ion at mass-to-charge () 73 (–Si(CH), arising from the scission of O–Si bond in R–O–[Si(CH3)3]. In other words, all derivatized compounds produce ions with 73 during analysis. Therefore, the total signal at 73 can be taken as the total concentration of organic compounds with at least one hydroxyl group (including both –OH and –C(O)OH) present in cooking SOA, much like how 57 represents total concentration of aliphatic compounds in hydrocarbon mixtures (Zhao et al., 2014, 2015). It should be noted that organic peroxides (R–OOH) were also found to be derivatized, but the major reaction product formed is R–O–[Si(CH3)3] (which is also formed from R–OH derivatization) as shown in Fig. S3. Here we assume alcohols and acids are the major components but will explore the potential role of ROOH on the overall chemical composition in Sect. 3.1.
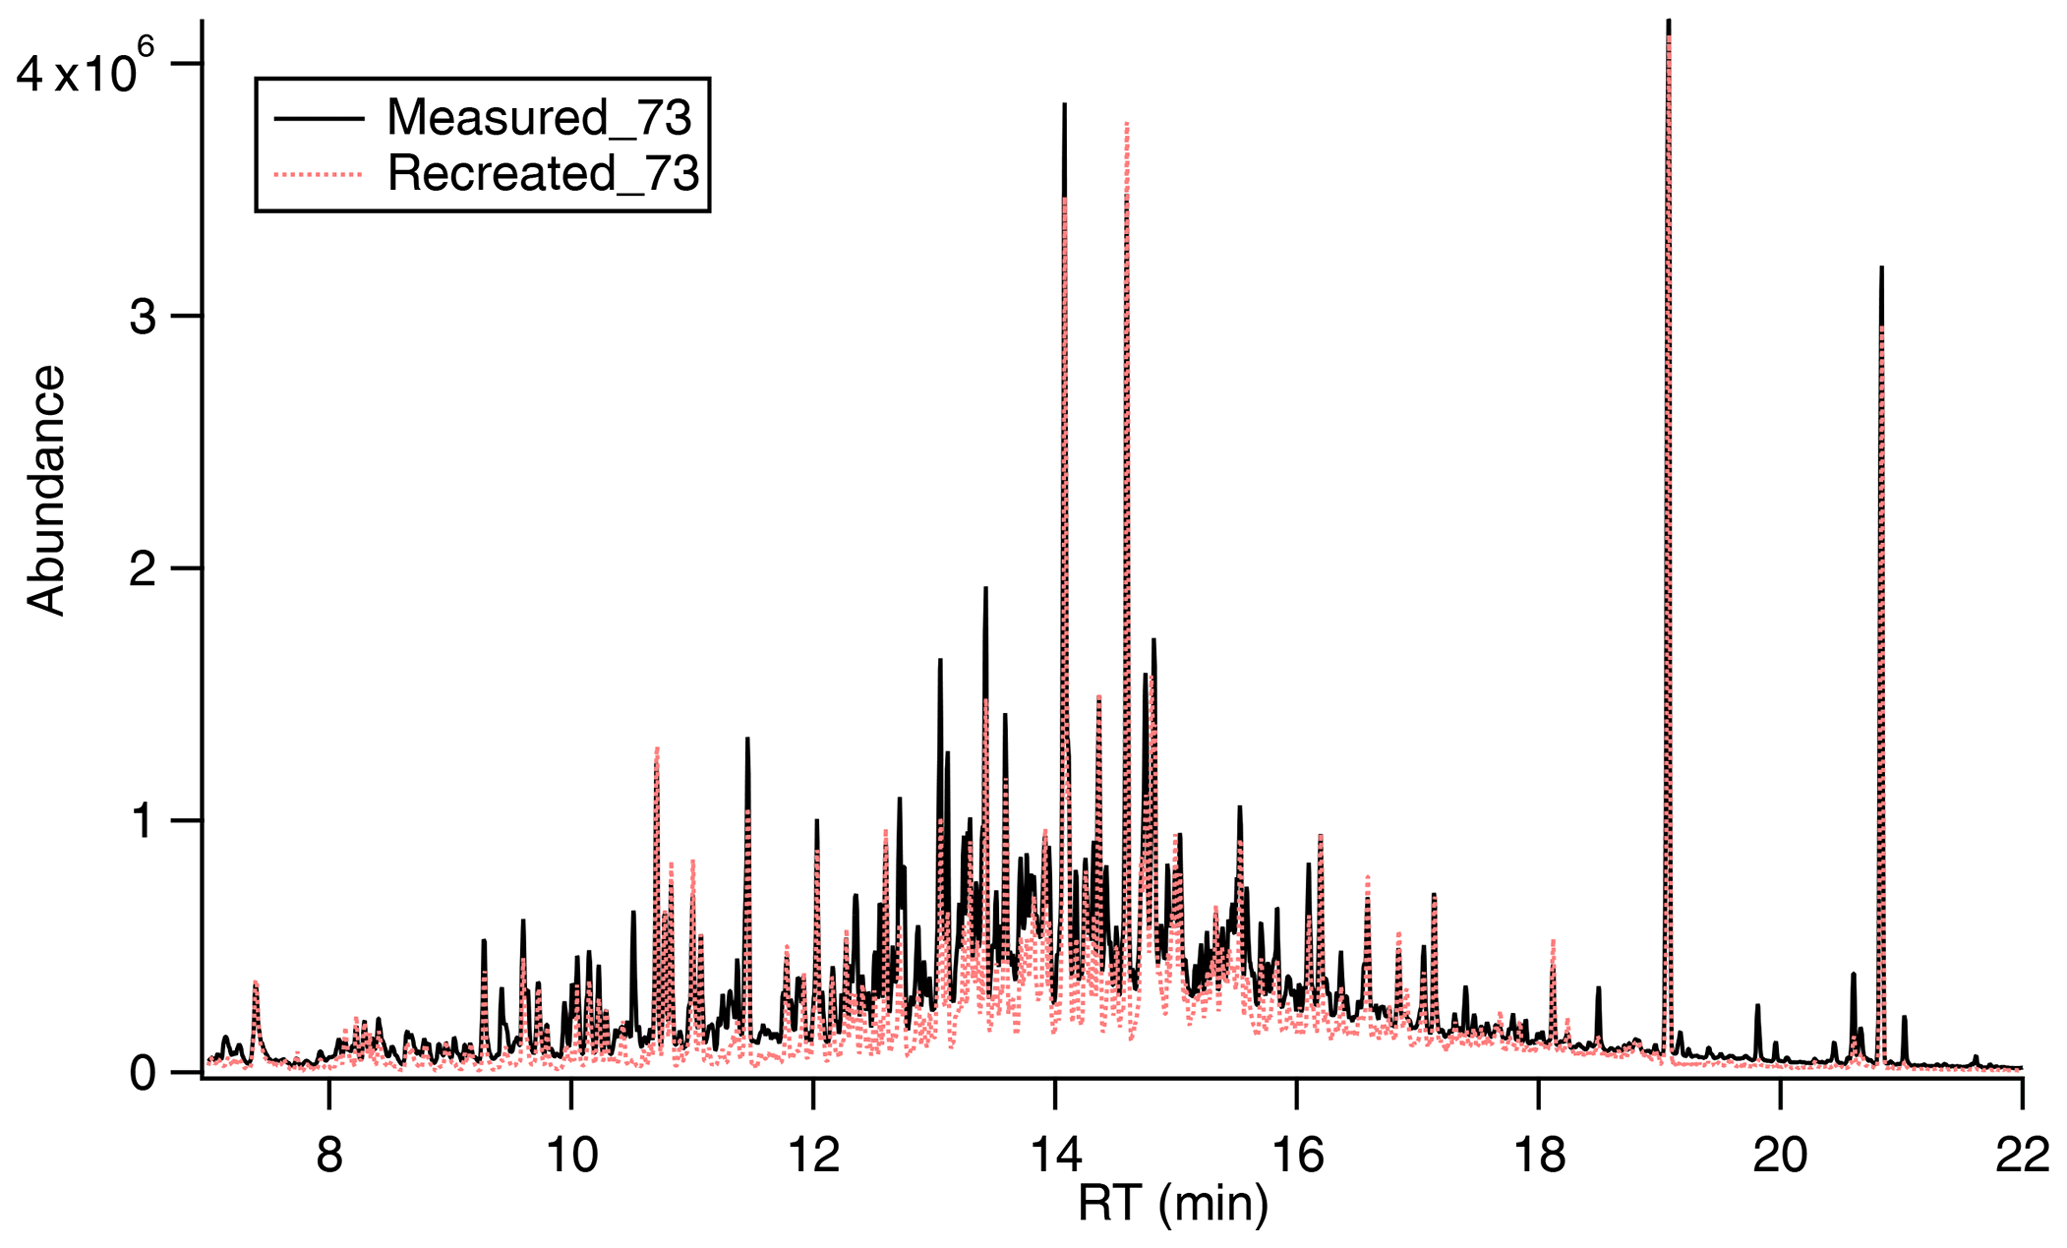
Figure 2Highly complex mixture of canola oil SOA generated upon photooxidation. With known signal and mass fragmentation, the signal of 73 can be recreated based on pseudo-parent ions (e.g., M-15 used in this study).
As shown in Fig. 2, many compounds in cooking SOA contain at least one –OH group, and the chromatogram of 73 is typical of that for a highly complex mixture or unresolved complex mixture (UCM). Using traditional analytical techniques like GC–MS it is difficult to deconvolute the UCM. However, knowledge about mass spectral fragmentation of TMS derivatives can be used to understand the compounds contributing to the UCM. Table S2 shows a list of compounds containing multiple functional groups, e.g., –COOH and –OH, resulting in different combinations of compound classes like dicarboxylic acids, hydroxy acids, hydroxy dicarboxylic acids, and dihydroxy dicarboxylic acids with different carbon numbers. As mentioned earlier, we acknowledge the potential contribution from ROOH but first assume the functional groups shown in Table S2 here and consider ROOH in more detail in a later section. The compound groups shown in Table S2 are expected to be formed from oxidation of aldehydes and be derivatized by MSTFA. The TMS derivatives of these compounds share common ion fragments in their EI mass spectra: 73 [Si(CH3)3], 75, 147 [(CH3)2Si=O(CH3)3], M-15 [M–CH3] (Jaoui et al., 2004, 2005; Yu et al., 1998). Most importantly, all TMS derivatives exhibit quantifiable peaks at 73 (ubiquitous ion for all derivatives) and M-15 (ion specific to each compound group, hereby referred to as the pseudo-parent ion). We also obtained the characteristic ratio of these two ions for each compound group ( from the National Institute of Standards and Technology (NIST) mass spectral libraries and from analyzing authentic standards. To verify the validity of this method, we calculate the total 73 ion signal that is attributable to these compound groups by taking the chromatograms of the pseudo-parent ion for each compound group, dividing by its characteristic ratio , and then summing across all compound groups as shown in Eq. (1).
where is the 73 ion signal at retention time t that is attributable to all compound groups listed in Table S2, is the signal of the pseudo-parent ion for compound group i at retention time t, and is the characteristic ratio of the pseudo-parent ion to 73. This approach is similar to that described in Isaacman-VanWertz et al. (2020). As shown in Fig. 2, shows excellent agreement with the measured 73 ion signal, suggesting that the 73 signal, which is representative of all TMS derivatives, is almost entirely comprised of contributions from the compound groups listed in Table S2. This agreement between our bottom-up approach and measured signal provides confidence that our method is able to provide information about the chemical composition of a highly complex mixture.
With the signals from all the pseudo-parent ions for all compound groups, the total mass of each compound group was then calculated using Eq. (2).
where Mi is the mass of compound group i, TAi is the total integrated signal of the pseudo-parent ion for compound group i (normalized by the signal of the deuterated internal standard), RF is the response factor (calculated from calibration curves of fatty acid and dicarboxylic acid authentic standards) of compound group i, and is the characteristic ratio of the pseudo-parent ion to 73 for compound group i. A more detailed, step-by-step description of the procedure can be found in the Supplement in Sect. S3 and is illustrated in Fig. S4, with corresponding uncertainties in the fitting procedure shown in Fig. S5.
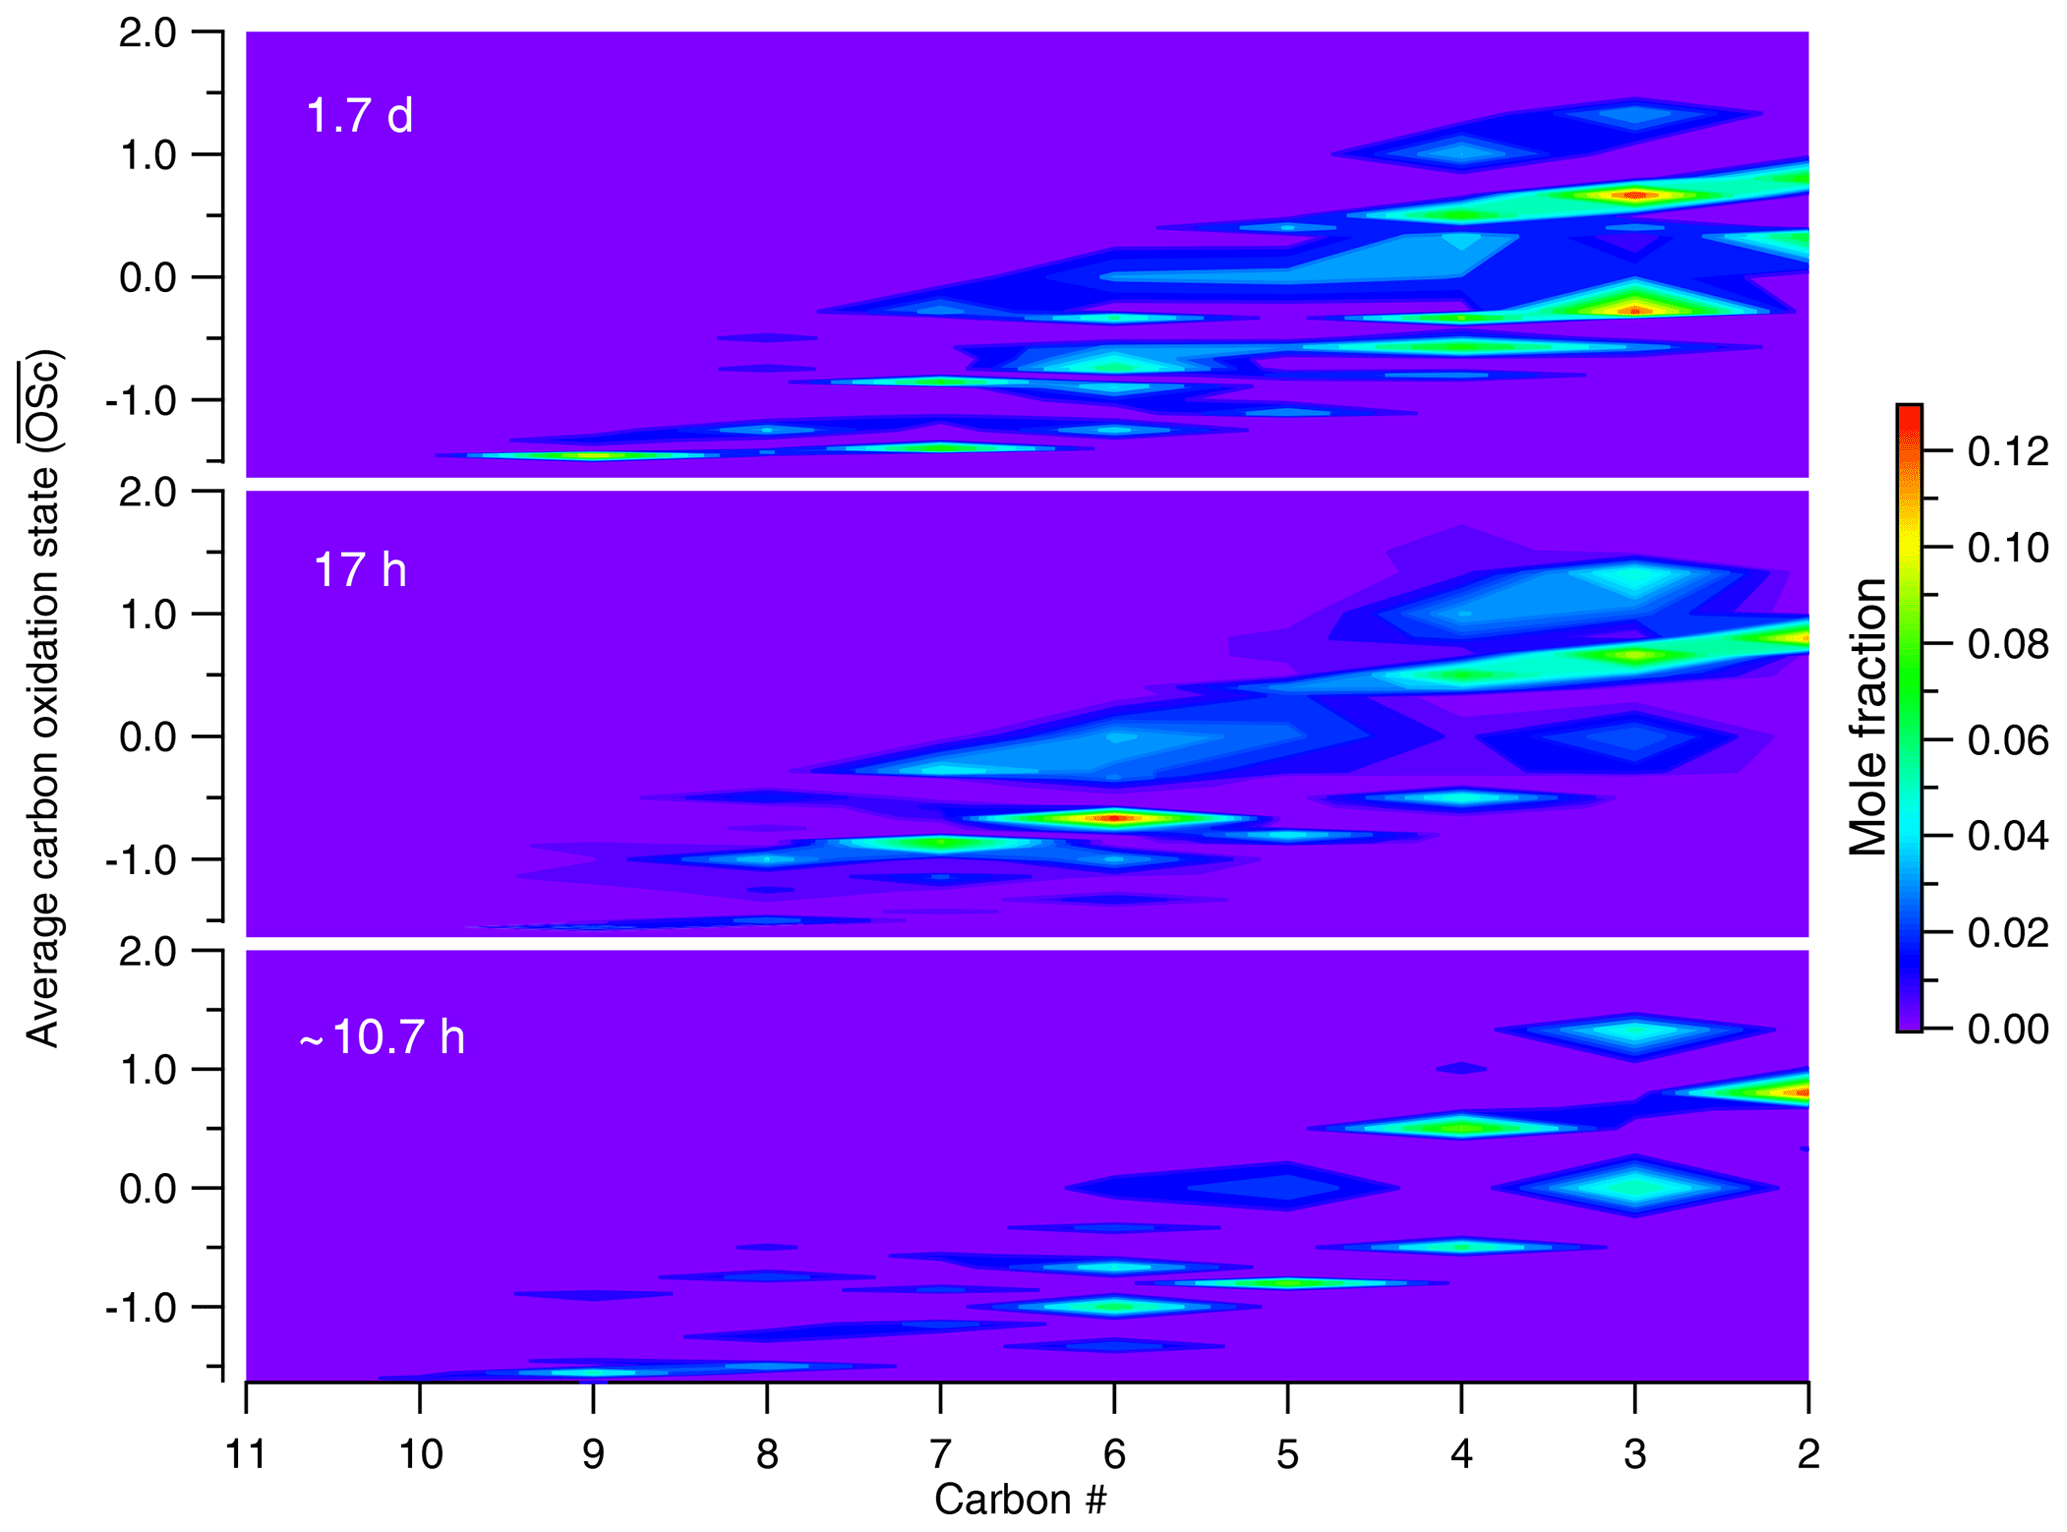
Figure 3Evolution in –nc space for canola oil SOA under different conditions of photochemical aging. As the oxidation progresses in the atmosphere, more compounds are formed with smaller nc and higher , suggesting fragmentation to be a dominant pathway of oxidation for cooking emissions in the atmosphere.
3.1 Chemical evolution of SOA
As described in Sect. 2.2, components in cooking SOA were classified by functional groups and carbon number. To describe the overall changes in SOA composition with increasing OH exposure, we use the average carbon oxidation state () as a metric for the evolving composition of a complex mixture undergoing oxidation (Kroll et al., 2011). Both and number of carbon atoms (nc) for each compound group are calculated from the GC-derived chemical composition. The total mole fraction of C, H, and O was calculated for each sample, which was then used to calculate the bulk using Eq. –H:C (Kroll et al., 2011). The evolution in this framework for canola oil SOA is shown in Fig. 3. The bulk was observed to increase from −0.6 to −0.24 when OH exposure increased from 5.77 to 22.0×10¹⁰ molecules cm−3 s for canola oil SOA. For comparison, Liu et al. (2017a) showed an initial decrease in and O:C, which gradually stabilized at OH exposure greater than 9×10¹⁰ molecules cm−3 s. For the range reported here, the of cooking SOA falls in the range of SV-OOA as determined from factor analysis of AMS data (Canagaratna et al., 2015). This degree of oxygenation is greater than that of the COA factor measured by AMS, which is reported to be around −1.37 (Canagaratna et al., 2015). This difference suggests that the COA factor resolved using positive matrix factorization (PMF) analysis is likely of primary origin and does not represent SOA formed from atmospheric oxidation of cooking emissions. Furthermore, previous GC–MS analysis showed for POA from cooking oils an of −1.66 (canola oil) and −1.7 (beef tallow, olive oil; Takhar et al., 2019). These observations again suggest that the COA factor measured by AMS represents primary cooking emissions.
In addition to carbon oxidation state, knowledge about molecular composition provides further insights into the oxidation mechanisms. Canola oil SOA at an OH exposure of 5.77×10¹⁰ molecules cm−3 s is comprised of ∼19 % larger (C8–C10) and less oxygenated compounds; this fraction declined to ∼11 % at higher OH exposures. Furthermore, the total fraction of C2–C7 products increased from 81 % to 89 % when OH exposure increased from 10.7 h to 1.7 d. Of this fraction, the smaller-carbon-number compounds (C2–C4), which are indicative of fragmentation processes, increased from 42 % at 10.7 h to ∼49 % at 1.7 d. An increase in smaller and more oxygenated compounds, along with a decrease in larger and less oxygenated products, suggests that fragmentation reactions are responsible for the shift towards formation of smaller oxygenated compounds. As a result, oxidation simultaneously leads to higher and lower carbon number on average. Based on the compounds observable by our technique, this trend suggests that fragmentation reactions are key processes in the oxidative evolution of cooking emissions.

Figure 4Van Krevelen diagram of canola oil SOA colored by different OH exposure. In the background, average carbon oxidation state () and functionalization slopes are shown for reference. The slope of −0.19 for canola oil SOA corresponds to formation of both alcohol and carboxylic acid, consistent with the chemical composition obtained from TD–GC–MS.
The compounds observed here can also be compared to previously measured bulk composition using elemental ratios, such as those presented in a Van Krevelen (VK) diagram (Heald et al., 2010). As shown in Fig. 4, the O:C ratio in our study ranged between 0.64 and 0.79 when OH exposure increased from 5.77×10¹⁰ to 22.0×10¹⁰ molecules cm−3 s. The O:C ratios measured using an AMS (Kaltsonoudis et al., 2017; Liu et al., 2017a) ranged between 0.24–0.46, which is within a factor of 2 of those measured in this study. Furthermore, the H:C versus O:C trend is linear with a slope of −0.19, which lies between the slope of 0 measured for low-NOx oxidation reported by Liu et al. (2017a) and −0.4 for high-NOx conditions (Liu et al., 2018). Therefore, based on elemental ratios, the evolution in SOA composition measured in this study is comparable to that in bulk average properties estimated by AMS. Furthermore, we use the two-dimensional volatility basis set (2D-VBS) framework developed by Donahue et al. (2012) to investigate OA chemistry and understand the evolution of cooking SOA through changes in the volatility of the SOA system. The vapor pressures of the identified compounds are calculated using the group contribution method (Pankow and Asher, 2008) where experimentally determined vapor pressures were unavailable and reported in Table S2. The observed compounds in SOA have a broad range of volatilities since they were formed from oxidation of a complex ensemble of VOC precursors. As shown in Fig. S6, there is a minor decrease in overall volatility of the mixture (change lies within 1 decade in C*) irrespective of the presence of peroxides, while is increasing with oxidation. This increase in oxidation state is coincident with increasing fragmentation upon oxidation, and, as a result, the overall change in the bulk volatility of canola oil SOA is relatively small.
As mentioned earlier in Sect. 2.2, there is a potential to misclassify ROOH as ROH using our current GC–MS method. In Fig. S3, we show that derivatization of cumene hydroperoxide forms the TMS of hydroxy-cumene in our system. Here we further examine the chemical composition by assuming that each –O–[Si(CH3)3] group observed originates from an –OOH group in the SOA. It should be noted that replacing –OH with –OOH results in a higher estimate of O:C (and ) but does not change H:C or carbon number. Furthermore, since pseudo-molecular ion fraction () for organic peroxides (needed for quantification) is unknown, we assume that it is similar to those presented in Table S2. As shown in Fig. S7 if all observed –OH groups are –OOH groups, the VK slope would be −0.15, which is similar to the value of −0.19 calculated based on the no-peroxide assumption. Similarly, Fig. S6 shows that this uncertainty in hydroxyl group identification has a negligible effect on estimation of vapor pressure or volatility in the 2D-VBS framework. Therefore, this potential misclassification of peroxide groups may lead to an underestimation in O:C and but is not expected to affect estimates of volatility and our general conclusions about the importance of fragmentation reactions. In the future, analytical techniques such as extractive-electrospray-ionization time-of-flight mass spectrometry (Lopez-Hilfiker et al., 2019) may be useful to better understand the composition of peroxides from cooking SOA. While the misclassification of peroxides may have little impact on the bulk properties such as average O:C ratios, there may be important implications on understanding the reactivity of the SOA.
3.2 Evaporation rates of SOA
The volatility of the SOA is also probed by measuring the evaporation rates in a heated thermodenuder and compared to the rates expected from the measured composition. In order to derive the evaporation rates from the measured chemical composition of cooking SOA, we use the kinetic mass transfer model developed by Riipinen et al. (2010). Among the inputs into the model, the mass accommodation coefficient is a critical but uncertain parameter that accounts for the mass transfer limitations in the system.
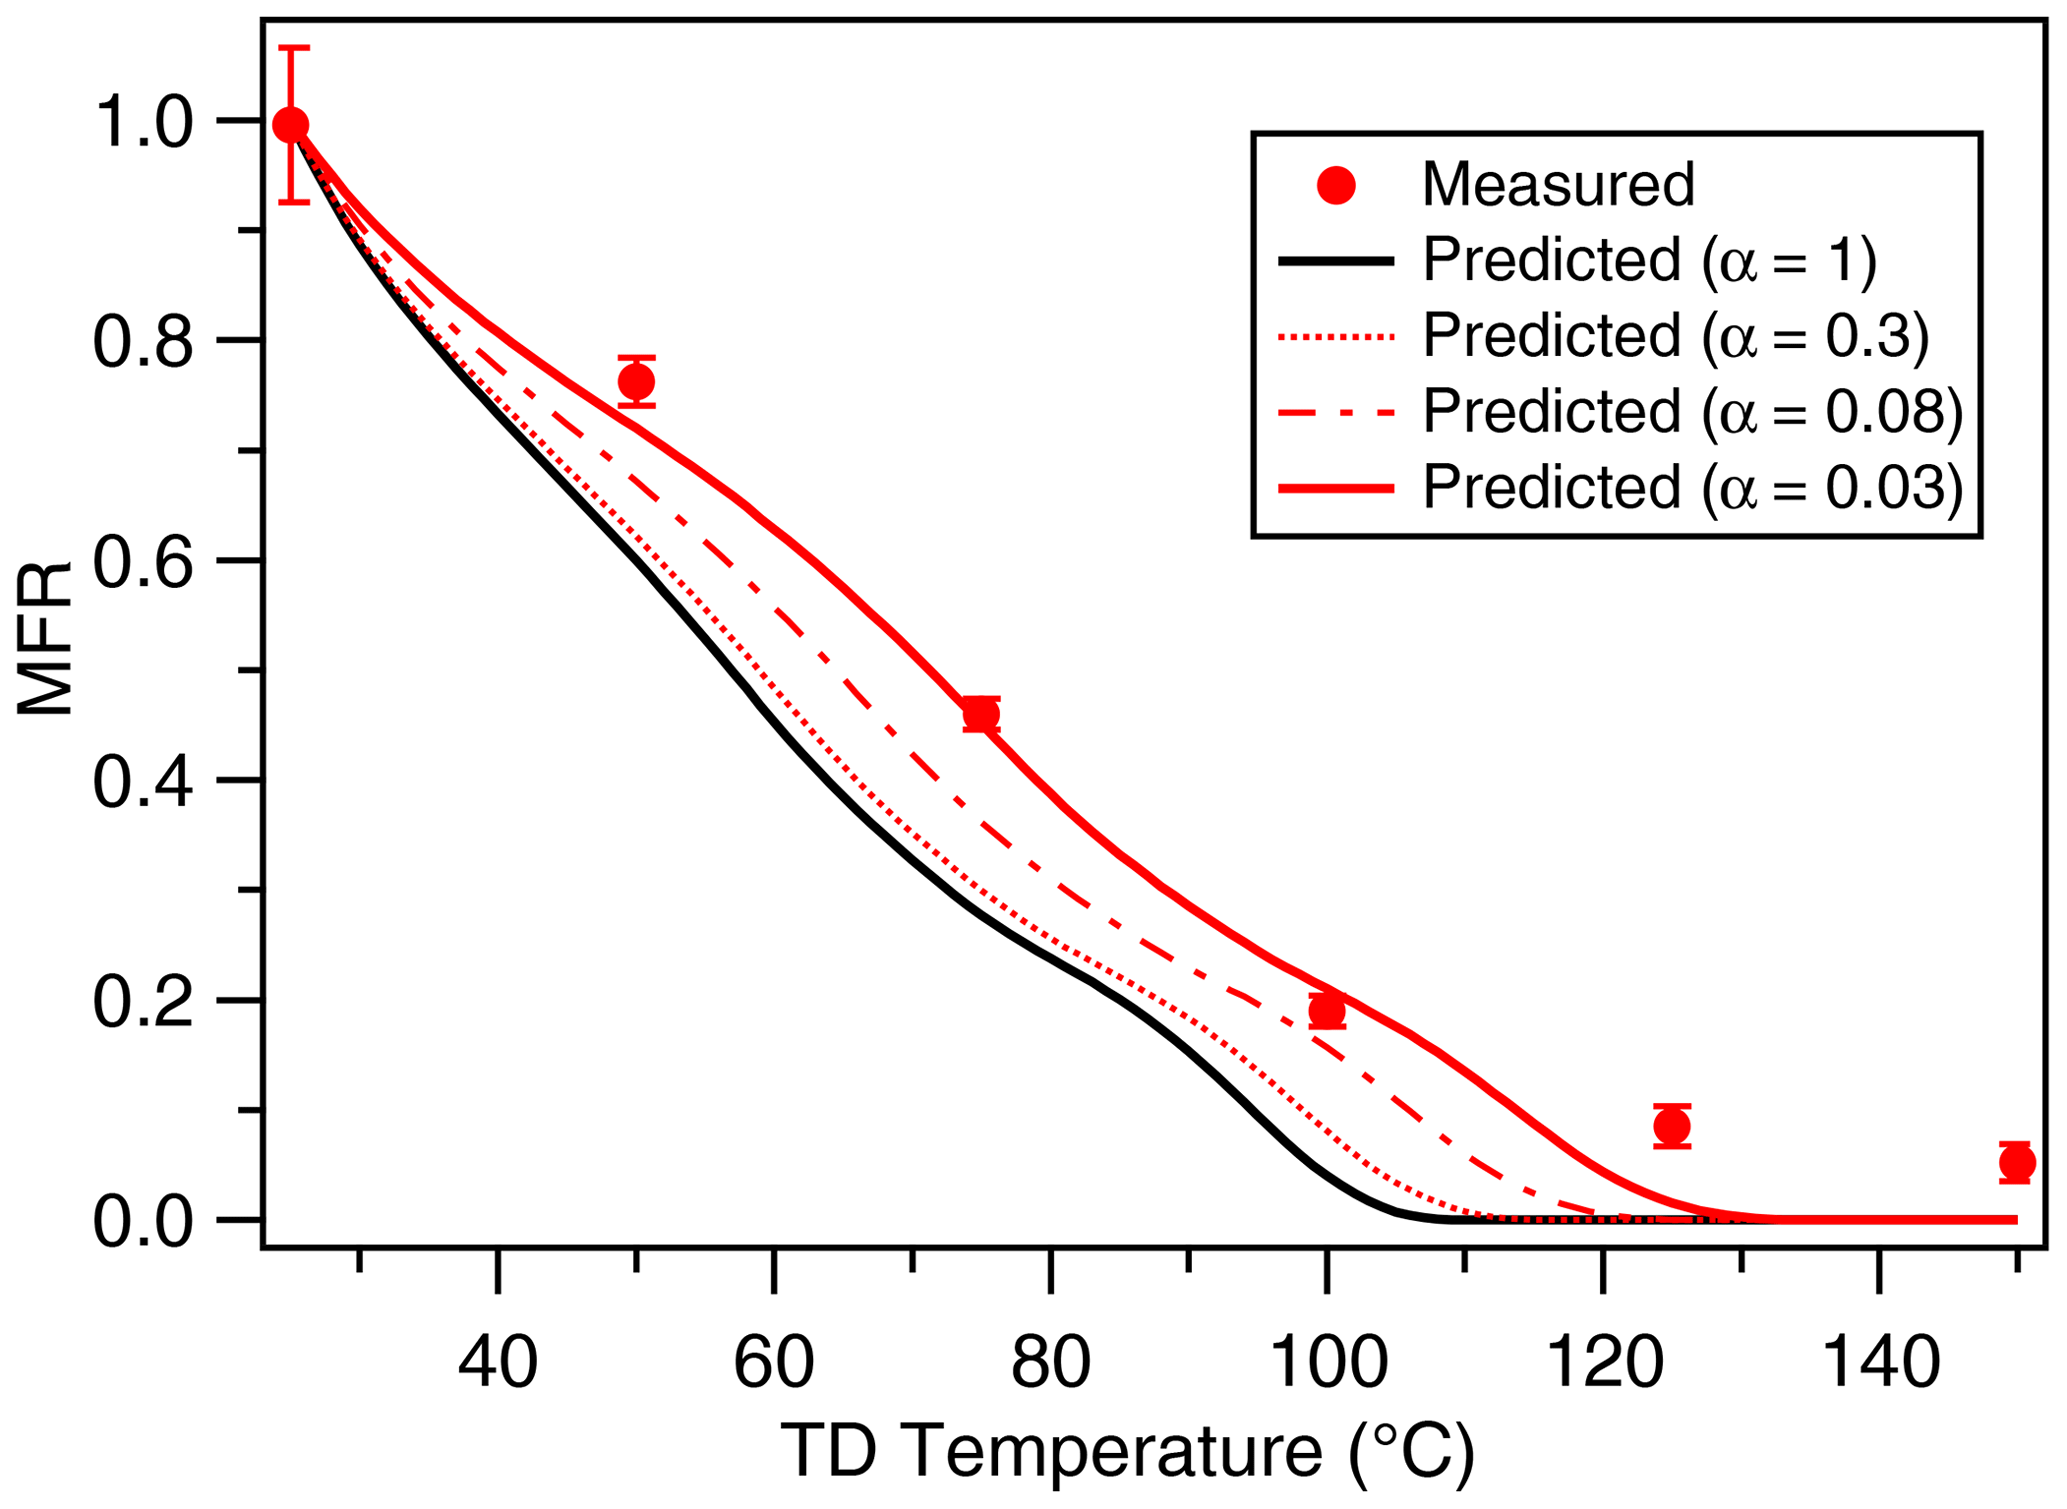
Figure 5Mass thermogram of canola oil SOA at an OH exposure of 9.23×10¹⁰ molecules cm−3 s. The black line represents model simulations using α=1, underpredicting the measured MFR. The red line corresponds to model simulations using α=0.03, predicting the measurements reasonably well, therefore implying kinetic limitations in the system. The error bars represent ±1σ.
Figure 5 shows both measured and modeled mass thermograms for canola oil SOA. We observe that for canola oil SOA, a mass accommodation coefficient of 0.03 is needed to predict the experimentally determined mass thermograms. An accommodation coefficient of <1 suggests that mass transfer limitations in the system likely occur in the condensed phase. Formation of multifunctional organic compounds such as those observed in this study is likely responsible for an increase in viscosity through increasing hydrogen bonding and other polar interactions (Rothfuss and Petters, 2016). It should be noted that Takhar et al. (2019) reported similar magnitudes of mass accommodation coefficients for heterogeneous oxidation of cooking oil particles. Due to similarity in the type of functional groups present in both aging pathways, we believe the decrease in mass accommodation coefficients for both systems undergoes similar changes in phase and/or viscosity.
These measurements of evaporation rates are consistent with the volatilities expected from our measured composition of SOA containing small oxygenated compounds. Although mass accommodation coefficients are highly uncertain, the mass accommodation coefficients for other SOA systems have been measured to be even lower, on the order of 10−4 (Cappa and Wilson, 2011), which would require the volatilities to be even higher to explain the measured evaporation rates. Therefore, the TD measurements support the conclusion that smaller oxygenated compounds are produced from oxidation of cooking oil vapors and that fragmentation reactions are dominant. Furthermore, these measurements provide useful inputs into chemical transport models for predicting SOA formation and gas-particle partitioning. Our previous work (Takhar et al., 2019) showed that even at , gas-particle partitioning timescales are short (within hours), and the assumption of equilibrium partitioning still holds for regional-scale SOA formation. Further work is needed to directly measure the viscosity of cooking SOA and corresponding mixing timescales to better constrain the physicochemical properties of cooking SOA.
3.3 Contribution of aldehydes to observed oxidation products and total SOA
Since cooking oil vapors are comprised of a number of reactive aldehydes that can lead to SOA formation, we conduct further experiments of SOA formation from these precursors and identify the relative contributions to observed oxidation products and to total SOA. These results are applied to the heated-cooking-oil experiments to understand the role of aldehydes in the overall production and evolution of cooking oil SOA.
3.3.1 Formation of particle-phase oxidation products
As described in the earlier sections, we are able to quantify the mass concentrations of different compound groups (six different combinations of functional groups, from C2 to C10, summarized in Table S2) in the particle phase for all experiments. We denote the observed mass concentrations of compound group i in SOA from canola oil photooxidation as . The expected precursors to these oxidation products are likely aldehydes since aldehydes are emitted in significant amounts and are highly reactive. To examine this hypothesis, here we calculate the formation of these observed compound groups from oxidation of aldehydes. For this calculation, heptanal, trans-2-heptenal, trans-2-octenal, trans,trans-2,4-heptadienal, and trans,trans-2,4-decadienal (Sigma Aldrich Co.) were considered because these aldehydes are the dominant VOC precursors emitted from heated canola oil in our experiments as shown in Fig. S8. More volatile aldehydes, such as acrolein and methacrolein, were likely present but could not be captured and analyzed by our techniques. The molar amount reacted for each aldehyde j in the canola oil oxidation experiments is denoted as and was calculated based on the measured OH exposure.

Figure 6Prediction of different compounds formed at an OH exposure of 6.43×10¹⁰ molecules cm−3 s using product molar yields of heptanal, heptenal, octenal, heptadienal, and decadienal. The total aldehyde products can explain the observed oil SOA products within a factor of 0.5, while the inconsistency in prediction of some SOA products is likely caused by differences in gas-particle partitioning in both photooxidation systems.
In order to estimate the contribution from oxidation of an aldehyde j in the gas-phase mix to the formation of each compound group i, we conducted a series of experiments in which a representative aldehyde was oxidized, and the molar yields of the various compounds were measured:
where γij represents the molar yield of compound group i from precursor j, denotes the mass concentration of compound i observed in photooxidation experiments in which aldehyde j was the sole precursor, MWi is the molecular weight of compound i, and is the amount of precursor j reacted in each experiment. γij is then applied to the heated-cooking-oil experiments to estimate the mass of oxidation products that would form from each precursor:
A sample calculation for this analysis is presented in Sect. S4 of the Supplement. The comparison between (contribution of aldehyde oxidation to formation of compound i) and (observed concentrations of compound i) is shown in Fig. 6. Based on this methodology, oxidation of aldehydes accounts for 63 µg m−3 () of the observed 75 µg m−3 () (or 84 %) of particle-phase oxidation products measured at an OH exposure of 6.43×10¹⁰ molecules cm−3 s. The contributions of alkanals (heptanal), alkenals (heptenal + octenal), and alkadienals (heptadienal + decadienal) are 7 %, ∼31 %, and 46 %, respectively.
While the mass of oxidation products expected from aldehydes is somewhat lower than that observed in canola oil SOA, this difference may arise from differences in gas-particle partitioning between single-aldehyde photooxidation and canola oil photooxidation. As shown in Fig. 6, the formation of higher-carbon-number products cannot be explained from the photooxidation of aldehydes used to predict oil oxidation products, likely due to the assumption of negligible particle-phase or oligomerization reactions occurring in the condensed phase. In addition, higher-carbon-number acids are likely present as primary vapors in the gas phase, which can then partition to the condensed phase upon SOA formation. As shown in Fig. S9, more oxygenated compounds (higher O:C and greater number of functional groups) tend to be more abundant in the canola oil SOA than expected from aldehyde photooxidation, suggesting that canola oil SOA is more favorable for oxygenated compounds to partition than SOA from individual aldehydes. On the other hand, there is no clear trend in partitioning with respect to vapor pressures and carbon number. It should be noted that uncertainties in the fitting procedure or estimation in the pseudo-molecular ion (refer to Table S2 and Fig. S5) can also result in uncertainties between −40 % and +20 %. Therefore, in summary, the quantified oxidation products from canola oil SOA are generally consistent with those from aldehyde photooxidation, and the relative masses may be subject to further changes due to gas-particle partitioning.
3.3.2 Using the statistical oxidation model (SOM) framework
To further explore the evolution of canola oil SOA, we applied our results to the statistical oxidation model (SOM) framework developed by Cappa and Wilson (Cappa et al., 2013; Cappa and Wilson, 2012). SOM describes the oxidation chemistry of a VOC precursor through multi-generational space defined by the number of carbon and oxygen atoms present in the precursor and its possible SOA product molecules. The SOM does not specifically track the product composition in terms of functional groups but provides adequate details to represent key atmospheric processes such as gas-particle partitioning, fragmentation, functionalization, reactions with oxidants, and condensed-phase chemistry. The model has been applied to chamber experiments to derive parametrizations by fitting experimental data to both SOA mass concentration and the bulk aerosol O:C ratio. Eluri et al. (2018) used the chamber-derived parameterizations to predict the properties of SOA generated from diesel exhaust in an oxidation flow tube reactor.
To the best of the authors' knowledge, there are no parameterizations for the oxidation of aldehydes. Therefore, in this study we first derived the parameterizations for aldehyde oxidation and then use these parameters to predict the SOA mass concentrations. In order to obtain the parameters, we fit the measured SOA concentration from oxidation of heptanal, trans-2-heptenal, and trans,trans-2,4-heptadienal at different OH exposures to optimize the six tunable parameters under low-NOx conditions (shown in Fig. S10). Best-fit SOM parameters indicate that photooxidation leads to fragmentation per reaction with OH, as shown by a lower mfrag than compared to other systems, e.g., alkanes (≥2 for branched, cyclic, or n-alkane under low-NOx conditions (Eluri et al., 2018)). Since a lower value for mfrag represents greater fragmentation (Cappa and Wilson, 2012), this again reflects the higher propensity for fragmentation in this SOA system. The optimized parameters were then used to predict the SOA concentration for canola oil photooxidation under different aging conditions in the OH exposure range, similarly to that of aldehyde photooxidation.

Figure 7SOM prediction of SOA produced from different aldehydes with increasing photochemical age. The model overpredicts SOA formation at lower photochemical age, while it underpredicts SOA formation by ∼40 % at higher photochemical age, suggesting that traditional VOC precursors cannot fully explain the SOA formation, and other gas-phase precursors may be needed to better constrain the formation of SOA at higher aging conditions. In addition, the SOM-predicted O:C is within 50 % of the measured O:C, suggesting that the overall change in chemical composition of cooking SOA is predicted reasonably well.
Based on these established parameterizations for different aldehydes, model simulations were conducted for canola oil having a mixture of aldehydes under different photochemical-aging conditions. It should be noted that we used parameterizations of heptanal for all alkanals, heptenal for all alkenals, and heptadienal for alkadienals. As shown in Fig. 7, the model generally captures the amount of SOA formed to up to 62 % but overpredicts SOA formation at lower photochemical ages and underpredicts SOA concentrations at higher photochemical ages. In addition, SOM also tracks atomic O:C ratio, which was further compared with the measured O:C ratio. SOM predicts an O:C around 0.51, which is within 50 % of the measured O:C, likely suggesting that the changes in chemical composition of cooking SOA are in a reasonable agreement with the model predictions. Furthermore, the unexplained SOA can likely arise from other unidentified S and IVOCs as hypothesized by Liu et al. (2017c). However, unlike traffic emissions (Zhao et al., 2014), S and IVOCs from cooking have not been positively identified. In addition, small VOC precursors like acrolein and malondialdehyde, which have been measured in large quantities from cooking emissions (Klein et al., 2016b), may form SOA products having higher O:C ratios, which may better explain the O:C ratios observed in our experiments.
One inconsistency between the model and measurements is the slope at which SOA is being formed. The experimental data suggest a steeper trend of SOA formation, while the model predicts a more gradual increase in SOA formation. A potential explanation for this discrepancy is the contribution from other unmeasured VOCs. These VOCs are less reactive than those considered in the model such that they contribute to higher SOA at higher OH exposures. Alternatively, these missing VOCs are more volatile such that more of their SOA is formed at later generations of oxidation. For example, acrolein forms SOA with measurable yields (Chan et al., 2010) and is emitted at large amounts from heated cooking oils (Klein et al., 2016b). Despite these limitations, these parameterizations generally capture the amount of SOA formed and its degree of oxidation (O:C) on oxidation timescales relevant to urban areas (within 2 d) and are useful for representing cooking oil emissions in the chemical transport models. Overall, the amount of SOA formed and the evolution upon oxidation can be well described by photooxidation of aldehydes.
In this work, we characterize the detailed chemical composition of SOA generated from cooking oil vapors. We show that cooking SOA occurring as a highly complex mixture can be deconvoluted using mass spectral fragmentation pattern to extract useful information about the chemical identities of organic compounds, such as functional groups and carbon number. Using this detailed chemical composition of cooking SOA, we show that fragmentation is an important pathway for oxidative processing of cooking emissions in the atmosphere even within short timescales of oxidation. Furthermore, we show that aldehydes can reasonably explain the formation of SOA generated from cooking oil vapors and the oxidative evolution as described using a multi-generational oxidation model. Our study, therefore, highlights the importance of molecular composition in constraining the chemical properties of cooking SOA as well as understanding the contribution of aldehydes in the formation of SOA from cooking emissions.
Consistent with other studies, our work shows that aldehydes are an important class of VOC precursors emitted from cooking emissions, and substantial efforts have been made to measure their emission factors depending on different cooking settings (heating temperature, cooking style, food, ingredients) (Klein et al., 2016a, b). However, the contribution of aldehydes from cooking emissions is underrepresented in chemical transport models. Recently, McDonald et al. (2018) showed that the ambient concentrations of OA were underpredicted when aldehydes were not included in the box model calculations, suggesting that aldehydes, likely from food cooking, play an important role in atmospheric oxidation chemistry. Furthermore, Klein et al. (2019) showed that heavy polluters like restaurants play a significant role in contributing to the ambient cooking organic aerosol concentrations. In this study, we show that a large fraction of the SOA is derived from aldehyde precursors, with strong similarities in chemical composition. Therefore, it is important to consider the contribution of aldehyde chemistry in atmospheric models towards total OA budget. Furthermore, we demonstrate the importance of fragmentation reactions and their influence on OA properties such as volatility and chemical composition. Future work should therefore focus on measuring not only the SOA formation but also the oxygenated VOCs formed due to fragmentation upon aging to provide insights into aging of cooking emissions.
Formation of SOA from cooking emissions in the atmosphere is likely influenced by emissions of POA and other gas-phase precursors. Therefore, inclusion of POA during atmospheric processing of cooking emissions will likely influence the physicochemical properties of cooking SOA. For instance, with cooking POA being much less functionalized than SOA, inclusion of POA will likely decrease the system O:C (or ). However, POA from cooking emissions can undergo heterogeneous reactions in the atmosphere, thereby increasing O:C (or ). On the other hand, there could potentially be contributions from other gas-phase precursors or S and IVOCs emitted from cooking vapors that can result in SOA formation. These precursors can potentially contribute to SOA formation from cooking emissions, but their oxidative evolution in the atmosphere is not well understood.
Gas-particle partitioning of SOA can be further affected by non-ideal mixing as well as morphology of the particles (Shiraiwa et al., 2013; Zuend and Seinfeld, 2012). Future work should investigate the effect of these parameters on cooking SOA properties and formation potential. To account for thermodynamic mixing favorability of the particles, the Hansen solubility framework developed by Ye et al. (2016) can be implemented to provide insights into SOA mixing and yield enhancement. As shown in Ye et al. (2018), primary meat-cooking emissions can enhance SOA yield from α-pinene due to similarity in Hansen solubility parameters, suggesting that primary meat-cooking particles are miscible with α-pinene SOA. It should be noted that the present study did not investigate the effect of atmospherically relevant seed particles as well as NOx levels, which are representative of typical urban environments. Upon entering the atmosphere, emissions get mixed with background air and other source emissions and diluted upon mixing, thereby altering the gas-particle partitioning and thus the total OA loading. Therefore, it is important to understand the changes in partitioning and miscibility of cooking emissions as the composition continually evolves with atmospheric processing. Additionally, as mentioned earlier, cooking SOA undergoes large mass transfer limitations due to changes in the phase state of the SOA particles, making it more important to experimentally determine the corresponding viscosity of cooking SOA. Therefore, future work should focus on measuring both the viscosity and miscibility of SOA derived from cooking emissions.
The SOM code used in this paper is cited in Sect. 3.3.2 and should be requested from Cappa and Wilson (2012) and Cappa et al. (2013)
The data are available upon request to the corresponding author.
The supplement related to this article is available online at: https://doi.org/10.5194/acp-21-5137-2021-supplement.
MT and AWHC designed the research. MT collected and analyzed the data. MT, YL, and AWHC interpreted the results. MT and AWHC wrote the manuscript with input from YL.
The authors declare that they have no conflict of interest.
The authors acknowledge Environment and Climate Change Canada (ECCC) for funding support through the government of Canada Grants and Contributions program. The authors would like to thank Shao-Meng Li from ECCC for use of the thermodenuder; Chris Cappa from UC Davis for help with SOM simulations; and Greg Evans, Jeff Brook, and Tengyu Liu from the University of Toronto for helpful discussion.
This paper was edited by Allan Bertram and reviewed by two anonymous referees.
Allan, J. D., Williams, P. I., Morgan, W. T., Martin, C. L., Flynn, M. J., Lee, J., Nemitz, E., Phillips, G. J., Gallagher, M. W., and Coe, H.: Contributions from transport, solid fuel burning and cooking to primary organic aerosols in two UK cities, Atmos. Chem. Phys., 10, 647–668, https://doi.org/10.5194/acp-10-647-2010, 2010.
Canagaratna, M. R., Jimenez, J. L., Kroll, J. H., Chen, Q., Kessler, S. H., Massoli, P., Hildebrandt Ruiz, L., Fortner, E., Williams, L. R., Wilson, K. R., Surratt, J. D., Donahue, N. M., Jayne, J. T., and Worsnop, D. R.: Elemental ratio measurements of organic compounds using aerosol mass spectrometry: characterization, improved calibration, and implications, Atmos. Chem. Phys., 15, 253–272, https://doi.org/10.5194/acp-15-253-2015, 2015.
Cappa, C. D. and Wilson, K. R.: Evolution of organic aerosol mass spectra upon heating: implications for OA phase and partitioning behavior, Atmos. Chem. Phys., 11, 1895–1911, https://doi.org/10.5194/acp-11-1895-2011, 2011.
Cappa, C. D. and Wilson, K. R.: Multi-generation gas-phase oxidation, equilibrium partitioning, and the formation and evolution of secondary organic aerosol, Atmos. Chem. Phys., 12, 9505–9528, https://doi.org/10.5194/acp-12-9505-2012, 2012.
Cappa, C. D., Zhang, X., Loza, C. L., Craven, J. S., Yee, L. D., and Seinfeld, J. H.: Application of the Statistical Oxidation Model (SOM) to Secondary Organic Aerosol formation from photooxidation of C12 alkanes, Atmos. Chem. Phys., 13, 1591–1606, https://doi.org/10.5194/acp-13-1591-2013, 2013.
Chan, A. W. H., Chan, M. N., Surratt, J. D., Chhabra, P. S., Loza, C. L., Crounse, J. D., Yee, L. D., Flagan, R. C., Wennberg, P. O., and Seinfeld, J. H.: Role of aldehyde chemistry and NOx concentrations in secondary organic aerosol formation, Atmos. Chem. Phys., 10, 7169–7188, https://doi.org/10.5194/acp-10-7169-2010, 2010.
Choe, E. and Min, D. B.: Mechanisms and factors for edible oil oxidation, Compr. Rev. Food Sci. Food Saf., 5, 169–186, https://doi.org/10.1111/j.1541-4337.2006.00009.x, 2006.
Choe, E. and Min, D. B.: Chemistry of deep-fat frying oils, J. Food Sci., 72, 77–86, https://doi.org/10.1111/j.1750-3841.2007.00352.x, 2007.
Crippa, M., DeCarlo, P. F., Slowik, J. G., Mohr, C., Heringa, M. F., Chirico, R., Poulain, L., Freutel, F., Sciare, J., Cozic, J., Di Marco, C. F., Elsasser, M., Nicolas, J. B., Marchand, N., Abidi, E., Wiedensohler, A., Drewnick, F., Schneider, J., Borrmann, S., Nemitz, E., Zimmermann, R., Jaffrezo, J.-L., Prévôt, A. S. H., and Baltensperger, U.: Wintertime aerosol chemical composition and source apportionment of the organic fraction in the metropolitan area of Paris, Atmos. Chem. Phys., 13, 961–981, https://doi.org/10.5194/acp-13-961-2013, 2013.
Dall'Osto, M., Paglione, M., Decesari, S., Facchini, M. C., O'Dowd, C., Plass-Duellmer, C., and Harrison, R. M.: On the Origin of AMS “cooking Organic Aerosol” at a Rural Site, Environ. Sci. Technol., 49, 13964–13972, https://doi.org/10.1021/acs.est.5b02922, 2015.
Donahue, N. M., Robinson, A. L., Stanier, C. O., and Pandis, S. N.: Coupled partitioning, dilution, and chemical aging of semivolatile organics, Environ. Sci. Technol., 40, 2635–2643, https://doi.org/10.1021/es052297c, 2006.
Donahue, N. M., Kroll, J. H., Pandis, S. N., and Robinson, A. L.: A two-dimensional volatility basis set – Part 2: Diagnostics of organic-aerosol evolution, Atmos. Chem. Phys., 12, 615–634, https://doi.org/10.5194/acp-12-615-2012, 2012.
Eluri, S., Cappa, C. D., Friedman, B., Farmer, D. K., and Jathar, S. H.: Modeling the formation and composition of secondary organic aerosol from diesel exhaust using parameterized and semi-explicit chemistry and thermodynamic models, Atmos. Chem. Phys., 18, 13813–13838, https://doi.org/10.5194/acp-18-13813-2018, 2018.
Florou, K., Papanastasiou, D. K., Pikridas, M., Kaltsonoudis, C., Louvaris, E., Gkatzelis, G. I., Patoulias, D., Mihalopoulos, N., and Pandis, S. N.: The contribution of wood burning and other pollution sources to wintertime organic aerosol levels in two Greek cities, Atmos. Chem. Phys., 17, 3145–3163, https://doi.org/10.5194/acp-17-3145-2017, 2017.
Fullana, A., Carbonell-Barrachina, A. A., and Sidhu, S.: Comparison of volatile aldehydes present in the cooking fumes of extra virgin olive, olive, and canola oils, J. Agric. Food Chem., 52, 5207–5214, https://doi.org/10.1021/jf035241f, 2004a.
Fullana, A., Carbonell-Barrachina, Á. A., and Sidhu, S.: Volatile aldehyde emissions from heated cooking oils, J. Sci. Food Agric., 84, 2015–2021, https://doi.org/10.1002/jsfa.1904, 2004b.
Gardner, H. W.: Oxygen radical chemistry of polyunsaturated fatty acids, Free Radic. Biol. Med., 7, 65–86, https://doi.org/10.1016/0891-5849(89)90102-0, 1989.
Hallquist, M., Wenger, J. C., Baltensperger, U., Rudich, Y., Simpson, D., Claeys, M., Dommen, J., Donahue, N. M., George, C., Goldstein, A. H., Hamilton, J. F., Herrmann, H., Hoffmann, T., Iinuma, Y., Jang, M., Jenkin, M. E., Jimenez, J. L., Kiendler-Scharr, A., Maenhaut, W., McFiggans, G., Mentel, Th. F., Monod, A., Prévôt, A. S. H., Seinfeld, J. H., Surratt, J. D., Szmigielski, R., and Wildt, J.: The formation, properties and impact of secondary organic aerosol: current and emerging issues, Atmos. Chem. Phys., 9, 5155–5236, https://doi.org/10.5194/acp-9-5155-2009, 2009.
Hayes, P. L., Ortega, A. M., Cubison, M. J., Froyd, K. D., Zhao, Y., Cliff, S. S., Hu, W. W., Toohey, D. W., Flynn, J. H., Lefer, B. L., Grossberg, N., Alvarez, S., Rappenglück, B., Taylor, J. W., Allan, J. D., Holloway, J. S., Gilman, J. B., Kuster, W. C., De Gouw, J. A., Massoli, P., Zhang, X., Liu, J., Weber, R. J., Corrigan, A. L., Russell, L. M., Isaacman, G., Worton, D. R., Kreisberg, N. M., Goldstein, A. H., Thalman, R., Waxman, E. M., Volkamer, R., Lin, Y. H., Surratt, J. D., Kleindienst, T. E., Offenberg, J. H., Dusanter, S., Griffith, S., Stevens, P. S., Brioude, J., Angevine, W. M., and Jimenez, J. L.: Organic aerosol composition and sources in Pasadena, California, during the 2010 CalNex campaign, J. Geophys. Res.-Atmos., 118, 9233–9257, https://doi.org/10.1002/jgrd.50530, 2013.
Heald, C. L., Kroll, J. H., Jimenez, J. L., Docherty, K. S., Decarlo, P. F., Aiken, A. C., Chen, Q., Martin, S. T., Farmer, D. K., and Artaxo, P.: A simplified description of the evolution of organic aerosol composition in the atmosphere, Geophys. Res. Lett., 37, L08803, https://doi.org/10.1029/2010GL042737, 2010.
Huang, X.-F., He, L.-Y., Hu, M., Canagaratna, M. R., Sun, Y., Zhang, Q., Zhu, T., Xue, L., Zeng, L.-W., Liu, X.-G., Zhang, Y.-H., Jayne, J. T., Ng, N. L., and Worsnop, D. R.: Highly time-resolved chemical characterization of atmospheric submicron particles during 2008 Beijing Olympic Games using an Aerodyne High-Resolution Aerosol Mass Spectrometer, Atmos. Chem. Phys., 10, 8933–8945, https://doi.org/10.5194/acp-10-8933-2010, 2010.
Isaacman-VanWertz, G., Lu, X., Weiner, E., Smiley, E. B., and Widdowson, M. A.: Characterization of hydrocarbon groups in complex mixtures using gas chromatography with unit-mass resolution electron ionization mass spectrometry, Anal. Chem., 92, 12481–12488, https://doi.org/10.1021/acs.analchem.0c02308, 2020.
Jaoui, M., Kleindienst, T. E., Lewandowski, M., and Edney, E. O.: Identification and quantification of aerosol polar oxygenated compounds bearing carboxylic or hydroxyl groups. 1. Method development, Anal. Chem., 76, 4765–4778, https://doi.org/10.1021/ac049919h, 2004.
Jaoui, M., Kleindienst, T. E., Lewandowski, M., Offenberg, J. H., and Edney, E. O.: Identification and quantification of aerosol polar oxygenated compounds bearing carboxylic or hydroxyl groups. 2. Organic tracer compounds from monoterpenes, Environ. Sci. Technol., 39, 5661–5673, https://doi.org/10.1021/es048111b, 2005.
Kaltsonoudis, C., Kostenidou, E., Louvaris, E., Psichoudaki, M., Tsiligiannis, E., Florou, K., Liangou, A., and Pandis, S. N.: Characterization of fresh and aged organic aerosol emissions from meat charbroiling, Atmos. Chem. Phys., 17, 7143–7155, https://doi.org/10.5194/acp-17-7143-2017, 2017.
Katragadda, H. R., Fullana, A., Sidhu, S., and Carbonell-Barrachina, Á. A.: Emissions of volatile aldehydes from heated cooking oils, Food Chem., 120, 59–65, https://doi.org/10.1016/j.foodchem.2009.09.070, 2010.
Klein, F., Farren, N. J., Bozzetti, C., Daellenbach, K. R., Kilic, D., Kumar, N. K., Pieber, S. M., Slowik, J. G., Tuthill, R. N., Hamilton, J. F., Baltensperger, U., Prévôt, A. S. H., and El Haddad, I.: Indoor terpene emissions from cooking with herbs and pepper and their secondary organic aerosol production potential, Sci. Rep.-UK, 6, 1–7, https://doi.org/10.1038/srep36623, 2016a.
Klein, F., Platt, S. M., Farren, N. J., Detournay, A., Bruns, E. A., Bozzetti, C., Daellenbach, K. R., Kilic, D., Kumar, N. K., Pieber, S. M., Slowik, J. G., Temime-Roussel, B., Marchand, N., Hamilton, J. F., Baltensperger, U., Prévôt, A. S. H., and El Haddad, I.: Characterization of Gas-Phase Organics Using Proton Transfer Reaction Time-of-Flight Mass Spectrometry: Cooking Emissions, Environ. Sci. Technol., 50, 1243–1250, https://doi.org/10.1021/acs.est.5b04618, 2016b.
Klein, F., Baltensperger, U., Prévôt, A. S. H., and El Haddad, I.: Quantification of the impact of cooking processes on indoor concentrations of volatile organic species and primary and secondary organic aerosols, Indoor Air, 29, 926–942, https://doi.org/10.1111/ina.12597, 2019.
Kostenidou, E., Florou, K., Kaltsonoudis, C., Tsiflikiotou, M., Vratolis, S., Eleftheriadis, K., and Pandis, S. N.: Sources and chemical characterization of organic aerosol during the summer in the eastern Mediterranean, Atmos. Chem. Phys., 15, 11355–11371, https://doi.org/10.5194/acp-15-11355-2015, 2015.
Kroll, J. H., Donahue, N. M., Jimenez, J. L., Kessler, S. H., Canagaratna, M. R., Wilson, K. R., Altieri, K. E., Mazzoleni, L. R., Wozniak, A. S., Bluhm, H., Mysak, E. R., Smith, J. D., Kolb, C. E., and Worsnop, D. R.: Carbon oxidation state as a metric for describing the chemistry of atmospheric organic aerosol, Nat. Chem., 3, 133–139, https://doi.org/10.1038/nchem.948, 2011.
Lee, B. P., Li, Y. J., Yu, J. Z., Louie, P. K. K., and Chan, C. K.: Characteristics of submicron particulate matter at the urban roadside in downtown Hong Kong – overview of 4 months of continuous high-resolution aerosol mass spectrometer measurements, J. Geophys. Res., 120, 7040–7058, https://doi.org/10.1002/2015JD023311, 2015.
Liu, T., Li, Z., Chan, M., and Chan, C. K.: Formation of secondary organic aerosols from gas-phase emissions of heated cooking oils, Atmos. Chem. Phys., 17, 7333–7344, https://doi.org/10.5194/acp-17-7333-2017, 2017a.
Liu, T., Liu, Q., Li, Z., Huo, L., Chan, M. N., Li, X., Zhou, Z., and Chan, C. K.: Emission of volatile organic compounds and production of secondary organic aerosol from stir-frying spices, Sci. Total Environ., 599–600, 1614–1621, https://doi.org/10.1016/j.scitotenv.2017.05.147, 2017b.
Liu, T., Wang, Z., Huang, D. D., Wang, X., and Chan, C. K.: Significant Production of Secondary Organic Aerosol from Emissions of Heated Cooking Oils, Environ. Sci. Technol. Lett., 5, 32–37, https://doi.org/10.1021/acs.estlett.7b00530, 2017c.
Liu, T., Wang, Z., Wang, X., and Chan, C. K.: Primary and secondary organic aerosol from heated cooking oil emissions, Atmos. Chem. Phys., 18, 11363–11374, https://doi.org/10.5194/acp-18-11363-2018, 2018.
Lopez-Hilfiker, F. D., Pospisilova, V., Huang, W., Kalberer, M., Mohr, C., Stefenelli, G., Thornton, J. A., Baltensperger, U., Prevot, A. S. H., and Slowik, J. G.: An extractive electrospray ionization time-of-flight mass spectrometer (EESI-TOF) for online measurement of atmospheric aerosol particles, Atmos. Meas. Tech., 12, 4867–4886, https://doi.org/10.5194/amt-12-4867-2019, 2019.
Mao, J., Ren, X., Brune, W. H., Olson, J. R., Crawford, J. H., Fried, A., Huey, L. G., Cohen, R. C., Heikes, B., Singh, H. B., Blake, D. R., Sachse, G. W., Diskin, G. S., Hall, S. R., and Shetter, R. E.: Airborne measurement of OH reactivity during INTEX-B, Atmos. Chem. Phys., 9, 163–173, https://doi.org/10.5194/acp-9-163-2009, 2009.
McDonald, B. C., De Gouw, J. A., Gilman, J. B., Jathar, S. H., Akherati, A., Cappa, C. D., Jimenez, J. L., Lee-Taylor, J., Hayes, P. L., McKeen, S. A., Cui, Y. Y., Kim, S. W., Gentner, D. R., Isaacman-VanWertz, G., Goldstein, A. H., Harley, R. A., and Frost, M.: Volatile chemical products emerging as largest petrochemical source of urban organic emissions, Science, 359, 760–764, https://doi.org/10.1126/science.aaq0524, 2018.
Mohr, C., Huffman, J. A., Cubison, M. J., Aiken, A. C., Docherty, K. S., Kimmel, J. R., Ulbrich, I. M., Hannigan, M., and Jimenez, J. L.: Characterization of primary organic aerosol emissions from meat cooking, trash burning, and motor vehicles with high-resolution aerosol mass spectrometry and comparison with ambient and chamber observations, Environ. Sci. Technol., 43, 2443–2449, https://doi.org/10.1021/es8011518, 2009.
Mohr, C., DeCarlo, P. F., Heringa, M. F., Chirico, R., Slowik, J. G., Richter, R., Reche, C., Alastuey, A., Querol, X., Seco, R., Peñuelas, J., Jiménez, J. L., Crippa, M., Zimmermann, R., Baltensperger, U., and Prévôt, A. S. H.: Identification and quantification of organic aerosol from cooking and other sources in Barcelona using aerosol mass spectrometer data, Atmos. Chem. Phys., 12, 1649–1665, https://doi.org/10.5194/acp-12-1649-2012, 2012.
Pankow, J. F. and Asher, W. E.: SIMPOL.1: a simple group contribution method for predicting vapor pressures and enthalpies of vaporization of multifunctional organic compounds, Atmos. Chem. Phys., 8, 2773–2796, https://doi.org/10.5194/acp-8-2773-2008, 2008.
Riipinen, I., Pierce, J. R., Donahue, N. M., and Pandis, S. N.: Equilibration time scales of organic aerosol inside thermodenuders: Evaporation kinetics versus thermodynamics, Atmos. Environ., 44, 597–607, https://doi.org/10.1016/j.atmosenv.2009.11.022, 2010.
Rothfuss, N. E. and Petters, M. D.: Influence of functional groups on the viscosity of organic aerosol, Environ. Sci. Technol., 51, 271–279, https://doi.org/10.1021/acs.est.6b04478, 2016.
Schauer, J. J., Kleeman, M. J., Cass, G. R., and Simoneit, B. R. T.: Measurement of emissions from air pollution sources. 1. C1 through C29 organic compounds from meat charbroiling, Environ. Sci. Technol., 33, 1566–1577, https://doi.org/10.1021/es980076j, 1999.
Schauer, J. J., Kleeman, M. J., Cass, G. R., and Simoneit, B. R. T.: Measurement of emissions from air pollution sources. 4. C1-C27 organic compounds from cooking with seed oils, Environ. Sci. Technol., 36, 567–575, https://doi.org/10.1021/es002053m, 2002.
Shiraiwa, M., Zuend, A., Bertram, A. K., and Seinfeld, J. H.: Gas-particle partitioning of atmospheric aerosols: Interplay of physical state, non-ideal mixing and morphology, Phys. Chem. Chem. Phys., 15(27), 11441–11453, https://doi.org/10.1039/c3cp51595h, 2013.
Sun, Y.-L., Zhang, Q., Schwab, J. J., Demerjian, K. L., Chen, W.-N., Bae, M.-S., Hung, H.-M., Hogrefe, O., Frank, B., Rattigan, O. V., and Lin, Y.-C.: Characterization of the sources and processes of organic and inorganic aerosols in New York city with a high-resolution time-of-flight aerosol mass apectrometer, Atmos. Chem. Phys., 11, 1581–1602, https://doi.org/10.5194/acp-11-1581-2011, 2011.
Takhar, M., Stroud, C. A., and Chan, A. W. H.: Volatility Distribution and Evaporation Rates of Organic Aerosol from Cooking Oils and their Evolution upon Heterogeneous Oxidation, ACS Earth Sp. Chem., 3, 1717–1728, https://doi.org/10.1021/acsearthspacechem.9b00110, 2019.
Ye, J., Gordon, C. A., and Chan, A. W. H.: Enhancement in Secondary Organic Aerosol Formation in the Presence of Preexisting Organic Particle, Environ. Sci. Technol., 50, 3572–3579, https://doi.org/10.1021/acs.est.5b05512, 2016.
Ye, J., Van Rooy, P., Adam, C. H., Jeong, C. H., Urch, B., Cocker, D. R., Evans, G. J., and Chan, A. W. H.: Predicting Secondary Organic Aerosol Enhancement in the Presence of Atmospherically Relevant Organic Particles, ACS Earth Sp. Chem., 2, 1035–1046, https://doi.org/10.1021/acsearthspacechem.8b00093, 2018.
Yu, J., Flagan, R. C., and Seinfeld, J. H.: Identification of products containing -COOH, -OH, and -C=O in atmospheric oxidation of hydrocarbons, Environ. Sci. Technol., 32, 2357–2370, https://doi.org/10.1021/es980129x, 1998.
Zhao, Y., Hennigan, C. J., May, A. A., Tkacik, D. S., De Gouw, J. A., Gilman, J. B., Kuster, W. C., Borbon, A., and Robinson, A. L.: Intermediate-volatility organic compounds: A large source of secondary organic aerosol, Environ. Sci. Technol., 48, 13743–13750, https://doi.org/10.1021/es5035188, 2014.
Zhao, Y., Nguyen, N. T., Presto, A. A., Hennigan, C. J., May, A. A., and Robinson, A. L.: Intermediate Volatility Organic Compound Emissions from On-Road Diesel Vehicles: Chemical Composition, Emission Factors, and Estimated Secondary Organic Aerosol Production, Environ. Sci. Technol., 49, 11516–11526, https://doi.org/10.1021/acs.est.5b02841, 2015.
Zuend, A. and Seinfeld, J. H.: Modeling the gas-particle partitioning of secondary organic aerosol: the importance of liquid-liquid phase separation, Atmos. Chem. Phys., 12, 3857–3882, https://doi.org/10.5194/acp-12-3857-2012, 2012.