the Creative Commons Attribution 4.0 License.
the Creative Commons Attribution 4.0 License.
 | 24 Mar 2021
Ice-nucleating particles in precipitation samples from the Texas Panhandle
Hemanth S. K. Vepuri
Cheyanne A. Rodriguez
Dimitrios G. Georgakopoulos
Dustin Hume
James Webb
Gregory D. Mayer
Ice-nucleating particles (INPs) influence the formation of ice crystals in clouds and many types of precipitation. This study reports unique properties of INPs collected from 42 precipitation samples in the Texas Panhandle region from June 2018 to July 2019. We used a cold stage instrument called the West Texas Cryogenic Refrigerator Applied to Freezing Test system to estimate INP concentrations per unit volume of air (nINP) through immersion freezing in our precipitation samples with our detection capability of > 0.006 INP L−1. A disdrometer was used for two purposes: (1) to characterize the ground-level precipitation type and (2) to measure the precipitation intensity as well as size of precipitating particles at the ground level during each precipitation event. While no clear seasonal variations of nINP values were apparent, the analysis of yearlong ground-level precipitation observation as well as INPs in the precipitation samples showed some INP variations, e.g., the highest and lowest nINP values at −25 ∘C both in the summer for hail-involved severe thunderstorm samples (3.0 to 1130 INP L−1), followed by the second lowest at the same temperature from one of our snow samples collected during the winter (3.2 INP L−1). Furthermore, we conducted bacteria community analyses using a subset of our precipitation samples to examine the presence of known biological INPs. In parallel, we also performed metagenomics characterization of the bacterial microbiome in suspended ambient dust samples collected at commercial open-lot livestock facilities (cattle feedyards hereafter) in the Texas Panhandle (i.e., the northernmost counties of Texas, also known as “West Texas”) to ascertain whether local cattle feedyards can act as a source of bioaerosol particles and/or INPs found in the precipitation samples. Some key bacterial phyla present in cattle feedyard samples appeared in precipitation samples. However, no known ice nucleation active species were detected in our samples. Overall, our results showed that cumulative nINP in our precipitation samples below −20 ∘C could be high in the samples collected while observing > 10 mm h−1 precipitation with notably large hydrometeor sizes and an implication of cattle feedyard bacteria inclusion.
- Article
(4358 KB) - Full-text XML
-
Supplement
(1984 KB) - BibTeX
- EndNote


1.1 What are INPs?
Aerosol particles play a major role in altering cloud properties, precipitation patterns, and ultimately the Earth's radiation budget (Lohmann and Feichter, 2005). In the past few decades, aerosol particle direct effects (i.e., the impact of aerosol particles on net radiation through scattering and absorption of solar radiation) have been extensively studied (Satheesh and Krishna Moorthy, 2005). For example, the global radiative forcing by sea salt aerosols and dust is known to be in the range of −0.5 to −2 W m−2 and −2 to +0.5 W m−2, respectively. However, aerosol particle indirect effects (i.e., radiative impact due to formation of clouds) have been enigmatic. Some atmospheric aerosol particles are known to act as ice-nucleating particles (INPs) and catalyze the formation of ice crystals in the clouds, but their overall impact on the Earth's radiative budget remains quantitatively uncertain (Lohmann et al., 2007).
While INPs are sparse in the atmosphere, they have substantial impacts on cloud microphysics and precipitation formation (DeMott et al., 2010). The sources of atmospheric INPs are diverse as they emerge naturally and also through human activities, adding complexities to our comprehensive understanding in their impacts (e.g., Kanji et al., 2017; Zhao et al., 2019).
In general, INPs provide a surface on which water vapor and/or cloud droplets deposit and freeze (Van den Heever et al., 2006). This type of ice formation in the presence of INPs is known as heterogeneous freezing (Vali et al., 2015). In the absence of INPs, the formation of atmospheric ice particles follows the process of homogeneous nucleation, in which it requires cloud droplets to be supercooled to the temperature (T) of −32 ∘C and below (depending on the pure water droplet size) to form ice crystals (Koop et al., 2000; Koop and Murray, 2016).
Although our knowledge regarding INPs remains insufficient, there have been advances in understanding the different modes of heterogeneous ice nucleation (IN) in the atmosphere in the last few decades. For example, deposition nucleation is induced by the direct deposition of water vapor onto an INP's surface and ice embryo formation on the surface under ice supersaturation conditions (Kanji and Abbatt, 2006; Möhler et al., 2008). Recently, some studies have argued that deposition nucleation could be interpreted as pore condensation and freezing (Marcolli, 2014). The presence of water in pores of mineral materials and the resulting inverse Kelvin effect cause an instantaneous water saturation condition in the confined space, allowing the water to freeze even at water sub-saturated ambient conditions (David et al., 2019; Marcolli, 2014).
Amongst various IN paths, perhaps the most important mode is immersion freezing (De Boer et al., 2010). This process starts with the formation of cloud droplet followed by freezing due to an INP immersed in the supercooled droplet. In addition, past studies have identified other modes of heterogeneous nucleation, such as condensation freezing (Belosi and Santachiara, 2019), contact freezing (Hoffmann et al., 2013), and inside-out evaporation freezing (Durant and Shaw, 2005). These modes are relatively less relevant in mixed-phase clouds (MPCs) as discussed in the next section.
1.2 Importance of immersion freezing
INPs greatly influence cloud properties, especially in MPCs, which are typically observed in the altitude range of 2 to 9 (above ground level; Hartmann et al., 1992). Out of all heterogeneous IN modes, immersion freezing is the most dominant mode of ice formation in MPCs (De Boer et al., 2010; Westbrook and Illingworth, 2011; Hande and Hoose, 2017; Vergara-Temprado et al., 2018). In Hande and Hoose (2017), different cloud types such as orographic, stratiform, and deep-convective systems were simulated and analyzed for different freezing modes under various polluted conditions. The authors demonstrate that immersion freezing is the predominant IN mode under various simulated circumstances, accounting for 85 % to 99 %, while other IN paths play a less significant role. Similarly, an importance and predominance of supercooled liquid droplets as for a prerequisite of atmospheric ice formation is reported in Westbrook and Illingworth (2011). The authors verified it based on radar and lidar observations of clouds over the UK at temperatures relevant to immersion freezing. Cui et al. (2006) also showed that immersion freezing is the primary mode of ice formation with little significance of the deposition mode in the early stages of the cloud development. Moreover, whereas contact freezing may be a highly efficient ice formation path, a previous simulation study showed that it is a negligible mode in the given MPC conditions (Phillips et al., 2007). Field et al. (2012) and De Boer et al. (2011) showed that the formation of cloud droplets is a precondition for ice formation in MPCs, thus highlighting the importance of immersion nucleation. Due to the importance and dominance of immersion freezing, the current study focuses on measuring the immersion freezing efficiency of the precipitation samples collected in the Texas Panhandle region.
1.3 INPs in precipitation
It is known that INPs in MPCs have a notable impact on the properties of precipitation. Previously, Yang et al. (2019) studied the effect of INPs on cloud dynamics and precipitation through model simulations of an observed severe storm in northern China. The authors show that an increase in INPs can enhance the storm, whereas an excessive increase of INPs may impede the updrafts in the storm. The reason for this complex effect of INPs may be explained by the variation in the latent heat release in the convective system at different stages of its development. When immersion freezing occurs, the latent heat of freezing energy can be released. Thus, INPs themselves can impact the dynamics of the precipitation system. Furthermore, the increase in INP number might reduce the mean hail diameter (hail particles with smaller diameters melt more easily), which leads to decreased hail precipitation and an increased rain formation in contrast to the previous studies (Fan et al., 2017; Van den Heever et al., 2006). Similar results have been found by Chen et al. (2019). The authors show that an increased ambient INP concentration (nINP) in the simulated hailstorm can reduce the graupel size and the concentration of hail stones. Likewise, the aircraft observations along with the model simulations of convective storms in the Texas Panhandle and US High Plains have shown that the addition of INPs at the base of warm clouds results in stronger updrafts and leads to increased amounts of precipitation (Rosenfeld et al., 2008), ultimately affecting the local hydrological cycle (Mülmenstädt et al., 2015). It has also been observed that INPs can be removed from the atmosphere through precipitation resulting in a net decrease in nINP, affecting precipitation development (Stopelli et al., 2015).
Several previous studies have characterized nINP in precipitation samples from various locations (Creamean et al., 2019; Petters and Wright, 2015; Levin et al., 2019). Petters and Wright (2015) reported a wide range of nINP values in their local precipitation samples collected approximately 3 km west of Raleigh, NC, USA, for July 2012 and October 2013. Their study shows a variation of 10 orders of magnitude in the concentrations of INPs with a high variability in the temperature range of −5 to −12 ∘C, suggesting inclusion of biological INPs, which are generally known to be active at relatively high freezing temperatures (Després et al., 2012). The lower limit for the INP spectrum as a function of temperature derived from the cloud water and precipitation samples in Petters and Wright (2015) may highlight the extreme rarity of INPs at temperatures warmer than −10 ∘C. Particularly, the authors showed that the highest ever observed nINP values at −8 ∘C were 3 orders of magnitude lower than observed ice crystal concentrations in tropical cumuli at the same temperature. More precipitation studies may provide a constraint on minimum enhancement factors for secondary ice formation processes. In Levin et al. (2019), the nINP values during an atmospheric river event on the west coast of the United States were studied. The authors found an increased concentration of marine INPs in contrast to their previous studies, showing high mineral/soil dust during an atmospheric river precipitation.
1.4 Study motivation and objectives
In this study, we characterized properties of INPs in precipitation samples collected in the Texas Panhandle region to understand whether the high density of cattle in large open-lot concentrated feeding operation facilities (cattle feedyards hereafter), where often > 45 000 head capacity can be seen in a single facility in this region, has a discernible impact on regional atmospheric INP concentration and composition near the ground and in clouds. This region significantly contributes to the US cattle production, and the total cattle population of 11 million head accounts for 42 % of cattle in the US (according to cattle feedyard research experts at Texas A&M AgriLife Research). Adjacent cattle feedyards are located within 33 mi (53 km) of our sampling site, and the impact of cattle feedyard dust in ambient particulate matter (PM), frequently exceeding 1200 µg m−3 (24 h averaged-basis), and aerosol particle composition as well as an overall regional air quality is described in Hiranuma et al. (2011) and Von Essen and Auvermann (2005). Moreover, the emission flux of PM smaller than < 10 µm diameter (PM10) is typically high in the range of 4.5 up to 23.5 depending on stocking density, creating PM-laden ambient conditions in this particular region (Bush et al., 2014).
All of our precipitation samples were analyzed at our laboratory using a cold stage instrument. The estimated nINP in the precipitation samples were compared with ground-level precipitation properties, such as the precipitation type, intensity of precipitation (mm h−1), and hydrometeor particle size (mm). A subset of the collected precipitation samples was analyzed for taxonomic identification to characterize potential biological INP sources in the Texas Panhandle region and also to determine the presence of known high-temperature biological INPs. Some of the water-suspended cattle feedyard PM samples were also analyzed with metagenomics to determine the composition of bacterial microbiome that may appear in precipitations. Although the estimation of nINP in precipitation samples collected at the ground level does not represent INPs at cloud height, we report the INPs resolved by ground-level weather observation that help with understanding of ambient INPs in the Texas Panhandle region, where unique and substantial INPs, ranging from several hundred to several thousand INPs L−1 at −20 and −25 ∘C, respectively, are consistently emitted from open-lot livestock operations (Hiranuma et al., 2020).
2.1 Precipitation sampling
Our precipitation samples were collected from different seasons throughout the year during June 2018–July 2019. Sterilized polypropylene tubes of 50 mL volume (VWR® Centrifuge Tube) were used as sampling gauges. The gauges were placed at ∼ 50 ft (∼15 m) above the ground on the rooftop of the Natural Science Building at West Texas A&M University, Canyon, TX. This particular location was chosen to avoid any obstruction of our sampling activities. The sampling tubes were exposed to the ambient air without any canopies throughout the sampling process. The sampling gauges were replaced every 24 h to minimize the effect of dry deposition prior to the precipitation sample collection.
A blank dry deposition sample (sample no. 34) was collected for 24 h from 2–3 January 2019 in order to examine and quantify the effect of dry deposition on nINP. The freezing spectrum of this dry deposition sample (suspended in high-performance liquid chromatography (HPLC)-grade pure water) was later compared with the IN spectra of precipitation samples (see Sect. 3.3). We note that a volume of pure water (5 mL) for an atmospheric INP estimate based on a dry deposition sample was determined by averaging collected precipitation volumes of all samples prior to this dry deposition sample.
For the duration of a given precipitation episode, some amount of sample was accumulated in the tube. The sampling tubes were then capped and stored at temperature of 4 ∘C in the refrigerator, following the method described in Petters and Wright (2015), until the droplet-freezing assay experiments were commenced. The effect of storage conditions on the IN activity was not considered in this study. We note that Beall et al. (2020) recently found a decrease in precipitation nINP by 42 % when stored at 4 ∘C (i.e., Table 5) and suggested correction factors for the temperature range of −7 to −17 ∘C. After the freezing experiment, a subset of our samples was kept under deep-freeze conditions (−80 ∘C) for further biological analysis (see Sect. 2.6).
In total, 42 precipitation samples were collected from different weather systems observed at the surface level. Based on these samples and observations, we estimated the nINP values from (1) snow, (2) hail/thunderstorm, (3) long-lasted rain, and (4) weak rain. More information about the samples used in this study, precipitation types and the amount of the precipitation collected for each sample are provided in Sect. S1 in the Supplement.
2.2 Disdrometer measurements of precipitation properties
For our precipitation measurements, we used an OTT Parsivel2 (Particle Size Velocity 2) sensor. This device is a modern laser-optical disdrometer (λ = 780 nm), which measures the size and fall velocity of precipitating particles. The OTT Parsivel2 was deployed side-by-side with the precipitation gauge collector for the duration of our study period. A detailed technical description of OTT Parsivel2 is given in a previous study (Tokay et al., 2014), so only a brief description is provided here. A combination of the laser transmitter and receiver component was integrated as a single cluster in a weatherproof housing to detect precipitation particles passing through a horizontal strip of light. A nominal cross section area of a laser beam detection was 54 cm2, and the system recorded the number of hydrometeors in a 32 × 32 matrix (i.e., fall velocity × diameter) in the ≥ 30 s time resolution. The measurable size range of hydrometeor particles was 0.062–24.5 mm in diameter (Dp) with bin size intervals (ΔDp) varying from 0.125 to 3.0 mm. Our disdrometer was coupled with an OTT netDL Hydrosystem logger (40 channels). The OTT Parsivel2 also measured the intensity of precipitation (mm h−1) and the number of precipitation particles passing through the horizontal strip of light in the event of precipitation. The OTT Parsivel2 automatically categorized the precipitation type according to the National Weather Service (NWS) weather code based on the measured precipitation properties. Due to the intermittent nature of the precipitation, the OTT Parsivel2 assigned multiple NWS precipitation codes during a single precipitation event (Table S1 in the Supplement, column “NWS Code”). We compared our manual observations with the NWS precipitation code assigned by the disdrometer, and we categorized all observed precipitation into four different types. These four major precipitation types defined in this study included snow, hail/thunderstorm, long-lasted rain, and weak rain, and we collected 6, 18, 13, and 5 samples from each type, respectively, which sum to a total of 42 samples. More detailed methodology of precipitation categorization is discussed in Sect. S1.1.
2.3 IoT air quality sensor measurements
A cluster of Arduino-based Internet of Things (IoT) air quality sensors was developed to measure ambient air conditions at our precipitation sampling location. This IoT cluster was deployed alongside the disdrometer and sampling gauge to complement this study. A DFRobot PM laser dust sensor measured PM with size ranges of < 1 µm (PM1.0), < 2.5 µm (PM2.5), and PM10 with an estimated uncertainty of ± 27 % relative to an optical particle counter (Markowicz and Chiliński, 2020). Other ambient conditions, including temperature, barometric pressure, and humidity, were measured with a precision Bosch BME280 environmental sensor. We calibrated our sensors against a commercially available sensor (GlobalSat Inc., LS-113). Our sensors utilized Long Range Wide Area Network (LoRaWAN) technology for data transmission. A LoRaWAN transceiver is connected to our sensors for wireless data transmission. This small IoT device operated with 915 MHz signal frequency, transmitting encrypted and signed packets of captured air quality data through a hosted LoRa network server to a Kibana visualization server. This data interface enabled in situ monitoring and processing of the data. The PM concentrations were later time-averaged for assessing contribution of wet scavenging of aerosol particles to nINP in the precipitation samples.
2.4 Immersion freezing experiment
All immersion freezing experiments in this study were conducted using an offline instrument called West Texas Cryogenic Refrigerator Applied to Freezing Test (WT-CRAFT) system (Hiranuma et al., 2019; Cory, 2019). The WT-CRAFT system is a cold stage technique, in which the droplets are placed on an aluminum plate and cooled until they are frozen. A commercially available digital camera was used to record the droplet freezing events, and we visually evaluated the freezing temperatures based on the shift in droplet brightness while freezing. If there was an uncertainty in determining the temperature at which a droplet was completely frozen, we used the ImageJ software for further image analysis of those droplets (see Table S4 in Hiranuma et al., 2019). This system was used to obtain temperature-resolved nINP in −25 ∘C < T < 0 ∘C. The lower temperature limit was −25 ∘C to ensure measuring INPs with negligible artifacts. Our system is susceptible to low INP detection, and the minimum INP detection limit of the WT-CRAFT system for this study was 0.006 L−1 air. To minimize any contamination during the IN measurement, the WT-CRAFT system was placed in a ventilated fume hood.
For each experiment, an aluminum plate surface was freshly coated with a thin layer of thermally conductive and IN-inert Vaseline to physically isolate individual droplets from the aluminum surface (otherwise, aluminum can act as a heterogeneous IN surface). A total of 70 suspension droplets of 3 µL volume each were prepared for each run. The aluminum plate with the droplets on it was then placed inside a portable cryogenic refrigerator (Cryo-Porter). Freezing temperatures were measured by the sensor taped on the aluminum surface with a resolution of 0.1 ∘C, and the external keypad controller was used to control cooling rate (). In this study, the freezing experiments were carried out at a cooling rate of 1 . The validity of using this cooling rate and another test regarding time trial aspect are demonstrated in Sect. S2 (Figs. S1 and S2 in the Supplement). The droplets were cooled until all 70 droplets were frozen before warming up the system to 5 ∘C to be prepared for a subsequent experiment.
If all the droplets were frozen at T > −25 ∘C, a HPLC-grade ultrapure water was used to prepare different serial dilutions for the precipitation samples. The diluted suspensions were made to compute the nINP down to −25 ∘C. Some of our precipitation samples were diluted until the frozen fraction (the ratio of number of droplets frozen to the total number of droplets) curve was conformed to the background curve (i.e., frozen fraction curve for the HPLC ultrapure water). At the end of each WT-CRAFT experiment, the frozen fraction and ambient nINP were estimated as a function of temperature with an interval of 0.5 ∘C. The IN measurements from the undiluted and diluted runs were merged by taking lower nINP values, which typically possess lower uncertainties, for the overlapped temperature region.
The total systematic temperature and nINP uncertainties in WT-CRAFT are ± 0.5 ∘C and ± 23.5 % (Hiranuma et al., 2019). For this study, the experimental uncertainty in our estimated nINP was evaluated and reported using the 95 % confidence interval method described in Schiebel (2017). Background contamination tests for WT-CRAFT were carried out weekly to make sure negligible background freezing at −25 ∘C. In this study, we consider the frozen fraction ≤ 0.05, accounting for less than 3 % of pure water activation, as negligible background. For these background tests, only HPLC grade ultrapure water was used for preparing the droplets.
2.5 Precipitation nINP(T) estimation
Here we describe the estimation of INP concentration in cloud volume from INP concentration measured in precipitation samples. Initially, we computed the CINP(T) value, which is the nucleus concentration in precipitation suspension (L−1 water) at a given temperature as described in Vali (1971). This CINP(T) value was calculated as
in which, funfrozen(T) is a unfrozen fraction of examined droplets at given temperature, and Vd is the volume of the droplet (3 µL).
Next, we used the cloud water content (CWC) parameter in order to convert CINP(T) to nINP(T) at standard temperature and pressure conditions. We assumed CWC to be a constant of 0.4 g m−3, following Petters and Wright (2015). This assumption would be reasonable for the following three reasons: (1) Petters and Wright (2015) and references therein showed typical values of CWC for different cloud types could narrowly range within a factor of 2 from 0.4 g m−3; (2) the authors also showed that the variation of nINP with CWC values for different cloud types in the atmosphere would typically be limited within a factor of 2, and our nINP uncertainties could be larger than that; and (3) based on a parametrization for rainwater evaporation, Zhang et al. (2006) suggests that evaporation does not contribute to nINP bias for both strong convective systems and persistent rain events with cloud base heights of ≈ 3 km. Thus, a constant CWC was used in this study.
The sample air volume (Vair) at the cloud level was calculated by converting the volume of the precipitation sample collected (Vl) using the Eq. (2) from Petters and Wright (2015):
where ρw is a unit density of water (1 g mL−1). Vair is in liters (L), whereas Vl is given in milliliters (mL). The multiplication factor “1000” is used to convert the volume to liter of air. The cumulative nINP per unit volume of air, described in the previous study DeMott et al. (2017), was then estimated as
where DF is a serial dilution factor (e.g., DF = 1, 10, or 100 and so on).
2.6 Microbiome of cattle feedyard dust and precipitation samples
The overall goal of our metagenomics analysis was to identify known IN-active bacterial species in cattle feedyard dust, collected in commercial cattle feedyards located within 33 mi (53 m) from the precipitation sampling site and suspended in the HPLC-grade water (Hiranuma et al., 2020), and precipitation samples collected in the Texas Panhandle region. This biological analysis is also useful to examine if local cattle feedyards can act as a source of bioaerosol particles and/or INPs found in the precipitation samples. In this study, we have examined a heterogeneous set of samples including four airborne PM samples locally collected at the downwind location of typical commercial cattle feedyards the Texas Panhandle on 28 March 2019 and 22, 23, and 24 July 2018 (see Hiranuma et al., 2020), precipitation samples (sample nos. 1, 2, 7, and 50), and a 24 h dry deposition sample (sample no. 34). We note that the precipitation sample no. 50 (another hail/thunderstorm sample), which was collected on 23 March 2019 when a tornado warning was issued, was preserved only for metagenomics due to its low volume (≈ 1 mL). It is also noteworthy that we attempted to analyze samples of all precipitation types but acquired quantitative results only for those hail/thunderstorm samples (the reason is unknown).
Next, we describe our microbiome analysis procedure in four different steps, including (1) DNA extraction, (2) 16S rRNA amplicon diversity sequencing, (3) bioinformatics, and (4) data analysis. For DNA extraction, genomic DNA was first extracted from all samples using PowerSoil DNA Isolation Kit (MoBio Laboratories, Inc., Carlsbad, CA, USA). Extraction proceeded following the manufacturer's protocol, with the following minor changes: solutions C1 and C6 were heated to 65 ∘C, and solution C6 was allowed to remain on the filter membrane for at least 1 min before centrifugation. Additionally, the C6 step was repeated. Library preparation for bacterial 16S DNA amplicon sequencing utilized primers for the V1–V3 hypervariable region of the 16S gene. These primers were constructed for the 16S amplicon using a combination of the 28F and Illumina i5 sequencing primers and the Illumina i7 sequencing primer with the 519R primer. Amplifications were performed in 25 µL reactions with Qiagen HotStarTaq master mix (Qiagen Inc., Valencia, CA, USA). Reactions were performed with 1 µL of each 5 µM primer mix and the template DNA. Amplification was performed on an ABI Veriti thermocycler (Applied Biosystems, Carlsbad, CA, USA) under the following thermal profile: 95 ∘C for 5 min, then 25 cycles of 94 ∘C for 30 s, 54 ∘C for 40 s, 72 ∘C for 1 min, followed by one cycle of 72 ∘C for 10 min and a 4 ∘C hold. An ethidium bromide-stained gel was used to qualitatively determine the amount of the amplification product to add to the second amplification stage. Primers for the second PCR were designed based on the Illumina Nextera PCR primers. The second stage amplification proceeded using the same cycling protocol as the first round, except it was amplified for only 10 cycles. SPRIselect beads (BeckmanCoulter, Indianapolis, IN, USA) were used at a 0.7 ratio to size-select the DNA amplicons from an equimolar pooled sample. Pooled samples were then quantified using a Quibit 2.0 fluorometer (Life Technologies) and loaded on an Illumina MiSeq (Illumina, Inc. San Diego, CA, USA) 2 × 300 flow cell at 10 pM.
For bioinformatics, raw data were initially processed using a standard microbial diversity analysis pipeline (QIIME2-2020). Raw data were first checked for sequencing quality and chimeric sequences, before being parsed through a microbial diversity pipeline. During the cleanup stage, denoising of the raw data was performed using various techniques to remove short sequences, singleton sequences, and reads with poor-quality scores. Next, chimera detection software was used to filter out any potentially chimeric sequences. Finally, remaining high-quality sequences were corrected base by base to check for sequencer miscalls. The diversity analysis pipeline clustered all sequences based on 97 % similarity to yield operational taxonomic units (OTUs), before running a seed sequence from each OTU through a taxonomic database curated in-house by RTLGenomics. Finally, the taxonomy was assigned to each sequence using a classifier that was pretrained on the GreenGenes database with 99 % OTUs. The relative abundance of bacterial taxa within each sediment sample was determined by dividing each OTU by the total number of reads.

Figure 1Time series of disdrometer and IoT sensor measurements for (a) average temperature ± SD (standard deviation); (b) average relative humidity ± SD; (c) cumulative number of detected hydrometeors in each precipitation event; and (d) maximum, average, and minimum precipitation intensity. Each data point corresponds to the sampling start time for each precipitation event.
3.1 Ambient and precipitation properties
The time series summary of ambient and precipitation properties measured by our disdrometer as well as IoT cluster is shown in Fig. 1. Each data point in Fig. 1a shows the average temperature measured over the sampling period of a given precipitation event. A notable seasonal variation of ambient temperature at our sampling location was observed. The highest average temperature measured during a precipitation event was 34.9 ± 12.2 ∘C, which was in the summer of 2018 (i.e., ID no. 7; a long-lasted rain sample), while the lowest temperature was −6.5 ± 6.7 ∘C, measured during the winter of 2018 (i.e., ID no. 23; a snow sample). The annual mean temperature for the Canyon, TX, region measured at our sampling site was 17.7 ∘C. The diurnal cycles of ambient properties are not shown in Fig. 1a. Nevertheless, we typically observed suppression of temperature before precipitation events in our study. It is known that the temperature gradient plays a major role in the development and growth of the precipitation systems (Vaid and Liang, 2015).
Next, each relative humidity data point shown in Fig. 1b corresponds to the average during each precipitation event. With an overall average of 54.0 %, the highest and lowest relative humidity values measured were 70.7 ± 2.3 % (ID no. 26; a weak rain sample) and 30.8 ± 0.7 % (ID no. 7; a long-lasted rain sample). The observed low ground-level relative humidity values during some precipitation events (Tables S1 and S2) may be a concern as loss of water through partial evaporation of hydrometeors during free fall. But, it is noteworthy that the water evaporation might have a negligible effect on nINP estimated from precipitation samples as discussed in Sect. 2.5.
Figure 1c displays the time series of the cumulative number of detected precipitation particles in individual precipitation events and the overall mean number of detected particles (dashed line). In our study period, a disdrometer detected a substantial number of precipitation particles with a cumulative number ranging from 1.0 × 10⁴ to 6.6 × 10⁵ particles passing through its laser beam cross section per event. More details of each precipitation event and its properties are shown in the Tables S1–S3. As seen in Table S3, high numbers of precipitation particles were observed in conjunction with snow/hail-involved precipitation events during our study period, which may increase the wet scavenging efficiency of ambient aerosol particles during precipitation (see Sects. 3.2 and S4). Out of all the 42 samples, the highest number of precipitation particles was detected on the 5 November 2018 (ID no. 19; a snow sample), while the lowest was observed on the 2 September 2018 (ID no. 13; weak rain).
Figure 1d shows the average, maximum, and minimum precipitation intensity (mm h−1) measured during each precipitation event. Due to the intermittent nature of the precipitation, the intensity widely ranged from 1.1 to 129.3 mm h−1 per event. The highest maximum intensity of 129.3 mm h−1 was measured during a hail/thunderstorm event (ID no. 40), while the lowest was 1.1 mm h−1 during a snow event (ID no. 23). These intensity data were used for our wet deposition analysis (Sect. S4).

Figure 2Size distribution of precipitation particles detected in (a) snow, (b) hail/thunderstorm, (c) long-lasted rain, and (d) weak rain samples. A subset of distributions shows varying uncertainty in diameter (mm). The x-axis error bars are ± 1.0 mm of size class for diameter < 2 mm and ± 0.5 mm of size class for diameter > 2 mm. The y-axis error bars represent standard errors at each diameter. The subtotal number of precipitation samples in each category is shown by the value of “n”.
The variation of precipitation properties was further investigated by analyzing the size distribution of precipitation particles measured by the OTT Parsivel2 disdrometer. Figure 2 shows the precipitation particle size distribution for each category of ground-level-observed precipitation type. The size of precipitation particles was represented at the median diameter of the corresponding disdrometer's size bin. As shown in Fig. 2a and b, both snow and hail/thunderstorm samples had particles of diameter greater than 10 mm with the maximum particle diameter of 17 mm. Although there are three episodes of long-lasted rain with a particle diameter greater than 14 mm (Fig. 2c), a clear trend of overall decrease in the hydrometeor size was seen for this category as well as the weak rain samples (Fig. 2d). In fact, all weak rain samples contained particles only smaller than 6.5 mm. Moreover, the mode precipitation particle diameter for the snow, hail/thunderstorm, and long-lasted rain samples was 0.44 mm, whereas it was 0.31 mm for the weak rain samples (see Table S3). This variation in mode diameter along with the results shown in Fig. 2 generally exhibited the shift in hydrometeor particle size distribution towards a larger diameter with an increased intensity of precipitation at the ground level.
Table 1Adjacent hourly averaged PM values (with one decimal point) before and after each precipitation event. We excluded 14 data points where PM data were not recorded due to technical issues (ID nos. 6–7, 17, 20, 22–24, 26, 28–33).
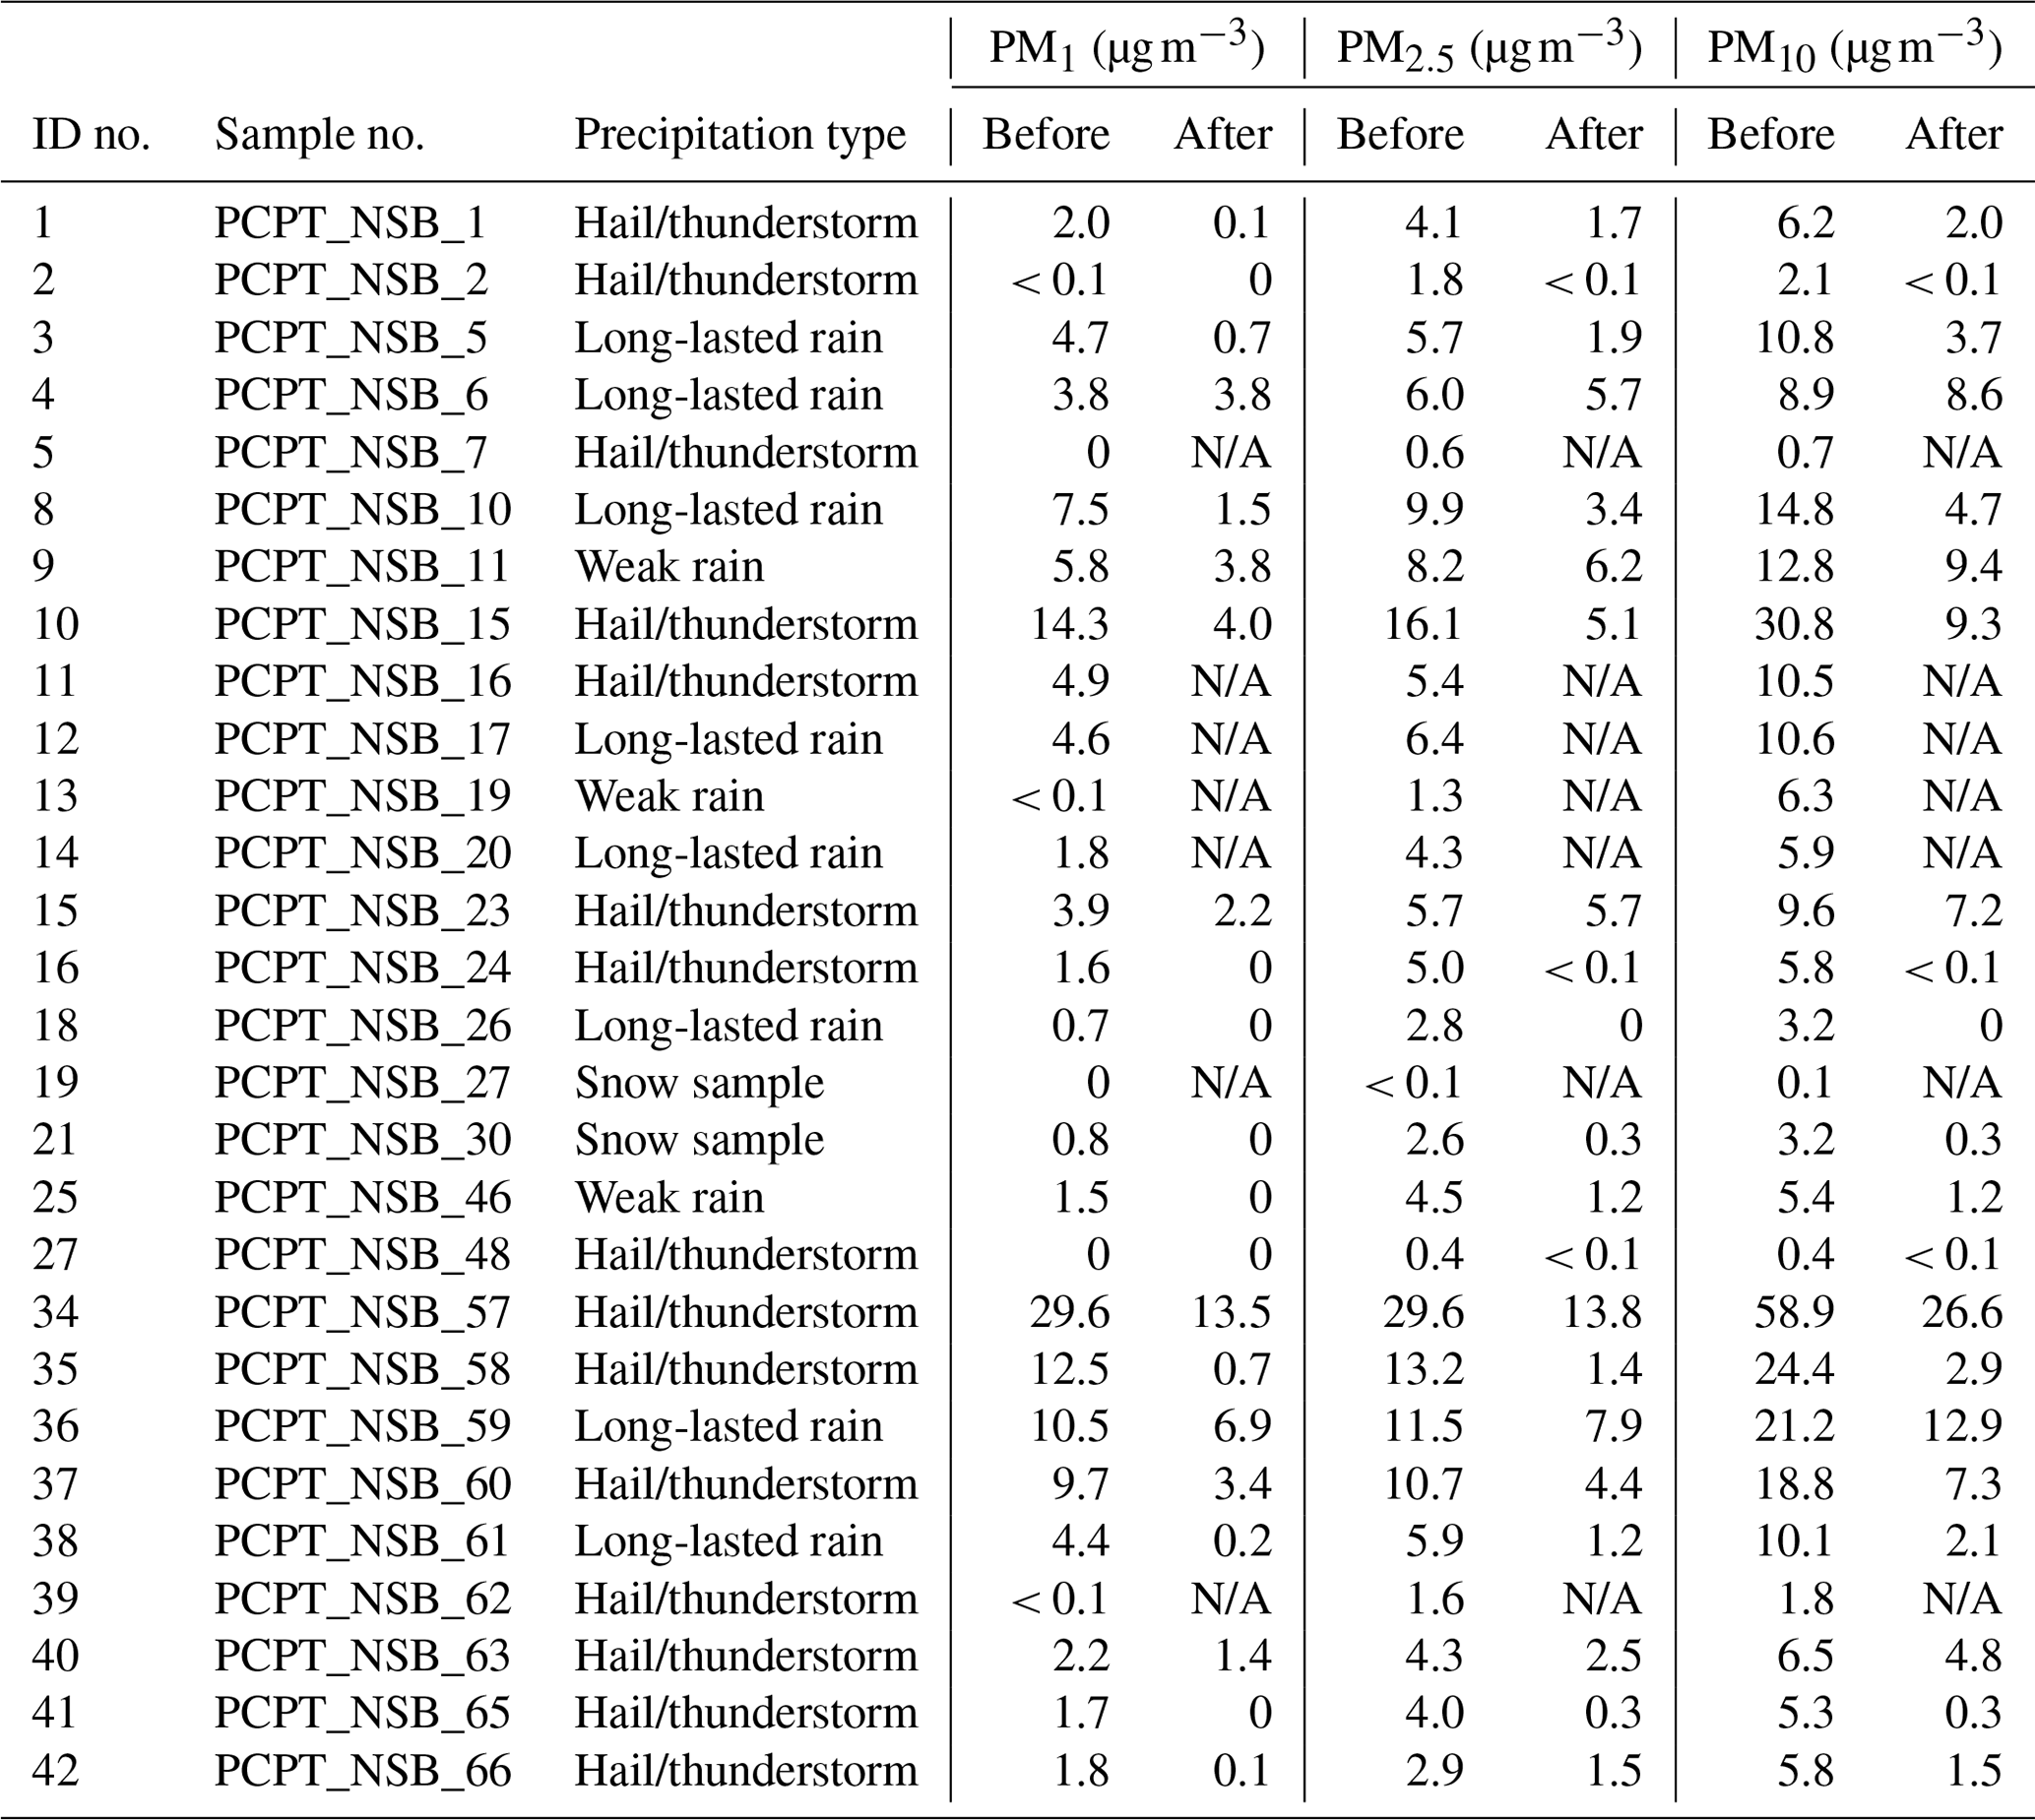
N/A: below detection sensor failure return values (i.e., detection limit of our PM sensor).
3.2 IoT air quality sensor results and implication of wet deposition
The overall mean PM concentrations (± standard error) measured by an IoT air quality sensor for our study period were 3.9 ± 0.09 µg m−3 (PM1.0), 4.0 ± 0.05 µg m−3 (PM2.5), and 10.0 ± 0.22 µg m−3 (PM10). Although there was an inconsistent variation of PM concentrations with precipitation type, we observed a substantial increase in all PM values for the period July–August 2018 and May 2019. In contrast, a decrease in all PM concentrations was observed during September 2018–March 2019. This increase in PM values during summer and decrease during winter suggested a seasonal variation at the sampling site. The seasonal variation in PM values may be indicative of different aerosol particle sources or the local meteorological conditions. Besides the local PM values originating from cattle feedyards as described in Sect. 1.4, other prominent local sources include harvesting crop fields and agricultural burning in the US Great Plains region nearby the Texas Panhandle (Garcia et al., 2012; DeMott et al., 2015). Based on the long-term measurements of aerosol particle composition at the US Southern Great Plains (SGP), Parworth et al. (2015) found a seasonally varying interstate transport of biogenic aerosols to the SGP site. The authors also observed a springtime increase in biomass burning organic aerosols at SGP, which were mainly associated with local fires. The long-distance dispersion of Juniperus ashei pollen into the SGP area by the southern winds was previously observed by Van de Water et al. (2003). Elevated layers of haze have been observed over the same site due to the inter-oceanic and intercontinental transport of smoke from intense Siberian fires (Arnott et al., 2006; Damoah et al., 2004). It was also evident from previous observation and simulation modeling studies that Saharan dust can reach southeastern parts of USA through transatlantic long-range transport (Weinzierl et al., 2017). Thus, PM values observed in the Texas Panhandle region may be a mixture of aerosol particles from different sources and spatial scales of transport.
Table 1 shows the hourly time-averaged PM data measured prior to vs. after precipitation. During intense precipitation, aerosol particle concentrations below cloud tend to decrease due to the wet scavenging effect (Hanlon et al., 2017). In fact, the reduction in our hourly averaged PM1, PM2.5, and PM10 after precipitation is apparent in Table 1, presumably because of scavenging in part at least. Note that any counter mechanisms, such as primary biological aerosol particles and surface material ejected by water impaction of rainfall (e.g., Huffman et al., 2013; Wang et al., 2016), were not considered in our data interpretation. The first-order calculations are performed to understand implications of scavenging processes towards the reduction in the PM after rain event (Sect. S4). These calculations contain ± 61.5 % uncertainty, which can be further extended with some assumptions to estimate INP. However, to better constrain these estimates, direct vertical INP (He et al., 2020) and scavenging measurements (Hanlon et al., 2017) are needed. A total of 28 precipitation events was analyzed, and our estimated nINP(T) of scavenged aerosol particles appeared to be constantly an order magnitude lower as compared to total nINP(T) measured in our precipitation samples (Fig. S3). This trend is true across all ranges of examined temperatures (> −25 ∘C). Nevertheless, our estimates imply some (but negligible) contributions of scavenged aerosol particles on nINP(T) in our precipitation samples.
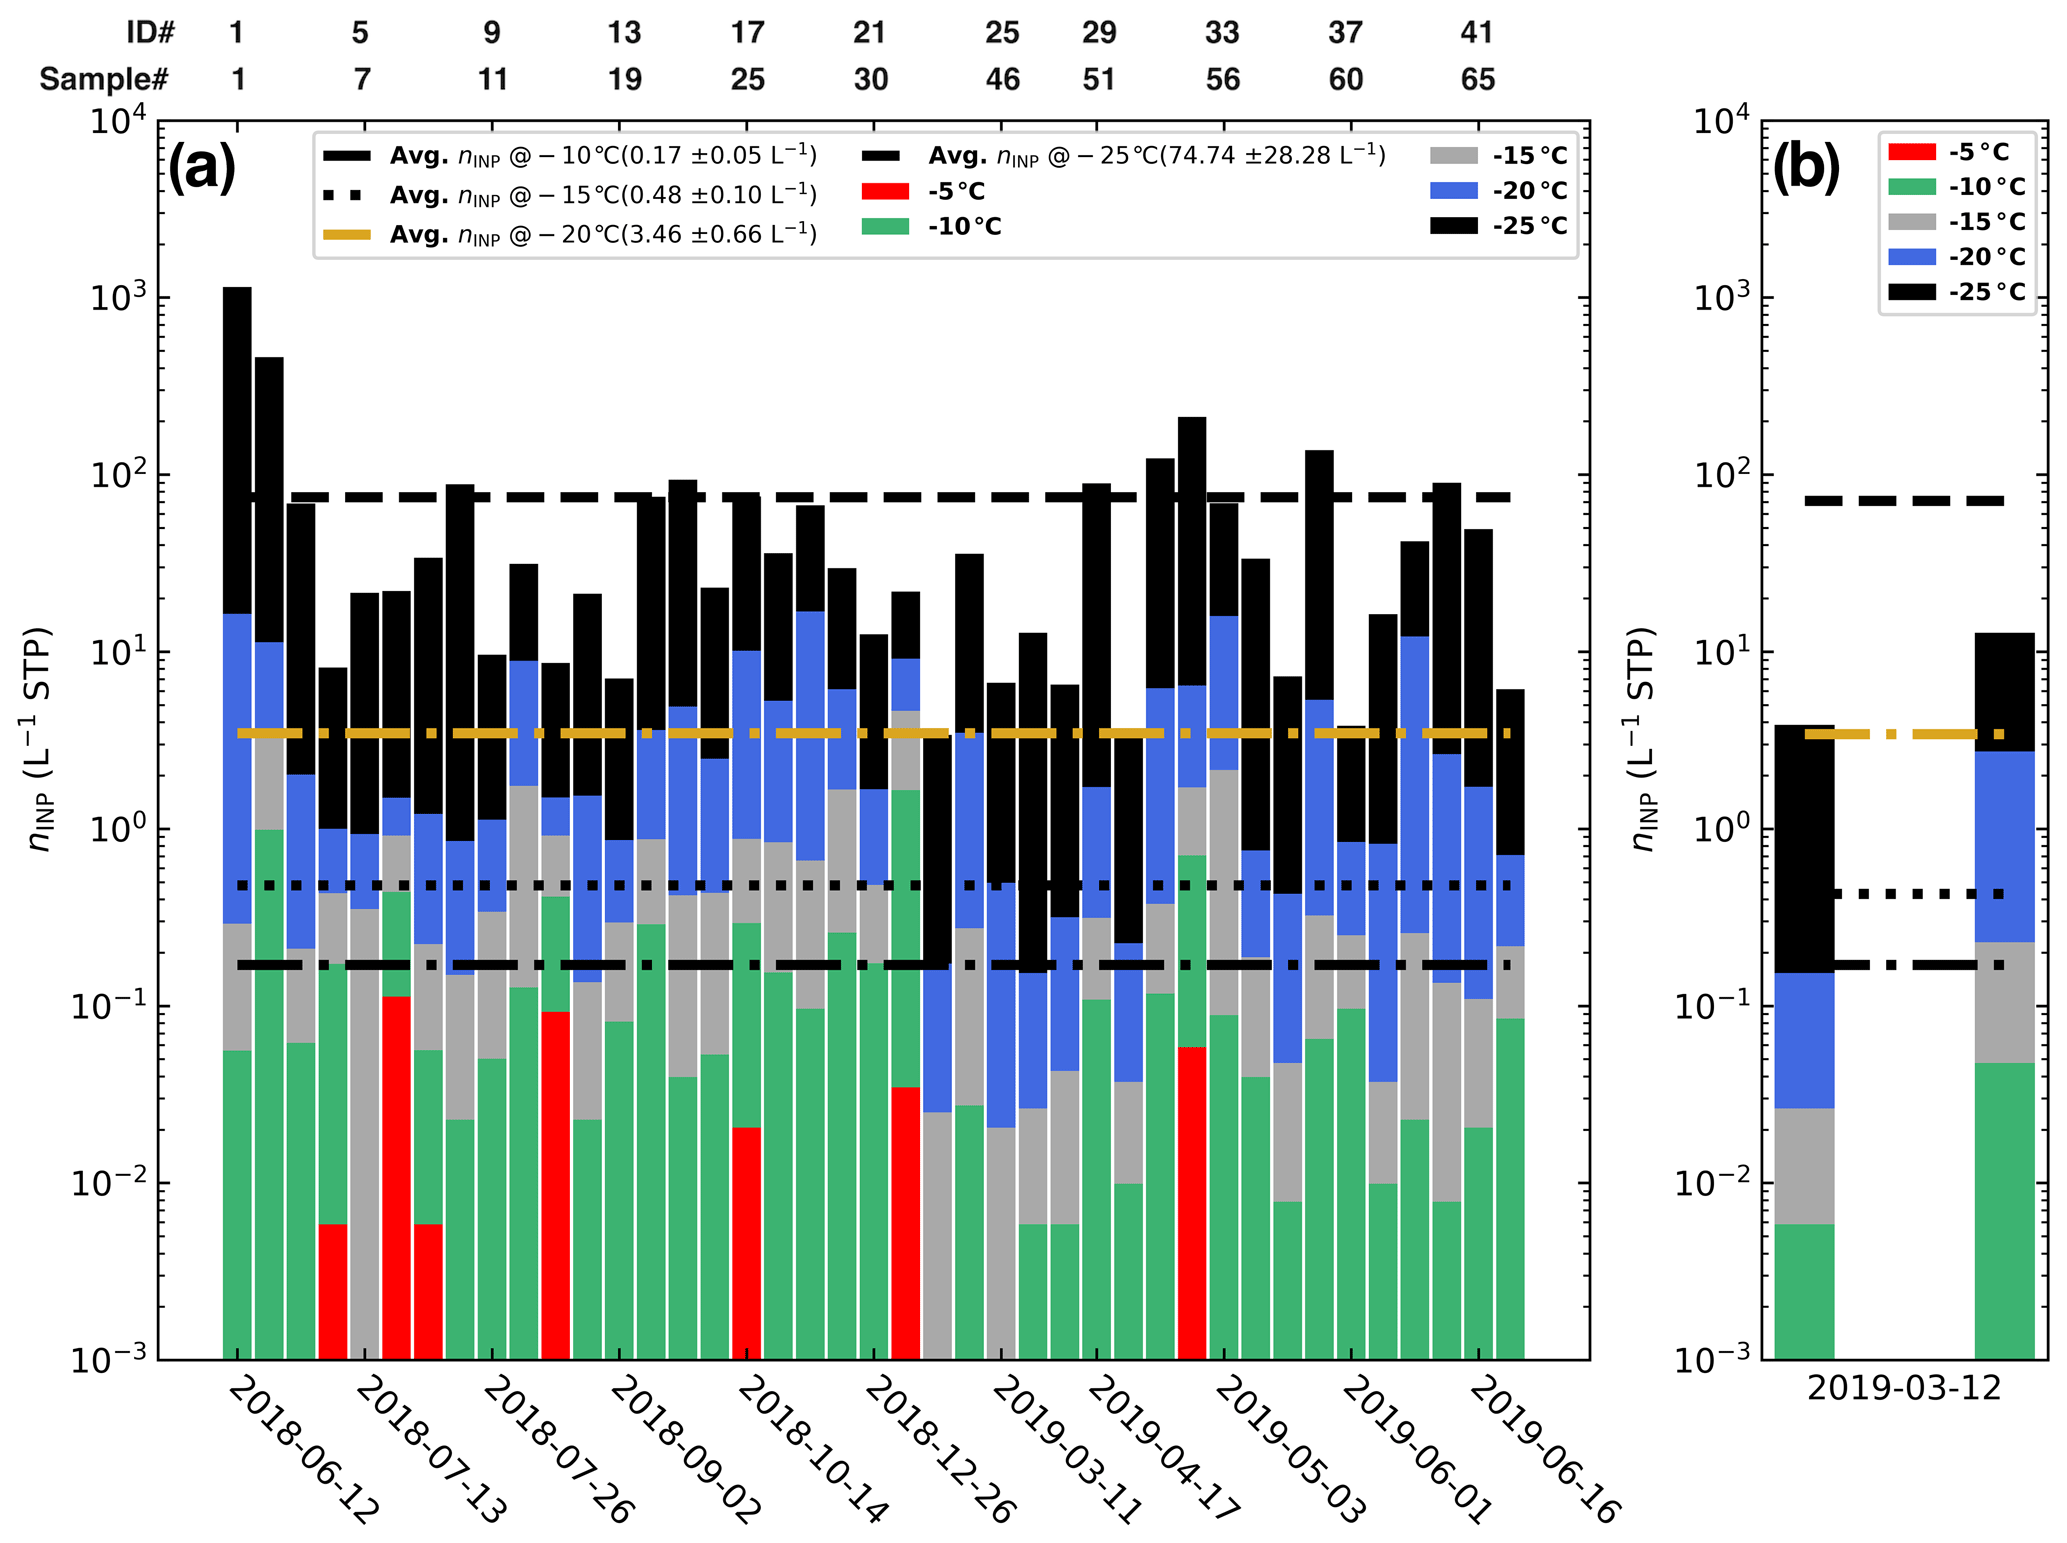
Figure 3(a) Time series of cumulative nINP (L−1 air) in each precipitation sample at different temperatures. (b) nINP for two precipitation samples (ID no. 26 and 27) observed on the same day of 12 March 2019. The uncertainty in the average nINP at each temperature (± numbers in parentheses) is the standard error calculated for 42 samples.
3.3 INP results
The time series of cumulative nINP from precipitation samples at different temperatures (i.e., −5, −10, −15, −20, and −25 ∘C) are shown in Fig. 3. The temperature-resolved mean cumulative nINP ± standard error is also presented in Fig. 3. Note that Fig. 3b shows nINP for two precipitation samples (ID nos. 26 and 27) observed on the same day of 12 March 2019. Overall, 3 orders of magnitude variations of averaged cumulative nINP values were observed between −10 ∘C (0.17 ± 0.04 L−1) and −25 ∘C (74.74 ± 28.28 L−1) for our precipitation samples. Occasionally, we observed nINP detected at ≥ −5 ∘C, but such a high-temperature INPs was randomly found in only 7 out of 42 samples within our detection capability.
Attempts to examine the distribution of nINP based on the precipitation type, meteorological season, and maximum precipitation intensity (mm h−1) were made (see Sect. S5). Due to the limited total number of samples we collected, we cannot conclusively state anything regarding seasonal variations of nINP in our precipitation samples. Nonetheless, our INP results showed that the lowest nINP at −25 ∘C (3.0 L−1) was found in a hail/thunderstorm sample (ID no. 37; no inclusion of large hydrometeors as seen in Fig. 2b) collected during the summer 2019. Likewise, the highest nINP at −25 ∘C (1130 L−1) was found in a hail-involved severe thunderstorm sample (ID no. 1) collected in summer 2018. This observation is interesting, because the measured PM10 of ∼ 6.2 µg m−3 prior to precipitation of ID no. 1 (Table 1) is not the highest PM10 recorded in 2018/19, suggesting wet scavenging does not control the total INPs in precipitation samples. The fact that the second lowest nINP (−25 ∘C), which is 3.2 L−1, is from the snow sample (ID no. 23) also supports a negligible contribution of scavenging in our INP data. Moreover, our results showed that cumulative nINP below −20 ∘C in our precipitation samples could be high in the samples collected while observing > 10 mm h−1 hail/thunderstorm and snow precipitation with notably large hydrometeor sizes.
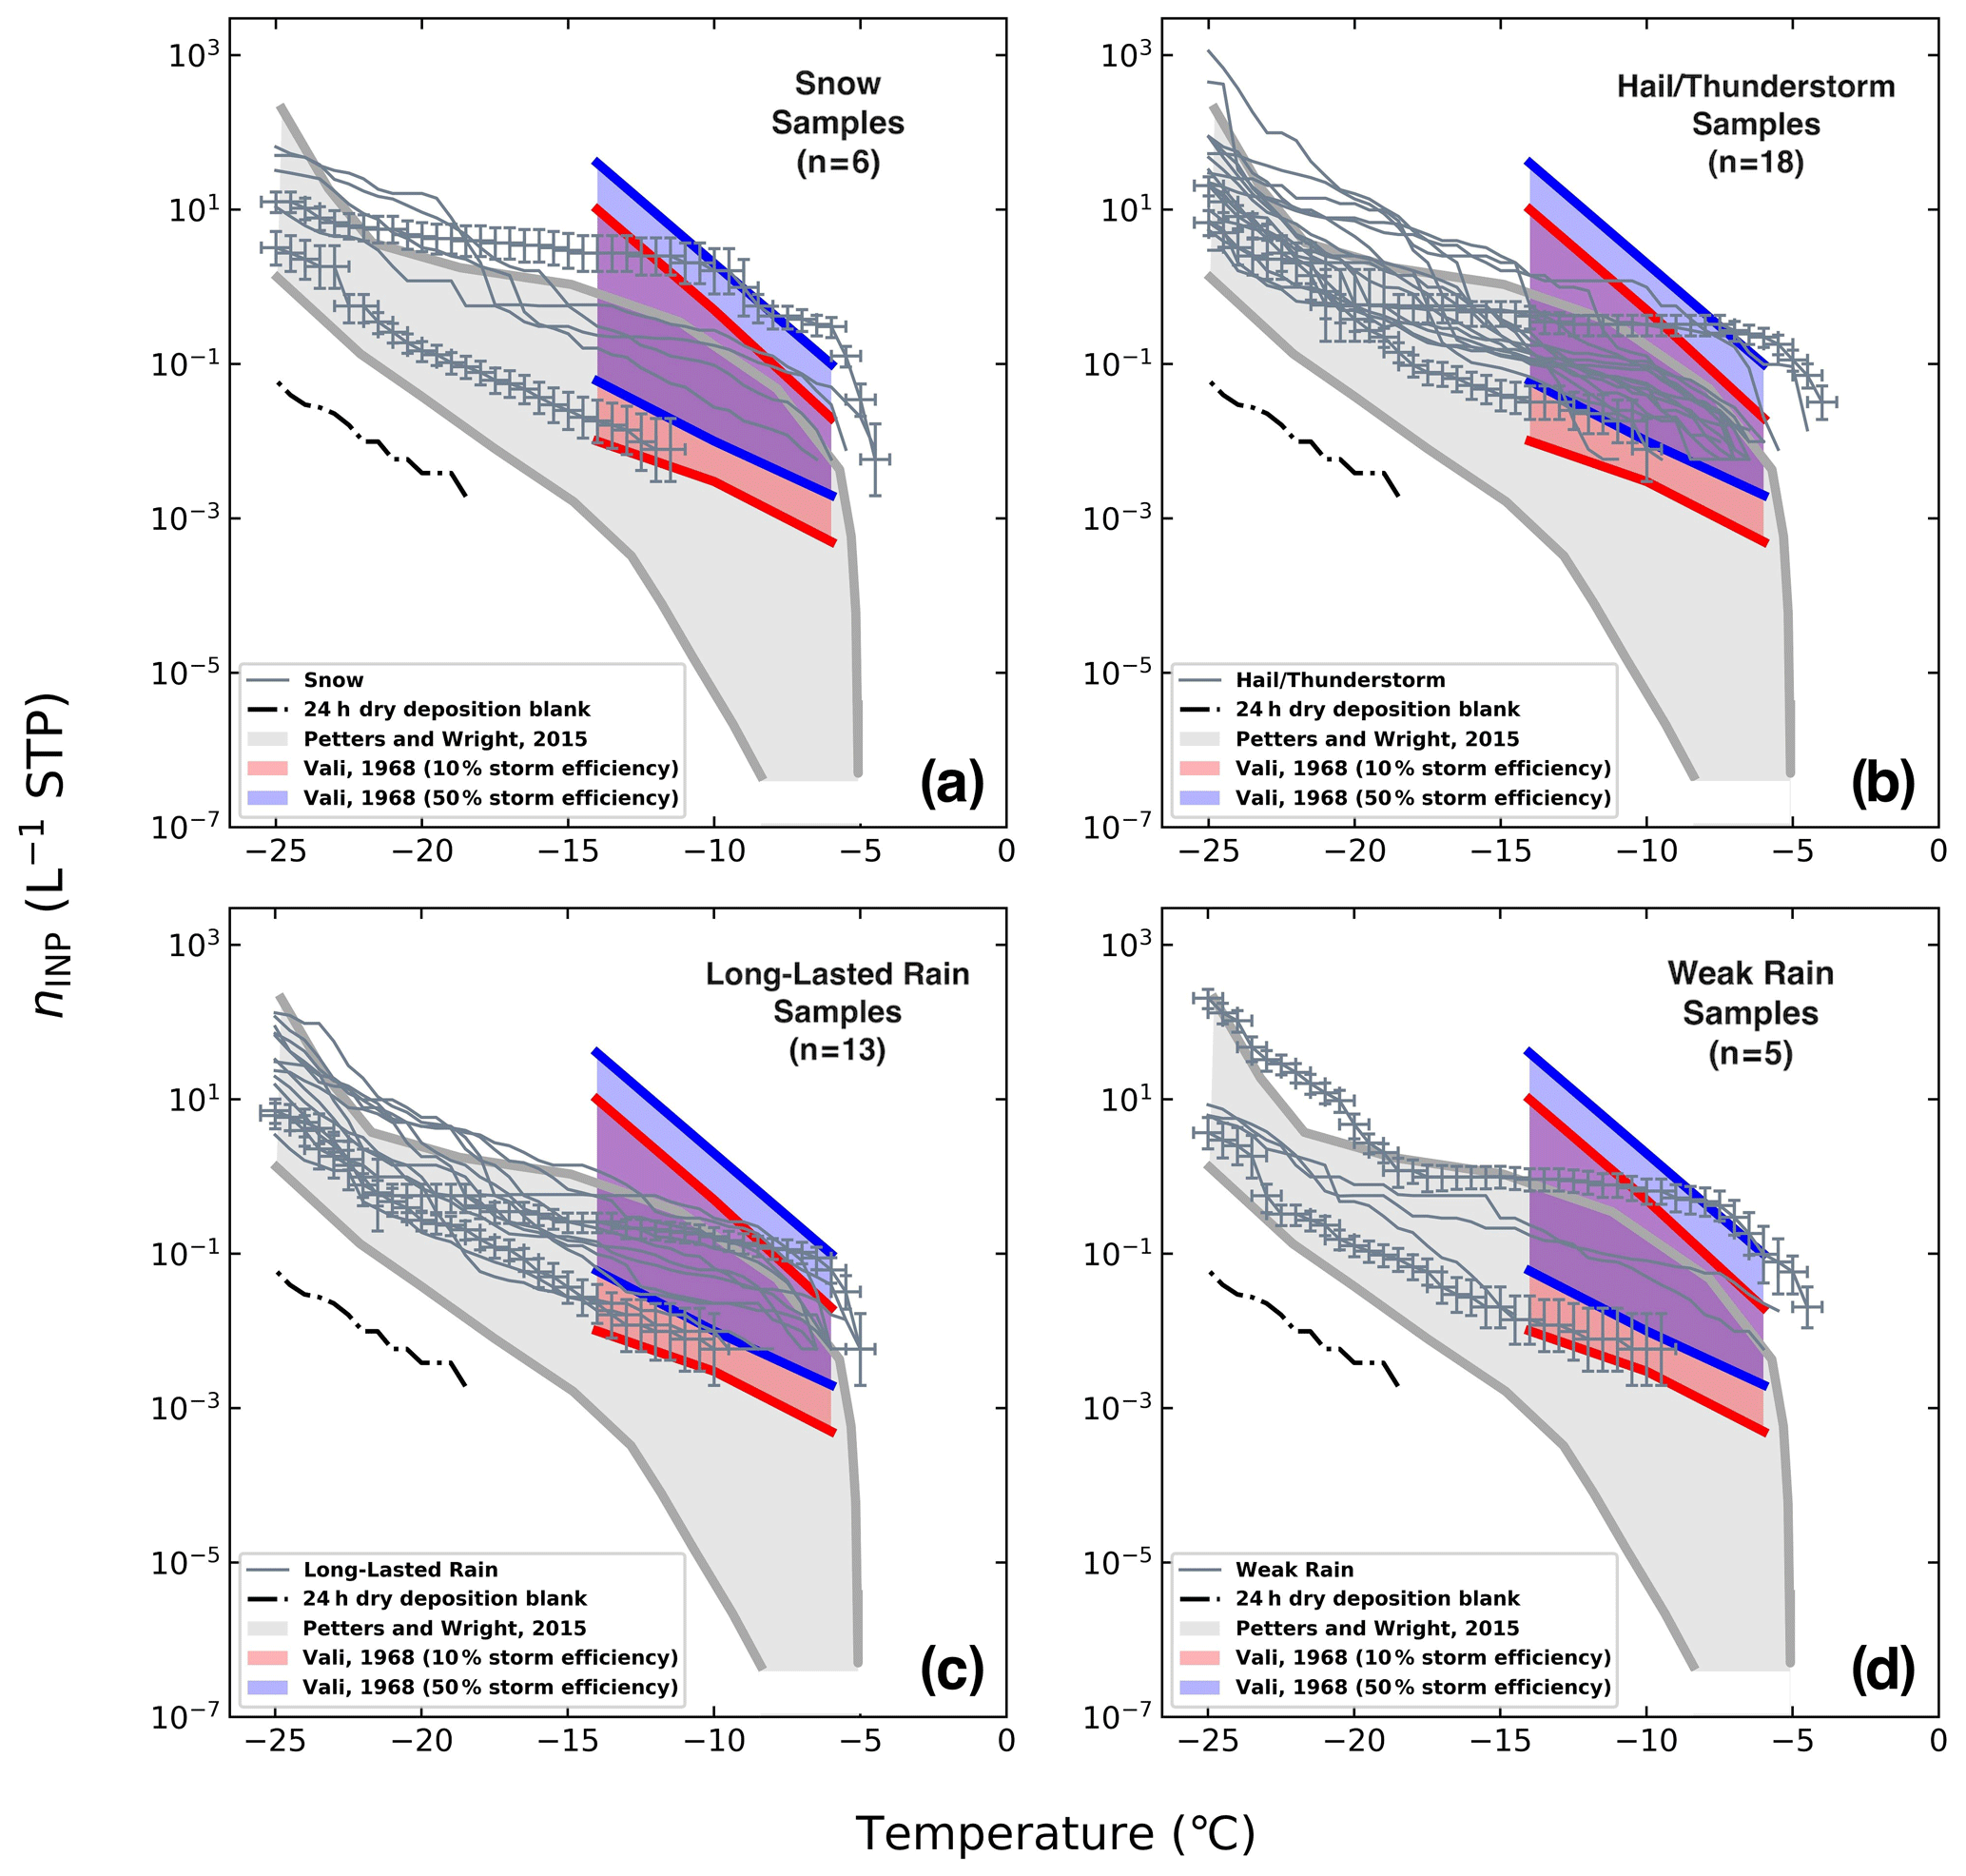
Figure 4IN spectra of (a) snow, (b) hail/thunderstorm, (c) long-lasted rain, and (d) weak rain samples superimposed on nucleation spectra from previous precipitation INP studies (shaded areas). A subset of spectra shows error bars. The x-axis error bars represent constant uncertainty of ± 0.5 ∘C in temperature. The y-axis error bars are 95 % confidence interval for nINP shown only for two samples from each category. The number of precipitation samples in each category is shown by the value of “n”.
Figure 4 shows a compilation of nINP(T) spectra of each precipitation type in comparison to previously reported precipitation nINP(T). In general, most of nINP spectra fall in the upper range of the previous precipitation nINP data presented in Petters and Wright (2015) and Vali (1968). INP humps shaping the reference spectra (i.e., one below −20 ∘C and another at > −20 ∘C) are also found in our spectra. The observed hump is especially obvious for nINP at temperatures above −20 ∘C, and some of our spectra exceed the upper bound of the reference spectra in any precipitation types. For temperatures below −20 ∘C, our nINP(T) data match fairly well within the range of the reference nINP(T) for all four precipitation types.Thus, the precipitation type observed at the ground level would not have any relationships with INP propensity at least for our 42 samples collected for this study. However, it is interesting that most of our nINP data points above −15 ∘C fall within the range of estimated nINP at cloud height with < 50 % storm efficiency, reported in Vali (1968). In fact, regardless of precipitation type, we see reasonable overlaps of our nINP(T) with Vali (1968). The author stated that the large differences in IN content among precipitation samples were mainly caused by differences in the nucleus content of the air entering the storm. This implies that the cloud-level dynamics like cloud entrainment impact the cloud-level INP concentrations. Hence, we compared our precipitation INP data with the lower and upper limits of the IN concentrations in the air entering the storm given by Vali (1968) (Table 2, Sect. 9). These cloud-level INP concentrations given by Vali (1968) were for two different storm efficiencies, which is the ratio of mass of precipitation to the mass of water input. The storm efficiency of 10 % represents the time when high concentrations of precipitation inside the storm begins to develop. Likewise, 50 % is at the peak intensity of the storm. These different combinations of storm efficiencies and water content accounted for a tenfold variation in the ice nucleus content. As more air is entered into the storm with 50 % efficiency, more IN concentrations are observed at cloud level. Although our data are comparable to Vali (1968), there is still indeed the need for cloud-level INP measurements to define the relationship between the ground-level INP concentrations and precipitation intensity.
In addition, Fig. 4 also shows the nINP result of our 24 h dry deposition blank sample. For the measured temperature range, nINP values from the dry deposition blank sample were at least an order of magnitude lower than that from our precipitation samples. This finding corroborated our assumption of negligible contribution of dry deposition in our WT-CRAFT estimated nINP from precipitation samples.
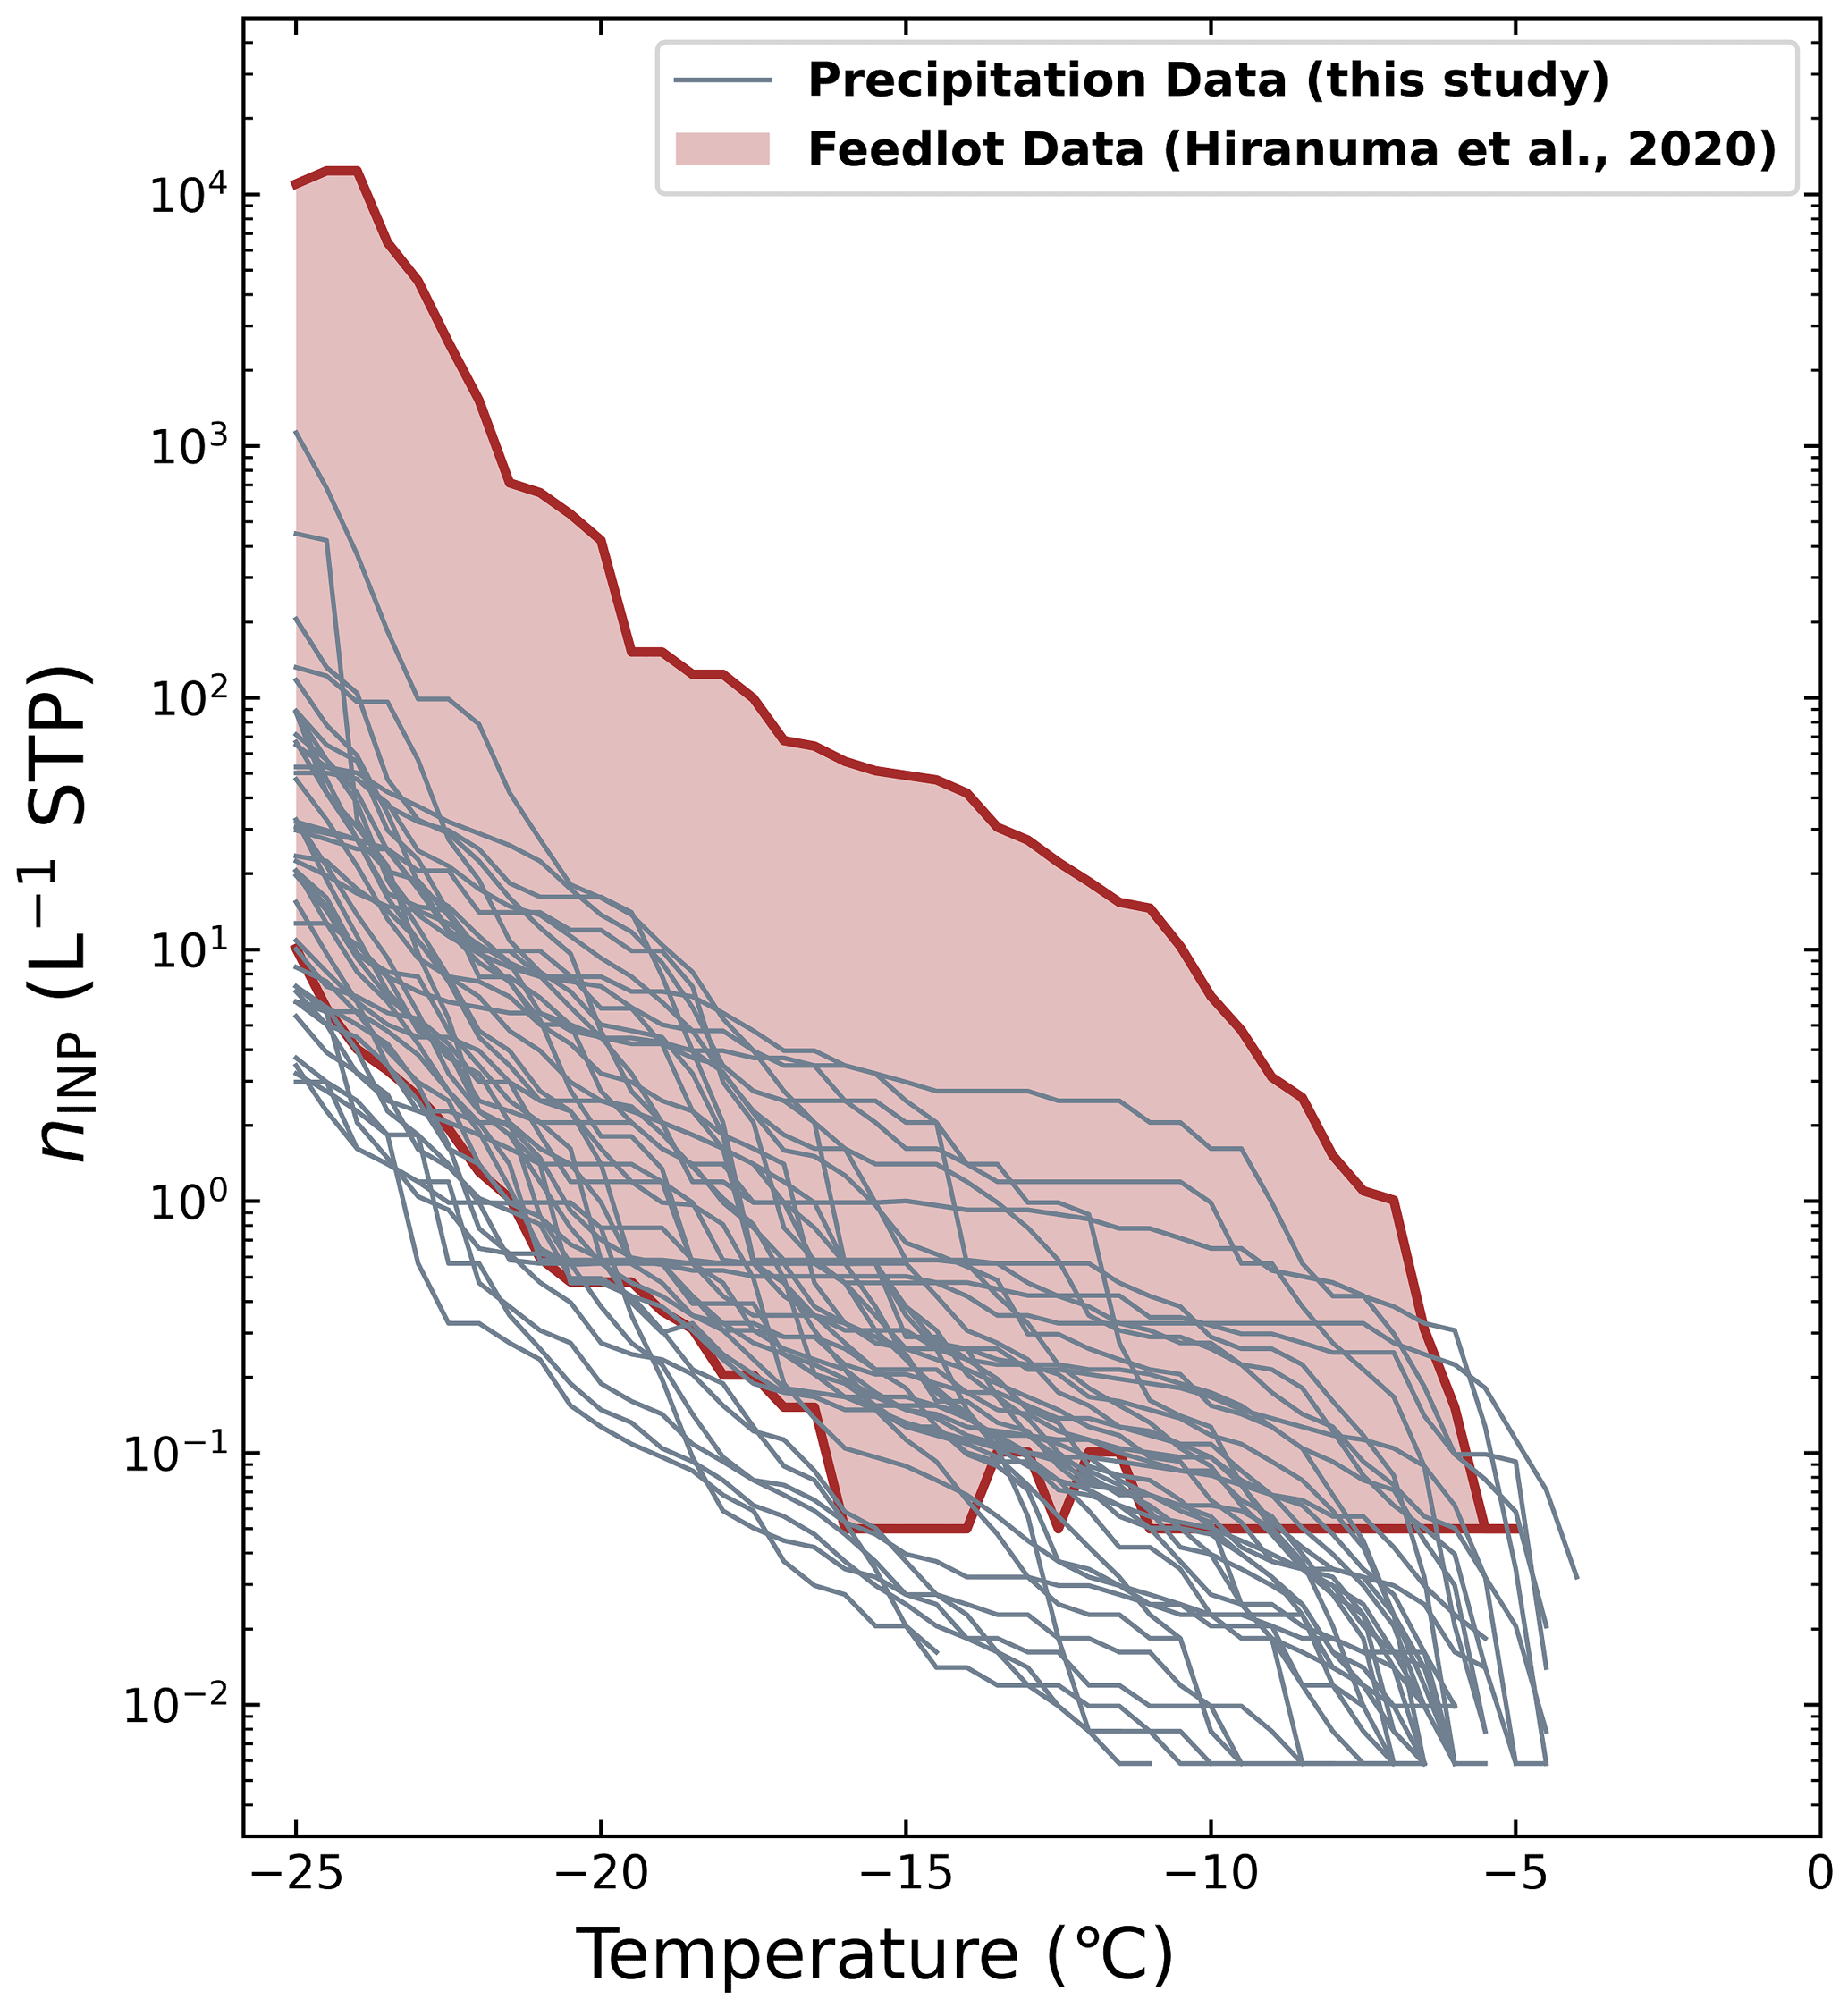
Figure 5Compiled IN spectra of our precipitation samples superimposed on nucleation spectra from a local cattle feedyard dust study (shaded area). The cattle feedyard INP data are adapted from Hiranuma et al. (2020).
Figure 5 shows another compilation plot of our precipitation nINP(T) spectra compared to ambient nINP(T) data of local agricultural dust from Hiranuma et al. (2020). As seen, most of our precipitation INP spectra are accumulated near the lower end of the cattle feedyard IN spectra, implying some inclusion of this local dust as INPs in our samples. Although we are not certain if this local dust plays a role in precipitation (and assessing the potential of locally emitted aerosol particles to precipitation formation is beyond the scope of the current study), it is important to study the contribution of local agricultural dust in wet scavenging and INP formation at cloud height separately in the future. Further discussion regarding the cattle feedyard contribution in INPs in our precipitation samples is provided in Sect. 3.4.
3.4 Microbiome of cattle feedyard and precipitation samples
We conducted the microbiome analysis of a subset of our precipitation samples and ambient dust samples collected at commercial cattle feedyards in the Texas Panhandle to identify potential biological sources of INPs in our precipitation samples.
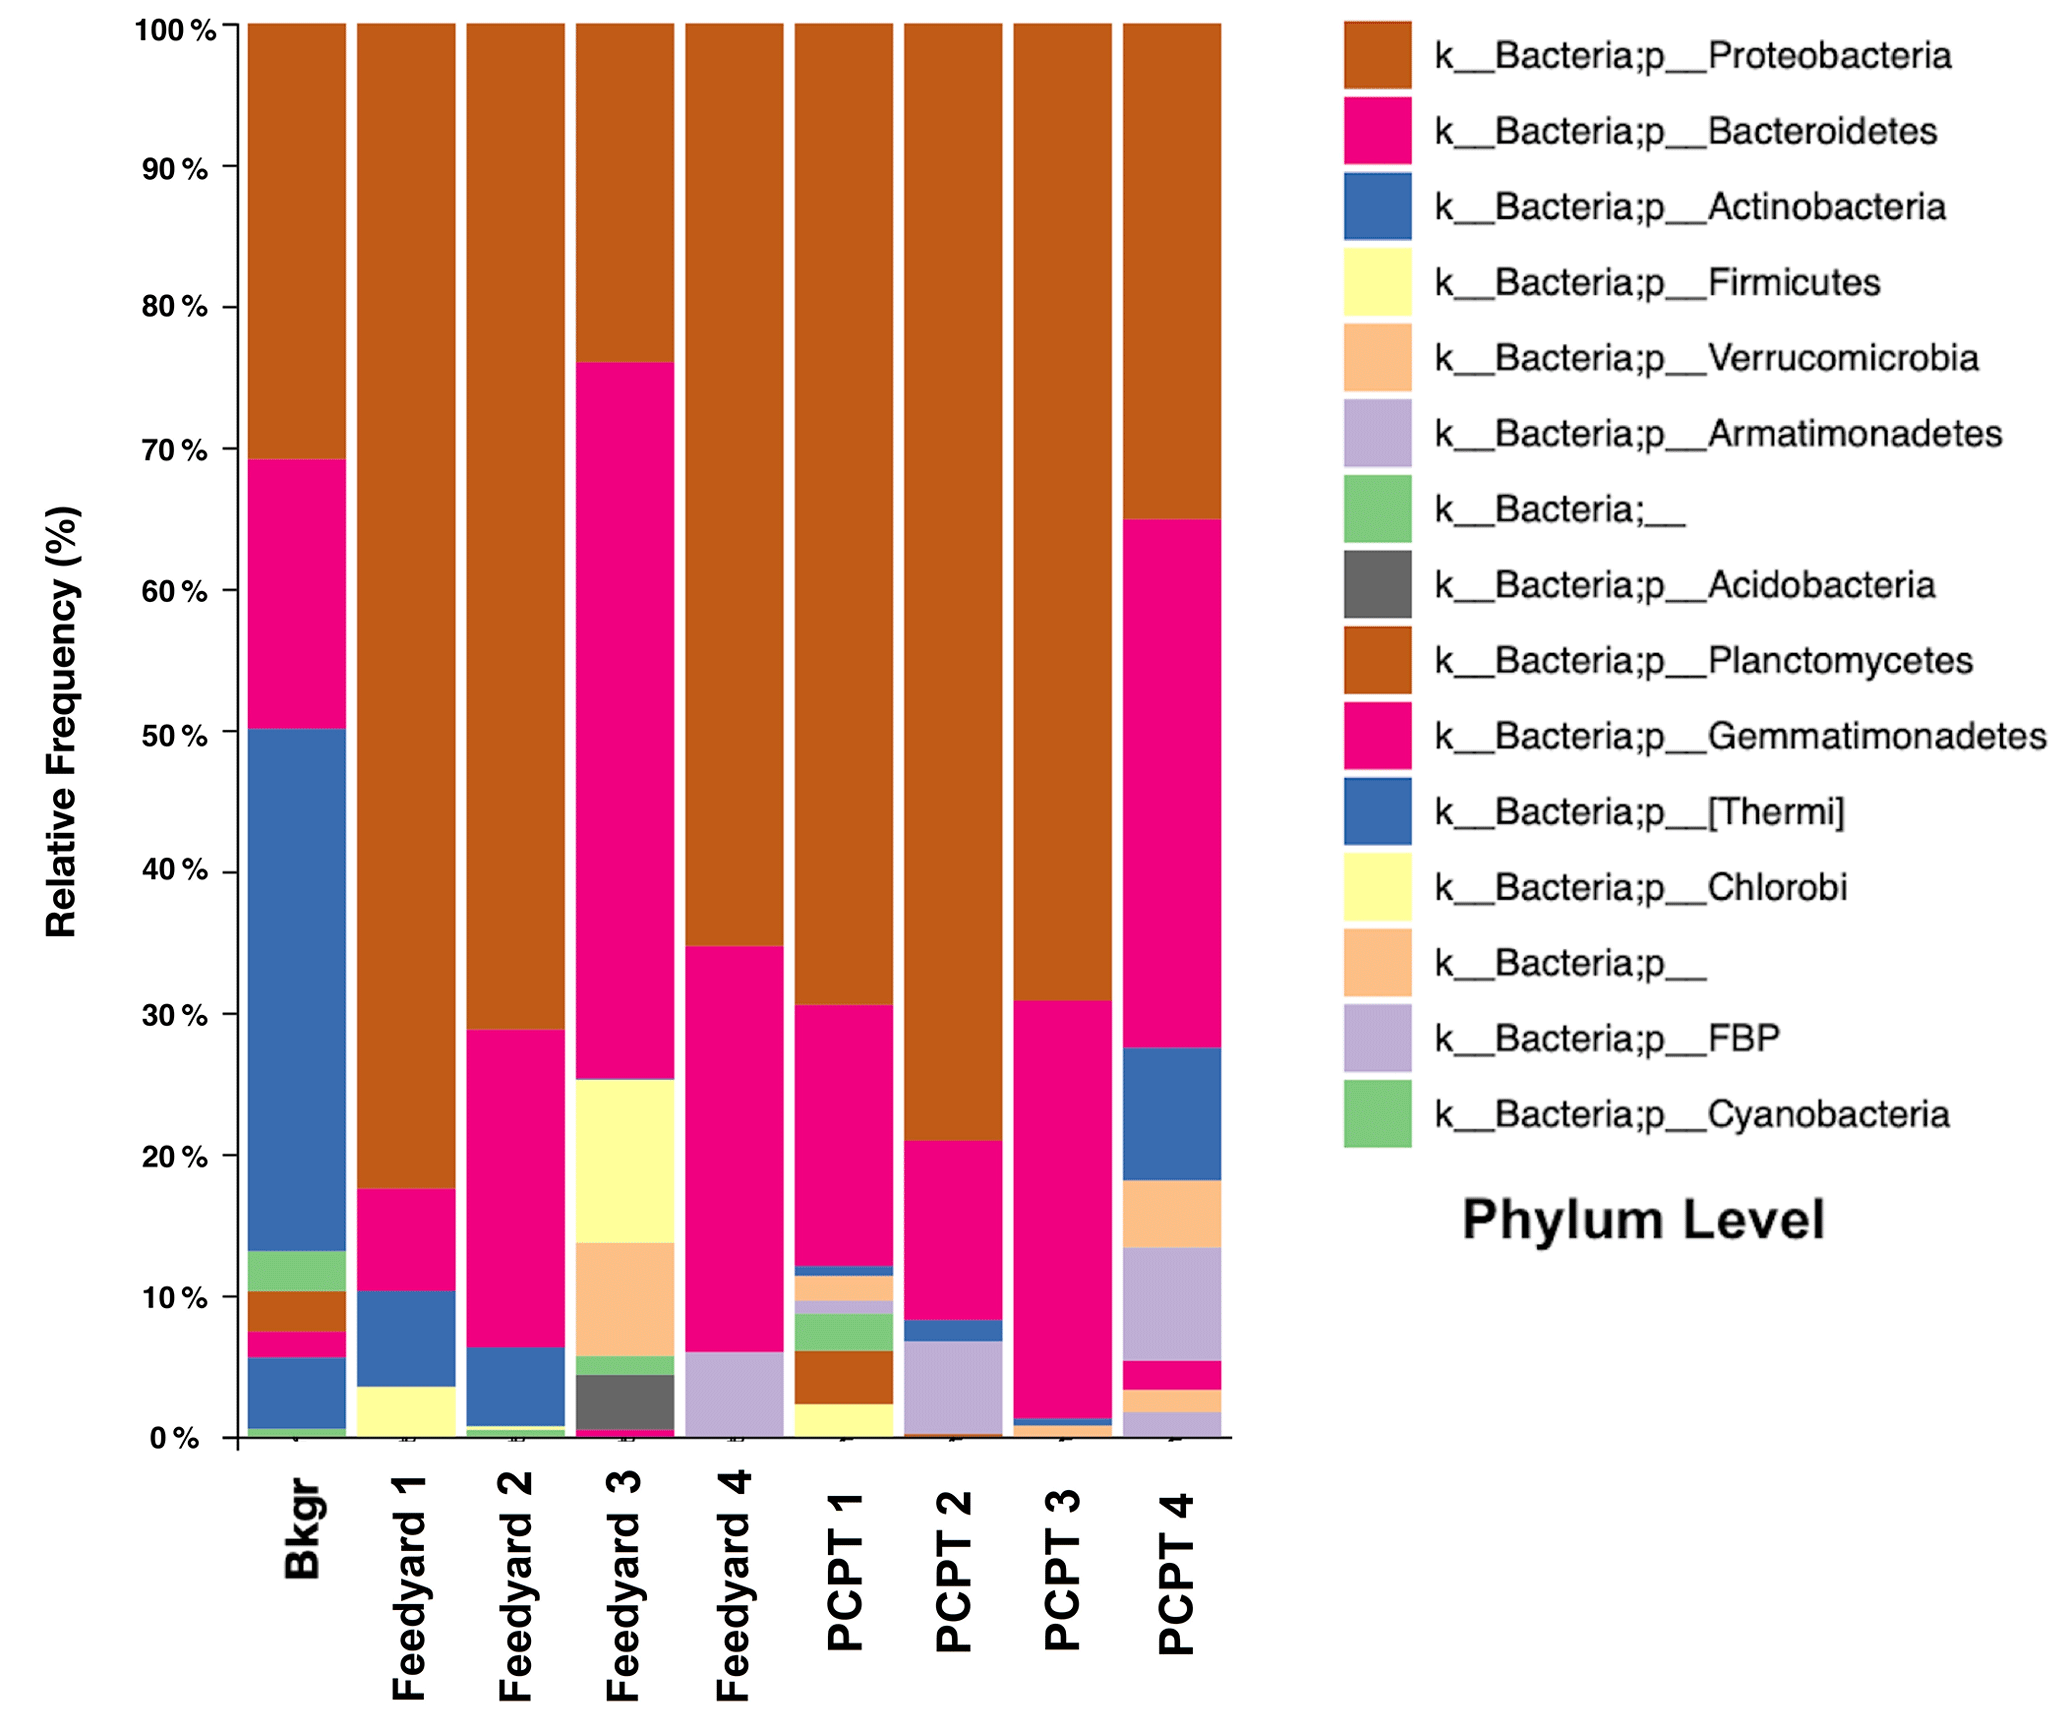
Figure 6Bacterial community analysis of precipitation and cattle feedyard dust samples showing Relative Frequency (%) or abundance of Bacterial taxonomy. “Bkgr” represents the 24 h dry deposition blank sample (sample no. 34). Our cattle feedyard samples are collected locally on 28 March 2019 (1), 22 July 2018 (2), 23 July 2018 (3), and 24 July 2018 (4) – see Hiranuma et al. (2020). PCPT 1–4 corresponds to our sample nos. 1, 2, 50, and 7, respectively.
We successfully generated data of the bacterial microbiome of our precipitation and cattle feedyard dust samples. Unfortunately, our attempt to characterize the fungal and archaeal components of the microbiome was not successful due to the limitation in sample amount. Thus, we focus on bacterial discussions hereafter. In most cases, bacterial phyla were classified to the level of genus. The majority of bacteria in all samples belonged to the phyla Proteobacteria and Bacteroidetes (Fig. 6 and Table S9). In hailstorm samples, the main taxa of Proteobacteria were Massilia (a genus found in clinical samples and mammals but also the soil, rhizosphere, and even aerosols), genera belonging to the order Sphingomonadales (bacteria with wide metabolic abilities), Caulobacterales (bacteria living in diverse terrestrial and aquatic habitats; some are minor human pathogens), and Rhizobiales (nitrogen-fixing bacteria forming symbioses with the roots of legumes). Among the Bacteroidetes phylum, the genus Marinoscillum was relatively the most abundant. This genus is a recently described marine bacterium, and it is interesting that it was found in hailstorm samples at percentages from 17.3 % to 3.2 % of the microbiome. Additionally, in one hailstorm sample, we also identified Gilvimarinus, which is another marine genus of Gammaproteobacteria (Table S9). These results indicate some connection with air mass originating from ocean.
For verification, we performed back-trajectory analysis using the HYSPILT-READY model with Global Data Assimilation System (1 degree) meteorological data as input (Stein et al., 2015; Rolph et al., 2017). The analysis for our precipitation sampling periods (i.e., PCPT 1–4 in Fig. 6) was carried out at different heights over our precipitation sampling location; i.e., 500, 1000, and 3000 (assuming these as the typical cloud heights). Furthermore, for the cattle feedyard samples 1–4 (Fig. 6), the back-trajectory analysis was carried out at the sampling height, which is 1.5 Overall, all these back-trajectories indicate a possible maritime influence through the Caribbean Sea, Gulf of Mexico, and/or the Pacific Ocean (not shown to protect location privacy). Thus, these results support a possible marine influence in our precipitation and cattle feedyard samples. Other Bacteroidetes taxa with notable presence in hailstorm microbiome included Saprospirales and Chitinophagales orders with bacteria living on animals and in the gut of animals as expected.
The microbiomes commonly found in our precipitation samples included the genus Massilia in significant numbers (11.3 % of the microbiome), bacteria of the Proteobacterial orders Rhizobiales, Sphingomonadales, and Burkholderiales; a significant percentage (8.5 %) of the marine genus Marinoscillum, and bacteria in the order Saprospirales of phylum Bacteroidetes. Our results suggest that no known IN active species were detected in precipitation microbiomes. The order Pseudomonadales, which includes most known IN active species, was a very minor component of the microbiome in our samples.
Massilia and other unidentified genera of the family Oxalobacteraceae were also relatively dominant in all four cattle feedyard samples with percentages from 6.5 % to 65.4 % of the microbiome. Marinoscillum, a marine bacterium surprisingly found in all precipitation samples, was also found in all cattle feedyard samples from 3 % to 8.5 % of the microbiome (Table S9). These similarities of the predominant bacteria in the microbiome of four cattle feedyard dust samples and of four precipitation samples taken at an area distant from the cattle feedyards, perhaps indicate some connection of the cattle feedyard dust and precipitation microbiomes, either with the formation of precipitation or with their presence in aerosols during precipitation events. Although we cannot rule out the possibility that scavenging of aerosolized bacteria explains the presence of these bacteria both in cattle feedyard and precipitation samples taken even at a distance from cattle feedyards, our dry deposition background result shows different biological composition (Fig. 6). It is also noteworthy to mention that neither of the genera (Massilia and Marinoscillum) were detected in the background deposition blank sample and it is not known whether they have any IN activity. Genera Massilia and Sphingomonas have been reported as weak IN active species (Jimenez-Sanchez et al., 2018), but these results are inconclusive and the discussion is ongoing at this stage (Woo and Yamamoto, 2020). Therefore, the scavenging may not be the main reason for the presence of Massilia and Marinoscillum found in our precipitation samples. Other bacterial taxa with a significant presence in cattle feedyard samples included members of orders Caulobacterales and Burkholderiales.
3.5 Caveats and future studies
A surface-level air mass on a plain is not necessarily the same as the air mass where precipitation forms at the cloud level. Studying the vertical gradient in INP concentrations in this region would hint at the link between these two vertical zones (e.g., He et al., 2020). The future investigation should also include investigations in physicochemical transformation of hydrometers and INPs, which might occur between the cloud height and the ground (e.g., Pereira et al., 2020), impact of aerosol dynamics and processing, effect of solutes to alter the freezing point (Whale et al., 2018), secondary ice formation, and cloud macrophysics addressed in Wright and Petters (2015 – Sects. 4.1 to 4.3). For instance, while assuming a constant CWC may be reasonable to study precipitation INPs (i.e., Sect. 2.5), it is necessary in the future to further investigate in-cloud-specific CWCs incorporating loss of water through partial evaporation of raindrops during free fall based on vertical vapor deficit profiles to conclusively assess if this assumption is fair or not. Precipitation evaporation rate might introduce bias in nINP for precipitation systems with high cloud base, and the correction can be applied accordingly (Petters and Wright, 2015). Direct comparison between INP measurements in cloud water samples and those in precipitation samples might also be key to answer this question (e.g., Pereira et al., 2020).
The precipitation intensity strongly depends on several other dynamical factors and thermodynamic conditions, including the land use, moisture levels, land surface temperatures, and convective available potential energy. For instance, a recent observational study showed that the irrigation practices in the US Great Plains region had enhanced summer precipitation intensity (Alter et al., 2015), resulting an increase in the total precipitation received. Hence, it is not straightforward to link the precipitation intensity to the estimated INP concentrations, and more future studies involving cloud-level and surface-level INP measurements might help in elucidating this problem. To assess the impact of INPs on precipitation properties (and vice versa), it is necessary to conduct the INP measurement of cloud water samples, aerosol particle characterizations below cloud, and more detailed analysis of precipitation-forming cloud properties as well as cloud height. A more detailed scavenging analysis without many assumptions and limitations, such as assuming a constant scavenging rate over precipitation, limited particle size distributions, and a well-mixed boundary layer, is also necessary to connect the surface observations to cloud-level phenomena. Diffusional scavenging of small particles may not contribute to IN unless they are highly ice-active macromolecules or other small biological species. Regardless, robust aerosol particle size distribution data across the ground to cloud base segment would definitely complement to accurately and precisely estimate scavenging efficiencies. Some previous studies support the assumption of a well-mixed boundary layer near the study area. Further effort may be needed to characterize the climatology of boundary layer height in the Texas Panhandle region at different times of a day, as demonstrated in Schmid and Niyogi (2012) and Zhu et al. (2001). Incorporating more local, specific vertical ambient profiles (lapse rate, Dong et al., 2008) for further analysis would also be helpful.
As for more future studies, INPs derived from precipitation samples collected over multiple years would give comprehensive insight into their impact on local precipitation systems. This work highlights this need for more precipitation-based INP studies from different geographical locations. The reduced uncertainties in nINP along with the high INP detection sensitivity could help in addressing the long-debated issue of INP rarity at temperatures ≥ −10 ∘C.
We have successfully estimated nINP (L−1 of air) in the immersion freezing mode from different precipitation samples collected in Canyon, TX, USA, during June 2018–July 2019. IN spectra were derived for MPC temperature range (0 to −25 ∘C) from four different precipitation types (snow, hail/thunderstorm, long-lasted rain, and weak rain) using a cold stage instrument. We have found that nINP values from our precipitation samples match or exceed nINP from previous precipitation-based INP studies (Petters and Wright, 2015; Vali, 1968). Notably, the high-temperature (≥ −15 ∘C) INPs in some of our precipitation samples are in the same order of magnitude as what is reported in Vali (1968). Although we found no clear seasonal variations in nINP values, in part due to the limited number of samples, the analysis of yearlong ground-level precipitation observations as well as INPs for the precipitation samples showed that the highest nINP at −25 ∘C of 1130 L−1 coincided with a hail-involved severe thunderstorm event observed during the summer in 2018 (ID no. 1). Similarly, the lowest cumulative INP at the same temperature, 3.0 INP L−1, was found in another hail/thunderstorm sample collected in June 2019 (ID no. 37). The second lowest nINP (−25 ∘C) was found in one of our snow samples collected during the winter (ID no. 23 = 3.2 INP L−1). Overall, our results showed that cumulative nINP in our precipitation samples below −20 ∘C could be high in the samples collected while observing > 10 mm h−1 precipitation with the presence of notably large hydrometeor sizes. While our results cannot conclusively define the relationship between INPs and precipitation, our precipitation INP data are an important asset for understanding ambient INPs in the Texas Panhandle region, where a rural agricultural environment prevails.
Our metagenomics results suggest the presence of marine genera Marinoscillum and Gilvimarinus in precipitation and cattle feedyard PM samples. These genera may have derived by an influence of air mass originating from maritime regions. Marine bacteria in inland sampling sites have been identified in previous studies (e.g., Cho and Jang, 2014). We also identified bacterial genera common in our precipitation as well as the local cattle feedyard dust samples, while the microbiome composition in one feedyard sample (Feedyard 3 in Fig. 6) was considerably different from the microbiome composition in precipitation samples. The difference of the microbiomes in dry and wet deposition samples, suggesting a non-local origin of bioaerosols in precipitation, has also been observed previously over crops (Constantinidou et al., 1990), as well as in urban precipitation samples (Cho and Jang, 2014; Woo and Yamamoto, 2020). While we cannot conclude if local cattle feedyard dust contributes to precipitation formation, we also found some indications of the inclusion of agricultural dust in our precipitation samples. Regardless, we did not find previously known bacterial INPs, such as Pseudomonas and Xanthomonas (Morris et al., 2004), in either the precipitation or cattle feedyard samples. To further seek a connection between local dust and precipitation, it is worthwhile to characterize the local cattle feedyard dust in cloud water samples, as it can be the source of INPs and may impact the local hydrological cycle. Collecting long-term pollen and other biogenic aerosol particles samples (i.e., Fungi and Archaea), and associated observational data for multiple years may add important knowledge regarding the role of local bioaerosols on precipitation INPs. Besides DNA analysis, analysis of RNA by metatranscriptomics will provide insights into the active life of the microbiome in clouds and precipitation. Ultimately, both DNA and RNA analyses of the microbe in ice crystal residuals would offer a direct link between naturally occurring biological particles and INPs.
Original data created for the study can be found in the Supplement.
The supplement related to this article is available online at: https://doi.org/10.5194/acp-21-4503-2021-supplement.
NH and JW proposed and designed this collaborative research. HSKV and CAR conducted the WT-CRAFT measurements. GDM conducted the metagenomics investigation without knowing the identity of samples. DH developed the IoT sensors and their data acquisition interface with the support of JW and NH. DH and NH conducted the IoT measurements. The data analyses were carried out by HSKV, DGG, and NH. HSKV wrote the article with advice of NH and DGG. The revision effort was led by NH with support of all authors.
The authors declare that they have no conflict of interest.
The authors acknowledge the financial support by Killgore Graduate Student Research Grant (WT20-017) provided by West Texas A&M University. This material is based upon work supported by the US Department of Energy, Office of Science, Office of Biological and Environmental Research under award number DE-SC-0018979. We also acknowledge Gourihar Kulkarni and Swarup China for useful discussions regarding implications of scavenging processes on our data.
This research has been supported by the US Department of Energy, Office of Science, Office of Biological and Environmental Research (grant no. DE-SC-0018979) and the Killgore Graduate Student Research Grant, West Texas A&M University (grant no. WT20-017).
This paper was edited by Susannah Burrows and reviewed by three anonymous referees.
Alter, R. E., Fan, Y., Lintner, B. R., and Weaver, C. P.: Observational Evidence that Great Plains Irrigation Has Enhanced Summer Precipitation Intensity and Totals in the Midwestern United States, J. Hydrometeorol., 16, 1717–1735, 2015.
Arnott, W. P., Walker, J. W., Moosmüller, H., Elleman, R. A., Jonsson, H. H., Buzorius, G., Conant, W. C., Flagan, R. C., and Seinfeld, J. H.: Photoacoustic insight for aerosol light absorption aloft from meteorological aircraft and comparison with particle soot absorption photometer measurements: DOE Southern Great Plains climate research facility and the coastal stratocumulus imposed perturbation experiments, J. Geophys. Res., 111, D05S02, https://doi.org/10.1029/2005JD005964, 2006.
Beall, C. M., Lucero, D., Hill, T. C., DeMott, P. J., Stokes, M. D., and Prather, K. A.: Best practices for precipitation sample storage for offline studies of ice nucleation in marine and coastal environments, Atmos. Meas. Tech., 13, 6473–6486, https://doi.org/10.5194/amt-13-6473-2020, 2020.
Belosi, F. and Santachiara, G.: Laboratory investigation of aerosol coating and capillarity effects on particle ice nucleation in deposition and condensation modes, Atmos. Res., 230, 104633, https://doi.org/10.1016/j.atmosres.2019.104633, 2019.
Bush, J., Heflin, K. R., Marek, G. W., Bryant, T. C., and Auvermann, B. W.: Increasing stocking density reduces emissions of fugitive dust from cattle feedyards, Appl. Eng. Agric., 30, 815–824, 2014.
Chen, Q., Yin, Y., Jiang, H., Chu, Z., Xue, L., Shi, R., Zhang, X., and Chen, J.: The Roles of Mineral Dust as Cloud Condensation Nuclei and Ice Nuclei During the Evolution of a Hail Storm, J. Geophys. Res., 124, 14262–14284, 2019.
Cho, B. C. and Jang, G. I.: Active and diverse rainwater bacteria collected at an inland site in spring and summer 2011, Atmos. Environ., 94, 409–416, 2014.
Constantinidou, H. A., Hirano, S. S., Baker, L. S., and Upper, C. D.: Atmospheric dispersal of ice nucleation-active bacteria: the role of rain, Phytopathology, 80, 934–97, 1990.
Cory, K. M.: Immersion freezing of non-proteinaceous biological aerosol proxies and arctic ambient particles, MS thesis, West Texas A & M University, Canyon, TX, USA, available at: https://wtamu-ir.tdl.org/handle/11310/227 (last access: 21 December 2020), 2019.
Creamean, J. M., Mignani, C., Bukowiecki, N., and Conen, F.: Using freezing spectra characteristics to identify ice-nucleating particle populations during the winter in the Alps, Atmos. Chem. Phys., 19, 8123–8140, https://doi.org/10.5194/acp-19-8123-2019, 2019.
Cui, Z., Carslaw, K. S., Yin, Y., and Davies, S.: A numerical study of aerosol effects on the dynamics and microphysics of a deep convective cloud in a continental environment, J. Geophys. Res., 111, D05201, https://doi.org/10.1029/2005JD005981, 2006.
Damoah, R., Spichtinger, N., Forster, C., James, P., Mattis, I., Wandinger, U., Beirle, S., Wagner, T., and Stohl, A.: Around the world in 17 days – hemispheric-scale transport of forest fire smoke from Russia in May 2003, Atmos. Chem. Phys., 4, 1311–1321, https://doi.org/10.5194/acp-4-1311-2004, 2004.
David, R. O., Marcolli, C., Fahrni, J., Qiu, Y., Sirkin, Y. A. P., Molinero, V., Mahrt, F., Brühwiler, D., Lohmann, U., and Kanji, Z. A.: Pore condensation and freezing is responsible for ice formation below water saturation for porous particles, P. Natl. Acad. Sci. USA, 116, 8184–8189, 2019.
de Boer, G., Hashino, T., and Tripoli, G. J.: Ice nucleation through immersion freezing in mixed-phase stratiform clouds: Theory and numerical simulations, Atmos. Res., 96, 315–324, 2010.
de Boer, G., Morrison, H., Shupe, M., and Hildner, R.: Evidence of liquid dependent ice nucleation in high-latitude stratiform clouds from surface remote sensors, Geophys. Res. Lett., 38, L01803, https://doi.org/10.1029/2010GL046016, 2011.
DeMott, P. J., Prenni, A. J., Liu, X., Kreidenweis, S. M., Petters, M. D., Twohy, C. H., Richardson, M. S., Eidhammer, T., and Rogers, D. C.: Predicting global atmospheric ice nuclei distributions and their impacts on climate, P. Natl. Acad. Sci. USA, 107, 11217–11222, 2010.
DeMott, P. J., Suski, K. J., Hill, T. C. J., and Levin, E. J. T.: Southern Great Plains Ice Nuclei Characterization Experiment Final Campaign Summary (No. DOE/SC-ARM-15-012), DOE Office of Science Atmospheric Radiation Measurement (ARM) Program (United States), available at: https://www.arm.gov/publications/programdocs/doe-sc-arm-15-012.pdf (last access: 14 March 2021), 2015.
DeMott, P. J., Hill, T. C. J., Petters, M. D., Bertram, A. K., Tobo, Y., Mason, R. H., Suski, K. J., McCluskey, C. S., Levin, E. J. T., Schill, G. P., Boose, Y., Rauker, A. M., Miller, A. J., Zaragoza, J., Rocci, K., Rothfuss, N. E., Taylor, H. P., Hader, J. D., Chou, C., Huffman, J. A., Pöschl, U., Prenni, A. J., and Kreidenweis, S. M.: Comparative measurements of ambient atmospheric concentrations of ice nucleating particles using multiple immersion freezing methods and a continuous flow diffusion chamber, Atmos. Chem. Phys., 17, 11227–11245, https://doi.org/10.5194/acp-17-11227-2017, 2017.
Després, V., Huffman, J. A., Burrows, S. M., Hoose, C., Safatov, A., Buryak, G., Fröhlich-Nowoisky, J., Elbert, W., Andreae, M., Pöschl, U., and Jaenicke, R.: Primary biological aerosol particles in the atmosphere: a review, Tellus B, 64, 15598, https://doi.org/10.3402/tellusb.v64i0.15598, 2012.
Dong, X., Minnis, P., Xi, B., Sun-Mack, S., and Chen, Y.: Comparison of CERES-MODIS stratus cloud properties with ground-based measurements at the DOE ARM Southern Great Plains site, J. Geophys. Res., 113, D03204, https://doi.org/10.1029/2007JD008438, 2008.
Durant, A. J. and Shaw, R. A.: Evaporation freezing by contact nucleation inside-out, Geophys. Res. Lett., 32, L20814, https://doi.org/10.1029/2005GL024175, 2005.
Fan, J., Leung, L. R., Rosenfeld, D., and DeMott, P. J.: Effects of cloud condensation nuclei and ice nucleating particles on precipitation processes and supercooled liquid in mixed-phase orographic clouds, Atmos. Chem. Phys., 17, 1017–1035, https://doi.org/10.5194/acp-17-1017-2017, 2017.
Field, P. R., Heymsfield, A. J., Shipway, B. J., DeMott, P. J., Pratt, K. A., Rogers, D. C., Stith, J., and Prather, K. A.: Ice in clouds experiment–layer clouds. Part II: Testing characteristics of heterogeneous ice formation in lee wave clouds, J. Atmos. Sci., 69, 1066–1079, 2012.
Garcia, E., Hill, T. C. J., Prenni, A. J., DeMott, P. J., Franc, G. D., and Kreidenweis, S. M.: Biogenic ice nuclei in boundary layer air over two U. S. High Plains agricultural regions, J. Geophys. Res., 117, D18209, https://doi.org/10.1029/2012JD018343, 2012.
Hande, L. B. and Hoose, C.: Partitioning the primary ice formation modes in large eddy simulations of mixed-phase clouds, Atmos. Chem. Phys., 17, 14105–14118, https://doi.org/10.5194/acp-17-14105-2017, 2017.
Hanlon, R., Powers, C., Failor, K., Monteil, C. L., Vinatzer, B. A., and Schmale III, D. G.: Microbial ice nucleators scavenged from the atmosphere during simulated rain events, Atmos. Environ., 163, 182–189, 2017.
Hartmann, D. L., Ockert-Bell, M. E., and Michelsen, M. L.: The effect of cloud type on Earth's energy balance: Global analysis, J. Climate, 5, 1281–1304, 1992.
He, C., Yin, Y., Wang, W., Chen, K., Mai, R., Jiang, H., Zhang, X., and Fang, C.: Aircraft observations of ice nucleating particles over the Northern China Plain: Two cases studies, Atmos. Res., 248, 105242, https://doi.org/10.1016/j.atmosres.2020.105242, 2020.
Hiranuma, N., Brooks, S. D., Gramann, J., and Auvermann, B. W.: High concentrations of coarse particles emitted from a cattle feeding operation, Atmos. Chem. Phys., 11, 8809–8823, https://doi.org/10.5194/acp-11-8809-2011, 2011.
Hiranuma, N., Adachi, K., Bell, D. M., Belosi, F., Beydoun, H., Bhaduri, B., Bingemer, H., Budke, C., Clemen, H.-C., Conen, F., Cory, K. M., Curtius, J., DeMott, P. J., Eppers, O., Grawe, S., Hartmann, S., Hoffmann, N., Höhler, K., Jantsch, E., Kiselev, A., Koop, T., Kulkarni, G., Mayer, A., Murakami, M., Murray, B. J., Nicosia, A., Petters, M. D., Piazza, M., Polen, M., Reicher, N., Rudich, Y., Saito, A., Santachiara, G., Schiebel, T., Schill, G. P., Schneider, J., Segev, L., Stopelli, E., Sullivan, R. C., Suski, K., Szakáll, M., Tajiri, T., Taylor, H., Tobo, Y., Ullrich, R., Weber, D., Wex, H., Whale, T. F., Whiteside, C. L., Yamashita, K., Zelenyuk, A., and Möhler, O.: A comprehensive characterization of ice nucleation by three different types of cellulose particles immersed in water, Atmos. Chem. Phys., 19, 4823–4849, https://doi.org/10.5194/acp-19-4823-2019, 2019.
Hiranuma, N., Auvermann, B. W., Belosi, F., Bush, J., Cory, K. M., Fösig, R., Georgakopoulos, D., Höhler, K., Hou, Y., Saathoff, H., Santachiara, G., Shen, X., Steinke, I., Umo, N., Vepuri, H. S. K., Vogel, F., and Möhler, O.: Feedlot is a unique and constant source of atmospheric ice-nucleating particles, Atmos. Chem. Phys. Discuss. [preprint], https://doi.org/10.5194/acp-2020-1042, in review, 2020.
Huffman, J. A., Prenni, A. J., DeMott, P. J., Pöhlker, C., Mason, R. H., Robinson, N. H., Fröhlich-Nowoisky, J., Tobo, Y., Després, V. R., Garcia, E., Gochis, D. J., Harris, E., Müller-Germann, I., Ruzene, C., Schmer, B., Sinha, B., Day, D. A., Andreae, M. O., Jimenez, J. L., Gallagher, M., Kreidenweis, S. M., Bertram, A. K., and Pöschl, U.: High concentrations of biological aerosol particles and ice nuclei during and after rain, Atmos. Chem. Phys., 13, 6151–6164, https://doi.org/10.5194/acp-13-6151-2013, 2013.
Jimenez-Sanchez, C., Hanlon, R., Aho, K. A., Powers, C., Morris, C. E., and Schmale III, D. G.: Diversity and ice nucleation activity of microorganisms collected with a small Unmanned Aircraft System (sUAS) in France and the United States, Front. Microbiol., 9, 1667, https://doi.org/10.3389/fmicb.2018.01667, 2018.
Kanji, Z. A. and Abbatt, J. P. D.: Laboratory studies of ice formation via deposition mode nucleation onto mineral dust and n-hexane soot samples, J. Geophys. Res., 111, D16204, https://doi.org/10.1029/2005JD006766, 2006.
Kanji, Z. A., Ladino, L. A., Wex, H., Boose, Y., Burkert-Kohn, M., Cziczo, D. J., and Krämer, M.: Overview of ice nucleating particles, Meteorol. Monogr., 58, 1.1–1.33, 2017.
Koop, T. and Murray, B. J.: A physically constrained classical description of the homogeneous nucleation of ice in water, J. Chem. Phys., 145, 211915, https://doi.org/10.1063/1.4962355, 2016.
Koop, T., Luo, B., Tsias, A., and Peter, T.: Water activity as the determinant for homogeneous ice nucleation in aqueous solutions, Nature, 406, 611–614, 2000.
Levin, E. J., DeMott, P. J., Suski, K. J., Boose, Y., Hill, T. C. J., McCluskey, C. S., Schill, G. P., Rocci, K., Al-Mashat, H., Kristensen, L. J., Cornwell, G., Prather, K., Tomlinson, J., Mei, F., Hubbe, J., Pekour, M., Sullivan, R., Leung, L. R., and Kreidenweis, S. M.: Characteristics of ice nucleating particles in and around California winter storms, J. Geophys. Res., 124, 11530–11551, 2019.
Lohmann, U. and Feichter, J.: Global indirect aerosol effects: a review, Atmos. Chem. Phys., 5, 715–737, https://doi.org/10.5194/acp-5-715-2005, 2005.
Lohmann, U., Stier, P., Hoose, C., Ferrachat, S., Kloster, S., Roeckner, E., and Zhang, J.: Cloud microphysics and aerosol indirect effects in the global climate model ECHAM5-HAM, Atmos. Chem. Phys., 7, 3425–3446, https://doi.org/10.5194/acp-7-3425-2007, 2007.
Marcolli, C.: Deposition nucleation viewed as homogeneous or immersion freezing in pores and cavities, Atmos. Chem. Phys., 14, 2071–2104, https://doi.org/10.5194/acp-14-2071-2014, 2014.
Markowicz, K. M. and Chiliński, M. T.: Evaluation of two low-cost optical particle counters for the measurement of ambient aerosol scattering coefficient and Ångström exponent, Sensors, 20, 2617, https://doi.org/10.3390/s20092617, 2020.
Möhler, O., Benz, S., Saathoff, H., Schnaiter, M., Wagner, R., Schneider, J., Walter, S., Ebert, V., and Wagner, S.: The effect of organic coating on the heterogeneous ice nucleation efficiency of mineral dust aerosols, Environ. Res. Lett., 3, 025007, https://doi.org/10.1088/1748-9326/3/2/025007, 2008.
Morris, C. E., Georgakopoulos, D. G., and Sands, D. C.: Ice nucleation active bacteria and their potential role in precipitation, J. Phys. IV, 121, 87–103, 2004.
Mülmenstädt, J., Sourdeval, O., Delanoë, J., and Quaas, J.: Frequency of occurrence of rain from liquid-, mixed-, and ice-phase clouds derived from A-Train satellite retrievals, Geophys. Res. Lett., 42, 6502–6509, 2015.
Parworth, C., Fast, J., Mei, F., Shippert, T., Sivaraman, C., Tilp, A., Watson, T., and Zhang, Q.: Long-term measurements of submicrometer aerosol chemistry at the Southern Great Plains (SGP) using an Aerosol Chemical Speciation Monitor (ACSM), Atmos. Environ., 106, 43–55, 2015.
Pereira, D. L., Silva, M. M., García, R., Raga, G. B., Alvarez-Ospina, H., Carabali, G., Rosas, I., Martinez, L., Salinas, E., Hidalgo-Bonilla, S. and Ladino, L. A.: Characterization of ice nucleating particles in rainwater, cloud water, and aerosol samples at two different tropical latitudes, Atmos. Res., 250, 105356, https://doi.org/10.1016/j.atmosres.2020.105356, 2020.
Petters, M. D. and Wright, T. P.: Revisiting ice nucleation from precipitation samples, Geophys. Res. Lett., 42, 8758–8766, 2015.
Phillips, V. T. J., Donner, L. J., and Garner, S. T.: Nucleation processes in deep convection simulated by a cloud-system-resolving model with double-moment bulk microphysics, J. Atmos. Sci., 64, 738–761, 2007.
Rolph, G., Stein, A., and Stunder, B.: Real-time Environmental Applications and Display sYstem: READY, Environ. Model. Softw., 95, 210–228, 2017.
Rosenfeld, D., Lohmann, U., Raga, G. B., O'Dowd, C. D., Kulmala, M., Fuzzi, S., Reissell, A., and Andreae, M. O.: Flood or drought: How do aerosols affect precipitation?, Science, 321, 1309–1313, 2008.
Satheesh, S. K. and Moorthy, K. K.: Radiative effects of natural aerosols: A review, Atmos. Environ., 39, 2089–2110, 2005.
Schiebel, T.: Ice nucleation activity of soil dust aerosols, PhD thesis, Institute of Meteorology and Climate Research, Karlsruhe Institute of Technology, Karlsruhe, Germany, https://doi.org/10.5445/IR/1000076327, 2017.
Schmid, P. and Niyogi, D.: A method for estimating planetary boundary layer heights and its application over the ARM Southern Great Plains site, J. Atmos. Ocean. Tech., 29, 316–322, 2012.
Stein, A. F., Draxler, R. R., Rolph, G. D., Stunder, B. J. B., Cohen, M. D., and Ngan, F.: NOAA's HYSPLIT atmospheric transport and dispersion modeling system, B. Am. Meteorol. Soc., 96, 2059–2077, 2015.
Stopelli, E., Conen, F., Morris, C. E., Herrmann, E., Bukowiecki, N., and Alewell, C.: Ice nucleation active particles are efficiently removed by precipitating clouds, Sci. Rep.-UK, 5, 16433, https://doi.org/10.1038/srep16433, 2015.
Tokay, A., Wolff, D. B., and Petersen, W. A.: Evaluation of the new version of the laser-optical disdrometer, OTT Parsivel2, J. Atmos. Ocean. Tech., 31, 1276–1288, 2014.
Vaid, B. H. and San Liang, X.: Tropospheric temperature gradient and its relation to the South and East Asian precipitation variability, Meteorol. Atmos. Phys., 127, 579–585, 2015.
Vali, G.: Ice nucleation relevant to formation of hail, Stormy Weather Group, PhD thesis, McGill University, Montreal, Quebec, Canada, available at https://central.bac-lac.gc.ca/.item?id=TC-QMM-73746&op=pdf&app=Library&oclc_number=894992919 (last access: 21 December 2020), 1968.
Vali, G.: Quantitative evaluation of experimental results on the heterogeneous freezing nucleation of supercooled liquids, J. Atmos. Sci., 28, 402–409, 1971.
Vali, G., DeMott, P. J., Möhler, O., and Whale, T. F.: Technical Note: A proposal for ice nucleation terminology, Atmos. Chem. Phys., 15, 10263–10270, https://doi.org/10.5194/acp-15-10263-2015, 2015.
Van den Heever, S. C., Carrió, G. G., Cotton, W. R., DeMott, P. J., and Prenni, A. J.: Impacts of nucleating aerosol on Florida storms. Part I: Mesoscale simulations, J. Atmos. Sci., 63, 1752–1775, 2006.
Van de Water, P. K., Keever, T., Main, C. E., and Levetin, E.: An assessment of predictive forecasting of Juniperus ashei pollen movement in the Southern Great Plains, USA, Int. J. Biometeorol., 48, 74–82, 2003.
Vergara-Temprado, J., Miltenberger, A. K., Furtado, K., Grosvenor, D. P., Shipway, B. J., Hill, A. A., Wilkinson, J. M., Field, P. R., Murray, B. J., and Carslaw, K. S.: Strong control of Southern Ocean cloud reflectivity by ice-nucleating particles, P. Natl. Acad. Sci. USA, 115, 2687–2692, 2018.
Von Essen, S. G. and Auvermann, B. W.: Health effects from breathing air near CAFOs for feeder cattle or hogs, J. Agromed., 10, 55–64, 2005.
Wang, B., Harder, T. H., Kelly, S. T., Piens, D. S., China, S., Kovarik, L., Keiluweit, M., Arey, B. W., Gilles, M. K., and Laskin, A.: Airborne soil organic particles generated by precipitation, Nat. Geosci., 9, 433–437, 2016.
Weinzierl, B., Ansmann, A., Prospero, J. M., Althausen, D., Benker, N., Chouza, F., Dollner, M., Farrell, D., Fomba, W. K., Freudenthaler, V., and Gasteiger, J.: The saharan aerosol long-range transport and aerosol-cloud-interaction experiment: Overview and selected highlights, B. Am. Meteorol. Soc., 98, 1427–1451, 2017.
Westbrook, C. D. and Illingworth, A. J.: Evidence that ice forms primarily in supercooled liquid clouds at temperatures > −27 ∘C, Geophys. Res. Lett., 38, L14808, https://doi.org/10.1029/2011GL048021, 2011.
Whale, T. F., Holden, M. A., Wilson, T. W., O'Sullivan, D., and Murray, B. J.: The enhancement and suppression of immersion mode heterogeneous ice-nucleation by solutes, Chem. Sci., 9, 4142–4151, https://doi.org/10.1039/C7SC05421A, 2018.
Woo, C. and Yamamoto, N.: Falling bacterial communities from the atmosphere, Environ. Microbio., 15, 22, https://doi.org/10.1186/s40793-020-00369-4, 2020.
Yang, H., Xiao, H., and Guo, C.: Effects of Aerosols as Ice Nuclei on the Dynamics, Microphysics and Precipitation of Severe Storm Clouds, Atmosphere, 10, 783, https://doi.org/10.3390/atmos10120783, 2019.
Zhang, G. F., Sun, J. Z., and Brandes, E. I. A.: Improving parameterization of rain microphysics with disdrometer and radar observations, J. Atmos. Sci., 63, 1273–1290, 2006.
Zhao, B., Wang, Y., Gu, Y., Liou, K.-N., Jiang, J. H., Fan, J., Liu, X., Huang, L., and Yung, Y. L.: Ice nucleation by aerosols from anthropogenic pollution, Nat. Geosci., 12, 602–607, 2019.
Zhu, P., Albrecht, B., and Gottschalck, J.: Formation and development of nocturnal boundary layer clouds over the southern Great Plains, J. Atmos. Sci., 58, 1409–1426, 2001.