the Creative Commons Attribution 4.0 License.
the Creative Commons Attribution 4.0 License.
 | 23 Mar 2021
Aerosol impacts on warm-cloud microphysics and drizzle in a moderately polluted environment
Ying-Chieh Chen
Qilong Min
Pay-Liam Lin
Neng-Huei Lin
Kao-Shan Chung
Everette Joseph
Climate is critically affected by aerosols, which alter cloud lifecycles and precipitation distribution through radiative and microphysical effects. In this study, aerosol and cloud property datasets from MODIS (Moderate Resolution Imaging Spectroradiometer), onboard the Aqua satellite, and surface observations, including aerosol concentrations, raindrop size distribution, and meteorological parameters, were used to statistically quantify the effects of aerosols on low-level warm-cloud microphysics and drizzle over northern Taiwan during multiple fall seasons (from 15 October to 30 November of 2005–2017). Our results indicated that northwestern Taiwan, which has several densely populated cities, is dominated by low-level clouds (e.g., warm, thin, and broken clouds) during the fall season. The observed effects of aerosols on warm clouds indicated aerosol indirect effects (i.e., increased aerosol loading caused a decrease in cloud effective radius (CER)), an increase in cloud optical thickness, an increase in cloud fraction, and a decrease in cloud-top temperature under a fixed cloud water path. Quantitatively, aerosol–cloud interactions (, changes in CER relative to changes in aerosol amounts) were 0.07 for our research domain and varied between 0.09 and 0.06 in the surrounding remote (i.e., ocean) and polluted (i.e., land) areas, respectively, indicating aerosol indirect effects were stronger in the remote area. From the raindrop size distribution analysis, high aerosol loading resulted in a decreased frequency of drizzle events, redistribution of cloud water to more numerous and smaller droplets, and reduced collision–coalescence rates. However, during light rain (≤1 mm h−1), high aerosol concentrations drove raindrops towards smaller droplet sizes and increased the appearance of drizzle drops. This study used long-term surface and satellite data to determine aerosol variations in northern Taiwan, effects on clouds and precipitation, and observational strategies for future research on aerosol–cloud–precipitation interactions.
- Article
(8769 KB) - Full-text XML
- BibTeX
- EndNote


Since the industrial revolution, the quantity of aerosols produced by human activities has increased significantly, with the strongest aerosol emissions from areas with frequent industrial activities or high biomass burning (Textor et al., 2006). The effect of aerosols on climate is recognized as significant (Charlson et al., 1992; Kiehl and Briegleb, 1993; Penner et al., 2001; Ramanathan et al., 2001; Ramaswamy et al., 2001) albeit complex. Aerosols can alter cloud properties with subsequent impacts on climate, i.e., aerosol indirect effect (Warner and Twomey, 1967; Twomey, 1974; Albrecht, 1989; Lohmann and Feichter, 2005). The responses of convective and boundary layer clouds contribute to the spread of global cloud feedbacks in general circulation models (GCMs), which dominate the inter-model differences (Bony et al., 2006). Furthermore, studies have demonstrated that GCMs significantly overestimate the frequency of drizzle (Stephens et al., 2010), which brings into question the accuracy of aerosol–cloud interactions (ACIs) in models. Therefore, observational studies of aerosol and cloud microphysical properties are crucial for clarifying the relationship between aerosols and the microphysical process of clouds and evaluating the accuracy of model simulations.
Jones et al. (2009) emphasized that ACIs should be explored at the regional scale because the aerosol type, concentration, and meteorological conditions differ depending on the area. Numerous studies have used the aerosol concentration and cloud droplet size to investigate ACIs at global or regional scales. A negative correlation between aerosols and cloud drop size has been observed in global- (Bréon et al., 2002; Myhre et al., 2007; Nakajima et al., 2001) and regional-scale (Costantino and Bréon, 2010; Ou et al., 2012) studies. Sekiguchi et al. (2003) and Grandey and Stier (2010) have used global satellite data and identified different correlations (positive, negative, or weak) between aerosol optical depth (AOD) and cloud effective radius (CER) depending on the location of the observation. Likewise, Twohy et al. (2009) and Christensen et al. (2017) reported spurious correlations between AOD and cloud properties using in situ aircraft and satellite data. Despite advances in satellite-based retrievals in recent decades, obtaining robust statistical relationships between aerosols and clouds is difficult using only satellite-based observations (Christensen et al., 2017).
Nevertheless, some effects from aerosols on cloud microphysics can be observed using satellite data (Krüger and Graßl, 2002; Menon et al., 2008; Rosenfeld et al., 2014; Saponaro et al., 2017; Sporre et al., 2014). With satellite-based precipitation observations from the Tropical Rainfall Measuring Mission (TRMM), Rosenfeld (1999) demonstrated that aerosols derived from biomass burning suppress warm rain processes. Aircraft observations over the Amazon basin demonstrated decreased in-cloud droplet sizes and a delay in precipitation onset when a large quantity of aerosols entered the cloud (Andreae et al., 2004). The effects of aerosols in suppressing drizzle have been identified in field experiments on stratocumulus clouds over the northeastern Atlantic Ocean (Albrecht et al., 1995; Wood, 2005), northeastern Pacific Ocean (Lu et al., 2007, 2009; Stevens et al., 2003; VanZanten et al., 2005), and southeastern Pacific Ocean (Bretherton et al., 2010; Comstock et al., 2004; Wood et al., 2011). Moreover, model simulations have revealed that polluted environments could suppress drizzle in warm clouds (Ackerman et al., 2004; Guo et al., 2011; H. Wang et al., 2011; M. Wang et al., 2011). Although numerous studies have used observations and model simulations to discuss the indirect effects of aerosols, the interaction mechanism between aerosols and clouds remains weakly constrained (Bellouin et al., 2020) in the global climate system.
Huang et al. (2007) used a regional coupled climate–chemical–aerosol model for East Asia and determined that the aerosol indirect effect significantly reduced precipitation in fall and winter. Menon et al. (2002) used a global climate model to study the effects of aerosols in China and India and reported that anthropogenic aerosols increased precipitation in southeastern China but inhibited precipitation in northeastern China. Furthermore, Giorgi et al. (2003), using a coupled regional chemistry–climate model, found that aerosol indirect effects were largely dominant over direct effects in inhibiting precipitation in East Asian climates. Takemura et al. (2005) used a global aerosol transport-radiation model coupled to a general circulation model and determined that the indirect effect had a strong signal in regions with large quantities of anthropogenic aerosols and cloud water.
These studies have demonstrated a significant correlation between aerosols and cloud microphysics and the indirect effect of aerosols on regional precipitation. However, the aerosol type, concentration, and characteristics vary by region. Moreover, the uncertainty on radiative forcing, especially via the impact from clouds, remains large in Earth's radiation budget (Bellouin et al., 2020). Taiwan is an island with a high population density, a complicated topography, and a climate that ranges from tropical in the south to subtropical in the north. These characteristics result in substantially complex microphysical processes between aerosols and clouds. In this study, we aimed to systematically analyze aerosols, cloud optical properties, and precipitation characteristics by integrating satellite and surface observation data over northern Taiwan to investigate the following questions. (1) How do aerosols affect cloud microphysical properties in response to different pollution conditions? (2) How do aerosols affect the frequency of drizzle and the change in precipitation distribution? In Sect. 2, we describe the data and methodology. In Sect. 3, we present results and the discussion. Findings are summarized in Sect. 4.
2.1 Study area and time period
Our study domain, northern Taiwan, covers the area 24.5–25.8∘ N and 120.8–122.2∘ E (Fig. 1) and has a population of approximately 10 million. The emissions of this area are considered a combination of urban and industrial activities. For this area, air quality worsens in fall when precipitation is less and air masses stagnate. Moreover, the results of Huang et al. (2007) indicated that aerosol indirect effects frequently occur in fall. Therefore, we chose the data period from 15 October to 30 November between 2005 and 2017 (611 d in total) to explore aerosol effects on cloud microphysics and drizzle. To remove the effect of typhoons from the analysis, typhoon alarm days (21–23 October 2010, Typhoon Megi) issued by the Central Weather Bureau were excluded in this study.
2.2 Surface measurement data
Hourly meteorological (i.e., temperature, relative humidity, rainfall, wind direction, and wind speed) and PM2.5 concentration data collected from the Taiwan EPA (Environmental Protection Administration) Pingzhen site (24.95∘ N, 121.20∘ E) and 1 min raindrop size distribution Joss–Waldvogel disdrometer (JWD) data obtained from the National Central University (NCU) (24.968∘ N, 121.185∘ E) observatory were used. The NCU and EPA Pingzhen sites are located near each other at the center of the study domain. The PM2.5 concentration was measured using the MetOne BAM-1020 beta attenuation monitor. The JWD measures the number of rain droplets every minute by using 20 bin sizes of 0.359–5.373 mm (n1–n20: 0.359, 0.455, 0.551, 0.656, 0.771, 0.913, 1.116, 1.331, 1.506, 1.665, 1.912, 2.259, 2.584, 2.869, 3.198, 3.544, 3.916, 4.350, 4.859, and 5.373 mm). To ensure data quality, observations were discarded when the rain rate was lower than 0.1 mm h−1 (Greenberg, 2001; Seela et al., 2017).
2.3 Satellite data
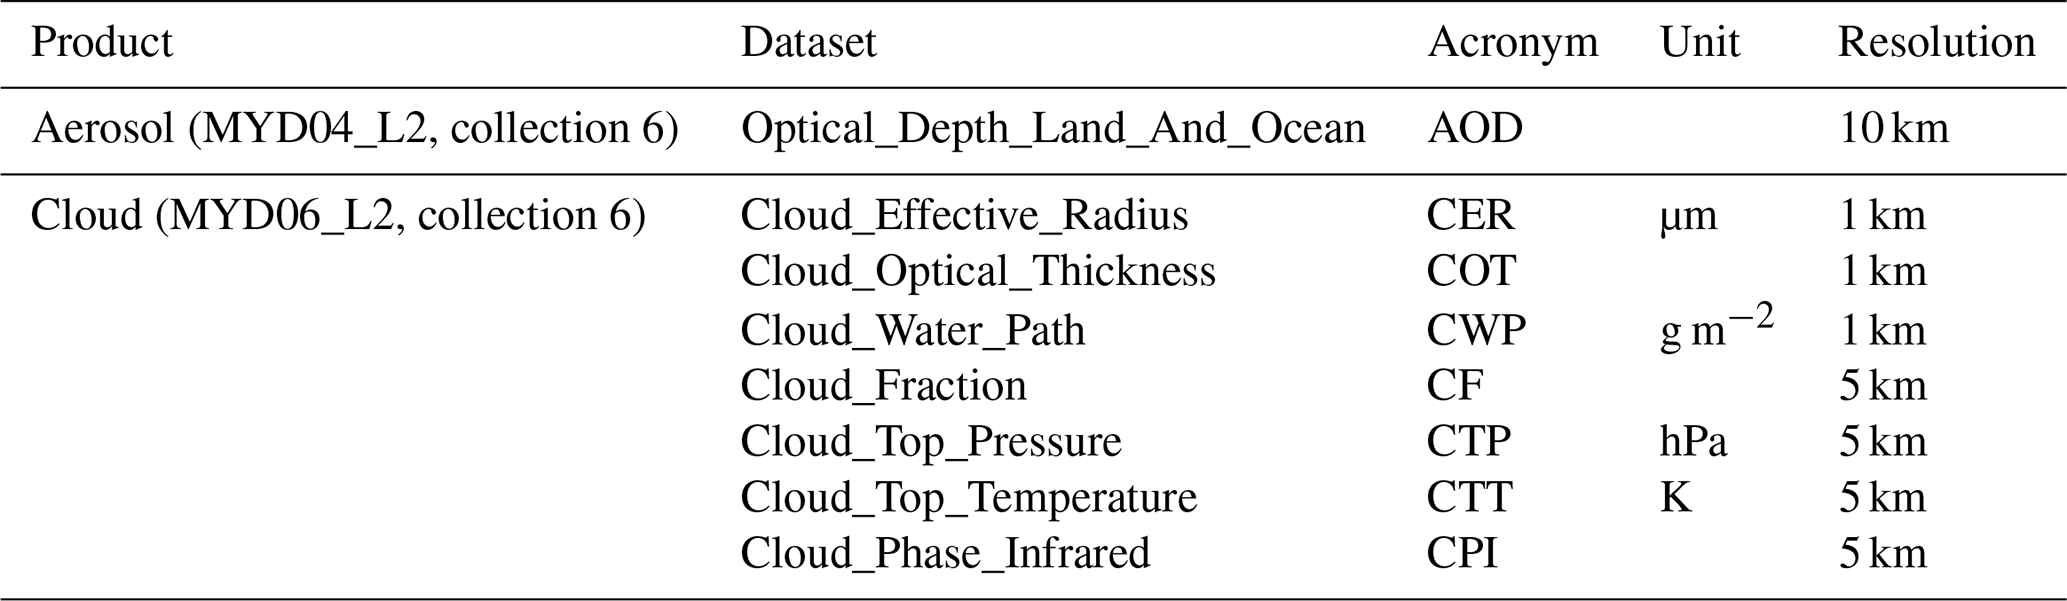
Cloud and aerosol data from the NASA Aqua satellite, Moderate Resolution Imaging Spectroradiometer (MODIS) collection 6 level 2 products (MYD06 for clouds and MYD04 for aerosols), were used in this study. Data were downloaded from https://modis.gsfc.nasa.gov/data/ (last access: 22 February 2021). Data on cloud properties included cloud optical thickness (COT), CER, and cloud water path (CWP), all of which had a resolution of 1 km, as well as cloud fraction (CF), cloud-top pressure (CTP), cloud-top temperature (CTT), and cloud phase infrared (CPI), all of which had a resolution of 5 km. CWP included the liquid water path and ice water path (). For aerosol data, AOD with a resolution of 10 km was used. Descriptions of parameters and products are presented in Table 1. To ensure spatial resolution consistency between datasets, data were interpolated to a coarse resolution of .
2.4 Data screening and grouping
Satellite aerosol data were not retrieved when conditions were overcast, except when aerosols were above clouds. To compensate for this limitation, densely available surface PM2.5 data in the study domain were used. The composition of PM2.5 in East Asia is usually dominated by carbonaceous species and water soluble ions, including , , and (Xu et al., 2012), which are important in determining the hygroscopicity of aerosols (Shen et al., 2009). Thus, based on these suitable characteristics and the lack of measured CCN (cloud condensation nuclei) in this study, we used PM2.5 as a proxy for CCN concentrations. The spatial homogeneity of PM2.5 concentrations was examined based on the correlation of concentrations between the Pingzhen site and the 30 air quality monitoring sites in the northern Taiwan. Results indicated that correlation coefficients were higher than 0.6 and 0.8 for northern Taiwan and the research area (24.6–25.2∘ N and 120.9–121.5∘ E), respectively, demonstrating that PM2.5 data from the Pingzhen site accurately represented the aerosol concentration over our research domain (Fig. 1).

Figure 1Spatial correlation coefficient of the PM2.5 concentration between the Pingzhen station and other stations. The main research area (24.6–25.2∘ N, 120.9–121.5∘ E) is indicated with a magenta box.
Fine particles were assumed well-mixed throughout the planetary boundary layer (PBL) during daytime (Maletto et al., 2003). PM2.5 data between 10:00 and 14:00 were averaged as a measure of daily PM2.5 concentrations for comparison with Aqua satellite data (overpass time is approximately 13:30 local time). Furthermore, the 20th percentile of daily average PM2.5 data (≤11.2 µg m−3) was defined as clean days (n=123 d). The 80th percentile of daily average PM2.5 data (≥34.6 µg m−3) was defined as polluted days (n=121 d). Polluted days were further divided into three groups: slightly polluted (40 d), moderately polluted (40 d), and heavily polluted (41 d) with PM2.5 concentrations of 34.6–39.9, 39.9–52.3, and 52.3–110 µg m−3, respectively.
A previous study reported that the vertical aerosol distribution for the study region in fall primarily resided within 2 km (Wang et al., 2010). For ACI at a local scale, clouds that occurred below 2 km were targeted. Therefore, only clouds with CTP≥800 hPa and CPI=1 (water cloud) were included, thereby ensuring that only warm clouds were analyzed.
To quantify ACI, the commonly used formula proposed by Feingold et al. (2001) was employed, as illustrated in Eq. (1). This equation calculates how a change in aerosols affects CER at a constant CWP.
where α represents the proxy for the quantity of aerosols, using either PM2.5 or AOD values. Positive ACI values indicate that a change in CER depends on increased aerosols and vice versa. An ACI value approaching 0 indicates that the relationship between CER and aerosols (i.e., aerosol indirect effect) is not significant. The ACI calculation should be performed under a fixed range of CWP in Eq. (1). Therefore, the CWP population density distribution was divided into 10 groups (Fig. 2), with each group representing 10 % of CWP data.
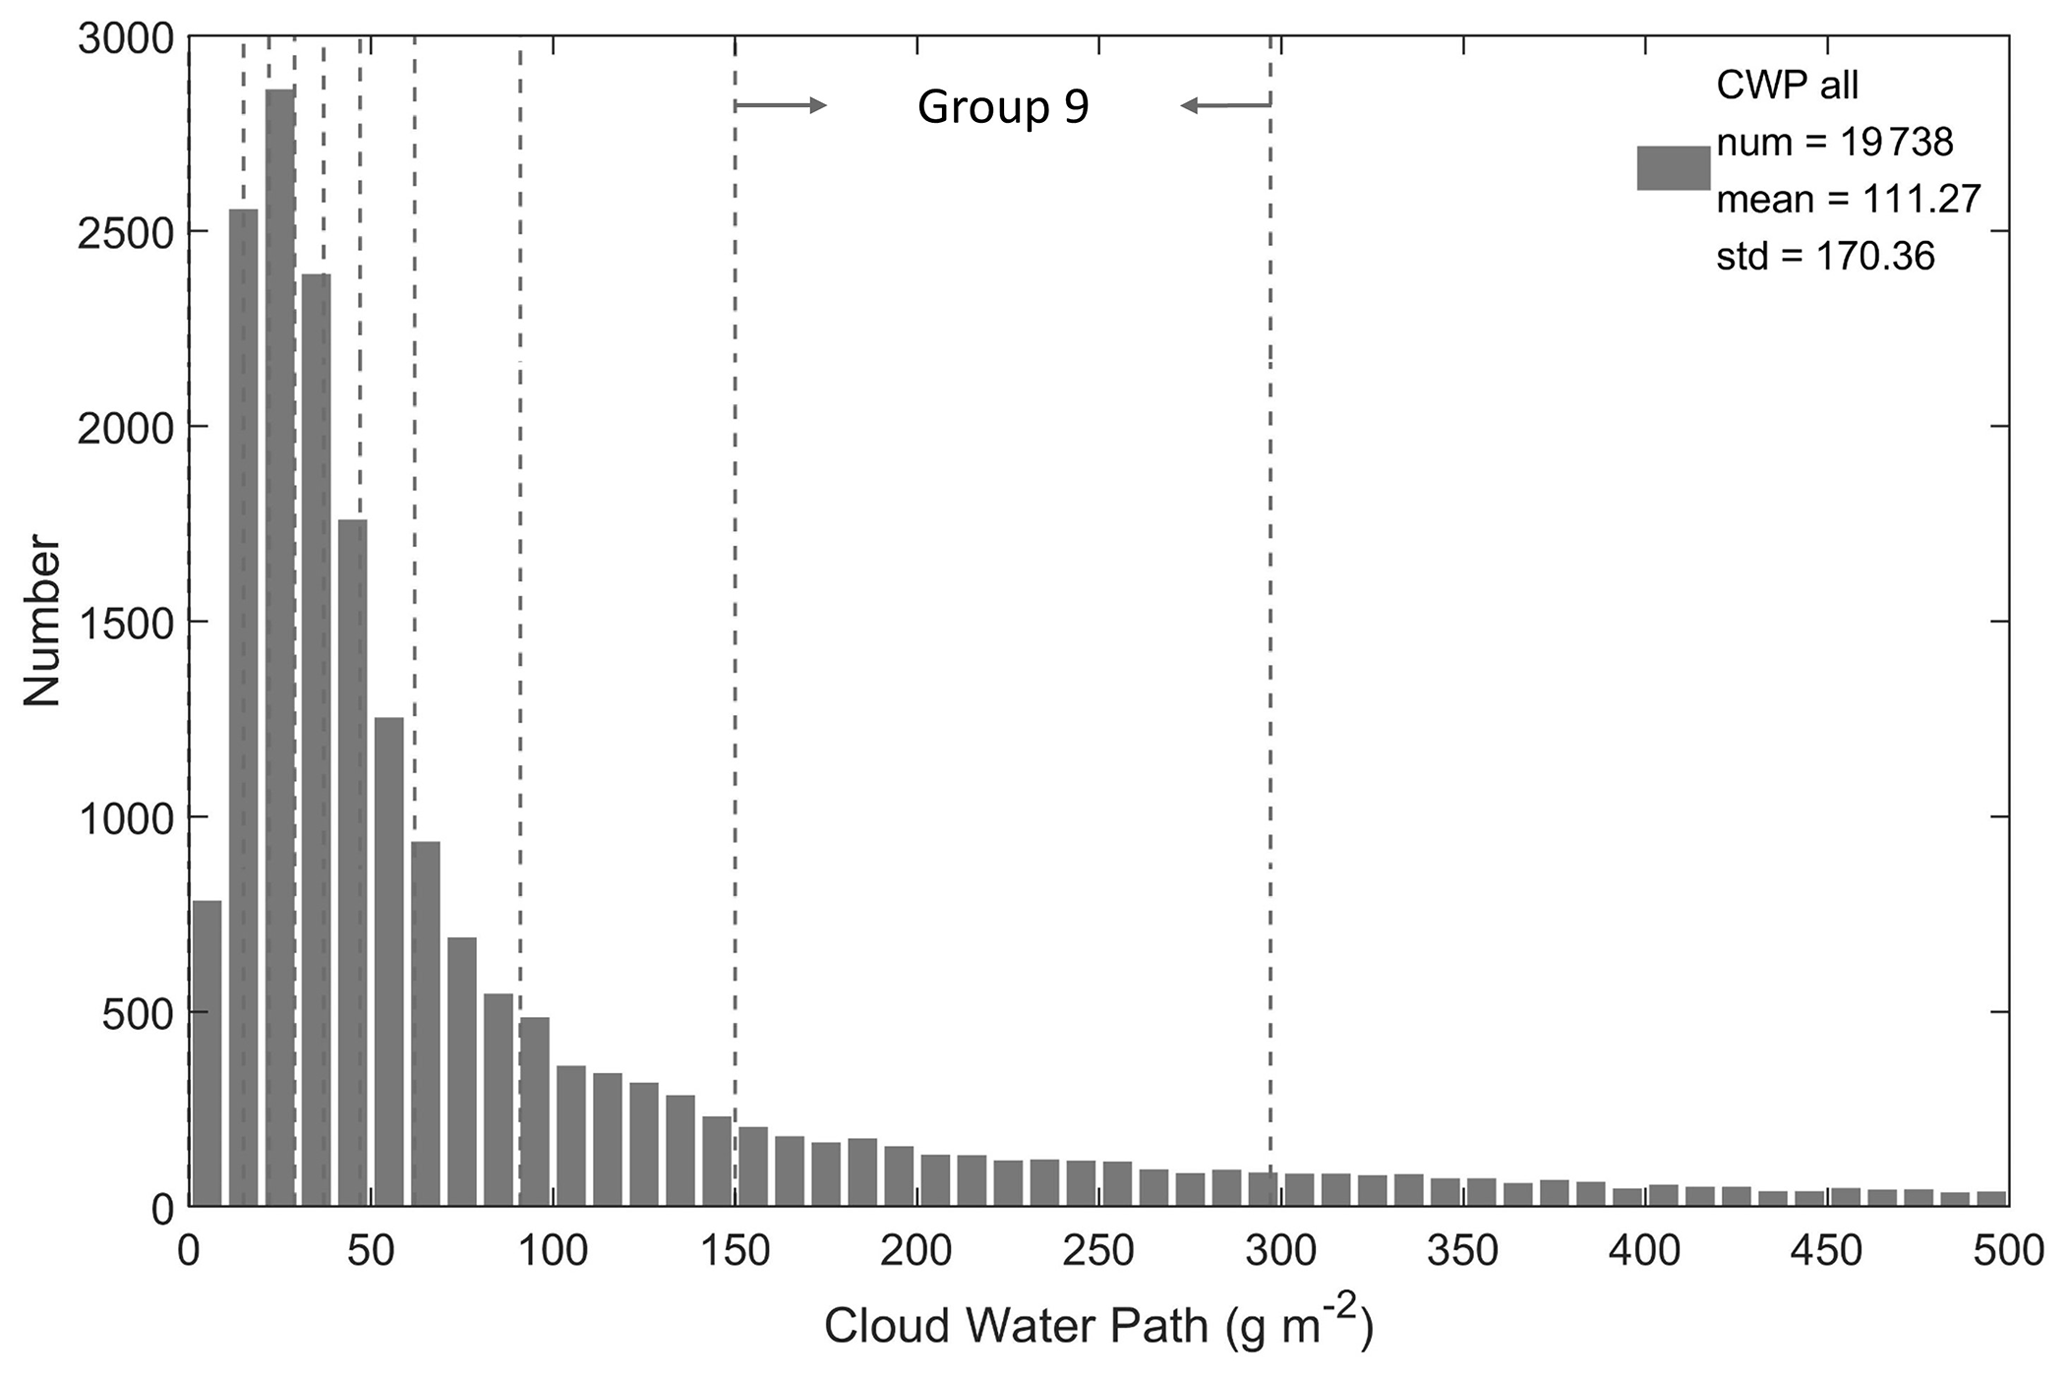
Figure 2Histogram of cloud water path (CWP) values over northern Taiwan from 15 October to 30 November 2005–2017. CWP is divided into 10 bins (10 % for each bin) indicated by dashed lines. The key CWP group 9 () is marked in the figure. num: number; mean: mean; std: standard deviation.
Data on the raindrop size distribution obtained from JWD were further processed. The daily rainfall amount was defined as the sum of precipitation from 10:00 to the next day at 10:00. The American Meteorological Society's Glossary of Meteorology (Huschke, 1959) defines drizzle as very small, numerous, and uniformly dispersed water drops that may appear to float in currents. In contrast to fog droplets, drizzle falls to the ground. In weather observations, drizzle is classified as (a) “very light”, comprised of scattered drops that do not entirely wet an exposed surface regardless of the duration; (b) “light”, the rate of fall being traced to 0.25 mm h−1; (c) “moderate”, the rate of fall being 0.25–0.50 mm h−1; and (d) “heavy”, the rate of fall exceeding 0.5 mm h−1. When the precipitation equals or exceeds 1 mm h−1, all or part of the precipitation is considered rain. The threshold for rain intensity was set at 1 mm h−1 to focus on the effect of aerosols on drizzle. Drizzle drops are conventionally 0.5 mm or less in diameter; therefore, JWD data in the n1 (0.359 mm) and n2 (0.455 mm) channels were summarized as drizzle precipitation.
3.1 Overall aerosol, cloud, and meteorological characteristics
To explore the effect of aerosols on cloud microphysics and the subsequent precipitation, a general understanding of aerosol quantities, cloud microphysics, and precipitation characteristics over the study region is crucial. Figure 3 illustrates the spatial distribution of mean aerosol and cloud parameter values (including AOD, COT, CWP, CF, CER, and CTP) over northern Taiwan from 15 October to 30 November 2005–2017. The mean AOD reached 0.6 in northwestern Taiwan because of the high density of human activities, whereas lower AOD values (less than 0.2) were observed over the Xueshan mountain range (the green triangle in Fig. 3a).

Figure 3Average (a) aerosol optical depth (AOD), (b) cloud optical thickness (COT), (c) cloud water path (CWP), (d) cloud fraction (CF), (e) cloud effective radius (CER), and (f) cloud-top pressure (CTP) in warm clouds from 15 October to 30 November 2005–2017. The magenta box represents the main study area (24.6–25.2∘ N, 120.9–121.5∘ E), and the blue box in (a) is the remote area (25.2–25.8∘ N, 120.9–121.5∘ E). The green triangles in (a) mark the location of the Xueshan mountain range. The topography of northern Taiwan is depicted with brown-colored contour lines (in meter) in (b–f).
Clouds were affected by the prevailing northeastern wind and topography, resulting in higher top heights and more significant coverage for clouds over northeastern Taiwan compared with northwestern Taiwan. The mean CWP, CF, and CER in our study area ranged from 60 to 120 g m−2, 0.6 to 0.7, and 13 to 14.5 µm, respectively. COT was usually around 10, and most of the CTP was higher than 850 hPa, suggesting low-level clouds (e.g., warm, thin, and broken clouds).
Surface PM2.5 concentrations and meteorological parameters for clean and polluted days were also analyzed. We collected 1189 h of rainfall data out of approximately 14 000 total hours of meteorological data. The mean values of temperature, relative humidity, rainfall, wind speed, and PM2.5 concentrations were 22.3∘, 74.9 %, 1.4 mm h−1, 3.2 m s−1, and 23.4 µg m−3, respectively (illustrated in Fig. 4). The prevailing wind direction was northeastern. During clean days, the aforementioned mean values were 22.2∘, 79.3 %, 1.5 mm h−1, 3.6 m s−1, and 9.9 µg m−3, respectively, compared with the mean values of 22.5∘, 72.5 %, 1.4 mm h−1, 2.7 m s−1, and 43.3 µg m−3, respectively, on polluted days. Overall, compared with clean days, meteorological conditions on polluted days had lower relative humidity, less rainfall, more wind direction in addition to the northeastern wind, and lower wind speed. However, differences were not observed in mean rainfall rates between clean and polluted days. The number of rainfall hours differed significantly with 384 h during clean days and 115 h during polluted days. A weaker and more disorderly direction of the wind was observed on polluted days, which suggests that pollution may be associated with more stagnant conditions.
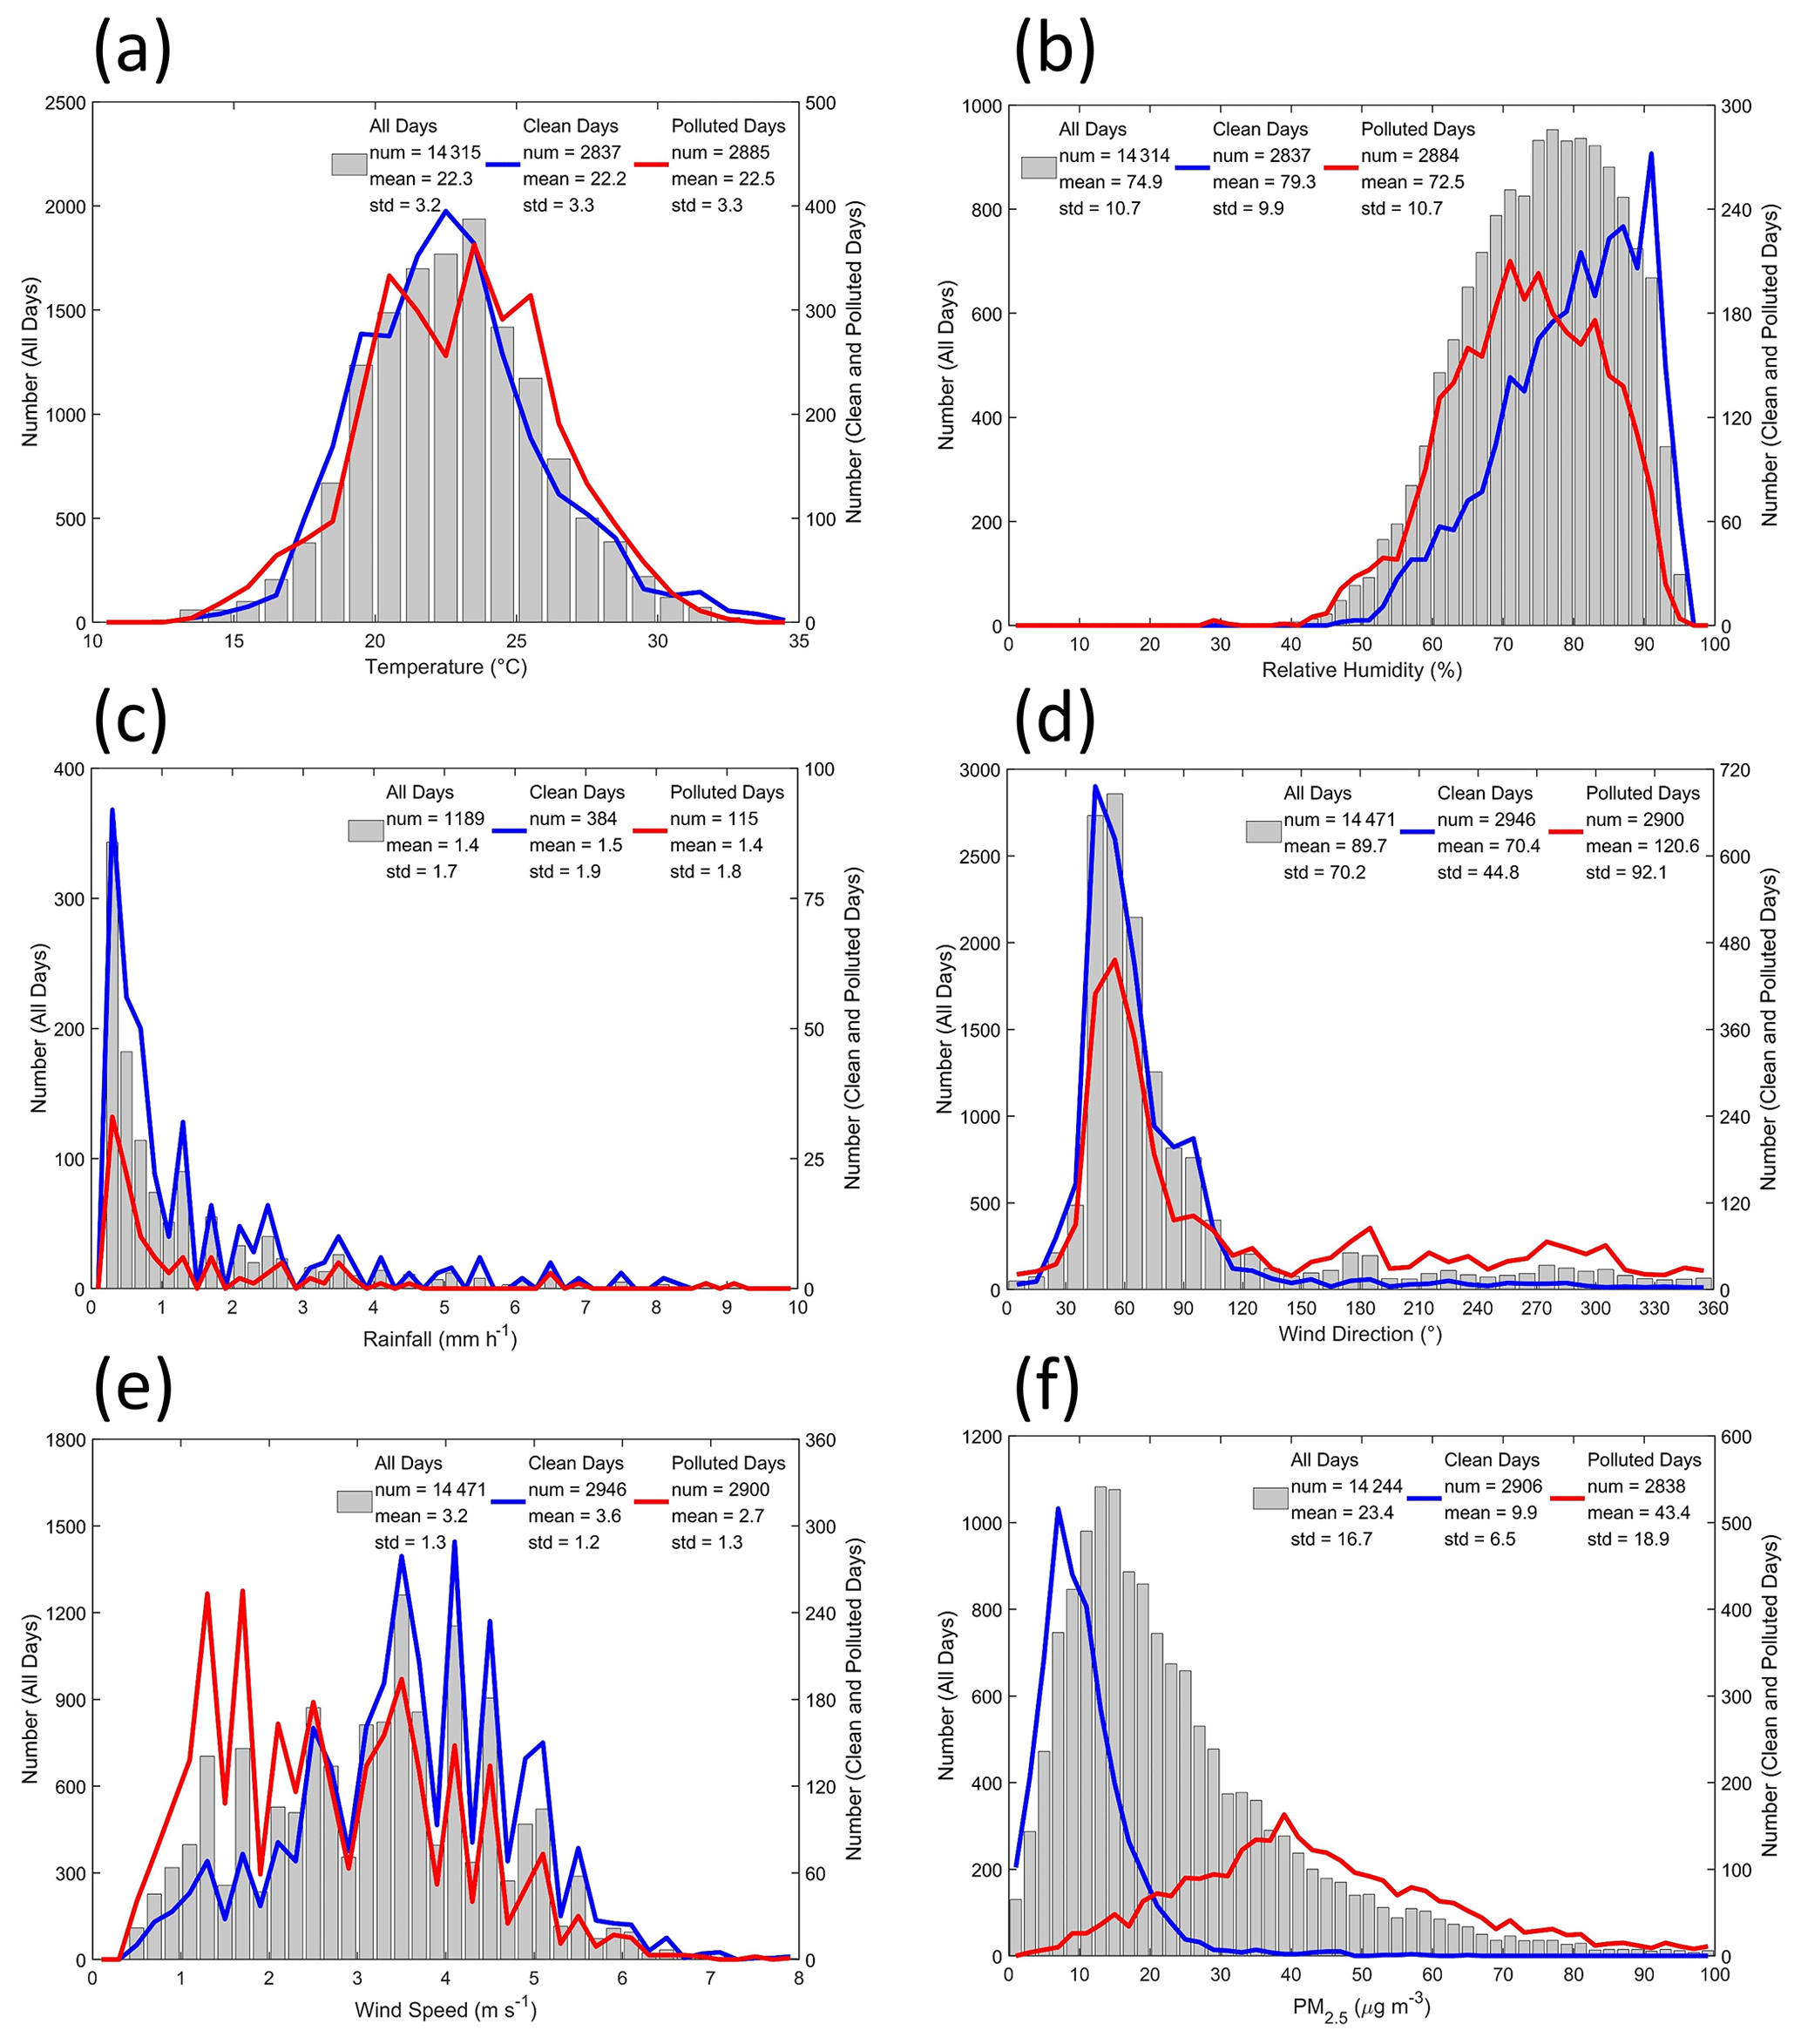
Figure 4The distribution of (a) temperature, (b) relative humidity, (c) rainfall, (d) wind direction, (e) wind speed, and (f) PM2.5 hourly data from the Pingzhen station from 15 October to 30 November 2005–2017. The gray bars are the distribution of all valid observations; the blue lines represent the clean days; and the red lines represent the polluted days. num: number; mean: mean; std: standard deviation.
CWP is a constraint factor for the ACI index calculation as illustrated in Eq. (1). We further examined CWP variability in response to main meteorological parameters (temperature, relative humidity, and rainfall) and PM2.5 concentrations from the Pingzhen site and CER from MODIS. We calculated the daily mean value of CWP and CER by averaging grids over the main research area (24.6–25.2∘ N, 120.9–121.5∘ E). Daily meteorological parameters and PM2.5 concentration data, described in Sect. 2.2, were used. Figure 5 illustrates the mean and standard deviation of PM2.5 and CER in 10 CWP groups. As CWP increased, the average temperature and relative humidity gradually decreased and increased, respectively. No significant correlation was identified between rainfall and CWP. The complicated relationship between PM2.5 and CWP is illustrated in Fig. 5. PM2.5 increased with an increase in CWP up to 50 g m−2 and then decreased, whereas CER increased at first before decreasing and then increasing again. The standard deviation of CWP in group 9 () was smaller than in other groups, indicating that group 9 was a more stable community; thus, much of the subsequent analysis focused on group 9 to reduce uncertainties caused by the variability of environmental conditions.
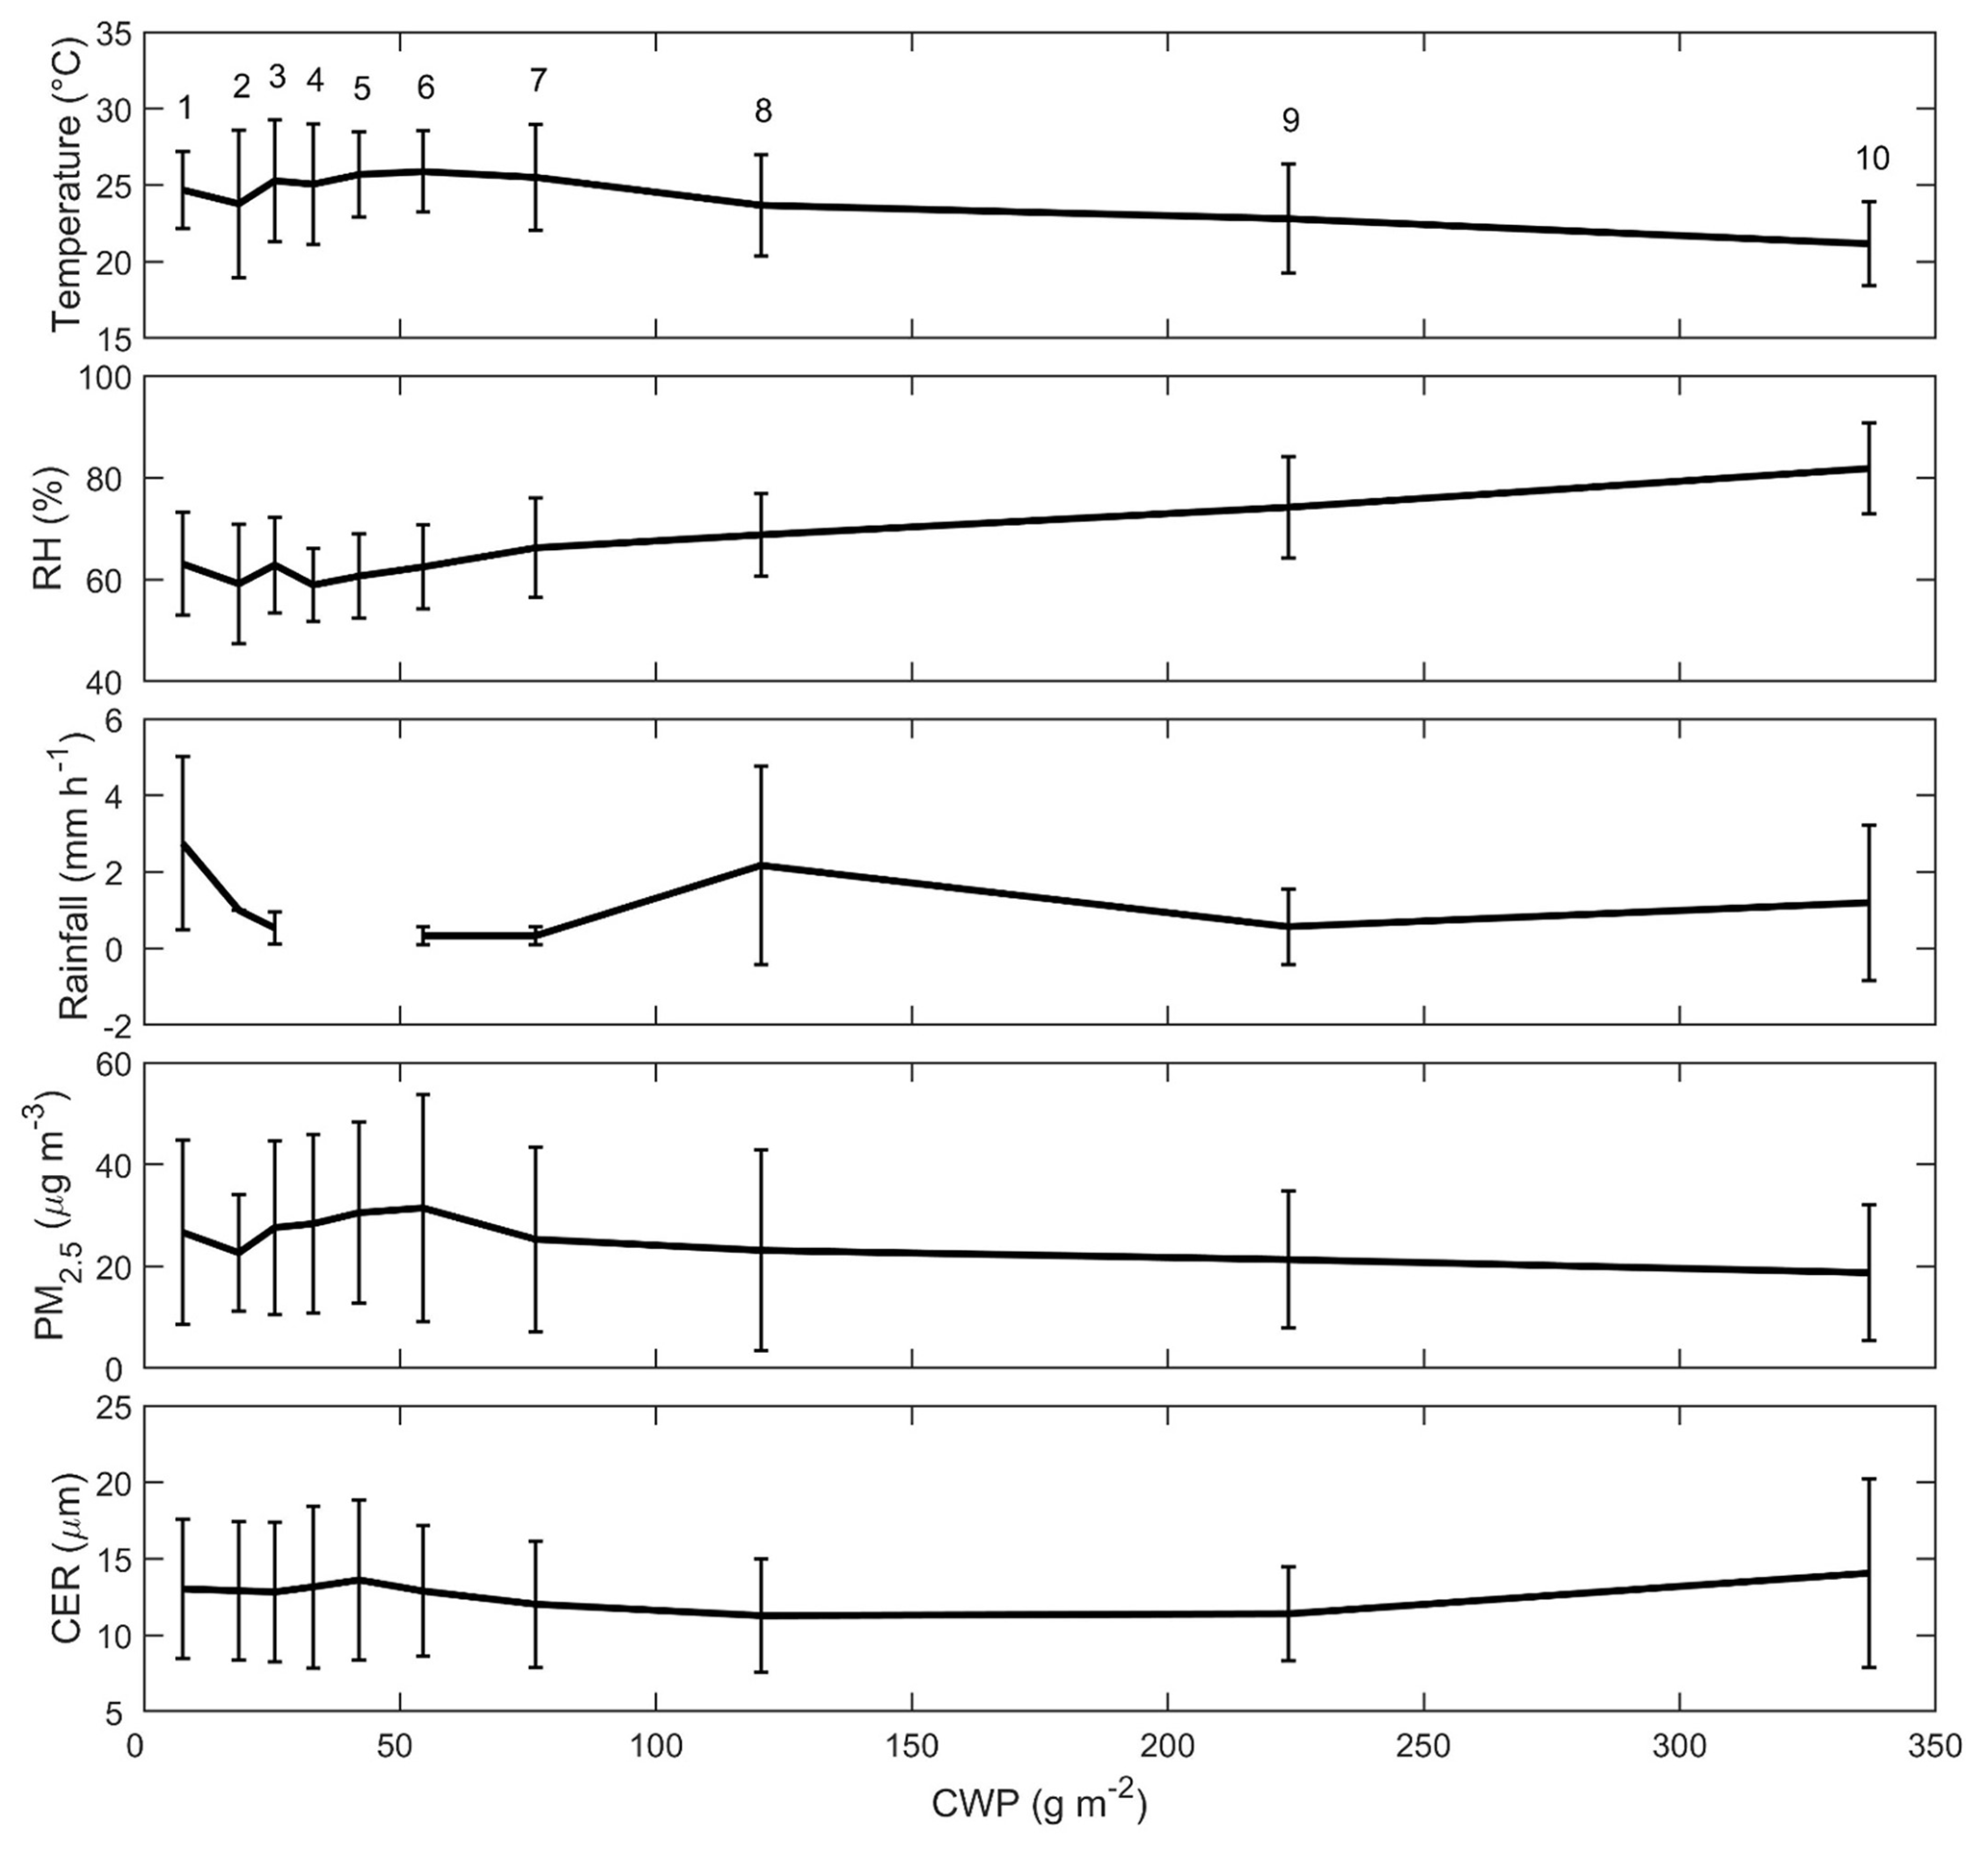
Figure 5Multiyear (2005–2017) mean and standard deviation of temperature, relative humidity (RH), rainfall, PM2.5, and cloud effective radius (CER) in different cloud water path (CWP) bins. The CWP group numbers are marked in the top panel.
3.2 Aerosol effect on warm-cloud properties
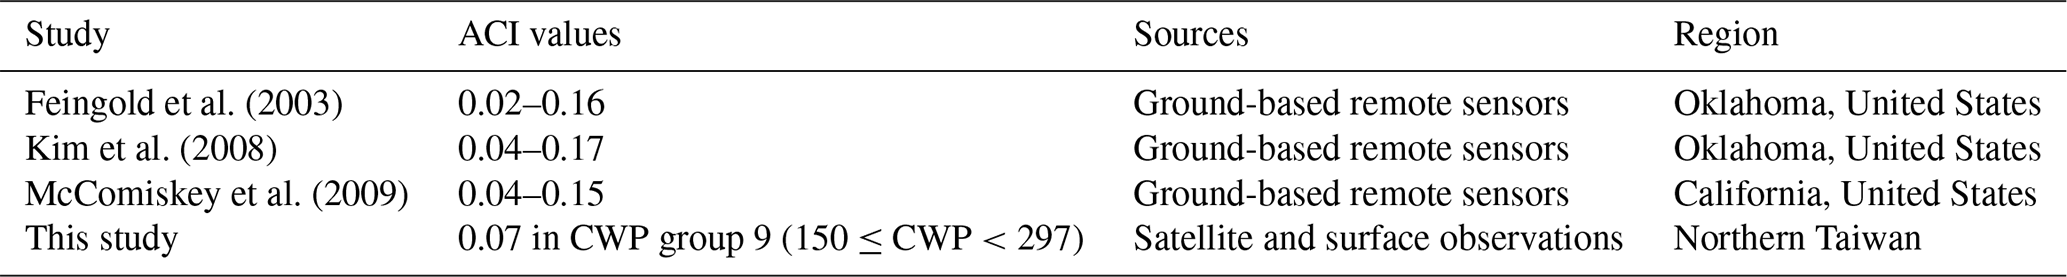
The effects of aerosols on warm-cloud microphysics in different CWP groups for the main research domain were studied using the ACI index (Eq. 1). Figure 6 illustrates the ACI values and correlation coefficient (r(ACI)) of the PM2.5 mass concentration and CER under different CWP groups. ACI was 0.07 in CWP group 9 () and had the lowest root mean square error (RMSE=0.23) compared with other groups. The correlation coefficient between PM2.5 and CER in group 9 was −0.19. Positive ACI values were observed when CWP was larger than CWP group 7 (i.e., CWP groups 8–10), and a higher value of ACI was associated with higher CWP groups. The negative correlation for these groups indicates an aerosol indirect effect (i.e., an increase in aerosols causes cloud droplet radii to become smaller under a fixed water content). Negative ACI values were associated with low-CWP groups (i.e., groups 1–7), which may be caused by the large standard deviation of CER data in CWP groups with lower values. However, these low-CWP groups may reduce the effects of aerosols on warm-cloud microphysics. We compared our results with values from the literature (Table 2). Feingold et al. (2003) analyzed ACIs by using ground-based remote sensors in Oklahoma, United States, focusing on ice-free, single-layered, nonprecipitating, and airborne-insect-free clouds. Their results indicated that under the same LWP, the ACI values of seven cases were 0.02–0.16. Kim et al. (2008) conducted a 3-year experiment by using ground-based remote sensors to investigate the aerosol indirect effect. Their results suggested that the ACI values of continental stratus clouds ranged from 0.04 to 0.17 in north-central Oklahoma. McComiskey et al. (2009) observed the ACI values of coastal stratiform clouds between 0.04 and 0.15 by using ground-based remote sensing data from the Atmospheric Radiation Measurement (ARM) program at Point Reyes, California, United States. Our findings were on the lower end of these ranges, likely due to the more polluted conditions in our East Asia study area.
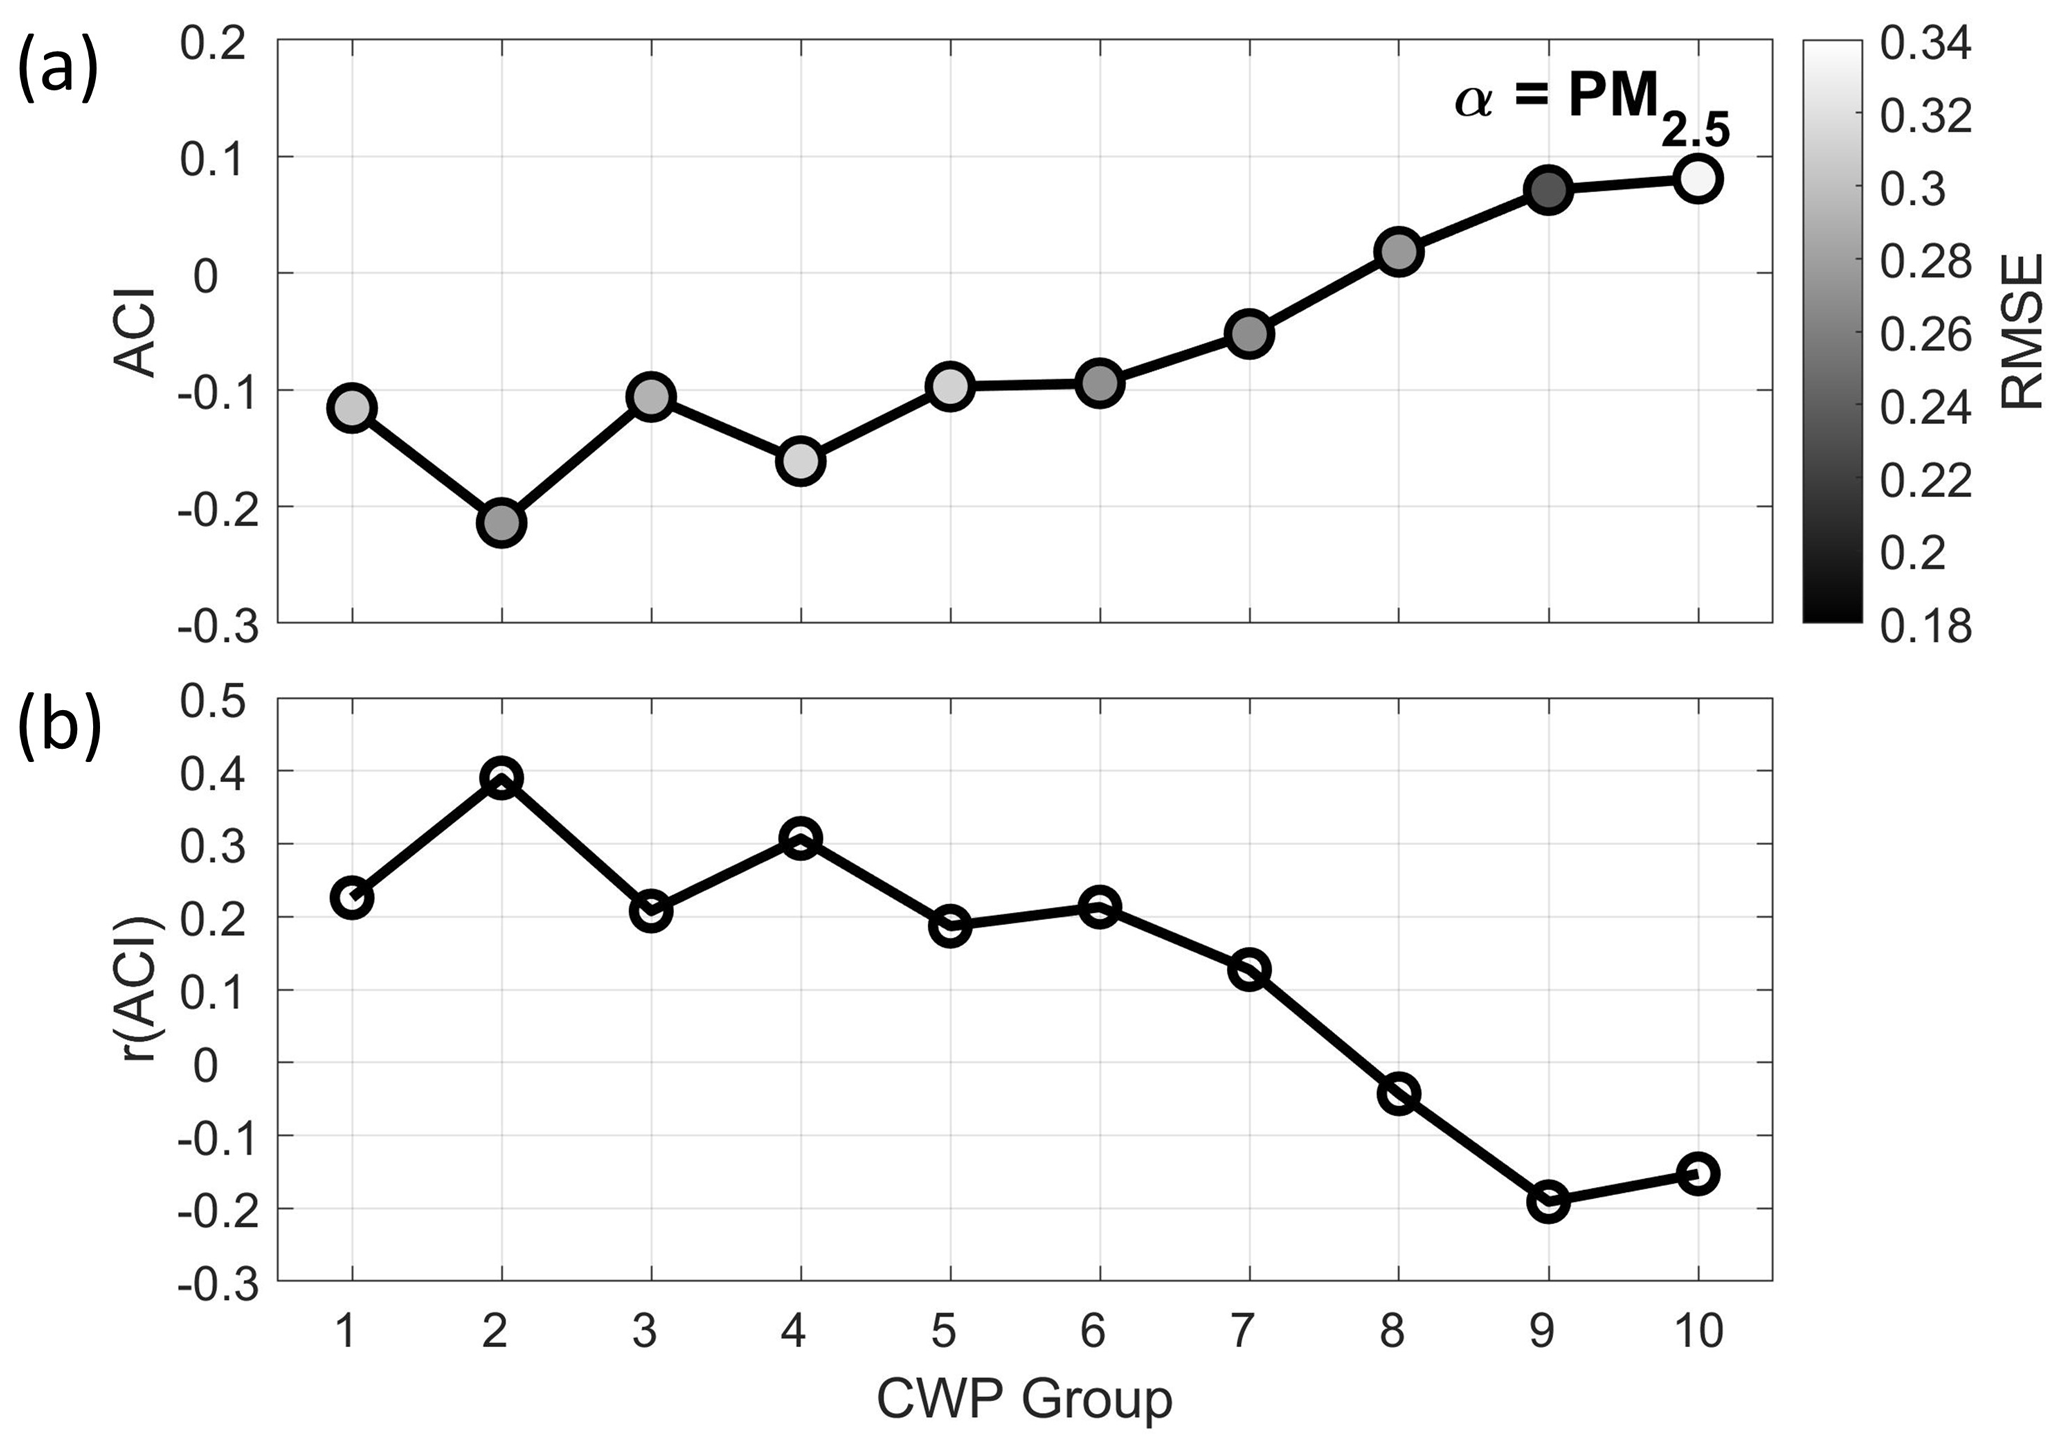
Figure 6(a) Aerosol–cloud interaction (ACI) estimated values, computed for the cloud effective radius (CER) in the different CWP groups by applying PM2.5 concentrations as aerosol proxies. The shading in (a) represents the RMSE. (b) The correlation coefficients between PM2.5 and CER are illustrated.
Table 2ACI values from the literature in comparison to this study.
Because of the distinct ACI signal in CWP group 9, we further explored the effect of aerosols on cloud microphysical parameters by analyzing their differences between polluted days and clean days over the main research area (24.6–25.2∘ N, 120.9–121.5∘ E). Compared with clean days, COT, CER, CF, and CTT exhibited changes of +9.53, −2.77 µm, +0.07, and −1.28 K on polluted days (Fig. 7). While the positive CF value difference may have been due to higher aerosol loading, the atmospheric condition may have contributed as well. For instance, Saponaro et al. (2017) showed that CF is more sensitive to lower-troposphere stability (LTS) than other cloud variables (i.e., CER, CTT, and COT). Also from Fig. 7, higher PM2.5 concentrations corresponded to smaller CER and CTT values and higher COT, in agreement with the aerosol indirect effect.
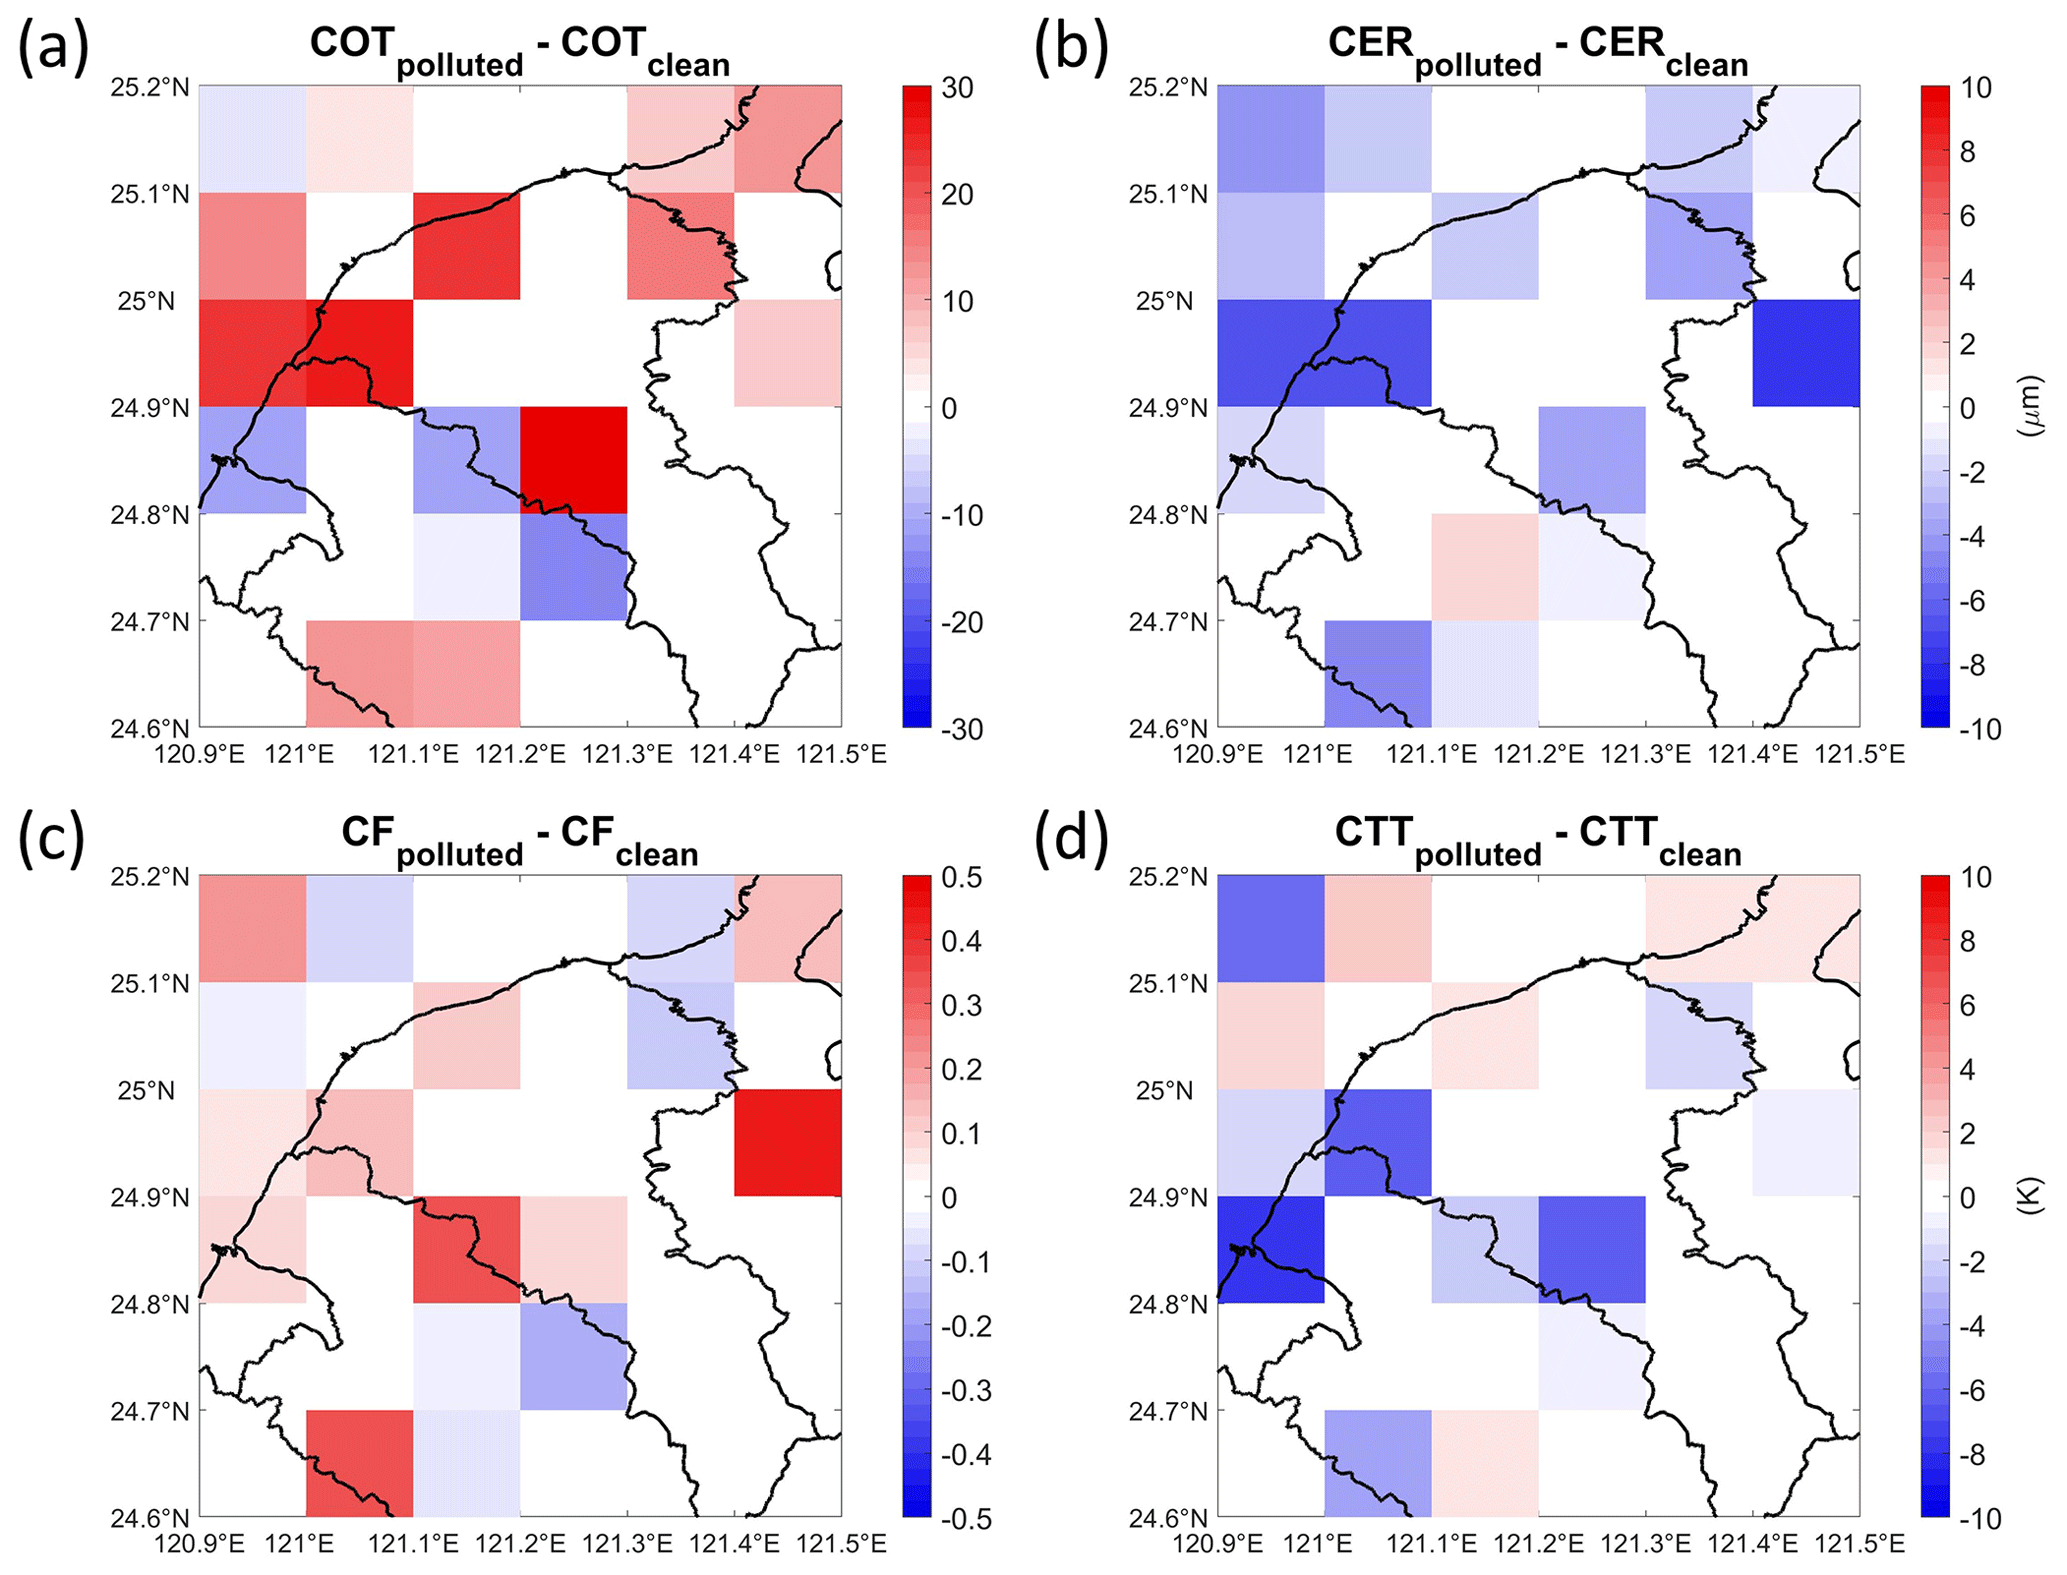
Figure 7Difference in (a) COT, (b) CER, (c) CF, and (d) CTT between polluted days and clean days in group 9 ().
The relationship between CTT and CER and aerosols was studied in further detail. Figure 8 displays CWP group 9 () results of the corresponding CTT–CER relationship and the occurrence frequency (%) of CTT on clean and polluted days. On clean days, the mean CER increased from 10.7 to 12.7 µm as CTT decreased from 291 to 279 K, indicating an inverse relationship over much of the CTT range. This phenomenon could be caused by the onset of water cloud generation during strong updrafts; i.e., droplet size increases during air parcel expansion in an adiabatic process (Saito et al., 2019). However, on polluted days, as CTT lowered, the mean CER decreased; at a CTT of 291 to 279 K, CER decreased from 10.8 to 9.1 µm. Figure 8b shows that CTT exhibited a higher occurrence frequency between 288 and 285 K on polluted days, whereas clean days had a higher frequency of CTT between 285 and 282 K. These results suggest that abundant aerosols activated higher concentrations of CCN near the surface, which tends to form more low-level clouds with smaller cloud droplet size.
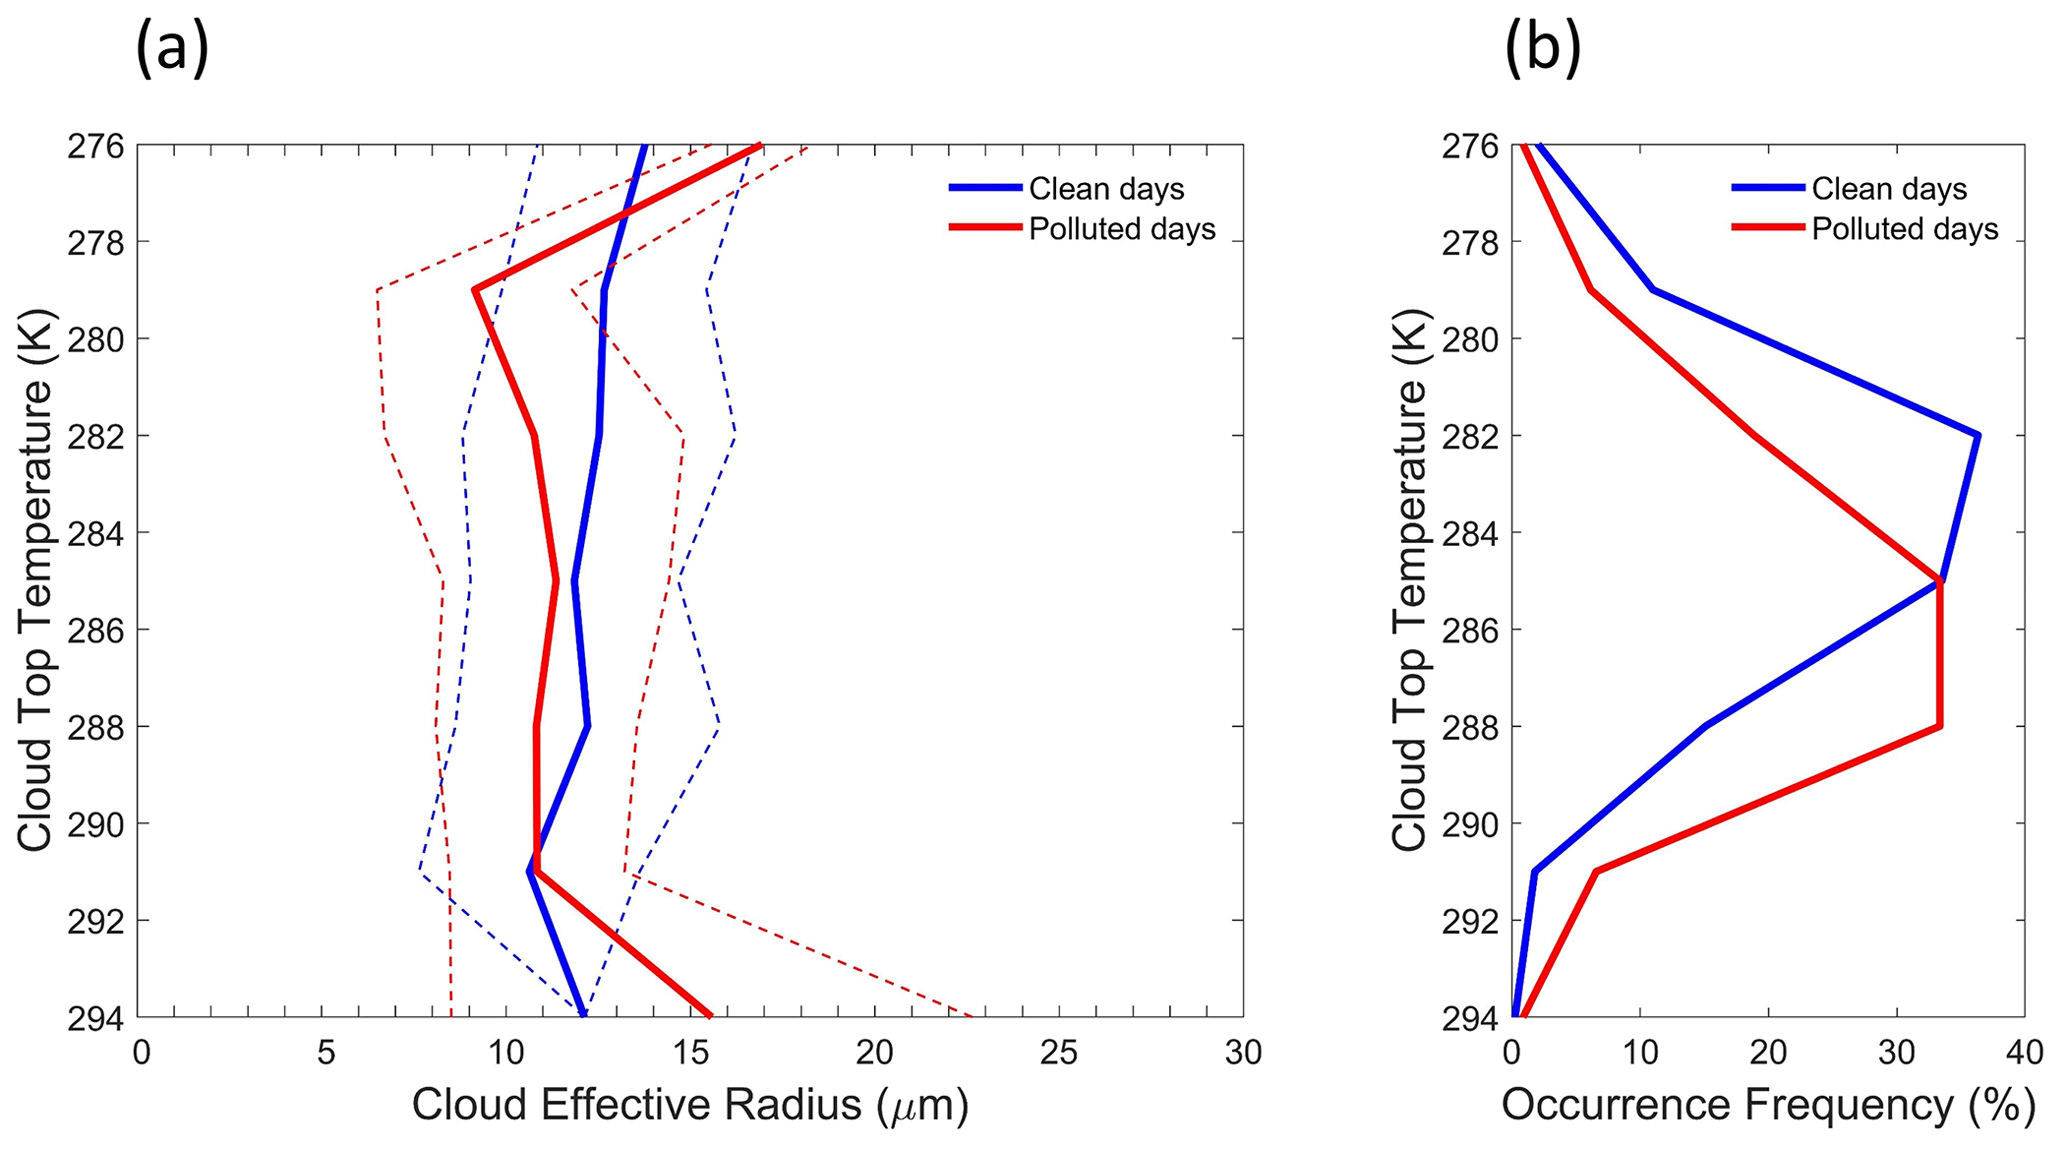
Figure 8Multiyear (2005–2017) (a) relationship of cloud-top temperature (CTT) and cloud effective radius (CER). Plotted are the mean (solid line) and 1 standard deviation (dashed line) of CER for each 3 K interval and (b) frequency of occurrence of CTT. Clean and polluted days are depicted with blue and red lines, respectively. Both (a, b) are constrained to CWP group 9 ().
3.3 Effect of different polluted conditions on ACI
We further explored the effect of aerosols on cloud microphysics under different polluted conditions. We investigated ACI from two perspectives, considering different polluted levels and considering different polluted areas. First, we divided polluted days into three equal groups: slightly, moderately, and heavily polluted days. We then calculated ACI values by using RMSE and correlation coefficients (denoted with r(ACI)) of PM2.5 and CER under different CWP groups and at different polluted levels for the main research domain. As illustrated in Fig. 9a, the three polluted levels exhibited similar trends, but stronger ACI signals (larger ACI slope and absolute r(ACI) values) were observed for heavily polluted cases compared with moderately and slightly polluted days. On heavily polluted days (red line), when CWP was larger than group 5, the ACI value increased with increasing CWP, and from group 8, the ACI value was positive, whereas ACI values for slightly and moderately polluted days continued to increase in groups 7 to 9 but decreased in group 10 and were not consistently at positive ACI values past a particular CWP range. For CWP groups 7–10, the ACI values of heavily polluted days were consistently higher than the ACI values of slightly and moderately polluted days, especially in group 10. Notably, the differences in ACI values for the three polluted levels (0.08, 0.07, and 0.06 for heavily, moderately, and slightly, respectively) associated with CWP group 9 () were apparently small; thus the effects on cloud properties may prove insignificant.

Figure 9Multiyear (2005–2017) ACI values with the RMSE (shaded) and the correlation coefficient among (a) different polluted levels, (b) different aerosol proxies, and (c) different polluted condition areas.
The effects of aerosols on cloud microphysics over the land and ocean (denoted with magenta and blue square boxes, respectively, in Fig. 3) are discussed. Because of the lack of PM2.5 surface observations over the ocean, we used AOD from MODIS/Aqua as the aerosol proxy in Eq. (1) for the ACI calculation. To ensure the reliability of calculations, we computed ACI in the primary research area (24.6–25.2∘ N, 120.9–121.5∘ E) based on different aerosol proxies (i.e., AOD and PM2.5 concentration). As illustrated in Fig. 9b, in CWP groups 1–8, ACI values evaluated with AOD had larger values than those evaluated with PM2.5; the difference was the largest in CWP group 2 (0.22). For positive ACI ranges, ACIs estimated with AOD were positive for CWP groups 7–10, whereas ACIs computed with PM2.5 were positive after CWP group 8. In CWP groups 8–10, differences in ACI values became smaller, especially in group 9. We focused on group 9, which had an ACI value using PM2.5 of 0.07 and an ACI value using AOD of 0.06, a difference of only 0.01.
The effects of aerosols on cloud microphysics in polluted (i.e., land) and remote (i.e., ocean, mean AOD of 0.31) areas can be assessed further by using the ACI value with AOD as an aerosol proxy. We defined the main research area of 24.6–25.2∘ N and 120.9–121.5∘ E as the polluted area (Fig. 3a magenta box) and 25.2–5.8∘ N and 120.9–121.5∘ E as the remote area (Fig. 3a blue box). As illustrated in Fig. 9c, ACI values and correlation coefficients between mean AOD and CER were calculated in remote and polluted areas. Comparing ACI values between polluted and remote areas demonstrated that ACI values were higher in the polluted area in CWP groups 1–5. In this CWP interval, the ACI values of the remote area increased with an increase in CWP, whereas the ACI values of the polluted area changed significantly. In CWP groups 6–10, the ACI values of the remote area became more pronounced than the polluted area. The positive and increasing tendency of ACI values was observed in larger CWP groups (>7) in two areas, suggesting that the environmental condition (i.e., water vapor) was critical to aerosol indirect effects. In CWP group 9, ACI values were 0.09 and 0.06 for remote and polluted areas, respectively, indicating that aerosol indirect effects were stronger in remote areas (i.e., lower aerosols). These results are consistent with a study (Saponaro et al., 2017) that found large aerosol concentrations can saturate the effect of ACI, causing a lower ACI value.
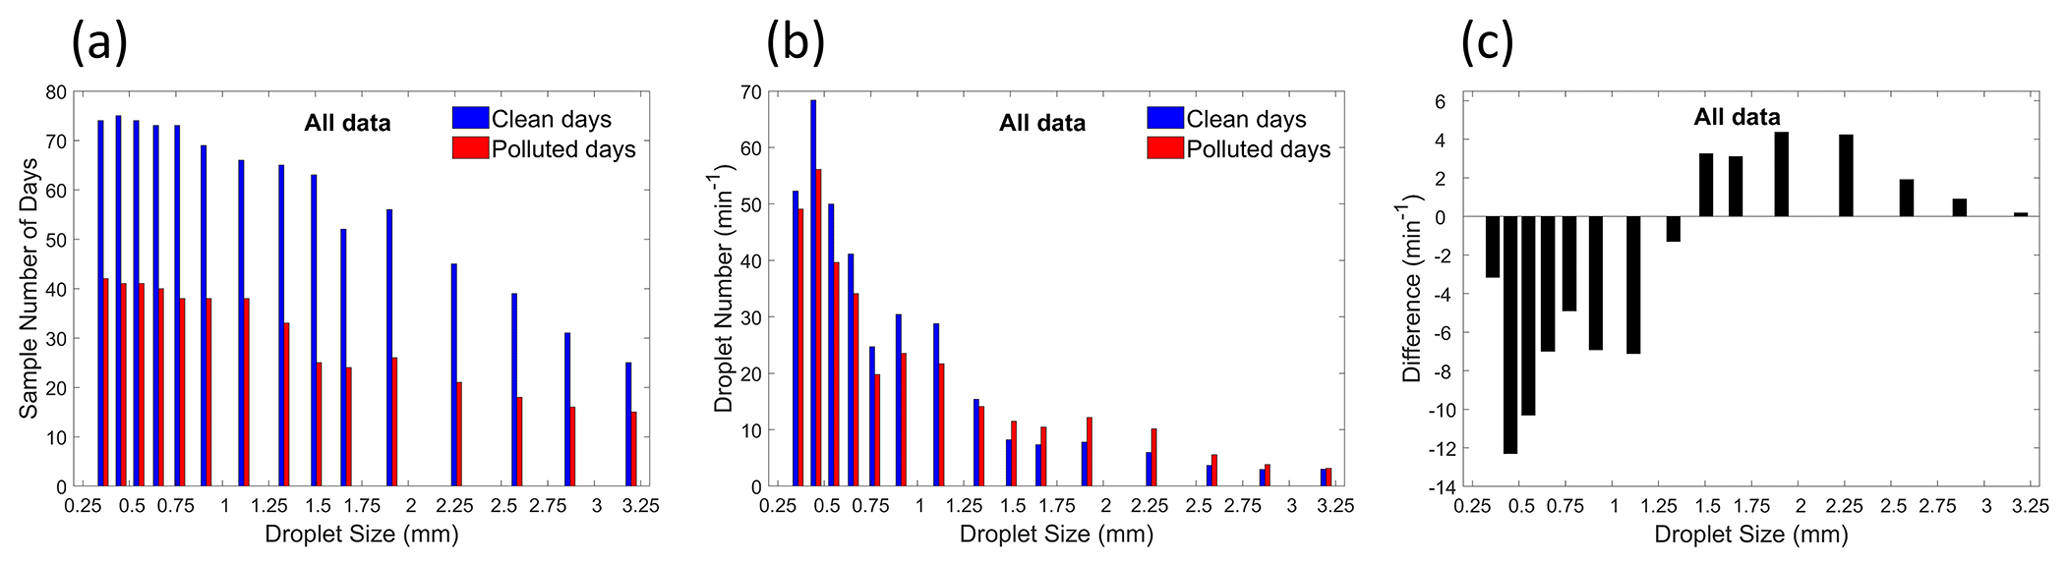
Figure 10Multiyear (2005–2017) (a) JWD sample number of days in each raindrop size bin, (b) mean droplet number per minute for clean and polluted days, and (c) the differences in the mean droplet number between polluted and clean days. The droplet size for each bin is, in order, 0.359, 0.455, 0.551, 0.656, 0.771, 0.913, 1.116, 1.331, 1.506, 1.665, 1.912, 2.259, 2.584, 2.869, and 3.198 mm.
3.4 Aerosol effect on precipitation
Aerosol effects on warm-cloud properties were discussed in Sect. 3.2; these effects may subsequently alter the cloud lifetime and the precipitation process. This section further explores their consequential influence on precipitation. High-time-resolution (1 min) JWD and PM2.5 datasets were used to investigate the effects of aerosols on the raindrop size distribution, rainfall, and cloud lifetime. Figure 10a shows the number of sample occurrences under different raindrop size classifications for clean and polluted days. The sample number (days) was significantly higher for clean conditions, suggesting rainfall was more common on clean days than on polluted days. We further calculated the minute-averaged droplet number in each raindrop size classification for polluted and clean days. Higher populations of raindrops were observed from 0.359 to 0.656 mm (bins n1–n4), with the peak in 0.455 mm (bin n2) for both clean and polluted days (Fig. 10b). The difference is plotted in Fig. 10c. The results illustrate (Fig. 10c) that during polluted days, the droplet numbers appear lower for the smaller raindrop size (<1.5 mm) compared to clean days and higher for the larger raindrop size (≥1.5 mm). A significant reduction in droplet number (decreased from 68 min−1 on clean days to 56 min−1 on polluted days) was observed in the 0.455 mm size (bin n2), corresponding to a reduction in drizzle. Our preliminary findings suggest that CCN may have competing effects (Ghan et al., 1998) on water uptake under aerosol-laden air and cloud-water-content-limited conditions, which would alter the precipitation processes.
To investigate the aerosol impacts on the change in droplet size, the cumulative number distribution of each raindrop size for clean and polluted days was calculated. We then normalized the data by computing the percentage of droplet numbers in each raindrop size class to the total number, and the difference between polluted and clean days was defined by Eq. (2).
where nX represents different raindrop size bins, b reflects the number of bins (b=1–20), and dp and dc represent the number of polluted and clean days, respectively. The results are similar to Fig. 10c; the droplet numbers, on polluted days compared to clean days, appear lower for the smaller raindrop size (≤0.771 mm, bin n5) and higher for the larger raindrop size (>0.771 mm) (Fig. 11a). To investigate the aerosol impacts on light rain, we created a plot similar to Fig. 11a but only considered precipitation less than or equal to 1 mm h−1, as shown in Fig. 11b. Our statistics for the droplet number concentration indicated that raindrop occurrence at n1 and n2 (i.e., drizzle) accounted for over 50 % on both polluted and clean days (not shown here), indicating that drizzle drops were a common raindrop type when rainfall was ≤1 mm h−1. We determined that when rainfall was ≤1 mm h−1, polluted days accounted for a more significant proportion when raindrop size was ≤0.5 mm, as compared with clean days (especially in the raindrop size distribution n1, which accounted for 2.3 %) (Fig. 11b). On the other hand, a decreased proportion when raindrop size was >0.5 mm was observed during polluted days, as compared with clean days. These results indicate that if precipitation is lower than or equal to 1 mm h−1 (i.e., light rain), an abundant amount of CCN drives raindrops to move towards smaller drop sizes, which increases the appearance of drizzle drops.
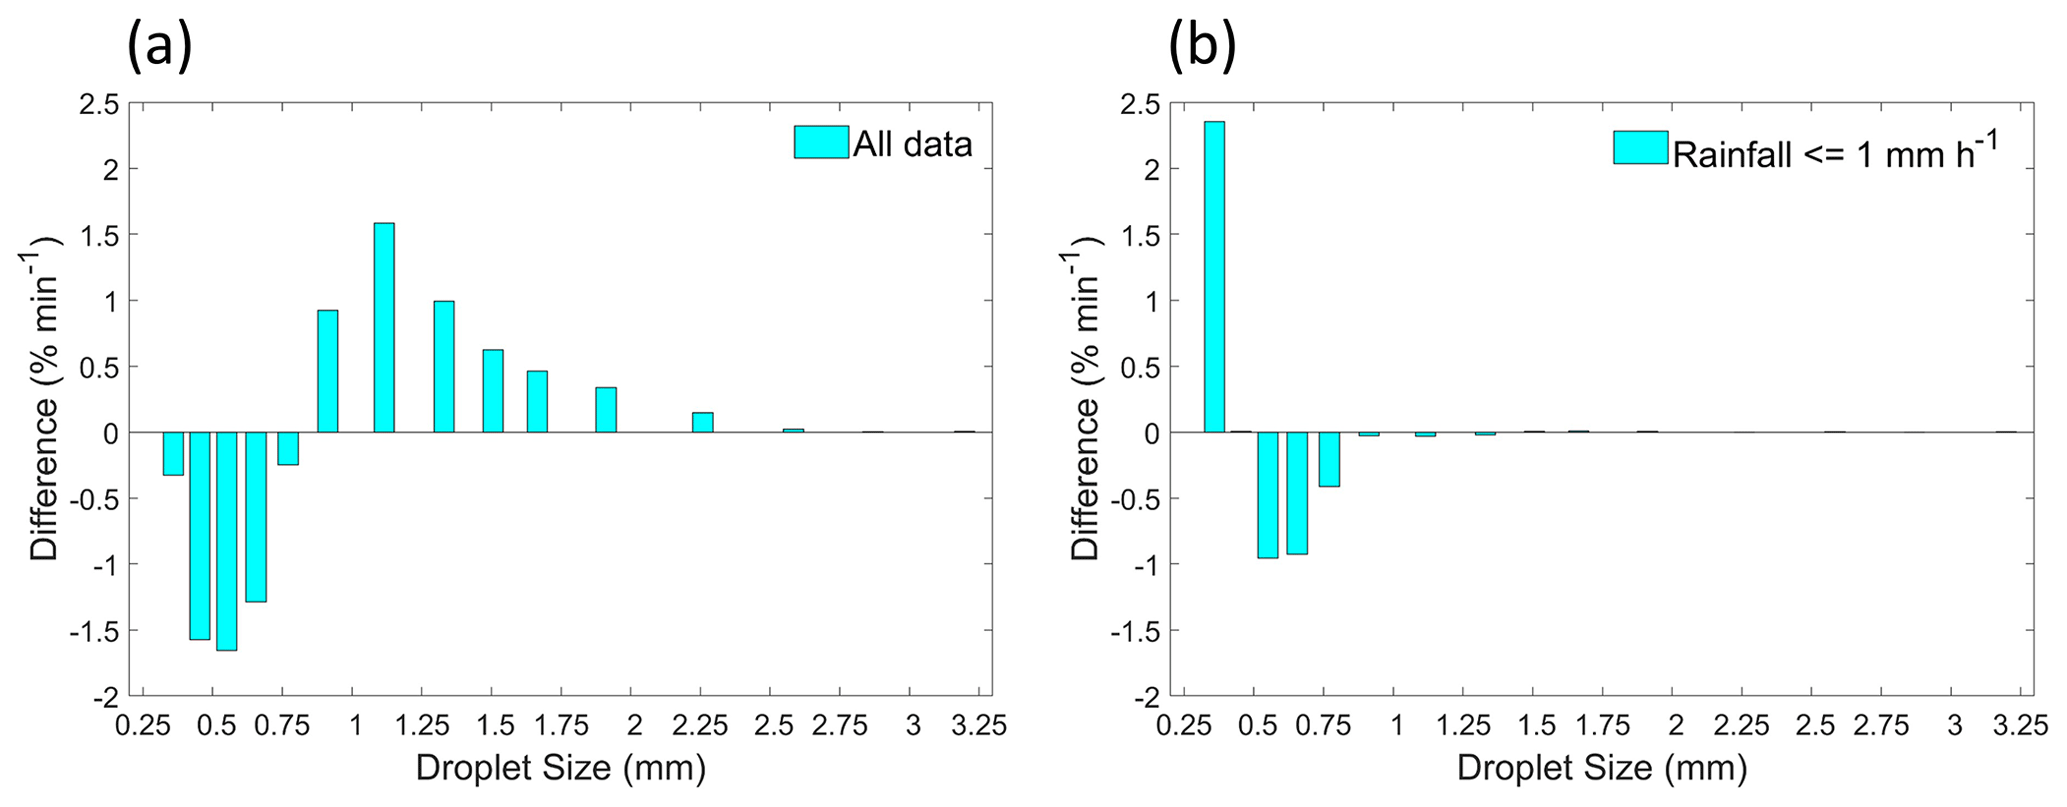
Figure 11Multiyear (2005–2017) differences between polluted and clean days as percentages of the cumulative droplet number distribution for (a) all data and (b) the data with precipitation less than or equal to 1 mm h−1. The droplet size bin information of the x axis is the same as Fig. 10.
A modeling study (Huang et al., 2007) revealed that the second indirect effect of aerosols (a large number of small droplets are generated by enhanced aerosols and reduce the precipitation efficiency) significantly reduces fall and winter precipitation from 3 % to 20 % across East Asia, although it was dependent on the auto-conversion scheme assumed. In this study, we used observational data (i.e., JWD) to analyze the difference between the average daily rainfall of polluted and clean days in different CWP groups and explored whether the increase in aerosol loading inhibits precipitation. Figure 12a demonstrates that the daily rainfall difference between polluted and clean days varies greatly for CWP groups 1–7, which may be small sample numbers in those CWP groups. However, the average daily rainfall on clean days consistently exhibited higher values in CWP groups 8–10 compared with polluted days. In CWP group 9 (), the daily average rainfall on polluted days (1.4 mm) decreased by 6.8 mm compared with clean days (8.2 mm).
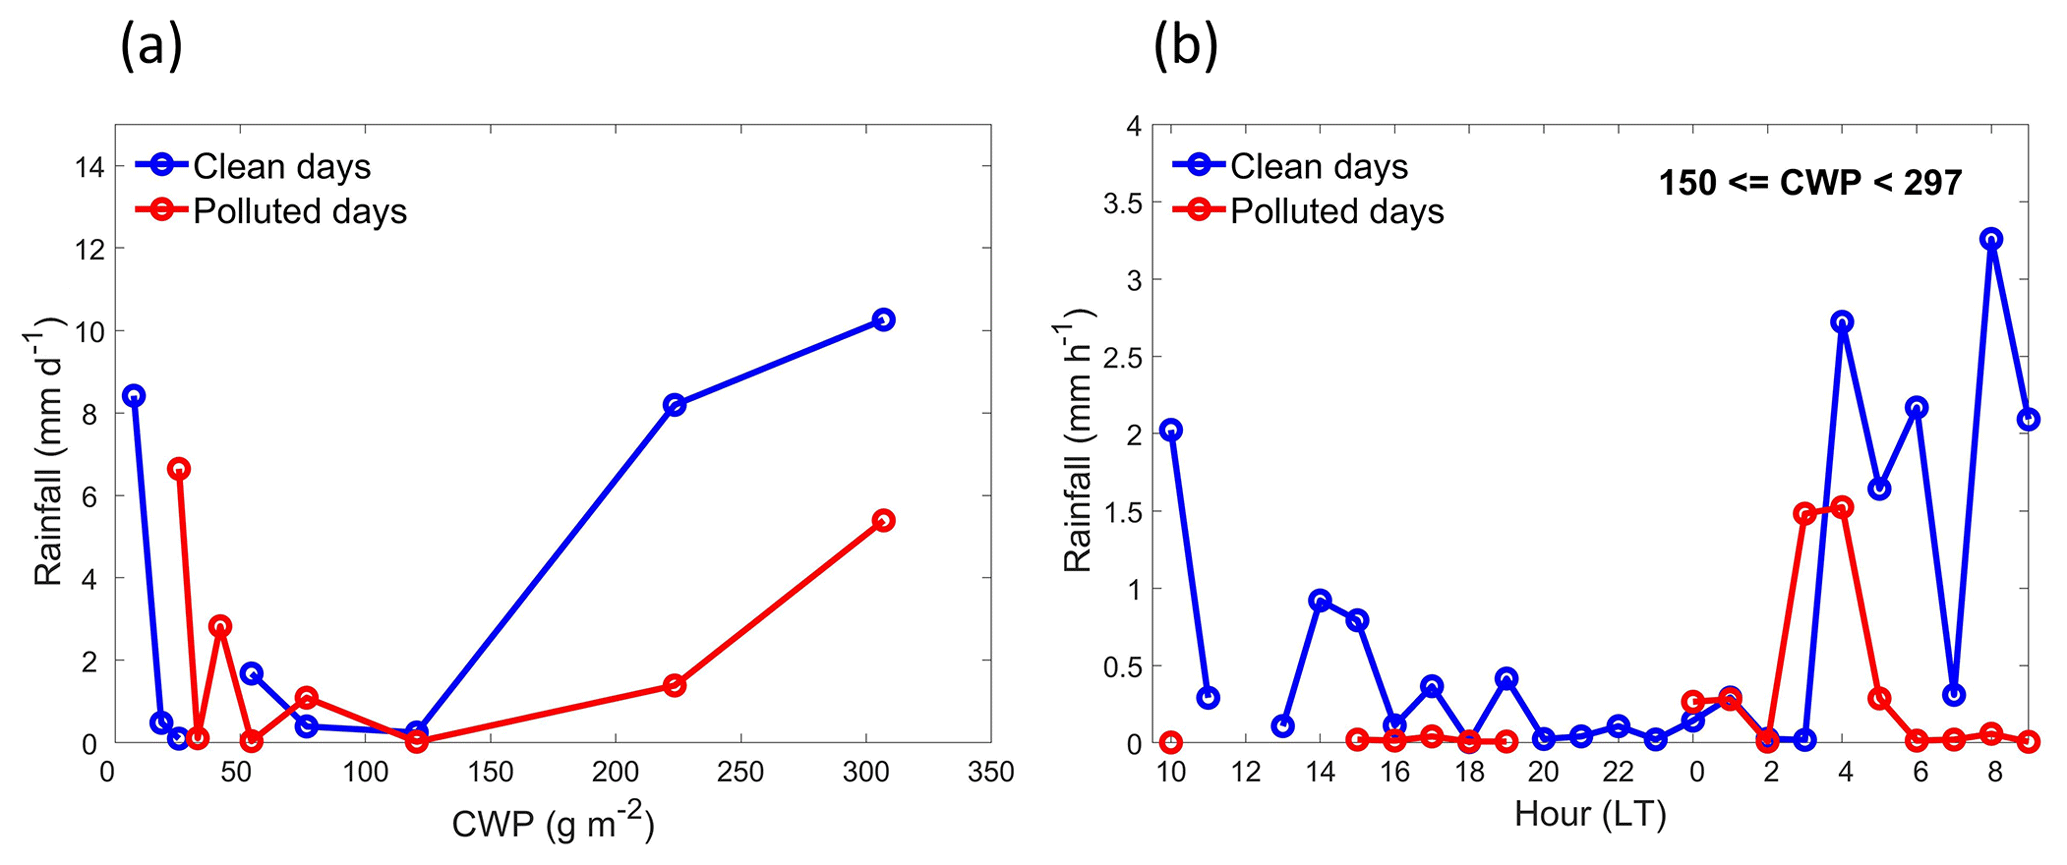
Figure 12Multiyear (2005–2017) (a) mean rainfall in different CWP groups calculated for clean and polluted days, and (b) average hourly rainfall rate calculated for clean and polluted days according to CWP group 9 () only. Rainfall analyses were performed from 10:00, and the PM2.5 data were averaged from 10:00 to 14:00 as daily PM2.5.
Furthermore, we analyzed the hourly rainfall rate of CWP group 9 () for clean and polluted days to explore the effect of aerosol on cloud lifetime. Figure 12b illustrates the rainfall rate trends for clean and polluted days. On clean days, rainfall was randomly distributed throughout the entire day with a notably larger rainfall rate observed after 04:00, whereas no rainfall was observed during daytime on polluted days, and a relatively weak rainfall rate started early in the night. Although the existence of an aerosol effect on cloud lifetime is still widely disputed (Small et al., 2009; Stocker, 2014), our preliminary results show that precipitation might be suppressed and delayed under high aerosol loading. Combined with the results from Sect. 3.2, the process in the aerosol–cloud–precipitation interactions is consistent with the cloud lifetime effect. The presence of aerosols enhances the concentration of condensation nuclei under a fixed water content, which increases the cloud droplet number and redistributes cloud water to more numerous and smaller droplets, reducing collision–coalescence rates, which in turn suppresses precipitation and delays rainfall occurrence (i.e., the cloud lifetime effect; Albrecht, 1989; Pincus and Baker, 1994; Lohmann and Feichter, 2005). Our results provide evidence of this and other aerosol indirect effects over a highly populated island in the western Pacific.
Numerous studies have explored aerosol–cloud–precipitation interactions in marine stratocumulus clouds based on in situ observations, satellite observations, and models; however, few studies have investigated clouds over a dense population and complex topography area. In this study, we integrated numerous aerosol, cloud, and precipitation data from satellite and surface observations to quantify the effects of aerosols on low-level warm-cloud microphysics and precipitation over northern Taiwan, an urban area in the northwestern Pacific Ocean. A 13-year (2005–2017) dataset with a selected timeframe (15 October to 30 November) was used in this study. In contrast to previous studies that have focused on the rainfall rate, we investigated changes in raindrop size distribution as the key variable in the effect of aerosols on precipitation.
We used surface PM2.5 mass concentration data as an aerosol proxy to study the aerosol impacts on clouds and precipitation. According to the PM2.5 concentration level, the data were split into clean and polluted days. The analysis of aerosol effects on clouds indicated that in CWP group 9 (), the average COT in the main research area increased by 9.53; CER decreased by 2.77 µm; CF increased by 0.07; and CTT decreased by 1.28 K on polluted days compared with clean days. According to the aerosol indirect effect, polluted atmospheric conditions are connected with clouds characterized by lower CER and CTP and larger CF and COT, which our results further support. Regarding the vertical distribution, our evidence shows that excess aerosols produced more liquid particles at lower altitude and inhibited the cloud droplet size under polluted conditions. Moreover, the effects of aerosol on cloud microphysics in polluted (i.e., land) and remote (i.e., ocean, less polluted) areas were investigated in CWP group 9: the ACI value of the remote area was 0.09, and the polluted area was 0.06. The ACI value in the remote area was larger than in the polluted area, indicating that clouds in the remote area were more sensitive to aerosol indirect effects.
Our analysis shows that precipitation might be suppressed and delayed under high aerosol loading. The observational data show higher aerosol concentration redistributed cloud water to more numerous and smaller droplets under a constant liquid water content, reducing collision–coalescence rates, which further suppressed the precipitation and delayed rainfall duration. Our results are consistent with the cloud lifetime effect. Finally, we combined the observation of raindrop size distribution to complete the story of aerosol–cloud–precipitation interactions. As a result, on polluted days compared to clean days, droplet numbers decreased for smaller droplets bins but increased for larger droplets. However, when we looked into the category of light rain (≤1 mm h−1), high concentration of aerosols drove raindrops towards smaller droplet sizes and increased the appearance of drizzle drops.
Our observational results from northern Taiwan in fall show agreement with the aerosol indirect effects. However, we did not consider the aerosol direct radiative effects or long-term variations caused by different weather systems. Overall, this study used long-term surface and satellite data for a preliminary understanding of aerosol variations in northern Taiwan, the effects of aerosol on the environment, and the effects of aerosols on precipitation. We suggest that further research on aerosol–cloud–precipitation interactions over this area should be conducted to fully understand these processes.
The satellite data from the MODIS instrument used in this study were obtained from https://ladsweb.modaps.eosdis.nasa.gov/search/ (last access: 22 February 2021; Levy and Hsu, 2015, https://doi.org/10.5067/MODIS/MYD04_L2.061; Platnick et al., 2015, https://doi.org/10.5067/MODIS/MYD06_L2.061). The meteorological and PM2.5 observation data were available from the Taiwan EPA (2021) at https://data.epa.gov.tw/dataset/aqx_p_02 (last access: 2 March 2021; data are available on request by contacting Wei-Wen Hsieh at weiwen.hsieh@epa.gov.tw). JWD data in this study were provided by the Planetary Boundary Layer and Air Pollution Lab of the Department of Atmospheric Sciences, National Central University, Taiwan (PBLAP, 2021: http://pblap.atm.ncu.edu.tw/weather10.asp, last access: 22 February 2021; data are available on request by contacting PBLAP group at office@pblap.atm.ncu.edu.tw).
SW, QM, and SL provided guidance on the data processing. YC performed the data analysis. YC, SW, QM, SL, PL, NL, KC, and EJ interpreted and discussed the data results. YC wrote the paper with input from all coauthors. All authors contributed to the final paper.
The authors declare that they have no conflict of interest.
This research was supported by the US–Taiwan PIRE program, which itself is supported by the Ministry of Science and Technology (grant no. MOST 104-2923-M-008-003-MY5) and US National Science Foundation (contract no. PIRE-1545917, managed by Everette Joseph and Pay-Liam Lin), and the Ministry of Science and Technology (grant no. MOST 108-2111-M-008-025). We thank NASA for providing the MODIS data and Taiwan EPA for providing the air quality and meteorological data.
This research has been supported by the Ministry of Science and Technology, Taiwan (grant nos. 104-2923-M-008-003-MY5 and MOST 108-2111-M-008-025), and US National Science Foundation (contract no. PIRE-1545917).
This paper was edited by Philip Stier and reviewed by two anonymous referees.
Ackerman, A. S., Kirkpatrick, M. P., Stevens, D. E., and Toon, O. B.: The impact of humidity above stratiform clouds on indirect aerosol climate forcing, Nature, 432, 1014–1017, 2004.
Albrecht, B. A.: Aerosols, cloud microphysics, and fractional cloudiness, Science, 245, 1227–1231, 1989.
Albrecht, B. A., Bretherton, C. S., Johnson, D., Scubert, W. H., and Frisch, A. S.: The Atlantic stratocumulus transition experiment–ASTEX, B. Am. Meteor. Soc., 76, 889–904, 1995.
Andreae, M. O., Rosenfeld, D., Artaxo, P., Costa, A., Frank, G., Longo, K., and Silva-Dias, M.: Smoking rain clouds over the Amazon, Science, 303, 1337–1342, 2004.
Bellouin, N., Quaas, J., Gryspeerdt, E., Kinne, S., Stier, P., Watson-Parris, D., Boucher, O., Carslaw, K., Christensen, M., Daniau, A.-L., Dufresne, J.-L., Feingold, G., Fiedler, S., Forster, P., Gettelman, A., Haywood, J., Lohmann, U., Malavelle, F., Mauritsen, T., McCoy, D., Myhre, G., Mülmenstädt, J., Neubauer, D., Possner, A., Rugenstein, M., Sato, Y., Schulz, M., Schwartz, S., Sourdeval, O., Storelvmo, T., Toll, V., Winker, D., and Stevens, B.: Bounding global aerosol radiative forcing of climate change. Reviews of Geophysics, 58, e2019RG000660, https://doi.org/10.1029/2019RG000660, 2020.
Bony, S., Colman, R., Kattsov, V. M., Allan, R. P., Bretherton, C. S., Dufresne, J.-L., Hall, A., Hallegatte, S., Holland, M. M., and Ingram, W.: How well do we understand and evaluate climate change feedback processes?, J. Climate, 19, 3445–3482, 2006.
Bréon, F.-M., Tanré, D., and Generoso, S.: Aerosol effect on cloud droplet size monitored from satellite, Science, 295, 834–838, 2002.
Bretherton, C. S., Wood, R., George, R. C., Leon, D., Allen, G., and Zheng, X.: Southeast Pacific stratocumulus clouds, precipitation and boundary layer structure sampled along 20° S during VOCALS-REx, Atmos. Chem. Phys., 10, 10639–10654, https://doi.org/10.5194/acp-10-10639-2010, 2010.
Charlson, R. J., Schwartz, S., Hales, J., Cess, R. D., Coakley, J. J., Hansen, J., and Hofmann, D.: Climate forcing by anthropogenic aerosols, Science, 255, 423–430, 1992.
Christensen, M. W., Neubauer, D., Poulsen, C. A., Thomas, G. E., McGarragh, G. R., Povey, A. C., Proud, S. R., and Grainger, R. G.: Unveiling aerosol–cloud interactions – Part 1: Cloud contamination in satellite products enhances the aerosol indirect forcing estimate, Atmos. Chem. Phys., 17, 13151–13164, https://doi.org/10.5194/acp-17-13151-2017, 2017.
Comstock, K. K., Wood, R., Yuter, S. E., and Bretherton, C. S.: Reflectivity and rain rate in and below drizzling stratocumulus, Q. J. Roy. Meteorol. Soc., 130, 2891–2918, 2004.
Costantino, L. and Bréon, F. M.: Analysis of aerosol-cloud interaction from multi-sensor satellite observations, Geophys. Res. Lett., 30, 1287, https://doi.org/10.1029/2002GL016633, 2010.
Feingold, G., Remer, L. A., Ramaprasad, J., and Kaufman, Y. J.: Analysis of smoke impact on clouds in Brazilian biomass burning regions: An extension of Twomey's approach, J. Geophys. Res.-Atmos., 106, 22907–22922, 2001.
Feingold, G., Eberhard, W. L., Veron, D. E., and Previdi, M.: First measurements of the Twomey indirect effect using ground-based remote sensors, Geophys. Res. Lett., 30, L11801, https://doi.org/10.1029/2009GL041828, 2003.
Ghan, S. J., Guzman, G., and Abdul-Razzak, H.: Competition between sea salt and sulfate particles as cloud condensation nuclei, J. Atmos. Sci., 55, 3340–3347, 1998.
Giorgi, F., Bi, X., and Qian, Y.: Indirect vs. direct effects of anthropogenic sulfate on the climate of East Asia as simulated with a regional coupled climate-chemistry/aerosol model, Clim. Change, 58, 345–376, 2003.
Grandey, B. S. and Stier, P.: A critical look at spatial scale choices in satellite-based aerosol indirect effect studies, Atmos. Chem. Phys., 10, 11459–11470, https://doi.org/10.5194/acp-10-11459-2010, 2010.
Greenberg, S.: Ground Based Rainfall Measurements at the NASA Wallops Flight Facility, Pennsylvania State University, 2001.
Guo, H., Golaz, J. C., and Donner, L.: Aerosol effects on stratocumulus water paths in a PDF-based parameterization, Geophys. Res. Lett., 38, L17808, https://doi.org/10.1029/2011GL048611, 2011.
Huang, Y., Chameides, W. L., and Dickinson, R. E.: Direct and indirect effects of anthropogenic aerosols on regional precipitation over east Asia, J. Geophys. Res., 112, D03212, https://doi.org/10.1029/2006JD007114, 2007.
Huschke, R. E.: Glossary of Meteorology, American Meteorological Society, Boston, MA, 638 pp., 1959.
Jones, T. A., Christopher, S. A., and Quaas, J.: A six year satellite-based assessment of the regional variations in aerosol indirect effects, Atmos. Chem. Phys., 9, 4091–4114, https://doi.org/10.5194/acp-9-4091-2009, 2009.
Kiehl, J. and Briegleb, B.: The relative roles of sulfate aerosols and greenhouse gases in climate forcing, Science, 260, 311–314, 1993.
Kim, B. G., Miller, M. A., Schwartz, S. E., Liu, Y., and Min, Q.: The role of adiabaticity in the aerosol first indirect effect, J. Geophys. Res.-Atmos., 113, D05210, https://doi.org/10.1029/2007JD008961, 2008.
Krüger, O. and Graßl, H.: The indirect aerosol effect over Europe, Geophys. Res. Lett., 29, 1925, https://doi.org/10.1029/2001GL014081, 2002.
Levy, R. and Hsu, C.: MODIS Atmosphere L2 Aerosol Product, NASA MODIS Adaptive Processing System, Goddard Space Flight Center, USA, https://doi.org/10.5067/MODIS/MYD04_L2.061, 2015 (data available at: https://ladsweb.modaps.eosdis.nasa.gov/search/, last access: 22 February 2021).
Lohmann, U. and Feichter, J.: Global indirect aerosol effects: a review, Atmos. Chem. Phys., 5, 715–737, https://doi.org/10.5194/acp-5-715-2005, 2005.
Lu, M. L., Conant, W. C., Jonsson, H. H., Varutbangkul, V., Flagan, R. C., and Seinfeld, J. H.: The Marine Stratus/Stratocumulus Experiment (MASE): Aerosol-cloud relationships in marine stratocumulus, J. Geophys. Res.-Atmos., 112, D10209, https://doi.org/10.1029/2006JD007985, 2007.
Lu, M. L., Sorooshian, A., Jonsson, H. H., Feingold, G., Flagan, R. C., and Seinfeld, J. H.: Marine stratocumulus aerosol-cloud relationships in the MASE-II experiment: Precipitation susceptibility in eastern Pacific marine stratocumulus, J. Geophys.Res.-Atmos., 114, D24203, https://doi.org/10.1029/2009JD012774, 2009.
Maletto, A., McKendry, I., and Strawbridge, K.: Profiles of particulate matter size distributions using a balloon-borne lightweight aerosol spectrometer in the planetary boundary layer, Atmos. Environ., 37, 661–670, 2003.
McComiskey, A., Feingold, G., Frisch, A. S., Turner, D. D., Miller, M. A., Chiu, J. C., Min, Q., and Ogren, J. A.: An assessment of aerosol-cloud interactions in marine stratus clouds based on surface remote sensing, J. Geophys. Res.-Atmos., 114, D09203, https://doi.org/10.1029/2008JD011006, 2009.
Menon, S., Hansen, J., Nazarenko, L., and Luo, Y.: Climate effects of black carbon aerosols in China and India, Science, 297, 2250–2253, 2002.
Menon, S., Del Genio, A. D., Kaufman, Y., Bennartz, R., Koch, D., Loeb, N., and Orlikowski, D.: Analyzing signatures of aerosol-cloud interactions from satellite retrievals and the GISS GCM to constrain the aerosol indirect effect, J. Geophys. Res.-Atmos., 113, D14S22, https://doi.org/10.1029/2007JD009442, 2008.
Myhre, G., Stordal, F., Johnsrud, M., Kaufman, Y. J., Rosenfeld, D., Storelvmo, T., Kristjansson, J. E., Berntsen, T. K., Myhre, A., and Isaksen, I. S. A.: Aerosol-cloud interaction inferred from MODIS satellite data and global aerosol models, Atmos. Chem. Phys., 7, 3081–3101, https://doi.org/10.5194/acp-7-3081-2007, 2007.
Nakajima, T., Higurashi, A., Kawamoto, K., and Penner, J. E.: A possible correlation between satellite-derived cloud and aerosol microphysical parameters, Geophys. Res. Lett., 28, 1171–1174, 2001.
Ou, S., Liou, K., Hsu, N., and Tsay, S.: Satellite remote sensing of dust aerosol indirect effects on cloud formation over Eastern Asia, Int. J. Remote Sens., 33, 7257–7272, 2012.
Penner, J. E., Andreae, M., Annegarn, H., Barrie, L., Feichter, J., Hegg, D., Jayaraman, A., Leaitch, R., Murphy, D., and Nganga, J.: Aerosols, their direct and indirect effects, in: Climate Change 2001: The Scientific Basis. Contribution of Working Group I to the Third Assessment Report of the Intergovernmental Panel on Climate Change, Cambridge University Press, Cambridge, 289–348, 2001.
Pincus, R. and Baker, M. B.: Effect of precipitation on the albedo susceptibility of clouds in the marine boundary layer, Nature, 372, 250–252, 1994.
Planetary Boundary Layer and Air Pollution Lab of the Department of Atmospheric Sciences (PBLAP), National Central University, Taiwan: http://pblap.atm.ncu.edu.tw/weather10.asp, last access: 22 February 2021.
Platnick, S., Ackerman, S., King, M., et al.: MODIS Atmosphere L2 Cloud Product (06_L2). NASA MODIS Adaptive Processing System, Goddard Space Flight Center, USA, https://doi.org/10.5067/MODIS/MYD06_L2.061, 2015 (data available at: https://ladsweb.modaps.eosdis.nasa.gov/search/, last access: 22 February 2021).
Ramanathan, V., Crutzen, P., Kiehl, J., and Rosenfeld, D.: Aerosols, climate, and the hydrological cycle, Science, 294, 2119–2124, 2001.
Ramaswamy, V., Boucher, O., Haigh, J., Hauglustaine, D., Hay-wood, J., Myhre, G., Nakajima, T., Shi, G. Y., and Solomon, S.: Radiative Forcing of Climate Change, in: Climate Change 2001: The Scientific Basis, Contribution of working group I to the Third Assessment Report of the Intergovernmental Panel on Climate Change, edited by: Houghton, J. T., Ding, Y., Griggs, D.J., Noguer, M., Van der Linden, P. J., Dai, X., Maskell, K., and Johnson, C. A., 349–416, Cambridge Univ. Press, New York, 2001.
Rosenfeld, D.: TRMM observed first direct evidence of smoke from forest fires inhibiting rainfall, Geophys. Res. Lett., 26, 3105–3108, 1999.
Rosenfeld, D., Sherwood, S., Wood, R., and Donner, L.: Climate effects of aerosol-cloud interactions, Science, 343, 379–380, 2014.
Saito, M., Yang, P., Hu, Y., Liu, X., Loeb, N., Smith Jr, W. L., and Minnis, P.: An Efficient Method for Microphysical Property Retrievals in Vertically Inhomogeneous Marine Water Clouds Using MODIS-CloudSat Measurements, J. Geophys. Res.-Atmos., 124, 2174–2193, 2019.
Saponaro, G., Kolmonen, P., Sogacheva, L., Rodriguez, E., Virtanen, T., and de Leeuw, G.: Estimates of the aerosol indirect effect over the Baltic Sea region derived from 12 years of MODIS observations, Atmos. Chem. Phys., 17, 3133–3143, https://doi.org/10.5194/acp-17-3133-2017, 2017.
Seela, B. K., Janapati, J., Lin, P. L., Reddy, K. K., Shirooka, R., and Wang, P. K.: A comparison study of summer season raindrop size distribution between Palau and Taiwan, two islands in western Pacific, J. Geophys. Res.-Atmos., 122, 11787–11805, 2017.
Sekiguchi, M., Nakajima, T., Suzuki, K., Kawamoto, K., Higurashi, A., Rosenfeld, D., Sano, I., and Mukai, S.: A study of the direct and indirect effects of aerosols using global satellite data sets of aerosol and cloud parameters, J. Geophys. Res.-Atmos., 108, 4699, https://doi.org/10.1029/2002JD003359, 2003.
Shen, Z., Cao, J., Arimoto, R., Han, Z., Zhang, R., Han, Y., Liu, S., Okuda, T., Nakao, S., and Tanaka, S.: Ionic composition of TSP and PM2. 5 during dust storms and air pollution episodes at Xi'an, China, Atmos. Environ., 43, 2911–2918, 2009.
Small, J. D., Chuang, P. Y., Feingold, G., and Jiang, H.: Can aerosol decrease cloud lifetime?, Geophys. Res. Lett., 36, L16806, https://doi.org/10.1029/2009GL038888, 2009.
Sporre, M. K., Swietlicki, E., Glantz, P., and Kulmala, M.: A long-term satellite study of aerosol effects on convective clouds in Nordic background air, Atmos. Chem. Phys., 14, 2203–2217, https://doi.org/10.5194/acp-14-2203-2014, 2014.
Stephens, G. L., L'Ecuyer, T., Forbes, R., Gettelmen, A., Golaz, J. C., Bodas-Salcedo, A., Suzuki, K., Gabriel, P., and Haynes, J.: Dreary state of precipitation in global models, J. Geophys. Res.-Atmos., 115, D24211, https://doi.org/10.1029/2010JD014532, 2010.
Stevens, B., Lenschow, D. H., Vali, G., Gerber, H., Bandy, A., Blomquist, B., Brenguier, J.-L., Bretherton, C., Burnet, F., and Campos, T.: Dynamics and chemistry of marine stratocumulus–DYCOMS-II, B. Am. Meteorol. Soc., 84, 579–594, 2003.
Stocker, T.: Climate change 2013: the physical science basis: Working Group I contribution to the Fifth assessment report of the Intergovernmental Panel on Climate Change, Cambridge University Press, Cambridge, 2014.
Taiwan EPA (Environmental Protection Administration): https://data.epa.gov.tw/dataset/aqx_p_02, last access: 2 March 2021.
Takemura, T., Nozawa, T., Emori, S., Nakajima, T. Y., and Nakajima, T.: Simulation of climate response to aerosol direct and indirect effects with aerosol transport-radiation model, J. Geophys. Res.-Atmos., 110, D02202, https://doi.org/10.1029/2004JD005029, 2005.
Textor, C., Schulz, M., Guibert, S., Kinne, S., Balkanski, Y., Bauer, S., Berntsen, T., Berglen, T., Boucher, O., Chin, M., Dentener, F., Diehl, T., Easter, R., Feichter, H., Fillmore, D., Ghan, S., Ginoux, P., Gong, S., Grini, A., Hendricks, J., Horowitz, L., Huang, P., Isaksen, I., Iversen, I., Kloster, S., Koch, D., Kirkevåg, A., Kristjansson, J. E., Krol, M., Lauer, A., Lamarque, J. F., Liu, X., Montanaro, V., Myhre, G., Penner, J., Pitari, G., Reddy, S., Seland, Ø., Stier, P., Takemura, T., and Tie, X.: Analysis and quantification of the diversities of aerosol life cycles within AeroCom, Atmos. Chem. Phys., 6, 1777–1813, https://doi.org/10.5194/acp-6-1777-2006, 2006.
Twohy, C. H., Coakley Jr, J. A., and Tahnk, W. R.: Effect of changes in relative humidity on aerosol scattering near clouds, J. Geophys. Res.-Atmos., 114, D05205, https://doi.org/10.1029/2008JD010991, 2009.
Twomey, S.: Pollution and the planetary albedo, Atmos. Environ., 8, 1251–1256, 1974.
VanZanten, M., Stevens, B., Vali, G., and Lenschow, D.: Observations of drizzle in nocturnal marine stratocumulus, J. Atmos. Sci., 62, 88–106, 2005.
Wang, H., Rasch, P. J., and Feingold, G.: Manipulating marine stratocumulus cloud amount and albedo: a process-modelling study of aerosol-cloud-precipitation interactions in response to injection of cloud condensation nuclei, Atmos. Chem. Phys., 11, 4237–4249, https://doi.org/10.5194/acp-11-4237-2011, 2011.
Wang, M., Ghan, S., Ovchinnikov, M., Liu, X., Easter, R., Kassianov, E., Qian, Y., and Morrison, H.: Aerosol indirect effects in a multi-scale aerosol-climate model PNNL-MMF, Atmos. Chem. Phys., 11, 5431–5455, https://doi.org/10.5194/acp-11-5431-2011, 2011.
Wang, S. H., Lin, N. H., Chou, M. D., Tsay, S. C., Welton, E. J., Hsu, N. C., Giles, D. M., Liu, G. R., and Holben, B. N.: Profiling transboundary aerosols over Taiwan and assessing their radiative effects, J. Geophys. Res.-Atmos., 115, D00K31, https://doi.org/10.1029/2009JD013798, 2010.
Warner, J. and Twomey, S.: The production of cloud nuclei by cane fires and the effect on cloud droplet concentration, J. Atmos. Sci., 24, 704–706, 1967.
Wood, R.: Drizzle in stratiform boundary layer clouds. Part I: Vertical and horizontal structure, J. Atmos. Sci., 62, 3011–3033, 2005.
Wood, R., Mechoso, C. R., Bretherton, C. S., Weller, R. A., Huebert, B., Straneo, F., Albrecht, B. A., Coe, H., Allen, G., Vaughan, G., Daum, P., Fairall, C., Chand, D., Gallardo Klenner, L., Garreaud, R., Grados, C., Covert, D. S., Bates, T. S., Krejci, R., Russell, L. M., de Szoeke, S., Brewer, A., Yuter, S. E., Springston, S. R., Chaigneau, A., Toniazzo, T., Minnis, P., Palikonda, R., Abel, S. J., Brown, W. O. J., Williams, S., Fochesatto, J., Brioude, J., and Bower, K. N.: The VAMOS Ocean-Cloud-Atmosphere-Land Study Regional Experiment (VOCALS-REx): goals, platforms, and field operations, Atmos. Chem. Phys., 11, 627–654, https://doi.org/10.5194/acp-11-627-2011, 2011.
Xu, L., Chen, X., Chen, J., Zhang, F., He, C., Zhao, J., and Yin, L.: Seasonal variations and chemical compositions of PM2. 5 aerosol in the urban area of Fuzhou, China, Atmos. Res., 104, 264–272, 2012.