the Creative Commons Attribution 4.0 License.
the Creative Commons Attribution 4.0 License.
 | 18 Mar 2021
COVID-19 lockdowns highlight a risk of increasing ozone pollution in European urban areas
James D. Lee
Will S. Drysdale
Alastair C. Lewis
Christoph Hueglin
Lukas Emmenegger
David C. Carslaw
In March 2020, non-pharmaceutical intervention measures in the form of lockdowns were applied across Europe to urgently reduce the transmission of severe acute respiratory syndrome coronavirus 2 (SARS-CoV-2), the virus which causes the COVID-19 disease. The aggressive curtailing of the European economy had widespread impacts on the atmospheric composition, particularly for nitrogen dioxide (NO2) and ozone (O3). To investigate these changes, we analyse data from 246 ambient air pollution monitoring sites in 102 urban areas and 34 countries in Europe between February and July 2020. Counterfactual, business-as-usual air quality time series are created using machine-learning models to account for natural weather variability. Across Europe, we estimate that NO2 concentrations were 34 % and 32 % lower than expected for respective traffic and urban background locations, whereas O3 was 30 % and 21 % higher (in the same respective environments) at the point of maximum restriction on mobility. To put the 2020 changes into context, average NO2 trends since 2010 were calculated, and the changes experienced across European urban areas in 2020 was equivalent to 7.6 years of average NO2 reduction (or concentrations which might be anticipated in 2028). Despite NO2 concentrations decreasing by approximately a third, total oxidant (Ox) changed little, suggesting that the reductions in NO2 were substituted by increases in O3. The lockdown period demonstrated that the expected future reductions in NO2 in European urban areas are likely to lead to widespread increases in urban O3 pollution unless additional mitigation measures are introduced.
- Article
(6675 KB) - Full-text XML
- BibTeX
- EndNote


On 31 December 2019, a cluster of unexplained pneumonia cases in Wuhan, Hubei, China was reported to the World Health Organization (WHO) (WHO, 2020a; Wu et al., 2020). Subsequent research in January 2020 identified the disease as being caused by a previously unknown betacoronavirus (SARS-CoV-2), and it was given the name coronavirus disease 2019 (COVID-19) (Zhou et al., 2020; WHO, 2020c). Due to rapid human-to-human transmission and the introduction of the virus to countries outside China, cases of COVID-19 were soon detected on all continents worldwide, with the exception of Antarctica, and WHO declared a COVID-19 pandemic on 11 March 2020 (WHO, 2020b).
Europe was named the epicentre of the pandemic on 13 March, and most European countries undertook unprecedented non-pharmaceutical intervention measures to reduce the transmission rate of SARS-CoV-2 in early or mid March (BBC, 2020; Dehning et al., 2020; Remuzzi and Remuzzi, 2020). The exact nature and duration of the measures varied by country, but collectively they are often referred to as “lockdowns” (Ruktanonchai et al., 2020). The lockdowns generally resulted in the closure of all shops, schools, universities, and restaurants with the exception of supermarkets, pharmacies, and other services deemed essential. Working from home whenever possible was encouraged, and some countries also controlled or restricted travel, exercise, and leisure activities. All of these measures created a situation where European economic activity was reduced to a bare minimum within a matter of days, and the mobility of the European population was severely altered. Google's mobility data (Google, 2020), based on movement trends, very effectively demonstrate the change in mobility based on a baseline (Fig. 1).
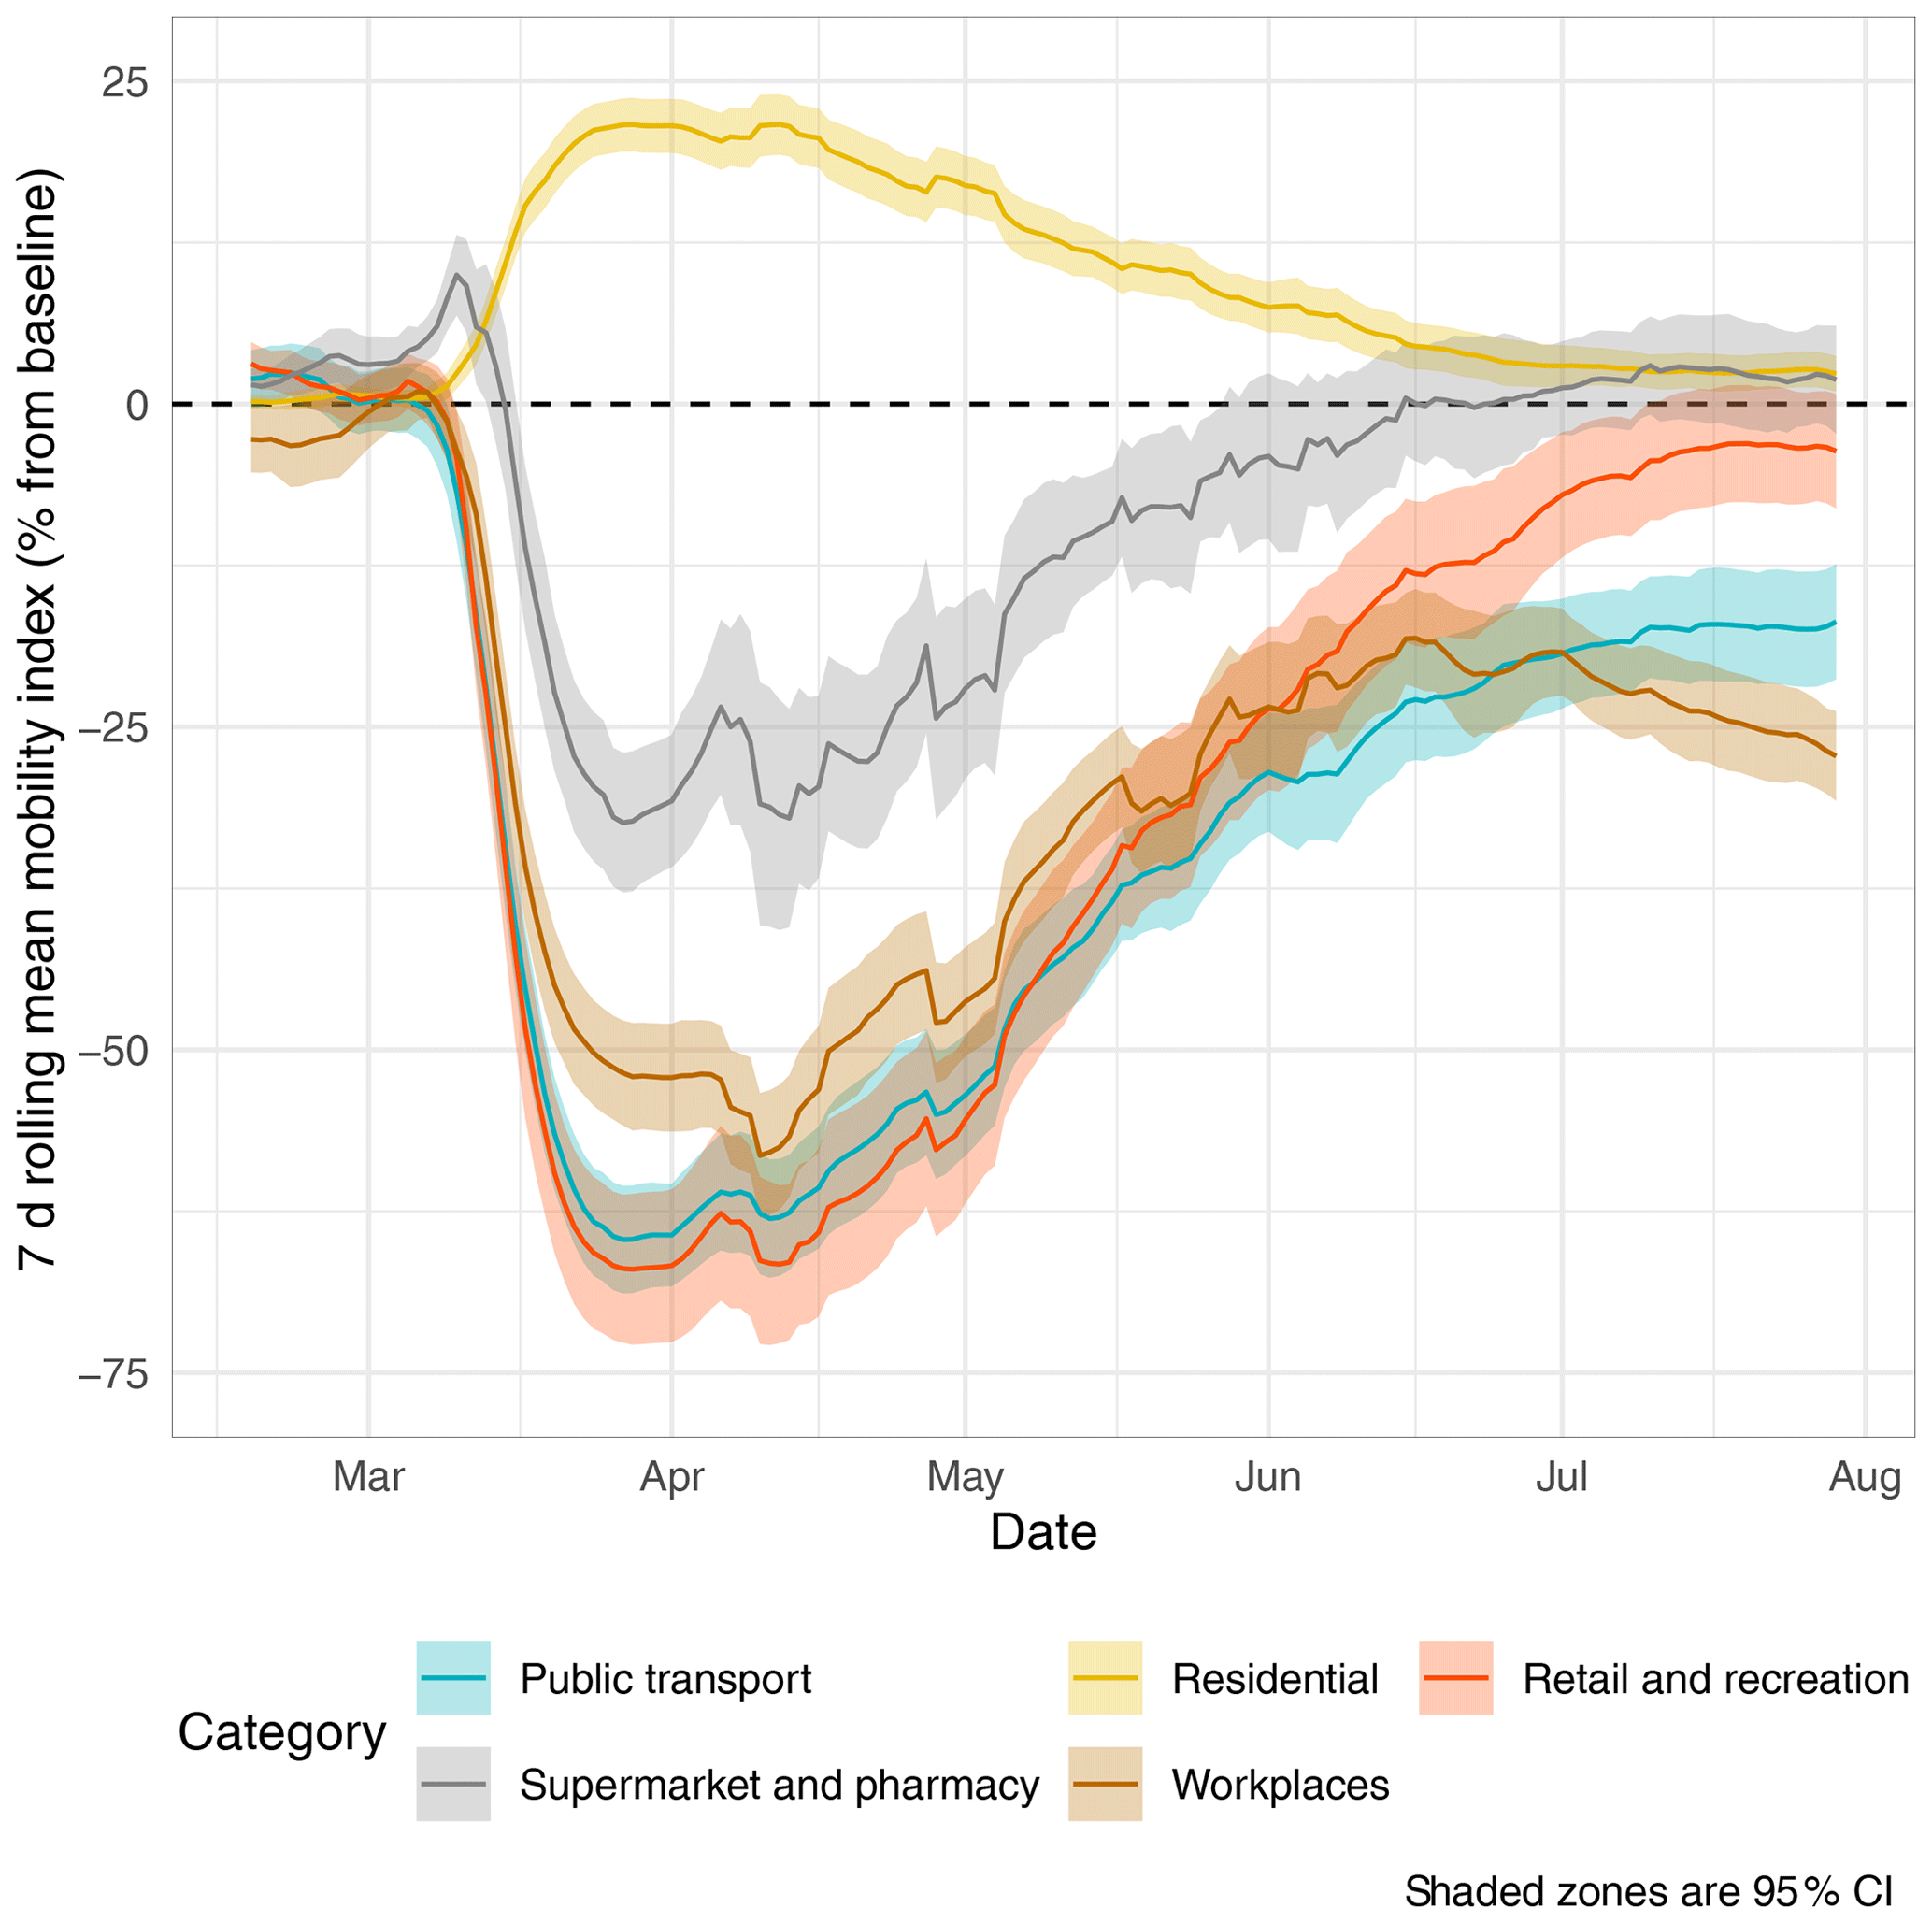
Figure 1European mobility changes based on Google's mobility indices between February and July 2020 (© Google, 2020). The metrics display movement trends based on a baseline.
The rapid reduction in economic activity had many positive environmental impacts with the improvement of air quality being widely reported, especially via striking satellite observations of column NO2 (Liu et al., 2020; Patel et al., 2020; Venter et al., 2020). Reductions in CO2 emissions have also been reported globally due to heavily curtailed economic activities (Le Quéré et al., 2020; Forster et al., 2020). Many of the reports of improved air quality were preliminary, and further research was required to fully understand and quantify the improvements observed throughout Europe, particularly after accounting for meteorological factors (Grange et al., 2020; Carslaw, 2020; Lee et al., 2020; Wang et al., 2020; Shi et al., 2021; Fenech et al., 2021; Velders et al., 2021).
The European lockdowns can be thought of and approached as an air quality “experiment” where economic activity was substantially curtailed and where commercial, transportation, and recreation activities drastically declined. Questions can be asked from the data, such as the following:
-
What were the results of the lockdowns?
-
How do they compare to other planned intervention measures such as low-emission or clean-air zones?
-
Were the observations in line with what would be expected?
The rate and severity of the changes imposed on European populations due to the lockdowns is something that previously could only have be investigated using atmospheric modelling. Therefore, the COVID-19 lockdowns have provided a unique “real-world modelling scenario” which represents a plausible future with far fewer internal combustion engine vehicles in use across Europe.
Here, we report an analysis based on counterfactual business-as-usual scenarios using predictive machine-learning models. This allows for robust comparisons of the observed concentrations of air pollutants with those which would have been expected without the lockdown measures. The primary objective of this study is to report the response of NO2 and O3 concentrations throughout European urban areas caused by mobility restrictions due to COVID-19 lockdown measures. A secondary objective is to outline the implications for European air quality management that the dramatic changes in population mobility exposed.
2.1 Data
Up-to-date (UTD) hourly NO2 and O3 monitoring data were retrieved from the European Air Quality Portal (European Environment Agency, 2019) for the period between 2018 and 2020 for 102 urban areas in 33 European countries (Fig. 2). For the 34th country, the United Kingdom, observations were directly retrieved from the countries' individual (England, Wales, and Scotland) and national networks (Automatic Urban and Rural Network; AURN) (Department for Environment Food & Rural Affairs, 2020).
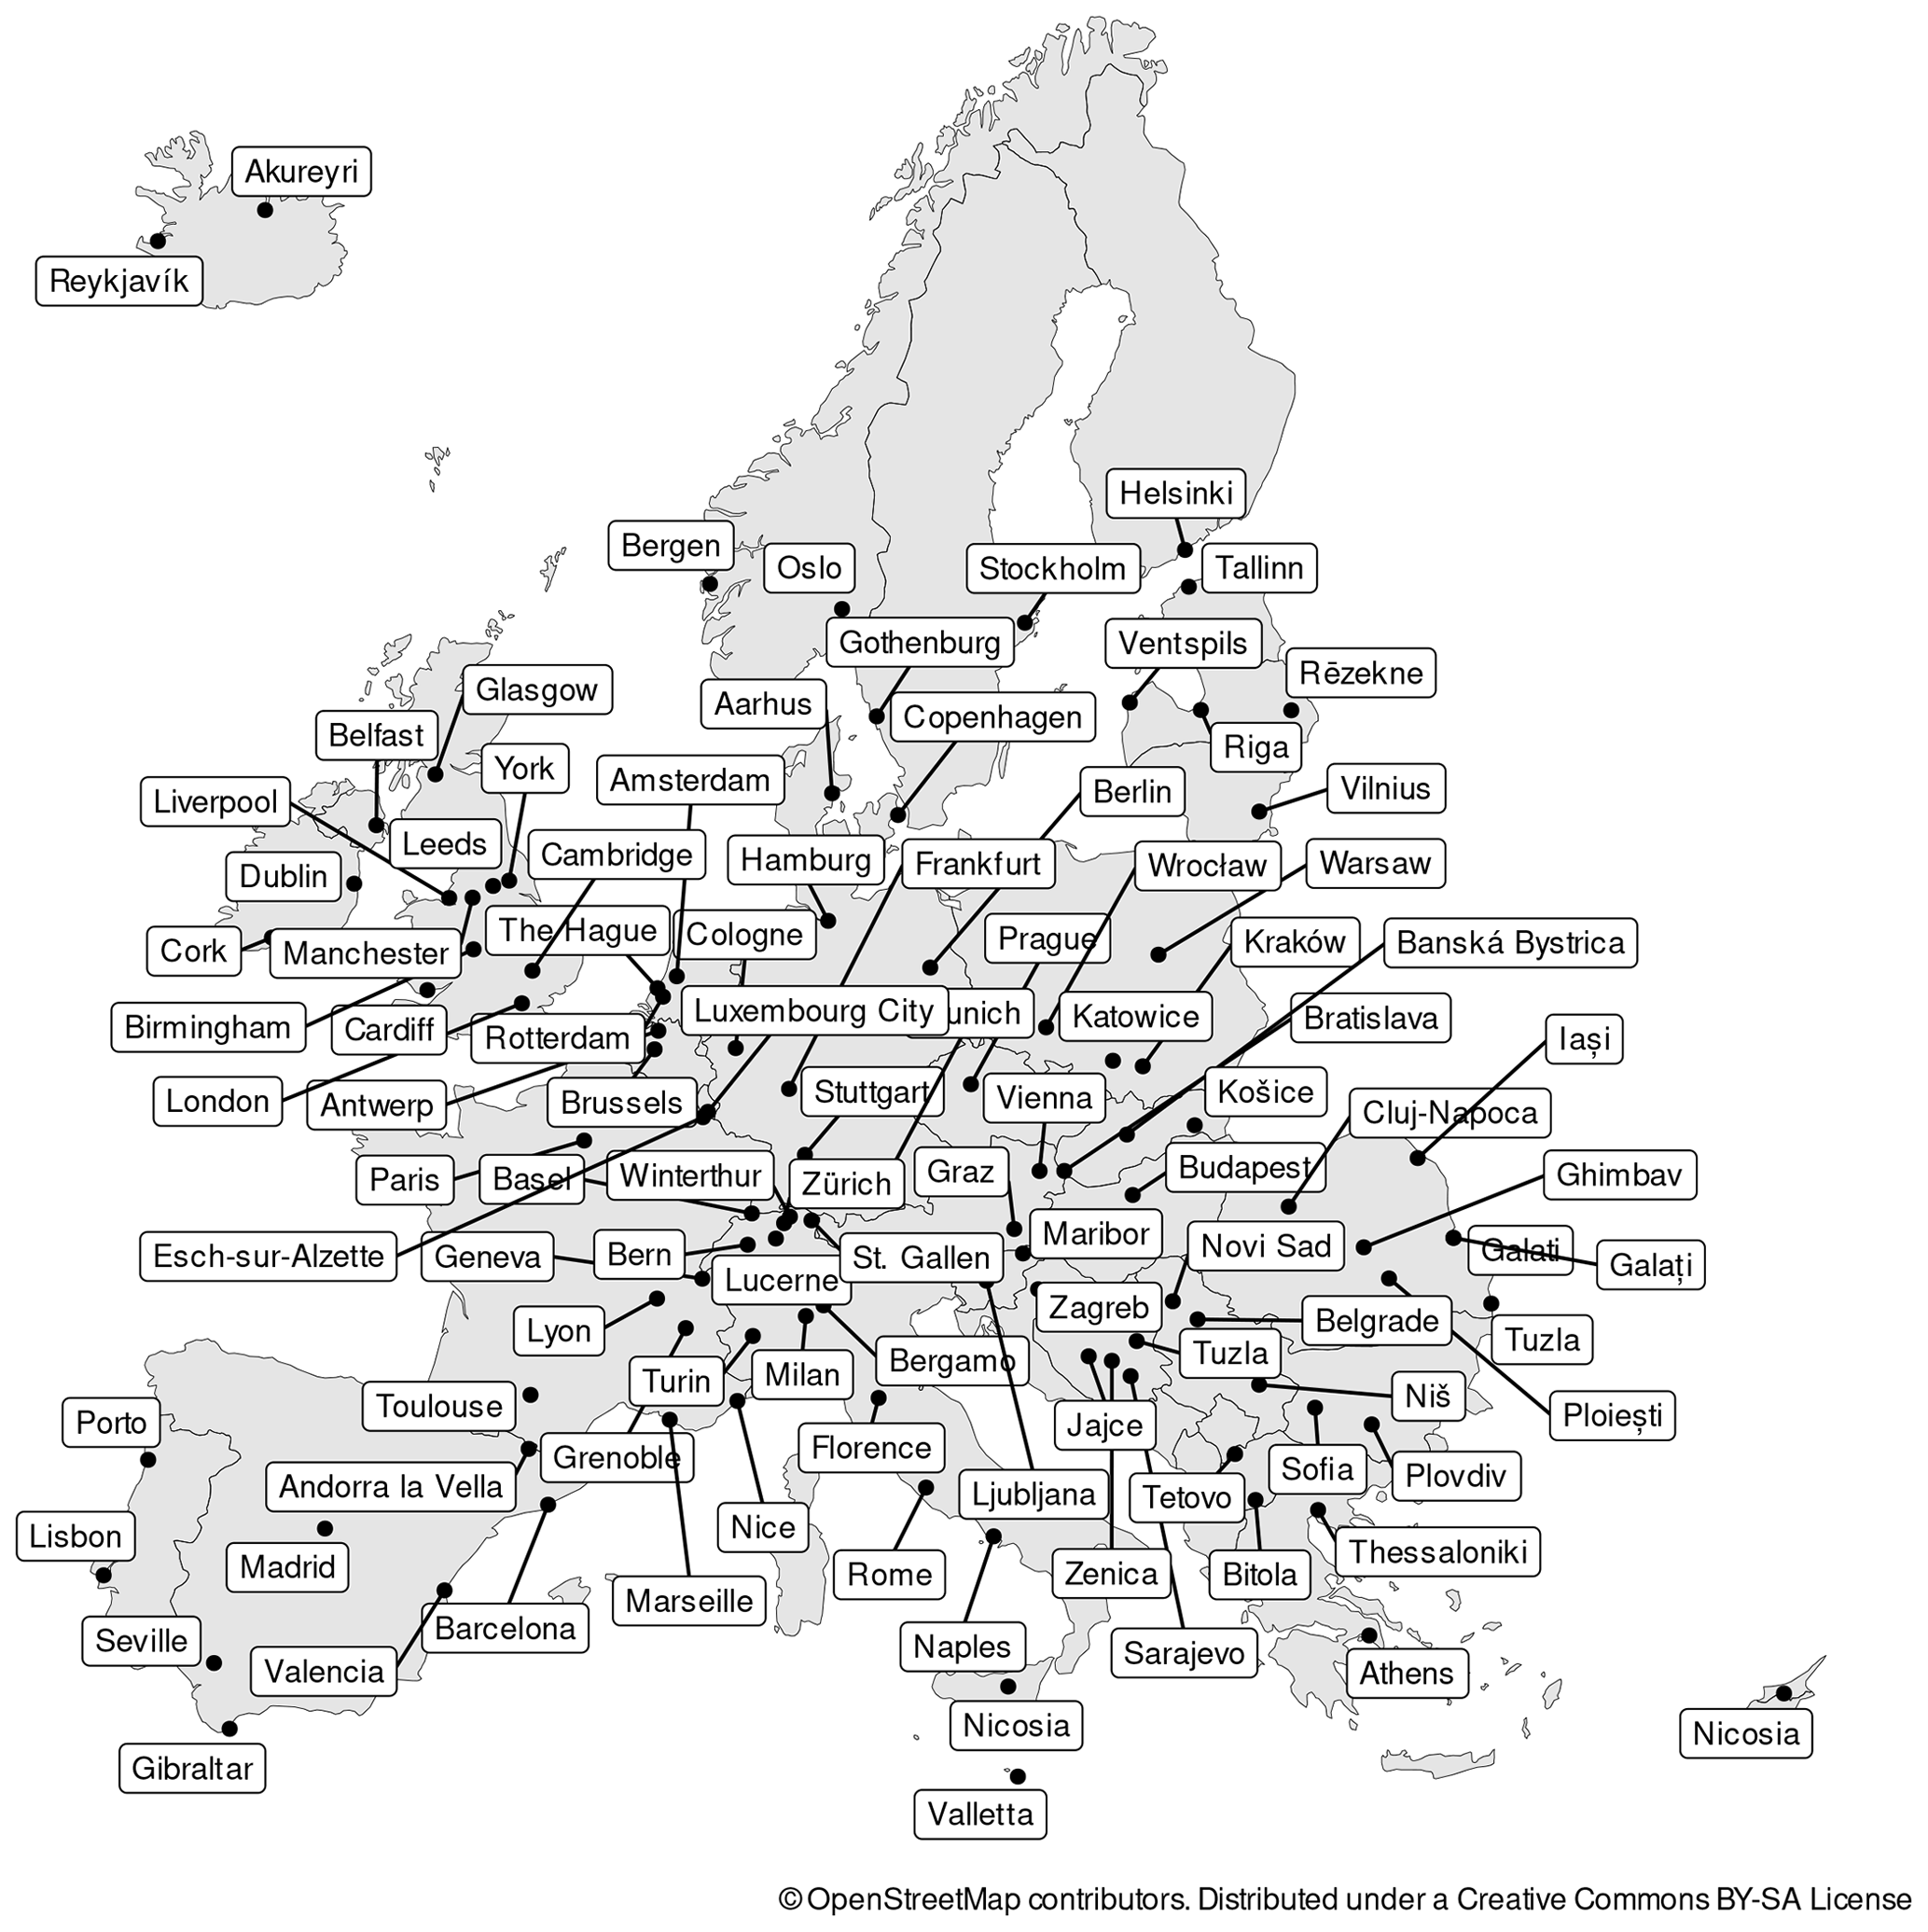
Figure 2The 102 European urban areas included in the data analysis.
The 102 urban areas were chosen because they are the capital, a “principal”, or a particularly relevant city for the included European countries (Fig. 2). In each urban area, at least one representative traffic site and at least one urban background site were chosen (if available) to represent the area. The mean distance among the different air quality monitoring sites within an urban area was 5.2 km. Notably, UTD data are not validated, are subject to change, and will only be finalized (at the time of writing) in 9-months time (the deadline is September 2021). However, the time series were screened for undesirable features such as calibration issues, frequent missing data, or long periods of no reported data. Time series with such obvious issues were not included in the analysis. Unfortunately, oxides of nitrogen () data were not available because most countries that participate in the UTD process do not report NOx (or NO), as it is not a regulated, ambient pollutant in Europe (Grange, 2019). Additionally, total oxidant () was calculated (in ppb) and included in the analysis as a third variable.
Hourly surface-based meteorological data were downloaded from the Integrated Surface Database (ISD). For the 102 urban areas, these sites were generally airports (NOAA, 2016; Grange, 2020). The matching logic between the air quality and meteorological sites was simple: the nearest ISD site to a particular air quality site was determined, and the observations were queried and tested to ensure that the data record was complete for the analysis period; if this criterion was met, the site match was positive and was used for the analysis. A total of 246 air quality monitoring sites and 91 meteorological sites were included in the analysis. For details of the sites, see the table provided in an accompanying, persistent data repository (Grange, 2021).
In the current work, we focus on changes in the concentrations of NO2 and O3 at urban traffic and urban background locations. NO2 and O3 in such locations are strongly influenced by local road vehicle emissions and not, for example, by transboundary contributions, which would be the case for particulate matter (PM2.5 and PM10). Furthermore, the concentrations of NO2 and O3 in urban areas are strongly influenced by local meteorological effects. Generally, traffic sites are located in close proximity to roads, and pollutant concentrations are forced by local vehicular emissions. The urban background classification is more varied, but it can be thought of as environments away from the immediate vicinity of roads and industrial facilities although still located within an urban area.
2.2 Business-as-usual (BAU) modelling
A central issue when considering changes in atmospheric concentrations due to intervention is whether the change is due to variations in meteorological conditions or emission source strength (Grange and Carslaw, 2019). This problem is widespread and affects timescales from hours to years. It is particularly important in “before–after” studies where meteorological change, rather than changes in emission source strength, can easily dominate the variation in concentrations. This ambiguity can be somewhat reduced by averaging over several years to account for past inter-annual variability. However, this approach cannot account for the significant impact that meteorology may have on a specific observation period.
In the current context of the changes in activities brought about by COVID-19 lockdowns, the changes are over a duration of several months and span a period from spring to summertime conditions. This period straddles important natural changes in meteorological conditions and atmospheric composition. For example, the United Kingdom and much of western Europe experienced exceptionally high mean wind speeds during February 2020 due to storms Ciara, Dennis, and Jorge. Surface wind speed records in Southern England suggest that February 2020 had the highest mean wind speed of any month for over 40 years. This demonstrates that the state of the atmospheric dispersion across Europe at the time of COVID-19 lockdowns was different from that experienced in previous years. Similarly, urban background concentrations of O3 in the Northern Hemisphere tend to increase from the beginning of the year and peak in April, which will also influence NO2 (Monks, 2000). These and other factors suggest that considerable care is needed for the quantification of an intervention measures such as the COVID-19 lockdowns on surface concentrations of primary and secondary pollutants.
To address the above issues, random forest models were trained to explain hourly mean NO2, O3, and Ox concentrations using surface meteorological and time explanatory variables for each monitoring site (Breiman, 2001). The explanatory variables used were wind direction, wind speed, air temperature, relative humidity, atmospheric pressure (if available in the ISD database), a trend term in the form of Unix date, a seasonal term in the form of Julian day, weekday, and hour of day. The following random forest hyper-parameters were kept constant for all models: 300 trees, three variables to split at each node, and a minimal node size of five. The training period spanned just over 2 years and was between 1 January 2018 and 14 February 2020. The training–testing split percentage was 80 and 20 respectively. From 14 February to 31 July 2020, the models were used in predictive mode to predict pollutant concentrations based on the observed meteorological variables.
The philosophy of this approach involves using a machine-learning model, trained on past data, to predict beyond the last observations it has seen. The model is trained on a substantially long period, 2 years in this work, to capture the variability of concentrations experienced under a variety of meteorological conditions. Beyond the training period (14 February 2020), the model predicts concentrations based on meteorological variables which, from the model's perspective, are from the future. The time series which results is a “counterfactual”. This counterfactual represents an estimate of concentrations during a business-as-usual (BAU) scenario. The BAU concentrations can be readily compared with what was observed, for example, Fig. 3, and the changes can be quantified, explained, and interpreted. This allows for a robust comparison between what was expected and what was observed.
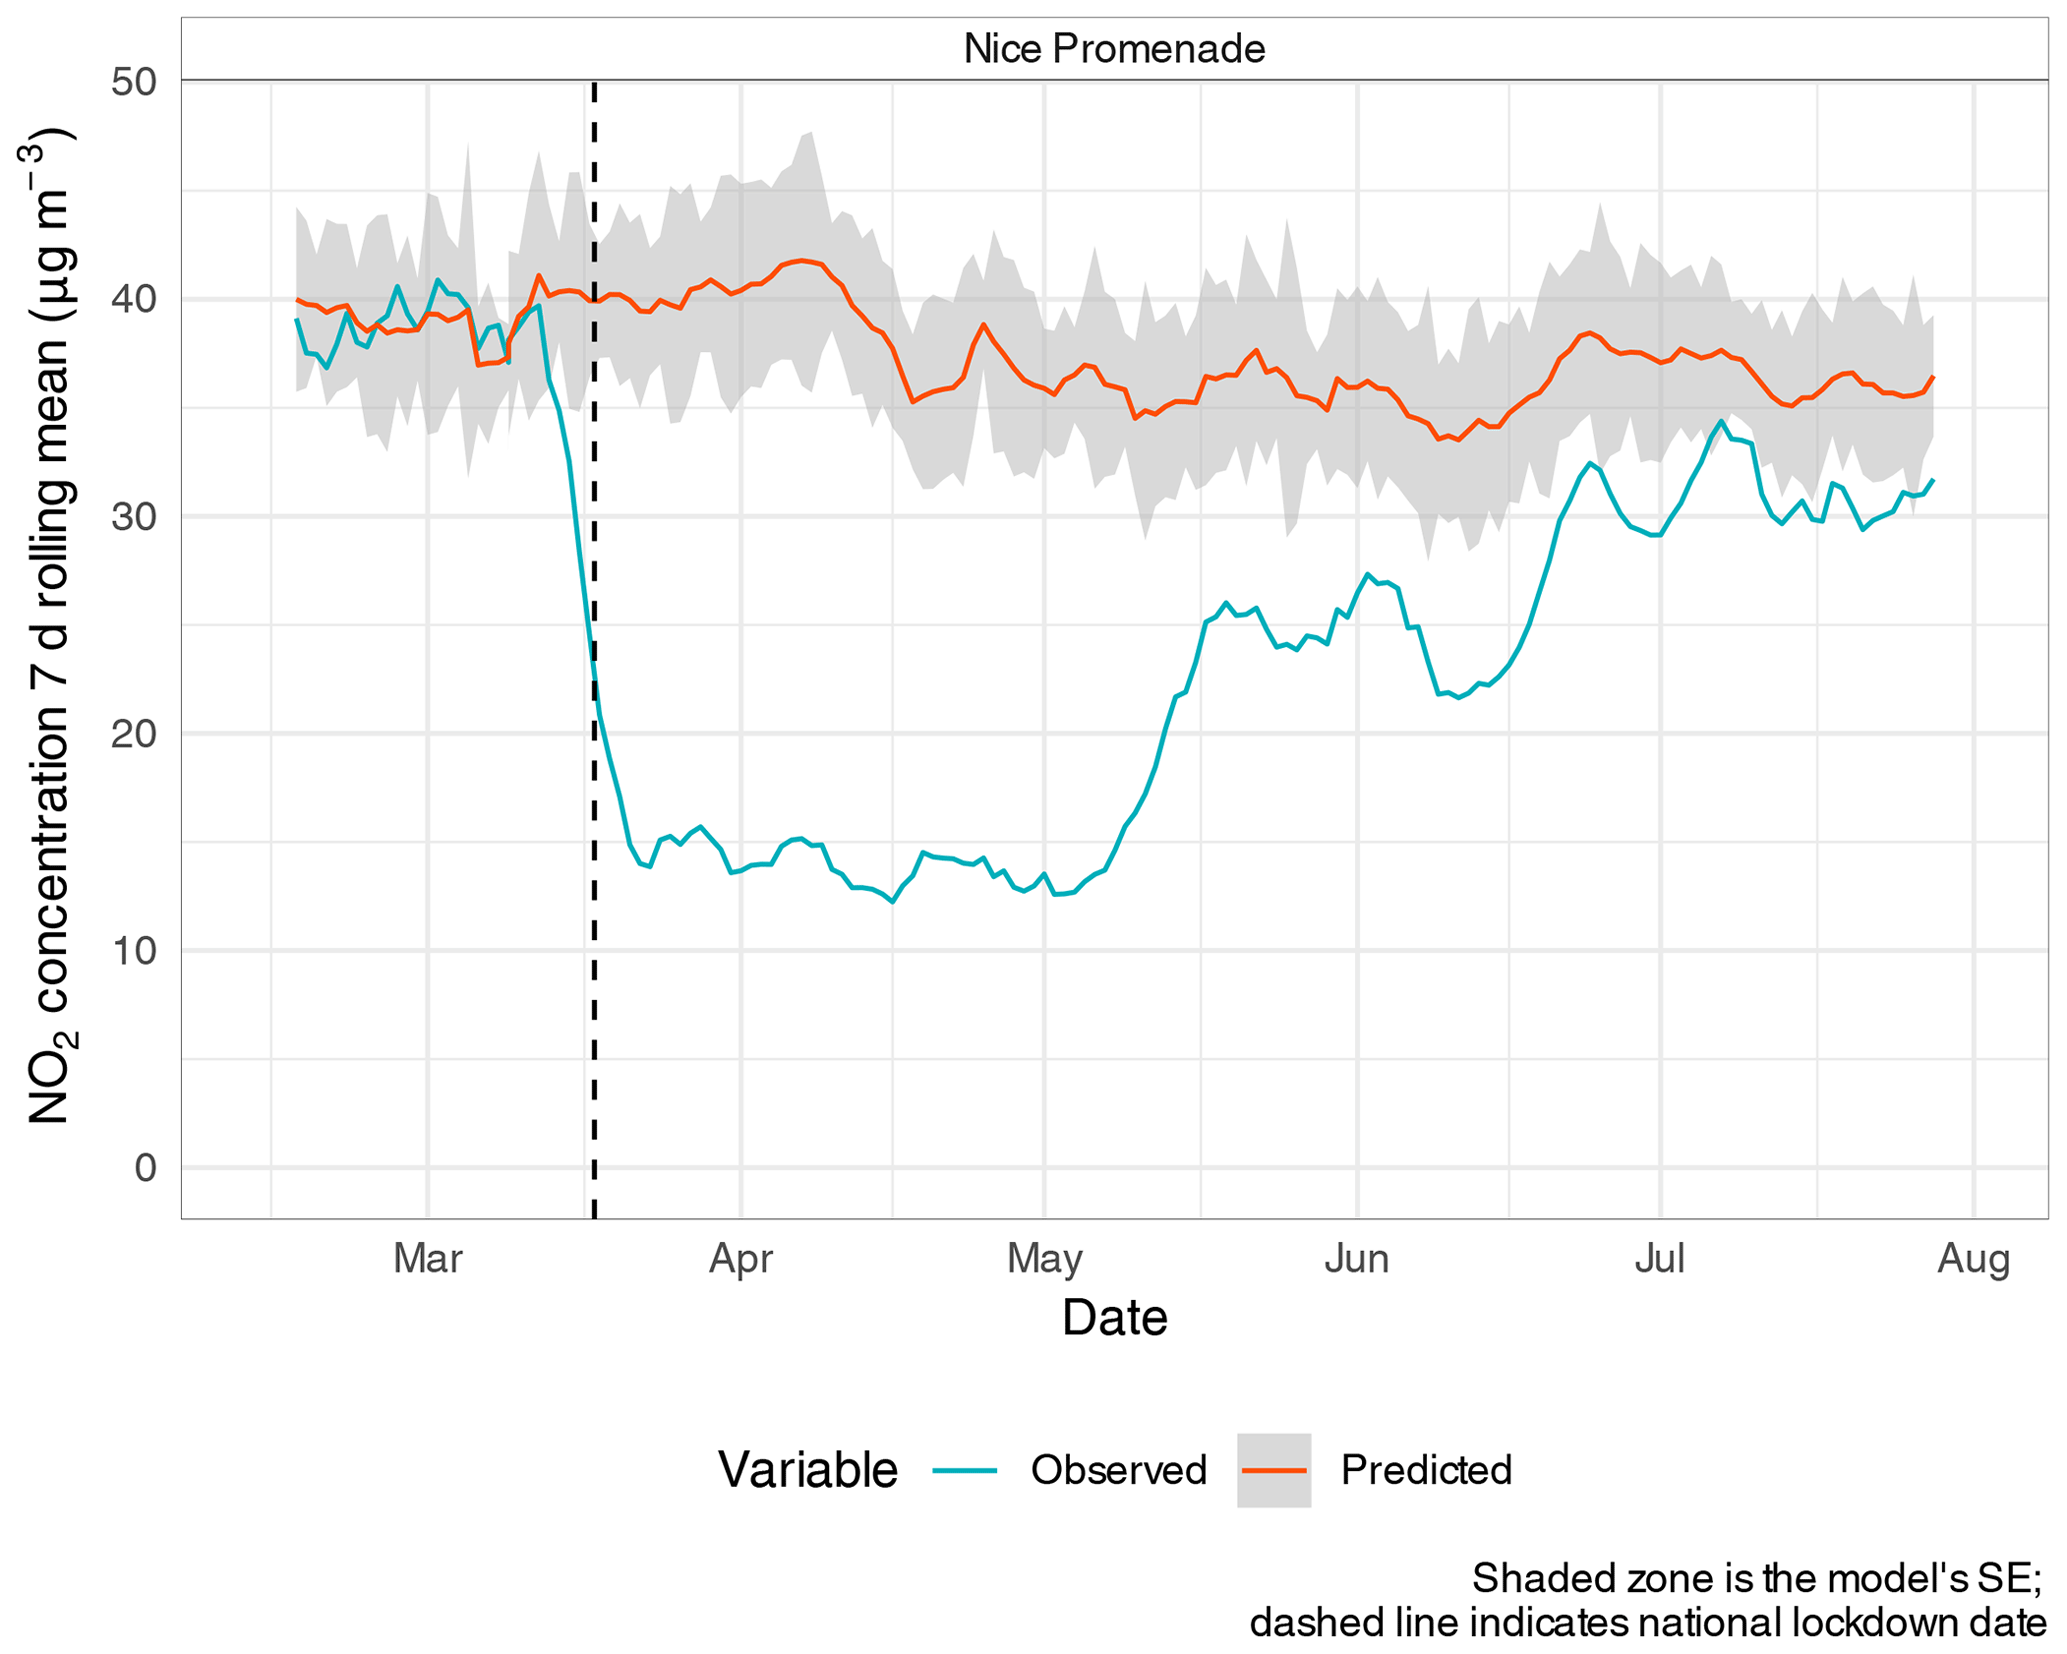
Figure 3An NO2 example where the observed concentrations clearly diverged from the business-as-usual (BAU) scenario for the Nice Promenade (France) traffic monitoring site between February and July 2020.
The period from 14 February to 1 March 2020 was considered a validation period where the models' skill were checked for adequate performance. Summaries of the models' performance metrics based on the training and validation periods are shown in Fig. A1. From the start date of the lockdowns (the earliest was 9 March in Italy), the application period began and gave estimates of BAU values, i.e. what concentrations would have been if the lockdown measures were not implemented. The modelling was conducted using the rmweather R package (Grange et al., 2018; Grange and Carslaw, 2019; Grange, 2018).
During the validation phase, a number of models showed bias in prediction; most notably, NO2 was under-predicted at many locations. The under-prediction was on average −3.7 µg m−3 (95 % confidence interval (CI) ; mean percentage change of 15.9 %). This under-prediction was most likely caused by already curtailed economic activity and reduced emissions throughout Europe at the very end of February and the beginning of March, i.e. before the formal lockdowns were implemented. The beginning of 2020 was also mild with respect to ambient temperature and rather windy at most locations (discussed above) which may have resulted in some models under-predicting concentrations at this time of the year. For consistency and to create a reference point in time, the model predictions were corrected by calculating the model offset validation phase (14 February to 1 March) and subtracting this offset from the predictions. This ensured that the counterfactual predictions were calibrated at the start of the application phase and represented the changes in concentrations after 1 March 2020.
2.2.1 Change point analysis
To link NO2, O3, and Ox concentration changes in March–April 2020 to the lockdown restrictions placed on European populations, change point models were calculated. These change point models were conceptually simple – an intercept change was the expected a priori assumption. There were two motivations for these change point models. The first was to identify both the time and magnitude of the concentration response with an objective, data-driven approach rather than using a subjective and manual classifier. The second was to use such a technique to identify an atmospheric response following an intervention measure (an unplanned one in this case) which is a general goal of air quality data analysis.
The change point logic was implemented with the mcp R package with Bayesian inference (Lindeløv, 2020). To detect the change points, three Markov chains were run with 9000 iterations. The change point models tested the delta between the observed and counterfactual; however, the change points were calibrated back to their pre-lockdown concentrations to conduct the (relative) percentage change calculations.
2.2.2 Presentation of results
When presenting the results of the analysis, most time series are displayed as 7 d rolling means. These rolling means act as a smoothing filter to make patterns clearer and remove the day-to-day variations generally seen in air quality monitoring data. A total of 34 countries were included in the analysis (Fig. 2); however, to avoid overwhelming plots and figures, a consistent set of six European countries (France, Germany, Italy, Spain, Switzerland, and the United Kingdom) were chosen to be displayed when discussing the counties' air quality patterns.
3.1 Mean concentration changes
For all 34 European countries analysed, the observed concentrations of NO2 were lower than those predicted by the counterfactual business-as-usual (BAU) scenarios between 14 February and 31 July 2020 (deltas, Δ, changes between the observed concentrations and predicted counterfactual shown in Fig. 4). The reductions in NO2 were greater in both an absolute and relative sense at the sites classified as either roadside or traffic environments compared with urban background locations which can be explained by NO2 being primarily a traffic-sourced pollutant (Grange et al., 2017). The impacts of vehicle-flow reductions during the lockdowns were more dramatic in the close proximity of roads when compared with more distant urban background locations.
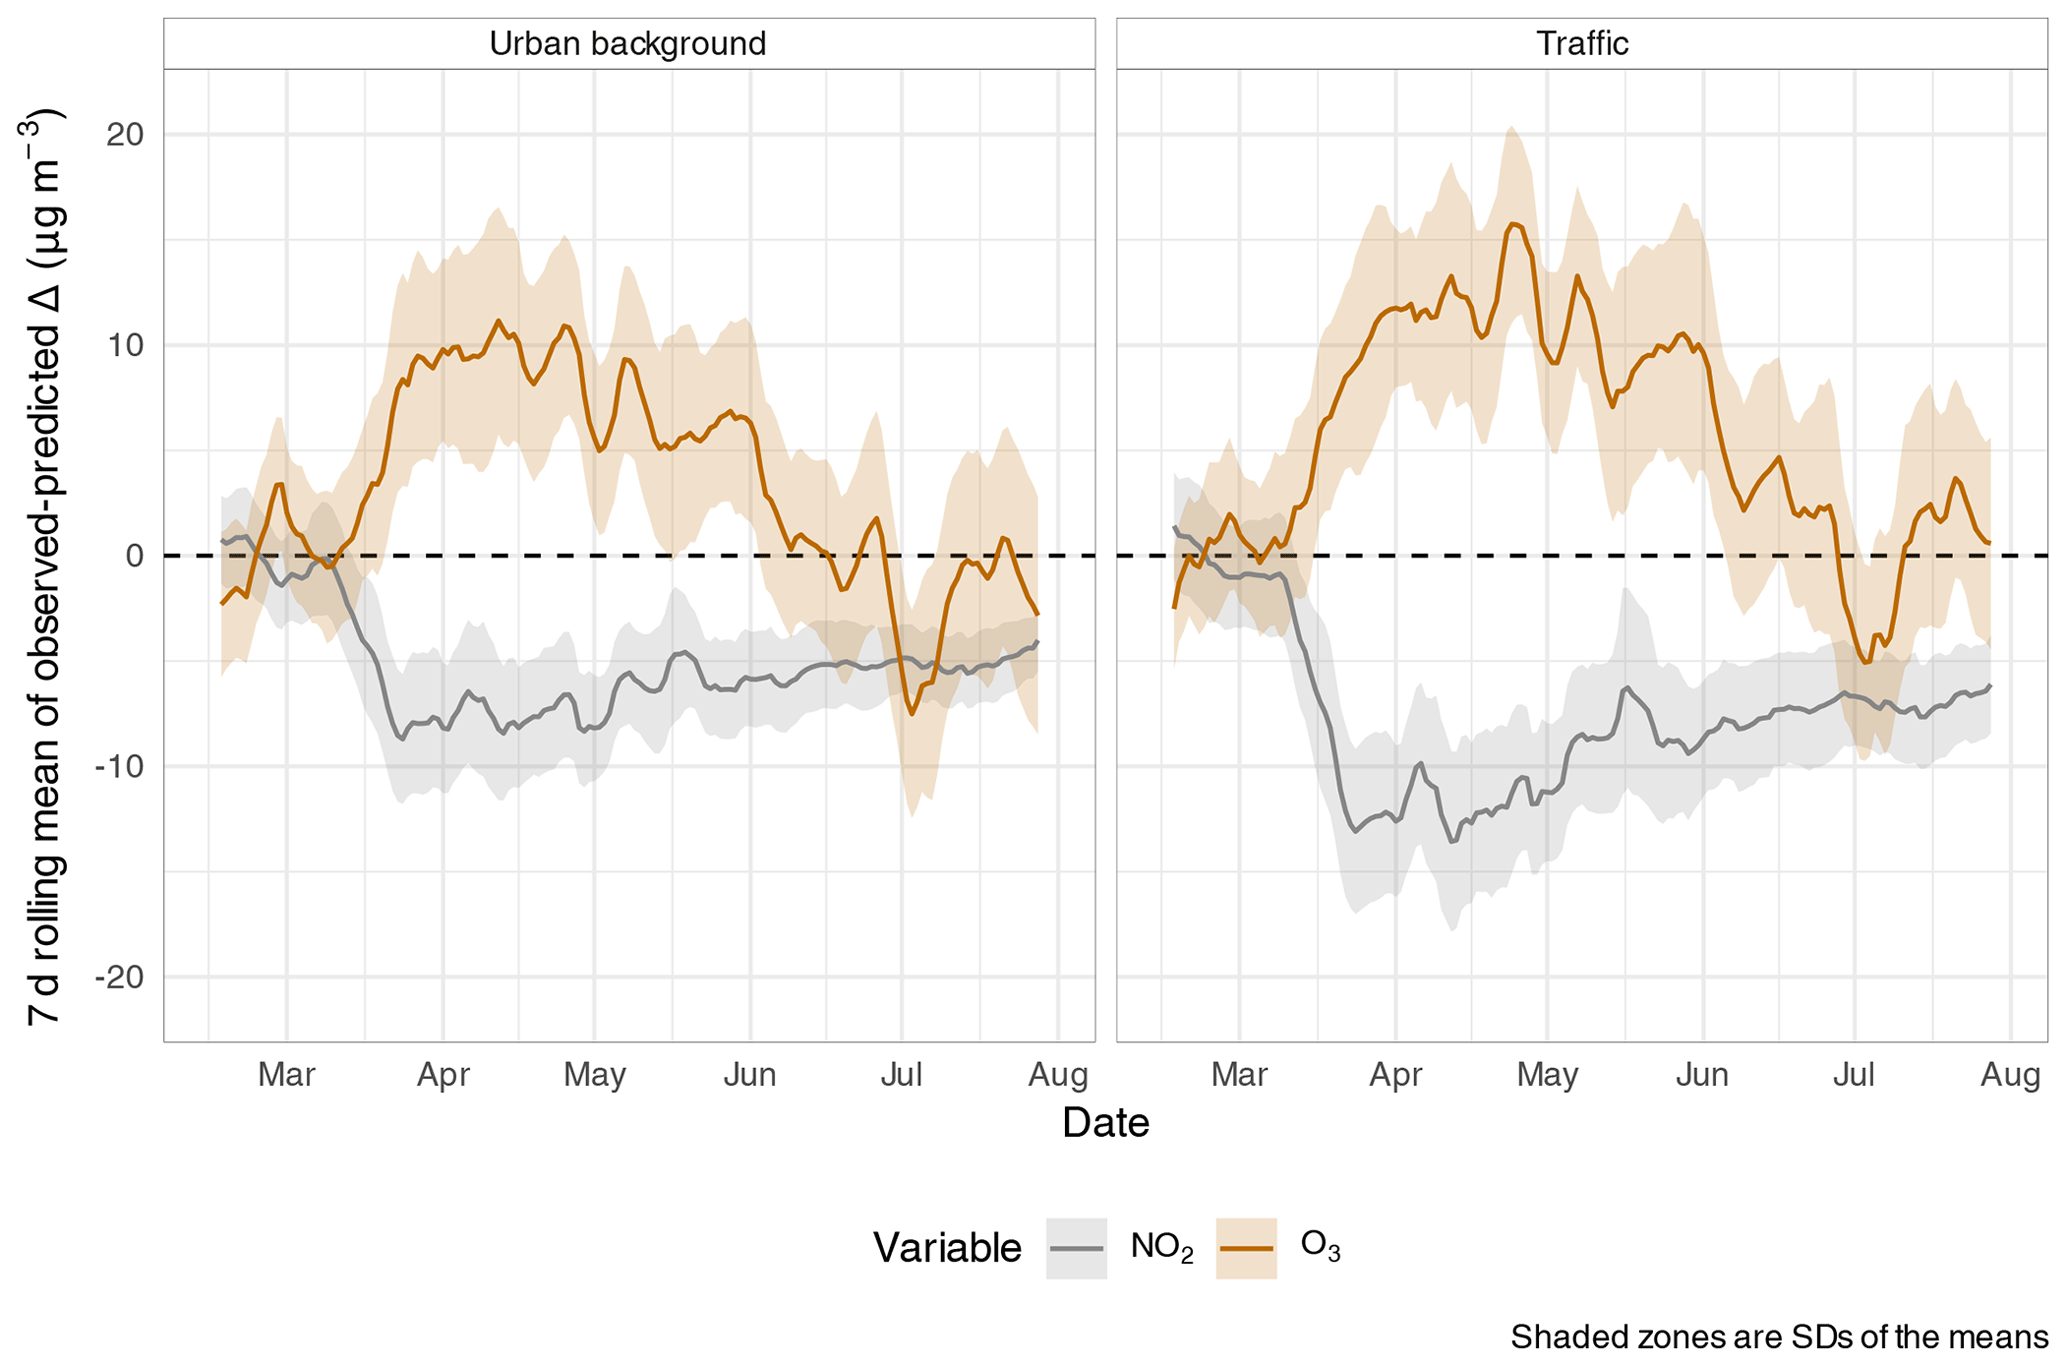
Figure 4The 7 d rolling means of the observed–predicted concentrations' deltas for NO2 and O3 for all European sites analysed between 14 February and 31 July 2020.
Mean O3 concentrations increased at a similar magnitude to which NO2 decreased throughout Europe between February and July 2020 (Fig. 4). Like NO2, O3 at roadside locations showed a greater divergence from the BAU predictions than urban background sites. The near-mirror image of NO2 and O3 can be explained by the relationship between NOx and O3. The reduction in NOx emissions and concentrations across Europe drove decreased O3 destruction via the NO titration cycle during this period. In many countries, the 8 h legal limit for O3 of 120 was breached during this time period. Unlike NO2 where concentrations remained below their BAU estimates until the end of the analysis period, O3 concentrations returned to their expected values by the end of July 2020.
3.2 Timing of changes
Figure 4 clearly indicates that concentrations in the first half of 2020 diverged from what was predicted by the counterfactual modelling. To objectively identify the date and magnitude of maximum divergence, change points were identified with a data-driven approach using Bayesian inference. The mean dates when NO2 started to diverge at their greatest extent from the BAU scenarios along with national lockdown dates for six European countries are displayed in Fig. 5. For the complete set of dates for all countries included in the analysis, see Table A1.
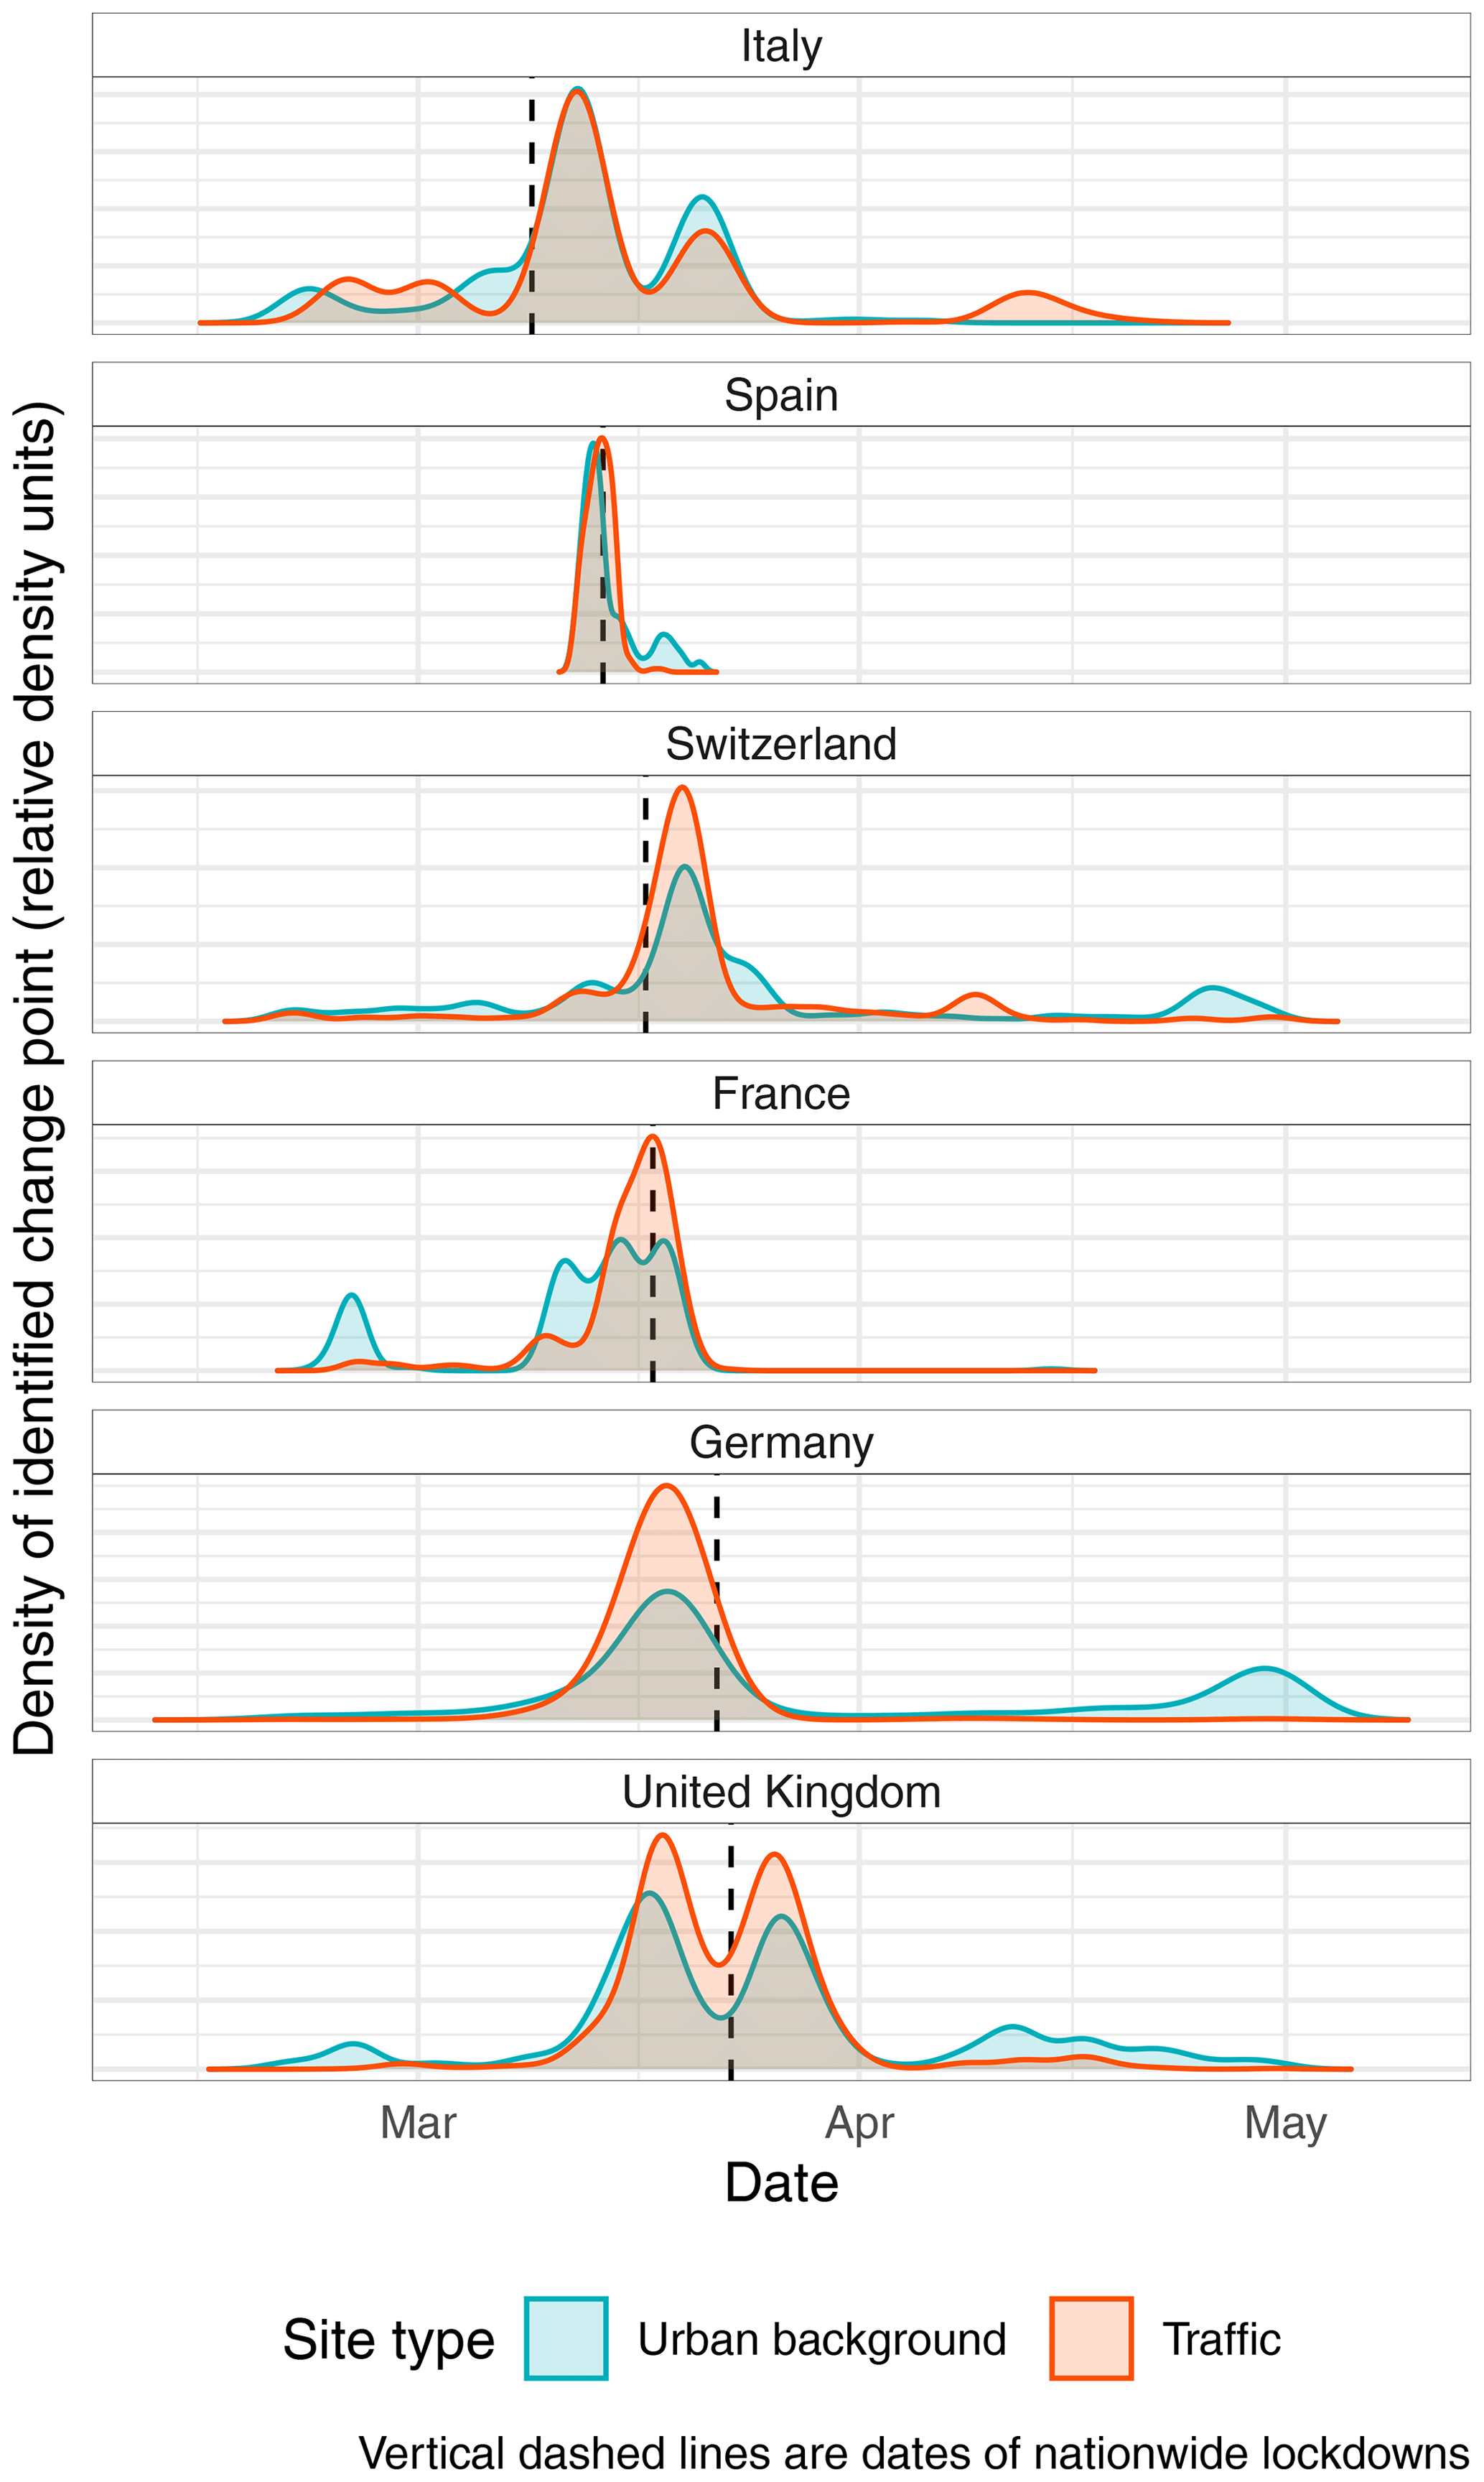
Figure 5Estimated timing of changes to NO2 concentrations for six European countries between March and May 2020. The distribution shown for each country is the dimensionless probability distribution of the estimated change point in concentration. The country panels are ordered by nationwide lockdown date.
For NO2, the change points were between 7 d before and 7 d after the countries' lockdown date (excluding the outlier of Denmark). For O3, this range was greater, between −12 and 8 d. Italy was the first country in Fig. 5 where change points were identified for NO2 concentrations on 13 March 2020, and this was 4 d before Italy's nationwide lockdown date, whereas Spain's NO2 change point was the same as the country's lockdown date. Change points were often identified 1–2 days earlier than the lockdown date when the lockdown began on a Sunday or a Monday (e.g. in Germany). For almost every site included in the analysis, the change points for NO2 were ones of decreases, whereas those for O3 were increases (as seen in Fig. 4).
Figure 5 shows that some countries had very consistent changes in concentrations for the sites that were analysed (e.g. Spain). Changes in other counties were less consistent which may indicate regional differences within countries. The United Kingdom showed two peaks in density for the NO2 change points which were separated by a week. This feature represents a two-phase reduction in emissions because staggered lockdown measures were announced: the first was a set of recommendations for social distancing and not visiting restaurants and other social establishments (on 16 March), whereas the second announcement (23 March) was one of a more strict lockdown.
Although the identified change point dates for NO2 were broadly consistent with the various countries' lockdown dates, the change points for O3 were not aligned as closely (Table A1). There was also no correlation between the magnitude of NO2 reduction and the time required for an O3 change point to be identified. This suggests that secondary O3 generation processes did not immediately respond to reductions in ambient NOx concentrations after lockdowns were imposed due to less NO titration. For this process to be identifiable, O3 generation must occur, and this requires sunlight. Therefore, the lack of sunny conditions in some urban areas around the time of the NO2 atmospheric response may have resulted in varying duration lags before changes in O3 could be observed.
3.3 Concentration changes among different countries
At a European level, the maximum divergence of NO2 and O3 from the counterfactual predictions was reached in late-March 2020 (Fig. 4). However, there was some diversity among European countries' NO2 and O3 divergence from their counterfactuals for the analysis periods (Fig. 6). All of the countries analysed passed their maximum divergences for NO2 and O3 in late April, and the shape of the recovery is that of a “swoosh” with a sharp plunge away from the counterfactual around the date of the individual lockdown implementation (Fig. 6), but this rapid plunge is followed by a slower and more gradual return to the BAU vales until the end of July. This pattern is very much reminiscent of the mobility changes shown in Fig. 1.
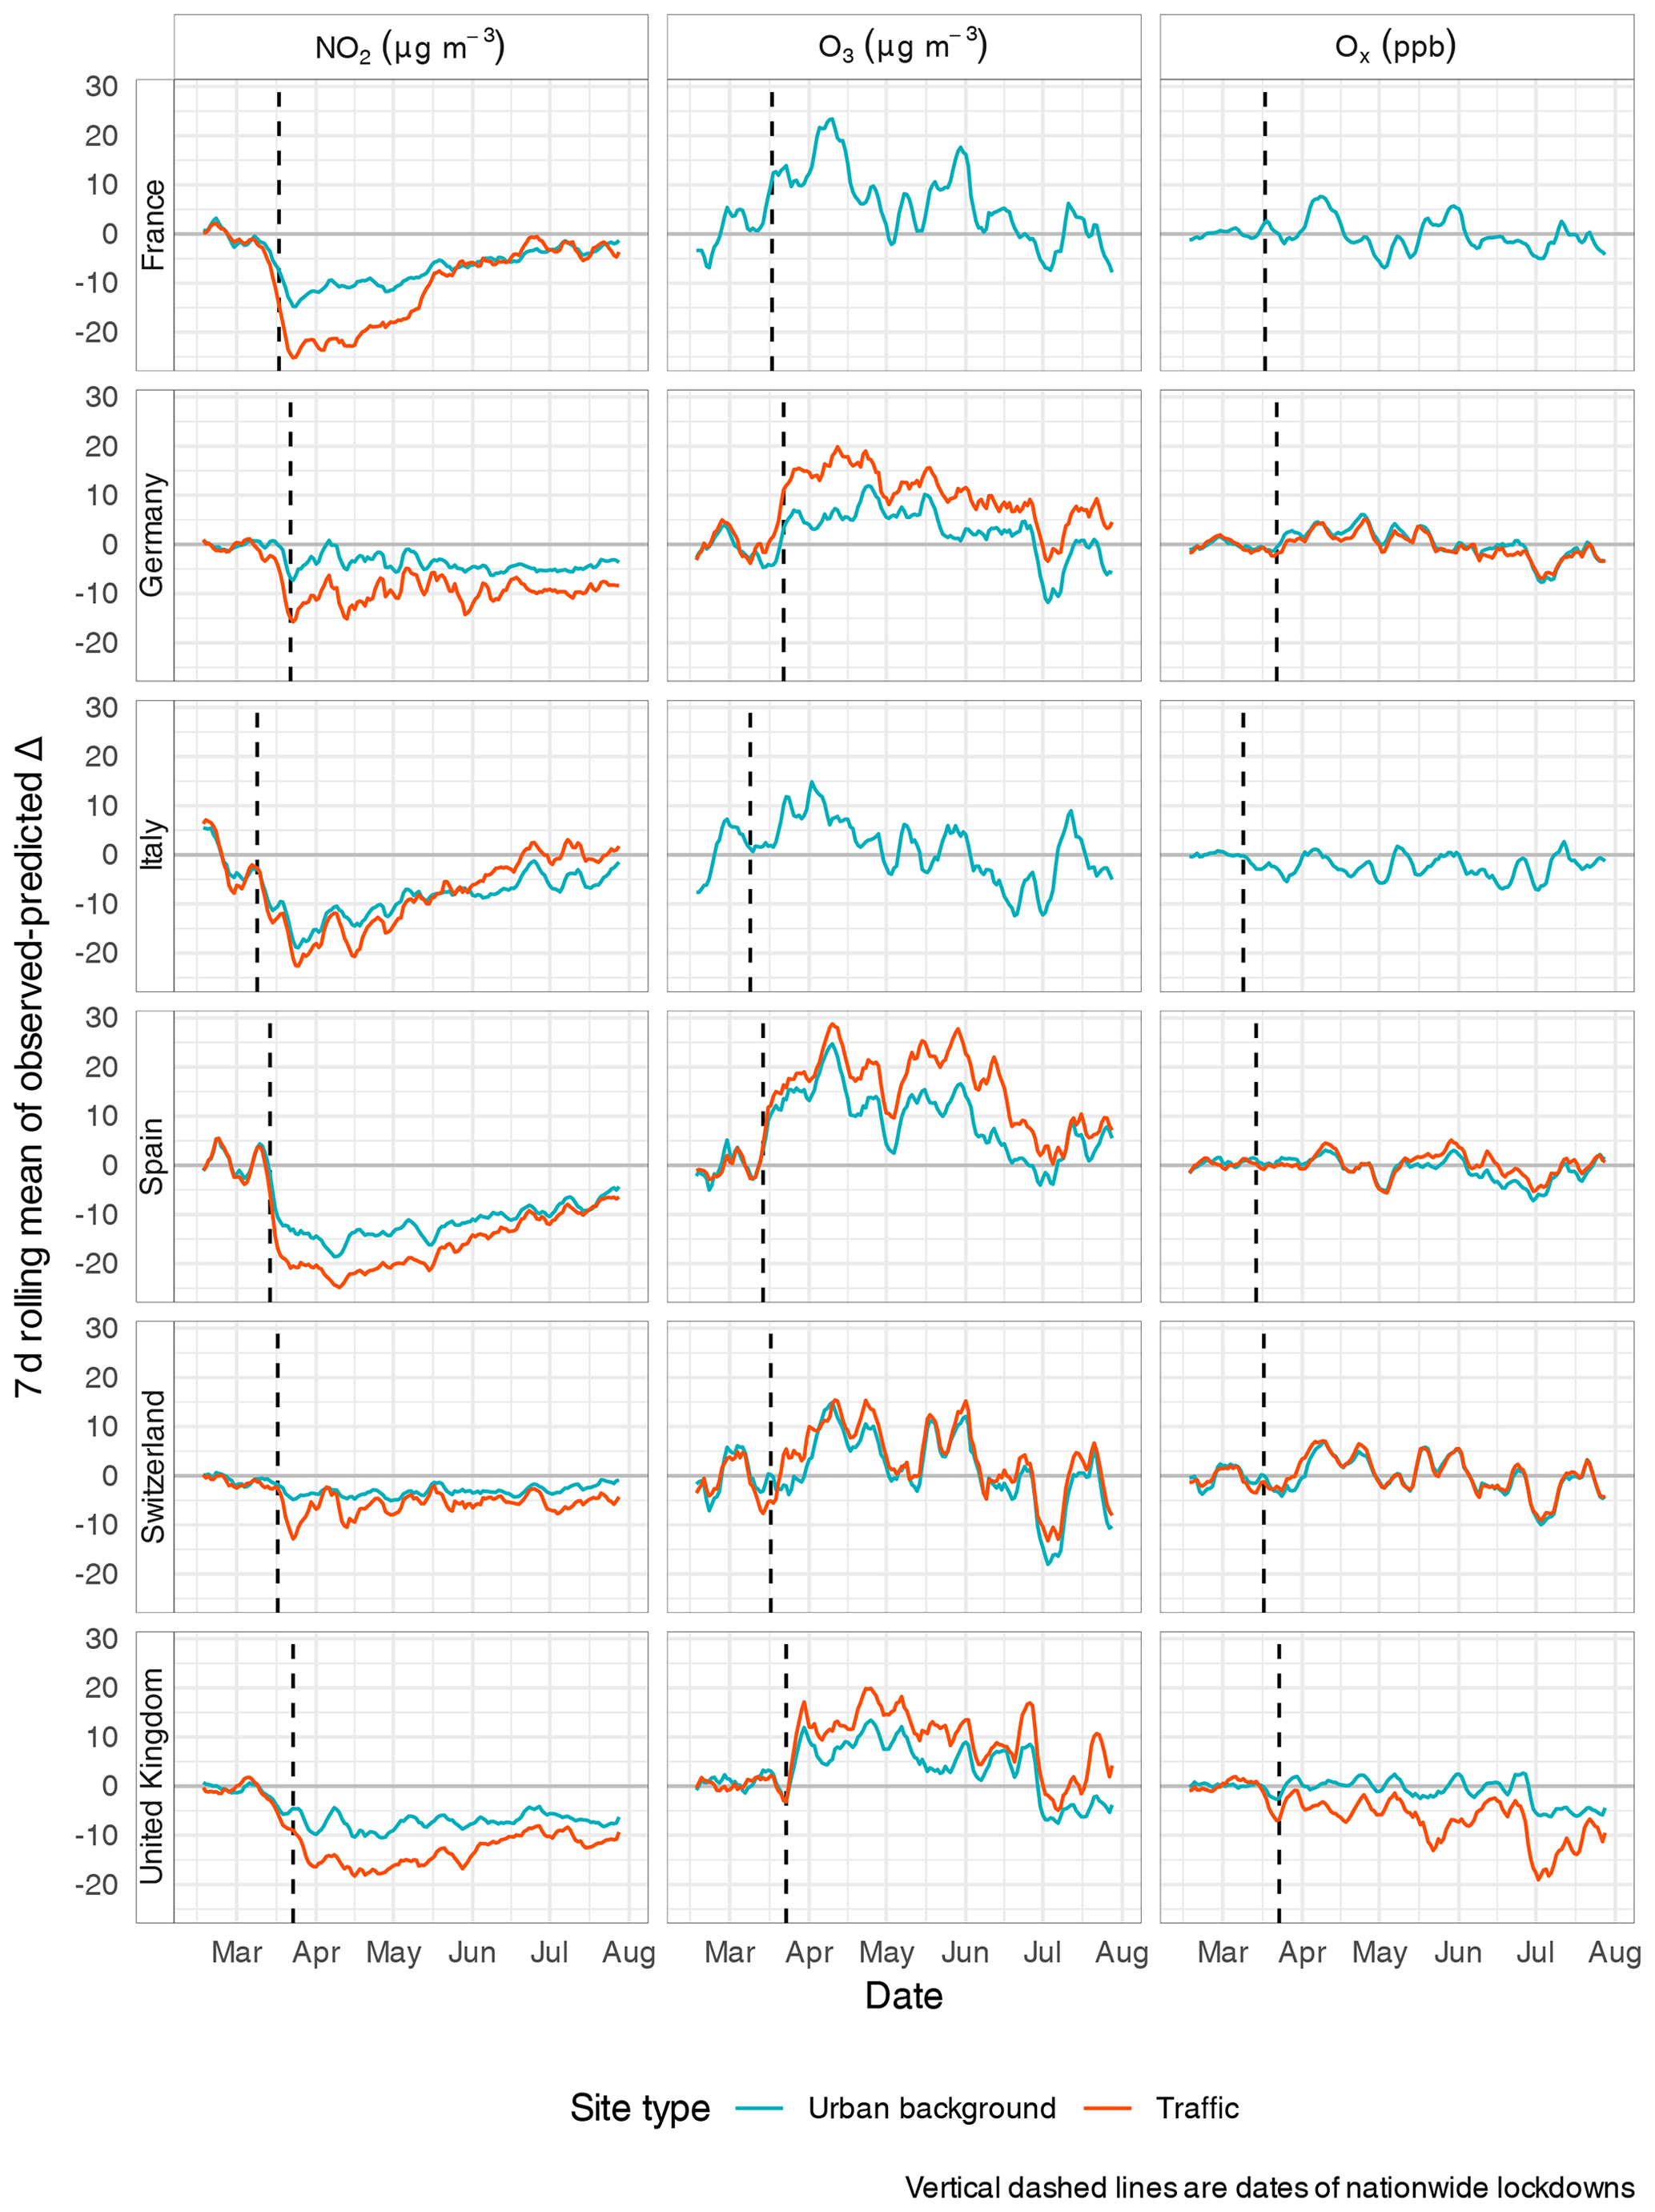
Figure 6The 7 d rolling means of the observed-predicted concentrations' deltas for NO2, O3, and Ox for six selected countries in Europe between 14 February and 31 July 2020.
Some countries experienced a smaller reduction in NO2 than others. Germany and Switzerland, for example, experienced lower NO2 reductions when compared with France, Italy, and Spain. Some countries' greater reductions in ambient NO2 concentrations could be explained by the level of “stringency” of the countries' lockdowns and the resulting changes in mobility (Hale et al., 2020; Google, 2020) (Fig. A2). For example, the German and Swiss measures were very strong recommendations with few legally enforceable restrictions on recreational or leisure activities, whereas France, Italy, and Spain had more stringent requirements where movement and travel were restricted and enforced in a much stronger manner. It is very likely that these different levels (or enforcement) of restrictions had implications for emissions of atmospheric pollutants. However, meteorological conditions, perhaps similar synoptic-scale patterns likely played a role in the differences observed among the countries too.
After late April, concentrations moved towards their predicted counterfactual values, and this continued to the end of the analysis period (Fig. 6). Some European countries began to remove lockdown restrictions in the second half of April which increased traffic-sourced emissions, and this is consistent with the observations in Figs. 4 and 6. O3 concentrations returned to approximately their BAU levels by the end of July, but NO2 had yet to do so at the end of the analysis period, with the exception of Italy. This indicates that NOx emissions (mostly traffic-sourced) had not yet reached their estimated BAU levels by the end of July across most of Europe after the country lockdowns were released.
3.4 Quantifying the changes in concentrations
The change point dates identified by Bayesian inference shown in Fig. 5 and Table A1 were used to classify the time series as pre-lockdown, within lockdown, or post-lockdown periods. With this classification, concentrations were compared to calculate concentration deltas and percentage changes. At a European level, the mean NO2 percentage changes for NO2 at traffic and urban background sites were −34 % (95 % CI ) and −32 % (95 % CI ) respectively (which equalled respective concentration reductions of −11 and −7 µg m−3). The European annual NO2 standard is 40 , and the mean reduction of 11 µg m−3 is 27 % of the legal limit (European Commission, 2019). For O3, the mean European percentage changes for traffic and urban background sites were estimated to be 30 % (95 % CI [26, 35]) and 21 % (95 % CI [18, 24]) respectively, and the respective concentration changes were 12 and 9 µg m−3. The concentration deltas and percentage changes attributed to the European lockdown measures are listed by country and site type in Table 1.
Table 1Mean concentration deltas or differences and percentage changes in NO2, O3, and Ox for different countries and site types attributed to COVID-19 lockdown measures in March 2020. Missing values indicate that there were no data available, and NC indicates that no change point was identified.

To put these concentration changes into context, NO2 and O3 trend analysis between 2010 and 2019 for the 246 sites was conducted. Based on the sites that had a complete data record, the mean trends were −1.44 and −0.72 for NO2 at traffic and urban background locations respectively, whereas O3 trends in the same respective environments were 0.2 and 0.49 . Therefore, at the roadside, the mean reduction in NO2 across Europe due to the COVID-19 lockdown measures was equivalent to that of 7.6 years of continued concentration reduction or to the anticipated European atmosphere in 2028 (Fig. 7). O3, however, increased at an equivalent of 17 years of the rate of change determined by trend analysis in urban background locations. These calculations have not been done to predict future concentrations, only to put the changes experienced between March and July 2020 into context.
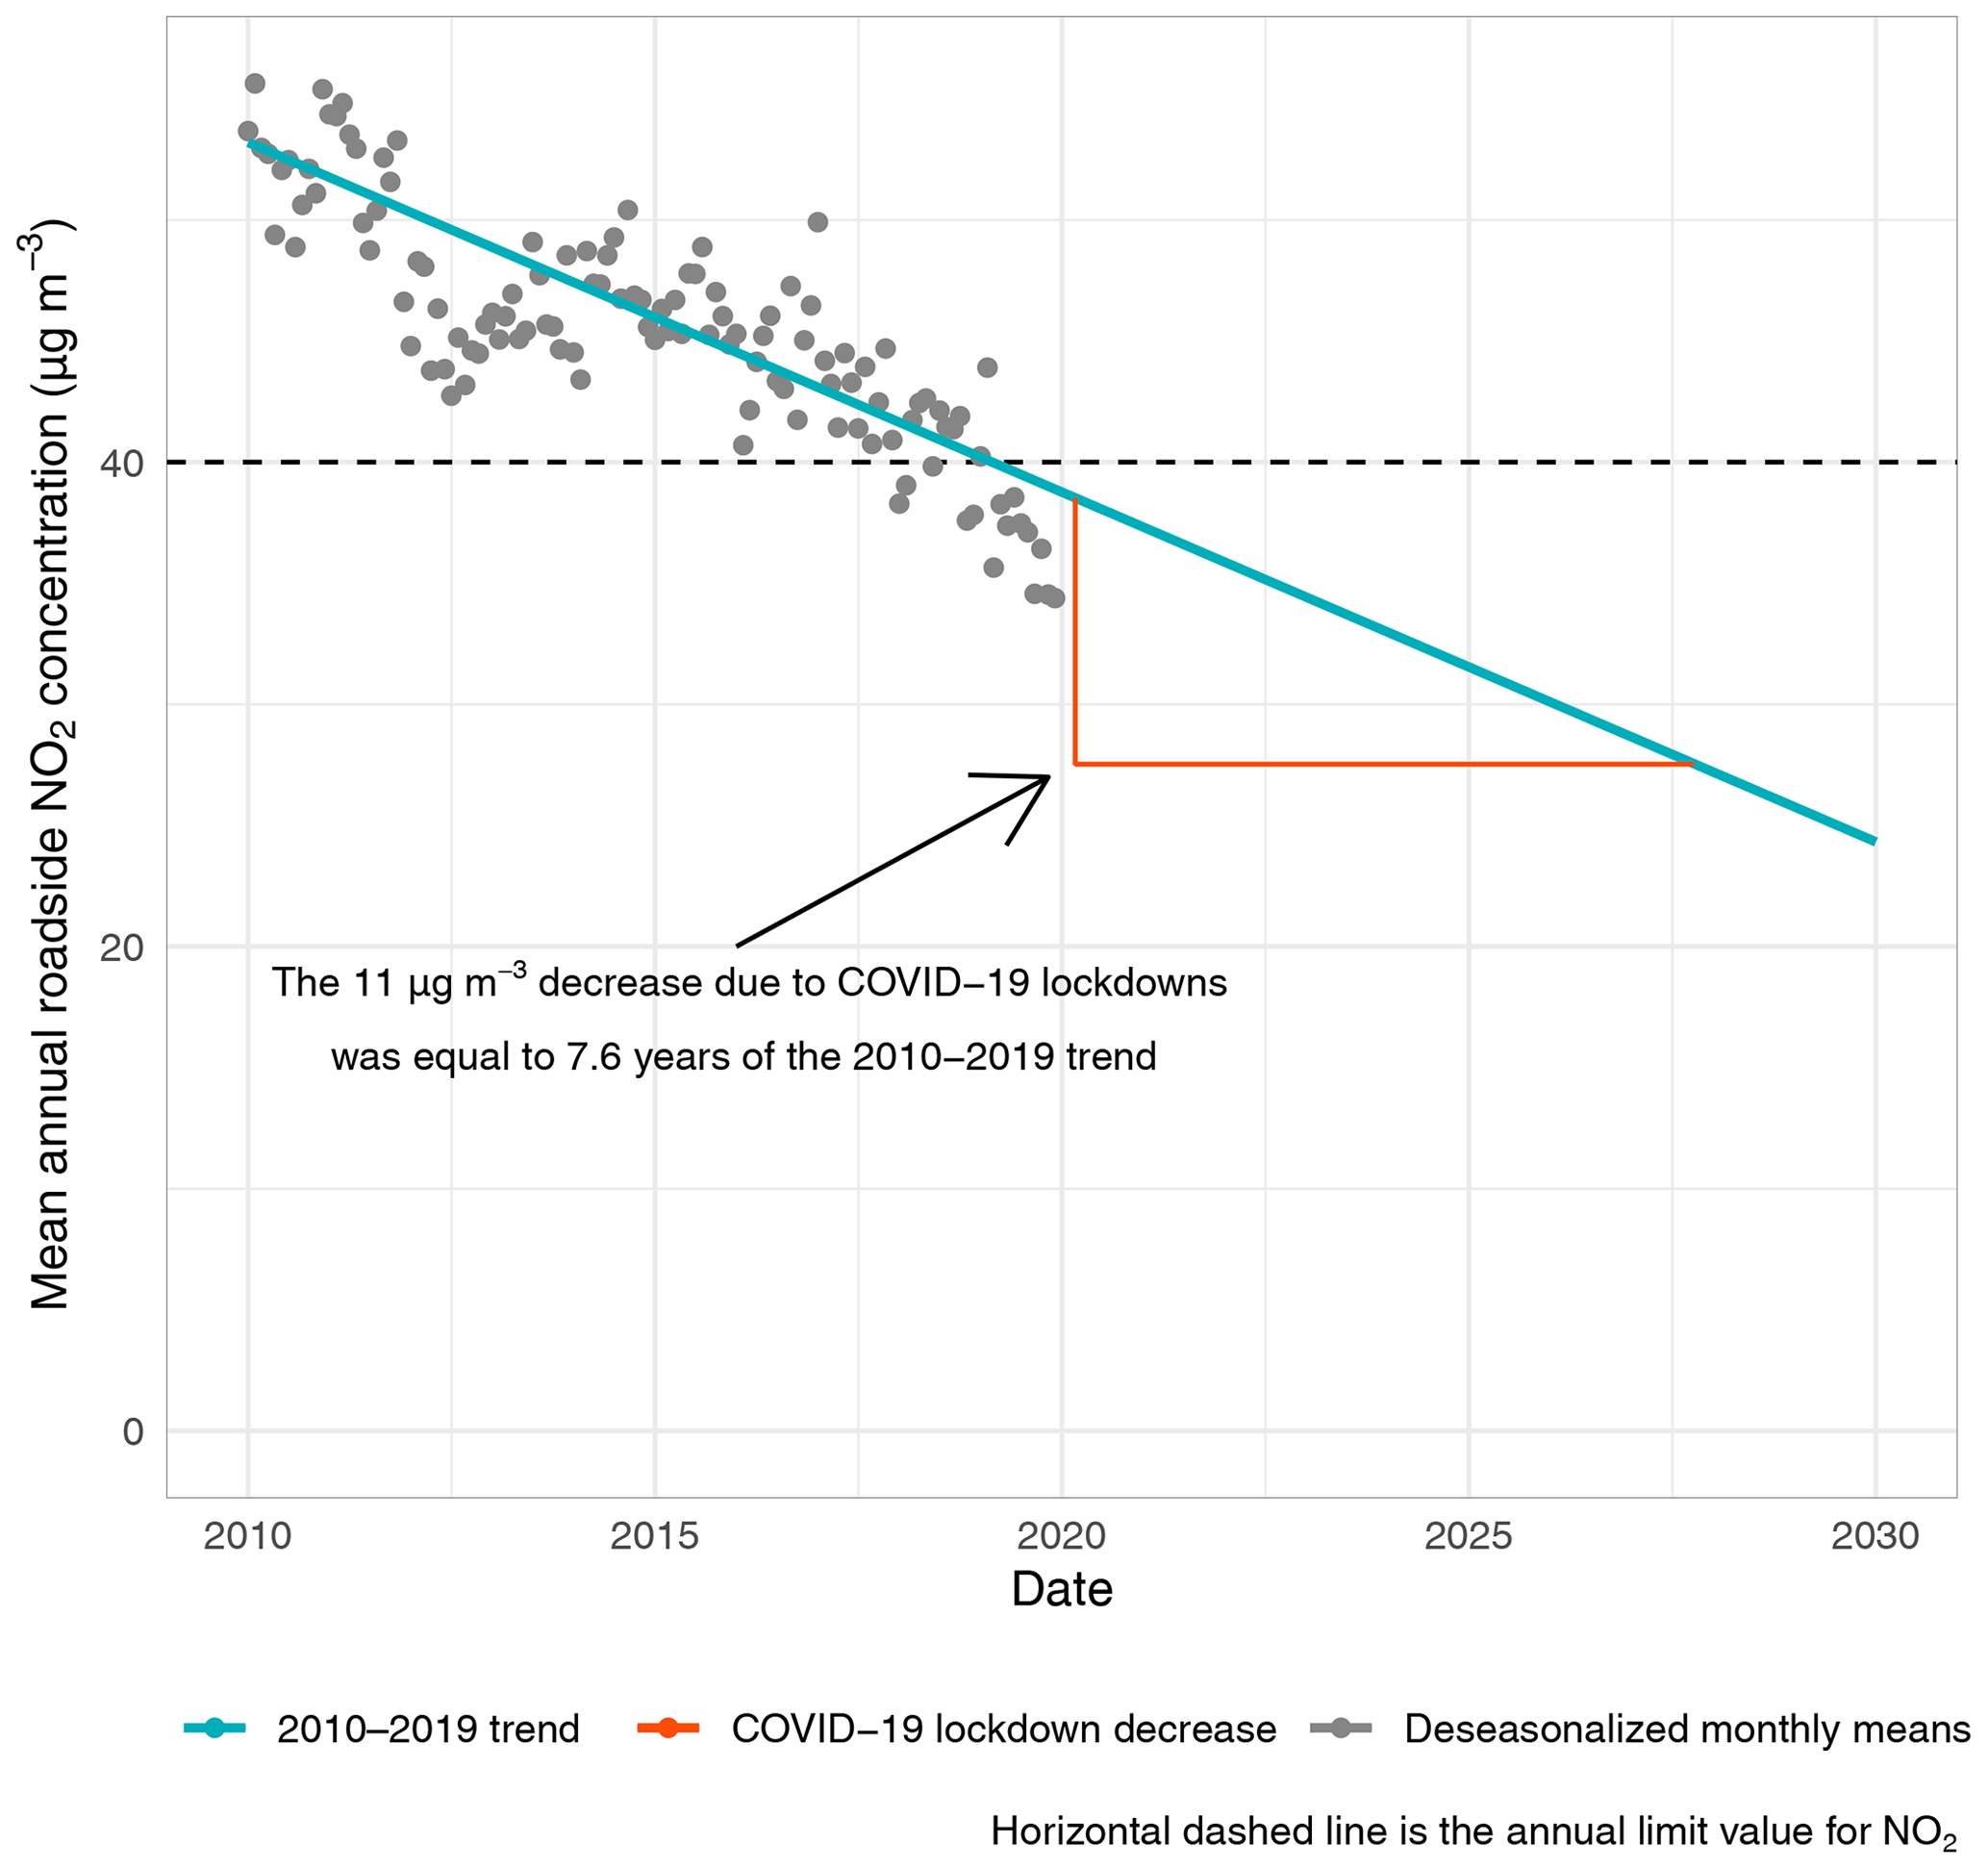
Figure 7Mean European roadside NO2 trend with the reduction in NO2 concentrations attributed to the COVID-19 lockdowns put into context.
The changes at traffic sites will strongly reflect the influence of changes in traffic activity in close proximity to each site for NOx, NO2, and O3. Close to roads, the origins of NO2 can be thought of as the combination of a background component, a component which is generated from the fast reaction between vehicular NO emissions and O3, and directly emitted (primary) NO2. The primary NO2 contribution is known to have decreased in recent years from a peak around 2010. In London, for example, the analysis of 35 traffic-influenced sites showed a reduction in the mean vehicle emission ratio from around 25 % in 2010 to about 15 % in 2014, (Carslaw et al., 2016), whereas at a European level, the emission ratio peaked at 16 % (also in 2010) (Grange et al., 2017). This decrease is believed to be driven by improvements in selective catalytic reduction control systems used on vehicles to reduce NOx and also by the effect of ageing of diesel oxidation catalysts (Carslaw et al., 2019).
The decrease in primary NO2 emissions over the past decade would have acted to reduce ambient NO2 concentrations close to roads. Indeed, if the traffic reductions experienced across Europe through country-wide lockdowns had occurred closer to 2010, the reductions in road vehicle NO2 emissions would have been much more important with respect to affecting ambient concentrations than was experienced in early 2020.
The posterior draws (a type of model prediction) from the change point models show that the decrease in traffic volumes during the COVID-19 lockdowns reduced NO2 concentrations in some countries to levels experienced at urban background locations (e.g. the United Kingdom shown in Fig. 8). The roadside increment in NO2 above urban background concentrations diminished considerably over lockdown due to large reductions in vehicle activity. However, as discussed above and shown in Fig. 8, O3 increased in response to the reductions in NO2, and Ox only altered very slightly. The patterns seen in the United Kingdom were also experienced in other European countries, such as France and Spain, but were not as clear for counties such as Switzerland and Germany (Table 1).
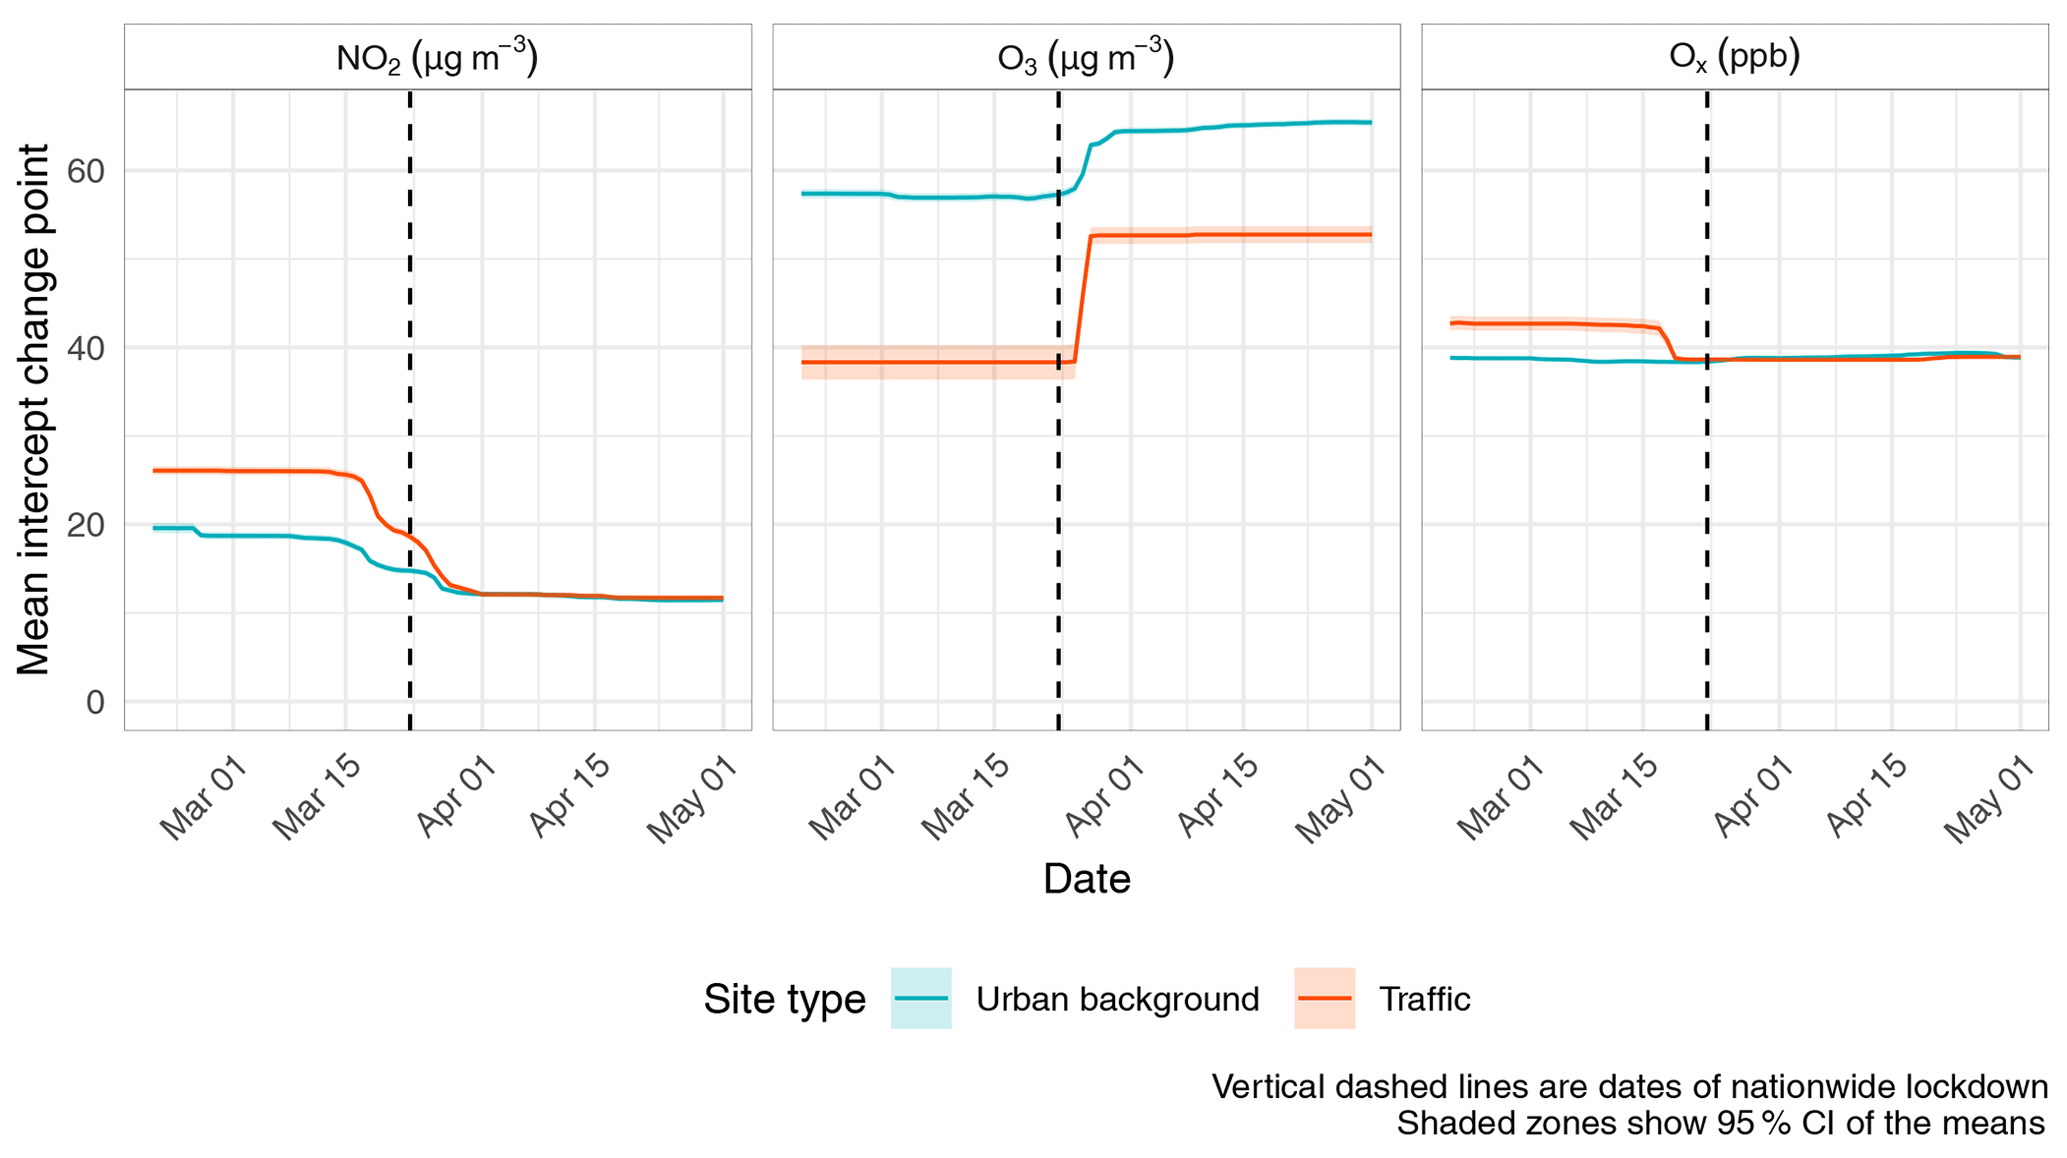
Figure 8Posterior draws for NO2, O3, and Ox two-intercept change point models for the United Kingdom between March and May 2020.
3.5 Ox–NO2 and O3 repartitioning
Figures 4 and 6 demonstrate that NO2 concentrations and emissions decreased throughout Europe due to the COVID-19 lockdown measures, especially at the roadside. However, the reduction in NO2 was accompanied by an increase in O3 at a similar magnitude and resulted in Ox showing little change despite the large reductions in traffic-sourced NO2 (e.g. Fig. 8).
Mean European changes in Ox were variable between the two site environments. At traffic sites, Ox decreased by −1 ppb (−1.8 %; 95 % CI ), whereas in urban background locations, Ox increased by 0.7 ppb (2.1 %; 95 % CI ). In the case of the traffic sites, the modest decrease in Ox can be partially explained by decreased emissions of primary NO2 (Grange et al., 2017). However, in urban background locations, Ox remained nearly constant. This is a very important observation for European air quality management, as it suggests that the 34 % reduction in NO2 concentrations was equalled by a similar absolute increase in O3, which is clearly an undesirable outcome due to the deleterious effects of O3 on population health, buildings, and vegetation.
The repartitioning of NO2 to O3 is of importance from a public health perspective. As Williams et al. (2014) argued, there are good reasons from an atmospheric chemistry perspective to consider NO2 and O3 together in epidemiological studies, rather than either of the two pollutants separately in single-pollutant models. Indeed, Williams et al. (2014) found that there were larger associations (with mortality) for mean 24 h concentrations of Ox than for either O3 or NO2 individually. On this basis, the current analysis suggest that the health impacts may have been small because Ox concentrations changed little in urban environments. The analysis conducted here was exclusively concerned with daily mean O3 concentrations and does not explore the subtleties associated with peak and/or increases in daily minima O3 concentrations, which are also important when considering the deleterious effects of O3.
Efficacious management of O3 has proven to be a challenge in Europe and in many other locations around the world (Sillman, 1999; Wang et al., 2017; Chang et al., 2017; Li et al., 2019). The struggle with O3 control is partly due to the highly non-linear chemistry of O3 production based on its precursors: volatile organic compounds (VOCs) and NOx. There are two regimes – a NOx-sensitive regime and a VOC-sensitive regime – and the Ox analysis presented here strongly suggests that O3 production is overwhelmingly VOC-sensitive across urban Europe. Therefore, if higher O3 concentrations are to be avoided in the future, when reductions in NOx emissions of the scale seen in lockdown are likely, enhanced control of VOC emissions will be critical in the European urban environment. The prominence given to NO2 as a pollutant following the “Dieselgate” scandal of 2015 (Anenberg et al., 2017) has led to far more ambitious NO2 emission reduction policies in Europe than are currently in place for VOCs.
VOCs are only measured routinely at a few locations throughout Europe's urban areas, and they represent a broad class of pollutants that are emitted from a wide range of sources. Whilst VOC emissions were dominated by gasoline vehicle emissions (both tailpipe and evaporative) in the 1980s and 1990s, their abundance has become increasingly influenced by non-transport sources such as natural gas leakage, biogenic emissions, and wider solvent use in more recent years (Lewis et al., 2020).
Data from the London Eltham site, the only suburban VOC monitoring site in the United Kingdom, indicate that lockdown did not lead to significant changes in overall emissions or atmospheric concentrations for many VOCs (Fig. A3). A conclusion from this albeit anecdotal evidence would be that further reductions in only traffic-related VOC emissions would not likely generate the desired air quality improvements in O3 and that reducing emissions from other sectors would be essential.
Although outside of scope of the current work, an obvious avenue for future research is to further explore how individual VOC concentrations responded during the lockdown periods in European urban areas in order to evaluate the proportion of VOCs that still come from traffic. This, combined with chemical modelling on a species-by-species basis to fully assess O3 production chemistry, would help direct where future VOC reduction strategies should be focused. An analysis such as this would also strongly benefit from access to NOx (or NO and NO2) data which, arguably, would be a better pollutant to analyse than NO2 from an emissions perspective. We strongly encourage the institutions involved with reporting ambient air quality data to the European Environment Agency to include NOx alongside the legally required NO2 observations for the air quality community.
This work represents a classic air quality data analysis where atmospheric responses are linked to an intervention measure. In this case, the intervention was an unplanned, likely unique, and extreme event with very different characteristics when compared with typical intervention measures such as the introduction of new emission standards and low-emission zones. Despite the extreme nature of the COVID-19 lockdowns and their results being much more impactful on urban atmospheric composition than other policies over a short time period, the analysis still demonstrates the difficulty of detecting “change upon change” for atmospheric pollutants – especially for locations where concentrations are close to background. However, this analysis presents a robust and portable framework for intervention analysis using a combination of machine-learning-derived counterfactuals and change point analysis to identify the timing and magnitude of an atmospheric response.
Analysis of the effect of the European COVID-19 lockdowns on NO2, O3, and Ox concentrations combining machine-learning-derived BAU modelling and Bayesian change point models indicate that NO2 concentrations decreased by 34 % at roadside locations. However, the widespread reductions in NO2 concentrations were accompanied by increases in O3 of a similar magnitude (30 %); thus, Ox concentrations only changed very slightly due to the lockdowns when considering Europe as a whole.
This insight has important implications for the implementation of future air quality management policies. The COVID-19 lockdown conditions give a glimpse of a realistic, and indeed likely, future environment where NOx emissions continue to decrease at their current rate, primarily due to the increasing stringency of vehicular emission standards (Carslaw et al., 2016; Grange et al., 2017). The future reduction of NOx concentrations will likely result in repartitioning of Ox and the increase in O3 concentrations across most European urban areas. Although increases in European O3 concentrations have been acknowledged, the further rise should be pre-empted by the European air quality management community through increased focus on VOC emission controls and the more holistic combined management of NO2, O3, and VOCs. This will allow for continued improvements to air quality in a general sense, rather than focusing on reductions in individual pollutants.
Table A1Most commonly identified dates when observed and BAU-modelled concentrations diverged in March 2020. Missing dates indicate that no change point was detected in March 2020.
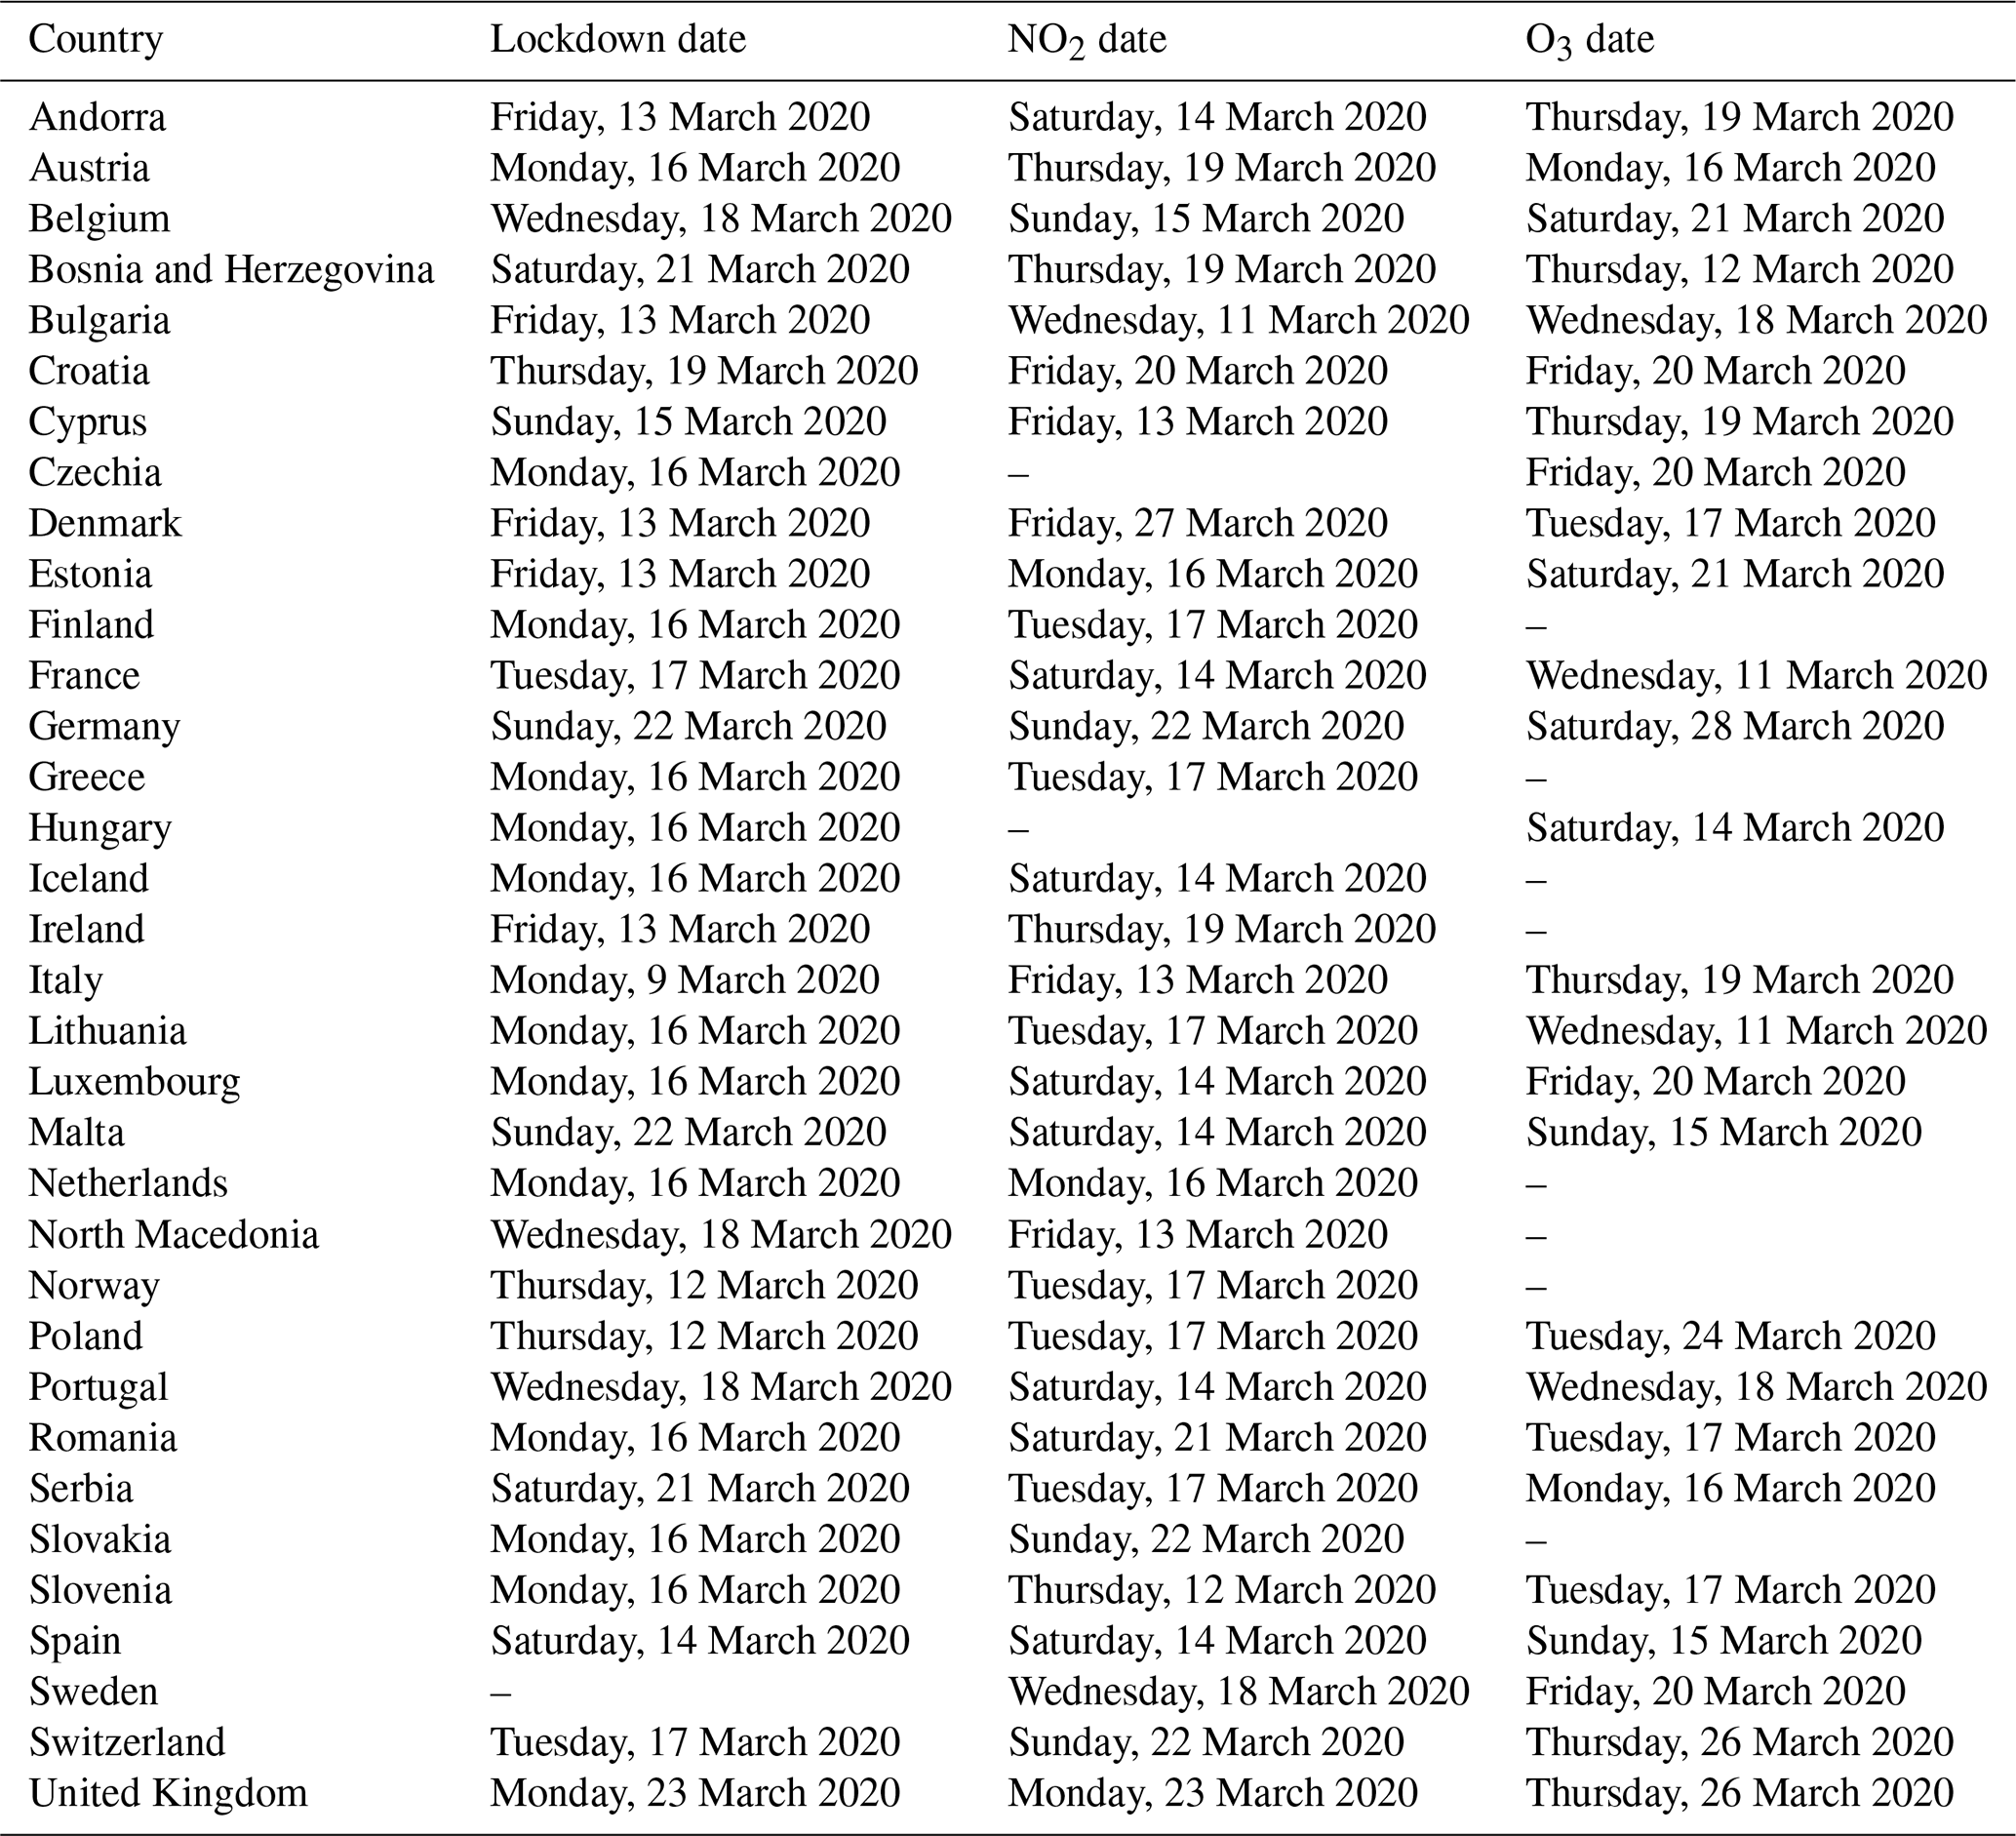
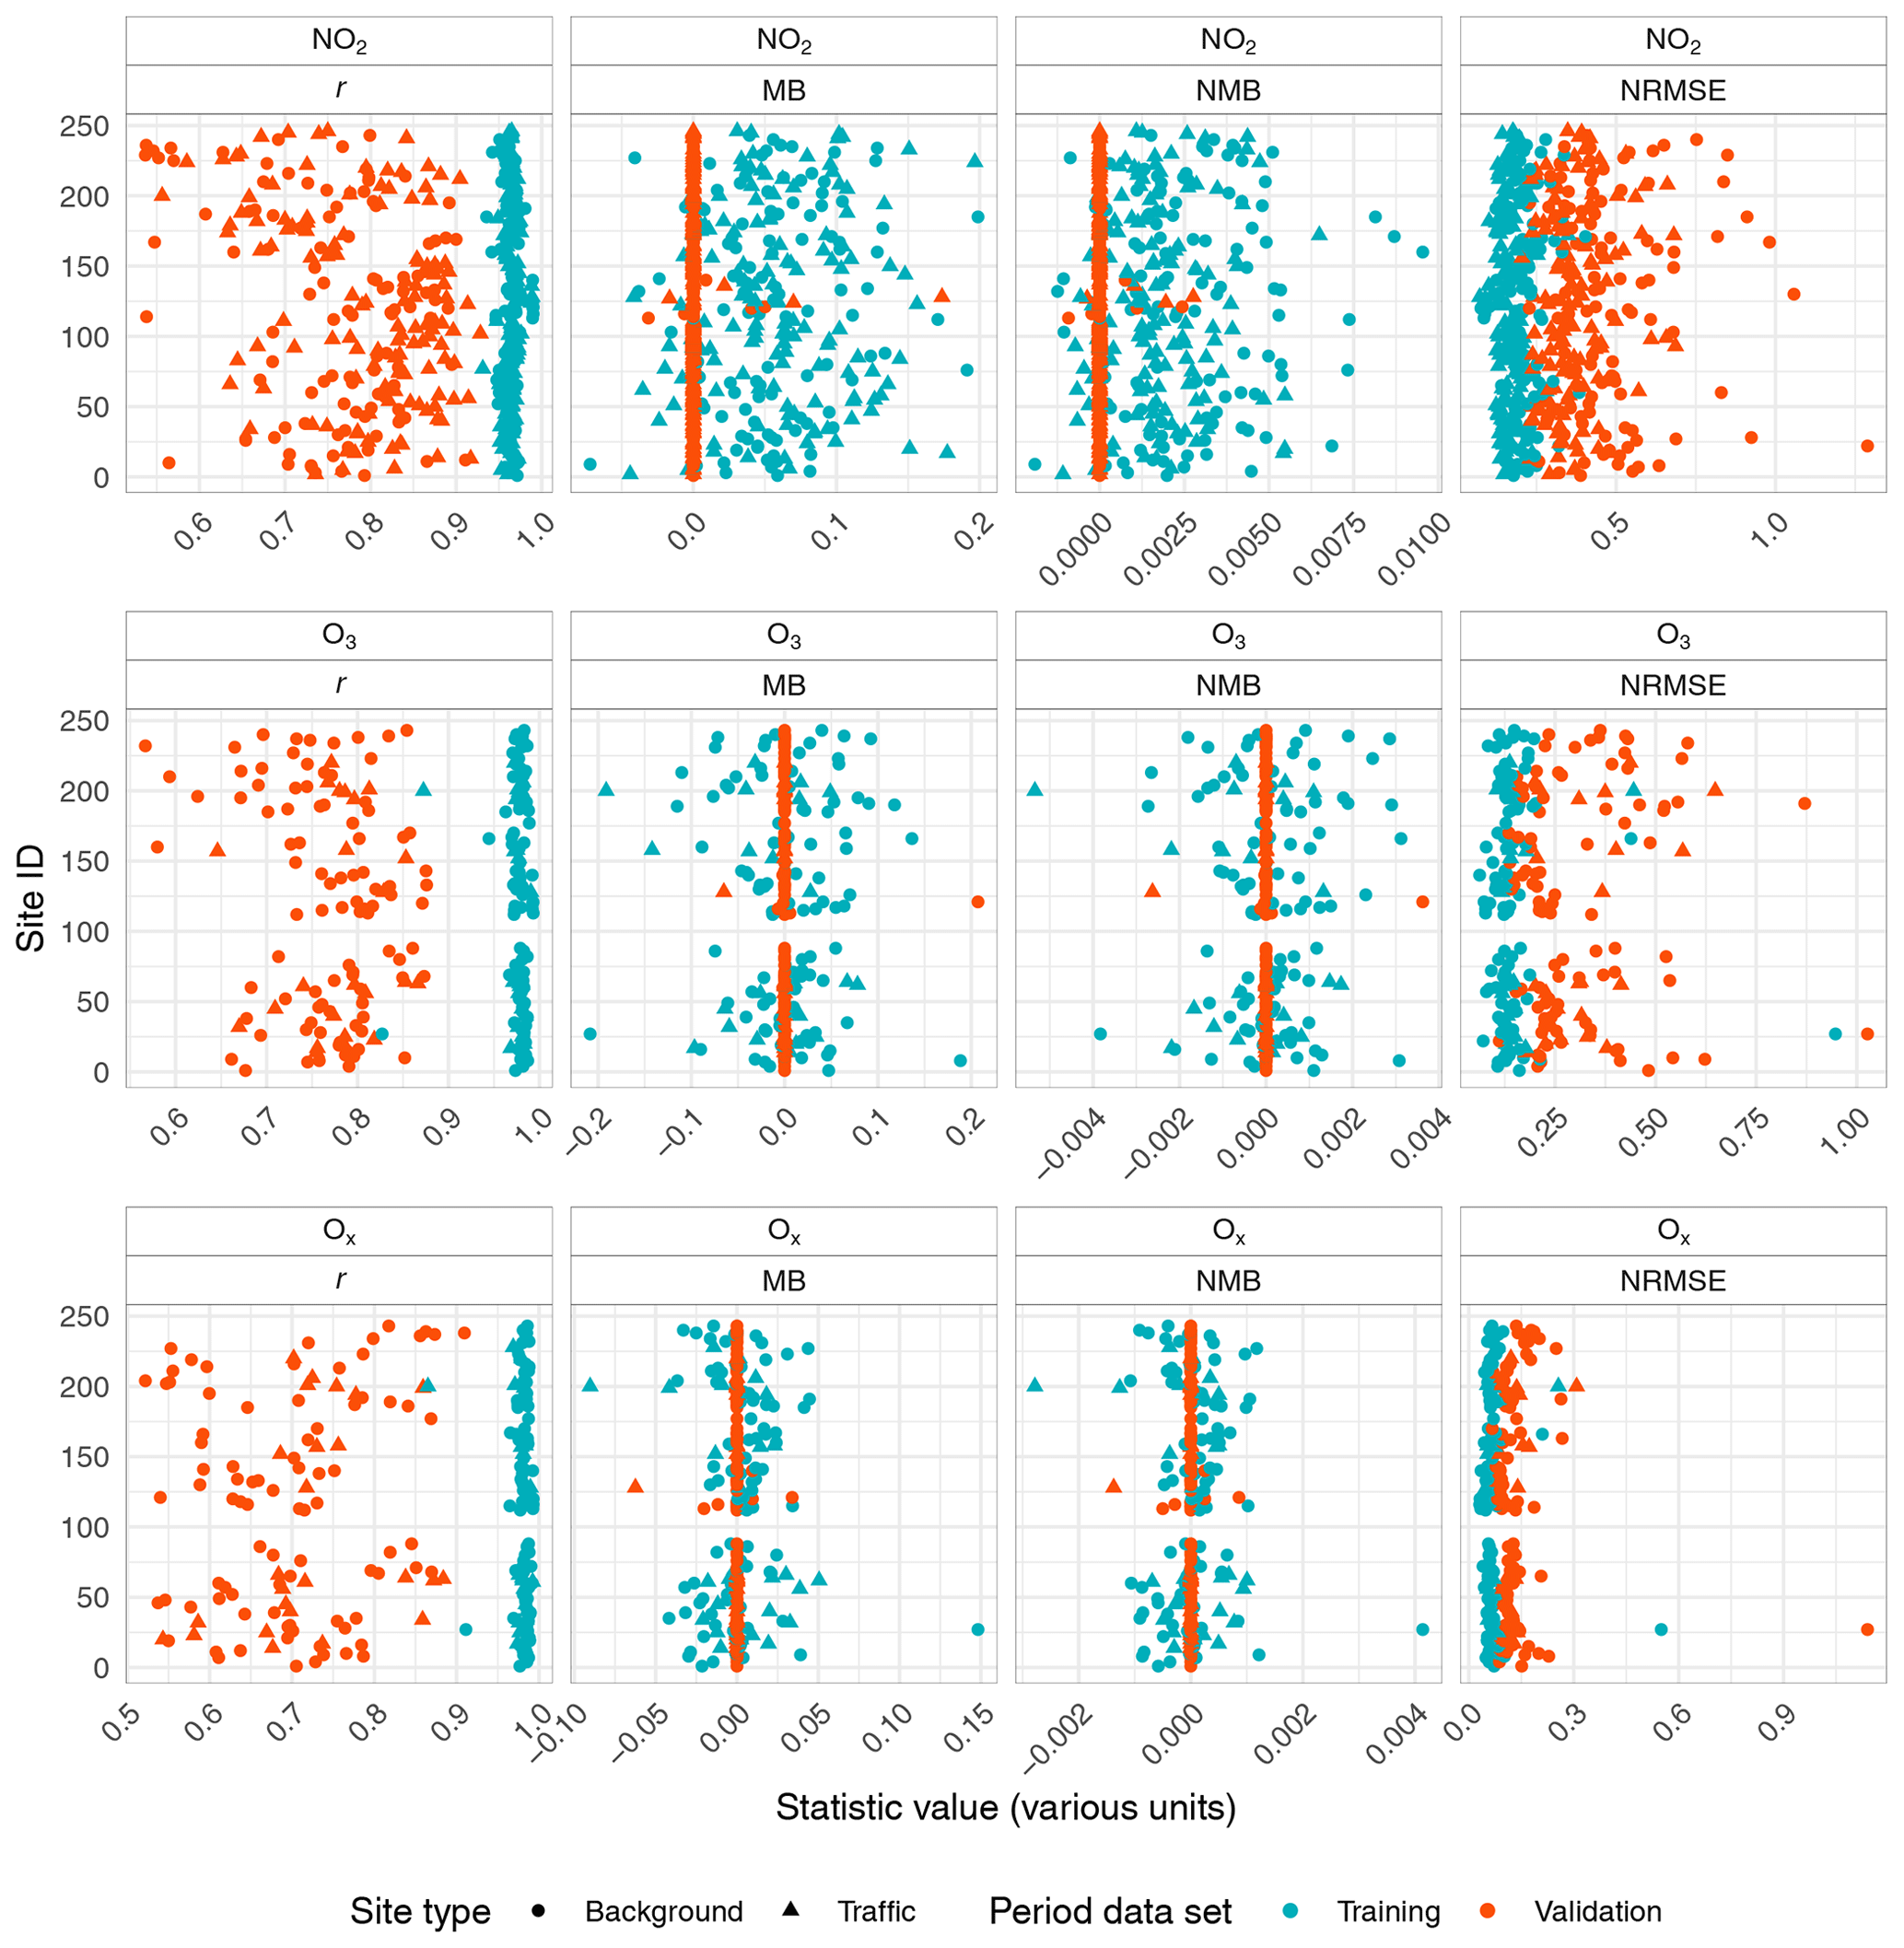
Figure A1Model error summaries for all monitoring sites' (coded as integers) NO2, O3, and Ox models for two data sets: training sets and validation sets. The error summaries are the Pearson's correlation coefficient (r), the mean bias (MB; in µg m−3), the normalized mean bias (NMB), and the normalized root-mean-square error (NRMSE). The normalized values were normalized by the observed mean.
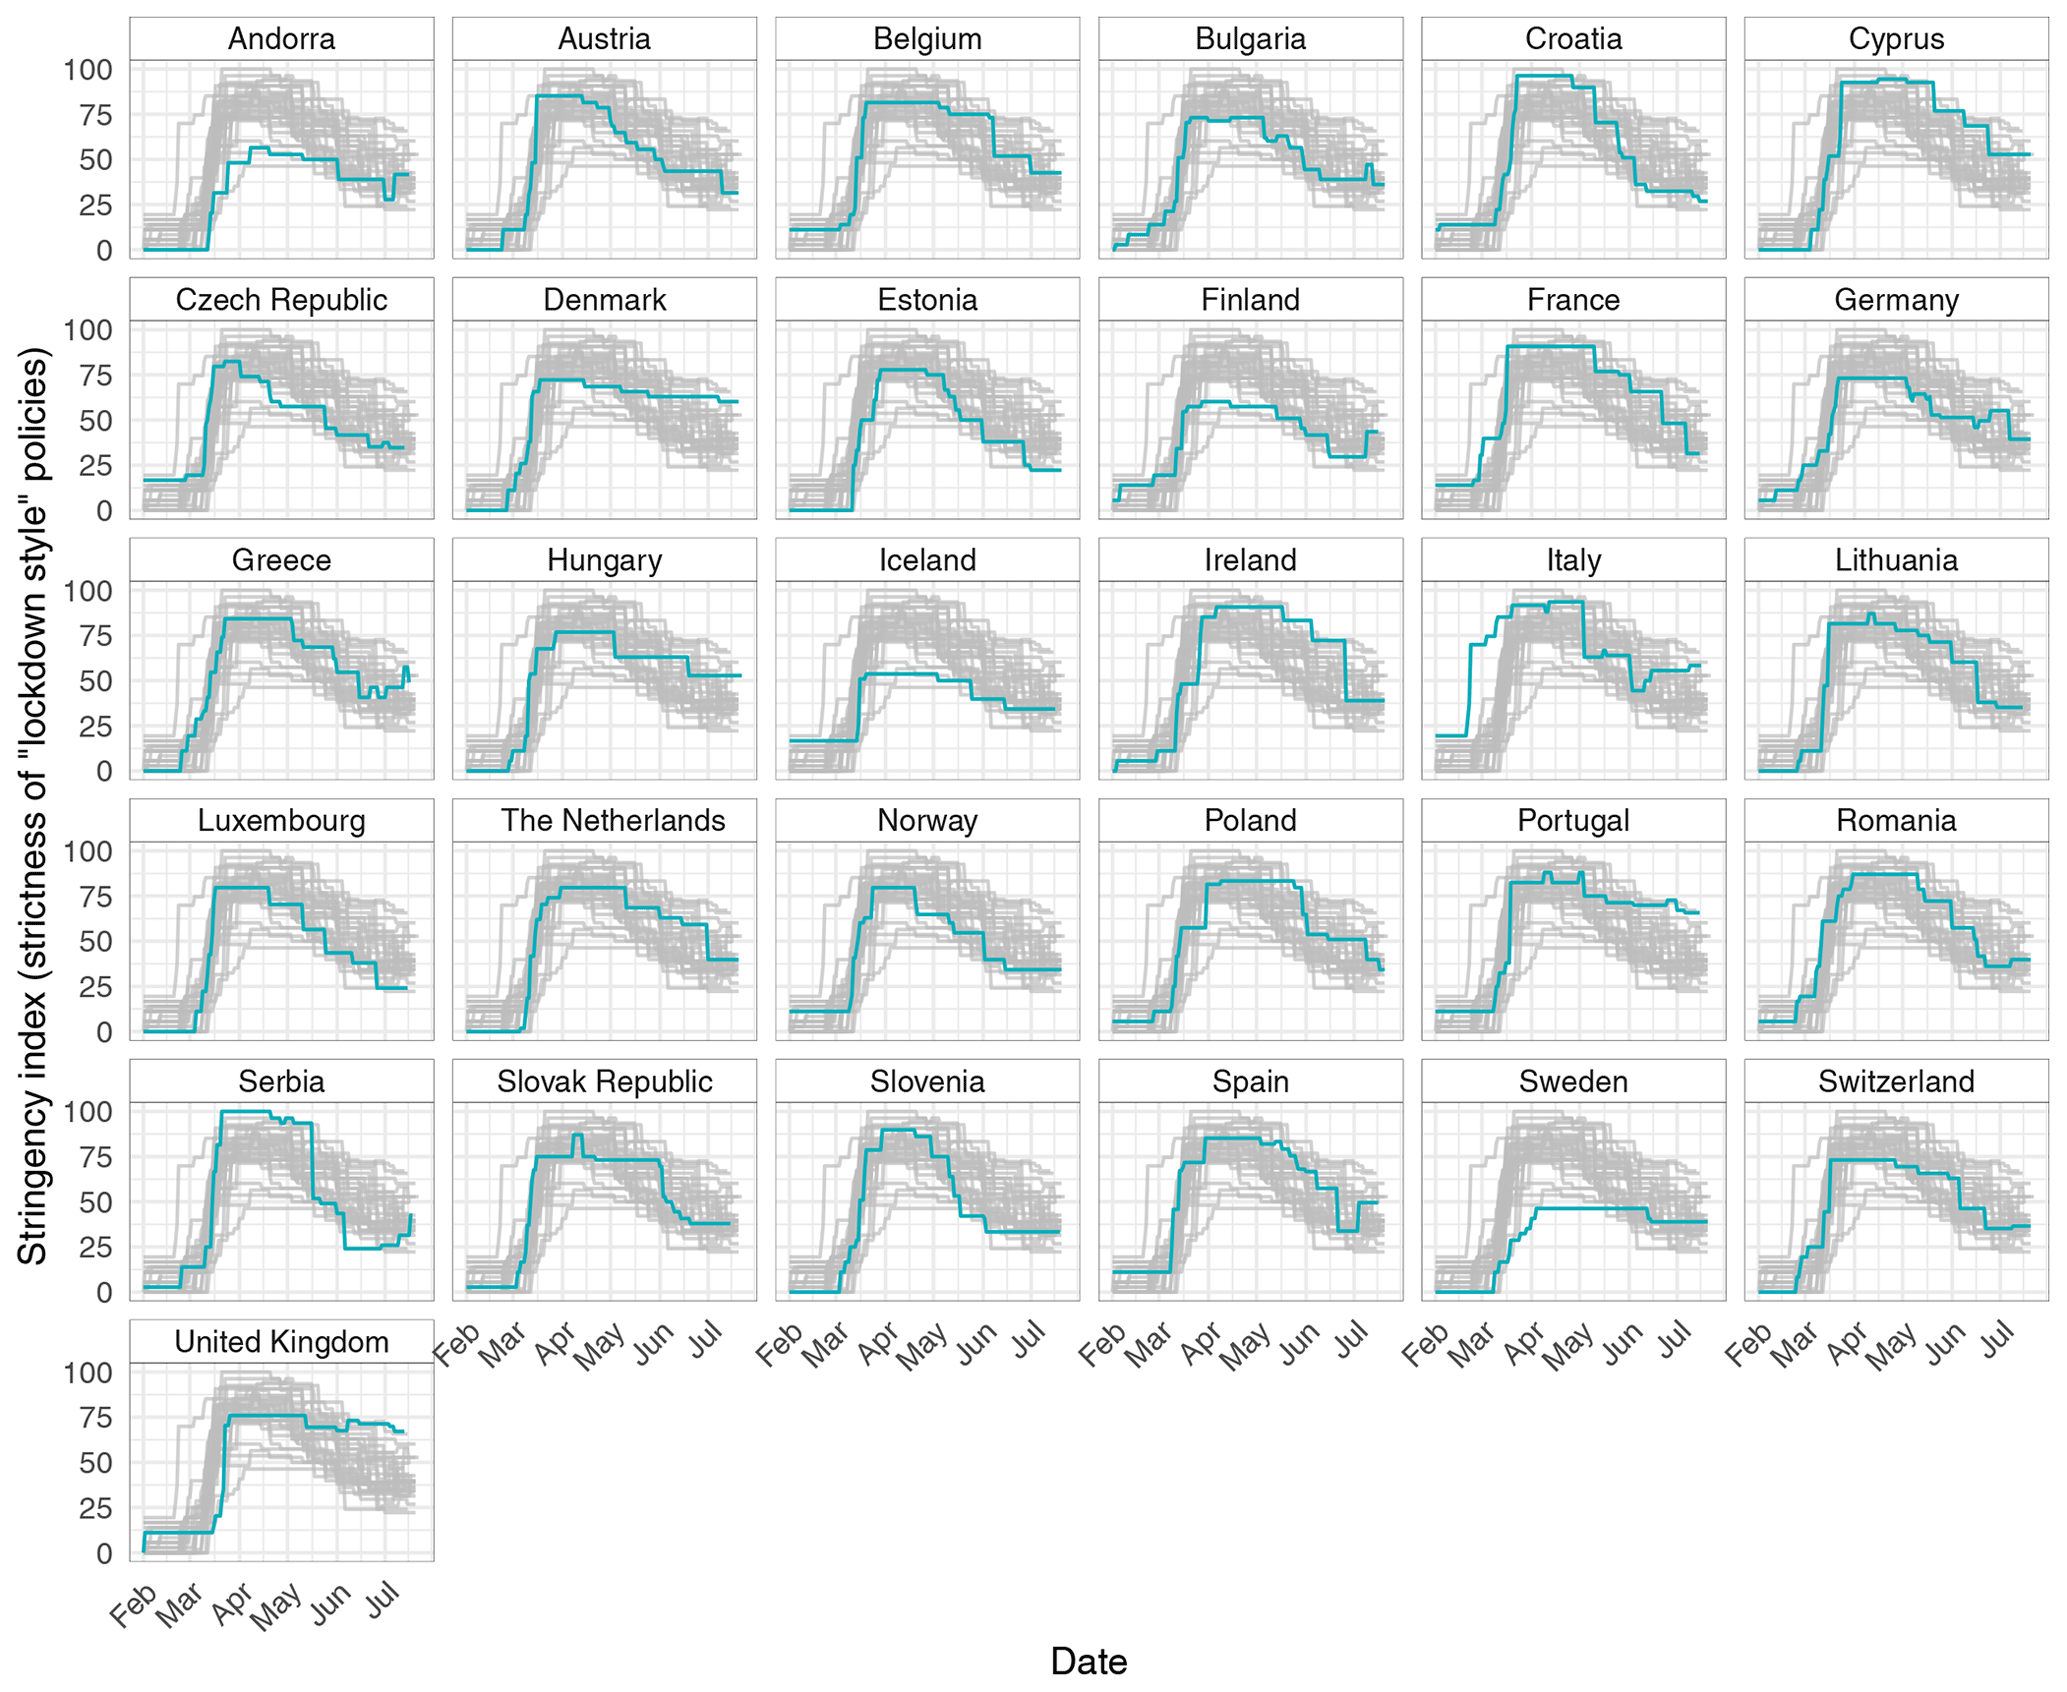
Figure A2The Oxford COVID-19 Government Response Tracker (OxCGRT) stringency index of COVID-19 lockdown measures imposed by different countries' governments between February and July 2020 (Hale et al., 2020).
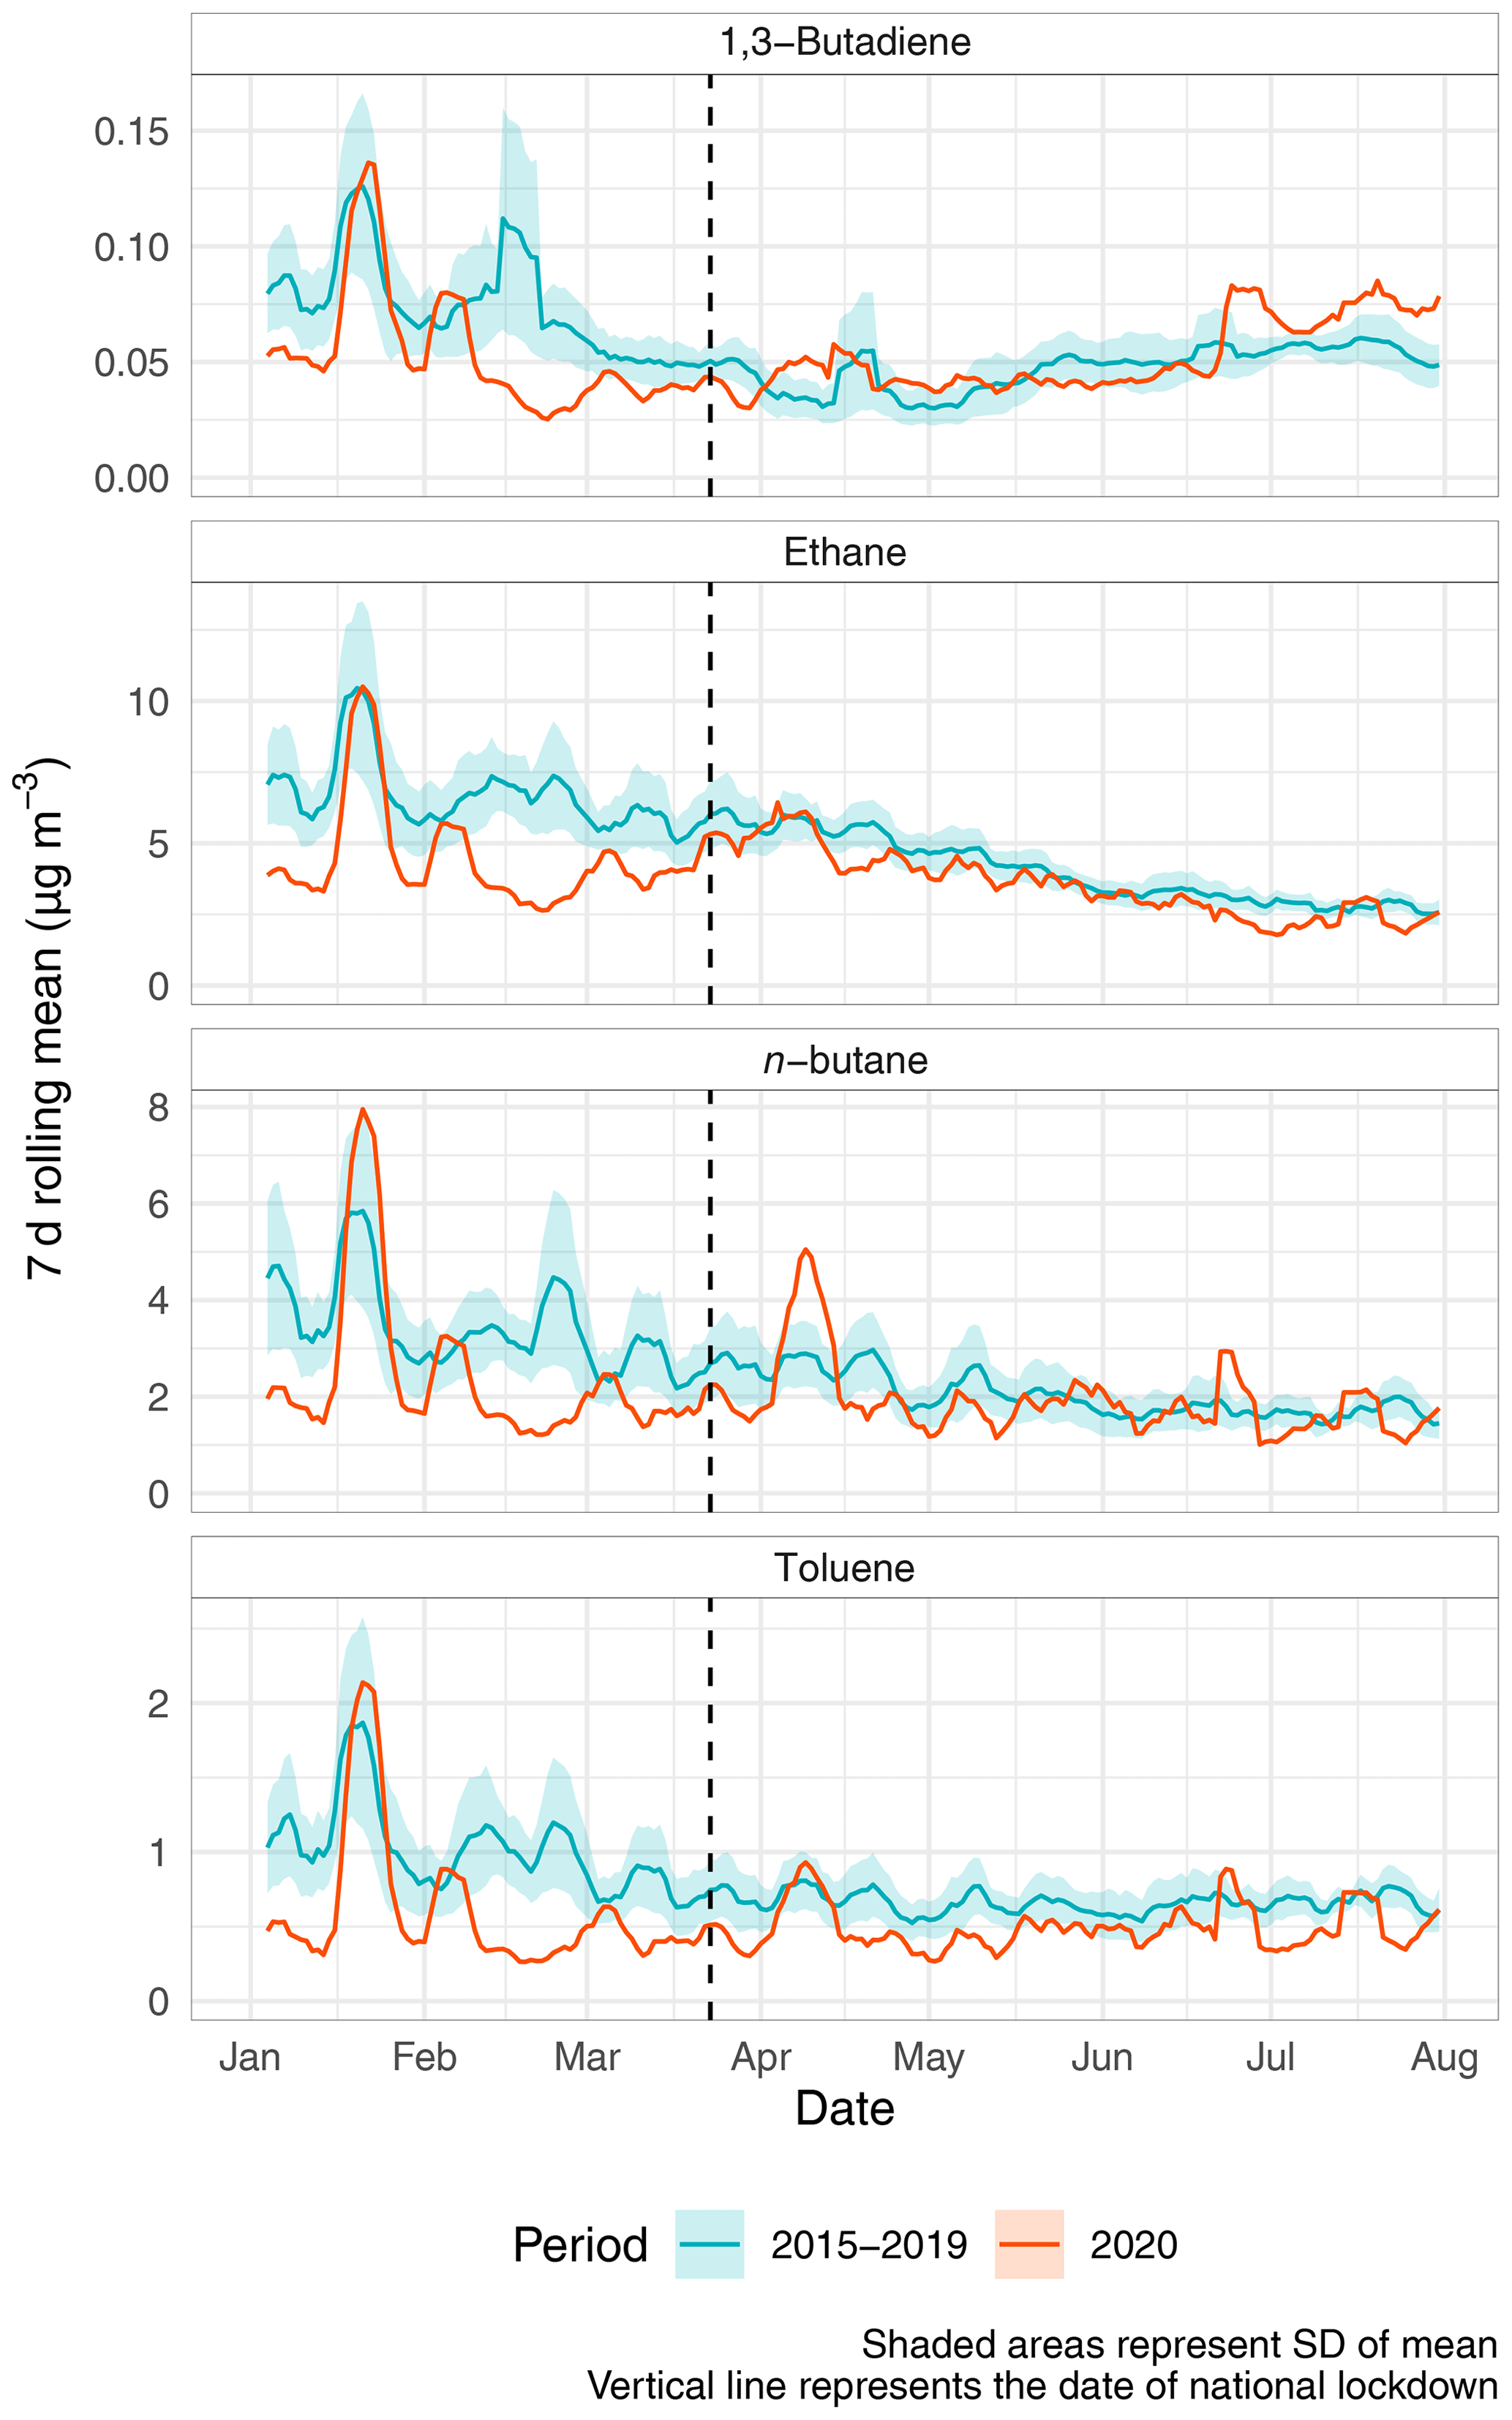
Figure A3Time series of volatile organic compounds (VOCs) at London Eltham, an urban background site in the United Kingdom.
The data sources used in this work are described and some data sets are publicly accessible in a persistent data repository (Grange, 2021, https://doi.org/10.5281/zenodo.4464734). Additional data and information are available from the authors upon reasonable request.
SKG and DCC conceived the research questions, conducted the analysis, and wrote the paper. JDL, WSD, and ACL contributed to the research design and writing the paper. CH and LE reviewed the article and contributed to the writing process.
The authors declare that they have no conflict of interest.
Stuart K. Grange is supported by the Swiss Federal Office for the Environment (FOEN) and the Natural Environment Research Council (NERC) while holding associate status at the University of York.
This paper was edited by Astrid Kiendler-Scharr and reviewed by Shaojun Zhang and one anonymous referee.
Anenberg, S. C., Miller, J., Minjares, R., Du, L., Henze, D. K., Lacey, F., Malley, C. S., Emberson, L., Franco, V., Klimont, Z., and Heyes, C.: Impacts and mitigation of excess diesel-related NOx emissions in 11 major vehicle markets, Nature, 545, 467–471, https://doi.org/10.1038/nature22086, 2017. a
BBC: Coronavirus: Europe now epicentre of the pandemic, says WHO, available at: https://www.bbc.com/news/world-europe-51876784, last access: 13 March 2020. a
Breiman, L.: Random Forests, Mach. Learn., 45, 5–32, https://doi.org/10.1023/A:1010933404324, 2001. a
Carslaw, D.: Blog update on COVID-19 and changes in air pollution, available at: https://ee.ricardo.com/news/blog-update-on-covid-19-and-changes-in-air-pollution (last access: 1 March 2021), 2020. a
Carslaw, D. C., Murrells, T. P., Andersson, J., and Keenan, M.: Have vehicle emissions of primary NO2 peaked?, Faraday Discuss., 189, 439–454, https://doi.org/10.1039/C5FD00162E, 2016. a, b
Carslaw, D. C., Farren, N. J., Vaughan, A. R., Drysdale, W. S., Young, S., and Lee, J. D.: The diminishing importance of nitrogen dioxide emissions from road vehicle exhaust, Atmos. Environ., 1, 100002, https://doi.org/10.1016/j.aeaoa.2018.100002, 2019. a
Chang, K.-L., Petropavlovskikh, I., Cooper, O. R., Schultz, M. G., and Wang, T.: Regional trend analysis of surface ozone observations from monitoring networks in eastern North America, Europe and East Asia, Elementa Sci. Anthropocene, 5, 22 pp., https://doi.org/10.1525/elementa.243, 2017. a
Dehning, J., Zierenberg, J., Spitzner, F. P., Wibral, M., Neto, J. P., Wilczek, M., and Priesemann, V.: Inferring change points in the spread of COVID-19 reveals the effectiveness of interventions, Science, 369, eabb9789, https://doi.org/10.1126/science.abb9789, 2020. a
Department for Environment Food & Rural Affairs: UK AIR Air Information Resource – Automatic Urban and Rural Network (AURN), available at: https://uk-air.defra.gov.uk/networks/network-info?view=aurn (last access: 1 March 2021), 2020. a
European Commission: Air Quality Standards, under Directive 2008/50/EU. Last updated: 31/12/2019, available at: https://ec.europa.eu/environment/air/quality/standards.htm (last access: 1 March 2021), 2019. a
European Environment Agency: Download of air quality data, Download service for E1a and E2a data, available at: http://discomap.eea.europa.eu/map/fme/AirQualityExport.htm (last access: 1 March 2021), 2019. a
Fenech, S., Aquilina, N. J., and Vella, R.: COVID-19-Related Changes in NO2 and O3 Concentrations and Associated Health Effects in Malta, Front. Sust. Cities, 3, 631280, https://doi.org/10.3389/frsc.2021.631280, 2021. a
Forster, P. M., Forster, H. I., Evans, M. J., Gidden, M. J., Jones, C. D., Keller, C. A., Lamboll, R. D., Quéré, C. L., Rogelj, J., Rosen, D., Schleussner, C.-F., Richardson, T. B., Smith, C. J., and Turnock, S. T.: Current and future global climate impacts resulting from COVID-19, Nat. Clim. Change, 10, 913–919, https://doi.org/10.1038/s41558-020-0883-0, 2020. a
Google: COVID-19 Community Mobility Reports, available at: https://www.google.com/covid19/mobility/ (last access: 1 March 2021), 2020. a, b
Grange, S. K.: rmweather: Tools to Conduct Meteorological Normalisation on Air Quality Data, R package version 0.1.2, available at: https://CRAN.R-project.org/package=rmweather (last access: 1 March 2021), 2018. a
Grange, S. K.: Technical note: saqgetr R package, A user manual to accompany the saqgetr R package, https://doi.org/10.13140/RG.2.2.15533.44001, 2019. a
Grange, S. K.: isdr: Import NOAA's Integrated Surface Database (ISD) Data, R package, GitHub, available at: https://github.com/skgrange/isdr (last access: 1 March 2021), 2020. a
Grange, S. K.: Data for publication “COVID-19 lockdowns highlight a risk of increasing ozone pollution in European urban areas”, Zenodo, https://doi.org/10.5281/zenodo.4464734, 2021. a, b
Grange, S. K. and Carslaw, D. C.: Using meteorological normalisation to detect interventions in air quality time series, Sci. Total Environ., 653, 578–588, 2019. a, b
Grange, S. K., Lewis, A. C., Moller, S. J., and Carslaw, D. C.: Lower vehicular primary emissions of NO2 in Europe than assumed in policy projections, Nat. Geosci., 10, 914–918, https://doi.org/10.1038/s41561-017-0009-0, 2017. a, b, c, d
Grange, S. K., Carslaw, D. C., Lewis, A. C., Boleti, E., and Hueglin, C.: Random forest meteorological normalisation models for Swiss PM10 trend analysis, Atmos. Chem. Phys., 18, 6223–6239, https://doi.org/10.5194/acp-18-6223-2018, 2018. a
Grange, S. K., Hüglin, C., and Emmenegger, L.: Influence of COVID-19 lockdowns on Switzerland's air quality, Empa's Laboratory for Air Pollution/Environmental Technology, available at: https://empa-interim.github.io/empa.interim/swiss_air_quality_and_covid_19.html (last access: 1 March 2021), 2020. a
Hale, T., Webster, S., Petherick, A., Phillips, T., and Kira, B.: Oxford Covid-19 Government Response Tracker (OxCGRT), Blavatnik School of Government, available at: https://github.com/OxCGRT/covid-policy-tracker, last access: 22 September 2020. a, b
Lee, J. D., Drysdale, W. S., Finch, D. P., Wilde, S. E., and Palmer, P. I.: UK surface NO2 levels dropped by 42 % during the COVID-19 lockdown: impact on surface O3, Atmos. Chem. Phys., 20, 15743–15759, https://doi.org/10.5194/acp-20-15743-2020, 2020. a
Le Quéré, C., Jackson, R. B., Jones, M. W., Smith, A. J. P., Abernethy, S., Andrew, R. M., De-Gol, A. J., Willis, D. R., Shan, Y., Canadell, J. G., Friedlingstein, P., Creutzig, F., and Peters, G. P.: Temporary reduction in daily global CO2 emissions during the COVID-19 forced confinement, Nat. Clim. Change, 10, 647–653, https://doi.org/10.1038/s41558-020-0797-x, 2020. a
Lewis, A. C., Hopkins, J. R., Carslaw, D. C., Hamilton, J. F., Nelson, B. S., Stewart, G., Dernie, J., Passant, N., and Murrells, T.: An increasing role for solvent emissions and implications for future measurements of volatile organic compounds, Philos. T. R. Soc. A, 378, 20190328, https://doi.org/10.1098/rsta.2019.0328, 2020. a
Li, K., Jacob, D. J., Liao, H., Zhu, J., Shah, V., Shen, L., Bates, K. H., Zhang, Q., and Zhai, S.: A two-pollutant strategy for improving ozone and particulate air quality in China, Nat. Geosci., 12, 906–910, https://doi.org/10.1038/s41561-019-0464-x, 2019. a
Lindeløv, J. K.: mcp: An R Package for Regression With Multiple Change Points, OSF, [preprint], https://doi.org/10.31219/osf.io/fzqxv, 2020. a
Liu, F., Page, A., Strode, S. A., Yoshida, Y., Choi, S., Zheng, B., Lamsal, L. N., Li, C., Krotkov, N. A., Eskes, H., van der A, R., Veefkind, P., Levelt, P. F., Hauser, O. P., and Joiner, J.: Abrupt decline in tropospheric nitrogen dioxide over China after the outbreak of COVID-19, Sci. Adv., 6, eabc2992, https://doi.org/10.1126/sciadv.abc2992, 2020. a
Monks, P. S.: A review of the observations and origins of the spring ozone maximum, Atmos. Environ., 34, 3545–3561, 2000. a
NOAA: Integrated Surface Database (ISD), available at: https://www.ncdc.noaa.gov/isd (last access: 1 March 2021), 2016. a
Patel, H., Talbot, N., Salmond, J., Dirks, K., Xie, S., and Davy, P.: Implications for air quality management of changes in air quality during lockdown in Auckland (New Zealand) in response to the 2020 SARS-CoV-2 epidemic, Sci. Total Environ., 746, 141129, https://doi.org/10.1016/j.scitotenv.2020.141129, 2020. a
Remuzzi, A. and Remuzzi, G.: COVID-19 and Italy: what next?, Lancet, 395, 1225–1228, https://doi.org/10.1016/s0140-6736(20)30627-9, 2020. a
Ruktanonchai, N. W., Floyd, J. R., Lai, S., Ruktanonchai, C. W., Sadilek, A., Rente-Lourenco, P., Ben, X., Carioli, A., Gwinn, J., Steele, J. E., Prosper, O., Schneider, A., Oplinger, A., Eastham, P., and Tatem, A. J.: Assessing the impact of coordinated COVID-19 exit strategies across Europe, Science, 369, 1465–1470, https://doi.org/10.1126/science.abc5096, 2020. a
Shi, Z., Song, C., Liu, B., Lu, G., Xu, J., Van Vu, T., Elliott, R. J. R., Li, W., Bloss, W. J., and Harrison, R. M.: Abrupt but smaller than expected changes in surface air quality attributable to COVID-19 lockdowns, Sci. Adv., 7, eabd6696, https://doi.org/10.1126/sciadv.abd6696, 2021. a
Sillman, S.: The relation between ozone, NOx and hydrocarbons in urban and polluted rural environments, Atmos. Environ., 33, 1821–1845, 1999. a
Velders, G. J., Willers, S. M., Wesseling, J., van den Elshout, S., van der Swaluw, E., Mooibroek, D., and van Ratingen, S.: Improvements in air quality in the Netherlands during the corona lockdown based on observations and model simulations, Atmos. Environ., 247, 118158, https://doi.org/10.1016/j.atmosenv.2020.118158, 2021. a
Venter, Z. S., Aunan, K., Chowdhury, S., and Lelieveld, J.: COVID-19 lockdowns cause global air pollution declines, P. Natl. Acad. Sci. USA, 117, 18984–18990, https://doi.org/10.1073/pnas.2006853117, 2020. a
Wang, T., Xue, L., Brimblecombe, P., Lam, Y. F., Li, L., and Zhang, L.: Ozone pollution in China: A review of concentrations, meteorological influences, chemical precursors, and effects, Sci. Total Environ., 575, 1582–1596, https://doi.org/10.1016/j.scitotenv.2016.10.081, 2017. a
Wang, Y., Wen, Y., Wang, Y., Zhang, S., Zhang, K. M., Zheng, H., Xing, J., Wu, Y., and Hao, J.: Four-Month Changes in Air Quality during and after the COVID-19 Lockdown in Six Megacities in China, Environ. Sci. Tech. Lett., 7, 802–808, https://doi.org/10.1021/acs.estlett.0c00605, 2020. a
WHO (World Health Organization): Pneumonia of unknown cause – China, available at: https://www.who.int/csr/don/05-january-2020-pneumonia-of-unkown-cause-china/en/ (last access: 1 March 2021), 2020a. a
WHO (World Health Organization): WHO Director – General's opening remarks at the media briefing on COVID-19, available at: https://www.who.int/director-general/speeches/detail/who-director-general-s-opening-remarks-at-the-media-briefing-on-covid-19–11-march-2020 (last access: 1 March 2021), 2020b. a
WHO (World Health Organization): Naming the coronavirus disease (COVID-19) and the virus that causes it, Disease: coronavirus disease (COVID-19). Virus: severe acute respiratory syndrome coronavirus 2 (SARS-CoV-2), available at: https://www.who.int/emergencies/diseases/novel-coronavirus-2019/technical-guidance/naming-the-coronavirus-disease-(covid-2019)-and-the-virus-that-causes-it (last access: 1 March 2021), 2020c. a
Williams, M. L., Atkinson, R. W., Anderson, H. R., and Kelly, F. J.: Associations between daily mortality in London and combined oxidant capacity, ozone and nitrogen dioxide, Air Quality, Atmos. Health, 7, 407–414, 2014. a, b
Wu, J. T., Leung, K., and Leung, G. M.: Nowcasting and forecasting the potential domestic and international spread of the 2019-nCoV outbreak originating in Wuhan, China: a modelling study, Lancet, 395, 689–697, https://doi.org/10.1016/s0140-6736(20)30260-9, 2020. a
Zhou, P., Yang, X.-L., Wang, X.-G., Hu, B., Zhang, L., Zhang, W., Si, H.-R., Zhu, Y., Li, B., Huang, C.-L., Chen, H.-D., Chen, J., Luo, Y., Guo, H., Jiang, R.-D., Liu, M.-Q., Chen, Y., Shen, X.-R., Wang, X., Zheng, X.-S., Zhao, K., Chen, Q.-J., Deng, F., Liu, L.-L., Yan, B., Zhan, F.-X., Wang, Y.-Y., Xiao, G.-F., and Shi, Z.-L.: A pneumonia outbreak associated with a new coronavirus of probable bat origin, Nature, 579, 270–273, https://doi.org/10.1038/s41586-020-2012-7, 2020. a