the Creative Commons Attribution 4.0 License.
the Creative Commons Attribution 4.0 License.
 | 17 Mar 2021
Quantifying the range of the dust direct radiative effect due to source mineralogy uncertainty
Natalie M. Mahowald
Ron L. Miller
Carlos Pérez García-Pando
Martina Klose
Douglas S. Hamilton
Maria Gonçalves Ageitos
Paul Ginoux
Yves Balkanski
Robert O. Green
Olga Kalashnikova
Jasper F. Kok
Vincenzo Obiso
David Paynter
David R. Thompson
The large uncertainty in the mineral dust direct radiative effect (DRE) hinders projections of future climate change due to anthropogenic activity. Resolving modeled dust mineral speciation allows for spatially and temporally varying refractive indices consistent with dust aerosol composition. Here, for the first time, we quantify the range in dust DRE at the top of the atmosphere (TOA) due to current uncertainties in the surface soil mineralogical content using a dust mineral-resolving climate model. We propagate observed uncertainties in soil mineral abundances from two soil mineralogy atlases along with the optical properties of each mineral into the DRE and compare the resultant range with other sources of uncertainty across six climate models. The shortwave DRE responds region-specifically to the dust burden depending on the mineral speciation and underlying shortwave surface albedo: positively when the regionally averaged annual surface albedo is larger than 0.28 and negatively otherwise. Among all minerals examined, the shortwave TOA DRE and single scattering albedo at the 0.44–0.63 µm band are most sensitive to the fractional contribution of iron oxides to the total dust composition. The global net (shortwave plus longwave) TOA DRE is estimated to be within −0.23 to +0.35 W m−2. Approximately 97 % of this range relates to uncertainty in the soil abundance of iron oxides. Representing iron oxide with solely hematite optical properties leads to an overestimation of shortwave DRE by +0.10 W m−2 at the TOA, as goethite is not as absorbing as hematite in the shortwave spectrum range. Our study highlights the importance of iron oxides to the shortwave DRE: they have a disproportionally large impact on climate considering their small atmospheric mineral mass fractional burden (∼2 %). An improved description of iron oxides, such as those planned in the Earth Surface Mineral Dust Source Investigation (EMIT), is thus essential for more accurate estimates of the dust DRE.
- Article
(15080 KB) - Full-text XML
-
Supplement
(18131 KB) - BibTeX
- EndNote


Mineral dust emitted from erodible land surfaces has myriad impacts on the Earth system and human society by perturbing the radiation budget (Tegen and Fung, 1994; Sokolik and Toon, 1996), interacting with cloud processes (Rosenfeld et al., 2001; DeMott et al., 2003; Mahowald and Kiehl, 2003; Atkinson et al., 2013), affecting ocean and land biogeochemical cycles (Swap et al., 1992; Jickells et al., 2005; Mahowald et al., 2017), causing respiratory and cardiovascular disease (Meng and Lu, 2007), contributing to other ailments like meningitis (Pérez García-Pando et al., 2014), and modifying atmospheric chemistry (Dentener et al., 1996; Martin et al., 2003). Dust aerosol (here defined as soil particles suspended in the atmosphere) perturbs the radiative energy balance directly by scattering and absorbing shortwave and longwave radiation, known as the aerosol–radiation interaction (Boucher et al., 2013), and indirectly by changing the cloud albedo and lifetime by acting as cloud condensation nuclei (CCN) and ice nuclei (IN) (Nenes et al., 2014) and by increasing diabatic heating in the atmosphere and evaporating cloud (Hansen et al., 1997; Bollasina et al., 2008; Jacobson, 2012), known as the aerosol–cloud interaction (Boucher et al., 2013). Through interactions with radiation and cloud, dust can feed back upon meteorology in the planetary boundary layer, the large-scale circulation, and the energy, water, and carbon cycles (Miller and Tegen, 1999; Perlwitz et al., 2001; Pérez et al., 2006; Solmon et al., 2008; Lau et al., 2009; Mahowald et al., 2011; Shao et al., 2011).
At the global scale, mineral dust is estimated to warm the atmosphere and cool the Earth's surface in the shortwave spectral range and induces opposite effects in the longwave spectral range (Sokolik and Toon, 1996; Kok et al., 2017). However, these estimates are currently highly uncertain. A recent review which synthesized data on dust abundance, optical properties, and size distribution estimated that at the top of the atmosphere (TOA) the shortwave, longwave, and net direct radiative effects (DREs) of dust range between [−0.81, −0.15], [0.17, 0.48], and [−0.48, +0.20] W m−2, respectively (Kok et al., 2017). This degree of uncertainty in the net DRE of dust constitutes an important gap in our understanding of the role it plays in climate.
Much of the DRE uncertainty can be attributed to uncertainties in the dust aerosol composition and its evolution during transport (Hand et al., 2004; Baker and Croot, 2010; Shao et al., 2011). Most of the abovementioned impacts of dust aerosols on climate are closely related to the composition of minerals in dust particles: (1) the dust DRE in some longwave bands depends on quartz or calcite, and across many shortwave bands dust strongly depends on the iron-oxide content and its mixing state with other minerals (Sokolik et al., 1998; Sokolik and Toon, 1999); (2) chemical reactions occurring on the dust particle surface depend on dust minerals (particularly, calcite) and chemical composition (Dentener et al., 1996; Hanisch and Crowley, 2003; Kumar et al., 2014); (3) the liquid water uptake rate and ice nucleation ability of dust is determined by its hygroscopicity, size, and shape and is thus related to the physio-chemical properties of the minerals (e.g., feldspar) (Karydis et al., 2011; Atkinson et al., 2013); (4) after atmospheric processing, iron-bearing minerals (e.g., hematite, goethite, illite, and hydroxide) contained in dust aerosols contribute a large fraction of the atmospheric bioavailable iron flux to remote ocean regions. This can cause dust–iron fertilization to occur and thus influences ocean marine primary productivity and biomass accumulation (Meskhidze et al., 2003; Journet et al., 2008; Schroth et al., 2009); and (5) phosphorus-bearing minerals are important for marine and terrestrial biogeochemistry effects, for example, the North Pacific Ocean and Amazon rainforest (Swap et al., 1992; Okin et al., 2004; Letelier et al., 2019). Currently, the soil mineral compositions required by dust-speciated models are provided by either Claquin et al. (1999) (C1999 hereafter) – with additional extrapolation to other soil types (three new soil units and soil phosphorous) proposed by Nickovic et al. (2012) – or Journet et al. (2014) (J2014 hereafter). The mineral composition of clay- (between 0 and 2 µm diameter) and silt-sized (between 2 and 63 µm diameter) particles is assumed to be related to the soil type in C1999 and the soil unit in J2014. Because of limited measurements, many of which are not located in major dust emission regions, global atlases of soil mineral distribution are based on extensive extrapolation and thus have a large uncertainty (Claquin et al., 1999; Journet et al., 2014; Perlwitz et al., 2015a, b; Scanza et al., 2015).
A technique to model dust aerosol optical properties, accounting for their physicochemical characteristics, was proposed by Sokolik and Toon (1999). The authors demonstrated, via offline radiative transfer calculations, that the DRE by mineral dust was highly dependent on the representation of its mineral-specific absorption properties. They suggested that internal mixing of iron oxides (hematite and goethite) with less absorptive minerals enhances the absorption of shortwave radiation and can reverse the sign from a negative (cooling) to positive (warming) DRE at the TOA. Later studies (Alfaro et al., 2004; Lafon et al., 2006; Balkanski et al., 2007; Formenti et al., 2014; Li and Sokolik, 2018) confirmed the importance of iron oxides to the shortwave dust DRE, particularly near dust source areas, even when they are mixed with particles that are also strongly absorbing (e.g., black carbon) (Alfaro et al., 2004). Two main types of iron-oxide minerals are found in soils: hematite and goethite (Journet et al., 2014). Iron in both minerals is generally to be found in a (III) oxidation state, but they have distinct optical properties in the shortwave spectrum: hematite exhibits a more pronounced spectral absorption and has a comparatively stronger ability to absorb shortwave radiation than goethite. Consequently, the calculated estimates of the single scattering albedo (SSA) for hematite– and goethite–clay aggregates, with the same size distribution, are significantly different (Lafon et al., 2006). Iron oxides represent 2.4 %–4.5 % of the total dust mass (Formenti et al., 2008), although a slightly larger range (0.7 %–5.8 %) of iron oxides in dust was reported in a more recent study (Di Biagio et al., 2019). Northern African samples exhibited a dominance of goethite over hematite (percentage mass content of iron oxides: 52 %–78 % versus 22 %–48 %, respectively) (Formenti et al., 2014). The partitioning of these two iron oxides is thus necessary to accurately estimate the DRE, because of the difference in their optical properties and a strong regional variation in their soil content (Lafon et al., 2006; Formenti et al., 2014; Di Biagio et al., 2019).
Because of the importance of physio-chemical characteristics of different dust minerals to estimating the dust DRE at shortwave bands, one focus for dust model development is on improving the representation of dust minerals (Scanza et al., 2015; Perlwitz et al., 2015a) and their coupling with radiative transfer processes using mineral-specific optical properties (Sokolik and Toon, 1999). Scanza et al. (2015) introduced eight minerals (illite, kaolinite, smectite, hematite, quartz, calcite, gypsum and feldspar) identified as climatically important by C1999 into the Community Atmosphere Model of version 4 (CAM4) and five minerals (illite, kaolinite, smectite, hematite, and a bulk remainder mineral) into version 5 (CAM5) based on C1999 (both CAM4 and CAM5 are embedded within the Community Earth System Model: CESM). Similarly, the eight minerals within CAM4 were included in the NASA Goddard Institute for Space Studies (GISS) Earth System ModelE2 (Perlwitz et al., 2015a). These previous studies exhibited the models' limited ability to match the available observations of mineral fractions and ratios. This mismatch can be primarily attributed to the inherent limitations and uncertainties in the surface soil mineralogy mapping (Perlwitz et al., 2015b; Scanza et al., 2015; Y. Zhang et al., 2015) along with uncertainties in the models' emission, transport, and deposition. Perlwitz et al. (2015a, b) and Pérez García-Pando et al. (2016) show that despite these uncertainties, reconstructing the emitted mineral aggregates from the disturbed soil mineralogy atlases based upon brittle fragmentation theory (Kok, 2011) and additional empirical constraints better reproduces size-resolved mineralogy and elemental composition observations. Scanza et al. (2015) show that CAM underestimates the observed DRE efficiency near northern Africa. This underestimate could be attributed to difficulty of DRE retrieval along with the large uncertainty in hematite in the C1999 soil mineralogy atlas, which includes a range of iron-oxide abundance (0.0 %–7.0 % by weight).
Here, for the first time, we undertake a detailed and systematic study of the sensitivity of the dust DRE resulting from current uncertainties in soil mineral composition. We compare the sensitivity of DRE to uncertainties in soil mineral composition to those from other sources, such as the range in measured complex refractive indices for dust minerals and dust burdens. In this study we focus on composition of dust and do not examine other sources of uncertainty, including the mineral vertical and size distributions, cloud processes, surface albedo (Liao and Seinfeld, 1998; Li and Sokolik, 2018), and mixing and interaction of dust with pollution aerosols (Li and Shao, 2009; Huang et al., 2010; Tobo et al., 2010). In addition to C1999, as used in previous studies (Scanza et al., 2015; Perlwitz et al., 2015a), we incorporate results using the updated J2014 soil mineralogical atlas, which separates iron oxides into hematite and goethite. We focus on the sensitivity studies within only one model (CAM5) and then compare results to four other models, CAM6, GISS ModelE2, the Multiscale Online Non-hydrostatic AtmospheRe CHemistry model (MONARCH; previously known as the Non-hydrostatic multiscale model (NMMB) / Barcelona Supercomputing Center (BSC) – chemical transport model (CTM), and Geophysical Fluid Dynamics Laboratory (GFDL) (see Sect. 2.2 for model descriptions), to examine both parametric and structural uncertainty sources.
2.1 Descriptions of soil mineralogy data
Two datasets currently exist that can be used to describe the size-resolved mineralogical composition for potential dust sources around the globe. For both datasets, the soil mineralogical composition was inferred based on the hypothesis that the surface mineralogy depends on the size distribution and physio-chemical properties (e.g., appearance color) of the soil.
The first dataset was originally created by Claquin et al. (1999), who compiled measurements linking soil type and mineral composition from the available literature. This dataset contains information regarding an average relative abundance of eight minerals (mean mineralogy table, MMT) in the clay-sized and silt-sized categories for 28 soil types that are considered wind erodible. Illite, kaolinite, and smectite (only present in the clay-sized category) frequently dominate over calcite and quartz among different soil types. In the silt-sized category, the dominant minerals are quartz and/or feldspar instead of hematite, gypsum, and calcite, except for salt flats where calcite is dominant. Also included in C1999 is the standard deviation of the mean mineral content for the 28 soil types. This study extends hematite to the clay-sized category by assigning the same mass fraction as it is in the silt-sized category and subtracting the same mass fraction from illite, consistent with recent studies (Balkanski et al., 2007; Nickovic et al., 2012; Scanza et al., 2015; Perlwitz et al., 2015a). The global atlas of arid surface mineralogy is created following Claquin et al. (1999) and Scanza et al. (2015) via the FAO/UNESCO WGB84 at 5 × 5 arcmin with soil legend from FAO/UNESCO Soil Map of the World in 1976 (Batjes, 1997) using the MMT.
The other soil mineral dataset presented in Journet et al. (2014) (J2014) is an extension of C1999. It includes four additional minerals, one (vermiculite) in the clay-sized soil category, two (mica and goethite) in the silt-sized category, and one (chlorite) in both categories. The mean mineralogical content was assigned to different soil units, as classified by FAO (FAO-UNESCO, 1974: 135 soil units; FAO, 1990: 193 soil units). The standard deviation is also provided, but only for a limited number of soil units. Compared to C1999, this more recent compilation is not confined to the soil units that are located in arid and semi-arid areas and benefits from a use of more extensive literature. Nevertheless, there is a number of soil units lacking mineralogical information (the mean mineralogical content and in particular the associated standard deviation), especially for the silt-sized soil class where the information is scarce. The mean mineralogical content for these missing soil units was thus characterized through assumptions rather than observation-derived data. For iron oxides, which are relevant to the DRE of dust, data are present for only 23 % of the reported soil units (∼45). We fill soil units without the mean mineralogy content, including iron oxides, with the mineralogical composition of the major soil unit they belong to. Our mineralogy atlases created according to this dataset rely on the dominant soil unit at 0.5∘ × 0.5∘ resolution, as derived from the Harmonized World Soil Database v1.21 (FAO/IIASA/ISRIC/ISSCAS/JRC, 2012) map at 30 arcsec of horizontal resolution. Mean mineralogy values are then geographically assigned according to the relevant soil units.
2.2 Model descriptions
Model sensitivity analysis in this paper focuses on results from CESM. To assess a spread in the sensitivity of DRE to representations of dust cycles, we compare CESM to three other models (GISS ModelE2, MONARCH, and GFDL), as described in this section. We employ three versions of CAM in CESM following Scanza et al. (2015): the Bulk Aerosol Model (BAM) in the CAM4 (Neale et al., 2013) and the Modal Aerosol Model (MAM) in CAM5 (Hurrell et al., 2013) and CAM6 (Danabasoglu et al., 2020). In these CAM versions, the DRE is calculated by speciating dust into minerals (Sect. 2.2.1). We construct perturbation sensitivity analyses with CAM5 only (Sect. 2.3.1), as the DRE in CAM4 is insensitive to dust minerals (Sect. “Uncertainty due to dust minerals, burden, and imaginary complex refractive index”) and the high-resolution CAM6 model is computationally expensive (a factor of 10 times more core hours is required in CAM6 compared to CAM5, particularly considering the large number of simulations needed.
Mineral composition is also calculated using an updated version of the NASA ModelE2.1 (Schmidt et al., 2014) (ModelE2 hereafter; Sect. 2.2.2) as described in Perlwitz et al. (2015a, b) and Pérez García-Pando et al. (2016). Since the relation of the DRE to simulated minerals in this model is still under development, we apply a statistical relationship between simulated minerals and shortwave dust DRE in CAM5 to predict the shortwave DRE (Sect. 2.3.4) based on simulated minerals in GISS ModelE2. The MONARCH (Sect. 2.2.3) and GFDL models (Sect. 2.2.4) do not include dust mineral speciation, so we use the DRE related to aerosol optical depth (AOD) for bulk dust (DOD) (Sect. 2.3.4).
2.2.1 Community Earth System Model
Dust mineral speciation (illite, kaolinite, montmorillonite, hematite, quartz, calcite, feldspar, and gypsum) was incorporated for CAM4 (Scanza et al., 2015) and CAM5 (Scanza et al., 2015; Hamilton et al., 2019) using C1999. Here we add a new mineral tracer for goethite to CAM5 to use J2014 and adopt the incorporated CAM5 mineral species when using C1999. Recently, a new CAM6 model for CESM2 was released which was updated to an improved two-moment prognostic cloud microphysics, MG2 (Gettelman and Morrison, 2015), from MG (Morrison and Gettelman, 2008) used in CAM5. For this study, we incorporate the mineral speciation of CAM5, closely related to the Department of Energy model, the Energy Exascale Earth System Model (E3SM) (Liu et al., 2016; Lauritzen et al., 2018; Caldwell et al., 2019), into the CAM6 model. Each mineral was separately emitted, transported, and deposited in the model. Aerosols including dust in both CAM5 and CAM6 are subdivided into interstitial (within the clear air) and cloud-borne (within clouds) particles for a better representation of advection and deposition processes, as documented in Liu et al. (2012). In the atmosphere each mineral interacts with the shortwave and longwave radiation.
The dust emission, transport, and deposition are simulated by the Dust Entrainment And Deposition model (DEAD, Zender et al., 2003) which has been implemented in the land and atmosphere components of the CESM and described in detail previously (Zender et al., 2003; Mahowald et al., 2006; Albani et al., 2014). The emission of dust occurs within non-vegetated, dry soil regions and is initiated once a friction velocity threshold has been exceeded. The friction velocity threshold is parameterized as a function of the soil state (e.g., soil moisture, snow cover, surface crust, vegetation cover) and near-surface meteorology (e.g., air density, horizontal wind speed). Vegetation tends to protect the soil from wind erosion by reducing the energy transfer of wind momentum to the soil surface. This effect of vegetation on dust emissions is represented via a linear dependence on the leaf area index (LAI) (Mahowald et al., 2006). No dust emission occurs within grid cells with the LAI exceeding 0.3 m2 m−2. The friction velocity threshold for dust entrainment to the atmosphere increases with soil moisture following a semi-empirical relation between the threshold and soil moisture obtained by Fécan et al. (1999) with additional optimization from the traditional dependence of the square of clay mass fraction (Fécan et al., 1999; Zender et al., 2003).
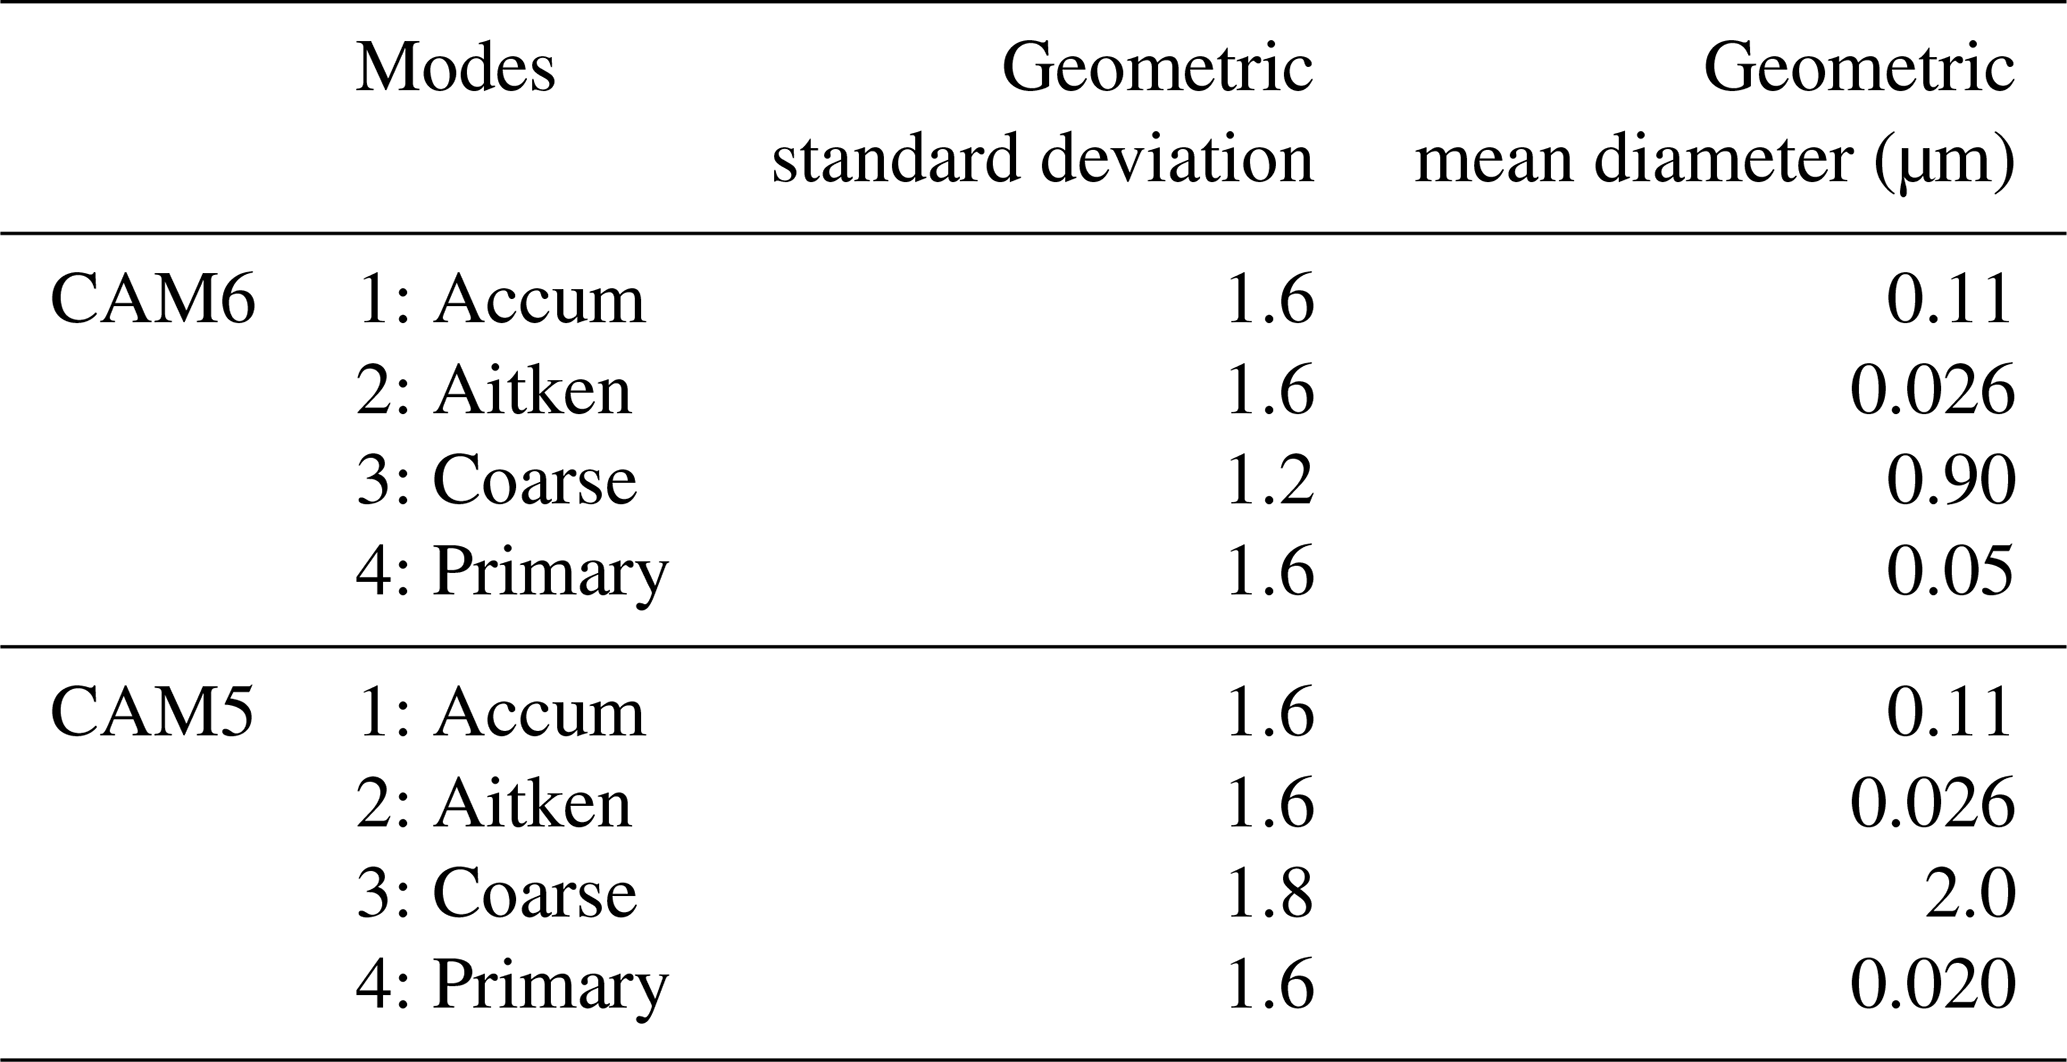
The default dust model utilizes a prescribed soil erodibility source function (Ginoux et al., 2001) which associates dust emissions with topographical depressions where abundant erodible sediment accumulates (Ginoux et al., 2001; Zender et al., 2003; Mahowald et al., 2006). In this study, we use an updated physical dust emission scheme developed by Kok et al. (2014a), based on the brittle fragmentation theory (Kok, 2011) which has been shown to improve model–observation comparisons without the source function (Kok et al., 2014b). The emitted size distribution of either bulk dust (sum of all minerals or non-speciated dust) or minerals is assumed to be independent of the soil properties of the source location and wind speeds (Albani et al., 2014; Perlwitz et al., 2015a; Scanza et al., 2015) and currently only considers the likely climatologically most relevant diameter range from 0.01 to 10 µm. Each mode in CAM5 or CAM6 represents the aerosol size distribution by a lognormal function with varying mode dry or wet particle radii. For CAM6, the default size distribution uses a narrow coarse-mode width (geometric standard deviation: 1.2 compared to 1.8 in CAM5; Table 1) which does not adequately simulate size distribution of the dust aerosol mass. Thus, in the CAM6 simulations, we retain the mode size distribution of CAM5, which also enables the use of the same fractional contributions of the clay- and silt-sized soil to the dust aerosol mass for the accumulation and coarse modes in CAM6 as in Scanza et al. (2015). The emission of each mineral into the Aitken mode in CAM5 and CAM6 is refined following that into the accumulation mode.
Table 1MAM mode size parameters in CAM5 and CAM6 by default. We reverted the coarse mode parameters in CAM6 to those in CAM5 in our CAM6 simulation.
Dust mineral species carried within each mode in CAM5 and CAM6 are internally mixed with each other and with other non-dust species (e.g., sea salt, sulfate, black carbon, primary and/or secondary organic matter) in the same mode under the homogenous assumption (the same proportions of each components in any individual aerosol particle) but externally mixed between the different modes (Liu et al., 2012, 2016). In comparison, all aerosol species are externally mixed in CAM4, but the optical properties for dust species (SSA, the extinction coefficient, and the asymmetry factor) are calculated offline using the MIEV0 software (Wiscombe, 1980) with a spherical shape assumption and prescribed aerosol size distribution independent of locations.
The radiative flux at each vertical model layer, at 19 (band centre range: 0.22–4.36 µm) and 14 (band centre range: 0.23–3.46 µm excluding the broad Band 14 centered at 8.02 µm) shortwave bands (for CAM4 and CAM5/CAM6, respectively) and 16 longwave bands (band centre range: 3.46–514.29 µm), is computed by the rapid radiative transfer method (RRTMG) for general circulation model (Iacono et al., 2008) each model hour (two time steps) with the aerosol optical properties determined from their composition, size, mass, etc. Specifically, in MAM, the aerosol optical properties (e.g., the specific scattering, specific absorption, and asymmetric parameter) of an internal mixture of aerosol components are expressed in terms of the wet surface mode radius and the wet refractive index of each component in each mode. Wet size and volume of aerosol are predicted by assuming the hygroscopic growth following the κ-Köhler theory (Ghan and Zaveri, 2007) according to the dry radius, density, and hygroscopicity of a particle and the ambient relative humidity and temperature. The wet refractive index is calculated from the composition of the wet aerosol and the refractive index of each component using the volume mixing method. Aerosol optical properties are then parameterized via the Chebyshev polynomial, given the wet surface mode radius and wet refractive index of each component (Ghan and Zaveri, 2007). The refractive index of each mineral for each band implemented in CAM is derived from Scanza et al. (2015) and shown in Fig. 1 for CAM5/6. It is worth noting here that the volume-averaging method applied to minerals to compute the bulk aerosol optical properties may lead to an artificially strong absorption relative to scattering and thus a low SSA for bulk dust aerosol (X. L. Zhang et al., 2015; Li and Sokolik, 2018). We prescribe the density of each mineral from Scanza et al. (2015) with the exception of goethite, which was not included in that study; the density of goethite is prescribed at 3800 kg m−3. The same hygroscopicity (0.068) is assumed for all minerals due to the smaller influence of hygroscopicity on shortwave and longwave radiation compared to other optical properties (e.g., the complex refractive index, dust mineralogy, and the size distribution), also following Scanza et al. (2015). Due to lack of information about the optical properties of chlorite, vermiculite, and mica, we add the mass of chlorite and vermiculite to kaolinite in the clay-sized category and merge chlorite, vermiculite, and mica into one in the silt-sized category. We assume that the merged mineral has the same optical properties as kaolinite. Such a treatment of these minerals for which the optical properties are missing would not introduce large errors in estimating the dust DRE uncertainty because (1) they are known to be much less absorbing at the shortwave bands than iron oxides; (2) the DOD is insensitive to the perturbed contents of these minerals within the uncertainty range in soil, since the differences of the mass extinction efficiency of these minerals are not that big to make a considerable difference to the simulated global DOD. Thus, no retuning procedure is required to retain DOD in all cases except the ones where we perturb DOD (see Sect. 2.3.1); and (3) our results (Sect. “Uncertainty due to dust minerals, burden, and imaginary complex refractive index”) will also show that the shortwave DRE is insensitive to minerals other than iron oxides and that the longwave DRE is insensitive to all minerals we considered here. The optical properties of goethite, which is known to strongly absorb shortwave radiation, differ from those of hematite in terms of both intensity and spectral dependence (Sokolik and Toon, 1999; Lafon et al., 2006). Given no reliable set of spectral optical properties for goethite at bands of our interests, in the base studies using J2014, we assume that goethite is highly absorptive (only second to hematite with the imaginary refractive index of goethite half of hematite), which is generally consistent with previous calculations (Formenti et al., 2014), and has a hygroscopicity identical to all other minerals.
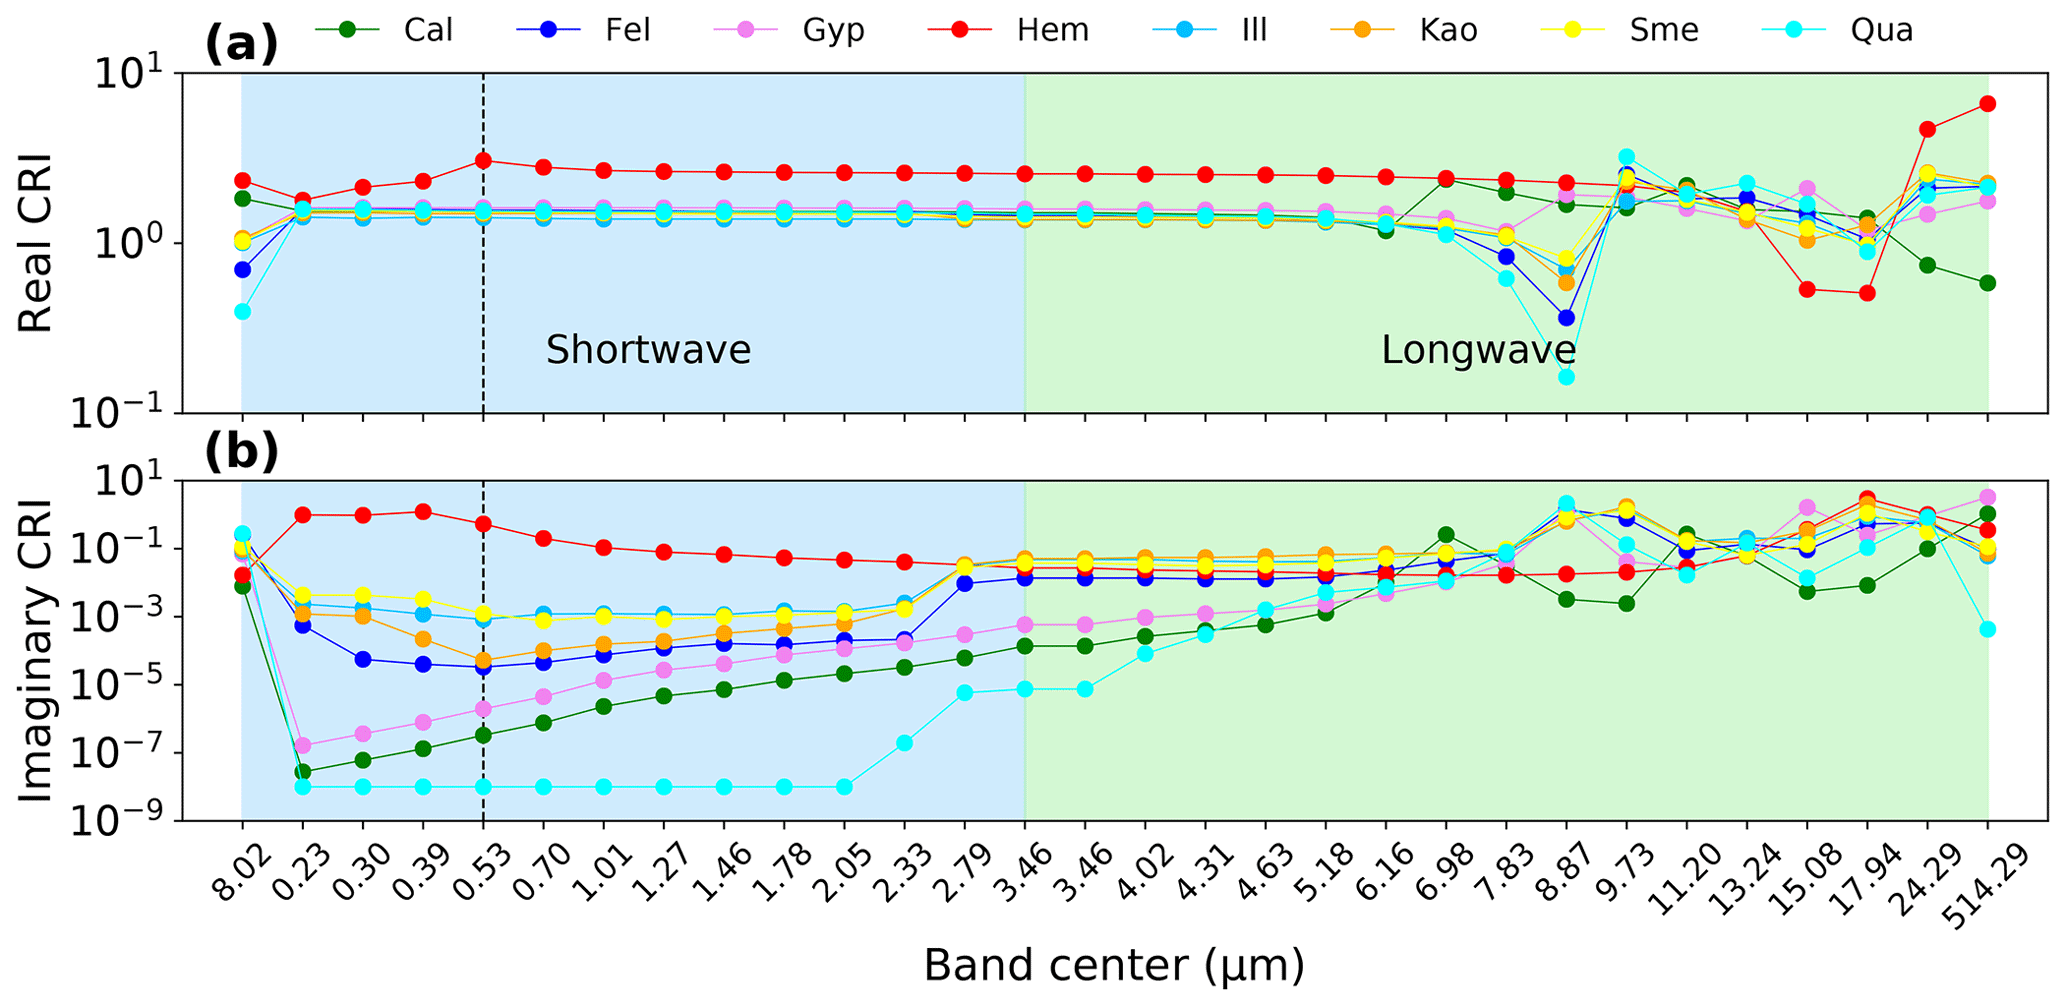
Figure 1Real (a) and imaginary (b) complex refractive index (CRI) of each mineral for shortwave (blue shading) and longwave (green shading) bands (band centres shown as x-axis labels) implemented in CAM5/6. CRI values were derived for each band with original data taken from Scanza et al. (2015). The imaginary CRI of goethite was assumed to be half of hematite with the same spectral shape, while the real part of goethite is assumed to be identical to that of hematite. Vertical dash lines indicate the shortwave Band 10 centered at 0.53 µm at which DOD and SSA for CAM5/6 were calculated. Note that the band centered at 8.02 µm (leftmost) is broad, with low and high boundaries of 3.84 and 12.20 µm, respectively. This broad band has been included in the model as shortwave bands by model developers. For mineral names, see text in Sect. 2.2.1.
CAM6 and CAM5(4) are configured with default horizontal resolutions (longitude by latitude: 1.25∘ × 0.9∘ and 2.5∘ × 1.9∘, respectively). All CAM models use 56 vertical layers up to 2 hPa. Meteorology (horizontal wind, air temperature T, and relative humidity) is nudged toward Modern-Era Retrospective analysis for Research and Applications (MERRA) dynamics version 2 (CAM6) and version 1 (CAM4 and CAM5), for 2006–2011 with the simulated first year discarded as a model spin-up period. The nudging is updated with a 6 h relaxation timescale. We use anthropogenic emissions from AeroCom in CAM4, the Climate Model Intercomparison Program (CMIP5) inventory (Lamarque et al., 2010) in CAM5, and CMIP6 in CAM6 for the year 2000 in all simulations.
The TOA dust DRE under all-sky conditions, unless otherwise stated, is calculated following Eq. (1) as the instantaneous difference of net fluxes (ΔFdust) at the TOA (Ghan and Zaveri, 2007), diagnosed at each model time step with all aerosol species on the climate diagnostic list (F1) and values with all aerosol species except for dust minerals (F2):
2.2.2 NASA Goddard Institute for Space Studies ModelE2
NASA GISS ModelE2 has a horizontal resolution of 2.5∘ longitude by 2∘ latitude with 40 vertical layers extending to 0.1 hPa. In ModelE2, dust enters the atmosphere as a result of winds exceeding a prescribed threshold value that increases with soil moisture content. Emitted dust mass is largest within basins where erodible particles have accumulated and there is limited vegetation to protect the soil surface. These regions of preferential emission are identified by Ginoux et al. (2001). Emission depends upon the surface model wind speed and parameterized wind gusts that represent the effects of sub-grid fluctuations (Cakmur et al., 2004). A full model description of emission and transport is given by Miller et al. (2006) with an updated description of aerosol wet deposition in Perlwitz et al. (2015a).
Prognostic calculation of dust mineral emissions (Perlwitz et al., 2015a, b; Pérez García-Pando et al., 2016) is done based upon the fractional mass abundance of eight minerals within the soil, as derived from measurements of wet-sieved soils by C1999. For particle diameters <10 µm, the emitted size distribution of each mineral (except quartz) follows a semi-empirical fit to measurements (Kok, 2011) that account for the modification of the original soil size distribution by wet sieving. For larger particle diameters (up to 50 µm), the size distribution is constrained from in situ measurements of mineral concentration (Kandler et al., 2009; Carlos Pérez García-Pando, personal communication, 2019).
Each mineral is transported separately within five size bins ranging from clay to silt diameters (0.10–2.0, 2.0–4.0, 4.0–8.0, and 16–32 µm). Goethite and hematite are removed preferentially due to their higher density (about 2-fold) compared to the remaining minerals. Hematite is also transported as a trace constituent as part of an internal mixture with the remaining minerals, allowing hematite to travel farther than in its externally mixed (pure) form. Only mineralogy is predicted in the model, so the DRE is estimated a posteriori using the CAM results, as described later.
2.2.3 Model Multiscale Online Non-hydrostatic AtmospheRe CHemistry model
The MONARCH model developed at the BSC (e.g., Pérez et al., 2011; Badia et al., 2017) contains advanced chemistry and aerosol packages and is coupled online with the NMMB, which allows for running either global or high-resolution (convection-permitting) regional simulations (Janjic et al., 2001; Janjic and Gall, 2012). The dust module of MONARCH (Haustein et al., 2012; Klose et al., 2021; Pérez et al., 2011) includes different parameterizations of dust emission, including those from Marticorena and Bergametti (1995), Ginoux et al. (2001), Shao (2001, 2004), Shao et al. (2011), Kok et al. (2014a), and Klose et al. (2014). The model simulations performed for this study utilize the dust emission scheme from Ginoux et al. (2001) with some modifications described in Klose et al. (2021). The model includes eight dust size transport bins ranging up to 20 µm in diameter. The emitted size distribution is based on Kok (2011). The inclusion of mineral speciation is under development, and therefore it is not included in this study.
The radiation scheme is RRTMG (Iacono et al., 2001, 2008). In the longwave, we assume refractive indices from the Optical Properties of Aerosols and Clouds (OPAC) dataset (Hess et al., 1998) and spherical particle shape. In the shortwave, we assume tri-axial ellipsoids as described by Kok et al. (2017), who used the dust single-scattering database of Meng et al. (2010) and size-dependent refractive indices based on a globally averaged mineralogical composition. The radiation flux is diagnosed twice, one with all aerosol species and the other one solely without dust aerosol to determine the DRE for bulk dust. While MONARCH does not calculate mineral speciation of dust, we include its DOD as a measure of uncertainty in comparison to DREs related to uncertainty in the soil mineral composition.
The model is run from 2007 to 2011 at a horizontal resolution of 1.0∘ × 1.4∘, with 48 vertical layers. The meteorological fields are re-initialized daily using ERA-Interim reanalysis data (Berrisford et al., 2011), while dust fields and soil moisture are recycled between the daily runs.
2.2.4 Geophysical Fluid Dynamics Laboratory model
The latest GFDL global climate model includes the fourth version of the coupled Climate Model (CM4) and Earth System Model (ESM4), with detailed descriptions provided by Held et al. (2019) and Dunne et al. (2020), respectively. In CM4 dust emission depends only on wind speeds with prescribed dust sources (Ginoux et al., 2001), while in ESM4 it depends also on soil water and ice, snow cover, leaf and stem area indices, and land use type, which are all dynamically calculated, except for land use (Evans et al., 2016). The dust size distribution at emission follows the brittle fragmentation theory of Kok (2011). The simulations are performed from 2010 to 2015 with observed sea surface temperature and sea ice (i.e., AMIP simulation; Taylor et al., 2000). Dust DRE is not calculated within this model, but the modeled DOD is used to assess the effect of cross-model differences.
2.3 Quantifying dust aerosol radiative effect uncertainty
2.3.1 Sensitivity studies with mineralogy in the Community Atmospheric Model of version 5
A set of sensitivity studies, based primarily on CAM5, is conducted to characterize the range in DRE due to uncertainties in the soil mineralogical composition. To determine the uncertainty in soil mineralogy, we use two different approaches to estimate the mineral content of soils: the first is based on C1999 and the second is based on J2014. We consider the set of climatically important minerals identified in the soil compilations of C1999 and J2014, although other minerals may be important, especially in specific regions. However, optical analyses of aerosolized soil samples show that shortwave absorption varies most strongly with iron oxides like hematite and goethite (Moosmüller et al., 2012; Di Biagio et al., 2019), suggesting that other radiatively active minerals are mainly present in small concentrations.
We select simulations with soil mineralogy derived from the MMT of C1999 as the baseline (see Sect. 3.1 for the resultant hematite aerosol mass percentage). In addition to the mean, the MMT provides uncertainty ranges for each mineral and for each soil type, for which we calculate the 95 % confidence interval of the mineral fraction (Fig. 2). Hematite mass abundance is low, but in general, it has the largest relative uncertainty. Atlases containing the high- and low-bound minerals (high-bound mineral: upper limit of the 95% confidence interval of the abundance of a mineral in the corresponding category and soil type; the low-bound mineral is similarly defined) such as hematite, illite, and smectite are similarly created following C1999 using soil type to prescribe mineral fractions. When perturbing the amount of one mineral, we conserve emitted dust mass through an identical and opposite change in soil abundance of the dominant mineral (referred to as the offsetting mineral) within the same clay- or silt-sized category. Another criterion to select the offsetting mineral is that it should have a minimized impact on the simulated instantaneous TOA fluxes. For example, illite and kaolinite occupy the same clay-sized soil category (mass fraction: 0.39) in the calcaric soil type. In this case, we choose kaolinite as the offsetting mineral, because the DRE is less sensitive (measured by the relative change in the DRE over the relative change in the high-bound kaolinite aerosol content with respect to the base value) to this mineral than to illite in test simulations. Similarly to Scanza et al. (2015), we employ a nearest-neighbor algorithm to estimate mineral fractions of land mass not specified by the MMT of C1999 in avoid of “zero” dust emissions in these regions. The spatial distribution of uncertainties in the soil mineral abundance based on which we estimate the propagated error in the DRE calculation is discussed in Sect. 2.3.2.
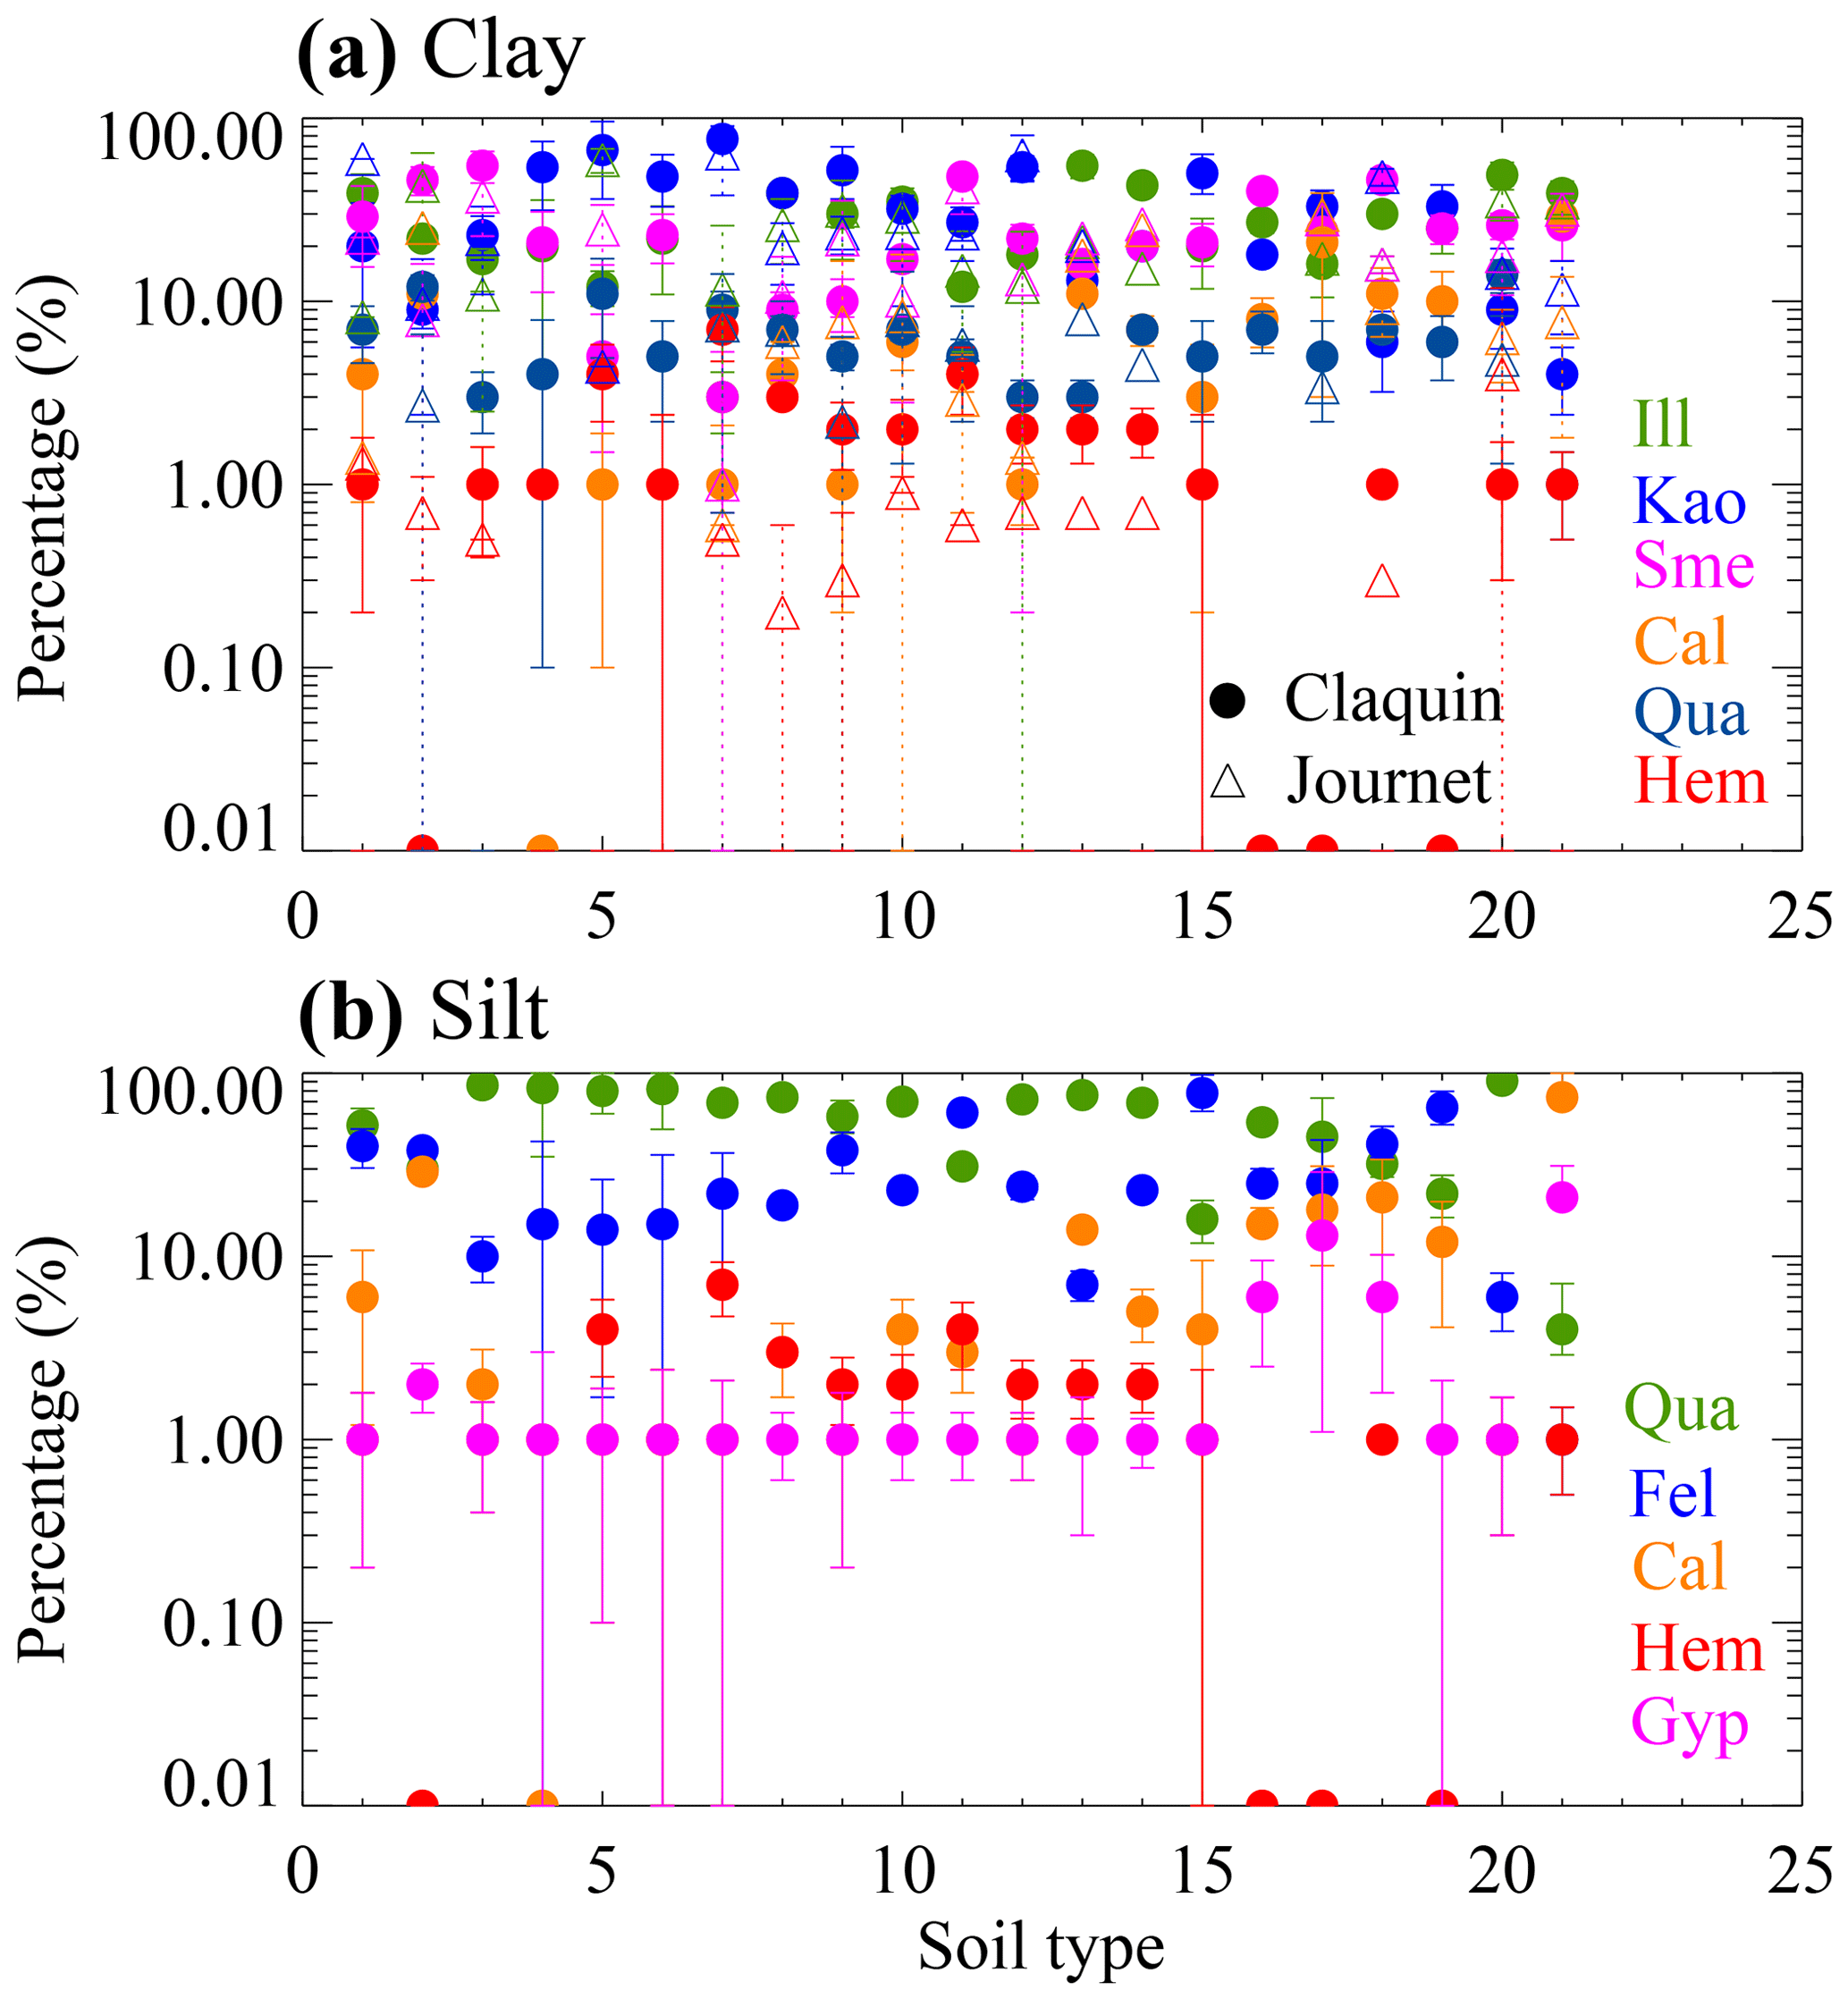
Figure 2Mean mineral percentage (C1999: colored filled dots; J2014: colored triangle) and associated uncertainty (error bars) in the clay- (a) and silt-sized (b) categories based on C1999 and J2014 for each soil type. x-axis labels from 1 to 21 corresponds to the first column of Table 2 of Claquin et al. (1999) from top to bottom. Soil units used for comparison to C1999 data are listed in Table 3 of Journet et al. (2014) and are reordered here according to x-axis labels used for C1999 soil types.
In addition to C1999, we consider three scenarios based on J2014. One uses the mean mineral fraction from J2014. The other two use low and high bounds on iron oxides. We consider these bounds to be the average hematite and goethite mass fractions ± 2σ, representing 95 % of the variability, where σ denotes the standard deviation of hematite and goethite from J2014. The mineral fractions for the rest of the minerals are reduced (or increased) proportionally. Compared to clay, there is much less information available for silt-sized minerals, and the existing data are obtained mainly based on a number of assumptions rather than observations. Therefore, soil units which do not have an estimate of the uncertainty in the iron oxides are prescribed to have the maximum uncertainty range that is present in iron oxides across the dataset (Fig. 2). We follow the same procedure as in Sect. 2.1 to create the global mineralogy atlas. Mineral fractions are normalized to sum to unity.
Table 2 summarizes the experiments undertaken in this study. In the simulations with unperturbed mineralogy (C1999 or J2014), emissions are tuned following Albani et al. (2014) to yield a global mean DOD of ∼0.03 (simulated AOD and DOD by CAM and MONARCH are at the 0.44–0.63 µm band and by GFDL are at the 0.50–0.60 µm band here and after, unless otherwise stated) according to the observational estimate based upon satellite retrievals with bias-corrected observations from AErosol RObotic NETwork (AERONET) and multiple global models (Ridley et al., 2016). The baseline model fairly well reproduced the magnitude of dust concentration and deposition at the bottom model layer compared to station-based measurements (see Albani et al., 2014, for detailed descriptions) (Fig. 3; correlation in the log space: R2=0.88 and 0.83 for the surface dust concentration and deposition flux, respectively, which are statistically significant at the 95 % confidence level). Particularly over regions near the dust source, such as northern Africa, the model fairly well agrees with observations, despite a more smoothing spatial distribution of those dust proxies in the simulation. Comparing with the seasonal DOD averaged over 15 regions obtained by Ridley et al. (2016), the baseline simulation appears to show an overestimate in general near dust source regions and fairly well reproduced the seasonal cycle (Fig. 4) from the climatological side. Periods for the simulation (2007–2011) and DOD constraint (2004–2008) do not coincide well. Despite the inconsistency in period, this overestimate of DOD close to the source is probably not totally an artifact, considering that to match DOD of ∼0.03 the global tuning of the model tends to emit more dust to compensate unduly strong deposition during transport. For the other cases, the simulated dust cycle is similarly comparable with observations and thus is not shown. The similarity of the simulated dust cycle among the different cases except where we perturb DOD is primarily because DOD is insensitive to the variation of the mineral content at least within the mineral's uncertainty range, which is generally a small perturbation to the total dust amount. Therefore, a retuning procedure for experiment cases except the ones where we perturb DOD is unnecessary, and the simulated dust concentration and deposition, thus, remain almost unchanged.
Table 2List of experiments for the sensitivity test using CAMs (CAM4, CAM5, and CAM6), ModelE2, MONARCH, and GFDL with speciated (indicated by C1999 and J2014) and bulk dust. All the model results were processed onto 2.5∘ × 1.9∘ (longitude by latitude) horizontal grids for further calculation. Note: Ima – imaginary; LW – longwave; SW – shortwave; OPAC – Optical Properties of Aerosols and Clouds.
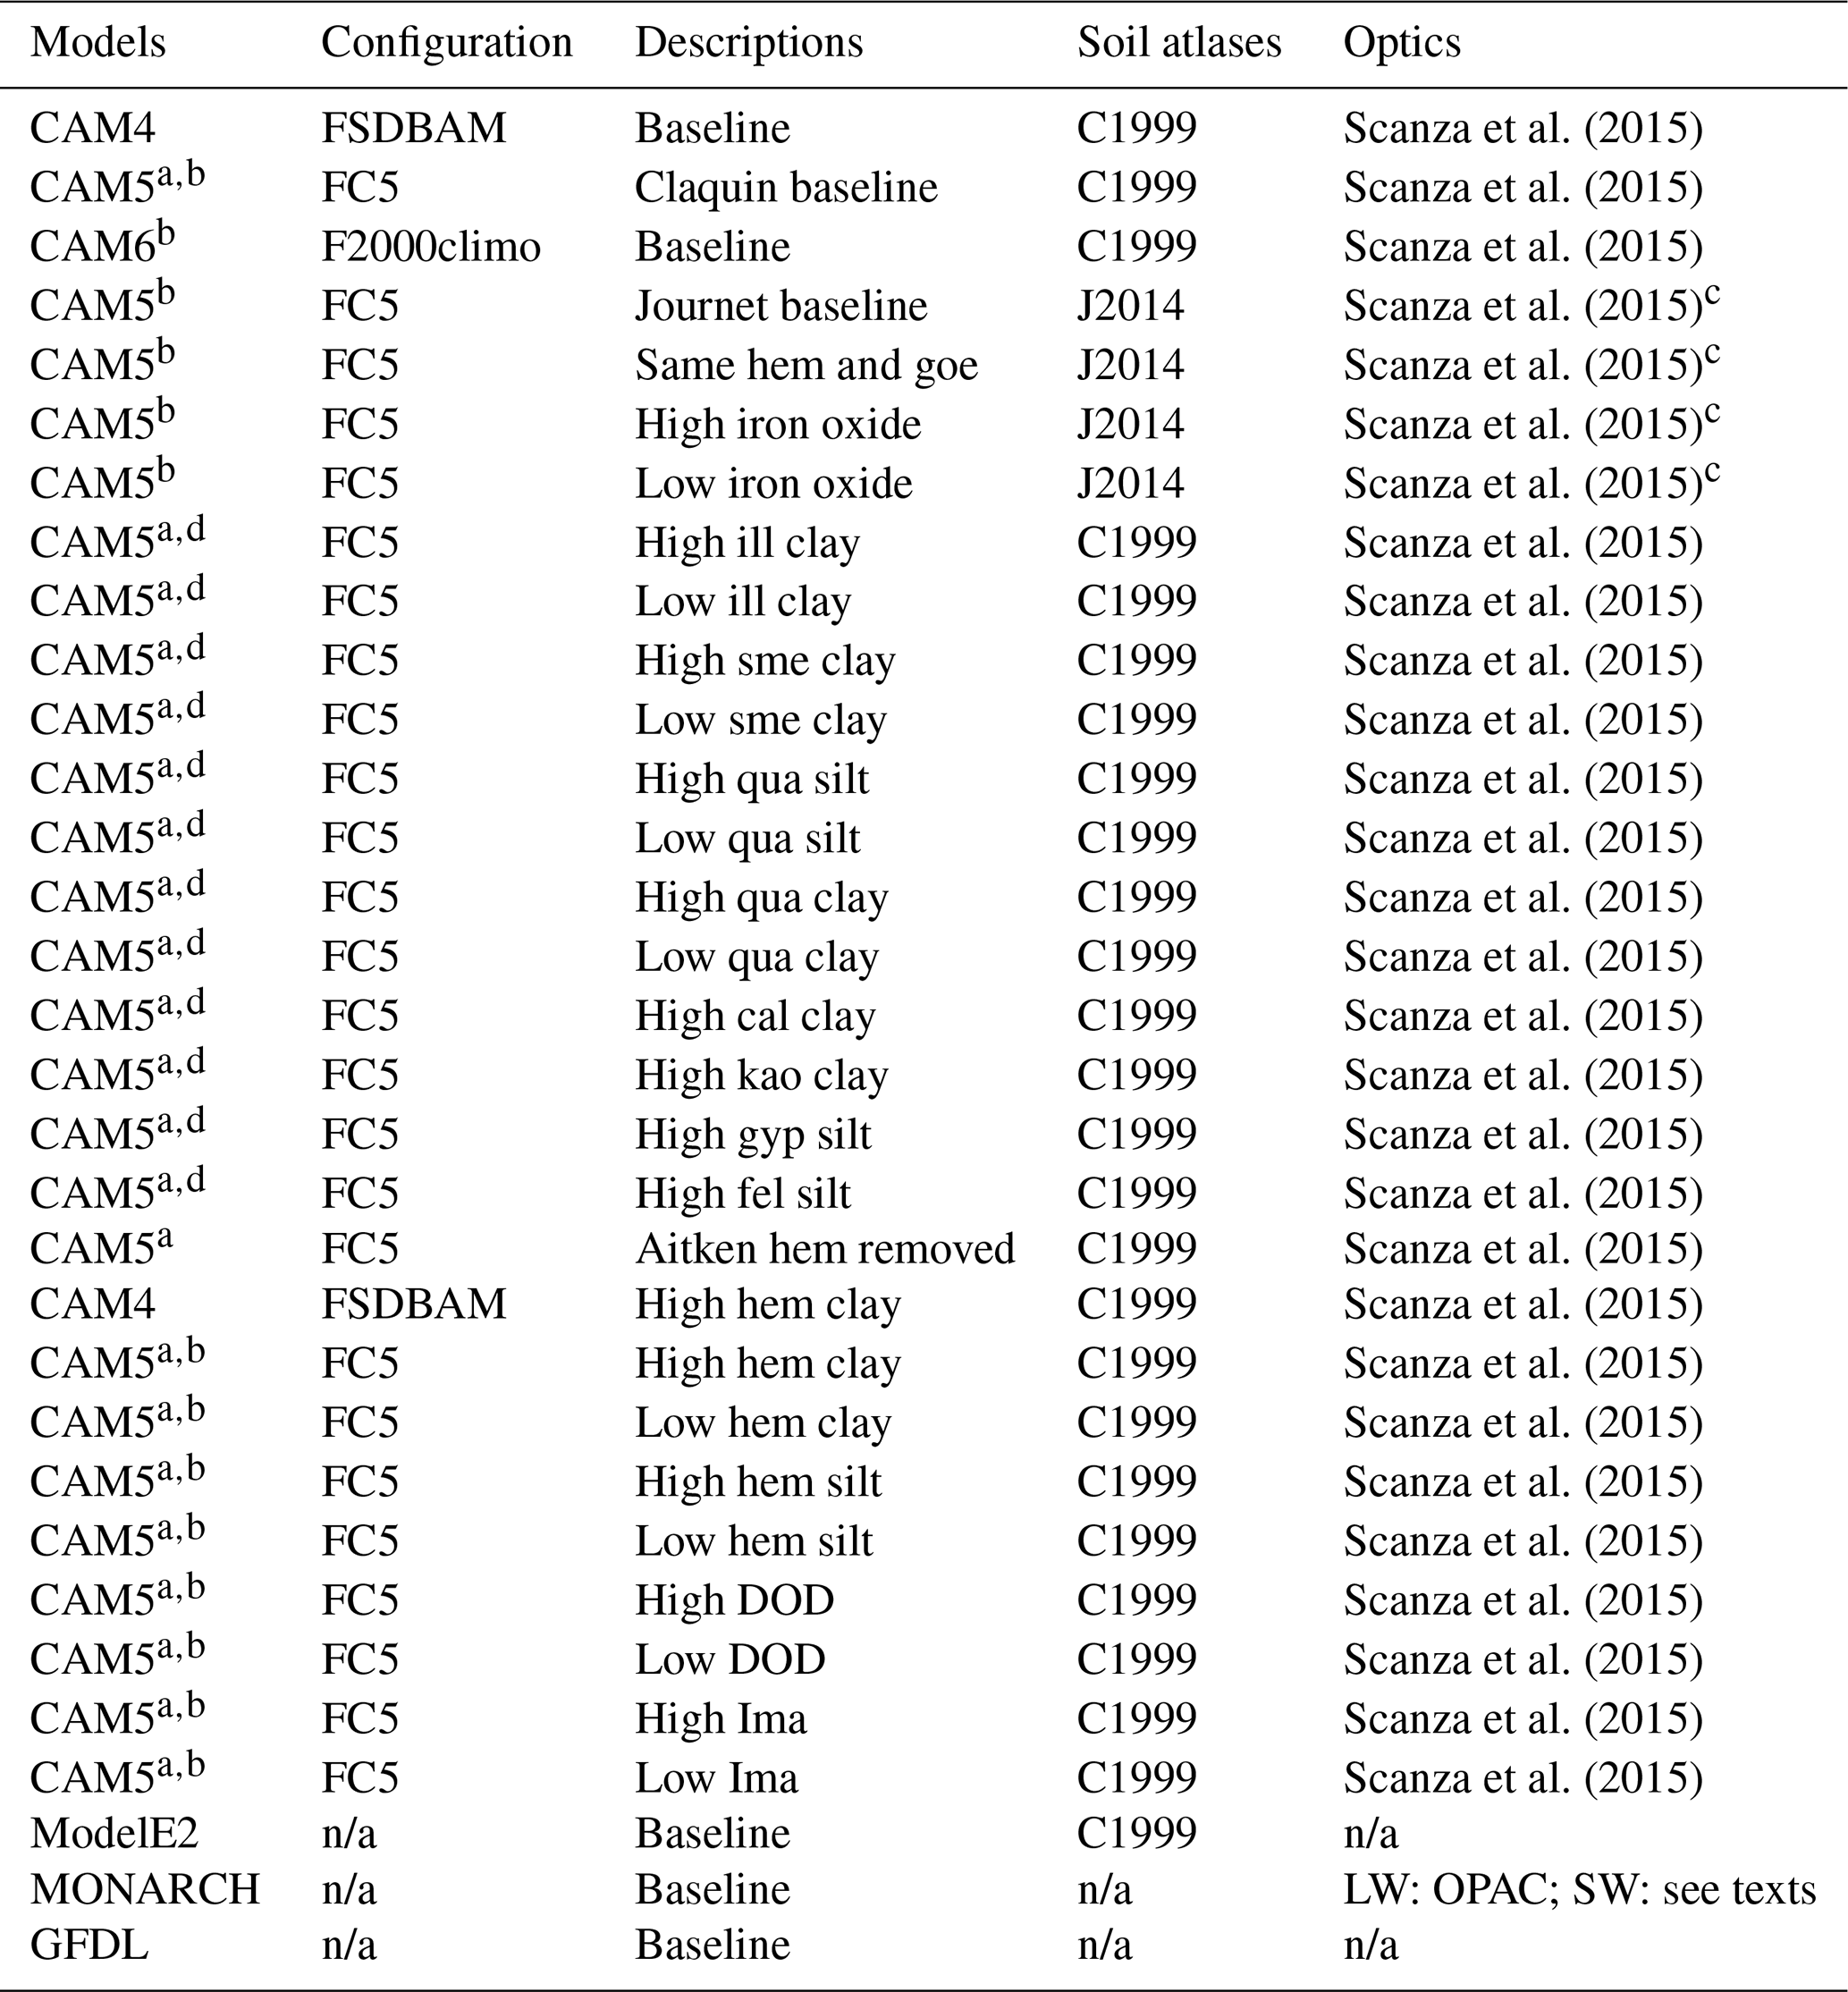
a,b Model simulations with and without the bug, respectively. c Assumed optical properties for goethite. d A scaling factor applied to the calculated DRE. n/a – not applicable.
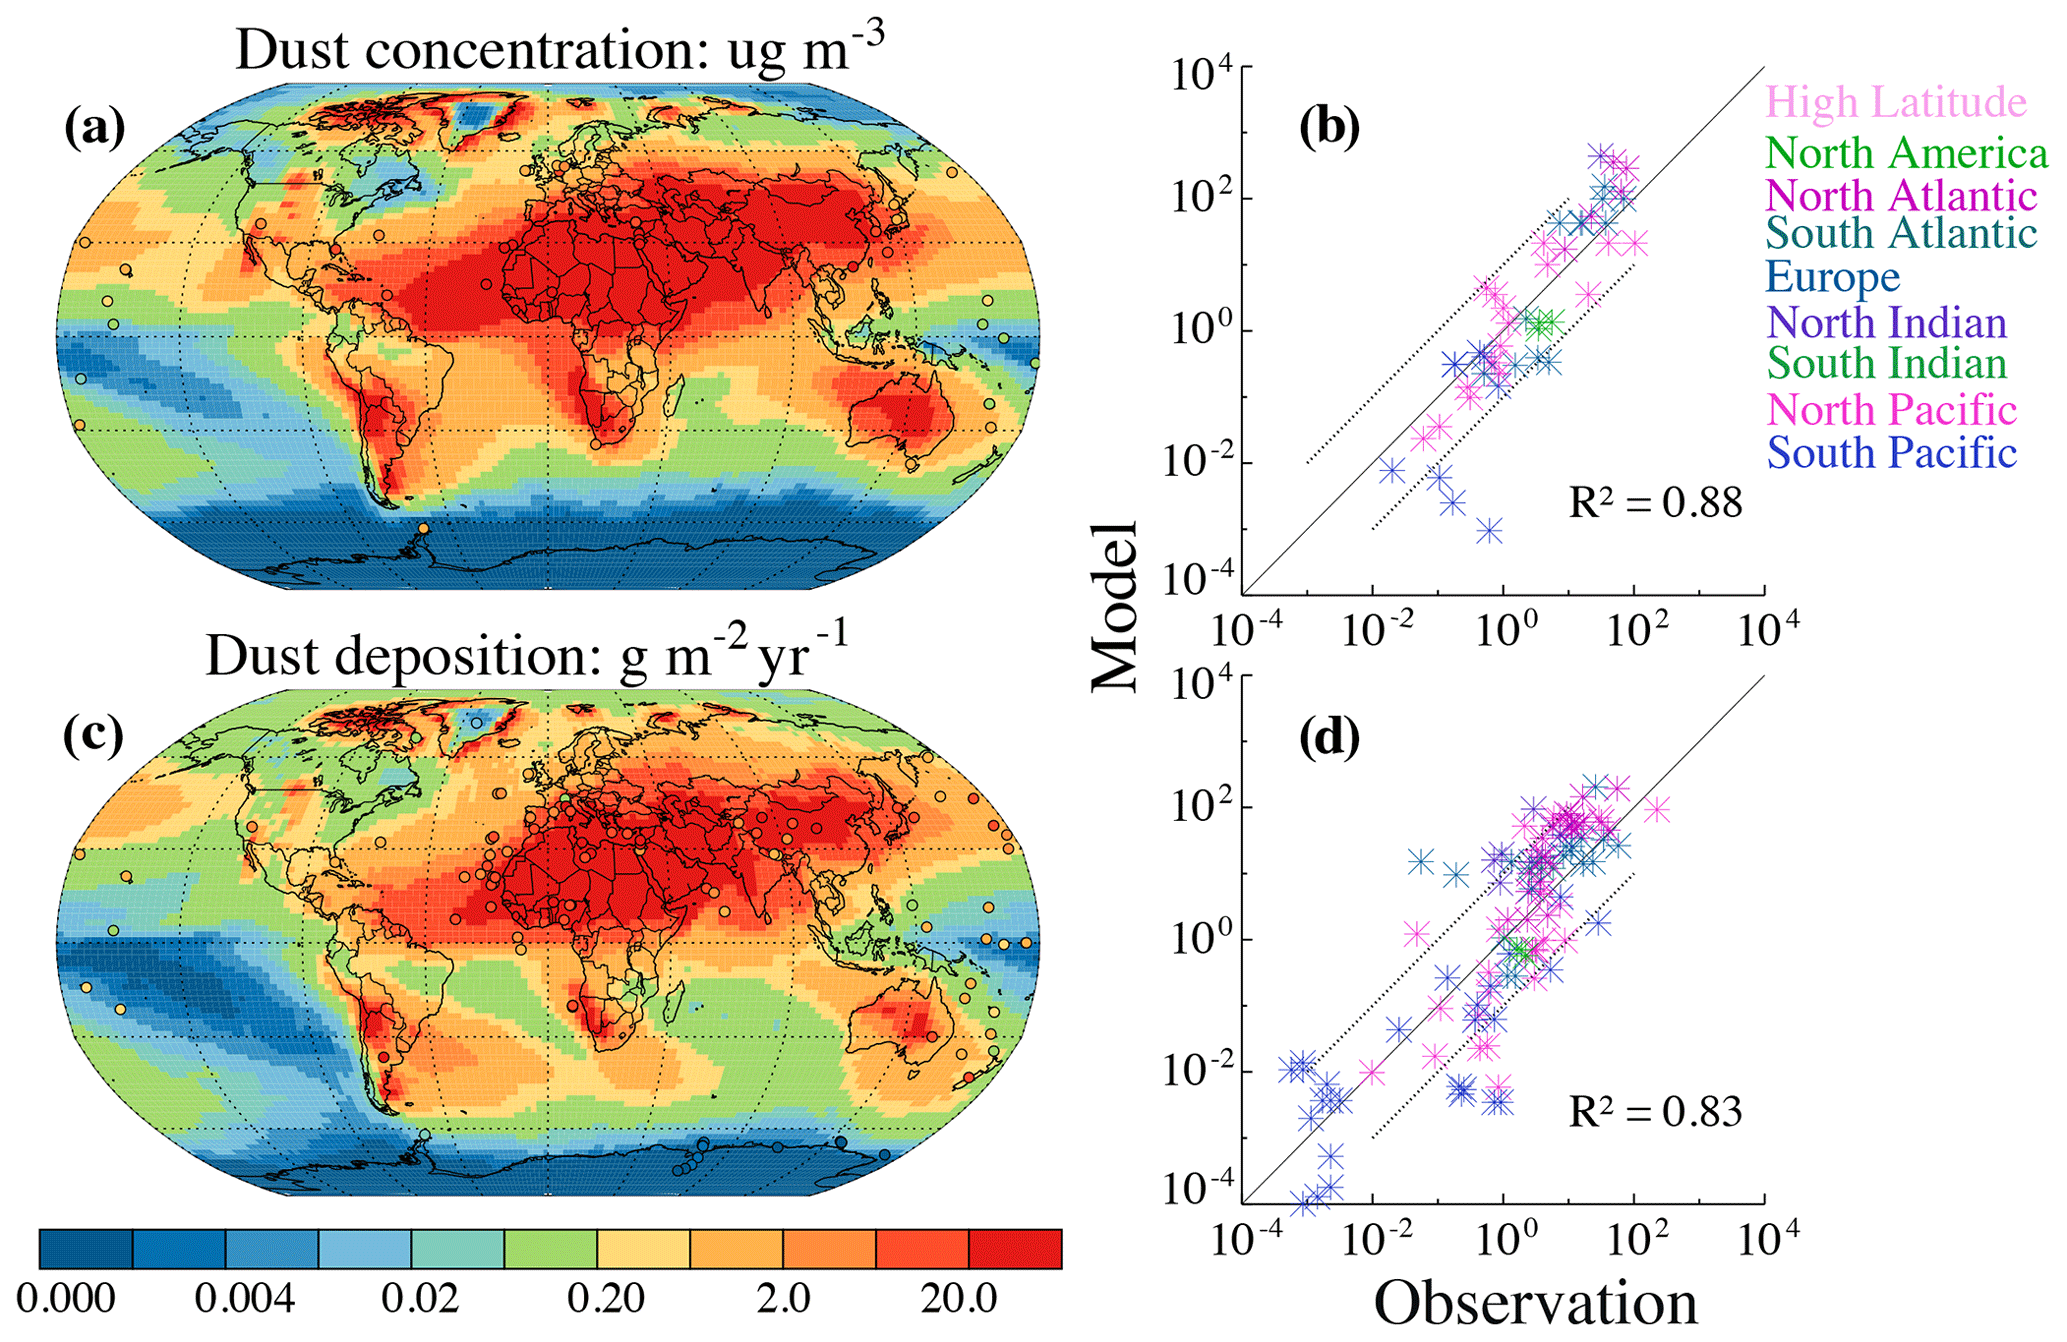
Figure 3Comparison of simulated (the baseline case; see text for details) dust surface concentration and deposition with observations. Also shown is the correlation in the log space (R2; both significant at the 95 % confidence level) between modeling and observations over sub-domains as indicated by texts in color. The dash lines in (b) and (d) represent 10 : 1 (upper left) and 1 : 10 (bottom right) lines.
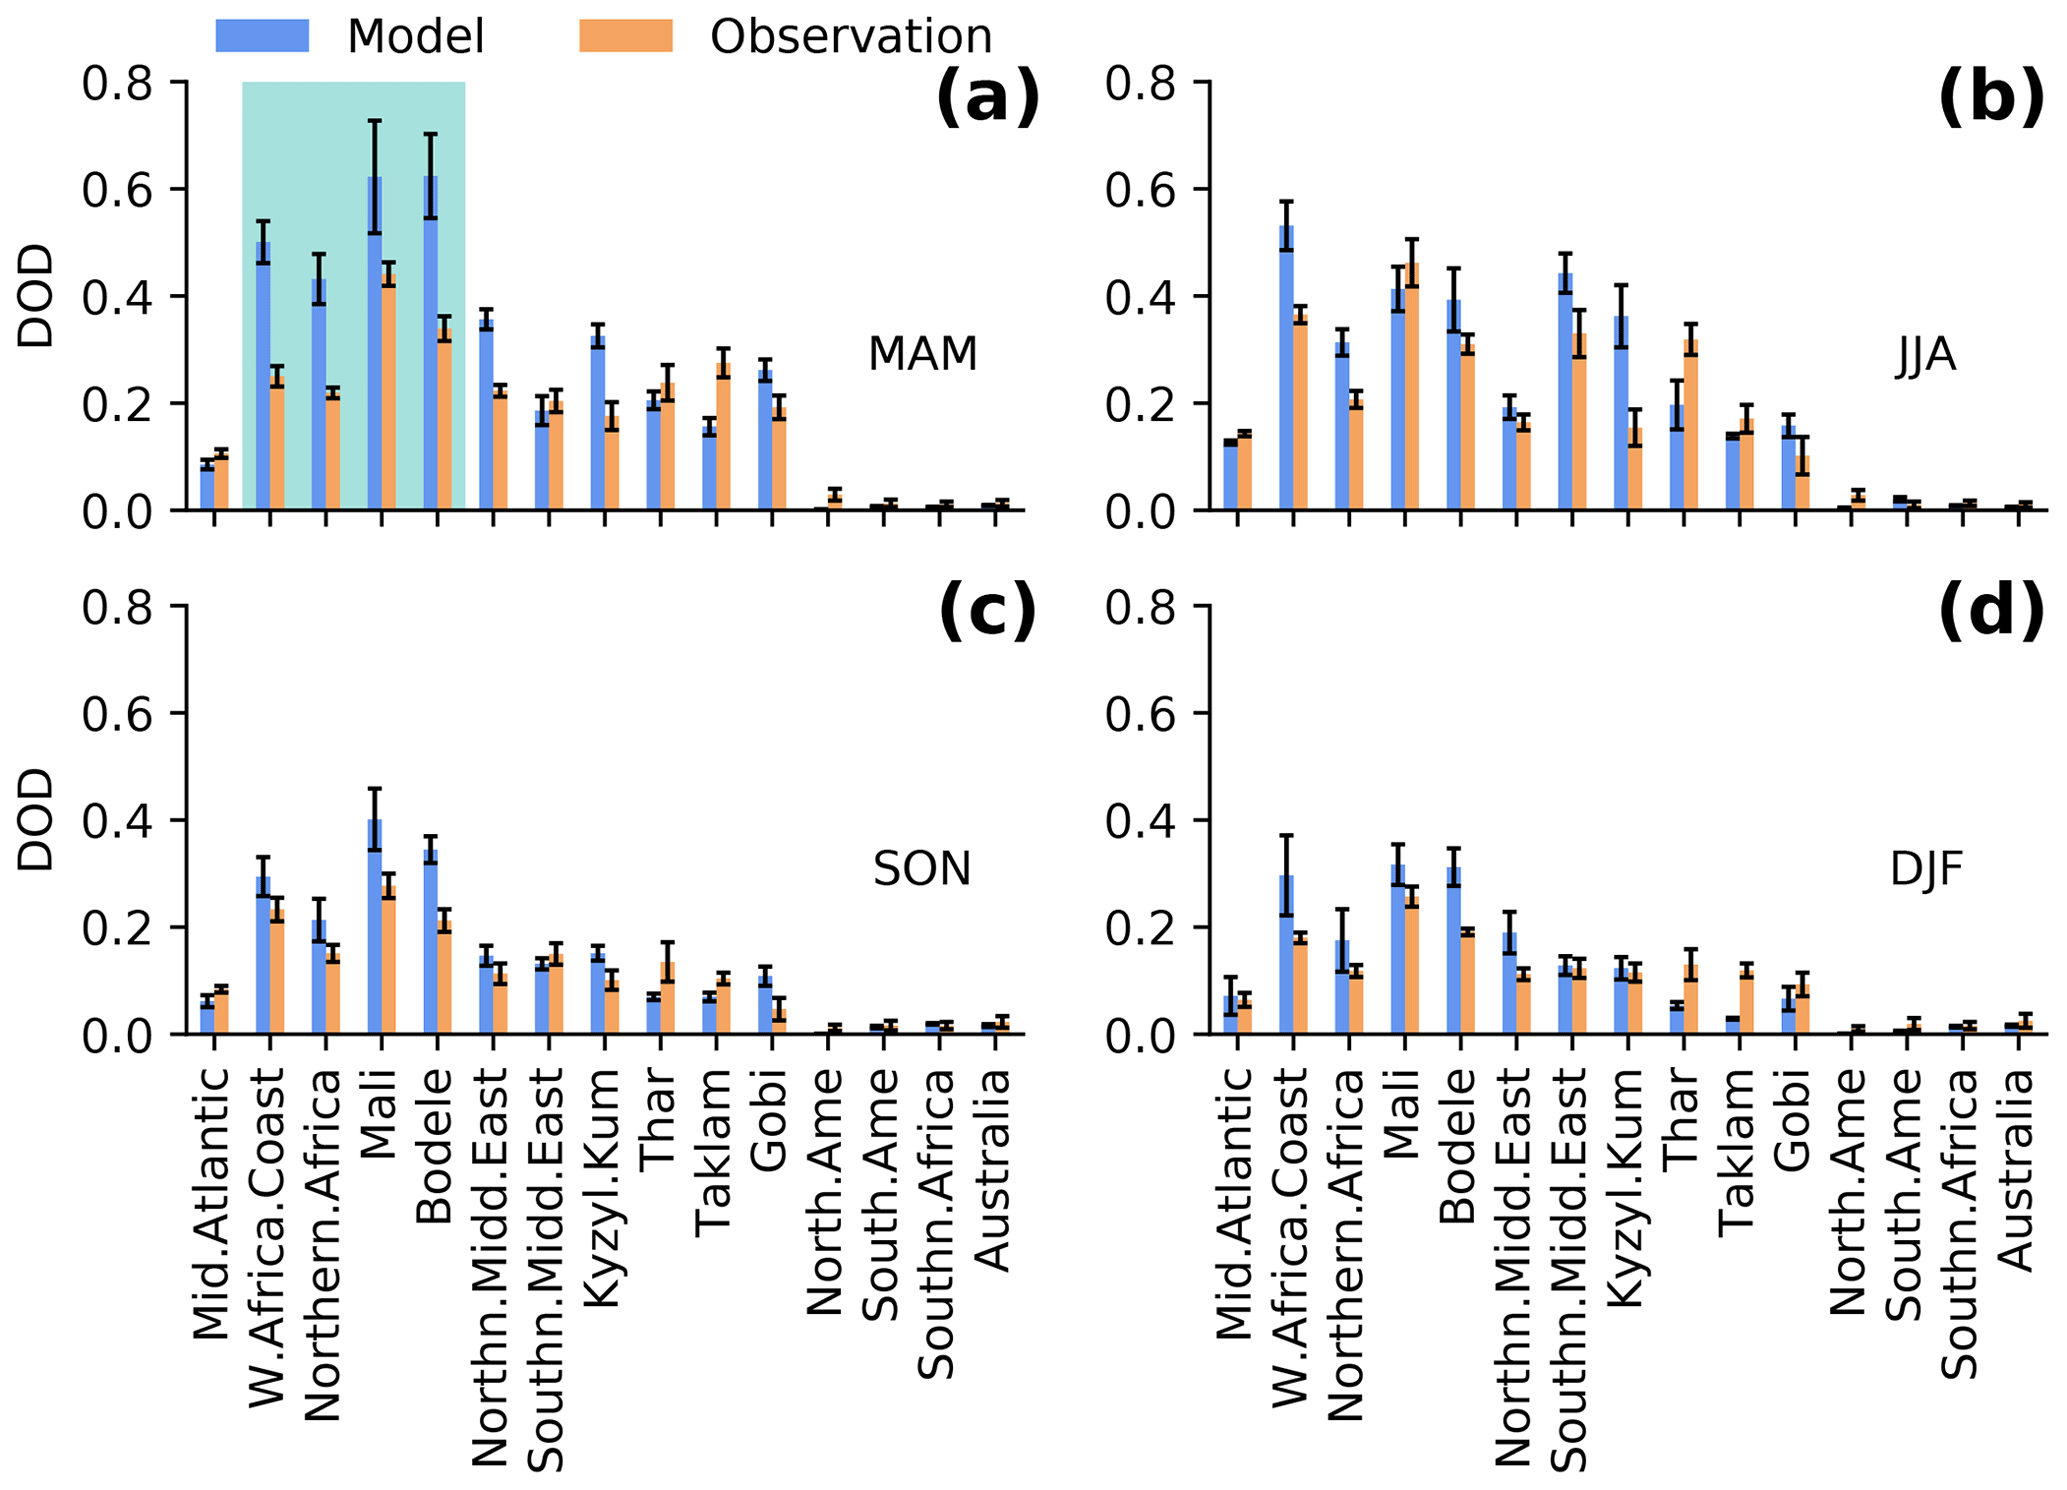
Figure 4Comparison of seasonally resolved DOD from the baseline simulation (blue) over 15 regions with that (brown) obtained in Ridley et al. (2016), who bias-corrected satellite-based retrievals from the Moderate Resolution Imaging Spectroradiometer (MODIS) and the Multi-angle Imaging Radiometer (MISR) using AERONET measurements and a model ensemble (see Ridley et al., 2016, for details). The shading area shows an example that the model greatly overestimated DOD compared to observations over some of the subregions. Error bars represent the standard deviation. For definition of the 15 regions see Fig. 1 of Ridley et al. (2016).
Dust optical properties are based upon Mie theory which idealizes particles as spheres. In contrast, AOD retrieved from sun photometers accounts for dust asphericity (Dubovik et al., 2002). To match modeled dust mass extinction efficiency with observations, we augment DOD globally by ∼16 % and ∼28 % for the accumulation plus Aitken and coarse modes, respectively, according to calculations of Kok et al. (2017), to account for dust asphericity for the first time in CAM. We do not consider the increased gravitational setting lifetime due to dust asphericity (Huang et al., 2020) and leave the lifetime effect of dust asphericity on dust DRE as a future study. Because of the DOD augmentation, a global DOD of ∼0.03 was achieved with a relatively lower dust emission compared to that without considering dust asphericity. For all other experiments, dust emission is set to be the same magnitude as in the base except for those used to assess uncertainty in DRE induced by changing the dust burden.
To compare the uncertainty in the DRE from mineralogy to the other factors whose uncertainties have been well quantified, we perturb the DOD and the imaginary complex refractive index of the mineral. We do not compare the resultant DRE uncertainty due to other error sources (see Appendix A), such as mixing and chemical reaction of dust with pollution aerosols (e.g., H2SO4, HNO3, and HCL) (Li and Shao, 2009; Huang et al., 2010; Tobo et al., 2010), which we leave as a field for future study. The DOD is perturbed via dust emission adjustment, to be ±0.005 (on the global average; high-bound DOD: 0.035; low-bound DOD: 0.025), based upon the constraint by Ridley et al. (2016). This perturbation amplitude was also utilized by Loeb and Su (2010). Considering the variation of dust absorptive properties in different source regions, mainly due to variations in the iron-oxide fraction (Lafon et al., 2006), the imaginary complex refractive index for bulk dust can vary by up to a factor of 2 for a given region, while the real part of the index changes less (Kim et al., 2011). Therefore, using a globally constant imaginary index may not capture a large fraction of the DRE caused by dust minerals. Measurements of the imaginary complex refractive index also indicate notable differences among different datasets (X. L. Zhang et al., 2015; Di Biagio et al., 2019). Here we perturb the imaginary complex refractive index, at the global scale, by ±16 % (relative percentage) for each mineral, following Kim et al. (2011), whose results are based on AERONET measurements at 14 dust-dominated sites in and around the Saharan and Arabian deserts for the sampling period spanning from 1996 to 2009. The absolute uncertainty (∼32 %) we considered sits in between the range of 13 %–75 % for dust aerosol obtained by Di Biagio et al. (2019).
After undertaking the first set of sensitivity runs, it was found that the calibration of DOD inadvertently double counted the mineral mass, resulting in dust emissions that were too low to obtain a DOD of ∼0.03 (emission rate of ∼3300 Tg a−1 compared to ∼6600 Tg a−1). We reran the model for a second time for those cases (e.g., iron oxides, DOD, and imaginary index) where the perturbed parameter was found to have an important impact on the DRE. The second set of simulations (dust emission rate: ∼4300 Tg a−1) introduced the effect of dust asphericity on the mass extinction efficiency, resulting in a global emission increase of 30 % compared to the first set of simulations (dust emission rate: ∼3300 Tg a−1) with incorrect mass specification for calculating DOD. The comparison of the calculated DRE between the two sets of simulation on the same perturbed parameter suggests a small difference (global average ≤0.05 W m−2) (Fig. S1 in the Supplement) after applying a “normalization” factor of 1.3. This factor was determined as the DRE ratio of the second to first set of simulations. It approximates the percentage change in dust emissions between the two sets of simulations (4300 Tg a−1/3300 Tg a−1) and is comparable with the enhancement of the mass extinction efficiency for particles in the coarse mode to account for dust asphericity. Therefore, we did not repeat those simulations where varying the minerals did not change the dust DRE. Instead, we use the “normalization” factor to convert the first set of CAM5 simulations (which did not include the shape effect) to the second set (which included the shape effect). We refer to the simulations that were not repeated in the figures and tables as “normalized” cases.
2.3.2 Soil mineralogy uncertainty in C1999
Here we discuss the sensitivity studies with CAM5 using a range of surface mineralogical maps based on the uncertainty in mineralogical composition by soil type (Fig. 2). Following the methodology described in the previous section and Scanza et al. (2015), multiple soil atlases are created and remapped onto CAM5 and CAM6 longitude and latitude grids based on C1999 and J2014 (shown in Fig. S2 for the distribution of minerals in J2014 and in Fig. S3 for the difference between J2014 and C1999) and corresponding soil uncertainties (e.g., Fig. 5). By subtracting the base value from the high-bound mass fraction for each mineral, we obtain the atlas of high-branch uncertainty for minerals such as illite, smectite, hematite, and goethite plus hematite in terms of absolute change (Fig. 5a, b, c, d; also shown is the relative change in Fig. 5e, f, g, h, respectively).
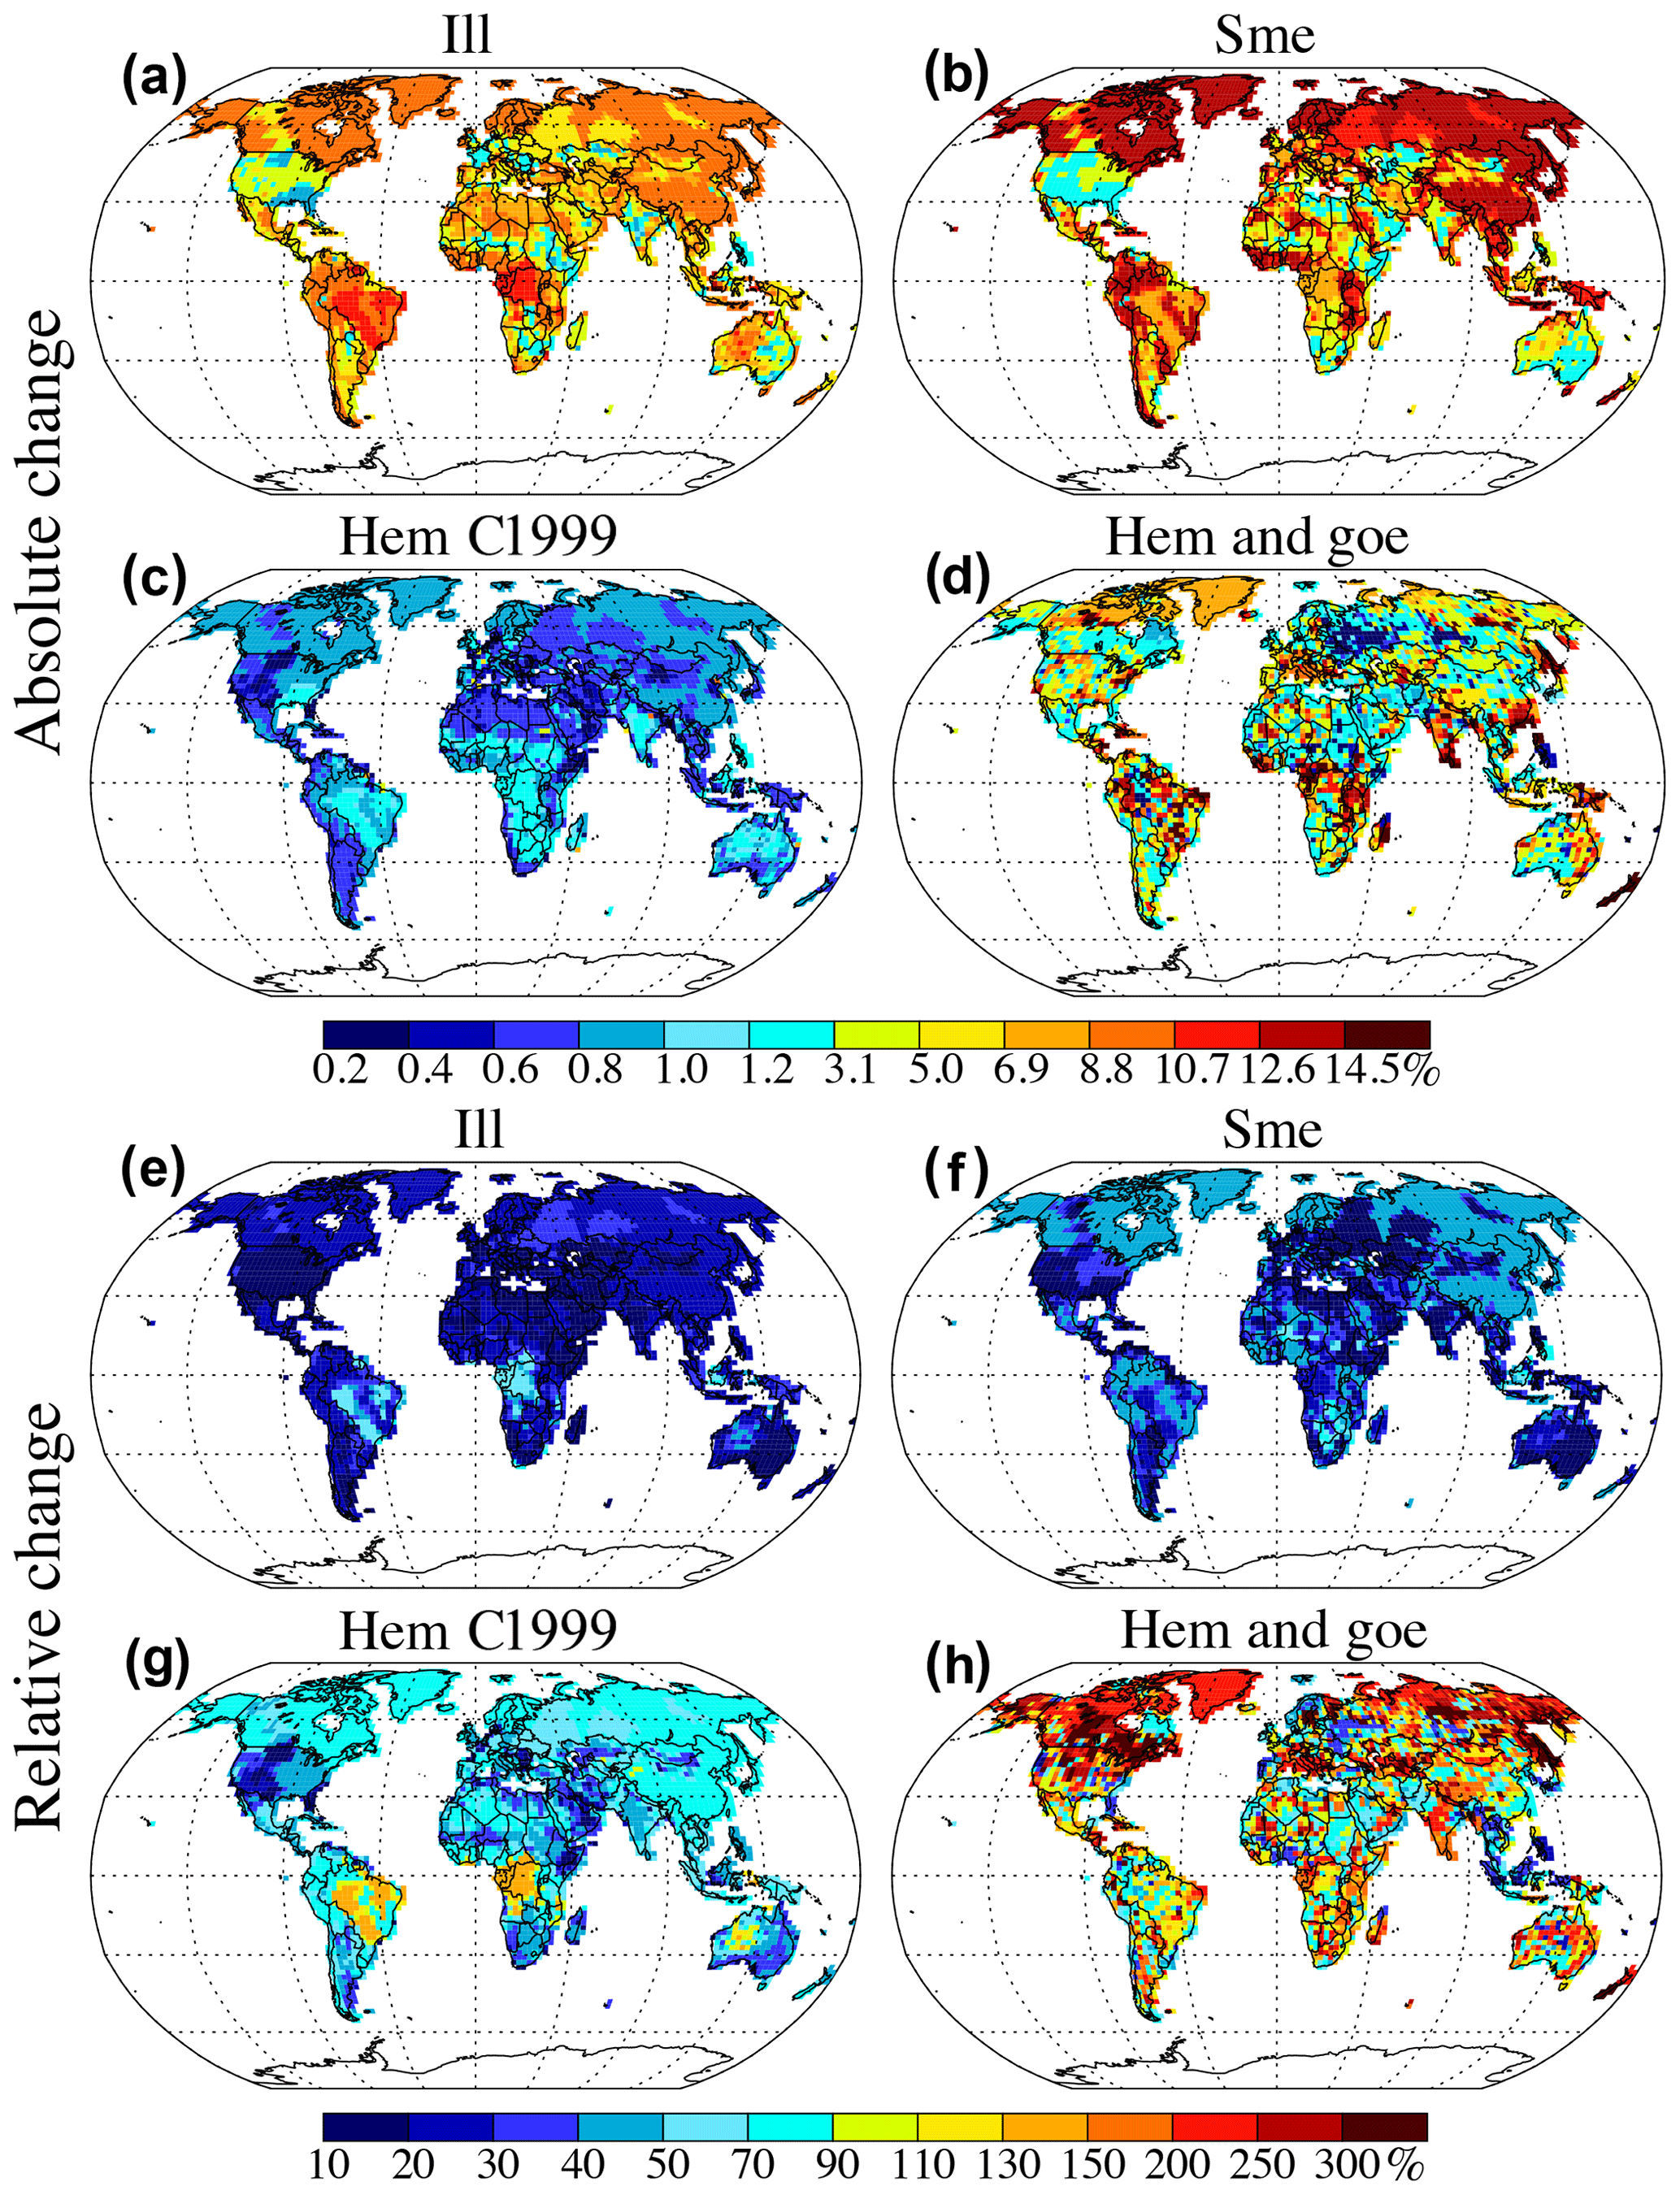
Figure 5Changes in soil concentration (fractional amount) of illite (ill), smectite (sme), hematite (hem), and goethite (goe) in the clay category. In (a), (b), (c), and (d), values are derived by taking the difference between high-bound mass fractions of the minerals and their base values constructed following the method of Scanza et al. (2015) according to the MMT in C1999 (a, b, c) and J2014 (d: hematite plus goethite) in CAM5. Similarly, (e), (f), (g), and (h) show the relative change defined as (high bound-base) (base) × 100. The mean soil distribution of these minerals has been shown previously (Scanza et al., 2015; Perlwitz et al., 2015a). Because of the limited information on mineral content in the silt-sized category, to create the global atlas for dust modeling showing the high and low bounds of iron oxides, we applied to all soil units a constant standard deviation of goethite that is present for two soil units for which we have information.
The amount of soil variability for other minerals tends to be smaller than for iron-oxide and hydroxide elements in terms of relative change (e.g., Fig. 5e, f compared to Fig. 5g, h). In addition, as shown later (e.g., Sect. 3.2.2), the iron-oxide and hydroxide minerals are more important for the DRE than the other minerals are, such that we focus our discussion here on iron-bearing minerals. Our calculation shows that in C1999 hematite, illite, and smectite in clay range between 0.27 %–0.86 %, 9.0 %–15 %, and 6.8 %–13 %, respectively, by mass with base values of 0.56 %, 12 %, and 10 %. In comparison, the globally mean hematite in J2014 is smaller (∼0.34 %) with an uncertainty range of 0.017 %–1.0 %. Goethite in clay and silt is estimated to be 1.3 % and 0.43 %, with ranges of 0.36 %–2.6 % and 0.00 %–1.0 %, respectively. We discuss next the spatial distribution of the uncertainty in iron oxides and clays in C1999 and compare it to that in J2014.
Iron oxides
Hematite and goethite are the most common iron oxides present in soils. In-lab analysis shows goethite being less absorptive than hematite (Formenti et al., 2014). Thus, partitioning these iron oxides at emission is relevant to accurately represent the dust DRE in the shortwave spectrum. C1999, however, only considers iron oxides to be in the form of hematite, while J2014 distinguishes two different iron-oxide species, hematite (present in the clay size) and goethite (both in clay and silt size fractions), consistent with other measurements (Lafon et al., 2006; Formenti et al., 2008, 2014). Both datasets agree on the scarce mass abundance of iron oxides in the clay- and silt-sized categories as compared to other minerals (note our extension of hematite to the clay-sized category in C1999). The combined iron-oxide (hematite and goethite) abundance in J2014 represents a much larger soil fraction than in C1999 (Fig. 5), particularly in the global average. We found that J2014 shows the dominance of the iron-oxide content by goethite over hematite, regardless of source region. Hematite in J2014 presents strong regional differences as in C1999 with mass fractions predominantly below 1.5 %, but in some arid regions, for instance northern Africa, reaching up to 5.0 % (Journet et al., 2014).
C1999 exhibits a large uncertainty in the soil abundance of hematite in the soils of Australia, central and southern Africa, western India, the south-eastern part of North America, and eastern Brazil (Fig. 5c). Particularly for areas considered to be sand dunes within the Sahel, the high-bound hematite in the clay-sized category is ∼80 % higher (Fig. 5g) than the base. The high iron-oxide content in soils from central Mauritania to central Mali (Lafon et al., 2006; Formenti et al., 2008; Klaver et al., 2011) is represented by a narrow uncertainty range. There is also high confidence in the low iron-oxide fraction attributed to the Bodélé depression (Lafon et al., 2006; Formenti et al., 2008), which has been characterized by satellite-based sensor as an active dust source (Ginoux et al., 2012). In J2014, soil abundance of iron oxides is more uncertain than in C1999 over North America, southern Africa, India, Russia, western China, and some regions in Europe and Australia. Over most dust source regions, high-bound goethite is approximately 1.3 times the base. In contrast, hematite is overall much less uncertain than goethite, and only at some hotspots can high-bound hematite be 1.6 times the base.
Clays
Illite dominates the clay-sized category. Most regions in C1999 show over 25 % illite by mass in the clay-sized soils and both atlases report up to 50 % clay-sized illite over some Sahara sand dunes. The region-to-region variation for illite is less pronounced than for low-abundance minerals (e.g., feldspars, hematite, and calcite). In comparison to hematite, the soil content uncertainty in illite in terms of the relative change is small (∼20 %) over dust source areas (Fig. 5e). Large uncertainties primarily exist over regions that tend to have low emissions, such as in southern Africa outside of the Kalahari Desert and the western part of South America outside of the Atacama Desert (Ginoux et al., 2012). Similarly, smectite abundances are also more certain than hematite, in particular over dust-active areas, with a relative change in its soil content less than 10 %. Absolute changes in these two minerals, however, are much larger compared to those of hematite in the clay- and silt-sized categories, even in dust source regions. Because of the small influence of these minerals on the shortwave DRE (apparent in C1999 and Sect. “Uncertainty due to dust minerals, burden, and imaginary complex refractive index”), we performed sensitivity tests only on iron oxides but not on illite and smectite when using J2014.
2.3.3 Spatially explicit uncertainty estimates
Spatially, we quantify the contribution of each uncertain parameter described in Sect. 2.3.1 to the total dust DRE uncertainty by accounting for the deviation in DRE from the perturbed case to the baseline case at target grid boxes. Specifically, the dust DRE due to uncertainties in soil mineralogy (e.g., hematite) is obtained following Eq. (2):
where Fdust,peturb is the DRE in an experiment; Fdust,base is the DRE in the baseline simulation; F1 is diagnosed radiative flux at the TOA in the baseline with dust and F2 without dust; F3 is diagnosed radiative flux at the TOA in the perturbed experiment with dust, and, similarly, F4 without dust.
Loeb and Su (2010) applied the root-mean sum of the squares of the uncertainties associated with each perturbing experiment (e.g., DOD), to get the total DRE uncertainty in the global average. This method was also used by Yoshioka et al. (2007) to estimate the errors for differences between two groups of data. Here, we utilize a similar method and apply it to the grid-cell level to get the total DRE uncertainty (Eq. 3 for C1999 and Eqs. 4 and 5 to account for difference between the two soil datasets) due to parameters we considered (minerals, dust burden, and imaginary complex refractive index for each mineral):
where ΔFhig and ΔFlow represents uncertainty in absolute terms; subscript “hig” and “low” show high and low branches; “n” is the total case number; “i” indicates different cases; “base” refers to the baseline simulation (CAM5 with C1999); “C” denotes C1999; “n−3” means that we exclude three cases associated with J2014 (see Sect. 2.3.1); term “b” is calculated following Eq. (5):
where “J” represents cases using J2014, and the “2” cases are for oxides with maximum and minimum soil abundances. Equation (3) includes only the perturbations to the model based upon C1999. Equations (4) and (5) allow the inclusion of perturbations associated with the J2014 soil mineral content. The bhig and blow factors allow the effect of perturbations calculated using J2014 to be included in the total DRE uncertainty despite the different base state of this model compared to that calculated using C1999.
Our adopted method, firstly, indicates an assumption that any difference between the experiment and base on the DRE calculation belongs to a part of the overall uncertainty and thus should be accounted for at the grid-cell level (Eqs. 3, 4, and 5), and secondly, effectively assumes that the perturbed parameters are independent. As in Loeb and Su (2010), we separate cases with a stronger warming from those with the opposite effect, splitting uncertainty into low and high branches but at the grid-cell level. These branches show the maximum range of DRE uncertainty that we can achieve through any combination of our perturbed experiments, assuming that these perturbations are independent.
We do not quantify the global mean uncertainty by simply averaging the value we obtained at all grid boxes, because there is no simple relationship between local and global uncertainty. Local uncertainty correlates across neighboring grid boxes, and this correlation probably varies spatially. Therefore, a simple average of the local deviation would very likely lead to bias in the global mean estimate toward regions with large correlation. Instead, we characterize global average uncertainty of the DRE based on the global mean of different cases as in Loeb and Su (2010).
In addition to the total DRE uncertainty due to all parameters considered, to quantify the contribution of uncertainty in the soil distribution of iron oxides to the total uncertainty, we repeat the above calculation but single out the effect of iron oxides.
2.3.4 Estimating radiative effect from other models
In order to understand the relative importance of uncertainties in mineral amounts to other uncertainties in dust DRE, we require estimates of the DRE from other model estimates, using up-to-date dust optics and size distributions, but there are limited models available that simulate mineral distributions. At present, the relation of dust mineral composition to AOD and DRE in ModelE2 is under development. Instead, we predict the shortwave dust DRE assuming that the relationship between the DRE and the monthly column hematite mass in CAM5 also holds in ModelE2. This relationship is founded by applying a least squares regression to each grid cell based on the monthly DRE and atmospheric column hematite mass in a CAM5 case with the high-bound hematite in the clay-sized category. We select the CAM5 high-bound case, because it simulated a similar global hematite loading to that in ModelE2. The regression model only includes hematite because the shortwave DRE is most sensitive to it. This is supported by various laboratory experiments of dust samples (Moosmüller et al., 2012; Di Biagio et al., 2019) and will be discussed further in Sect. “Uncertainty due to dust minerals, burden, and imaginary complex refractive index”.
As a test of the regression model, the DRE derived solely from hematite mass in CAM5 shows good agreement and self-consistency with the actual DRE (Fig. S4a, b). The predicted DRE aligns well with the actual value: the global mean difference is +0.01 W m−2, a measure of the uncertainty of our estimates of the DRE based upon the GISS ModelE2. The regression process reproduced the spatial contrast of aerosol warming and cooling. When applying the slope to CAM6 (Fig. S5a, b), the biases are larger along the “dust belt” (Fig. S5a), with positive errors over regions such as the Sahel and negative errors across most of the Sahara (Fig. S6a).
Similarly, the shortwave dust DRE in GFDL is predicted based on its simulated bulk DOD (i.e., without mineral speciation) using the least squares regression derived from CAM5. To make the models more comparable, we increase the dust amounts in the GFDL model by a factor of 1.5, so that the DODs are both ∼0.03 (Table 3). We compute the regression slope and interception based on the shortwave dust DRE and DOD in the CAM5 baseline. This approach works well for CAM5 (Fig. S4c, d) and CAM6 (Fig. S5c, d) and yields a similar shortwave dust DRE between GFDL and CAM5 with the global mean difference of ∼0.08 W m−2 (Fig. S6b). To check how the approach works for non-CAM models, we show the comparison for MONARCH, where we know the dust DRE (Fig. S7). In this case, there are some differences spatially, as the regression model underestimates the shortwave dust cooling over northern Africa, the Middle East and Central Asia. Globally, the underestimation reaches up to ∼0.2 W m−2.
Table 3DOD and dust burdens (Tg) in CAM4, CAM5 with C1999 and J2014, CAM6 with C1999 with hematite coming solely from the clay-sized category, and ModelE2 with C1999, GFDL, and MONARCH. Note differences in the global mean dust SSA calculation between CAMs and MONARCH: in CAM, the global mean dust SSA was derived from the simulated SSA for total aerosols at the 0.44–0.63 µm band by retaining only pixels with DOD > 0.5 ⋅ AOD in the calculation following Scanza et al. (2015); in MONARCH, the global mean SSA was calculated based on the simulated SSA at the 0.44–0.63 µm band for pure dust aerosol; in GFDL, the global mean SSA was calculated based on the simulated SSA at the 0.50–0.60 µm band for pure dust aerosol.
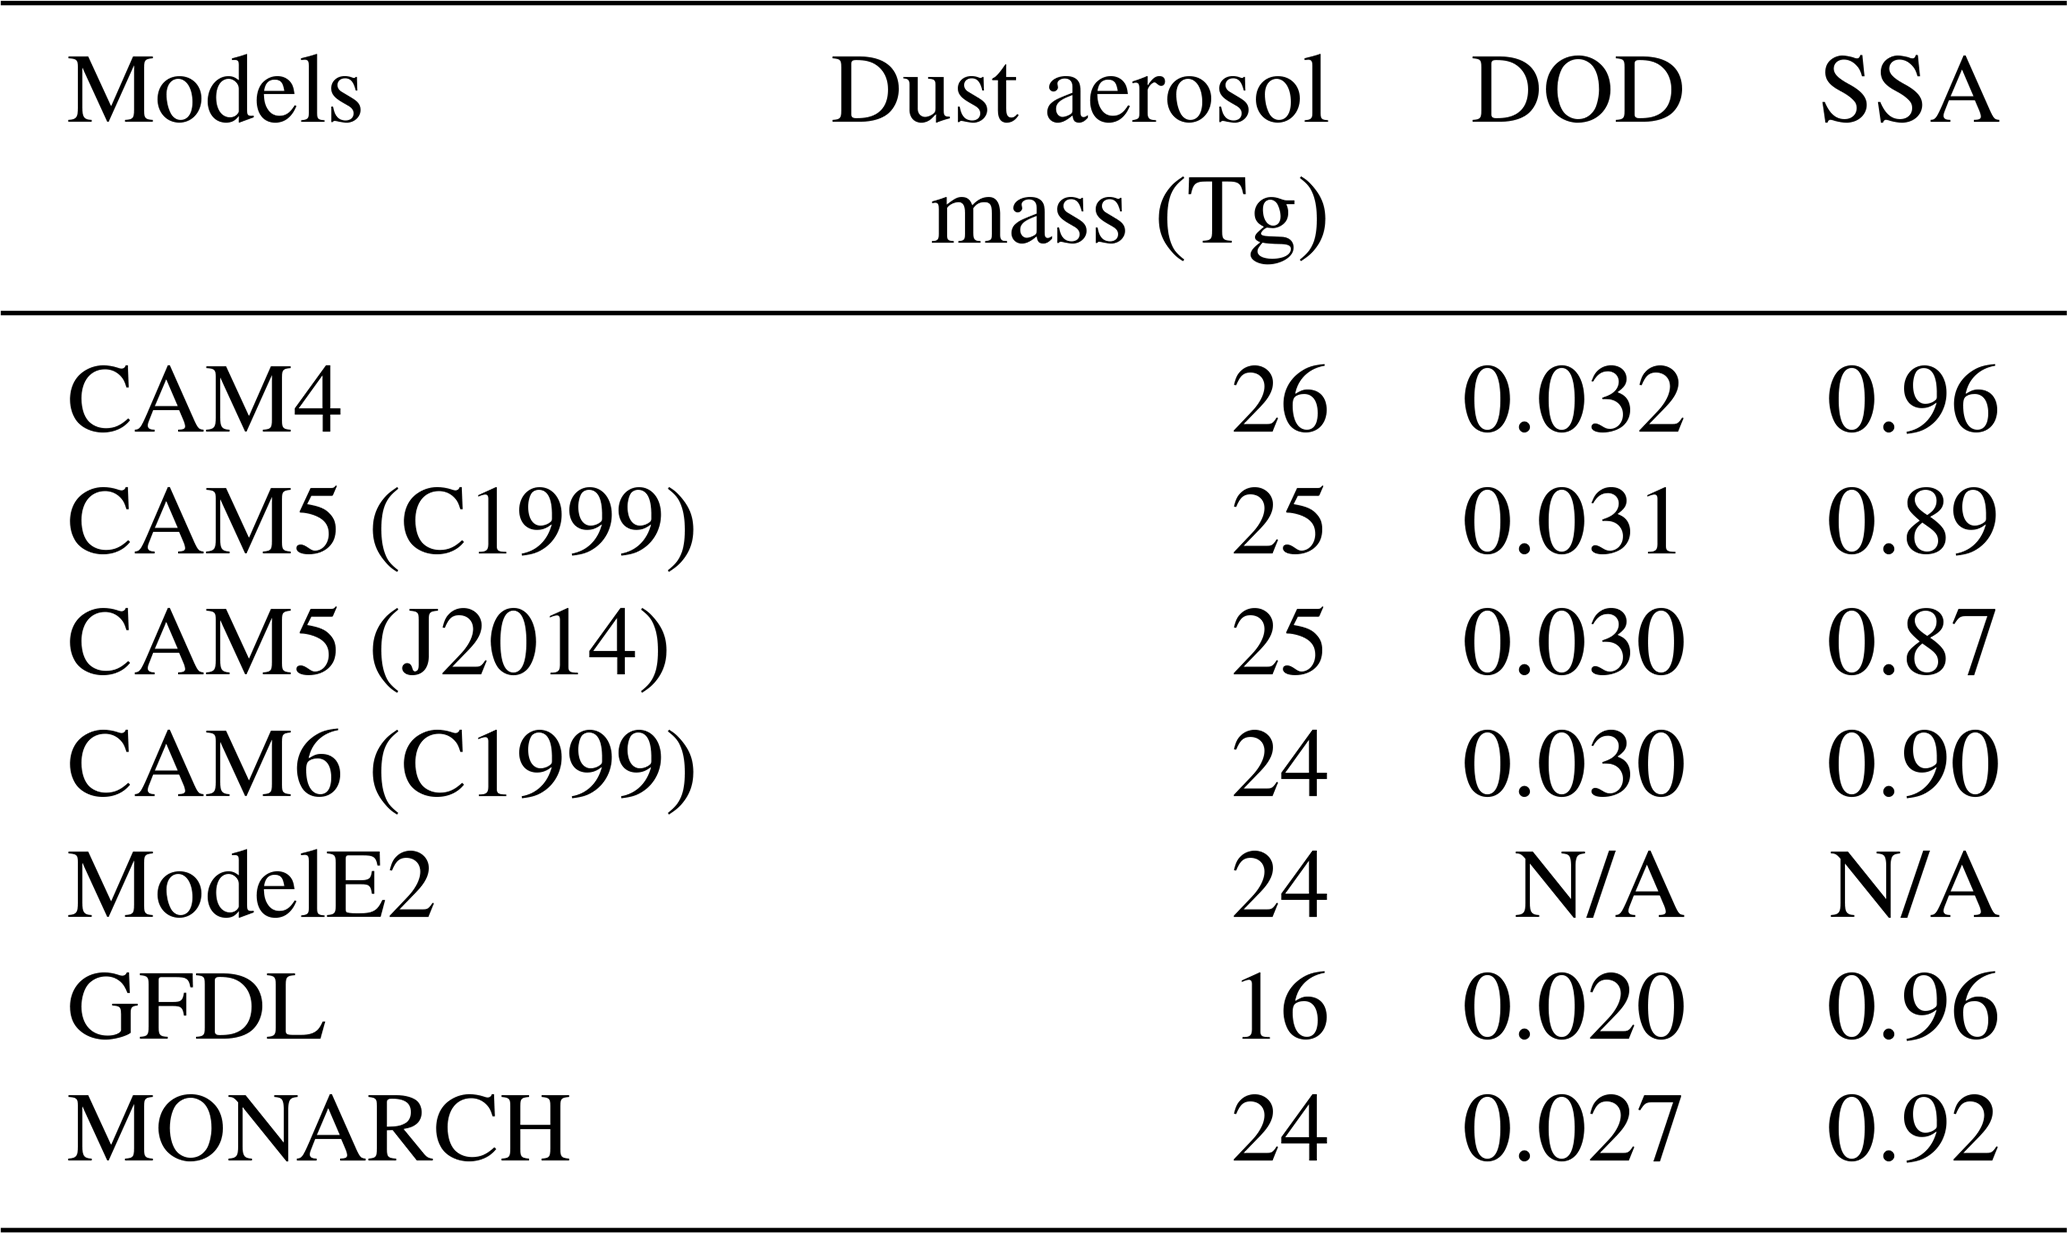
N/A – no data.
3.1 Simulated atmospheric mineral concentration uncertainty
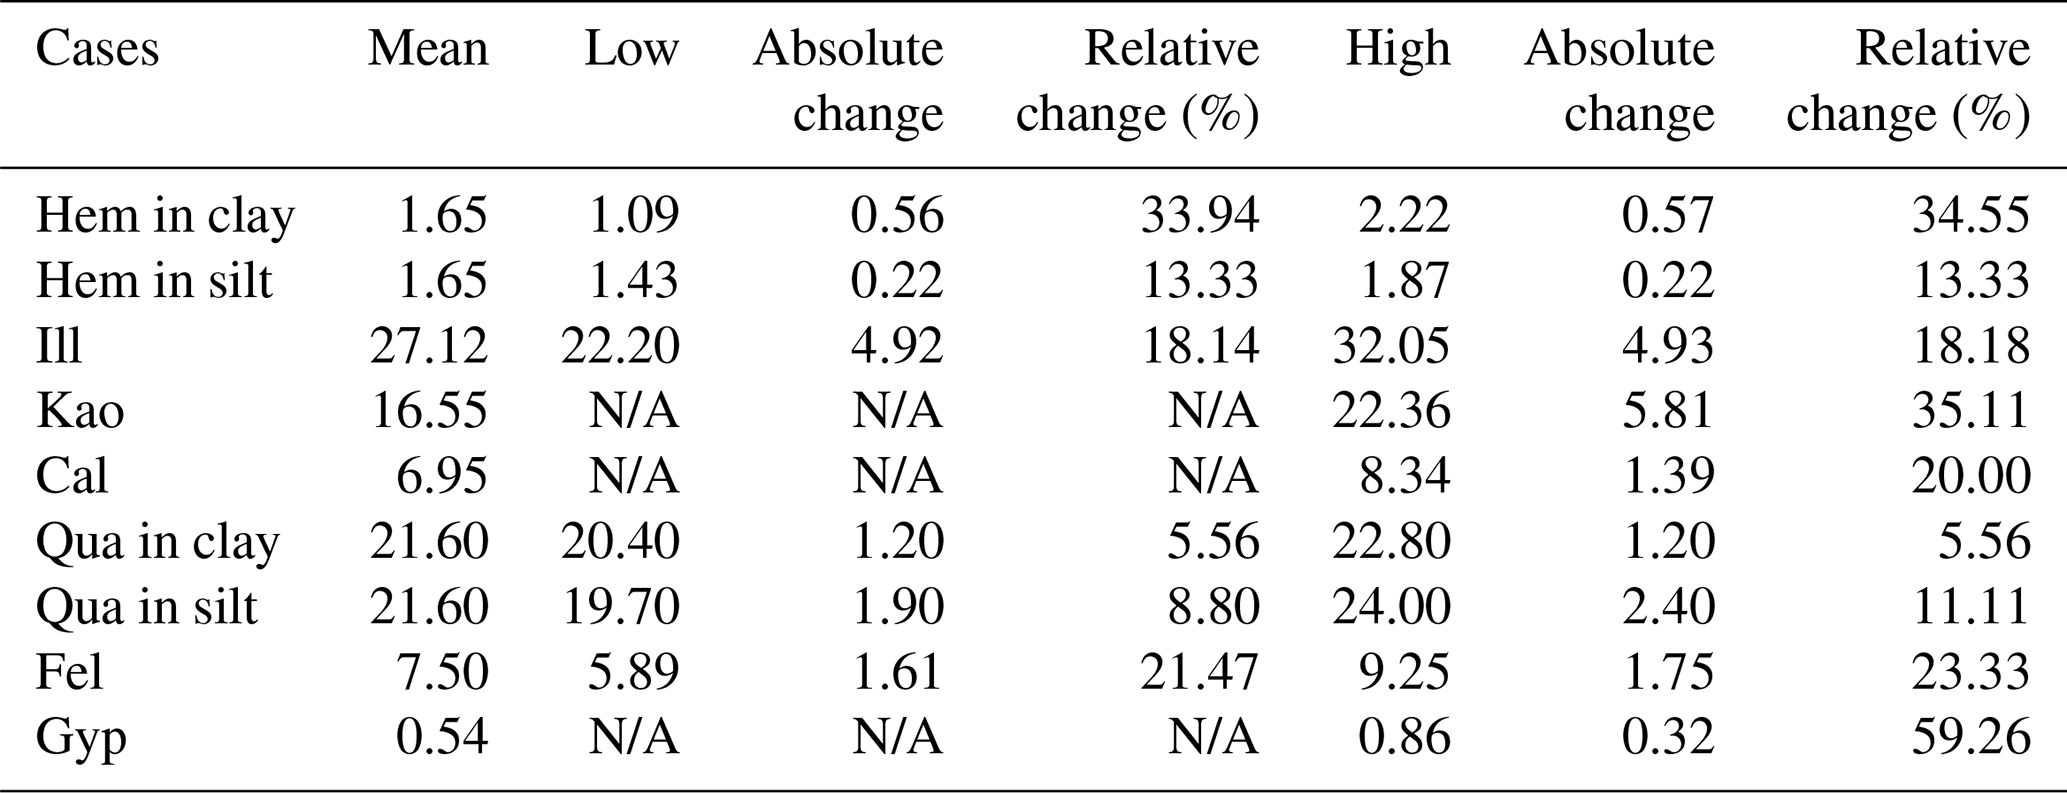
Once dust is emitted, the uncertainties in the soil mineral abundance (see Sect. 2.3.2) propagate into the uncertainties in the simulated atmospheric dust aerosol mineralogical composition. Table 4 lists the base global mean atmospheric dust mass fractions for hematite (1.7 %), illite (27 %), and smectite (18 %) and their uncertainty ranges (1.1 %–2.2 %, 22 %–32 %, and 13 %–23 %, respectively: absolute changes in low and high bounds with respect to the base) in CAM5 using C1999. The uncertainty range in hematite in the clay soil fraction (0.27 %–0.86 %) results in approximately a 35 % relative change in its simulated atmospheric burden with respect to the base; this value is 18 % for illite and 26 % for smectite (Table 4). The brittle fragmentation theory applied to the fully disaggregated soil particles puts clay-sized soil particles ∼130 % more into coarse-mode aerosol particles compared to the silt-sized source (Table 2b of Scanza et al., 2015), increasing more the baseline percentage of coarse-sized aerosol hematite. Consequently, uncertainty in hematite in the clay-sized soil category leads to a larger relative change in simulated total hematite burden than that in the silt-sized category does (35 % versus 13 %, respectively), although identical soil uncertainties are prescribed. Similar results are obtained in CAM4, because it is binned with similar diameter boundaries to CAM5 (bin 1: 0.10–1.0 µm in CAM4 versus Aitken and accumulation modes in CAM5 and bins 2–4: 1.0–10 µm versus the coarse mode). CAM6 simulates a much smaller hematite fraction of the total dust mass as we prescribed hematite solely from the clay-sized soil, despite similar values for the illite and smectite fractions. Silt-sized soil hematite sources were removed for the CAM6 sensitivity test, because its omission could probably improve the model–observation comparison in SSA for CAM5 (Scanza et al., 2015). Combining all three versions of CAM yields an estimate of the global mean hematite burden of 0.58 %–2.2 % of the total dust by mass.
Table 4Simulated mineral mass fraction and fractional absolute and relative changes (in percentage, %) in mineral mass fraction from the mean to the high bound in the global average.
N/A – no data.
Perturbing hematite in the silt- and clay-sized categories requires an opposite and compensating change in the abundance of the remaining minerals in the same soil-sized category (Sect. 2.3.1), which are often dominated by phyllosilicates (e.g., illite, kaolinite, and smectite) (Claquin et al., 1999). As iron oxides are, in general, a small fraction of total dust mass, this change represents a tiny fraction for the offsetting mineral, generally less than ∼2 % in practice. Table 4 and Fig. 5a, b, c show that absolute uncertainty in the hematite change in C1999 is frequently much smaller than that of either illite or smectite with the absolute change in simulated hematite aerosol mass fraction with respect to the base value (1.7 %) ∼0.6 % and ∼0.3 % due to uncertainty in the clay- and silt-sized category, respectively. The simulated relative change for hematite is comparable to kaolinite, large compared to illite, smectite, quartz, and feldspar but small compared to gypsum.
We show spatial distributions of the relative change in simulated mass fraction due to uncertainty in iron oxides in both atlases and kaolinite in C1999 in Fig. 6 (for other minerals, see Fig. S8), and the column mean mineral mass percentage simulated in CAM5 and CAM6 in Fig. S9. Northern Africa (in particular the Sahel), Australia, followed by the Middle East, are important sources of hematite (Claquin et al., 1999). In agreement with the location of the maximum hematite fraction observed in soils within C1999, large mean column hematite fractions are found in the interior of Australia and to its north (Fig. S9k) and in the dust plume that extends from northern Africa to South America. The high hematite content in dust particles from the Middle East agrees with Krueger et al. (2004). The comparison of iron oxides with other minerals in the global average (e.g., the smaller absolute uncertainty in hematite change comparable to other minerals and comparable relative change between hematite and kaolinite) is somewhat true regionally (Fig. S8). For example, over northern Africa and the dust plume in downwind regions, uncertainty in the soil abundance of hematite in the clay-sized category in C1999 leads to a relative change of ∼40 % in the atmospheric abundance compared to the baseline simulation in CAM5. This regional relative change in simulated hematite aerosol mass fraction is only a little small compared to kaolinite (Fig. 6) but large compared to illite (Fig. S8e), smectite (Fig. S8g), and quartz (Fig. S8i, j).
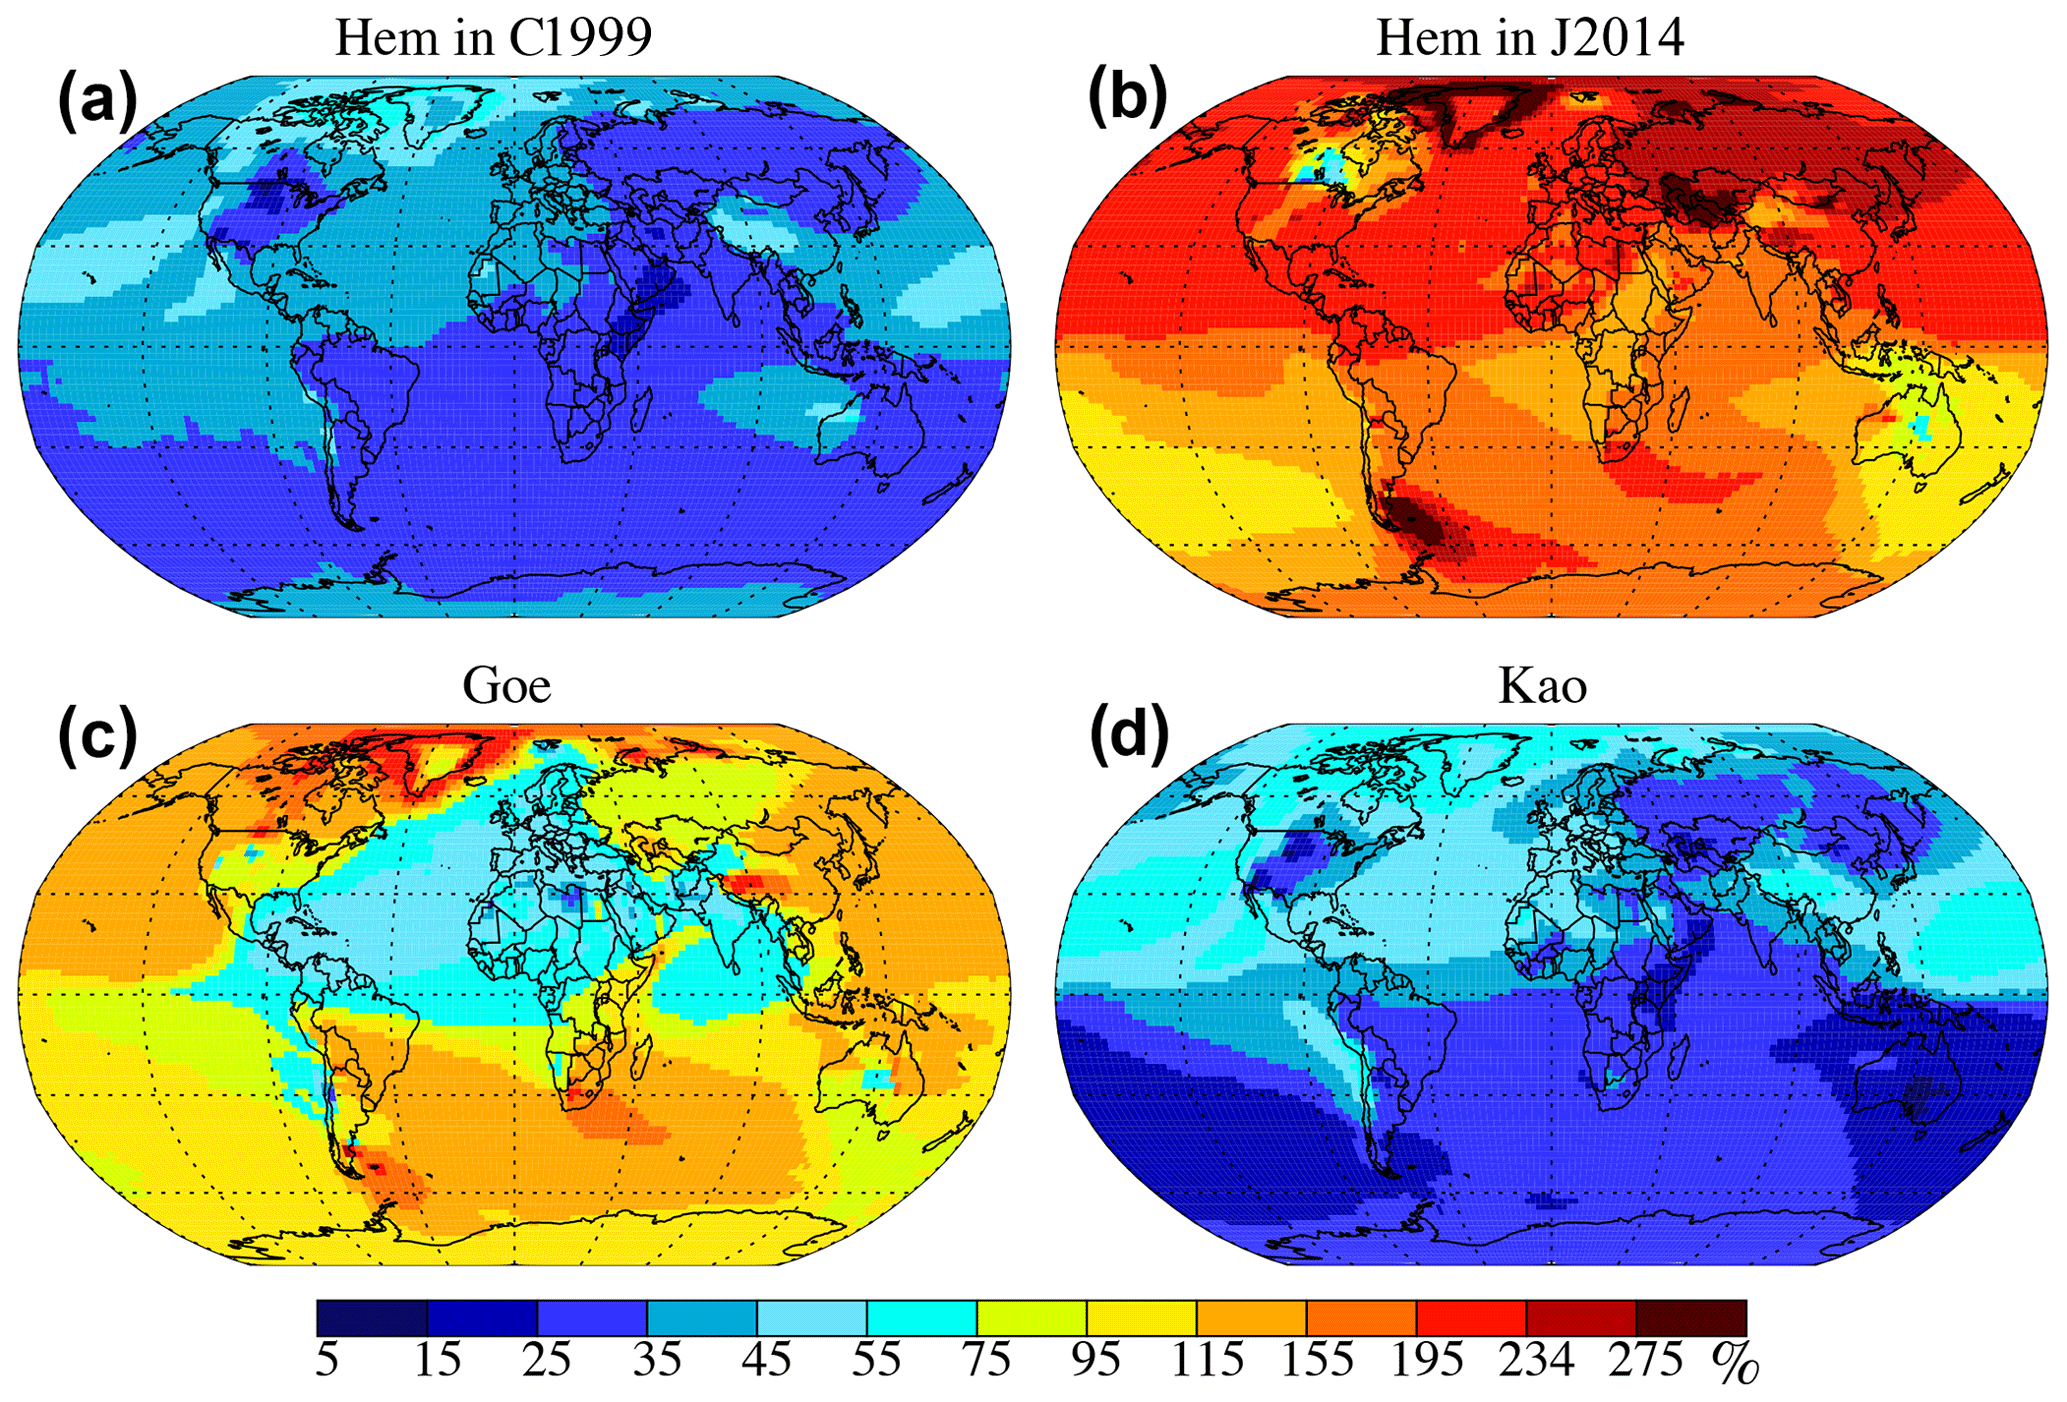
Figure 6Relative change (in percentage) of simulated mass fraction for hematite (hem) C1999 (a; in the clay-sized category) and J2014 (b), goethite (c, goe), and kaolinite (d, kao) in CAM5 from base to high bounds of their soil distribution. Relative change in percentage is calculated as (high bound-base) (base) × 100. The mean distributions have been shown previously (Scanza et al., 2015; Perlwitz et al., 2015a).
In addition to the variation in soil mineral distribution, the uncertainty in the monthly mean mineral composition of dust aerosol is sensitive to the seasonal cycle and the interannual variability in dust emissions (Smith et al., 2017) as well as the model version used. Figure S10c, d show the coefficient of variation (CV: calculated as the ratio of the standard deviation of the monthly means to the mean across all experiments, including results from GISS ModelE2) for iron oxides. The global mean CV is less than 1.0. In the regions that are downwind of the major dust sources, except the Patagonian Desert and Australian deserts, variability in the iron oxide(s) amount (CV < 0.9) is lower than that which occurs over the Sahel and dust sources in Australia, likely due to seasonal and interannual variability of the dust emissions (e.g., Mahowald et al., 2003). Much of the variability shown in Fig. S10 is because of including results from different models, as seen by contrasting the CV of the combined CAM5, CAM6, and ModelE2 (e.g., Fig. S10c; global mean CV equals 0.7) to that of CAM5 only (e.g., Fig. S11c; global mean CV equals 0.3). The effect of model differences on the hematite variability is also illustrated in Fig. S12. The combined CV between different models (e.g., Fig. S12a, global mean CV equals 0.6 for combined CAM5 and CAM6; Fig. S12b, 0.7 for combined CAM5 and ModelE2) is larger than that induced by the soil uncertainty in hematite in C1999 in CAM5 only (Fig. S11c), but comparable to the CV (Fig. S11d; global mean CV of 0.7) obtained accounting for the difference between the two atlases. Despite matching soil mineralogy C1999, ModelE2 and CAM5 differ in various aspects of dust mineral representation, including the treatment of aerosol mixing states for mineral species. Specifically, ModelE2 represents hematite in both the pure crystalline form (externally mixed, as for CAM4) and as small impurities attached as an internal mixture to non-iron-oxide minerals (internal-mixed, as for CAM5/6 in each mode). Hematite aerosol in the pure form is removed quickly from the atmosphere by gravitational setting because of large density (5260 kg m−3) compared to other minerals (density < 4000 kg m−3). In contrast, the allocation of hematite within a mixed aerosol composition facilitates long-range transport of the hematite contained within, because hematite occupies only a small mass (volume) fraction and thus the aggregated density is determined by the host mineral(s). Due in part to the different treatments of hematite between CAM5 and ModelE2, combined variability between CAM5 and ModelE2 (global mean CV = 0.7) is comparable to that due to uncertainty of iron oxides in the two atlases (global mean CV = 0.6) and also comparable to a combination of CAM5 and CAM6 with removed hematite source from the silt-sized category (global mean CV = 0.6).
3.2 Shortwave direct radiative effect uncertainty
3.2.1 Base simulation direct radiative effect
The choice of the soil mineralogy dataset and model employed has a strong impact on the derived dust DRE (Table 5 and Fig. 7). CAM5 with C1999 simulates a global mean TOA DRE of −0.18 W m−2 compared to −0.34 W m−2 in CAM6 (Table 5 and Fig. 7a, b). Compared to the CAM5 baseline, CAM4 has a similar global mean TOA DRE (−0.13 W m−2) assuming external mixing compared to the internal mixtures of CAM5 in each mode. However, CAM4 simulates a different spatial pattern with more warming over the majority of the northern African deserts consistent with Scanza et al. (2015). They obtained slightly less global shortwave dust cooling compared to the CAM4 results of this study, primarily because of their low DOD (0.016), only half the value in this study (∼0.03). Note that in CAM4 the optical properties for minerals (quartz, gypsum, feldspar, and calcite) are calculated considering an internal mixture in both Scanza et al. (2015) and this study. In contrast to the similarity of dust DRE between CAM4 and CAM5, CAM6 with C1999 simulates a stronger global averaged shortwave cooling of −0.34 W m−2 and more areas showing cooling effects (Fig. 7b, c), because we assumed that hematite solely comes from the clay-sized soil category, resulting in a smaller hematite aerosol mass fraction (CAM5: 1.65 %; CAM6: 1.11 %). The treatment of iron oxides within the model is, therefore, important for estimates of the shortwave dust DRE.
Table 5Global mean SSA at the 0.44–0.63 µm band and DRE in shortwave (SW) and longwave (LW) spectra and their sum (Net) for different cases in CAM5 and CAM6. DOD for all cases is approximately 0.03 except “High DOD” (∼0.035) and “Low DOD” (∼0.025). Values in the last four rows are obtained in CAM5 using J2014 with different and identical optical properties for hematite and goethite (same hem and goe). See descriptions for the case name in Table 2.

a Obtained in model runs with incorrect mass specification for DOD calculation (see Sect. 2.3.1). b Obtained in model runs with correct mass specification for DOD calculation. c “Normalized” cases (see Sect. 2.3.1). 1 Dust SSA calculated based upon pixels that have DOD > 0.5 ⋅ AOD (dust fractional threshold: 0.5). 2 Dust SSA calculated with a higher dust fractional threshold (0.8) than in “1”. N/A – no data.

Figure 7Shortwave TOA DRE (W m−2) in CAM5 (a) and CAM6 (b) with C1999 (a, b, c) and J2014 (d) and their differences (c, d) for 2007–2011. DRE in CAM6 was remapped onto CAM5 grids. Numbers in the title show global mean DRE (a, b) or difference: between CAM6 and CAM5 (c); between CAM5 with J2014 and with C1999 (d).
Regionally, the mean shortwave dust DRE for the base simulation shows warming over northern Africa and cooling downwind (Fig. 7a), similar to previous studies (Miller and Tegen, 1998; Yoshioka et al., 2007) and other model versions used in this study (e.g., CAM6 in Fig. 7b). We find that in the baseline where the annual mean surface albedo exceeds ∼0.20 in the visible spectrum shortwave DRE is positive and negative otherwise. There is also a strong warming contribution over desert land regions such as northern Africa and the Middle East compared to remote regions due to a higher shortwave absorbing efficiency of large-sized particles (Kok et al., 2017) which are found at a relatively larger fraction close to the emission source (Mahowald et al., 2014; Ryder et al., 2019). These simulations underestimated coarse dust (diameter between ∼5 and 10 µm) and missed the very coarse dust (diameter > ∼10 µm) as well as underestimated transport of particles > ∼5 µm in diameter further away from the source (Ryder et al., 2019; Adebiyi and Kok, 2020). This underestimation of the coarse and very coarse dust particle transport may result from inaccurately representing turbulent or convective vertical mixing that could decrease the dry deposition of dust aerosols (Adebiyi and Kok, 2020) and from not accounting for the dust asphericity which can increase the gravitational settling lifetime (Huang et al., 2020). Consequently, we might underestimate both the shortwave and longwave (Sect. 3.3) dust warming.
Comparing the shortwave DRE from CAM5 simulations with different mineral atlases, C1999 and J2014 (Fig. 7d), shows a slight difference in the DRE amplitude at the global annual mean scale (−0.18 W m−2 versus −0.14 W m−2, Table 5). However, there are noticeable regional differences comparable in amplitude to the DRE itself. J2014 contains larger soil fractions of iron oxides (sum of hematite and goethite) within main dust source regions like northern Africa (Fig. S3d, e, l). A more positive DRE is thus realized when using J2014 compared to C1999 over most dust-dominant continents and even oceanic regions such as the North Atlantic Ocean.
Previous studies (Sokolik and Toon, 1999; Lafon et al., 2006) have shown that hematite and goethite have distinct optical properties at the shortwave bands. Considering both hematite and goethite in mineral dust produced a more flat spectral SSA, owing to the less pronounced dependence of the imaginary refractive index of goethite on the short wavelengths (Formenti et al., 2014). If we assume that goethite is less absorbing than hematite, we obtain a global mean shortwave dust DRE of −0.14 W m−2 (Table 5). Assuming goethite is as absorbing as hematite leads to an even larger increase in the shortwave dust DRE: −0.05 W m−2 (Table 5; the “Same hem and goe” case). The 64 % reduction in the shortwave cooling is, thus, due to the stronger absorption of shortwave radiation by hematite than by goethite. Over the northern African continent, distinguishing the optical properties of these two iron oxides produces a difference of ∼56 % in the shortwave dust DRE.
3.2.2 Uncertainty of shortwave direct radiative effect and importance of iron oxides
In this section, we characterize the shortwave DRE uncertainty due to dust minerals, dust burdens, the imaginary refractive index of the minerals, and radiative parameterization, while other uncertainty sources are discussed in Appendix A. We evaluate the importance of iron oxides for the shortwave DRE variation relative to other minerals, dust burden, and the surface albedo. The shortwave DREs from multiple models are compared and included in the shortwave DRE estimate based on the methodology described in Sect. 2.3.3. Scanza et al. (2015) showed a model–observation comparison of the clear-sky shortwave DRE efficiency calculated with earlier versions of mineralogy CAM4 and CAM5 as well as the released versions of both models. With updated mineralogy in CAM5 as well as ported mineralogy in CAM6, we revisit the model–observation comparison in this section by also including the uncertainty in iron oxides derived from the soil abundance in C1999 and J2014.
Uncertainty due to dust minerals, burden, and imaginary complex refractive index
The sensitivity studies undertaken with CAM5 (Table 2) show that the uncertainty of hematite causes the largest change in the global mean shortwave dust DRE (Table 5 and Fig. 8a) and SSA at the 0.44–0.63 µm band (note simulated SSA by CAM and MONARCH are at the 0.44–0.63 µm band and by GFDL is at the 0.50–0.60 µm band here and after unless stated otherwise) (Fig. 8b) compared to the uncertainty of other minerals. Scanza et al. (2015) showed that in CAM5 with hematite confined solely from the clay-sized category, the sign of the dust DRE at TOA is altered from slightly positive (+0.05 W m−2) in CAM5 with hematite confined from both the clay- and silt-sized categories to slightly negative (−0.04 W m−2), despite similar surface DRE (not shown), suggesting the importance of hematite in the shortwave DRE estimate at the TOA. Figures 8 and 9 demonstrate the importance of hematite for the TOA DRE. We see a more (less) cooling value of −0.28 W m−2 (−0.10 W m−2) in CAM5 with the low (high) bound of hematite in the silt-sized category compared to the baseline simulation (−0.18 W m−2) resulting from the changed SSA (Fig. 8b). Similarly, use of the high bound of clay-sized hematite significantly decreases the SSA (Fig. 8b), leading to even less cooling (−0.08 W m−2), compared to lowering the clay-sized abundance. We can, thus, expect that the larger uncertainty in iron oxides in J2014, compared to that in C1999, would lead to a larger range in the global annual mean SSA and thus a larger uncertainty in the shortwave DRE. The importance of hematite for the shortwave DRE is true regionally as well as globally (Fig. 9). Uncertainty in other minerals in the soil causes a small change in the shortwave DRE globally (less than 10% of the uncertainty related to hematite; Fig. 8a) due partly to their small fractional change relative to the large total abundance of those minerals in terms of the soil distribution (Fig. 5, relative change) and to the low sensitivity of the shortwave DRE to those minerals (Fig. 10). For example, increasing the soil amount of illite to its high bound results in an additional warming of +0.01 W m−2 (for other minerals, see Fig. 8a). Figures 9a and S13a, b (other minerals; see other panels of Fig. S13) show that an increase in hematite in either the clay-sized or silt-sized soil categories leads to more warming over both the continental and downwind oceanic regions at the TOA and vice versa, which is consistent with the absorbing nature of iron oxides and with results of previous sensitivity studies (e.g., Balkanski et al., 2007). This influence of hematite aerosol burden on the shortwave dust DRE is most apparent over northern Africa, in particular over the western Sahara and Sahel (e.g., Fig. 9a), where a large uncertainty exists in the underlying hematite soil abundance in C1999 (Fig. 5c).

Figure 8Global mean shortwave DRE by dust (a) and SSA at the 0.44–0.63 µm band (b) averaged over pixels where DOD > 0.5 ⋅ AOD following Scanza et al. (2015) in CAM5 for different cases in C1999 (the first 12 bars from the left) and J2014 (the last bar from the right). Values associated with parameters other than iron oxides, the imaginary complex refractive index, and DOD were derived from the “normalized” cases (see Sect. 2.3.1). Red dash lines indicate values obtained from the baseline simulation; blue dash lines denote values obtained from the simulation with J2014 distinguishing hematite from goethite; purple dash lines are similar to blue ones but with identical optical properties between hematite and goethite. Bars: values associated with higher (in color) and lower bounds (dash with opposite signs to real values) of minerals, DOD, and imaginary complex refractive index. x-axis labels: Hem – hematite; Sme – smectite; Ill – illite; Kao – kaolinite; Cal – calcite; Qua – quartz; Fel – feldspar; Gyp – gypsum; DOD – dust aerosol optical depth; Ima – imaginary; J. iron oxide – iron oxides in J2014.
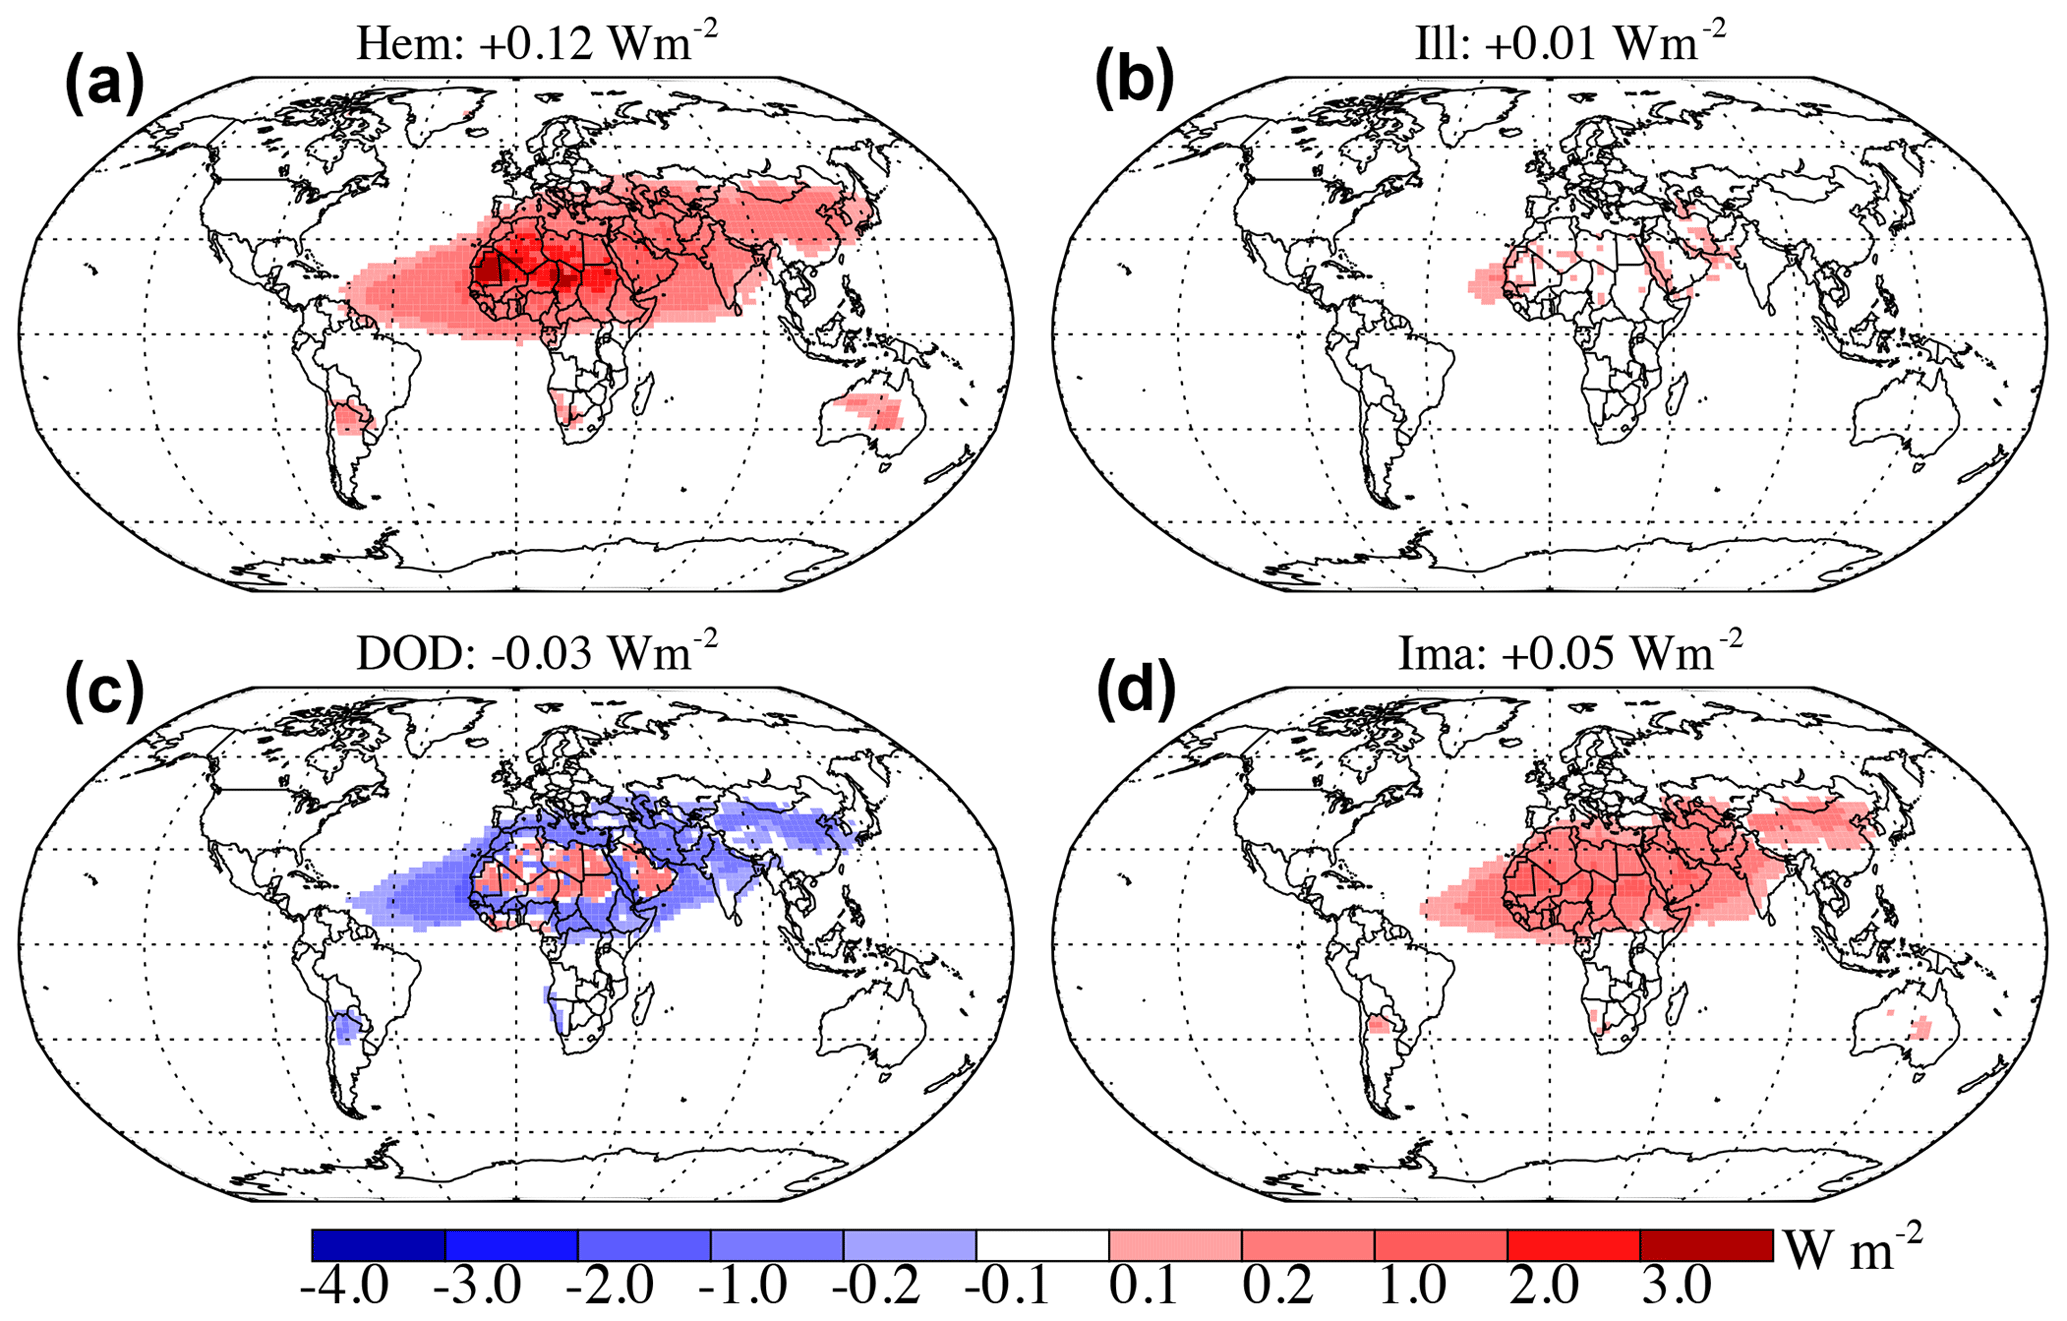
Figure 9High-branch uncertainty in TOA shortwave DRE W m−2 induced by uncertainty in hematite (a, hem), illite (b, ill), DOD (c), and imaginary complex refractive index (d, ima) in CAM5. All simulations used here are based on C1999. Numbers in the title denote global mean deviation from the baseline in CAM5. Values are calculated at each grid box as the difference between DRE from the high-bound soil mineralogy case and the baseline.
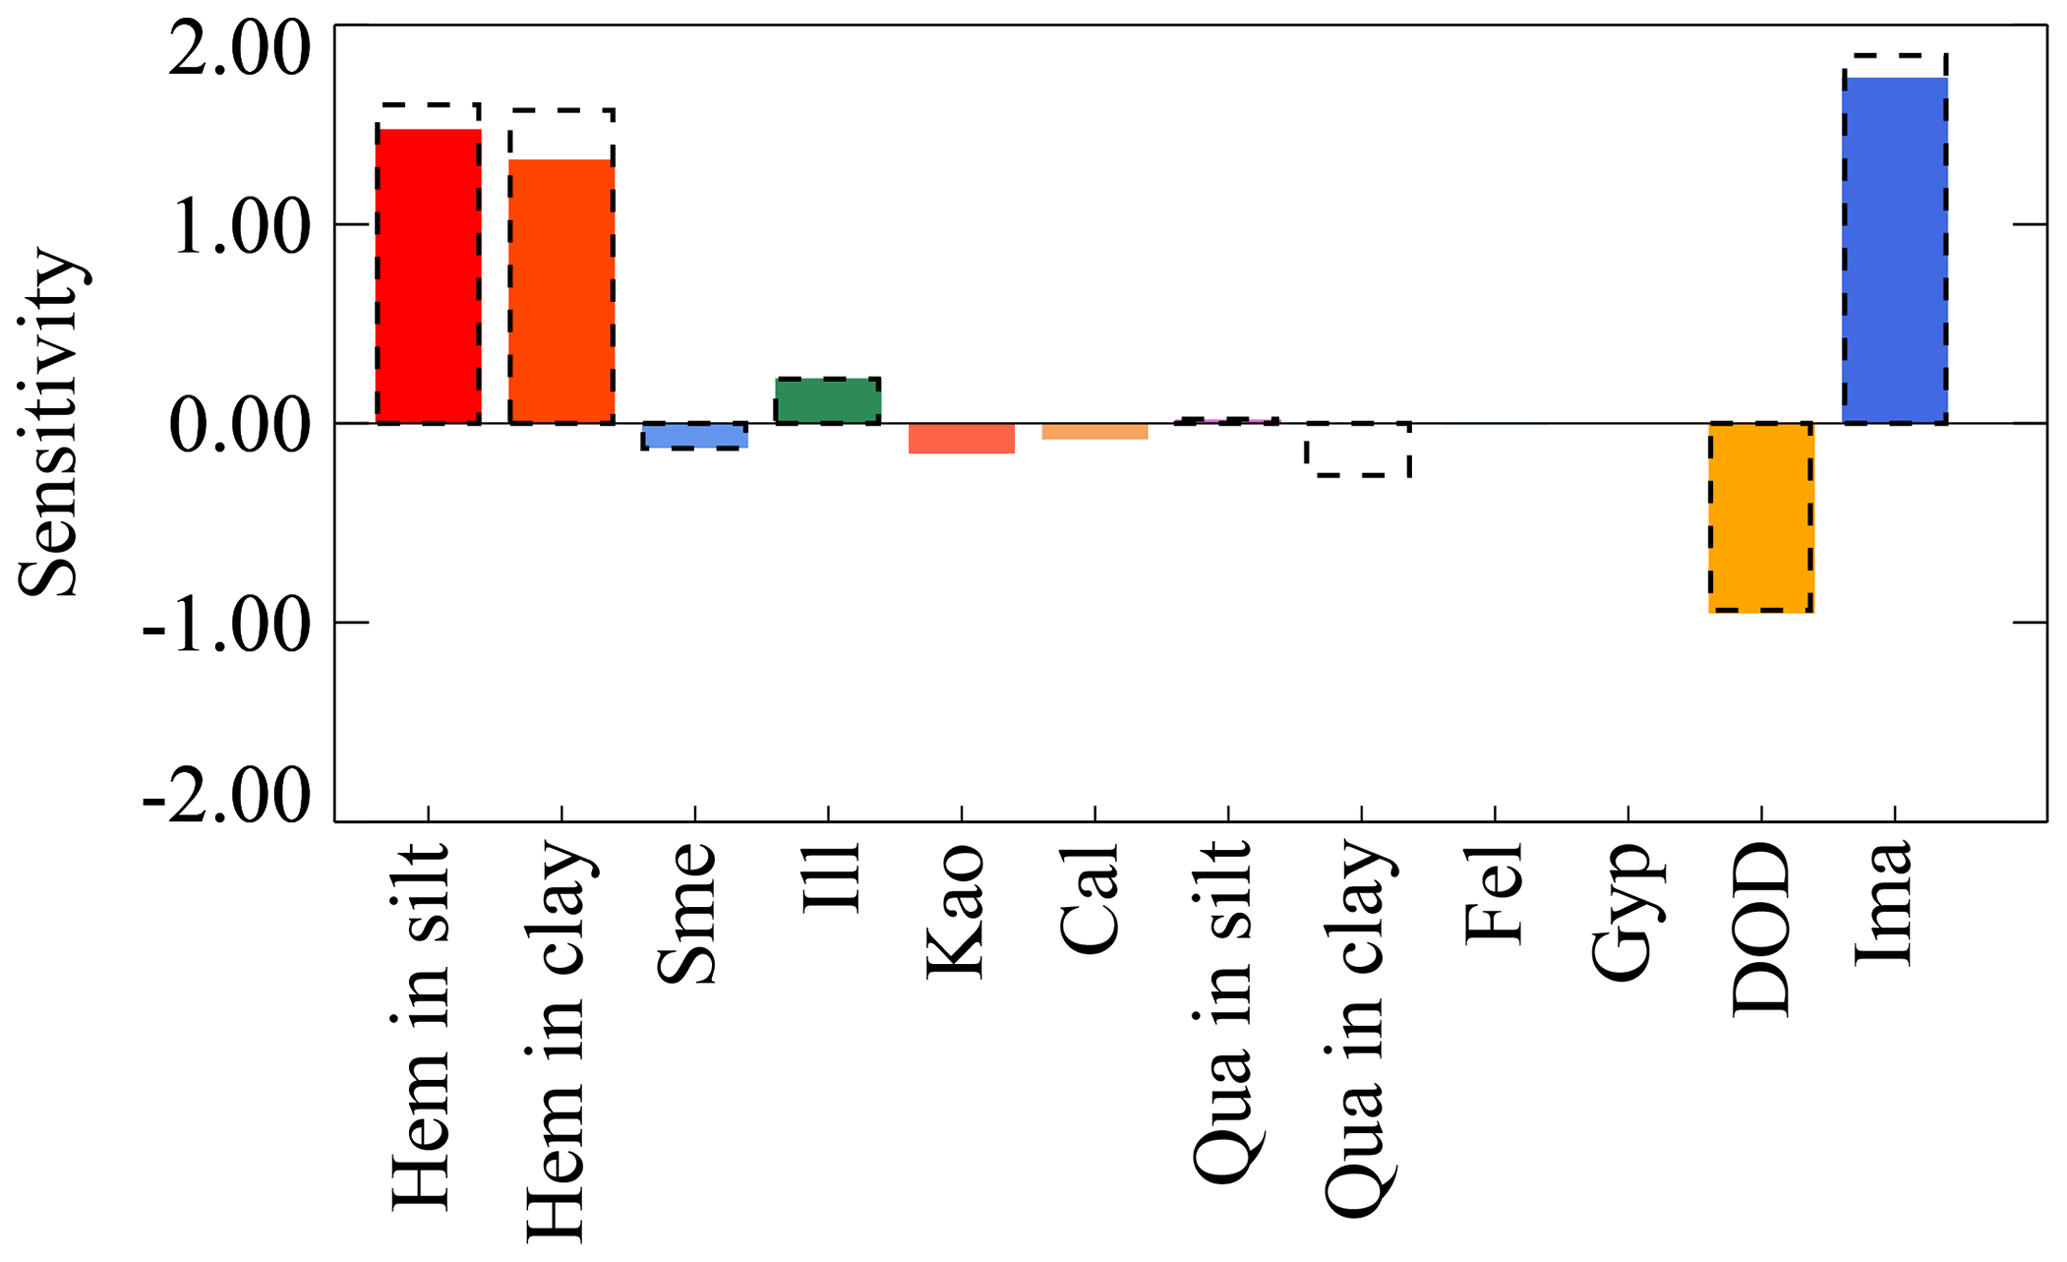
Figure 10Sensitivity parameter (unitless) of the shortwave DRE to simulated minerals (hematite, smectite, and illite), DOD, and the prescribed imaginary complex refractive indices within the known uncertainty in CAM5. The sensitivity is measured by the ratio of the relative change in shortwave DRE to that of the parameter considered. Bars: values associated with higher (in color) and lower bounds (dash with opposite signs to real values) of minerals, DOD, and imaginary complex refractive index. x-axis labels: Hem – hematite; Sme – smectite; Ill – illite; Kao – kaolinite; Cal – calcite; Qua – quartz; Fel – feldspar; Gyp – gypsum; DOD – dust aerosol optical depth; Ima – imaginary complex refractive index. Sensitivity for parameters other than hematite, DOD, and imaginary complex refractive index was derived from the “normalized” cases (see Sect. 2.3.1).
The response of shortwave DRE to increasing DOD to the high bound (0.03 + 0.005; Ridley et al., 2016) has a very different spatial pattern (Fig. 9c) in comparison to perturbing hematite abundance (Fig. 9a) or the imaginary refractive index of minerals (Fig. 9d). For example, increasing iron-oxide content results in a uniformly stronger warming, owing to the enhanced ability of dust aerosol to absorb shortwave radiation. A higher DOD, however, tends to enhance the warming-to-cooling contrast, given a certain emission scheme, by amplifying the baseline shortwave DRE (Fig. 7a) due to more total surface area to absorb and/or scatter shortwave radiation, whose features depend on the annually mean albedo of the underlying surface.
Figure 10 displays the sensitivity of the shortwave dust DRE at the TOA to DOD, imaginary indices, and the mineral content in soil in CAM5 with C1999. The sensitivity in Fig. 10 is calculated as the ratio of the relative change in the DRE to the relative change in each driver, both with respect to base simulation values. The shortwave dust DRE is most sensitive to changes in hematite in the silt-sized category. In contrast, perturbations to other minerals, including illite and smectite, within their 95 % intervals, induce a relatively small influence on the shortwave dust DRE in terms of the globally averaged value owing to negligible resultant changes in the SSA (Fig. 8b). The cancelling of opposite regional effects (Fig. 9c) by perturbing DOD over regions with low (annual mean ≤0.2; negative DRE) and high (annual mean >0.2; positive DRE) visible surface albedo results in little change in the global mean shortwave DRE (Fig. 8a), although regional changes and especially land–sea contrasts may be larger. Consequently, a large fraction of total uncertainty in the global mean DRE is attributed to uncertainty in the soil hematite because of its higher absorption efficiency at the shortwave bands.
The spatial distribution of the estimated uncertainty due to all effects combined is illustrated in Fig. 11 based on the method described in Eqs. (3) to (5) of Sect. 2.3.3. For low-branch uncertainty, we only show in Fig. 11 the global mean value (inlet numbers) because of the reginal similarity of the uncertainty associated with the two branches in amplitude. Globally, we obtain a total range of [−0.12, +0.11] W m−2 based on uncertainty of mineral distribution in C1999, DOD, and imaginary indices. Perturbations on iron oxides in the clay- and silt-sized categories result in an uncertainty range of [−0.11, +0.09] W m−2, contributing ∼87 % of the total range. Adding the difference between the mineral distribution in C1999 and in J2014 and the iron-oxide uncertainty in J2014 yields a larger total uncertainty range of [−0.23, +0.28] W m−2. The majority (∼96 %) of the total uncertainty including both the C1999 and J2014 experiments can be attributed to uncertainty in soil fractions of iron oxides, considering the resulting range of [−0.22, +0.27] W m−2 due to iron oxides only. We find that the spatial pattern of this high-branch uncertainty in C1999 is similar to that of the intensified warming due to solely more hematite in Fig. 9a. Because a similar spatial distribution presents in both low and high uncertainty branches, large absolute uncertainties occur over northern Africa, specifically, over regions spanning from Mauritania through Niger and Chad to Sudan.
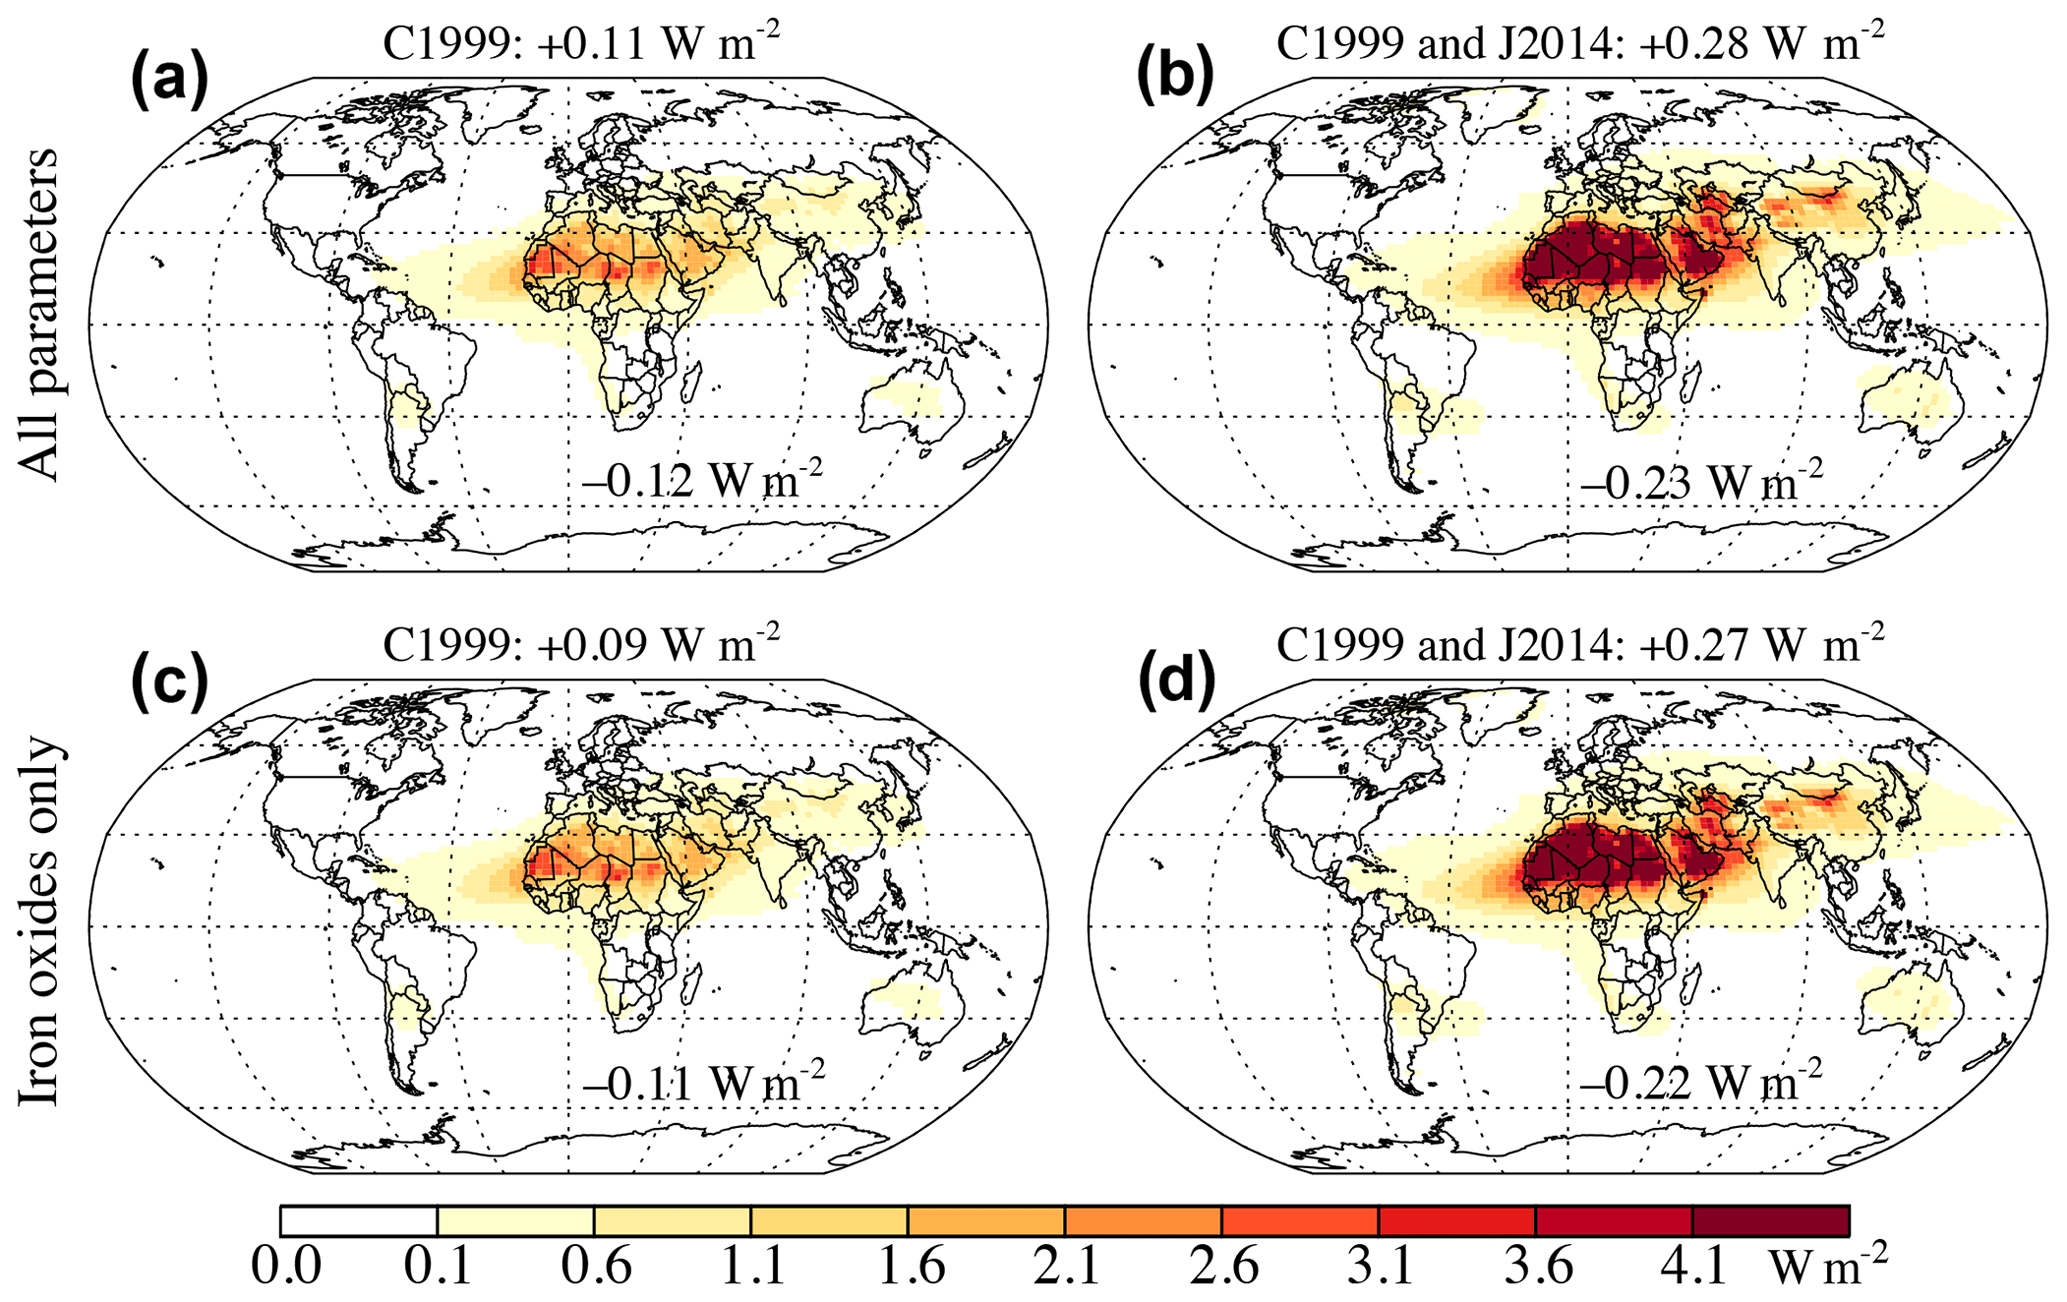
Figure 11High-branch shortwave DRE uncertainty estimated considering all parameters (a, b) and iron oxides only (c, d) in CAM5 with the soil mineral distribution coming solely from C1999 (a, c) and both C1999 and J2014 (b, d). Numbers show the high (in the title) and low branches (inlet) of the global mean uncertainty estimated based on the global average shortwave DRE in individual cases (see Sect. 2.3.3).
In CAM4, which employs an external aerosol mixing assumption, there is a lack of sensitivity in the shortwave dust DRE to any mineral (Fig. S14). Perturbating hematite produces a small change in SSA within 1 % (relative change, not shown) and hence a small change in the shortwave dust DRE (Fig. S14). Because of this, previous results using CAM4 were also insensitive to changes in hematite aerosol burden (Scanza et al., 2015). Results from this study are consistent with Sokolik and Toon (1999), who demonstrated that to have SSA lower than 0.9 at 0.50 µm requires an unrealistically high amount of hematite under the external mixing assumption. Reduced DRE sensitivity to variations of the hematite by external mixtures of hematite (compared to internal mixtures) has also been shown by Koven and Fung (2006) and Balkanski et al. (2007).
Model-to-observation comparison: clear-sky radiative effect efficiency and absorbing aerosol optical depth
There are limited calculations of the dust DRE efficiency estimated from satellite retrievals that can be used for comparison with model results. Figure 12 compares the TOA DRE efficiency of dust under clear-sky conditions (W m−2 τ−1, defined as the ratio of clear-sky DRE to DOD) obtained with mineralogy in CAM5 and CAM6 to clear-sky satellite-based observations near/over northern Africa. Over the ocean, both models and most cases yield a dust DRE efficiency which is not significantly different from observations during summer and winter (Li et al., 2004). According to Patadia et al. (2009), the observed clear-sky shortwave dust DRE efficiency over northern Africa is approximately zero for a surface albedo of 0.4 during the “high” dust season (June, July, and August: JJA). Compared to observations, both models with C1999 yield a similar clear-sky shortwave dust DRE efficiency, while CAM5 with the high-bound iron oxides, as derived by the uncertainty in J2014, shows much larger values, possibly suggesting too much shortwave absorption by dust in this case. Of the two models and different cases considered here, CAM6 with C1999 has more skill in better reproducing observations of the DRE efficiency. All the models underestimate the clear-sky longwave dust DRE efficiency in September compared to the observation (Zhang and Christopher, 2003), although we have augmented the longwave DRE by 51 % to account for dust scattering neglected by CAM (Scanza et al., 2015).
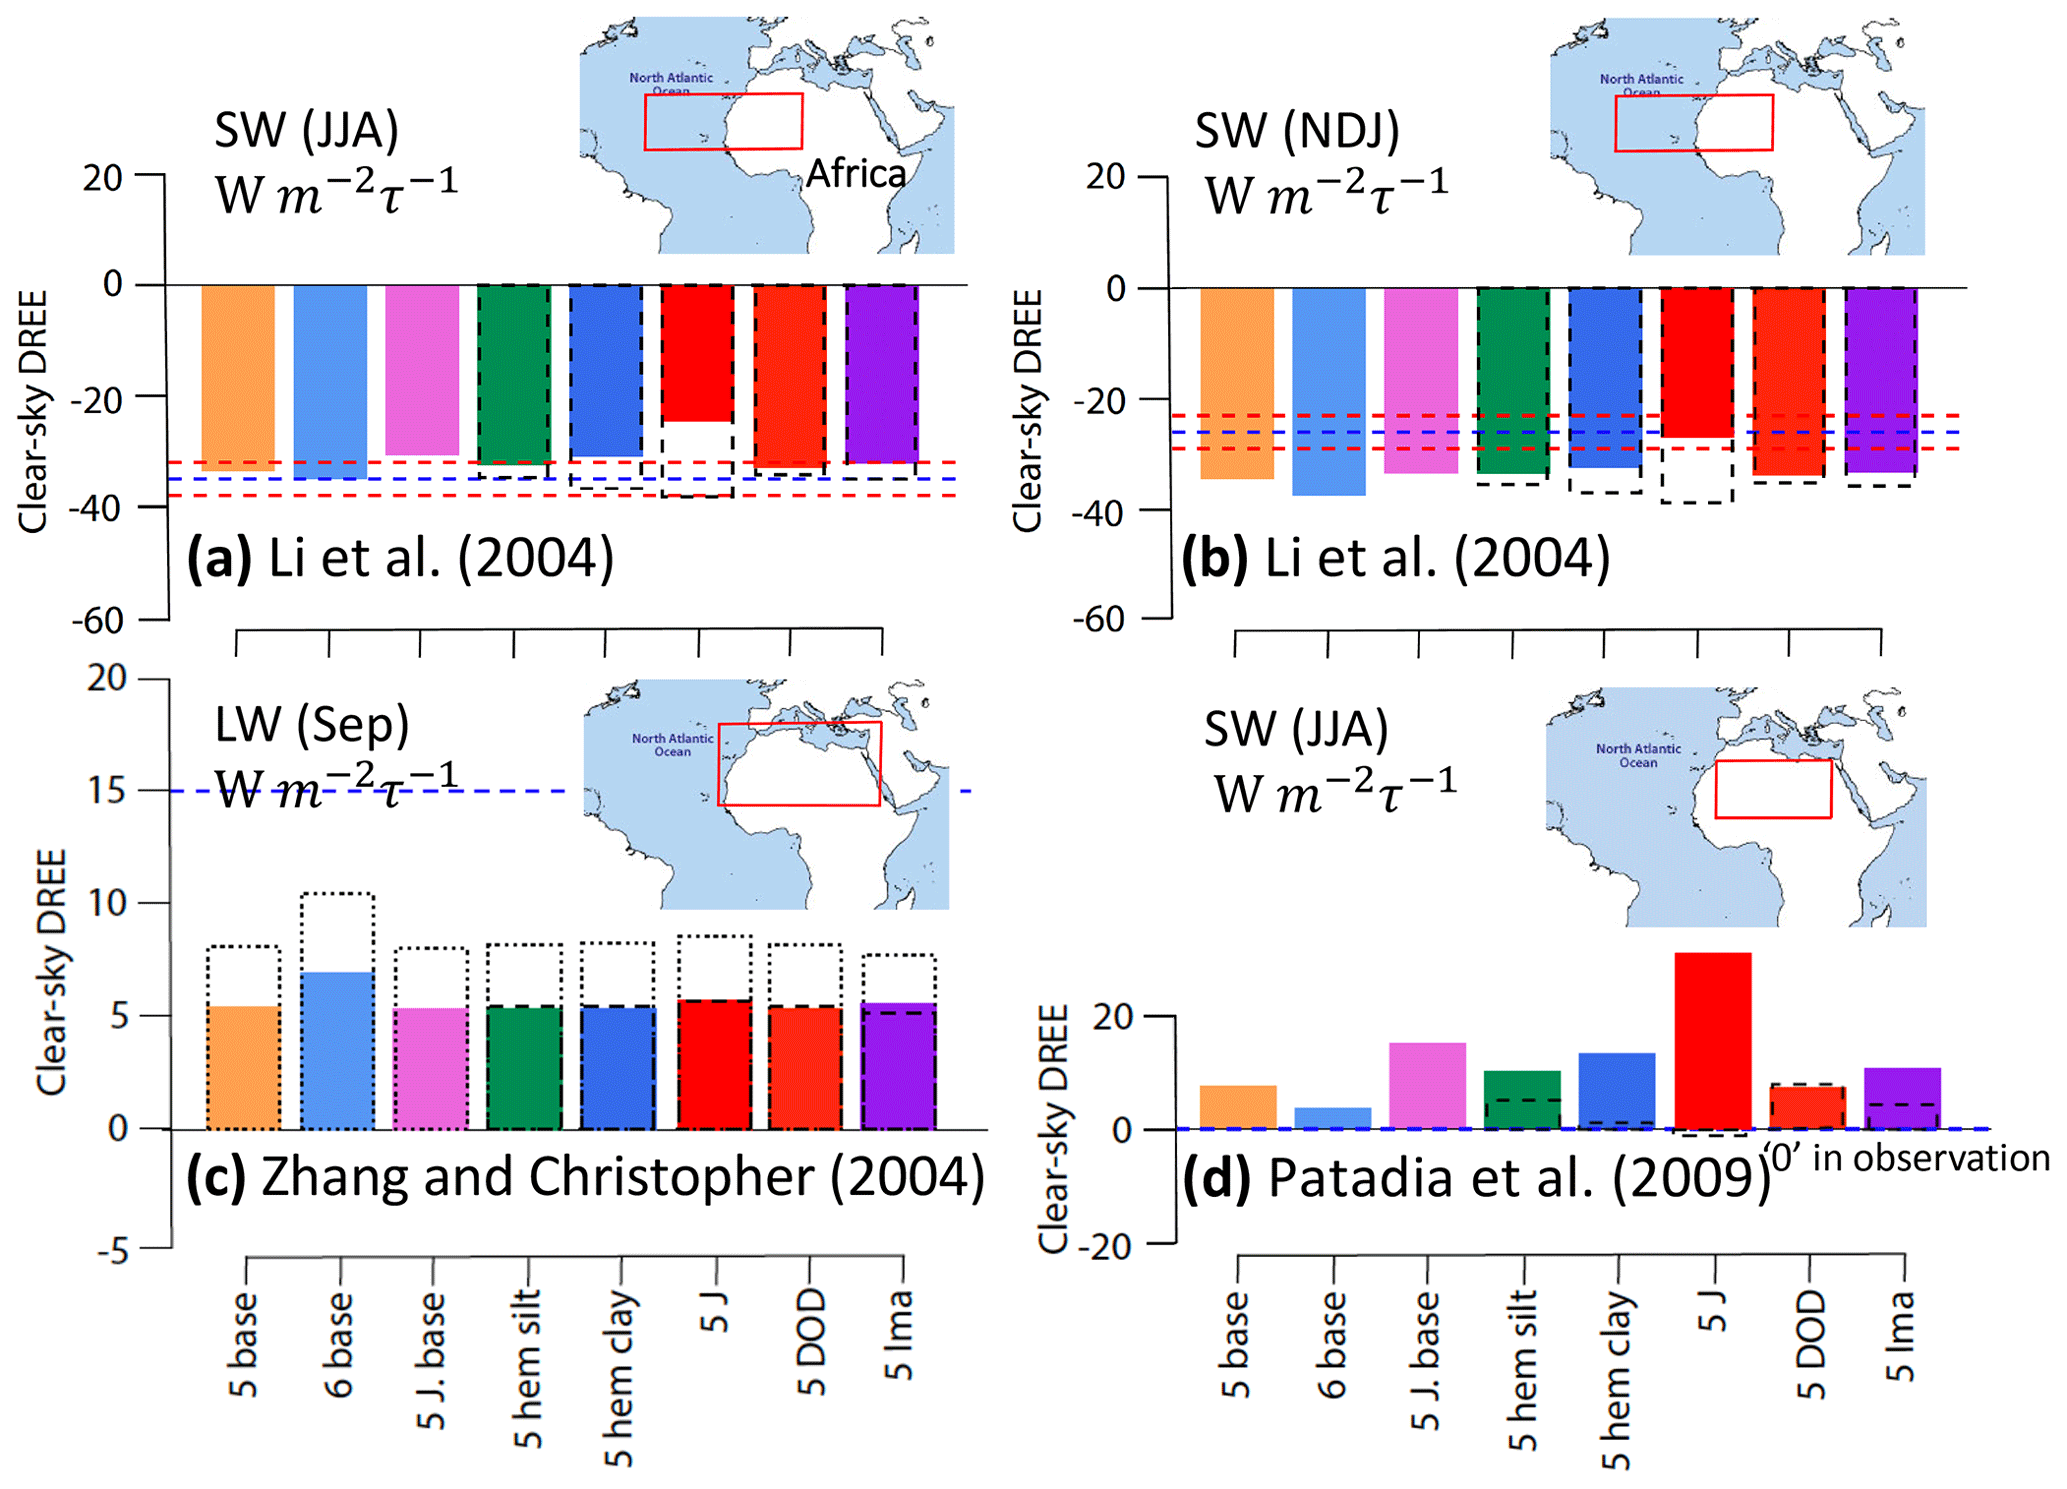
Figure 12Comparison of clear-sky shortwave (SW) and longwave (LW) dust DRE efficiency (unit: W m−2 τ−1) to observation at the TOA. The model–observation comparison is in summer and winter over the North Atlantic (a, b; JJA and NDJ; Li et al., 2004), September (c, Sep; Zhang and Christopher, 2003), and summer over northern Africa (d; JJA; Patadia et al., 2009) for the longwave and shortwave spectral ranges, respectively. The DRE efficiency is calculated as a ratio of DRE under clear-sky conditions to simulated DOD (indicated by τ). First three bars from the left: DRE efficiency calculated in CAM5 and CAM6 with mean soil data of J2014 and C1999; last five bars: values obtained from runs in CAM5 with high (in color) and low (dash) bounds. Horizonal blue lines denote the observational mean, and two red dash lines in (a) and (b) denote uncertainty in the observations. Note zero SW dust DRE efficiency in the observations over northern Africa in summer (d) (Patadia et al., 2009). Inlet maps with the red box show the location where observational DRE efficiency is made and used for comparison. x-axis labels: 5 base – CAM5 with C1999; 6 base – CAM6 with C1999; 5 J. base – CAM5 with J2014; 5 DOD – CAM5 DOD; 5 Ima – CAM5 imaginary complex refractive index. Dot boxes in (c) indicate longwave DRE augmented by 51 %.
The predicted absorbing AOD (AAOD) at the band centered at 0.55 µm is well within 1 standard deviation (σ) of AERONET observations at 0.55 µm in all the cases except CAM6 with high-bound iron oxides in J2014 (Table 6). However, over the AERONET sites, CAM5/6 systematically undershoot observational AOD and with simulated values outside mean ± σ (standard deviation) of the observation. The coincidence between predicted and observational AAOD accidently occurs, because, meanwhile, CAM5/6 overestimates the dust absorption of radiation near the 0.55 µm band with the simulated SSA systematically below the observation. It is likely that the overestimated radiation absorption is due to the use of the volume averaging method to compute the optical properties of bulk dust from those of the minerals. However, we cannot exclude the possibility of the contamination of dust over the selected sites by other absorbing aerosols like the black carbon. Moreover, the method used to filter out the AEROENT sites where dust aerosol does not dominate over other aerosols in terms of the optical depth (DOD ≤ 0.5 ⋅ AOD) relies on the accuracy in the simulated DOD and non-dust AOD. Consequently, a mismatch that potentially exists between simulated and observational DOD and non-dust AOD may cause the comparison here less meaningful. There are no SSA constraints made in Ridley et al. (2016) for the 15 regions. Thus, a comparison of the AAOD is unachievable. We do not compare the modeled AAOD with that from satellite observations, because available AAOD solely based on satellite retrievals are very likely subject to large uncertainty (Samset et al., 2018) for a large portion of areas with no station-based measurements available for calibration.
Table 6The climatologically mean AOD, AAOD, and SSA at 0.55 µm for AERONET (first portion) and at Band 10 centered at 0.53 µm for CAM5/6 (second portion). Values from CAM5/6 with J2014 (J) and/or C1999 (C) were obtained by averaging modeled AOD, AAOD, and SSA over the grid box nearest to the AERONET sites (e.g., Holben et al., 1998), where DOD > 0.5 ⋅ AOD. Values in parentheses show the standard deviation of AOD, AAOD, and SSA. Other notations: C(J)_bse: the baseline simulation with C1999 (J2014); J_Hig(Low): high (low) bound of iron oxides in J2014, respectively; C_H(L)HemClay(Silt): high(low)-bound (see text for explanations) hematite in the clay(silt)-sized category; C_H(L)DOD: high(low)-bound DOD; C_H(L)Ima: high(low)-bound imaginary complex refractive index of minerals.
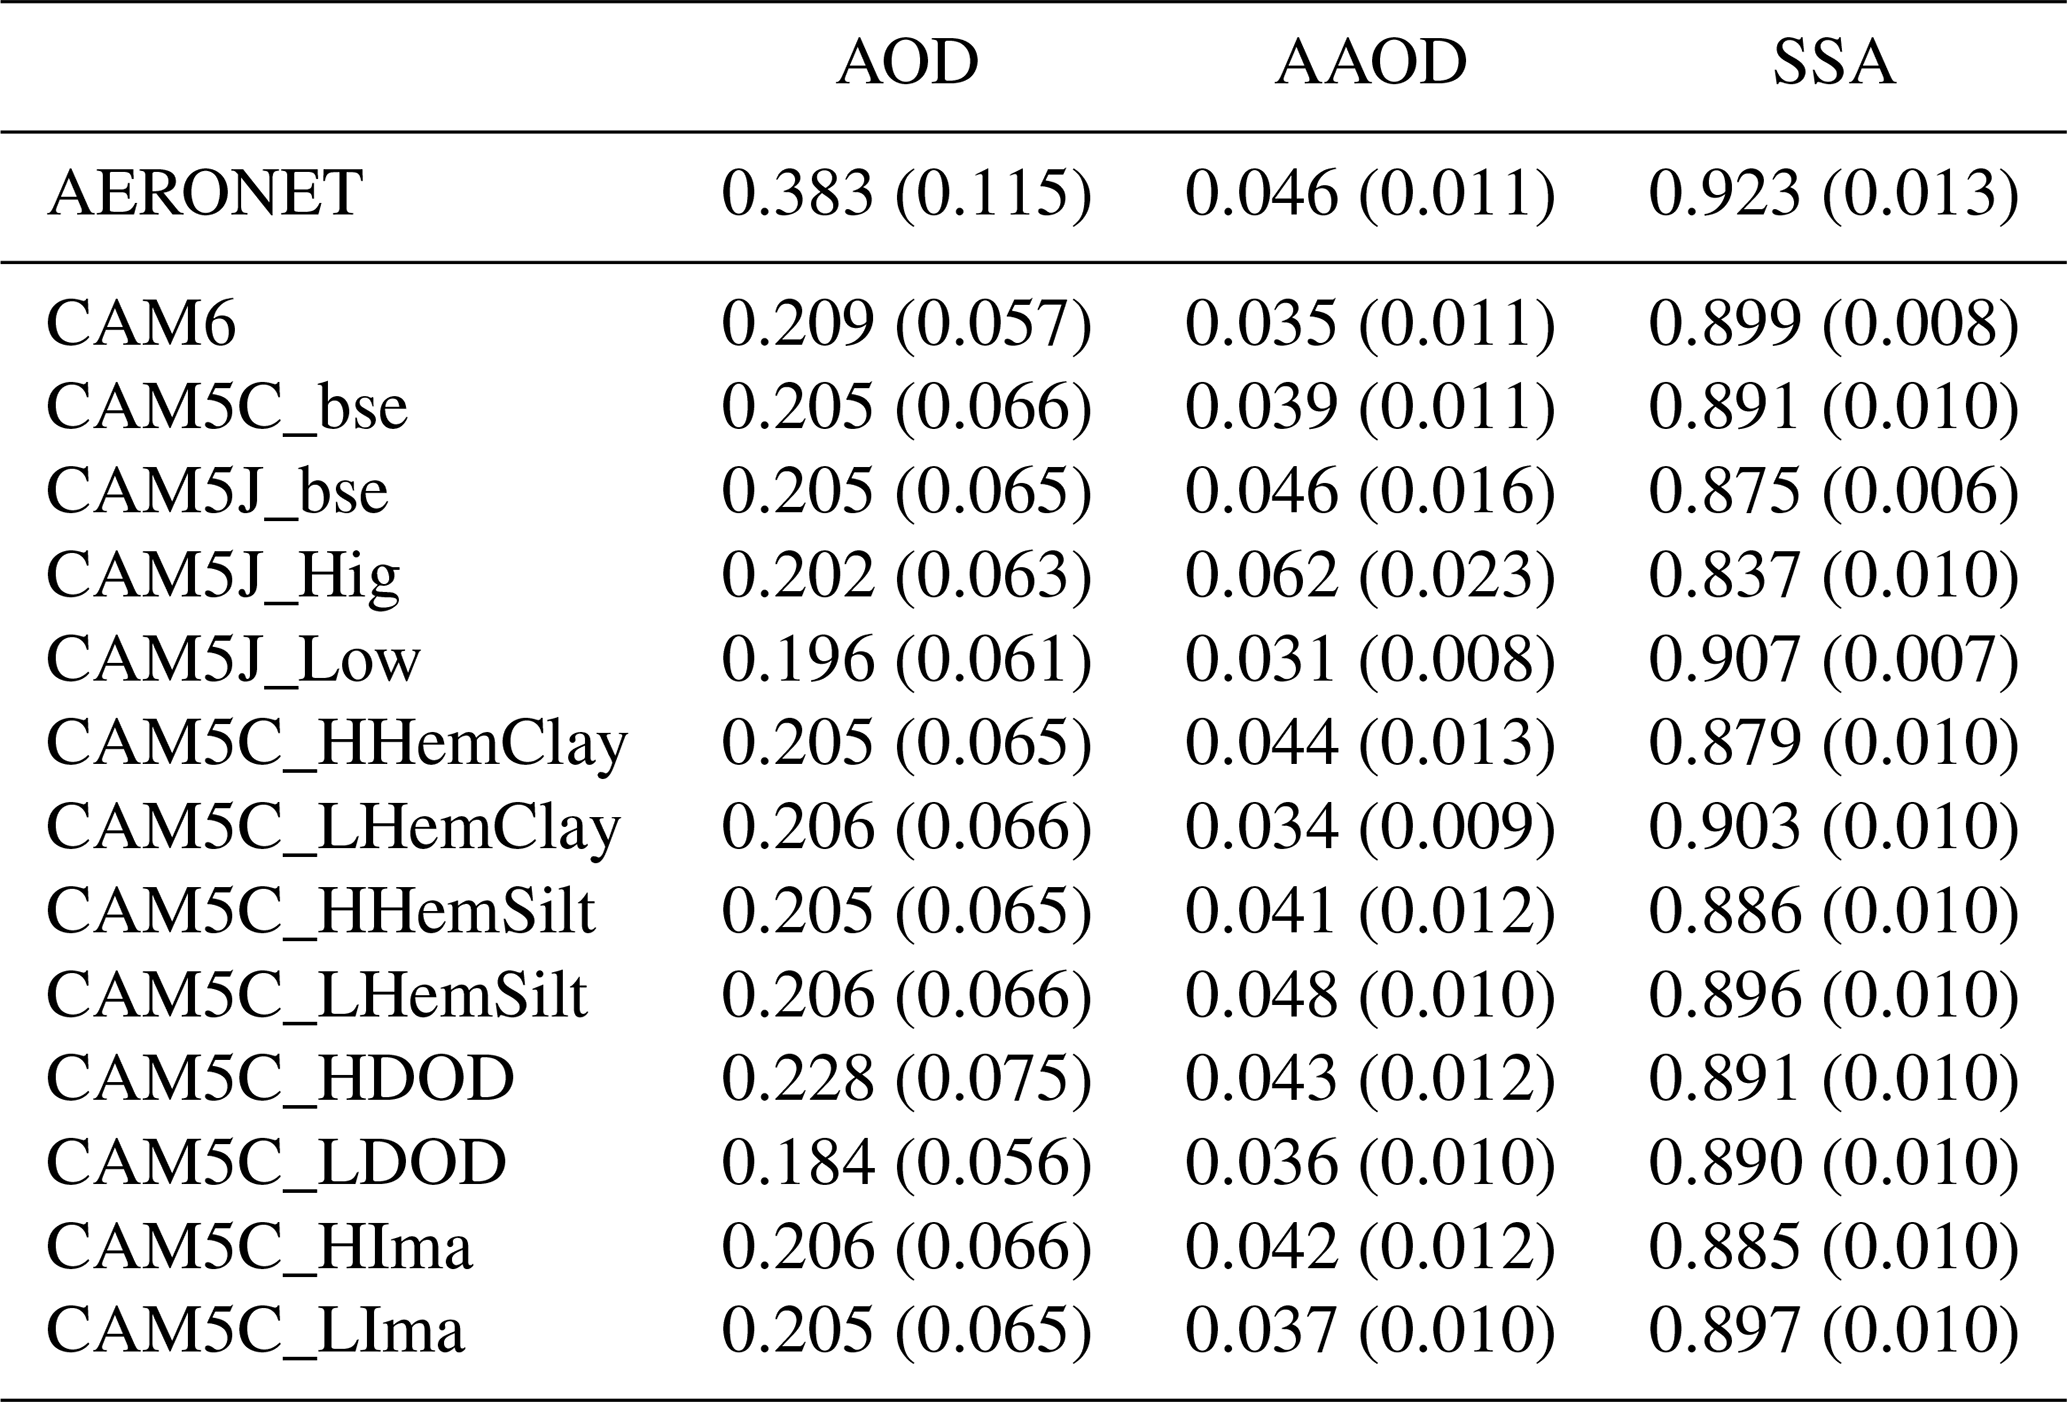
Understanding the relative roles of single scattering albedo, hematite, and dust aerosol optical depth in the shortwave direct radiative effect
A fundamental question for this study is what the most important determinants in altering the shortwave DRE for different regions are. Analysis of soil samples taken from locations representative of the Sahara and Sahel deserts suggests that a linear correlation exists between SSA and the iron content in fine-sized dust particles (<2 µm in diameter) at visible and infrared bands (Moosmüller et al., 2012). A recent study built on this showed that the relationship is statistically significant at shortwave wavelengths and not limited to fine-sized dust (Di Biagio et al., 2019). The relative shortwave absorption (related to SSA) of dust particles should thus be related to iron-oxide burden, in addition to its dependence on dust size distribution and effects upon the complex refractive index by other minerals. Here, we use variations across different experiments and interannual variability in our model simulations to assess the relative roles of iron oxides (Fig. 13), DOD, and surface albedo (Fig. 14) over different regions.
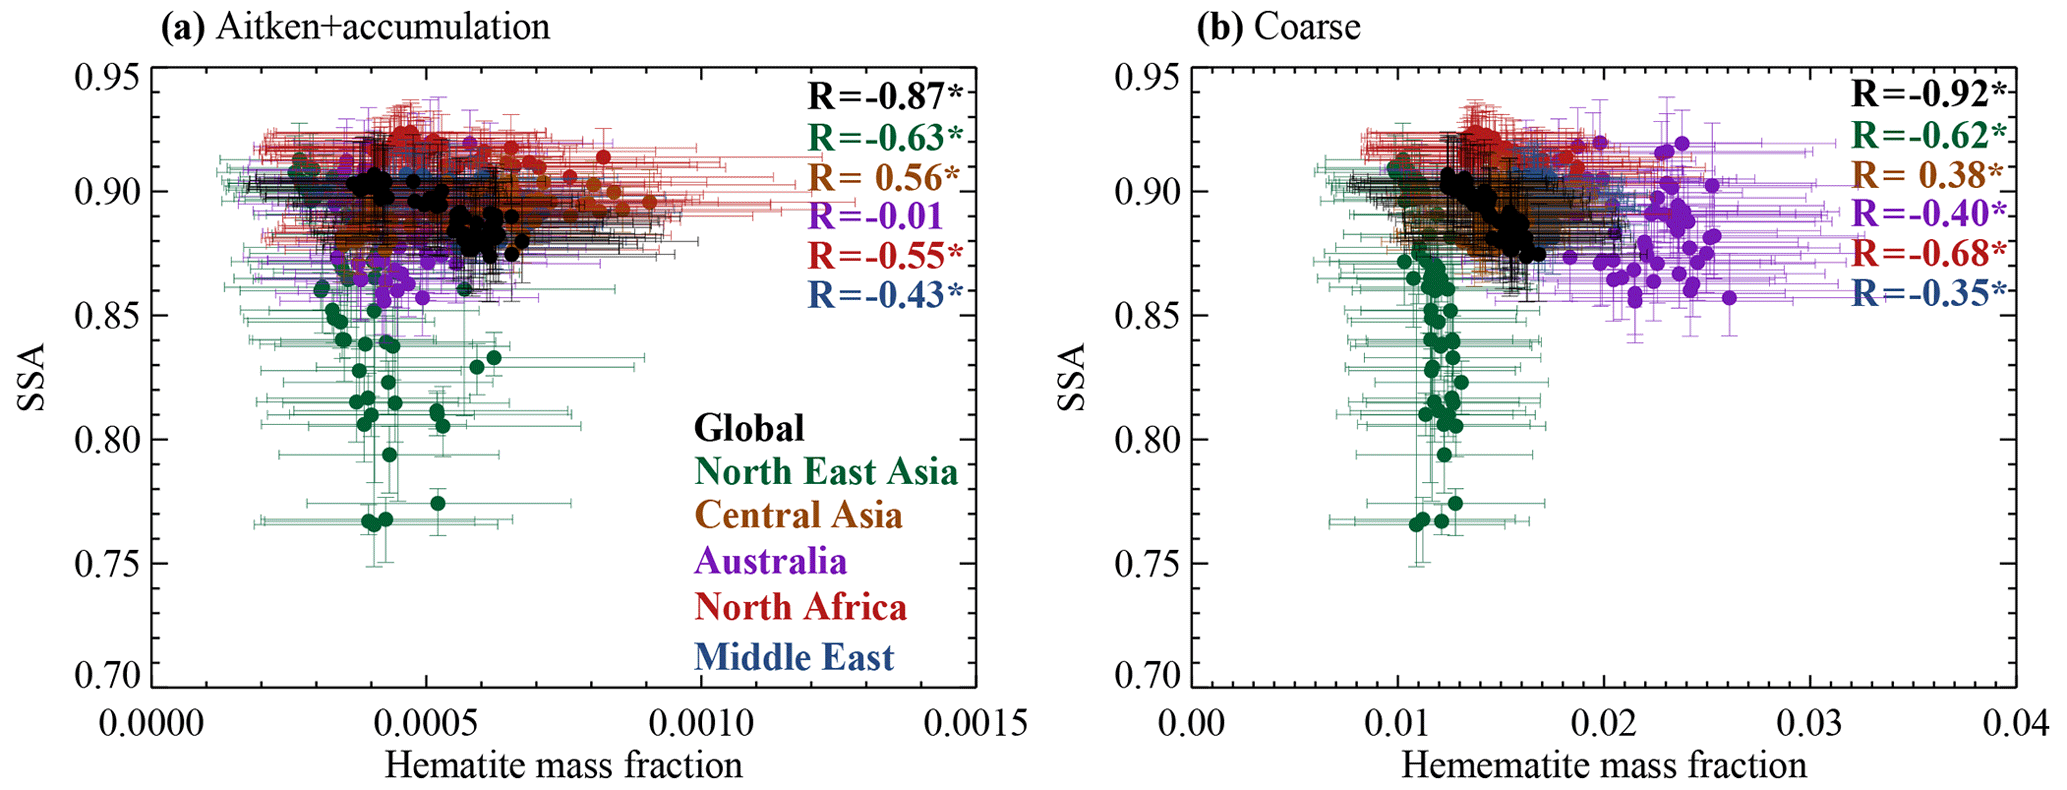
Figure 13SSA at the 0.44–0.63 µm band versus the mass fraction of hematite in Aitken plus accumulation (a) and coarse (b) modes for different sub-continental regions (the Middle East, northern Africa, Australia, Central Asia, and north-eastern Asia as indicated in the legend in color) and for global continents (in black). Simulations in CAM5 with C1999 for the baseline, perturbed iron-oxide mass fractions, DOD, and the imaginary complex refractive index are used for analysis. Each point represents an area-average annual mean for each simulation. Pixels identified as ocean mask and having DOD ≤ 0.5 ⋅ AOD for the land mask are removed for the regional analysis. Error bars indicate 1 standard deviation of the derived dust SSA and simulated hematite aerosol mass fraction in different modes. Also shown is the correlation coefficient between the derived dust SSA and hematite aerosol mass fraction. Stars indicate that the correlation is statistically significant at the 95 % confidence level.
First, we consider the relationship of the derived dust SSA at the 0.44–0.63 µm band with the hematite mass fraction over dust-dominated areas, both globally and over five sub-continental regions containing major dust sources (northern Africa, Middle East, Central Asia, north-eastern Asia, and Australia; domains defined in Table S1 in the Supplement and names of the sub-continental regions given in Fig. 13). As the SSA calculated in CESM is for all aerosols, we extract the dust SSA following Scanza et al. (2015) by only selecting those grid pixels where the ratio of DOD to AOD is greater than 0.5 (DOD > 0.5 ⋅ AOD; the derived SSA varies only a little bit with a higher fractional threshold of 0.8; Table 5) and the land coverage is 100 % of the total grid pixel area.
Figure 13 illustrates a strong regional variability of the derived dust SSA at the 0.44–0.63 µm band, hematite mass fractions, and their relationship with one another. The quantitative analysis shows a statistically significant negative relationship between global mean SSA and the hematite mass fraction for both coarse (; Pearson correlation here and after) and fine (sum of Aitken and accumulation, ) modes over land grid pixels at the 95 % confidence level (Student's t test). Dust SSA is more closely correlated with the coarse-mode hematite mass fraction over northern Africa and Australia and more closely correlated with the fine-mode hematite mass fraction for the Middle East, Central Asia, and north-eastern Asia. The modeled SSA over dust dominant areas ranging between 0.83 and 0.91 (Table 5) revealed high absorption by dust at the visible band. Two aspects may explain the low SSA. Firstly, the criterion for removing non-dust aerosols, which excludes pixels with DOD ≤ 0.5 ⋅ AOD passes absorptive non-dust aerosols. Secondly, the use of the volume averaging of minerals to compute the complex refractive index for bulk dust could yield an artificially strong absorption compared to scattering and thus low SSA (X. L. Zhang et al., 2015; Li and Sokolik, 2018). In contrast to these two aspects, the underestimation of coarse dust particles (> ∼5 µm) could bias SSA toward high values, because of the large surface area of coarse dust particles for radiation absorption. All the three aspects could influence the accuracy of the derived dust SSA and thus its relationship with hematite aerosol. Nevertheless, our results regarding the relationship between SSA and hematite mass fraction agree with Moosmüller et al. (2012) and Di Biagio et al. (2020). The coexisting of dust and absorptive non-dust aerosol (e.g., black carbon; Kim et al., 2004; Ge et al., 2010) could partially explain the “discrepancy” between the low derived dust SSA and the relatively strong shortwave cooling by dust over north-eastern Asia (Fig. 14; the shortwave DRE versus DOD). The correlation between SSA and hematite mass fraction statistically highlights the importance of the simulated hematite for the shortwave dust DRE estimate. It suggests that over most dust source regions the shortwave DRE uncertainty due to iron oxides in C1999 and J2014 significantly (p value < 0.05; Student's t test) exceeds the annual mean shortwave DRE by 2σ (Fig. S15), where σ denotes the standard deviation of the annual mean DRE with the seasonal cycle removed.

Figure 14 shows response of the variability of shortwave DRE to that of DOD and the surface albedo globally and over the examined sub-regions. Over all sub regions, the variability of shortwave DRE is statistically significantly (p-value < 0.05; Student's t test) correlated with that of DOD. The relationship between these two variables is regionally specific, with different slopes for different regions (Fig. 14a), mainly depending on the annual mean surface albedo (Fig. 14b). For regions such as northern Africa and the Middle East with an annual mean surface albedo of ∼0.28 at the visible band in CAM5, shortwave DRE positively scales with DOD, because the shortwave DRE is dominated by dust absorption over surfaces with the annual visible surface albedo >0.2. In contrast, the shortwave DRE inversely scales with DOD in Central Asia and north-eastern Asia, where the annual visible surface albedo ≤0.2 and the shortwave dust scattering dominates over absorption. This is similar to the influence of increasing DOD for example on the shortwave DRE from a climatology perspective: intensified warming (cooling) over a region where the shortwave DRE is positive (negative) in the baseline simulation (Fig. 9c). The surface albedo variability in northern Africa and the Middle East is weak compared to other sub regions. Overall, dust DRE becomes more warming (less cooling) as the surface albedo increases due to the absorption of more reflected shortwave radiation, consistent with the results of previous studies (Liao and Seinfeld, 1998; Miller et al., 2014; Li and Sokolik, 2018).
Model diversity: across model comparisons
Previous studies have highlighted how the variability in the DRE is due to different model representation of the sensitivity of DRE to dust optical properties, surface albedo, and aerosol–cloud interactions (e.g., Huneeus et al., 2011; Shindell et al., 2013; Kok et al., 2017). We estimate in this section the multi-model spread in the shortwave DRE using both soil mineral distributions based on all our simulations (Table 2) at each grid cell.
The shortwave DRE from ModelE2 is not directly calculated based on the model run but derived here a posteriori via regression (see Sect. 2.3.4). Globally, the predicted shortwave DRE (−0.09 W m−2) is less negative than in the CAM5 baseline (−0.18 W m−2). We derive a stronger warming over most desert areas in ModelE2 than in CAM5 with C1999 (Fig. S16a). The strong warming in ModelE2 compared to CAM5 highly likely results from the high hematite aerosol mass simulated in ModelE2 over the Sahel, the Middle East, and Australia (Fig. S17), although the regression model induced error may also contribute (e.g., Fig. S4). Similarly, we use the DOD distribution in the GFDL model to estimate the shortwave DRE (described in Sect. 2.3.4). The resultant estimate (−0.23 W m−2) is slightly lower than that in our base case in the global average (Fig. S6b). Over most desert regions in northern Africa, the Middle East, and Central Asia, GFDL dust shows stronger cooling compared to the CAM5 baseline.
Dust DRE from MONARCH is calculated by the model and reported here. In the global average, MONARCH simulates a stronger cooling (−0.37 W m−2) compared to CAM5 with C1999 (−0.18 W m−2; Fig. S16b) partly due to a more scattering dust in the former (SSA: 0.92 and 0.89 in MONARCH and CAM5, respectively; Table 3). The stronger cooling is seen most clearly over the land areas in northern Africa and the Middle East (Fig. S16b).
We estimate the DRE uncertainty to be [−0.23, +0.14] W m−2, considering the combined model spread (CAM5, CAM6, ModelE2, MONARCH, and GFDL) and uncertainties in the soil mineral abundance in C1999, dust burdens, and imaginary refractive index of minerals. This range is even narrower than the uncertainty induced by all parameters that we have considered in the perturbation analysis using CAM5 and both soil atlases, implying that the effect of inter-model differences is smaller than the uncertainty revealed by CAM5, even though the a posteriori statistical DRE calculation for the ModelE2 and GFDL models introduces uncertainties. Adding the difference between C1999 and J2014 and iron-oxide uncertainty in J2014 to the result broadens the range to [−0.30, +0.30] W m−2. Therefore, even considering the model spread, iron oxides are still the most important error source in terms of the contribution (82 % ≈ (0.22 + 0.27) (0.30 + 0.30) × 100; cf. Sect. “Uncertainty due to dust minerals, burden, and imaginary complex refractive index” for the numerator) to the total shortwave DRE uncertainty. Spatially, the total shortwave DRE uncertainty (Fig. 15) including the model spread is in general larger than that due to soil iron-oxide uncertainty in C1999 and in both datasets, particularly over the Middle East, north-western Africa, and oceanic areas downwind of northern Africa.
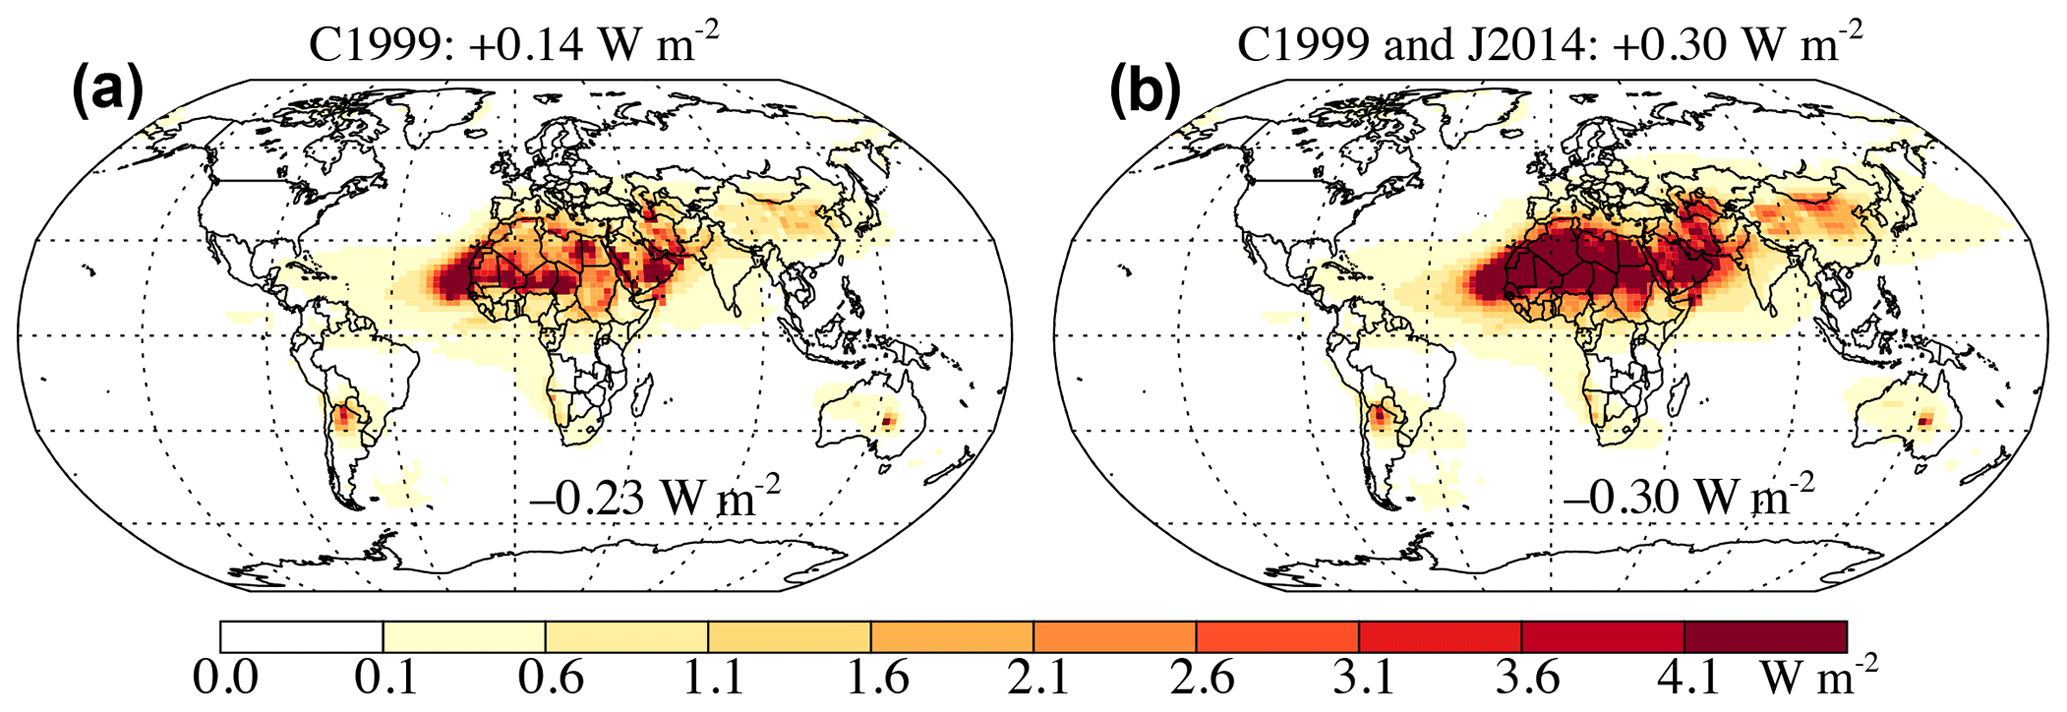
Figure 15As in Fig. 11 but for the shortwave DRE uncertainty estimated based on a combination of five models (CAM5, CAM6, ModelE2, GFDL, MONARCH). Panel (a) only includes soil distribution of minerals and their uncertainty in the C1999 soil atlas. Panel (b) further includes the difference between C1999 and J2014 and uncertainty in J2014. Note that the shortwave DREs for ModelE2 and GFDL are obtained through regressions (see Sect. 2.3.4). Numbers show the high (in the title) and low branches (inlet numbers) of the global mean uncertainty estimated based on the global average shortwave DRE in individual cases (see Sect. 2.3.3).
Errors in shortwave direct radiative effect calculations due to radiative parameterization
The band error in the model radiation parameterization in the model is an important uncertainty source for the DRE estimate (Jones et al., 2017). We assess this uncertainty with a line-by-line calculation using CAM (e.g., Jones et al., 2017) for a 1 d (22 March 2005) simulation over northern Africa. According to the line-by-line calculation, the shortwave bands implemented in CESM introduce negative bias (∼25 % error) in the TOA DRE calculation compared to the benchmark radiation code (a similar error level is shown in the TOA DRE calculation under clear-sky and all-sky conditions; David Paynter, personal communication, 2020). This suggests that despite the use of accurate optical properties, CAM underestimates the DRE and dust warming mostly due to (1) the use of the two-stream δ-Eddington approximation (major error source) in RRTMG in comparison to the 16 streams used in the line-by-line run and (2) the radiative model's low band resolution (minor error source compared to that in point 1) (David Paynter, personal communication, 2020). The underestimation, however, is small, with an amplitude of ∼0.05 W m−2 considering the DRE in our baseline simulation. Thus, although the line-by-line calculation is performed only for 1 full day over northern Africa, we suggest that the uncertainty associated with the band error in GCMs is likely much smaller than that due to iron oxides (Sect. “Uncertainty due to dust minerals, burden, and imaginary complex refractive index”).
3.3 Longwave radiative effect uncertainty
CAM5 simulated differences in the longwave dust DRE. Unlike the shortwave DRE, the longwave DRE uncertainties mainly arise from the uncertainties in the mineral complex refractive indices, size distribution, and vertical distribution (effectively, dust acts similarly to a greenhouse gas) of dust aerosol rather than mineralogy. The sensitivity tests in our model show that the longwave DRE is insensitive to the change in dust mineral contents in either the clay- or silt-sized category (Fig. 16). The global mean longwave DREs calculated by different CAM versions are +0.24 W m−2 in CAM4 (taken as an outlier), +0.11 W m−2 in CAM5, and +0.14 W m−2 in CAM6.
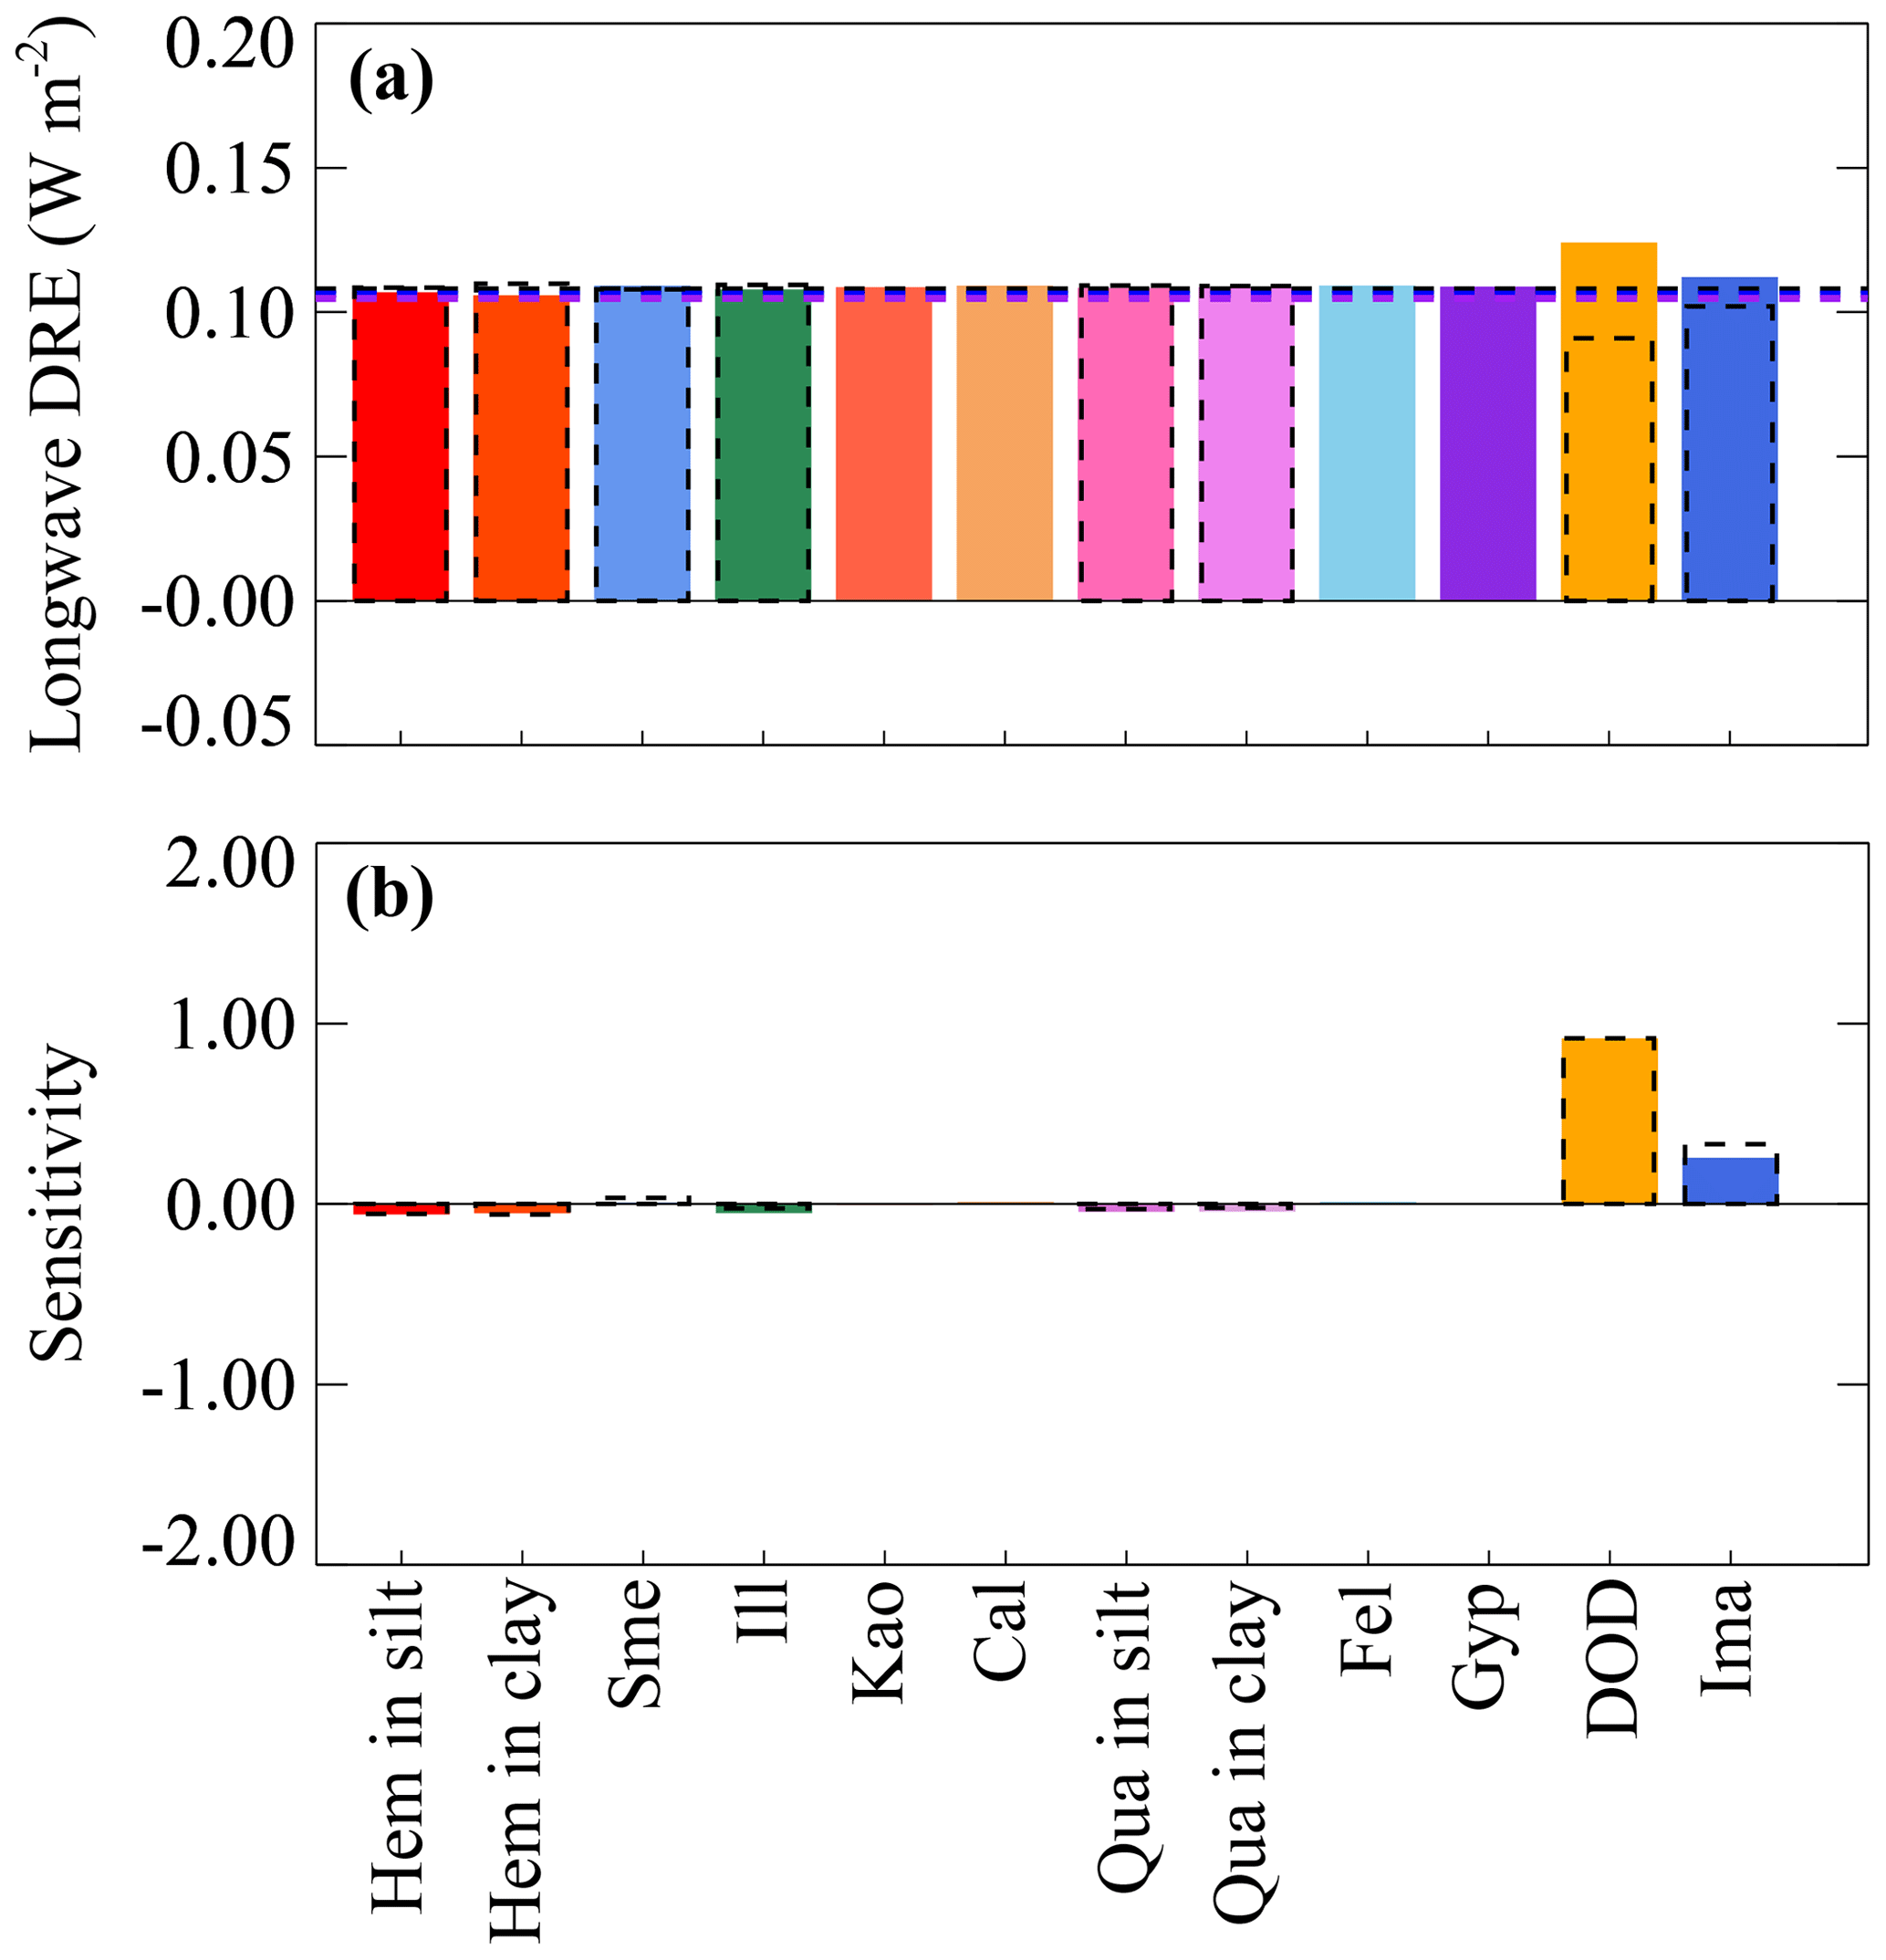
Figure 16Longwave DRE (a) and its sensitivity to minerals, DOD, and imaginary complex refractive index (b) in CAM5. In (a), black lines indicate values obtained from the simulation with C1999; blue lines denote values obtained from the simulation with J2014 distinguishing hematite from goethite; purple lines are similar to blue ones but with identical optical properties between hematite and goethite. Bars: values associated with higher (in color) and lower limits (dash with opposite signs to real values) of minerals, DOD, and the imaginary complex refractive index. x-axis labels: Hem – hematite; Sme – smectite; Ill – illite; Kao – kaolinite; Cal – calcite; Qua – quartz; Fel – feldspar; Gyp – gypsum; DOD – dust aerosol optical depth; Ima – imaginary complex refractive index.
Our calculation suggests weak impacts on the longwave dust DRE by uncertainty in the soil distribution of minerals such as quartz and feldspar (Fig. S18), which may be a result of the longwave bands and the averaged absorption properties of the eight minerals used in CAM5. Quartz dominates absorption at several longwave bands (e.g., 9.2 µm), including the atmospheric window (Sokolik and Toon, 1999), with additional significant contributions from both the silt- and clay-sized minerals (Fig. S19). However, its absorption at most other bands (e.g., band 3: 15.87–20 µm) implemented in CAM5 is weak or comparable with that of other minerals (Fig. 1b). As a result, the perturbing analysis highly likely underestimated the sensitivity of the longwave dust DRE to variations of the mineral contents and the uncertainty in the longwave DRE. Our calculation neglecting dust scattering of longwave radiation shows that the global mean longwave dust DRE deviates from the baseline by ±0.02 W m−2, resulting in an uncertainty range of [+0.09, +0.13] W m−2, with large values mainly found along the “dust belt” (Fig. S20).
Previous studies have suggested that omitting longwave dust scattering results in an underestimate of the longwave DRE by between ∼23 % and 51 % (Sicard et al., 2014; Dufresne et al., 2002). The estimated deviation from the baseline in the longwave DRE becomes ±0.03 W m−2 due to perturbed parameters (e.g., imaginary complex refractive index for each mineral), if we artificially augment the longwave dust DRE at the TOA by 51 % attempting to include scattering effects following previous studies (Di Biagio et al., 2020; Kok et al., 2017; Miller et al., 2006). This results in an estimate of the longwave DRE ranging between [+0.14, +0.20] W m−2. MONARCH simulates a longwave dust DRE of +0.17 W m−2. This value is the same as in CAM with the 51 % augmentation. Adding the simulated longwave dust DRE from MONARCH to that of CAM thus leads to little change in the longwave dust DRE uncertainty.
3.4 Net (sum of shortwave and longwave) direct radiative effect uncertainty
Our baseline simulation shows a net dust warming of +0.04 W m−2 (Fig. 17d), which is close to the estimate of −0.03 W m−2 obtained by Di Biagio et al. (2020). The net dust DRE we estimate is strongly contrasted to the cooling effect as obtained by AEROCOM (−0.50 W m−2) and Kok et al. (2017; −0.26 W m−2). The longwave warming induced by both dust scattering (augmentation by 51 %) and absorption completely offsets the shortwave cooling at the TOA obtained in CAM5 with C1999, longwave : shortwave ≈1.3 (in absolute terms), which is larger than the ratio range (0.23–0.88 in absolute terms) reported in previous studies (Kok et al., 2017; Di Biagio et al., 2020).
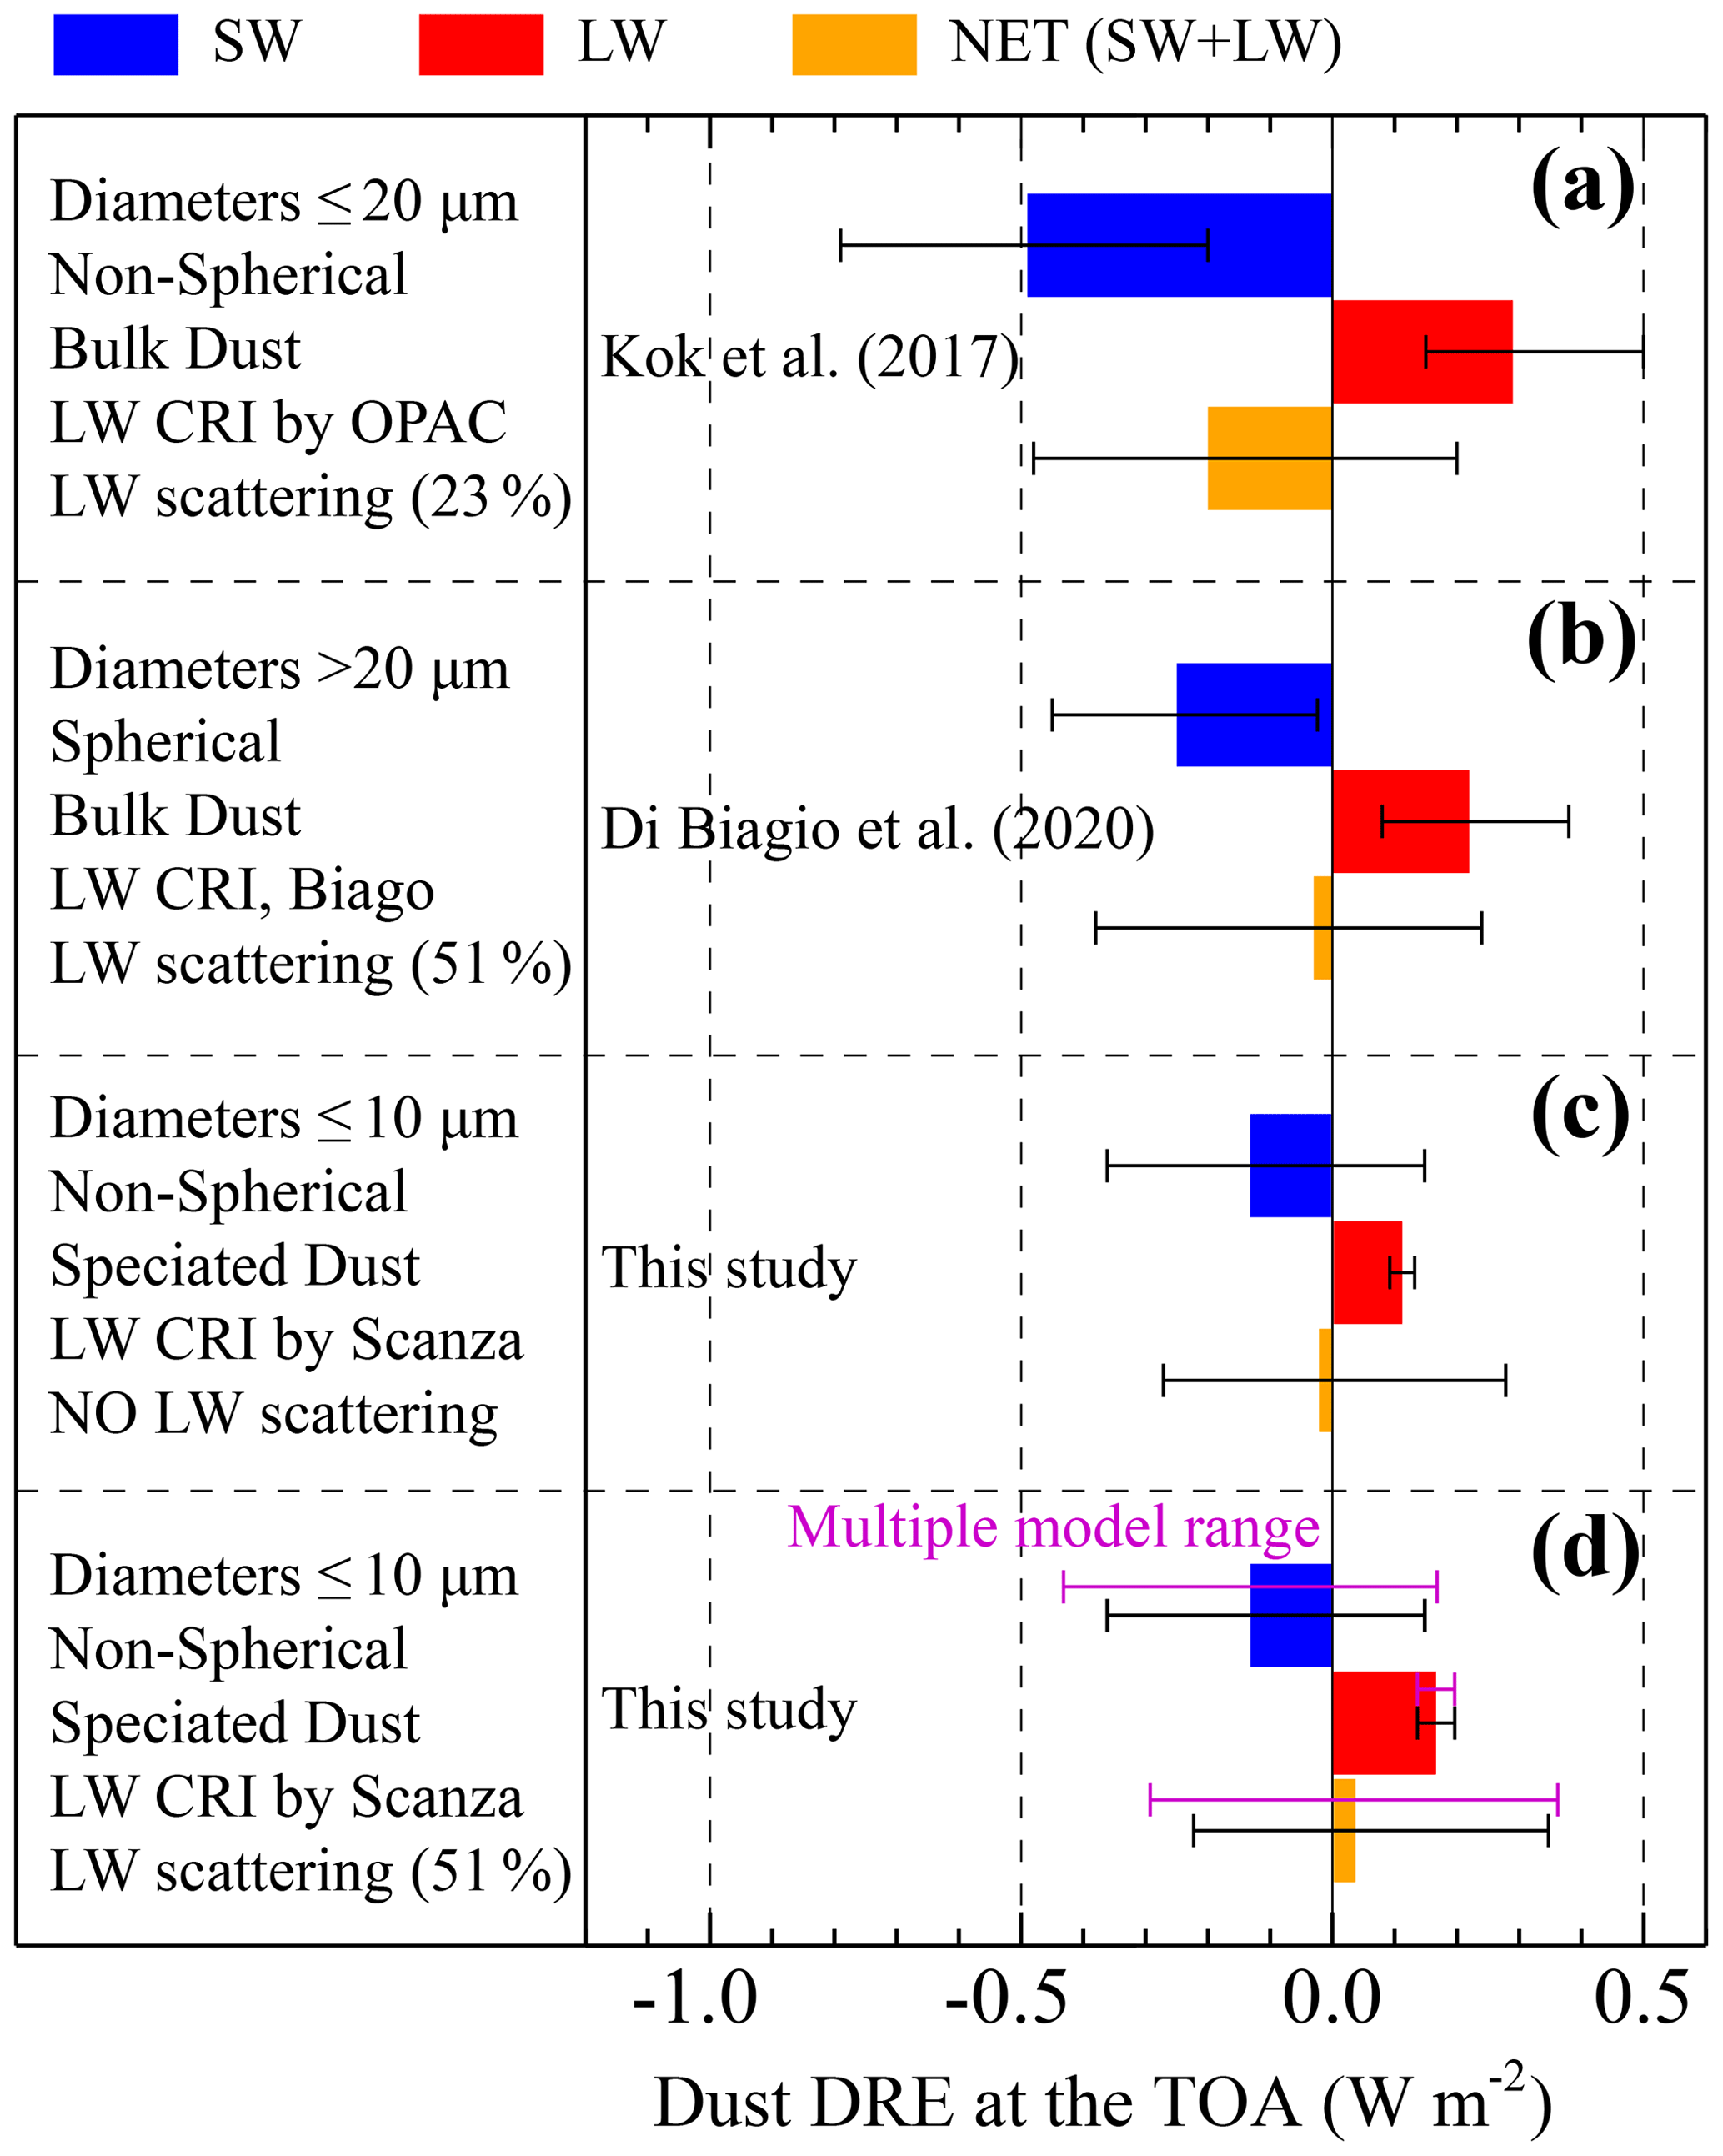
Figure 17Comparison of global mean shortwave (SW), longwave (LW), and net (NET) DRE at the TOA obtained by Kok et al. (2017) (a), Di Biagio et al. (2020) (b), and this study (c, d). In (c) and (d), black error bars denote estimates based on CAM5 and CAM6 with mineral uncertainty in C1999 and J2014. Purple bars in (d) represent estimates based on multiple models (CAM5, CAM6, ModelE2, GFDL, and MONARCH with both soil atlases), and the longwave DRE in CAM is scaled up by ∼1.5. Note that the uncertainty of the longwave DRE is obtained based on CAM5, CAM6, and MONARCH. Texts to the left describe detailed information used for corresponding estimates. The description of this study applies to CAM5 and CAM6 only. GFDL also has a cut-off diameter of 10 µm. ModelE2 and MONARCH consider dust particles with the diameter up to 50 and 20 µm, respectively. Kok et al. (2017) utilized the complex refractive index (CRI) from Optical Properties of Aerosols and Clouds (OPAC) (Hess et al., 1998) or Volz (1973). The estimate in Di Biagio et al. (2020) is based on the CRI obtained from Di Biagio et al. (2017) in the longwave spectral range and from Balkanski et al. (2007) in the shortwave spectral range including dust >20 µm in diameter. The speciated-dust model utilizes the CRI of each mineral taken from Scanza et al. (2015). Dust optics in MONARCH are for longwave and shortwave optics (see text).
We estimate the range of the net dust DRE to be between [−0.23, +0.35] W m−2 using CAM5 with both soil atlases being considered. Therefore, dust has a probability of ∼60 % to warm the planet, a factor of 1.4 (relative change) higher than the estimate of Kok et al. (2017), who argued that there was a 25 % chance that dust warms. The net dust DRE range becomes [−0.22, +0.34] W m−2 when considering iron oxides only in the shortwave DRE calculation (longwave DRE is not totally insensitive to variations of mineral amounts in our model). The uncertainty in the soil abundance of iron oxides, therefore, contributes ∼97 % ((0.34 + 0.22)(0.35 + 0.23) × 100) to the total uncertainty for CAM5. Thus, we identify iron oxides as the largest uncertainty source and can be more important than dust burden or the imaginary refractive index of minerals.
The inclusion of multiple-models results into the abovementioned estimate yields the largest net DRE range of [−0.30, +0.36] W m−2 to date. The uncertainty range, to a certain extent, reflects the influence of different model treatments of parameters (on, e.g., size distribution, emission, transport, mixing states of minerals or dust with other species, and atmospheric processing), which is smaller than that of uncertainties in parameters we considered in CAM5. Using this estimate, soil mineral uncertainties account for ∼ 85 % ((0.34 + 0.22)(0.36 + 0.30) × 100) of the total range in DRE calculated in this study.
Iron oxides including hematite and goethite are the most important mineral absorbers at solar wavelengths (Sokolik and Toon, 1999; Claquin et al., 1999; Lafon et al., 2006; Balkanski et al., 2007; Formenti et al., 2014; Journet et al., 2014; Scanza et al., 2015; Li and Sokolik, 2018). Here, for the first time we performed comprehensive studies to address uncertainty in dust DRE arising from the abundance of iron oxides in soil mineralogy atlases, C1999 and J2014. We estimated this uncertainty in DRE by using dust mineralogy-speciated climate models and focusing in particular on iron oxides with their known uncertainties in C1999 and J2014. Detailed sensitivity studies were performed using a perturbation analysis methodology on the eight different minerals and associated imaginary refractive indices along with DOD. Uncertainties in iron-oxide content represent ∼97 % of the uncertainties estimated considering CAM only and ∼85 % across multi-model uncertainties.
While hematite is a more absorbing iron oxide than goethite, our results show that uncertainty in goethite in J2014 produces a larger uncertainty in the shortwave DRE estimate, even larger than the uncertainty caused by the hematite differences between C1999 and J2014. Given the volume averaging method used in the model to compute bulk aerosol optical properties, despite J2014 being the latest soil atlas, its introduction does not improve CAM5 predictions of the observed DRE efficiency at the TOA over northern Africa and downwind regions. While C1999 assumed that iron oxides are all in the form of hematite, our tests highlight the importance of distinguishing goethite from hematite for the shortwave DRE estimate. Otherwise, the model tends to underestimate dust warming at the TOA by ∼56 %.
Sensitivity studies in CAM5, which represents internally mixed aerosol species within each mode, demonstrated that the shortwave dust DRE at the TOA is highly sensitive to estimates of the iron-oxide atmospheric burden; iron oxides along with other minerals considered in this study have a negligible influence on the longwave DRE. As a consequence, the large uncertainty in the amount of hematite present in soils leads to an uncertainty up to 0.32 W m−2 in the TOA shortwave DRE. We conclude that, to estimate the shortwave DRE, the modeled fraction and speciation of iron oxides must be considered in addition to parameters such as the size distribution and imaginary complex refractive index of minerals. When including the longwave warming in our model, there is about a 60 % probability that mineral dust will produce a net warming at the TOA (Fig. 17).
The use of the volume averaging method to compute the bulk dust optical properties (e.g., complex refractive index) based on the dust mineral species probably overestimates the shortwave absorption (X. L. Zhang et al., 2015; Li and Sokolik, 2018), leading to an artificial warming in CAM5 and CAM6. Our model very likely underestimates a large fraction of the coarse dust particles (diameter > ∼5 µm) according to a recent study (Adebiyi and Kok, 2020) and thus underestimates the dust warming effect. In addition, the transport of “giant” dust particles (diameter > ∼20 µm) is still a representation issue that remains unsolved. Treatments of the “giant” dust particles as have been considered in previous studies (e.g., Di Biagio et al., 2020) will continue with future studies. See detailed discussions about some other sources of the DRE uncertainty estimate in Appendix A. Even though they are not explicitly accounted for in the perturbation analysis in CAM, the influence of some of these remaining elements on the DRE may have been in part covered by using multiple models as reflected in the large model spread.
Considering that improving modeled mineralogical composition of dust is important to other disciplines or research subjects, such as biogeochemistry and dust–cloud interactions, a new soil atlas (Green et al., 2020) with more accurate hematite soil distribution is required. New measurement methods are expected to produce such an atlas. Incorporating this information will improve a model's ability to quantify and understand the DRE by mineral dust and its role in the Earth system.
In this Appendix, we compare the mineral speciation uncertainties to some of the other major sources of dust DRE uncertainty. Our perturbation analysis has not explicitly accounted for all elements that are relevant to this estimate in CAM, which are discussed here.
Size distribution is known as an important parameter that strongly affects the dust DRE (Mahowald et al., 2014). The base shortwave DRE obtained in CAM5 based upon C1999 relies heavily on the aerosol size distribution employed in CAM5. The representation of the size distribution is an issue that remains as yet unsolved (Li et al., 2021a). A single larger dust particle typically has a higher absorption efficiency and lower scattering efficiency in the shortwave spectrum range. Therefore, even for the size-independent mineralogical composition, although the complex refractive index of each mineral does not depend on size (Sokolik et al., 1993; Sokolik and Toon, 1999), the SSA decreases steadily as the fraction of large-sized dust increases. Recent observations show significantly abundant coarse and even “giant” (diameter > ∼20 µm) dust particles, over the Sahara and islands downwind (Johnson and Osborne, 2011; Ryder et al., 2013, 2019). Consequently, an aerosol cut-off diameter of 10 µm in CAM could bias our baseline towards more cooling, since coarse particles have shorter lifetimes and tend to absorb shortwave radiation more than fine-sized particles (Kok et al., 2017; Granados-Muñoz et al., 2019). A recent study (Adebiyi and Kok, 2020) found that most models including ModelE2 and CESM significantly underestimate the fraction of dust particles, with the diameter greater than ∼5 µm in the atmosphere compared to in situ measurements of dust size distributions compiled from publications. Because the dependence of SSA on composition is important only when the coarse fraction is low (Di Biagio et al., 2019; Ryder et al., 2013), the importance of iron oxides is probably overestimated here owing to missing a large fraction of coarse-mode dust by the models.
A major source of hematite is the Sahel, whose emission is sensitive to the model dynamics and dust generation scheme, even though here the model wind is nudged towards MERRA. Even though the dust scheme used by CAM (Kok et al., 2014a) shows some improvements compared to DEAD in the model–observation comparison (Kok et al., 2014b), there are still large uncertainties in representing surface soil conditions of dust source areas in global models. Despite the insensitivity of dust mass extinction efficiency to mineralogy, a new generation scheme that yields a different emission pattern could change the mass fraction of iron oxides of dust aerosol across the globe. This could modify the shortwave DRE, even with the same globally mean DOD.
Apart from the emission, many aspects of modeling dust transport (dry and wet deposition, dust–cloud interaction, and mixing states with other aerosols such as sulfate, black carbon, and sea salt) remain subject to large uncertainties. Most of them are related to uncertainties in parameterizations of the dust cycle as well as the simulated meteorology propagating in part from the reanalysis products, to which that dust mobilization is sensitive. Most models, therefore, could not perfectly reproduce the observational dust distributions (Ginoux et al., 2001; Mahowald et al., 2005; Huneeus et al., 2011; Albani et al., 2014). This is true also because of the limited spatial coverage and temporal frequency of observational datasets and their sampling bias with few measurements over remote regions. For instance, both CAM4 and CAM5 match dust deposition observations within a factor of 10 (Fig. 3). At sites such as Colle del Lys and Colle Gnifetti in Europe, the baseline simulation in CAM5 greatly overestimated the surface deposition, while over the South Pacific the model greatly underestimated the deposition. Although a notable difference exists in the dust spatial distribution among the multiple models used in this study, it is possible that the simulated spatial distributions of dust minerals do not bracket the full range of observations in dust plume extents or burdens, leaving out a part of uncertainty.
The ageing process (e.g., heterogenous chemistry) of individual dust particles acts to alter their chemical composition. For example, high-level calcite-containing dust from, e.g., parts of China and Saudi Arabia have been found to react with nitric acid and form a nitrate salt (Krueger et al., 2004). The salt compounds cause increased adsorption of water vapour from the atmosphere and thus growth of the particle size. As a result, compared to non-aged particles, aged dust is more efficiently removed by the wet and dry deposition, leading to a reduced dust burden and lifetime (Abdelkader et al., 2017). Growth of particle size by deliquescence also changes the optical properties. The importance of the atmospheric processing on changing physical–chemical properties dust aerosol depends on its mineralogy and transport path, which determine the species (e.g., secondary acids, ammonium) that accumulate on the dust surface (Sullivan et al., 2007). In contrast to the Asia dust case (Krueger et al., 2004), optical properties and chemical composition of transported dust in Mediterranean from the Saharan show negligible changes, despite mixing with pollution particles (Denjean et al., 2016). These processes, unfortunately, are still not well established.
Other relevant uncertainties for the DRE estimate that are not explicitly considered here include (1) the altitude of the dust plume (Granados-Muñoz et al., 2019), especially its location with respect to clouds (Huang et al., 2009); (2) representation of surface albedo; (3) mixing assumptions, two extreme states of which shown in CAM4 and CAM5, when in reality, the mixing state of dust minerals along with other species is somewhere in between; (4) nano-sized iron oxides that are commonly associated with clay minerals but are not well represented in the CAM model; (5) hygroscopicity for each mineral which is assumed to be identical here; and (6) the efficiency of transmitting fine-mode aerosols to coarse-model aerosols through particle coagulation.
Data are available in the Cornell eCommons repository (https://doi.org/10.7298/wedj-jv65, Li et al., 2021b).
The supplement related to this article is available online at: https://doi.org/10.5194/acp-21-3973-2021-supplement.
LL and NMM designed the study with discussions with RLM, CPGP, PG, MK, MGA, DSH, OK, VO, and DP. LL developed mineralogy CAM6, performed CAM simulations, analyzed multiple model results, and wrote the manuscript with comments from NMM, RLM, CPGP, DSH, MGA, MK, PG, YB, JFK, ROG, DRT, and VO; MK performed MONARCH simulations and analysed DOD and SSA in MONARCH; RLM performed ModelE2 simulations; PG performed GFDL simulations; DP performed line-by-line calculations; MGA, CPGP, and YB provided Journet soil atlases; JFK performed the mass extinction efficient calculation for non-spherical and spherical dust.
The authors declare that they have no conflict of interest.
A portion of this work was funded by the Earth Surface Mineral Dust Source Investigation (EMIT), a NASA Earth Ventures-Instrument (EVI-4) Mission. We are grateful for high-performance computing resources provided by NCAR's Computational and Information Systems Laboratory.
A portion of this work was funded by the Earth Surface Mineral Dust Source Investigation (EMIT), a NASA Earth Ventures-Instrument (EVI-4) Mission. Longlei Li, Natalie M. Mahowald, and Douglas S. Hamilton were supported by the Atkinson Centre for a Sustainable Future. Jasper F. Kok received support from NSF grant 1552519. Martina Klose received funding from the European Union's Horizon 2020 research and innovation program under Marie Skłodowska-Curie grant agreement no. 789630 (DUST.ES). Carlos Pérez García-Pando and Maria Gonçalves Ageitos received support from the European Research Council (grant no. 773051, FRAGMENT), EU H2020 project FORCES (grant no. 821205), the AXA Research Fund, the Spanish Ministry of Science, Innovation and Universities (RYC-2015-18690 and NUTRIENT: CGL2017-88911-R), and PRACE and RES for awarding access to MareNostrum at the Barcelona Supercomputing Center to run MONARCH. Ron L. Miller received for support from the NASA Modeling, Analysis and Prediction Program (NNG14HH42I).
This paper was edited by Joshua Fu and reviewed by three anonymous referees.
Abdelkader, M., Metzger, S., Steil, B., Klingmüller, K., Tost, H., Pozzer, A., Stenchikov, G., Barrie, L., and Lelieveld, J.: Sensitivity of transatlantic dust transport to chemical aging and related atmospheric processes, Atmos. Chem. Phys., 17, 3799–3821, https://doi.org/10.5194/acp-17-3799-2017, 2017.
Adebiyi, A. A. and Kok, J. F.: Climate models miss most of the coarse dust in the atmosphere, Sci. Adv., 6, 1–10, https://doi.org/10.1126/sciadv.aaz9507, 2020.
Albani, S., Mahowald, N., Perry, A., Scanza, R., Zender, C., and Flanner, M. G.: Improved representation of dust size and optics in the CESM, J. Adv. Model. Earth Sy., 6, 541–570, https://doi.org/10.1002/2013MS000279, 2014.
Alfaro, S., Lafon, S., Rajot, J., Formenti, P., Gaudichet, A., and Maille, M.: Iron oxides and light absorption by pure desert dust: an experimental study, J. Geophys. Res., 109, D08208, https://doi.org/10.1029/2003JD004374, 2004.
Atkinson, J., Murray, B., Woodhouse, M., Whale, T., Baustian, K., Carslaw, K. S., Doobie, S., O'Sullivan, D., and Malkin, T.: The importance of feldspar for ice nucleation by mineral dust in mixed-phase clouds, Nature, 498, 355–358, https://doi.org/10.1038/nature12278, 2013.
Badia, A., Jorba, O., Voulgarakis, A., Dabdub, D., Pérez García-Pando, C., Hilboll, A., Gonçalves, M., and Janjic, Z.: Description and evaluation of the Multiscale Online Nonhydrostatic AtmospheRe CHemistry model (NMMB-MONARCH) version 1.0: gas-phase chemistry at global scale, Geosci. Model Dev., 10, 609–638, https://doi.org/10.5194/gmd-10-609-2017, 2017.
Baker, A. R. and Croot, P. L.: Atmospheric and marine controls on aerosol iron solubility in seawater, Mar. Chem., 120, 4–13, https://doi.org/10.1016/j.marchem.2008.09.003, 2010.
Balkanski, Y., Schulz, M., Claquin, T., and Guibert, S.: Reevaluation of Mineral aerosol radiative forcings suggests a better agreement with satellite and AERONET data, Atmos. Chem. Phys., 7, 81–95, https://doi.org/10.5194/acp-7-81-2007, 2007.
Batjes, N. H.: A world dataset of derived soil properties by FAO–UNESCO soil unit for global modelling, Soil Use Manage., 13, 9–16, 1997.
Berrisford, P., Kållberg, P., Kobayashi, S., Dee, D., Uppala, S., Simmons, A. J., Poli, P., and Sato, H.: Atmospheric conservation properties in ERA-Interim, Q. J. Roy. Meteor. Soc., 137, 1381–1399, https://doi.org/10.1002/qj.864, 2011.
Bollasina, M., Nigam, S., and Lau, K. M.: Absorbing aerosols and summer monsoon evolution over South Asia: An observational portrayal, J. Climate, 21, 3221–3239, https://doi.org/10.1175/2007JCLI2094.1, 2008.
Boucher, O., Randall, D., Artaxo, P., Bretherton, C., Feingold, G., Forster, P., Kerminen, V.-M., Kondo, Y., Liao, H., Lohman, U., Rasch, P., Satheesh, S., Sherwood, S., Stevens, B., Zhang, X.-Y., Lohmann, U., Rasch, P., Satheesh, S., Sherwood, S., Stevens, B., and Zhang, X.-Y.: Clouds and Aerosols, in: Climate Change 2013: The Physical Science Basis, Contribution of Working Group I to the Fifth Assessment Report of the Intergovernmental Panel on Climate Change, edited by: Stocker, V. B., Qin, T. F. D., Plattner, G.-K., Tignor, M., Allen, S. K., Boschung, J., Nauels, A., Xia, Y., and Midgley, P. M., Cambridge University Press, Cambridge, United Kingdom, 573–657, 2013.
Cakmur, R., Miller, R., and Torres, O.: Incorporating the effect of small-scale circulations upon dust emission in an atmospheric general circulation model, J. Geophys. Res., 109, D07201, https://doi.org/10.1029/2003JD004067, 2004.
Caldwell, P. M., Mametjanov, A., Tang, Q., Van Roekel, L. P., Golaz, J. C., Lin, W., Bader, D. C., Keen, N. D., Feng, Y., Jacob, R., Maltrud, M. E., Roberts, A. F., Taylor, M. A., Veneziani, M., Wang, H., Wolfe, J. D., Balaguru, K., Cameron-Smith, P., Dong, L., Klein, S. A., Leung, L. R., Li, H. Y., Li, Q., Liu, X., Neale, R. B., Pinheiro, M., Qian, Y., Ullrich, P. A., Xie, S., Yang, Y., Zhang, Y., Zhang, K., and Zhou, T.: The DOE E3SM Coupled Model Version 1: Description and Results at High Resolution, J. Adv. Model. Earth Sy., 11, 4095–4146, https://doi.org/10.1029/2019MS001870, 2019.
Claquin, T., Schulz, M., and Balkanski, Y.: Modeling the mineralogy of atmospheric dust sources, J. Geophys. Res., 104, 22222–243256, 1999.
Danabasoglu, G., Lamarque, J. F., Bacmeister, J., Bailey, D. A., du Vivier, A. K., Edwards, J., Emmons, L. K., Fasullo, J., Garcia, R., Gettelman, A., Hannay, C., Holland, M. M., Large, W. G., Lauritzen, P. H., Lawrence, D. M., Lenaerts, J. T. M., Lindsay, K., Lipscomb, W. H., Mills, M. J., Neale, R., Oleson, K. W., Otto-Bliesner, B., Phillips, A. S., Sacks, W., Tilmes, S., van Kampenhout, L., Vertenstein, M., Bertini, A., Dennis, J., Deser, C., Fischer, C., Fox-Kemper, B., Kay, J. E., Kinnison, D., Kushner, P. J., Larson, V. E., Long, M. C., Mickelson, S., Moore, J. K., Nienhouse, E., Polvani, L., Rasch, P. J., and Strand, W. G.: The Community Earth System Model Version 2 (CESM2), J. Adv. Model. Earth Sy., 12, e2019MS001916, https://doi.org/10.1029/2019MS001916, 2020.
DeMott, P. J., Sassen, K., Poellot, M. R., Baumgardner, D., Rogers, D. C., Brooks, S. D., Prenni, A. J., and Kreidenweis, S. M.: African dust aerosols as atmospheric ice nuclei, Geophys. Res. Lett., 30, 1732, https://doi.org/10.1029/2003GL017410, 2003.
Denjean, C., Cassola, F., Mazzino, A., Triquet, S., Chevaillier, S., Grand, N., Bourrianne, T., Momboisse, G., Sellegri, K., Schwarzenbock, A., Freney, E., Mallet, M., and Formenti, P.: Size distribution and optical properties of mineral dust aerosols transported in the western Mediterranean, Atmos. Chem. Phys., 16, 1081–1104, https://doi.org/10.5194/acp-16-1081-2016, 2016.
Dentener, F. J., Carmichael, G. R., Zhang, Y., Lelieveld, J., and Crutzen, P. J.: Role of mineral aerosol as a reactive surface in the global troposphere, J. Geophys. Res., 101, 22869–22889, 1996.
Di Biagio, C., Formenti, P., Balkanski, Y., Caponi, L., Cazaunau, M., Pangui, E., Journet, E., Nowak, S., Caquineau, S., Andreae, M. O., Kandler, K., Saeed, T., Piketh, S., Seibert, D., Williams, E., and Doussin, J.-F.: Global scale variability of the mineral dust long-wave refractive index: a new dataset of in situ measurements for climate modeling and remote sensing, Atmos. Chem. Phys., 17, 1901–1929, https://doi.org/10.5194/acp-17-1901-2017, 2017.
Di Biagio, C., Formenti, P., Balkanski, Y., Caponi, L., Cazaunau, M., Pangui, E., Journet, E., Nowak, S., Andreae, M. O., Kandler, K., Saeed, T., Piketh, S., Seibert, D., Williams, E., and Doussin, J.-F.: Complex refractive indices and single-scattering albedo of global dust aerosols in the shortwave spectrum and relationship to size and iron content, Atmos. Chem. Phys., 19, 15503–15531, https://doi.org/10.5194/acp-19-15503-2019, 2019.
Di Biagio, C., Balkanski, Y., Albani, S., Boucher, O., and Formenti, P.: Direct Radiative Effect by Mineral Dust Aerosols Constrained by New Microphysical and Spectral Optical Data, Geophys. Res. Lett., 47, 1–12, https://doi.org/10.1029/2019GL086186, 2020.
Dubovik, O., Holben, B., Eck, T. F., Smirnov, A., Kaufmann, Y. J., King, M. D., Tanré, D., and Slutsker, I.: Variability of absorption and optical properties of key aerosol types observed in worldwide locations, J. Atmos. Sci., 59, 590–608, https://doi.org/10.1175/1520-0469(2002)059<0590:VOAAOP>2.0.CO;2, 2002.
Dufresne, J. L., Gautier, C., and Ricchiazzi, P.: Longwave scattering effects of mineral aerosols, J. Atmos. Sci., 59, 1959–1966, https://doi.org/10.1175/1520-0469(2002)059<1959:LSEOMA>2.0.CO;2, 2002.
Dunne, J. P., Horowitz, L. W., Adcroft, A. J., Ginoux, P., Held, I. M., John, J. G., Krasting, J. P., Malyshev, S., Naik, V., Paulot, F., Shevliakova, E., Stock, C. A., Zadeh, N., Balaji, V., Blanton, C., Dunne, K. A., Dupuis, C., Durachta, J., Dussin, R., Gauthier, P. P. G., Griffies, S. M., Guo, H., Hallberg, R. W., Harrison, M., He, J., Hurlin, W., McHugh, C., Menzel, R., Milly, P. C. D., Nikonov, S., Paynter, D. J., Ploshay, J., Radhakrishnan, A., Rand, K., Reichl, B. G., Robinson, T., Schwarzkopf, D. M., Sentman, L. T., Underwood, S., Vahlenkamp, H., Winton, M., Wittenberg, A. T., Wyman, B., Zeng, Y., and Zhao, M.: The GFDL Earth System Model Version 4.1 (GFDL-ESM 4.1): Overall Coupled Model Description and Simulation Characteristics, J. Adv. Model. Earth Syst., 12, 1–56, https://doi.org/10.1029/2019MS002015, 2020.
Evans, S., Ginoux, P., Malyshev, S. and Shevliakova, E.: Climate-vegetation interaction and amplification of Australian dust variability, Geophys. Res. Lett., 43(22), 11,823-11,830, doi:10.1002/2016GL071016, 2016.
FAO/IIASA/ISRIC/ISSCAS/JRC: Harmonized World Soil Database (version 1.2), FAO, Rome, Italy and IIASA, Laxenburg, Austria, 2012.
Fécan, F., Marticorena, B., and Bergametti, G.: Parametrization of the increase of the aeolian erosion threshold wind friction velocity due to soil moisture for arid and semi-arid areas, Ann. Geophys., 17, 149–157, https://doi.org/10.1007/s00585-999-0149-7, 1999.
Formenti, P., Rajot, J., Desboefs, K., Caquineau, S., Chevallier, S., Nava, S., Gaudichet, A., Journet, E., Triquet, S., Alfaro, S., Chiari, S., Haywood, J., Coe, H., and Highwood, E.: Regional variability of the composition of mineral dust from estern Africa: results from the AMMA SOP0/DABEX and DODO field campaigns, J. Geophys. Res., 113, D00C13, https://doi.org/10.1029/2008JD009903, 2008.
Formenti, P., Caquineau, S., Chevaillier, S., Klaver, A., Desboeufs, K., Rajot, J. L., Belin, S., and Briois, V.: Dominance of goethite over hematite in iron oxides of mineral dust from Western Africa: Quantitative partitioning by X‐ray absorption spectroscopy, J. Geophys. Res.-Atmos., 119, 12740–12754, https://doi.org/10.1002/2014JD021668, 2014.
Ge, J. M., Su, J., Ackerman, T. P., Fu, Q., Huang, J. P., and Shi, J. S.: Dust aerosol optical properties retrieval and radiative forcing over northwestern China during the 2008 China-US joint field experiment, J. Geophys. Res.-Atmos., 115, D00K12, https://doi.org/10.1029/2009JD013263, 2010.
Gettelman, A. and Morrison, H.: Advanced two-moment bulk microphysics for global models. Part I: Off-line tests and comparison with other schemes, J. Climate, 28, 1268–1287, https://doi.org/10.1175/JCLI-D-14-00102.1, 2015.
Ghan, S. J. and Zaveri, R. A.: Parameterization of optical properties for hydrated internally mixed aerosol, J. Geophys. Res.-Atmos., 112, D10201, https://doi.org/10.1029/2006JD007927, 2007.
Ginoux, P., Chin, M., Tegen, I., Prospero, J. M., Holben, B. N., Dubovik, O., and Lin, S.-J.: Sources and distribution of dust aerosols with the GOCART model, J. Geophys. Res., 106, 20255–20273, 2001.
Ginoux, P., Prospero, J., Gill, T. E., Hsu, N. C., and Zhao, M.: Global scale attribution of anthropogenic and natural dust sources and their emission rates based on MODIS deep blue aerosol products, Rev. Geophys., 50, RG3005, https://doi.org/10.1029/2012RG000388, 2012.
Granados-Muñoz, M. J., Sicard, M., Román, R., Benavent-Oltra, J. A., Barragán, R., Brogniez, G., Denjean, C., Mallet, M., Formenti, P., Torres, B., and Alados-Arboledas, L.: Impact of mineral dust on shortwave and longwave radiation: evaluation of different vertically resolved parameterizations in 1D radiative transfer computations, Atmos. Chem. Phys., 19, 523–542, https://doi.org/10.5194/acp-19-523-2019, 2019.
Green, R. O., Mahowald, N., Ung, C., Thompson, D. R., Bator, L., Bennet, M., Bernas, M., Blackway, N., Bradley, C., Cha, J., Clark, P., Clark, R., Cloud, D., Diaz, E., Ben Dor, E., Duren, R., Eastwood, M., Ehlmann, B. L., Fuentes, L., Ginoux, P., Gross, J., He, Y., Kalashnikova, O., Kert, W., Keymeulen, D., Klimesh, M., Ku, D., Kwong-Fu, H., Liggett, E., Li, L., Lundeen, S., Makowski, M. D., Mazer, A., Miller, R., Mouroulis, P., Oaida, B., Okin, G. S., Ortega, A., Oyake, A., Nguyen, H., Pace, T., Painter, T. H., Pempejian, J., Garcia-Pando, C. P., Pham, T., Phillips, B., Pollock, R., Purcell, R., Realmuto, V., Schoolcraft, J., Sen, A., Shin, S., Shaw, L., Soriano, M., Swayze, G., Thingvold, E., Vaid, A., and Zan, J.: The Earth Surface Mineral Dust Source Investigation: An Earth Science Imaging Spectroscopy Mission, in: 2020 IEEE Aerospace Conference, Big Sky, Montana, USA, 7–14 March 2020, 1–15, https://doi.org/10.1109/AERO47225.2020.9172731, 2020.
Hamilton, D. S., Scanza, R. A., Feng, Y., Guinness, J., Kok, J. F., Li, L., Liu, X., Rathod, S. D., Wan, J. S., Wu, M., and Mahowald, N. M.: Improved methodologies for Earth system modelling of atmospheric soluble iron and observation comparisons using the Mechanism of Intermediate complexity for Modelling Iron (MIMI v1.0), Geosci. Model Dev., 12, 3835–3862, https://doi.org/10.5194/gmd-12-3835-2019, 2019.
Hand, J. L., Mahowald, N. M., Chen, Y., Siefert, R. L., Luo, C., Subramaniam, A., and Fung, I.: Estimates of atmospheric-processed soluble iron from observations and a global mineral aerosol model: Biogeochemical implications, J. Geophys. Res.-Atmos., 109, D17205, https://doi.org/10.1029/2004JD004574, 2004.
Hanisch, F. and Crowley, J. N.: Ozone decomposition on Saharan dust: an experimental investigation, Atmos. Chem. Phys., 3, 119–130, https://doi.org/10.5194/acp-3-119-2003, 2003.
Hansen, J., Sato, M., and Ruedy, R.: Radiative forcing and climate response, J. Geophys. Res.-Atmos., 102, 6831–6864, https://doi.org/10.1029/96JD03436, 1997.
Haustein, K., Pérez, C., Baldasano, J. M., Jorba, O., Basart, S., Miller, R. L., Janjic, Z., Black, T., Nickovic, S., Todd, M. C., Washington, R., Müller, D., Tesche, M., Weinzierl, B., Esselborn, M., and Schladitz, A.: Atmospheric dust modeling from meso to global scales with the online NMMB/BSC-Dust model – Part 2: Experimental campaigns in Northern Africa, Atmos. Chem. Phys., 12, 2933–2958, https://doi.org/10.5194/acp-12-2933-2012, 2012.
Held, I. M., Guo, H., Adcroft, A., Dunne, J. P., Horowitz, L. W., Krasting, J., Shevliakova, E., Winton, M., Zhao, M., Bushuk, M., Wittenberg, A. T., Wyman, B., Xiang, B., Zhang, R., Anderson, W., Balaji, V., Donner, L., Dunne, K., Durachta, J., Gauthier, P. P. G., Ginoux, P., Golaz, J. C., Griffies, S. M., Hallberg, R., Harris, L., Harrison, M., Hurlin, W., John, J., Lin, P., Lin, S. J., Malyshev, S., Menzel, R., Milly, P. C. D., Ming, Y., Naik, V., Paynter, D., Paulot, F., Rammaswamy, V., Reichl, B., Robinson, T., Rosati, A., Seman, C., Silvers, L. G., Underwood, S., and Zadeh, N.: Structure and Performance of GFDL's CM4.0 Climate Model, J. Adv. Model. Earth Syst., 11, 3691–3727, https://doi.org/10.1029/2019MS001829, 2019.
Hess, M., Kopke, P., and Schult, I.: Optical properties of aerosols and clouds: the software package OPAC, B. Am. Meteorol. Soc., 79, 831–844, 1998.
Holben, B. N., Eck, T., Slutsker, I., Tanré, D., Buis, J. P., Setzer, A., Vermote, E., Reagan, J. A., Kaufman, Y. J., Nakajima, T., Lavenu, F., Jankowiak, I., and Smirnov, A.: AERONET – A Federated Instrument Network and Data Archive for Aerosol Characterization, Remote Sens. Environ., 66, 1–16, https://doi.org/10.1016/S0034-4257(98)00031-5, 1998.
Huang, J., Fu, Q., Su, J., Tang, Q., Minnis, P., Hu, Y., Yi, Y., and Zhao, Q.: Taklimakan dust aerosol radiative heating derived from CALIPSO observations using the Fu-Liou radiation model with CERES constraints, Atmos. Chem. Phys., 9, 4011–4021, https://doi.org/10.5194/acp-9-4011-2009, 2009.
Huang, K., Zhuang, G., Lin, Y., Li, J., Sun, Y., Zhang, W., and Fu, J. S.: Relation between optical and chemical properties of dust aerosol over Beijing, China, J. Geophys. Res., 115, D00K16, https://doi.org/10.1029/2009jd013212, 2010.
Huang, Y., Kok, J. F., Kandler, K., Lindqvist, H., Nousiainen, T., Sakai, T., Adebiyi, A., and Jokinen, O.: Climate Models and Remote Sensing Retrievals Neglect Substantial Desert Dust Asphericity, Geophys. Res. Lett., 47, e2019GL086592, https://doi.org/10.1029/2019GL086592, 2020.
Huneeus, N., Schulz, M., Balkanski, Y., Griesfeller, J., Prospero, J., Kinne, S., Bauer, S., Boucher, O., Chin, M., Dentener, F., Diehl, T., Easter, R., Fillmore, D., Ghan, S., Ginoux, P., Grini, A., Horowitz, L., Koch, D., Krol, M. C., Landing, W., Liu, X., Mahowald, N., Miller, R., Morcrette, J.-J., Myhre, G., Penner, J., Perlwitz, J., Stier, P., Takemura, T., and Zender, C. S.: Global dust model intercomparison in AeroCom phase I, Atmos. Chem. Phys., 11, 7781–7816, https://doi.org/10.5194/acp-11-7781-2011, 2011.
Hurrell, J. W., Holland, M. M., Gent, P. R., Ghan, S., Kay, J. E., Kushner, P. J., Lamarque, J.-F., Large, W. G., Lawrence, D., Lindsay, K., Lipscomb, W. H., Long, M. C., Mahowald, N., Marsh, D. R., Neale, R. B., Rasch, P., Vavrus, S., Vertenstein, M., Bader, D., Collins, W. D., Hack, J. J., Kiehl, J., and Marshall, S.: The community earth system model: A framework for collaborative research, B. Am. Meteorol. Soc., 94, 1339–1360, https://doi.org/10.1175/BAMS-D-12-00121.1, 2013.
Iacono, M. J., Mlawer, E. J., and Clough, S. A.: Validation of the RRTM Shortwave Radiation Model and Comparison to GCM Shortwave Models, in: Eleventh ARM Science Team Meeting Proceedings, 1–6, Atlanta, GA, U.S. Department of Energy, 2001.
Iacono, M. J., Delamere, J. S., Mlawer, E. J., Shephard, M. W., Clough, S. A., and Collins, W. D.: Radiative forcing by long-lived greenhouse gases: Calculations with the AER radiative transfer models, J. Geophys. Res.-Atmos., 113, 2–9, https://doi.org/10.1029/2008JD009944, 2008.
Jacobson, M. Z.: Investigating cloud absorption effects: Global absorption properties of black carbon, tar balls, and soil dust in clouds and aerosols, J. Geophys. Res.-Atmos., 117, D06205, https://doi.org/10.1029/2011JD017218, 2012.
Janjic, Z. I. and Gall, R.: Scientific documentation of the NCEP Nonhydrostatic Multiscale Model on the B grid (NMMB), National Center for Atmospheric Research, Maryland, USA, 2012.
Janjic, Z. I., Gerrity, J., and Nickovic, S.: An alternative approach to nonhydrostatic modeling, Mon. Weather Rev., 129, 1164–1178, https://doi.org/10.1175/1520-0493(2001)129<1164:AAATNM>2.0.CO;2, 2001.
Jickells, T. D., An, Z. S., Andersen, K. K., Baker, A. R., Bergametti, C., Brooks, N., Cao, J. J., Boyd, P. W., Duce, R. A., Hunter, K. A., Kawahata, H., Kubilay, N., La Roche, J., Liss, P. S., Mahowald, N., Prospero, J. M., Ridgwell, A. J., Tegen, I., and Torres, R.: Global iron connections between desert dust, ocean biogeochemistry, and climate, Science, 308, 67–71, https://doi.org/10.1126/science.1105959, 2005.
Johnson, B. T. and Osborne, S. R.: Physical and optical properties of mineral dust aerosol measured by aircraft during the gerbils campaign, Q. J. Roy. Meteor. Soc., 137, 1117–1130, https://doi.org/10.1002/qj.777, 2011.
Jones, A. L., Feldman, D. R., Freidenreich, S., Paynter, D., Ramaswamy, V., Collins, W. D., and Pincus, R.: A New Paradigm for Diagnosing Contributions to Model Aerosol Forcing Error, Geophys. Res. Lett., 44, 12004–12012, https://doi.org/10.1002/2017GL075933, 2017.
Journet, E., Desboeufs, K. V., Caquineau, S., and Colin, J.-L.: Mineralogy as a critical factor of dust iron solubility, Geophys. Res. Lett., 35, L07805, https://doi.org/10.1029/2007GL031589, 2008.
Journet, E., Balkanski, Y., and Harrison, S. P.: A new data set of soil mineralogy for dust-cycle modeling, Atmos. Chem. Phys., 14, 3801–3816, https://doi.org/10.5194/acp-14-3801-2014, 2014.
Kandler, K., Schütz, L., Deutscher, C., Ebert, M., Hofmann, H., Jäckel, S., Jaenicke, R., Knippertz, P., Lieke, K., Massling, A., Petzold, A., Schladitz, A., Weinzierl, B., Wiedensohler, A., Zorn, S., and Weinbruch1, S.: Size distribution, mass concentration, chemical and mineralogical composition and derived optical parameters of the boundary layer aerosol at Tinfou, Morocco, during SAMUM 2006, Tellus B, 61, 32–50, https://doi.org/10.1111/j.1600-0889.2008.00385.x, 2009.
Karydis, V., Kumar, P., Barahona, D., Sokolik, I., and Nenes, A.: On the effect of dust particles on global cloud condensation nuclei and cloud droplet numbers, J. Geophys. Res., 116, D23204, https://doi.org/10.1029/2011JD016283, 2011.
Kim, D., Chin, M., Yu, H., Eck, T. F., Sinyuk, A., Smirnov, A., and Holben, B. N.: Dust optical properties over North Africa and Arabian Peninsula derived from the AERONET dataset, Atmos. Chem. Phys., 11, 10733–10741, https://doi.org/10.5194/acp-11-10733-2011, 2011.
Kim, D. H., Sohn, B. J., Nakajima, T., Takamura, T., Takemura, To., Choi, B. C. and Yoon, S. C.: Aerosol optical properties over east Asia determined from ground-based sky radiation measurements, J. Geophys. Res.-Atmos., 109, D02209, https://doi.org/10.1029/2003jd003387, 2004.
Klaver, A., Formenti, P., Caquineau, S., Chevaillier, S., Ausset, P., Calzolai, G., Osborne, S., Johnson, B., Harrison, M., and Dubovik, O.: Physico-chemical and optical properties of sahelian and saharan mineral dust: In situ measurements during the gerbils campaign, Q. J. Roy. Meteor. Soc., 137, 1193–1210, https://doi.org/10.1002/qj.889, 2011.
Klose, M., Shao, Y., Li, X., Zhang, H., Ishizuka, M., Mikami, M., and Leys, J. F.: Further development of a parameterization for convective turbulent dust emission and evaluation based on field observations, J. Geophys. Res., 119, 10441–10457, https://doi.org/10.1002/2014JD021688, 2014.
Klose, M., et al.: The mineral dust cycle in the Multiscale Online Nonhydrostatic AtmospheRe CHemistry model (MONARCH) Martina, in preparation, 2021.
Kok, J. F.: A scaling theory for the size distribution of emitted dust aerosols suggests climate models underestimate the size of the global dust cycle, P. Natl. Acad. Sci. USA, 108, 1016–1021, https://doi.org/10.1073/pnas.1014798108, 2011.
Kok, J. F., Mahowald, N. M., Fratini, G., Gillies, J. A., Ishizuka, M., Leys, J. F., Mikami, M., Park, M.-S., Park, S.-U., Van Pelt, R. S., and Zobeck, T. M.: An improved dust emission model – Part 1: Model description and comparison against measurements, Atmos. Chem. Phys., 14, 13023–13041, https://doi.org/10.5194/acp-14-13023-2014, 2014a.
Kok, J. F., Albani, S., Mahowald, N. M., and Ward, D. S.: An improved dust emission model – Part 2: Evaluation in the Community Earth System Model, with implications for the use of dust source functions, Atmos. Chem. Phys., 14, 13043–13061, https://doi.org/10.5194/acp-14-13043-2014, 2014b.
Kok, J. F., Ridley, D. A., Zhou, Q., Miller, R. L., Zhao, C., Heald, C. L., Ward, D. S., Albani, S., and Haustein, K.: Smaller desert dust cooling effect estimated from analysis of dust size and abundance, Nat. Geosci., 10, 274–278, https://doi.org/10.1038/ngeo2912, 2017.
Koven, C. and Fung, I.: Inferring dust composition from wavelength-dependent absorption in Aerosol Robotic Network (AERONET) data, J. Geophys. Res., 111, D14205, https://doi.org/10.1029/2005JD006678, 2006.
Krueger, B. J., Grassian, V. H., Cowin, J. P., and Laskin, A.: Heterogeneous chemistry of individual mineral dust particles from different dust source regions: The importance of particle mineralogy, Atmos. Environ., 38, 6253–6261, https://doi.org/10.1016/j.atmosenv.2004.07.010, 2004.
Kumar, R., Barth, M. C., Madronich, S., Naja, M., Carmichael, G. R., Pfister, G. G., Knote, C., Brasseur, G. P., Ojha, N., and Sarangi, T.: Effects of dust aerosols on tropospheric chemistry during a typical pre-monsoon season dust storm in northern India, Atmos. Chem. Phys., 14, 6813–6834, https://doi.org/10.5194/acp-14-6813-2014, 2014.
Lafon, S., Sokolik, I. N., Rajot, J. L., Caquincau, S., and Gaudichet, A.: Characterization of iron oxides in mineral dust aerosols: Implications for light absorption, J. Geophys. Res.-Atmos., 111, D21207, https://doi.org/10.1029/2005JD007016, 2006.
Lamarque, J.-F., Bond, T. C., Eyring, V., Granier, C., Heil, A., Klimont, Z., Lee, D., Liousse, C., Mieville, A., Owen, B., Schultz, M. G., Shindell, D., Smith, S. J., Stehfest, E., Van Aardenne, J., Cooper, O. R., Kainuma, M., Mahowald, N., McConnell, J. R., Naik, V., Riahi, K., and van Vuuren, D. P.: Historical (1850–2000) gridded anthropogenic and biomass burning emissions of reactive gases and aerosols: methodology and application, Atmos. Chem. Phys., 10, 7017–7039, https://doi.org/10.5194/acp-10-7017-2010, 2010.
Lau, K. M., Kim, K. M., Sud, Y. C., and Walker, G. K.: A GCM study of the response of the atmospheric water cycle of West Africa and the Atlantic to Saharan dust radiative forcing, Ann. Geophys., 27, 4023–4037, https://doi.org/10.5194/angeo-27-4023-2009, 2009.
Lauritzen, P. H., Nair, R. D., Herrington, A. R., Callaghan, P., Goldhaber, S., Dennis, J. M., Bacmeister, J. T., Eaton, B. E., Zarzycki, C. M., Taylor, M. A., Ullrich, P. A., Dubos, T., Gettelman, A., Neale, R. B., Dobbins, B., Reed, K. A., Hannay, C., Medeiros, B., Benedict, J. J., and Tribbia, J. J.: NCAR Release of CAM-SE in CESM2.0: A Reformulation of the Spectral Element Dynamical Core in Dry-Mass Vertical Coordinates With Comprehensive Treatment of Condensates and Energy, J. Adv. Model. Earth Sy., 10, 1537–1570, https://doi.org/10.1029/2017MS001257, 2018.
Letelier, R. M., Björkman, K. M., Church, M. J., Hamilton, D. S., Mahowald, N. M., Scanza, R. A., Schneider, N., White, A. E., and Karl, D. M.: Climate-driven oscillation of phosphorus and iron limitation in the North Pacific Subtropical Gyre, P. Natl. Acad. Sci. USA, 116, 12720–12728, https://doi.org/10.1073/pnas.1900789116, 2019.
Li, F., Vogelman, A., and Ramanathan, V.: Saharan dust aerosol radiative forcing measured from space, J. Climate, 17, 2558–2571, 2004.
Li, L. and Sokolik, I. N.: The Dust Direct Radiative Impact and Its Sensitivity to the Land Surface State and Key Minerals in the WRF-Chem-DuMo Model: A Case Study of Dust Storms in Central Asia, J. Geophys. Res.-Atmos., 123, 4564–4582, https://doi.org/10.1029/2017JD027667, 2018.
Li, L., Mahowald, N. M. and Al, E.: Evaluation of the modeled dust cycle in the Community Atmosphere Model (version 6), in preparation, 2021a.
Li, L., Mahowald, N. M., Miller, R. L., Pérez García-Pando, C., Klose, M., Hamilton, D. S., Gonçalves Ageitos, M., Ginoux, P., Balkanski, Y., Green, R. O., Kalashnikova, O., Kok, J. F., Obiso, V., Paynter, D., and Thompson, D. R.: Atmospheric mean mineral aerosol abundance and direct radiative effect by dust for models and cases described in Li et al. (2021), Cornell eCommons, https://doi.org/10.7298/wedj-jv65, 2021b.
Li, W. J. and Shao, L. Y.: Observation of nitrate coatings on atmospheric mineral dust particles, Atmos. Chem. Phys., 9, 1863–1871, https://doi.org/10.5194/acp-9-1863-2009, 2009.
Liao, H. and Seinfeld, J. H.: Radiative forcing by mineral dust aerosols: sensitivity to key variables, J. Geophys. Res., 103, 31637–31645, 1998.
Liu, X., Easter, R. C., Ghan, S. J., Zaveri, R., Rasch, P., Shi, X., Lamarque, J.-F., Gettelman, A., Morrison, H., Vitt, F., Conley, A., Park, S., Neale, R., Hannay, C., Ekman, A. M. L., Hess, P., Mahowald, N., Collins, W., Iacono, M. J., Bretherton, C. S., Flanner, M. G., and Mitchell, D.: Toward a minimal representation of aerosols in climate models: description and evaluation in the Community Atmosphere Model CAM5, Geosci. Model Dev., 5, 709–739, https://doi.org/10.5194/gmd-5-709-2012, 2012.
Liu, X., Ma, P.-L., Wang, H., Tilmes, S., Singh, B., Easter, R. C., Ghan, S. J., and Rasch, P. J.: Description and evaluation of a new four-mode version of the Modal Aerosol Module (MAM4) within version 5.3 of the Community Atmosphere Model, Geosci. Model Dev., 9, 505–522, https://doi.org/10.5194/gmd-9-505-2016, 2016.
Loeb, N. G. and Su, W.: Direct aerosol radiative forcing uncertainty based on a radiative perturbation analysis, J. Climate, 23, 5288–5293, https://doi.org/10.1175/2010JCLI3543.1, 2010.
Mahowald, N., Luo, C., del Corral, J., and Zender, C. S.: Interannual variability in atmospheric mineral aerosols from a 22-year model simulation and observational data, J. Geophys. Res.-Atmos., 108, 4352, https://doi.org/10.1029/2002JD002821, 2003.
Mahowald, N., Lindsay, K., Rothenberg, D., Doney, S. C., Moore, J. K., Thornton, P., Randerson, J. T., and Jones, C. D.: Desert dust and anthropogenic aerosol interactions in the Community Climate System Model coupled-carbon-climate model, Biogeosciences, 8, 387–414, https://doi.org/10.5194/bg-8-387-2011, 2011.
Mahowald, N., Albani, S., Kok, J. F., Engelstaeder, S., Scanza, R., Ward, D. S., and Flanner, M. G.: The size distribution of desert dust aerosols and its impact on the Earth system, Aeolian Res., 15, 53–71, https://doi.org/10.1016/j.aeolia.2013.09.002, 2014.
Mahowald, N. M. and Kiehl, L. M.: Mineral aerosol and cloud interactiocns, Geophys. Res. Lett., 30, 1475, https://doi.org/10.1029/2002GL016762, 2003.
Mahowald, N. M., Baker, A. R., Bergametti, G., Brooks, N., Duce, R. A., Jickells, T. D., Kubilay, N., Prospero, J. M., and Tegen, I.: Atmospheric global dust cycle and iron inputs to the ocean, Global Biogeochem. Cy., 19, GB4025, https://doi.org/10.1029/2004GB002402, 2005.
Mahowald, N. M., Muhs, D., Levis, S., Rasch, P. J., Yoshioka, M., Zender, C. S., Muhs, D. R., Levis, S., Rasch, P. J., Yoshioka, M., Zender, C. S., and Luo, C.: Change in atmospheric mineral aerosols in response to climate: last glacial period, pre-industrial, modern and doubled-carbon dioxide climates, J. Geophys. Res., 111, D10202, https://doi.org/10.1029/2005JD006653, 2006.
Mahowald, N. M., Scanza, R., Brahney, J., Goodale, C. L., Hess, P. G., Moore, J. K., and Neff, J.: Aerosol Deposition Impacts on Land and Ocean Carbon Cycles, Current Climate Change Reports, 3, 16–31, https://doi.org/10.1007/s40641-017-0056-z, 2017.
Marticorena, B. and Bergametti, G.: Modeling the atmospheric dust cycle: 1. Design of a soil-derived dust emission scheme, J. Geophys. Res., 100, 16415–16430, 1995.
Martin, R., Jacob, D., Yantosca, R., Chin, M., and Ginoux, P.: Global and regional decreases in tropospheric oxidats from photochemical effects of aerosols, J. Geophys. Res., 108, 4097, https://doi.org/10.1029/2002JD002622, 2003.
Meng, Z. and Lu, B.: Dust events as a risk factor for daily hospitalization for respiratory and cardiovascular diseases in Minqin, China, Atmos. Environ., 41, 7048–7058, https://doi.org/10.1016/j.atmosenv.2007.05.006, 2007.
Meng, Z., Yang, P., Kattawar, G. W., Bi, L., Liou, K. N., and Laszlo, I.: Single-scattering properties of tri-axial ellipsoidal mineral dust aerosols: A database for application to radiative transfer calculations, J. Aerosol Sci., 41, 501–512, https://doi.org/10.1016/j.jaerosci.2010.02.008, 2010.
Meskhidze, N., Chameides, W. L., Nenes, A., and Chen, G.: Iron mobilization in mineral dust: Can anthropogenic SO2 emissions affect ocean productivity?, Geophys. Res. Lett., 30, 2085, https://doi.org/10.1029/2003GL018035, 2003.
Miller, R. L. and Tegen, I.: Climate Response to Soil Dust Aerosols, J. Climate, 11, 3247–3267, 1998.
Miller, R. L. and Tegen, I.: Radiative Forcing of a Tropical Direct Circulation by Soil Dust Aerosols, J. Atmos. Sci., 56, 2403–2433, 1999.
Miller, R. L., Cakmur, R., Perlwitz, J., Geogdzhayev, I., Ginoux, P., Kohfeld, K., Koch, D., Prigent, C., Ruedy, R., Schmidt, G., and Tegen, I.: Mineral dust aerosols in the NASA Goddard Institute of Space Sciences ModelE Atmospheric General Circulation Model, J. Geophys. Res., 111, D06208, https://doi.org/10.1029/2005JD005796, 2006.
Miller, R. L., Knippertz, P., Pérez García-Pando, C., Perlwitz, J. P., and Tegen, I.: Impact of dust radiative forcing upon climate, in: Mineral Dust: A Key Player in the Earth System, edited by: Knippertz, P. and Stuut, J. B. W., Springer, Dordrecht, the Netherlands, 327–357, 2014.
Moosmüller, H., Engelbrecht, J. P., Skiba, M., Frey, G., Chakrabarty, R. K., and Arnott, W. P.: Single scattering albedo of fine mineral dust aerosols controlled by iron concentration, J. Geophs. Res., 2006, 2004–2008, https://doi.org/10.1029/2011JD016909, 2012.
Morrison, H. and Gettelman, A.: A New Two-moment bulk stratiform cloud microhpysics scheme in the Community Atmosphere Model, Version 3 (CAM3): Part I: Description and Numerical Tests, J. Climate, 21, 3642–3659, 2008.
Neale, R., Richter, J., Park, S., Lauritzen, P., Vavrus, S., Rasch, P., and Zhang, M.: The mean climate of the Community Atmosphere Model (CAM4) in forced SST and fully copled experiments, J. Climate, 26, 5150–5168, https://doi.org/10.1175/JCLI-D-12-00236.1, 2013.
Nenes, A., Murray, B., and Bougiatioti, A.: Mineral Dust and its Microphysical Interactions with Clouds, in: Mineral Dust: A Key player in the Earth System, edited by: Knippertz, P. and Stuut, J. B. W., Springer, Dordrecht, the Netherlands, 287–325, 2014.
Nickovic, S., Vukovic, A., Vujadinovic, M., Djurdjevic, V., and Pejanovic, G.: Technical Note: High-resolution mineralogical database of dust-productive soils for atmospheric dust modeling, Atmos. Chem. Phys., 12, 845–855, https://doi.org/10.5194/acp-12-845-2012, 2012.
Okin, G. S., Mahowald, N., Chadwick, O. A., and Artaxo, P.: Impact of desert dust on the biogeochemistry of phosphorus in terrestrial ecosystems, Global Biogeochem. Cy., 18, GB2005, https://doi.org/10.1029/2003GB002145, 2004.
Patadia, F., Yang, E.-S., and Christopher, S.: Does dust change the clear sky top of atmosphere shortwave flux over high surface reflectance regions?, Geophys. Res. Lett., 36, L15825, https://doi.org/10.1029/2009GL039092, 2009.
Pérez, C., Nickovic, S., Pejanovic, G., Baldasano, J. M., and Özsoy, E.: Interactive dust-radiation modeling: A step to improve weather forecasts, J. Geophys. Res.-Atmos., 111, D16206, https://doi.org/10.1029/2005JD006717, 2006.
Pérez, C., Haustein, K., Janjic, Z., Jorba, O., Huneeus, N., Baldasano, J. M., Black, T., Basart, S., Nickovic, S., Miller, R. L., Perlwitz, J. P., Schulz, M., and Thomson, M.: Atmospheric dust modeling from meso to global scales with the online NMMB/BSC-Dust model – Part 1: Model description, annual simulations and evaluation, Atmos. Chem. Phys., 11, 13001–13027, https://doi.org/10.5194/acp-11-13001-2011, 2011.
Pérez García-Pando, C., Stanton, M. C., Diggle, P. J., Trzaska, S., and Miller, R. L.: Soil Dust Aerosols and Wind as Predictors of Seasonal Meningitis Incidence, Environ. Health Persp., 122, 679–686, 2014.
Pérez García-Pando, C., Miller, R. L., Perlwitz, J. P., Rodríguez, S., and Prospero, J. M.: Predicting the mineral composition of dust aerosols: Insights from elemental composition measured at the Izaña Observatory, Geophys. Res. Lett., 43, 10520–10529, https://doi.org/10.1002/2016GL069873, 2016.
Perlwitz, J., Tegen, I. and Miller, R.: Interactive soil dust aerosol model in the GISS GCM 1. Sensitivity of the soil dust cycle to radiative properties of soil dust aerosols, J. Geophys. Res., 106(D16), 18,118-167,192, 2001.
Perlwitz, J. P., Pérez García-Pando, C., and Miller, R. L.: Predicting the mineral composition of dust aerosols – Part 1: Representing key processes, Atmos. Chem. Phys., 15, 11593–11627, https://doi.org/10.5194/acp-15-11593-2015, 2015a.
Perlwitz, J. P., Pérez García-Pando, C., and Miller, R. L.: Predicting the mineral composition of dust aerosols – Part 2: Model evaluation and identification of key processes with observations, Atmos. Chem. Phys., 15, 11629–11652, https://doi.org/10.5194/acp-15-11629-2015, 2015b.
Ridley, D. A., Heald, C. L., Kok, J. F., and Zhao, C.: An observationally constrained estimate of global dust aerosol optical depth, Atmos. Chem. Phys., 16, 15097–15117, https://doi.org/10.5194/acp-16-15097-2016, 2016.
Rosenfeld, D., Rudich, Y., and Lahav, R.: Desert dust suppressing precipitation: a possible desertification feedback loop, P. Natl. Acad. Sci. USA, 98, 5975–5980, 2001.
Ryder, C. L., Highwood, E. J., Rosenberg, P. D., Trembath, J., Brooke, J. K., Bart, M., Dean, A., Crosier, J., Dorsey, J., Brindley, H., Banks, J., Marsham, J. H., McQuaid, J. B., Sodemann, H., and Washington, R.: Optical properties of Saharan dust aerosol and contribution from the coarse mode as measured during the Fennec 2011 aircraft campaign, Atmos. Chem. Phys., 13, 303–325, https://doi.org/10.5194/acp-13-303-2013, 2013.
Ryder, C. L., Highwood, E. J., Walser, A., Seibert, P., Philipp, A., and Weinzierl, B.: Coarse and giant particles are ubiquitous in Saharan dust export regions and are radiatively significant over the Sahara, Atmos. Chem. Phys., 19, 15353–15376, https://doi.org/10.5194/acp-19-15353-2019, 2019.
Samset, B. H., Stjern, C. W., Andrews, E., Kahn, R. A., Myhre, G., Schulz, M., and Schuster, G. L.: Aerosol Absorption: Progress Towards Global and Regional Constraints, Current Climate Change Reports, 4, 65–83, https://doi.org/10.1007/s40641-018-0091-4, 2018.
Scanza, R. A., Mahowald, N., Ghan, S., Zender, C. S., Kok, J. F., Liu, X., Zhang, Y., and Albani, S.: Modeling dust as component minerals in the Community Atmosphere Model: development of framework and impact on radiative forcing, Atmos. Chem. Phys., 15, 537–561, https://doi.org/10.5194/acp-15-537-2015, 2015.
Schmidt, G. A., Kelley, M., Nazarenko, L., Ruedy, R., Russell, G. L., Aleinov, I., Bauer, M., Bauer, S. E., Bhat, M. K., Bleck, R., Canuto, V., Chen, Y., Cheng, Y., Clune, T. L., Genio, A. Del, Fainchtein, R. De, Faluvegi, G., Hansen, J. E., Healy, R. J., Kiang, N. Y., Koch, D., Lacis, A. A., Legrande, A. N., Lerner, J., Lo, K. K., Matthews, E. E., Menon, S., Miller, R. L., Oinas, V., and Oloso, A. O.: Journal of Advances in Modeling Earth Systems contributions to the CMIP5 archive, J. Adv. Model. Earth Syst., 6, 141–184, https://doi.org/10.1002/2013MS000265, 2014.
Schroth, A. W., Crusius, J., Sholkovitz, E. R., and Bostick, B. C.: Iron solubility driven by speciation in dust sources to the ocean, Nat. Geosci., 2, 337–340, https://doi.org/10.1038/ngeo501, 2009.
Shao, Y.: A model for mineral dust emission. J. Geophys. Res.-Atmos., 106, 20239–20254, https://doi.org/10.1029/2001JD900171, 2001.
Shao, Y.: Simplification of a dust emission scheme and comparison with data, J. Geophys. Res., 109, D10202, https://doi.org/10.1029/2003JD004372, 2004.
Shao, Y., Wyrwoll, K.-H., Chappel, A., Huang, J., Lin, Z., McTainsh, G., Mikami, M., Tanaka, T., Wang, X., and Yoon, S.: Dust cycle: an emerging core theme in earth system science, Aeolian Res., 2, 181–204, 2011.
Shindell, D. T., Lamarque, J.-F., Schulz, M., Flanner, M., Jiao, C., Chin, M., Young, P. J., Lee, Y. H., Rotstayn, L., Mahowald, N., Milly, G., Faluvegi, G., Balkanski, Y., Collins, W. J., Conley, A. J., Dalsoren, S., Easter, R., Ghan, S., Horowitz, L., Liu, X., Myhre, G., Nagashima, T., Naik, V., Rumbold, S. T., Skeie, R., Sudo, K., Szopa, S., Takemura, T., Voulgarakis, A., Yoon, J.-H., and Lo, F.: Radiative forcing in the ACCMIP historical and future climate simulations, Atmos. Chem. Phys., 13, 2939–2974, https://doi.org/10.5194/acp-13-2939-2013, 2013.
Sicard, M., Bertolín, S., Mallet, M., Dubuisson, P., and Comerón, A.: Estimation of mineral dust long-wave radiative forcing: sensitivity study to particle properties and application to real cases in the region of Barcelona, Atmos. Chem. Phys., 14, 9213–9231, https://doi.org/10.5194/acp-14-9213-2014, 2014.
Smith, M. B., Mahowald, N. M., Albani, S., Perry, A., Losno, R., Qu, Z., Marticorena, B., Ridley, D. A., and Heald, C. L.: Sensitivity of the interannual variability of mineral aerosol simulations to meteorological forcing dataset, Atmos. Chem. Phys., 17, 3253–3278, https://doi.org/10.5194/acp-17-3253-2017, 2017.
Sokolik, I. N. and Toon, O. B.: Direct radiative forcing by anthropogenic airborne mineral aerosols, Nature, 381, 681–683, 1996.
Sokolik, I. N. and Toon, O. B.: Incorporation of mineralogical composition into models of the radiative properties of mineral aerosol form UV to IR wavelengths, J. Geophys. Res., 104, 9423–9444, 1999.
Sokolik, I. N., Andronova, A., and Johnson, T. C.: Complex refractive index of atmospheric dust aerosols, Atmos. Environ. A-Gen., 27, 2495–2502, https://doi.org/10.1016/0960-1686(93)90021-P, 1993.
Sokolik, I. N., Toon, O. B., and Bergstrom, R. W.: Modeling the radiative characteristics of airborne mineral aerosols at infrared wavelengths, J. Geophys. Res., 103, 8813–8826, 1998.
Solmon, F., Mallet, M., Elguindi, N., Giorgi, F., Zakey, A., and Konaré, A.: Dust aerosol impact on regional precipitation over western Africa, mechanisms and sensitivity to absorption properties, Geophys. Res. Lett., 35, L24705, https://doi.org/10.1029/2008GL035900, 2008.
Sullivan, R. C., Guazzotti, S. A., Sodeman, D. A., and Prather, K. A.: Direct observations of the atmospheric processing of Asian mineral dust, Atmos. Chem. Phys., 7, 1213–1236, https://doi.org/10.5194/acp-7-1213-2007, 2007.
Swap, R., Garstang, M., Greco, S., Talbot, R., and Kallberg, P.: Saharan dust in the Amazon Basin, Tellus, 44, 133–149, 1992.
Taylor, K. E., Wiliamson, D., and Zwiers, F.: The sea surface temperature and sea-ice concentration boundary conditions for AMIP II simulations, in Program for Climate Model Diagnosis and Intercomparison, Lawrence Livermore National Laboratory, University of California, 2000.
Tegen, I. and Fung, I.: Modeling of mineral dust in the atmosphere: Sources, transport, and optical thickness, J. Geophys. Res., 99, 22897–22914, 1994.
Tobo, Y., Zhang, D., Matsuki, A., and Iwasaka, Y.: Asian dust particles converted into aqueous droplets under remote marine atmospheric conditions, P. Natl. Acad. Sci. USA, 107, 17905–17910, https://doi.org/10.1073/pnas.1008235107, 2010.
Volz, F. E.: Infrared Optical Constants of Ammonium Sulfate, Sahara Dust, Volcanic Pumice, and Flyash, Appl. Optics, 12, 564, https://doi.org/10.1364/ao.12.000564, 1973.
Wiscombe, W. J.: Improved Mie scattering algorithms, Appl. Optics, 19, 1505–1509, https://doi.org/10.1364/ao.19.001505, 1980.
Yoshioka, M., Mahowald, N. M., Conley, A. J., Collins, W. D., Fillmore, D. W., Zender, C. S., and Coleman, D. B.: Impact of desert dust radiative forcing on sahel precipitation: Relative importance of dust compared to sea surface temperature variations, vegetation changes, and greenhouse gas warming, J. Climate, 20, 1445–1467, https://doi.org/10.1175/JCLI4056.1, 2007.
Zender, C., Bian, H., and Newman, D.: Mineral Dust Entrainment and Deposition (DEAD) model: Description and 1990's dust climatology, J. Geophys. Res., 108, 4416, https://doi.org/10.1029/2002JD002775, 2003.
Zhang, J. and Christopher, S.: Long wave radiative forcing of Saharan dust aerosols estimated from MODIS, MISR and CERES observations on TERRA, Geophys. Res. Lett., 30, 2188, https://doi.org/10.1029/2003GL018479, 2003.
Zhang, X. L., Wu, G. J., Zhang, C. L., Xu, T. L., and Zhou, Q. Q.: What is the real role of iron oxides in the optical properties of dust aerosols?, Atmos. Chem. Phys., 15, 12159–12177, https://doi.org/10.5194/acp-15-12159-2015, 2015.
Zhang, Y., Mahowald, N., Scanza, R. A., Journet, E., Desboeufs, K., Albani, S., Kok, J. F., Zhuang, G., Chen, Y., Cohen, D. D., Paytan, A., Patey, M. D., Achterberg, E. P., Engelbrecht, J. P., and Fomba, K. W.: Modeling the global emission, transport and deposition of trace elements associated with mineral dust, Biogeosciences, 12, 5771–5792, https://doi.org/10.5194/bg-12-5771-2015, 2015.