the Creative Commons Attribution 4.0 License.
the Creative Commons Attribution 4.0 License.
 | 15 Mar 2021
Long-term multi-source data analysis about the characteristics of aerosol optical properties and types over Australia
Xingchuan Yang
Yikun Yang
The spatiotemporal distributions of aerosol optical properties and major aerosol types, along with the vertical distribution of major aerosol types over Australia, are investigated based on multi-year Aerosol Robotic Network (AERONET) observations at nine sites, the Moderate Resolution Imaging Spectroradiometer (MODIS), Modern-Era Retrospective analysis for Research and Applications, Version 2 (MERRA-2), Cloud-Aerosol Lidar with Orthogonal Polarization (CALIOP), and back-trajectory analysis from the Hybrid Single-Particle Lagrangian Integrated Trajectory (HYSPLIT). During the observation period from 2001–2020, the annual aerosol optical depth (AOD) at most sites showed increasing trends (0.002–0.029 yr−1), except for that at three sites, Canberra, Jabiru, and Lake Argyle, which showed decreasing trends (−0.004 to −0.014 yr−1). In contrast, the annual Ångström exponent (AE) showed decreasing tendencies at most sites (−0.045 to −0.005 yr−1). The results showed strong seasonal variations in AOD, with high values in the austral spring and summer and relatively low values in the austral fall and winter, and weak seasonal variations in AE, with the highest mean values in the austral spring at most sites. Monthly average AOD increases from August to December or the following January and decreases during March–July. Spatially, the MODIS AOD showed obvious spatial heterogeneity, with high values appearing over the Australian tropical savanna regions, Lake Eyre Basin, and southeastern regions of Australia, while low values appeared over the arid regions in western Australia. MERRA-2 showed that carbonaceous aerosol over northern Australia, dust over central Australia, sulfate over densely populated northwestern and southeastern Australia, and sea salt over Australian coastal regions are the major types of atmospheric aerosols. The nine ground-based AERONET sites over Australia showed that the mixed type of aerosols (biomass burning and dust) is dominant in all seasons. Moreover, Cloud-Aerosol Lidar and Infrared Pathfinder Satellite Observations (CALIPSO) showed that polluted dust is the dominant aerosol type detected at heights 0.5–5 km over the Australian continent during all seasons. The results suggested that Australian aerosol has similar source characteristics due to the regional transport over Australia, especially for biomass burning and dust aerosols. However, the dust-prone characteristic of aerosol is more prominent over central Australia, while the biomass-burning-prone characteristic of aerosol is more prominent in northern Australia.
- Article
(12992 KB) - Full-text XML
-
Supplement
(1121 KB) - BibTeX
- EndNote


Aerosols play a crucial role in the Earth's radiation budget and climate change, both through direct interaction with the solar radiation and through indirectly modifying the optical properties and lifespan of clouds (Albrecht, 1989; Charlson et al., 1992; Garrett and Zhao, 2006; Ramanathan et al., 2001; Twomey, 1977; Zhao and Garrett, 2015; Zhao et al., 2018). In addition, elevated aerosols degrade air quality and visibility, causing an adverse impact on human health and the environment (Luhar et al., 2008; Pope et al., 2009; Zhao et al., 2019; Yang et al., 2018). Therefore, the influential effects of aerosols at both regional and global scales cannot be ignored.
Australia is situated between the Pacific Ocean and Indian Ocean in the Southern Hemisphere, with 70 % of its land surface occupied by arid and semi-arid regions. Northern Australia is characterized by tropical savanna ecosystems, with dense grasslands and scattered shrubs or trees. Frequent fires that occur during the dry season (typically April–November) each year in this region have released large quantities of biomass burning aerosols into the atmosphere (Radhi et al., 2012; Paton-Walsh et al., 2004). Schultz et al. (2008) reported that Australian fires contribute almost 8.25 % of global carbon emissions. Mitchell et al. (2013) demonstrated that Australia is a globally significant source of biomass burning aerosol from savanna burning. To the south of the savanna are huge desert regions (including Great Victoria, Simpson, Gibson, and Sturt deserts) and agricultural lands that have been under the control of prolonged drought, which makes Australia a dominant dust source in the Southern Hemisphere (Mitchell et al., 2010). Tanaka and Chiba (2006) found that the Australian annual dust emission is about 106 Tg in contrast to 1087 Tg from North Africa and 575 Tg from Asia. Luhar et al. (2008) demonstrated that the mean top of atmosphere (TOA) direct radiative forcing significantly increased during the 2004 burning season. Small et al. (2011) found that cloud fraction initially increased by 25 % with increasing aerosol optical depth, followed by a slow systematic decrease (∼ 18 %) with higher aerosol optical depth. Hence, Australian aerosol constitutes a significant component of the global aerosol budget, with great impacts on regional and global climate and the radiation budget.
There are numerous studies that have focused on aerosol optical properties in Australia. Northern Australia is highly influenced by biomass burning aerosol from wild fires during the dry season (typically April–November), while central Australia is mostly affected by dust aerosol (Yoon et al., 2016; Qin and Mitchell, 2009). Australian aerosol optical depth (AOD) generally increases from the austral winter to spring then decreases from summer to fall (Mitchell et al., 2017). Moreover, Mitchell et al. (2017) reported a long-range coherence in the aerosol cycle over the Australian continent due to the similar source characteristics and intercontinental transport. Many studies found significant decreasing trends in AOD using ground-based or satellite remote-sensing data (e.g., Cloud-Aerosol Lidar and Infrared Pathfinder Satellite Observations (CALIPSO), the Moderate Resolution Imaging Spectroradiometer (MODIS), and Multiangle Imaging SpectroRadiometer (MISR)) over Australia (Mehta et al., 2016, 2018; Yoon et al., 2016). There are also a lot of studies focusing on short-term aerosol properties during environmental events, such as dust storms (Shao et al., 2007) or wildfires (Radhi et al., 2012; Mitchell et al., 2006), and most of these studies are based on a specific site/region. In addition, aerosol properties in Australia have been studied in a number of field campaigns such as the Mildura Aerosol Tropospheric Experiment (MATE 98) (Rosen et al., 2000), the Biomass Burning and Lightning Experiment Phase B (BIBLE-B) campaign (Takegawa et al., 2003), the Savannah Fires in the Early Dry Season (SAFIRED) campaign (Mallet et al., 2017), and the Measurements of Urban, Marine and Biogenic Air (MUMBA) campaign (Paton-Walsh et al., 2017). In previous studies, the fire season has often been the focus study period due to the significant impacts of biomass burning aerosol. Meanwhile, most previous studies have focused on aerosol properties at a specific site/region or short-term variations of aerosols due to the difficulty of obtaining ground-based aerosol data (Mitchell et al., 2010; Bouya and Box, 2011). However, it is essential to characterize the national-scale and long-term aerosol optical properties, which could provide a better understanding of the aerosol characteristics and their impacts on climate over Australia.
Ground-based observations can provide more accurate data to estimate aerosol properties, while the remote-sensing technique provides a better understanding of aerosol properties at a large scale. In this study, multi-year aerosol optical properties obtained from nine ground-based sun photometers, along with the MODIS AOD product over Australia, are analyzed to investigate the long-term spatiotemporal variations of aerosol optical properties over the Australian continent. In addition, the MERRA-2 AOD product and CALIPSO aerosol profile data are used to characterize the spatiotemporal and vertical variations of aerosol properties in the atmosphere over Australia, respectively.
The paper is organized as follows. Section 2 describes the AERONET (Aerosol Robotic Network) sites, data, and methods. Section 3 illustrates the spatiotemporal variations in aerosol properties and the classification of aerosol types and their seasonal distributions and discusses the seasonal variations of aerosol vertical distributions in Australia. Section 4 summarizes the findings of the study.
2.1 Sites
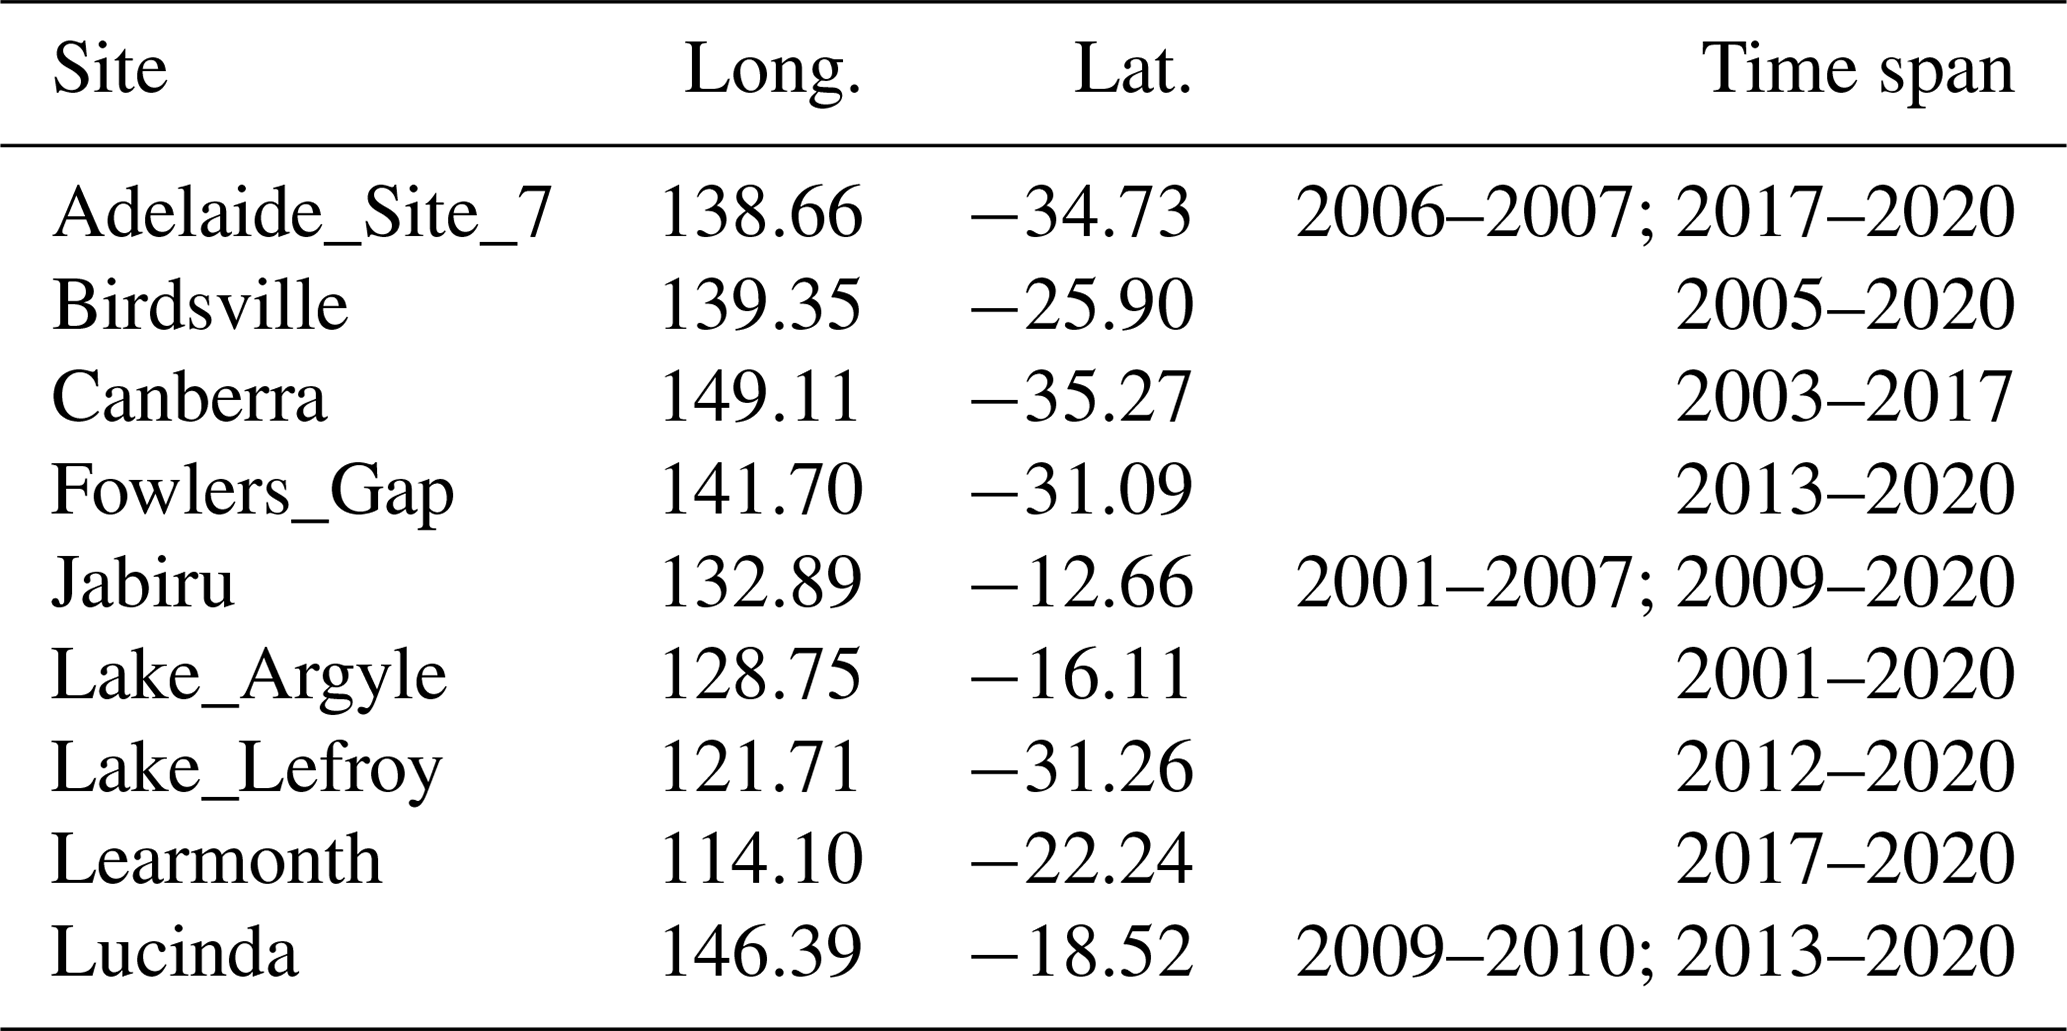
Australia is located in Oceania between the Indian Ocean and South Pacific. Australia's topography is not too varied, most of it being desert plateau (Fig. 1a). Western Australia is covered by great deserts and large plains, with scattered shrubs and grasses. Central Australia is covered by the Central Lowlands, including the Great Artesian Basin (GAB). Eastern Australia is mainly composed of fertile plains along the eastern coast and the eastern highlands with dense trees and grasses (Fig. 1b). Northern Australia is covered by tropical savanna, with dense grasses, scattered trees, and grassy woodlands (Mitchell et al., 2013). In this study, nine AERONET sites in Australia were used for analysis. Table 1 shows the site locations and the available observation data period at each site. Lake Argyle and Jabiru are located in northern Australia, where biomass burning is a significant source of aerosols during the dry season. The Learmonth site is located on the west coast of Australia and is situated on the northwestern dust pathway from the Australian interior. Lake Lefory is located in the southwest of Australia and next to the Great Victoria Desert. Birdsville and Fowlers Gap are located in central Australia, exactly where the dust transport path is. Lucinda and Adelaide Site 7 are located on the eastern and southern coast of Australia, respectively. The Canberra site is located at the top of a hill in southeastern Australia. Note that the time periods for which data are available are different among these sites.
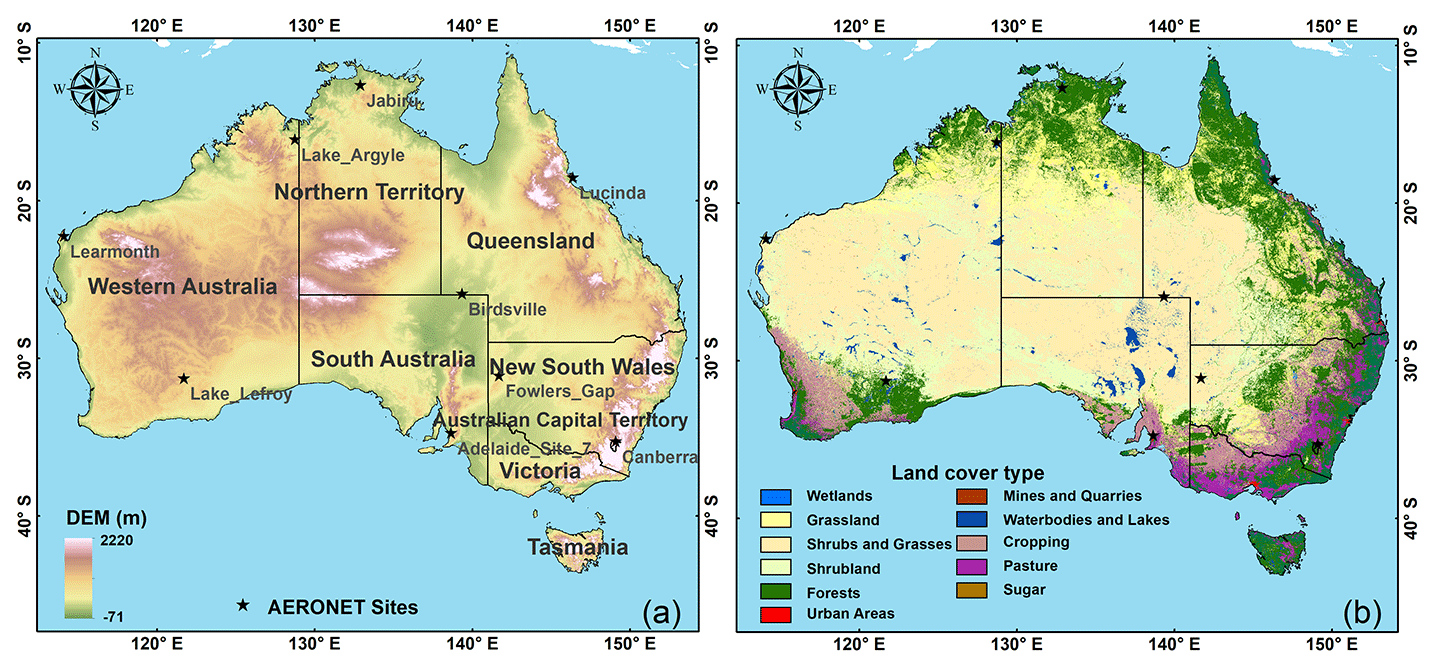
Figure 1Terrain elevation of Australia and the nine AERONET sites used are indicated by a black star (a). Land cover type in 2015 of Australia using the Dynamic Land Cover Dataset (DLCD) Version 2.1 dataset (b). Note that the Australian DEM data are provided by the Australian public data website (https://data.gov.au/data/, last access: 31 January 2021). The Dynamic Land Cover Dataset (DLCD) is provided by Geoscience Australia (http://www.ga.gov.au/scientific-topics/earth-obs/accessing-satellite-imagery/landcover, last access: 31 January 2021).
2.2 Data
2.2.1 AERONET data
The AERONET is a ground-based remote-sensing aerosol network which measures direct solar and diffuse sky radiance in the spectral range of 0.34–1.02 mm (Holben et al., 1998). AERONET provides high-quality measurements of aerosol optical, microphysical, and radiative properties every 15 min. The uncertainty of the AOD from AERONET is approximately 0.01–0.02 (Eck et al., 1999). In this study, level 2.0 quality-controlled and cloud-screened data of AOD, Ångström exponent (AE), and single scattering albedo (SSA) are adopted. Because the AERONET quality assurance level of 2.0 is not available during 2019–2020 at a few sites, level 1.5 data are used from 2019–2020 for those sites instead. A sensitivity analysis showed that the use of level 1.5 data should not affect the trend analysis since they show similar trends for the period of 2001–2018 when both datasets are available.
2.2.2 MODIS data
The Moderate Resolution Imaging Spectroradiometer (MODIS) instrument is a multispectral sensor with 36 bands between 400 and 1440 nm on board the Aqua and Terra platforms (Remer et al., 2005). MODIS provides two kinds of long-term aerosol products, the Level-2 daily products at 10 and 3 km resolutions and Level-3 daily, 8 d, and monthly products with a 1∘ × 1∘ horizontal resolution. Sayer et al. (2014) showed that the MODIS Deep Blue (DB) algorithm can retrieve ∼ 1.6 times more AODs than the Dark Target (DT) algorithm, with more than 82 % of AOD retrievals falling within the expected error envelopes and with a small root mean squared error (RMSE; 0.07) over Oceania. As the MODIS Terra and Aqua sensors are near to each other, and the same retrieval algorithms are used to generate AODs, the DB algorithm shows very similar performance for the two sensors (Sayer et al.,2013). Therefore, in this study, the data record named “Deep_Blue_Aerosol_ Optical_Depth_550_Land_Best_Estimate” from the Aqua MODIS Collection 6.1 daily AOD product (MYD04_L2) with 10 km spatial resolution from July 2002–May 2020 is used to examine the spatiotemporal variations of aerosol optical properties in Australia.
2.2.3 MERRA-2 data
MERRA-2 is the NASA's newest global atmospheric reanalysis product. It is produced by the Global Modeling and Assimilation Office (GMAO), using the Goddard Earth Observing System (GEOS-5) atmospheric data assimilation system. The global natural and anthropogenic aerosols are simulated in MERRA-2 with the Goddard Chemistry, Aerosol, Radiation and Transport (GOCART) model (Randles et al., 2017). MERRA-2 assimilates aerosol optical depth (AOD) from various ground and remote-sensed platforms, which include direct AOD measurements from AERONET, bias-corrected AOD retrievals from the Advanced Very High Resolution Radiometer (AVHRR) instruments, and AOD retrievals from the MISR and the MODIS over bright surfaces (Buchard et al., 2017). Buchard et al. (2017) demonstrated that MERRA-2 has high reliability in simulating aerosol properties. The monthly MERRA-2 and AERONET AOD showed good agreement, with correlation coefficients (R) between 0.59 and 0.94 at nine sites over Australia (Fig. S1). Moreover, the RMSEs were smaller than 0.05, which indicated that the monthly MERRA-2 AOD products showed good performance over Australia. Therefore, in this study, monthly AODs at 550 nm from MERRA-2 (MERRA2_400.tavgM_2d_aer_Nx) for total aerosols and different aerosol species during the period from July 2002–May 2020 are used to analyze their spatiotemporal variations.
2.2.4 CALIPSO data
The CALIPSO satellite was launched on 28 April 2006. It is a dual-wavelength (532 and 1064 nm) polarization lidar designed to measure the global vertical profile of aerosols and clouds (Winker et al., 2003). CALIPSO provides vertical profiles data of the attenuated backscatter at 532 and 1064 nm and the perpendicular polarization component at 532 nm during both day and night. Omar et al. (2013) investigated the performance of CALIPSO AOD data and found that when cloud-cleared and extinction quality-controlled CALIPSO data were compared with AERONET data with AOD less than 1.0, the mean relative difference between the two measurements was 25 % of AERONET AOD. In addition, they found that the CALIPSO AOD has good correlation (r=0.65) with AERONET AOD at Lake Argyle in northern Australia. In this study, a globally gridded monthly product derived from the CALIPSO Version 4.2 Level 3 aerosol profile product (CAL_LID_L3_Tropospheric_APro_CloudFree-Standard-V4-20) is used to investigate the vertical distributions of different aerosol species in Australia. The data have 208 layers with 60 m vertical resolution for heights up to 12.1 km above mean sea level.
2.2.5 ERA-5 data
ERA-5 is the latest atmospheric reanalysis data developed by the European Centre for Medium-Range Weather Forecasts (ECWMF). ERA-5 has a great improvement in horizontal and vertical resolutions in comparison to ERA-Interim and covers the period from 1979 onward (Albergel et al., 2018). In this study, monthly ERA-5 data, including the u wind, v wind, and precipitation, were obtained from the Copernicus Climate Change Service (C3S).
2.3 Methodology
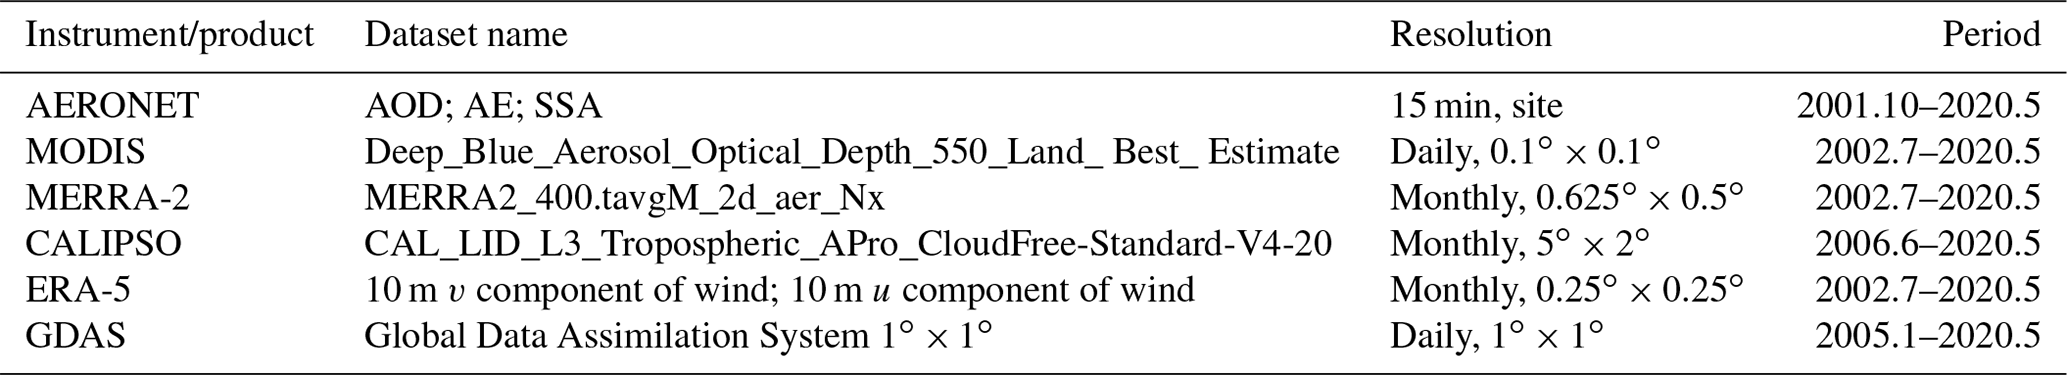
The AERONET observations, including the total, fine-mode, and coarse-mode AOD at 500 nm, AE at 500 and at 440–870 nm, and SSA at 440 mm, and the MODIS AOD products are utilized to examine the spatiotemporal variations of aerosol properties over Australia. MERRA-2 and CALIPSO AOD products are analyzed to present the spatiotemporal and vertical variations of different aerosol species over Australia. Table 2 provides detailed information about the data used in this study. Different aerosol types have diverse optical, physical, and chemical properties, with different impacts on the atmosphere (Charlson et al., 1992). Furthermore, the classification of aerosol can provide a key clue to the leading source of regional aerosols. Two methods from Kaskaoutis et al. (2007) and Giles et al. (2012) are adopted to distinguish aerosol types using the AOD at 500 nm, AE at 440–870 nm, and SSA at 440 nm, which are derived from AERONET, as illustrated in Fig. 2. As a result, five prominent types of aerosols such as biomass burning, clean marine aerosol, urban/industrial aerosol, dust, and mixed-type aerosol can be obtained. Back trajectory analysis is conducted to identify the main transport pathways of air masses. The 72 h back trajectories at an altitude of 500 m above ground level (a.g.l.) are simulated using the Hybrid Single-Particle Lagrangian Integrated Trajectory (HYSPLIT) model (Draxler and Hess, 1998). Moreover, the back trajectories are calculated every 6 h a day at nine AERONET sites during the period 2005–2020. Note that we have employed the TrajStat module from Meteoinfo version 2.4.1 to cluster the back trajectories using the Euclidean distance method (http://meteothink.org/docs/trajstat/index.html, last access: 31 January 2021).
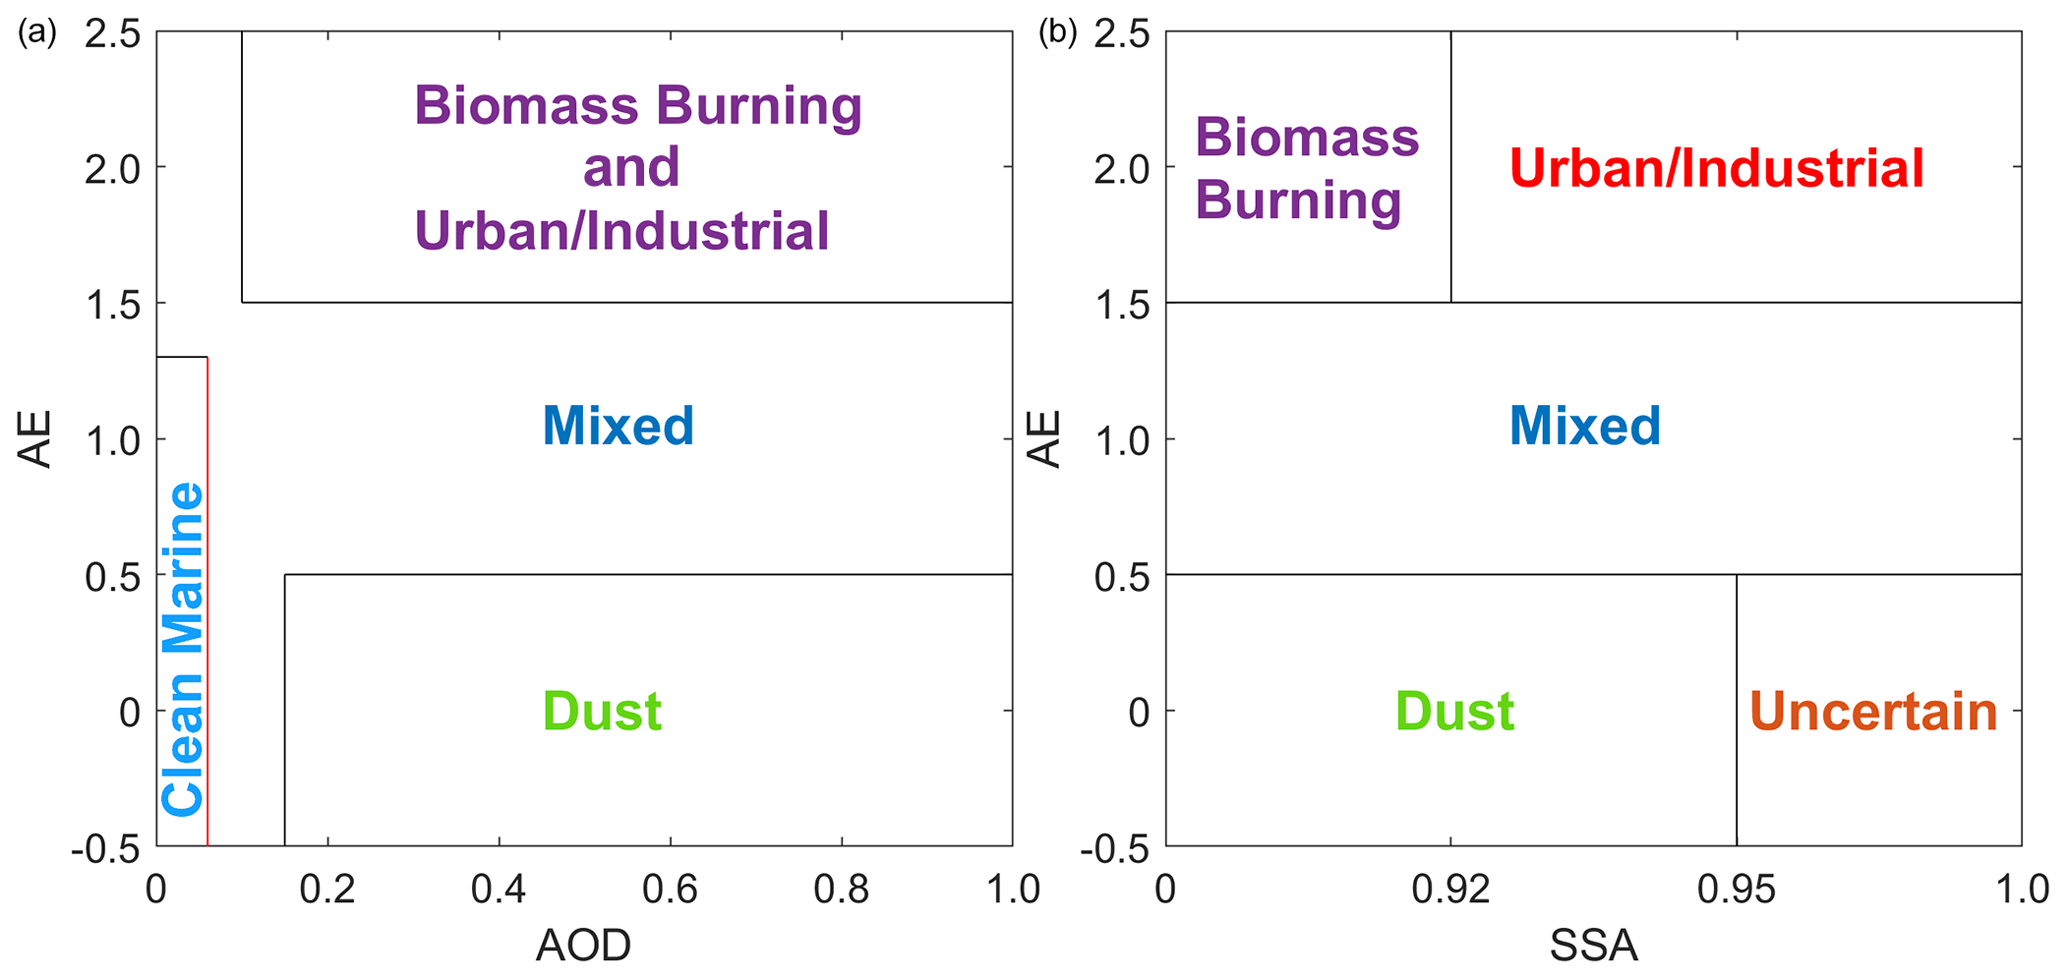
Figure 2Schematic diagrams of the aerosol classifications defined in Kaskaoutis et al. (2007) (a) and Giles et al. (2012) (b).
3.1 Spatiotemporal variation of aerosol optical properties
3.1.1 Long-term variations and trends of aerosol optical properties
The annual variations and linear trends of AOD and AE at the nine sites over Australia are shown in Fig. 3. The annual means of AOD were 0.05–0.15 over Australia, which indicates the generally excellent air quality over Australia. It showed an increasing tendency in the annual mean AOD at most sites in Australia during the observation period from 2001–2020, except for the sites of Canberra, Jabiru, and Lake Argyle, at which the annual mean AOD showed a decreasing trend of −0.004 ± 0.033, −0.002 ± 0.035, −0.004 ± 0.057 yr−1, respectively. There were no statistically significant trends at all sites during the observation period from 2001–2020 except for the sites of Birdsville and Fowlers Gap. The general AOD decrease at sites over northern Australia and the general increase at sites over central Australia are consistent with the findings obtained by Mehta et al. (2016) using the MODIS and MISR AOD dataset during the period 2001–2014 and Mitchell et al. (2010) using site observations over the decade 1997–2007. The decreasing annual trends over northern Australia could be associated with the decreases in black carbon and organic carbon AODs (Yoon et al., 2016). However, increasing AOD trends over central Australia could be mainly attributed to the increase of dust activities (Mitchell et al., 2010). In particular, the highest AOD (0.20) at Canberra was observed in 2003 followed by a decrease to 0.06 in 2004. This was mostly related to the wildfires of southeastern Australia in January 2003, which generated large amounts of smoke aerosols, leading to a maximum in AOD during that observation period (Mitchell et al., 2006). Among the six sites with the increasing trend of AOD, Fowlers Gap had a more evident AOD increasing trend of 0.029 ± 0.060 yr−1 during the period 2013–2020. It is worth mentioning that significant increases of AOD are observed during the period 2019–2020 at most sites, such as Adelaide Site 7, Birdsville, Fowlers Gap, and Lucinda. The increases in AOD were related to the frequent fire activities in Australia from September 2019–January 2020. In addition, optical and physical properties of aerosols during the Australia wildfires in 2019 will be investigated in detail in our future study. The annual means of AE were 0.80–1.30 over Australia. The annual AE showed decreasing trends at most sites during the observation period from 2001–2020 except for Lake Lefory, at which it showed an increasing trend of 0.003 ± 0.217 yr−1. This result indicated that the size of aerosol particles increased at Lake Lefory, while the size of the aerosol decreased at other sites. However, the temporal trends for annual AE did not pass the significance tests at all sites during the observation period from 2001–2020. The annual AODs at Jabiru (0.15) and Lake Argyle (0.13) were higher than those at other sites (0.05–0.10) in Australia. Moreover, the AE values at Jabiru (1.23) and Lake Argyle (1.29) were higher than those at other sites (0.80–1.20) except for Canberra (1.30). This can be explained by the extensive and frequent wildfires over the tropical north of Australia. Moreover, the annual AOD and AE at Jabiru and Lake Argyle presented significant interannual variations in amplitude. Similar results have also been reported by Radhi et al. (2012) and Mitchell et al. (2013). This is likely a consequence of the relatively high rainfall during the wet season and large smoke emissions during the subsequent burning season. The rainfall likely suppressed the smoke emissions due to the high level of moisture in the air, but it also promoted the growth of vegetation, leading to an increase in smoke emissions during the subsequent dry seasons (Mitchell et al., 2013).
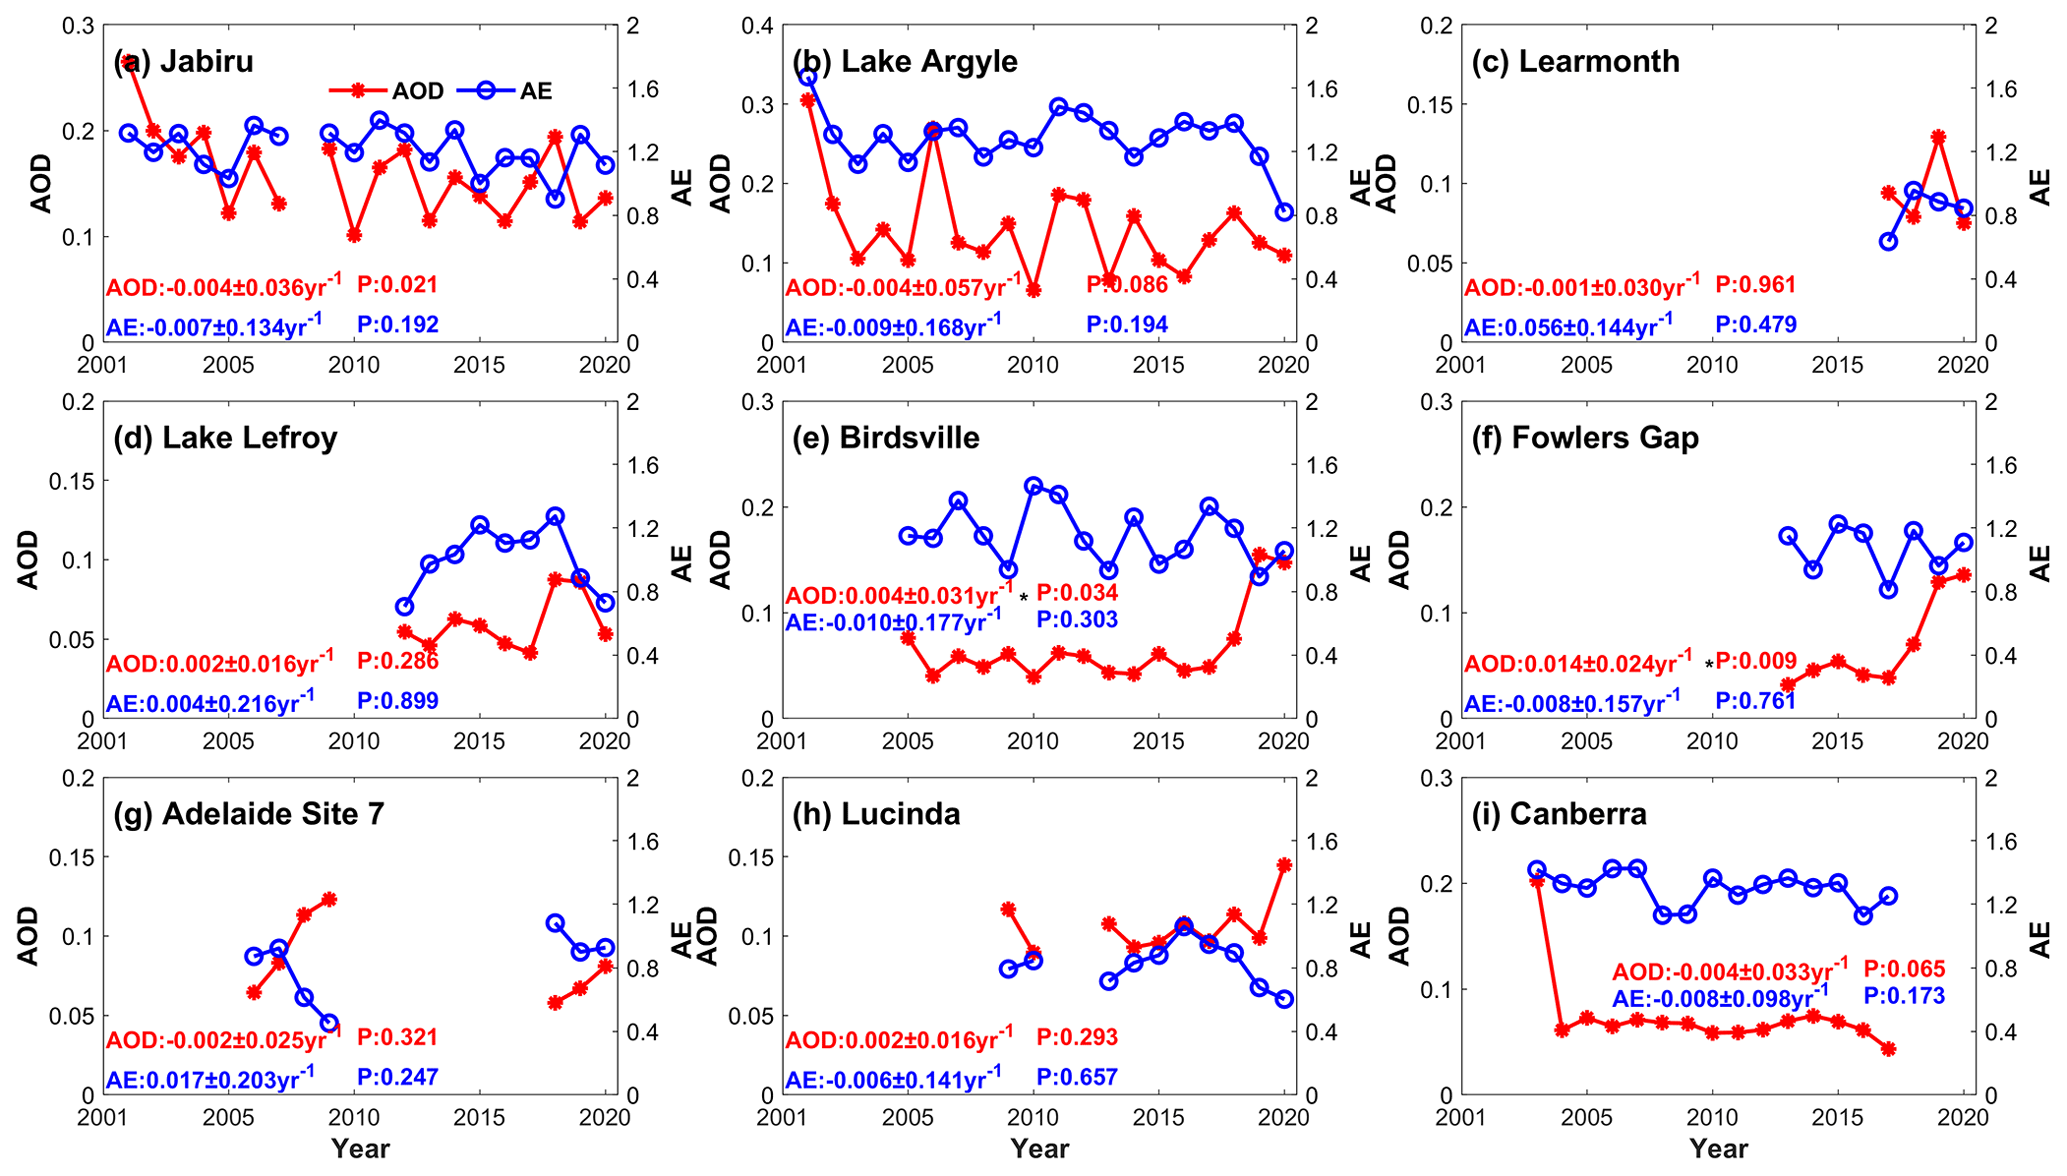
Figure 3Temporal variations of annual mean AOD and AE at nine AERONET sites in Australia. Note that “*” means the confidence test is passed at α=0.05. “P” is the p value.
The spatial distribution of annual averaged (Fig. 4a–s) and multi-year averaged (Fig. 4t) MODIS AODs for the years of 2002–2020 indicates that, overall, the patterns of AOD spatial distributions were similar from 2002–2020. However, the magnitude of the spatial AOD distributions varied to some extent. It is worth mentioning that the years of 2002 and 2020 only covered July to December and January to May due to observation data availability, respectively. Figure 4 shows that the average annual AOD values in central and eastern Australia were higher than that in western Australia. This similar spatial variability of aerosols was also captured in previous studies (Mehta et al., 2016, 2018; Yang et al., 2020). AODs with values smaller than 0.04 were found in the arid zone of western Australia, which is a sparsely populated area with low aerosol emissions. The highest AOD values were found in tropical and subtropical zones with dense grasses or forests, where the average AOD value was greater than 0.1. Furthermore, the AOD was high over the Central Lowlands, with the 19-year averaged AOD ranging from ∼ 0.02 to ∼ 0.14, which was mostly affected by the dust storms. It was clear that the temporal trends in AOD estimated by AERONET and MODIS were generally consistent. Furthermore, the time series of annually averaged MODIS AOD over the Australian continent and eight main administrative regions during the period 2002–2020 are shown in Fig. 5. The time series of the yearly averaged AOD over Australia showed quite a small decreasing trend (−0.0003) during the period 2002–2020, but there were still short-term annual variations. Mehta et al. (2016) also reported a decreasing trend in AOD over Australia from 2006–2016 using CALIPSO data. Although the data for the years 2002 and 2020 were incomplete and cannot represent the statistical characteristics of AOD throughout the year, the significant impact of environmental events (e.g., wildfire, dust storm) on Australian aerosol can be found from 2002–2020. In southeastern Australia, the Australian Capital Territory and Victoria had similar annual variation characteristics in AOD, while New South Wales, Queensland, and South Australia had similar annual variation patterns of AOD. The Northern Territory showed an apparent interannual variability of AOD compared to other states. The AODs in Tasmania and western Australia showed no obvious long-term tendencies and interannual variations with low values (∼ 0.03; ∼ 0.05) in comparison with those in other states. The highest mean AOD (∼ 0.055) over Australia was observed in the year 2002. This was largely attributed to the dust storms in southern and eastern Australia (Mitchell et al., 2010; Chan et al., 2005) and the biomass burning in southeastern Australia (Paton-Walsh et al., 2004), which increased the aerosol loadings over Australia. The interannual variation was small, with a mean AOD of about 0.04 during the period 2003–2008. In particular, high AOD values were observed in the Australian Capital Territory (0.152) and Victoria (0.115) in 2003. This was mostly caused by 2003 wildfires in southeastern Australia, which generated large amounts of smoke aerosols (Mitchell et al., 2006). In 2009, there were extreme dust storms in central Australia (Mukkavilli et al., 2019), which led to a large increase in AOD from 0.038 in 2008 to 0.045 in 2009. The AOD decreased after 2009 with a mean value of about 0.036 during the period 2010–2016, and then increased from 2017–2020. The increasing trend in AOD during the period 2017–2020 may be related to the more frequent wildfire activities during this period in Australia.
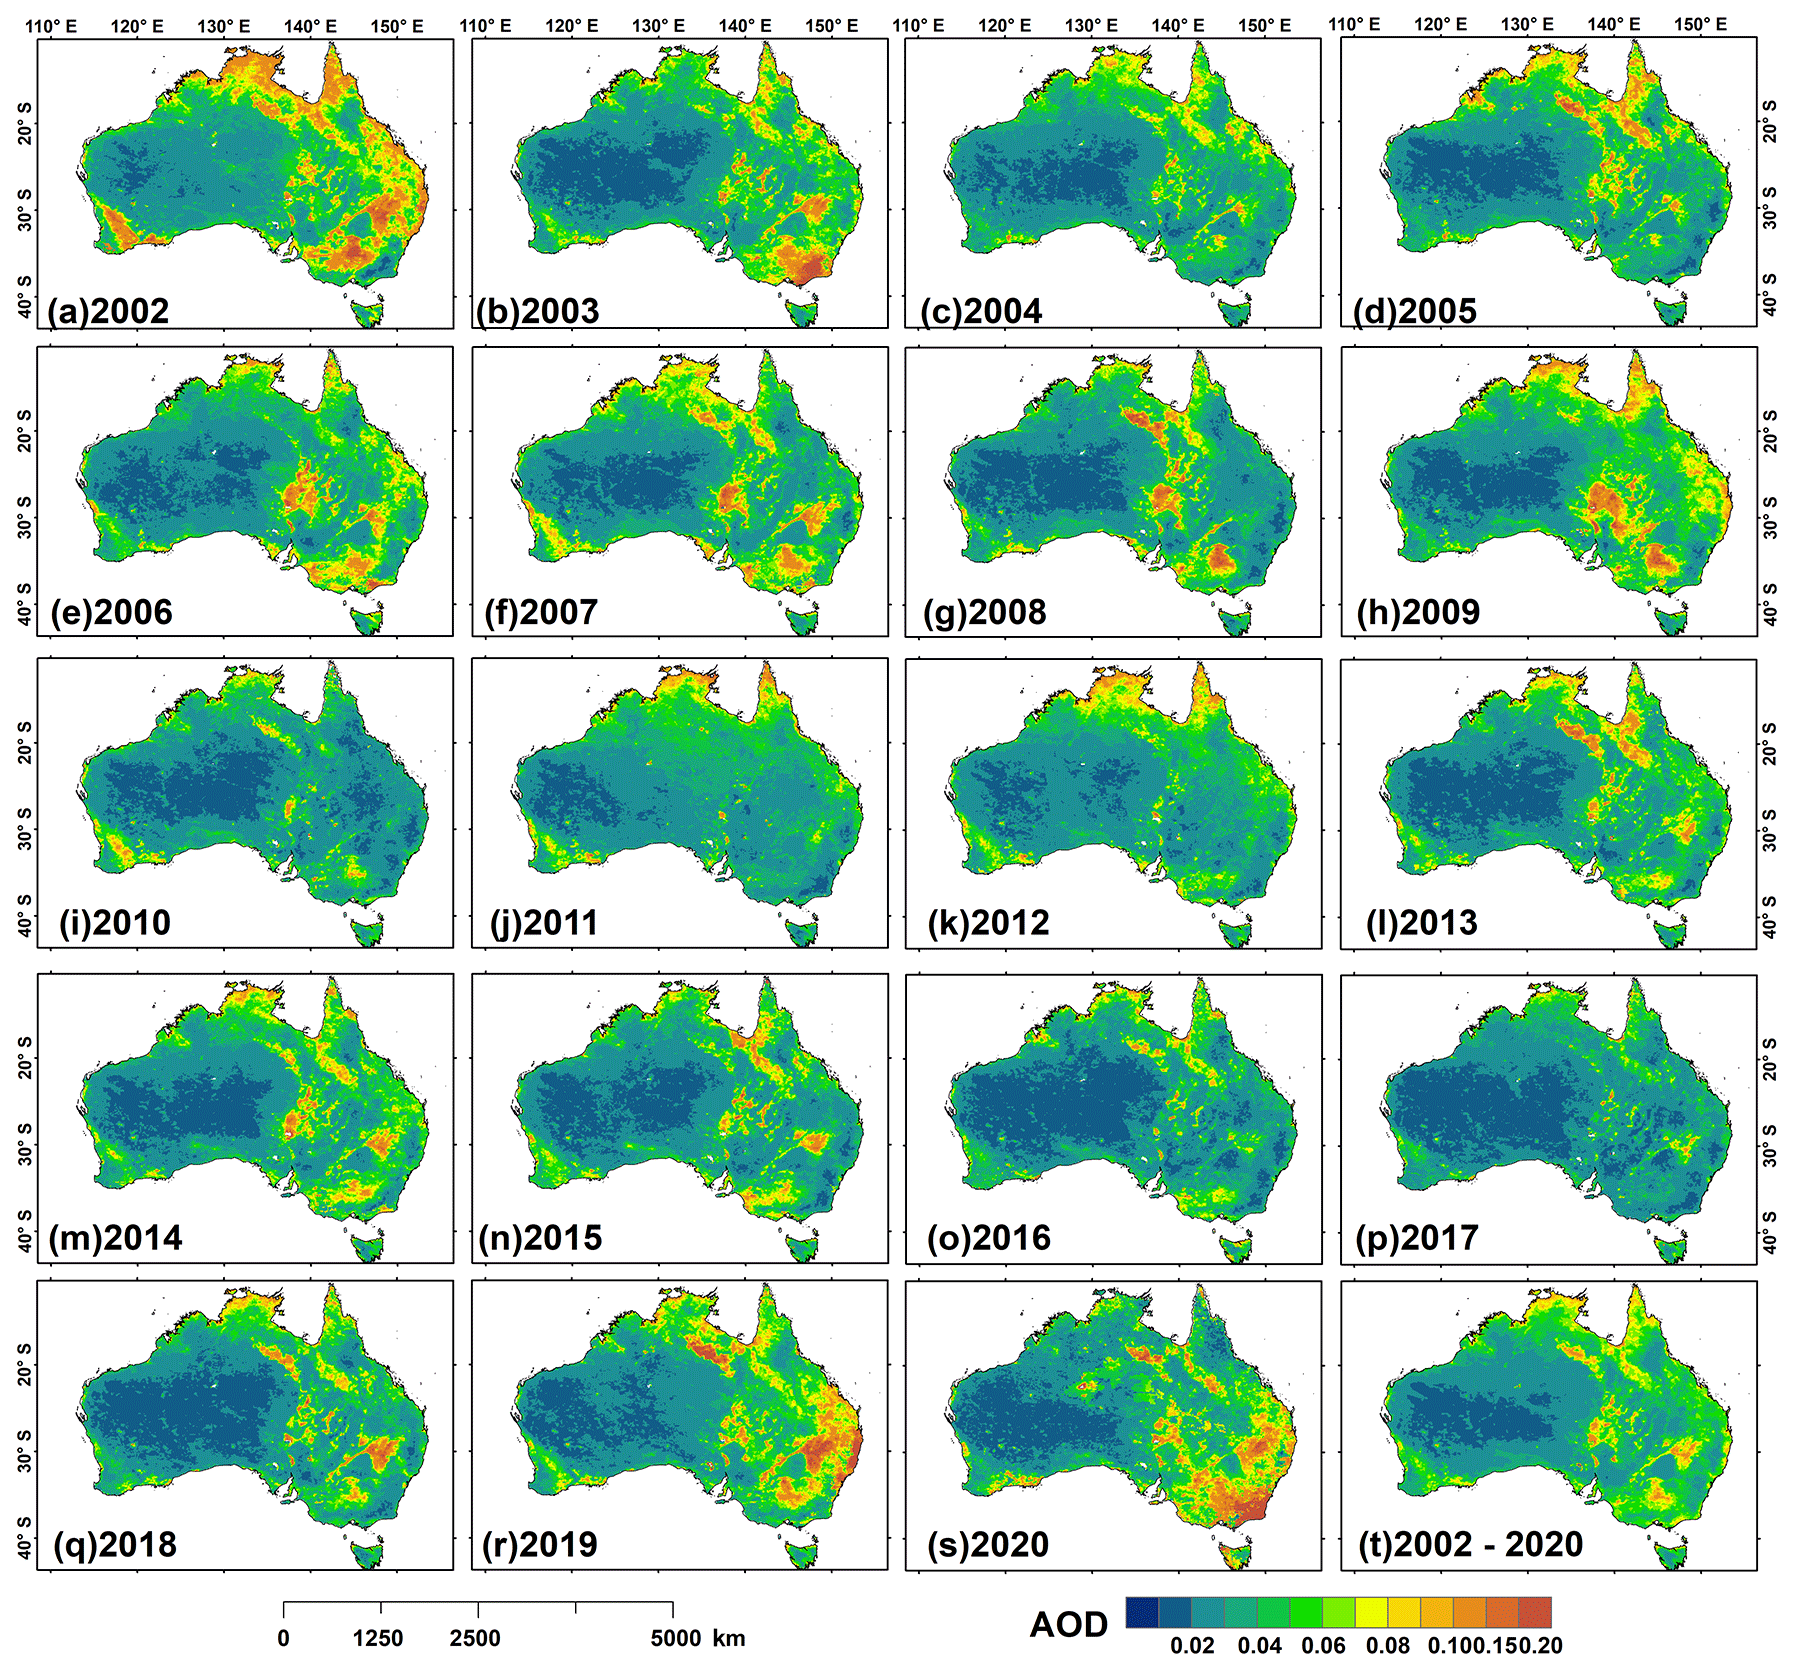
Figure 4Spatial distributions of annual averaged Aqua MODIS DB AODs at 550 nm in Australia from 2002–2020 (a–s), along with that for multi-year averaged Aqua MODIS DB AODs at 550 nm in Australia from 2002–2020 (t). Note that the year of 2002 only covers July–December and the year of 2020 only covers January–May.
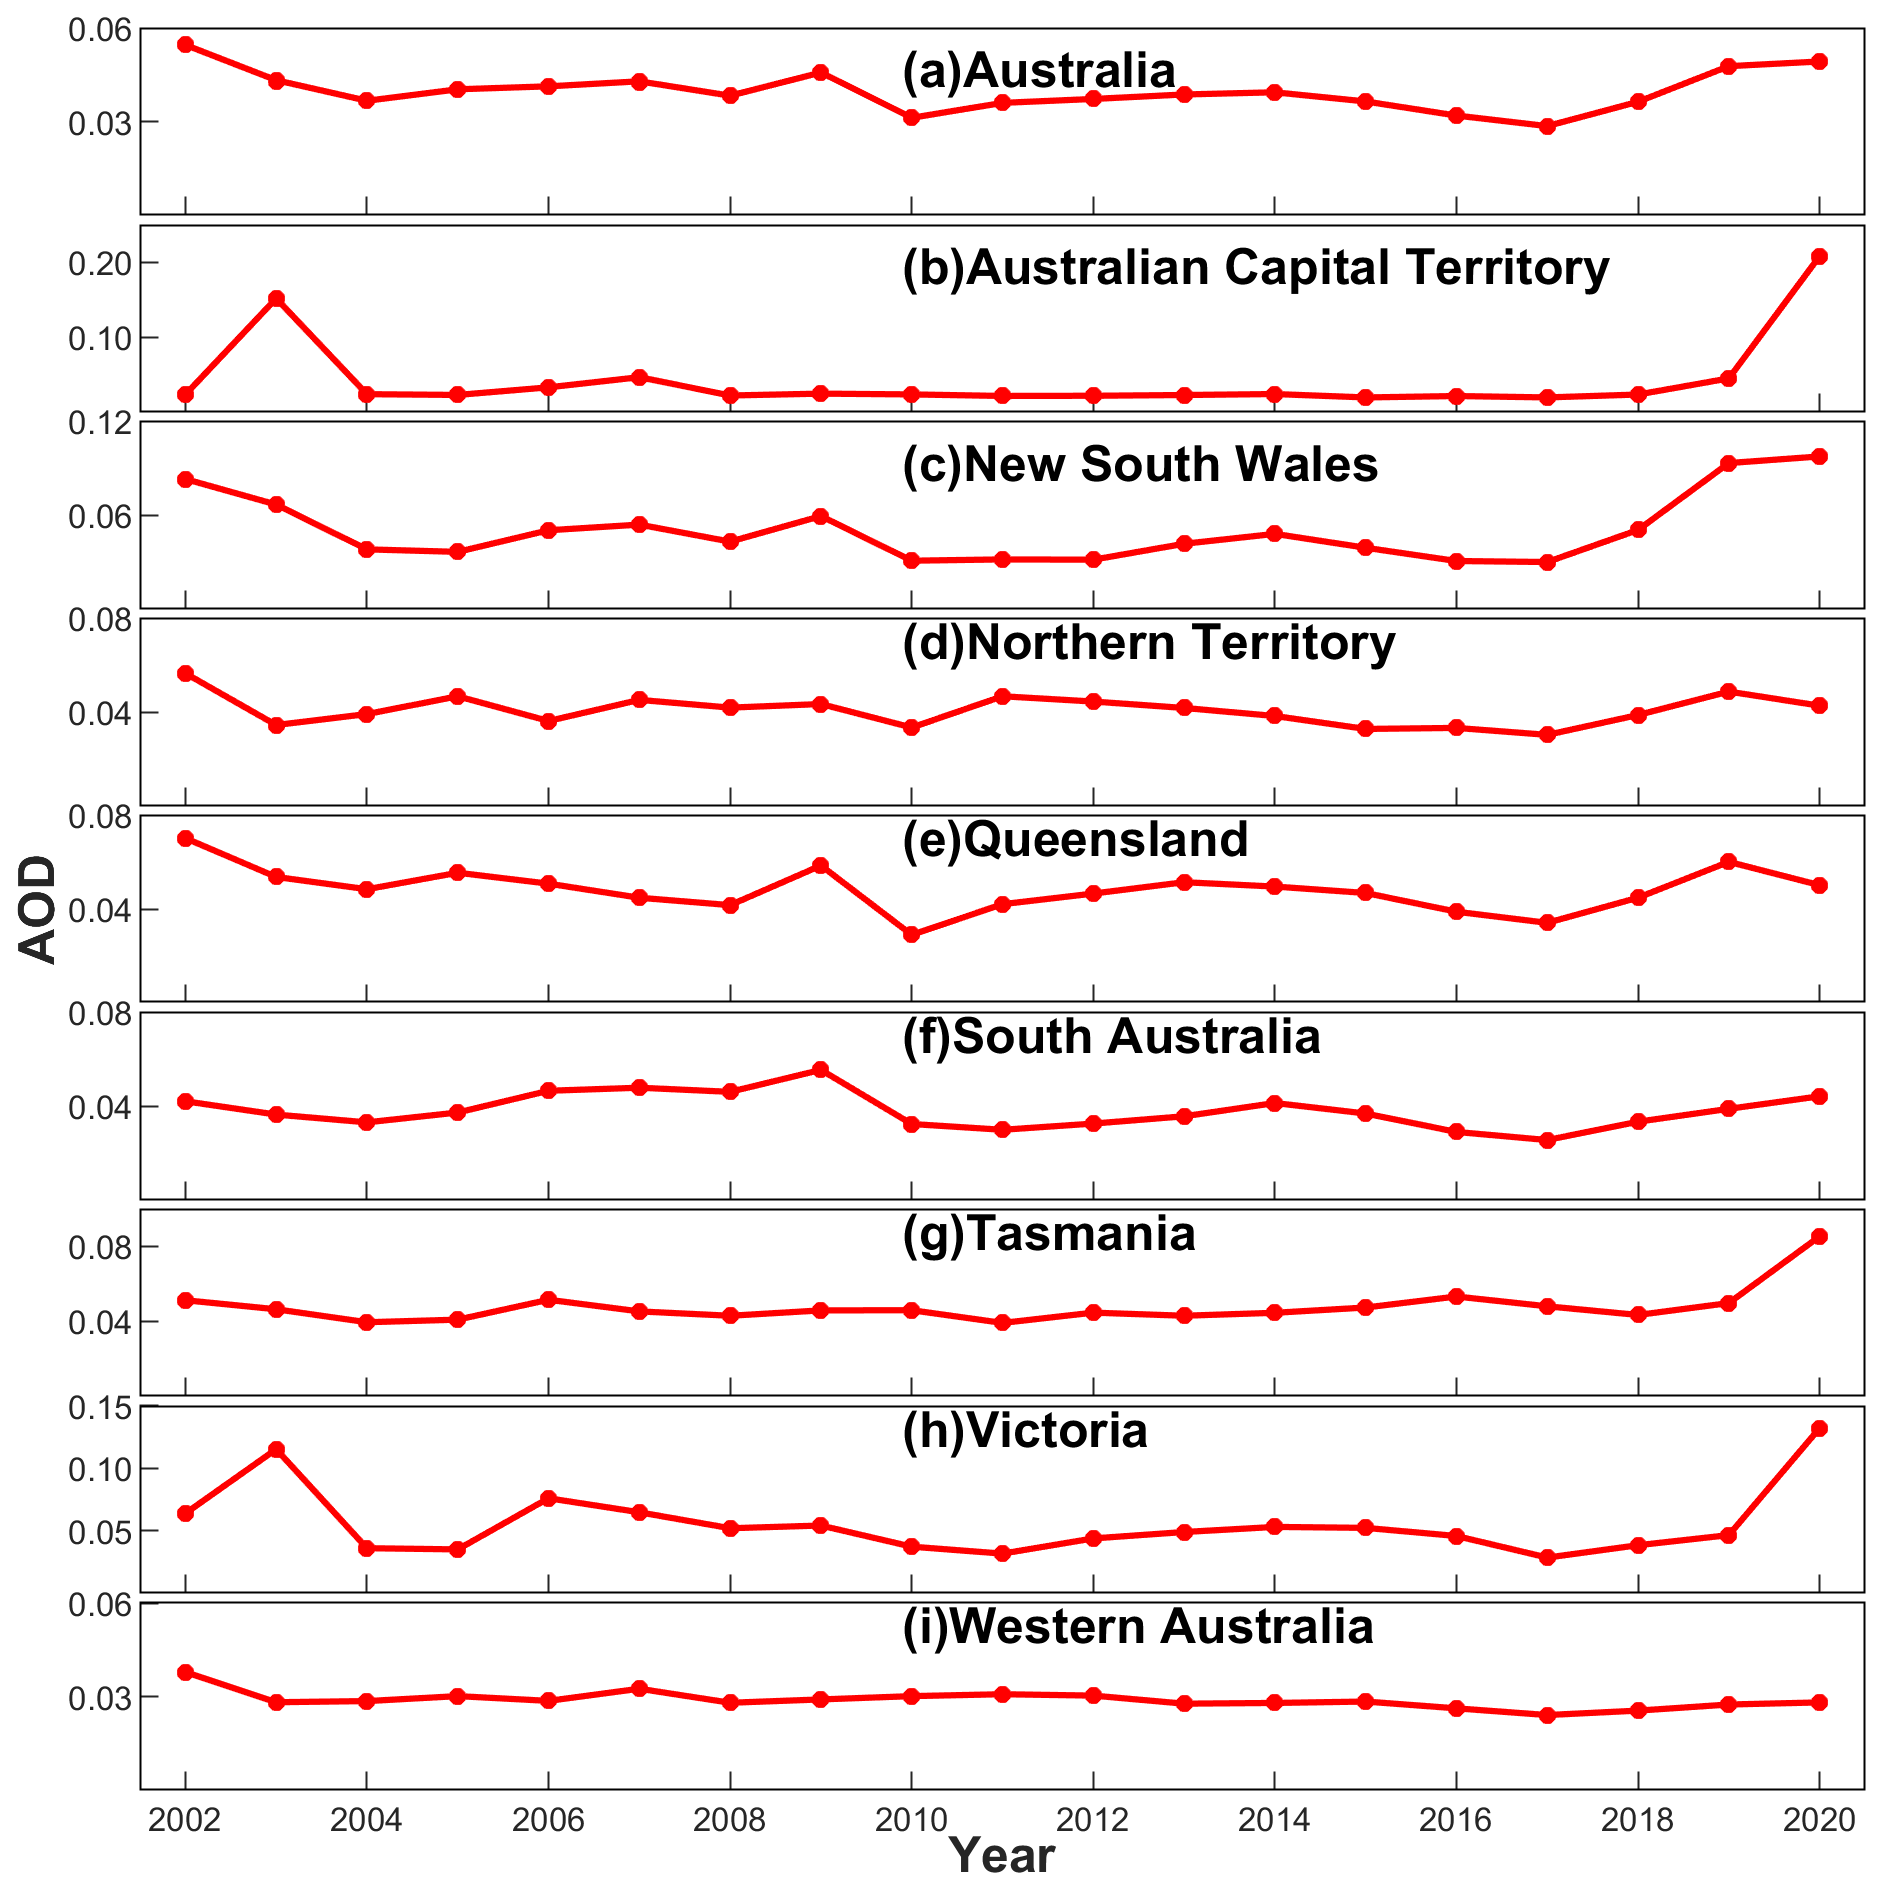
Figure 5Time series of the yearly averaged Aqua MODIS DB AODs over Australia and its eight main administrative regions from 2002–2020.
3.1.2 Seasonal variations of aerosol optical properties
Seasonal variations of AOD and AE at nine sites in Australia are presented in Fig. 6. It was clear that there was a seasonal cycle in AOD at nine sites, with high values in spring and summer and low values in fall and winter. Similarly, seasonal distributions of MODIS AOD indicated that high AODs were observed in spring (∼ 0.048) and summer (∼ 0.058), while low AODs were observed in fall (∼ 0.031) and winter (∼ 0.029) (Fig. 7). The main contributors to the high AODs in spring and summer were smoke emissions from biomass burning, dust storms, marine emissions from the sea spray produced in breaking waves, and the natural sulfate particles released from phytoplankton (Rotstayn et al., 2010). The occurrence frequency and intensity of dust storm activities and wildfires decreased in fall and winter, resulting in low AOD values in those two seasons over Australia. Furthermore, the highest seasonal average AOD values were observed in spring at Birdsville (0.09), Jabiru (0.22), Lake Argyle (0.23), and Lucinda (0.13), while they were observed in summer at the other five sites (0.08–0.11). The seasonal variations in AOD observed by AERONET and MODIS were in good agreement at nine sites apart from small differences in magnitude. Mitchell et al. (2013) also found that the AOD values at Wagga and Canberra peaked in summer, while AOD values peaked in spring at sites that are located in the arid zone. This is due to the increasingly forested and bushfire-prone characteristics at the more easterly sites (Mitchell et al., 2013). Moreover, less precipitation and higher wind speeds during spring were observed in northern Australia (north of 18∘ S), which may lead to the increase in AOD from biomass burning and long-range transport of marine emissions (Fig. S2). During summer, the decrease in AOD was significant over northwestern regions, consistent with the large increase in precipitation and decrease in wind speeds. However, the increase in AOD in eastern and southeastern regions during summer could be associated with the increase of biomass burning and sea salt aerosols that were transported from the Pacific Ocean.
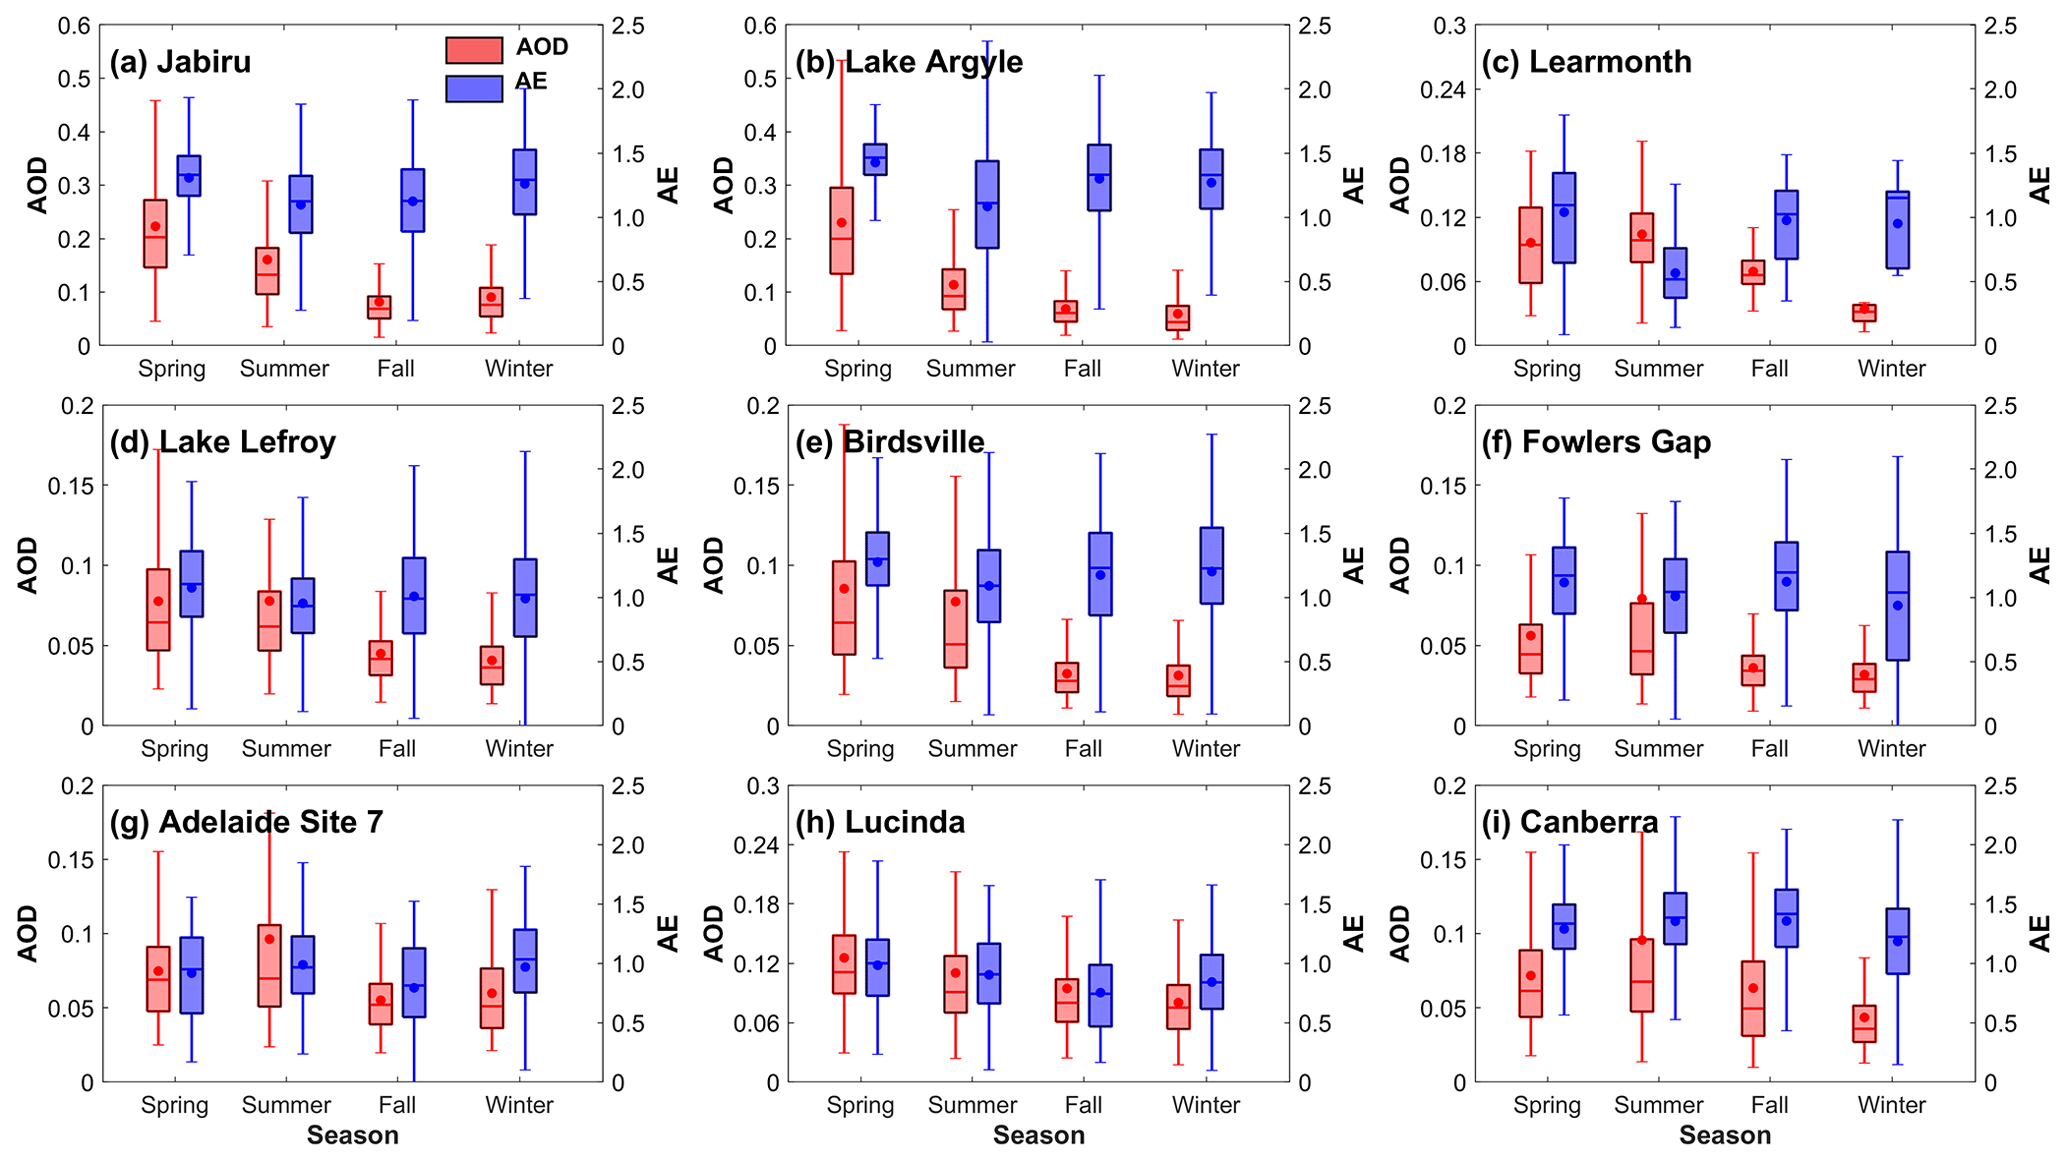
Figure 6Box plots of the seasonal average AOD and AE at the nine AERONET sites in Australia. In each box, the dots in the center are the mean, and the lower and upper limits are the first and the third quartiles, respectively. The lines extending vertically from the box indicate the spread of the distribution, with the length being 1.5 times the difference between the first and the third quartiles.
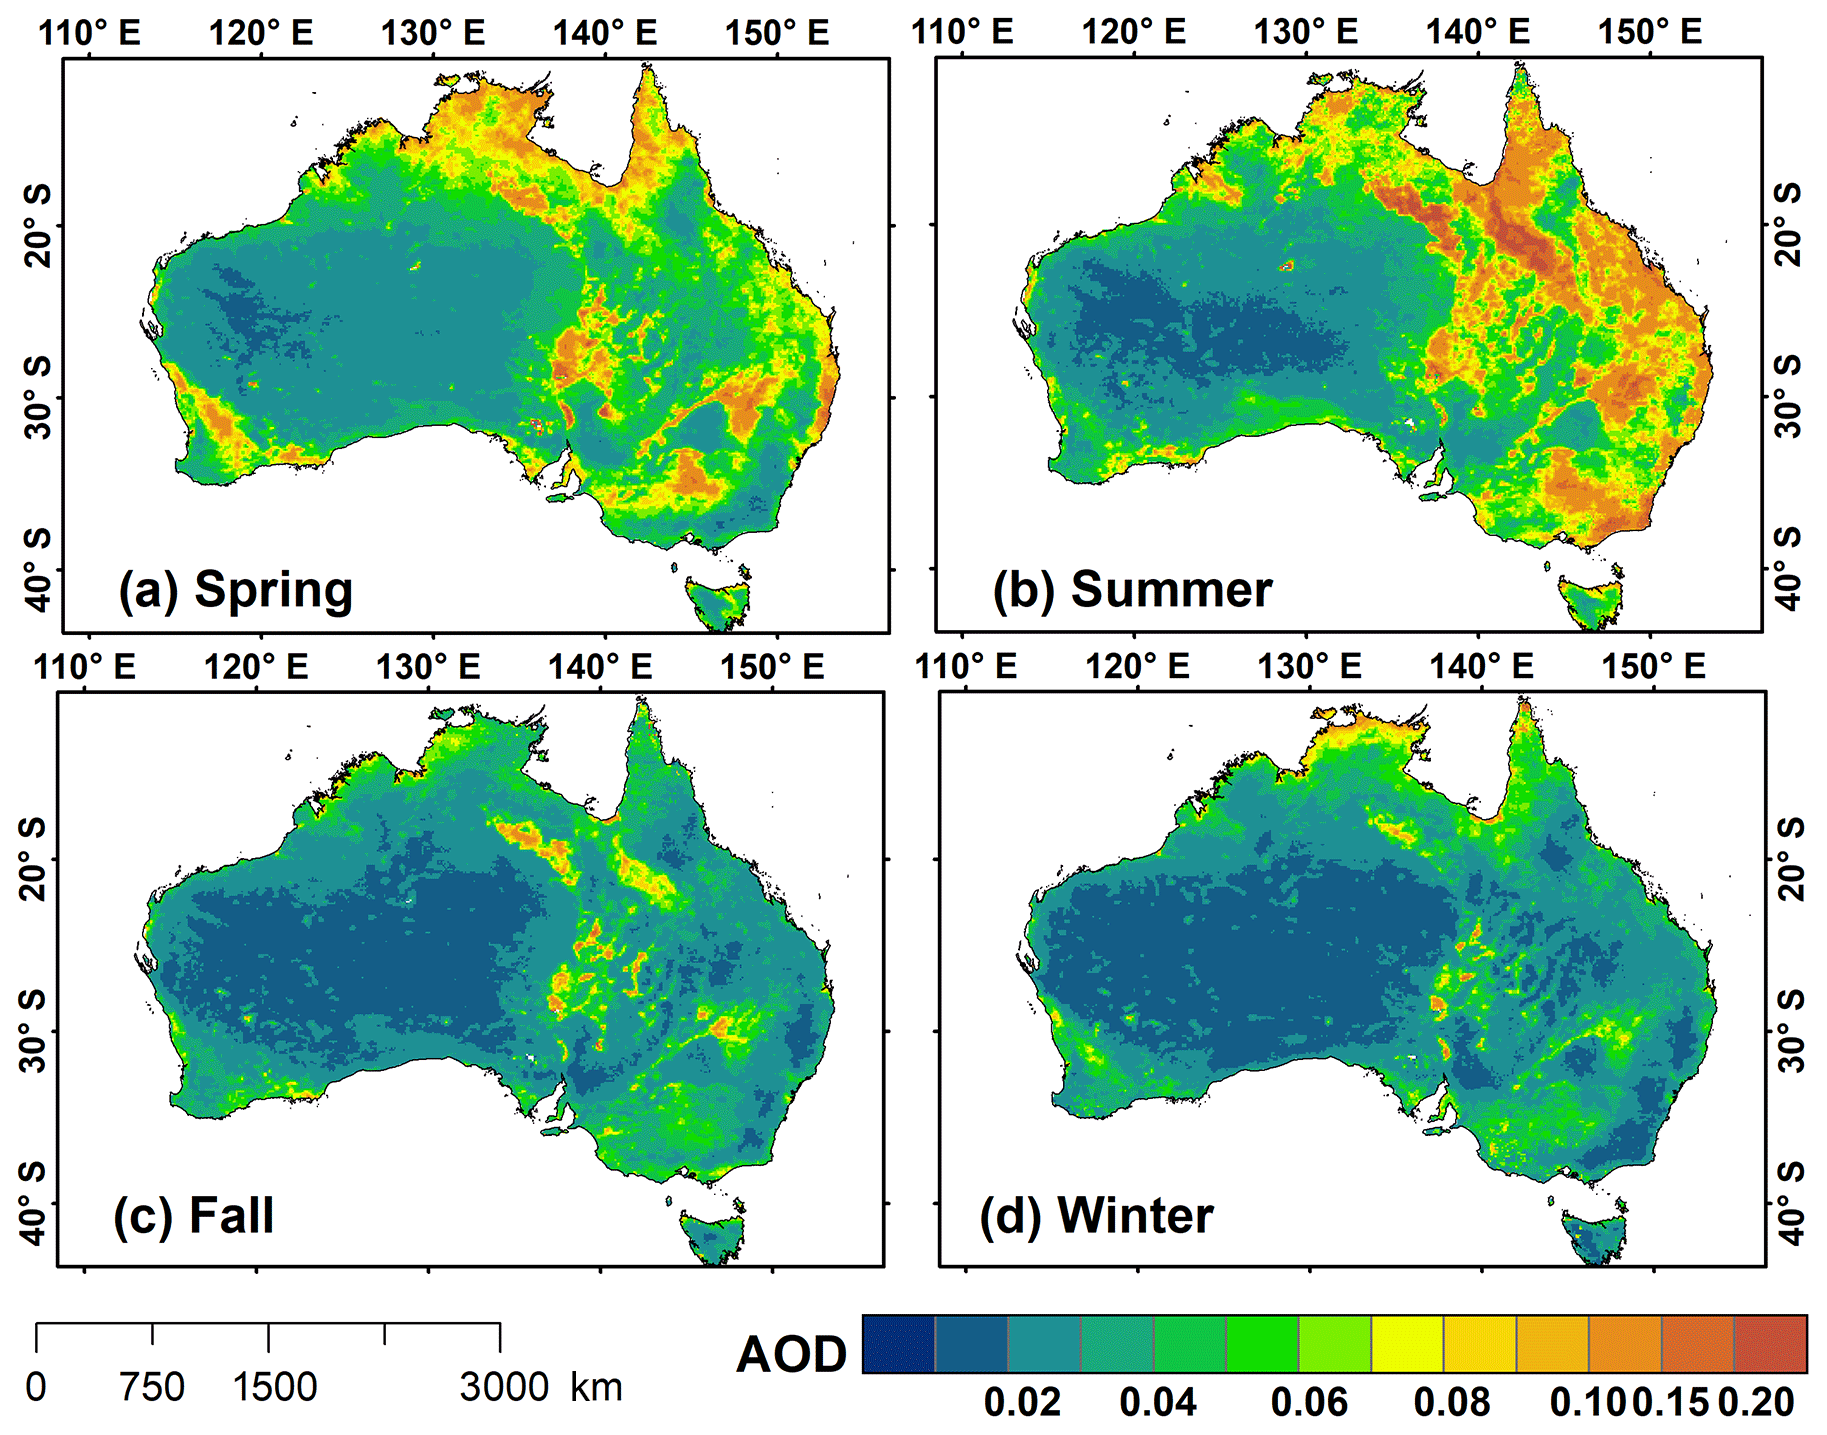
Figure 7Spatial distributions of seasonally averaged Aqua MODIS DB AODs at 550 nm during the period 2002–2020 in Australia, in (a) spring, (b) summer, (c) fall, and (d) winter.
The seasonal variation in AE was different from that in AOD. There were no obvious seasonal variations in AE at the nine sites. The maximum seasonal mean AE values (0.92–1.43) were observed in spring at all sites except for Canberra (1.35 in summer), which was mostly related to the fine particles from biomass burning. Similar results were reported by Mitchell et al. (2013) during the period 1998–2012 in northern Australia. Further, the seasonal mean AE values were greater than 1.0 over all seasons at Canberra, Jabiru, Lake Argyle, Fowlers Gap, and Birdsville, while the mean AE values were less than 1 over all seasons at Adelaide Site 7 and Lucinda. In addition, at Learmonth and Lake Lefroy, high AE values (0.98–1.07) were observed in spring and fall, and low values (0.56-0.99) were observed in summer and winter.
3.1.3 Monthly variations of aerosol optical properties
Figure 8 depicts the monthly variations of total, fine-mode and coarse-mode AODs at 500 nm at nine AERONET sites in Australia. Furthermore, the spatial distributions of monthly averaged MODIS AODs are shown in Fig. 9. The mean MODIS AOD varied monthly, with high values appearing during October–January and low values appeared during June–July. Moreover, significant differences in monthly AOD variations were found among regions of Australia. Therefore, we classified the nine AERONET sites as four categories based on their locations, which are (1) Jabiru and Lake Argyle in northern Australia, (2) Learmonth and Lake Lefory in western Australia, (3) Birdsville, Fowlers Gap, and Adelaide Site 7, in central Australia, and (4) Lucinda and Canberra in eastern Australia. In order to avoid bisecting the aerosol peak, the timeline was adopted from July to June rather than from January to December (Mitchell et al., 2017). In northern Australia, the monthly mean AODs at Jabiru and Lake Argyle varied considerably, with the highest values in October (0.24; 0.26) and the lowest values in April at Jabiru (0.07) and June at Lake Argyle (0.05). Further, fine-mode AODs showed high values during May–December at Jabiru and during April–December at Lake Argyle. The fine-mode AODs peaked in October at Jabiru (0.17) and Lake Argyle (0.20). These results suggested that fine-mode aerosols dominated in the dry season at the two sites, which was mostly caused by the biomass burning in northern Australia. In addition, Jabiru showed higher mean monthly AOD values than Lake Argyle and a later increasing trend in fine-mode AOD, owing to its location closer to the coast and hence to sea salt advection (Radhi et al., 2012). In western Australia, the highest monthly AOD values occurred in December at Learmonth (0.11) and January at Lake Lefroy (0.09), while the lowest monthly AOD values occurred in August at Learmonth (0.03) and June at Lake Lefroy (0.04). Fine-mode aerosols dominated in all months at Lake Lefroy, which was mostly related to the biomass burning and anthropogenic aerosols in this region. Coarse-mode aerosols dominated in all months except for September and October at Learmonth, which was likely related to the dust aerosols transported from central Australia such as the Gibson Desert and Great Victoria Desert (Karlson et al., 2014). The increase in fine-mode AOD during September–October may be a result of relatively low wind speeds in fall at Learmonth (Fig. S2), which could reduce the amount of dust that was transported from inland deserts. In the central plains, the monthly mean AODs at Birdsville, Fowlers Gap, and Adelaide Site 7 displayed two peaks. One peak was observed in September at Adelaide Site 7 and Fowlers Gap and in October at Birdsville, with magnitude values of 0.08, 0.07, and 0.10, respectively. The other one was observed in January, with magnitude values of 0.10, 0.09, and 0.09 at Adelaide Site 7, Fowlers Gap, and Birdsville, respectively. The findings were consistent with the result of MODIS AOD, which also showed higher values during September and February than during other months in the central plains. It is worth mentioning that the bimodal trend weakened at Fowlers Gap and Adelaide Site 7 compared to Birdsville, especially the first peak during September. This was likely due to their location farther away from the Simpson Desert, which was the most active dust source with high aerosol loading during September–February. At Birdsville, coarse-mode aerosols dominated during summer and fall, while fine-mode aerosols dominated during spring and winter. Coarse-mode aerosols were more abundant during later summer and fall at Fowlers Gap and during late spring and fall at Adelaide Site 7. However, fine-mode aerosols at Fowlers Gap and Adelaide Site 7 were more abundant than that at Birdsville due to the influence of biomass burning aerosols transported from the eastern and southern forest areas (discussed in Sect. 3.2.2). In eastern Australia, the highest monthly AOD was observed in October (0.13) at Lucinda and January at Canberra (0.13). Fine-mode aerosols dominated in all months at Canberra, indicating that Canberra suffered from fine-particle aerosols, such as smoke and anthropogenic aerosols. By contrast, coarse-mode aerosols dominated in all months at Lucinda, which may be related to the dust and sea salt aerosols transported from the central plains and the Pacific Ocean, respectively.
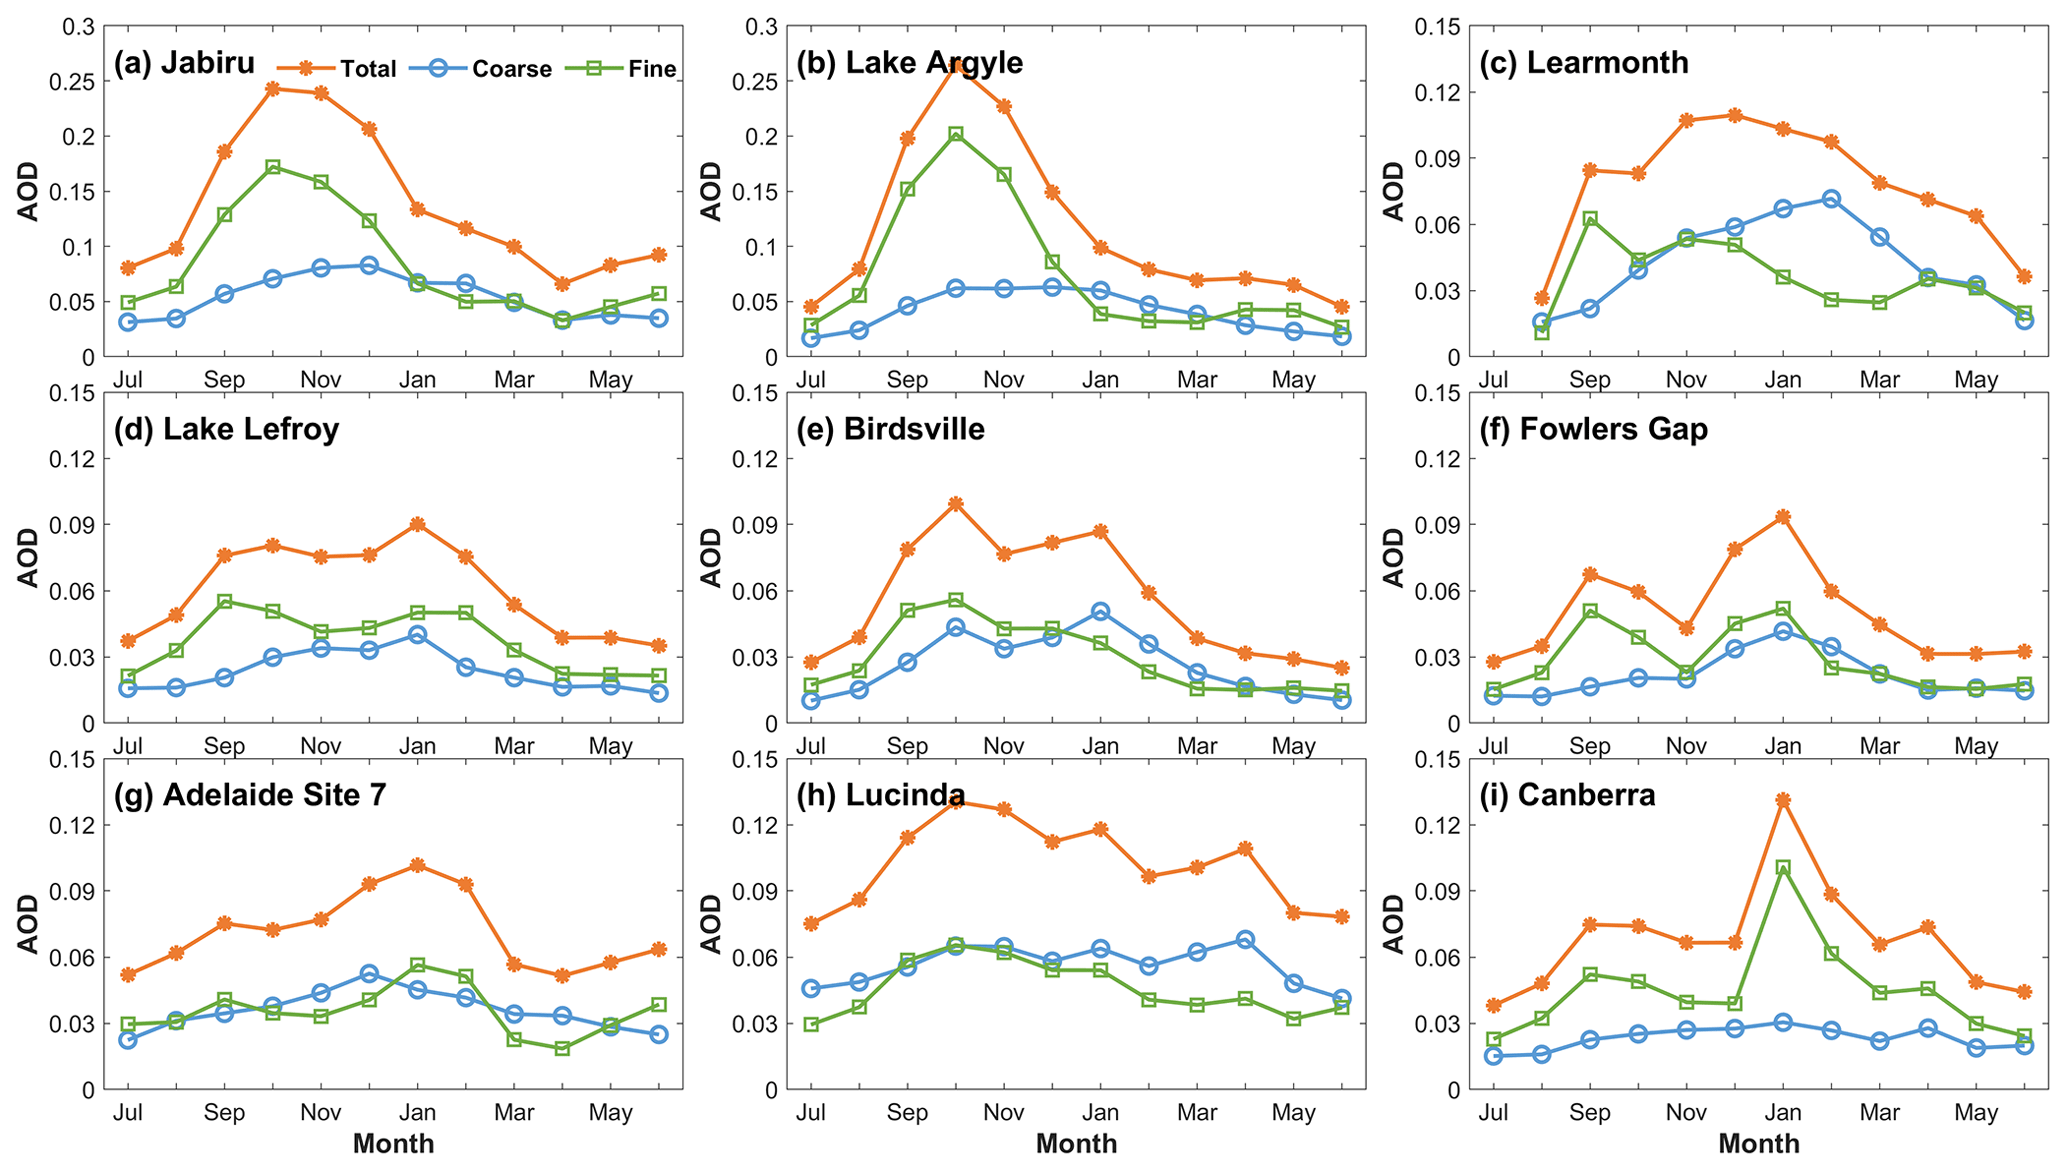
Figure 8Monthly variations of multi-year averaged total, fine-mode, and coarse-mode AODs at 500 nm at nine AERONET sites in Australia.
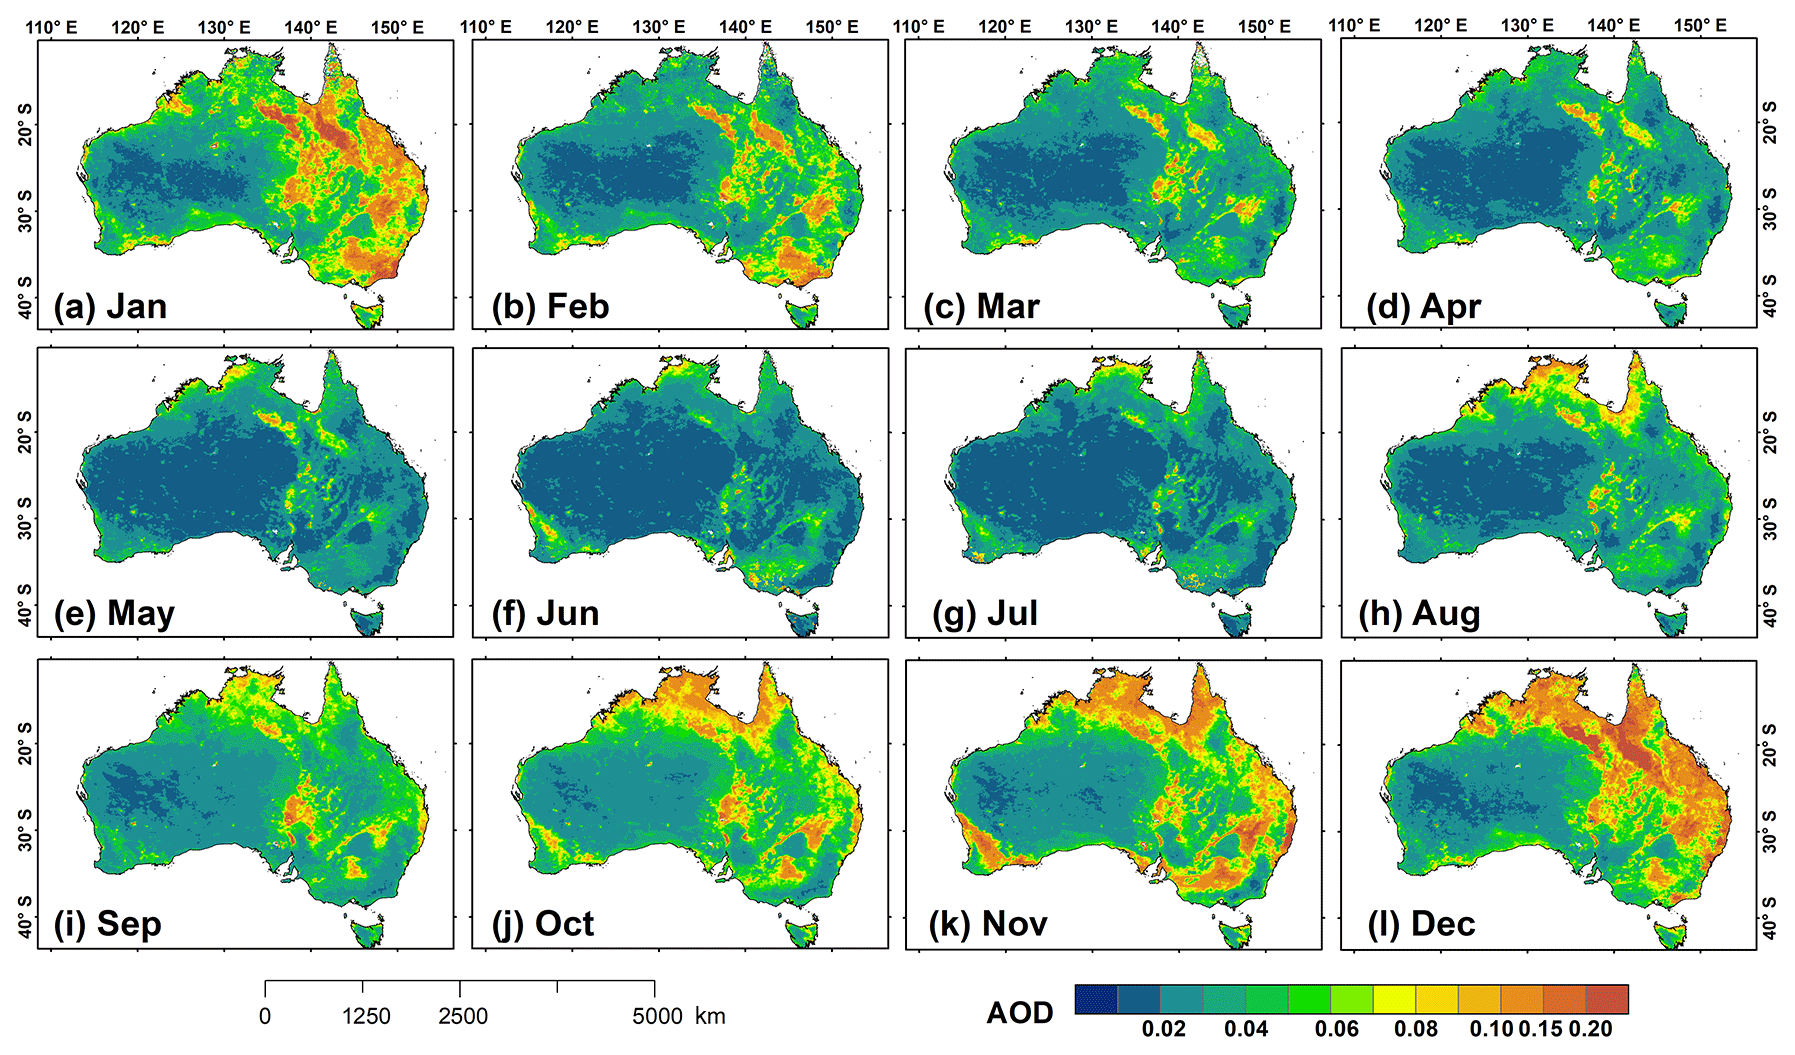
Figure 9Spatial distributions of monthly averaged Aqua MODIS DB AODs at 550 nm during the period 2002–2020 in Australia.
3.2 Classification of aerosol types and their seasonal contributions
3.2.1 Frequency distributions of aerosol optical properties
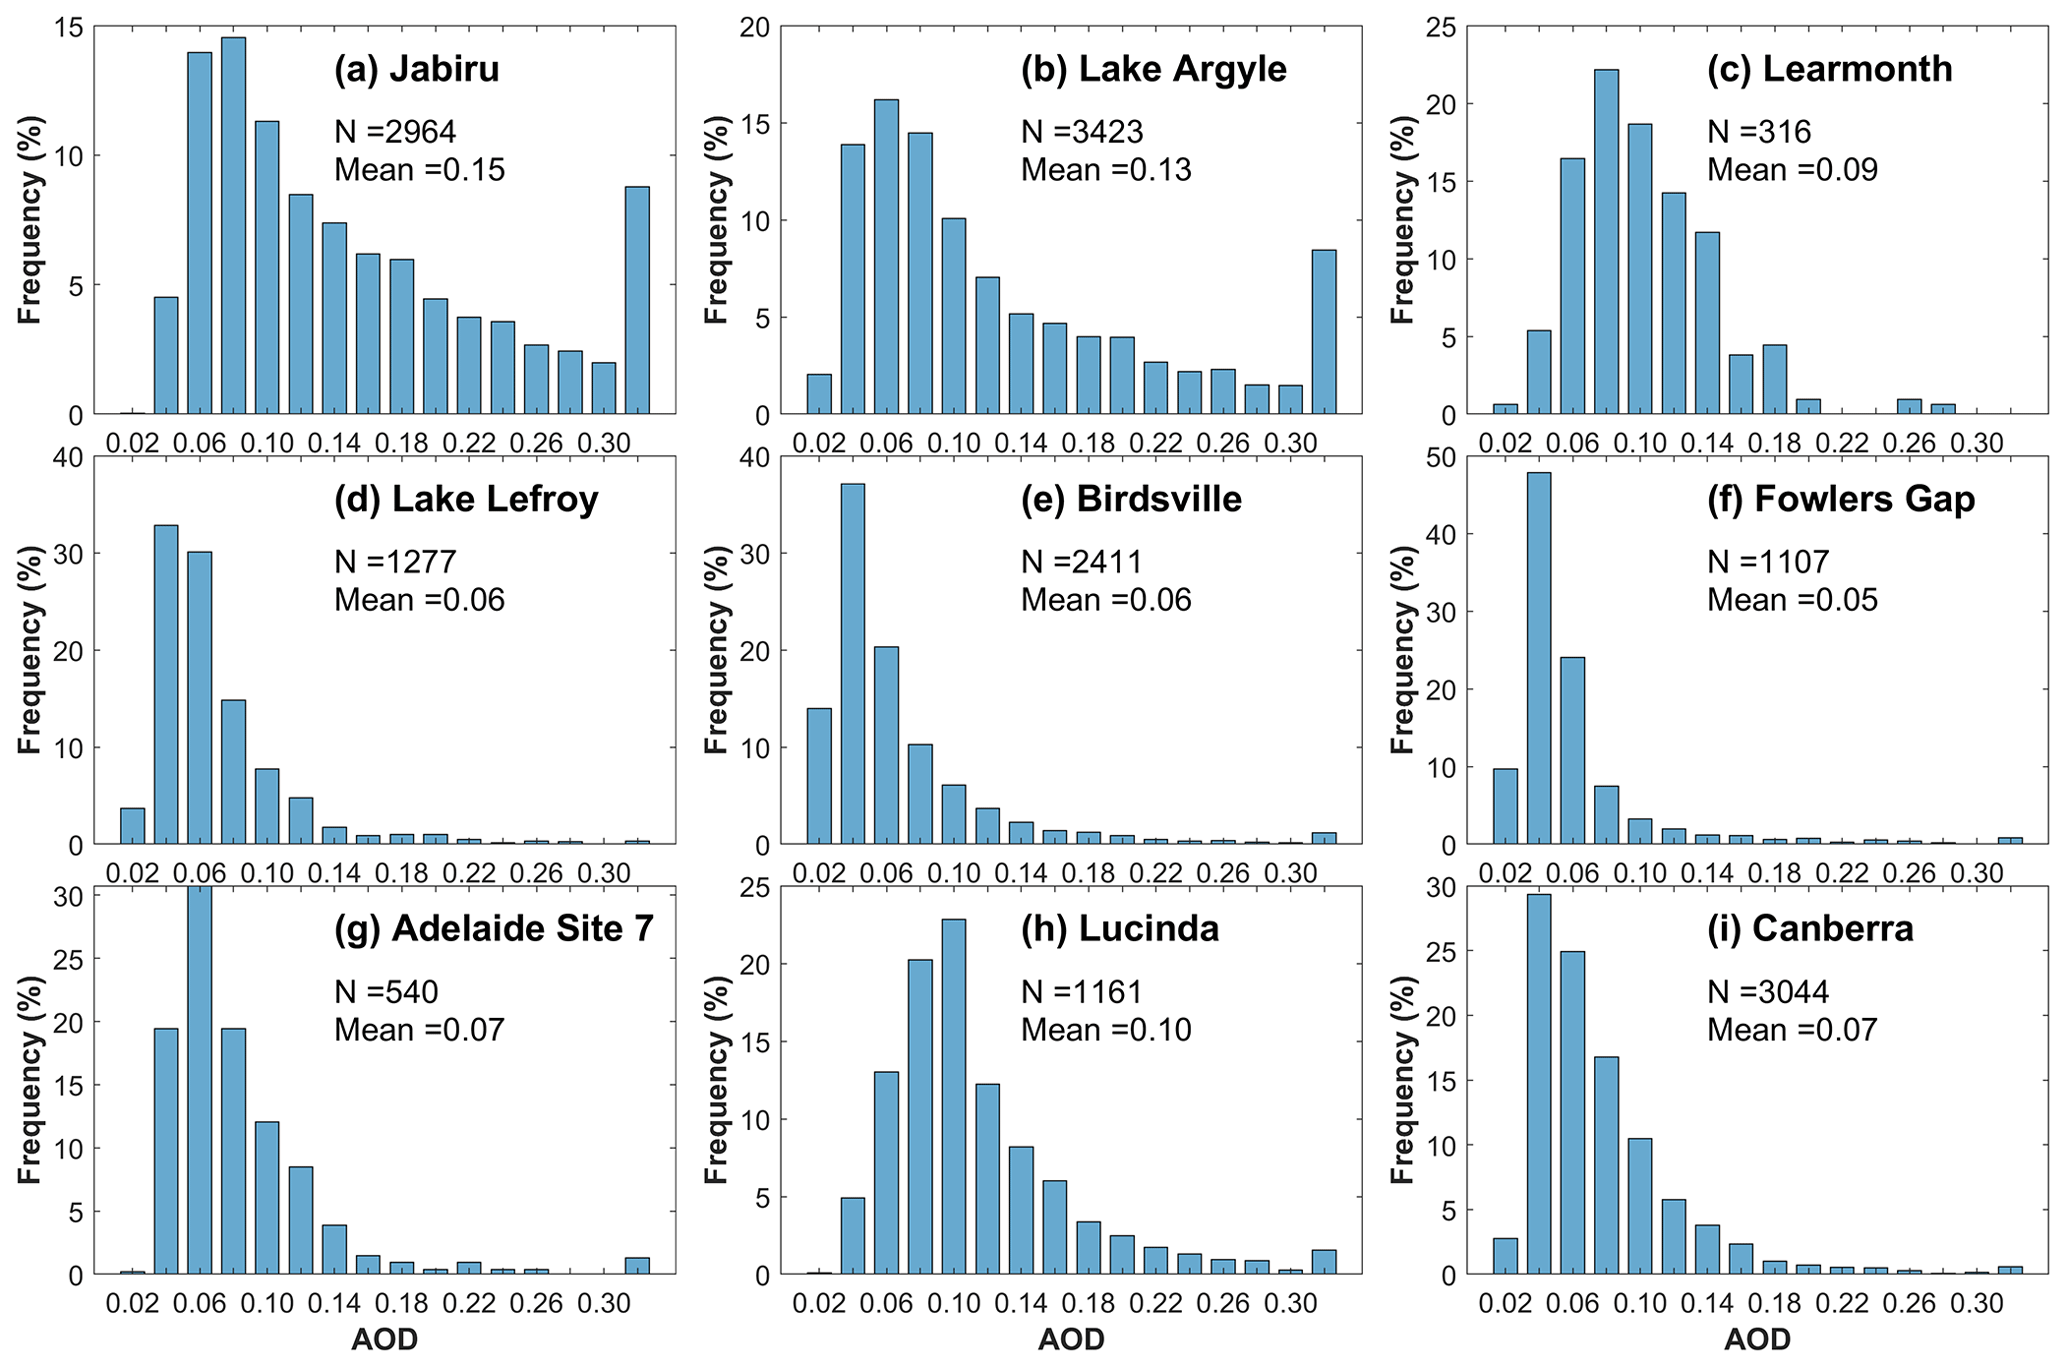
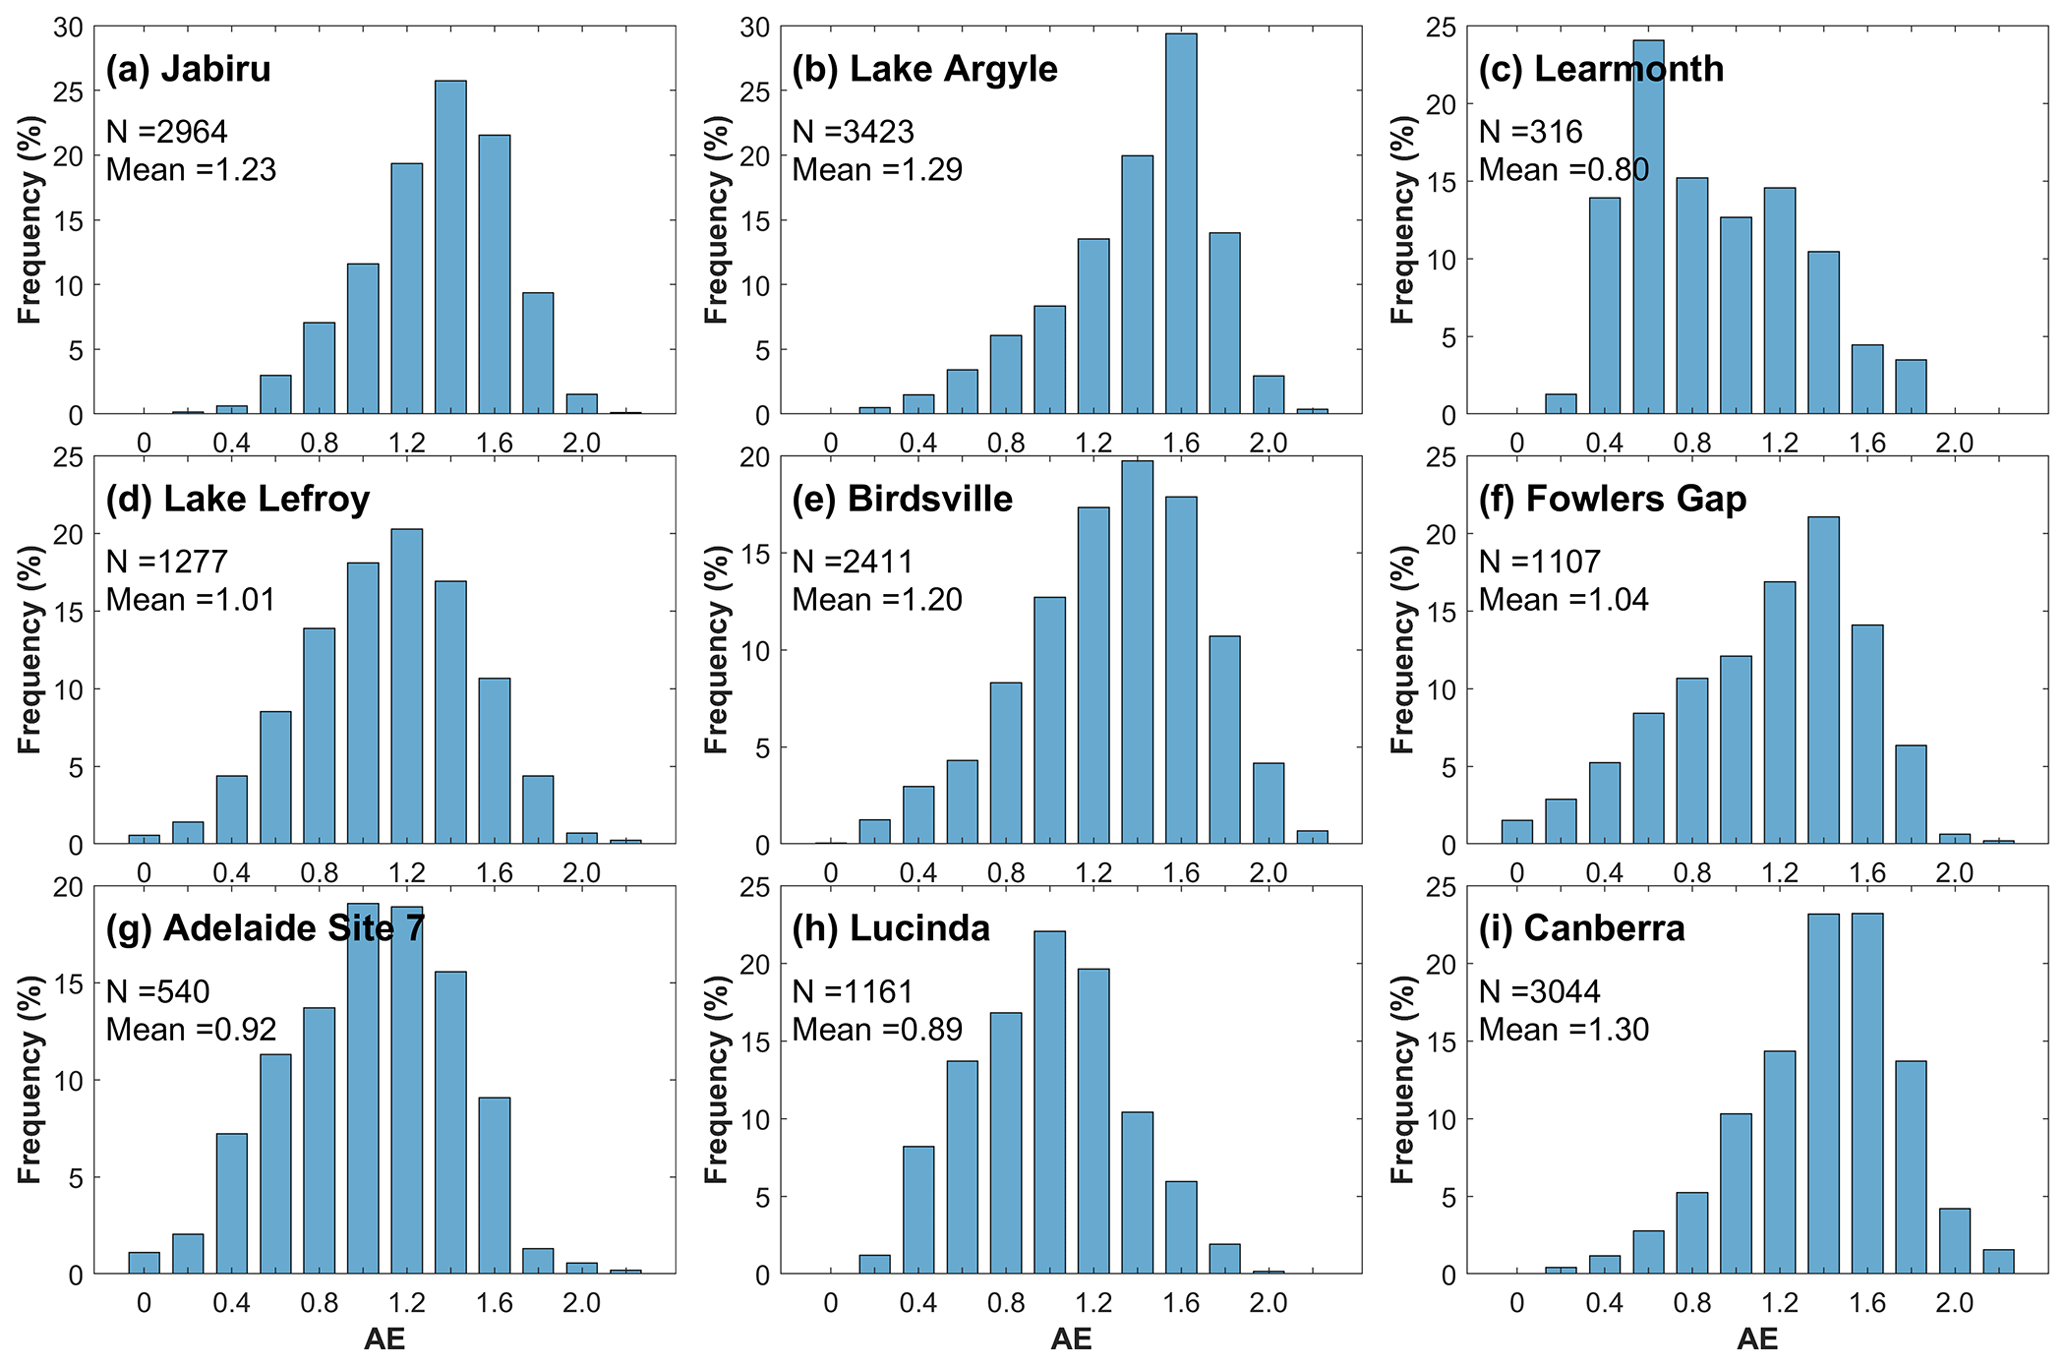
The frequency distributions of AOD and AE at nine AERONET sites in Australia are shown in Figs. 10 and 11, respectively. In general, the frequency distributions of AOD roughly showed single-mode distributions, with the maximum occurrence frequency at relatively low values (AOD <0.1). The frequency distribution of AOD was generally broad, with high frequencies of AOD (60.22 %–95.61 %) in the range of 0.02–0.14. Further, the frequencies of AOD with values larger than 0.14 were generally small (4.39 %–18.52 %) and showed a decreasing trend with AOD at all sites except for Jabiru and Lake Argyle, where the frequencies of AOD with values larger than 0.14 were about 39.78 % and 31.14 %, respectively. Moreover, at Jabiru and Lake Argyle, the frequencies of AOD with values greater than 0.30 are about 8.77 % and 8.45 %, which was mostly related to the wildfires as evidenced earlier. The histograms of AE at nine sites show that the AE values mainly lie in the range of 0.2–1.8, which indicates great variability of aerosol types such as biomass burning, dust, marine aerosol, and mixtures over Australia. The frequency distributions of AE were skewed towards large AE values at all sites except for Lake Lefroy, Learmonth, and Lucinda, where AE followed the normal probability distributions. High frequencies of AE (54.44 %–67.09 %) with values less than 1.0 were found at Adelaide Site 7, Learmonth, and Lucinda, suggesting the dominance of coarse-mode aerosol particles. However, relatively high frequencies of AE (52.94 %–79.78 %) were observed in the range of 1.0–2.0 at the other sites, indicating a mixture of fine-mode and coarse-mode aerosols at these sites.
3.2.2 Aerosol classification and potential source analysis
Variances in the relationship between AOD and AE provide a potential method to classify the aerosol types in different seasons (Kaskaoutis et al., 2007). Figure 12 depicts the scatter plots of AOD against AE in the four seasons at nine AERONET sites in Australia. However, it is difficult to discriminate biomass burning from urban/industrial aerosol using the relationship between AOD and AE alone (Mishra and Shibata, 2012). Further, a better analysis can be made through correlations between SSA and AE from AERONET. Figure 13 represents the relative percentages of different aerosol components in each season at nine sites based on the aerosol classification method of Giles et al. (2012). It should be noted that regional transport is also an important factor that can affect aerosols' type. Therefore, the annual and seasonal averaged back trajectories at nine AERONET sites are simulated to analyze the potential sources of aerosol at these sites (Figs. 14, S3–S6). It was clear that the aerosol concentration was high in spring and summer and low in fall and winter. There were a wide range of AOD values ranging from 0.1–0.8 and AE values ranging from ∼ 0.5 to ∼ 1.5 in all seasons at nine sites. The mixed type of aerosol (mainly a mixture of biomass burning and dust aerosols) dominated in all seasons at nine sites. Mitchell et al. (2017) also found that the aerosol sources over Australia were driven by mechanisms that do not vary greatly either at regional or continental scales by analyzing the monthly mean data at 22 sites, which was associated with a similar source of aerosol.
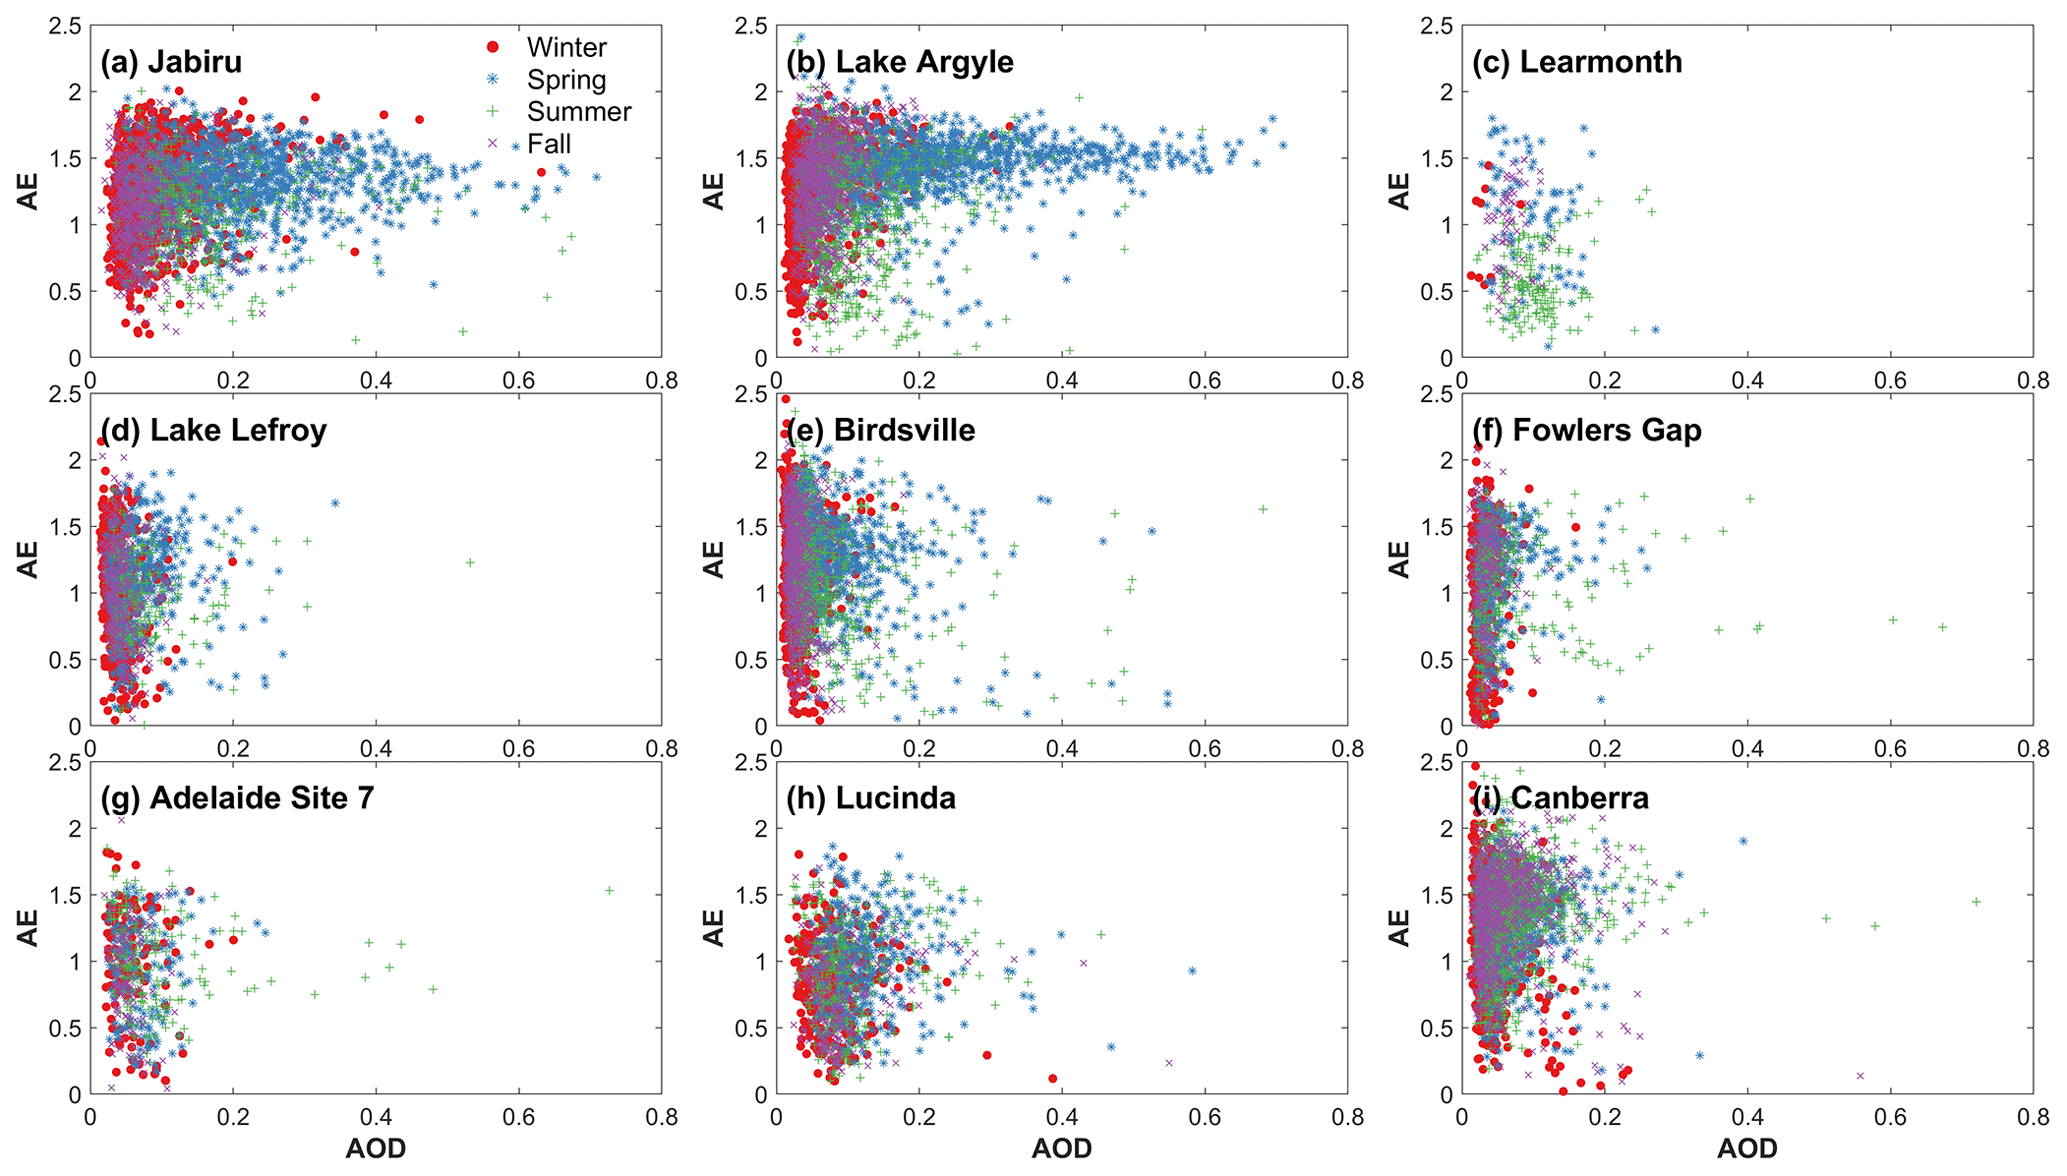
Figure 12Scattered plot for AOD at 500 nm vs. AE at 500 nm in spring (blue), summer (green), fall (purple), and winter (red) at nine AERONET sites in Australia.
In northern Australia, Jabiru and Lake Argyle exhibited a wide range of AOD values and high AE values (>1.5) during the four seasons, which suggested the existence of biomass burning and urban/industrial aerosols (Fig. 12a, b). Moreover, dust (AOD >0.15, AE <0.5) and clean marine aerosols (AOD <0.06, AE <1.3) were observed at the two sites. The annual averaged back trajectories ending at Jabiru and Lake Argyle showed that more than 23 % of all trajectories were from the Lake Eyre Basin (LEB), which was a significant dust source region. Further, there were about 43.40 % and 21.96 % airflows originating from the northern Ocean at Jabiru and Lake Argyle, respectively (Fig. 14a, b). These results indicated that the two sites were affected by marine and dust aerosols, which were transported from the northwestern Indian Ocean and southern deserts, respectively. Biomass burning aerosols accounted for a relatively large proportion at Jabiru and Lake Argyle in spring, fall, and winter (Fig. 13a, b), which was related to the biomass combustion during the dry season (Radhi et al., 2012). Dust aerosols were also observed during summer, fall, and winter. Karlson et al. (2014) analyzed the element and particle size of dust deposited in northwestern Australia from 2008–2009 and found that samples of Halls Creek (located in the southwest of lake Argyle) were derived from central Australia (e.g., the Lake Eyre Basin). Fire events were a main provider of dust aerosols in the atmosphere because the pyro-convection could accelerate the dust entrainment during the fire events. Furthermore, the seasonal trajectories evidenced the dust aerosols' transport from the southeastern deserts (Fig. S3). The results were similar to the findings of McGowan and Clark (2008), who also demonstrated that dust transport from Lake Eyre could travel through the northwest dust transport pathway to affect northern Australia, Indonesia, and the southern Philippines during 1980–2000 using the HYSPLIT model. The trajectories also indicated a possible transport of marine aerosols generated in the northwestern Indian Ocean, Arafura Sea, and Coral Sea.
In western Australia, mixed aerosols and dust aerosols were abundant during all seasons at Learmonth, while biomass burning and urban/industrial aerosols were also observed in spring (Figs. 12c, 13c). Learmonth was found to have heavy loadings of dust aerosols, which was consistent with our earlier result. The annual averaged back trajectories ending at Learmonth showed 22.76 % of airflow from the eastern deserts and 32.47 % of airflow from southern inland (Fig. 14c), which indicated that dust in eastern deserts (e.g., Gibson Desert, Great Victoria Desert, and Lake Eyre Basin) and biomass burning and urban/industrial aerosols from southern regions (e.g., Perth) could be transported to the Learmonth site. Karlson et al. (2014) also found the dust at Learmonth may have had a central Australian source. Although 44.77 % of airflow was from the Indian Ocean, clean marine aerosol was seldom found at Learmonth due to the fact that it is situated on the northwestern dust pathway (Strong et al., 2011). It was evident that mixed aerosols, biomass burning, and urban/industrial aerosols were dominant during all seasons at Lake Lefory (Figs. 12d, 13d). The urban/industrial aerosols were observed during all seasons, making fine-mode aerosols dominant throughout the year at Lake Lefory. The annual and seasonal averaged trajectories ending at Lake Lefory both showed that biomass burning and urban/industrial aerosols could be transported by the western and southwestern airflows (Figs. 14d and S4).
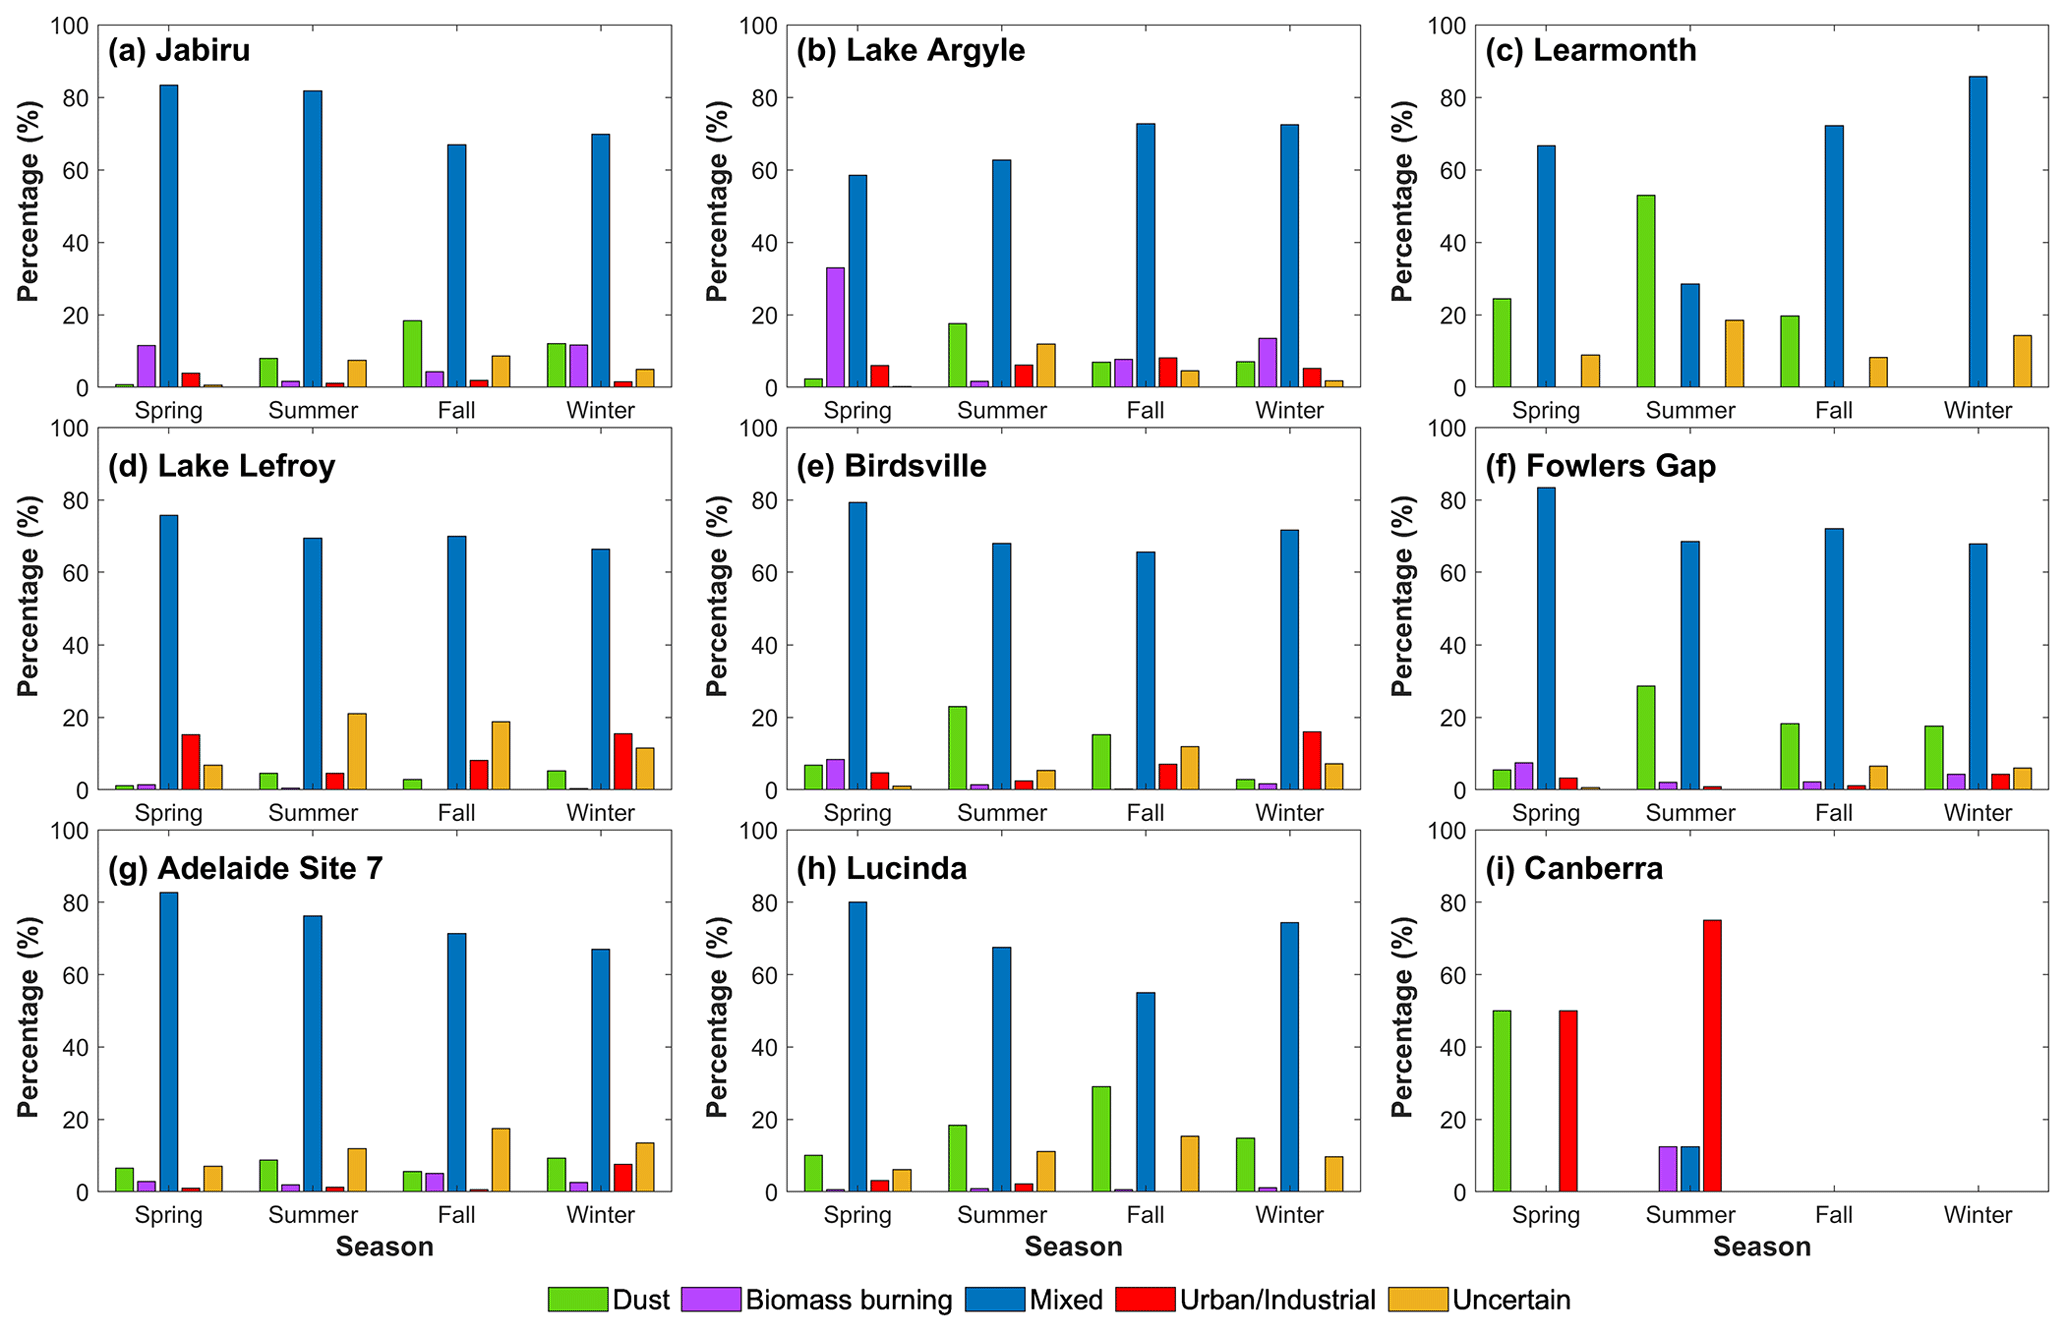
Figure 13Relative percentages of different aerosol components in each season at nine sites which are derived from AERONET during the observation period, including dust, biomass burning, mixed, urban/industrial, and uncertain aerosol types.
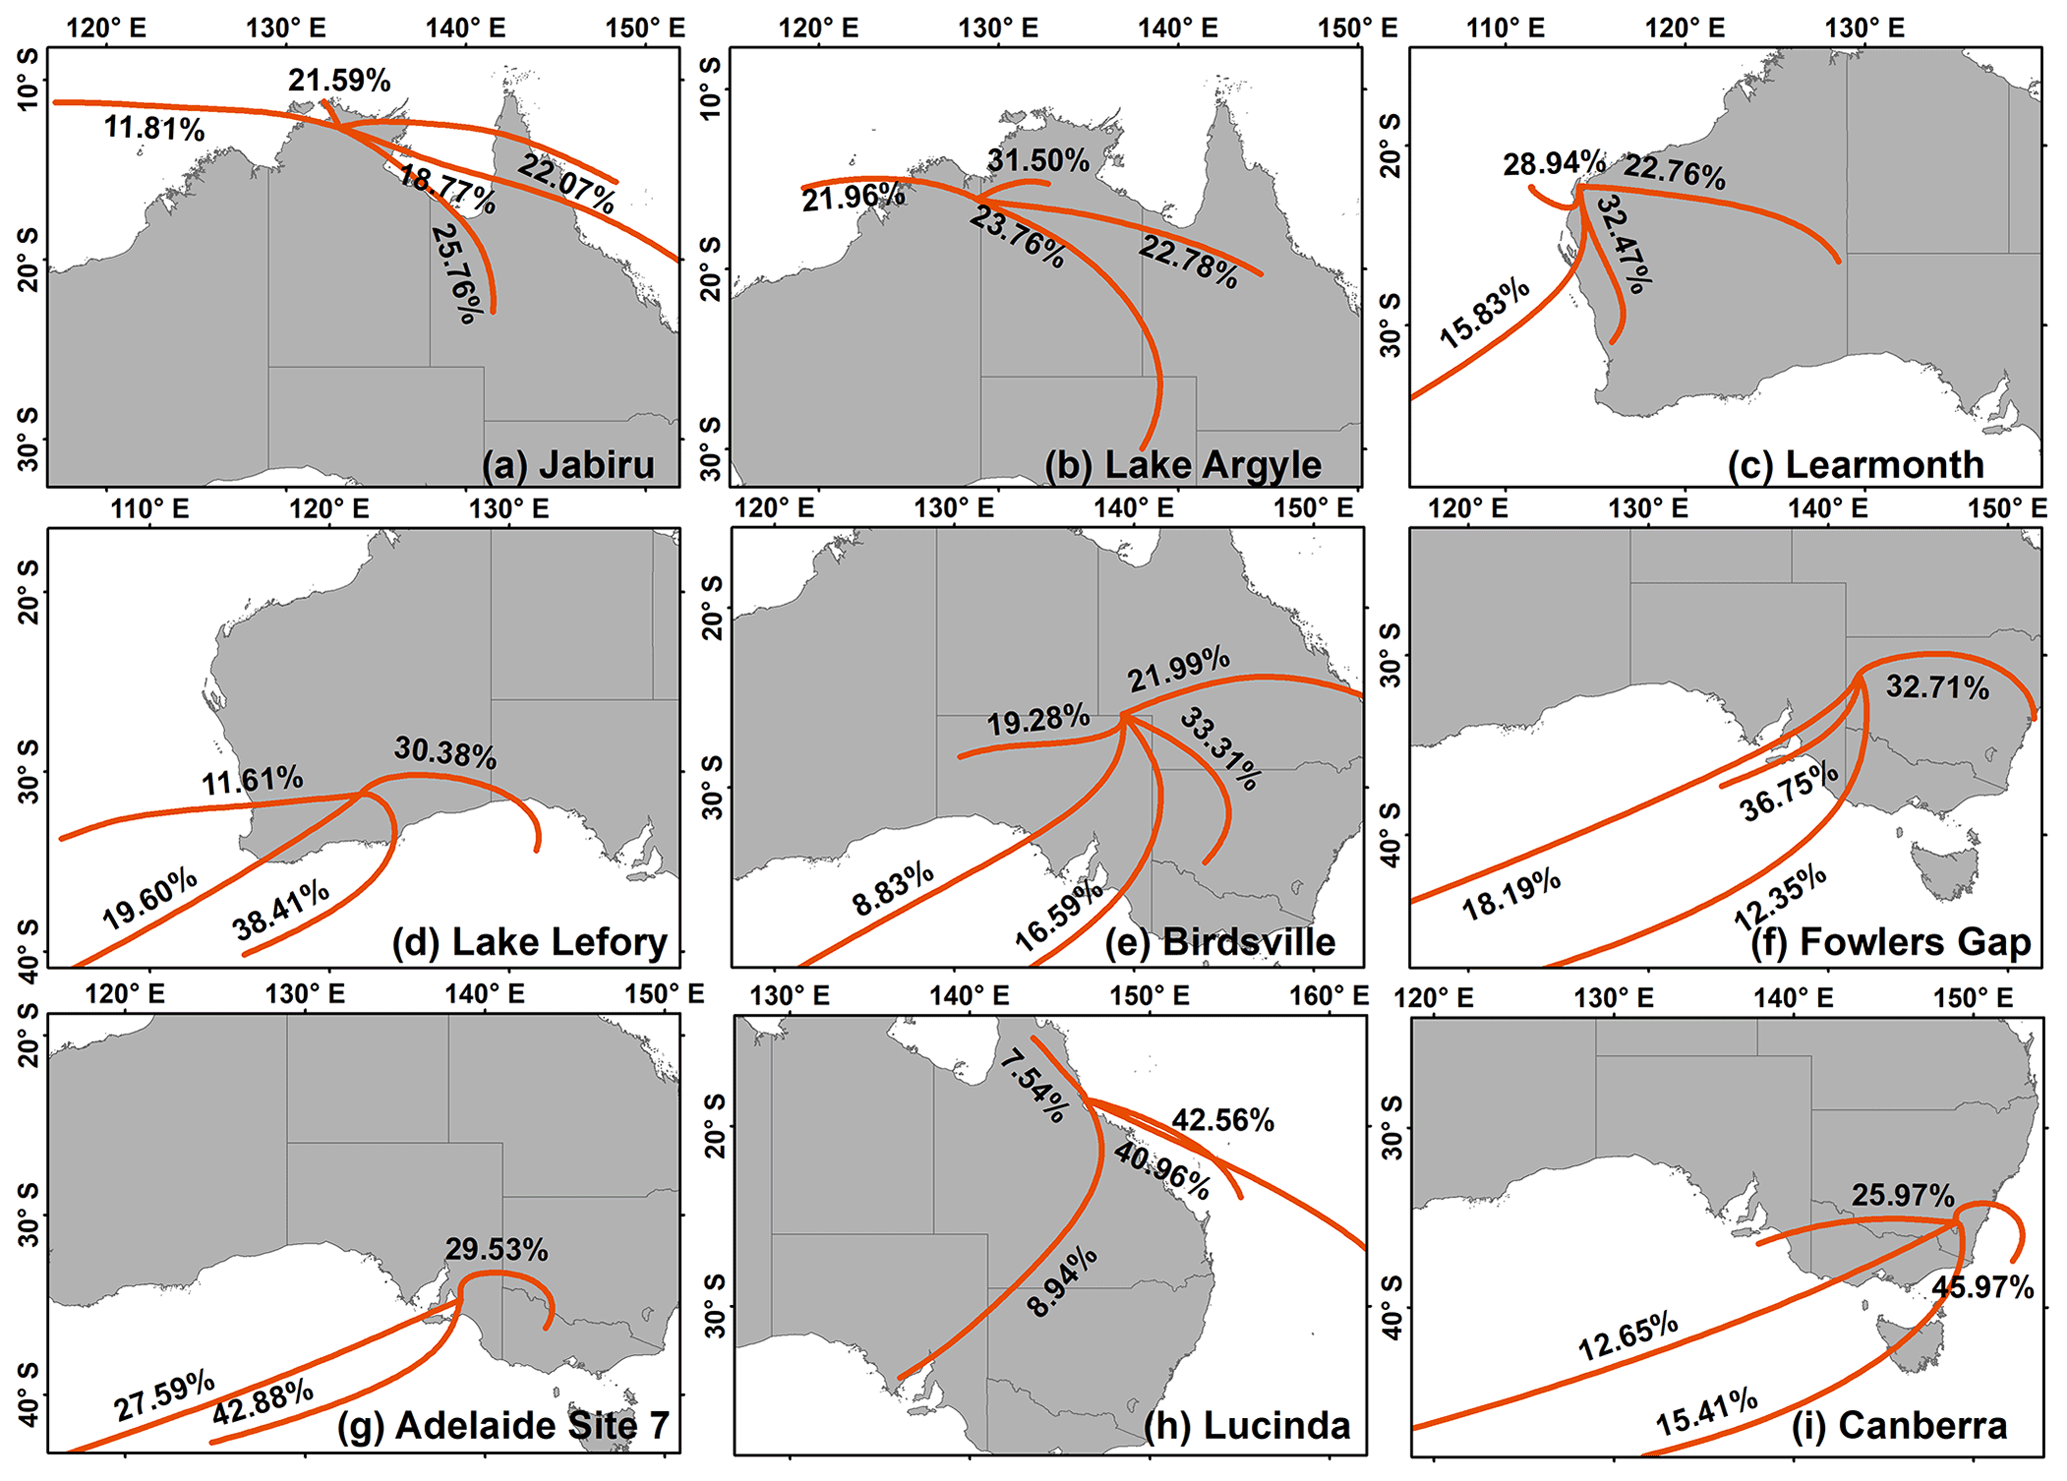
Figure 14Cluster analysis of simulated back trajectories from HYSPLIT during the period January 2005–May 2020 for air masses ending at nine AERONET sites at 500 m above ground level in Australia.
In central Australia, mixed aerosols, biomass burning, and urban/industrial aerosols were found during all seasons (Figs. 12e–g, 13e–g). Dust aerosols with high AOD (>0.15) and low AE (<0.5) were abundant at Birdsville and Fowlers Gap during spring, summer, and fall, while clean marine aerosols were observed during fall and spring. Different aerosol types can be found under relatively clean atmospheric conditions with AOD <0.2 and AE <1.5 at Adelaide Site 7. The annual averaged back trajectories ending at Birdsville showed that the southern (25.42 %) and southwestern (19.28 %) airflows may bring the clean marine aerosols and dust aerosols from the Indian Ocean and Lake Eyre Basin to Birdsville (Fig. 14e). Seasonal trajectories showed that 50 % of the airflow at Birdsville was from eastern and southeastern Australia during the four seasons, which evidenced the biomass burning aerosols transport, especially during spring and summer (Fig. S5). This was supported by the findings of Qin et al. (2009), who demonstrated that smoke generated from fires in Canberra could be transported over 1500 km across New South Wales to central Australia. The annual (seasonal) averaged back trajectories ending at Fowlers Gap and Adelaide Site 7 showed that more than 67 % (46 %) of airflow was originated mainly from the Indian Ocean, which could transport clean marine aerosols to the two sites (Figs. 14f, g, S5). Further, 32.71 % and 29.53 % of airflows at Fowlers Gap and Adelaide Site 7 were from southeastern Australia, which implied a possible transport of biomass burning aerosols.
In eastern Australia, different aerosol types (e.g., clean marine aerosols, dust, mixed aerosols) were observed at Lucinda during all seasons (Figs. 12h, 13h). The annual and seasonal trajectories showed that the Lake Eyre Basin is a region with an important contribution of dust aerosols to the Lucinda site (Figs. 14h, S6). Furthermore, the marine aerosols from the southeastern ocean probably contribute to the presence of coarse particles over the Lucinda site. The Canberra site exhibited a wide range of AOD values and high AE values ranging from ∼ 1.5 to ∼ 2.5, which indicated the existence of biomass burning and urban/industrial aerosols during all seasons (Figs. 12i, 13i). Many previous studies also showed that urban/industrial aerosols and biomass burning aerosols were the main components of aerosols at Canberra (Qin et al., 2009; Mitchell et al., 2006; Provençal et al., 2017). Moreover, clean marine and dust aerosols were abundant during fall and winter, which was associated with its location in coastal areas and southeast dust transport corridors (McGowan and Clark., 2008). Figures 14i and S6 suggest that air masses originated mainly from the Indian Ocean (>50 %), crossing the regions that are affected by wildfires during the spring and summer season and reaching the Canberra site, which indicated a possible transport of biomass burning and clean marine aerosols from forest regions and ocean, respectively.
3.2.3 Spatiotemporal characteristics of different aerosol types
MERRA-2 data were used to determine the contribution of different kinds of aerosols to the AOD over Australia. We should note that the AERONET-based aerosol types show similar spatial distributions to using the MERRA-2-based aerosol types, while they are slightly different in aerosol types classified. Considering the similar emission sources of organic carbon and black carbon aerosols, we combined the two as carbonaceous aerosols for analysis. Carbonaceous aerosols and sulfate aerosols are produced from biomass burning, fossil fuel combustion, and biofuel consumption, while dust and sea salt aerosols mainly originate from natural emissions (Randles et al., 2017). The spatial distributions of carbonaceous, dust, sulfate, and sea salt AOD over the Australian continent are shown in Fig. 15. Carbonaceous aerosols were mainly distributed in northern and southeastern Australia. Carbonaceous aerosols in these two regions could be highly related to the fires in the grasslands, forests, and croplands during the dry seasons. Dust aerosols were mainly distributed in the central plains of Australia. The dust aerosols over the central plains primarily originated from the Lake Eyre Basin, one of the Southern Hemisphere's most significant dust sources. Mukkavilli et al. (2019) found that the spatial distributions of dust aerosols across Australia demonstrated concentrated values in the Lake Eyre Basin using the ECMWF Monitoring Atmospheric Composition and Climate (MACC) reanalysis product. Sulfate aerosols were mainly observed in the northwestern (such as Darwin) and southeastern (such as Melbourne, Canberra, and Sydney) Australian coastal regions, where human activities were highly frequent. The near-coastal region generally had higher sea salt aerosol loadings than the continental interior region due to the land–sea breeze effects. Prijith et al. (2014) found that the higher wind speed would lead to more sea salt aerosol formation, and the corresponding shorter transport time would lead to weaker loss. Sea salt aerosols had a relatively large impact on the northern coastal regions of Australia, which was mostly due to the higher wind speeds on the northern coast (Fig. S2). Overall, carbonaceous aerosol over northern Australia, dust over central Australia, sulfate over densely populated northwestern and southeastern Australia, and sea salt over Australian coastal regions were the major types of atmospheric aerosols in Australia.

Figure 15Spatial distributions of carbonaceous (a), dust (b), sulfate (c), and sea salt (d) AOD derived from the MERRA-2 monthly dataset during the period 2002–2020 in Australia.
To determine the temporal distributions of different kinds of aerosols in Australia, seasonal variation analyses of aerosols are performed. Figure 16 shows the seasonal variations of carbonaceous, dust, sulfate, and sea salt aerosols in Australia. Generally, carbonaceous AODs in northern regions were much higher than those in southern and southwestern regions in all seasons. High carbonaceous AOD values were observed in northern Australia during spring and southeastern Australia during summer. This was consistent with our findings in seasonal distributions of MODIS AOD in Australia. Further, both the northern and eastern Australian atmosphere were influenced by carbonaceous aerosols in spring. During spring and summer, northern and southern Australia experienced warm, dry, and high wind speed weather conditions, which increased the occurrence frequency and development of extreme wildfires. The carbonaceous AODs declined in fall and winter in Australia due to the decreasing occurrence frequency of biomass burning. Central Australia was always the relatively high dust AOD center in the four seasons. Further, higher dust AOD values were observed in spring, and summer and lower dust AOD values were observed in fall and winter. This seasonality of dust aerosols was consistent with the results of Mukkavilli et al. (2019) and Ridley et al. (2016). The near-coastal regions of Australia generally had higher wind speeds and precipitation than the continental interior regions (Fig. S2). Therefore, these regions had lower dust storm activities than the continental interior regions. In contrast, the west, central, and parts of the south Australian continents had dry spring and summer, which enhanced the dust storm occurrence frequency. The frequencies of dust storms in central Australia showed strong seasonal dependency on the frontal activity (i.e., pre-frontal northerly, frontal westerly and post-frontal southerly winds) (Baddock et al., 2015; Strong et al., 2011). During the austral winter, high-pressure systems were situated in the middle of the continent and blocked the fronts from reaching the continent, which helped the formation of stable weather conditions with little dust entrainment. During late spring and early summer, the high-pressure systems shifted southwards with frontogenesis arising, which increased the chances of occurrence of dust storms (Strong et al., 2011; Ekström et al., 2004). High sulfate AODs were observed in densely populated coastal urban regions in southeast and northwest Australia during spring and summer, while low sulfate AODs were observed during fall and winter. The high sulfate AODs during spring and summer could be a result of the high local emissions from industrial activities and biomass burning, along with the adverse meteorological conditions such as low wind speeds and weak precipitation. Sea salt AODs showed a decreasing trend from the coast to the further inland regions in all seasons. High sea salt AOD values were observed in northeast coastal regions. Further, high sea salt AOD values appeared in summer and fall, while low sea salt AOD values appeared in spring and winter. Actually, many studies have identified the large increase of coarse-mode sea salt aerosols at coastal regions of northern Australia during the wet season (i.e., November–April) (Bouya et al., 2010; Radhi et al., 2012).
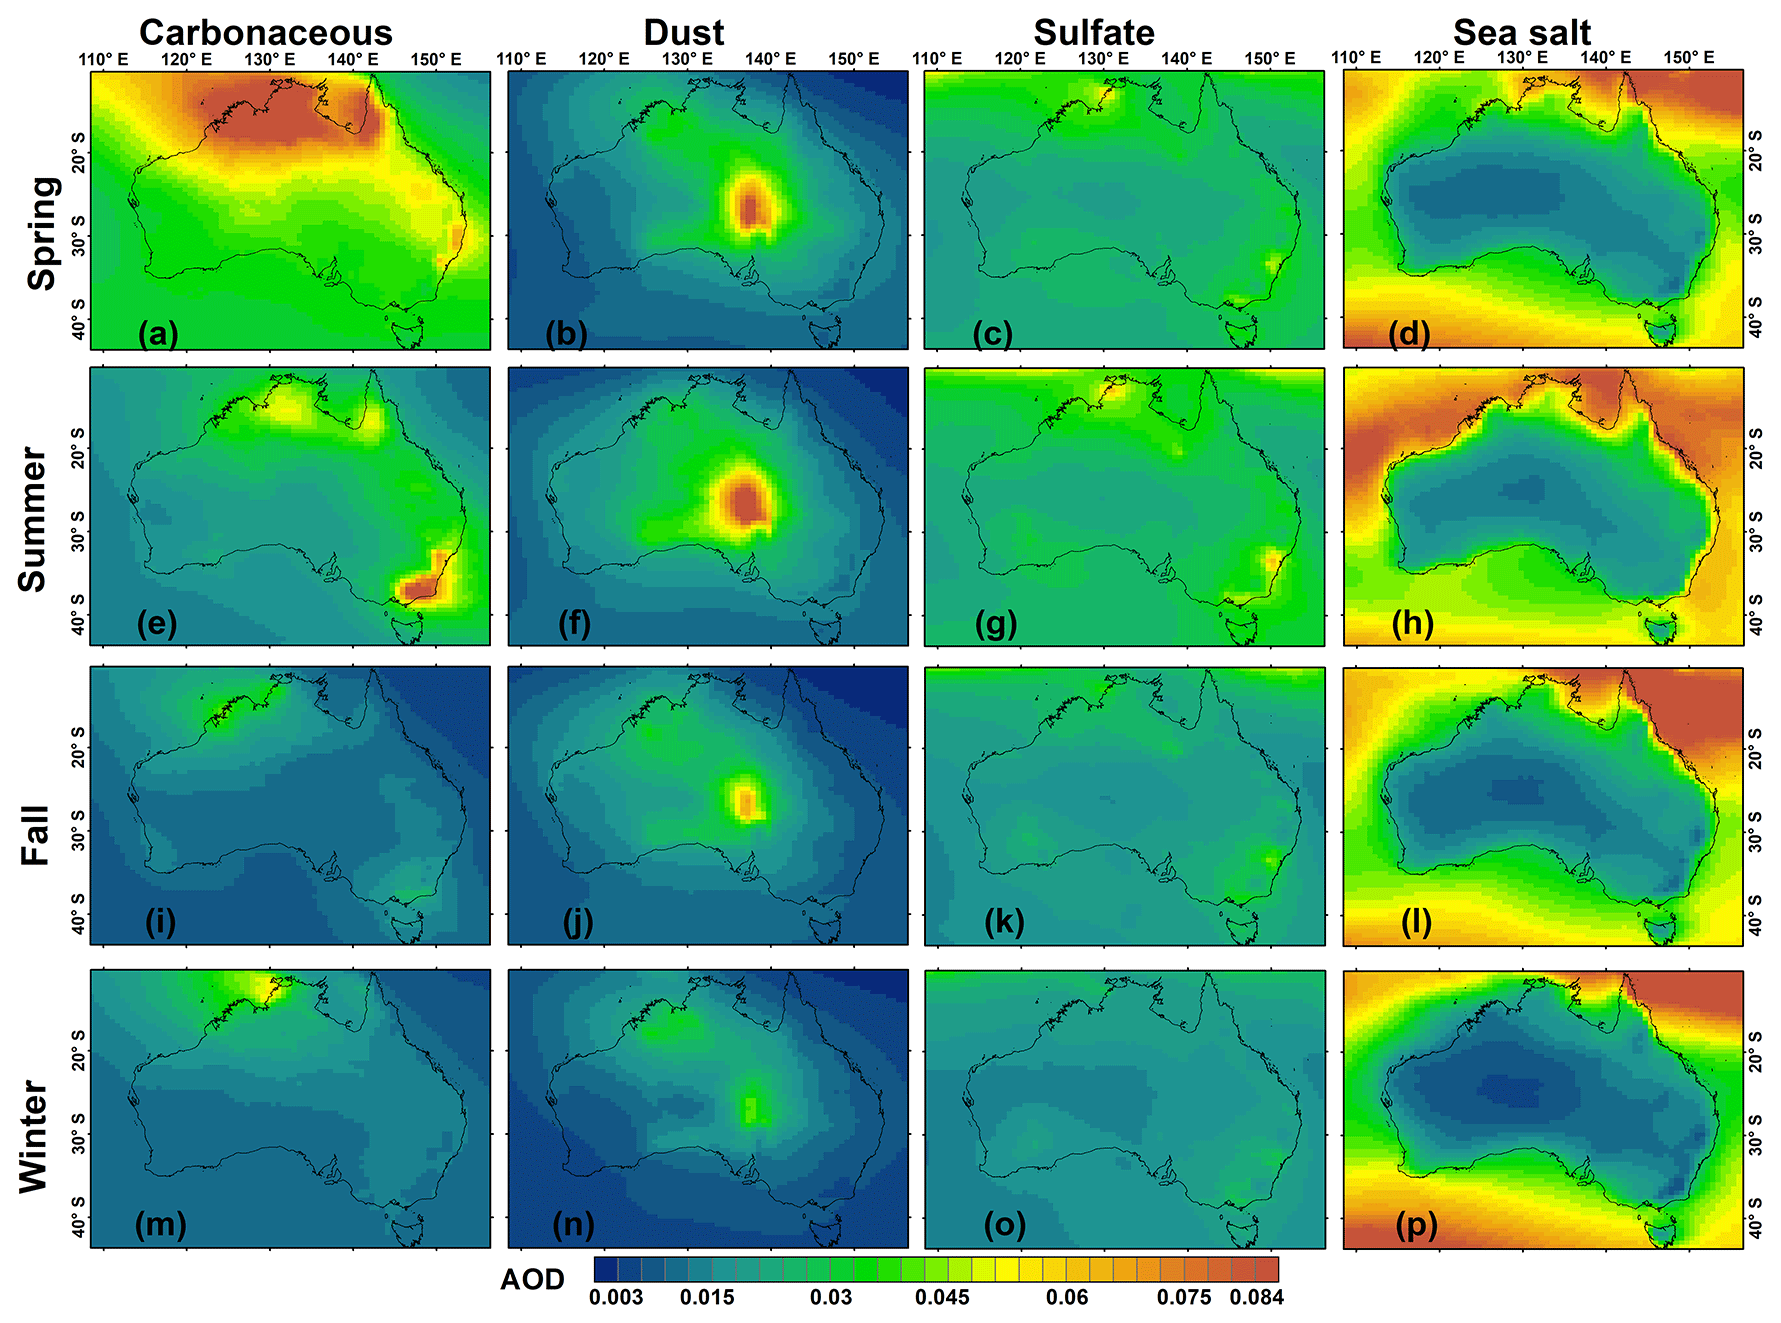
Figure 16Spatial distributions of carbonaceous, dust, sulfate, and sea salt AOD derived from MERRA-2 monthly dataset in each season during the period 2002–2020 in Australia.
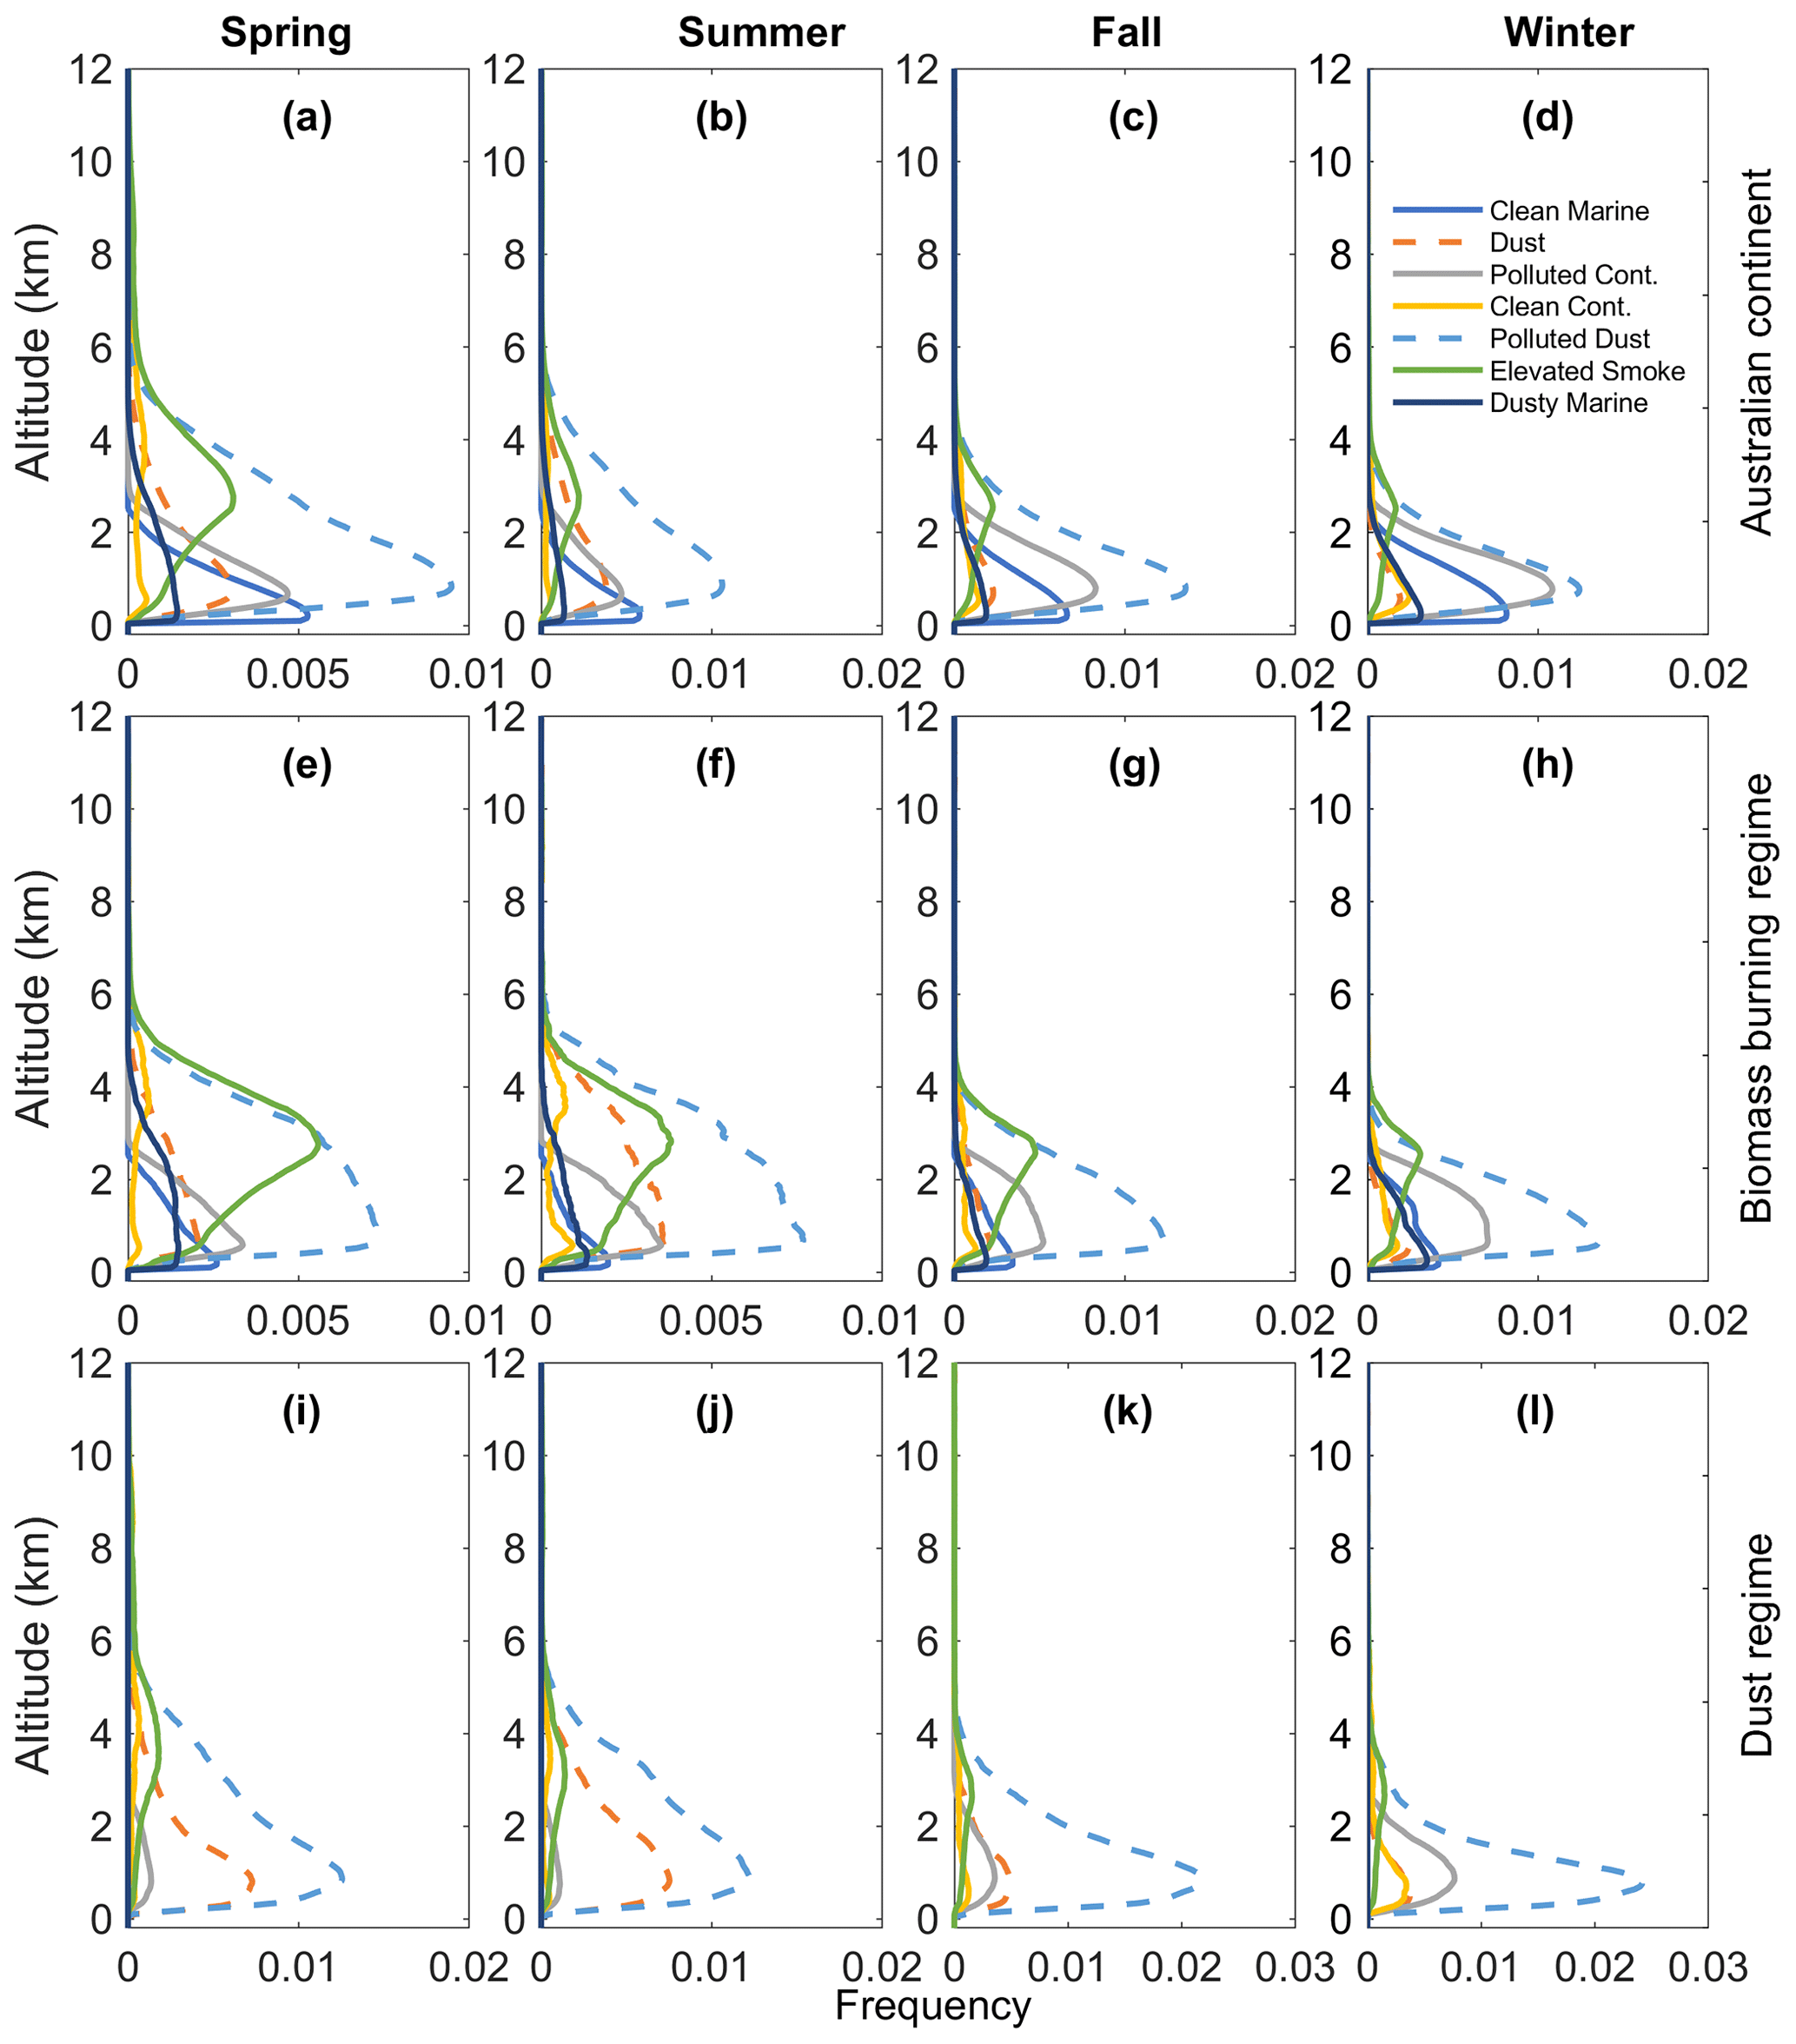
Figure 17Occurrence frequency profile of each aerosol type in the four seasons from the 15-year CALIPSO L3 aerosol profile data product in Australian continent (a–d), the biomass burning regime (e–h), and the desert regime (i–l).
3.3 Vertical distribution of aerosol optical properties
The CALIPSO aerosol product can provide the profiles of aerosol optical properties. Thus, three domains are chosen to explore the vertical distribution of various aerosol types in Australia, as shown in Fig. S7. The first domain covers most of the Australian continent (blue shaded region), where carbonaceous aerosol over northern Australia and dust over central Australia are the major types of atmospheric aerosols. The second domain includes parts of the Northern Territory, western Australia, and Queensland (deep purple shaded region), where biomass burning aerosol dominates. The third domain includes parts of the Northern Territory, Southern Australia, New South Wales, and Queensland (gray shaded region), where dust aerosol is abundant.
Figure 17a–d show the averaged occurrence frequency profile of each aerosol type in each season from 15-year CALIPSO observations in the whole of Australia (blue shade region in Fig. S7). In general, polluted dust was the dominant aerosol type detected roughly from 0.5–6 km during spring and summer and roughly from 0.5–4 km during fall and winter. The altitude with the peak occurrence frequency (>9 %) of the polluted dust was ∼ 1 km throughout the year. Burton et al. (2013) have pointed out that the polluted dust was defined as a mixed aerosol type to represent mixtures of dust and biomass burning smoke. Further, the aerosol types classified by AERONET over Australia also indicated that the mixed type of aerosols (mostly biomass burning and dust) is the dominant type during all seasons. The result suggested the significant impacts of both biomass burning and desert emissions in Australia. Polluted continental aerosol was the secondary dominant aerosol type detected approximately at heights from 1–2 km, with higher occurrence frequency during fall and winter than that during spring and fall. The occurrence frequency of clean marine aerosol was the largest at the surface and decreased with altitude. The occurrence frequency of elevated smoke increased with height at 0–3 km and then decreased with height at 3–12 km. Elevated smoke was the secondary dominant aerosol type detected approximately at heights from 2–5 km during all seasons, the dominant aerosol type at 6–12 km during spring and summer, and the dominant aerosol type at 6–8 km during fall and winter. Dust with an occurrence frequency larger than 0.1 % can reach as high as 12 km. Dust was detected more frequently at height approximately from 0–6 km in all seasons. Further, the occurrence frequency of the dust was significantly higher in summer than in other three seasons, which was consistent with the observations of MERRA-2.
The vertical profile of occurrence frequency for each type of aerosol in each season over the biomass burning regime in Australia (deep purple shade region in Fig. S7) is presented in Fig. 17e–h. Polluted dust was the dominant aerosol type at heights approximately from 0.5–3 km during all seasons except for summer when polluted dust dominated at heights roughly from 0.5–6 km. The largest occurrence frequency of polluted dust was observed at heights from 0–2 km during fall. The wind fields in fall (Fig. S2c) and the back trajectory at Jabiru and Lake Argyle (Fig. 14a, b) revealed that the airflows passed over the Lake Eyre Basin before reaching the biomass burning regime areas. Those airflows brought a large amount of dust from the Lake Eyre Basin, which then got mixed with the biomass burning aerosols, resulting in the increasing occurrence frequency of polluted dust during fall. The results confirmed the existence of dust aerosols in northern Australia, which were mostly generated along with fires and transported from southern inland deserts. The altitude with peak occurrence frequency (∼ 5 %) for elevated smoke was ∼ 3 km throughout the year. An even higher occurrence frequency of elevated smoke was observed at heights from 2–4 km in spring, consistent with the result of prevalence of biomass burning aerosol in spring at Lake Argyle, which is located in the biomass burning regime. Polluted continental aerosol was the secondary dominant aerosol type at heights from 0.5–2 km, with a higher occurrence frequency during fall and winter than during spring and summer. In addition, the dust occurrence frequency increased with height from 0–4 km during summer. The finding was consistent with the results shown in Fig. 16, which showed high dust aerosol loadings in the biomass burning regime areas during summer.
Figure 17i–l show the occurrence frequency of aerosol type in the four seasons over the desert regime in Australia (gray shaded region in Fig. S7). Similar to the biomass burning regime areas, polluted dust was the dominant aerosol type at heights from 0–5 km, with higher occurrence frequency (>10 %) during fall and winter. Similar results were reported by Huang et al. (2013), who found that the aerosol characteristics in western Australia were closer to that in the biomass burning regime rather than that in other desert regimes such as North Africa and west China. There were two likely main reasons. First, the continent had relatively low topographical relief, and the arid regions were old and highly weathered. Thus, fine particles were blown away a long time ago (Prospero et al., 2002). Second, the atmosphere of central Australia was affected by the biomass burning aerosols transported from eastern and southeastern Australia as discussed earlier. In addition, the elevated smoke was the dominant type at heights above 5 km in all seasons except winter when the elevated smoke was dominant at heights above 3 km. The smoke in the desert regime was mostly transported from eastern and southeastern Australia (Fig. 14). However, there were significant differences in aerosol types between biomass burning and dust regime areas. Dust was the secondary dominant aerosol type at heights from 0–3 km in spring, from 0–4 km in summer, and from 0–2 km in fall. The altitude with the peak occurrence frequency of dust was ∼ 1 km throughout the year. Furthermore, there were no clean marine and dusty marine aerosols in the desert regime areas due to its location far away from the ocean. Although polluted dust was the dominant aerosol type at heights from 0–5 km over the desert regime, the occurrence frequency of dust significantly increased at heights from 0–3 km. Furthermore, higher occurrence frequencies of the polluted dust were found during all seasons over the desert regime than those over the biomass burning regime.
In general, results from CALIPSO indicated that the dominant aerosol type at heights from ∼ 0.5 to ∼ 3 km in Australia was polluted dust, which was consistent with the aerosol classification results at the nine AERONET sites. This resulted from the regional transport of aerosols over Australia, especially for biomass burning and dust aerosols. However, the dust-prone characteristic of aerosol was more prominent in central Australia, while the biomass-burning-prone characteristic of aerosol was more prominent in northern Australia.
In this study, long-term spatiotemporal variations of aerosol optical properties in Australia were analyzed using a combination of ground-based and satellite aerosol products. Two different methods based on the different combinations of aerosol optical properties from AERONET products were used to classify the aerosol types at nine sites. Furthermore, the spatiotemporal variations and vertical distributions of different aerosol species were analyzed using MERRA-2 and CALIPSO data. The main conclusions of the study are as follows.
-
The annual averaged AOD at most Australia sites showed increasing trends (0.002 to 0.029 yr−1) during the observation period except for Canberra, Jabiru, and Lake Argyle, at which the AOD showed decreasing trends (−0.005 to −0.002 yr−1). By contrast, the annual averaged AE presented decreasing trends at most sites (−0.045 to −0.005 yr−1). There was a clear seasonal variation in AOD, with high values in austral spring and summer and low values in austral fall and winter. However, the seasonal variations of AE were weaker, with the highest mean values in spring at most sites. Furthermore, the monthly variation of AOD tends to have a unimodal distribution with peak values in September–January at most sites, which were located in warm and rainy regions. In contrast, the monthly variation of AOD at those sites in arid regions tends more to have a bimodal distribution, showing dual peaks in austral spring and summer.
-
During the period July 2002–May 2020, the annual average MODIS AOD showed a weak decreasing trend (−0.0003 yr−1) in Australia. The spatial distribution of annual mean MODIS AOD showed obvious spatial heterogeneity, with higher values in east than in west Australia. High aerosol loadings were observed in the Australian tropical savanna regions, Lake Eyre Basin, and southeastern regions of Australia, while low aerosol loadings were observed over the arid region in western Australia. High AOD values were observed in spring and summer, while low AOD values were observed in fall and winter. The AOD increased from August until January of the following year in northern, central, and eastern Australia, which was most likely related to the biomass burning and dust storms.
-
The mixed type of aerosols (biomass burning and dust aerosols) was dominant in all seasons identified at nine sites. The biomass burning aerosol was the second dominant contributor to the aerosol composition at Jabiru and Lake Argyle, while the dust aerosol was the second dominant aerosol type at Birdsville, Fowlers Gap, Adelaide Site 7, Lucinda, and Learmonth. Clean marine and urban/industrial aerosols were observed at most sites such as Lake Lefory and Canberra. Spatially, aerosols in Australia were mainly carbonaceous over the northern regions, dust over the central regions, sulfate over densely populated northwestern and southeastern regions, and sea salt over coastal regions. Seasonal variations of carbonaceous, dust, sulfate, and sea salt AODs in Australia generally showed high values in spring and summer and low values in fall and winter. Furthermore, the results from CALIPSO showed that clean marine aerosol and polluted dust were the dominant aerosol types at heights approximately from 0–5 km in all seasons, while polluted continental aerosol was the secondary dominant aerosol type at heights from 1–2 km, and elevated smoke was the secondary dominant aerosol type at heights from 2–5 km in Australia. Australian aerosol tends to have similar source characteristics due to regional transport of aerosols in Australia, especially for biomass burning and dust aerosols. However, the dust-prone characteristic of aerosol was more prominent in central Australia, while the biomass-burning-prone characteristic of aerosol was more prominent in northern Australia.
The results of this study provide significant information on aerosol optical properties in Australia. Of course, there are still several limitations. First, only nine AERONET sites were used, which may not be sufficient to fully reveal aerosol optical properties in Australia. Thus, in the future, more in-depth analyses should be made using long-term ground-based measurements at more sites and short-term field campaigns in conjunction with satellite remote sensing. Second, only two aerosol classification methods were used to distinguish the aerosol types at nine AERONET sites, which could pose a potential threat to the accuracy of the classification results of aerosol types. Hence, more aerosol classification methods and aerosol optical parameters (e.g., fine-mode fraction (FMF), extinction Ångström exponent (EAE), absorption Ångström exponent (AAE), real and imaginary refractive indices (RRI and IRI respectively), and asymmetry parameter (ASY)) could be used to determine the aerosol types in Australia.
The Australian DEM data are provided by the Australian public data website (https://data.gov.au/data/, Geoscience Australia, 2011). The Dynamic Land Cover Dataset (DLCD) is provided by Geoscience Australia (http://www.ga.gov.au/scientific-topics/earth-obs/accessing-satellite-imagery/landcover, Lymburner et al., 2015). The AERONET dataset can be found at https://aeronet.gsfc.nasa.gov/ (NASA, 2016). Aqua MODIS AOD data were retrieved from the Atmosphere Archive and Distribution System Distributed Active Archive Center (LAADS DAAC; https://ladsweb.modaps.eosdis.nasa.gov/, Levy et al., 2015). HYSPLIT data are accessible through the NOAA READY website (http://www.ready.noaa.gov, NOAA, 2016). MERRA-2 Reanalysis data were provided by the NASA Global Modeling and Assimilation Office (https://gmao.gsfc.nasa.gov/reanalysis/MERRA-2/, Global Modeling and Assimilation Office (GMAO), 2015). ERA-5 Reanalysis data were provided by the European Centre for Medium Weather Forecasts (https://cds.climate.copernicus.eu/, Hersbach et al., 2019). The CALIPSO data were downloaded from the NASA's website (https://www-calipso.larc.nasa.gov/, NASA/LARC/SD/ASDC, 2019).
The supplement related to this article is available online at: https://doi.org/10.5194/acp-21-3803-2021-supplement.
CFZ and XCY developed the ideas and designed the study. YKY contributed to collection and analyses of CALIPSO aerosol data. XCY performed the analysis and prepared the manuscript. HF provided constructive comments on this research. All authors made substantial contributions to this work.
The authors declare that they have no conflict of interest.
This research was supported by the National Natural Science Foundation of China (grant no. 41925022), the China National Key R&D Program (2019YFA0606803), and the State Key Laboratory of Earth Surface Processes and Resource Ecology. The authors would like to thank the CALIPSO team, NASA AERONET, NASA Goddard Space Flight Center (GSFC), and NASA Global Modeling and Assimilation Office (GMAO) for providing aerosol optical properties' data. We also thank the European Centre for Medium-Range Weather Forecasts team for processing and distributing the ERA-5 data.
This research has been supported by the National Natural Science Foundation of China (grant no. 41925022), the China National Key R&D Program (grant no. 2019YFA0606803), and the State Key Laboratory of Earth Surface Processes and Resource Ecology.
This paper was edited by Xiaohong Liu and reviewed by three anonymous referees.
Albergel, C., Dutra, E., Munier, S., Calvet, J.-C., Munoz-Sabater, J., de Rosnay, P., and Balsamo, G.: ERA-5 and ERA-Interim driven ISBA land surface model simulations: which one performs better?, Hydrol. Earth Syst. Sci., 22, 3515–3532, https://doi.org/10.5194/hess-22-3515-2018, 2018.
Albrecht, B. A.: Aerosols, Cloud Microphysics, and Fractional Cloudiness, Science, 245, 1227–1230, https://doi.org/10.1126/science.245.4923.1227, 1989.
Baddock, M., Parsons, K., Strong, C., Leys, J., and Mctainsh, G.: Drivers of Australian dust: a case study of frontal winds and dust dynamics in the lower lake Eyre basin, Earth Surf. Proc. Land., 40, 1982–1988, 2015.
Bouya, Z., Box, G. P., and Box, M. A.: Seasonal variability of aerosol optical properties in Darwin, Australia, J. Atmos. Sol.-Terr. Phys., 72, 726–739, https://doi.org/10.1016/j.jastp.2010.03.015, 2010.
Bouya, Z. and Box, G. P.: Seasonal variation of aerosol size distributions in Darwin, Australia, J. Atmos. Sol.-Terr. Phys., 73, 2022–2033, https://doi.org/10.1016/j.jastp.2011.06.016, 2011.
Buchard, V., Randles, C. A., da Silva, A. M., Darmenov, A., Colarco, P. R., Govindaraju, R., Ferrare, R., Hair, J., Beyersdorf, A. J., Ziemba, L. D., and Yu, H.: The MERRA-2 Aerosol Reanalysis, 1980 Onward. Part II: Evaluation and Case Studies, J. Climate, 30, 6851–6872, https://doi.org/10.1175/jcli-d-16-0613.1, 2017.
Burton, S. P., Ferrare, R. A., Vaughan, M. A., Omar, A. H., Rogers, R. R., Hostetler, C. A., and Hair, J. W.: Aerosol classification from airborne HSRL and comparisons with the CALIPSO vertical feature mask, Atmos. Meas. Tech., 6, 1397–1412, https://doi.org/10.5194/amt-6-1397-2013, 2013.
Chan, Y.-C., McTainsh, G., Leys, J., McGowan, H., and Tews, K.: Influence of the 23 October 2002 Dust Storm on the Air Quality of Four Australian Cities, Water Air Soil Poll., 164, 329–348, https://doi.org/10.1007/s11270-005-4009-0, 2005.
Charlson, R. J., Schwartz, S. E., Hales, J. M., Cess, R. D., Coakley, J. A., Hansen, J. E., and Hofmann, D. J.: Climate forcing by anthropogenic aerosols, Science, 255, 423–430, 1992.
Draxler, R. R. and Hess, G. D.: An overview of the HYSPLIT_4 modelling system for trajectories, dispersion and deposition, Aust. Met. Mag, 47, 295–308, 1998.
Eck, T. F., Holben, B. N., Reid, J. S., Dubovik, O., Smirnov, A., O”Neill, N. T., Slutsker, I., and Kinne, S.: Wavelength dependence of the optical depth of biomass burning, urban, and desert dust aerosols, J. Geophys. Res.-Atmos., 104, 31333–31349, 1999.
Ekström, M., McTainsh, G. H., and Chappell, A.: Australian dust storms: temporal trends and relationships with synoptic pressure distributions (1960–99), Int. J. Climatol., 24, 1581–1599, https://doi.org/10.1002/joc.1072, 2004.
Garrett, T. J. and Zhao, C.: Increased Arctic cloud longwave emissivity associated with pollution from mid-latitudes, Nature, 440, 787–789, https://doi.org/10.1038/nature04636, 2006.
Geoscience Australia: 1 second SRTM Digital Elevation Model (DEM), Bioregional Assessment Source Dataset, available at: http://data.bioregionalassessments.gov.au/dataset/9a9284b6-eb45-4a13-97d0-91bf25f1187b (last access: 31 January 2021), 2011.
Giles, D. M., Holben, B. N., Eck, T. F., Sinyuk, A., Smirnov, A., Slutsker, I., Dickerson, R. R., Thompson, A. M., and Schafer, J. S.: An analysis of AERONET aerosol absorption properties and classifications representative of aerosol source regions, J. Geophys. Res.-Atmos., 117, https://doi.org/10.1029/2012jd018127, 2012.
Global Modeling and Assimilation Office (GMAO): MERRA-2 tavgM_2d_aer_Nx: 2d, Monthly mean, Time-averaged, Single-Level, Assimilation, Aerosol Diagnostics V5.12.4, Greenbelt, MD, USA, Goddard Earth Sciences Data and Information Services Center (GES DISC), https://doi.org/10.5067/FH9A0MLJPC7N (last access: 31 January 2021), 2015.
Hersbach, H., Bell, B., Berrisford, P., Biavati, G., Horányi, A., Muñoz Sabater, J., Nicolas, J., Peubey, C., Radu, R., Rozum, I., Schepers, D., Simmons, A., Soci, C., Dee, D., and Thépaut, J.-N: ERA5 monthly averaged data on single levels from 1979 to present. Copernicus Climate Change Service (C3S) Climate Data Store (CDS), https://doi.org/10.24381/cds.f17050d7, 2019.
Holben, B. N., Eck, T. F., Slutsker, I., Tanré, D., Buis, J. P., Setzer, A., Vermote, E., Reagan, J. A., Kaufman, Y. J., Nakajima, T., Lavenu, F., Jankowiak, I., and Smirnov, A.: AERONET–A Federated Instrument Network and Data Archive for Aerosol Characterization, Remote Sens. Environ., 66, 1–16, https://doi.org/10.1016/S0034-4257(98)00031-5, 1998.
Huang, L., Jiang, J. H., Tackett, J. L., Su, H., and Fu, R.: Seasonal and diurnal variations of aerosol extinction profile and type distribution from CALIPSO 5-year observations, J. Geophys. Res.-Atmos., 118, 4572–4596, https://doi.org/10.1002/jgrd.50407, 2013.
Karlson, L. R., Greene, R. S. B., Scott, K. M., Stelcer, E., and O'Loingsigh, T.: Characteristics of aeolian dust across northwest Australia, Aeolian Res., 12, 41–46, https://doi.org/10.1016/j.aeolia.2013.11.003, 2014.
Kaskaoutis, D. G., Kambezidis, H. D., Hatzianastassiou, N., Kosmopoulos, P. G., and Badarinath, K. V. S.: Aerosol climatology: dependence of the Angstrom exponent on wavelength over four AERONET sites, Atmos. Chem. Phys. Discuss., 7, 7347–7397, https://doi.org/10.5194/acpd-7-7347-2007, 2007.
Levy, R. and Hsu, C.: MODIS Atmosphere L2 Aerosol Product, NASA MODIS Adaptive Processing System, Goddard Space Flight Center, USA, https://doi.org/10.5067/MODIS/MYD04_L2.061 (last access: 31 January 2021), 2015.
Luhar, A. K., Mitchell, R. M., Meyer, C. P., Qin, Y., Campbell, S., Gras, J. L., and Parry, D.: Biomass burning emissions over northern Australia constrained by aerosol measurements: II–Model validation, and impacts on air quality and radiative forcing, Atmospheric Environment, 42, 1647–1664, https://doi.org/10.1016/j.atmosenv.2007.12.040, 2008.
Lymburner, L., Tan, P., McIntyre, A., Thankappan, M., and Sixsmith, J.: Dynamic Land Cover Dataset Version 2.1. Geoscience Australia, Canberra, available at: http://pid.geoscience.gov.au/dataset/ga/83868 (last access: 31 January 2021), 2015.
Mallet, M. D., Desservettaz, M. J., Miljevic, B., Milic, A., Ristovski, Z. D., Alroe, J., Cravigan, L. T., Jayaratne, E. R., Paton-Walsh, C., Griffith, D. W. T., Wilson, S. R., Kettlewell, G., van der Schoot, M. V., Selleck, P., Reisen, F., Lawson, S. J., Ward, J., Harnwell, J., Cheng, M., Gillett, R. W., Molloy, S. B., Howard, D., Nelson, P. F., Morrison, A. L., Edwards, G. C., Williams, A. G., Chambers, S. D., Werczynski, S., Williams, L. R., Winton, V. H. L., Atkinson, B., Wang, X., and Keywood, M. D.: Biomass burning emissions in north Australia during the early dry season: an overview of the 2014 SAFIRED campaign, Atmos. Chem. Phys., 17, 13681–13697, https://doi.org/10.5194/acp-17-13681-2017, 2017.
McGowan, H. and Clark, A.: Identification of dust transport pathways from Lake Eyre, Australia using Hysplit, Atmos. Environ., 42, 6915–6925, https://doi.org/10.1016/j.atmosenv.2008.05.053, 2008.
Mehta, M., Singh, R., Singh, A., Singh, N., and Anshumali: Recent global aerosol optical depth variations and trends – A comparative study using MODIS and MISR level 3 datasets, Remote Sens. Environ., 181, 137–150, https://doi.org/10.1016/j.rse.2016.04.004, 2016.
Mehta, M., Singh, N., and Anshumali: Global trends of columnar and vertically distributed properties of aerosols with emphasis on dust, polluted dust and smoke - inferences from 10-year long CALIOP observations, Remote Sens. Environ., 208, 120–132, https://doi.org/10.1016/j.rse.2018.02.017, 2018.
Mishra, A. K. and Shibata, T.: Synergistic analyses of optical and microphysical properties of agricultural crop residue burning aerosols over the Indo-Gangetic Basin (IGB), Atmos. Environ.t, 57, 205–218, https://doi.org/10.1016/j.atmosenv.2012.04.025, 2012.
Mitchell, R. M., O'Brien, D. M., and Campbell, S. K.: Characteristics and radiative impact of the aerosol generated by the Canberra firestorm of January 2003, J. Geophys. Res.-Atmos., 111, D02204, https://doi.org/10.1029/2005jd006304, 2006.
Mitchell, R. M., Campbell, S. K., and Qin, Y.: Recent increase in aerosol loading over the Australian arid zone, Atmos. Chem. Phys., 10, 1689–1699, https://doi.org/10.5194/acp-10-1689-2010, 2010.
Mitchell, R. M., Forgan, B. W., Campbell, S. K., and Qin, Y.: The climatology of Australian tropical aerosol: Evidence for regional correlation, Geophys. Res. Lett., 40, 2384–2389, https://doi.org/10.1002/grl.50403, 2013.
Mitchell, R. M., Forgan, B. W., and Campbell, S. K.: The Climatology of Australian Aerosol, Atmos. Chem. Phys., 17, 5131–5154, https://doi.org/10.5194/acp-17-5131-2017, 2017.
Mukkavilli, S. K., Prasad, A. A., Taylor, R. A., Huang, J., Mitchell, R. M., Troccoli, A., and Kay, M. J.: Assessment of atmospheric aerosols from two reanalysis products over Australia, Atmos. Res., 215, 149–164, https://doi.org/10.1016/j.atmosres.2018.08.026, 2019.
NASA: Aerosol optical depth (V3), solar and aerosol inversions (V3), Goddard Space Flight Center, USA, available at: https://aeronet.gsfc.nasa.gov/ (last access: 31 January 2021), 2016.
NASA/LARC/SD/ASDC: CALIPSO Lidar Level 3 Tropospheric Aerosol Profiles, Cloud Free Data, Standard V4-20 [Data set], NASA Langley Atmospheric Science Data Center DAAC, retrieved from: https://doi.org/10.5067/CALIOP/ (last access: 31 January 2021), 2019.
NOAA: GDAS – Daily Tar Files (1∘ by 1∘), NCEI's NOAA National Operational Model Archive and Distribution System (NOMADS), ftp://ftp.arl.noaa.gov/pub/archives/gdas1 (last access: 31 January 2021), 2016.
Omar, A. H., Winker, D. M., Tackett, J. L., Giles, D. M., Kar, J., Liu, Z., Vaughan, M. A., Powell, K. A., and Trepte, C. R.: CALIOP and AERONET aerosol optical depth comparisons: One size fits none, J. Geophys. Res.-Atmos., 118, 4748–4766, https://doi.org/10.1002/jgrd.50330, 2013.
Paton-Walsh, C., Jones, N., Wilson, S., Meier, A., Deutscher, N., Griffith, D., Mitchell, R., and Campbell, S.: Trace gas emissions from biomass burning inferred from aerosol optical depth, Geophys. Res. Lett., 31, L05116, https://doi.org/10.1029/2003gl018973, 2004.
Paton-Walsh, C., Guérette, É.-A., Kubistin, D., Humphries, R., Wilson, S. R., Dominick, D., Galbally, I., Buchholz, R., Bhujel, M., Chambers, S., Cheng, M., Cope, M., Davy, P., Emmerson, K., Griffith, D. W. T., Griffiths, A., Keywood, M., Lawson, S., Molloy, S., Rea, G., Selleck, P., Shi, X., Simmons, J., and Velazco, V.: The MUMBA campaign: measurements of urban, marine and biogenic air, Earth Syst. Sci. Data, 9, 349–362, https://doi.org/10.5194/essd-9-349-2017, 2017.
Pope, C. A., Burnett, R. T., Krewski, D., Jerrett, M., Shi, Y., Calle, E. E., and Thun, M. J.: Cardiovascular mortality and exposure to airborne fine particulate matter and cigarette smoke: shape of the exposure-response relationship, Circulation, 120, 941–948, https://doi.org/10.1161/circulationaha.109.857888, 2009.
Prijith, S. S., Aloysius, M., and Mohan, M.: Relationship between wind speed and sea salt aerosol production: A new approach, J. Atmos. Sol.-Terr. Phys., 108, 34–40, https://doi.org/10.1016/j.jastp.2013.12.009, 2014.
Prospero, J. M., Ginoux, P., Torres, O., Nicholson, S. E., and Gill, T. E.: Environmental Characterization of Global Sources of Atmospheric Soil Dust identified with the Nimbus 7 Total Ozone Mapping Spectrometer (TOMS)Absorbing Aerosol Product, Rev. Geophys., 40, 2-1–2-31, https://doi.org/10.1029/2000rg000095, 2002.
Provençal, S., Kishcha, P., da Silva, A. M., Elhacham, E., and Alpert, P.: AOD distributions and trends of major aerosol species over a selection of the world's most populated cities based on the 1st version of NASA's MERRA Aerosol Reanalysis, Urban Climate, 20, 168–191, https://doi.org/10.1016/j.uclim.2017.04.001, 2017.
Qin, Y. and Mitchell, R. M.: Characterisation of episodic aerosol types over the Australian continent, Atmos. Chem. Phys., 9, 1943–1956, https://doi.org/10.5194/acp-9-1943-2009, 2009.
Radhi, M., Box, M. A., Box, G. P., and Mitchell, R. M.: Biomass-burning aerosol over northern Australia, Aust. Meteorol. Ocean., 62, 25–33, 2012.
Ramanathan, V., Crutzen, P. J., Kiehl, J. T., and Rosenfeld, D.: Aerosols, climate, and the hydrological cycle, Science, 294, 2119–2124, https://doi.org/10.1126/science.1064034, 2001.
Randles, C. A., da Silva, A. M., Buchard, V., Colarco, P. R., Darmenov, A., Govindaraju, R., Smirnov, A., Holben, B., Ferrare, R., Hair, J., Shinozuka, Y., and Flynn, C. J.: The MERRA-2 Aerosol Reanalysis, 1980 Onward. Part I: System Description and Data Assimilation Evaluation, J. Climate, 30, 6823–6850, https://doi.org/10.1175/jcli-d-16-0609.1, 2017.
Remer, L. A., Kaufman, Y. J., Tanré, D., Mattoo, S., Chu, D. A., Martins, J. V., Li, R.-R., Ichoku, C., Levy, R. C., Kleidman, R. G., Eck, T. F., Vermote, E., and Holben, B. N.: The MODIS Aerosol Algorithm, Products, and Validation, J. Atmos. Sci., 62, 947–973, https://doi.org/10.1175/jas3385.1, 2005.
Ridley, D. A., Heald, C. L., Kok, J. F., and Zhao, C.: An observationally constrained estimate of global dust aerosol optical depth, Atmos. Chem. Phys., 16, 15097–15117, https://doi.org/10.5194/acp-16-15097-2016, 2016.
Rosen, J., Young, S., Laby, J., Kjome, N., and Gras, J.: Springtime aerosol layers in the free troposphere over Australia: Mildura Aerosol Tropospheric Experiment (MATE 98), J. Geophys. Res.-Atmos., 105, 17833–17842, https://doi.org/10.1029/2000jd900208, 2000.
Rotstayn, L. D., Keywood, M. D., Forgan, B. W., Gabric, A. J., Galbally, I. E., Gras, J. L., Luhar, A. K., Mctainsh, G. H., Mitchell, R. M., and Young, S. A.: Possible impacts of anthropogenic and natural aerosols on Australian climate: a review, Int. J. Climatol., 29, 461–479, 2010.
Sayer, A. M., Hsu, N. C., Bettenhausen, C., and Jeong, M.-J.: Validation and uncertainty estimates for MODIS Collection 6 “Deep Blue” aerosol data, J. Geophys. Res.-Atmos., 118, 7864-7872, https://doi.org/10.1002/jgrd.50600, 2013.
Sayer, A. M., Munchak, L. A., Hsu, N. C., Levy, R. C., Bettenhausen, C., and Jeong, M.-J.: MODIS Collection 6 aerosol products: Comparison between Aqua's e-Deep Blue, Dark Target, and “merged” data sets, and usage recommendations, J. Geophys. Res.-Atmos, 119, 13965–13989, https://doi.org/10.1002/2014JD022453, 2014.
Schultz, M. G., Heil, A., Hoelzemann, J. J., Spessa, A., Thonicke, K., Goldammer, J. G., Held, A. C., Pereira, J. M. C., and van het Bolscher, M.: Global wildland fire emissions from 1960 to 2000, Glob. Biogeochem. Cy., 22, GB2002, https://doi.org/10.1029/2007gb003031, 2008.
Shao, Y., Leys, J. F., McTainsh, G. H., and Tews, K.: Numerical simulation of the October 2002 dust event in Australia, J. Geophys. Res.-Atmos., 112, D08207, https://doi.org/10.1029/2006jd007767, 2007.
Small, J. D., Jiang, J. H., Su, H., and Zhai, C.: Relationship between aerosol and cloud fraction over Australia, Geophys. Res. Lett., 38, L23802, https://doi.org/10.1029/2011gl049404, 2011.
Strong, C. L., Parsons, K., McTainsh, G. H., and Sheehan, A.: Dust transporting wind systems in the lower Lake Eyre Basin, Australia: A preliminary study, Aeolian Res., 2, 205–214, https://doi.org/10.1016/j.aeolia.2010.11.001, 2011.
Takegawa, N., Kondo, Y., Koike, M., Ko, M., Kita, K., Blake, D. R., Nishi, N., Hu, W., Liley, J. B., Kawakami, S., Shirai, T., Miyazaki, Y., Ikeda, H., Russel-Smith, J., and Ogawa, T.: Removal of NOx and NOy in biomass burning plumes in the boundary layer over northern Australia, J. Geophys. Res.-Atmos., 108, D104308, https://doi.org/10.1029/2002jd002505, 2003.
Tanaka, T. Y. and Chiba, M.: A numerical study of the contributions of dust source regions to the global dust budget, Global Planet. Change, 52, 88–104, https://doi.org/10.1016/j.gloplacha.2006.02.002, 2006.
Twomey, S.: The Influence of Pollution on the Shortwave Albedo of Clouds, J. Atmos. Sci., 34, 1149-1152, https://doi.org/10.1175/1520-0469(1977)034<1149:tiopot>2.0.co;2, 1977.
Winker, D. M., Pelon, J., and Mccormick, M. P.: The CALIPSO mission: spaceborne lidar for observation of aerosols and clouds, Proc. Spie, 4893, 1211–1229, 2003.
Yang, X., Jiang, L., Zhao, W., Xiong, Q., Zhao, W., and Yan, X.: Comparison of Ground-Based PM(2.5) and PM(10) Concentrations in China, India, and the U.S, Int. J. Env. Res. Pub. He., 15, 1382, https://doi.org/10.3390/ijerph15071382, 2018.
Yang, X., Zhao, C., Luo, N., Zhao, W., Shi, W., and Yan, X.: Evaluation and Comparison of Himawari-8 L2 V1.0, V2.1 and MODIS C6.1 aerosol products over Asia and the oceania regions, Atmos. Environ., 220, 117068, https://doi.org/10.1016/j.atmosenv.2019.117068, 2020.
Yoon, J., Pozzer, A., Chang, D. Y., Lelieveld, J., Kim, J., Kim, M., Lee, Y. G., Koo, J. H., Lee, J., and Moon, K. J.: Trend estimates of AERONET-observed and model-simulated AOTs between 1993 and 2013, Atmos. Environ., 125, 33–47, https://doi.org/10.1016/j.atmosenv.2015.10.058, 2016.
Zhao, C. and Garrett, T. J.: Effects of Arctic haze on surface cloud radiative forcing, Geophys. Res. Lett., 42, 557–564, https://doi.org/10.1002/2014gl062015, 2015.
Zhao, C., Lin, Y., Wu, F., Wang, Y., Li, Z., Rosenfeld, D., and Wang, Y.: Enlarging Rainfall Area of Tropical Cyclones by Atmospheric Aerosols, Geophys. Res. Lett., 45, 8604–8611, https://doi.org/10.1029/2018gl079427, 2018.
Zhao, C., Wang, Y., Shi, X., Zhang, D., Wang, C., Jiang, J.H., Zhang, Q., and Fan, H.: Estimating the contribution of local primary emissions to particulate pollution using highdensity station observations, J. Geophys. Res.-Atmos., 124, 1648–1661, https://doi.org/10.1029/2018jd028888, 2019.