the Creative Commons Attribution 4.0 License.
the Creative Commons Attribution 4.0 License.
 | 15 Mar 2021
Measurement report: Long-range transport patterns into the tropical northwest Pacific during the CAMP2Ex aircraft campaign: chemical composition, size distributions, and the impact of convection
Miguel Ricardo A. Hilario
Ewan Crosbie
Michael Shook
Jeffrey S. Reid
Maria Obiminda L. Cambaliza
James Bernard B. Simpas
Luke Ziemba
Joshua P. DiGangi
Glenn S. Diskin
Phu Nguyen
F. Joseph Turk
Edward Winstead
Claire E. Robinson
Jian Wang
Jiaoshi Zhang
Yang Wang
Subin Yoon
James Flynn
Sergio L. Alvarez
Ali Behrangi
The tropical Northwest Pacific (TNWP) is a receptor for pollution sources throughout Asia and is highly susceptible to climate change, making it imperative to understand long-range transport in this complex aerosol-meteorological environment. Measurements from the NASA Cloud, Aerosol, and Monsoon Processes Philippines Experiment (CAMP2Ex; 24 August to 5 October 2019) and back trajectories from the National Oceanic and Atmospheric Administration Hybrid Single Particle Lagrangian Integrated Trajectory Model (HYSPLIT) were used to examine transport into the TNWP from the Maritime Continent (MC), peninsular Southeast Asia (PSEA), East Asia (EA), and the West Pacific (WP). A mid-campaign monsoon shift on 20 September 2019 led to distinct transport patterns between the southwest monsoon (SWM; before 20 September) and monsoon transition (MT; after 20 September). During the SWM, long-range transport was a function of southwesterly winds and cyclones over the South China Sea. Low- (high-) altitude air generally came from MC (PSEA), implying distinct aerosol processing related to convection and perhaps wind shear. The MT saw transport from EA and WP, driven by Pacific northeasterly winds, continental anticyclones, and cyclones over the East China Sea. Composition of transported air differed by emission source and accumulated precipitation along trajectories (APT). MC air was characterized by biomass burning tracers while major components of EA air pointed to Asian outflow and secondary formation. Convective scavenging of PSEA air was evidenced by considerable vertical differences between aerosol species but not trace gases, as well as notably higher APT and smaller particles than other regions. Finally, we observed a possible wet scavenging mechanism acting on MC air aloft that was not strictly linked to precipitation. These results are important for understanding the transport and processing of air masses with further implications for modeling aerosol lifecycles and guiding international policymaking to public health and climate, particularly during the SWM and MT.
- Article
(8706 KB) - Full-text XML
-
Supplement
(2730 KB) - BibTeX
- EndNote


As pollution emissions from Asian countries have surpassed those of countries in Europe and North America (Akimoto, 2003; Smith et al., 2011), Asia has become increasingly important from a global climate and health perspective. The tropical Northwest Pacific (TNWP), situated adjacent to Southeast Asia (Fig. 1), is a receptor for multiple sources of aerosol particles throughout the region (Bagtasa et al., 2018; Hilario et al., 2020a; Huang et al., 2019; Reid et al., 2015) and is one of the most susceptible regions to global climate change (IPCC, 2014; Reid et al., 2013; Yusuf and Francisco, 2009). Amidst several multi-scale meteorological phenomena ranging from the Asian monsoon system (Akasaka et al., 2007; Chang et al., 2005), the El Niño–Southern Oscillation (Cruz et al., 2013), the Madden–Julian Oscillation (Maloney and Hartmann, 2001; Pullen et al., 2015), and intermittent typhoons (Bagtasa, 2017; Maloney and Dickinson, 2003), the TNWP hosts arguably one of the most complex meteorological environments in the world with likewise intricate relationships to aerosol life cycle and climate impacts (Reid et al., 2012; Ross et al., 2018).
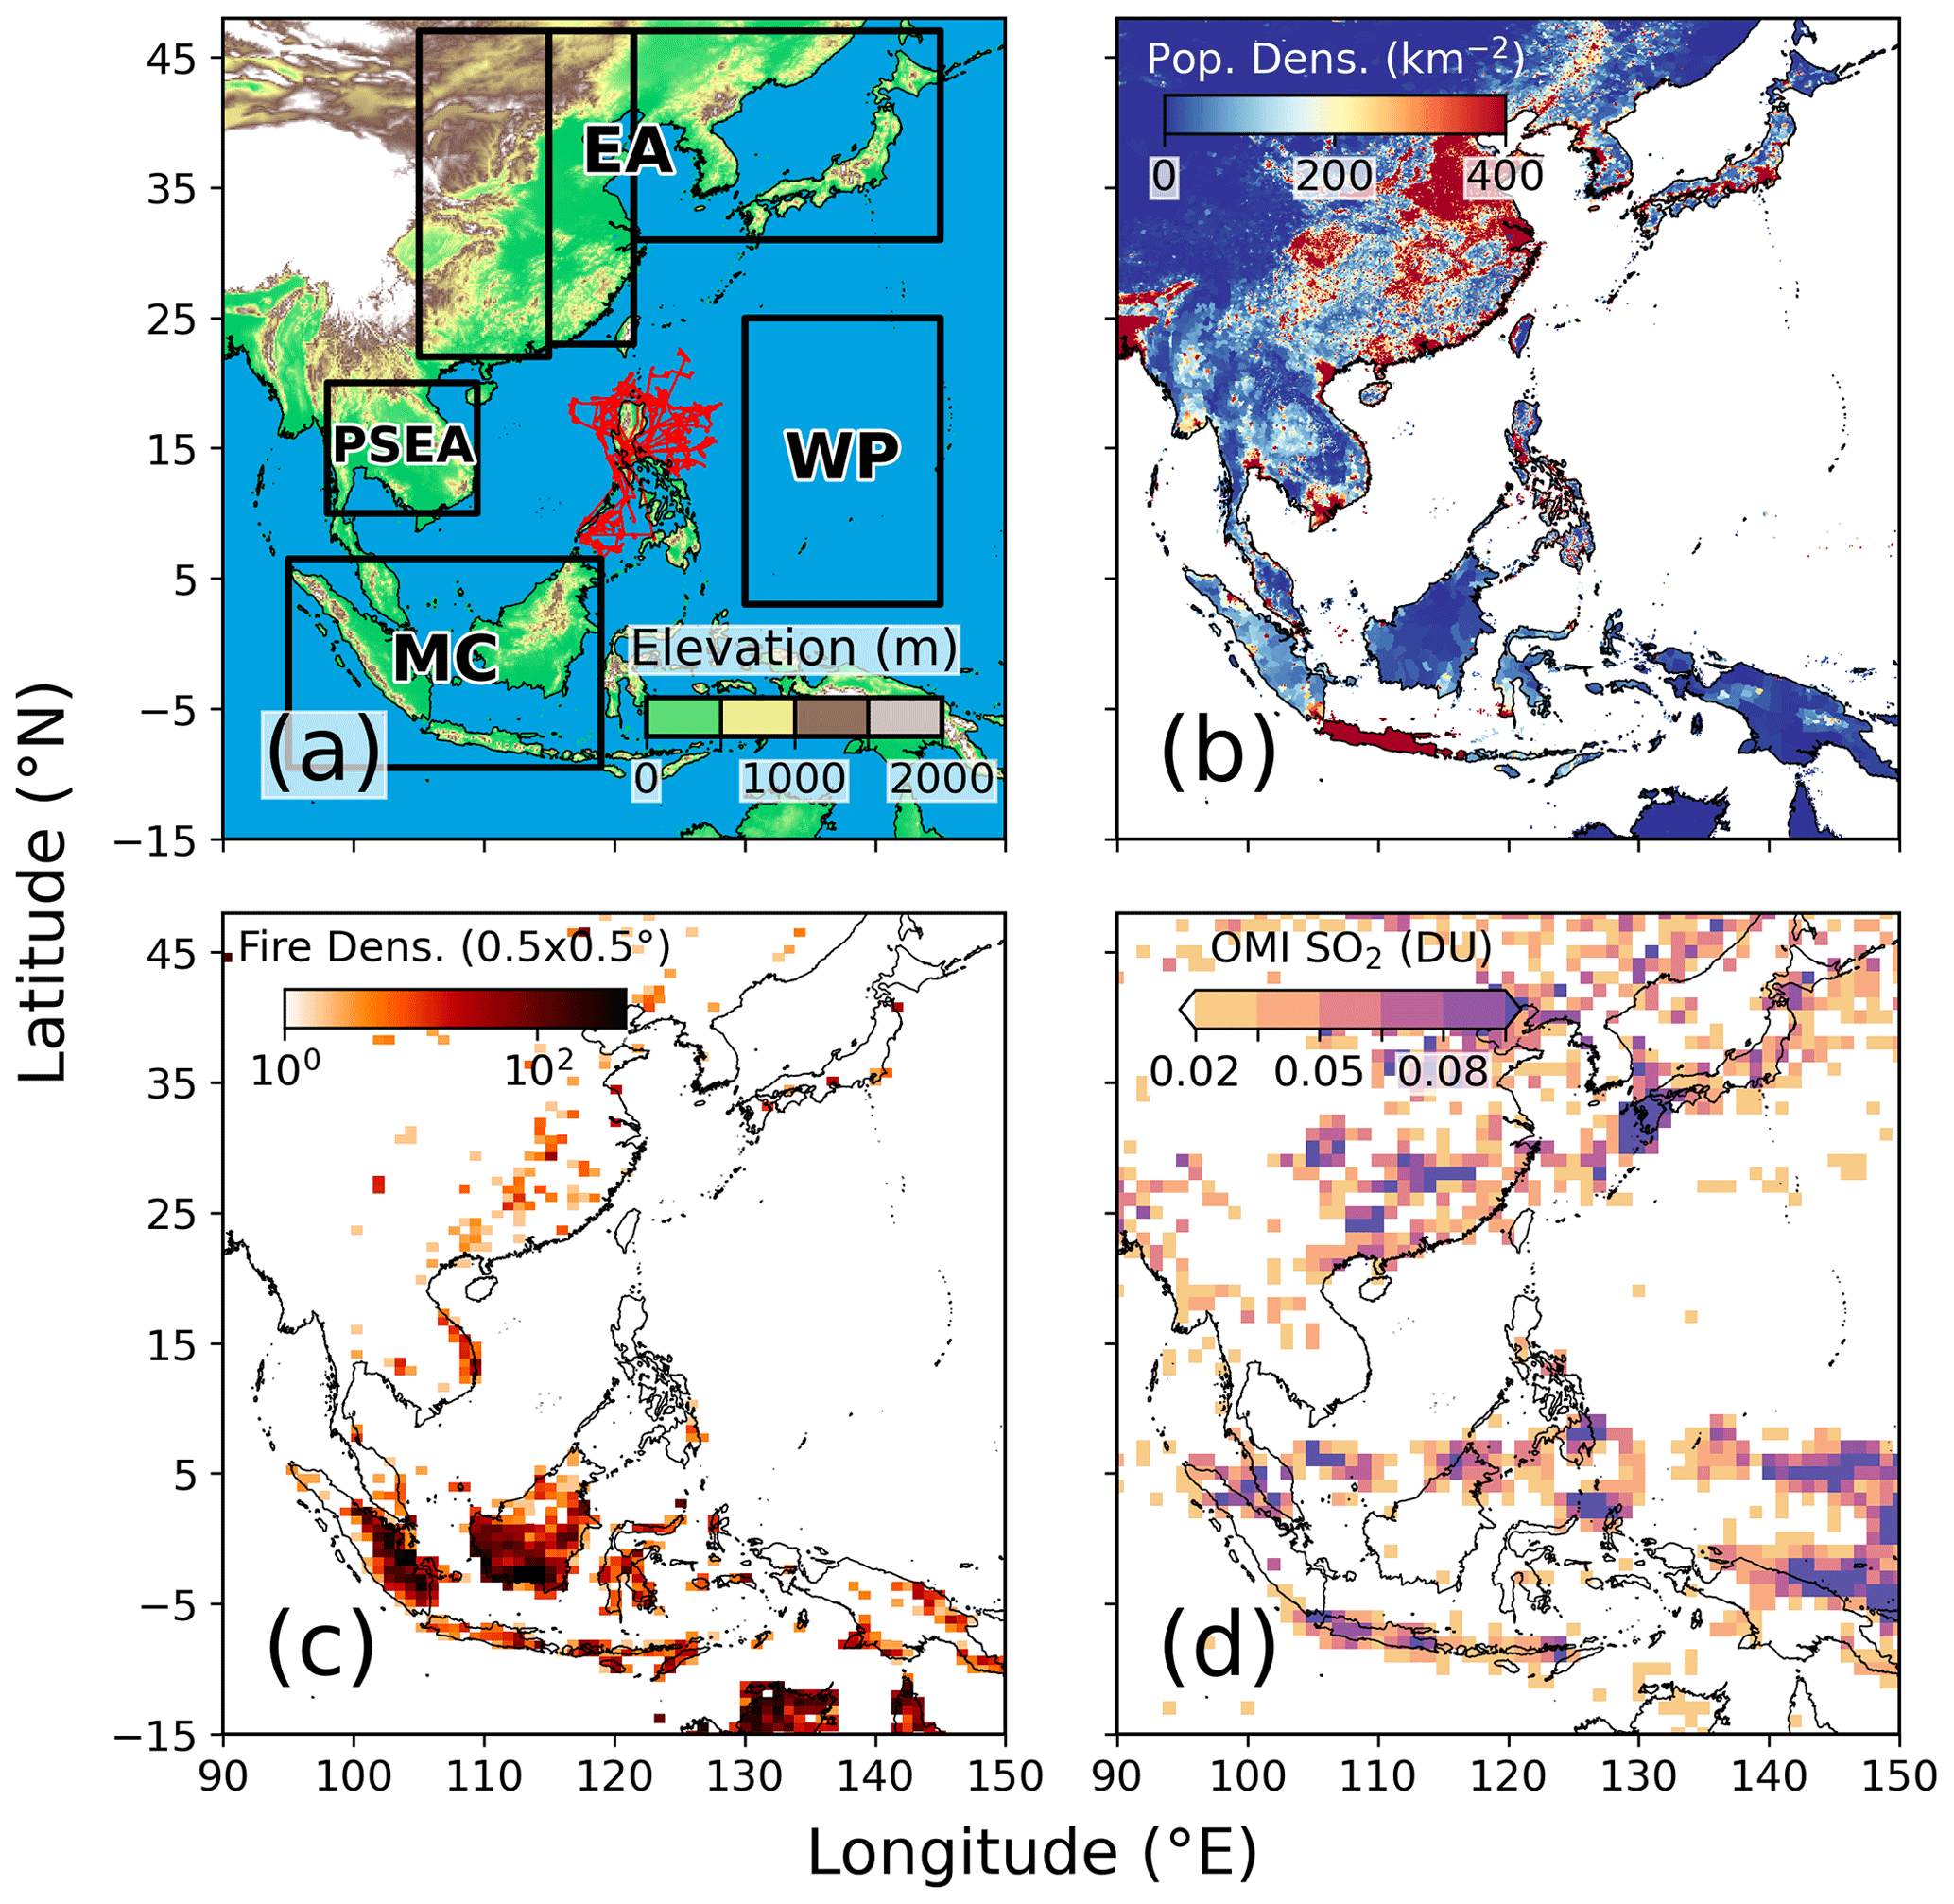
Figure 1Maps of (a) ground elevation from the Global Multi-resolution Terrain Elevation Data 2010 (GMTED2010), with flight tracks in red and approximate source regions in labeled boxes (peninsular Southeast Asia (PSEA), the Maritime Continent (MC), East Asia (EA), and the West Pacific (WP)), (b) 2020 population density from the Center for International Earth Science Information Network (CIESIN) Gridded Population of the World (GPW) v4, (c) MODIS active fire hotspot density (only fires tagged with >80 % confidence) averaged at 0.5∘ × 0.5∘ resolution from 1 August to 15 October 2019, and (d) OMI-retrieved planetary boundary layer (PBL) SO2 averaged over the same period.
Owing to atmospheric residence times ranging from days to weeks (Balkanski et al., 1993; Kritz and Rancher, 1980) and enabled by the surrounding meteorology, aerosol particles from multiple sources can undergo long-range transport into the TNWP (Lin et al., 2007; Xian et al., 2013). These sources include biomass burning from Indonesia and Malaysia (Hilario et al., 2020a, b; Reid et al., 2015); anthropogenic and dust outflow from China, Korea, and Japan (Bagtasa et al., 2019; Braun et al., 2020; Geng et al., 2019; Miyazaki, 2003; Oshima et al., 2012; Tan et al., 2012); emissions from countries such as Vietnam, Laos, and Thailand (Bagtasa et al., 2019; Geng et al., 2019; Huang et al., 2020; Lin et al., 2009; Nguyen et al., 2020); and marine aerosol particles from the Pacific Ocean. Such transport is controlled by the interplay of several factors such as topography, sea breeze, monsoon flows, and typhoons (Reid et al., 2012; Wang et al., 2013). Aside from the risk posed by transported anthropogenic aerosol on public health (Lelieveld et al., 2015; Zhang et al., 2017), such a diverse set of aerosol sources and types can result in variable aerosol–cloud–climate interactions (Hamid et al., 2001; Heald et al., 2014; Rosenfeld, 1999; Ross et al., 2018; Sorooshian et al., 2009; Yu et al., 2006; Yuan et al., 2011), which are complicated further by the spatial inhomogeneity of transported aerosol particles (Akimoto, 2003). As the influence of aerosol particles on climate remains one of the largest uncertainties in our understanding of the atmosphere (IPCC, 2014), investigating the composition and transport mechanisms of air masses from different source regions will aid in the future development of transport models and lead to a better understanding of the transport pathways that modulate aerosol particles in this part of the world.
Previous aircraft campaigns in Asia and the Pacific include the Transport and Chemical Evolution Over the Pacific (TRACE-P) campaign (Jacob et al., 2003), the Aerosol Radiative Forcing in East Asia (A-FORCE) campaign (Oshima et al., 2012), the Pacific Exploratory Mission – West A and B (PEM-West) (Hoell et al., 1996, 1997), and the Oxidant and Particulate Photochemical Processes Above a South East Asian Rainforest (OP3) project (Hewitt et al., 2010). These campaigns examined springtime outflow from the Asian continent (e.g., Koike et al., 2003; Kondo et al., 2004; Park, 2005) and early-summertime characteristics of local and transported aerosol over Borneo (e.g., Robinson et al., 2011, 2012); however, no study to our knowledge has utilized aircraft data to characterize long-range transport patterns over the TNWP coinciding with the peak agricultural burning period for Indonesia and Malaysia. Limited ship observations in association with the 7 Southeast Asian Studies (7SEAS) program (e.g., Reid et al., 2015, 2016a, b) found a highly dynamic aerosol environment (Atwood et al., 2017; Hilario et al., 2020a; Reid et al., 2015).
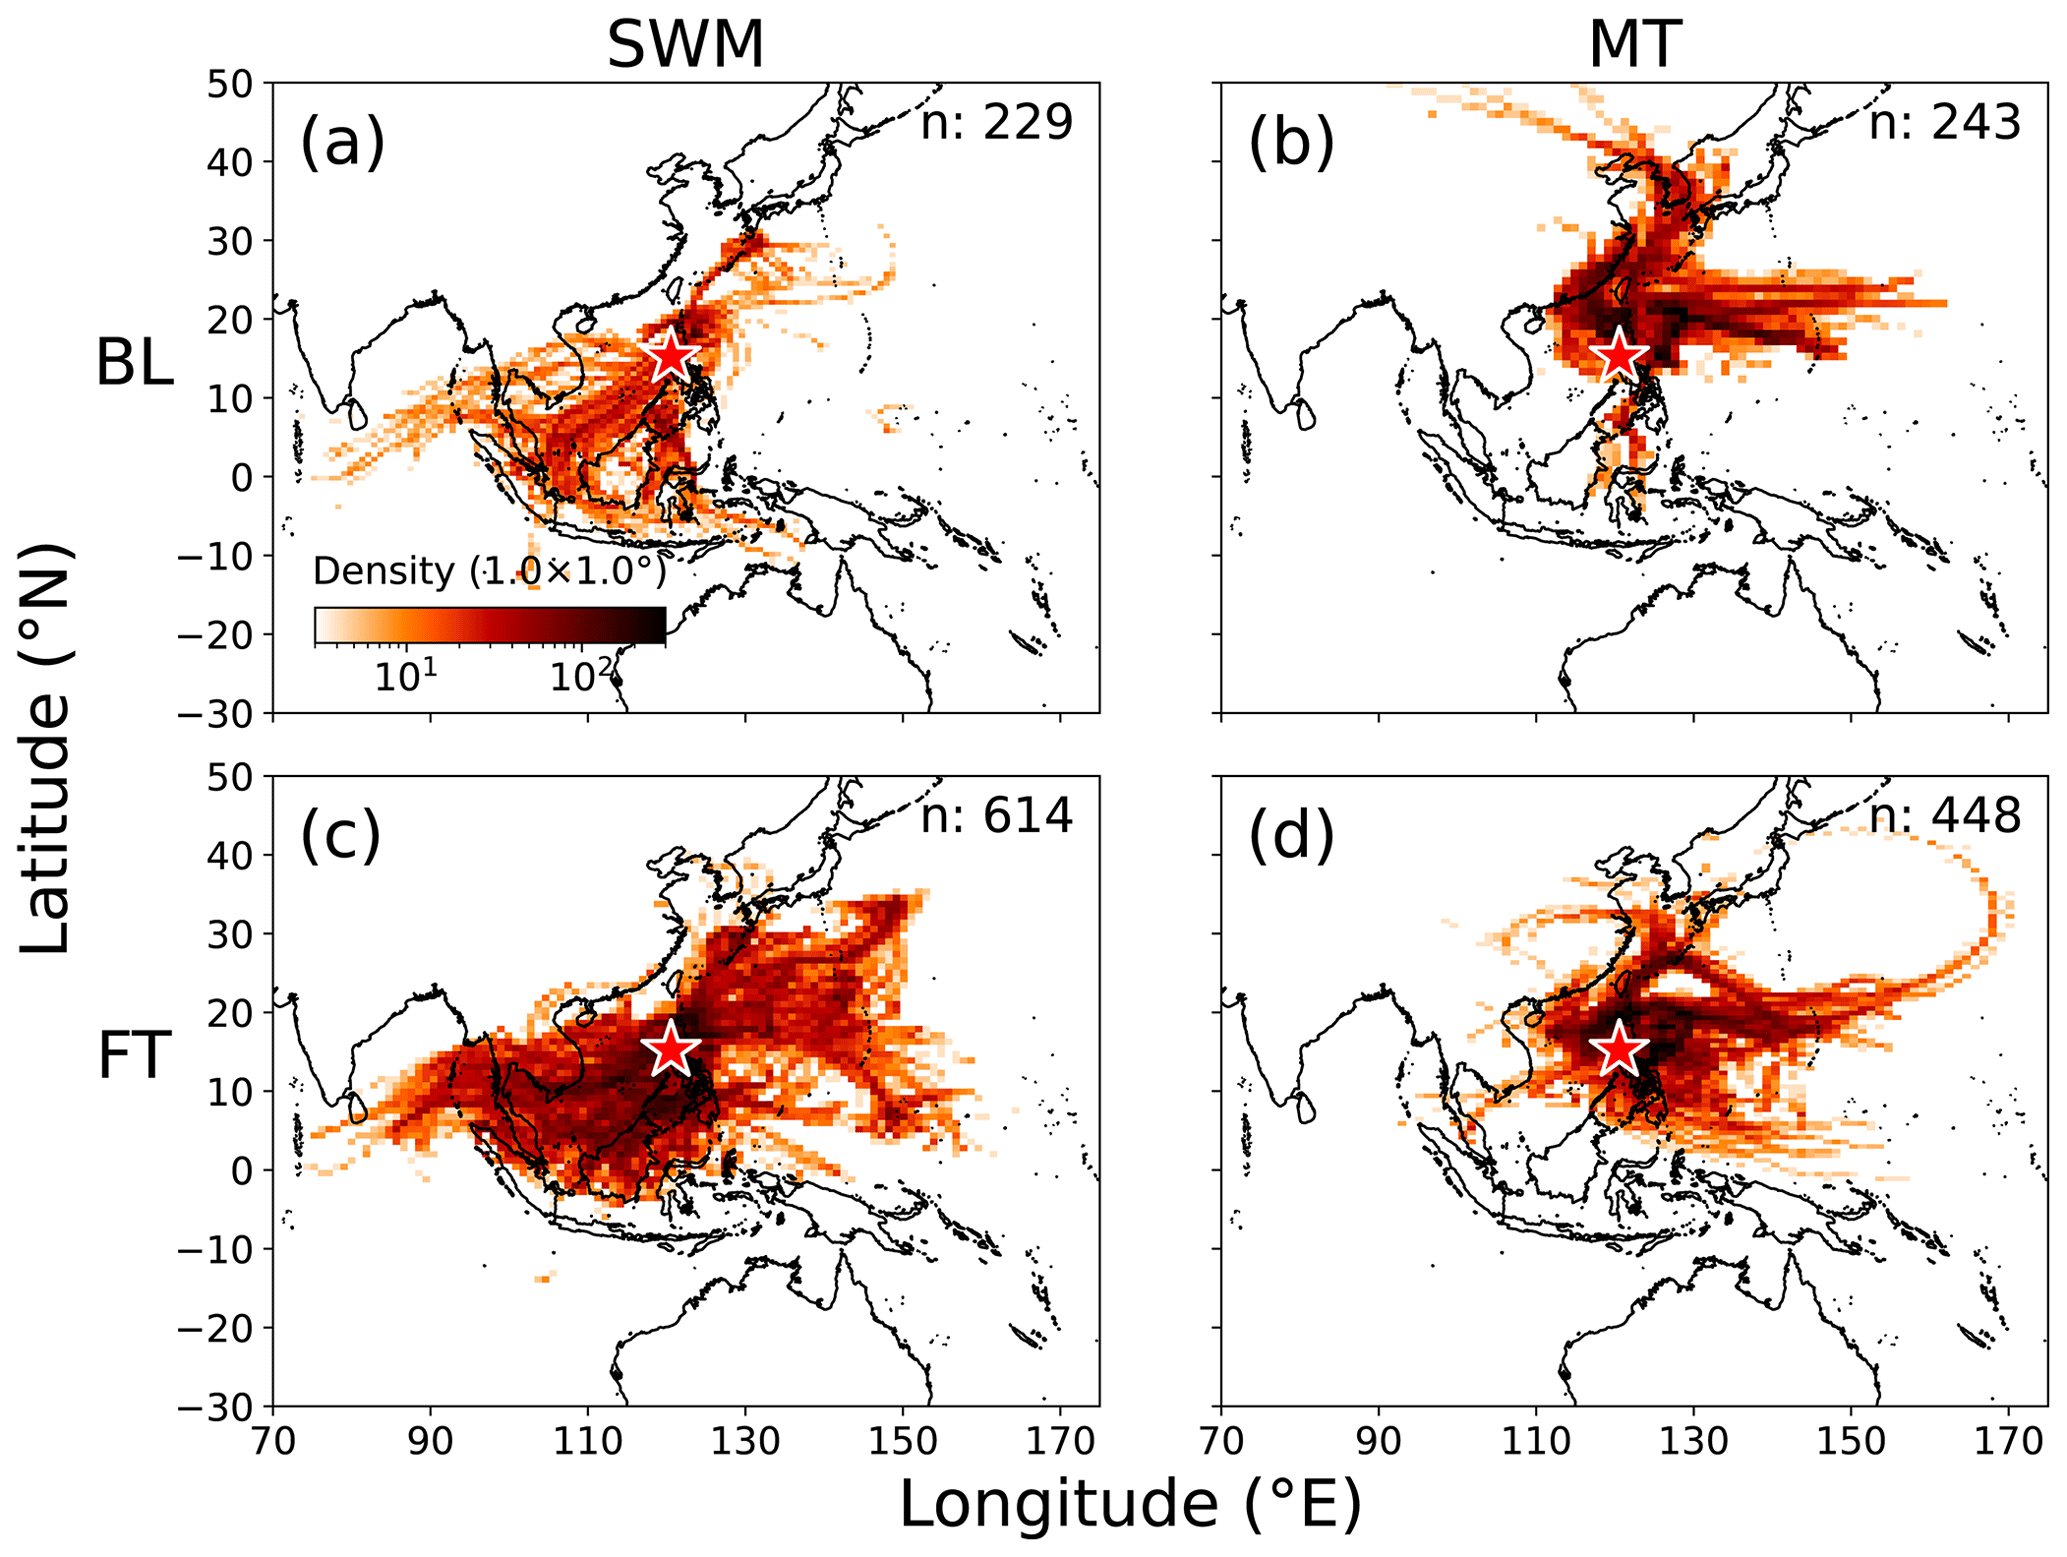
Figure 2Trajectory densities resolved by monsoon phase and sampling vertical level. Monsoon phases are southwest monsoon (SWM; before 20 September 2019) and the monsoon transition (MT; after 20 September 2019). Vertical sampling levels are divided into boundary layer (BL; < 2 km) and free troposphere (FT; > 2 km). Red star denotes Clark International Airport, Philippines. Number of trajectories (n) is shown in the upper right of each panel.
The NASA Cloud, Aerosol, and Monsoon Processes-Philippines Experiment (CAMP2Ex) aircraft campaign examined the influence of meteorology, convection, and radiative effects on gas and aerosol species in the TNWP. Based at Clark, Luzon, Philippines, from 24 August to 5 October 2019, CAMP2Ex obtained a wide array of measurements between 0–9 (above ground level) across 19 research flights (RFs). Some RFs were conducted in coordination with the seaborne research vessel R/V Sally Ride as part of the Office of Naval Research Propagation of InterSeasonal Tropical OscillatioNs (PISTON) project (https://onrpiston.colostate.edu/, last access: 27 July 2020). The CAMP2Ex campaign is unique in that it began during the peak of the Asian southwest monsoon (SWM) and coincided with an early monsoon transition (MT), which occurred in late September instead of the more common time in October (Chang et al., 2005; Matsumoto et al., 2020). The early MT led to diverse transport patterns (Fig. 2) that offered an opportunity to examine long-range transport into the TNWP.
Aircraft campaigns allow for vertically resolved measurements of air mass properties, which are essential to better understand the atmosphere, as aerosol–cloud–climate interactions vary by altitude (Dahutia et al., 2019; Dong et al., 2017; Hansen, 2005; Mishra et al., 2015) and vertical transport can influence air mass composition (Matsui et al., 2011a; Moteki et al., 2012; Oshima et al., 2012, 2013). Furthermore, as the main route of aerosol removal from the atmosphere, wet scavenging is a crucially important aspect of aerosol vertical profiles and is linked to significant uncertainties in climate models (Neu and Prather, 2012; H. Wang et al., 2013; Yu et al., 2019). Vertically resolved in situ observations in field campaigns targeting aerosol–cloud–meteorology interactions are necessary to advance our understanding of scavenging processes to inform the spectrum of models ranging from smaller-scale process models to larger-scale climate models (MacDonald et al., 2018; Sorooshian et al., 2019).
As Asian emissions continue to increase as a consequence of rapid economic development, it is imperative to understand the influence of long-range transport on air quality and aerosol–cloud–climate feedbacks in this region. In this study, we focus on characterizing transported air masses from four key regions: the Maritime Continent (MC: 5∘ S–6.8∘ N, 94.9–119.5∘ E), peninsular Southeast Asia (PSEA: 10–23∘ N, 95–109.5∘ E), East Asia (EA: 22–44∘ N, 100–122∘ E and 30–44∘ N, 122–145∘ E), and the west Pacific Ocean (WP: 3–25∘ N, 130–145∘ E). Using air mass back trajectories to complement the CAMP2Ex data, this study aims to (1) identify regional transport pathways into the TNWP and their associated synoptic conditions, (2) characterize air masses coming from different source regions in terms of composition and aerosol size distribution, and (3) estimate the influence of convection and precipitation on transported air masses. By examining how transport and scavenging mechanisms impact air mass composition, our results have implications for improving the modeling of aerosol lifecycles during the SWM and MT in this meteorologically complex region. Furthermore, due to the health impacts of biomass burning and anthropogenic emissions, this work is also important for guiding policymaking related to public health and climate during the transport-intensive SWM and MT. Due to the specificity of some abbreviations used in this work, we have provided a lookup table with definitions (Table 1).
2.1 CAMP2Ex observations
A major goal of the 2019 CAMP2Ex aircraft campaign was to understand aerosol–cloud–climate feedbacks in the TNWP (Di Girolamo et al., 2018). Although multiple aircraft were deployed, this study focused on measurements made onboard the NASA P-3B Orion (N426NA) aircraft. Aircraft altitude ( hereafter) was calculated as the difference between GPS altitude and ground elevation provided by the Google Maps API, with an uncertainty of ± 5 m. Dry optical size distribution data were collected by the laser aerosol spectrometer (LAS; TSI Model 3340) and are presented as an integrated particle number concentration for diameters between 100 and 1000 nm (N100−1000 nm; cm−3). Uncertainty of LAS-derived N100−1000 nm is estimated at 20 %. LAS optical sizing is calibrated using polystyrene latex spheres (i.e., with a real refractive index of 1.59) and verified in flight using an onboard nebulizer to ensure a consistent response throughout the campaign. During post-flight processing, sizing is corrected using monodisperse ammonium sulfate aerosol so that derived size distributions are referenced to a real refractive index of 1.53 and relevant to ambient aerosols (Shingler et al., 2016). Carbon monoxide (CO; ppm) and methane (CH4; ppm) mixing ratios were measured by a dried-airstream near-infrared cavity ring-down absorption spectrometer (G2401-m; PICARRO, Inc.), with uncertainties of 2 % and 1 % and precisions of 0.005 and 0.001 ppm, respectively. Ozone (O3; ppbv) measurements were conducted with a dual-beam UV absorption sensor (Model 205; 2B Technologies) with an uncertainty of 6 ppbv. A fast integrated mobility spectrometer (FIMS) measured aerosol size distribution between 10 and ∼ 600 nm with a concentration uncertainty of ∼ 15 % and size uncertainty of ∼ 3 % (Wang et al., 2017a, b; Y. Wang et al., 2018).
Non-refractory aerosol composition in the submicrometer range was measured with a high-resolution time-of-flight aerosol mass spectrometer (AMS; Aerodyne) (Canagaratna et al., 2007; DeCarlo et al., 2006). The species of relevance to this study include sulfate (), ammonium (), nitrate (), and organic aerosol (OA), all of which are reported in units of µg m−3 with uncertainties up to 50 % to account for ambiguity in the instrument collection efficiency. The AMS was operated in 1 Hz Fast-MS mode and averaged to 30 s time resolution for this study. The 1σ detection limits (in µg m−3) are as follows for the 30 s averaged data: 0.169 (OA), 0.039 (), 0.035 (), and 0.169 (). Detection limits were determined in flight when sampling behind a filter blank or during periods in the free troposphere with constant aerosol concentrations. Mass concentrations below these detection limit values, which are sometimes negative due to the AMS difference method, are statistically equal to zero. To avoid a positive bias, negative AMS values were included in the analysis but were interpreted as a concentration value of zero (e.g., Table 3). Black carbon (BC; ng m−3) was measured with a single-particle soot photometer (SP2) (Moteki and Kondo, 2007, 2010), including an uncertainty of 15 % based on laboratory intercomparison results from Slowik et al. (2007). Lower detection limits are less than 10 ng m−3 based on manufacturer specifications and confirmed by in-flight filter-blank measurements and observations in the clean tropical free troposphere. SP2 mass concentration calibration is accomplished using monodisperse nebulized fullerene soot aerosol according to Gysel et al. (2011). We note that BC data were unavailable during one flight covering a major Borneo smoke event (RF9); thus, we have provided statistics of the AMS total minus RF9 for a more direct comparison with BC (Table 3). Particle size ranges for SP2 and AMS are reported at 100–700 nm (BC equivalent), and 60–600 nm (vacuum aerodynamic) diameter, respectively. While quantitative comparison of these instruments is complicated by differing sizing techniques, each is relevant to accumulation-mode aerosol and is assumed to capture the majority of particle mass in this size range. Likewise, LAS-integrated number concentrations from 100–1000 nm optical diameter are used to illustrate variability in accumulation-mode number concentration.
All aerosol data are reported at standard temperature and pressure (STP; 273 K, 1013 hPa). All in situ aerosol measurements were placed downstream of a forward-facing shrouded solid diffuser inlet designed by the University of Hawaii that efficiently transmits particles (≤ 5.0 µm aerodynamic diameter) to cabin-mounted instrumentation (McNaughton et al., 2007). The inlet flow rate is manually controlled to provide isokinetic sampling over the full range of P-3B airspeeds to minimize size-dependent biasing of the ambient particle size distribution. Downstream of the inlet, flow is split to individual instruments using a custom-designed stainless-steel manifold (Brechtel Manufacturing Inc.).
Only data collected via isokinetic sampling (McNaughton et al., 2007) were used to eliminate sampling artifacts from the shattering of large water and ice particles (Murphy et al., 2004). When the aircraft entered clouds, sampling was manually switched to a counterflow virtual impactor (CVI) inlet (Brechtel Manufacturing Inc.). Using only data collected during isokinetic sampling removed 16 % of CAMP2Ex samples.
Background concentrations of each species were defined as the lowest 10th percentile of all CAMP2Ex data along vertical profiles for every 5 K range of potential temperature (Koike et al., 2003; Matsui et al., 2011a). Enhancements above these background concentrations are denoted by Δ. For species ratios, only data with ΔCO> 0.02 ppm were included similar to past work (Kleinman et al., 2007; Kondo et al., 2011; Matsui et al., 2011b).
Only data along profiles extending vertically more than 2 km were considered for analysis as they provide a “snapshot” of the atmosphere with which we can compare more directly air mass characteristics across different altitudes. Data collected when the aircraft sampled directly over urbanized Luzon (13–15.8∘ N, 120–122∘ E) were excluded from analysis to minimize the impact of local emissions. Flight tracks and identified vertical profiles are shown in Fig. S1 in the Supplement.
2.2 Back trajectory classification
The National Oceanic and Atmospheric Administration (NOAA) Hybrid Single Particle Lagrangian Integrated Trajectory Model (HYSPLIT) (Rolph et al., 2017; Stein et al., 2015) was used to generate 120 h back trajectories along vertical profiles with 1 min temporal resolution. Input meteorological data were from the Global Forecast System (GFS) reanalysis produced by the National Centers for Environmental Prediction (NCEP) at a horizontal resolution of 0.25∘ × 0.25∘.
Our analysis focused on transport from key source regions (MC, PSEA, EA, WP). We note here that “source region” refers to the attributed origin of an air mass as identified by our trajectory classification scheme and does not preclude the possibility of entrainment from emission sources during transport (e.g., shipping) nor small-scale convection along trajectories unresolved by GFS. Our classification scheme considered two important environmental factors: (1) the synoptic shift that occurred around 20 September 2019, dividing the CAMP2Ex period into the SWM (before 20 September) and MT (after 20 September); and (2) the vertical wind shear across the region (Fig. 2). To better capture the pronounced effect of the monsoon shift, air masses were only classified as MC or PSEA (EA or WP) if sampled during the SWM (MT). For example, instances of EA air sampled during the SWM were classified as “other”, while air from EA sampled during MT was classified as EA. The inclusion of a monsoon phase filter more explicitly highlights the temporal aspect of meteorology in the TNWP; however, without this monsoon phase criterion, resulting air mass classifications remain largely unchanged (Sect. 3.2). Furthermore, to account for regional vertical inhomogeneity (Atwood et al., 2013; Sarkar et al., 2018), our analysis of air mass characteristics differentiates between boundary layer (BL; < 2 km) and free troposphere (FT; > 2 km) (Sect. 3.3). We use a 2 km threshold to differentiate between BL and FT air based on climatologically derived BL heights in this region (Chien et al., 2019). This inherently comes with a degree of uncertainty; however, we believe a conservative value of 2 km is sufficient for an overview study of this kind. An effort to determine CAMP2Ex BL heights is ongoing and warrants its own separate study.
For an air mass to be classified as coming from a source region, its back trajectory must pass within a source region's bounding box for more than 6 h at an altitude below 2 km (Chien et al., 2019). In addition to excluding data collected over urbanized Luzon (Sect. 2.1), trajectories passing through the Philippines (12–18.25∘ N, 120.5–122.5∘ E and 5.1–14.5∘ N, 122.5–126.7∘ E) under our trajectory classification scheme were excluded to further focus our analysis on long-range transport and associated processes.
Most air masses came from only one of the four source regions: WP (117 occurrences), MC (174 occurrences), PSEA (88 occurrences), and EA (130 occurrences). Air masses that passed through both EA and WP (12 occurrences) were regarded as EA air due to the considerable influence of EA outflow on air mass composition (Talbot et al., 1997). Other transport permutations (e.g., air that passed through both MC and PSEA) did not meet the requirements of our classification scheme and were omitted. Thus, we focus on the four major transport pathways (MC, PSEA, WP, EA). Focusing on these major pathways adds robustness to the analysis by partly compensating for the limits of the trajectory model in capturing more complex meteorological phenomena such as wind shear (Freitag et al., 2014), which have been shown to contribute to trajectory uncertainty (Siems et al., 2000; Stohl et al., 2002). In addition to requiring that the back trajectories pass through the source regions, the additional criteria imposed (e.g., altitude < 2 km over the source region) increase our confidence that the remaining cases represent instances of long-range transport. Resulting source-region contributions per RF are shown in Fig. S2. We emphasize that these source-region contributions represent frequencies of observation rather than frequencies of occurrence, as the sampling location of the aircraft introduces a bias inherent in aircraft campaigns (Sect. 3.2).
As a consequence of our filtering scheme, a large portion of trajectories were tagged as “other” (66.8 %). This is attributable to several scenarios, including but not limited to (1) air masses that passed over source regions, but above our BL height threshold of 2 km (∼ 20 %); (2) air masses influenced by the Philippines (i.e., air masses that stayed over the Philippines at < 2 km for more than 6 h) (∼ 8 %); (3) transport permutations that occurred too infrequently to provide robust statistics (∼ 3 %); and (4) stagnant air masses that did not reach any source region (≤ 35 %). We note that the first scenario is equivalent to long-range transport from further away source regions not considered in this work (e.g., India, West Asia).
Trajectory clustering was performed using two well-established methods: k means and Ward linkage (Govender and Sivakumar, 2020) in order to confirm the robustness of our predefined source regions. K-means clustering classifies data into k clusters such that the sum of squares per cluster is minimized (Hartigan and Wong, 1979), with the drawback that k must be specified beforehand. Ward linkage is a hierarchical clustering method that merges clusters such that the increase in intra-cluster Ward's distance is minimized (Ward, 1963) and has been described as the method that most closely accomplishes the goals of clustering (Tufféry, 2011). More comprehensive descriptions of these clustering methods can be found elsewhere (Govender and Sivakumar, 2020; Pérez et al., 2017). Prior to clustering, a weighted distance matrix was calculated, similar to Taubman et al. (2006): (1) normalized trajectory coordinates to give equal weighting to both horizontal and vertical transport; (2) weighted time steps linearly back in time; and (3) assigned nearby points (time step < 6 h) zero weighting on the clustering to remove the influence of aircraft position on the clustering.
2.3 Accumulated precipitation along individual trajectories
Accumulated precipitation along individual trajectories (APT) was calculated using data from satellite precipitation products (SPPs): (1) the Precipitation Estimation from Remotely Sensed Information using Artificial Neural Networks – Climate Data Record (PERSIANN-CDR) (Ashouri et al., 2015; Nguyen et al., 2018); (2) the Integrated Multi-satellitE Retrievals for the Global Precipitation Measurement (GPM) mission (IMERG) (Huffman et al., 2019); and (3) the Tropical Rainfall Measuring Mission (TRMM) Multi-satellite Precipitation Analysis (TMPA) 3B42-V7 (Huffman et al., 2007). The purpose of utilizing multiple SPPs is to account for the uncertainties inherent in satellite retrievals, particularly during very light or heavy rainfall conditions, providing us with an ensemble of estimates rather than relying on a single SPP (S. Chen et al., 2020; Liu, 2016; Maggioni et al., 2016; Mahmud et al., 2017; Tan and Santo, 2018). Furthermore, although these SPPs measure surface precipitation and do not fully capture scavenging effects aloft, we use APT as an indicator of whether an air mass passed through a convectively active region.
PERSIANN-CDR (0.25∘ × 0.25∘, daily resolution) uses a modified PERSIANN algorithm utilizing NCEP Stage IV hourly precipitation and monthly precipitation from the Global Precipitation Climatology Project (GPCP) to maintain monthly amounts consistent with GPCP (Ashouri et al., 2015). PERSIANN-CDR data are available at the Center for Hydrometeorology and Remote Sensing (CHRS) Data Portal (http://chrsdata.eng.uci.edu, last access: 8 June 2020) (Nguyen et al., 2019).
IMERG (0.1∘ × 0.1∘, 30 min resolution) integrates multiple satellite retrievals from the passive microwave (MW) precipitation retrievals provided by the suite of GPM constellation passive microwave radiometers (Kummerow et al., 2015), the Climate Prediction Center MORPHing technique (CMORPH) from NOAA, and PERSIANN-Cloud Classification System (PERSIANN-CCS; Hong et al., 2004) from the University of California, Irvine. These data are available from the NASA Precipitation Processing System (Skofronick-Jackson et al., 2018). For inter-calibrating various MW precipitation products, IMERG uses the GPM_2BCMB product (Olson, 2018) that utilizes the GPM Microwave Imager (GMI) and Dual-frequency Precipitation Radar (DPR) instruments on the GPM core satellite IMERG (Hou et al., 2014; Kidd et al., 2020). For this study, we use IMERG Final Run data, available at https://pmm.nasa.gov/data-access/downloads/gpm (last access: 6 July 2020).
TMPA (0.25∘ × 0.25∘, 3 h resolution) similarly combines data from multiple satellites such as TRMM (pre-2015), NASA's Aqua, and the NOAA satellite series, involving calibration with gauge data when feasible (Huffman et al., 2007). Though TRMM ended its service in 2015, the TMPA 3B42 algorithm was continued in parallel with IMERG through December 2019 and had been based on a climatological calibration since 2014. As TMPA is climatologically calibrated, TMPA may be less sensitive to interannual variability in precipitation; thus, including TMPA in this study may provide a better idea of the spread among SPPs. TMPA data are accessible through https://pmm.nasa.gov/data-access/downloads/trmm (last access: 28 January 2020).
Precipitation along each trajectory was integrated from the trajectory spawn point (i.e., P3-B sampling location) to the point when it reaches the boundary of a source region. An additional 24 h along the trajectory after reaching a source region was included in the APT integration to account for precipitation effects within the source region (Matsui et al., 2011a, b). No significant APT differences were found between using 0, 24, or 48 h for the APT calculation, suggesting that our results are robust with regard to the added duration. Furthermore, APT comparisons demonstrate that our results are independent of chosen SPP in terms of APT ranking (i.e., all SPPs agreed on which source regions are associated with the highest or lowest APTs).
2.4 Other data
Elevation data (Fig. 1a) were acquired from the United States Geological Survey (USGS) Global Multi-resolution Terrain Elevation Data 2010 (GMTED2010) (Danielson and Gesch, 2011). Population density data for 2020 (Fig. 1b) were retrieved from the Gridded Population of the World (GPW), v4 (Center for International Earth Science Information Network, 2018) (https://sedac.ciesin.columbia.edu/data/set/gpw-v4-population-density-rev11/data-download, last access: 3 July 2020). Depicted in Fig. 1c, active fires tagged with high confidence (>80 %; Bhardwaj et al., 2016) were obtained from the Moderate Resolution Imaging Spectroradiometer (MODIS) Collection 6 algorithm (https://firms.modaps.eosdis.nasa.gov/, last access: 27 June 2020) (Levy et al., 2013) and converted into average fire density at 0.5∘ × 0.5∘ resolution. Planetary BL (PBL) sulfur dioxide (SO2) was retrieved by the Ozone Monitoring Instrument (OMI) and obtained from NASA Goddard Earth Sciences Data and Information Services Center (GES DISC) (Li et al., 2015). The OMI SO2 data were then resampled to 1∘ × 1∘ resolution and averaged between 1 August and 15 October 2019 (Fig. 1d). Reanalysis data from NCEP/NCAR (2.5∘ × 2.5∘) were used to examine synoptic conditions (Kalnay et al., 1996).
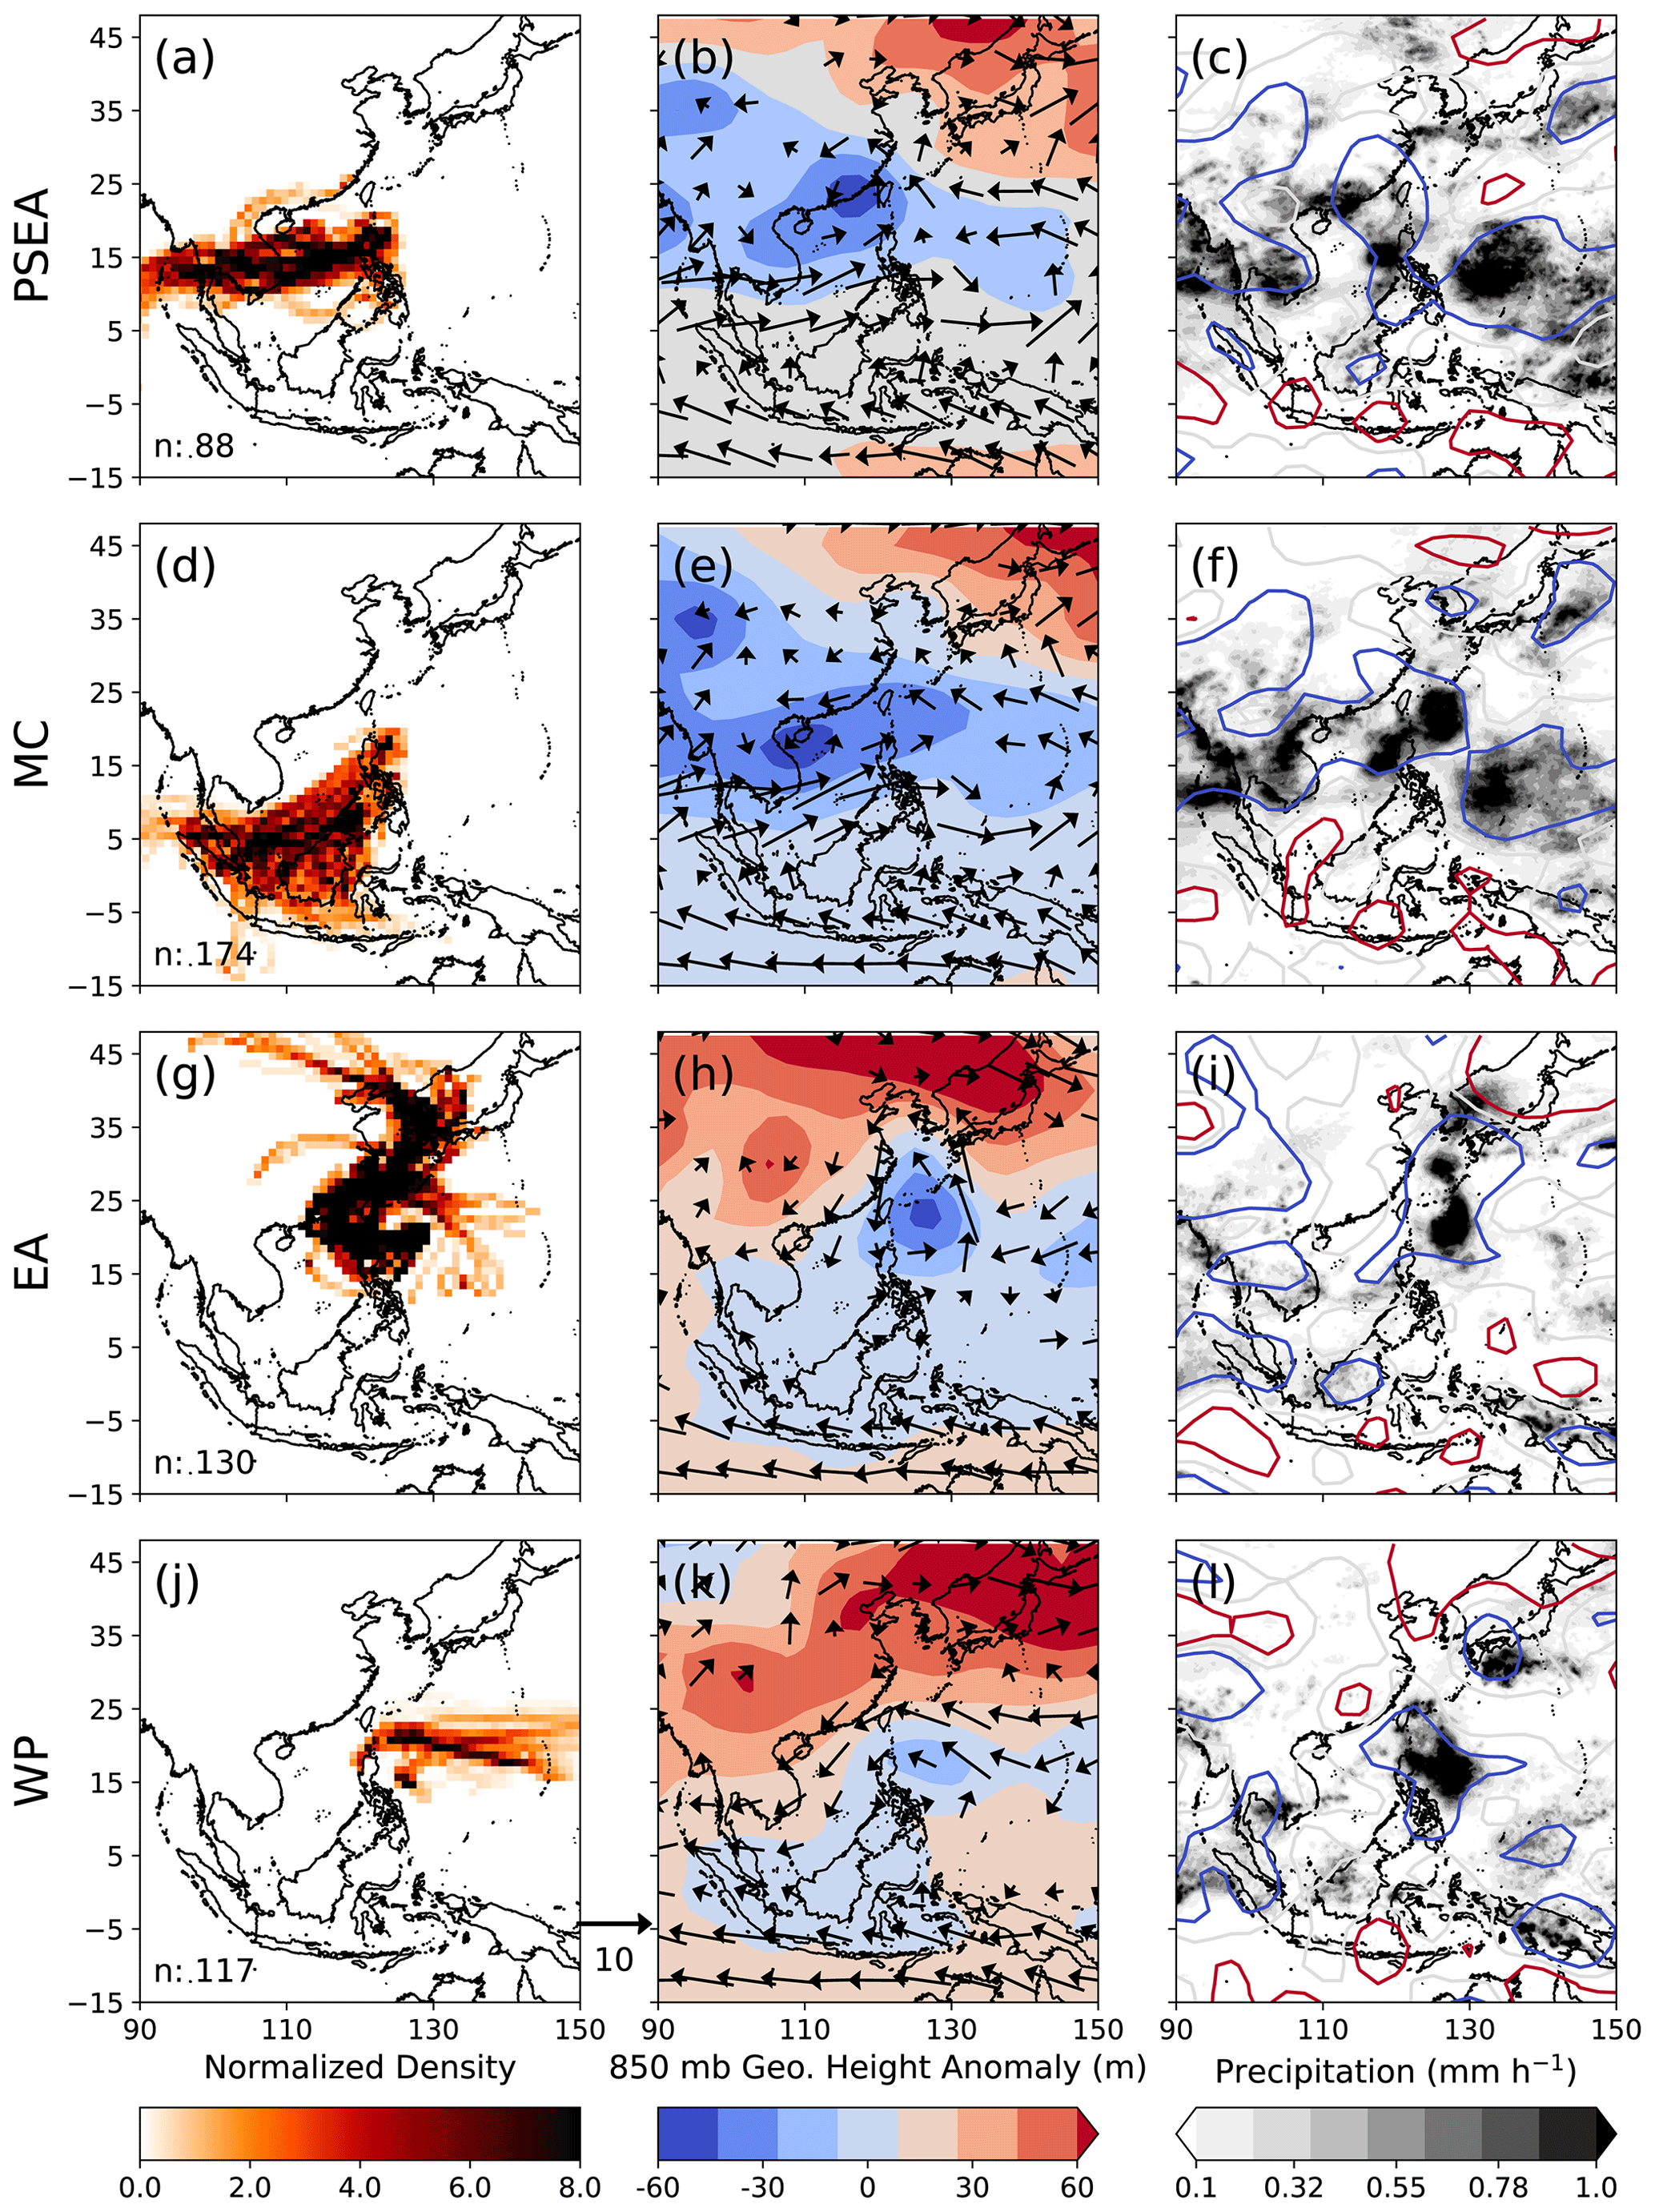
Figure 3Classified trajectories and synoptic conditions associated with transport from (a–c) peninsular Southeast Asia (PSEA), (d–f) the Maritime Continent (MC), (g–i) East Asia (EA), and (j–l) the West Pacific (WP). Left column: trajectory density normalized to the mean per source region, with the number of trajectories classified as coming from each source region annotated on the lower left of each panel. Middle column: NCEP 850 mb geopotential height anomaly from the mean for 2019, overlaid with horizontal winds (≥ 2 m s−1). Right column: PERSIANN-CDR average precipitation overlaid with NCEP 850 mb ω, where red (blue) contour lines represent ω values above 0.05 Pa s−1 (below −0.05 Pa s−1).
Table 1Definitions of frequently used abbreviations in this work.

3.1 Observed transport patterns during CAMP2Ex
Figure 1 provides an overview of the general source regions impacting the TNWP. The TNWP is surrounded by areas of high population density in EA, MC, and PSEA (Fig. 1b). Burning was prevalent mainly in the MC (Fig. 1c), although fires were also detected along the eastern PSEA coast. Satellite retrievals of PBL SO2 reveal possible point sources (Fig. 1d), perhaps from volcanoes, shipping, burning, and industry (Fioletov et al., 2016; Guttikunda et al., 2001; Zhang et al., 2019); however, we caution that cloud contamination may influence the SO2 retrievals, and it is used here to demonstrate the variety of sources in Asia.
Trajectories from each source region show distinct pathways (Fig. 3a, d, g, and j), indicative of differences in accompanying synoptic-scale circulation. These pathways are generally corroborated by both k means and Ward linkage clustering methods (Figs. S3 and S4), confirming the robustness of our predefined source regions (Fig. 1a). Prior to further discussion, we emphasize the temporal aspect of these observed transport patterns (Figs. 2 and 3), in particular, their dependence on both synoptic (e.g., SWM) and mesoscale meteorology (e.g., typhoons), which varied during CAMP2Ex in terms of phase and frequency, respectively. Consequently, a specific transport pattern may be more dominant in one monsoon phase and less so in another while being enhanced (or suppressed) by intermittent mesoscale phenomena.
3.1.1 Southwest monsoon
Beginning with transport during the SWM prior to 20 September 2019, PSEA air is advected by uniform westerlies (Fig. 3a) associated with cyclonic activity over the northern South China Sea (SCS) (Fig. 3b) (Cheng et al., 2013; Huang et al., 2020; Lin et al., 2009). In comparison, although MC transport also occurs during the SWM, the mechanism behind MC transport is driven instead by southwesterlies originating across the MC (Fig. 3d) (Ge et al., 2014; J. Wang et al., 2013; Xian et al., 2013). Transport from the MC is further promoted by well-developed cyclones entering PSEA (Fig. 3e), as previously highlighted by observational (Hilario et al., 2020a; Reid et al., 2015) and modeling studies (J. Wang et al., 2013). The similar cyclonic activity over northern SCS/PSEA may explain the confluence of air masses from PSEA and MC (e.g., RF6), indicated by the frequent sampling of MC and PSEA air in the same RF (Fig. S2).
Table 2Statistics for accumulated precipitation along trajectories (APT, mm) for peninsular Southeast Asia (PSEA), the Maritime Continent (MC), East Asia (EA), and the West Pacific (WP), calculated with IMERG, TMPA, and PERSIANN-CDR. Median values are presented along with the 25th and 75th percentiles provided in parentheses.
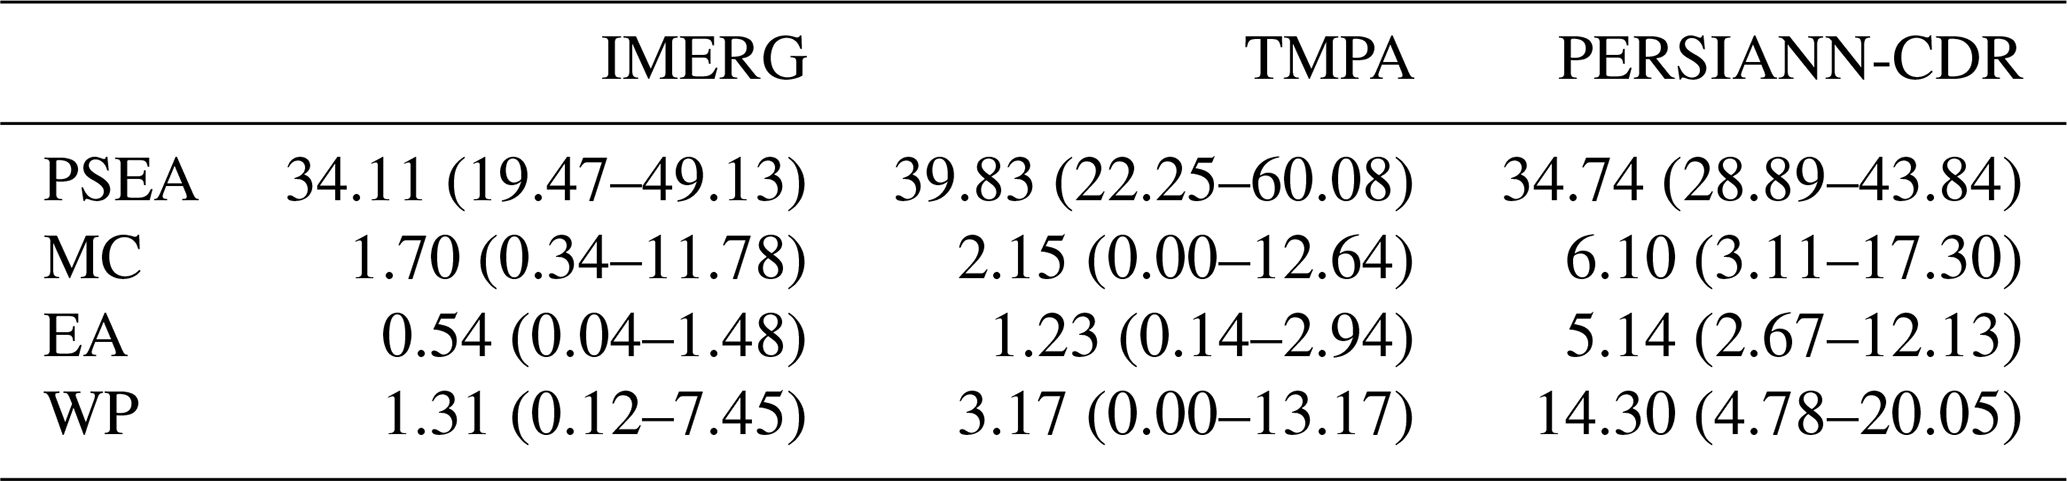
A key difference between PSEA and MC air is that PSEA air passed through convective areas over the PSEA (Takahashi et al., 2010), the SCS (Fig. 3a and c) (Chen et al., 2017), and along the western coast of the Philippines (Akasaka et al., 2007; Chen et al., 2017; Cruz et al., 2013; Hilario et al., 2020c), while MC air passed through areas with less precipitation (Fig. 3d and f). As a result, PSEA air showed much higher APT than MC air (Table 2) and was more likely to have been processed by clouds. The transport pathway of PSEA through convective regions may lead to wet scavenging and aqueous-phase processing (MacDonald et al., 2018; Moteki et al., 2012; Sorooshian et al., 2006, 2007; Wonaschuetz et al., 2012), affecting both air mass composition and particle size distributions (Sect. 3.3).
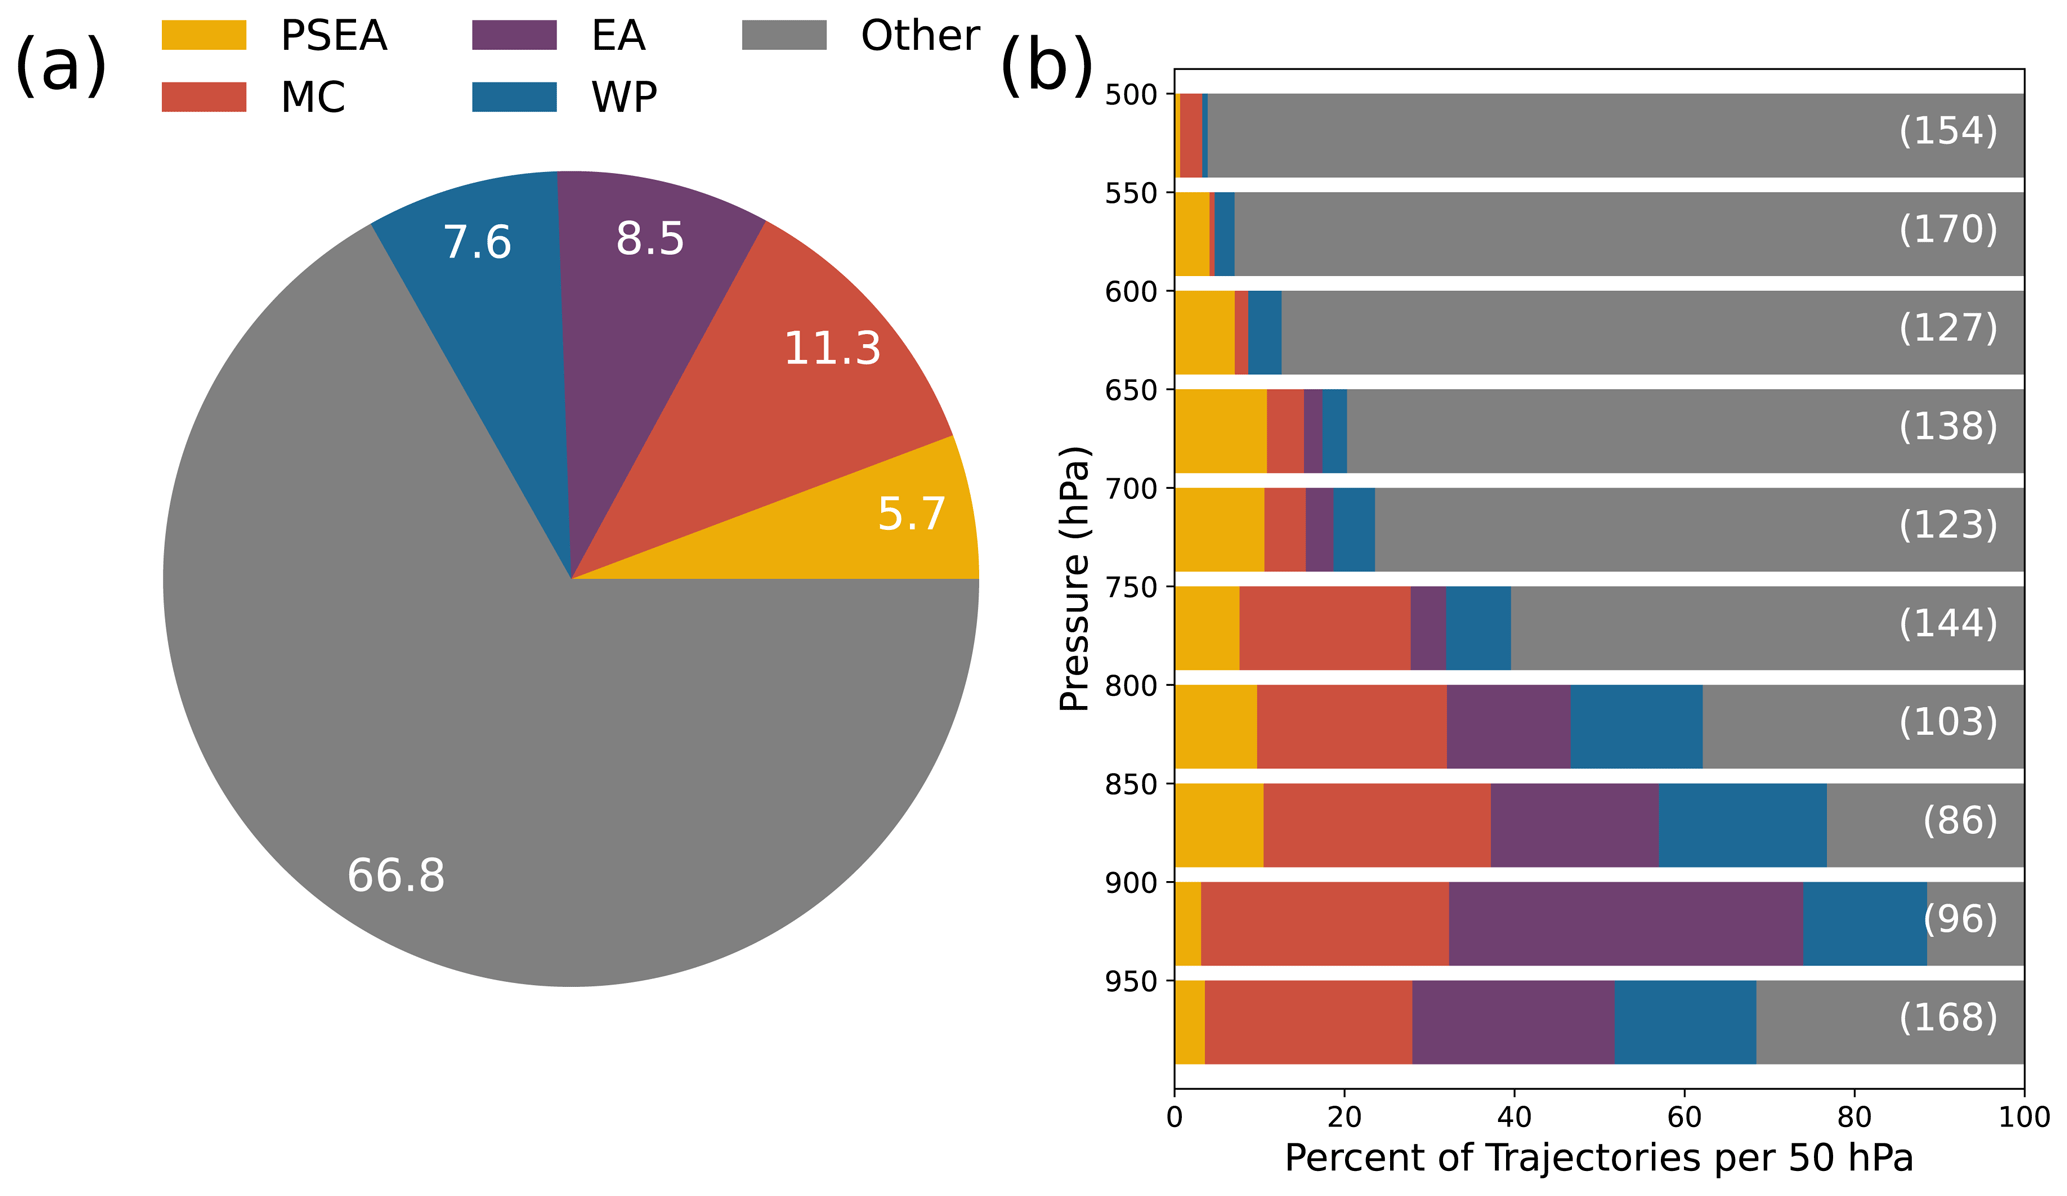
Figure 4Relative contributions (in percentages) of air masses arriving from study regions averaged over (a) all altitudes and (b) pressure levels (hPa). Total number of trajectories per pressure bin is provided at the right end of (b). Source regions are peninsular Southeast Asia (PSEA), the Maritime Continent (MC), East Asia (EA), and the West Pacific (WP).
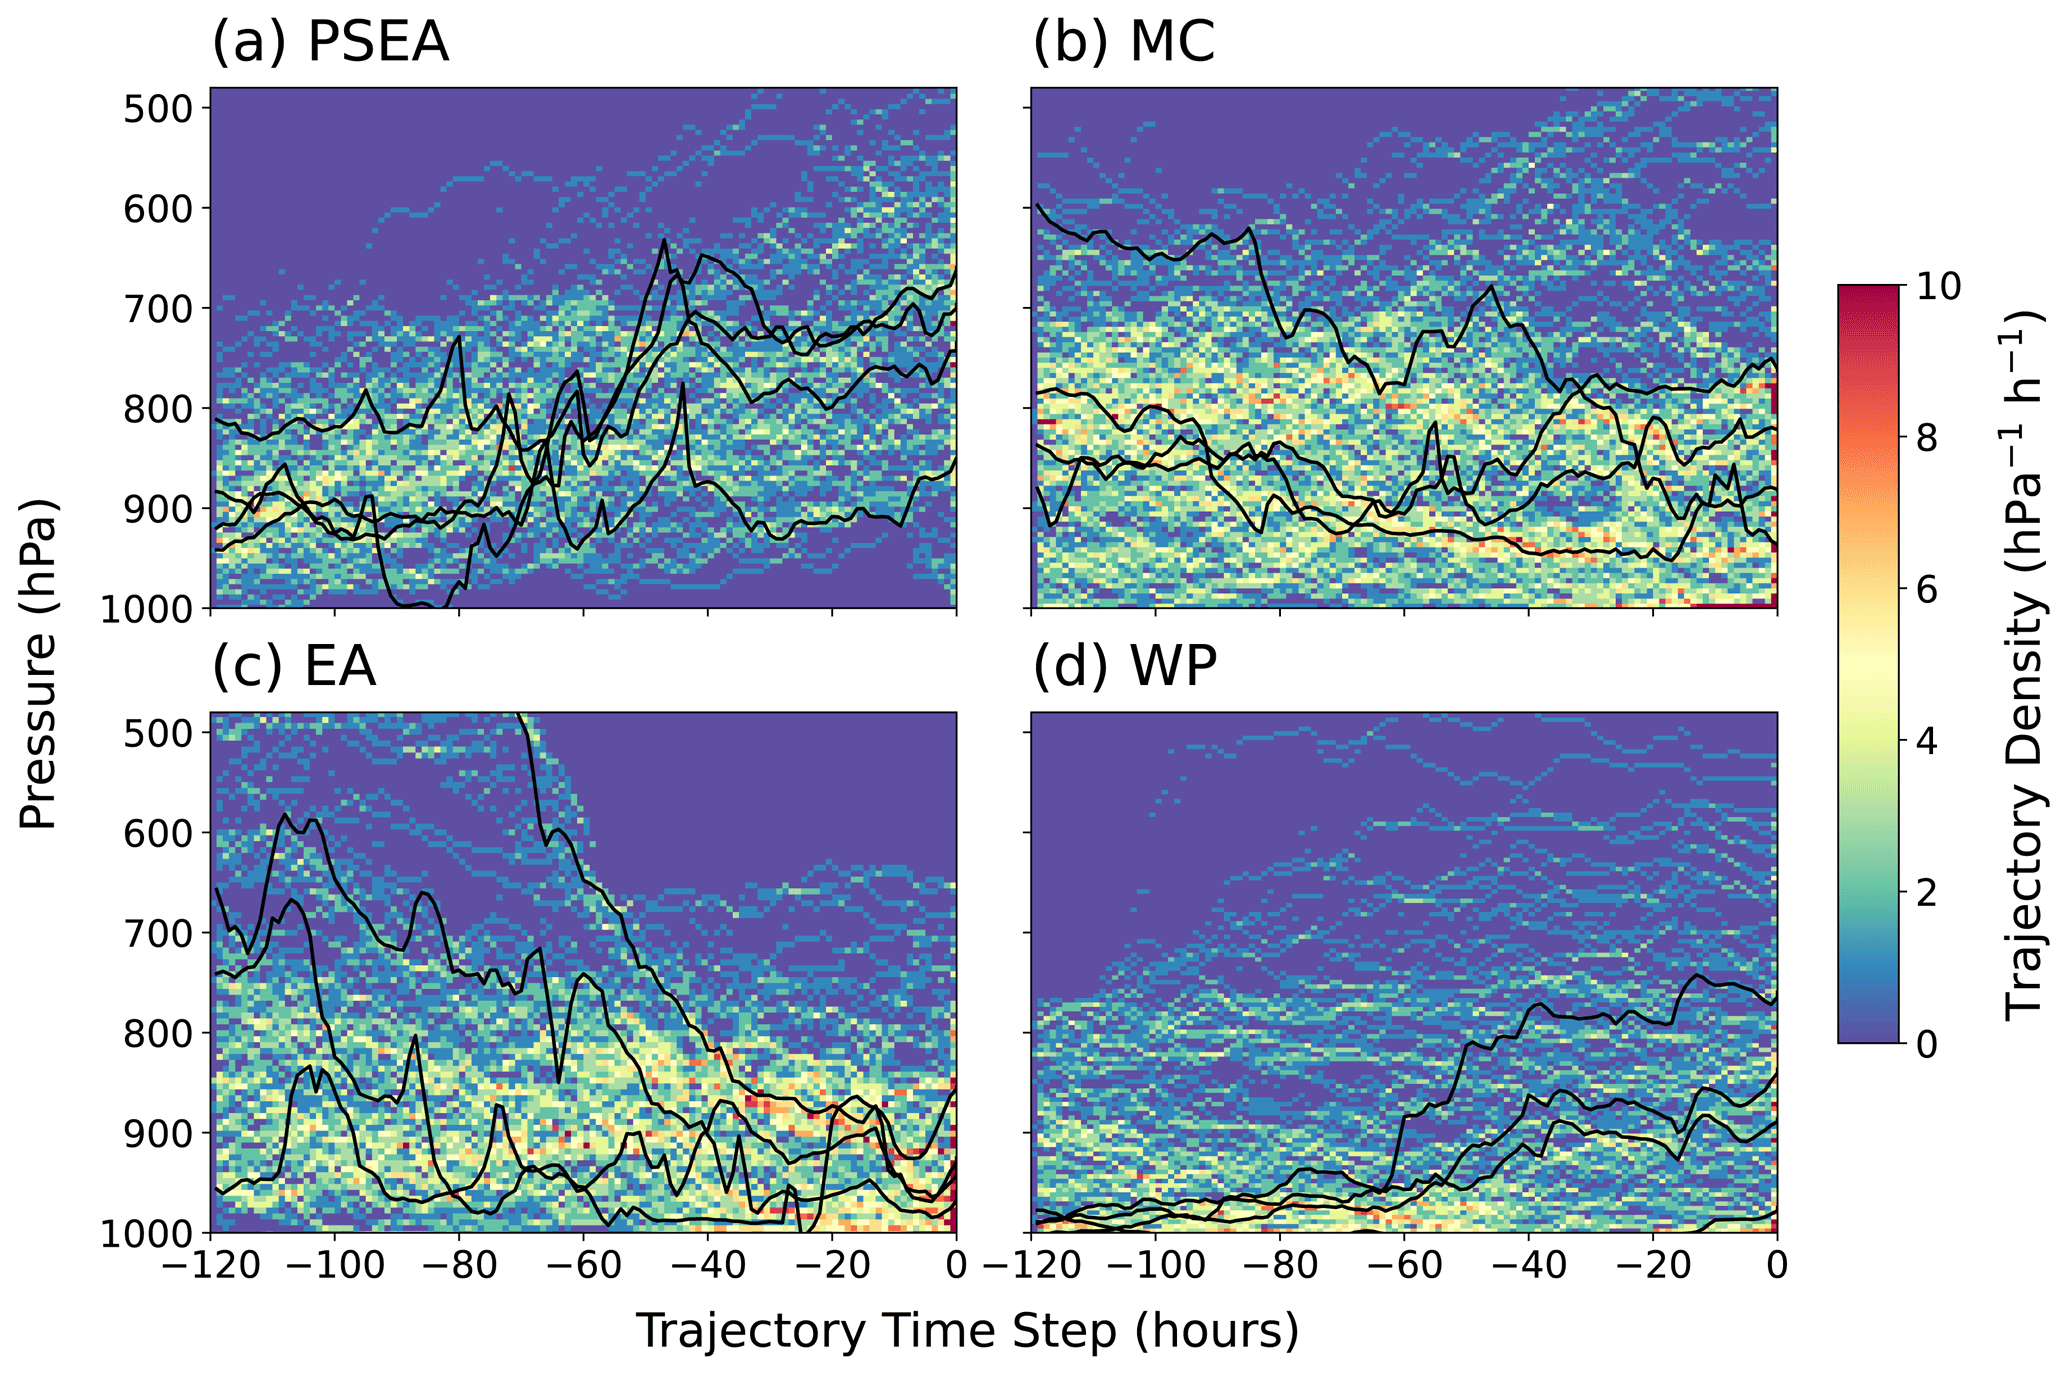
Figure 5Vertical motion during transport from (a) peninsular Southeast Asia (PSEA), (b) the Maritime Continent (MC), (c) East Asia (EA), and (d) the West Pacific (WP). Color corresponds to density as a function of trajectory altitude (pressure) and time step. Example trajectories are plotted in black to show actual vertical motion.
In terms of sampled air masses, PSEA and MC showed contributions of 5.7 % and 11.3 %, respectively (Fig. 4a), and they differ in terms of vertical distribution (Fig. 4b). PSEA air was sampled across a wide range of altitudes with the majority of observations over 900 hPa, similar to Kondo et al. (2004), explainable by convection-related lofting (Fig. 5a). Very few observations of PSEA air were made near the surface. The lofting of PSEA air can occur over the PSEA itself (Fig. 3c) (Kondo et al., 2004), through mechanisms like orographic effects (Lin et al., 2009). Convection over the SCS trough likely also contributes to lofting (Fig. 3c) (Chen et al., 2017). Lofting of PSEA air into the FT has important downstream ramifications as it modulates both aerosol composition and size distribution (Matsui et al., 2011a; Moteki et al., 2012; Oshima et al., 2013). However, we note that vertical motion is an important source of uncertainty in trajectory models (Harris et al., 2005) and should be interpreted with caution.
In contrast to PSEA air, sampled MC air was well-mixed within the BL (Fig. 5b), but the observation frequency of MC air dropped sharply above 750 hPa, consistent with previous modeling studies (e.g., Xian et al., 2013). Such distinct vertical distributions between MC and PSEA air are perhaps due to a highly sheared environment during the SWM, generally contributing to distinct air mass sources across different altitudes (Atwood et al., 2013; Sarkar et al., 2018) and varying degrees to which these air masses are processed (Sect. 3.3).
3.1.2 Monsoon transition
The arrival of the MT period after 20 September 2019 led to a synoptic-scale shift (Fig. 2), allowing the sampling of air from EA and WP (Fig. 3g and j). Transport from EA was observed across several MT flights (Fig. S2) and originated mainly from southeastern China, Korea, and Japan (Fig. 3g), suggesting the entrainment of anthropogenic emissions (Sect. 3.3) (Cheng et al., 2013; Hatakeyama et al., 2001, 2004; Kim et al., 2009; Wang et al., 2016). Depicted in Fig. 3h, Asian outflow was promoted by the pairing of a well-developed cyclone passing over the East China Sea (Hatakeyama et al., 2001, 2004; Uno et al., 1998) and an anticyclone over the Asian continent (Honomichl and Pan, 2020). In comparison, WP transport was observed mainly towards the end of the campaign (Fig. S2), likely a consequence of sampling location, and was driven by Pacific northeasterlies (Fig. 3j–k). Transport from the WP, similar to that of EA, coincided with an anticyclone over the Asian continent (Fig. 3k); however, WP transport is marked by the absence of the East China Sea cyclone that promoted southward transport of EA air (Fig. 3h). This difference may explain why EA and WP air were usually sampled in separate RFs (Fig. S2), in contrast to PSEA and MC air, which tended to be sampled together.
Air from EA and WP show similarly low APT (Table 2), explainable by the generally lower precipitation in MT (Fig. 3i and l) compared to SWM (Fig. 3c and f) (Matsumoto et al., 2020), as well as the lower number of cyclone occurrences after 20 September 2019. Although EA transport was driven by a well-developed cyclone (Fig. 3h), trajectories suggest that EA air traveled through the outer bands of the cyclone (Fig. 3g), largely avoiding high-precipitation areas (Fig. 3i). This suggests that anthropogenic emissions entrained in EA air experienced low levels of scavenging and were more likely to be sampled, in contrast with high APT urban source regions like PSEA (Sect. 3.3).
Transport from EA and WP were quite similar in terms of relative contribution (8.5 % and 7.6 %, respectively; Fig. 4a) and vertical sampling distribution (Fig. 4b). Sampled EA and WP air were largely constrained to the BL, though EA air was sampled almost entirely below the 900 hPa level, while WP air was more evenly sampled. In terms of vertical motion during transport, some EA trajectories exhibited downward motion (Fig. 5c), likely due to subsidence from the continental anticyclone (Fig. 3h), contrasting the vertical motion of PSEA air, which generally experienced upward motion associated with convection (Fig. 5a).
In summary, important transport features over the TNWP include the following: (1) SWM transport from the MC and PSEA was driven by southwesterlies and cyclonic activity over northern SCS/PSEA, while MT transport from EA and the WP was driven by Pacific northeasterlies, anticyclones over the Asian continent, and well-developed cyclones over the East China Sea; (2) EA and MC air were sampled largely within the BL, did not exhibit significant upward motion, and experienced low APT, suggesting that they likely carry urban/continental or biomass burning emissions; in contrast, (3) PSEA air may have undergone a high degree of aerosol scavenging over convective regions (e.g., SCS), indicated by high APT and upward motion of trajectories.
3.2 Sensitivity analysis
Due to the complex nature of long-range transport and the limited resolution of the meteorological input data, there is inherent uncertainty in the generated trajectories. In order to assess the effect of this uncertainty on our results, we evaluated the effect of modifying the following variables on our source-region distribution: (1) trajectory height threshold over source regions; (2) back trajectory run time; (3) vertical profile filtering; (4) monsoon phase; and (5) aircraft sampling location. For example, to test the sensitivity of our results to trajectory height threshold (i.e., 2 km over source regions), we varied this threshold (e.g., 0.5, 1, 3 km over source regions), reclassified trajectories according to the new threshold, and compared the new source-region distribution to the original result, which was presented in Sect. 3.1. Except for aircraft sampling location, independently changing any of these variables had little effect on the resulting source-region distribution (Table S1 in the Supplement). The relative contributions of source regions did vary significantly with sampling location, though areas surrounding Luzon (e.g., east of Luzon, north of Luzon) showed some degree of similarity. Thus, we emphasize that, as with any aircraft campaign, observed transport is to some degree dependent on aircraft location.
To reduce the effect of local emissions, we excluded trajectories classified as influenced by the Philippines (PH). This filter screened approximately 8 % of the data. To evaluate our filter for Philippine-influenced trajectories (hereafter, PH filter), air mass characteristics were compared between transported air unaffected by PH (no PH air; e.g., MC) and transported air mixed with PH air (with PH; e.g., MC-PH). A local signal was observed for N100−1000 nm, suggested by differences in the histograms of N100−1000 nm between non-PH and PH-mixed air (Fig. S5), particularly for MC and PSEA air. Differences in the species concentration histograms of non-PH and PH-mixed air were also observed for other anthropogenic species (BC, OA, ; not shown), confirming the effectiveness of the PH filter.
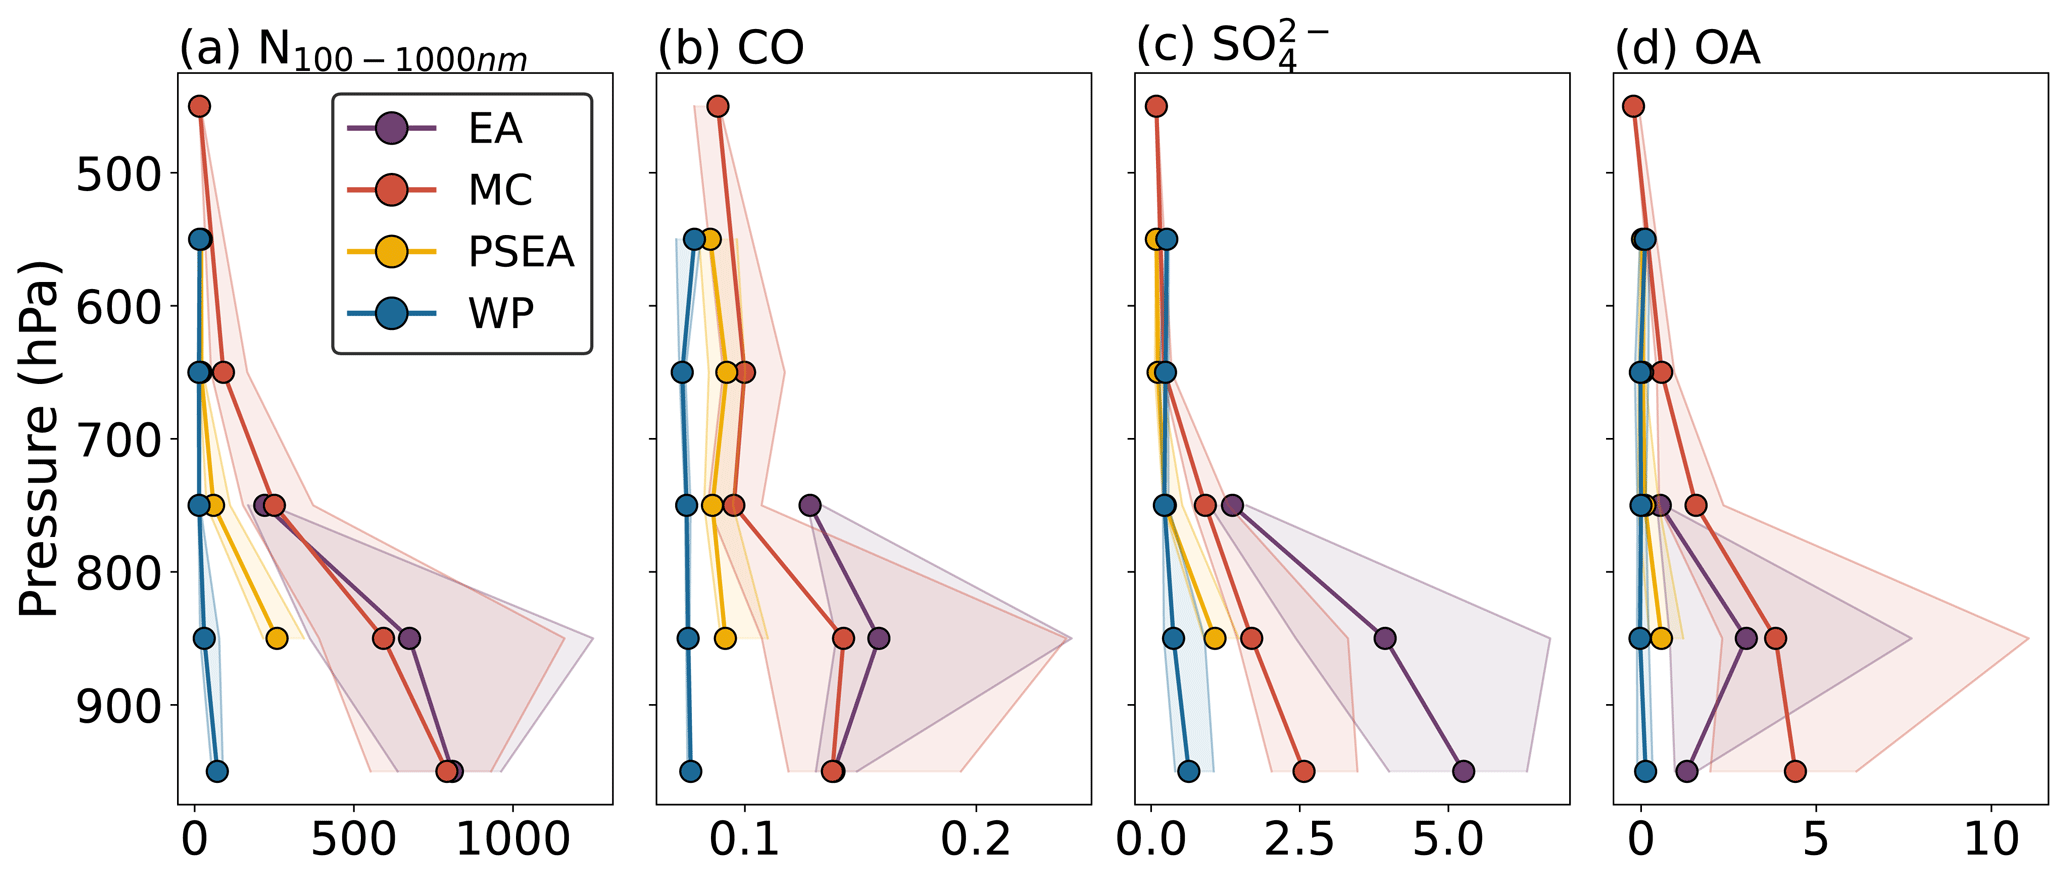
Figure 6Vertical median profiles of composition for peninsular Southeast Asia (PSEA), the Maritime Continent (MC), East Asia (EA), and the West Pacific (WP). (a) N100−1000 nm (cm−3), (b) CO (ppm), (c) (µg m−3), (d) OA (µg m−3). Left and right sides of shaded areas refer to 25th and 75th percentiles, respectively.
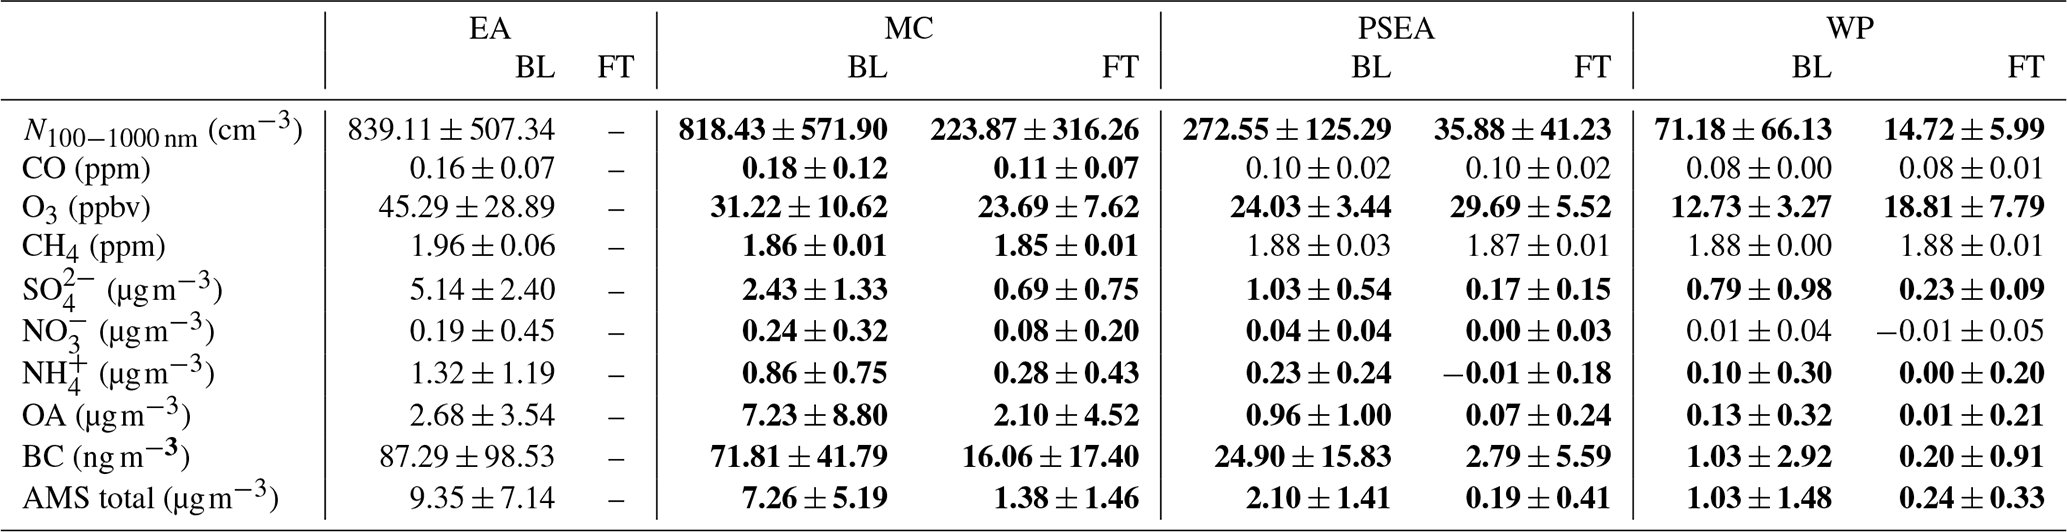
Table 3Comparisons of boundary layer (BL; < 2 km) and free troposphere (FT; > 2 km) mean values across source regions. Uncertainty values are presented as 1 SD. Bold values denote when significant statistical differences are found (p<0.05). Corresponding p values are provided in Table S2. The EA FT column was left blank due to the infrequent sampling of EA air in the FT. AMS total is provided minus RF9 for better comparison to BC (no RF9 SP2 data). Statistics exclude RF18 (local pollution flight).
3.3 Chemical composition of transported air masses
A convenient opportunity afforded by having conducted the air mass classification presented above was to examine how gas and aerosol properties vary for each source region based on vertically resolved in situ aircraft measurements. To account for regional vertical wind shear (Fig. 2) while considering the generally lower classification frequency at higher altitudes (Fig. 4b), air mass characterization was resolved into BL and FT subsets and composited by source region (Table 3). The delineation between BL and FT composition is demonstrated by selected species (Fig. 6), which generally dropped in concentration above the BL (⪅ 850 hPa). Prior to further discussion, we note here that shipping is a major regional source (Streets et al., 1997, 2000) and may contribute appreciably to all air masses.
Significant differences in composition were observed in the same monsoon season (e.g., SWM) depending on air mass origin. Air from PSEA had much lower species concentrations than MC (Table 3) due to decreased emissions and increased potential for wet scavenging. Sampled MC air showed statistically significant differences between BL and FT concentrations for both gas and aerosol species (Table S2), indicative of emissions constrained to the BL, and exhibited strong biomass burning signals in its composition profile (e.g., N100−1000 nm, CO, , OA, and BC) (Maudlin et al., 2015; Pósfai et al., 2003; Reid et al., 1998, 2005; Theodoritsi et al., 2020; Yadav et al., 2017). We note that peaks of CO (Fig. 6b) and CO2 (not shown) were observed in MC samples at around 650 hPa, suggestive of MC burning emissions lofted into the FT; however, this feature consisted of few samples and did not appear in other gases (e.g., SO2) and thus warrants caution in its interpretation.
In contrast, PSEA air was generally characterized by concentration magnitudes between those of MC and WP. Aerosol concentrations of PSEA air in the FT were lower by at least 1 order of magnitude than those in the BL (, , OA, BC) while trace gases (CO, CH4) showed more similar BL and FT concentrations (Tables 2 and S2; Fig. S6). These aerosol–gas differences point to (1) the lofting of PSEA air into the FT, as suggested by the similarity of trace gas concentrations between BL and FT, and (2) the consequent scavenging of aerosol particles, explaining the much lower aerosol concentrations in the FT (Oshima et al., 2012, 2013; Sievering et al., 1984). For comparison, MC air showed large BL and FT differences in both aerosol and gas species, the latter of which indicates the infrequent lofting of MC air (Figs. 4b and 5b). Since PSEA air came from a populated region (Fig. 1b) and likely originally contained anthropogenic aerosol particles, these unique characteristics of PSEA air compared to MC and EA air support the likelihood of aerosol scavenging in PSEA air. These observations are robust due to the relatively even sampling frequency of PSEA across altitudes (Fig. 4b).

Figure 7Linear regressions of (a) , (b) , (c) , (d) , and (e) for the Maritime Continent (MC; red) and East Asia (EA; purple). Annotated are species ratios (slope) per region and standard error (SE) as a measure of uncertainty (slope ± SE). Pearson's R values are provided in parentheses. Only data with ΔCO > 0.02 ppm were included to better identify combustion-related ratios. Peninsular Southeast Asia and West Pacific data were not plotted due to low correlations.
Transport during the MT season showed similarly distinct composition profiles depending on air mass origin. Air from EA exhibited higher concentrations of , O3, CH4, and , owing to urban emissions in continental outflow (Chuang et al., 2014; Talbot et al., 1997; Thornton et al., 1999; Umezawa et al., 2014; Wang et al., 2007) and extensive secondary aerosol formation (Hatakeyama et al., 2001, 2004, 2011; Krupa and Manning, 1988; Matsui et al., 2014). In contrast, WP air is characterized as pure marine due to composition similar to those previously reported in Pacific marine environments (Davis et al., 1996; Matsumoto et al., 1998; Talbot et al., 1997).
3.3.1 Species ratios
Composition profiles between regions (Table 3) reveal clear differences as a function of (1) emission source and (2) passage through convective regions indicated by APT (Table 2). The role of emission source was most evident when comparing air masses of low APT (EA, MC). Though EA and MC had similar BL values for N100−1000 nm (Table 3), they showed distinct chemical differences: MC air was characterized by higher concentrations of biomass burning tracers (e.g., CO, CH4, , OA), while EA air showed influence from urban/continental sources and secondary formation (e.g., O3, CH4, , ). Such differences in composition are corroborated by species ratios derived with linear regression (Fig. 7). Prior to a discussion on the species ratios, we note that the reported species ratios in this study are difficult to compare directly to at-source measurements of the same quantity because the composition of air masses was likely influenced by sources and sinks during transport (e.g., Choi et al., 2019; Conte et al., 2019; Gruber et al., 2019; Yang et al., 2009); however, differences in species ratios can still aid in air mass characterization and point to possible emission sources.
In Fig. 7a, the higher ratio of EA air vs. MC air is indicative of an inefficient combustion signature in MC air (Halliday et al., 2019), attributable to the predominantly smoldering phase of MC fires (Gras et al., 1999; Reid et al., 2013). We note that the poor ΔCO2–ΔCO correlation for MC air indicates that our reported ratio does not reflect expected emission ratios (Andreae, 2019; Hurst et al., 1994). This further suggests (1) our source-region classification (i.e., MC, EA) may not perfectly capture air mass differences and (2) additional sources of CO or CO2 during transport. The contribution of other CO or CO2 sources within the MC besides biomass burning may also explain the low correlation. Thus, it is necessary to use multiple species ratios to supplement air mass chemical characterization.
The strong relationship between CH4 and CO in MC air is a good indication of biomass burning influence (Andreae, 2019; Hecobian et al., 2011). The ratio of (Fig. 7b) was higher by 1 order of magnitude in EA air compared to MC air, indicating the contribution of CH4 from EA residential and industrial activity (Geng et al., 2019; He et al., 2019; Tohjima et al., 2014) as well as from rice cultivation in EA (Xia et al., 2020).
As indicators of aerosol hygroscopicity (Kreidenweis and Asa-Awuku, 2014; Malm et al., 2005; Svenningsson et al., 2006), (Fig. 7c) and (Fig. 7d) ratios point to higher hygroscopicity in EA air than MC air (Cheung et al., 2020; Saxena et al., 1995; X. Wang et al., 2017; Z. Wang et al., 2018, Wang et al., 2019). Interestingly, though peat burning in the MC has been associated with (Ikegami et al., 2001; Reid et al., 2013), the elevated and lower in MC air are indicative of lower hygroscopicity. This is explainable by the high levels of OA emitted during biomass burning (Radzi bin Abas et al., 2004; Theodoritsi et al., 2020) or produced through gas-to-particle conversion during transport (Cappa et al., 2020; Mardi et al., 2018; Zhou et al., 2012). In contrast, lower and higher ratios of EA air signal hygroscopicity that is attributable to the high levels of SO2 in EA (Fig. 1d), facilitating the secondary formation of (e.g., Hatakeyama et al., 2011).
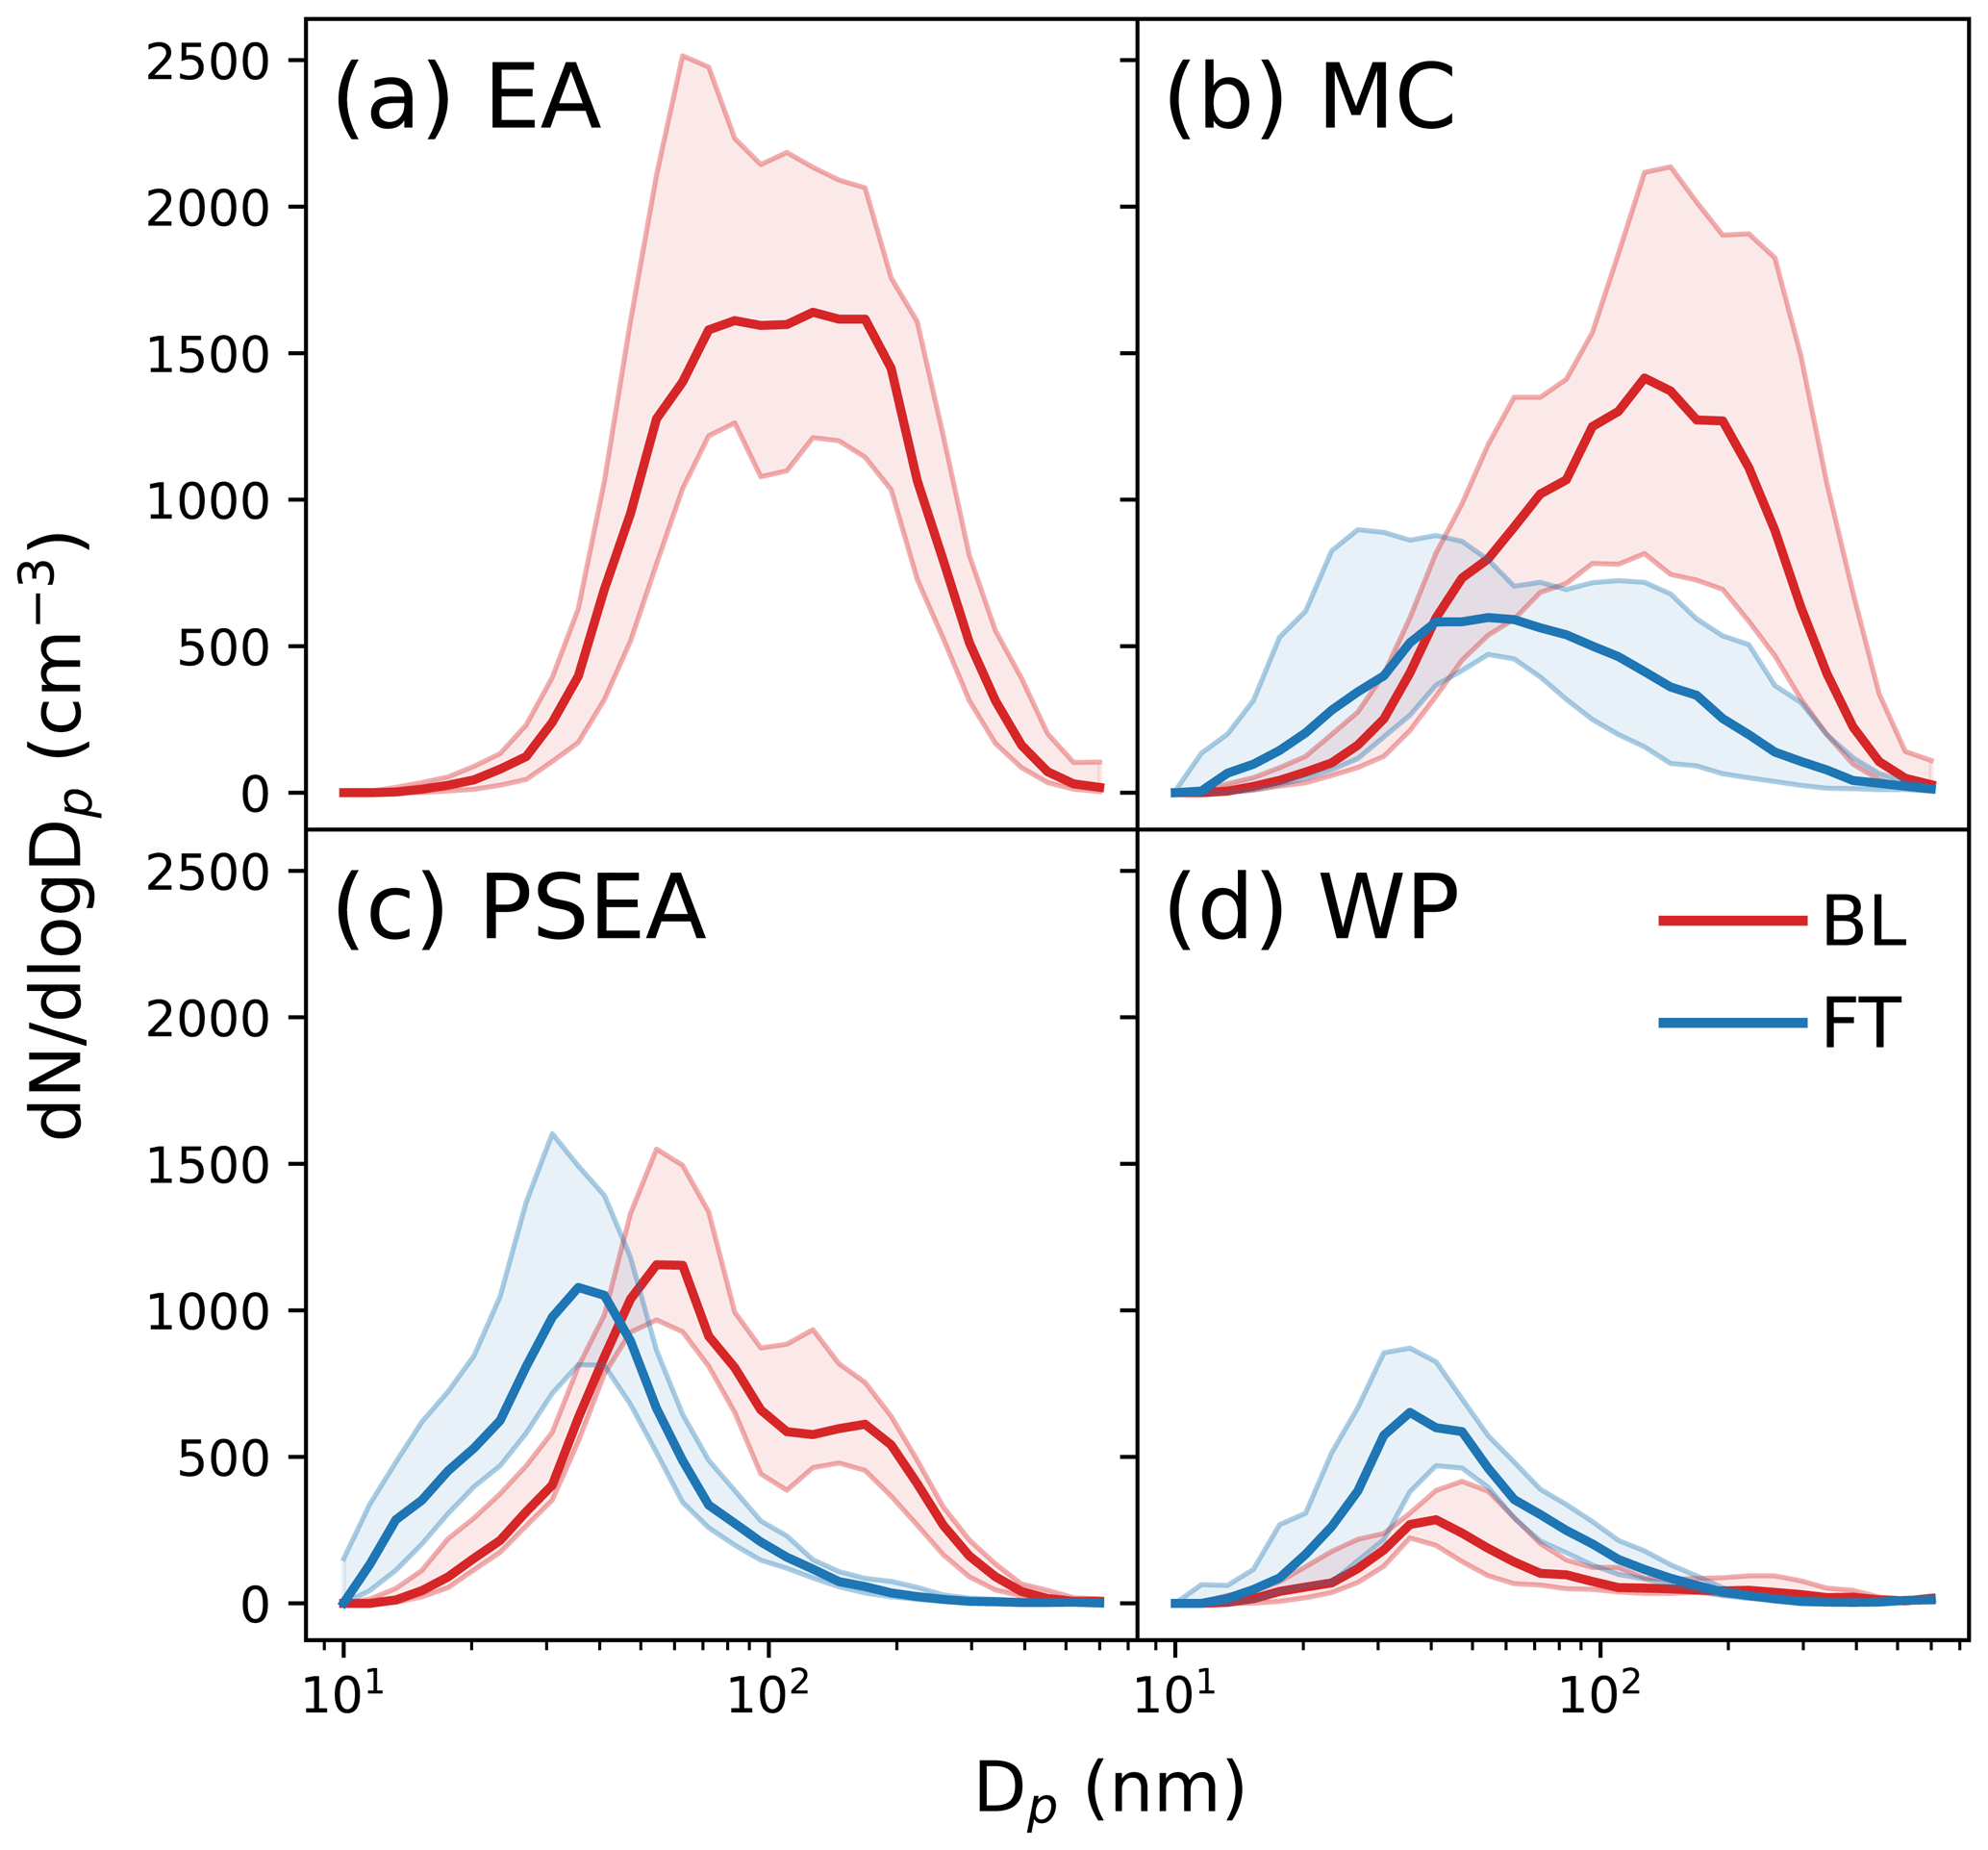
Figure 8Median FIMS number size distributions (; cm−3) as a function of geometric mean particle diameter (Dp; nm), resolved by source region and sampling altitude in the boundary layer (BL; < 2 km) and free troposphere (FT; > 2 km). Source regions are peninsular Southeast Asia (PSEA), the Maritime Continent (MC), East Asia (EA), and the West Pacific (WP). Upper and lower bounds of the shaded areas refer to 25th and 75th percentiles, respectively. The size distribution of EA air in the FT was not plotted due to the infrequent sampling of EA air in the FT.
Although MC was calculated to have low APT (Table 2), a comparison of BL and FT air from MC (Figs. S6 and S7) allows for speculation on a possible scavenging mechanism acting on FT air. Vertically resolved linear regressions of reveal a reduction in Δ in the FT compared to the BL (Fig. S7a), while (Fig. S7b) indicated no such effect on OA. Considering the higher hygroscopicity and therefore scavenging susceptibility of compared to OA (e.g., Kreidenweis and Asa-Awuku, 2014), we speculate the removal of to be related to wet scavenging. Comparisons of BL and FT aerosol concentrations (Fig. S6) and size distributions (Sect. 3.4; Fig. 8b) further support this possibility, as aerosol and particle concentrations have significantly lower values in the FT compared to BL, a difference not observed for trace gases (Fig. S6). The discrepancy between and (Fig. S7) implies externally mixed particles, which is surprising given the aged nature of these air masses (Gorkowski et al., 2020). Further analysis is required involving , O:C ratios to account for aging effects (e.g., internal mixing, oxidation) and determine the exact mechanism behind the difference. We emphasize that the hypothesized scavenging of MC air in the FT is largely speculation for now and mainly introduces opportunities for future work.
We note that the speculated wet scavenging is not apparent from APT, which suggested dry conditions for MC air (Table 2). This disagreement with APT stems from the usage of SPPs which typically describe surface precipitation, and, consequently, our APT may not fully capture potential wet scavenging effects aloft. Thus, the speculated scavenging mechanism of MC air in the FT may occur aloft and may not be linked to surface precipitation. Perhaps this mechanism is related to processes such as in-cloud scavenging (Sievering et al., 1984; Yang et al., 2021; Yu et al., 2020), but, indeed, this requires a deeper investigation in future work.
Due to BC's lack of secondary sources, the ratio of has been used to gauge transport efficiency as affected by physical removal processes in air masses (Matsui et al., 2011b; Moteki et al., 2012; Oshima et al., 2012) and as an indicator of combustion efficiency, which increases with (Kondo et al., 2011). The ratio of was much higher in EA air than in MC air (Fig. 7e), similar to observations by Pani et al. (2019) in Taiwan. This difference is explainable by burning in industrial and residential areas in EA (Bond et al., 2004; Geng et al., 2019) and the predominance of smoldering fires in the MC (Gras et al., 1999; Reid et al., 2013), which yield a lower than flaming fires (Kondo et al., 2011).
3.4 Size distributions of transported air masses
To more deeply characterize the air masses from different source regions, we examine the differences in normalized FIMS number (Fig. 8) and volume (Fig. S8) size distributions between BL and FT, which can also offer insights into convection-related removal. We note that these findings require further investigation in future research, which is outside the scope of this work focused on overall transport during CAMP2Ex. In-cloud processing during transport may influence particle sizes in these air masses, whereby a combination of the following processes can occur (e.g., Ervens, 2015; Sorooshian et al., 2007; Wonaschuetz et al., 2012), followed by detrainment from the cloud or wet removal: (1) collisions between interstitial aerosol and droplets; (2) coalescence among droplets; and (3) aqueous-phase processing in droplets. However, comparisons between size distributions between regions and between BL and FT may still lend valuable insights into transport-related processes (e.g., Moteki et al., 2012).
EA air in the BL (Fig. 8a) had a wide peak (40–200 nm), suggestive of contributions from multiple sources (e.g., industrial, rice cultivation) (Y. Chen et al., 2020; Geng et al., 2019; Wang et al., 2016; Xia et al., 2020). The width of the accumulation-mode peak and the absence of an Aitken mode peak may indicate aged aerosol that has been shifted towards larger modes during transport (Zhang et al., 2005).
MC air in the BL (Fig. 8b) had a single peak centered at 100 nm. Biomass burning emissions have been shown to greatly influence air mass composition (Engling et al., 2014; Fujii et al., 2015; Santoso et al., 2011), and, by extension, such a dominant emission source in addition to growth processes during transport explains the large accumulation-mode peak (Figs. 8b and S8b). The Aitken mode peak in MC FT air supports the possibility of new particle formation (NPF) and growth (Williamson et al., 2019), promoted by the removal of aerosols and transport of gases during lofting into the FT (Fig. S6). Significant differences between the size distributions of FT and BL air from the MC (Fig. 8b) point to a potential scavenging mechanism acting on MC air lofted into the FT (Sect. 3.3.1).
PSEA air in the BL had a bimodal size distribution, peaking around 50 and 200 nm (Fig. 7c). Comparing PSEA and MC air in the BL reveals much smaller particle sizes in PSEA air (Fig. 8c), explainable by differences in source emissions as well as by the susceptibility of larger particles to scavenging (Moteki et al., 2012). A comparison of BL and FT air from PSEA points to scavenging during lofting into the FT: the FT size distribution of PSEA air showed a sharp drop in particle number concentrations above 50 nm, resembling background WP air (Fig. 7d), while the BL size distribution of PSEA air had an additional peak at 200 nm. The 30 nm peaks from PSEA and WP may originate from NPF events (Williamson et al., 2019), associated with high APT in marine environments (Ueda et al., 2016).
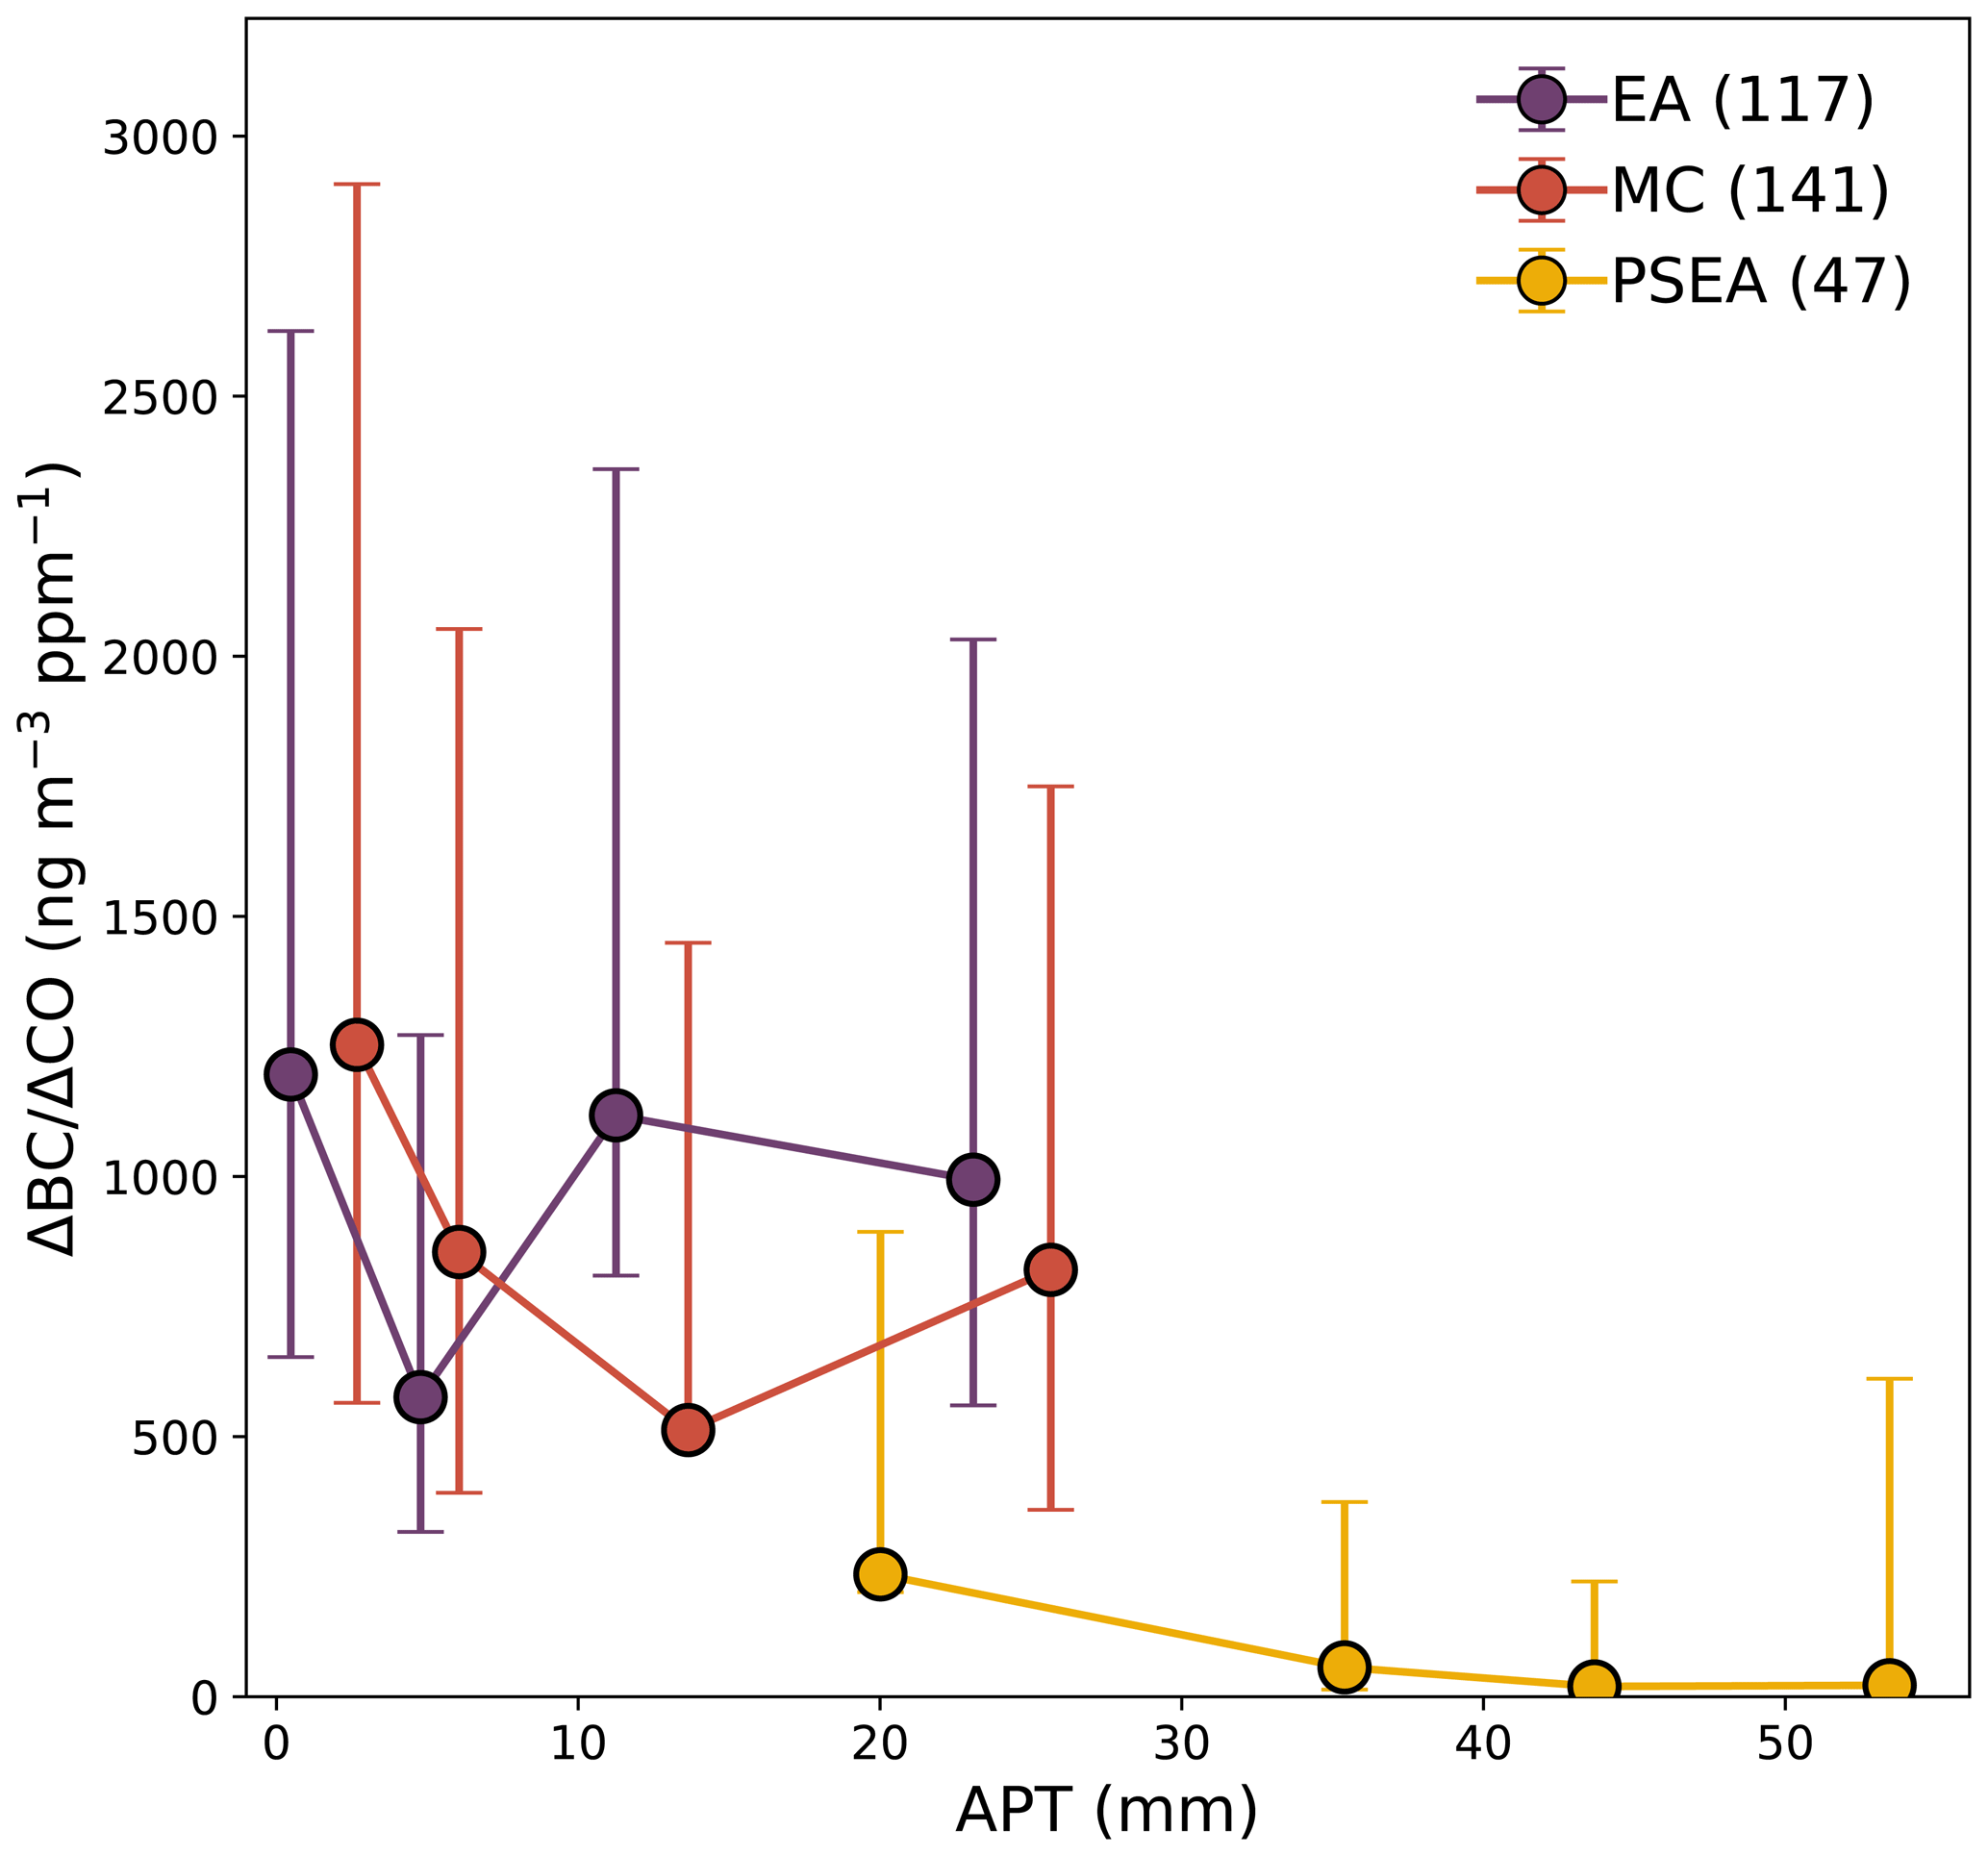
Figure 9 ratio (ΔCO > 0.02 ppm) as a function of accumulated precipitation along individual trajectories (APT) resolved by source region. APT was calculated with PERSIANN-CDR. Medians and 25th/75th percentiles (error bars) are shown for each source region: peninsular Southeast Asia (PSEA), the Maritime Continent (MC), and East Asia (EA). The West Pacific (WP) was not plotted because of few data points where ΔCO > 0.02 ppm. The number of observations plotted per source region is provided in parentheses.
3.5 Influence of convection on transported air masses
The relationship between composition and convection was further investigated through scatterplots of the ratio, an indicator of physical removal processes (Moteki et al., 2012), as a function of APT, an indicator of convection. For simplicity, APT in Fig. 9 is derived solely from PERSIANN-CDR, as Table 2 shows no significant qualitative difference between SPPs. The decrease in ratio with higher APT (Fig. 9) indicates that convection during transport indeed contributes to scavenging in the TNWP, though we note that source emission ratios also play an important role in the ratio. Both EA and MC air showed very high ratios compared to PSEA, suggestive of more efficient transport and higher source emission ratios. Lower APT along EA and MC pathways (Table 2) likely allowed for a clear transport signal as shown by the high concentrations of anthropogenic or burning species in these air masses (Sect. 3.3). In contrast to MC and EA air, air from PSEA was characterized by a lower ratio, particularly at higher APT, pointing to particle scavenging over convective areas (e.g,. SCS). Higher at lower APT suggests that the higher BL concentrations of anthropogenic species in MC and EA air were likely enabled by lower levels of wet removal. Deviations from this trend indicate that Fig. 9, though useful in showing wet deposition, is unable to capture scavenging unrelated to precipitation, such as in-cloud scavenging (Sect. 3.4).
Utilizing airborne CAMP2Ex measurements between 24 August and 5 October 2019 and HYSPLIT back trajectories, we examined transport patterns into TNWP from key source regions (PSEA, MC, EA, WP). Key conclusions from this study include the following points.
-
Meteorological phenomena driving transport as well as the origins of transported air masses shifted significantly with the monsoon phase. During the SWM, MC and PSEA transport was associated with monsoon-driven southwesterly winds and cyclonic activity over the northern SCS. Wind shear was associated with predominantly BL (FT) sampling of MC (PSEA) air, implying distinct aerosol processing between these two source regions. In comparison, transport during the MT period from EA and WP was driven by northeasterly winds from the Pacific, anticyclones over the Asian continent, and well-developed cyclones passing through the East China Sea. These transport differences led to varying degrees of convection experienced by transported air masses. PSEA air generally passed through convective regions (SCS, west of Luzon, and over the PSEA itself) and was lofted into the FT, which led to the scavenging of aerosols. In contrast, air masses from the MC and EA underwent relatively little convection, indicated by low APT, and mainly were confined to the BL, enabling the transport of anthropogenic emissions.
-
Characteristics of transported air masses differed primarily by emission source and passage through convective regions. Due to low APT and high , transported air from MC and EA exhibited characteristic emissions: MC air from biomass burning (CO, well-correlated CO and CH4, , OA) and EA air from anthropogenic outflow and secondary formation (O3, CH4, , ). Key species ratios corroborated distinct sources between MC and EA air. Aerosol size distributions in EA air suggested multiple primary sources (industry, residential emissions, rice cultivation) as well as secondary formation, indicated by its relatively broad peak; in contrast, the narrower peak in the size distribution of MC air pointed to the predominance of biomass burning emissions.
-
Air from the PSEA showed strong evidence of particle scavenging: passage over high-precipitation areas, convective lofting, high APT, low , relatively low levels of anthropogenic species, and a size distribution shifted towards smaller particle sizes. Aerosol concentrations of PSEA air in the FT were lower by at least 1 order of magnitude than those in the BL, a difference that was not observed for trace gases, which pointed to the scavenging of aerosol particles in the FT. Furthermore, PSEA air in the FT lacked the larger peak (Dp = 200 nm) observed in BL air and instead peaked at much smaller sizes (Dp = 30 nm), suggesting large particle removal during convective lofting. The fine-mode peak (Dp = 30 nm) for PSEA FT air also resembled that of WP air, suggestive of new particle formation during transport from the PSEA, perhaps occurring over the convective SCS.
-
A possible wet scavenging mechanism for MC FT air was inferred from and ratios between BL and FT and corroborated by size distributions, which showed significant BL and FT differences for larger particles (>50 nm). The disagreement with APT was attributed to SPP limitations in capturing scavenging effects aloft, hinting that the scavenging mechanism acts at higher layers and may not be linked to surface precipitation. However, we emphasize that the exact scavenging mechanism is for now speculative and warrants its own investigation in the future.
Recommendations for future work include (1) investigating the hypothesized scavenging mechanism of MC air aloft using vertically resolved moisture and convection retrievals; (2) examining deep convection periods to further evaluate wet scavenging effects on transported air; (3) characterizing aerosol hygroscopicity as a function of air mass source region and transport processes; and (4) comparing different sampling areas over the Philippines as impacted by transported air masses.
The CAMP2Ex dataset can be found at https://doi.org/10.5067/Suborbital/CAMP2EX2018/DATA001; NASA, 2020a). HYSPLIT data are accessible through the NOAA READY website (http://www.ready.noaa.gov, last access: 13 July 2020) (NOAA Air Resources Laboratory, 2020). Global elevation data from GMTED2010 are available at http://temis.nl/data/gmted2010/ (last access: 12 March 2020) (USGS and NGA, 2020). Population density data are provided by the Center for International Earth Science Information Network, available at https://sedac.ciesin.columbia.edu/data/set/gpw-v4-population-density-rev11/data-download (last access: 3 July 2020) (CIESIN, 2020). MODIS active fire data can be downloaded through the Fire Information for Resource Management System (https://firms.modaps.eosdis.nasa.gov/, last access: 29 June 2020) (NASA, 2020b). OMI data were retrieved from the NASA GES DISC website (https://doi.org/10.5067/Aura/OMI/DATA3008) (Li et al., 2020). NCEP/NCAR Reanalysis data were provided by the NOAA/OAR/ESRL PSD, Boulder, Colorado, USA, from their website (https://www.esrl.noaa.gov/psd/, last access: 13 June 2020) (NOAA Physical Sciences Laboratory, 2020).
The supplement related to this article is available online at: https://doi.org/10.5194/acp-21-3777-2021-supplement.
MRAH performed the analysis and prepared the paper. EC, MS, LZ, JPDG, GSD, EW, CER, JW, JZ, YW, SY, JF, SLA, and AS collected and prepared the data. EC, MS, JSR, MOLC, JBBS, LZ, JPDG, GSD, PN, FJT, EW, JW, JZ, YW, AB, and AS provided input and feedback on the paper.
The authors declare that they have no conflict of interest.
This article is part of the special issue “Cloud Aerosol and Monsoon Processes Philippines Experiment (CAMP2Ex) (ACP/AMT inter-journal SI)”. It is not associated with a conference.
This research was funded by NASA grant 80NSSC18K0148 in support of CAMP2Ex. The research by FJT was carried out at the Jet Propulsion Laboratory, California Institute of Technology, under a contract with NASA.
This research has been supported by the National Aeronautics and Space Administration (grant no. 80NSSC18K0148).
This paper was edited by Roya Bahreini and reviewed by two anonymous referees.
Akasaka, I., Morishima, W., and Mikami, T.: Seasonal march and its spatial difference of rainfall in the Philippines, Int. J. Climatol., 27, 715–725, https://doi.org/10.1002/joc.1428, 2007.
Akimoto, H.: Global Air Quality and Pollution, Science, 302, 1716–1719, https://doi.org/10.1126/science.1092666, 2003.
Andreae, M. O.: Emission of trace gases and aerosols from biomass burning – an updated assessment, Atmos. Chem. Phys., 19, 8523–8546, https://doi.org/10.5194/acp-19-8523-2019, 2019.
Ashouri, H., Hsu, K.-L., Sorooshian, S., Braithwaite, D. K., Knapp, K. R., Cecil, L. D., Nelson, B. R., and Prat, O. P.: PERSIANN-CDR: Daily Precipitation Climate Data Record from Multisatellite Observations for Hydrological and Climate Studies, B. Am. Meteorol. Soc., 96, 69–83, https://doi.org/10.1175/BAMS-D-13-00068.1, 2015.
Atwood, S. A., Reid, J. S., Kreidenweis, S. M., Cliff, S. S., Zhao, Y., Lin, N.-H., Tsay, S.-C., Chu, Y.-C., and Westphal, D. L.: Size resolved measurements of springtime aerosol particles over the northern South China Sea, Atmos. Environ., 78, 134–143, https://doi.org/10.1016/j.atmosenv.2012.11.024, 2013.
Atwood, S. A., Reid, J. S., Kreidenweis, S. M., Blake, D. R., Jonsson, H. H., Lagrosas, N. D., Xian, P., Reid, E. A., Sessions, W. R., and Simpas, J. B.: Size-resolved aerosol and cloud condensation nuclei (CCN) properties in the remote marine South China Sea – Part 1: Observations and source classification, Atmos. Chem. Phys., 17, 1105–1123, https://doi.org/10.5194/acp-17-1105-2017, 2017.
Bagtasa, G.: Contribution of Tropical Cyclones to Rainfall in the Philippines, J. Climate, 30, 3621–3633, https://doi.org/10.1175/JCLI-D-16-0150.1, 2017.
Bagtasa, G., Cayetano, M. G., and Yuan, C.-S.: Seasonal variation and chemical characterization of PM2.5 in northwestern Philippines, Atmos. Chem. Phys., 18, 4965–4980, https://doi.org/10.5194/acp-18-4965-2018, 2018.
Bagtasa, G., Cayetano, M. G., Yuan, C.-S., Uchino, O., Sakai, T., Izumi, T., Morino, I., Nagai, T., Macatangay, R. C., and Velazco, V. A.: Long-range transport of aerosols from East and Southeast Asia to northern Philippines and its direct radiative forcing effect, Atmos. Environ., 218, 117007, https://doi.org/10.1016/j.atmosenv.2019.117007, 2019.
Balkanski, Y. J., Jacob, D. J., Gardner, G. M., Graustein, W. C., and Turekian, K. K.: Transport and residence times of tropospheric aerosols inferred from a global three-dimensional simulation of 210Pb, J. Geophys. Res., 98, 20573, https://doi.org/10.1029/93JD02456, 1993.
Bhardwaj, P., Naja, M., Kumar, R., and Chandola, H. C.: Seasonal, interannual, and long-term variabilities in biomass burning activity over South Asia, Environ. Sci. Pollut. R., 23, 4397–4410, https://doi.org/10.1007/s11356-015-5629-6, 2016.
Bond, T. C., Streets, D. G., Yarber, K. F., Nelson, S. M., Woo, J.-H., and Klimont, Z.: A technology-based global inventory of black and organic carbon emissions from combustion, J. Geophys. Res., 109, D14203, https://doi.org/10.1029/2003JD003697, 2004.
Braun, R. A., Aghdam, M. A., Bañaga, P. A., Betito, G., Cambaliza, M. O., Cruz, M. T., Lorenzo, G. R., MacDonald, A. B., Simpas, J. B., Stahl, C., and Sorooshian, A.: Long-range aerosol transport and impacts on size-resolved aerosol composition in Metro Manila, Philippines, Atmos. Chem. Phys., 20, 2387–2405, https://doi.org/10.5194/acp-20-2387-2020, 2020.
Canagaratna, M. R., Jayne, J. T., Jimenez, J. L., Allan, J. D., Alfarra, M. R., Zhang, Q., Onasch, T. B., Drewnick, F., Coe, H., Middlebrook, A., Delia, A., Williams, L. R., Trimborn, A. M., Northway, M. J., DeCarlo, P. F., Kolb, C. E., Davidovits, P., and Worsnop, D. R.: Chemical and microphysical characterization of ambient aerosols with the aerodyne aerosol mass spectrometer, Mass Spectrom. Rev., 26, 185–222, https://doi.org/10.1002/mas.20115, 2007.
Cappa, C. D., Lim, C. Y., Hagan, D. H., Coggon, M., Koss, A., Sekimoto, K., de Gouw, J., Onasch, T. B., Warneke, C., and Kroll, J. H.: Biomass-burning-derived particles from a wide variety of fuels – Part 2: Effects of photochemical aging on particle optical and chemical properties, Atmos. Chem. Phys., 20, 8511–8532, https://doi.org/10.5194/acp-20-8511-2020, 2020.
Center for International Earth Science Information Network: Gridded Population of the World, Version 4 (GPWv4): Population Density, Revision 11, Palisades, NY, https://doi.org/10.7927/H49C6VHW, 2018.
Chang, C.-P., Wang, Z., McBride, J., and Liu, C.-H.: Annual Cycle of Southeast Asia – Maritime Continent Rainfall and the Asymmetric Monsoon Transition, J. Climate, 18, 287–301, https://doi.org/10.1175/JCLI-3257.1, 2005.
Chen, S., Liu, B., Tan, X., and Wu, Y.: Inter-comparison of spatiotemporal features of precipitation extremes within six daily precipitation products, Clim. Dyn., 54, 1057–1076, https://doi.org/10.1007/s00382-019-05045-z, 2020.
Chen, T.-C., Tsay, J.-D., and Matsumoto, J.: Interannual Variation of the Summer Rainfall Center in the South China Sea, J. Climate, 30, 7909–7931, https://doi.org/10.1175/JCLI-D-16-0889.1, 2017.
Chen, Y., Cai, J., Wang, Z., Peng, C., Yao, X., Tian, M., Han, Y., Shi, G., Shi, Z., Liu, Y., Yang, X., Zheng, M., Zhu, T., He, K., Zhang, Q., and Yang, F.: Simultaneous measurements of urban and rural particles in Beijing – Part 1: Chemical composition and mixing state, Atmos. Chem. Phys., 20, 9231–9247, https://doi.org/10.5194/acp-20-9231-2020, 2020.
Cheng, F.-Y., Yang, Z.-M., Ou-Yang, C.-F., and Ngan, F.: A numerical study of the dependence of long-range transport of CO to a mountain station in Taiwan on synoptic weather patterns during the Southeast Asia biomass-burning season, Atmos. Environ., 78, 277–290, https://doi.org/10.1016/j.atmosenv.2013.03.020, 2013.
Cheung, H. C., Chou, C. C.-K., Lee, C. S. L., Kuo, W.-C., and Chang, S.-C.: Hygroscopic properties and cloud condensation nuclei activity of atmospheric aerosols under the influences of Asian continental outflow and new particle formation at a coastal site in eastern Asia, Atmos. Chem. Phys., 20, 5911–5922, https://doi.org/10.5194/acp-20-5911-2020, 2020.
Chien, F.-C., Hong, J.-S., and Kuo, Y.-H.: The Marine Boundary Layer Height over the Western North Pacific Based on GPS Radio Occultation, Island Soundings, and Numerical Models, Sensors, 19, 155, https://doi.org/10.3390/s19010155, 2019.
Choi, Y., Kim, D., Cho, S., and Kim, T.-W.: Southeastern Yellow Sea as a sink for atmospheric carbon dioxide, Mar. Pollut. Bull., 149, 110550, https://doi.org/10.1016/j.marpolbul.2019.110550, 2019.
Chuang, M.-T., Lee, C.-T., Chou, C. C.-K., Lin, N.-H., Sheu, G.-R., Wang, J.-L., Chang, S.-C., Wang, S.-H., Chi, K. H., Young, C.-Y., Huang, H., Chen, H.-W., Weng, G.-H., Lai, S.-Y., Hsu, S.-P., Chang, Y.-J., Chang, J.-H., and Wu, X.-C.: Carbonaceous aerosols in the air masses transported from Indochina to Taiwan: Long-term observation at Mt. Lulin, Atmos. Environ., 89, 507–516, https://doi.org/10.1016/j.atmosenv.2013.11.066, 2014.
CIESIN – Center for International Earth Science Information Network, Columbia University: Gridded Population of the World, Version 4 (GPWv4): Population Density, Revision 11, NASA Socioeconomic Data and Applications Center (SEDAC), Palisades, NY, https://doi.org/10.7927/H49C6VHW, 2018.
Conte, L., Szopa, S., Séférian, R., and Bopp, L.: The oceanic cycle of carbon monoxide and its emissions to the atmosphere, Biogeosciences, 16, 881–902, https://doi.org/10.5194/bg-16-881-2019, 2019.
Cruz, F. T., Narisma, G. T., Villafuerte, M. Q., Cheng Chua, K. U., and Olaguera, L. M.: A climatological analysis of the southwest monsoon rainfall in the Philippines, Atmos. Res., 122, 609–616, https://doi.org/10.1016/j.atmosres.2012.06.010, 2013.
Dahutia, P., Pathak, B., and Bhuyan, P. K.: Vertical distribution of aerosols and clouds over north-eastern South Asia: Aerosol–cloud interactions, Atmos. Environ., 215, 116882, https://doi.org/10.1016/j.atmosenv.2019.116882, 2019.
Danielson, J. J. and Gesch, D. B.: Global Multi-resolution Terrain Elevation Data 2010 (GMTED2010): US Geological Survey Open-File Report 2011-1073, USGS, 34, 2011.
Davis, D. D., Crawford, J., Chen, G., Chameides, W., Liu, S., Bradshaw, J., Sandholm, S., Sachse, G., Gregory, G., Anderson, B., Barrick, J., Bachmeier, A., Collins, J., Browell, E., Blake, D., Rowland, S., Kondo, Y., Singh, H., Talbot, R., Heikes, B., Merrill, J., Rodriguez, J., and Newell, R. E.: Assessment of ozone photochemistry in the western North Pacific as inferred from PEM-West A observations during the fall 1991, J. Geophys. Res.-Atmos., 101, 2111–2134, https://doi.org/10.1029/95JD02755, 1996.
DeCarlo, P. F., Kimmel, J. R., Trimborn, A., Northway, M. J., Jayne, J. T., Aiken, A. C., Gonin, M., Fuhrer, K., Horvath, T., Docherty, K. S., Worsnop, D. R., and Jimenez, J. L.: Field-deployable, high-resolution, time-of-flight aerosol mass spectrometer, Anal. Chem., 78, 8281–8289, https://doi.org/10.1021/ac061249n, 2006.
Di Girolamo, L., Reid, J. S., Holz, R., Tanelli, S., van den Heever, S. C., Narisma, G. T. T., and Simpas, J. B. B.: Cloud and Aerosol Monsoonal Processes-Philippines Experiment (CAMP2Ex), avialable at: https://espo.nasa.gov/CAMP2Ex_White_Paper (last access: 31 July 2019), 2018.
Dong, Z., Li, Z., Yu, X., Cribb, M., Li, X., and Dai, J.: Opposite long-term trends in aerosols between low and high altitudes: a testimony to the aerosol–PBL feedback, Atmos. Chem. Phys., 17, 7997–8009, https://doi.org/10.5194/acp-17-7997-2017, 2017.
Engling, G., He, J., Betha, R., and Balasubramanian, R.: Assessing the regional impact of indonesian biomass burning emissions based on organic molecular tracers and chemical mass balance modeling, Atmos. Chem. Phys., 14, 8043–8054, https://doi.org/10.5194/acp-14-8043-2014, 2014.
Ervens, B.: Modeling the Processing of Aerosol and Trace Gases in Clouds and Fogs, Chem. Rev., 115, 4157–4198, https://doi.org/10.1021/cr5005887, 2015.
Fioletov, V. E., McLinden, C. A., Krotkov, N., Li, C., Joiner, J., Theys, N., Carn, S., and Moran, M. D.: A global catalogue of large SO2 sources and emissions derived from the Ozone Monitoring Instrument, Atmos. Chem. Phys., 16, 11497–11519, https://doi.org/10.5194/acp-16-11497-2016, 2016.
Freitag, S., Clarke, A. D., Howell, S. G., Kapustin, V. N., Campos, T., Brekhovskikh, V. L., and Zhou, J.: Combining airborne gas and aerosol measurements with HYSPLIT: a visualization tool for simultaneous evaluation of air mass history and back trajectory consistency, Atmos. Meas. Tech., 7, 107–128, https://doi.org/10.5194/amt-7-107-2014, 2014.
Fujii, Y., Tohno, S., Amil, N., Latif, M. T., Oda, M., Matsumoto, J., and Mizohata, A.: Annual variations of carbonaceous PM2.5 in Malaysia: influence by Indonesian peatland fires, Atmos. Chem. Phys., 15, 13319–13329, https://doi.org/10.5194/acp-15-13319-2015, 2015.
Ge, C., Wang, J., and Reid, J. S.: Mesoscale modeling of smoke transport over the Southeast Asian Maritime Continent: coupling of smoke direct radiative effect below and above the low-level clouds, Atmos. Chem. Phys., 14, 159–174, https://doi.org/10.5194/acp-14-159-2014, 2014.
Geng, X., Zhong, G., Li, J., Cheng, Z., Mo, Y., Mao, S., Su, T., Jiang, H., Ni, K., and Zhang, G.: Molecular marker study of aerosols in the northern South China Sea: Impact of atmospheric outflow from the Indo-China Peninsula and South China, Atmos. Environ., 206, 225–236, https://doi.org/10.1016/j.atmosenv.2019.02.033, 2019.
Gorkowski, K., Donahue, N. M., and Sullivan, R. C.: Aerosol Optical Tweezers Constrain the Morphology Evolution of Liquid-Liquid Phase-Separated Atmospheric Particles, Chem, 6, 204–220, https://doi.org/10.1016/j.chempr.2019.10.018, 2020.
Govender, P. and Sivakumar, V.: Application of k-means and hierarchical clustering techniques for analysis of air pollution: A review (1980–2019), Atmos. Pollut. Res., 11, 40–56, https://doi.org/10.1016/j.apr.2019.09.009, 2020.
Gras, J. L., Jensen, J. B., Okada, K., Ikegami, M., Zaizen, Y., and Makino, Y.: Some optical properties of smoke aerosol in Indonesia and tropical Australia, Geophys. Res. Lett., 26, 1393–1396, https://doi.org/10.1029/1999GL900275, 1999.
Gruber, N., Clement, D., Carter, B. R., Feely, R. A., van Heuven, S., Hoppema, M., Ishii, M., Key, R. M., Kozyr, A., Lauvset, S. K., Lo Monaco, C., Mathis, J. T., Murata, A., Olsen, A., Perez, F. F., Sabine, C. L., Tanhua, T., and Wanninkhof, R.: The oceanic sink for anthropogenic CO2 from 1994 to 2007, Science, 363, 1193–1199, https://doi.org/10.1126/science.aau5153, 2019.
Guttikunda, S. K., Thongboonchoo, N., Calori, G., Carmichael, G. R., and Streets, D. G.: Sulfur Deposition in Asia: Seasonal Behavior and Contributions from Various Energy Sectors, Water Air Soil Poll., 131, 383–406, https://doi.org/10.1023/A:1011912902825, 2001.
Gysel, M., Laborde, M., Olfert, J. S., Subramanian, R., and Gröhn, A. J.: Effective density of Aquadag and fullerene soot black carbon reference materials used for SP2 calibration, Atmos. Meas. Tech., 4, 2851–2858, https://doi.org/10.5194/amt-4-2851-2011, 2011.
Halliday, H. S., DiGangi, J. P., Choi, Y., Diskin, G. S., Pusede, S. E., Rana, M., Nowak, J. B., Knote, C., Ren, X., He, H., Dickerson, R. R., and Li, Z.: Using Short-Term Ratios to Assess Air Mass Differences Over the Korean Peninsula During KORUS-AQ, J. Geophys. Res.-Atmos., 124, 10951–10972, https://doi.org/10.1029/2018JD029697, 2019.
Hamid, E. Y., Kawasaki, Z.-I., and Mardiana, R.: Impact of the 1997–98 El Niño Event on lightning activity over Indonesia, Geophys. Res. Lett., 28, 147–150, https://doi.org/10.1029/2000GL011374, 2001.
Hansen, J.: Efficacy of climate forcings, J. Geophys. Res., 110, D18104, https://doi.org/10.1029/2005JD005776, 2005.
Harris, J. M., Draxler, R. R., and Oltmans, S. J.: Trajectory model sensitivity to differences in input data and vertical transport method: Trajectory Model Sensitivity, J. Geophys. Res.-Atmos., 110, D14109, https://doi.org/10.1029/2004JD005750, 2005.
Hartigan, J. A. and Wong, M. A.: Algorithm AS 136: A K-Means Clustering Algorithm, J. R. Stat. Soc. C, 28, 100–108, https://doi.org/10.2307/2346830, 1979.
Hatakeyama, S., Murano, K., Sakamaki, F., Mukai, H., Bandow, H., and Komazaki, Y.: Transport of Atmospheric Pollutants from East Asia, Water Air Soil Poll., 130, 373–378, https://doi.org/10.1023/A:1013877000169, 2001.
Hatakeyama, S., Takami, A., Sakamaki, F., Mukai, H., Sugimoto, N., Shimizu, A., and Bandow, H.: Aerial measurement of air pollutants and aerosols during 20–22 March 2001 over the East China Sea, J. Geophys. Res.-Atmos., 109, D13304, https://doi.org/10.1029/2003JD004271, 2004.
Hatakeyama, S., Hanaoka, S., Ikeda, K., Watanabe, I., Arakaki, T., Sadanaga, Y., Bandow, H., Kato, S., Kajii, Y., Sato, K., Shimizu, A., and Takami, A.: Aerial Observation of Aerosols Transported from East Asia – Chemical Composition of Aerosols and Layered Structure of an Air Mass over the East China Sea, Aerosol Air Qual. Res., 11, 497–507, https://doi.org/10.4209/aaqr.2011.06.0076, 2011.
He, L., Zeng, Z., Pongetti, T. J., Wong, C., Liang, J., Gurney, K. R., Newman, S., Yadav, V., Verhulst, K., Miller, C. E., Duren, R., Frankenberg, C., Wennberg, P. O., Shia, R., Yung, Y. L., and Sander, S. P.: Atmospheric Methane Emissions Correlate With Natural Gas Consumption From Residential and Commercial Sectors in Los Angeles, Geophys. Res. Lett., 46, 8563–8571, https://doi.org/10.1029/2019GL083400, 2019.
Heald, C. L., Ridley, D. A., Kroll, J. H., Barrett, S. R. H., Cady-Pereira, K. E., Alvarado, M. J., and Holmes, C. D.: Contrasting the direct radiative effect and direct radiative forcing of aerosols, Atmos. Chem. Phys., 14, 5513–5527, https://doi.org/10.5194/acp-14-5513-2014, 2014.
Hecobian, A., Liu, Z., Hennigan, C. J., Huey, L. G., Jimenez, J. L., Cubison, M. J., Vay, S., Diskin, G. S., Sachse, G. W., Wisthaler, A., Mikoviny, T., Weinheimer, A. J., Liao, J., Knapp, D. J., Wennberg, P. O., Kürten, A., Crounse, J. D., St. Clair, J., Wang, Y., and Weber, R. J.: Comparison of chemical characteristics of 495 biomass burning plumes intercepted by the NASA DC-8 aircraft during the ARCTAS/CARB-2008 field campaign, Atmos. Chem. Phys., 11, 13325–13337, https://doi.org/10.5194/acp-11-13325-2011, 2011.
Hewitt, C. N., Lee, J. D., MacKenzie, A. R., Barkley, M. P., Carslaw, N., Carver, G. D., Chappell, N. A., Coe, H., Collier, C., Commane, R., Davies, F., Davison, B., DiCarlo, P., Di Marco, C. F., Dorsey, J. R., Edwards, P. M., Evans, M. J., Fowler, D., Furneaux, K. L., Gallagher, M., Guenther, A., Heard, D. E., Helfter, C., Hopkins, J., Ingham, T., Irwin, M., Jones, C., Karunaharan, A., Langford, B., Lewis, A. C., Lim, S. F., MacDonald, S. M., Mahajan, A. S., Malpass, S., McFiggans, G., Mills, G., Misztal, P., Moller, S., Monks, P. S., Nemitz, E., Nicolas-Perea, V., Oetjen, H., Oram, D. E., Palmer, P. I., Phillips, G. J., Pike, R., Plane, J. M. C., Pugh, T., Pyle, J. A., Reeves, C. E., Robinson, N. H., Stewart, D., Stone, D., Whalley, L. K., and Yin, X.: Overview: oxidant and particle photochemical processes above a south-east Asian tropical rainforest (the OP3 project): introduction, rationale, location characteristics and tools, Atmos. Chem. Phys., 10, 169–199, https://doi.org/10.5194/acp-10-169-2010, 2010.
Hilario, M. R. A., Cruz, M. T., Cambaliza, M. O. L., Reid, J. S., Xian, P., Simpas, J. B., Lagrosas, N. D., Uy, S. N. Y., Cliff, S., and Zhao, Y.: Investigating size-segregated sources of elemental composition of particulate matter in the South China Sea during the 2011 Vasco cruise, Atmos. Chem. Phys., 20, 1255–1276, https://doi.org/10.5194/acp-20-1255-2020, 2020a.
Hilario, M. R. A., Cruz, M. T., Bañaga, P. A., Betito, G., Braun, R. A., Stahl, C., Cambaliza, M. O., Lorenzo, G. R., MacDonald, A. B., AzadiAghdam, M., Pabroa, P. C., Yee, J. R., Simpas, J. B., and Sorooshian, A.: Characterizing weekly cycles of particulate matter in a coastal megacity: The importance of a seasonal, size-resolved, and chemically-speciated analysis, J. Geophys. Res.-Atmos., https://doi.org/10.1029/2020JD032614, in press, 2020b.
Hilario, M. R. A., Olaguera, L. M., Narisma, G. T., and Matsumoto, J.: Diurnal Characteristics of Summer Precipitation Over Luzon Island, Philippines, Asia-Pacific J. Atmos. Sci., https://doi.org/10.1007/s13143-020-00214-1, 2020c.
Hoell, J. M., Davis, D. D., Liu, S. C., Newell, R., Shipham, M., Akimoto, H., McNeal, R. J., Bendura, R. J., and Drewry, J. W.: Pacific Exploratory Mission-West A (PEM-West A): September–October 1991, J. Geophys. Res.-Atmos., 101, 1641–1653, https://doi.org/10.1029/95JD00622, 1996.
Hoell, J. M., Davis, D. D., Liu, S. C., Newell, R. E., Akimoto, H., McNeal, R. J., and Bendura, R. J.: The Pacific Exploratory Mission-West Phase B: February-March, 1994, J. Geophys. Res.-Atmos., 102, 28223–28239, https://doi.org/10.1029/97JD02581, 1997.
Hong, Y., Hsu, K.-L., Sorooshian, S., and Gao, X.: Precipitation Estimation from Remotely Sensed Imagery Using an Artificial Neural Network Cloud Classification System, J. Appl. Meteorol., 43, 1834–1853, https://doi.org/10.1175/JAM2173.1, 2004.
Honomichl, S. B. and Pan, L. L.: Transport from the Asian Summer Monsoon Anticyclone over the Western Pacific, J. Geophys. Res.-Atmos., 125, e2019JD032094, https://doi.org/10.1029/2019JD032094, 2020.
Hou, A. Y., Kakar, R. K., Neeck, S., Azarbarzin, A. A., Kummerow, C. D., Kojima, M., Oki, R., Nakamura, K., and Iguchi, T.: The Global Precipitation Measurement Mission, B. Am. Meteorol. Soc., 95, 701–722, https://doi.org/10.1175/BAMS-D-13-00164.1, 2014.
Huang, H.-Y., Wang, S.-H., Huang, W.-X., Lin, N.-H., Chuang, M.-T., da Silva, A. M., and Peng, C.-M.: Influence of Synoptic-Dynamic Meteorology on the Long-Range Transport of Indochina Biomass Burning Aerosols, J. Geophys. Res.-Atmos., 125, e2019JD031260, https://doi.org/10.1029/2019JD031260, 2020.
Huang, L., Lin, W., Li, F., Wang, Y., and Jiang, B.: Climate Impacts of the Biomass Burning in Indochina on Atmospheric Conditions over Southern China, Aerosol Air Qual. Res., 9, 2707–2720, https://doi.org/10.4209/aaqr.2019.01.0028, 2019.
Huffman, G. J., Bolvin, D. T., Nelkin, E. J., Wolff, D. B., Adler, R. F., Gu, G., Hong, Y., Bowman, K. P., and Stocker, E. F.: The TRMM Multisatellite Precipitation Analysis (TMPA): Quasi-Global, Multiyear, Combined-Sensor Precipitation Estimates at Fine Scales, J. Hydrometeorol., 8, 38–55, https://doi.org/10.1175/JHM560.1, 2007.
Huffman, G. J., Bolvin, D. T., Nelkin, E. J., and Tan, J.: NASA Global Precipitation Measurement (GPM) Integrated Multi-satellitE Retrievals for GPM (IMERG), Algorithm Theoretical Basis Document, version 6, available at: https://docserver.gesdisc.eosdis.nasa.gov/public/project/GPM/IMERG_doc.06.pdf (last access: 20 March 2020), 2019.
Hurst, D. F., Griffith, D. W. T., and Cook, G. D.: Trace gas emissions from biomass burning in tropical Australian savannas, J. Geophys. Res., 99, 16441, https://doi.org/10.1029/94JD00670, 1994.
Ikegami, M., Okada, K., Zaizen, Y., Makino, Y., Jensen, J. B., Gras, J. L., and Harjanto, H.: Very high weight ratios of in individual haze particles over Kalimantan during the 1997 Indonesian forest fires, Atmos. Environ., 35, 4237–4243, https://doi.org/10.1016/S1352-2310(01)00247-3, 2001.
IPCC: Climate Change 2014: Synthesis Report, in: Contribution of Working Groups I, II and III to the Fifth Assessment Report of the Intergovernmental Panel on Climate Change, available at: https://www.ipcc.ch/report/ar5/syr/ (last access: 2 January 2020), 2014.
Jacob, D. J., Crawford, J. H., Kleb, M. M., Connors, V. S., Bendura, R. J., Raper, J. L., Sachse, G. W., Gille, J. C., Emmons, L., and Heald, C. L.: Transport and Chemical Evolution over the Pacific (TRACE-P) aircraft mission: Design, execution, and first results, J. Geophys. Res., 108, 9000, https://doi.org/10.1029/2002JD003276, 2003.
Kalnay, E., Kanamitsu, M., Kistler, R., Collins, W., Deaven, D., Gandin, L., Iredell, M., Saha, S., White, G., Woollen, J., Zhu, Y., Leetmaa, A., Reynolds, B., Chelliah, M., Ebisuzaki, W., Higgins, W., Janowiak, J., Mo, K. C., Ropelewski, C., Wang, J., Jenne, R., and Joseph, D.: The NCEP/NCAR 40-Year Reanalysis Project, B. Am. Meteorol. Soc., 77, 437–472, https://doi.org/10.1175/1520-0477(1996)077<0437:TNYRP>2.0.CO;2, 1996.
Kidd, C., Takayabu, Y. N., Skofronick-Jackson, G. M., Huffman, G. J., Braun, S. A., Kubota, T., and Turk, F. J.: The Global Precipitation Measurement (GPM) Mission, in: Satellite Precipitation Measurement: Volume 1, edited by: Levizzani, V., Kidd, C., Kirschbaum, D. B., Kummerow, C. D., Nakamura, K., and Turk, F. J., Springer International Publishing, Cham, 3–23, https://doi.org/10.1007/978-3-030-24568-9_1, 2020.
Kim, J. H., Yum, S. S., Lee, Y.-G., and Choi, B.-C.: Ship measurements of submicron aerosol size distributions over the Yellow Sea and the East China Sea, Atmos. Res., 93, 700–714, https://doi.org/10.1016/j.atmosres.2009.02.011, 2009.
Kleinman, L. I., Daum, P. H., Lee, Y.-N., Senum, G. I., Springston, S. R., Wang, J., Berkowitz, C., Hubbe, J., Zaveri, R. A., Brechtel, F. J., Jayne, J., Onasch, T. B., and Worsnop, D.: Aircraft observations of aerosol composition and ageing in New England and Mid-Atlantic States during the summer 2002 New England Air Quality Study field campaign, J. Geophys. Res., 112, D09310, https://doi.org/10.1029/2006JD007786, 2007.
Koike, M., Kondo, Y., Kita, K., Takegawa, N., Masui, Y., Miyazaki, Y., Ko, M. W., Weinheimer, A. J., Flocke, F., Weber, R. J., Thornton, D. C., Sachse, G. W., Vay, S. A., Blake, D. R., Streets, D. G., Eisele, F. L., Sandholm, S. T., Singh, H. B., and Talbot, R. W.: Export of anthropogenic reactive nitrogen and sulfur compounds from the East Asia region in spring, J. Geophys. Res., 108, 8789, https://doi.org/10.1029/2002JD003284, 2003.
Kondo, Y., Morino, Y., Takegawa, N., Koike, M., Kita, K., Miyazaki, Y., Sachse, G. W., Vay, S. A., Avery, M. A., Flocke, F., Weinheimer, A. J., Eisele, F. L., Zondlo, M. A., Weber, R. J., Singh, H. B., Crawford, J. H., Blake, D. R., Fuelberg, H. E., Clarke, A. D., Talbot, R. W., Sandholm, S. T., Browell, E. V., Streets, D. G., and Liley, B.: Impacts of biomass burning in Southeast Asia on ozone and reactive nitrogen over the western Pacific in spring, J. Geophys. Res., 109, D15S12, https://doi.org/10.1029/2003JD004203, 2004.
Kondo, Y., Matsui, H., Moteki, N., Sahu, L., Takegawa, N., Kajino, M., Zhao, Y., Cubison, M. J., Jimenez, J. L., Vay, S., Diskin, G. S., Anderson, B., Wisthaler, A., Mikoviny, T., Fuelberg, H. E., Blake, D. R., Huey, G., Weinheimer, A. J., Knapp, D. J., and Brune, W. H.: Emissions of black carbon, organic, and inorganic aerosols from biomass burning in North America and Asia in 2008, J. Geophys. Res., 116, D08204, https://doi.org/10.1029/2010JD015152, 2011.
Kreidenweis, S. M. and Asa-Awuku, A.: Aerosol Hygroscopicity: Particle Water Content and Its Role in Atmospheric Processes, in: Treatise on Geochemistry, Elsevier, 331–361, https://doi.org/10.1016/B978-0-08-095975-7.00418-6, 2014.
Kritz, M. A. and Rancher, J.: Circulation of Na, Cl, and Br in the tropical marine atmosphere, J. Geophys. Res., 85, 1633, https://doi.org/10.1029/JC085iC03p01633, 1980.
Krupa, S. V. and Manning, W. J.: Atmospheric ozone: Formation and effects on vegetation, Environ. Pollut., 50, 101–137, https://doi.org/10.1016/0269-7491(88)90187-X, 1988.
Kummerow, C. D., Randel, D. L., Kulie, M., Wang, N.-Y., Ferraro, R., Joseph Munchak, S., and Petkovic, V.: The Evolution of the Goddard Profiling Algorithm to a Fully Parametric Scheme, J. Atmos. Ocean. Tech., 32, 2265–2280, https://doi.org/10.1175/JTECH-D-15-0039.1, 2015.
Lelieveld, J., Evans, J. S., Fnais, M., Giannadaki, D., and Pozzer, A.: The contribution of outdoor air pollution sources to premature mortality on a global scale, Nature, 525, 367–371, https://doi.org/10.1038/nature15371, 2015.
Levy, R. C., Mattoo, S., Munchak, L. A., Remer, L. A., Sayer, A. M., Patadia, F., and Hsu, N. C.: The Collection 6 MODIS aerosol products over land and ocean, Atmos. Meas. Tech., 6, 2989–3034, https://doi.org/10.5194/amt-6-2989-2013, 2013.
Li, C., Krotkov, N. A., and Leonard, P.: OMI/Aura Sulfur Dioxide (SO2) Total Column L3 1 day Best Pixel in 0.25 degree × 0.25 degree V3, Goddard Earth Sciences Data and Information Services Center (GES DISC), https://doi.org/10.5067/Aura/OMI/DATA3008, 2020.
Lin, C.-Y., Hsu, H.-m., Lee, Y. H., Kuo, C. H., Sheng, Y.-F., and Chu, D. A.: A new transport mechanism of biomass burning from Indochina as identified by modeling studies, Atmos. Chem. Phys., 9, 7901–7911, https://doi.org/10.5194/acp-9-7901-2009, 2009.
Lin, I.-I., Chen, J.-P., Wong, G. T. F., Huang, C.-W., and Lien, C.-C.: Aerosol input to the South China Sea: Results from the MODerate Resolution Imaging Spectro-radiometer, the Quick Scatterometer, and the Measurements of Pollution in the Troposphere Sensor, Deep-Sea Res. Pt. II, 54, 1589–1601, https://doi.org/10.1016/j.dsr2.2007.05.013, 2007.
Liu, Z.: Comparison of Integrated Multisatellite Retrievals for GPM (IMERG) and TRMM Multisatellite Precipitation Analysis (TMPA) Monthly Precipitation Products: Initial Results, J. Hydrometeorol., 17, 777–790, https://doi.org/10.1175/JHM-D-15-0068.1, 2016.
MacDonald, A. B., Dadashazar, H., Chuang, P. Y., Crosbie, E., Wang, H., Wang, Z., Jonsson, H. H., Flagan, R. C., Seinfeld, J. H., and Sorooshian, A.: Characteristic Vertical Profiles of Cloud Water Composition in Marine Stratocumulus Clouds and Relationships With Precipitation, J. Geophys. Res.-Atmos., 123, 3704–3723, https://doi.org/10.1002/2017JD027900, 2018.
Maggioni, V., Meyers, P. C., and Robinson, M. D.: A Review of Merged High-Resolution Satellite Precipitation Product Accuracy during the Tropical Rainfall Measuring Mission (TRMM) Era, J. Hydrometeorol., 17, 1101–1117, https://doi.org/10.1175/JHM-D-15-0190.1, 2016.
Mahmud, M. R., Hashim, M., and Reba, M. N. M.: How effective is the new generation of GPM satellite precipitation in characterizing the rainfall variability over Malaysia?, Asia-Pac. J. Atmos. Sci., 53, 375–384, https://doi.org/10.1007/s13143-017-0042-3, 2017.
Malm, W., Day, D., Kreidenweis, S., Collettjr, J., Carrico, C., Mcmeeking, G., and Lee, T.: Hygroscopic properties of an organic-laden aerosol, Atmos. Environ., 39, 4969–4982, https://doi.org/10.1016/j.atmosenv.2005.05.014, 2005.
Maloney, E. D. and Dickinson, M. J.: The Intraseasonal Oscillation and the Energetics of Summertime Tropical Western North Pacific Synoptic-Scale Disturbances, J. Atmos. Sci., 60, 2153–2168, https://doi.org/10.1175/1520-0469(2003)060<2153:TIOATE>2.0.CO;2, 2003.
Maloney, E. D. and Hartmann, D. L.: The Madden–Julian Oscillation, Barotropic Dynamics, and North Pacific Tropical Cyclone Formation. Part I: Observations, J. Atmos. Sci., 58, 2545–2558, https://doi.org/10.1175/1520-0469(2001)058<2545:TMJOBD>2.0.CO;2, 2001.
Mardi, A. H., Dadashazar, H., MacDonald, A. B., Braun, R. A., Crosbie, E., Xian, P., Thorsen, T. J., Coggon, M. M., Fenn, M. A., Ferrare, R. A., Hair, J. W., Woods, R. K., Jonsson, H. H., Flagan, R. C., Seinfeld, J. H., and Sorooshian, A.: Biomass Burning Plumes in the Vicinity of the California Coast: Airborne Characterization of Physicochemical Properties, Heating Rates, and Spatiotemporal Features, J. Geophys. Res.-Atmos., 123, 13560–13582, https://doi.org/10.1029/2018JD029134, 2018.
Matsui, H., Kondo, Y., Moteki, N., Takegawa, N., Sahu, L. K., Koike, M., Zhao, Y., Fuelberg, H. E., Sessions, W. R., Diskin, G., Anderson, B. E., Blake, D. R., Wisthaler, A., Cubison, M. J., and Jimenez, J. L.: Accumulation-mode aerosol number concentrations in the Arctic during the ARCTAS aircraft campaign: Long-range transport of polluted and clean air from the Asian continent, J. Geophys. Res., 116, D20217, https://doi.org/10.1029/2011JD016189, 2011a.
Matsui, H., Kondo, Y., Moteki, N., Takegawa, N., Sahu, L. K., Zhao, Y., Fuelberg, H. E., Sessions, W. R., Diskin, G., Blake, D. R., Wisthaler, A., and Koike, M.: Seasonal variation of the transport of black carbon aerosol from the Asian continent to the Arctic during the ARCTAS aircraft campaign, J. Geophys. Res., 116, D05202, https://doi.org/10.1029/2010JD015067, 2011b.
Matsui, H., Koike, M., Kondo, Y., Takami, A., Fast, J. D., Kanaya, Y., and Takigawa, M.: Volatility basis-set approach simulation of organic aerosol formation in East Asia: implications for anthropogenic–biogenic interaction and controllable amounts, Atmos. Chem. Phys., 14, 9513–9535, https://doi.org/10.5194/acp-14-9513-2014, 2014.
Matsumoto, J., Olaguera, L. M. P., Nguyen-Le, D., Kubota, H., and Villafuerte, M. Q.: Climatological seasonal changes of wind and rainfall in the Philippines, Int. J. Climatol., 40, joc.6492, https://doi.org/10.1002/joc.6492, 2020.
Matsumoto, K., Nagao, I., Tanaka, H., Miyaji, H., Iida, T., and Ikebe, Y.: Seasonal characteristics of organic and inorganic species and their size distributions in atmospheric aerosols over the northwest pacific ocean, Atmos. Environ., 32, 1931–1946, https://doi.org/10.1016/S1352-2310(97)00499-8, 1998.
Maudlin, L. C., Wang, Z., Jonsson, H. H., and Sorooshian, A.: Impact of wildfires on size-resolved aerosol composition at a coastal California site, Atmos. Environ., 119, 59–68, https://doi.org/10.1016/j.atmosenv.2015.08.039, 2015.
McNaughton, C. S., Clarke, A. D., Howell, S. G., Pinkerton, M., Anderson, B., Thornhill, L., Hudgins, C., Winstead, E., Dibb, J. E., Scheuer, E., and Maring, H.: Results from the DC-8 Inlet Characterization Experiment (DICE): Airborne Versus Surface Sampling of Mineral Dust and Sea Salt Aerosols, Aerosol Sci. Tech., 41, 136–159, https://doi.org/10.1080/02786820601118406, 2007.
Mishra, A. K., Koren, I., and Rudich, Y.: Effect of aerosol vertical distribution on aerosol-radiation interaction: A theoretical prospect, Heliyon, 1, e00036, https://doi.org/10.1016/j.heliyon.2015.e00036, 2015.
Miyazaki, Y.: Synoptic-scale transport of reactive nitrogen over the western Pacific in spring, J. Geophys. Res., 108, 8788, https://doi.org/10.1029/2002JD003248, 2003.
Moteki, N. and Kondo, Y.: Effects of Mixing State on Black Carbon Measurements by Laser-Induced Incandescence, Aerosol Sci. Tech., 41, 398–417, https://doi.org/10.1080/02786820701199728, 2007.
Moteki, N. and Kondo, Y.: Dependence of Laser-Induced Incandescence on Physical Properties of Black Carbon Aerosols: Measurements and Theoretical Interpretation, Aerosol Sci. Tech., 44, 663–675, https://doi.org/10.1080/02786826.2010.484450, 2010.
Moteki, N., Kondo, Y., Oshima, N., Takegawa, N., Koike, M., Kita, K., Matsui, H., and Kajino, M.: Size dependence of wet removal of black carbon aerosols during transport from the boundary layer to the free troposphere, Geophys. Res. Lett., 39, L13802, https://doi.org/10.1029/2012GL052034, 2012.
Murphy, D. M., Cziczo, D. J., Hudson, P. K., Thomson, D. S., Wilson, J. C., Kojima, T., and Buseck, P. R.: Particle Generation and Resuspension in Aircraft Inlets when Flying in Clouds, Aerosol Sci. Tech., 38, 401–409, https://doi.org/10.1080/02786820490443094, 2004.
NASA: Clouds, Aerosol, and Monsoon Processes – Phillipines Experiment, https://doi.org/10.5067/Suborbital/CAMP2EX2018/DATA001, 2020a.
NASA: Fire Information for Resource Management System, available at: https://firms.modaps.eosdis.nasa.gov/map/ (last access: 29 June 2020), 2020b.
Neu, J. L. and Prather, M. J.: Toward a more physical representation of precipitation scavenging in global chemistry models: cloud overlap and ice physics and their impact on tropospheric ozone, Atmos. Chem. Phys., 12, 3289–3310, https://doi.org/10.5194/acp-12-3289-2012, 2012.
Nguyen, L. S. P., Huang, H.-Y., Lei, T. L., Bui, T. T., Wang, S.-H., Chi, K. H., Sheu, G.-R., Lee, C.-T., Ou-Yang, C.-F., and Lin, N.-H.: Characterizing a landmark biomass-burning event and its implication for aging processes during long-range transport, Atmos. Environ., 241, 117766, https://doi.org/10.1016/j.atmosenv.2020.117766, 2020.
Nguyen, P., Ombadi, M., Sorooshian, S., Hsu, K., AghaKouchak, A., Braithwaite, D., Ashouri, H., and Thorstensen, A. R.: The PERSIANN family of global satellite precipitation data: a review and evaluation of products, Hydrol. Earth Syst. Sci., 22, 5801–5816, https://doi.org/10.5194/hess-22-5801-2018, 2018.
Nguyen, P., Shearer, E. J., Tran, H., Ombadi, M., Hayatbini, N., Palacios, T., Huynh, P., Braithwaite, D., Updegraff, G., Hsu, K., Kuligowski, B., Logan, W. S., and Sorooshian, S.: The CHRS Data Portal, an easily accessible public repository for PERSIANN global satellite precipitation data, Scient. Data, 6, 180296, https://doi.org/10.1038/sdata.2018.296, 2019.
NOAA Air Resources Laboratory: Hybrid Single-Particle Lagrangian Integrated Trajectory model, available at: https://www.arl.noaa.gov/hysplit/hysplit/, last access: 13 July 2020.
NOAA Physical Sciences Laboratory: Gridded Climate Datasets: All, available at: https://psl.noaa.gov/data/gridded/index.html, last access: 13 June 2020.
Olson, W. S.: GPM Combined Radar-Radiometer Precipitation Algorithm Theoretical Basis Document (Version 5), available at: https://gpm.nasa.gov/resources/documents/gpm-combined-radar-radiometer-precipitation-algorithm-theoretical-basis (last access: 10 March 2020), 2018.
Oshima, N., Kondo, Y., Moteki, N., Takegawa, N., Koike, M., Kita, K., Matsui, H., Kajino, M., Nakamura, H., Jung, J. S., and Kim, Y. J.: Wet removal of black carbon in Asian outflow: Aerosol Radiative Forcing in East Asia (A-FORCE) aircraft campaign, J. Geophys. Res.-Atmos., 117, D03204, https://doi.org/10.1029/2011JD016552, 2012.
Oshima, N., Koike, M., Kondo, Y., Nakamura, H., Moteki, N., Matsui, H., Takegawa, N., and Kita, K.: Vertical transport mechanisms of black carbon over East Asia in spring during the A-FORCE aircraft campaign, J. Geophys. Res.-Atmos., 118, 13175-13198, https://doi.org/10.1002/2013JD020262, 2013.
Pani, S. K., Ou-Yang, C.-F., Wang, S.-H., Ogren, J. A., Sheridan, P. J., Sheu, G.-R., and Lin, N.-H.: Relationship between long-range transported atmospheric black carbon and carbon monoxide at a high-altitude background station in East Asia, Atmos. Environ., 210, 86–99, https://doi.org/10.1016/j.atmosenv.2019.04.053, 2019.
Park, R. J.: Export efficiency of black carbon aerosol in continental outflow: Global implications, J. Geophys. Res., 110, D11205, https://doi.org/10.1029/2004JD005432, 2005.
Pérez, I. A., Sánchez, M. L., García, M. A., and Pardo, N.: Boundaries of air mass trajectory clustering: key points and applications, Int. J. Environ. Sci. Te., 14, 653–662, https://doi.org/10.1007/s13762-016-1140-y, 2017.
Pósfai, M., Simonics, R., Li, J., Hobbs, P. V., and Buseck, P. R.: Individual aerosol particles from biomass burning in southern Africa: 1. Compositions and size distributions of carbonaceous particles, J. Geophys. Res.-Atmos., 108, D138483, https://doi.org/10.1029/2002JD002291, 2003.
Pullen, J., Gordon, A. L., Flatau, M., Doyle, J. D., Villanoy, C., and Cabrera, O.: Multiscale influences on extreme winter rainfall in the Philippines, J. Geophys. Res.-Atmos., 120, 3292–3309, https://doi.org/10.1002/2014JD022645, 2015.
Radzi bin Abas, M., Oros, D. R., and Simoneit, B. R. T.: Biomass burning as the main source of organic aerosol particulate matter in Malaysia during haze episodes, Chemosphere, 55, 1089–1095, https://doi.org/10.1016/j.chemosphere.2004.02.002, 2004.
Reid, J. S., Hobbs, P. V., Ferek, R. J., Blake, D. R., Martins, J. V., Dunlap, M. R., and Liousse, C.: Physical, chemical, and optical properties of regional hazes dominated by smoke in Brazil, J. Geophys. Res.-Atmos., 103, 32059–32080, https://doi.org/10.1029/98JD00458, 1998.
Reid, J. S., Koppmann, R., Eck, T. F., and Eleuterio, D. P.: A review of biomass burning emissions part II: intensive physical properties of biomass burning particles, Atmos. Chem. Phys., 5, 799–825, https://doi.org/10.5194/acp-5-799-2005, 2005.
Reid, J. S., Xian, P., Hyer, E. J., Flatau, M. K., Ramirez, E. M., Turk, F. J., Sampson, C. R., Zhang, C., Fukada, E. M., and Maloney, E. D.: Multi-scale meteorological conceptual analysis of observed active fire hotspot activity and smoke optical depth in the Maritime Continent, Atmos. Chem. Phys., 12, 2117–2147, https://doi.org/10.5194/acp-12-2117-2012, 2012.
Reid, J. S., Hyer, E. J., Johnson, R. S., Holben, B. N., Yokelson, R. J., Zhang, J., Campbell, J. R., Christopher, S. A., Di Girolamo, L., Giglio, L., Holz, R. E., Kearney, C., Miettinen, J., Reid, E. A., Turk, F. J., Wang, J., Xian, P., Zhao, G., Balasubramanian, R., Chew, B. N., Janjai, S., Lagrosas, N., Lestari, P., Lin, N.-H., Mahmud, M., Nguyen, A. X., Norris, B., Oanh, N. T. K., Oo, M., Salinas, S. V., Welton, E. J., and Liew, S. C.: Observing and understanding the Southeast Asian aerosol system by remote sensing: An initial review and analysis for the Seven Southeast Asian Studies (7SEAS) program, Atmos. Res., 122, 403–468, https://doi.org/10.1016/j.atmosres.2012.06.005, 2013.
Reid, J. S., Lagrosas, N. D., Jonsson, H. H., Reid, E. A., Sessions, W. R., Simpas, J. B., Uy, S. N., Boyd, T. J., Atwood, S. A., Blake, D. R., Campbell, J. R., Cliff, S. S., Holben, B. N., Holz, R. E., Hyer, E. J., Lynch, P., Meinardi, S., Posselt, D. J., Richardson, K. A., Salinas, S. V., Smirnov, A., Wang, Q., Yu, L., and Zhang, J.: Observations of the temporal variability in aerosol properties and their relationships to meteorology in the summer monsoonal South China Sea/East Sea: the scale-dependent role of monsoonal flows, the Madden–Julian Oscillation, tropical cyclones, squall lines and cold pools, Atmos. Chem. Phys., 15, 1745–1768, https://doi.org/10.5194/acp-15-1745-2015, 2015.
Reid, J. S., Lagrosas, N. D., Jonsson, H. H., Reid, E. A., Atwood, S. A., Boyd, T. J., Ghate, V. P., Xian, P., Posselt, D. J., Simpas, J. B., Uy, S. N., Zaiger, K., Blake, D. R., Bucholtz, A., Campbell, J. R., Chew, B. N., Cliff, S. S., Holben, B. N., Holz, R. E., Hyer, E. J., Kreidenweis, S. M., Kuciauskas, A. P., Lolli, S., Oo, M., Perry, K. D., Salinas, S. V., Sessions, W. R., Smirnov, A., Walker, A. L., Wang, Q., Yu, L., Zhang, J., and Zhao, Y.: Aerosol meteorology of Maritime Continent for the 2012 7SEAS southwest monsoon intensive study – Part 2: Philippine receptor observations of fine-scale aerosol behavior, Atmos. Chem. Phys., 16, 14057–14078, https://doi.org/10.5194/acp-16-14057-2016, 2016a.
Reid, J. S., Xian, P., Holben, B. N., Hyer, E. J., Reid, E. A., Salinas, S. V., Zhang, J., Campbell, J. R., Chew, B. N., Holz, R. E., Kuciauskas, A. P., Lagrosas, N., Posselt, D. J., Sampson, C. R., Walker, A. L., Welton, E. J., and Zhang, C.: Aerosol meteorology of the Maritime Continent for the 2012 7SEAS southwest monsoon intensive study – Part 1: regional-scale phenomena, Atmos. Chem. Phys., 16, 14041–14056, https://doi.org/10.5194/acp-16-14041-2016, 2016b.
Robinson, N. H., Newton, H. M., Allan, J. D., Irwin, M., Hamilton, J. F., Flynn, M., Bower, K. N., Williams, P. I., Mills, G., Reeves, C. E., McFiggans, G., and Coe, H.: Source attribution of Bornean air masses by back trajectory analysis during the OP3 project, Atmos. Chem. Phys., 11, 9605–9630, https://doi.org/10.5194/acp-11-9605-2011, 2011.
Robinson, N. H., Allan, J. D., Trembath, J. A., Rosenberg, P. D., Allen, G., and Coe, H.: The lofting of Western Pacific regional aerosol by island thermodynamics as observed around Borneo, Atmos. Chem. Phys., 12, 5963–5983, https://doi.org/10.5194/acp-12-5963-2012, 2012.
Rolph, G., Stein, A., and Stunder, B.: Real-time Environmental Applications and Display sYstem: READY, Environ. Model. Softw., 95, 210–228, https://doi.org/10.1016/j.envsoft.2017.06.025, 2017.
Rosenfeld, D.: TRMM observed first direct evidence of smoke from forest fires inhibiting rainfall, Geophys. Res. Lett., 26, 3105–3108, https://doi.org/10.1029/1999GL006066, 1999.
Ross, A. D., Holz, R. E., Quinn, G., Reid, J. S., Xian, P., Turk, F. J., and Posselt, D. J.: Exploring the first aerosol indirect effect over Southeast Asia using a 10-year collocated MODIS, CALIOP, and model dataset, Atmos. Chem. Phys., 18, 12747–12764, https://doi.org/10.5194/acp-18-12747-2018, 2018.
Santoso, M., Lestiani, D. D., Mukhtar, R., Hamonangan, E., Syafrul, H., Markwitz, A., and Hopke, P. K.: Preliminary study of the sources of ambient air pollution in Serpong, Indonesia, Atmos. Pollut. Res., 2, 190–196, https://doi.org/10.5094/APR.2011.024, 2011.
Sarkar, S., Fan, W. H., Jia, S., Blake, D. R., Reid, J. S., Lestari, P., and Yu, L. E.: A quantitative assessment of distributions and sources of tropospheric halocarbons measured in Singapore, Sci. Total Environ., 619–620, 528–544, https://doi.org/10.1016/j.scitotenv.2017.11.087, 2018.
Saxena, P., Hildemann, L. M., McMurry, P. H., and Seinfeld, J. H.: Organics alter hygroscopic behavior of atmospheric particles, J. Geophys. Res., 100, 18755, https://doi.org/10.1029/95JD01835, 1995.
Shingler, T., Crosbie, E., Ortega, A., Shiraiwa, M., Zuend, A., Beyersdorf, A., Ziemba, L., Anderson, B., Thornhill, L., Perring, A. E., Schwarz, J. P., Campazano-Jost, P., Day, D. A., Jimenez, J. L., Hair, J. W., Mikoviny, T., Wisthaler, A., and Sorooshian, A.: Airborne characterization of subsaturated aerosol hygroscopicity and dry refractive index from the surface to 6.5 km during the SEAC4 RS campaign: DASH-SP Measurements in SEAC4 RS, J. Geophys. Res.-Atmos., 121, 4188–4210, https://doi.org/10.1002/2015JD024498, 2016.
Siems, S. T., Hess, G., Suhre, K., Businger, S., and Draxler, R. R.: The impact of wind shear on observed and simulated trajectories during the ACE-1 Lagrangian experiments, Aust. Meteorol. Mag., 109–120, 2000.
Sievering, H., Van Valin, C. C., Barrett, E. W., and Pueschel, R. F.: Cloud scavenging of aerosol sulfur: Two case studies, Atmos. Environ., 18, 2685–2690, https://doi.org/10.1016/0004-6981(84)90333-0, 1984.
Skofronick-Jackson, G., Kirschbaum, D., Petersen, W., Huffman, G., Kidd, C., Stocker, E., and Kakar, R.: The Global Precipitation Measurement (GPM) mission's scientific achievements and societal contributions: reviewing four years of advanced rain and snow observations, Q. J. Roy. Meteorol. Soc., 144, 27–48, https://doi.org/10.1002/qj.3313, 2018.
Slowik, J. G., Cross, E. S., Han, J.-H., Davidovits, P., Onasch, T. B., Jayne, J. T., Williams, L. R., Canagaratna, M. R., Worsnop, D. R., Chakrabarty, R. K., Moosmüller, H., Arnott, W. P., Schwarz, J. P., Gao, R.-S., Fahey, D. W., Kok, G. L., and Petzold, A.: An Inter-Comparison of Instruments Measuring Black Carbon Content of Soot Particles, Aerosol Sci. Tech., 41, 295–314, https://doi.org/10.1080/02786820701197078, 2007.
Smith, S. J., van Aardenne, J., Klimont, Z., Andres, R. J., Volke, A., and Delgado Arias, S.: Anthropogenic sulfur dioxide emissions: 1850–2005, Atmos. Chem. Phys., 11, 1101–1116, https://doi.org/10.5194/acp-11-1101-2011, 2011.
Sorooshian, A., Varutbangkul, V., Brechtel, F. J., Ervens, B., Feingold, G., Bahreini, R., Murphy, S. M., Holloway, J. S., Atlas, E. L., Buzorius, G., Jonsson, H., Flagan, R. C., and Seinfeld, J. H.: Oxalic acid in clear and cloudy atmospheres: Analysis of data from International Consortium for Atmospheric Research on Transport and Transformation 2004: Oxalic Acid Data Analysis From ICARTT, J. Geophys. Res.-Atmos., 111, D23S45, https://doi.org/10.1029/2005JD006880, 2006.
Sorooshian, A., Lu, M.-L., Brechtel, F. J., Jonsson, H., Feingold, G., Flagan, R. C., and Seinfeld, J. H.: On the Source of Organic Acid Aerosol Layers above Clouds, Environ. Sci. Technol., 41, 4647–4654, https://doi.org/10.1021/es0630442, 2007.
Sorooshian, A., Padró, L. T., Nenes, A., Feingold, G., McComiskey, A., Hersey, S. P., Gates, H., Jonsson, H. H., Miller, S. D., Stephens, G. L., Flagan, R. C., and Seinfeld, J. H.: On the link between ocean biota emissions, aerosol, and maritime clouds: Airborne, ground, and satellite measurements off the coast of California: Ocean Emissions, Aerosol, and Clouds, Global Biogeochem. Cy., 23, GB4007, https://doi.org/10.1029/2009GB003464, 2009.
Sorooshian, A., Anderson, B., Bauer, S. E., Braun, R. A., Cairns, B., Crosbie, E., Dadashazar, H., Diskin, G., Ferrare, R., Flagan, R. C., Hair, J., Hostetler, C., Jonsson, H. H., Kleb, M. M., Liu, H., MacDonald, A. B., McComiskey, A., Moore, R., Painemal, D., Russell, L. M., Seinfeld, J. H., Shook, M., Smith, W. L., Thornhill, K., Tselioudis, G., Wang, H., Zeng, X., Zhang, B., Ziemba, L., and Zuidema, P.: Aerosol–Cloud–Meteorology Interaction Airborne Field Investigations: Using Lessons Learned from the U.S. West Coast in the Design of ACTIVATE off the U.S. East Coast, B. Am. Meteorol. Soc., 100, 1511–1528, https://doi.org/10.1175/BAMS-D-18-0100.1, 2019.
Stein, A. F., Draxler, R. R., Rolph, G. D., Stunder, B. J. B., Cohen, M. D., and Ngan, F.: NOAA's HYSPLIT Atmospheric Transport and Dispersion Modeling System, B. Am. Meteorol. Soc., 96, 2059–2077, https://doi.org/10.1175/BAMS-D-14-00110.1, 2015.
Stohl, A., Eckhardt, S., Forster, C., James, P., Spichtinger, N., and Seibert, P.: A replacement for simple back trajectory calculations in the interpretation of atmospheric trace substance measurements, Atmos. Environ., 36, 4635–4648, https://doi.org/10.1016/S1352-2310(02)00416-8, 2002.
Streets, D. G., Carmichael, G. R., and Arndt, R. L.: Sulfur dioxide emissions and sulfur deposition from international shipping in Asian waters, Atmos. Environ., 31, 1573–1582, https://doi.org/10.1016/S1352-2310(96)00204-X, 1997.
Streets, D. G., Guttikunda, S. K., and Carmichael, G. R.: The growing contribution of sulfur emissions from ships in Asian waters, 1988–1995, Atmos. Environ., 34, 4425–4439, https://doi.org/10.1016/S1352-2310(00)00175-8, 2000.
Svenningsson, B., Rissler, J., Swietlicki, E., Mircea, M., Bilde, M., Facchini, M. C., Decesari, S., Fuzzi, S., Zhou, J., Mønster, J., and Rosenørn, T.: Hygroscopic growth and critical supersaturations for mixed aerosol particles of inorganic and organic compounds of atmospheric relevance, Atmos. Chem. Phys., 6, 1937–1952, https://doi.org/10.5194/acp-6-1937-2006, 2006.
Takahashi, H. G., Fujinami, H., Yasunari, T., and Matsumoto, J.: Diurnal rainfall pattern observed by Tropical Rainfall Measuring Mission Precipitation Radar (TRMM-PR) around the Indochina peninsula, J. Geophys. Res., 115, D07109, https://doi.org/10.1029/2009JD012155, 2010.
Talbot, R. W., Dibb, J. E., Lefer, B. L., Bradshaw, J. D., Sandholm, S. T., Blake, D. R., Blake, N. J., Sachse, G. W., Collins, J. E., Heikes, B. G., Merrill, J. T., Gregory, G. L., Anderson, B. E., Singh, H. B., Thornton, D. C., Bandy, A. R., and Pueschel, R. F.: Chemical characteristics of continental outflow from Asia to the troposphere over the western Pacific Ocean during February-March 1994: Results from PEM-West B, J. Geophys. Res.-Atmos., 102, 28255–28274, https://doi.org/10.1029/96JD02340, 1997.
Tan, M. L. and Santo, H.: Comparison of GPM IMERG, TMPA 3B42 and PERSIANN-CDR satellite precipitation products over Malaysia, Atmos. Res., 202, 63–76, https://doi.org/10.1016/j.atmosres.2017.11.006, 2018.
Tan, S.-C., Shi, G.-Y., and Wang, H.: Long-range transport of spring dust storms in Inner Mongolia and impact on the China seas, Atmos. Environ., 46, 299–308, https://doi.org/10.1016/j.atmosenv.2011.09.058, 2012.
Taubman, B. F., Hains, J. C., Thompson, A. M., Marufu, L. T., Doddridge, B. G., Stehr, J. W., Piety, C. A., and Dickerson, R. R.: Aircraft vertical profiles of trace gas and aerosol pollution over the mid-Atlantic United States: Statistics and meteorological cluster analysis, J. Geophys. Res.-Atmos., 111, D10S07, https://doi.org/10.1029/2005JD006196, 2006.
Theodoritsi, G. N., Posner, L. N., Robinson, A. L., Yarwood, G., Koo, B., Morris, R., Mavko, M., Moore, T., and Pandis, S. N.: Biomass burning organic aerosol from prescribed burning and other activities in the United States, Atmos. Environ., 241, 117753, https://doi.org/10.1016/j.atmosenv.2020.117753, 2020.
Thornton, D. C., Bandy, A. R., Blomquist, B. W., Driedger, A. R., and Wade, T. P.: Sulfur dioxide distribution over the Pacific Ocean 1991-1996, J. Geophys. Res.-Atmos., 104, 5845–5854, https://doi.org/10.1029/1998JD100048, 1999.
Tohjima, Y., Kubo, M., Minejima, C., Mukai, H., Tanimoto, H., Ganshin, A., Maksyutov, S., Katsumata, K., Machida, T., and Kita, K.: Temporal changes in the emissions of CH4 and CO from China estimated from CH4/CO2 and CO/CO2 correlations observed at Hateruma Island, Atmos. Chem. Phys., 14, 1663–1677, https://doi.org/10.5194/acp-14-1663-2014, 2014.
Tufféry, S.: Data Mining and Statistics for Decision Making: Tufféry/Data Mining and Statistics for Decision Making, John Wiley & Sons, Ltd, Chichester, UK, 2011.
Ueda, S., Miura, K., Kawata, R., Furutani, H., Uematsu, M., Omori, Y., and Tanimoto, H.: Number–size distribution of aerosol particles and new particle formation events in tropical and subtropical Pacific Oceans, Atmos. Environ., 142, 324–339, https://doi.org/10.1016/j.atmosenv.2016.07.055, 2016.
Umezawa, T., Goto, D., Aoki, S., Ishijima, K., Patra, P. K., Sugawara, S., Morimoto, S., and Nakazawa, T.: Variations of tropospheric methane over Japan during 1988–2010, Tellus B, 66, 23837, https://doi.org/10.3402/tellusb.v66.23837, 2014.
Uno, I., Ohara, T., and Murano, K.: Simulated Acidic Aerosol Long-Range Transport and Deposition over East Asia – Role of Synoptic Scale Weather Systems, in: Air Pollution Modeling and Its Application XII, Springer, US, https://doi.org/10.1007/978-1-4757-9128-0_20, 1998.
USGS and NGA – US Geological Survey and the US National Geospatial-Intelligence Agency: GMTED2010 global digital elevation model, available at: https://www.temis.nl/data/gmted2010.html, last access: 12 March 2020.
Wang, F., Chen, Y., Meng, X., Fu, J., and Wang, B.: The contribution of anthropogenic sources to the aerosols over East China Sea, Atmos. Environ., 127, 22–33, https://doi.org/10.1016/j.atmosenv.2015.12.002, 2016.
Wang, H., Easter, R. C., Rasch, P. J., Wang, M., Liu, X., Ghan, S. J., Qian, Y., Yoon, J.-H., Ma, P.-L., and Vinoj, V.: Sensitivity of remote aerosol distributions to representation of cloud–aerosol interactions in a global climate model, Geosci. Model Dev., 6, 765–782, https://doi.org/10.5194/gmd-6-765-2013, 2013.
Wang, J., Ge, C., Yang, Z., Hyer, E. J., Reid, J. S., Chew, B.-N., Mahmud, M., Zhang, Y., and Zhang, M.: Mesoscale modeling of smoke transport over the Southeast Asian Maritime Continent: Interplay of sea breeze, trade wind, typhoon, and topography, Atmos. Res., 122, 486–503, https://doi.org/10.1016/j.atmosres.2012.05.009, 2013.
Wang, J., Pikridas, M., Spielman, S. R., and Pinterich, T.: A fast integrated mobility spectrometer for rapid measurement of sub-micrometer aerosol size distribution, Part I: Design and model evaluation, J. Aerosol Sci., 108, 44–55, https://doi.org/10.1016/j.jaerosci.2017.02.012, 2017a.
Wang, J., Pikridas, M., Pinterich, T., Spielman, S. R., Tsang, T., McMahon, A., and Smith, S.: A Fast Integrated Mobility Spectrometer for rapid measurement of sub-micrometer aerosol size distribution, Part II: Experimental characterization, J. Aerosol Sci., 113, 119–129, https://doi.org/10.1016/j.jaerosci.2017.05.001, 2017b.
Wang, N., Jing, B., Wang, P., Wang, Z., Li, J., Pang, S., Zhang, Y., and Ge, M.: Hygroscopicity and Compositional Evolution of Atmospheric Aerosols Containing Water-Soluble Carboxylic Acid Salts and Ammonium Sulfate: Influence of Ammonium Depletion, Environ. Sci. Technol., 53, 6225–6234, https://doi.org/10.1021/acs.est.8b07052, 2019.
Wang, X., Jing, B., Tan, F., Ma, J., Zhang, Y., and Ge, M.: Hygroscopic behavior and chemical composition evolution of internally mixed aerosols composed of oxalic acid and ammonium sulfate, Atmos. Chem. Phys., 17, 12797–12812, https://doi.org/10.5194/acp-17-12797-2017, 2017.
Wang, Y., Zhuang, G., Chen, S., An, Z., and Zheng, A.: Characteristics and sources of formic, acetic and oxalic acids in PM2.5 and PM10 aerosols in Beijing, China, Atmos. Res., 84, 169–181, https://doi.org/10.1016/j.atmosres.2006.07.001, 2007.
Wang, Y., Pinterich, T., and Wang, J.: Rapid measurement of sub-micrometer aerosol size distribution using a fast integrated mobility spectrometer, J. Aerosol Sci., 121, 12–20, https://doi.org/10.1016/j.jaerosci.2018.03.006, 2018.
Wang, Z., Jing, B., Shi, X., Tong, S., Wang, W., and Ge, M.: Importance of water-soluble organic acid on the hygroscopicity of nitrate, Atmos. Environ., 190, 65–73, https://doi.org/10.1016/j.atmosenv.2018.07.010, 2018.
Ward, J. H.: Hierarchical Grouping to Optimize an Objective Function, J. Am. Stat. Assoc., 58, 236–244, https://doi.org/10.1080/01621459.1963.10500845, 1963.
Williamson, C. J., Kupc, A., Axisa, D., Bilsback, K. R., Bui, T., Campuzano-Jost, P., Dollner, M., Froyd, K. D., Hodshire, A. L., Jimenez, J. L., Kodros, J. K., Luo, G., Murphy, D. M., Nault, B. A., Ray, E. A., Weinzierl, B., Wilson, J. C., Yu, F., Yu, P., Pierce, J. R., and Brock, C. A.: A large source of cloud condensation nuclei from new particle formation in the tropics, Nature, 574, 399–403, https://doi.org/10.1038/s41586-019-1638-9, 2019.
Wonaschuetz, A., Sorooshian, A., Ervens, B., Chuang, P. Y., Feingold, G., Murphy, S. M., de Gouw, J., Warneke, C., and Jonsson, H. H.: Aerosol and gas re-distribution by shallow cumulus clouds: An investigation using airborne measurements, J. Geophys. Res.-Atmos., 117, D17202, https://doi.org/10.1029/2012JD018089, 2012.
Xia, L., Zhang, G., Zhan, M., Li, B., and Kong, P.: Seasonal variations of atmospheric CH4 at Jingdezhen station in Central China: Understanding the regional transport and its correlation with CO2 and CO, Atmos. Res., 241, 104982, https://doi.org/10.1016/j.atmosres.2020.104982, 2020.
Xian, P., Reid, J. S., Atwood, S. A., Johnson, R. S., Hyer, E. J., Westphal, D. L., and Sessions, W.: Smoke aerosol transport patterns over the Maritime Continent, Atmos. Res., 122, 469–485, https://doi.org/10.1016/j.atmosres.2012.05.006, 2013.
Yadav, I. C., Linthoingambi Devi, N., Li, J., Syed, J. H., Zhang, G., and Watanabe, H.: Biomass burning in Indo-China peninsula and its impacts on regional air quality and global climate change-a review, Environ. Pollut., 227, 414–427, https://doi.org/10.1016/j.envpol.2017.04.085, 2017.
Yang, G.-P., Zhang, H.-H., Su, L.-P., and Zhou, L.-M.: Biogenic emission of dimethylsulfide (DMS) from the North Yellow Sea, China and its contribution to sulfate in aerosol during summer, Atmos. Environ., 43, 2196–2203, https://doi.org/10.1016/j.atmosenv.2009.01.011, 2009.
Yang, Y., Lin, Q., Fu, Y., Lian, X., Jiang, F., Peng, L., Zhang, G., Li, L., Chen, D., Li, M., Ou, J., Bi, X., Wang, X., and Sheng, G.: Stage-resolved in-cloud scavenging of submicron and BC-containing particles: A case study, Atmos. Environ., 244, 117883, https://doi.org/10.1016/j.atmosenv.2020.117883, 2020.
Yu, H., Kaufman, Y. J., Chin, M., Feingold, G., Remer, L. A., Anderson, T. L., Balkanski, Y., Bellouin, N., Boucher, O., Christopher, S., DeCola, P., Kahn, R., Koch, D., Loeb, N., Reddy, M. S., Schulz, M., Takemura, T., and Zhou, M.: A review of measurement-based assessments of the aerosol direct radiative effect and forcing, Atmos. Chem. Phys., 6, 613–666, https://doi.org/10.5194/acp-6-613-2006, 2006.
Yu, P., Froyd, K. D., Portmann, R. W., Toon, O. B., Freitas, S. R., Bardeen, C. G., Brock, C., Fan, T., Gao, R.-S., Katich, J. M., Kupc, A., Liu, S., Maloney, C., Murphy, D. M., Rosenlof, K. H., Schill, G., Schwarz, J. P., and Williamson, C.: Efficient In-Cloud Removal of Aerosols by Deep Convection, Geophys. Res. Lett., 46, 1061–1069, https://doi.org/10.1029/2018GL080544, 2019.
Yu, X., Li, D., Li, D., Zhang, G., Zhou, H., Li, S., Song, W., Zhang, Y., Bi, X., Yu, J., and Wang, X.: Enhanced wet deposition of water-soluble organic nitrogen during the harvest season: influence of biomass burning and in-cloud scavenging, J. Geophys. Res.-Atmos., 125, e2020JD032699, https://doi.org/10.1029/2020JD032699, 2020.
Yuan, T., Remer, L. A., Pickering, K. E., and Yu, H.: Observational evidence of aerosol enhancement of lightning activity and convective invigoration: aerosol enhancement of lightning, Geophys. Res. Lett., 38, L04701, https://doi.org/10.1029/2010GL046052, 2011.
Yusuf, A. A. and Francisco, H.: Climate change vulnerability mapping for Southeast Asia, Economy and Environment Program for Southeast Asia (EEPSEA) report, available at: https://www.idrc.ca/sites/default/files/sp/Documents EN/climate-change-vulnerability-mapping-sa.pdf (last access: 1 January 2019), 2009.
Zhang, H., Di, B., Liu, D., Li, J., and Zhan, Y.: Spatiotemporal distributions of ambient SO2 across China based on satellite retrievals and ground observations: Substantial decrease in human exposure during 2013–2016, Environ. Res., 179, 108795, https://doi.org/10.1016/j.envres.2019.108795, 2019.
Zhang, Q., Worsnop, D. R., Canagaratna, M. R., and Jimenez, J. L.: Hydrocarbon-like and oxygenated organic aerosols in Pittsburgh: insights into sources and processes of organic aerosols, Atmos. Chem. Phys., 5, 3289–3311, https://doi.org/10.5194/acp-5-3289-2005, 2005.
Zhang, Q., Jiang, X., Tong, D., Davis, S. J., Zhao, H., Geng, G., Feng, T., Zheng, B., Lu, Z., Streets, D. G., Ni, R., Brauer, M., van Donkelaar, A., Martin, R. V., Huo, H., Liu, Z., Pan, D., Kan, H., Yan, Y., Lin, J., He, K., and Guan, D.: Transboundary health impacts of transported global air pollution and international trade, Nature, 543, 705–709, https://doi.org/10.1038/nature21712, 2017.
Zhou, S., Wang, Z., Gao, R., Xue, L., Yuan, C., Wang, T., Gao, X., Wang, X., Nie, W., Xu, Z., Zhang, Q., and Wang, W.: Formation of secondary organic carbon and long-range transport of carbonaceous aerosols at Mount Heng in South China, Atmos. Environ., 63, 203–212, https://doi.org/10.1016/j.atmosenv.2012.09.021, 2012.