the Creative Commons Attribution 4.0 License.
the Creative Commons Attribution 4.0 License.
 | 05 Mar 2021
Future changes in isoprene-epoxydiol-derived secondary organic aerosol (IEPOX SOA) under the Shared Socioeconomic Pathways: the importance of physicochemical dependency
Alma Hodzic
Louisa K. Emmons
Simone Tilmes
Rebecca H. Schwantes
Michael J. Mills
Pedro Campuzano-Jost
Weiwei Hu
Rahul A. Zaveri
Richard C. Easter
Balwinder Singh
Zheng Lu
Christiane Schulz
Johannes Schneider
John E. Shilling
Armin Wisthaler
Jose L. Jimenez
Secondary organic aerosol (SOA) is a dominant contributor of fine particulate matter in the atmosphere, but the complexity of SOA formation chemistry hinders the accurate representation of SOA in models. Volatility-based SOA parameterizations have been adopted in many recent chemistry modeling studies and have shown a reasonable performance compared to observations. However, assumptions made in these empirical parameterizations can lead to substantial errors when applied to future climatic conditions as they do not include the mechanistic understanding of processes but are rather fitted to laboratory studies of SOA formation. This is particularly the case for SOA derived from isoprene epoxydiols (IEPOX SOA), for which we have a higher level of understanding of the fundamental processes than is currently parameterized in most models. We predict future SOA concentrations using an explicit mechanism and compare the predictions with the empirical parameterization based on the volatility basis set (VBS) approach. We then use the Community Earth System Model 2 (CESM2.1.0) with detailed isoprene chemistry and reactive uptake processes for the middle and end of the 21st century under four Shared Socioeconomic Pathways (SSPs): SSP1–2.6, SSP2–4.5, SSP3–7.0, and SSP5–8.5. With the explicit chemical mechanism, we find that IEPOX SOA is predicted to increase on average under all future SSP scenarios but with some variability in the results depending on regions and the scenario chosen. Isoprene emissions are the main driver of IEPOX SOA changes in the future climate, but the IEPOX SOA yield from isoprene emissions also changes by up to 50 % depending on the SSP scenario, in particular due to different sulfur emissions. We conduct sensitivity simulations with and without CO2 inhibition of isoprene emissions that is highly uncertain, which results in factor of 2 differences in the predicted IEPOX SOA global burden, especially for the high-CO2 scenarios (SSP3–7.0 and SSP5–8.5). Aerosol pH also plays a critical role in the IEPOX SOA formation rate, requiring accurate calculation of aerosol pH in chemistry models. On the other hand, isoprene SOA calculated with the VBS scheme predicts a nearly constant SOA yield from isoprene emissions across all SSP scenarios; as a result, it mostly follows isoprene emissions regardless of region and scenario. This is because the VBS scheme does not consider heterogeneous chemistry; in other words, there is no dependency on aerosol properties. The discrepancy between the explicit mechanism and VBS parameterization in this study is likely to occur for other SOA components as well, which may also have dependencies that cannot be captured by VBS parameterizations. This study highlights the need for more explicit chemistry or for parameterizations that capture the dependence on key physicochemical drivers when predicting SOA concentrations for climate studies.
- Article
(3085 KB) - Full-text XML
-
Supplement
(3414 KB) - BibTeX
- EndNote


Secondary organic aerosol (SOA) contributes substantial mass fractions of submicron particle concentrations globally (Zhang et al., 2007), but it is difficult to predict due to its complex sources and behavior in the atmosphere (Tsigaridis et al., 2014). There are typically many thousands of organic species and reactions involved depending on the precursor hydrocarbon (Lannuque et al., 2018), which necessitates the use of parameterizations in chemistry–climate SOA simulations. Over the last 2 decades, there has been much progress in understanding the chemistry of SOA (Ziemann and Atkinson, 2012; Glasius and Goldstein, 2016; Shrivastava et al., 2017; Bianchi et al., 2019), which has helped chemical transport models to develop more advanced SOA parameterizations (Hodzic et al., 2016; Tsimpidi et al., 2018; Schervish and Donahue, 2020).
Parameterizations range from simplified empirical methods (Hodzic and Jimenez, 2011) to volatility basis set (VBS) approaches of various complexity (Donahue et al., 2006, 2012), which can calculate not only mass concentrations but also oxidation states (Tsimpidi et al., 2018). A recent evaluation of global OA schemes reported that a simple parameterization showed similar performance compared to explicit chemistry and a complex parameterization scheme in terms of bias and variability (Pai et al., 2020). This can be explained by the fact that simple parameterizations are based on observational constraints from field campaigns (Hodzic and Jimenez, 2011; Kim et al., 2015). However, even though two different SOA schemes simulated similar SOA concentrations in present-day atmospheric conditions, they can have different responses to not only preindustrial conditions (Tilmes et al., 2019) but also future emissions and climate changes, and they can provide different performance in predicting future SOA concentrations, as discussed below.
In order to obtain realistic predictions of future SOA changes, all the variables affecting SOA concentrations should be considered. However, parameterizations inevitably omit some important processes; for example, the two-product or VBS approaches conventionally used in chemical transport models do not consider acid-catalyzed multiphase chemistry (Marais et al., 2016; Zhang et al., 2018a) and autoxidation (Bianchi et al., 2019; Schervish and Donahue, 2020). Based on recent laboratory and theoretical studies, which provide a nearly complete gas-phase oxidation mechanism for isoprene and its major products (Wennberg et al., 2018, and references therein), SOA models have started to employ explicit chemistry rather than relying on parameterization schemes, especially for isoprene SOA. As a result, state-of-the-art chemical transport models have started to use a hybrid approach to simulate SOA by using both parameterizations and explicit chemistry, including heterogeneous reactions (Pye et al., 2013; Marais et al., 2016; Jo et al., 2019; Shrivastava et al., 2019; Zare et al., 2019; Hodzic et al., 2020).
When it comes to climate modeling studies, generally simplified SOA parameterizations have been used (e.g., Sporre et al., 2019). In the fifth phase of the Coupled Model Intercomparison Project (CMIP5), most models used a constant SOA yield without performing the oxidation of volatile organic compounds (VOCs) and gas-to-particle partitioning calculations (Tsigaridis and Kanakidou, 2018). Climate studies focusing on SOA employed more detailed schemes with initial oxidation of VOCs and dynamic gas-to-particle partitioning such as the two-product scheme (Heald et al., 2008; Liao et al., 2009; Wu et al., 2012; Cholakian et al., 2019b) and the VBS scheme (Megaritis et al., 2013; Pommier et al., 2018; Zhang et al., 2018b). Recent studies used even more detailed processes such as SOA formation from highly oxygenated molecules (Zhu et al., 2019) and heterogeneous reactions (Lin et al., 2016).
A few previous studies examined the effects of different SOA schemes on future SOA prediction. Cholakian et al. (2019a) showed that the complex VBS scheme shows a higher relative change in biogenic SOA between future and historical simulations than the two-product scheme. On the other hand, Day and Pandis (2015) reported that the inclusion of the volatility of primary particles and chemical aging processes in the VBS scheme does not increase its sensitivity to climate change. However, these studies only compared different volatility-based parameterizations, not including explicit chemistry. As pointed out by Jo et al. (2019), the SIMPLE and VBS parameterizations in GEOS-Chem cannot capture the response to changes in NOx and SO2 emissions predicted by the explicit chemistry. This is critical because these emissions are expected to be substantially different in future climate and emissions scenarios (Feng et al., 2020). Lin et al. (2016) used the hybrid approach to simulate global SOA using both parameterizations and explicit chemistry. In their sensitivity simulation, they investigated the effects of aerosol acidity on present-day and future SOA concentrations by comparing two cases using the constant and the pH-dependent reactive uptake coefficient of isoprene epoxydiols (IEPOXs), and they concluded that the global average SOA production rate changes very little. This result is contrary to the results by Marais et al. (2017), who concluded that isoprene SOA mass yields per unit of isoprene oxidized decreased from 13 % in 1991 to 3.5 % in 2013 over the southeastern US. This could be because Lin et al. (2016) investigated aerosol pH effects only, while keeping other conditions the same (e.g., HO2 NO oxidation channel and aerosol surface area), whereas all the conditions were changed in Marais et al. (2017). Furthermore, Lin et al. (2016) calculated the effects of acidity on total SOA, but most SOA components were not affected by the acidity change except for IEPOX SOA. Stadtler et al. (2018) also investigated the IEPOX SOA sensitivity to variable aerosol pH compared to fixed pH and found 58 % differences between the two cases.
In this study, we investigate the future SOA change as predicted by the Community Earth System Model version 2.1.0 (CESM2.1.0) using explicit IEPOX SOA chemistry and compare it with the SOA predictions by the VBS parameterization recently implemented in the model (Tilmes et al., 2019). We focus on IEPOX SOA as we have a relatively higher mechanistic understanding of the IEPOX SOA formation compared to other SOA species, and IEPOX SOA contributes a substantial mass fraction of SOA, especially under low-NO conditions (Hu et al., 2015). The CESM includes several updates such as an adjustment of isoprene emissions, detailed isoprene chemistry, NOx-dependent yields of the VBS, and the heterogeneous uptake of IEPOX. We evaluate the simulated IEPOX SOA against aircraft campaign and surface network measurements. We then predict future IEPOX SOA concentration changes for the middle and end of the 21st century under four Shared Socioeconomic Pathways (SSPs) – SSP1–2.6, SSP2–4.5, SSP3–7.0, and SSP5–8.5 (O'Neill et al., 2016; Riahi et al., 2017). We also conduct sensitivity simulations to examine the effects of CO2 inhibition on isoprene change and IEPOX SOA budget, as well as the effects of aerosol pH on IEPOX SOA formation. Finally, we compare the explicit scheme and the VBS parameterization to investigate the differences between the two schemes in predicting future SOA concentrations.
2.1 General
We used CESM2.1.0 to simulate present and future climatic conditions (Danabasoglu et al., 2020). For the atmospheric configuration, the Community Atmosphere Model version 6 with comprehensive tropospheric and stratospheric chemistry representation (CAM6-chem) was used, with a horizontal resolution of 0.95∘ in latitude by 1.25∘ in longitude and 32 vertical layers up to 1 hPa (40 km) (Emmons et al., 2020). Simulations were conducted for 10 years to construct multiyear-averaged chemical fields under present (2005–2014) and future (2045–2054 and 2091–2100) atmospheric conditions; the first 2 years were not included in the analysis (used for spin-up). Atmospheric (CAM6-chem) and land (Community Land Model version 5; CLM5) models were fully coupled online. We constrained sea surface temperatures and sea ice conditions from observations for present runs and from the Whole Atmosphere Community Climate Model version 6 (WACCM6) results for future runs. The WACCM6 results used in this study were those of the CMIP phase 6 (Gettelman et al., 2019).
For present-day conditions, anthropogenic emissions are from the Community Emissions Data System (CEDS) (Hoesly et al., 2018), and biomass burning emissions are from the inventory developed for CMIP6 (van Marle et al., 2017). The SSPs were used for future climatic scenarios (Riahi et al., 2017). We selected all four Tier 1 scenarios – SSP5–8.5, SSP3–7.0, SSP2–4.5, and SSP1–2.6 (O'Neill et al., 2016; Gidden et al., 2019). A detailed description of each SSP scenario is briefly summarized in Table S1 (narrative, forcing category, population, regulation, and emission amount) and Fig. S1 (emission trajectories for SO2 and NOx). Biogenic emissions were calculated online within CLM5 using the Model of Emissions of Gases and Aerosols from Nature (MEGAN) version 2.1 (Guenther et al., 2012). To address isoprene emission uncertainties related to CO2 inhibition effects, we conducted two types of simulations with and without CO2 inhibition effects (see Sect 2.2.3 for details). Aerosol simulations were based on the four-mode version of the Modal Aerosol Module (MAM4) (Liu et al., 2016), with substantial changes to the treatments of inorganic and secondary organic aerosol species. Two very different treatments of secondary organic aerosol are used: an explicit treatment of IEPOX SOA (Sect. 2.2.2) and a modified version of the Tilmes et al. (2019) five-bin VBS SOA mechanism (Sect. 2.2.4). Dynamic partitioning of H2SO4, HNO3, HCl, and NH3 to each mode and the related particle-phase thermodynamics are calculated using the Model for Simulating Aerosol Interactions and Chemistry (MOSAIC) aerosol module (Zaveri et al., 2008, 2021; Lu et al., 2021).
For the model evaluation in Sect. 3, we used a specified dynamics option (FCSD compset) to reduce uncertainties related to dynamic simulations in the atmospheric model (CAM6). The meteorological fields (temperature, wind, and surface fluxes) were nudged towards the Modern-Era Retrospective analysis for Research and Applications version 2 (MERRA2) (Gelaro et al., 2017) with a relaxation time of 50 h.
2.2 Model updates
2.2.1 Gas-phase chemistry of isoprene
Because the isoprene SOA yield strongly depends on the gas-phase chemistry, we used the MOZART-TS2 (Model of Ozone And Related chemical Tracers, Troposphere–Stratosphere V2) detailed isoprene chemical mechanism recently developed by Schwantes et al. (2020). The MOZART-TS2 chemical mechanism includes more comprehensive and updated isoprene and terpene chemistry, but for computational efficiency, we only implemented the new isoprene chemistry. The updates for isoprene chemistry added 39 new compounds and 139 reactions on top of the MOZART-TS1 chemistry (Emmons et al., 2020) and included updates to isoprene hydroxy hydroperoxide (ISOPOOH) and IEPOX chemistry relevant to this work. These updates were applied to all simulations in this work.
2.2.2 Heterogenous IEPOX reactive uptake
We implemented the heterogeneous uptake of IEPOX based on the work by Jo et al. (2019). We used the resistor model equation (Anttila et al., 2006; Gaston et al., 2014b) to calculate the reactive uptake coefficient of IEPOX (γIEPOX). The equation needs several parameters such as Henry's law constant and diffusion coefficients of IEPOX in the aqueous core and in the organic layer; all input parameter values and equations are available in Supplement Sect. S1 of Jo et al. (2019). In addition to IEPOX SOA, other SOAs were simulated using the VBS scheme as described in Sect. 2.2.4.
Aerosol pH was calculated online for each mode by the MOSAIC module (Zaveri et al., 2008), as implemented in CESM by Zaveri et al. (2021) and Lu et al. (2021). In addition, we modified MOSAIC to calculate submicron (Aitken and accumulation modes) aerosol pH without sea salt following Jo et al. (2019) based on previous studies showing that sea salt aerosols were dominantly externally mixed with submicron sulfate–nitrate–ammonium rather than internally mixed (Guo et al., 2016; Bondy et al., 2018; Murphy et al., 2019). We note that sea salt was calculated in the model but excluded only for pH calculation. Removing sea salt resulted in substantially lower pH (more acidic aerosol) over the ocean and better agreement with the observationally constrained pH values by Nault et al. (2021). The effects of sea salt on global aerosol pH and IEPOX SOA formation are discussed in Sect. 4.2. It is worth noting that the submicron aerosol nitrate burden predicted by MAM4-MOSAIC is about 50 % of MAM7-MOSAIC (Lu et al., 2021; Zaveri et al., 2021) due to the different treatments of submicron sea salt and dust between MAM7 (Liu et al., 2012) and MAM4 (Liu et al., 2016), while the supermicron aerosol nitrate burdens are close. Nitrate aerosol affects pH and in turn IEPOX SOA formation, and pH also strongly affects nitrate aerosol formation. MAM4-MOSAIC has been found to predict similar nitrate levels compared to the observed nitrate aerosol concentrations over the US and East Asia (Lu et al., 2021), but additional studies will be needed to evaluate the nitrate simulation in other regions.
The effects of organic coatings have often been neglected in previous studies using the explicit chemistry for IEPOX SOA (Lin et al., 2016; Marais et al., 2016; Budisulistiorini et al., 2017; Stadtler et al., 2018; Shrivastava et al., 2019), although it can reduce the IEPOX SOA formation rate by up to ∼30 % (Zhang et al., 2018a; Schmedding et al., 2019). We considered the organic coating effect by assuming an inorganic core and organic shell mixture, as described in detail in Jo et al. (2019).
The SOA yield of IEPOX reactive uptake was assumed to be 100 %, and IEPOX SOA was treated as non-volatile in the model. This is consistent with other previous modeling (Marais et al., 2016; Budisulistiorini et al., 2017; Stadtler et al., 2018; Schmedding et al., 2019) based on field studies showing that ambient IEPOX SOA has very low volatility (Hu et al., 2016; Lopez-Hilfiker et al., 2016; Riva et al., 2019). A recent chamber-based study by D'Ambro et al. (2019) confirmed the low volatility of IEPOX SOA and suggested that the semi-volatile products (2-methyltetrols, C5-alkene triols, and 3-MeTHF-3,4-diols) measured by some techniques in ambient IEPOX SOA mostly resulted from thermal decomposition in those methods. On the other hand, they reported that the semi-volatile 2-methyltetrols that are also formed can evaporate after IEPOX reactive uptake and can be lost to gas-phase reactions with OH and dry–wet deposition, resulting in an IEPOX SOA yield lower than unity. However, the evaporation is completed within 1 h and is thus not inconsistent with the very low-volatility characteristics of ambient IEPOX SOA. The observed volatility of ambient IEPOX SOA can be explained by the low volatility of organosulfates and oxidation products, which comprise more than half of the IEPOX SOA tracers (Cui et al., 2018; Chen et al., 2020). D'Ambro et al. (2019) also pointed out that the measured γIEPOX is an order of magnitude or more higher than often used in models. We conducted sensitivity tests to investigate the effect of these uncertain parameters on model results in Sect. 3.
In addition to determining volatility, the formation of organosulfates is also important in terms of aerosol pH and its effect on the IEPOX SOA formation rate. Substantial amounts of inorganic sulfate can be converted to organosulfates, especially in regions with a high ratio of IEPOX to inorganic sulfate concentration (Riva et al., 2019). Riva et al. (2019) showed that up to 90 % of inorganic sulfate was converted to organosulfates under laboratory conditions that mimicked the Amazon. As a result, the aerosol became less acidic and reduced the reactive uptake of IEPOX (Zhang et al., 2019). A sensitivity simulation was carried out to estimate the changes in IEPOX SOA concentrations due to conversion of inorganic sulfate to organosulfate (Sect. 3). In this sensitivity run, we assumed 90 % conversion as an upper limit in the atmosphere. Because thermodynamic models used in 3D chemistry models (e.g., ISORROPIA; Fountoukis and Nenes, 2007) do not take into account organics (e.g., all models participated in the recent AeroCom phase III; Bian et al., 2017), we assumed that organics have a negligible effect on aerosol pH. Therefore, aerosol pH changes were solely calculated by the loss of inorganic sulfates. There are also high uncertainties in acid dissociation constant (pKa) values for IEPOX-derived organosulfates, which makes it difficult to include organosulfates in the thermodynamic calculation (Zhang et al., 2019) and requires further study.
Once IEPOX SOA is formed, there is no further oxidation in the model, as in previous studies (Marais et al., 2016; Budisulistiorini et al., 2017; Schmedding et al., 2019). However, measurement studies have observed further heterogeneous OH oxidation of 3-methyltetrol sulfate ester (Lam et al., 2019), 2-methyltetrol sulfates (Chen et al., 2020), and IEPOX SOA by positive matrix factorization (PMF) (Hu et al., 2016). Aged IEPOX SOA can be lost to the gas phase via volatilization if fragmentation is dominant (Hu et al., 2016; Lam et al., 2019) or transformed to highly oxidized molecules if functionalization is more favorable (Chen et al., 2020). Reaction rate constants with OH were similar among these studies: 2.0– cm3 molec.−1 s−1 including error ranges (Hu et al., 2016; Lam et al., 2019; Chen et al., 2020). We used cm3 molec.−1 s−1, which is based on the best guess of Hu et al. (2016), because the model simulates bulk IEPOX SOA. The sensitivity results of heterogeneous OH oxidation are also discussed in Sect. 3.
2.2.3 Isoprene emission adjustment
Isoprene emission changes are one of the main driving factors of IEPOX SOA change in the future climate (Sect. 5). MEGAN v2.1 has been considered the most reliable biogenic emission algorithm and is used in many chemistry models (e.g., all models that participated in the intercomparison study by Hodzic et al., 2020, used MEGAN). However, there are still many uncertainties in calculating isoprene emissions in models, especially for tropical forests, which are less understood than their temperate and boreal counterparts due to great heterogeneity, with many forest subtypes at scales of hundreds of meters (Batista et al., 2019). For example, ter Steege et al. (2013) reported that Amazonia harbors ∼16 000 different tree species, and Silk et al. (2015) showed that there are 40 000–53 000 tree species in the tropics, in contrast to only 124 across temperate Europe. Furthermore, there have been fewer emission studies over the tropics (<20 %) compared to their contribution to global biogenic VOC emissions (75 %) (Guenther, 2013).
Satellite-based top-down studies have reported that chemistry models with the MEGAN v2.1 algorithm tend to overestimate isoprene emissions over the tropics (Worden et al., 2019) including the Amazon (Barkley et al., 2013), central Africa (Marais et al., 2012), and Borneo (Stavrakou et al., 2014). On the other hand, aircraft flux measurements have suggested that MEGAN v2.0 and v2.1 underestimated isoprene emissions over the Amazon (v2.0 in Karl et al., 2007, and v2.1 in Gu et al., 2017). Sarkar et al. (2020) showed that the same MEGAN algorithm with different inputs can both overestimate and underestimate the observed isoprene emission fluxes at a tower site over the Amazon; i.e., MEGAN v2.1 using emissions factors based on the plant functional type (PFT) overestimated the observed isoprene flux, whereas MEGAN v2.1 with the 1 km emission factor distribution map underestimated the flux.
In order to calculate the isoprene emissions as realistically as possible, especially for the tropics, we used two constraints. First, we compared the simulated global isoprene emissions by CESM2.1.0–MEGANv2.1 (PFT-based emission factors, MODIS-based leaf area index – LAI) with isoprene top-down estimates using HCHO from the Ozone Monitoring Instrument (OMI) (Bauwens et al., 2016). As discussed above, the model overestimated isoprene emissions, especially for the tropics (Sect. S1 and Figs. S2 and S3 in the Supplement). Second, we evaluated the modeled isoprene concentrations against aircraft measurements over the Amazon, which also suggested an overestimation (see Sect. 3.2 for details). To reduce discrepancies found in both of these comparisons, we reduced isoprene emission factors for tropical PFTs (broadleaf evergreen tropical trees and broadleaf deciduous tropical trees) by a factor of 2. The resulting isoprene emissions were comparable to OMI-based isoprene emission estimates in terms of the annual global total value, although there were still some regional differences (Figs. S2 and S3). For example, the base model overestimated OMI-based isoprene emissions over the Amazon by a factor of 3–4. Because satellite-based top-down emissions also have uncertainties in the inversion process (e.g., a priori source uncertainty) and the aircraft comparison of ambient isoprene over the Amazon (Sect. 3.2) only supported reducing isoprene emissions by a factor of 2, we considered reducing isoprene emissions by a factor of 3–4 excessive.
The CO2 inhibition effect on isoprene emissions becomes important at high CO2 concentrations under future climatic conditions, which can solely offset an isoprene emission increase associated with future temperature increase (Tai et al., 2013). Controlled chamber experiments revealed that isoprene emissions are lower at elevated CO2 conditions (Wilkinson et al., 2009; Possell and Hewitt, 2011), and MEGANv2.1 includes the CO2 inhibition effect in the isoprene emission calculation (Guenther et al., 2012). However, the quantitative effects of CO2 inhibition on isoprene emission are still difficult to predict, likely due to the onset of complex feedback and feed-forward biochemical mechanisms and interactive effects (Sharkey and Monson, 2017; Feng et al., 2019). Bauwens et al. (2018) also reported the large uncertainty associated with CO2 inhibition calculations by using two distinct CO2 inhibition parameterizations. Therefore, we conducted future simulations without CO2 inhibition effects as a base case, and we additionally carried out simulations with CO2 effects to estimate the robustness of our conclusions with regard to CO2 effects. We note that the CO2 inhibition effect is included in MEGANv2.1 in CESM as a default (Guenther et al., 2012).
2.2.4 NOx-dependent yield of VBS scheme
The VBS scheme (Hodzic et al., 2016) as implemented in CESM2.1.0 considers only low-NOx conditions (Tilmes et al., 2019). Because NOx levels in the future are predicted to change substantially (Feng et al., 2020), it is important to consider NOx-dependent yields to capture the response to HO2 NO ratio change in the future. We updated the VBS scheme to simulate high- and low-NOx pathways of SOA formation based on yields from Hodzic et al. (2016). For example, for isoprene, the default scheme includes a reaction with OH forming the SOA precursor gas-phase species (SOAG) for the five VBS bins:
where SOAG0–4 represents gas-phase SOA species simulated by the VBS scheme spanning saturation vapor concentrations from 0.01 µg m−3 to 100 at 300 K; αlow, n is the SOA molar yield at low-NOx conditions for the volatility bin n with values of 0.0031, 0.0035, 0.0003, 0.0271, and 0.0474; k is the reaction rate coefficient (cm3 molecule−1 s−1); and T is the temperature in Kelvin.
To account for the high- and low-NOx conditions, we added two reactions to calculate the peroxy radical + HO2 and peroxy radical + NO explicitly, as follows:
where αhigh, 0–4 represents 0.0003, 0.0003, 0.0073, 0.0057, and 0.0623, respectively. Isoprene, OH, HO2, and NO are not consumed by the VBS reactions to avoid duplication of the detailed gas-phase isoprene chemistry in Sect. 2.2.1. In other words, the VBS does not affect gas chemistry in the model, so all simulations in Table 1 have the same gas chemistry. The isoprene peroxy radical (ISOPO2VBS) is a non-transported tracer to reduce computational cost. It is reasonable, as a typical lifetime of isoprene peroxy radicals in the atmosphere is less than a few minutes (Wennberg et al., 2018; Jo et al., 2019). The reaction rate constant of the isoprene + OH reaction matches the isoprene gas-phase reaction (Schwantes et al., 2020). Similarly high NOx yields for SOA formed from terpenes, benzene, toluene, and xylenes have been included in the mechanism.
3.1 SEAC4RS
The Studies of Emissions, Atmospheric Composition, Clouds and Climate Coupling by Regional Surveys (SEAC4RS) campaign in August–September 2013 sampled the continental US troposphere with a heavy emphasis on the SE US and provided aircraft measurements of isoprene and its oxidation products (Marais et al., 2016; Toon et al., 2016). We evaluated the model against isoprene, isoprene hydroxy hydroperoxide (ISOPOOH), IEPOX, and IEPOX SOA. Isoprene was observed by proton transfer reaction mass spectrometry (PTR-MS) (de Gouw and Warneke, 2007; Müller et al., 2014). Biomass-burning-impacted air masses ([CH3CN] >200 ppt; Travis et al., 2016) were excluded from the analysis in order to remove furan interference in detecting isoprene concentrations. The 2-methyl-3-buten-2-ol (MBO) interferences in the PTR-MS measurement of isoprene were assumed to be negligible over the SE US. ISOPOOH and IEPOX were measured by a chemical ionization mass spectrometer (CIMS) using the CF3O ion, and IEPOX and ISOPOOH were individually quantified by tandem MS (Crounse et al., 2006; Paulot et al., 2009; St. Clair et al., 2010). IEPOX SOA concentrations were quantified by applying PMF to aerosol mass spectrometer (AMS) OA measurements (Hu et al., 2015; Marais et al., 2016). We also excluded urban plumes as diagnosed by [NO2] >4 ppb and stratospheric air as diagnosed by [O3] [CO] >1.25 mol mol−1 based on Travis et al. (2016).
Figure 1 compares observed and modeled vertical profiles of isoprene, ISOPOOH, IEPOX, and IEPOX SOA. The model generally captured vertical distributions but underestimated observed concentrations. Normalized mean biases (NMBs) were −64 %, −73 %, −52 %, and −57 % for isoprene, ISOPOOH, IEPOX, and IEPOX SOA, respectively. The model substantially underestimated median values, especially for isoprene and ISOPOOH, but showed better performance for later generation products (IEPOX and IEPOX SOA) with longer lifetimes. IEPOX SOA concentrations over 6 km were overestimated by the model but underestimated below 6 km. This tendency is opposite to the vertical gradient of IEPOX SOA over the Amazon in Sect. 3.2. In terms of frequency distributions (Fig. S4), the model simulated more low-concentration points and fewer high-concentration points compared to measurements.
We conducted an additional sensitivity test as discussed in Sect. 2.2.2. We decreased the IEPOX SOA yield from IEPOX to 0.2 (based on Fig. 8 of D'Ambro et al., 2019). To increase γIEPOX in the model, we increased the effective Henry's law constant (H*), which is highly uncertain and spans 2 orders of magnitude in previous literature (1.0×10⁶–1.7×10⁸ M atm−1). Previous studies have used 1.0×10⁶ M atm−1 (Zhang et al., 2019), 2.7×10⁶ M atm−1 (Pye et al., 2013; Lin et al., 2016), 1.7×10⁷ M atm−1 (Zheng et al., 2020), 3.0×10⁷ M atm−1 (Budisulistiorini et al., 2017; Pye et al., 2017; Zhang et al., 2018a), 3.3×10⁷ M atm−1 (Marais et al., 2016), 1.3×10⁸ M atm−1 (Eddingsaas et al., 2010), and 1.7×10⁸ M atm−1 (Gaston et al., 2014a). We increased H* by a factor of 5 (8.5×10⁷ M atm−1 from 1.7×10⁷ M atm−1). The results are shown in Fig. S5a and d for IEPOX and IEPOX SOA, respectively. We found that IEPOX (NMB of −55 %) stayed at similar levels, while IEPOX SOA (NMB of −87 %) was greatly reduced in the model, which was attributed to the lower SOA yield of 20 %, since the total production of IEPOX stays the same. We further conducted sensitivity tests to investigate the IEPOX SOA concentrations using extremely high H* values (50 and 500 times higher, shown in Fig. S5b, c, e, f). Even in these extreme cases, IEPOX SOA concentrations were substantially decreased (NMBs of −78 % and −81 %) compared to the base case due to low SOA yield. The mean modeled IEPOX and IEPOX SOA ratios between the extreme case (H* of 8.5×10⁹ M atm−1 and the yield of 0.2) and the base case (H* of 1.7×10⁷ M atm−1 and the yield of 1.0) were 0.68 and 0.51, which shows that the extreme case tends to exacerbate the low bias in the model. Although the fraction of IEPOX taken up increases in this case, it is not enough to compensate for the reduced yield compared to the base case.
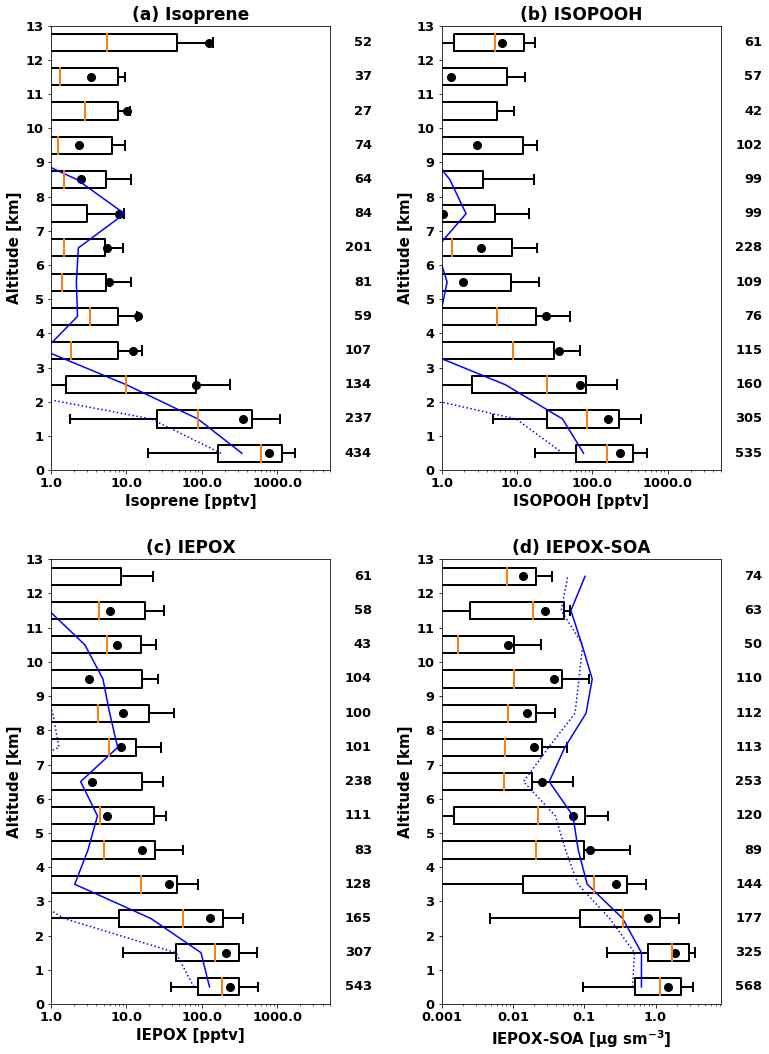
Figure 1Vertical profiles of (a) isoprene, (b) ISOPOOH, (c) IEPOX, and (d) IEPOX SOA during the SEAC4RS campaign over the southeastern US. Profiles are binned to the 1 km vertical resolution grid. Boxes show the 25th–75th percentile, with the orange line being the median. Whiskers represent 10th and 90th percentiles, and the black dot indicates the mean value. The model results are sampled along the flight tracks and shown in blue, with the solid line for the mean and the dashed line for median values. The number of 60 s merged data points in each kilometer interval is shown at the right of each panel.
3.2 GoAmazon and ACRIDICON-CHUVA
The Green Ocean Amazon (GoAmazon) experiment provided a variety of chemical measurements over the Amazon with aircraft and surface measurements in the wet and dry seasons of 2014. One of the main goals of the GoAmazon campaign was to investigate the interaction between pollution plumes from Manaus city and background conditions in the central Amazon Basin. There were two intensive operating periods (IOP1 and IOP2). IOP1 was carried out from 1 February to 31 March 2014 in the wet season, and IOP2 was conducted from 15 August to 15 October 2014 in the dry season (Martin et al., 2016). A low-flying G-159 Gulfstream I (G-1) aircraft collected data including isoprene mostly in the atmospheric boundary layer during IOP1 and IOP2. The German High Altitude and Long Range Research Aircraft (HALO) was deployed during the ACRIDICON-CHUVA (Aerosol, Cloud, Precipitation, and Radiation Interactions and Dynamics of Convective Cloud Systems) field campaign, which was performed in cooperation with IOP2 of the GoAmazon campaign (Wendisch et al., 2016). Unlike the G-1 aircraft, HALO flew not only in the boundary layer but also in the middle and upper troposphere. Isoprene was measured by PTR-MS (Shilling et al., 2018) in the G-1, and IEPOX SOA was calculated from AMS data using PMF analysis on the G-1 (Shilling et al., 2018) and on HALO (Schulz et al., 2018) using the 82 tracer method by Hu et al. (2015).
This dataset was used to evaluate the model results in typical tropical forest conditions characterized by elevated isoprene emissions. Given the coarse model resolution, we have filtered out urban and biomass burning plumes from low-altitude G-1 flights and focused on evaluating the model's ability to simulate SOA in background conditions. Based on cluster analyses at the surface (T3) site by de Sá et al. (2018) for IOP1 and de Sá et al. (2019) for IOP2, we used the following criteria for removing polluted air masses from the data for evaluation: NOy >1 ppb, ozone >20 ppb, and particle number >1200 cm−3 for IOP1 and NOy >1.3 ppb, ozone >36 ppb, and particle number >2240 cm−3 for IOP2. We applied these criteria to observations from the G-1 aircraft by assuming that both the G-1 aircraft and the T3 surface site were affected by similar air masses. The G-1 aircraft mostly sampled the boundary layer (∼75 % data points below 1 km, see Fig. 2), and its flight tracks were close to the T3 site (Martin et al., 2016). To estimate the impact of the uncertainty in modeled isoprene emissions, we conducted three simulations with different isoprene emissions by scaling the emission factors of tropical trees by 100 % (base), 50 % (half), and 25 % (quarter).
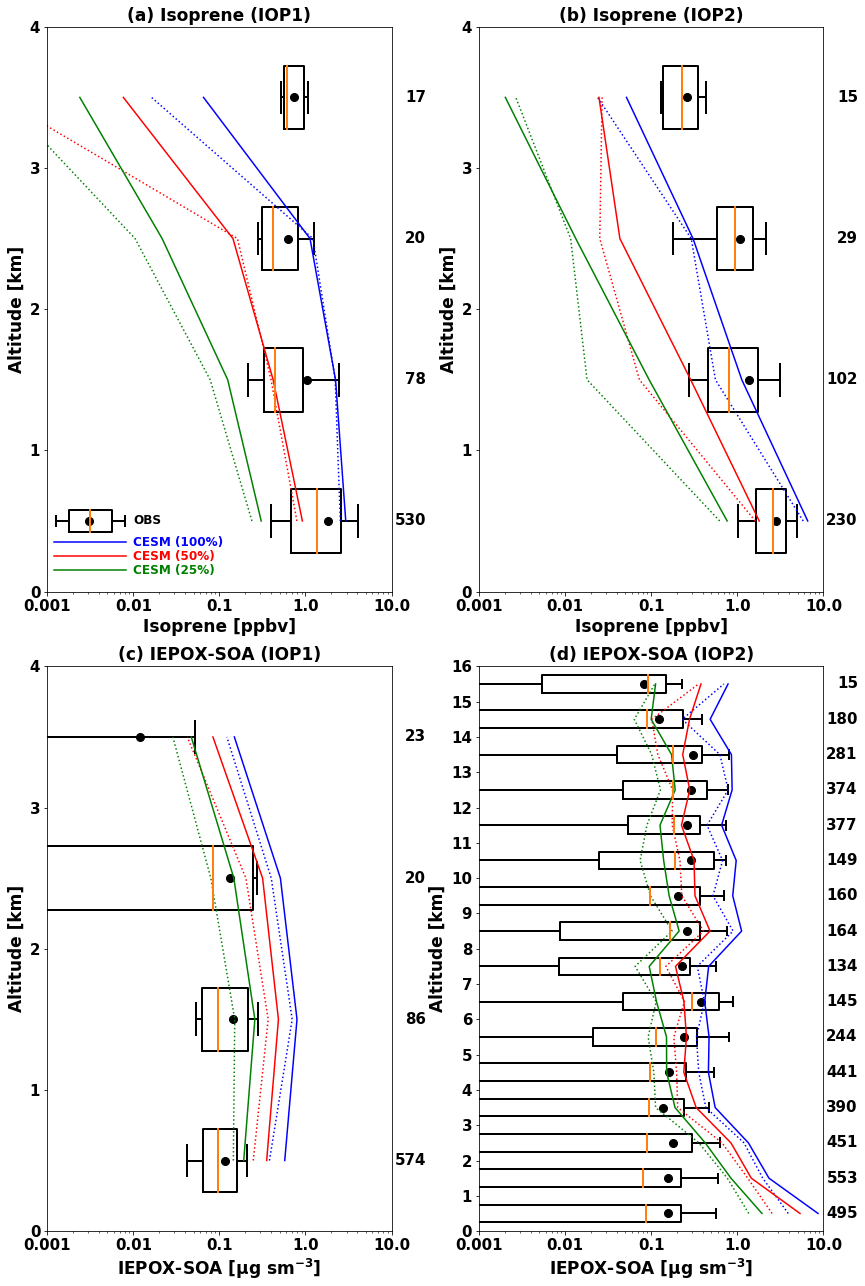
Figure 2Vertical profiles of isoprene (a, b) and IEPOX SOA (c, d) during the GoAmazon (a, b, c) and ACRIDICON-CHUVA (d) campaigns. Profiles are binned to the 1 km vertical resolution. Boxes show the 25th–75th percentile, with the orange line showing the median. Whiskers represent the 10th and 90th percentiles and the black dot indicates the mean value. The model results are shown in blue, red, and green for the base, half, and quarter isoprene emissions from tropical tree PFTs, respectively. The solid line represents the mean, and the dashed line indicates median values. The observed median and quartile values are not visible at the 3–4 km level in (c), as they are smaller than 0.001 µg m−3. The number of data points in each kilometer interval is shown at the right of each panel.
Figure 2 shows vertical profiles of isoprene and IEPOX SOA from the G-1 (a, b, c) and HALO (d), respectively. Isoprene and IEPOX SOA concentrations simulated by CESM2.1.0 with MEGANv2.1 substantially overestimate observed concentrations. The data (blue line) in Fig. 2 show NMBs of 65 % and 99 % for isoprene during IOP1 (a) and IOP2 (b), respectively. The overestimations were higher for IEPOX SOA, which were 430 % during IOP1 (c) and 769 % during IOP2 (d). We attribute these overestimations to isoprene emissions that are too high, as discussed in Sect. 2.2.3. A sensitivity simulation with the isoprene emissions from tropical trees decreased by 50 % reduced model biases to −51 % and −46 % for isoprene during IOP1 and IOP2, respectively, and to 225 % and 394 % for IEPOX SOA. A further reduction of isoprene emissions to 25 % led to substantial underprediction of isoprene concentrations with biases of −84 % during IOP1 and −77 % during IOP2. Mean IEPOX SOA concentrations were still overestimated (75 % and 121 %), with strong variability in biases according to altitude (Fig. 2d). Even the model with the lowest isoprene emissions overestimated IEPOX SOA below 5 km, but it substantially underestimated IEPOX SOA above 5 km (green line in Fig. 2d). One possible reason is inaccuracies in the convection scheme in the model because the ACRIDICON-CHUVA period was strongly influenced by tropical deep convection (Schulz et al., 2018). It is worth noting that the convection scheme in CAM6 (CLUBB; Cloud Layers Unified By Binormals) has shown improved performance for tropical deep convection over land compared to the previous convection schemes in CESM (Danabasoglu et al., 2020), but it may still contribute to the observed differences. In terms of IEPOX SOA concentrations above 5 km, NMBs were 181 %, 6 %, and −42 % for the base, half, and quarter isoprene emission cases, respectively.
The higher model IEPOX SOA biases against the ACRIDICON-CHUVA (121 %–769 %) compared to the GoAmazon (75 %–430 %) measurements can be partially explained by particle losses in the constant-pressure inlet used by the HALO AMS. Mei et al. (2020) reported that there were particle losses in the constant-pressure inlet used on the HALO AMS by comparing G1 AMS and HALO AMS during coordinated flights. The differences between G1 and HALO AMS were up to a factor of 2 below 2 km (Fig. 11 in Mei et al., 2020). The model biases during the ACRIDICON-CHUVA were reduced to 88 %–641 % after increasing the observed IEPOX SOA concentrations below 2 km 2 times.
We further investigated the effects of IEPOX SOA evaporation (Sect. 2.2.2) on the model performance by using H* of 8.5×10⁷ M atm−1 and the yield of 0.2 (IEPOX SOA yield from IEPOX reactive uptake), especially for the model with the half isoprene emissions (Fig. S6). NMBs were 11 % and 28 % over all altitudes for IOP1 and IOP2, respectively. For the ACRIDICON-CHUVA campaign (Fig. S6b), this improvement results from a combination of an overestimation of IEPOX SOA below 3 km and an underestimation above 3 km. The model showed a strong vertical gradient, which was different from the observed vertical profiles. NMB was −70 % above 5 km. However, in general, contrary to the evaluation against SEAC4RS measurements (Sect. 3.1), the inclusion of the recent findings from the chamber study by D'Ambro et al. (2019) improved the model simulation in terms of model bias (225 %–394 % to 11 %–28 %). One possible explanation is different IEPOX SOA molecular components between the southeastern US and the Amazon; however, the reported composition is similar for both locations (Yee et al., 2020). This new approach also changed IEPOX as shown in Sect. 3.1. Combined field measurements of IEPOX and IEPOX SOA will be needed to clarify the behaviors of IEPOX SOA in different regions.
Unlike the volatilities of IEPOX SOA, even if the molecular compositions of IEPOX SOA are similar for different locations, the formation rates of IEPOX SOA could be different. Depending on the ratio of IEPOX to inorganic sulfate, aerosol pH can change substantially due to the conversion of inorganic sulfate to organic sulfate (Riva et al., 2019). This inorganic-to-organic conversion can be especially important for IEPOX SOA over the Amazon, where the conversion was observed to be up to ∼90 % in the laboratory experiment mimicking the Amazon (Riva et al., 2019). To explore this effect, we conducted a sensitivity simulation in which we assumed that 90 % of the inorganic sulfate had converted to organic sulfate and excluded organic sulfate from the thermodynamic calculation (Sect. 2.2.2). The result is shown in Fig. S7. Model biases were substantially reduced and changed from positive (225 % and 394 % for the GoAmazon IOP1 and ACRIDICON-CHUVA campaigns, respectively) to negative (−9 % and −49 %). The model showed improved performance for GoAmazon IOP1 but substantially underestimated the observed IEPOX SOA concentrations during the ACRIDICON-CHUVA campaign except below 1 km. This change is due to less acidic conditions as shown in Fig. S8, which shows aerosol pH increases of 1–2 units over the Amazon; this is similar to the results by Zhang et al. (2019). Given the fact that the ratio of IEPOX to inorganic sulfate is especially high over the Amazon, the modeling of the conversion may improve the model performance over the Amazon while maintaining the model performance over the SE US and other regions. However, it did not improve the comparison, especially for the free troposphere. The results of this sensitivity run will be further discussed in Sect. 3.3 with other sensitivity model runs.
Considering the isoprene and IEPOX SOA evaluations together, the model with the half isoprene emissions showed relatively better performance, although it overestimated IEPOX SOA concentrations below 5 km. The other model results showed isoprene and IEPOX SOA that are too high (base emission case) or an isoprene mixing ratio that is too low (quarter emission case). The model with the half isoprene emissions also showed better results in terms of the frequency distribution (Fig. S9). Hereafter, the model simulations are based on the reduced isoprene emission factors by half for tropical tree PFTs. This treatment mainly affected isoprene emissions over the tropics (25∘ S–25∘ N; see Fig. S2e).
3.3 Global surface AMS dataset
We evaluated the model against global IEPOX SOA concentrations reported by Hu et al. (2015) with seven more recent observations (Table S2). They reported surface IEPOX SOA concentrations averaged for each campaign period (from a month to a few months). Figure 3 shows the comparison of modeled versus observed IEPOX SOA concentrations at the surface spanning the years between 2008 and 2014. In this section, the modeled isoprene emissions of tropical trees were reduced by half according to the evaluation in Sect. 3.2. Analogous to the evaluations against aircraft measurements above, the model generally underestimated IEPOX SOA over the SE US but overestimated IEPOX SOA over the Amazon. However, the model captured the spatial variability reasonably well across several chemical regimes and the interannual variability of IEPOX SOA (R2=0.62).
A sensitivity model run with 90 % of inorganic sulfate conversion to organic sulfate over the Amazon was also evaluated (black line in Fig. S10). The overestimation of the model over the Amazon was significantly reduced and became comparable to observed IEPOX SOA concentrations. R2 was also improved to 0.83 from 0.62. Another sensitivity model run with heterogeneous OH oxidation of IEPOX SOA was also investigated (blue line in Fig. S10). Contrary to the inorganic sulfate conversion sensitivity run, heterogeneous OH oxidation did not change the model results significantly, even though we assumed 100 % loss (via fragmentation) of aged IEPOX SOA. R2 remained similar (0.62 to 0.61) as the simulated IEPOX SOA concentration changed only slightly. As shown in Fig. S11, fresh IEPOX SOA is dominant globally except over the remote ocean. This is because the IEPOX SOA lifetime against heterogeneous OH oxidation is about ∼19 d, assuming an average ambient OH concentration of 1.5×10⁶ molec. cm−3 (Hu et al., 2016), which is substantially longer than the IEPOX SOA lifetime against wet and dry deposition (∼6 d, Sect. 4).
The evaluations in this section show the challenges in accurately predicting isoprene and IEPOX SOA. The model underestimated IEPOX SOA during SEAC4RS (Fig. 1) but overestimated IEPOX SOA in the Amazon (Fig. 2). Furthermore, the model biases as a function of altitude over the Amazon were opposite to those over the SE US during SEAC4RS. Even within the SE US region, the model showed different performance for different years (Centreville, Look Rock, Atlanta, and Yorkville in Fig. 3). The apparent differences in model performance across regions, altitudes, and time periods indicate that significant complexities still exist in the ambient atmosphere for IEPOX SOA formation despite significant advances in laboratory studies. For instance, results cannot be consistently improved by adjusting single parameters like Henry's law constant, and other model processes such as vertical mixing and wet deposition may be imperfect as well. Although we implemented a new comprehensive gas-phase and heterogeneous chemistry, more studies are needed to reduce the gap between observations and models.
Three sensitivity model runs in this section indicate that the accurate prediction of aerosol composition is key for predicting IEPOX SOA. (i) If newly formed IEPOX SOA is mainly composed of semi-volatile species (e.g., 2-methyltetrols) instead of very low-volatility species (e.g., organosulfates), it is likely to undergo evaporation, and the effective IEPOX SOA yield should be decreased in the model unless the model explicitly calculates reevaporation (D'Ambro et al., 2019). (ii) In terms of model evaluation, the inclusion of organics in aerosol thermodynamic calculations (conversion of inorganic to organic sulfates) seems to be most important, as it improves the model performance in regions where the model overpredicts IEPOX SOA (e.g., the Amazon). This conversion also affects the viscosity of the organic phase and increases inhibition of the IEPOX reactive uptake rate because IEPOX-derived organosulfates have likely higher viscosity values than alpha-pinene SOA (Riva et al., 2019; Zhang et al., 2019). Although the results are significantly improved over the Amazon, this conversion will reduce IEPOX SOA concentrations in regions where the model already underestimated the IEPOX SOA concentrations (e.g., the SE US), even though the conversion fraction over the SE US is expected to be lower than that over the Amazon (Riva et al., 2019). (iii) The heterogeneous OH reaction was found to be unimportant except over remote regions due to a longer lifetime compared to other loss pathways of IEPOX SOA in the model. However, this reaction can be important in terms of aerosol–cloud interaction by changing the properties of cloud condensation or ice nuclei over remote regions. The relative contribution of fragmentation and functionalization, as well as detailed reaction mechanisms with molecular structures, should be investigated from observational studies (e.g., newly identified organosulfate molecules from Chen et al., 2020) for future IEPOX SOA models. Overall, sensitivity studies revealed that future models will need to include a more molecular-level-based treatment of SOA. However, there are many uncertain parameters that should be investigated first, such as the molecular composition of fresh and aged IEPOX SOA as well as resulting volatility, viscosity, acidity, pKa, and hygroscopicity.
Finally, we evaluated IEPOX SOA concentrations simulated by the VBS (red line in Fig. S10). The VBS scheme also showed the underestimation of IEPOX SOA over the SE US and the overestimation over the Amazon. However, the VBS scheme substantially underestimated the observed IEPOX SOA over the SE US, and the R2 value (0.42) was significantly decreased. The explicit scheme showed better performance than the VBS scheme in terms of both bias and variability.
It is worth noting that there is also a limitation with the coarse grid resolution of the global model (0.95∘ × 1.25∘) in addition to chemistry. The model representativeness may be insufficient in some observation locations. Currently, the regional refinement version of the CESM2–CAM6-chem model is under development, which can simulate air pollutants with a regionally refined grid of ∼14 km resolution or finer over the region of interest while maintaining the capability of simulating the whole globe at 1∘ resolution (Pfister et al., 2020). This multiscale model will be able to better represent specific observational sites.
We have selected the model version evaluated in this section to assess IEPOX SOA concentrations under future climatic scenarios. This version has the most comprehensive representation of gas-phase chemistry of isoprene and IEPOX heterogeneous uptake that is available to date, and it captures the measured IEPOX SOA concentrations reasonably well across different chemical regimes. The mechanistic approach included with the explicit chemistry in this model can assess the sensitivity of IEPOX SOA to multiple factors, which cannot be evaluated from widely used parameterizations such as the two-product scheme or VBS approaches, as shown below.
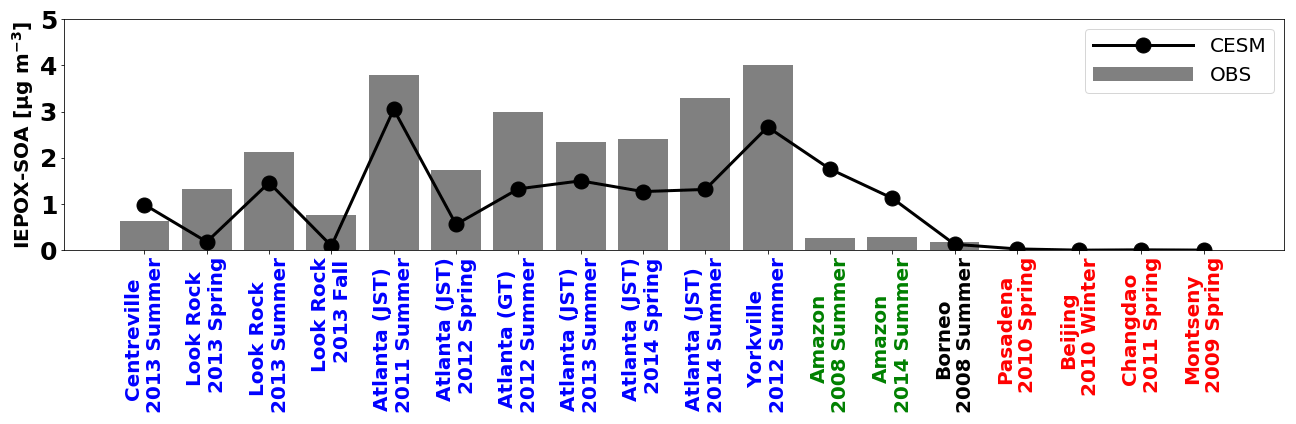
Figure 3Global surface IEPOX SOA observations (gray bar) versus the model results (solid line). Detailed information about site locations, time period, and IEPOX SOA concentrations is available in Table S2. The southeastern US, the Amazon, and urban regions are shown in blue, green, and red, respectively.
Table 1Description of IEPOX SOA simulations under present and future conditions.
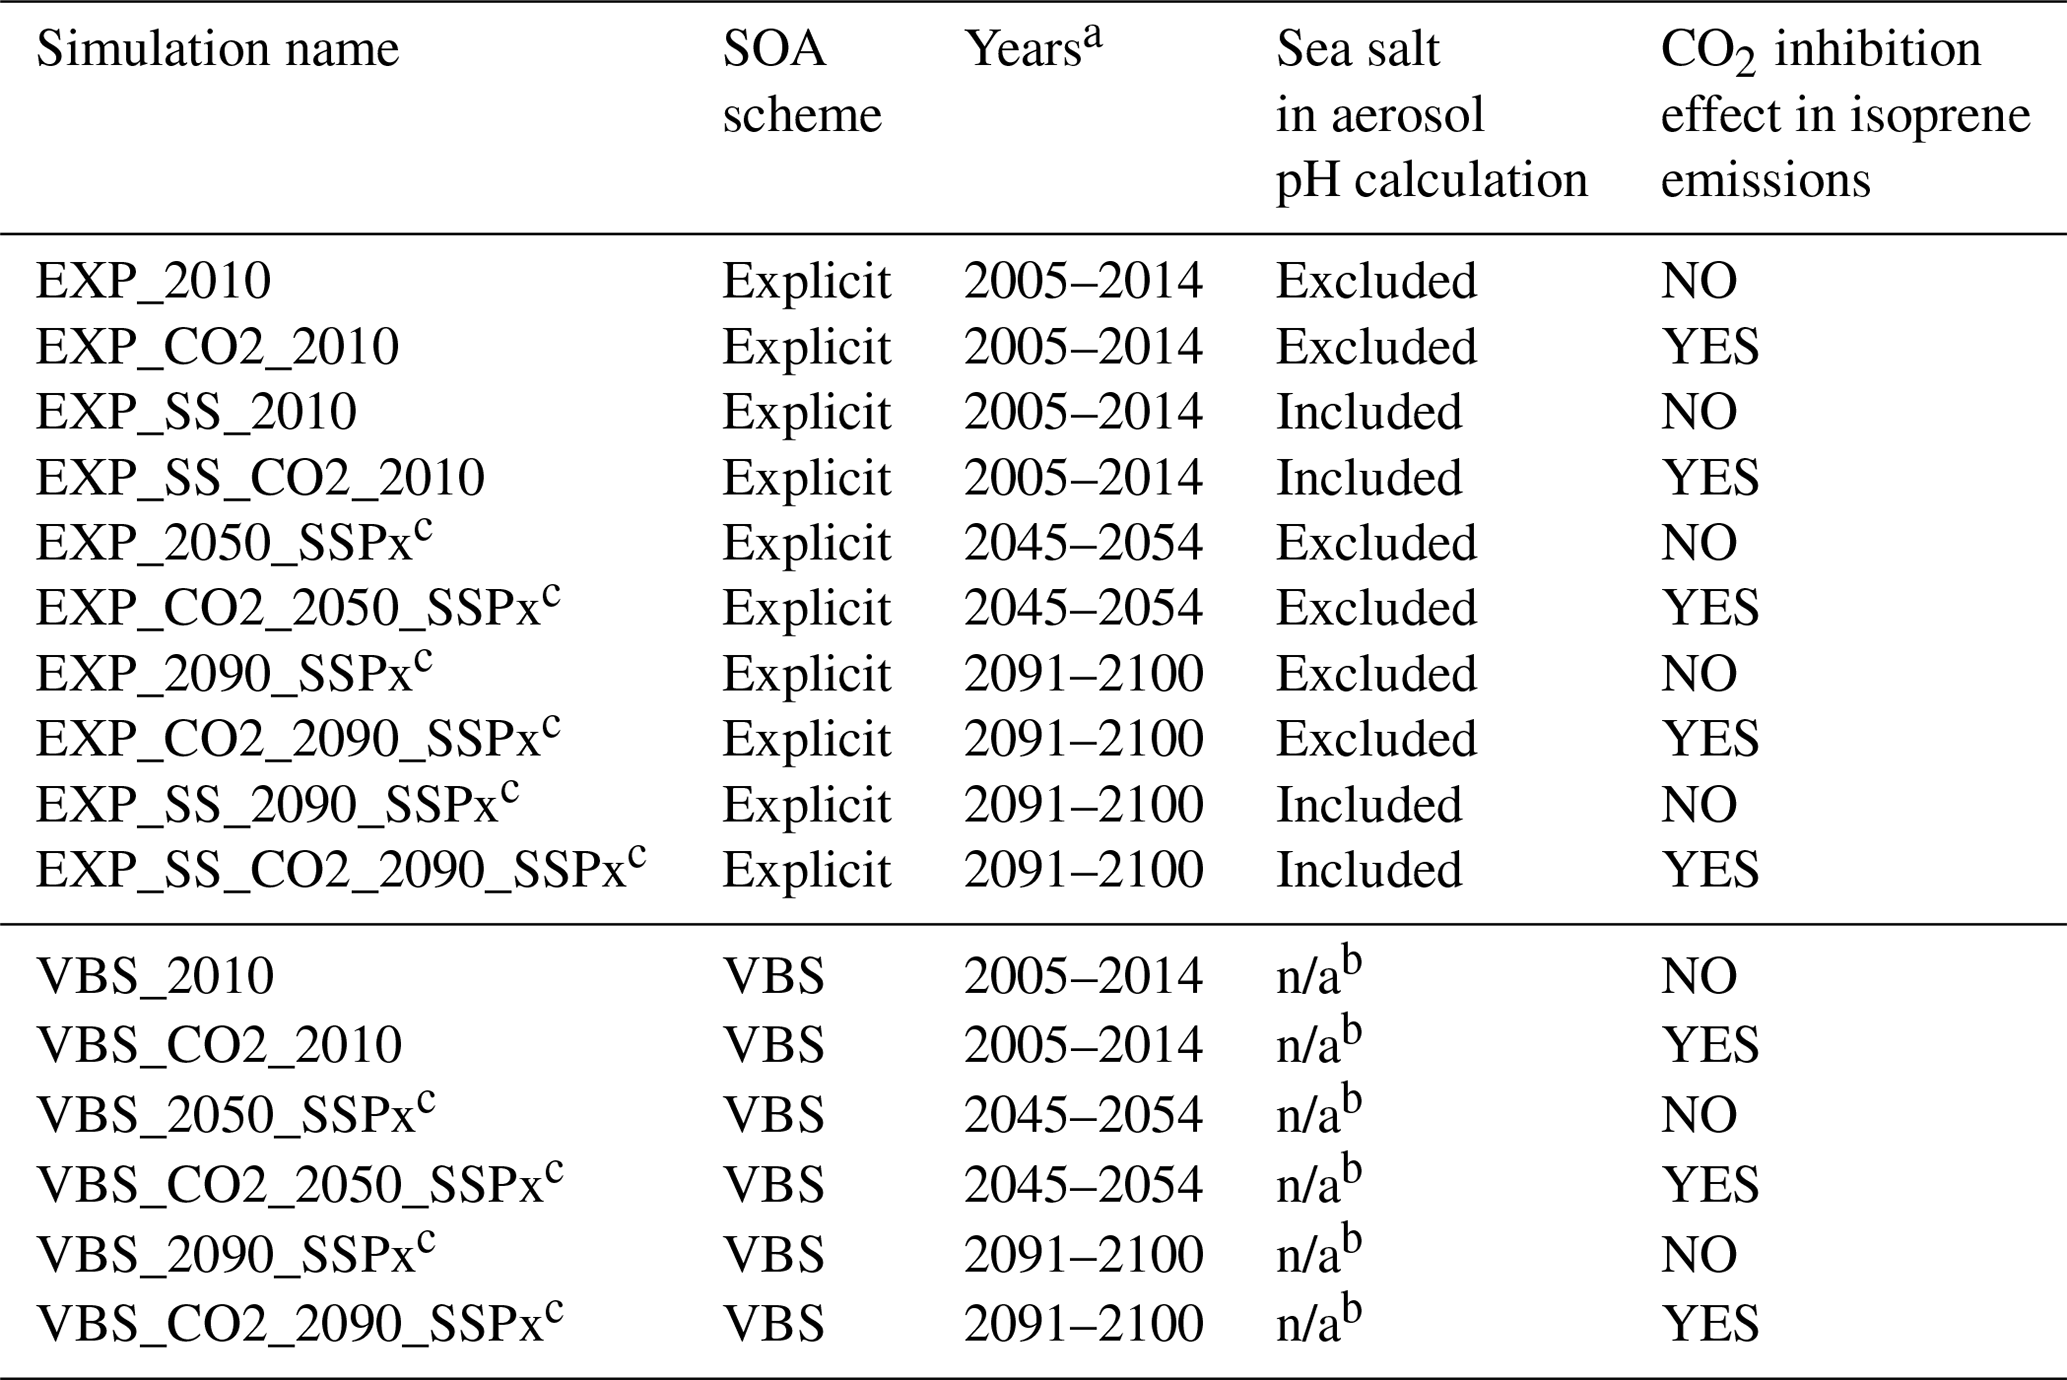
a The first 2 years were not used for analysis.
b SOA simulated by the VBS does not have a dependency on aerosol pH.
c Here x can be 5 (SSP5–8.5), 3 (SSP3–7.0), 2 (SSP2–4.5), and 1 (SSP1–2.6).
In this section, we present future IEPOX SOA concentrations predicted by the explicit chemistry using four SSP scenarios (SSP5–8.5, SSP3–7.0, SSP2–4.5, and SSP1–2.6), along with IEPOX SOA under present conditions. The characteristics of the simulations are listed in Table 1. One present (2010s) and two future (2050s and 2090s) simulations were conducted. In each set of simulations shown in Table 1, we simulated 10 years to account for interannual variability. The first 2 years were discarded as a spin-up period, and the remaining 8 years were used for the analysis. In addition to the future IEPOX SOA changes, we investigated the effects of aerosol pH (Sect. 4.2) and CO2 inhibition of isoprene emissions (Sect. 4.3) on IEPOX SOA budgets.
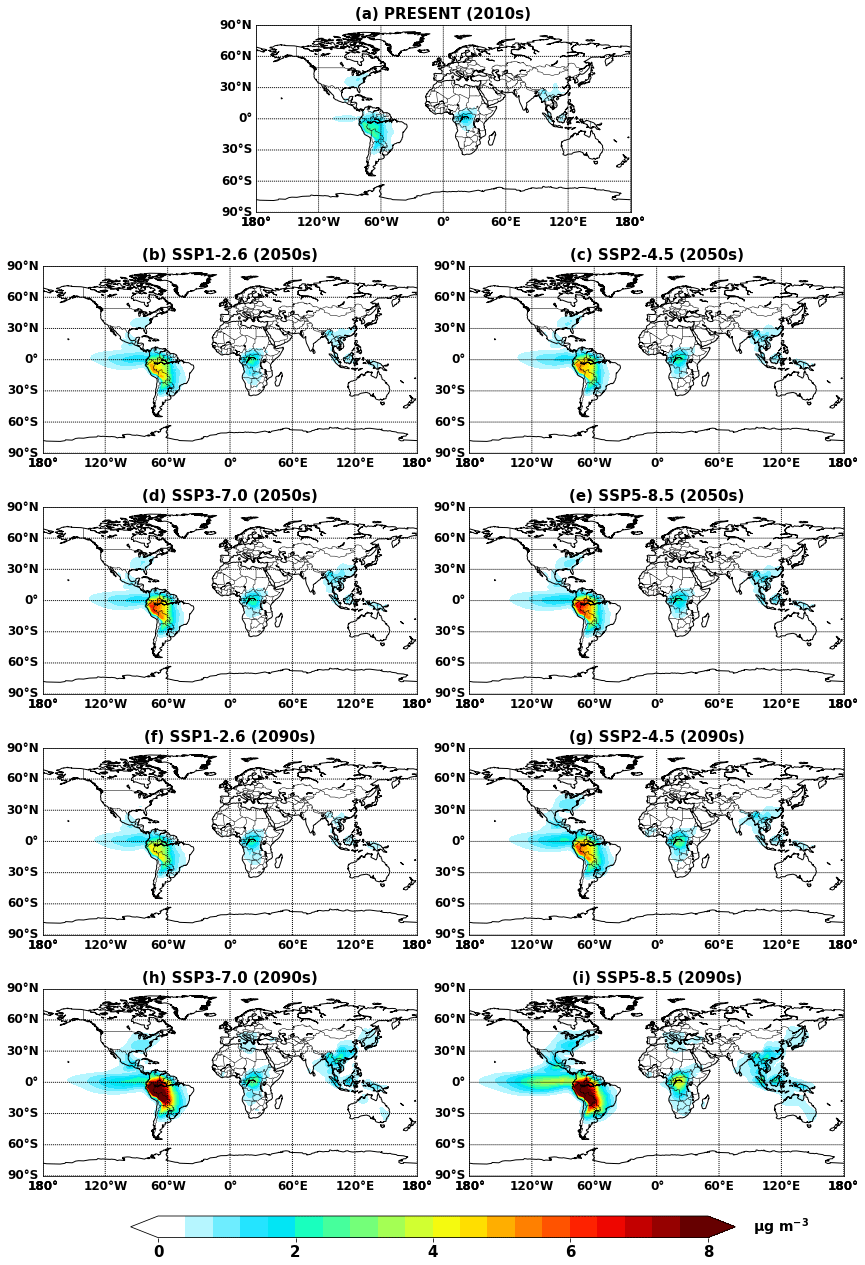
Figure 4Global mean IEPOX SOA concentrations at the surface simulated in (a) EXP_2010, (b–e) EXP_2050_SSPx, and (f–i) EXP_2090_SSPx.
4.1 IEPOX SOA changes
Figure 4 shows global mean surface concentrations of IEPOX SOA under present and future conditions for the explicit (EXP) simulations, while Fig. 5 shows IEPOX SOA changes under future climates with respect to present conditions. Generally, IEPOX SOA concentrations are predicted to increase globally, especially under high climate forcing scenarios (SSP3–7.0 and SSP5–8.5). The driving factor for increased IEPOX SOA concentrations is the increase in isoprene emissions, as shown in Fig. 6. Higher surface temperatures mainly increased isoprene future emissions under the base case simulations without CO2 inhibition (see Sect. 4.3 for a further discussion of multiple factors changing isoprene emissions under future climatic scenarios). Global mean surface temperatures were 278.8, 280.7, and 285.3 K for EXP_2010, EXP_2090_SSP1, and EXP_2090_SSP5 simulations, respectively.
The westward continental outflow from the Amazon was enhanced under all SSP scenarios as shown in Figs. 4 and 5. This was due to longer lifetimes of isoprene and its products (Fig. 6), which resulted from lower OH concentrations in future conditions (Fig. S12). Increased OH consumption by higher isoprene and decreased OH production by less NOx (Fig. S13) led to lower OH concentrations.

Figure 5Projected changes in global mean surface IEPOX SOA concentrations from present (EXP_2010) conditions to (a–d) 2050s (EXP_2050_SSPx) and (e–h) 2090s (EXP_2090_SSPx) conditions.
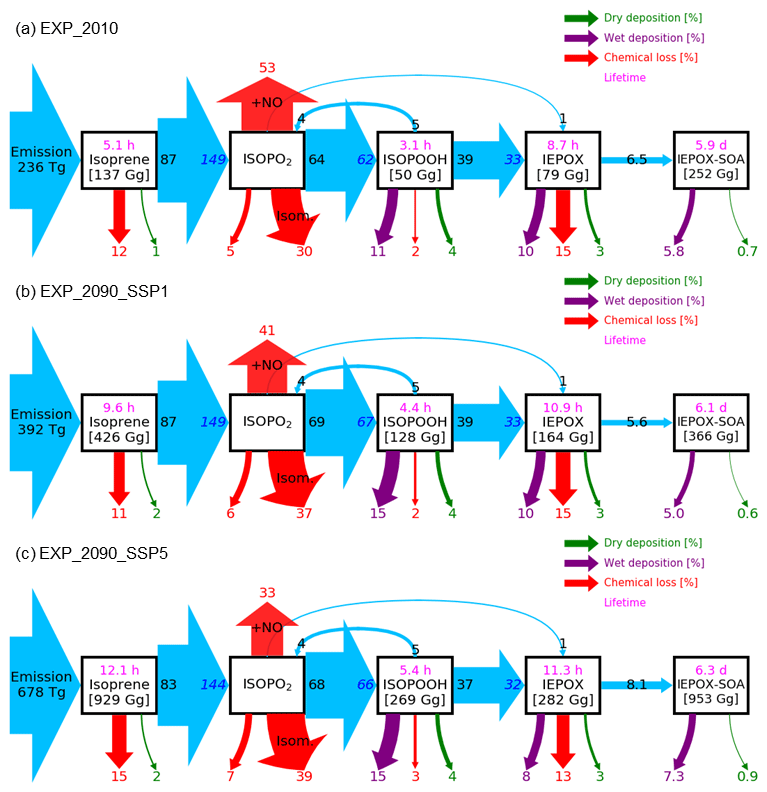
Figure 6Relative mass flux diagrams for global IEPOX SOA budget analysis in CESM2.1.0. Blue arrows represent the IEPOX SOA formation pathway. Mass fluxes (%) are calculated relative to isoprene emissions for each scenario (i.e., normalized to the isoprene emissions) and shown outside the boxes. Absolute values of mass fluxes (Tg yr−1) are presented in Fig. S14. Burdens (in Gg) are shown inside. Two flux numbers are shown if the loss amount of reactant (black number) differs from the production amount of product (blue number), which is caused by the different molecular weights and product yields. IEPOX formation initiated from the isoprene + NO3 reaction is not explicitly shown, and its amount is added to the IEPOX formation from the ISOPO2 + NO pathway. Red arrows show the chemical pathways not leading to IEPOX SOA formation. For the isoprene peroxy radical (ISOPO2), the chemical loss is separated into three categories: the reaction with NO ( + NO), isomerization (Isom.), and others. Purple and green arrows indicate wet and dry depositions, respectively. Global tropospheric burdens are shown in brackets for transported species in the model. Lifetime is shown in pink.
The fate of the isoprene peroxy radical also changed, as the relative contribution of the reaction with NO and isomerization was quite different between the present and future conditions (Fig. 6). In present conditions, the reaction with NO (53 % of the isoprene emission amount) was more dominant than the isomerization pathway (30 %). However, it was reversed under the SSP5–8.5 scenario, with the flux of the isomerization pathway (39 %) being higher than that of the reaction with NO (33 %). There were two main causes: (1) isomerization rates increase with temperature (Bianchi et al., 2019), and (2) the global mean NOx emissions decrease under all future SSP scenarios (Turnock et al., 2020).
Interestingly, the fraction of isoprene emissions leading to ISOPOOH formation did not change much (62 %–67 %), although the absolute amount increased due to the isoprene emissions increase (Fig. S14). The IEPOX formation rates from isoprene emissions were nearly constant (32 %–33 %) for present and all SSP scenarios (SSP2–4.5 and SSP3–7.0 are not shown) due to the compensating effects between factors discussed above.
The IEPOX SOA yield from isoprene emissions varied from 5.6 % (SSP1–2.6) to 8.6 % (SSP3–7.0), although IEPOX isoprene flux ratios were almost the same. Much of this difference is due to predicted changes in sulfate aerosol concentrations over the Amazon (Fig. S15). Higher sulfate concentrations over the Amazon not only increased the available surface area where IEPOX reactive uptake takes place but also enhanced aerosol acidity (reduced aerosol pH; Fig. S16), which led to faster formation of IEPOX SOA.
These findings show that IEPOX SOA formation is nonlinear. Thus, the formation cannot be easily simplified as various processes are involved, such as isoprene emissions affecting OH consumption and thus the lifetime of other chemical species, NO and temperature affecting the fate of peroxy radicals, and aerosol surface area and pH affecting IEPOX reactive uptake. In the following section (Sect. 5), we present a comparison between the explicit chemistry and the VBS approach to investigate the ability of an empirical parameterization that is typical of those currently used in most models to simulate SOA under future climates.
4.2 Effects of aerosol pH on IEPOX SOA formation
Here we discuss the effects of aerosol pH on IEPOX SOA formation by comparing EXP and EXP_SS simulations. Figure 7 shows IEPOX SOA concentrations and ratios between future and present conditions simulated by EXP_SS, which includes sea salt aerosols in the aerosol pH calculations. The predicted IEPOX SOA levels were lower in the EXP_SS than in the EXP case due to higher aerosol pH, which hindered acid-catalyzed reactions of IEPOX (Gaston et al., 2014a). Figure 8 illustrates that IEPOX SOA formations were decreased by 25 %–37 % in the EXP_SS simulation due to less acidic aerosols, even though emissions, chemistry, and deposition fluxes leading to IEPOX were almost the same compared to EXP. Most of the IEPOX SOA decreases were over the Amazon (Fig. S17) where absolute IEPOX SOA concentrations were highest (Fig. 7b–e). Aerosol pH increased mainly over the ocean but also increased over the Amazon due to the transport of sea salt aerosols by trade winds (Fig. S18). This result indicates that the accurate treatment of inorganic aerosols and their conversion to organic sulfates, as well as related thermodynamic calculations, are critically needed for the accurate simulation of organic aerosols. The different pH treatments could also impact nitrate formation; the accumulation-mode nitrate burden was reduced by 19 % in EXP_SS (14.8 GgN) compared to EXP (18.2 GgN).
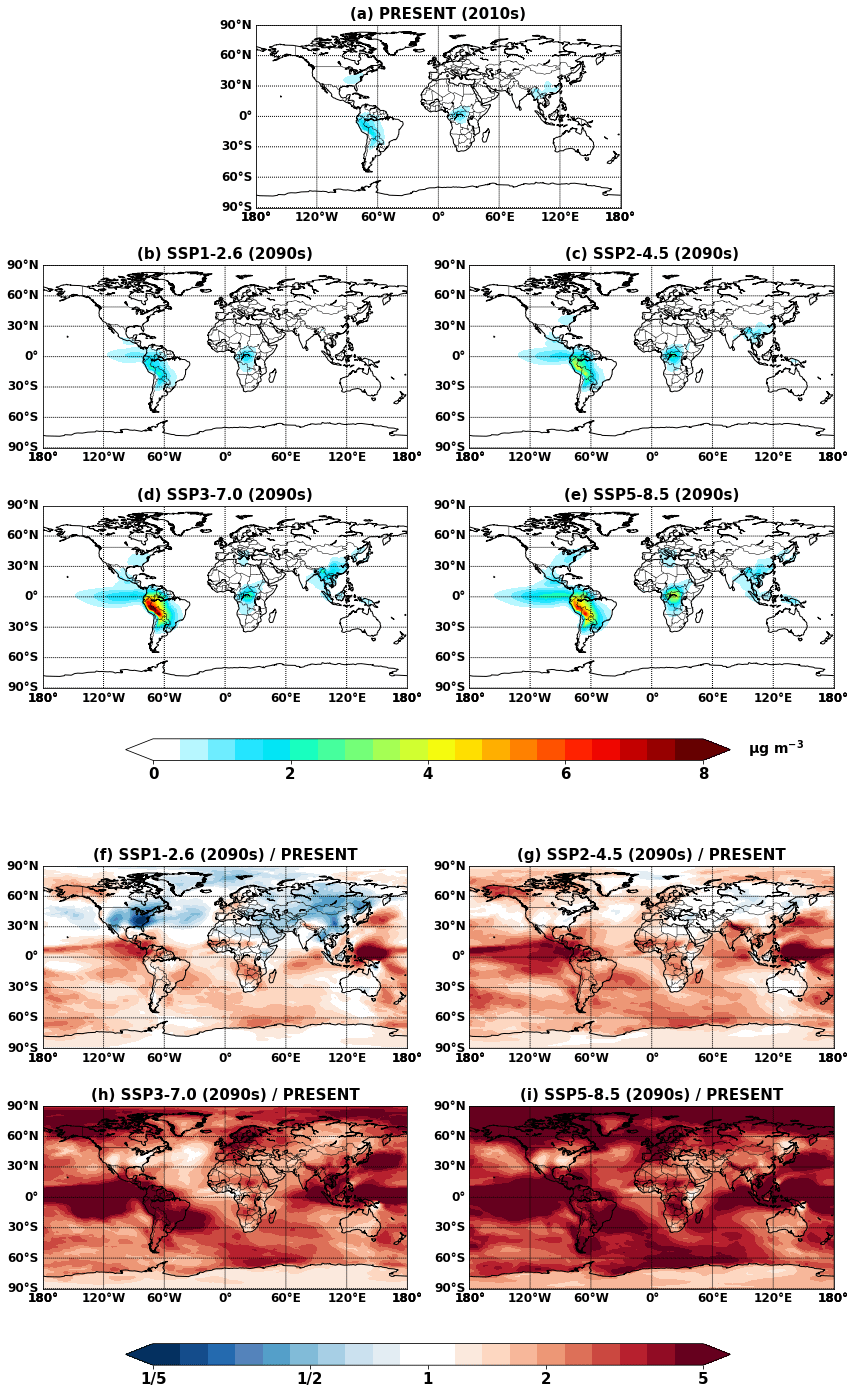
Figure 7Global mean IEPOX SOA concentrations at the surface simulated in (a) Explicit_SS_2010 and (b–e) Explicit_ SS_ 2090_SSPx. (f–i) Ratios of IEPOX SOA between future (b–e) and present (a) conditions.
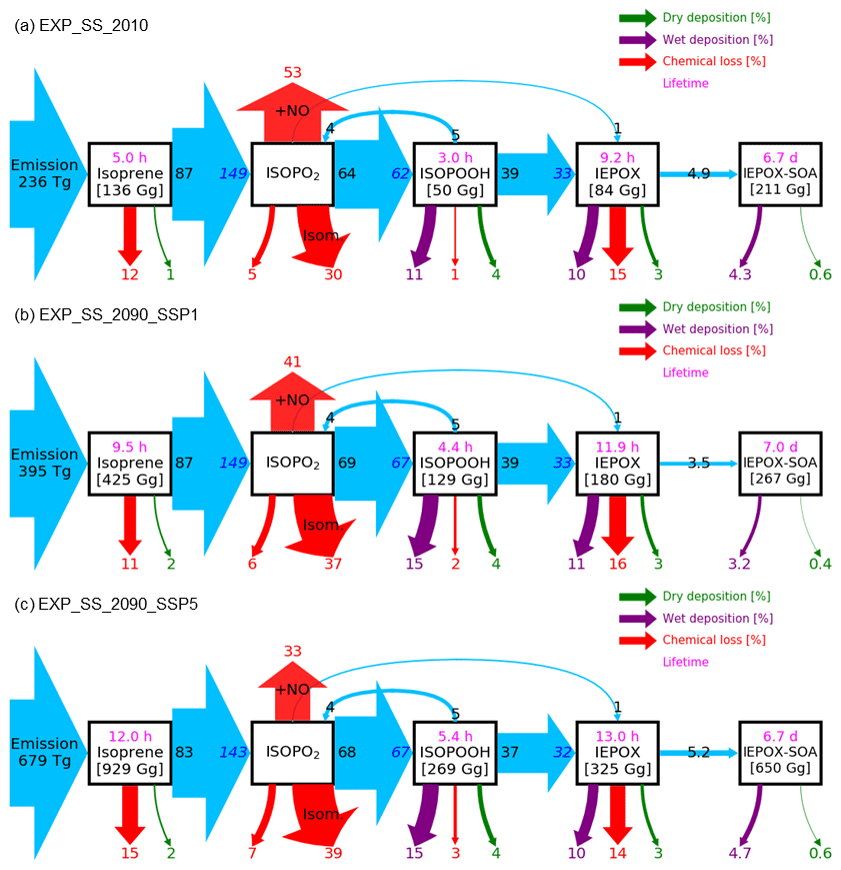
Figure 8Same as Fig. 6 but for EXP_SS simulations (including sea salt in aerosol pH calculation).
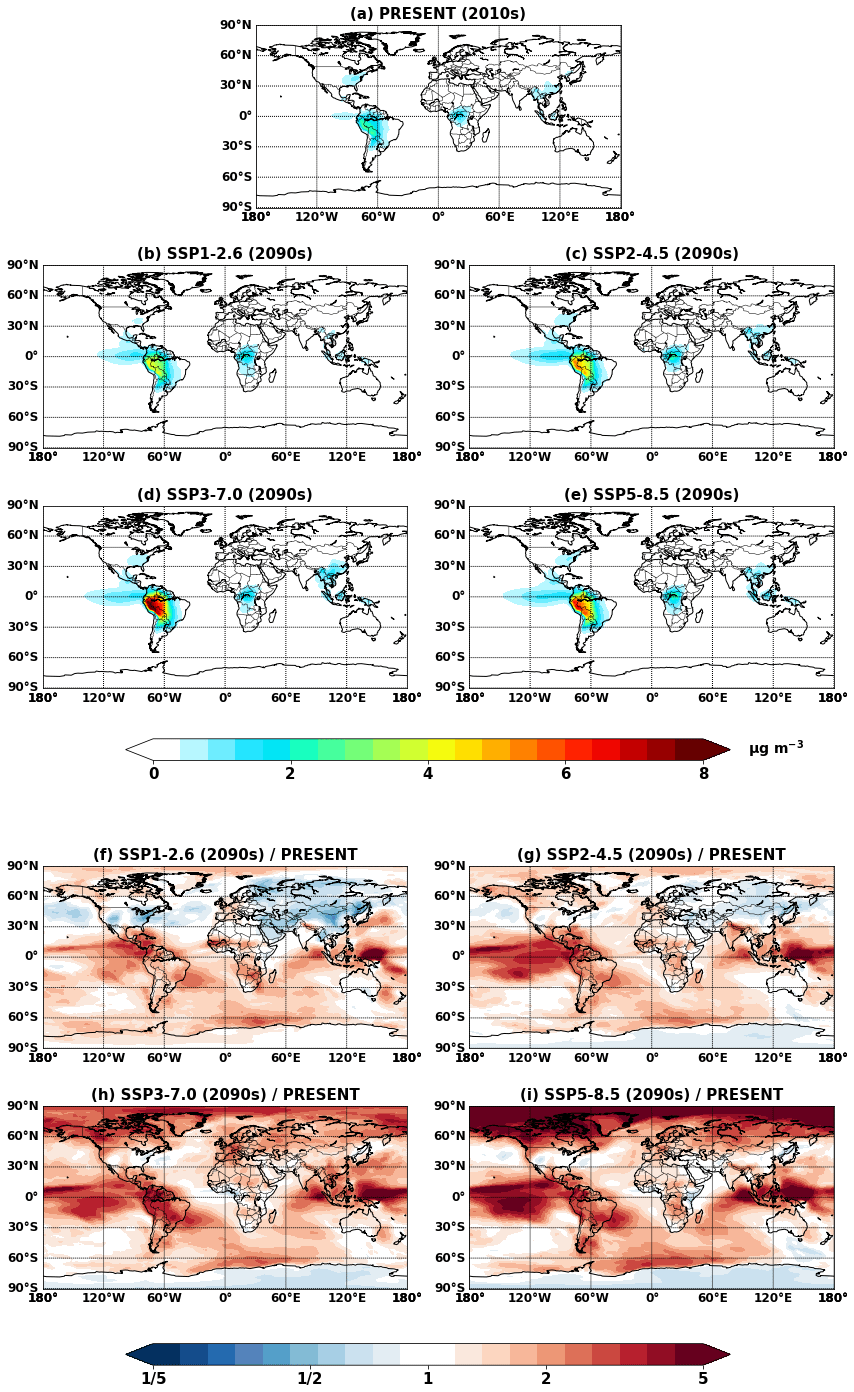
Figure 9Global mean IEPOX SOA concentrations at the surface simulated in (a) Explicit_CO2_2010 and (b–e) Explicit_ CO2_ 2090_SSPx. (f–i) Ratios of IEPOX SOA between future (b–e) and present (a) conditions.
4.3 Isoprene emission and IEPOX SOA changes with CO2 inhibition effects
As discussed in Sect. 2.2.3, the CO2 inhibition effect on isoprene emissions is especially important for predicting future climate, but large uncertainties exist. We examined the predicted IEPOX SOA concentrations with CO2 inhibition (EXP_CO2) and compared to the cases without CO2 inhibition (EXP). Predicted global mean surface IEPOX SOA concentrations in present and future (2090s) conditions are presented in Fig. 9a–e along with relative changes in the future compared to the present conditions (Fig. 9f–i). While aerosol pH affected IEPOX SOA in all the simulations including present conditions (Sect. 4.2), CO2 inhibition played a critical role only in future simulations with higher CO2 concentrations. As shown in Fig. 10, global isoprene emissions in EXP_CO2_2090 simulations were substantially lower than in EXP_2090 simulations (Fig. 6), especially for the SSP5–8.5 scenario with high CO2 (53 % decrease). Consequently, the annual IEPOX SOA formation fluxes were also reduced to 24.7 Tg yr−1 (EXP_2090_CO2) from 55.0 Tg yr−1 (EXP_2090) for the SSP5–8.5 scenario. Global surface IEPOX SOA concentrations were also decreased due to CO2 inhibition across all SSP scenarios with higher relative changes for SSP3–7.0 and SSP5–8.5 (Fig. S19).

Figure 10Same as Fig. 6 but for EXP_CO2 simulations (CO2 inhibition effect is taken into account).
Isoprene emission calculations by MEGANv2.1 are based on a simple mechanistic model that considers the major processes driving variations by using activity factors (Guenther et al., 2012). We broke down activity factor changes under SSP1–2.6 (Fig. S20) and SSP5–8.5 (Fig. S21) with respect to present conditions. The main driving factor in the isoprene emission increase was the response to temperature, although both LAI and light factors also contributed to the emission increase. On the other hand, CO2 inhibition counteracted the temperature effect, surpassing it especially for the SSP5–8.5 scenario.
Isoprene emission changes due to CO2 inhibition also affected chemistry. Lifetimes of IEPOX SOA precursors were decreased drastically under the SSP5–8.5 scenario when CO2 inhibition was included in the isoprene emission calculation (EXP_CO2, Fig. 10). This was due to higher OH concentrations in EXP_CO2 caused by less OH consumption by isoprene and its products (Fig. S22). The change increased as the forcing (CO2) increased. It also affected the relative changes in IEPOX SOA concentrations between future and present conditions, which has important implications for high forcing scenarios (SSP3–7.0 and SSP5–8.5).
In this section, we examine isoprene SOA and its future changes with the VBS approach (VBS case) and compare it against IEPOX SOA with explicit chemistry (EXP case). The VBS approach only simulates total isoprene SOA and does not separate IEPOX SOA (Tilmes et al., 2019). Because IEPOX SOA is mostly formed by the isoprene + OH reaction pathway, here we only considered isoprene SOA formed via the isoprene + OH VBS reaction pathway. The VBS SOA from isoprene + O3 and isoprene + NO3 pathways was excluded in the analysis, although it was included in the model simulation. Hereafter, we refer to isoprene SOA as VBS SOA from the isoprene + OH pathway simulated by the VBS in order to distinguish it from IEPOX SOA simulated by the explicit chemistry.

Figure 11Global mean isoprene SOA concentrations at the surface simulated in (a) VBS_2010 and (b–e) VBS_2090_SSPx. (f–i) Ratios of isoprene SOA between future (b–e) and present (a) conditions.
Figure 11 shows the VBS SOA and its change in the future. The VBS scheme captured global spatial patterns of isoprene SOA, although absolute magnitudes were lower than IEPOX SOA. VBS SOA was generally predicted to increase under the future climate, which was also analogous to the IEPOX SOA change (Fig. 5). However, the concentration changes in the future were regionally different. The model with the explicit chemistry predicted the IEPOX SOA concentration decrease in the 2090s under the SSP1–2.6 scenario over midlatitudes in the Northern Hemisphere, but the model with the VBS SOA predicted an increase. As a result, VBS SOA over the eastern US was lower than IEPOX SOA in present conditions but higher in the 2090s under the SSP1–2.6 scenario, as shown in Fig. 12. This was because the explicit chemistry took into account aerosol surface area and pH that were less favorable for IEPOX SOA formation under the SSP1–2.6 scenario, but the VBS does not consider aerosol properties in SOA formation (other than OA mass).
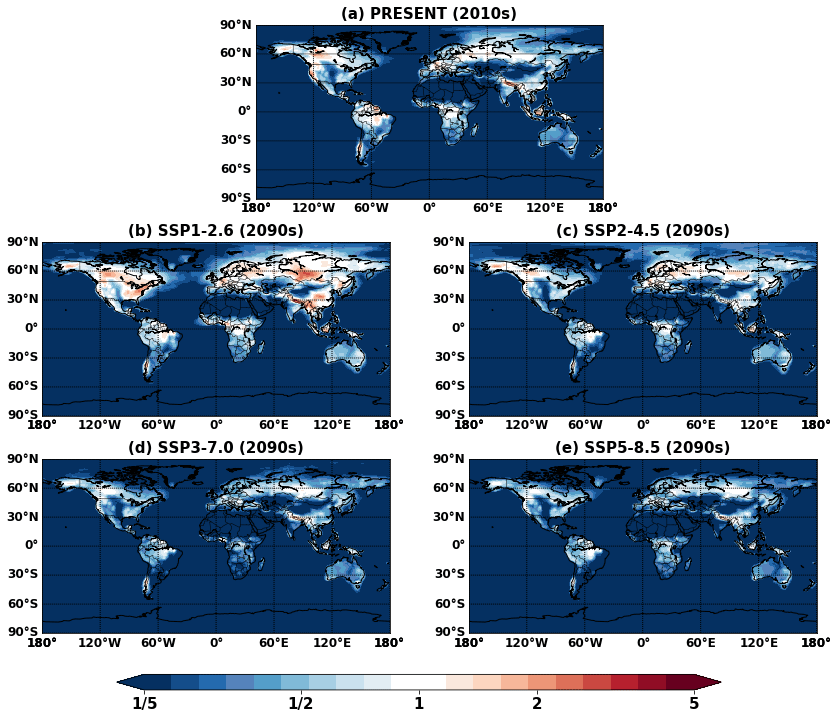
Figure 12Global ratio maps of surface isoprene SOA simulated by the VBS (VBS) to IEPOX SOA simulated by the explicit chemistry (EXP) for (a) present (2010s) and (b–e) future (2090s) conditions.
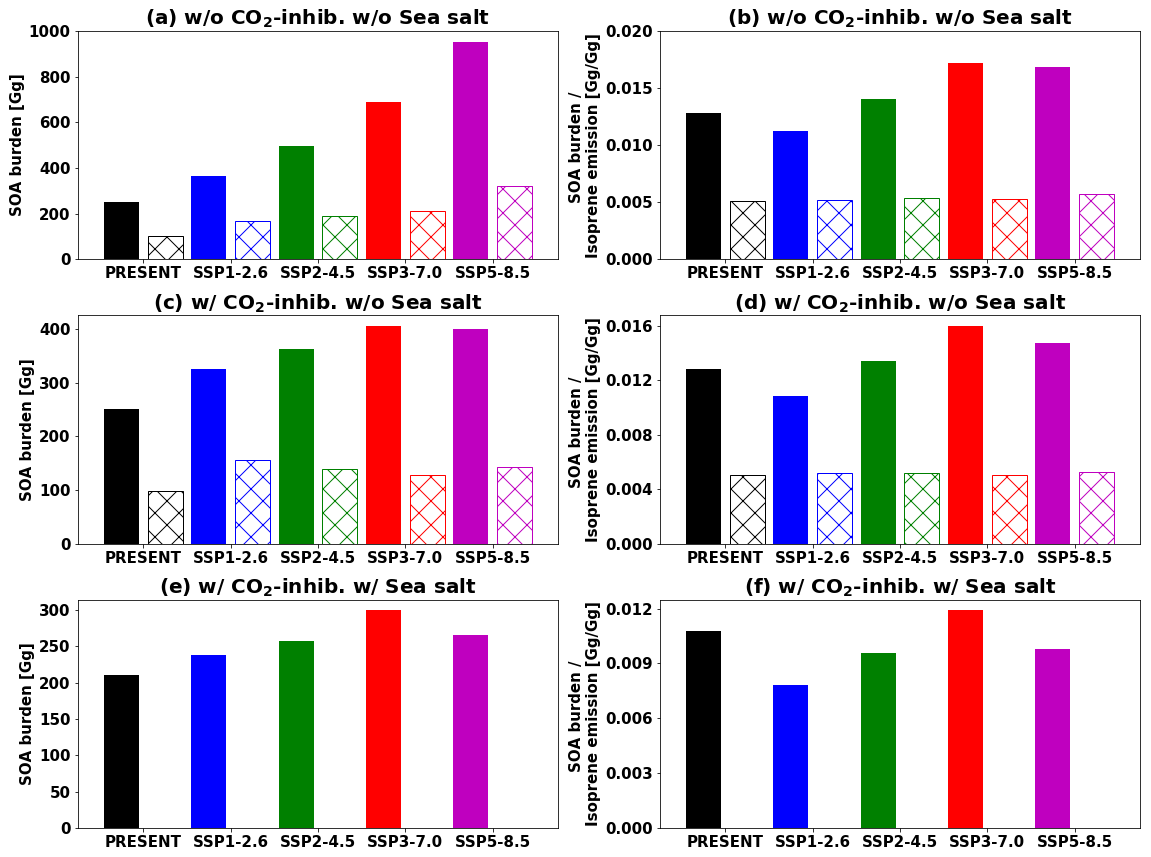
Figure 13Global tropospheric SOA burden (a, c, e) and SOA burden divided by annual isoprene emissions (b, d, f). IEPOX SOA simulated by the explicit chemistry and isoprene SOA simulated by the VBS are shown as filled and hatched bars, respectively. Values in the future are for the 2090s. (a–b) EXP and VBS. (c–d) EXP_CO2 and VBS_CO2. (e–f) EXP_ SS_CO2. The VBS SOA is not included in (e–f) as we did not have a simulation for the corresponding case (sea salt included in aerosol pH calculation and CO2 inhibition effect considered).
VBS SOA decreased over central Africa under the SSP3–7.0 scenario (Fig. 11h), which cannot be seen in the explicit chemistry (Fig. 5g). SSP3–7.0 was the scenario with the highest NOx emissions among all SSP scenarios (Turnock et al., 2020), and the NOx concentration was predicted to increase over central Africa (Fig. S13). The VBS SOA yields are lower in the high-NOx pathway than in the low-NOx pathway (Hodzic et al., 2016), which resulted in the VBS SOA decrease over Africa. On the other hand, the model with explicit chemistry predicted a slight increase in IEPOX SOA over central Africa under SSP3–7.0. The NOx dependency considered in the VBS also applied to the explicit chemistry, but again, the explicit chemistry has other dependencies such as aerosol surface area and pH. The increase in the sulfate aerosol concentration over Africa (Fig. S15) promoted IEPOX reactive uptake in the explicit chemistry, while the VBS SOA did not have this dependency.
Figure 12 indicates that isoprene SOA was exceedingly low compared to IEPOX SOA except for source regions. This result was consistent with Jo et al. (2019), who used the GEOS-Chem chemical transport model (see Fig. 3c in their paper). The main reason was that IEPOX SOA was non-volatile, but the VBS simulated most of the semi-volatile products as gas phase rather than aerosol phase, especially for remote regions (Jo et al., 2019). Therefore, both schemes simulated comparable results in high-aerosol-loading conditions including urban (e.g., the eastern US, Asia) and biogenic-dominated regions (e.g., the Amazon, Borneo), while the VBS predicted very low IEPOX SOA concentrations in most regions with low aerosol levels. As a result, global tropospheric burdens of isoprene SOA were lower than those of IEPOX SOA (e.g., 252 and 101 Gg for IEPOX SOA and isoprene SOA in present conditions, respectively).
Figure 13 represents the global tropospheric burdens of IEPOX SOA and isoprene SOA across different model configurations and future climatic scenarios. The inclusion of CO2 inhibition greatly reduced the IEPOX SOA burden under high forcing scenarios, with 1 %, 11 %, 27 %, 41 %, and 58 % reductions for the present, SSP1–2.6, SSP2–4.5, SSP3–7.0, and SSP5–8.5 scenarios, respectively. The VBS SOA also showed a similar tendency as it followed isoprene emissions, with 2 %, 8 %, 27 %, 39 %, and 55 % reductions for the present, SSP1–2.6, SSP2–4.5, SSP3–7.0, and SSP5–8.5 scenarios, respectively. However, the VBS SOA did not have additional reductions caused by aerosol pH changes (16 %–33 % reductions) due to a lack of aerosol pH dependency.
Isoprene emissions were the main driving factor of IEPOX SOA burden differences between the SSP scenarios, but Fig. 13 (right column) also shows that chemistry was important, which can change the SOA burden per unit of isoprene emission by up to 50 % (SSP3–7.0 vs SSP1–2.6). However, the values were nearly constant when it comes to the VBS. This suggests that the detailed chemistry should be included for more accurate SOA sensitivity in models.

Figure 14Regression slope and R2 values between IEPOX SOA (or VBS SOA) concentrations at the surface and isoprene emissions. Monthly mean values at each model grid point were used for the calculation. The different symbols indicate the different model configurations, with filled symbols for the 2090s and open symbols for the 2050s. The colors represent the SSP scenarios (or present conditions) as shown in the legend.
We further investigated the SOA sensitivities against emissions in different model configurations, as depicted in Fig. 14. For each model configuration in Table 1, we calculated the regression slope and R2 values between monthly gridded IEPOX SOA (isoprene SOA) concentrations at the surface and isoprene emissions. Similar to the metric (burden emission) in Fig. 13, the VBS showed a very narrow range of regression slopes. R2 values of the VBS cases were higher than those of the explicit chemistry, which means isoprene SOA generally followed isoprene emissions with little nonlinearity. Lower R2 implies other dependencies in simulating SOA concentrations in addition to isoprene emissions. Regression slopes of the models with sea salt in the aerosol pH calculation were lower because of less acidic conditions. CO2 inhibition also affected the regression slopes under the SSP3–7.0 and SSP5–8.5 scenarios. Higher isoprene emissions without CO2 inhibition made longer lifetimes of IEPOX SOA precursors (Sect. 4.3) and resulted in more IEPOX SOA in downwind regions. As a result, the regression slopes without CO2 inhibition were lower than with CO2 inhibition due to lower IEPOX SOA concentrations above isoprene emission source regions. These effects were not apparent in the VBS models.
Current climate models rely on parameterizations to predict SOA due to complex nonlinear chemistry affecting SOA formation. Thanks to recent progress in the mechanistic understanding of SOA formation from combined laboratory, field, and modeling studies, chemistry models have started to include explicit SOA mechanisms for a few SOA species including IEPOX SOA. Here, we implemented a detailed chemical mechanism to explicitly simulate IEPOX SOA in CESM2.1.0. We investigated future IEPOX SOA changes under four Tier 1 SSP scenarios using the explicit chemical mechanism and the VBS parameterization.
First, we evaluated the modeled IEPOX SOA against aircraft campaigns over the SE US and the Amazon as well as global surface observations measured by AMS. The explicit treatment of IEPOX chemistry better captured both absolute concentrations and spatial–temporal variabilities than the VBS scheme. However, there is still room for improvement, as the model underestimated the observed IEPOX SOA over the SE US, while it was overestimated over the Amazon. We further conducted sensitivity model runs to investigate the effects of recent findings from laboratory studies on modeled IEPOX SOA concentrations. We concluded that a more detailed representation of IEPOX SOA molecular tracers is needed for future models because the chemical composition of IEPOX SOA determines volatility, aerosol pH, coating, and viscosity, and in turn it affects the formation of IEPOX SOA.
IEPOX SOA concentrations were generally predicted to increase under the SSP scenarios. Isoprene emission change was the primary factor driving IEPOX SOA change. OH consumption by enhanced isoprene emissions increased the lifetimes of IEPOX SOA precursors, resulting in more IEPOX SOA in downwind regions. The CO2 inhibition effect on isoprene emissions became highly influential for high forcing SSP scenarios (SSP3–7.0 and SSP5–8.5); more studies are needed to reduce the high uncertainty related to this effect in future conditions. Aerosol properties (surface area and pH) were an important factor affecting IEPOX SOA. IEPOX SOA concentrations were decreased over the Northern Hemisphere midlatitudes, especially under SSP1–2.6. This was caused by the reduced sulfate aerosols compared to present conditions and in turn the reduced aerosol surface area and acidity.
We further predicted isoprene SOA concentrations using the VBS scheme. The VBS scheme also simulated the overall increase in isoprene SOA in the future, mainly due to increased isoprene emissions. VBS SOA concentrations were decreased over central Africa under the SSP3–7.0. Increased NOx concentrations in this region reduced the SOA yield because SOA yields from the high-NOx pathway are lower than from the low-NOx pathway. A NOx dependency was also included in the explicit chemistry mechanism. However, the explicit chemistry further included other dependencies such as aerosol acidity, leading to the opposite trend – the explicit chemistry predicted the slight increase in IEPOX SOA over central Africa.
Our base model with the explicit chemistry predicted IEPOX SOA increases in the 2090s of 45 %, 97 %, 173 %, and 278 % under SSP1–2.6, SSP2–4.5, SSP3–7.0, and SSP5–8.5, respectively. For SSP1–2.6, the predicted increase was lower than the isoprene emissions (66 %) and the VBS SOA (68 %) increases. On the other hand, the base model simulated a higher IEPOX SOA increase than isoprene emissions (187 %) and the VBS SOA changes (218 %) under SSP5–8.5. This is because the explicit chemistry simulated 50 % differences across different SSP scenarios, but the VBS scheme simulated nearly constant values in terms of the ratio of global SOA burden to isoprene emissions. Therefore, IEPOX SOA changes in previous studies that have used the VBS or two-product schemes were likely overestimated under future scenarios with strong emission reductions (e.g., SSP1–2.6), while they were likely underestimated under future scenarios with weak regulations (e.g., SSP3–7.0).
The SOA parameterization involves assumptions, inevitably leaving out some chemistry. This can be negligible in simulating present conditions but can become important under future climate with different emissions and meteorological conditions. Climate models have been improved in terms of resolution thanks to recent growth in computational power and parallel computing methods. In addition to the higher spatial and temporal resolution of climate models, detailed explicit chemistry is also essential for the correct simulation of aerosols and, in turn, radiation and clouds in climate models. Indeed, Sporre et al. (2020) showed that BVOC SOA treatment in Earth system models can have a substantial impact on the modeled climate, but the sensitivity varies greatly between the models. With the new development of measurements of the SOA formation mechanism from other compounds in the laboratory, the detailed explicit chemistry of SOA will be available. It would be recommended for climate models to use more comprehensive chemistry, or parameterizations with the correct physicochemical dependencies, to more correctly simulate the sensitivity of SOA in future climatic conditions, which often dominates submicron particulate matter mass.
CESM2.1.0 is publicly available at https://github.com/ESCOMP/CESM (CESM, 2021). The code updates (isoprene gas-phase mechanism, MOSAIC module, IEPOX SOA, and NOx-dependent yield of VBS SOA) in this work will be made available as a new compset in future releases of CESM (CESM2.2 and CESM2.3). SEAC4RS measurements are available at https://www-air.larc.nasa.gov/missions/seac4rs/ (SEAC4RS science team, 2013). GoAmazon measurements are available on the Atmospheric Radiation Measurement (ARM) data website: https://www.arm.gov/research/campaigns/amf2014goamazon (GoAmazon science team, 2014). ACRIDICON-CHUVA measurements are available on the HALO database: https://halo-db.pa.op.dlr.de/ (ACRIDICON-CHUVA science team, 2014). Surface IEPOX SOA measurements are available in the Supplement to this paper. Model simulation results are available on the NCAR Digital Asset Service Hub (DASH) at https://doi.org/10.5065/7873-2z88 (Jo et al., 2021).
The supplement related to this article is available online at: https://doi.org/10.5194/acp-21-3395-2021-supplement.
DSJ, AH, LKE, and JLJ designed and performed the research. DSJ performed all model simulations with help from AH, LKE, ST, and MJM. RHS updated the isoprene gas-phase chemistry in CESM. PCJ and JLJ analyzed the measurements. RAZ, RCE, BS, and ZL implemented the MOSAIC module in CESM. WH, CS, JS, JES, AW, PCJ, and JLJ provided observations used in the evaluation of the model. All authors contributed to the review and editing of the paper.
The authors declare that they have no conflict of interest.
This research was supported by grants EPA STAR 83587701-0, DOE (BER, ASR program) DE-SC0016559, NASA 80NSSC18K0630, and NSF AGS-1822664. Duseong S. Jo was partially supported by an NCAR Advanced Study Program postdoctoral fellowship. Alma Hodzic was supported by DOE ASR grant DE-SC0016331. Balwinder Singh, John E. Shilling, Rahul A. Zaveri, and Richard C. Easter were supported by the US Department of Energy, Office of Biological and Environmental Research as part of the Atmospheric System Research (ASR) and Energy Exascale Earth System Model (E3SM) programs; data from the Atmospheric Radiation Measurement (ARM) user facility, a DOE Office of Science user facility, were utilized. The Pacific Northwest National Laboratory (PNNL) is operated for the DOE by the Battelle Memorial Institute under contract DE-AC05-76RLO1830. Isoprene measurements during SEAC4RS were supported by the Austrian Federal Ministry for Transport, Innovation and Technology (bmvit) through the Austrian Space Applications Programme (ASAP) of the Austrian Research Promotion Agency (FFG). The ACRIDICON-CHUVA aircraft measurements were supported by the Max Planck Society, the German Science Foundation DFG (HALO-SPP 1294, SCHN1138/1-2), and the German Ministry of Research BMBF under grant no. 01LG1205E (ROMIC-SPITFIRE). We thank Jason M. St. Clair, John D. Crounse, and Paul O. Wennberg for ISOPOOH and IEPOX measurements during SEAC4RS. Data from the Caltech CIMS used in this analysis were made possible with support from NASA – NNX12AC06G. We acknowledge high-performance computing support from Cheyenne (https://doi.org/10.5065/D6RX99HX) provided by NCAR's Computational and Information Systems Laboratory, sponsored by the National Science Foundation. We thank Kelvin Bates and Loretta Mickley of Harvard, Alex Guenther of the University of California Irvine, and Eloise Marais of the University of Leicester for useful discussions.
This research has been supported by the U.S. Environmental Protection Agency (grant no. EPA STAR 83587701-0), the U.S. Department of Energy (grant nos. DE-SC0016559, DE-SC0016331, and DE-AC05-76RLO1830), the National Aeronautics and Space Administration (grant nos. 80NSSC18K0630 and NNX12AC06G), the National Science Foundation (grant no. AGS-1822664), the National Center for Atmospheric Research (Advanced Study Program and Cheyenne (https://doi.org/10.5065/D6RX99HX)), the German Science Foundation (grant no. DFG (HALO-SPP 1294, SCHN1138/1-2)), and the German Ministry of Research (ROMIC-SPITFIRE (grant no. 01LG1205E)).
This paper was edited by Jason Surratt and reviewed by two anonymous referees.
ACRIDICON-CHUVA science team: ACRIDICON-CHUVA campaign dataset, available at: https://halo-db.pa.op.dlr.de/ (last access: 1 March 2021), 2014.
Anttila, T., Kiendler-Scharr, A., Tillmann, R., and Mentel, T. F.: On the reactive uptake of gaseous compounds by organic-coated aqueous aerosols: theoretical analysis and application to the heterogeneous hydrolysis of N2O5, J. Phys. Chem. A, 110, 10435–10443, 2006.
Barkley, M. P., Smedt, I. D., Van Roozendael, M., Kurosu, T. P., Chance, K., Arneth, A., Hagberg, D., Guenther, A., Paulot, F., Marais, E., and Mao, J.: Top-down isoprene emissions over tropical South America inferred from SCIAMACHY and OMI formaldehyde columns, J. Geophys. Res.-Atmos., 118, 6849–6868, 2013.
Batista, C. E., Ye, J., Ribeiro, I. O., Guimarães, P. C., Medeiros, A. S. S., Barbosa, R. G., Oliveira, R. L., Duvoisin Jr., S., Jardine, K. J., Gu, D., Guenther, A. B., McKinney, K. A., Martins, L. D., Souza, R. A. F., and Martin, S. T.: Intermediate-scale horizontal isoprene concentrations in the near-canopy forest atmosphere and implications for emission heterogeneity, P. Natl. Acad. Sci. USA, 116, 19318–19323, 2019.
Bauwens, M., Stavrakou, T., Müller, J.-F., De Smedt, I., Van Roozendael, M., van der Werf, G. R., Wiedinmyer, C., Kaiser, J. W., Sindelarova, K., and Guenther, A.: Nine years of global hydrocarbon emissions based on source inversion of OMI formaldehyde observations, Atmos. Chem. Phys., 16, 10133–10158, https://doi.org/10.5194/acp-16-10133-2016, 2016.
Bauwens, M., Stavrakou, T., Müller, J.-F., Van Schaeybroeck, B., De Cruz, L., De Troch, R., Giot, O., Hamdi, R., Termonia, P., Laffineur, Q., Amelynck, C., Schoon, N., Heinesch, B., Holst, T., Arneth, A., Ceulemans, R., Sanchez-Lorenzo, A., and Guenther, A.: Recent past (1979–2014) and future (2070–2099) isoprene fluxes over Europe simulated with the MEGAN–MOHYCAN model, Biogeosciences, 15, 3673–3690, https://doi.org/10.5194/bg-15-3673-2018, 2018.
Bian, H., Chin, M., Hauglustaine, D. A., Schulz, M., Myhre, G., Bauer, S. E., Lund, M. T., Karydis, V. A., Kucsera, T. L., Pan, X., Pozzer, A., Skeie, R. B., Steenrod, S. D., Sudo, K., Tsigaridis, K., Tsimpidi, A. P., and Tsyro, S. G.: Investigation of global particulate nitrate from the AeroCom phase III experiment, Atmos. Chem. Phys., 17, 12911–12940, https://doi.org/10.5194/acp-17-12911-2017, 2017.
Bianchi, F., Kurtén, T., Riva, M., Mohr, C., Rissanen, M. P., Roldin, P., Berndt, T., Crounse, J. D., Wennberg, P. O., Mentel, T. F., Wildt, J., Junninen, H., Jokinen, T., Kulmala, M., Worsnop, D. R., Thornton, J. A., Donahue, N., Kjaergaard, H. G., and Ehn, M.: Highly Oxygenated Organic Molecules (HOM) from Gas-Phase Autoxidation Involving Peroxy Radicals: A Key Contributor to Atmospheric Aerosol, Chem. Rev., 119, 3472–3509, 2019.
Bondy, A. L., Bonanno, D., Moffet, R. C., Wang, B., Laskin, A., and Ault, A. P.: The diverse chemical mixing state of aerosol particles in the southeastern United States, Atmos. Chem. Phys., 18, 12595–12612, https://doi.org/10.5194/acp-18-12595-2018, 2018.
Budisulistiorini, S. H., Nenes, A., Carlton, A. G., Surratt, J. D., McNeill, V. F., and Pye, H. O. T.: Simulating Aqueous-Phase Isoprene-Epoxydiol (IEPOX) Secondary Organic Aerosol Production During the 2013 Southern Oxidant and Aerosol Study (SOAS), Environ. Sci. Technol., 51, 5026–5034, 2017.
CESM: CESM2.1.0, available at: https://github.com/ESCOMP/CESM, last access: 1 March 2021.
Chen, Y., Zhang, Y., Lambe, A. T., Xu, R., Lei, Z., Olson, N. E., Zhang, Z., Szalkowski, T., Cui, T., Vizuete, W., Gold, A., Turpin, B. J., Ault, A. P., Chan, M. N., and Surratt, J. D.: Heterogeneous Hydroxyl Radical Oxidation of Isoprene Epoxydiol-Derived Methyltetrol Sulfates: Plausible Formation Mechanisms of Previously Unexplained Organosulfates in Ambient Fine Aerosols, Environ. Sci. Technol. Lett., 7, 460–468, https://doi.org/10.1021/acs.estlett.0c00276, 2020.
Cholakian, A., Beekmann, M., Coll, I., Ciarelli, G., and Colette, A.: Biogenic secondary organic aerosol sensitivity to organic aerosol simulation schemes in climate projections, Atmos. Chem. Phys., 19, 13209–13226, https://doi.org/10.5194/acp-19-13209-2019, 2019a.
Cholakian, A., Colette, A., Coll, I., Ciarelli, G., and Beekmann, M.: Future climatic drivers and their effect on PM10 components in Europe and the Mediterranean Sea, Atmos. Chem. Phys., 19, 4459–4484, https://doi.org/10.5194/acp-19-4459-2019, 2019b.
Crounse, J. D., McKinney, K. A., Kwan, A. J., and Wennberg, P. O.: Measurement of gas-phase hydroperoxides by chemical ionization mass spectrometry, Anal. Chem., 78, 6726–6732, 2006.
Cui, T., Zeng, Z., Dos Santos, E. O., Zhang, Z., Chen, Y., Zhang, Y., Rose, C. A., Budisulistiorini, S. H., Collins, L. B., Bodnar, W. M., de Souza, R. A. F., Martin, S. T., Machado, C. M. D., Turpin, B. J., Gold, A., Ault, A. P., and Surratt, J. D.: Development of a hydrophilic interaction liquid chromatography (HILIC) method for the chemical characterization of water-soluble isoprene epoxydiol (IEPOX)-derived secondary organic aerosol, Environ. Sci. Process. Impacts, 20, 1524–1536, 2018.
D'Ambro, E. L., Schobesberger, S., Gaston, C. J., Lopez-Hilfiker, F. D., Lee, B. H., Liu, J., Zelenyuk, A., Bell, D., Cappa, C. D., Helgestad, T., Li, Z., Guenther, A., Wang, J., Wise, M., Caylor, R., Surratt, J. D., Riedel, T., Hyttinen, N., Salo, V.-T., Hasan, G., Kurtén, T., Shilling, J. E., and Thornton, J. A.: Chamber-based insights into the factors controlling epoxydiol (IEPOX) secondary organic aerosol (SOA) yield, composition, and volatility, Atmos. Chem. Phys., 19, 11253–11265, https://doi.org/10.5194/acp-19-11253-2019, 2019.
Danabasoglu, G., Lamarque, J.-F., Bacmeister, J., Bailey, D. A., DuVivier, A. K., Edwards, J., Emmons, L. K., Fasullo, J., Garcia, R., Gettelman, A., Hannay, C., Holland, M. M., Large, W. G., Lauritzen, P. H., Lawrence, D. M., Lenaerts, J. T. M., Lindsay, K., Lipscomb, W. H., Mills, M. J., Neale, R., Oleson, K. W., Otto-Bliesner, B., Phillips, A. S., Sacks, W., Tilmes, S., Kampenhout, L., Vertenstein, M., Bertini, A., Dennis, J., Deser, C., Fischer, C., Fox-Kemper, B., Kay, J. E., Kinnison, D., Kushner, P. J., Larson, V. E., Long, M. C., Mickelson, S., Moore, J. K., Nienhouse, E., Polvani, L., Rasch, P. J., and Strand, W. G.: The Community Earth System Model version 2 (CESM2), J. Adv. Model. Earth Syst., 12, e2019MS001916, https://doi.org/10.1029/2019MS001916, 2020.
Day, M. C. and Pandis, S. N.: Effects of a changing climate on summertime fine particulate matter levels in the eastern U.S, J. Geophys. Res.-Atmos., 120, 5706–5720, 2015.
de Gouw, J. and Warneke, C.: Measurements of volatile organic compounds in the earth's atmosphere using proton-transfer-reaction mass spectrometry, Mass Spectrom. Rev., 26, 223–257, 2007.
Donahue, N. M., Robinson, A. L., Stanier, C. O., and Pandis, S. N.: Coupled partitioning, dilution, and chemical aging of semivolatile organics, Environ. Sci. Technol., 40, 2635–2643, 2006.
Donahue, N. M., Kroll, J. H., Pandis, S. N., and Robinson, A. L.: A two-dimensional volatility basis set – Part 2: Diagnostics of organic-aerosol evolution, Atmos. Chem. Phys., 12, 615–634, https://doi.org/10.5194/acp-12-615-2012, 2012.
Eddingsaas, N. C., VanderVelde, D. G., and Wennberg, P. O.: Kinetics and products of the acid-catalyzed ring-opening of atmospherically relevant butyl epoxy alcohols, J. Phys. Chem. A, 114, 8106–8113, 2010.
Emmons, L. K., Schwantes, R. H., Orlando, J. J., Tyndall, G., Kinnison, D., Lamarque, J.-F., Marsh, D., Mills, M. J., Tilmes, S., Bardeen, C., Buchholz, R. R., Conley, A., Gettelman, A., Garcia, R., Simpson, I., Blake, D. R., Meinardi, S., and Pétron, G.: The Chemistry Mechanism in the Community Earth System Model version 2 (CESM2), J. Adv. Model. Earth Syst., 12, e2019MS001882, 2020.
Feng, Z., Yuan, X., Fares, S., Loreto, F., Li, P., Hoshika, Y., and Paoletti, E.: Isoprene is more affected by climate drivers than monoterpenes: A meta-analytic review on plant isoprenoid emissions, Plant Cell Environ., 42, 1939–1949, 2019.
Feng, L., Smith, S. J., Braun, C., Crippa, M., Gidden, M. J., Hoesly, R., Klimont, Z., van Marle, M., van den Berg, M., and van der Werf, G. R.: The generation of gridded emissions data for CMIP6, Geosci. Model Dev., 13, 461–482, https://doi.org/10.5194/gmd-13-461-2020, 2020.
Fountoukis, C. and Nenes, A.: ISORROPIA II: a computationally efficient thermodynamic equilibrium model for K+–Ca2+–Mg2+–NH–Na+–SO–NO–Cl−–H2O aerosols, Atmos. Chem. Phys., 7, 4639–4659, https://doi.org/10.5194/acp-7-4639-2007, 2007.
Gaston, C. J., Riedel, T. P., Zhang, Z., Gold, A., Surratt, J. D., and Thornton, J. A.: Reactive uptake of an isoprene-derived epoxydiol to submicron aerosol particles, Environ. Sci. Technol., 48, 11178–11186, 2014a.
Gaston, C. J., Thornton, J. A., and Ng, N. L.: Reactive uptake of N2O5 to internally mixed inorganic and organic particles: the role of organic carbon oxidation state and inferred organic phase separations, Atmos. Chem. Phys., 14, 5693–5707, https://doi.org/10.5194/acp-14-5693-2014, 2014b.
Gelaro, R., McCarty, W., Suárez, M. J., Todling, R., Molod, A., Takacs, L., Randles, C., Darmenov, A., Bosilovich, M. G., Reichle, R., Wargan, K., Coy, L., Cullather, R., Draper, C., Akella, S., Buchard, V., Conaty, A., da Silva, A., Gu, W., Kim, G.-K., Koster, R., Lucchesi, R., Merkova, D., Nielsen, J. E., Partyka, G., Pawson, S., Putman, W., Rienecker, M., Schubert, S. D., Sienkiewicz, M., and Zhao, B.: The Modern-Era Retrospective Analysis for Research and Applications, Version 2 (MERRA-2), J. Climate, 30, 5419–5454, 2017.
Gettelman, A., Hannay, C., Bacmeister, J. T., Neale, R. B., Pendergrass, A. G., Danabasoglu, G., Lamarque, J.-F., Fasullo, J. T., Bailey, D. A., Lawrence, D. M., and Mills, M. J.: High Climate Sensitivity in the Community Earth System Model Version 2 (CESM2), Geophys. Res. Lett., 46, 8329–8337, 2019.
Gidden, M. J., Riahi, K., Smith, S. J., Fujimori, S., Luderer, G., Kriegler, E., van Vuuren, D. P., van den Berg, M., Feng, L., Klein, D., Calvin, K., Doelman, J. C., Frank, S., Fricko, O., Harmsen, M., Hasegawa, T., Havlik, P., Hilaire, J., Hoesly, R., Horing, J., Popp, A., Stehfest, E., and Takahashi, K.: Global emissions pathways under different socioeconomic scenarios for use in CMIP6: a dataset of harmonized emissions trajectories through the end of the century, Geosci. Model Dev., 12, 1443–1475, https://doi.org/10.5194/gmd-12-1443-2019, 2019.
Glasius, M. and Goldstein, A. H.: Recent Discoveries and Future Challenges in Atmospheric Organic Chemistry, Environ. Sci. Technol., 50, 2754–2764, 2016.
GoAmazon science team: GoAmazon campaign dataset, available at: https://www.arm.gov/research/campaigns/amf2014goamazon (last access: 1 March 2021), 2014.
Gu, D., Guenther, A. B., Shilling, J. E., Yu, H., Huang, M., Zhao, C., Yang, Q., Martin, S. T., Artaxo, P., Kim, S., Seco, R., Stavrakou, T., Longo, K. M., Tóta, J., de Souza, R. A. F., Vega, O., Liu, Y., Shrivastava, M., Alves, E. G., Santos, F. C., Leng, G., and Hu, Z.: Airborne observations reveal elevational gradient in tropical forest isoprene emissions, Nat. Commun., 8, 15541, https://doi.org/10.1038/ncomms15541, 2017.
Guenther, A.: Biological and Chemical Diversity of Biogenic Volatile Organic Emissions into the Atmosphere, ISRN Atmospheric Sciences, 2013, 786290, https://doi.org/10.1155/2013/786290, 2013.
Guenther, A. B., Jiang, X., Heald, C. L., Sakulyanontvittaya, T., Duhl, T., Emmons, L. K., and Wang, X.: The Model of Emissions of Gases and Aerosols from Nature version 2.1 (MEGAN2.1): an extended and updated framework for modeling biogenic emissions, Geosci. Model Dev., 5, 1471–1492, https://doi.org/10.5194/gmd-5-1471-2012, 2012.
Guo, H., Sullivan, A. P., Campuzano-Jost, P., Schroder, J. C., Lopez-Hilfiker, F. D., Dibb, J. E., Jimenez, J. L., Thornton, J. A., Brown, S. S., Nenes, A., and Weber, R. J.: Fine particle pH and the partitioning of nitric acid during winter in the northeastern United States, J. Geophys. Res.-Atmos., 121, 10355–10376, 2016.
Heald, C. L., Henze, D. K., Horowitz, L. W., Feddema, J., Lamarque, J.-F., Guenther, A., Hess, P. G., Vitt, F., Seinfeld, J. H., Goldstein, A. H., and Fung, I.: Predicted change in global secondary organic aerosol concentrations in response to future climate, emissions, and land use change, J. Geophys. Res.-Atmos., 113, D05211, https://doi.org/10.1029/2007JD009092, 2008.
Hodzic, A. and Jimenez, J. L.: Modeling anthropogenically controlled secondary organic aerosols in a megacity: a simplified framework for global and climate models, Geosci. Model Dev., 4, 901–917, https://doi.org/10.5194/gmd-4-901-2011, 2011.
Hodzic, A., Kasibhatla, P. S., Jo, D. S., Cappa, C. D., Jimenez, J. L., Madronich, S., and Park, R. J.: Rethinking the global secondary organic aerosol (SOA) budget: stronger production, faster removal, shorter lifetime, Atmos. Chem. Phys., 16, 7917–7941, https://doi.org/10.5194/acp-16-7917-2016, 2016.
Hodzic, A., Campuzano-Jost, P., Bian, H., Chin, M., Colarco, P. R., Day, D. A., Froyd, K. D., Heinold, B., Jo, D. S., Katich, J. M., Kodros, J. K., Nault, B. A., Pierce, J. R., Ray, E., Schacht, J., Schill, G. P., Schroder, J. C., Schwarz, J. P., Sueper, D. T., Tegen, I., Tilmes, S., Tsigaridis, K., Yu, P., and Jimenez, J. L.: Characterization of organic aerosol across the global remote troposphere: a comparison of ATom measurements and global chemistry models, Atmos. Chem. Phys., 20, 4607–4635, https://doi.org/10.5194/acp-20-4607-2020, 2020.
Hoesly, R. M., Smith, S. J., Feng, L., Klimont, Z., Janssens-Maenhout, G., Pitkanen, T., Seibert, J. J., Vu, L., Andres, R. J., Bolt, R. M., Bond, T. C., Dawidowski, L., Kholod, N., Kurokawa, J.-I., Li, M., Liu, L., Lu, Z., Moura, M. C. P., O'Rourke, P. R., and Zhang, Q.: Historical (1750–2014) anthropogenic emissions of reactive gases and aerosols from the Community Emissions Data System (CEDS), Geosci. Model Dev., 11, 369–408, https://doi.org/10.5194/gmd-11-369-2018, 2018.
Hu, W., Palm, B. B., Day, D. A., Campuzano-Jost, P., Krechmer, J. E., Peng, Z., de Sá, S. S., Martin, S. T., Alexander, M. L., Baumann, K., Hacker, L., Kiendler-Scharr, A., Koss, A. R., de Gouw, J. A., Goldstein, A. H., Seco, R., Sjostedt, S. J., Park, J.-H., Guenther, A. B., Kim, S., Canonaco, F., Prévôt, A. S. H., Brune, W. H., and Jimenez, J. L.: Volatility and lifetime against OH heterogeneous reaction of ambient isoprene-epoxydiols-derived secondary organic aerosol (IEPOX-SOA), Atmos. Chem. Phys., 16, 11563–11580, https://doi.org/10.5194/acp-16-11563-2016, 2016.
Hu, W. W., Campuzano-Jost, P., Palm, B. B., Day, D. A., Ortega, A. M., Hayes, P. L., Krechmer, J. E., Chen, Q., Kuwata, M., Liu, Y. J., de Sá, S. S., McKinney, K., Martin, S. T., Hu, M., Budisulistiorini, S. H., Riva, M., Surratt, J. D., St. Clair, J. M., Isaacman-Van Wertz, G., Yee, L. D., Goldstein, A. H., Carbone, S., Brito, J., Artaxo, P., de Gouw, J. A., Koss, A., Wisthaler, A., Mikoviny, T., Karl, T., Kaser, L., Jud, W., Hansel, A., Docherty, K. S., Alexander, M. L., Robinson, N. H., Coe, H., Allan, J. D., Canagaratna, M. R., Paulot, F., and Jimenez, J. L.: Characterization of a real-time tracer for isoprene epoxydiols-derived secondary organic aerosol (IEPOX-SOA) from aerosol mass spectrometer measurements, Atmos. Chem. Phys., 15, 11807–11833, https://doi.org/10.5194/acp-15-11807-2015, 2015.
Jo, D. S., Hodzic, A., Emmons, L. K., Marais, E. A., Peng, Z., Nault, B. A., Hu, W., Campuzano-Jost, P., and Jimenez, J. L.: A simplified parameterization of isoprene-epoxydiol-derived secondary organic aerosol (IEPOX-SOA) for global chemistry and climate models: a case study with GEOS-Chem v11-02-rc, Geosci. Model Dev., 12, 2983–3000, https://doi.org/10.5194/gmd-12-2983-2019, 2019.
Jo, D., Hodzic, A., Emmons, L., Tilmes, S., Schwantes, R., Mills, M. J., Campuzano-Jost, P., Hu, W., Zaveri, R. A., Easter, R. C., Singh, B., Lu, Z., Schulz, C., Schneider, J., Shilling, J. E., Wisthaler, A., and Jimenez, J.: IEPOX-SOA and related chemical/meteorological fields simulated by CESM2/CAM-chem under present and future conditions. Version 1.0. UCAR/NCAR – DASH Repository, https://doi.org/10.5065/7873-2z88, 2021.
Karl, T., Guenther, A., Yokelson, R. J., Greenberg, J., Potosnak, M., Blake, D. R., and Artaxo, P.: The tropical forest and fire emissions experiment: Emission, chemistry, and transport of biogenic volatile organic compounds in the lower atmosphere over Amazonia, J. Geophys. Res., 112, D18302, https://doi.org/10.1029/2007JD008539, 2007.
Kim, P. S., Jacob, D. J., Fisher, J. A., Travis, K., Yu, K., Zhu, L., Yantosca, R. M., Sulprizio, M. P., Jimenez, J. L., Campuzano-Jost, P., Froyd, K. D., Liao, J., Hair, J. W., Fenn, M. A., Butler, C. F., Wagner, N. L., Gordon, T. D., Welti, A., Wennberg, P. O., Crounse, J. D., St. Clair, J. M., Teng, A. P., Millet, D. B., Schwarz, J. P., Markovic, M. Z., and Perring, A. E.: Sources, seasonality, and trends of southeast US aerosol: an integrated analysis of surface, aircraft, and satellite observations with the GEOS-Chem chemical transport model, Atmos. Chem. Phys., 15, 10411–10433, https://doi.org/10.5194/acp-15-10411-2015, 2015.
Lam, H. K., Kwong, K. C., Poon, H. Y., Davies, J. F., Zhang, Z., Gold, A., Surratt, J. D., and Chan, M. N.: Heterogeneous OH oxidation of isoprene-epoxydiol-derived organosulfates: kinetics, chemistry and formation of inorganic sulfate, Atmos. Chem. Phys., 19, 2433–2440, https://doi.org/10.5194/acp-19-2433-2019, 2019.
Lannuque, V., Camredon, M., Couvidat, F., Hodzic, A., Valorso, R., Madronich, S., Bessagnet, B., and Aumont, B.: Exploration of the influence of environmental conditions on secondary organic aerosol formation and organic species properties using explicit simulations: development of the VBS-GECKO parameterization, Atmos. Chem. Phys., 18, 13411–13428, https://doi.org/10.5194/acp-18-13411-2018, 2018.
Liao, H., Zhang, Y., Chen, W.-T., Raes, F., and Seinfeld, J. H.: Effect of chemistry-aerosol-climate coupling on predictions of future climate and future levels of tropospheric ozone and aerosols, J. Geophys. Res., 114, 1097, https://doi.org/10.1029/2008JD010984, 2009.
Lin, G., Penner, J. E., and Zhou, C.: How will SOA change in the future?, Geophys. Res. Lett., 43, 1718–1726, 2016.
Liu, X., Easter, R. C., Ghan, S. J., Zaveri, R., Rasch, P., Shi, X., Lamarque, J.-F., Gettelman, A., Morrison, H., Vitt, F., Conley, A., Park, S., Neale, R., Hannay, C., Ekman, A. M. L., Hess, P., Mahowald, N., Collins, W., Iacono, M. J., Bretherton, C. S., Flanner, M. G., and Mitchell, D.: Toward a minimal representation of aerosols in climate models: description and evaluation in the Community Atmosphere Model CAM5, Geosci. Model Dev., 5, 709–739, https://doi.org/10.5194/gmd-5-709-2012, 2012.
Liu, X., Ma, P.-L., Wang, H., Tilmes, S., Singh, B., Easter, R. C., Ghan, S. J., and Rasch, P. J.: Description and evaluation of a new four-mode version of the Modal Aerosol Module (MAM4) within version 5.3 of the Community Atmosphere Model, Geosci. Model Dev., 9, 505–522, https://doi.org/10.5194/gmd-9-505-2016, 2016.
Lopez-Hilfiker, F. D., Mohr, C., D'Ambro, E. L., Lutz, A., Riedel, T. P., Gaston, C. J., Iyer, S., Zhang, Z., Gold, A., Surratt, J. D., Lee, B. H., Kurten, T., Hu, W. W., Jimenez, J., Hallquist, M., and Thornton, J. A.: Molecular Composition and Volatility of Organic Aerosol in the Southeastern U.S.: Implications for IEPOX Derived SOA, Environ. Sci. Technol., 50, 2200–2209, 2016.
Lu, Z., Liu, X., Zaveri, R., Easter, R., Tlimes, S., Emmons, L., Vitt, F., Singh, B., Wang, H., Zhang, R., and Rasch, P.: Radiative Forcing of Nitrate Aerosols from 1975 to 2010 as Simulated by MOSAIC Module in CESM2-MAM4, J. Geophys. Res., in review, 2021.
Marais, E. A., Jacob, D. J., Kurosu, T. P., Chance, K., Murphy, J. G., Reeves, C., Mills, G., Casadio, S., Millet, D. B., Barkley, M. P., Paulot, F., and Mao, J.: Isoprene emissions in Africa inferred from OMI observations of formaldehyde columns, Atmos. Chem. Phys., 12, 6219–6235, https://doi.org/10.5194/acp-12-6219-2012, 2012.
Marais, E. A., Jacob, D. J., Jimenez, J. L., Campuzano-Jost, P., Day, D. A., Hu, W., Krechmer, J., Zhu, L., Kim, P. S., Miller, C. C., Fisher, J. A., Travis, K., Yu, K., Hanisco, T. F., Wolfe, G. M., Arkinson, H. L., Pye, H. O. T., Froyd, K. D., Liao, J., and McNeill, V. F.: Aqueous-phase mechanism for secondary organic aerosol formation from isoprene: application to the southeast United States and co-benefit of SO2 emission controls, Atmos. Chem. Phys., 16, 1603–1618, https://doi.org/10.5194/acp-16-1603-2016, 2016.
Marais, E. A., Jacob, D. J., Turner, J. R., and Mickley, L. J.: Evidence of 1991–2013 decrease of biogenic secondary organic aerosol in response to SO2 emission controls, Environ. Res. Lett., 12, 54018, https://doi.org/10.1088/1748-9326/aa69c8, 2017.
Martin, S. T., Artaxo, P., Machado, L. A. T., Manzi, A. O., Souza, R. A. F., Schumacher, C., Wang, J., Andreae, M. O., Barbosa, H. M. J., Fan, J., Fisch, G., Goldstein, A. H., Guenther, A., Jimenez, J. L., Pöschl, U., Silva Dias, M. A., Smith, J. N., and Wendisch, M.: Introduction: Observations and Modeling of the Green Ocean Amazon (GoAmazon2014/5), Atmos. Chem. Phys., 16, 4785–4797, https://doi.org/10.5194/acp-16-4785-2016, 2016.
Megaritis, A. G., Fountoukis, C., Charalampidis, P. E., Pilinis, C., and Pandis, S. N.: Response of fine particulate matter concentrations to changes of emissions and temperature in Europe, Atmos. Chem. Phys., 13, 3423–3443, https://doi.org/10.5194/acp-13-3423-2013, 2013.
Mei, F., Wang, J., Comstock, J. M., Weigel, R., Krämer, M., Mahnke, C., Shilling, J. E., Schneider, J., Schulz, C., Long, C. N., Wendisch, M., Machado, L. A. T., Schmid, B., Krisna, T., Pekour, M., Hubbe, J., Giez, A., Weinzierl, B., Zoeger, M., Pöhlker, M. L., Schlager, H., Cecchini, M. A., Andreae, M. O., Martin, S. T., de Sá, S. S., Fan, J., Tomlinson, J., Springston, S., Pöschl, U., Artaxo, P., Pöhlker, C., Klimach, T., Minikin, A., Afchine, A., and Borrmann, S.: Comparison of aircraft measurements during GoAmazon2014/5 and ACRIDICON-CHUVA, Atmos. Meas. Tech., 13, 661–684, https://doi.org/10.5194/amt-13-661-2020, 2020.
Müller, M., Mikoviny, T., Feil, S., Haidacher, S., Hanel, G., Hartungen, E., Jordan, A., Märk, L., Mutschlechner, P., Schottkowsky, R., Sulzer, P., Crawford, J. H., and Wisthaler, A.: A compact PTR-ToF-MS instrument for airborne measurements of volatile organic compounds at high spatiotemporal resolution, Atmos. Meas. Tech., 7, 3763–3772, https://doi.org/10.5194/amt-7-3763-2014, 2014.
Murphy, D. M., Froyd, K. D., Bian, H., Brock, C. A., Dibb, J. E., DiGangi, J. P., Diskin, G., Dollner, M., Kupc, A., Scheuer, E. M., Schill, G. P., Weinzierl, B., Williamson, C. J., and Yu, P.: The distribution of sea-salt aerosol in the global troposphere, Atmos. Chem. Phys., 19, 4093–4104, https://doi.org/10.5194/acp-19-4093-2019, 2019.
Nault, B. A., Campuzano-Jost, P., Day, D. A., Jo, D. S., Schroder, J. C., Allen, H. M., Bahreini, R., Bian, H., Blake, D.R., Chin, M., Clegg, S. L., Colarco, P. R., Crounse, J. D., Cubison, M. J., DeCarlo, P. F., Dibb, J. E., Diskin, G. S., Hodzic, A., Hu, W., Katich, J. M., Kim, M. J., Kodros, J. K., Kupc, A., Lopez-Hilfiker, F. D., Marais, E. A., Middlebrook, A. M., Neuman, J. A., Nowak, J. B., Palm, B. B., Paulot, F., Pierce, J. R., Schill, G. P., Scheuer, E., Thornton, J. A., Tsigaridis, K., Wennberg, P. O., Williamson, C. J., and Jimenez, J. L.: Models underestimate the increase of acidity with remoteness biasing radiative impact calculations, Communications Earth & Environment, in review, 2021.
O'Neill, B. C., Tebaldi, C., van Vuuren, D. P., Eyring, V., Friedlingstein, P., Hurtt, G., Knutti, R., Kriegler, E., Lamarque, J.-F., Lowe, J., Meehl, G. A., Moss, R., Riahi, K., and Sanderson, B. M.: The Scenario Model Intercomparison Project (ScenarioMIP) for CMIP6, Geosci. Model Dev., 9, 3461–3482, https://doi.org/10.5194/gmd-9-3461-2016, 2016.
Pai, S. J., Heald, C. L., Pierce, J. R., Farina, S. C., Marais, E. A., Jimenez, J. L., Campuzano-Jost, P., Nault, B. A., Middlebrook, A. M., Coe, H., Shilling, J. E., Bahreini, R., Dingle, J. H., and Vu, K.: An evaluation of global organic aerosol schemes using airborne observations, Atmos. Chem. Phys., 20, 2637–2665, https://doi.org/10.5194/acp-20-2637-2020, 2020.
Paulot, F., Crounse, J. D., Kjaergaard, H. G., Kürten, A., St Clair, J. M., Seinfeld, J. H., and Wennberg, P. O.: Unexpected epoxide formation in the gas-phase photooxidation of isoprene, Science, 325, 730–733, 2009.
Pfister, G. G., Eastham, S. D., Arellano, A. F., Aumont, B., Barsanti, K. C., Barth, M. C., Conley, A., Davis, N. A., Emmons, L. K., Fast, J. D., Fiore, A. M., Gaubert, B., Goldhaber, S., Granier, C., Grell, G. A., Guevara, M., Henze, D. K., Hodzic, A., Liu, X., Marsh, D. R., Orlando, J. J., Plane, J. M. C., Polvani, L. M., Rosenlof, K. H., Steiner, A. L., Jacob, D. J., and Brasseur, G. P.: The Multi-Scale Infrastructure for Chemistry and Aerosols (MUSICA), B. Am. Meteorol. Soc., 101, 1743–1760, 2020.
Pommier, M., Fagerli, H., Gauss, M., Simpson, D., Sharma, S., Sinha, V., Ghude, S. D., Landgren, O., Nyiri, A., and Wind, P.: Impact of regional climate change and future emission scenarios on surface O3 and PM2.5 over India, Atmos. Chem. Phys., 18, 103–127, https://doi.org/10.5194/acp-18-103-2018, 2018.
Possell, M. and Hewitt, C. N.: Isoprene emissions from plants are mediated by atmospheric CO2 concentrations: ISOPRENE-CO2 RESPONSE, Glob. Change Biol., 17, 1595–1610, 2011.
Pye, H. O. T., Pinder, R. W., Piletic, I. R., Xie, Y., Capps, S. L., Lin, Y.-H., Surratt, J. D., Zhang, Z., Gold, A., Luecken, D. J., Hutzell, W. T., Jaoui, M., Offenberg, J. H., Kleindienst, T. E., Lewandowski, M., and Edney, E. O.: Epoxide pathways improve model predictions of isoprene markers and reveal key role of acidity in aerosol formation, Environ. Sci. Technol., 47, 11056–11064, 2013.
Pye, H. O. T., Murphy, B. N., Xu, L., Ng, N. L., Carlton, A. G., Guo, H., Weber, R., Vasilakos, P., Appel, K. W., Budisulistiorini, S. H., Surratt, J. D., Nenes, A., Hu, W., Jimenez, J. L., Isaacman-VanWertz, G., Misztal, P. K., and Goldstein, A. H.: On the implications of aerosol liquid water and phase separation for organic aerosol mass, Atmos. Chem. Phys., 17, 343–369, https://doi.org/10.5194/acp-17-343-2017, 2017.
Riahi, K., van Vuuren, D. P., Kriegler, E., Edmonds, J., O'Neill, B. C., Fujimori, S., Bauer, N., Calvin, K., Dellink, R., Fricko, O., Lutz, W., Popp, A., Cuaresma, J. C., Kc, S., Leimbach, M., Jiang, L., Kram, T., Rao, S., Emmerling, J., Ebi, K., Hasegawa, T., Havlik, P., Humpenöder, F., Da Silva, L. A., Smith, S., Stehfest, E., Bosetti, V., Eom, J., Gernaat, D., Masui, T., Rogelj, J., Strefler, J., Drouet, L., Krey, V., Luderer, G., Harmsen, M., Takahashi, K., Baumstark, L., Doelman, J. C., Kainuma, M., Klimont, Z., Marangoni, G., Lotze-Campen, H., Obersteiner, M., Tabeau, A., and Tavoni, M.: The Shared Socioeconomic Pathways and their energy, land use, and greenhouse gas emissions implications: An overview, Glob. Environ. Change, 42, 153–168, 2017.
Riva, M., Chen, Y., Zhang, Y., Lei, Z., Olson, N. E., Boyer, H. C., Narayan, S., Yee, L. D., Green, H. S., Cui, T., Zhang, Z., Baumann, K., Fort, M., Edgerton, E., Budisulistiorini, S. H., Rose, C. A., Ribeiro, I. O., Oliveira, R. L., Dos Santos, E. O., Machado, C. M. D., Szopa, S., Zhao, Y., Alves, E. G., de Sá, S. S., Hu, W., Knipping, E. M., Shaw, S. L., Duvoisin Jr., S., de Souza, R. A. F., Palm, B. B., Jimenez, J.-L., Glasius, M., Goldstein, A. H., Pye, H. O. T., Gold, A., Turpin, B. J., Vizuete, W., Martin, S. T., Thornton, J. A., Dutcher, C. S., Ault, A. P., and Surratt, J. D.: Increasing Isoprene Epoxydiol-to-Inorganic Sulfate Aerosol Ratio Results in Extensive Conversion of Inorganic Sulfate to Organosulfur Forms: Implications for Aerosol Physicochemical Properties, Environ. Sci. Technol., 53, 8682–8694, 2019.
Sá, S. S., Palm, B. B., Campuzano-Jost, P., Day, D. A., Hu, W., Isaacman-VanWertz, G., Yee, L. D., Brito, J., Carbone, S., Ribeiro, I. O., Cirino, G. G., Liu, Y., Thalman, R., Sedlacek, A., Funk, A., Schumacher, C., Shilling, J. E., Schneider, J., Artaxo, P., Goldstein, A. H., Souza, R. A. F., Wang, J., McKinney, K. A., Barbosa, H., Alexander, M. L., Jimenez, J. L., and Martin, S. T.: Urban influence on the concentration and composition of submicron particulate matter in central Amazonia, Atmos. Chem. Phys., 18, 12185–12206, https://doi.org/10.5194/acp-18-12185-2018, 2018.
Sá, S. S., Rizzo, L. V., Palm, B. B., Campuzano-Jost, P., Day, D. A., Yee, L. D., Wernis, R., Isaacman-VanWertz, G., Brito, J., Carbone, S., Liu, Y. J., Sedlacek, A., Springston, S., Goldstein, A. H., Barbosa, H. M. J., Alexander, M. L., Artaxo, P., Jimenez, J. L., and Martin, S. T.: Contributions of biomass-burning, urban, and biogenic emissions to the concentrations and light-absorbing properties of particulate matter in central Amazonia during the dry season, Atmos. Chem. Phys., 19, 7973–8001, https://doi.org/10.5194/acp-19-7973-2019, 2019.
Sarkar, C., Guenther, A. B., Park, J.-H., Seco, R., Alves, E., Batalha, S., Santana, R., Kim, S., Smith, J., Tóta, J., and Vega, O.: PTR-TOF-MS eddy covariance measurements of isoprene and monoterpene fluxes from an eastern Amazonian rainforest, Atmos. Chem. Phys., 20, 7179–7191, https://doi.org/10.5194/acp-20-7179-2020, 2020.
Schervish, M. and Donahue, N. M.: Peroxy radical chemistry and the volatility basis set, Atmos. Chem. Phys., 20, 1183–1199, https://doi.org/10.5194/acp-20-1183-2020, 2020.
Schmedding, R., Ma, M., Zhang, Y., Farrell, S., Pye, H. O. T., Chen, Y., Wang, C.-T., Rasool, Q. Z., Budisulistiorini, S. H., Ault, A. P., Surratt, J. D., and Vizuete, W.: α-Pinene-Derived organic coatings on acidic sulfate aerosol impacts secondary organic aerosol formation from isoprene in a box model, Atmos. Environ., 213, 456–462, 2019.
Schulz, C., Schneider, J., Amorim Holanda, B., Appel, O., Costa, A., de Sá, S. S., Dreiling, V., Fütterer, D., Jurkat-Witschas, T., Klimach, T., Knote, C., Krämer, M., Martin, S. T., Mertes, S., Pöhlker, M. L., Sauer, D., Voigt, C., Walser, A., Weinzierl, B., Ziereis, H., Zöger, M., Andreae, M. O., Artaxo, P., Machado, L. A. T., Pöschl, U., Wendisch, M., and Borrmann, S.: Aircraft-based observations of isoprene-epoxydiol-derived secondary organic aerosol (IEPOX-SOA) in the tropical upper troposphere over the Amazon region, Atmos. Chem. Phys., 18, 14979–15001, https://doi.org/10.5194/acp-18-14979-2018, 2018.
Schwantes, R. H., Emmons, L. K., Orlando, J. J., Barth, M. C., Tyndall, G. S., Hall, S. R., Ullmann, K., St. Clair, J. M., Blake, D. R., Wisthaler, A., and Bui, T. P. V.: Comprehensive isoprene and terpene gas-phase chemistry improves simulated surface ozone in the southeastern US, Atmos. Chem. Phys., 20, 3739–3776, https://doi.org/10.5194/acp-20-3739-2020, 2020.
SEAC4RS science team: SEAC4RS campaign dataset, https://doi.org/10.5067/Aircraft/SEAC4RS/Aerosol-TraceGas-Cloud, 2013.
Sharkey, T. D. and Monson, R. K.: Isoprene research – 60 years later, the biology is still enigmatic, Plant Cell Environ., 40, 1671–1678, 2017.
Shilling, J. E., Pekour, M. S., Fortner, E. C., Artaxo, P., de Sá, S., Hubbe, J. M., Longo, K. M., Machado, L. A. T., Martin, S. T., Springston, S. R., Tomlinson, J., and Wang, J.: Aircraft observations of the chemical composition and aging of aerosol in the Manaus urban plume during GoAmazon 2014/5, Atmos. Chem. Phys., 18, 10773–10797, https://doi.org/10.5194/acp-18-10773-2018, 2018.
Shrivastava, M., Cappa, C. D., Fan, J., Goldstein, A. H., Guenther, A. B., Jimenez, J. L., Kuang, C., Laskin, A., Martin, S. T., Ng, N. L., Petaja, T., Pierce, J. R., Rasch, P. J., Roldin, P., Seinfeld, J. H., Shilling, J., Smith, J. N., Thornton, J. A., Volkamer, R., Wang, J., Worsnop, D. R., Zaveri, R. A., Zelenyuk, A., and Zhang, Q.: Recent advances in understanding secondary organic aerosol: Implications for global climate forcing: Advances in Secondary Organic Aerosol, Rev. Geophys., 55, 509–559, 2017.
Shrivastava, M., Andreae, M. O., Artaxo, P., Barbosa, H. M. J., Berg, L. K., Brito, J., Ching, J., Easter, R. C., Fan, J., Fast, J. D., Feng, Z., Fuentes, J. D., Glasius, M., Goldstein, A. H., Alves, E. G., Gomes, H., Gu, D., Guenther, A., Jathar, S. H., Kim, S., Liu, Y., Lou, S., Martin, S. T., McNeill, V. F., Medeiros, A., de Sá, S. S., Shilling, J. E., Springston, S. R., Souza, R. A. F., Thornton, J. A., Isaacman-Van Wertz, G., Yee, L. D., Ynoue, R., Zaveri, R. A., Zelenyuk, A., and Zhao, C.: Urban pollution greatly enhances formation of natural aerosols over the Amazon rainforest, Nat. Commun., 10, 1046, https://doi.org/10.1038/s41467-019-08909-4, 2019.
Slik, J. W. F., Arroyo-Rodríguez, V., Aiba, S.-I., et al.: An estimate of the number of tropical tree species, P. Natl. Acad. Sci. USA, 112, 7472–7477, 2015.
Sporre, M. K., Blichner, S. M., Karset, I. H. H., Makkonen, R., and Berntsen, T. K.: BVOC–aerosol–climate feedbacks investigated using NorESM, Atmos. Chem. Phys., 19, 4763–4782, https://doi.org/10.5194/acp-19-4763-2019, 2019.
Sporre, M. K., Blichner, S. M., Schrödner, R., Karset, I. H. H., Berntsen, T. K., van Noije, T., Bergman, T., O'Donnell, D., and Makkonen, R.: Large difference in aerosol radiative effects from BVOC-SOA treatment in three Earth system models, Atmos. Chem. Phys., 20, 8953–8973, https://doi.org/10.5194/acp-20-8953-2020, 2020.
Stadtler, S., Kühn, T., Schröder, S., Taraborrelli, D., Schultz, M. G., and Kokkola, H.: Isoprene-derived secondary organic aerosol in the global aerosol–chemistry–climate model ECHAM6.3.0–HAM2.3–MOZ1.0, Geosci. Model Dev., 11, 3235–3260, https://doi.org/10.5194/gmd-11-3235-2018, 2018.
Stavrakou, T., Müller, J.-F., Bauwens, M., De Smedt, I., Van Roozendael, M., Guenther, A., Wild, M., and Xia, X.: Isoprene emissions over Asia 1979–2012: impact of climate and land-use changes, Atmos. Chem. Phys., 14, 4587–4605, https://doi.org/10.5194/acp-14-4587-2014, 2014.
St. Clair, J. M., McCabe, D. C., Crounse, J. D., Steiner, U., and Wennberg, P. O.: Chemical ionization tandem mass spectrometer for the in situ measurement of methyl hydrogen peroxide, Rev. Sci. Instrum., 81, 094102, https://doi.org/10.1063/1.3480552, 2010.
Tai, A. P. K., Mickley, L. J., Heald, C. L., and Wu, S.: Effect of CO2 inhibition on biogenic isoprene emission: Implications for air quality under 2000 to 2050 changes in climate, vegetation, and land use: CO2-ISOPRENE INTERACTION AND AIR QUALITY, Geophys. Res. Lett., 40, 3479–3483, 2013.
ter Steege, H., Pitman, N. C. A., Sabatier, D., et al.: Hyperdominance in the Amazonian tree flora, Science, 342, 1243092, 2013.
Tilmes, S., Hodzic, A., Emmons, L. K., Mills, M. J., Gettelman, A., Kinnison, D. E., Park, M., Lamarque, J.-F, Vitt, F., Shrivastava, M., Campuzano-Jost, P., Jimenez, J. L., and Liu, X.: Climate Forcing and Trends of Organic Aerosols in the Community Earth System Model (CESM2), J. Adv. Model. Earth Syst., 18, 17745, https://doi.org/10.1029/2019MS001827, 2019.
Toon, O. B., Maring, H., Dibb, J., Ferrare, R., Jacob, D. J., Jensen, E. J., Luo, Z. J., Mace, G. G., Pan, L. L., Pfister, L., Rosenlof, K. H., Redemann, J., Reid, J. S., Singh, H. B., Thompson, A. M., Yokelson, R., Minnis, P., Chen, G., Jucks, K. W., and Pszenny, A.: Planning, implementation, and scientific goals of the Studies of Emissions and Atmospheric Composition, Clouds and Climate Coupling by Regional Surveys (SEAC4RS) field mission: Planning SEAC4RS, J. Geophys. Res.-Atmos., 121, 4967–5009, 2016.
Travis, K. R., Jacob, D. J., Fisher, J. A., Kim, P. S., Marais, E. A., Zhu, L., Yu, K., Miller, C. C., Yantosca, R. M., Sulprizio, M. P., Thompson, A. M., Wennberg, P. O., Crounse, J. D., St. Clair, J. M., Cohen, R. C., Laughner, J. L., Dibb, J. E., Hall, S. R., Ullmann, K., Wolfe, G. M., Pollack, I. B., Peischl, J., Neuman, J. A., and Zhou, X.: Why do models overestimate surface ozone in the Southeast United States?, Atmos. Chem. Phys., 16, 13561–13577, https://doi.org/10.5194/acp-16-13561-2016, 2016.
Tsigaridis, K. and Kanakidou, M.: The Present and Future of Secondary Organic Aerosol Direct Forcing on Climate, Current Climate Change Reports, 4, 84–98, 2018.
Tsigaridis, K., Daskalakis, N., Kanakidou, M., Adams, P. J., Artaxo, P., Bahadur, R., Balkanski, Y., Bauer, S. E., Bellouin, N., Benedetti, A., Bergman, T., Berntsen, T. K., Beukes, J. P., Bian, H., Carslaw, K. S., Chin, M., Curci, G., Diehl, T., Easter, R. C., Ghan, S. J., Gong, S. L., Hodzic, A., Hoyle, C. R., Iversen, T., Jathar, S., Jimenez, J. L., Kaiser, J. W., Kirkevåg, A., Koch, D., Kokkola, H., Lee, Y. H., Lin, G., Liu, X., Luo, G., Ma, X., Mann, G. W., Mihalopoulos, N., Morcrette, J.-J., Müller, J.-F., Myhre, G., Myriokefalitakis, S., Ng, N. L., O'Donnell, D., Penner, J. E., Pozzoli, L., Pringle, K. J., Russell, L. M., Schulz, M., Sciare, J., Seland, Ø., Shindell, D. T., Sillman, S., Skeie, R. B., Spracklen, D., Stavrakou, T., Steenrod, S. D., Takemura, T., Tiitta, P., Tilmes, S., Tost, H., van Noije, T., van Zyl, P. G., von Salzen, K., Yu, F., Wang, Z., Wang, Z., Zaveri, R. A., Zhang, H., Zhang, K., Zhang, Q., and Zhang, X.: The AeroCom evaluation and intercomparison of organic aerosol in global models, Atmos. Chem. Phys., 14, 10845–10895, https://doi.org/10.5194/acp-14-10845-2014, 2014.
Tsimpidi, A. P., Karydis, V. A., Pozzer, A., Pandis, S. N., and Lelieveld, J.: ORACLE 2-D (v2.0): an efficient module to compute the volatility and oxygen content of organic aerosol with a global chemistry–climate model, Geosci. Model Dev., 11, 3369–3389, https://doi.org/10.5194/gmd-11-3369-2018, 2018.
Turnock, S. T., Allen, R. J., Andrews, M., Bauer, S. E., Deushi, M., Emmons, L., Good, P., Horowitz, L., John, J. G., Michou, M., Nabat, P., Naik, V., Neubauer, D., O'Connor, F. M., Olivié, D., Oshima, N., Schulz, M., Sellar, A., Shim, S., Takemura, T., Tilmes, S., Tsigaridis, K., Wu, T., and Zhang, J.: Historical and future changes in air pollutants from CMIP6 models, Atmos. Chem. Phys., 20, 14547–14579, https://doi.org/10.5194/acp-20-14547-2020, 2020.
van Marle, M. J. E., Kloster, S., Magi, B. I., Marlon, J. R., Daniau, A.-L., Field, R. D., Arneth, A., Forrest, M., Hantson, S., Kehrwald, N. M., Knorr, W., Lasslop, G., Li, F., Mangeon, S., Yue, C., Kaiser, J. W., and van der Werf, G. R.: Historic global biomass burning emissions for CMIP6 (BB4CMIP) based on merging satellite observations with proxies and fire models (1750–2015), Geosci. Model Dev., 10, 3329–3357, https://doi.org/10.5194/gmd-10-3329-2017, 2017.
Wendisch, M., Pöschl, U., Andreae, M. O., Machado, L. A. T., Albrecht, R., Schlager, H., Rosenfeld, D., Martin, S. T., Abdelmonem, A., Afchine, A., Araùjo, A. C., Artaxo, P., Aufmhoff, H., Barbosa, H. M. J., Borrmann, S., Braga, R., Buchholz, B., Cecchini, M. A., Costa, A., Curtius, J., Dollner, M., Dorf, M., Dreiling, V., Ebert, V., Ehrlich, A., Ewald, F., Fisch, G., Fix, A., Frank, F., Fütterer, D., Heckl, C., Heidelberg, F., Hüneke, T., Jäkel, E., Järvinen, E., Jurkat, T., Kanter, S., Kästner, U., Kenntner, M., Kesselmeier, J., Klimach, T., Knecht, M., Kohl, R., Kölling, T., Krämer, M., Krüger, M., Krisna, T. C., Lavric, J. V., Longo, K., Mahnke, C., Manzi, A. O., Mayer, B., Mertes, S., Minikin, A., Molleker, S., Münch, S., Nillius, B., Pfeilsticker, K., Pöhlker, C., Roiger, A., Rose, D., Rosenow, D., Sauer, D., Schnaiter, M., Schneider, J., Schulz, C., de Souza, R. A. F., Spanu, A., Stock, P., Vila, D., Voigt, C., Walser, A., Walter, D., Weigel, R., Weinzierl, B., Werner, F., Yamasoe, M. A., Ziereis, H., Zinner, T., and Zöger, M.: ACRIDICON-CHUVA Campaign: Studying Tropical Deep Convective Clouds and Precipitation over Amazonia Using the New German Research Aircraft HALO, B. Am. Meteorol. Soc., 97, 1885–1908, 2016.
Wennberg, P. O., Bates, K. H., Crounse, J. D., Dodson, L. G., McVay, R. C., Mertens, L. A., Nguyen, T. B., Praske, E., Schwantes, R. H., Smarte, M. D., St Clair, J. M., Teng, A. P., Zhang, X., and Seinfeld, J. H.: Gas-Phase Reactions of Isoprene and Its Major Oxidation Products, Chem. Rev., 118, 3337–3390, 2018.
Wilkinson, M. J., Monson, R. K., Trahan, N., Lee, S., Brown, E., Jackson, R. B., Polley, H. W., Fay, P. A., and Fall, R.: Leaf isoprene emission rate as a function of atmospheric CO2 concentration, Glob. Change Biol., 15, 1189–1200, 2009.
Worden, H. M., Bloom, A. A., Worden, J. R., Jiang, Z., Marais, E. A., Stavrakou, T., Gaubert, B., and Lacey, F.: New constraints on biogenic emissions using satellite-based estimates of carbon monoxide fluxes, Atmos. Chem. Phys., 19, 13569–13579, https://doi.org/10.5194/acp-19-13569-2019, 2019.
Wu, S., Mickley, L. J., Kaplan, J. O., and Jacob, D. J.: Impacts of changes in land use and land cover on atmospheric chemistry and air quality over the 21st century, Atmos. Chem. Phys., 12, 1597–1609, https://doi.org/10.5194/acp-12-1597-2012, 2012.
Yee, L. D., Isaacman-Van Wertz, G., Wernis, R., Kreisberg, N. M., Glasius, M., Riva, M., Surratt, J. D., de Sa, S. S., Martin, S. T., Alexander, M. L., Palm, B. B., Hu, W., Campuzano-Jost, P., Day, D. A., Jimenez, J. L., Liu, Y., Misztal, P. K., Artaxo, P., Viegas, J., Manzi, A., de Souza, R. A. F., Edgerton, E. S., Baumann, K., and Goldstein, A. H.: Natural and anthropogenically-influenced isoprene oxidation in the Southeastern U.S.A. and central Amazon, Environ. Sci. Technol., 54, 5980–5991, https://doi.org/10.1021/acs.est.0c00805, 2020.
Zare, A., Fahey, K. M., Sarwar, G., Cohen, R. C., and Pye, H. O. T.: Vapor-pressure pathways initiate but hydrolysis products dominate the aerosol estimated from organic nitrates, ACS Earth Space Chem., 3, 1426–1437, 2019.
Zaveri, R. A., Easter, R. C., Fast, J. D., and Peters, L. K.: Model for Simulating Aerosol Interactions and Chemistry (MOSAIC), J. Geophys. Res., 113, 1591, https://doi.org/10.1029/2007JD008782, 2008.
Zaveri, R. A., Easter, R. C., Singh, B., Wang, H., Lu, Z., Tilmes, S., Emmons, L. K., Vitt, F., Zhang, R., Liu, X., Ghan, S. J., and Rasch, P. J.: Development and evaluation of aerosol-climate model CAM5-MOSAIC-MAM7: Global atmospheric distribution and radiative effects of nitrate aerosol, J. Adv. Model. Earth Syst., in review, 2021.
Zhang, Q., Jimenez, J. L., Canagaratna, M. R., Allan, J. D., Coe, H., Ulbrich, I., Alfarra, M. R., Takami, A., Middlebrook, A. M., Sun, Y. L., Dzepina, K., Dunlea, E., Docherty, K., DeCarlo, P. F., Salcedo, D., Onasch, T., Jayne, J. T., Miyoshi, T., Shimono, A., Hatakeyama, S., Takegawa, N., Kondo, Y., Schneider, J., Drewnick, F., Borrmann, S., Weimer, S., Demerjian, K., Williams, P., Bower, K., Bahreini, R., Cottrell, L., Griffin, R. J., Rautiainen, J., Sun, J. Y., Zhang, Y. M., and Worsnop, D. R.: Ubiquity and dominance of oxygenated species in organic aerosols in anthropogenically-influenced Northern Hemisphere midlatitudes, Geophys. Res. Lett., 34, L13801, https://doi.org/10.1029/2007GL029979, 2007.
Zhang, Y., Chen, Y., Lambe, A. T., Olson, N. E., Lei, Z., Craig, R. L., Zhang, Z., Gold, A., Onasch, T. B., Jayne, J. T., Worsnop, D. R., Gaston, C. J., Thornton, J. A., Vizuete, W., Ault, A. P., and Surratt, J. D.: Effect of the Aerosol-Phase State on Secondary Organic Aerosol Formation from the Reactive Uptake of Isoprene-Derived Epoxydiols (IEPOX), Environ. Sci. Technol. Lett., 5, 167–174, 2018a.
Zhang, Y., Liao, H., Ding, X., Jo, D., and Li, K.: Implications of RCP emissions on future concentration and direct radiative forcing of secondary organic aerosol over China, Sci. Total Environ., 640/641, 1187–1204, 2018b.
Zhang, Y., Chen, Y., Lei, Z., Olson, N. E., Riva, M., Koss, A. R., Zhang, Z., Gold, A., Jayne, J. T., Worsnop, D. R., Onasch, T. B., Kroll, J. H., Turpin, B. J., Ault, A. P., and Surratt, J. D.: Joint Impacts of Acidity and Viscosity on the Formation of Secondary Organic Aerosol from Isoprene Epoxydiols (IEPOX) in Phase Separated Particles, ACS Earth Space Chem., 3, 2646–2658, 2019.
Zheng, Y., Thornton, J. A., Ng, N. L., Cao, H., Henze, D. K., McDuffie, E. E., Hu, W., Jimenez, J. L., Marais, E. A., Edgerton, E., and Mao, J.: Long-term observational constraints of organic aerosol dependence on inorganic species in the southeast US, Atmos. Chem. Phys., 20, 13091–13107, https://doi.org/10.5194/acp-20-13091-2020, 2020.
Zhu, J., Penner, J. E., Yu, F., Sillman, S., Andreae, M. O., and Coe, H.: Decrease in radiative forcing by organic aerosol nucleation, climate, and land use change, Nat. Commun., 10, 423, https://doi.org/10.1038/s41467-019-08407-7, 2019.
Ziemann, P. J. and Atkinson, R.: Kinetics, products, and mechanisms of secondary organic aerosol formation, Chem. Soc. Rev., 41, 6582–6605, 2012.