the Creative Commons Attribution 4.0 License.
the Creative Commons Attribution 4.0 License.
 | 03 Mar 2021
Effects of marine fuel sulfur restrictions on particle number concentrations and size distributions in ship plumes in the Baltic Sea
Sami D. Seppälä
Joel Kuula
Antti-Pekka Hyvärinen
Sanna Saarikoski
Topi Rönkkö
Jorma Keskinen
Jukka-Pekka Jalkanen
Hilkka Timonen
Exhaust emissions from shipping are a major contributor to particle concentrations in coastal and marine areas. Previously, the marine fuel sulfur content (FSC) was restricted globally to 4.5 , but the limit was changed to 3.5 at the beginning of 2012 and further down to 0.5 in January 2020. In sulfur emission control areas (SECA), the limits are stricter: the FSC restriction was originally 1.50 , but it decreased to 1.00 in July 2010 and again to 0.10 in January 2015. In this work, the effects of the FSC restrictions on particle number concentrations (PNCs) and particle number size distributions (NSDs) are studied in the Baltic Sea SECA. Measurements were made on a small island (Utö, Finland; N, E) between 2007 and 2016. Ship plumes were extracted from the particle number size distribution data, and the effects of the FSC restrictions on the observed plumes as well as on the ambient concentrations were investigated.
Altogether, 42 322 analyzable plumes were identified during the 10-year measurement period. The results showed that both changes in the FSC restrictions reduced the PNCs of the plumes. The latter restriction (to 0.10 in January 2015) also decreased the ambient particle number concentrations, as a significant portion of particles in the area originated from ship plumes that were diluted beyond the plume detection limits. The overall change in the PNCs of the plumes and ambient air was 27 and 32 %, respectively, for the total FSC change from 1.50 to 0.10 . The decrease in the plume particle number concentration was caused mostly by a decrease in the concentration of particle sizes of between approximately 33 and 144 nm. The latter restriction also reduced the geometric mean diameter of the particles, which was probably caused by the fuel type change from residual oil to distillates during the latter restriction. The PNC was larger for the plumes measured at daytime than for those measured at nighttime, likely because of the photochemical aging of particles due to UV light. The difference decreased with decreasing FSC, indicating that a lower FSC also has an impact on the atmospheric processing of ship plumes.
- Article
(3003 KB) - Full-text XML
-
Supplement
(801 KB) - BibTeX
- EndNote


Particulate matter (PM) from shipping contributes to a significant fraction of PM10, PM2.5,, and PM1 in European coastal areas (1 %–7 %, 1 %–14 %, and ≥ 11 %, respectively) (Viana et al., 2014). PM from shipping emissions can also be transported hundreds of kilometers inland (Lv et al., 2018) and has been linked to increased cardiovascular mortality and morbidity (Lin et al., 2018). The reduction in PM2.5 emissions from shipping has been estimated to reduce the negative health effects (Barregard et al., 2019; Chen et al., 2019; Partanen et al., 2013; Sofiev et al., 2018). In multiple studies, shipping has also been reported to be a significant contributor to atmospheric particle number concentrations (PNCs) both in the sea and in coastal areas, especially in the ultrafine size range (Ausmeel et al., 2019; Gobbi et al., 2020; Karl et al., 2020; Kivekäs et al., 2014; Kukkonen et al., 2016; Zanatta et al., 2020). The atmospheric PNC has been considered to cause significant negative health effects, such as airway inflammation, impaired lung function, and cardiovascular mortality (Hennig et al., 2018; Strak et al., 2012).
Sulfur dioxide (SO2) is a gaseous air pollutant that is harmful to human health and the environment. Fossil fuels commonly contain sulfur that forms sulfur oxides (SOx) during combustion (Arnold et al., 2006; Hoang and Pham, 2018). Most of the sulfur in diesel fuels are oxidized to SO2 (Kozak and Merkisz, 2005; Walker, 2004); however, some SO2 is further oxidized to SO3 (3 %–5 %; Cordtz et al., 2013). In the high-temperature exhaust, it is already possible for SO3 to react with water molecules, resulting in the formation of gaseous sulfuric acid (GSA) (Arnold et al., 2012; Rönkkö et al., 2013). When the exhaust is cooled immediately after its emission into the atmosphere, the saturation ratio of GSA increases quickly, leading to the homogenous nucleation of sulfuric acid and water (Arnold et al., 2006; Kozak and Merkisz, 2005) which is possibly supported by the exhaust of partly oxidized organic compounds (Arnold et al., 2012; Pirjola et al., 2015). After leaving the exhaust pipe, sulfuric acid also contributes to particle growth by condensing on existing particles formed in an engine, entrained aerosol particles, or newly formed nanoparticles (Arnold et al., 2006; Riipinen et al., 2012). It should be noted that the oxidation of emitted SO2 and the formation of sulfuric acid continues in the atmosphere, leading to the secondary formation of sulfuric acid and particulate matter (see, e.g., Mylläri et al., 2016).
Fuel sulfur content (FSC) has a large effect on the formed particles, and it has been reported to have a strong correlation with particle mass and number concentrations in ship exhaust emissions (Alföldy et al., 2013; Diesch et al., 2013). The effect is especially clear in the nanoparticle size range (Ushakov et al., 2013). Using fuels with lower FSC has been shown to reduce PM emissions (Lehtoranta et al., 2019), but the FSC also has an influence on the chemical composition of exhaust particles. Typically, ship plume particles consist of organic matter (OM), black carbon (BC), and an inorganic fraction that is almost entirely composed of sulfuric acid (Kumar et al., 2013). Sulfate and OM concentrations have both been reported to be dependent on FSC (Lack et al., 2009). Furthermore, the emission factors (EFs) of SO2 and organic carbon (OC) have been observed to decrease when fuels with lower FSC are used (Wu et al., 2020). In the study of Celik et al. (2020), OM was twice as large for fuels with an FSC of 2.5 (mass per mass percentage) compared with an FSC of 0.5 .
To reduce the harmful effects of ship emissions, restrictions for marine FSC have been set for emission control areas (ECAs) and global marine transportation (IMO, 2008). Previously, the limit for FSC was 4.5 globally, but it was changed to 3.5 at the beginning of 2012 and further down to 0.5 in January 2020. In sulfur emission control areas (SECAs) specifically, the FSC limit is lower and was changed from 1.50 to 1.00 in July 2010 and further to 0.10 in January 2015. In addition to these limits, the maximum FSC is limited to 0.10 (from the beginning of January 2010) for berthed ships in European Union ports (European Parliament and the Council of the European Union, 2005). The FSC limits and emissions control areas are described in more detail in IMO MARPOL Annex VI, Regulation 14 (IMO, 2020b). The decline in the real FSC of marine vessels has been shown to follow the FSC restrictions well (Kattner et al., 2015; Pirjola et al., 2014); therefore, the FSC limits can be expected to resemble the real maximum FSC of the fuels used. However, Pirjola et al. (2014) reported that during the FSC restriction period of 1.50 (before July 2010), some vessels were already using fuels with an FSC of less than 1.00 . This implies that the real FSC change has followed a gradual – rather than a stepwise – behavior, at least for the July 2010 restriction enforcement.
The long-term effects of shipping emissions on atmospheric particle characteristics have only been considered in a few studies in SECAs (Ausmeel et al., 2019; Kivekäs et al., 2014). In this study, a 10-year time series of particle number size distribution (NSD) data (from 2007 to 2016), measured near several busy shipping lanes on the island of Utö in the Baltic Sea SECA, was investigated. The effects of two changes in the FSC restrictions (from 1.50 to 1.00 and from 1.00 to 0.10 ) on the PNCs and NSDs of ship exhaust plumes and ambient aerosol are discussed, respectively. Additionally, the impacts of photochemical aging on ship exhaust plumes are investigated.
2.1 Utö measurement site
The PNC and NSD data were measured at the atmospheric measurement station of the Finnish Meteorological Institute (FMI) at Utö between 11 January 2007 and 31 December 2016. Utö is a small island (0.81 km2) at the southern edge of the Finnish archipelago in the Baltic Sea ( N, E), and it has a year-round population of 20 to 30 inhabitants. The exact location of the measurement station on the island is shown in Fig. 1. The measurement station and location have been described in detail previously (Engler et al., 2007; Laakso et al., 2018).
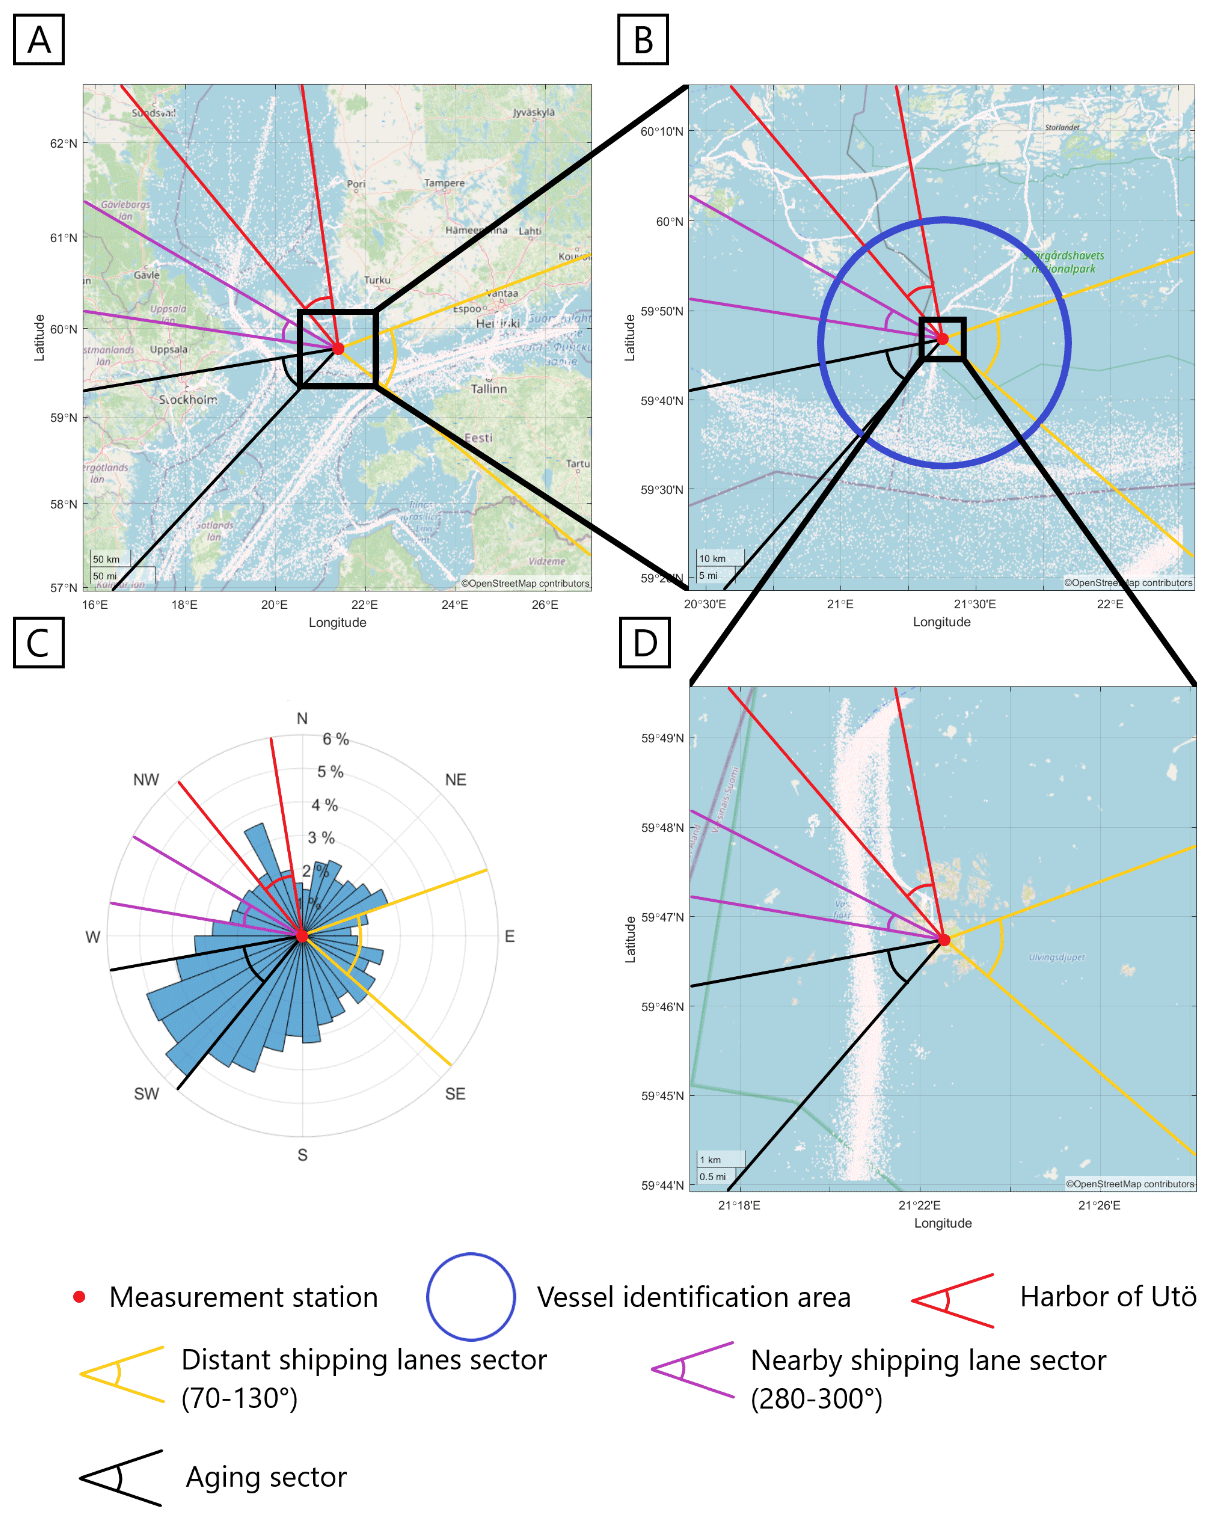
Figure 1(a) The location of Utö island and the locations of vessels with International Maritime Organization (IMO) numbers in a 360 000 km2 area around Utö. (b) The location of vessels with IMO numbers in a 10 000 km2 area around Utö. (c) Percentage of the time that wind was blowing from different directions during valid measurement periods divided into 10∘ sectors. (d) The location of vessels with IMO numbers in a 100 km2 area around Utö. White dots in panels (a), (b), and (d) mark the locations of vessels (0.01 %, 0.2 %, and 10 % of the locations plotted for panels (a), (b), and (d), respectively). The distant shipping lanes sector, aging sector, nearby shipping lane sector, and harbor of Utö are marked with colored lines. Base map and data from OpenStreetMap and OpenStreetMap Foundation (OSMF). Data from © OpenStreetMap contributors is licensed under the Open Data Commons Open Database License (ODbL) by the OSMF.
2.2 Ship routes and vessel types near Utö
Utö island is within the vicinity of busy shipping lanes. The closest shipping lane is on the western side of the island, about 500 m from the shore, and another busy shipping lane is 6 km south of Utö. Moreover, Utö has a pilot station and harbor with a regular passenger ferry connection to the mainland. The shipping routes near Utö are shown in Fig. 1. In Fig. 1, the data (white points) represent the Automatic Identification System (AIS) data from the Baltic Marine Environment Protection Commission (HELCOM). The AIS is a system that automatically produces and transmits information about vessels to other vessels and to coastal authorities (IMO, 2020a). This information includes the identity, type, position, course, speed, and navigational status of the vessel, as well as other safety-related information. Only a fraction of the AIS signals were plotted, as the total number of signals was excessive. In addition to estimating the presence and movement of vessels around Utö, the fractions of different types of vessels were also attained from the AIS data for this work. The AIS data were analyzed only for the vessels with IMO numbers, as these are larger vessels, and smaller vessels without IMO numbers are not likely to contribute significantly to identified plumes, as shown by Kivekäs et al. (2014).
The sectors of the nearby shipping lane, distant shipping lanes, the harbor of Utö, and aging (aging discussed in Sect. 3.6) are identified using colors in Fig. 1. While there is no clear upper limit to the distance from which the plumes may be arriving at the measurement station, a limit radius (blue circle) was set at 25 km to count the number of AIS signals. This limit was chosen so that the harbors of other islands to the northwest and northeast would not be included in the data, as they would have increased the number of AIS signals from berthed ferries extensively.
The AIS markings from ships within the 25 km radius from Utö were divided into 10∘ sectors (Fig. 2), and the activity of different types of vessels was estimated in each sector. As HELCOM AIS signals are recorded every 6 min, the residence time (RT) of vessels occupying different sectors could be estimated by giving every AIS signal a 6 min RT. These RTs were plotted for the three FSC restriction periods and are presented in Fig. 2. Based on the HELCOM AIS data, the vessels were classified into six different categories best representing their specific type: cargo ships, large passenger ships, medium-sized passenger vessels, large work vessels, small vessels, and other.
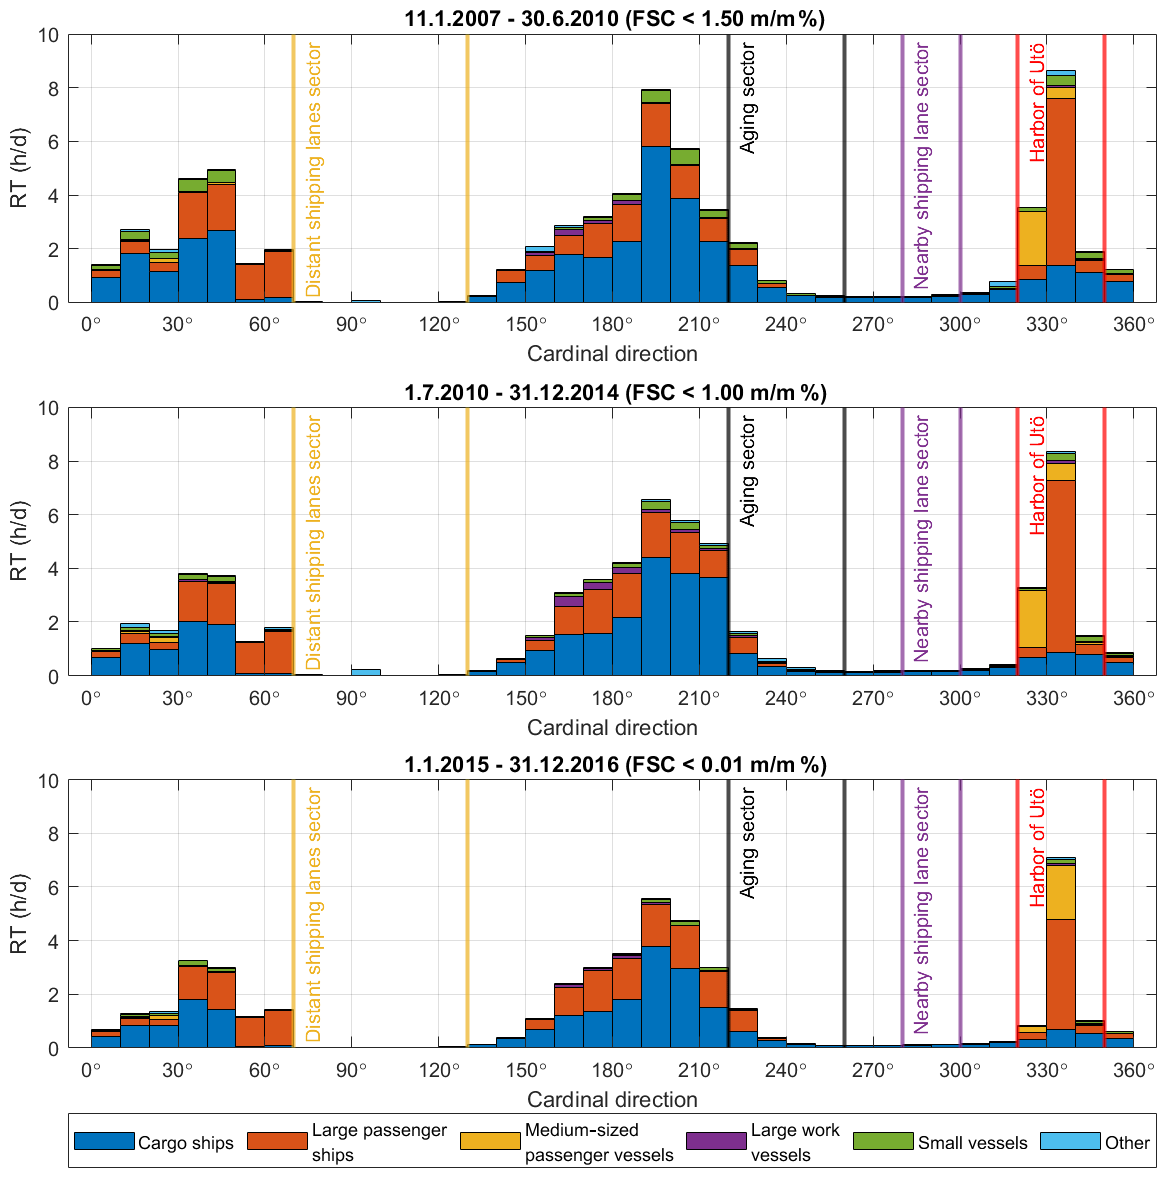
Figure 2Ship types around Utö during the different fuel sulfur content (FSC) restriction periods: (a) FSC < 1.50 (11 January 2007–30 June 2010), (b) FSC < 1.00 (1 July 2010–31 December 2014), and (c) FSC < 0.10 (1 January 2015–31 December 2016). Ship types were classified as cargo ships, large passenger ships, medium-sized passenger vessels, large work vessels, small vessels, and other. On the y axis, RT is the average residence time in hours per day of ships in the category in each of the 10∘ sectors given on the x axis. The distant shipping lanes sector, aging sector, nearby shipping lane sector, and harbor of Utö are marked using pairs of vertical lines.
The majority of the vessels around Utö were cargo and large passenger ships. While the amount of passenger vessel traffic and the distribution of traffic between the sectors remain almost the same among the different periods, the total amount of shipping, estimated from the total RT of vessels decreased from 71.1 (FSC < 1.50 ) to 64.2 (FSC < 1.00 ) and to 48.7 h d−1 (FSC < 0.10 ). This reduction was mostly caused by reduced cargo shipping activity. Notable is also that there were almost no vessels detected in the eastern directions (70–130∘). The RT of vessels on the western side of the island was low because the ships in the nearby shipping lane passed through the sectors quickly. The high number of passenger vessels in the 330–340∘ direction was due to the signals from berthed ferries at the Utö ferry harbor.
2.3 Particle measurement instrumentation
The aerosol was sampled with a PM2.5 inlet, which was positioned on the roof of the measurement container approximately 3 m above the ground. NSDs and PNCs were measured with a differential mobility particle sizer (DMPS). Before entering the DMPS, the sample aerosol was dried with a Nafion dryer. The DMPS consisted of a 28 cm long Vienna-type differential mobility analyzer (DMA) and a continuous flow condensation particle counter (CPC). The CPC was a TSI Model 3010. The theory and the response functions of the DMA were first described in Hoppel (1978). The particle size range of the DMPS was 7–537 nm, and the size spectra were given in 30 size bins. DMA losses were assumed to be 15 % independent of the particle size based on laboratory tests. The time resolution of the instrument was 5 min 20 s. During the measurements, parts of the DMPS, including the CPC, were changed a few times due to malfunctions.
2.4 Data processing method for plume identification
First, the concentration peaks caused by local sources (e.g., a tractor passing by) were removed from the DMPS data. Identification of the peaks caused by local sources was done by examining the time series of the ambient number size distribution (NSDtot) and ambient particle number concentration (PNCtot) visually, as the concentration peaks from tractors, for example, were expected to last only tens of seconds, whereas the durations of the ship plumes are measured in minutes. Second, the days with only four or fewer measurement cycles were removed from further analysis to ensure the representativeness of the data. The remaining data were characterized as the cleaned data. The coverage of the cleaned data varied between ∼ 26 % and 96 % depending on the year. The figure presenting the data coverage is presented in the Supplement (Fig. S1).
Plumes emitted from the ships were separated from the cleaned DMPS data using a modified version of the plume detection method developed and tested by Kivekäs et al. (2014). The method was originally developed for scanning mobility particle sizer (SMPS) data, but it is also applicable for the DMPS data. As the method is described in detail in Kivekäs et al. (2014), only a short description of the method, the modifications made to it, and otherwise relevant information is given below.
The identification of plumes assumes that ship plumes entail a significantly higher particle concentration than the natural background particle number concentration (PNCbg). The PNCbg was defined as a sliding 25th percentile of 40 consecutive measurements, and the excess particle number concentration (PNCe) was calculated by subtracting the background concentration from the PNCtot. Maxima of the PNCe were examined if they fulfilled at least one of the two criteria set for the plume detection:
-
the PNCe had to be at least 500 cm−3, or
-
the ratio of the PNCtot to PNCbg (Re) had to be at least 1.5.
When one of the abovementioned criterion was fulfilled, the PNCe was considered to be caused by a ship plume and is hereafter referred to as the particle number concentration in the plume (PNCpl). In Fig. 3, a typical day with plumes exceeding both limits is presented. Periods during which the red dotted line exceeds the black vertical line are considered ship plumes. If two consecutive peaks exceed the detection limit and are separated by a lower concentration, they are considered as two separate plumes. In terms of number size distributions, the studied NSDs are excess number size distribution (NSDe) values, which are calculated by subtracting the background number size distribution (NSDbg) values from the ambient number size distribution (NSDtot) values.

Figure 3An example of the time series of (a) the number size distribution of excess particles (NSDe), (b) the particle number concentration of excess particles (PNCe), and (c) the ratio of the ambient particle number concentration to the background particle number concentration (Re) for a single day. In panels (b) and (c) the plume detection limits have been marked with black lines.
As shown by Kivekäs et al. (2014), fast and large changes in the PNCbg can cause an error in the detected plumes during these changes. These errors occurred as the sliding 25th percentiles used for defining PNCbg reacted roughly 10 measurement points too early to decreasing concentrations and 10 measurement points too late to increasing concentrations. This could have caused distortions in the plumes measured during the fast PNCbg change, or the fast changes could themselves have been counted as plumes. Therefore, the fast PNCbg changes were excluded from the data, and the data were divided into valid and invalid data periods by counting the absolute and relative change rates in PNCbg and calculating the smoothed sliding average of six consecutive measurement points. When the absolute or relative change in the smoothed value was greater than ±53 cm−3 or ±5 %, respectively, the data were marked as invalid. These values were set so that they corresponded to 67 % of what was needed to define a plume. This validation procedure is described in detail in Kivekäs et al. (2014). Another factor that could have caused uncertainty in the detected plumes is the relatively long measurement cycle of the DMPS (5 min 20 s). However, the large data set means that the effect of these uncertainties is small. The errors related to the long measurement cycle are discussed in more detail in the Supplement.
3.1 Detected exhaust plumes
During the 10-year measurement period, a total of 71 811 ship exhaust plumes were observed, and, based on the data validation procedure described in the experimental section, 42 322 (∼ 59 %) of these were considered valid and representative. The number and the frequency of the valid plumes are shown in Fig. 4 as a function of wind direction (in 10∘ sectors). The two directions with the highest numbers of plumes (Fig. 4a) were 220–250 and 330–340∘. The peak observed in the 330–340∘ direction corresponds to the highest number of AIS markings, and it is the direction where both the Utö ferry harbor and pilot station are located. The second-largest number of plumes came from the 220–250∘ direction, where only a few AIS signals were observed within a 25 km radius. Similarly, a noticeable number of plumes were detected coming from the 70–130∘ direction, even though there were very few AIS signals in that direction. This indicates that some of the detected plumes had a distant source, which, for these directions, is likely to be the shipping lanes situated further away. However, not all of the emissions from these distant shipping lanes are expected to be detected as plumes, as they are probably too diluted to be unidentifiable by the detection method. Therefore, it is likely that the plumes detected from these directions were originally plumes with high initial concentrations. When the numbers of plumes are normalized by the duration of winds blowing from each direction (Fig. 1c), the plume frequencies from different wind directions are more even (Fig. 4b). Exceptions to this are the 50–110∘ direction, which includes the longest distance to the shipping lane, and the direction of the Utö ferry harbor (330–340∘), where the residence time of the berthed vessels is high (Fig. 2).
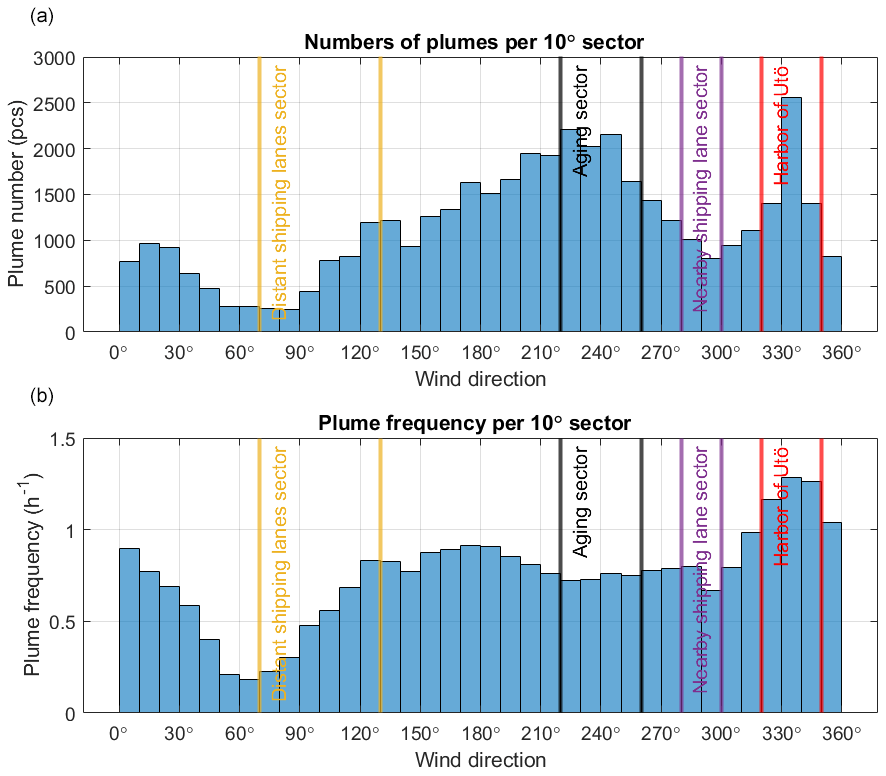
Figure 4(a) Number of valid plumes and (b) the frequencies of the plumes per hour from different wind directions during valid time periods. The distant shipping lanes sector, aging sector, nearby shipping lane sector, and harbor of Utö are marked using pairs of vertical lines.
3.2 Particle number concentrations of exhaust plumes
Particle number concentrations of the plumes (PNCpl) were averaged annually, and the annual data were averaged over the FSC restriction periods (Fig. 5). The results showed that the FSC restrictions were effective: the average PNCpl decreased from 1379 ± 30 (1.50 ) to 1290 ± 170 (1.00 ) and further down to 1010 ± 90 cm−3 (0.10 ). Moreover, the two lowest annual average PNCpl values (940 ± 990 and 1070 ± 920 cm−3) were observed during the 0.10 FSC restriction period, and three out of the four highest annual averages (1430 ± 2080, 1370 ± 780, and 1355 ± 2120 cm−3) were measured during the 1.50 restriction period. Notable is also that the standard deviations are significantly lower for the annual averages measured with the tighter FSC restriction periods, indicating that especially the fraction of plumes with very high concentrations have decreased. However, unexpectedly, the highest annual average (1570 ± 2100 cm−3) as well as the largest variability in the PNCpl (the widest 25th and 75th percentile range) were observed in 2014. Numerous intense nucleation events occurred in 2014; however, they are likely to have been identified as invalid data and, therefore, do not affect the detected plumes.
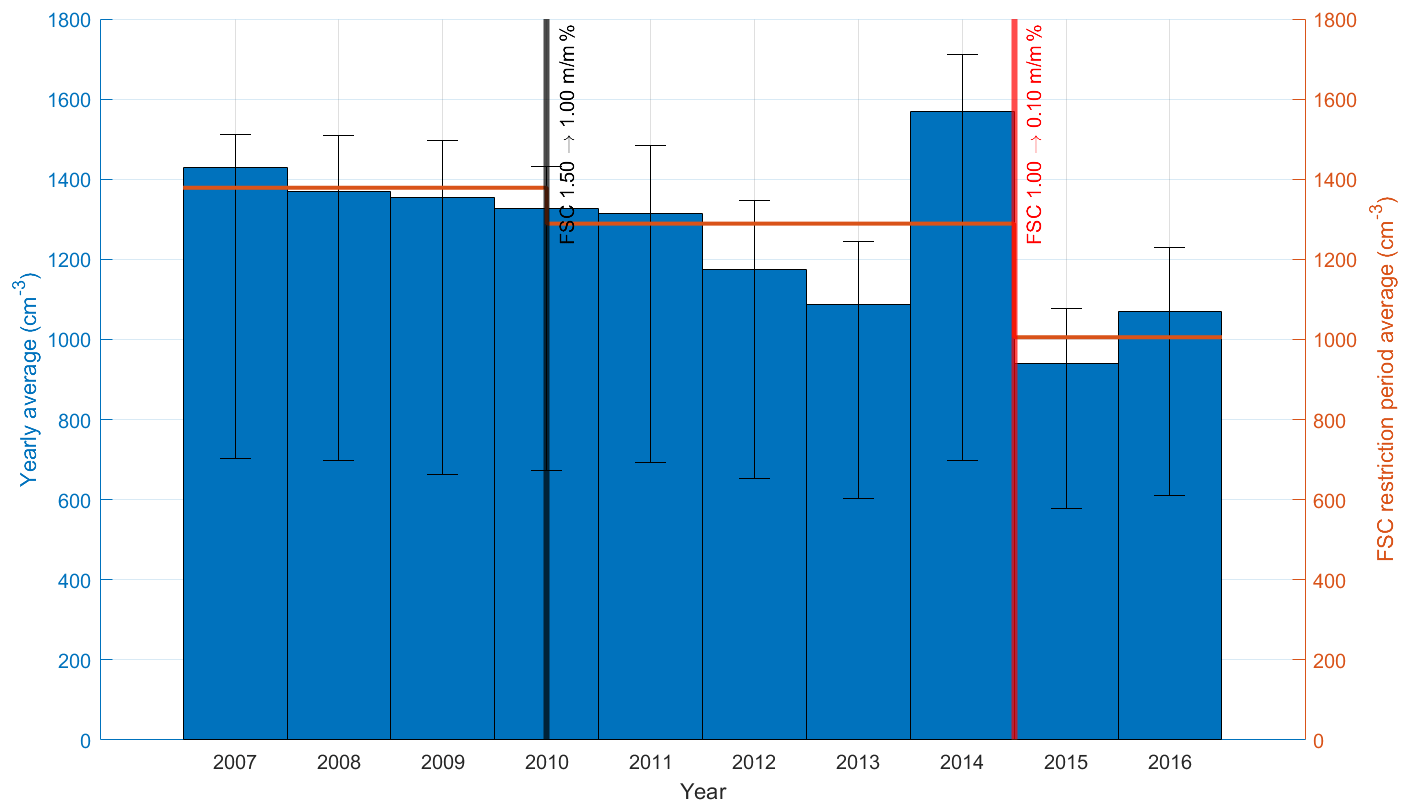
Figure 5Annual average particle number concentrations of plumes (PNCpl, blue bars), and the average PNCpl during different FSC restriction periods (orange lines). Changes in the FSC restrictions are marked with the black and red vertical lines. The 25th and 75th percentiles are marked with the black error bars.
PNCpl values attained in this work are similar to the concentrations of plumes observed in similar studies: median PNC values of 700 and 1470 cm−3 were measured during winter and summertime in southern Sweden, respectively (Ausmeel et al., 2019). A noticeably higher PNC concentration (2100 cm−3) of ship plumes was measured with airborne measurements right over the shipping lane in the southern Baltic Sea by Zanatta et al. (2020) during the 0.10 FSC restriction. Concentrations observed by Zanatta et al. (2020) were likely higher due to the fresher plumes (plume age ∼ 200–800 s). Moreover, the small sample size (only nine continuous periods of single or multiple exhaust plumes, each lasting a couple of minutes at maximum) might cause statistical uncertainty in the results. In addition, the local meteorology, dilution, and the aging process of the plume, as well as the measured particle size range, may influence the measured concentrations at least to some degree.
In direct emission measurements, the PNC of raw ship exhaust emissions at idle have been reported as being 432 ± 1.83 × 10⁸ and 24.6 ± 0.26 × 107 cm−3 for heavy fuel oil (HFO) and marine diesel oil (MDO) (Anderson et al., 2015b), respectively, and in the range of 106–107 cm−3 after dilution by a ratio of 8 (Karl et al., 2020). Therefore, fresh exhaust emission PNC can be expected to be around 108 cm−3. Similar concentrations of 0.9–1.94 × 108 cm−3, depending on the fuel and engine load, were found by Zhou et al. (2019). As the concentrations measured from the plumes are in the range of 103 cm−3 in this study, the dilution ratio for the measured plumes is estimated to be approximately 1:105 to 1:107.
3.3 Particle number size distribution of the exhaust plumes
The average number size distributions observed for the plumes (NSDpl) are shown as a function of wind direction in Fig. 6. The NSDpl values were first divided into 10∘ sectors and then averaged. These averaged NSDpl values were interpolated to form a continuous distribution. If the plumes had been plotted individually from every angle, the number of plumes from certain angles would have been very low (even zero), and the individual plumes would have had a disproportional effect on the distribution.
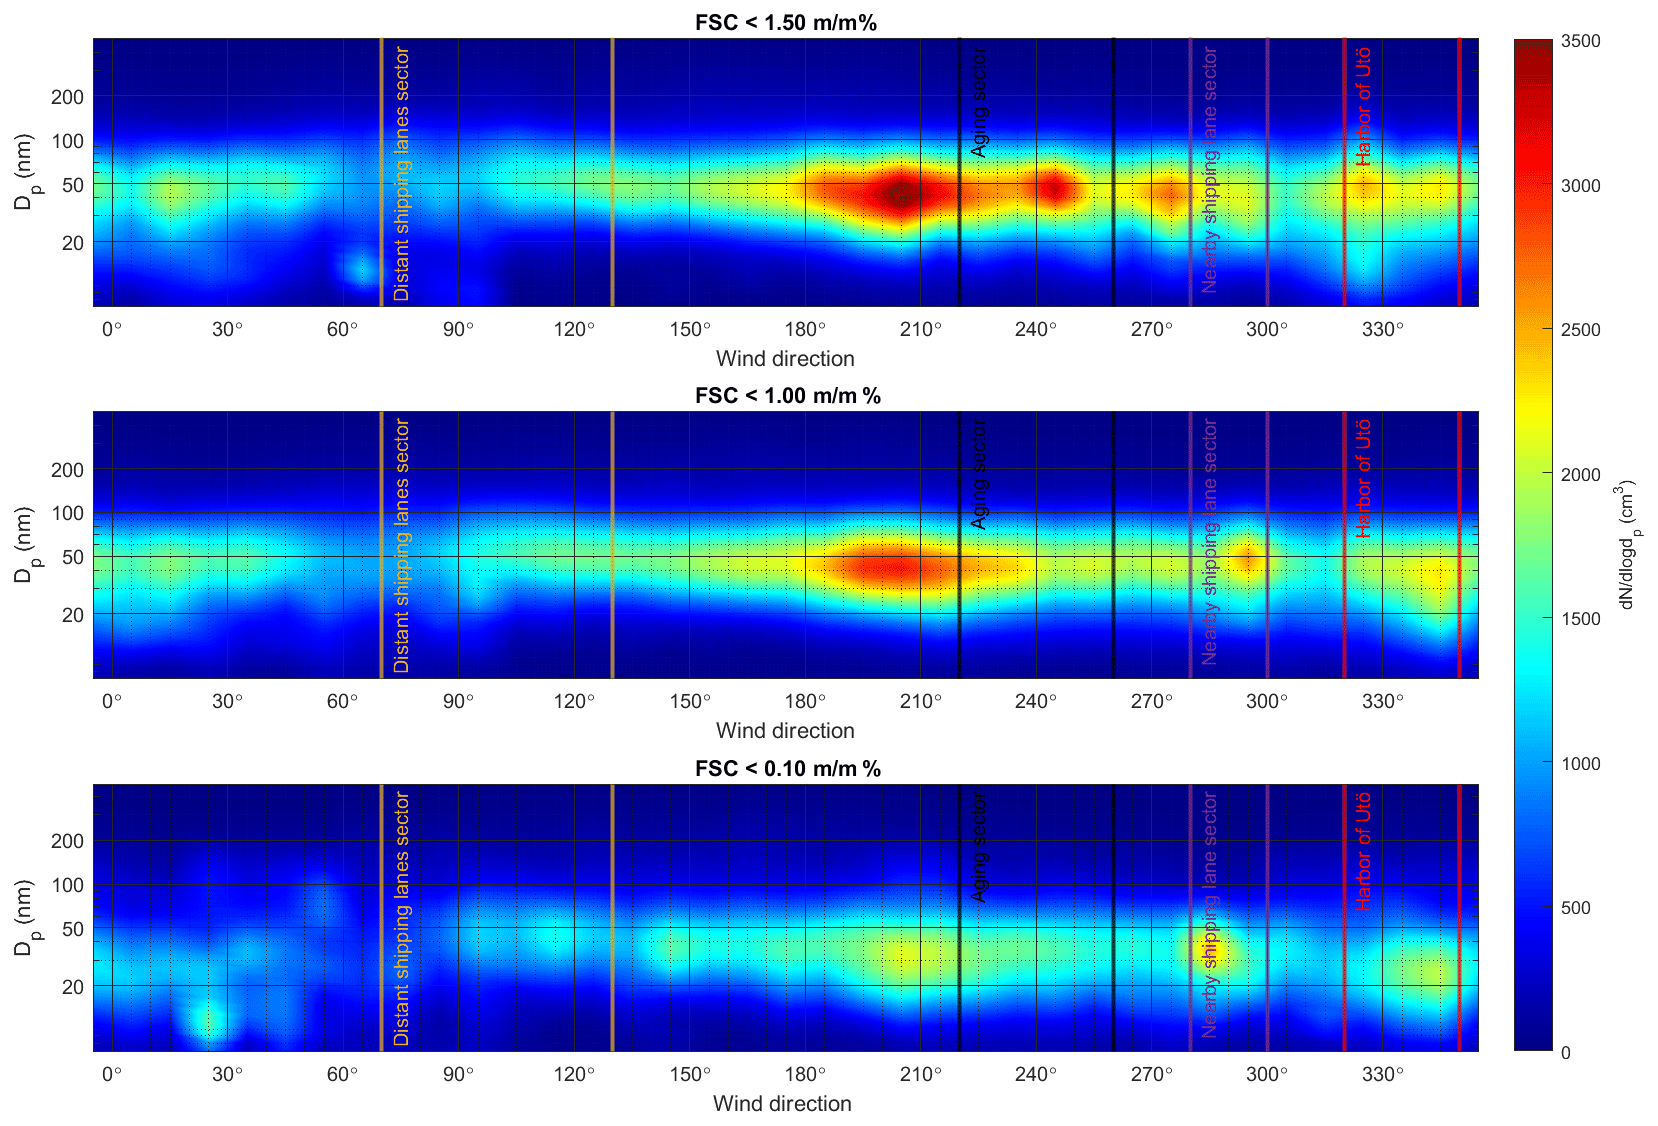
Figure 6Plume particle number size distributions (NSDpl; averaged for wind directions) for different fuel sulfur content (FSC) restrictions. Wind directions are shown on the x axis, particle mobility diameters (Dp) are shown on the y axis, and normalized particle number concentration (ddlogdp) are shown using colors. The distant shipping lanes sector, aging sector, nearby shipping lane sector, and harbor of Utö are marked using pairs of vertical lines.
The plumes with the highest PNCpl values arrived from the 190–240∘ sector, and the plumes with the lowest concentrations arrived from the 50–90∘ sector (Fig. 6). Near Utö, the 190–240∘ direction was the direction with the highest shipping activity, excluding the berthed ferries at Utö harbor (Fig. 2). Especially the cargo vessel activity in that direction was high. In contrast, the shipping activity was almost nonexistent near Utö in the 50–90∘ direction. PNCpl from the direction of the Utö ferry harbor (310–340∘) was generally lower than PNCpl from the plumes arriving from between 190 and 240∘, despite the fact that many of the plumes were expected to have originated from berthed ferries at the harbor (Fig. 1d). This might be due to the small size of the berthed ferries, which produced smaller amounts of particulate matter. The small ferries also operated on distillate fuels during all of the FSC restrictions. Distillate fuels have been shown to produce lower particulate emissions for lower engine loads (Zhou et al., 2019).
Stricter FSC limits were seen as a decreased PNCpl in the direction of nearby ship traffic (Fig. 6). The effect was visible after both restriction changes, but the decrease was significantly larger after the change in the FSC restriction from 1.00 to 0.10 . In addition to PNCpl changes, the change in the FSC limit from 1.00 to 0.10 was observed to reduce the particle size. To the knowledge of the authors, no previous studies have reported on the effects of FSC on particle sizes and concentrations from atmospheric exhaust plume measurements. Furthermore, the results from direct emission measurements are divided in the literature: Zetterdahl et al. (2016) reported that the stricter FSC limits reduce the particle size, but not the produced PNCpl, whereas studies such as Streibel et al. (2017) found lower emission factors for PNCpl and larger particle size when using distillate fuels instead of HFO.
From the 190–210∘ direction, the PNCpl values were significantly higher than from the 260–280∘ direction. The reason for this was investigated by calculating the fractions of specific ship types observed within these areas. These fractions are presented in the Supplement (Fig. S2). No significant difference was observed except for the higher fraction of roll-on/roll-off passenger vessels between 190 and 210∘. Therefore, the difference in the concentrations is not likely to be related to different ship fleets, but it could be caused by the meteorology of the area. The lower concentrations of the plumes between 260 and 280∘ might be caused by higher vertical dilution, or the plumes might be transported higher up in the marine boundary layer. However, the effect of meteorology could not be validated. In terms of plume number size distributions, it is notable that most of the plume particles were smaller than 100 nm in diameter or even smaller than 50 nm in the case of the 0.10 FSC restriction (Fig. 6). Therefore, the contribution of ship emissions to particle mass is likely to be small, and the characterization of ship plumes should be based on number concentrations rather than mass concentrations in plumes. This has also been proposed by Viana et al. (2014).
The geometric mean diameters (GMD) of particles in plumes were calculated and are shown as a function of wind direction in Fig. 7. The GMD remained almost unaltered during the change in the FSC restrictions from 1.50 to 1.00 . However, the FSC restriction change from 1.00 to 0.10 significantly reduced the GMD of particles arriving from all wind directions. Overall, the largest GMD of the plumes was observed from the eastern and southeastern directions (60–170∘), where the distance to the shipping lanes is large, and the smallest GMD was seen for the plumes from the north to northwestern directions (300–330∘), which is the direction of Utö ferry harbor. This variation in the GMD from a minimum of 36, 39, and 31 nm to a maximum of 58, 55, and 51 nm for the FSC restrictions of 1.50 , 1.00 , and 0.10 , respectively, implies that particles either grow significantly or small particles evaporate when they are transported in the atmosphere. Zanatta et al. (2020) found a similar behavior: increasing particle size as the age of the plumes increased. The atmospheric processing of plume particles is discussed more in Sect. 3.6.
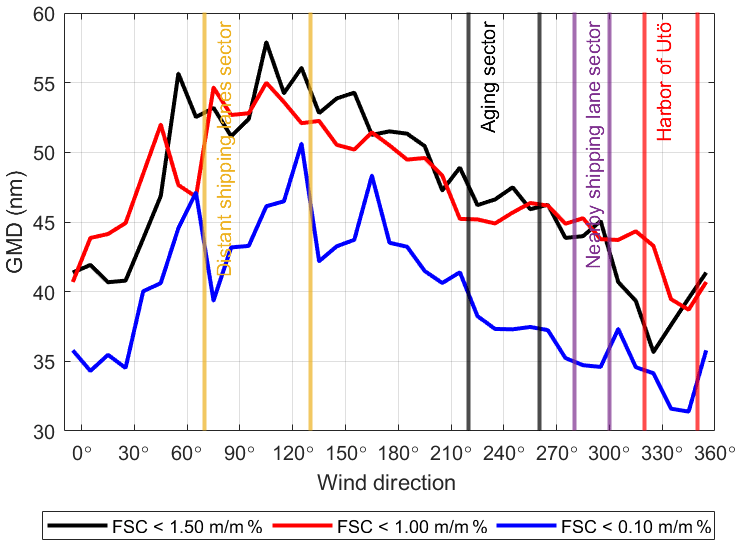
Figure 7Average geometric mean diameters (GMD) of particles in plumes originating from different directions during the different fuel sulfur content (FSC) restrictions. The distant shipping lanes sector, aging sector, nearby shipping lane sector, and harbor of Utö are marked using pairs of vertical line.
In direct emission measurements, the FSC has been specifically related to produced nanoparticles, and the effect on the larger particles has been observed to be smaller (Ushakov et al., 2013). Therefore, in this work, particles were divided into two size ranges (7–144 and 144–537 nm), and their concentration changes were studied separately. The two size ranges were calculated from the DMPS bins of 1–21 and 22–30. The size ranges were chosen based on testing to find a limit for the effects of the FSC restrictions on PNCpl values. Average NSDpl values for all the plumes during different sulfur restrictions are presented in the Supplement (Fig. S3). From these distributions, it is visible that the particle size of 144 nm acts as a limit for the effects of the FSC restrictions.
Based on the two size ranges, FSC restrictions were more effective in particles between 7 and 144 nm. The PNCpl of the smaller particles decreased clearly, whereas that of the larger particles remained almost unchanged when the FSC limit became tighter (Fig. 8). PNCpl values were also calculated using slightly different size ranges, and a figure with ranges from 7 to 125 and from 125 to 537 nm is presented in the Supplement (Fig. S4). The figure shows that if the lower limit for the larger particle size is below 144 nm, the change in the FSC restriction is also seen in the larger size class as reduced PNCpl values after the FSC change from 1.00 to 0.10 . Therefore, the effect of sulfur restrictions seems to be mostly limited to the PNCpl in particle sizes smaller than 144 nm.
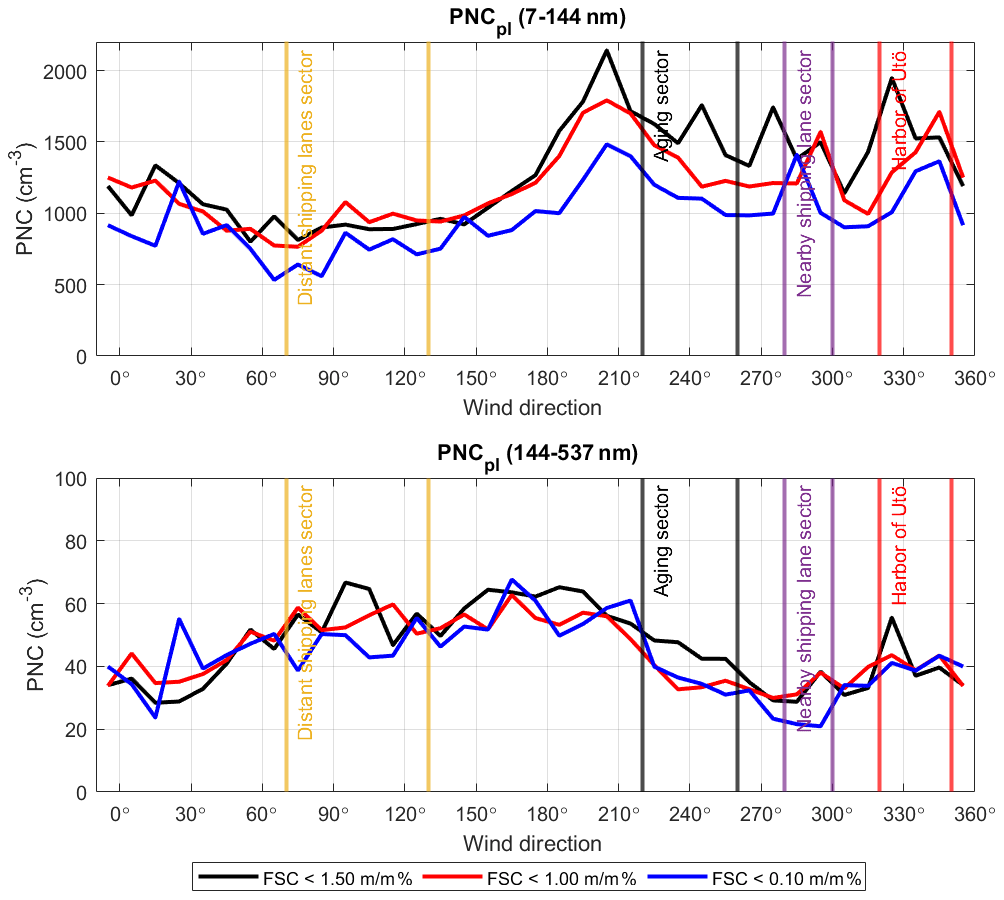
Figure 8Particle number concentrations of the plume particles (PNCpl) in size ranges from 7 to 144 nm and from 144 to 537 nm averaged for the 10∘ sectors. The distant shipping lanes sector, aging sector, nearby shipping lane sector, and harbor of Utö are marked using pairs of vertical lines.
The PNCpl in the smaller size range (7–144 nm) was observed to be highest when the wind was blowing from the 190–340∘ direction (Fig. 8), where there is plenty of shipping activity nearby (e.g., the nearby shipping lane and Utö harbor; see Fig. 1d). In contrast, the PNCpl of the larger size range (14–537 nm) was highest when the wind was blowing from the 60–210∘ direction, where there is a significant amount of ship traffic at longer distances from the measurement site (see Fig. 1a). This supports the assumption that particles grow to larger particle sizes in the atmosphere through atmospheric processing (e.g., condensation) and that the increased GMD is not only due to the evaporation of small particles. For the larger particle size range (144–537 nm), the similarity of the shapes of the PNCpl patterns in different FSC restriction periods also indicated that the ship fleet was responsible for the plumes and that the shipping routes have stayed relatively constant between different restriction periods. This strengthens the assumption that the differences observed in this study were caused by the FSC restriction changes and not by the change in the ship fleet.
3.4 Plume number size distributions for shipping lane sectors
To investigate the number size distributions of plumes (NSDpl) in more detail, two sectors, distant shipping lanes (70–130∘) and nearby shipping lanes (280–300∘), were chosen for a separate analysis. The sectors were selected so that the distant shipping lane represented plumes that were transported longer distances, whereas nearby shipping lanes represented fresher plumes. These assumptions of plume ages are based on the locations of the shipping lanes (Fig. 1), the GMDs of the plumes (Fig. 7), and the dependency of particle concentrations on wind directions (Fig. 8). Even though the GMDs for the plumes from the harbor of Utö (320–350∘) were the smallest, they were not included, as a large number of these plumes were expected to have originated from the berthed ferries operating on fuel with FSC < 0.10 during all three FSC restriction periods. In the case of distant shipping lanes (70–130∘), it was noted (Fig. 2) that there were no additional vessels between the measurement station and the shipping lanes (a distance of ∼ 25 km). In the nearby shipping lanes sector, almost all of the AIS markings were from cargo vessels from the nearby shipping lane (a distance of ∼ 1–2 km).
For both the nearby and distant shipping lane sectors, the shapes of the NSDpl remain nearly unchanged after the change from the 1.50 FSC restriction to the 1.00 restriction (Fig. 9). In the distant shipping lanes sector, the GMD shifted from 51 to 49 nm when the FSC restriction changed from 1.50 to 1.00 , and in the nearby shipping lanes sector, this change was from 40 to 41 nm. After the FSC restriction changed from 1.00 to 0.10 , the shape of the NSDpl altered more clearly as the GMD of the particles shifted to significantly smaller particle sizes: from 49 to 44 nm in the distant shipping lanes sector (70–130∘) and from 41 to 32 nm in the nearby shipping lane sector (280–300∘). This reduction in the particle size with decreasing FSC has also been reported by Zetterdahl et al. (2016), who observed a decrease in the particle size mode from 34 to 19 nm in the raw exhaust gas of ships using fuels with an FSC of 0.48 and 0.092 , respectively.

Figure 9(a) Average number size distribution of the plumes (NSDpl) from the nearby shipping lanes sector (280–300∘) and (b) from the distant shipping lanes sector (70–130∘) during the three fuel sulfur content (FSC) restriction periods. (c) Change in NSDpl in the nearby shipping lanes sector (280–300∘) and (d) in the distant shipping lanes sector (70–130∘) caused by the changes in the FSC restriction.
The NSDpl shapes from the distant shipping lanes sector (70–130∘) were observed to be bimodal, consisting of a nucleation mode with larger particle number concentrations at ∼ 30–60 nm and a soot mode with smaller number concentrations at ∼ 100–200 nm. The mode in the particle sizes larger than 100 nm in ship emission exhaust has been identified to be a soot mode (Ntziachristos et al., 2016). A similar NSD shape was attained for ship diesel exhaust emissions from direct emission measurements by Corbin et al. (2020): similar proportions between the nucleation and soot modes and with the nucleation mode particle size being slightly smaller (∼ 35 nm). This might be because the plumes measured in this study had time to grow in the atmosphere, as indicated in Fig. 7. In the literature, NSDs of ship plumes have been typically observed to be unimodal (Celik et al., 2020) or bimodal (Petzold et al., 2008), whereas emissions measured directly from the engine exhaust are often bimodal. (Anderson et al., 2015a; Ushakov et al., 2013). In addition to the former, trimodal NSDs measured directly from the marine engine exhaust have also been reported by Tian et al. (2014), who found a distinct volatile mode at 15 nm and two combustion-related modes at 38 and 155 nm.
3.5 Particle concentrations and size distributions in ambient air
The main focus of this work was to investigate the effects of the FSC restrictions on ship plumes; however, shipping emissions are also expected to contribute to the ambient particle number concentrations (PNCtot, including background concentrations, PNCpl, and the part of PNCe that was not considered as valid plumes) at Utö. The annual average PNCtot was calculated for each year (2007–2016) and averaged for the different FSC restriction periods (Fig. 10). The average PNCtot was almost the same during the FSC 1.50 (2910 ± 110) and 1.00 (2960 ± 1140 cm−3) restriction periods. However, after the FSC restriction was set to 0.10 , the average PNCtot decreased significantly (to 1970 ± 200 cm−3) probably because of the switch between heavy residual fuels and lighter distillates. The distillate fuels with lower FSC values have been shown to produce lower particle emissions (Zhou et al., 2019).
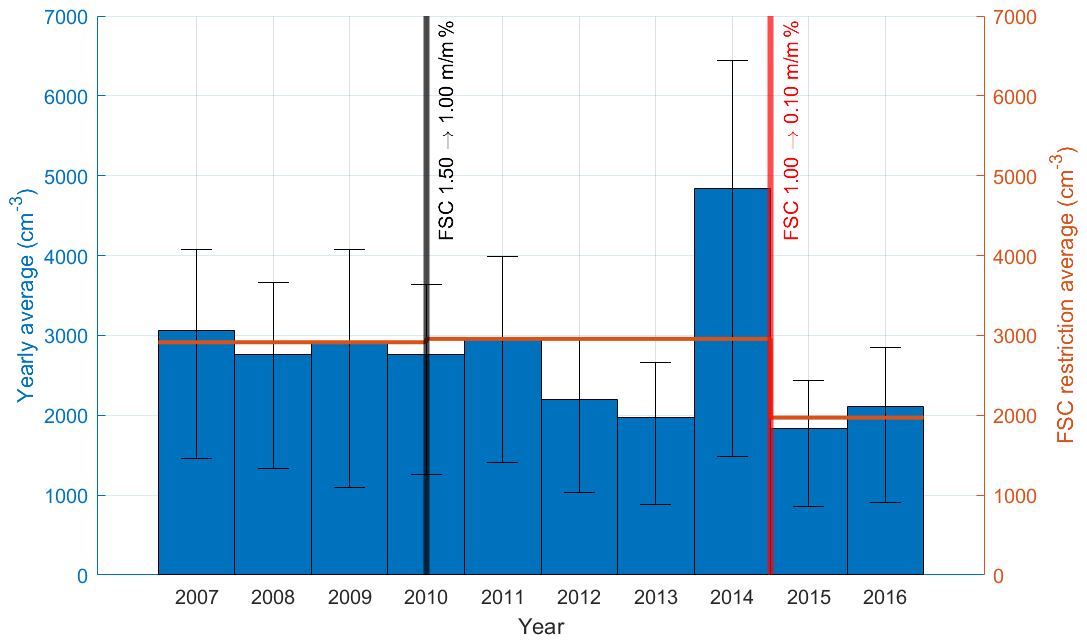
Figure 10Annual average ambient particle number concentrations (PNCtot, blue bars) and the average PNCtot values (orange lines) during the different FSC restrictions. Changes in the FSC restrictions are marked with the black and red vertical lines. The 25th and 75th percentiles are marked with the black error bars.
Despite the more stringent FSC restriction, the annual average PNCtot was as high as 4840 ± 5270 cm−3 in 2014. This was attributed, at least partially, to the numerous intense nucleation events occurring in that year (see Fig. S5 in the Supplement for an example of a nucleation event). These nucleation events increased the concentrations of small particles severalfold, and the concentration levels remained elevated for extended periods. These events fulfilled the criteria for the nucleation event set by Dal Maso et al. (2005): the appearance of a new mode in the size distribution in the nucleation mode size range that prevails over several hours and shows signs of growth. These criteria differentiate from the ship plumes, as the ship plumes last much shorter periods and do not show significant growth. Moreover, the plumes even had the NSDpl peak at larger particle sizes (∼ 30–60 nm) compared with the definition of the nucleation mode (3–25 nm) by Dal Maso et al. (2005). The existence of the nucleation events is also indicated by the much larger variability in the PNCtot values in 2014 than in the other years (Fig. 10).
To further investigate the effects of FSC restriction changes on the ambient aerosol at Utö, the average ambient number size distribution (NSDtot) values were plotted as a function of the wind direction for the three FSC restriction periods (Fig. 11). The highest PNCtot values were observed during the 1.50 and 1.00 FSC restrictions with the wind directions between 90 and 120 and between 170 and 220∘, with some elevated PNCtot values between 270 and 290∘. During the 0.10 FSC restriction, the PNCtot was also elevated in the same directions; however, the average PNCtot values were significantly lower. The highest PNCtot was observed in the size range from 40 to 100 nm, which is a typical size range for ship emission particles (Alanen et al., 2020; Celik et al., 2020; Jonsson et al., 2011; Petzold et al., 2008; Westerlund et al., 2015). All of the sectors with elevated PNCtot values correlated well with the distant shipping lanes (directions of distant shipping lanes estimated from Fig. 1a: 80–110, 170–250, and 270–290∘), indicating that a large fraction of the measured background particle concentrations in the 7–537 nm size range originated from the distant, diluted ship plumes. The fact that a large fraction of PNCtot is from diluted ship plumes is also supported by evidence that the elevations of PNCtot in the directions of the distant shipping lanes decrease with more stringent FSC restrictions. However, the effect of FSC restriction changes on the PNCtot might be slightly exaggerated, as the shipping activity in the immediate area of Utö has also decreased (Fig. 2). The change in ship traffic on the distant shipping lanes, however, was not directly studied and might differ from the change seen in Fig. 2. In a previous study by Kecorius et al. (2016), it was found that ambient PNCtot increased by 26 %–53 % when an air mass was transported over the Baltic Sea, and most of the increase was related to shipping traffic.

Figure 11Ambient number size distributions (NSDtot) averaged for wind directions. Wind directions are shown on the x axis, particle mobility diameters are shown on the y axis, and normalized particle number concentrations (ddlogdp) are shown using colors. Directions in which there are shipping lanes at least partially aligned with the wind directions are marked using pairs of vertical lines (black, red, and white). These shipping lanes have been estimated from Fig. 1a.
The ship exhaust plumes arriving from long distances are not observed as individual plumes, as they do not cause detectable peaks in the data due to excessive dilution. Excessive dilution causing ship plumes to become undetectable has also been presented in other studies: Kecorius et al. (2016) reported that ship plumes were undetectable when plumes arrived from at least 100 km away ; Petzold et al. (2008) estimated that ship exhaust plumes become entirely mixed with the marine boundary layer within 24 h; and Chen et al. (2005) found that, due to the dispersion, the lifetime of a plume was 2.5 ± 0.6 h when the detection criteria were the same as the second criteria used in this study (Re>1.5). As the FSC restrictions seem to affect both PNCpl and PNCtot, they have a larger effect on the air quality than one would assume from the direct effects measured from nearby ship exhaust plumes alone.
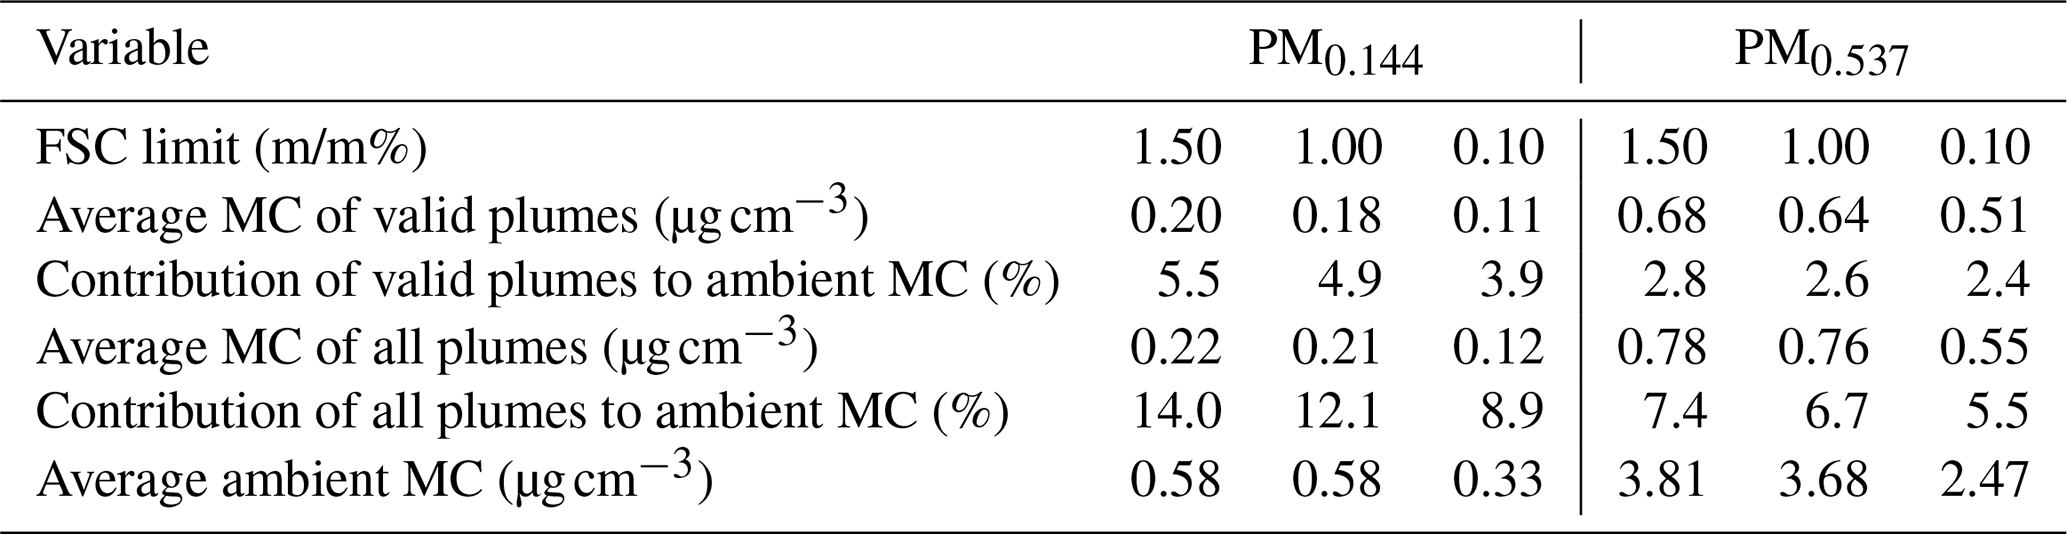
From the NSDpl and NSDtot values, the masses of PM0.144 and PM0.537 (PM of particles smaller than 144 and 537 nm, respectively) were calculated. Both PM0.144 and PM0.537 were calculated for the valid plumes and for all measured plumes. Moreover, the contributions of both to ambient PM0.144 and PM0.537 were calculated by taking the duration and number of the plumes into account (Table 1). Both the valid plumes and all of the plumes were calculated to give approximate lower and upper limits for the contributions, respectively, as valid plumes almost certainly did not include all of the plumes, and all of the measured plumes likely also included other phenomena in addition to plumes. A steady decrease in the contributions of the ship plumes to PM0.144 and PM0.537 can be seen after the FSC restriction changes with the contributions decreasing overall from 5.5 %–14.0 % (31.6–80.8 ng m−3) to 3.9 %–8.9 % (12.9–29.8 ng m3) for PM0.144 and from 2.8 %–7.4 % (106.3–283.3 ng m−3) to 2.4 %–5.5 % (60.0–136.2 ng m−3) for PM0.537. Similar values of 34 ± 19 ng m−3 (summer) and 18 ± 8 ng m−3 (winter) for PM0.15 during the 0.10 FSC restriction period were reported by Ausmeel et al. (2020). The contribution to PM0.5 reported by Ausmeel et al. (2020) is slightly lower compared with this study: 37 ± 20 ng m−3 (summer) and 29 ± 13 ng m−3 (winter). An important thing to note is that these contributions are only the direct contributions of the detected plumes to ambient PM0.144 and PM0.537. The real contributions are likely to be higher because of the contribution from ship plumes diluted beyond detection. In calculating the masses of plume particles, a density of 1.23 g cm−3 was used, corresponding to the density of ship exhaust particles calculated based on the particle chemistry (Petzold et al., 2008). For ambient aerosol, a density of 1.10 g cm−3 was used. This is the average of the effective density values reported by Geller et al. (2006) for coastal aerosols of different sizes. They reported density values of 1.19, 1.14, 0.99, and 1.06 g cm−3 for particle sizes of 50, 118, 146, and 202 nm, respectively.
Table 1Average mass concentrations (MC) of ambient aerosol, valid plumes, and all plumes during the different fuel sulfur content (FSC) restrictions, and the contributions of valid plumes and all of the plumes to the ambient MC.
3.6 Photochemical aging of the plumes
Photochemical aging changes the physical and chemical properties of the ship plume particles. The sulfur content in fuel affects SO2 emitted from marine engines; nevertheless, Zetterdahl et al. (2016) also measured reduced volatile organic compound (VOC) emissions related to a lower FSC. However, in contrast to decreased secondary aerosol (SA) precursor observations (SO2 and VOC), Wu et al. (2020) observed an increase in SA formation due to changing from residual fuel oils to distillate fuels. At Utö, the SO2-rich ship emissions from the Utö harbor area have previously been identified as a possible cause of local nucleation events (from secondary aerosol formation), especially in the size range from 10 to 30 nm (Hyvärinen et al., 2008).
In this study, the effect of photochemical aging on the exhaust plumes was examined by comparing the number size distributions (NSDpl) and volume size distributions (VSDpl) measured a nighttime (total radiation intensity Itot < 0 W m−2) and at daytime (Itot>200 W m−2). The NSDpl and VSDpl were calculated as averages in 10∘ sectors, and the numbers of plumes exceeding the limit values per angle are presented in the Supplement (Fig. S6). Only the 220–260∘ and 320–350∘ sectors had enough data for both nighttime and daytime plume analysis, as they exceeded 40 plumes per 10∘ sector. With fewer plumes per sector, noise in the data was high (Fig. S7). Moreover, the 320–350∘ sector was the direction of the Utö ferry harbor and was, therefore, excluded from further analysis.
Night- and daytime NSDpl and VSDpl differed from each other during all three FSC restriction periods (Fig. 12). A large fraction of the change between day and night might be related to the different meteorological conditions and contrasting ship traffic during day and night. Assuming that the wind speed, humidity, temperature, other meteorological parameters, and the composition of the ship fleet remained relatively constant between the restriction periods, the remaining variable is FSC, and the differences between the restriction periods are caused by the changes in the FSC limits. These assumptions cause large uncertainty in the results; therefore, the results are only considered qualitatively.

Figure 12Average number size distributions (NSDpl) and volume size distributions (VSDpl) of the plumes in the 220–260∘ sector for the three fuel sulfur content (FSC) restriction periods for nighttime and daytime: (a) nighttime NSDpl, (b) nighttime VSDpl, (c) daytime NSDpl, (d) daytime VSDpl, (e) change in NSDpl caused by exposure to sunlight, and (f) change in VSDpl caused by exposure to sunlight.
The most striking difference between the day- and nighttime NSDpl was that the size distribution maximum shifted to the larger particle size during the daytime (Fig. 12). The shift was largest for the 0.10 FSC limit and smallest for the 1.50 FSC limit. Moreover, during the 0.10 FSC limit period, the NSDpl maximum was clearly at the smaller particle size than the maxima at 1.00 and 1.50 at nighttime, whereas during the daytime, the maximum was almost independent of the FSC limit.
VSDpl was bimodal during all three restriction periods. The mode at the ∼ 90 nm particle size was smaller with respect to the mode at ∼ 300 nm, with the difference between the modes being especially noticeable during the 0.10 FSC restriction. Similar to the NSDpl, the mode at ∼ 90 nm shifted to the larger particle size during the daytime compared with that at nighttime. Again, the shift was largest for the 0.10 FSC and smallest for the 1.50 FSC.
When the effects caused by dilution to the PNCpl are excluded, the remaining factors in the atmosphere influencing PNCpl are coagulation and new particle formation (Celik et al., 2020). Moreover, condensation and evaporation can change NSDpl, and in the case of evaporation, it can affect the PNCpl by evaporating particles completely or reducing particle size below the detection limit of the measurement instrument. Celik et al. (2019) suspected that coagulation reduced the particle number emission factors during nighttime, but they did not find any correlation between plume age and plume particle number emission factor (En) during daytime. It was proposed that this could be because new particle formation during daytime overrides the effects of coagulation. With respect to photochemical aging, Shiraiwa et al. (2013) reported that semi-volatile organic compounds (SVOCs) equilibrate with the particle population and that the majority of SVOCs condense on the largest particles because of their greater absorption capacity and reduced equilibrium vapor pressure on the surface of the particle (the Kelvin effect). They found that the maxima of the NSD became narrower and shifted to a larger particle size at the diameter of 200 nm after 20 h of photochemical aging and depleted basically all particles below 100 nm. This kind of behavior is an extreme case but could be another plausible explanation for the observed behavior of NSDpl seen in this work.
Table 2 represents the total PNCpl and volume concentration of the plume particles (VCpl) for the three different FSC restrictions for day- and nighttime. Overall, the PNCpl was higher during nighttime plumes than during the daytime. The difference was largest for the 1.50 FSC restriction and smallest for the 0.10 restriction. Each change in the FSC restrictions was observed to reduce the PNCpl during both day- and nighttime; however, the dependency of the PNCpl on the FSC was greater at nighttime. Therefore the night–day difference in the PNCpl decreased with decreasing FSC. In contrast to PNCpl, the VCpl was higher during the daytime plumes, but, similar to the PNCpl, the VCpl reduced with the stricter FSC limit. For the VCpl, the difference between the day- and nighttime concentrations was less dependent on the FSC limit than for the PNCpl.
Table 2Particle number (PNCpl) and volume concentrations (VCpl) of plumes during the three different fuel sulfur content (FSC) restriction periods, and the change in concentrations between daytime and nighttime.
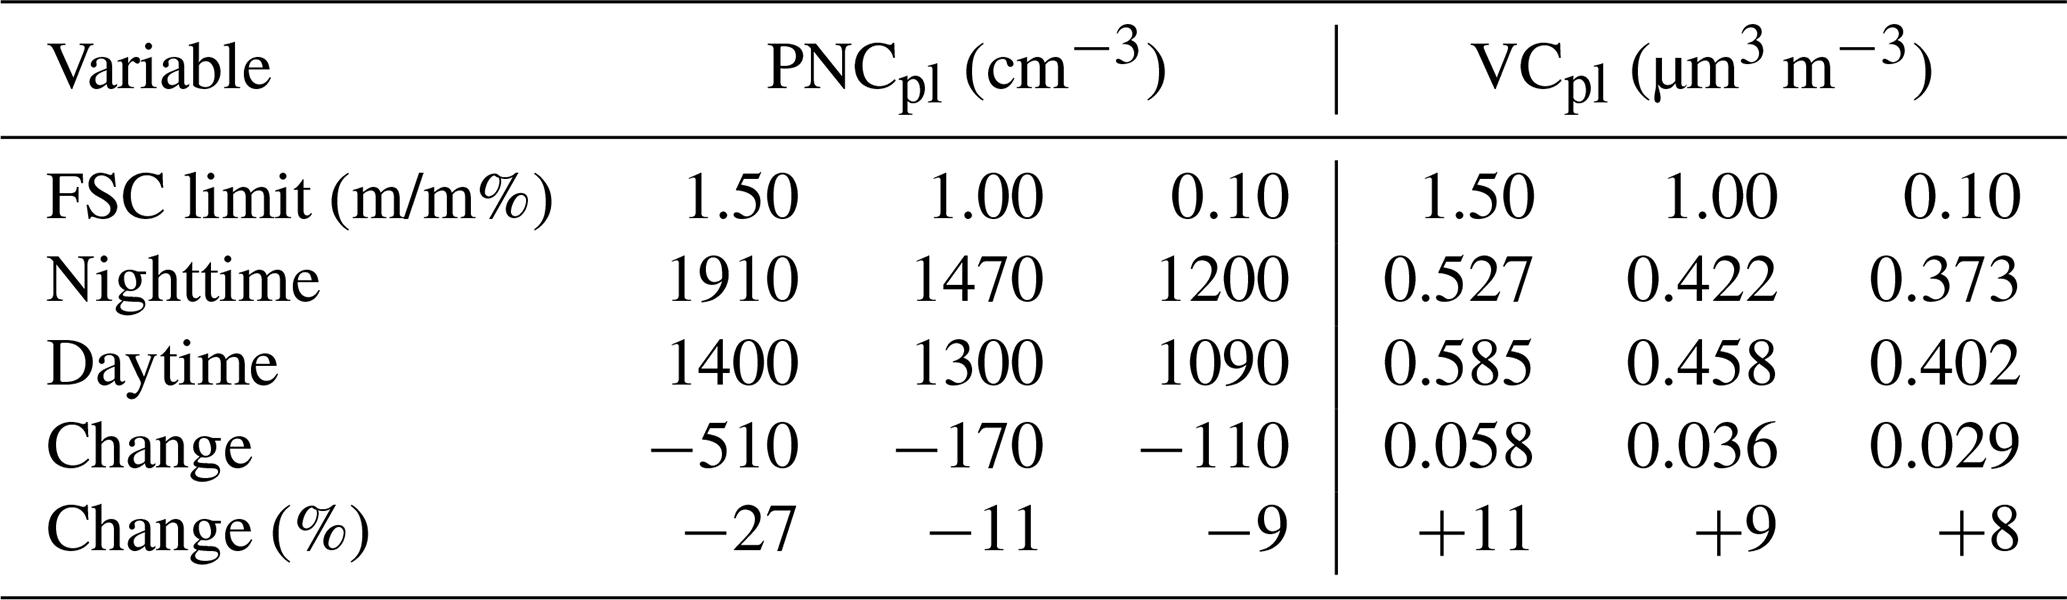
Higher total VCpl during daytime than during nighttime indicates the condensation of gaseous matter on particles. Meanwhile, the PNCpl was lower during daytime, which might indicate the evaporation of small particles. The decrease in PNCpl and increase in VCpl during daytime diminishes as the FSC decreases, implying that the higher FSC increases the evaporation of small particles and the condensation on larger particles. The higher number of smaller particles observed in Fig. 12 can be explained by the evaporation of liquid matter from the surface of medium-sized particles exposing the small solid core particles. The evaporated material from these particles as well as the wholly evaporated particles and other VOCs in the plume condensate over larger particles.
This study investigated the effects of fuel sulfur content (FSC) restrictions on the number size distributions (NSDpl) and particle number concentrations (PNCpl) at Utö island in the Baltic Sea during a 10-year time-period (2007–2016). The focus was on both the changes in the ship exhaust plumes and the ambient aerosol. In general, FSC restrictions were observed to have a clear impact on particle number concentrations and size distributions in the marine environment next to the shipping lanes. Furthermore, the FSC limitations affected the size distributions and the growth of particles during the plume aging.
The overall change in the FSC from 1.50 to 0.10 decreased the PNCpl and ambient particle number concentration (PNCtot) by 27 % and 32 %, respectively. In both cases, the largest decrease was observed after the latter FSC restriction change from 1.00 to 0.10 , likely because the fuel type was changed from residual oil to distillates.
The particle size distribution in the plumes also changed after the FSC restriction change from 1.00 to 0.10 . The FSC restriction particularly affected the concentrations of the small particles by reducing the particle number concentration in particle sizes between approximately 33 and 144 nm, whereas particles with Dp≥ 144 nm remained mostly unaffected. Due to the small size of particles in ship exhaust plume emissions (GMD typically 30–60 nm), the contribution of ship emissions to PM2.5 is likely to be small, and the effect of ship emissions should be characterized based on PNC rather than PM.
In addition to the isolated ship plumes, there was a decrease in the ambient particle number concentrations (PNCtot) with the stricter FSC limits. When the wind was blowing over distant shipping lanes, the PNCtot was significantly elevated because of large numbers of diluted ship plumes arriving at Utö. This observation indicates that shipping is a major source of particles in the marine environment, even though the distance to the shipping lanes can be substantial. Jonson et al. (2019) proposed that the contribution of shipping-related particle emissions to PM2.5 would be negligible after the FSC restriction of 0.10 . However, based on the results of this study, this does not seem to be the case: the reduction in PNCpl and particle size were moderate, and the concentrations in the largest particle sizes remained unchanged. However, the largest particle sizes in Utö can be affected by sources other than shipping – for example, long-range transported particles from other combustion sources on the mainland.
The geometric mean diameter (GMD) was found to increase with the increasing residence time of ship exhaust plumes in the atmosphere. The GMD was larger for the particles in plumes that traveled long distances. Furthermore, the particle volume concentration was larger for plumes measured at daytime compared with plumes measured at nighttime, likely due to the photochemical aging of particles due to UV light. This difference between day- and nighttime decreased with decreasing FSC. This indicates that a lower FSC might reduce the condensation of gaseous matter on larger particles and diminish the evaporation of smaller particles. This result includes several uncertainties and, therefore, requires further investigation.
We note that over the decade-long measurement period, ship traffic also somewhat decreased in the vicinity of Utö; thus, it is possible that the decrease in activity, in addition to FSC limits, affected the observed ambient particle number concentrations. However, the change from 1.00 to 0.10 FSC was specifically observed to cause a clear change in ambient particle concentrations. Moreover, the decrease in ship traffic is assumed to have been gradual and would not be expected to have caused this kind of step change. In addition, the amount of ship traffic does not affect the measured concentrations and number size distributions of plumes, as these average values do not depend on the number of measured plumes.
In conclusion, the FSC restrictions can be expected to cause impacts on the environment and human health due to the lower particle number concentrations in the ultrafine particle size range. The concentration reduction of ultrafine particles is especially effective in reducing negative health effects, as the respirable fraction of ultrafine particles is high (Heyder, 2004) and the lower fraction of the respiratory tract is more sensitive to pathogen numbers compared with the upper parts of the respiratory tract (Thomas, 2013). The reduction in the particle concentration in the size range of ∼ 33–144 nm observed in this study implies significant effects on the radiative properties of marine clouds. The particle diameter range from 40 to 120 nm has been identified as being crucial for cloud condensation nuclei, as larger particles are almost always activated to form cloud droplets, whereas particles smaller than 40 nm are not activated with realistic supersaturations (Dusek et al., 2006). Therefore, ships running with low-sulfur fuel produce fewer cloud condensation nuclei in this critical size range. This can lead to a substantial inverse Twomey effect, increasing the albedo of marine clouds and, thus, having an indirect warming effect on the climate (Twomey, 1977). Increasing the average cloud droplet concentrations from 100 to 375 cm−3 has been found to have more than double the cooling effect on the climate compared with the warming caused by the doubling of CO2 (Latham et al., 2008). Therefore, even a slight decrease in cloud condensation nuclei over sea areas might have a strong cooling effect on the climate.
Data are available upon request from the corresponding author Sami Seppälä (sami.seppala@fmi.fi).
The supplement related to this article is available online at: https://doi.org/10.5194/acp-21-3215-2021-supplement.
SDS handled the formal analysis, software, visualization, and wrote the original draft of the paper. JoeK, APH, SaS, TR, JorK, and JPJ contributed ideas and reviewed and edited the article. HT acted as a supervisor and contributed to reviewing and editing the article.
The authors declare that they have no conflict of interest.
This work was financed by the European Research Infrastructure for the observation of Aerosol, Clouds, and Trace Gases (ACTRIS); the European Union's Horizon 2020 Research and Innovation program (SCIPPER; grant agreement no. 814893); the Academy of Finland Center of Excellence program (grant no. 307331); Academy of Finland Flagship funding (grant no. 337552); and the Academy of Finland Flagship funding Atmosphere and Climate Competence Center (ACCC; grant no. 337549).
This paper was edited by Veli-Matti Kerminen and reviewed by Adam Kristensson and one anonymous referee.
Alanen, J., Isotalo, M., Kuittinen, N., Simonen, P., Martikainen, S., Kuuluvainen, H., Honkanen, M., Lehtoranta, K., Nyysso, S., Vesala, H., Timonen, H., Aurela, M., Keskinen, J., and Ro, T.: Physical Characteristics of Particle Emissions from a Medium Speed Ship Engine Fueled with Natural Gas and Low-Sulfur Liquid Fuels, Environ. Sci. Technol., 54, 5376–5384, https://doi.org/10.1021/acs.est.9b06460, 2020.
Alföldy, B., Lööv, J. B., Lagler, F., Mellqvist, J., Berg, N., Beecken, J., Weststrate, H., Duyzer, J., Bencs, L., Horemans, B., Cavalli, F., Putaud, J.-P., Janssens-Maenhout, G., Csordás, A. P., Van Grieken, R., Borowiak, A., and Hjorth, J.: Measurements of air pollution emission factors for marine transportation in SECA, Atmos. Meas. Tech., 6, 1777–1791, https://doi.org/10.5194/amt-6-1777-2013, 2013.
Anderson, M., Salo, K., and Fridell, E.: Particle- and Gaseous Emissions from an LNG Powered Ship, Environ. Sci. Technol., 49, 12568–12575, https://doi.org/10.1021/acs.est.5b02678, 2015a.
Anderson, M., Salo, K., Hallquist, Å. M., and Fridell, E.: Characterization of particles from a marine engine operating at low loads, Atmos. Environ., 101, 65–71, https://doi.org/10.1016/j.atmosenv.2014.11.009, 2015b.
Arnold, F., Pirjola, L., Aufmhoff, H., Schuck, T., Lähde, T., and Hämeri, K.: First gaseous sulfuric acid measurements in automobile exhaust: Implications for volatile nanoparticle formation, Atmos. Environ., 40, 7097–7105, https://doi.org/10.1016/j.atmosenv.2006.06.038, 2006.
Arnold, F., Pirjola, L., Rönkkö, T., Reichl, U., Schlager, H., Lähde, T., Heikkilä, J., and Keskinen, J.: First online measurements of sulfuric acid gas in modern heavy-duty diesel engine exhaust: Implications for nanoparticle formation, Environ. Sci. Technol., 46, 11227–11234, https://doi.org/10.1021/es302432s, 2012.
Ausmeel, S., Eriksson, A., Ahlberg, E., and Kristensson, A.: Methods for identifying aged ship plumes and estimating contribution to aerosol exposure downwind of shipping lanes, Atmos. Meas. Tech., 12, 4479–4493, https://doi.org/10.5194/amt-12-4479-2019, 2019.
Ausmeel. S., Eriksson, A., Ahlberg, E., Sporre, M. K., and Kristensson, A.: Ship plumes in the Baltic Sea Sulfur Emission Control Area: chemical characterization and contribution to coastal aerosol concnetrations, Atmos. Chem. Phys., 20, 9135–9151, https://doi.org/10.5194/acp-20-9135-2020, 2020.
Barregard, L., Molnr, P., Jonson, J. E., and Stockfelt, L.: Impact on population health of baltic shipping emissions, Int. J. Environ. Res., 16, 1954, https://doi.org/10.3390/ijerph16111954, 2019.
Celik, S., Drewnick, F., Fachinger, F., Brooks, J., Darbyshire, E., Coe, H., Paris, J.-D., Eger, P. G., Schuladen, J., Tadic, I., Friedrich, N., Dienhart, D., Hottmann, B., Fischer, H., Crowley, J. N., Harder, H., and Borrmann, S.: Influence of vessel characteristics and atmospheric processes on the gas and particle phase of ship emission plumes: in situ measurements in the Mediterranean Sea and around the Arabian Peninsula, Atmos. Chem. Phys., 20, 4713–4734, https://doi.org/10.5194/acp-20-4713-2020, 2020.
Chen, C., Saikawa, E., Comer, B., Mao, X., and Rutherford, D.: Ship Emission Impacts on Air Quality and Human Health in the Pearl River Delta (PRD) Region, China, in 2015, With Projections to 2030, GeoHealth, 3, 284–306, https://doi.org/10.1029/2019GH000183, 2019.
Chen, G., Huey, L. G., Trainer, M., Nicks, D., Corbett, J., Ryerson, T., Parrish, D., Neuman, J. A., Nowak, J., Tanner, D., Holloway, J., Brock, C., Crawford, J., Olson, J. R., Sullivan, A., Weber, R., Schauffler, S., Donnelly, S., Atlas, E., and Fehsenfeld, F.: An investigation of the chemistry of ship emission plumes during ITCT 2002, J. Geophys. Res.-Atmos., 110, 1–15, https://doi.org/10.1029/2004JD005236, 2005.
Corbin, J. C., Peng, W., Yang, J., Sommer, D. E., Trivanovic, U., Kirchen, P., Miller, J. W., Rogak, S., Cocker, D. R., Smallwood, G. J., Lobo, P., and Gagné, S.: Characterization of particulate matter emitted by a marine engine operated with liquefied natural gas and diesel fuels, Atmos. Environ., 220, 117030, https://doi.org/10.1016/j.atmosenv.2019.117030, 2020.
Cordtz, R., Schramm, J., Andreasen, A., Eskildsen, S. S., and Mayer, S.: Modeling the distribution of sulfur compounds in a large two stroke diesel engine, Energ. Fuel., 27, 1652–1660. https://doi.org/10.1021/ef301793a, 2013.
Dal Maso, M., Kulmala, M., Riipinen, I., Wagner, R., Hussein, T., Aalto, P. P., and Lehtinen, K. E. J.: Formation and growth of fresh atmospheric aerosols: Eight years of aerosol size distribution data from SMEAR II, Hyytiälä, Finland, Boreal Environ. Res., 10, 323–336, 2005.
Diesch, J.-M., Drewnick, F., Klimach, T., and Borrmann, S.: Investigation of gaseous and particulate emissions from various marine vessel types measured on the banks of the Elbe in Northern Germany, Atmos. Chem. Phys., 13, 3603–3618, https://doi.org/10.5194/acp-13-3603-2013, 2013.
Dusek, U., Frank, G. P., Hildebrandt, L., Curtius, J., Schneider, J., Walter, S., Chand, D., Drewnick, F., Hings, S., Jung, D., Borrmann, S., and Andreae, M. O.: Size matters more than chemistry for cloud-nucleating ability of aerosol particles, Science, 312, 1375–1378, https://doi.org/10.1126/science.1125261, 2006.
Engler, C., Lihavainen, H., Komppula, M., Kerminen, V. M., Kulmala, M., and Viisanen, Y.: Continuous measurements of aerosol properties at the Baltic Sea, Tellus B, 59, 728–741, https://doi.org/10.1111/j.1600-0889.2007.00285.x, 2007.
European Parliament and the Council of the European Union: Directive 2005/33/EC of the European Parliament and the Council of 6 July 2005 amending Directive 1999/32/EC, available at: https://eur-lex.europa.eu/LexUriServ/LexUriServ.do?uri=OJ:L:2005:191:0059:0069:EN:PDF (last access: 28 August 2020), 2005.
Geller, M., Biswas, S., and Sioutas, C.: Determination of Particle Effective Density in Urban Environments with a Differential Mobility Analyzer and Aerosol Particle Mass Analyzer, Aerosol Sci. Technol., 40, 709–723, https://doi.org/10.1080/02786820600803925, 2006.
Gobbi, G. P., Di Liberto, L., and Barnaba, F.: Impact of port emissions on EU-regulated and non-regulated air quality indicators: The case of Civitavecchia (Italy), Sci. Total Environ., 719, 134984, https://doi.org/10.1016/j.scitotenv.2019.134984, 2020.
Hennig, F., Quass, U., Hellack, B., Küpper, M., Kuhlbusch, T. A. J., Stafoggia, M., and Hoffmann, B.: Ultrafine and fine particle number and surface area concentrations and daily cause-specific mortality in the Ruhr area, Germany, 2009–2014, Environ. Health Persp., 126, 2009–2014, https://doi.org/10.1289/EHP2054, 2018.
Heyder, J.: Deposition of inhaled particles in the human respiratory tract and consequences for regional targeting in respiratory drug delivery, Proc. Am. Thorac. Soc., 1, 315–320, https://doi.org/10.1513/pats.200409-046TA, 2004.
Hoang, A. T. and Pham, V. V.: A review on fuels used for marine diesel engines, J. Mech. Eng. Res. Dev., 41, 22–32, 2018.
Hoppel, W. A.: Determination of aerosol size distribution from the mobility distribution of the charged fraction of aerosols, J. Aerosol. Sci., 9, 41–54, https://doi.org/10.1016/0021-8502(78)90062-9, 1978.
Hyvärinen, A. P., Komppula, M., Engler, C., Kivekäs, N., Kerminen, V. M., Dal Maso, M., Viisanen, Y., and Lihavainen, H.: Atmospheric new particle formation at Utö, Baltic Sea 2003–2005, Tellus B, 60, 345–352, https://doi.org/10.1111/j.1600-0889.2008.00343.x, 2008.
IMO: Amendments to the Annex of the Protocol of 1997 to amend the International Convention for Prevention of Pollution from Ships 1973, as modified by the Protocol of 1978, relating thereto, Revised MARPOL Annex VI, IMO (International Maritime Organization), available at: http://www.imo.org/en/KnowledgeCentre/IndexofIMOResolutions/Marine-Environment-Protection-Committee-(MEPC)/Documents/MEPC.176(58).pdf (last access: 28 August 2020), 2008.
IMO: AIS transponders, IMO (International Maritime Organization), available at: http://www.imo.org/en/OurWork/Safety/Navigation/Pages/AIS.aspx, last access: 28 August 2020a.
IMO: MARPOL 73/78 Annex VI – Regulations for the prevention of Air Pollution from ships – Technical and Operational implications, Det Norske Veritas, available at: http://hulpinnood.nl/wp-content/uploads/2015/03/BIJLAGE3_Marpol-annex-VI.pdf, last access: 28 August 2020b.
Jonsson, Å. M., Westerlund, J., and Hallquist, M.: Size-resolved particle emission factors for individual ships, Geophys. Res. Lett, 38, 1–5, https://doi.org/10.1029/2011GL047672, 2011.
Jonson, J. E., Gauss, M., Jalkanen, J.-P., and Johansson, L.: Effects of strengthening the Baltic Sea ECA regulations, Atmos. Chem. Phys., 19, 13469–13487, https://doi.org/10.5194/acp-19-13469-2019, 2019.
Karl, M., Pirjola, L., Karppinen, A., Jalkanen, J. P., Ramacher, M. O. P., and Kukkonen, J.: Modeling of the concentrations of ultrafine particles in the plumes of ships in the vicinity of major harbors, Int. J. Environ. Res., 17, 1–24, https://doi.org/10.3390/ijerph17030777, 2020.
Kattner, L., Mathieu-Üffing, B., Burrows, J. P., Richter, A., Schmolke, S., Seyler, A., and Wittrock, F.: Monitoring compliance with sulfur content regulations of shipping fuel by in situ measurements of ship emissions, Atmos. Chem. Phys., 15, 10087–10092, https://doi.org/10.5194/acp-15-10087-2015, 2015.
Kecorius, S., Kivekäs, N., Kristensson, A., Tuch, T., Covert, D. S., Birmili, W., Lihavainen, H., Hyvärinen, A. P., Martinsson, J., Sporre, M. K., Swietlicki, E., Wiedensohler, A., and Ulevicius, V.: Significant increase of aerosol number concentrations in air masses crossing a densely trafficked sea area, Oceanography, 58, 1–12, https://doi.org/10.1016/j.oceano.2015.08.001, 2016.
Kivekäs, N., Massling, A., Grythe, H., Lange, R., Rusnak, V., Carreno, S., Skov, H., Swietlicki, E., Nguyen, Q. T., Glasius, M., and Kristensson, A.: Contribution of ship traffic to aerosol particle concentrations downwind of a major shipping lane, Atmos. Chem. Phys., 14, 8255–8267, https://doi.org/10.5194/acp-14-8255-2014, 2014.
Kozak, M. and Merkisz, J.: the Mechanics of Fuel Sulphur Influence on Exhaust Emissions From Diesel Engines, TEKA Kom. Mot. Energ. Roln, 5, 96–106, 2005.
Kukkonen, J., Karl, M., Keuken, M. P., Denier van der Gon, H. A. C., Denby, B. R., Singh, V., Douros, J., Manders, A., Samaras, Z., Moussiopoulos, N., Jonkers, S., Aarnio, M., Karppinen, A., Kangas, L., Lützenkirchen, S., Petäjä, T., Vouitsis, I., and Sokhi, R. S.: Modelling the dispersion of particle numbers in five European cities, Geosci. Model Dev., 9, 451–478, https://doi.org/10.5194/gmd-9-451-2016, 2016.
Kumar, P., Pirjola, L., Ketzel, M., and Harrison, R. M.: Nanoparticle emissions from 11 non-vehicle exhaust sources – A review, Atmos. Environ., 67, 252–277, https://doi.org/10.1016/j.atmosenv.2012.11.011, 2013.
Laakso, L., Mikkonen, S., Drebs, A., Karjalainen, A., Pirinen, P., and Alenius, P.: 100 years of atmospheric and marine observations at the Finnish Utö Island in the Baltic Sea, Ocean Sci., 14, 617–632, https://doi.org/10.5194/os-14-617-2018, 2018.
Lack, D. A., Corbett, J. J., Onasch, T., Lerner, B., Massoli, P., Quinn, P. K., Bates, T. S., Covert, D. S., Coffman, D., Sierau, B., Herndon, S., Allan, J., Baynard, T., Lovejoy, E., Ravishankara, A. R., and Williams, E.: Particulate emissions from commercial shipping: Chemical, physical, and optical properties, J. Geophys. Res.-Atmos., 114, 1–16, https://doi.org/10.1029/2008JD011300, 2009.
Latham, J., Rasch, P., Chen, C. C., Kettles, L., Gadian, A., Gettelman, A., Morrison, H., Bower, K., and Choularton, T.: Global temperature stabilization via controlled albedo enhancement of low-level maritime clouds, Philos. Trans. R. Soc. A, 366, 3969–3987, https://doi.org/10.1098/rsta.2008.0137, 2008.
Lehtoranta, K., Aakko-Saksa, P., Murtonen, T., Vesala, H., Ntziachristos, L., Rönkkö, T., Karjalainen, P., Kuittinen, N., and Timonen, H.: Particulate Mass and Nonvolatile Particle Number Emissions from Marine Engines Using Low-Sulfur Fuels, Natural Gas, or Scrubbers, Environ. Sci. Technol., 53, 3315–3322, https://doi.org/10.1021/acs.est.8b05555, 2019.
Lin, H., Tao, J., Qian, Z., Ruan, Z., Xu, Y., Hang, J., Xu, X., Liu, T., Guo, Y., Zeng, W., Xiao, J., Guo, L., Li, X., and Ma, W.: Shipping pollution emission associated with increased cardiovascular mortality: A time series study in Guangzhou, China, Environ. Pollut., 241, 862–868, https://doi.org/10.1016/j.envpol.2018.06.027, 2018.
Lv, Z., Liu, H., Ying, Q., Fu, M., Meng, Z., Wang, Y., Wei, W., Gong, H., and He, K.: Impacts of shipping emissions on PM2.5 pollution in China, Atmos. Chem. Phys., 18, 15811–15824, https://doi.org/10.5194/acp-18-15811-2018, 2018.
Mylläri, F., Asmi, E., Anttila, T., Saukko, E., Vakkari, V., Pirjola, L., Hillamo, R., Laurila, T., Häyrinen, A., Rautiainen, J., Lihavainen, H., O'Connor, E., Niemelä, V., Keskinen, J., Dal Maso, M., and Rönkkö, T.: New particle formation in the fresh flue-gas plume from a coal-fired power plant: effect of flue-gas cleaning, Atmos. Chem. Phys., 16, 7485–7496, https://doi.org/10.5194/acp-16-7485-2016, 2016.
Ntziachristos, L., Saukko, E., Lehtoranta, K., Rönkkö, T., Timonen, H., Simonen, P., Karjalainen, P., and Keskinen, J.: Particle emissions characterization from a medium-speed marine diesel engine with two fuels at different sampling conditions, Fuel, 186, 456–465, https://doi.org/10.1016/j.fuel.2016.08.091, 2016.
Partanen, A. I., Laakso, A., Schmidt, A., Kokkola, H., Kuokkanen, T., Pietikäinen, J.-P., Kerminen, V.-M., Lehtinen, K. E. J., Laakso, L., and Korhonen, H.: Climate and air quality trade-offs in altering ship fuel sulfur content, Atmos. Chem. Phys., 13, 12059–12071, https://doi.org/10.5194/acp-13-12059-2013, 2013.
Petzold, A., Hasselbach, J., Lauer, P., Baumann, R., Franke, K., Gurk, C., Schlager, H., and Weingartner, E.: Experimental studies on particle emissions from cruising ship, their characteristic properties, transformation and atmospheric lifetime in the marine boundary layer, Atmos. Chem. Phys., 8, 2387–2403, https://doi.org/10.5194/acp-8-2387-2008, 2008.
Pirjola, L., Pajunoja, A., Walden, J., Jalkanen, J.-P., Rönkkö, T., Kousa, A., and Koskentalo, T.: Mobile measurements of ship emissions in two harbour areas in Finland, Atmos. Meas. Tech., 7, 149–161, https://doi.org/10.5194/amt-7-149-2014, 2014.
Pirjola, L., Karl, M., Rönkkö, T., and Arnold, F.: Model studies of volatile diesel exhaust particle formation: are organic vapours involved in nucleation and growth?, Atmos. Chem. Phys., 15, 10435–10452, https://doi.org/10.5194/acp-15-10435-2015, 2015.
Riipinen, I., Yli-Juuti, T., Pierce, J. R., Petäjä, T., Worsnop, D. R., Kulmala, M., and Donahue, N. M.: The contribution of organics to atmospheric nanoparticle growth, Nat. Geosci., 5, 453–458, https://doi.org/10.1038/ngeo1499, 2012.
Rönkkö, T., Lähde, T., Heikkilä, J., Pirjola, L., Bauschke, U., Arnold, F., Schlager, H., Rothe, D., Yli-Ojanperä, J., and Keskinen, J.: Effects of gaseous sulphuric acid on diesel exhaust nanoparticle formation and characteristics, Environ. Sci. Technol., 47, 11882–11889, https://doi.org/10.1021/es402354y, 2013.
Shiraiwa, M., Yee, L. D., Schilling, K. A., Loza, C. L., Craven, J. S., Zuend, A., Ziemann, P. J., and Seinfeld, J. H.: Size distribution dynamics reveal particle-phase chemistry in organic aerosol formation, P. Natl. Acad. Sci. USA, 110, 11746–11750, https://doi.org/10.1073/pnas.1307501110, 2013.
Sofiev, M., Winebrake, J. J., Johansson, L., Carr, E. W., Prank, M., Soares, J., Vira, J., Kouznetsov, R., Jalkanen, J. P., and Corbett, J. J.: Cleaner fuels for ships provide public health benefits with climate tradeoffs, Nat. Commun., 9, 1–12, https://doi.org/10.1038/s41467-017-02774-9, 2018.
Strak, M., Janssen, N. A. H., Godri, K. J., Gosens, I., Mudway, I. S., Cassee, F. R., Lebret, E., Kelly, F. J., Harrison, R. M., Brunekreef, B., Steenhof, M., and Hoek, G.: Respiratory health effects of airborne particulate matter: The role of particle size, composition, and oxidative potential-the RAPTES project, Environ. Health Persp., 120, 1183–1189, https://doi.org/10.1289/ehp.1104389, 2012.
Streibel, T., Schnelle-Kreis, J., Czech, H., Harndorf, H., Jakobi, G., Jokiniemi, J., Karg, E., Lintelmann, J., Matuschek, G., Michalke, B., Müller, L., Orasche, J., Passig, J., Radischat, C., Rabe, R., Reda, A., Rüger, C., Schwemer, T., Sippula, O., and Zimmermann, R.: Aerosol emissions of a ship diesel engine operated with diesel fuel or heavy fuel oil, Environ. Sci. Pollut. Res., 24, 10976–10991, https://doi.org/10.1007/s11356-016-6724-z, 2017.
Thomas, R. J.: Particle size and pathogenicity in the respiratory tract, Virulence, 4, 847–858, https://doi.org/10.4161/viru.27172, 2013.
Tian, J., Riemer, N., West, M., Pfaffenberger, L., Schlager, H., and Petzold, A.: Modeling the evolution of aerosol particles in a ship plume using PartMC-MOSAIC, Atmos. Chem. Phys., 14, 5327–5347, https://doi.org/10.5194/acp-14-5327-2014, 2014.
Twomey, S.: The influence of Pollution on the Shortwave Albedo of Clouds, J. Atmos. Sci., 34, 1149–1152, https://doi.org/10.1175/1520-0469(1977)034<1149:TIOPOT>2.0.CO;2, 1977.
Ushakov, S., Valland, H., Nielsen, J. B., and Hennie, E.: Effects of high sulphur content in marine fuels on particulate matter emission characteristics, J. Mar. Eng. Technol., 12, 30–39, 2013.
Viana, M., Hammingh, P., Colette, A., Querol, X., Degraeuwe, B., de Vlieger, I., and van Aardenne, J.: Impact of maritime transport emissions on coastal air quality in Europe, Atmos. Environ., 90, 96–105, https://doi.org/10.1016/j.atmosenv.2014.03.046, 2014.
Walker, A. P.: Controlling particulate emissions from diesel vehicles, Top. Catal., 28, 165–170, https://doi.org/10.1023/B:TOCA.0000024346.29600.0e, 2004.
Westerlund, J., Hallquist, M., and Hallquist, Å. M.: Characterization of fleet emissions from ships through multi-individual determination of size-resolved particle emissions in a coastal area, Atmos. Environ., 112, 159–166, https://doi.org/10.1016/j.atmosenv.2015.04.018, 2015.
Wu, Z., Zhang, Y., He, J., Chen, H., Huang, X., Wang, Y., Yu, X., Yang, W., Zhang, R., Zhu, M., Li, S., Fang, H., Zhang, Z., and Wang, X.: Dramatic increase in reactive volatile organic compound (VOC) emissions from ships at berth after implementing the fuel switch policy in the Pearl River Delta Emission Control Area, Atmos. Chem. Phys., 20, 1887–1900, https://doi.org/10.5194/acp-20-1887-2020, 2020.
Zanatta, M., Bozem, H., Köllner, F., Schneider, J., Kunkel, D., Hoor, P., de Faria, J., Petzold, A., Bundke, U., Hayden, K., Staebler, R. M., Schulz, H., and Herber, A. B.: Airborne survey of trace gases and aerosols over the Southern Baltic Sea: from clean marine boundary layer to shipping corridor effect, Tellus B, 72, 1–24, https://doi.org/10.1080/16000889.2019.1695349, 2020.
Zetterdahl, M., Moldanová, J., Pei, X., Pathak, R. K., and Demirdjian, B.: Impact of the 0.1% fuel sulfur content limit in SECA on particle and gaseous emissions from marine vessels, Atmos. Environ., 145, 338–345, https://doi.org/10.1016/j.atmosenv.2016.09.022, 2016.
Zhou, S., Zhou, J., and Zhu, Y.: Chemical composition and size distribution of particulate matters from marine diesel engines with different fuel oils, Fuel, 235, 972–983, https://doi.org/10.1016/j.fuel.2018.08.080, 2019.