the Creative Commons Attribution 4.0 License.
the Creative Commons Attribution 4.0 License.
 | 03 Mar 2021
Measurement report: Chemical characteristics of PM2.5 during typical biomass burning season at an agricultural site of the North China Plain
Linlin Liang
Guenter Engling
Chang Liu
Wanyun Xu
Xuyan Liu
Yuan Cheng
Zhenyu Du
Gen Zhang
Junying Sun
Xiaoye Zhang
Biomass burning activities are ubiquitous in China, especially in northern China, where there is a large rural population and winter heating custom. Biomass burning tracers (i.e., levoglucosan, mannosan and potassium (K+)), as well as other chemical components, were quantified at a rural site (Gucheng, GC) in northern China from 15 October to 30 November, during a transition heating season, when the field burning of agricultural residue was becoming intense. The measured daily average concentrations of levoglucosan, mannosan and K+ in PM2.5 (particulate matter with aerodynamic diameters less than 2.5 µm) during this study were 0.79 ± 0.75, 0.03 ± 0.03 and 1.52 ± 0.62 µg m−3, respectively. Carbonaceous components and biomass burning tracers showed higher levels during nighttime than daytime, while secondary inorganic ions were enhanced during daytime. An episode with high levels of biomass burning tracers was encountered at the end of October 2016, with high levoglucosan at 4.37 µg m−3. Based on the comparison of chemical components during different biomass burning pollution periods, it appeared that biomass combustion can obviously elevate carbonaceous component levels, whereas there was essentially no effect on secondary inorganic aerosols in the ambient air. Moreover, the levoglucosan mannosan ratios during different biomass burning pollution periods remained at high values (in the range of 18.3–24.9); however, the levoglucosan K+ ratio was significantly elevated during the intensive biomass burning pollution period (1.67) when air temperatures were decreasing, which was substantially higher than in other biomass burning periods (averaged at 0.47).
- Article
(2513 KB) - Full-text XML
-
Supplement
(2126 KB) - BibTeX
- EndNote


Particulate air pollution is attracting more and more concern in China because of its obvious adverse impact on visibility reduction, as well as health implications and regional or global climate change (Kanakidou et al., 2005; Pope and Dockery, 2006; Cheng et al., 2016). Carbonaceous species, i.e., organic carbon (OC) and elemental carbon (EC), and water-soluble inorganic ions, e.g., SO, NO and NH, are the major components of ambient aerosols (Liang et al., 2017; Du et al., 2014; Zheng et al., 2015; Tan et al., 2016). Biomass burning (BB) emissions constitute a large source of ambient particulate pollution, especially for carbonaceous components, i.e., primary organic carbon (POC) and black carbon (BC) on a global scale (Bond et al., 2004; Tang et al., 2018). As an important aerosol component, black carbon from industrial and combustion emissions contributes to the enhanced PM2.5 (particulate matter with aerodynamic diameters less than 2.5 µm) mass concentrations and influences regional radiative forcing (Chen et al., 2017). Fresh biomass burning aerosol was found to be mainly comprised of carbonaceous species which typically constitute 50 %–60 % of the total particle mass (Hallquist et al., 2009). Yao et al. (2016) identified approximately half of carbonaceous aerosols being contributed by biomass burning at Yucheng, a rural site in the North China Plain.
Biomass burning emissions also represent a potentially large source of secondary organic aerosol (SOA). The precursors and formation pathways of SOA from biomass burning emissions were investigated by extensive field observations (e.g., Zhu et al., 2015, 2017; Adler et al., 2011; Zhang et al., 2010, 2015). Based on morphological particle analysis, Yao et al. (2016) investigated the smoke emitted from biomass burning impacting SOA production. Sun et al. (2010) found that phenolic compounds, which were emitted in large amounts from wood combustion, can form SOA at high yields in aqueous-phase reactions. In addition, smoke from biomass burning can be transported thousands of kilometers downwind from the source areas. Biomass burning aerosol from southeast Asia can be transported to China, Singapore and even further to North America (Liang et al., 2017, 2020; Hertwig et al., 2015; Peltier et al., 2008). Based on molecular tracer measurements, synoptic data and air-mass back-trajectory analysis, a fire episode was captured at a background site of East China with smoke advected from southeast Asia (Liang et al., 2017).
The North China Plain (NCP) is one of the most polluted regions in China. Severe haze and fog of longer duration and more extensive coverage have occurred frequently in the NCP area, especially during the seasons of autumn and winter. NCP covers one-quarter of China's cultivated land and yields 35 % of the agricultural products in China (Boreddy et al., 2017). The rural population in NCP is also large and dense, and biomass burning activities are common in this region in the form of cooking and heating. Intense fire activity typically occurs in October after the corn harvest. Abundant smoke is emitted from agricultural burning, i.e., residential biofuel combustion, open field burns, etc. Various field observations have investigated different aspects of biomass burning, e.g., seasonal variations, chemical and physical properties of smoke particles, spatial distribution, sources and transport, in the NCP region (Cheng et al., 2013; Shen et al., 2018; Sun et al., 2013; Boreddy et al., 2017; Xu et al., 2019). However, these field investigations of the contribution of biomass burning to ambient aerosols in the NCP region were concentrated on the city of Beijing (Cheng et al., 2013; Zheng et al., 2015; Duan et al., 2004; Liang et al., 2016). Little field research about biomass burning was reported for rural areas in the NCP. In fact, biomass burning activities are common in the rural areas of the NCP region, and the resulting smoke aerosol can be transported to urban areas, e.g., the city of Beijing, resulting in haze episodic events.
In order to characterize the biomass burning pollution status within rural areas of the NCP region, multiple biomass burning tracers, i.e., levoglucosan, mannosan and K+ in PM2.5, sampled at a heavily polluted rural site in the Hebei province were quantified during a typical biomass burning season, i.e., autumn–winter transition season, following the corn harvest. Combined with the analysis of other chemical components, it reveals different levels of biomass combustion pollution impacting different types of chemical components in ambient aerosol. Based on the multi-analysis of biomass burning molecular tracers, back-trajectory analysis, fire activity data and synoptic conditions, the results of this study demonstrate the biomass burning pollution status, as well as the formation process of severe biomass burning pollution episodes in the rural atmosphere of northern China. These results can provide valuable information about the biomass burning activities in all of northern China.
2.1 Site description and sampling
Samples were collected at a rural site, Gucheng (GC, 39∘09′ N, 115∘44′ E; 15.2 m a.s.l.), located on a platform at the China Meteorological Administration farm in the town of Gucheng (GC site), approximately 110 km southwest of Beijing and 35 km north of the city of Baoding (population of about 5 million) in the Hebei province, as shown in Fig. S1. The station is surrounded by agricultural fields, with major crop species being corn and wheat. The dominant wind direction at GC is southwest and northeast during the study period. This site is upwind of Beijing, when the wind blows from the south or southwest, where heavily polluted cities and regions of Hebei province, i.e., Baoding, Shijiazhuang, Xingtai and Handan, are located. Thus, it is an appropriate station for representing the air pollution situation in the NCP region (Chi et al., 2018; Xu et al., 2019, 2020; Kuang et al., 2020).
Daytime and nighttime PM2.5 samples were collected from 15 October to 23 November 2016, by using a PM2.5 high-volume (hi-vol) sampler (GUV-15HBL1, Thermo Fisher Scientific Co., Ltd.) at the nominal flow rate of 1.13 m3 min−1. The daytime samples were collected from 07:00 to 19:00 LT, while nighttime samples were collected from 19:00 to 07:00 LT of the next day. All PM2.5 samples were collected on quartz fiber filters, prebaked at 850 ∘C for at least 5 h to remove carbonaceous material. A total of 33 couples of daytime–nighttime samples and six whole-day samples as well as four field blank samples were collected during the sampling period. The filters were stored at −20 ∘C after sample collection.
2.2 Experimental methods
2.2.1 Anhydrosugar and water-soluble inorganic ion analysis
The quartz filter samples were analyzed for biomass burning anhydrosugar tracers, i.e., levoglucosan and mannosan, using an improved high-performance anion-exchange chromatography (HPAEC) method with pulsed amperometric detection (PAD) on a Dionex ICS-5000+ system. Levoglucosan and mannosan were separated by a Dionex Carbopac MA1 analytical column and guard column with an aqueous sodium hydroxide (NaOH, 480 mM) eluent at a flow rate of 0.4 mL min−1. The detection limit of levoglucosan and mannosan was 0.002 and 0.005 mg L−1, respectively. More details about the HPAEC-PAD method can be found elsewhere (Iinuma et al., 2009).
The quartz filter samples were also analyzed for water-soluble inorganic ions by a Dionex ICS-5000+ ion chromatograph, including SO, NO, NH, Cl−, Ca2+, Na+, K+ and Mg2+, and the method detection limits for the individual ionic species were 0.18 0.15, 0.03, 0.048, 0.08, 0.01, 0.01 and 0.008 µg L−1, respectively. The cations were separated on an Ionpac CS12 analytical column and CG12 guard column with a 20 mM methanesulfonic acid as eluent at a flow rate of 1.0 mL min−1, while the anions were separated on an Ionpac AS11-HC column and AG11-HC guard column with 21.5 mM potassium hydroxide (KOH) eluent at a flow rate of 1.0 mL min−1. The water-soluble inorganic ion data were corrected by field blanks.
2.2.2 Organic carbon / elemental carbon analysis
OC and EC were measured on a punch (0.526 cm2) of each quartz sample by a thermal–optical carbon analyzer (DRI model 2001, Desert Research Institute, USA), using the Interagency Monitoring of Protected Visual Environments (IMPROVE) thermal evolution protocol with reflectance charring correction. The analytical error of OC was within 10 %, and 1 sample of every 10 samples was selected at random for duplicate analysis. The detection limit of OC was 0.82 µgC cm−2 (Liang et al., 2017).
2.2.3 Gas online monitoring (i.e., NO, NO2, SO2, O3, CO and NH3)
During this campaign, commercial instruments from Thermo Fisher Scientific Co., Ltd. were used to measure O3 (TE 49C), NO NO2 NOx (model 42CTL), CO (TE 48CTL) and SO2 (TE43CTL), while NH3 was measured by an ammonia analyzer (DLT-100, Los Gatos Research, USA) at the GC station. All measurement data quality was controlled according to standard gases (Xu et al., 2019; Lin et al., 2011; Meng et al., 2018).
2.2.4 Meteorological parameters
The meteorological parameters, including air temperature, relative humidity (RH) and wind speed at a 24 h resolution at the GC site, are presented in Fig. 1. During this campaign, the daily average RH value was observed at 77 ± 13%, with a range from 48 % to 99 %, while the daily wind speed was observed with an average value of 1.07 ± 1.14 m s−1, exhibiting moist and stable synoptic conditions at this rural site during the autumn–winter transition season. Moreover, there was rare precipitation during the sampling period at the GC site, except for two days, i.e., 20 and 27 October 2016 (Fig. 1).
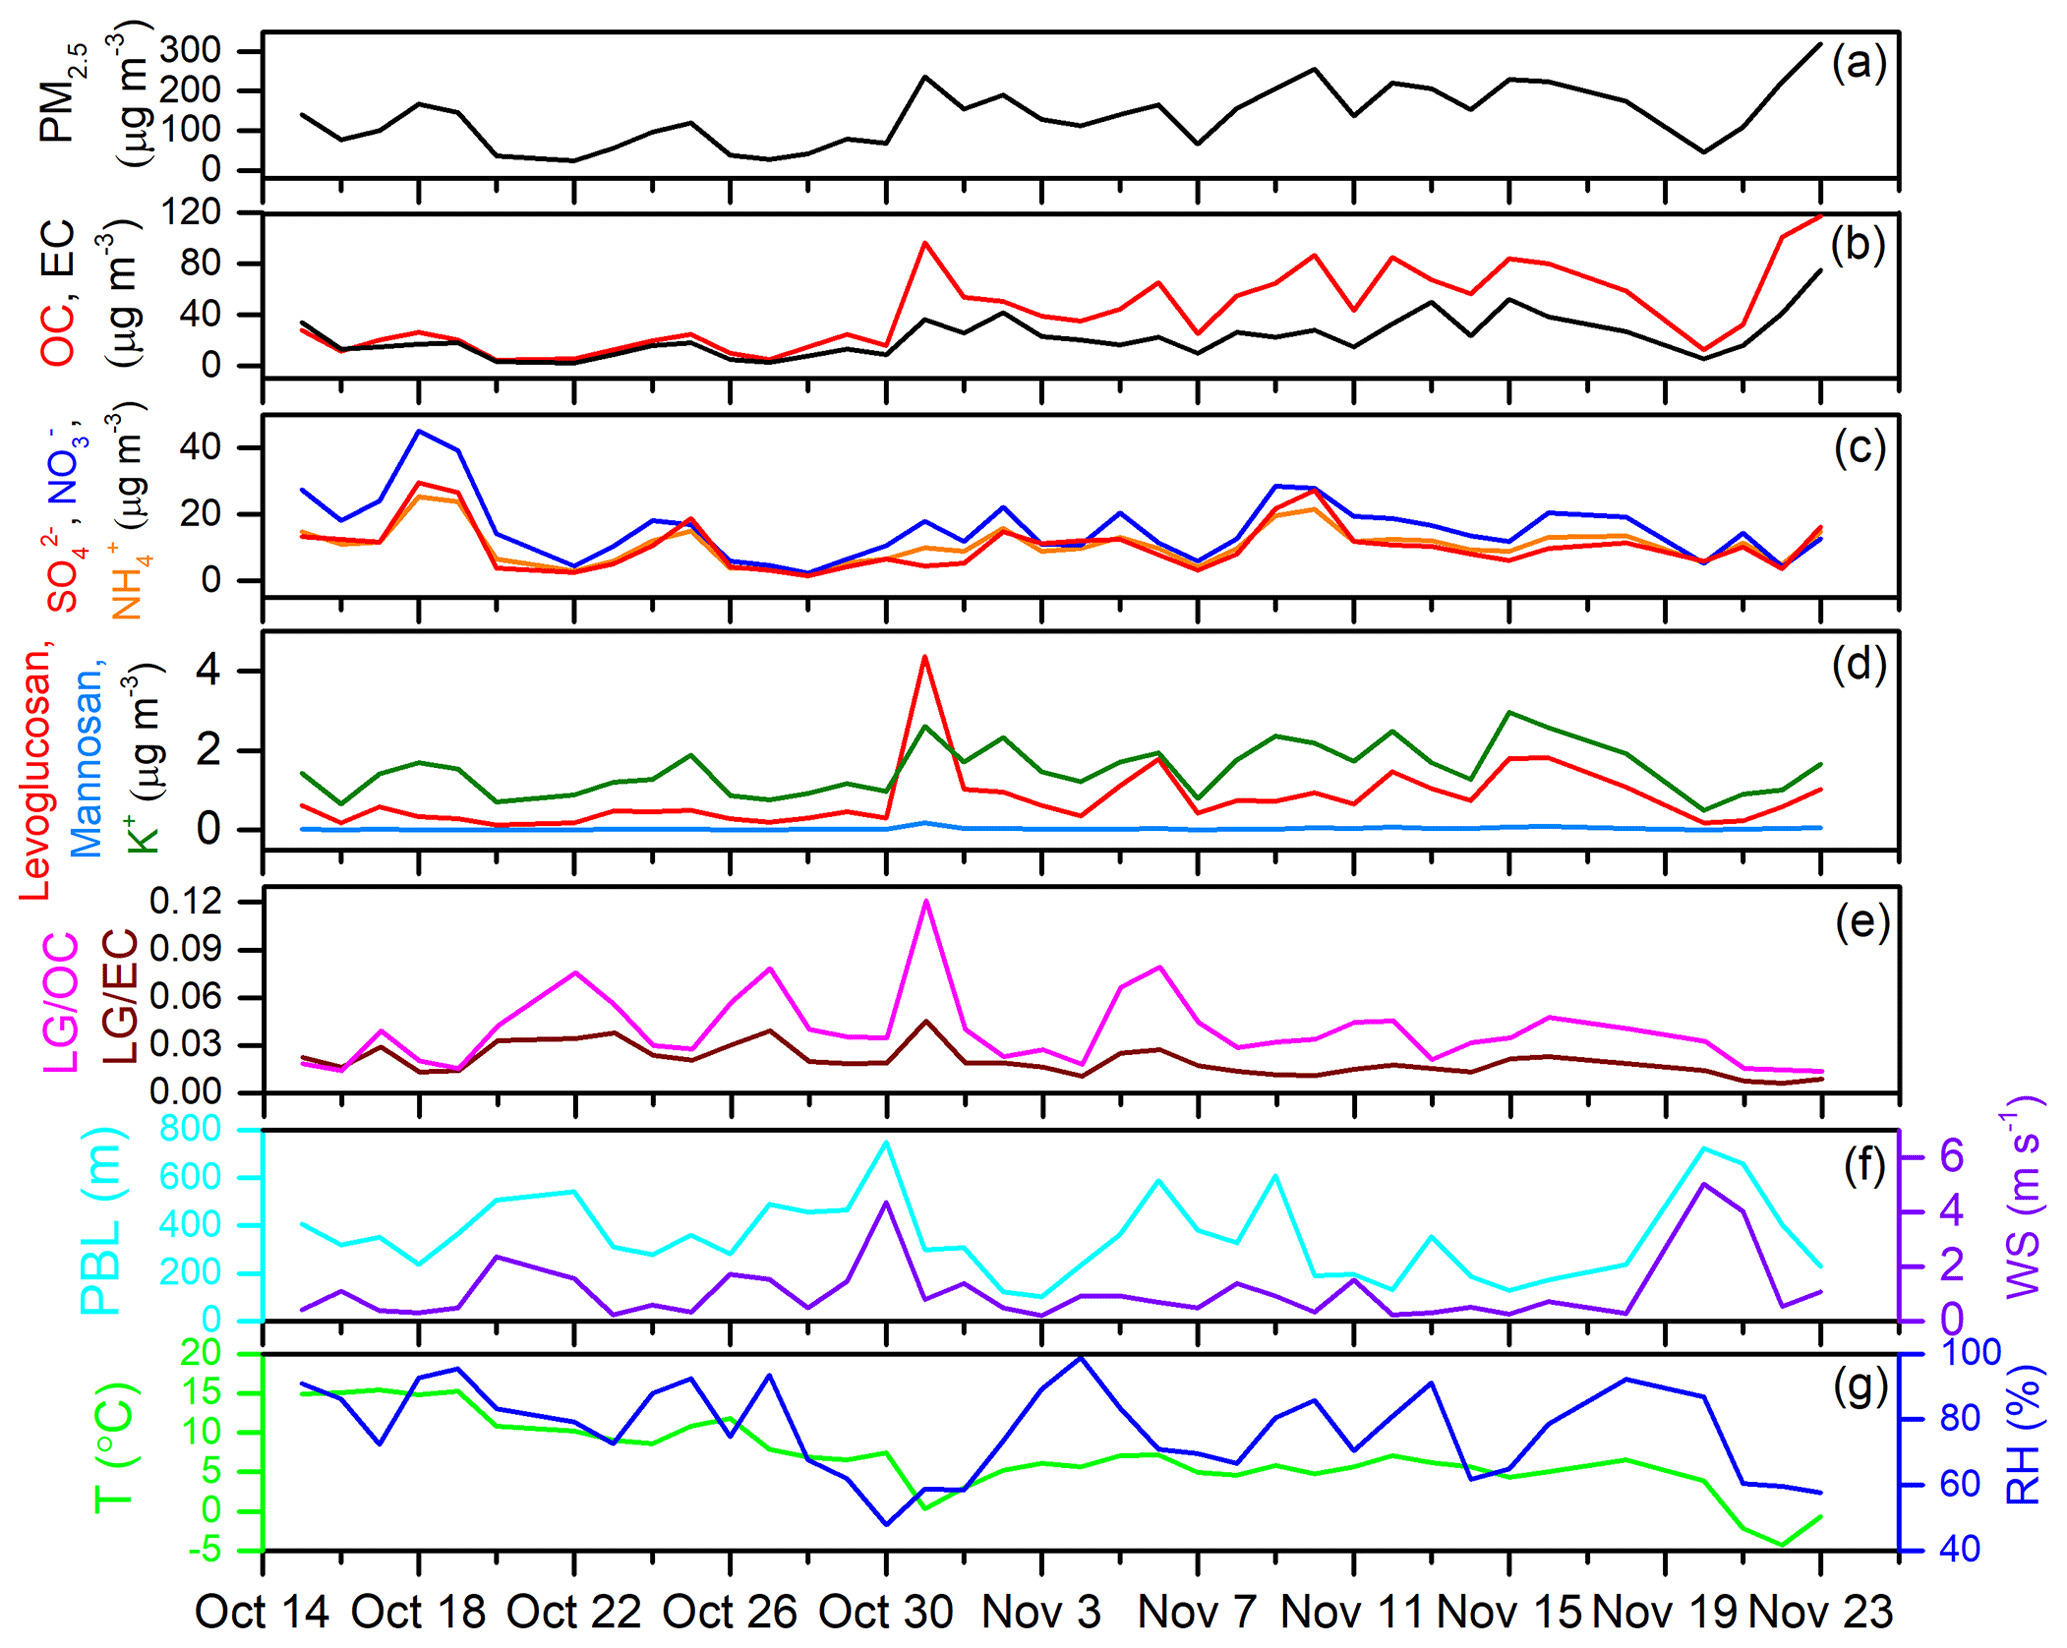
Figure 1Time-series variation obtained for PM2.5-cal and its major components, biomass burning tracers and meteorological factors at the GC site during the sampling period from 15 October to 23 November 2016. (a) PM2.5-cal, (b) OC and EC, (c) secondary inorganic aerosols, i.e., SO, NO and NH, (d) levoglucosan, mannosan and K+, (e) ratios of levoglucosan to OC (LG OC) and levoglucosan to EC (LG EC), (f) PBL and wind speed (WS), (g) temperature (T) and relative humidity (RH).
2.2.5 Back-trajectory and fire spot analysis
To characterize the transport pathways of the aerosol at the Gucheng site, back trajectories were calculated with the NOAA Hybrid Single-Particle Lagrangian Integrated Trajectory (HYSPLIT) model via the NOAA ARL READY website (http://ready.arl.noaa.gov/HYSPLIT.php, last access: 7 November 2020).
To investigate the influence of biomass burning activities in surrounding areas, fire hotspot counts were obtained from the Fire Information for Resource Management System (FIRMS) (available at https://firms.modaps.eosdis.nasa.gov/download/, last access: 23 November 2020).
2.2.6 Statistical analysis
Statistical analysis of data, i.e., the correlation analysis between the concentrations of levoglucosan, mannosan and K+ at the Gucheng site during the sampling period, was conducted with the linear fitting method.
3.1 Characteristics of chemical components in PM2.5
In this study, the mass concentration of PM2.5-cal was reconstituted by the sum of carbonaceous components (1.6 × OC + EC) and inorganic ions (SO NH NO Cl Ca Na K Mg2+). Figure 1 describes the time-series variation obtained for daily PM2.5-cal, OC, EC, biomass burning tracers (levoglucosan, mannosan and K+), ratios of levoglucosan OC and meteorological factors (temperature, RH, wind speed and planetary boundary layer (PBL) height) during the sampling period. The average daily PM2.5-cal mass concentration in the autumn–winter transition season at GC reached 137 ± 72.4 µg m−3, ranging from 23.3 to 319 µg m−3 (Table 1, Fig. 1a), which is higher than during the severe winter haze in January 2013 at an urban site in Beijing (121 µg m−3) (Zheng et al., 2015). The mass concentrations of these chemical species during the day are distributed as follows (from highest to lowest): OC > EC > NO > SO > NH > Cl− > Ca2+ > K+ > Na+ > Mg2+. Organic matter (OM), calculated by multiplying OC values with a coefficient of 1.6, was the most abundant PM component, the daily average value of which was 70.4 ± 49.6 µg m−3, accounting for nearly half (46.7 %) of PM2.5-cal mass, indicating obvious organic pollution at the rural site in the North China Plain during the sampling season.
Table 1Average concentrations and the range of PM2.5-cal and its chemical components, biomass burning tracers (µg m−3), gaseous species, ratios of OC EC and levoglucosan OC, as well as meteorological data observed at the GC site during daytime, nighttime and the whole day, respectively, during the sampling period from 15 October to 23 November 2016.
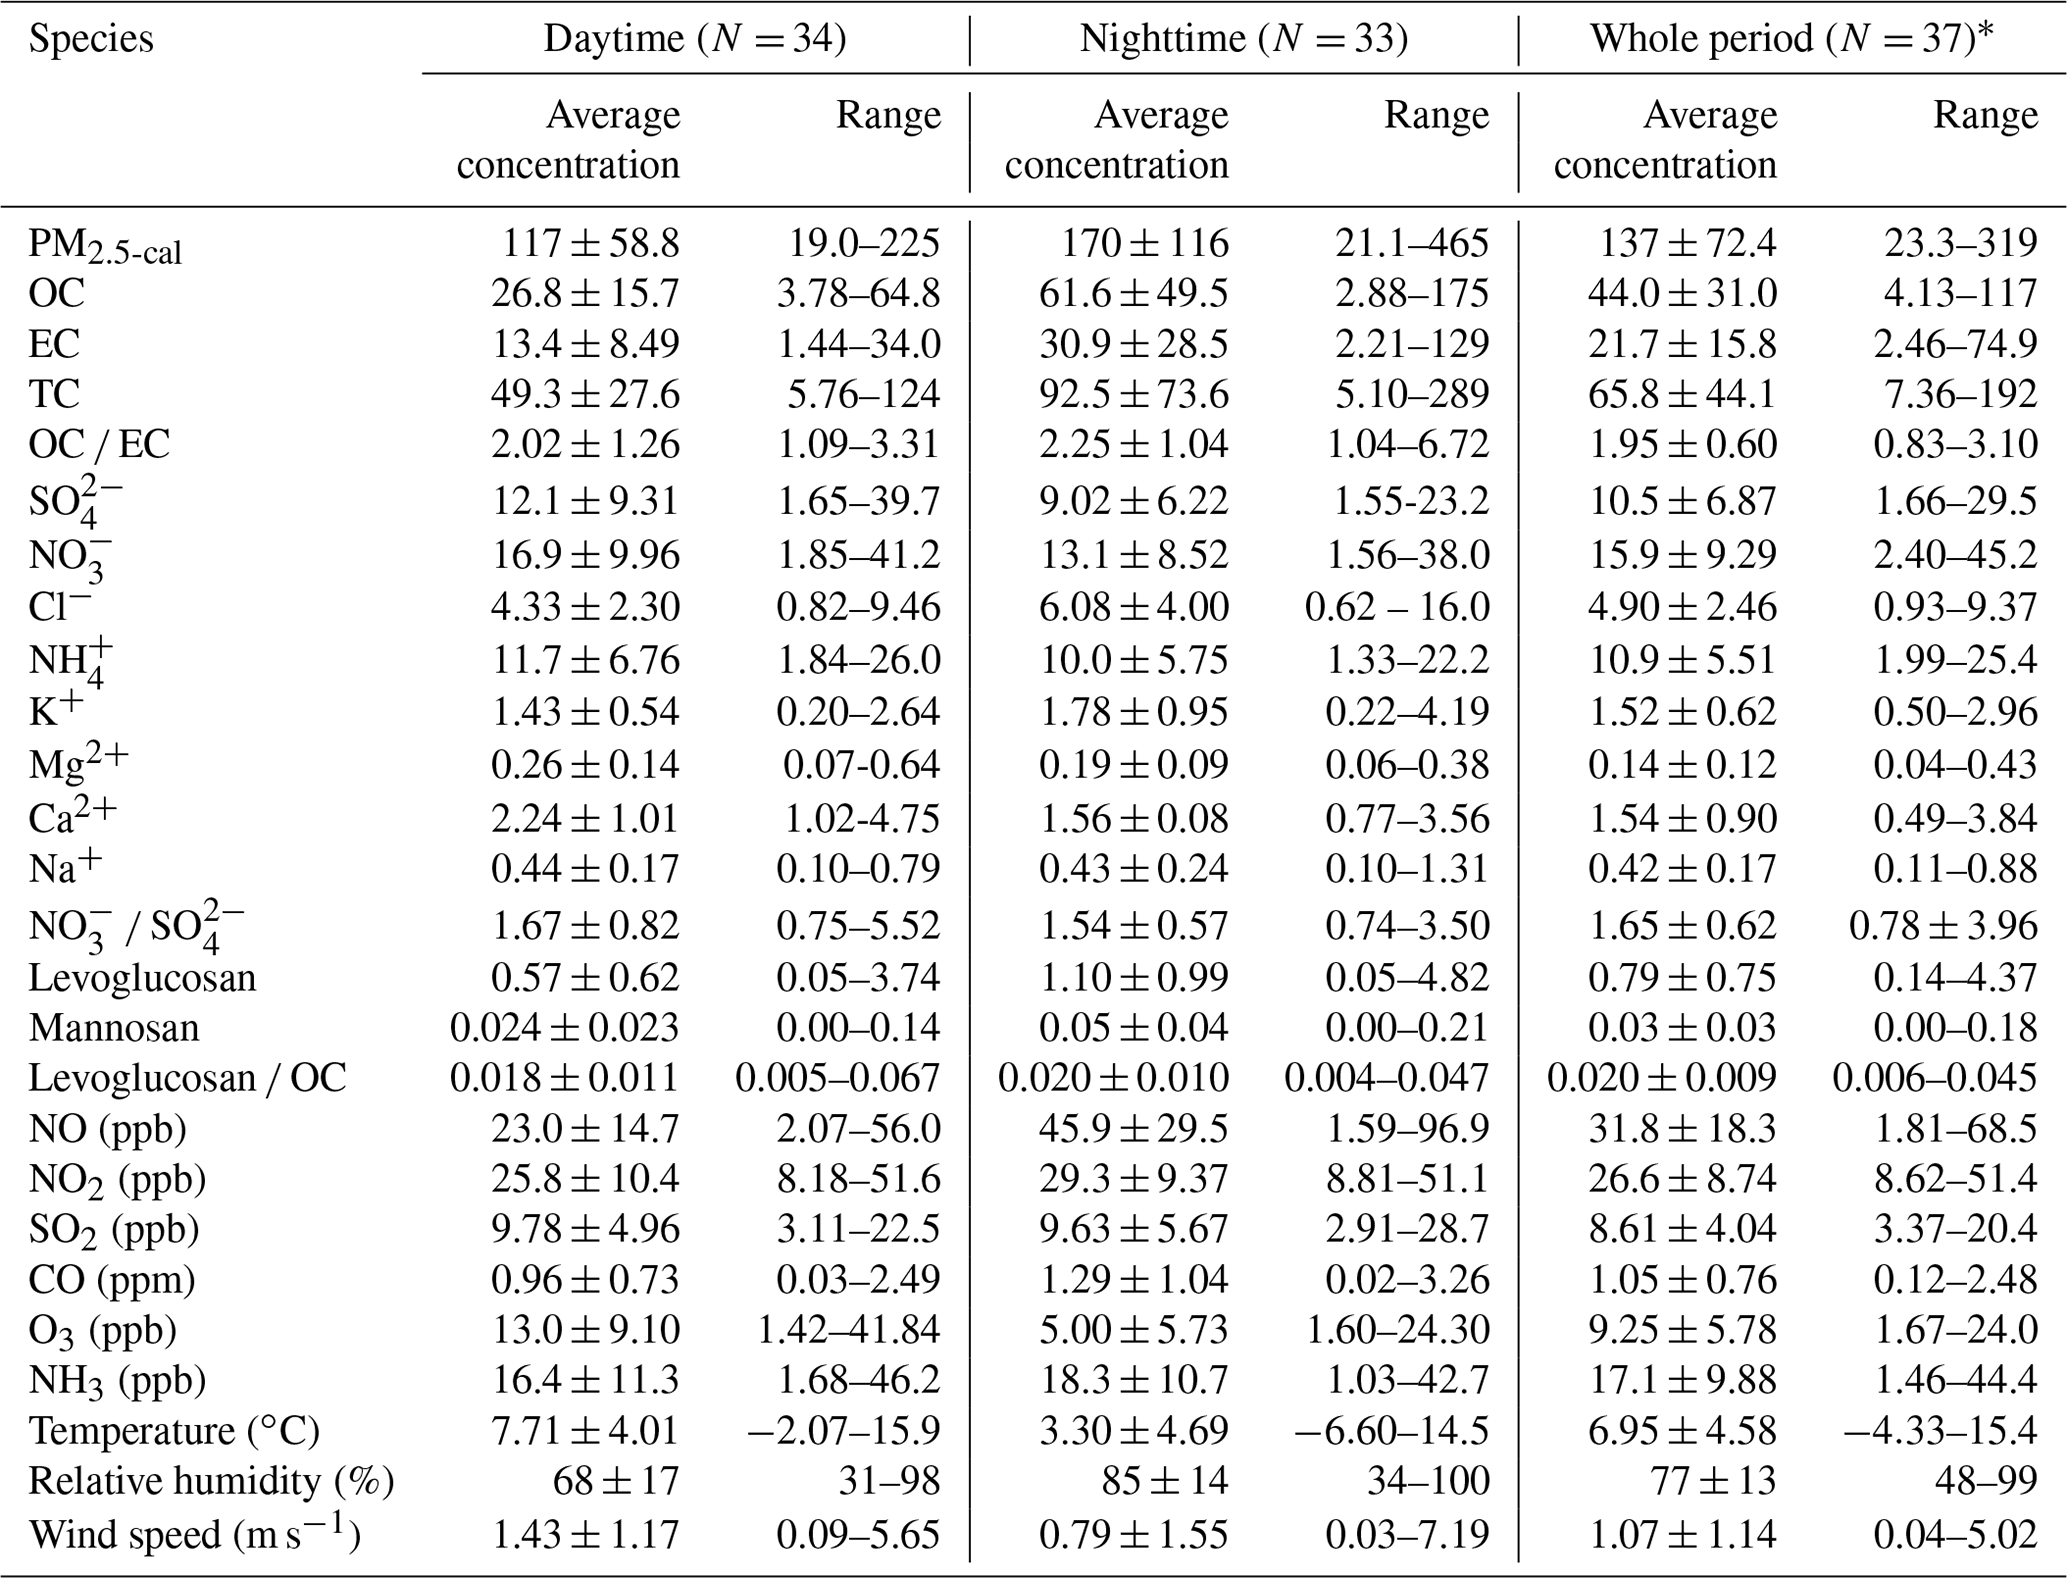
* Six whole-day samples were included in the data analysis of the “whole period”.
The measured daily average concentrations of biomass burning tracers, i.e., levoglucosan, mannosan and K+, in PM2.5 during our study were 0.79 ± 0.75, 0.03 ± 0.03 and 1.52 ± 0.62 µg m−3, respectively (Table 1). The ambient concentrations of levoglucosan in this study were higher than those observed in the city of Beijing during the summer (averaged at 0.23 ± 0.37 µg m−3, in the range of 0.06 to 2.30 µg m−3) and winter (averaged at 0.59 ± 0.42 µg m−3, in the range of 0.06 to 1.94 µg m−3) of 2010–2011 (Cheng et al., 2013). The biomass burning tracer levels and ratios observed in this study and other field studies are summarized in Table S1. The highest concentrations of levoglucosan in GC were observed on 31 October 2016 with 4.37 µg m−3, which is a sharp increase (over 30 times) of the minimum concentration (0.14 µg m−3) during that period (Fig. 1c). Accordingly, the PM2.5-cal concentration during that period was also elevated (as high as 236 µg m−3) (Fig. 1a). Secondary inorganic aerosol (sulfate, SO; nitrate, NO; and ammonium, NH; SNA) species were the major water-soluble ions, accounting for 82.8 % of total water-soluble ions, the daily average values of which were 10.5 ± 6.87, 15.9 ± 9.29 and 10.9 ± 5.51 µg m−3, respectively (Table 1). SNA species exhibited a synchronous temporal trend (Fig. 1c), while the NO concentrations exceeded those of SO at the GC site, in contrast to the results of previous studies, e.g., Tan et al. (2016), who found SO to be the dominant species in PM2.5 during winter in 2006 in Beijing. Similarly, Chi et al. (2018) also found NO concentrations exceeded those of SO at both the Beijing and GC sites during the winter in 2016, although they observed that NH was the dominant component of SNA (the concentrations of SO, NO and NH were 14.0, 14.2 and 24.2 µg m−3, respectively).
3.2 Day–night variations in the PM2.5 chemical components
Carbonaceous components and biomass burning tracers exhibited higher levels during nighttime than daytime, while secondary inorganic ions showed the opposite pattern, i.e., higher concentrations during daytime than nighttime (Figs. 2 and S2). Besides, the gap of carbonaceous components and anhydrosugars between daytime and nighttime (2-fold) was more significant than for secondary inorganic ions. EC and POC are not subject to significant differences in chemical reactions in ambient air between daytime and nighttime, and they will be mainly influenced by the variations of the PBL height. In the night, the PBL height decreases, compressing air pollutants into a shallow layer and subsequently resulting in faster accumulation and higher concentrations of pollutants (Zheng et al., 2015; Zhong et al., 2018; 2019). The contributions of OM and EC to PM2.5-cal were observed to be higher during nighttime (53.9 % and 16.6 %) than daytime (43.8 % and 13.7 %) as well (Fig. 3). Besides the influence from variations of the PBL height, the chemical degradation of levoglucosan may occur due to photochemical reaction in the ambient aerosols during daytime, further enlarging the gap of levoglucosan levels between daytime and nighttime (Sang et al., 2016; Gensch et al., 2018). Consequently, the contribution of levoglucosan to PM2.5-cal during daytime (0.45 %) was observed to be considerably lower than that during nighttime (0.64 %) (Fig. 3). However, secondary inorganic ions have an important formation pathway, i.e., photochemical processing, during daytime. Thus, the secondary inorganic species (SO, NO and NH) were enhanced during daytime due to photochemical formation (Sun et al., 2013; Zheng et al., 2015; Wu et al., 2018). The mass contributions of SO, NO and NH to PM2.5-cal decreased from daytime (9.9 %, 14.5 % and 10.0 %) to nighttime (6.5 %, 9.6 % and 7.1 %) (Fig. 3). Such an enhancement in secondary transformations during daytime is more evident in terms of the sulfur and nitrogen oxidation ratios (SOR and NOR, molar ratio of sulfate or nitrate to the sum of sulfate and SO2 or nitrate and NO2), which have been used previously as indicators of secondary transformations (Sun et al., 2013; Zheng et al., 2015). Both SOR and NOR during daytime were higher than those during nighttime (Fig. S3), further confirming the elevated secondary formation of sulfate and nitrate during daytime.
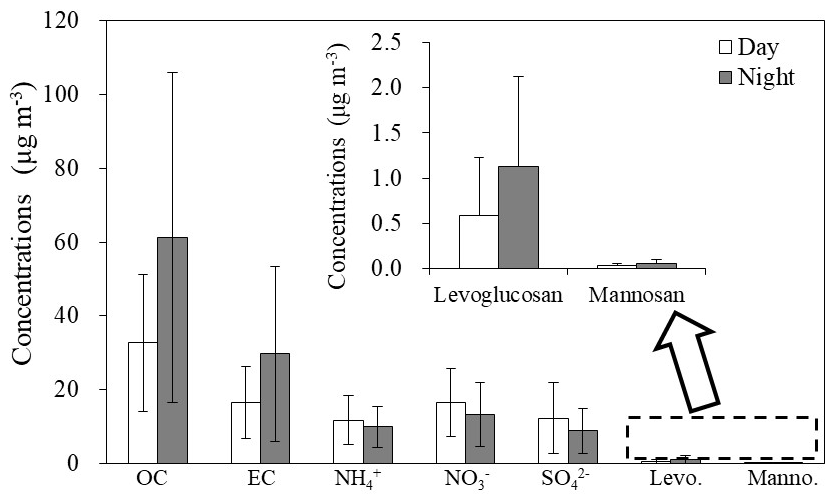
Figure 2Day and night distributions of mean concentrations of the main chemical components (OC, EC, SO, NO and NH and biomass burning tracers (levoglucosan and mannosan) in PM2.5 observed at the GC site during the sampling period.
In addition, the concentrations of other water-soluble inorganic ions, i.e., K+ and Cl−, during nighttime (1.78 ± 0.95 and 6.08 ± 4.00 µg m−3) were higher than those in daytime (1.43 ± 0.54 and 4.33 ± 2.30 µg m−3), while their contributions to PM2.5-cal were reversed, due to the significant accumulation and higher concentrations of pollutants during nighttime. As Ca2+, Mg2+ and Na+, which are mainly emitted from primary natural sources, such as dust, soil resuspension and sea salt, are subject to more activity during the daytime and also influenced by the airflow dynamics, the contributions of those species in nighttime were lower than those during daytime, especially for Ca2+, which decreased from 2.2 % in daytime to 0.9 % during nighttime (Fig. 3).
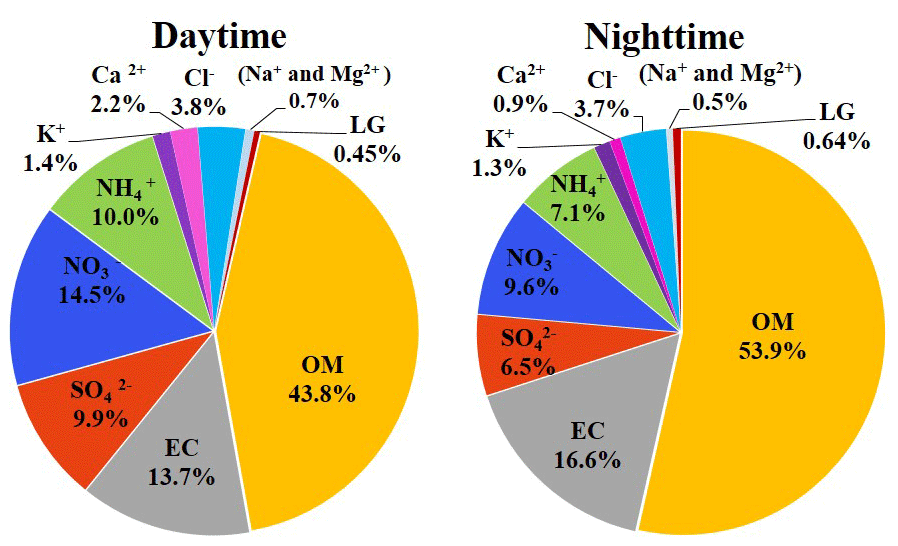
Figure 3Percent contributions of individual component mass concentrations to total estimated PM2.5-cal mass for daytime and nighttime during the sampling period.
3.3 Biomass burning episodes and the impacts on chemical PM2.5 characteristics
An episode with high biomass burning tracer levels was encountered on 31 October 2016. The concentrations of levoglucosan in PM2.5 during this 1 d episode (4.37 µg m−3) were significantly higher than those during the typical transition season at the GC site (0.69 ± 0.47 µg m−3) (Fig. 1d). Meanwhile, there was significant change in the meteorological conditions; i.e., the wind direction changed from southwesterly to northerly winds (Fig. S4). Northerly winds advected cold and dry air masses, with the lowest hourly temperature observed at −5.3 ∘C (Fig. S5). This notable temperature decline before the commencement of the operation of the central heating systems should have caused intense combustion activities for heating purposes at the rural site. Moreover, the synoptic situation on 31 October 2016 was under weaker turbulence with low PBL height and small wind speeds (Fig. 1f). These worsened meteorological conditions would further enhance aerosol accumulation.
Here, we mainly distinguish four subperiods based on daily levoglucosan concentrations during the time frame from 15 October to 23 November 2016. The four periods were separated as follows: 15–30 October (period I: minor biomass burning), 31 October (period II: intensive biomass burning), 1–14 November (period III: major biomass burning) and 15–23 November (period IV: heating season). Table 2 compares the concentrations of PM2.5-cal mass, chemical components and gases at the GC site during these four periods, as well as the ratios between the intensive and major BB periods and heating season to the minor BB period. The level of levoglucosan during the intensive BB period (II) was about 12 times greater than that during the minor BB period (I). K+ and Cl−, the common biomass burning tracers utilized in many studies (Duan et al., 2004; Cheng et al., 2013), were also observed with increased abundance during the intensive BB period (II). When entering November, the weather was becoming cold, and thus combustion activities for heating in the rural areas commenced, resulting in the ambient levels of levoglucosan increasing to 0.92 ± 0.47 µg m−3 during period III, about 3 times those in period I. The central heating systems in northern Chinese cities were operated during period IV, and the ambient level of levoglucosan was observed at 0.96 ± 0.63 µg m−3, which was similar to that observed in period III.
Table 2Concentrations of chemical components in PM2.5 aerosols as well as their ratios and gaseous species collected at the GC site during the four biomass burning periods (i.e., minor, intensive, major BB and heating periods) from 15 October to 23 November 2016.
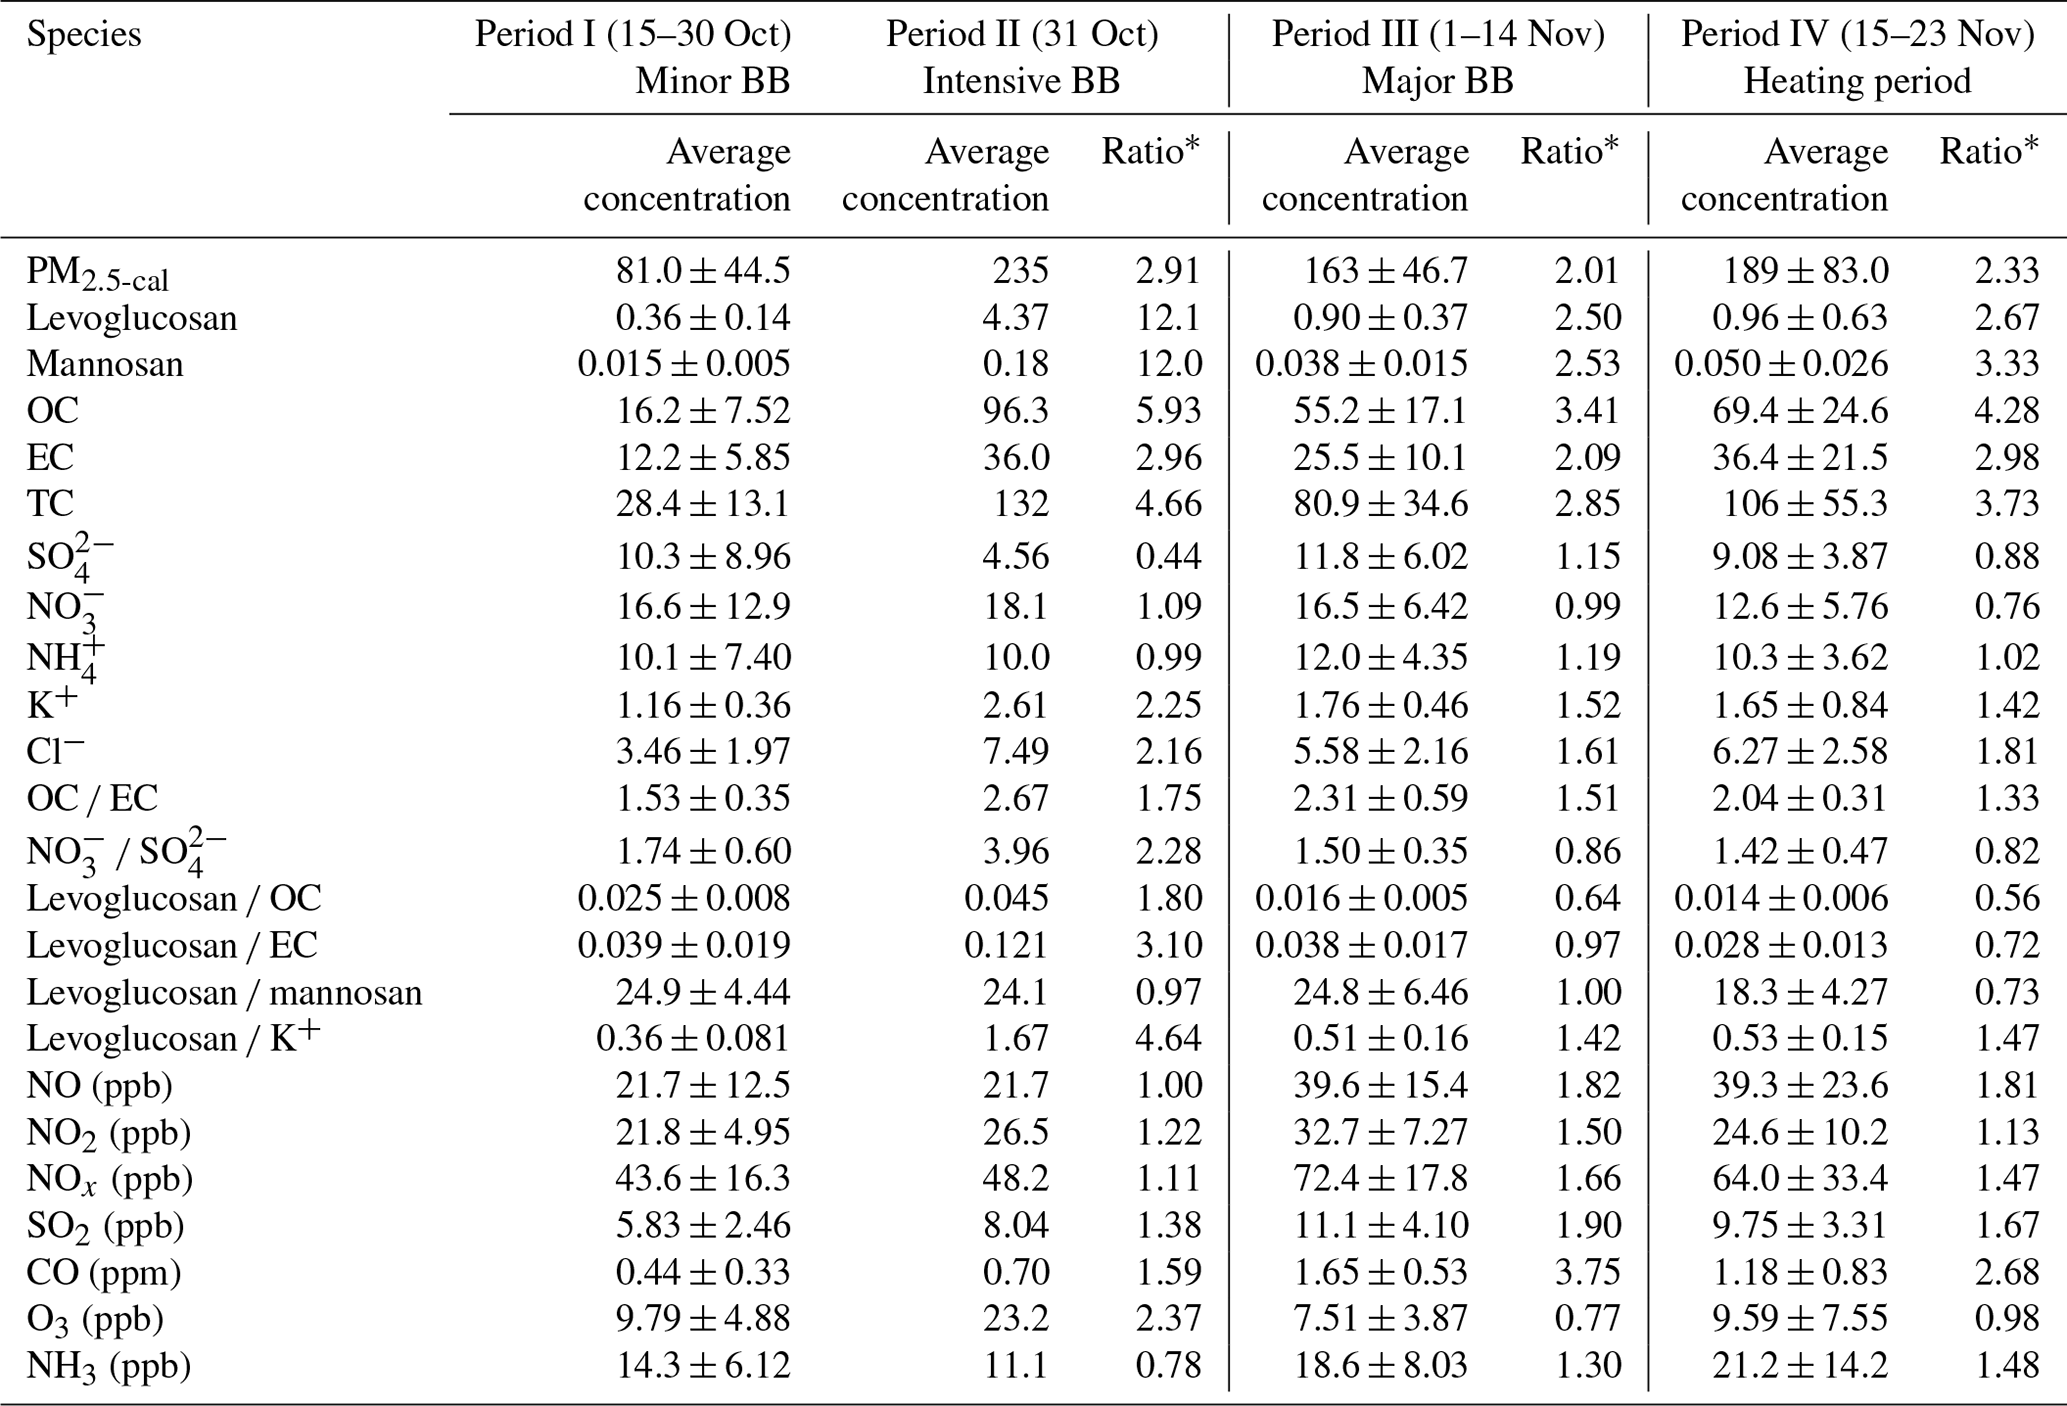
* indicates that the ratios of the heating period, intensive BB period or major BB period were divided by those from the minor BB period.
The concentrations of OC and EC were also observed to be strongly elevated in period II (Table 2), and especially OC levels increased to 96.3 µg m−3 during the intensive BB period (II), nearly 6 times those during the minor BB period (16.2 ± 7.52 µg m−3). The levoglucosan OC ratio was utilized to estimate the effect of biomass burning on ambient organic aerosols. Accordingly, levoglucosan OC ratios sharply increased to 0.045 during period II, which was noticeably higher than during other periods in this study (Fig. 1e). Moreover, this level is also higher than most of the published field observations, i.e., at urban sites (Zhang et al., 2008, 2014; Cheng et al., 2013), rural sites (Sang et al., 2013; Ho et al., 2014; Pietrogrande et al., 2015; Mkoma et al., 2013) and agricultural sites (Ho et al., 2014; Jung et al., 2014), yet lower than at an urban site in northern Italy during wintertime (in the range of 0.01 to 0.13) (Pietrogrande et al., 2015). This illustrates that biomass combustion played an important role in organic aerosol pollution during the intensive BB period (II). However, due to other emissions of OC enhanced during the major BB episode (period III) and heating season (period IV), i.e., combustion of coal and biofuel for heating, OC increased to a higher level (55.2 ± 17.1 and 69.4 ± 24.6 µgC m−3, respectively). Due to the abundance of organic aerosols, the contribution from biomass burning emission was thereby reduced and the levoglucosan OC ratios during periods III and IV decreased to 0.016 ± 0.005 and 0.014 ± 0.006, respectively, even lower than those observed in the minor BB period (I) (0.025 ± 0.008).
Compared to the carbonaceous components, the concentrations of secondary inorganic aerosol species (SO, NO, NH exhibited a different pattern, i.e., showing no obvious differences between the minor BB period (I) and other three periods. The ratios of SO, NO and NH during periods II, III and IV to period I were all around 1.0 (Table 2), with no increasing trend. Moreover, the relationships between levoglucosan and OC (and EC) were better than those between levoglucosan and SNA during daytime and nighttime (Fig. S3). The precursor gases of SNA, i.e., SO2, NO, NO2 and NH3, were observed to have an increasing trend when biomass burning was prevalent during periods III and IV, with the ratios to period I arranged from 1.13 to 1.90 (Table 2). The time-series variations of the gases (SO2, NOx, NH3, CO and O3) and PBL during the sampling period are shown in Fig. S4. The primary emission gases exhibited negative relationships with PBL, while O3 exhibited an obvious positive relationship with PBL (Fig. S5). Combustion from different fossil fuels (coal, gasoline, diesel, etc.) and biomass (straw, wood, leaves, etc.) can all emit CO into the atmosphere (Streets et al., 2003; Chantara et al., 2019; Merico et al., 2020). Due to the more abundant combustion in the colder weather, the concentrations of CO also increased to 1.65 ± 0.53 and 1.18 ± 0.83 ppm during the major biomass burning (period III) and the heating season (period IV), respectively.
The combustion of biomass, especially of agricultural residue (e.g., wheat and corn straw), is very common in the rural areas in northern China during the autumn–winter transition period. During the autumn harvest season in northern China, wheat and corn straw burning is common practice, resulting in more abundant fire spots when entering November than during period I (Fig. 4). The intense biomass burning event on 31 October 2016 was also supported by air-mass back-trajectory analysis (Fig. 5), performed with the TrajStat software. Based on the 48 h back trajectories at the GC site at 00:00 UTC on 1 November 2016, the air mass at the GC site was restricted in the region of Beijing–Tianjin–Hebei, the polluted area where fire spots were numerous. However, on the previous and following days of this episode, i.e., 31 October and 2 November onward, the air masses arriving at GC were advected from the northwest of Mongolia, where mostly desert areas are present, with less farm land and rare biomass burning activities (Fig. 5).

Figure 4Fire spots at the GC site and the surrounding provinces from (a) 15–30 October 2016 and (b) 1–23 November 2016, observed by MODIS Terra satellites (the blue dot represents the GC station).
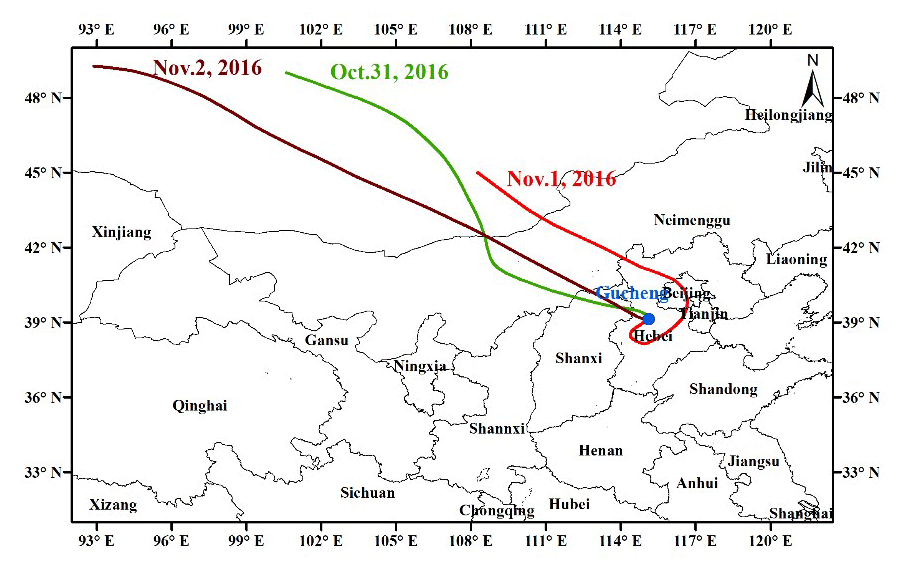
Figure 5The 48 h back trajectories at 500 m at the GC site (39∘09′ N, 115∘44′ E) at 00:00 UTC from 31 October to 2 November 2016.
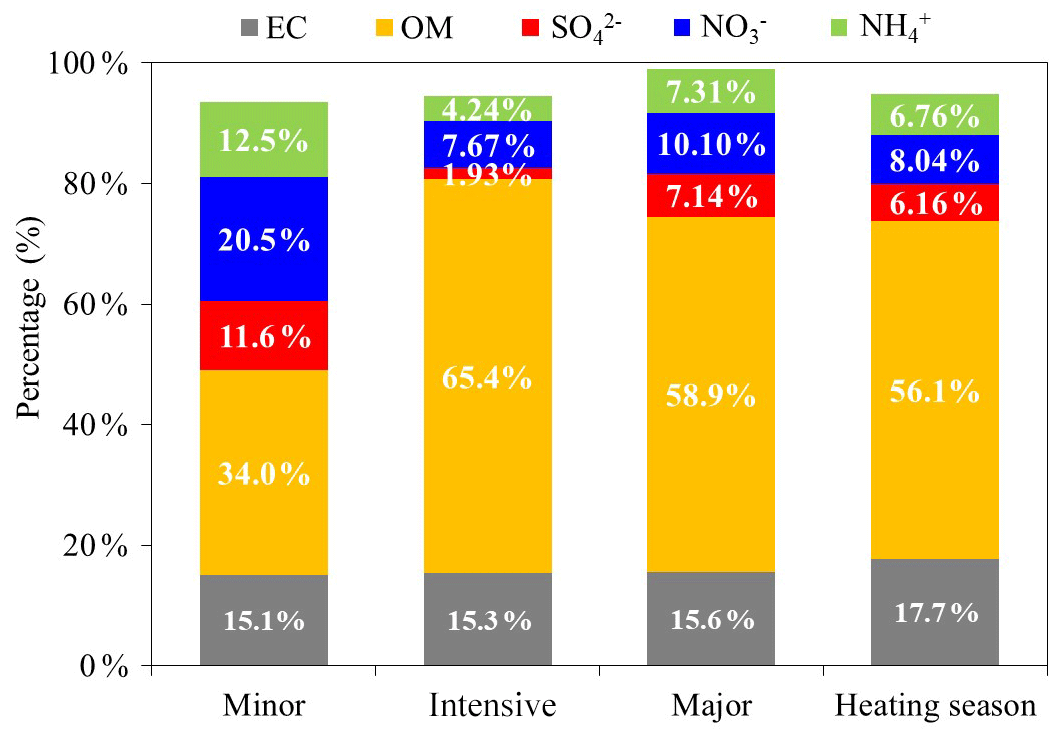
Figure 6Mean percentiles of major components in PM2.5 with respect to different biomass burning pollution periods at the GC site during the sampling time.
Mean percentiles of major components in PM2.5 with respect to different BB pollution periods at the GC site during the sampling time are shown in Fig. 6. With the variation of BB pollution periods, the EC fraction seems to exhibit no obvious change during periods I, II and III, but it slightly increased during the heating season (period IV), while the OC fraction increased significantly from 34.0 % during the minor BB period (I) to 65.4 % during the intensive BB period (II). The contributions of sulfate, nitrate and ammonium to PM2.5-cal all decreased sharply from the minor BB period to the intensive period (Fig. 6). This suggests that organic aerosol species become more important during BB pollution periods, concerning their contribution to the PM2.5-cal, while EC has no such character. The OM percentage during intensive BB period (II) was 65.4 %, about double that during the minor biomass burning period (34.0 %), indicating that there was a large fraction of OM in PM2.5-cal originating from BB at the GC site during the intensive BB period (II). In contrast to OM, contributions of secondary inorganic ions to PM2.5-cal significantly decreased with the BB pollution becoming more severe. The contributions of SO, NO and NH to PM2.5-cal during the minor BB period (11.6 %, 20.5 % and 12.5 %) obviously declined during the intensive BB period (1.93 %, 7.67 % and 4.24 %).
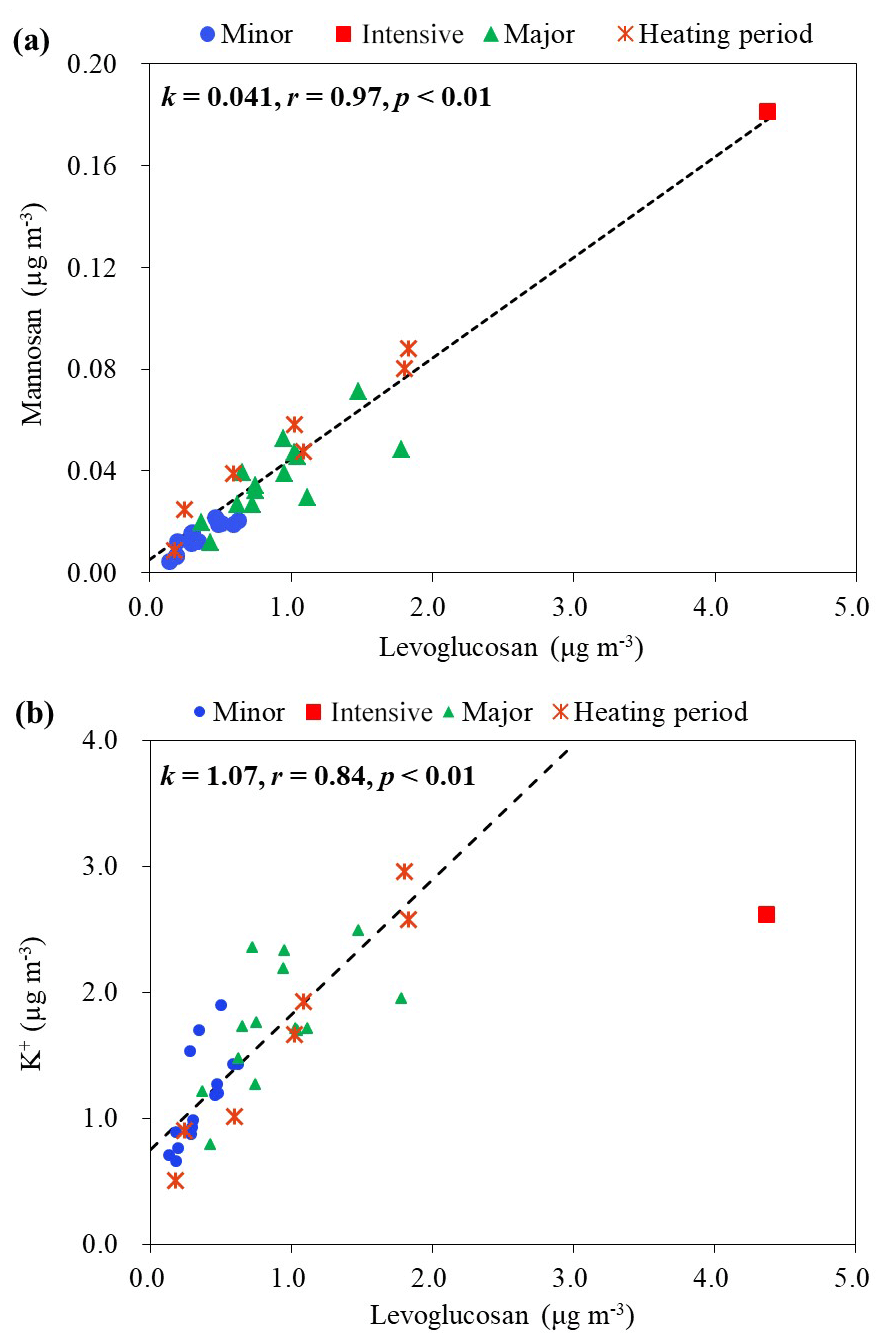
Figure 7Scatter plots of (a) levoglucosan versus mannosan, (b) levoglucosan versus K+. Statistical analysis of sampling data was conducted with the linear fitting method.
3.4 Relationships among tracers during different biomass burning pollution periods
In addition to pollution level information of biomass burning molecular tracers, the ratios between them could also be used to identify the different biomass types or indicate the burning formation processes of atmospheric aerosols. Levoglucosan and mannosan showed a good relationship during the entire sampling period (Fig. 7a, r=0.97, p < 0.01). The levoglucosan mannosan ratios during minor, intensive, major biomass pollution and heating season periods were observed at high values, i.e., 24.9, 24.1, 24.8 and 18.3, respectively (Table 2, Fig. 7). Compared to the former three episodes (24.1 to 24.9, averaged at 24.6), the levoglucosan mannosan ratio during the heating season period (18.3) decreased by 25.6 %. Based on source emission studies, the levoglucosan mannosan ratios from crop residue burning, i.e., rice straw, wheat straw and corn straw, are similar and are characterized by high values (averaged at 29, in the range of 12 to 55) (Zhang et al., 2007; Engling et al., 2009; Cheng et al., 2013; Jung et al., 2014), yet overlapping with those from hardwood (averaged at 28, in the range of 11 to 146) (Bari et al., 2009; Jung et al., 2014) and grass burning (18.2 ± 10.2) (Sullivan et al., 2008), while softwood is characterized by relatively lower levoglucosan mannosan ratios (averaged at 4.3, in the range of 2.5 to 4.7) (Engling et al., 2006; Cheng et al., 2013; Jung et al., 2014). Subsequently, this declining trend in the levoglucosan mannosan ratios during the heating season period was partly caused by the higher proportion of softwood combustion, which is characterized by relatively lower levoglucosan mannosan ratios. According to the local habits, softwood, e.g., China fir and pine, is also commonly used as biofuels for stove heating in northern China, since it allows for sustained heating duration.
The concentrations of levoglucosan and K+ during minor and major BB periods and the heating season were correlated well (Fig. 7b, r= 0.84, p < 0.01), while the red dot of period II is off from the fitted regression line. The levoglucosan K+ ratios during periods III and IV (0.51 and 0.53) were similar to those during a BB episode at an urban site in Beijing during wintertime (levoglucosan K 0.51) (Cheng et al., 2013). However, the levoglucosan K+ ratio during the intensive BB period (II) increased to 1.67, which was significantly higher than that in typical straw combustion (< 1.0). Correspondingly, there was a significant drop in temperatures at the GC site during period II, with the average daily temperature sharply decreasing from 7.5 ∘C on 30 October to 0.31 ∘C on 31 October 2016, and the average temperature at night on 31 October even decreasing to −3.4 ∘C (Fig. 1g). Hence, the combustion activities were apparently intense around the sampling site for heating purposes. Compared to K+, there is a large enrichment of levoglucosan in wood-burning emissions, based on the results from previous biomass source combustion studies (Engling et al., 2006; Chantara et al., 2019). The influence of softwood and/or other materials from softwood, which are commonly used as biofuels for stove heating in northern China (Cheng et al., 2013; Zhou et al., 2017), should be larger during this low-temperature period. Moreover, levoglucosan K+ ratios also can be influenced by combustion conditions, i.e., smoldering versus flaming burns. Biofuels are typically subject to smoldering combustion conditions in residential stoves for heating purposes in the rural areas in northern China, which was reflected in relatively higher levoglucosan K+ ratios than during flaming combustion (Schkolnik et al., 2005; Lee et al., 2010).
Anhydrosugars, including levoglucosan and mannosan, and water-soluble potassium ions were employed as molecular tracers to investigate the characteristics of biomass burning activities as well as chemical properties of ambient aerosols under different biomass burning pollution levels. The measured daily average concentrations of levoglucosan, mannosan and K+ in PM2.5 during a typical biomass burning season from 15 October to 30 November 2016 were 0.79 ± 0.75, 0.03 ± 0.03 and 1.52 ± 0.62 µg m−3, respectively. The concentrations of carbonaceous components and biomass burning tracers were observed to be higher during nighttime than daytime, while the patterns of secondary inorganic ions (SO, NO and NH were the opposite, since they were enhanced by photochemical formation during daytime. An episode with extreme biomass burning tracer levels was encountered on 31 October 2016, with concentrations of levoglucosan as high as 4.37 µg m−3. Comparing the chemical compositions between different biomass burning periods, it was apparent that biomass burning can considerably elevate the levels of organic components while not showing a significant effect on the production of secondary inorganic ions. Compared to the other biomass burning episodes, the levoglucosan mannosan ratios during the heating season period slightly decreased, while levoglucosan K+ ratio during the intensive BB period was unusually higher than those in the other three biomass burning periods.
The data used in this study can be obtained from the following open link: https://pan.baidu.com/s/1ZfPC17Bsa1KhjSrmTLIXcg#list/path=2F (Liang, 2016) (code: 5aue). It is also available from the corresponding author upon request (lianglinlin@cma.gov.cn).
The supplement related to this article is available online at: https://doi.org/10.5194/acp-21-3181-2021-supplement.
LL designed and conducted all observations and drafted the paper. GE revised and finalized the manuscript. XL drew Figs. 4 and 5. CL, WX, YC, ZD, GZ, JS and XZ interpreted the data and discussed the results. All authors approved the final version for publication.
The authors declare that they have no conflict of interest.
The authors would like to acknowledge Yingli Yu and Ye Kuang for their help with PM2.5 sample collection and Hongbing Cheng for help with chemical analyses.
This research has been supported by the Beijing Municipal Natural Science Foundation (grant no. 8192055), the State Environmental Protection Key Laboratory of Sources and Control of Air Pollution Complex (grant no. SCAPC201701), the Chinese Academy of Meteorological Sciences Fundamental Research Funds (grant no. 2017Z011) and the National Natural Science Foundation of China (grant no. 41705109).
This paper was edited by James Allan and reviewed by three anonymous referees.
Adler, G., Flores, J. M., Abo Riziq, A., Borrmann, S., and Rudich, Y.: Chemical, physical, and optical evolution of biomass burning aerosols: a case study, Atmos. Chem. Phys., 11, 1491–1503, https://doi.org/10.5194/acp-11-1491-2011, 2011.
Bari, M. A., Baumbach, G., Kuch, B., and Scheffknecht, G.: Wood smoke as a source of particle-phase organic compounds in residential areas, Atmos. Environ., 43, 4722–4732, https://doi.org/10.1016/j.atmosenv.2008.09.006, 2009.
Bond, T. C., Streets, D. G., Yarber, K. F., Nelson, S. M., Woo, J. H., and Klimont, Z.: A technology-based global inventory of black and organic carbon emissions from combustion, J. Geophys. Res., D14, D14203, https://doi.org/10.1029/2003JD003697, 2004.
Boreddy, S. K. R., Kawamura, K., Okuzawa, K., Kanaya, Y., and Wang, Z.: Temporal and diurnal variations of carbonaceous aerosols and major ions in biomass burning influenced aerosols over Mt. Tai in the North China Plain during MTX2006, Atmos. Environ., 154, 106–117, https://doi.org/10.1016/j.atmosenv.2017.01.042, 2017.
Chantara, S., Thepnuan, D., Wiriya, W., Prawan, S., and Tsai, Y.I.: Emissions of pollutant gases, fine particulate matters and their significant tracers from biomass burning in an open-system combustion chamber, Chemosphere, 224, 407–416, https://doi.org/10.1016/j.chemosphere.2019.02.153, 2019.
Chen, J., Li, C., Ristovski, Z., Milic, A., Gu, Y., Islam, M. S., Wang, S., Hao, J., Zhang, H., He, C., Guo, H., Fu, H., Miljevic, B., Morawska, L., Thai, P., Lam, Y. F., Pereira, G., Ding, A., Huang, X., and Dumka, U. C.: A review of biomass burning: Emissions and impacts on air quality, health and climate in China, Sci. Total Environ., 579, 1000–1034, https://doi.org/10.1016/j.scitotenv.2016.11.025, 2017.
Cheng, Y., He, K. B., Du, Z. Y., Engling, G., Liu, J. M., Ma, Y. L., Zheng, M., and Weber, R. J.: The characteristics of brown carbon aerosol during winter in Beijing, Atmos. Environ., 127, 355–364, https://doi.org/10.1016/j.atmosenv.2015.12.035, 2016.
Cheng, Y., Engling, G., He, K.-B., Duan, F.-K., Ma, Y.-L., Du, Z.-Y., Liu, J.-M., Zheng, M., and Weber, R. J.: Biomass burning contribution to Beijing aerosol, Atmos. Chem. Phys., 13, 7765–7781, https://doi.org/10.5194/acp-13-7765-2013, 2013.
Chi, X., He, P., Jiang, Z., Yu, X., Yue, F., Wang, L., Li, B., Kang, H., Liu, C., and Xie, Z.: Acidity of aerosols during winter heavy haze events in Beijing and Gucheng, China, J. Meteorol. Res., 32, 14–25, https://doi.org/10.1007/s13351-018-7063-4, 2018.
Du, Z. Y., He, K. B., Cheng, Y., Duan, F. K., Ma, Y. L., Liu, J. M., Zhang, X. L., Zheng, M., and Weber, R.: A yearlong study of water-soluble organic carbon in Beijing I: Sources and its primary vs. secondary nature, Atmos. Environ., 92, 514–521, https://doi.org/10.1016/j.atmosenv.2014.04.060, 2014.
Duan, F., Liu, X., Yu, T., and Cachier, H.: Identification and estimate of biomass burning contribution to the urban aerosol organic carbon concentrations in Beijing, Atmos. Environ., 38, 1275–1282, https://doi.org/10.1016/j.atmosenv.2003.11.037, 2004.
Engling, G., Carrico, C. M., Kreidenweis, S. M., Collett Jr, J. L., Day, D. E., Malm, W. C., Lincoln, L., Hao, W. M., Iinuma, Y., and Herrmann, H.: Determination of levoglucosan in biomass combustion aerosol by high-performance anion-exchange chromatography with pulsed amperometric detection, Atmos. Environ., 40, S299–S311, https://doi.org/10.1016/j.atmosenv.2005.12.069, 2006.
Engling, G., Lee, J. J., Tsai, Y. W., Lung, S. C. C., Chou, C. C. K., and Chan, C. Y.: Size resolved anhydrosugar composition in smoke aerosol from controlled field burning of rice straw, Aerosol Sci. Tech., 43, 662–672, https://doi.org/10.1080/02786820902825113, 2009.
Gensch, I., Sang-Arlt, X. F., Laumer, W., Chan, C. Y., Engling, G., Rudolph, J., and Kiendler-Scharr, A.: Using δ13C of levoglucosan as a chemical clock, Environ. Sci. Tech., 52, 11094–11101, https://doi.org/10.1021/acs.est.8b03054, 2018.
Hallquist, M., Wenger, J. C., Baltensperger, U., Rudich, Y., Simpson, D., Claeys, M., Dommen, J., Donahue, N. M., George, C., Goldstein, A. H., Hamilton, J. F., Herrmann, H., Hoffmann, T., Iinuma, Y., Jang, M., Jenkin, M. E., Jimenez, J. L., Kiendler-Scharr, A., Maenhaut, W., McFiggans, G., Mentel, Th. F., Monod, A., Prévôt, A. S. H., Seinfeld, J. H., Surratt, J. D., Szmigielski, R., and Wildt, J.: The formation, properties and impact of secondary organic aerosol: current and emerging issues, Atmos. Chem. Phys., 9, 5155–5236, https://doi.org/10.5194/acp-9-5155-2009, 2009.
Hertwig, D., Burgin, L., Gan, C., Hort, M., Jones, A., Shaw, F., Witham, C., and Zhang, K.: Development and demonstration of a Lagrangian dispersion modeling system for real-time prediction of smoke haze pollution from biomass burning in Southeast Asia, J. Geophys. Res.-Atmos., 120, 12605–12630, https://doi.org/10.1002/2015JD023422, 2015.
Ho, K. F., Engling, G., Sai Hang Ho, S., Huang, R., Lai, S., Cao, J., and Lee, S. C.: Seasonal variations of anhydrosugars in PM2.5 in the Pearl River Delta Region, China, Tellus B, 66, 22577, https://doi.org/10.3402/tellusb.v66.22577, 2014.
Iinuma, Y., Engling, G., Puxbaum, H., and Herrmann, H.: A highly resolved anion-exchange chromatographic method for determination of saccharidic tracers for biomass combustion and primary bio-particles in atmospheric aerosol, Atmos. Environ., 43, 1367–1371, https://doi.org/10.1016/j.atmosenv.2008.11.020, 2009.
Jung, J., Lee, S., Kim, H., Kim, D., Lee, H., and Oh, S.: Quantitative determination of the biomass-burning contribution to atmospheric carbonaceous aerosols in Daejeon, Korea, during the rice-harvest period, Atmos. Environ., 89, 642–650, https://doi.org/10.1016/j.atmosenv.2014.03.010, 2014.
Kanakidou, M., Seinfeld, J. H., Pandis, S. N., Barnes, I., Dentener, F. J., Facchini, M. C., Van Dingenen, R., Ervens, B., Nenes, A., Nielsen, C. J., Swietlicki, E., Putaud, J. P., Balkanski, Y., Fuzzi, S., Horth, J., Moortgat, G. K., Winterhalter, R., Myhre, C. E. L., Tsigaridis, K., Vignati, E., Stephanou, E. G., and Wilson, J.: Organic aerosol and global climate modelling: a review, Atmos. Chem. Phys., 5, 1053–1123, https://doi.org/10.5194/acp-5-1053-2005, 2005.
Kuang, Y., Xu, W. Y., Lin, W. L., Meng, Z. Y., Zhao, H. R., Ren, S. X. Zhang, G., Liang, L. L., and Xu, X. B.: Explosive morning growth phenomena of NH3 on the North China Plain: Causes and potential impacts on aerosol formation, Environ. Pollut., 257, 11362, https://doi.org/10.1016/j.envpol.2019.113621, 2020.
Lee, T., Sullivan, A. P., Mack, L., Jimenez, J. L., Kreidenweis, S. M., Onasch, T. B., Worsnop, D. R., Malm, W., Wold, C. E., Hao, W. M., and Collett Jr., J. L.: Chemical smoke marker emissions during flaming and smoldering phases of laboratory open burning of wildland fuels, Aerosol Sci. Technol., 44, 499884, https://doi.org/10.1080/02786826.2010.499884, 2010.
Liang, L.: Gucheng biomass burning data, available at: https://pan.baidu.com/s/1ZfPC17Bsa1KhjSrmTLIXcg#list/path=%2F (last access: 23 February 2021), 2016.
Liang, L., Engling, G., Du, Z., Cheng, Y., Duan, F., Liu, X., and He, K.: Seasonal variations and source estimation of saccharides in atmospheric particulate matter in Beijing, China, Chemosphere, 150, 365–377, https://doi.org/10.1016/j.chemosphere.2016.02.002, 2016.
Liang, L., Engling, G., Zhang, X., Sun, J., Zhang, Y., Xu, W., Liu, C., Zhang, G., Liu, X., and Ma, Q.: Chemical characteristics of PM 2.5 during summer at a background site of the Yangtze River Delta in China, Atmos. Res., 198, 163–172, https://doi.org/10.1016/j.atmosres.2017.08.012, 2017.
Liang, L., Engling, G., Cheng, Y., Liu, X., Du, Z., Ma, Q., Zhang, X., Sun, J., Xu, W., Liu, C., Zhang, G., and Xu, H.: Biomass burning impacts on ambient aerosol at a background site in East China: Insights from a yearlong study, Atmos. Res., 231, 104660, https://doi.org/10.1016/j.atmosres.2019.104660, 2020.
Lin, W. L., Xu, X. B., Sun, J. Y., Liu, X. W., and Wang, Y.: Background concentrations of reactive gases and the impacts of long-range transport at the jinsha regional atmospheric background station, Sci. China Earth Sci., 54, 1604–1613, 2011.
Meng, Z., Xu, X., Lin, W., Ge, B., Xie, Y., Song, B., Jia, S., Zhang, R., Peng, W., Wang, Y., Cheng, H., Yang, W., and Zhao, H.: Role of ambient ammonia in particulate ammonium formation at a rural site in the North China Plain, Atmos. Chem. Phys., 18, 167–184, https://doi.org/10.5194/acp-18-167-2018, 2018.
Merico, E., Grasso, F.M., Cesari, D., Decesari, S., Belosi, F., Manarini, F., De Nuntiis, P., Rinaldi, M., Gambaro, A., Morabito, E., and Contini, D.: Characterisation of atmospheric pollution near an industrial site with a biogas production and combustion plant in southern Italy, Sci. Total Environ., 717, 137220, https://doi.org/10.1016/j.scitotenv.2020.137220, 2020.
Mkoma, S. L., Kawamura, K., and Fu, P. Q.: Contributions of biomass/biofuel burning to organic aerosols and particulate matter in Tanzania, East Africa, based on analyses of ionic species, organic and elemental carbon, levoglucosan and mannosan, Atmos. Chem. Phys., 13, 10325–10338, https://doi.org/10.5194/acp-13-10325-2013, 2013.
Peltier, R. E., Hecobian, A. H., Weber, R. J., Stohl, A., Atlas, E. L., Riemer, D. D., Blake, D. R., Apel, E., Campos, T., and Karl, T.: Investigating the sources and atmospheric processing of fine particles from Asia and the Northwestern United States measured during INTEX B, Atmos. Chem. Phys., 8, 1835–1853, https://doi.org/10.5194/acp-8-1835-2008, 2008.
Pietrogrande, M. C., Bacco, D., Ferrari, S., Kaipainen, J., Ricciardelli, I., Riekkola, M.-L., Trentini, A., and Visentin, M.: Characterization of atmospheric aerosols in the Po valley during the supersito campaigns – Part 3: Contribution of wood combustion to wintertime atmospheric aerosols in Emilia Romagna region (Northern Italy), Atmos. Environ., 122, 291–305, https://doi.org/10.1016/j.atmosenv.2015.09.059, 2015
Pope, C. A. and Dockery, D. W.: Health effects of fine particulate air pollution: lines that connect, JAPCA J. Air Waste Ma., 56, 709–742, https://doi.org/10.1080/10473289.2006.10464485, 2006.
Sang, X. F., Zhang, Z. S., Chan, C. Y., and Engling, G.: Source categories and contribution of biomass smoke to organic aerosol over the southeastern Tibetan plateau, Atmos. Environ., 78, 113–123, https://doi.org/10.1016/j.atmosenv.2012.12.012, 2013.
Sang, X. F., Gensch, I., Kammer, B., Khan, A., Kleist, E., Laumer, W., Schlag, P., Schmitt, S. H., Wildt, J., Zhao, R., Mungall, E. L., Abbatt, J. P. D., and Kiendler-Scharr, A.: Chemical stability of levoglucosan: An isotopic perspective, J. Geophys. Res., 43, 5419–5424, https://doi.org/10.1002/2016GL069179, 2016.
Schkolnik, G., Falkovich, A. H., Rudich, Y., Maenhaut, W., and Artaxo, P.: New analytical method for the determination of levoglucosan, polyhydroxy compounds, and 2-methylerythritol and its application to smoke and rainwater samples, Environ. Sci. Technol., 39, 2744–2752, https://doi.org/10.1021/es048363c, 2005.
Shen, X. J., Sun, J. Y., Zhang, X. Y., Zhang, Y. M., Wang, Y. Q., Tan, K. Y., Wang, P., Zhang, L., Qi, X. F., Che, H. Z., Zhang, Z., Zhong, J. T., Zhao, H. R., and Ren, S. X.: Comparison of submicron particles at a rural and an urban site in the North China Plain during the December 2016 heavy pollution episodes, J. Meteorol. Res., 32, 14–25, https://doi.org/10.1007/s13351-018-7060-7, 2018.
Streets, D. G., Bond, T. C., Carmichael, G. R., Fernandes, S. D., Fu, Q., He, D., Klimont, Z., Nelson, S. M., Tsai, N. Y., Wang, M. Q., Woo, J. H., and Yarber, K. F.: An inventory of gaseous and primary aerosol emissions in Asia in the year 2000, J. Geophys. Res., 108, 8809, https://doi.org/10.1029/2002JD003093, 2003.
Sullivan, A. P., Holden, A. S., Patterson, L. A., McMeeking, G. R., Kreidenweis, S. M., Malm, W. C., Hao, W. M., Wold, C. E., and Collett Jr., J. L.: A method for smoke marker measurements and its potential application for determining the contribution of biomass burning from wildfires and prescribed fires to ambient PM2.5 organic carbon, J. Geophys. Res., 113, D22302, https://doi.org/10.1029/2008JD010216, 2008.
Sun, Y. L., Wang, Z. F., Fu, P. Q., Yang, T., Jiang, Q., Dong, H. B., Li, J., and Jia, J. J.: Aerosol composition, sources and processes during wintertime in Beijing, China, Atmos. Chem. Phys., 13, 4577–4592, https://doi.org/10.5194/acp-13-4577-2013, 2013.
Sun, Y. L., Zhang, Q., Anastasio, C., and Sun, J.: Insights into secondary organic aerosol formed via aqueous-phase reactions of phenolic compounds based on high resolution mass spectrometry, Atmos. Chem. Phys., 10, 4809–4822, https://doi.org/10.5194/acp-10-4809-2010, 2010.
Tan, J. H., Duan, J. C., Zhen, N. J., He, K. B., and Hao, J. M.: Chemical characteristics and source of size-fractionated atmospheric particle in haze episode in Beijing, Atmos. Res., 167, 24–33, https://doi.org/10.1016/j.atmosres.2015.06.015, 2016.
Tang, R., Wu, Z., Li, X., Wang, Y., Shang, D., Xiao, Y., Li, M., Zeng, L., Wu, Z., Hallquist, M., Hu, M., and Guo, S.: Primary and secondary organic aerosols in summer 2016 in Beijing, Atmos. Chem. Phys., 18, 4055–4068, https://doi.org/10.5194/acp-18-4055-2018, 2018.
Wu, Y., Ge, X., Wang, J., Shen, Y., Ye, Z., Ge, S., Wu, Y., Yu, H., and Chen, M.: Responses of secondary aerosols to relative humidity and photochemical activities in an industrialized environment during late winter, Atmos. Environ., 193, 66–78, https://doi.org/10.1016/j.atmosenv.2018.09.008, 2018.
Xu, W., Kuang, Y., Zhao, C., Tao, J., Zhao, G., Bian, Y., Yang, W., Yu, Y., Shen, C., Liang, L., Zhang, G., Lin, W., and Xu, X.: NH3-promoted hydrolysis of NO2 induces explosive growth in HONO, Atmos. Chem. Phys., 19, 10557–10570, https://doi.org/10.5194/acp-19-10557-2019, 2019.
Xu, W., Kuang, Y., Liang, L., He, Y., Cheng, H., Bian, Y., Tao, J., Zhang, G., Zhao, P., Ma, N., Zhao, H., Zhou, G., Su, H., Cheng, Y., Xu, X., Shao, M., and Sun, Y.: Dust-Dominated Coarse Particles as a Medium for Rapid Secondary Organic and Inorganic Aerosol Formation in Highly Polluted Air, Environ. Sci. Technol., 54, 15710–15721, https://doi.org/10.1021/acs.est.0c07243, 2020.
Yao, L., Yang, L. X., Chen, J. M., Wang, X. F., Xue, L. K., Li, W. J., Sui, X., Wen, L., Chi, J. W., Zhu, Y. H., Zhang, J. M., Xu, C. H., Zhu, T., and Wang, W. X.: Characteristics of carbonaceous aerosols: Impact of biomass burning and secondary formation in summertime in a rural area of the North China Plain, Sci. Total Environ., 557–558, 520–530, https://doi.org/10.1016/j.scitotenv.2016.03.111, 2016.
Zhang, T., Claeys, M., Cachier, H., Dong, S. P., Wang, W., Maenhaut, W., and Liu, X. D.: Identification and estimation of the biomass burning contribution to Beijing aerosol using levoglucosan as a molecular marker, Atmos. Environ., 42, 7013–7021, https://doi.org/10.1016/j.atmosenv.2008.04.050, 2008.
Zhang, T., Cao, J. J., Chow, J. C., Shen, Z. X., Ho, K. F., Ho, S. S. H., Liu, S. X., Han, Y. M., Watson, J. G., Wang, G. H., and Huang, R. J.: Characterization and seasonal variations of levoglucosan in fine particulate matter in Xi'an, China, JAPCA J. Air Waste Ma., 64, 1317–1327, https://doi.org/10.1080/10962247.2014.944959, 2014.
Zhang, Y. X., Shao, M., Zhang, Y. X., Zeng, L.-M., He, L. Y., Zhu, B., Wei, Y. J., and Zhu, X. L.: Source profiles of particulate organic matters emitted from cereal straw burnings, J. Environ. Sci., 19, 167–175, https://doi.org/10.1016/s1001-0742(07)60027-8, 2007.
Zhang, Z., Engling, G., Lin, C.-Y., Chou, C. C. K., Lung, S.-C. C., Chang, S.-Y., Fan, S., Chan, C.-Y., and Zhang, Y.-H.: Chemical speciation, transport and contribution of biomass burning smoke to ambient aerosol in Guangzhou, a mega city of China, Atmos. Environ., 44, 3187–3195, https://doi.org/10.1016/j.atmosenv.2010.05.024, 2010.
Zhang, Z., Gao, J., Engling, G., Tao, J., Chai, F., Zhang, L., Zhang, R., Sang, X., Chan, C. Y., Lin, Z., and Cao, J.: Characteristics and applications of size-segregated biomass burning tracers in China's Pearl River Delta region, Atmos. Environ., 102, 290–301, https://doi.org/10.1016/j.atmosenv.2014.12.009, 2015.
Zheng, G. J., Duan, F. K., Su, H., Ma, Y. L., Cheng, Y., Zheng, B., Zhang, Q., Huang, T., Kimoto, T., Chang, D., Pöschl, U., Cheng, Y. F., and He, K. B.: Exploring the severe winter haze in Beijing: the impact of synoptic weather, regional transport and heterogeneous reactions, Atmos. Chem. Phys., 15, 2969–2983, https://doi.org/10.5194/acp-15-2969-2015, 2015.
Zhong, J. T., Zhang, X. Y., and Wang, Y. Q.: Reflections on the threshold for PM2.5 explosive growth in the cumulative stage of winter heavy aerosol pollution episodes (HPEs) in Beijing, Tellus B, 71, 1–7, https://doi.org/10.1080/16000889.2018.1528134, 2019.
Zhong, J. T., Zhang, X. Y., Wang, Y. Q., Liu, C., and Dong, Y. S.: Heavy aerosol pollution episodes in winter Beijing enhanced by radiative cooling effects of aerosols, Atmos. Res., 209, 59–64, https://doi.org/10.1016/j.atmosres.2018.03.011, 2018.
Zhou, Y., Xing, X., Lang, J., Chen, D., Cheng, S., Wei, L., Wei, X., and Liu, C.: A comprehensive biomass burning emission inventory with high spatial and temporal resolution in China, Atmos. Chem. Phys., 17, 2839–2864, https://doi.org/10.5194/acp-17-2839-2017, 2017.
Zhu, C., Kawamura, K., and Kunwar, B.: Effect of biomass burning over the western North Pacific Rim: wintertime maxima of anhydrosugars in ambient aerosols from Okinawa, Atmos. Chem. Phys., 15, 1959–1973, https://doi.org/10.5194/acp-15-1959-2015, 2015.
Zhu, Y. H., Yang, L. X., Kawamura, K., Chen, J. M., Ono, K., Wang, X. F., Xue, L. K., and Wang, W. X.: Contributions and source identification of biogenic and anthropogenic hydrocarbons to secondary organic aerosols at Mt. Tai in 2014, Environ. Pollut., 220, 863–872, https://doi.org/10.1016/j.envpol.2016.10.070, 2017.