the Creative Commons Attribution 4.0 License.
the Creative Commons Attribution 4.0 License.
 | 02 Mar 2021
Effectiveness of emission control in reducing PM2.5 pollution in central China during winter haze episodes under various potential synoptic controls
Yingying Yan
Yue Zhou
Shaofei Kong
Jintai Lin
Jian Wu
Huang Zheng
Zexuan Zhang
Aili Song
Yongqing Bai
Zhang Ling
Dantong Liu
Tianliang Zhao
Currently, mitigating severe particle pollution in autumn and winter is the key to further improving the air quality of China. The source contributions and transboundary transport of fine particles (PM2.5) in pollution episodes are closely related to large-scale or synoptic-scale atmospheric circulation. How to effectively reduce emissions to control haze pollution under different synoptic conditions is rarely reported. In this study, we classify the synoptic conditions over central China from 2013 to 2018 by using Lamb–Jenkinson method and the National Centers for Environmental Prediction/National Center for Atmospheric Research (NCEP/NCAR) Final (FNL) operational global analysis data. The effectiveness of emission control to reduce PM2.5 pollution during winter haze episodes under potential synoptic controls is simulated by GEOS-Chem model. Among the 10 identified synoptic patterns, four types account for 87 % of the total pollution days. Two typical synoptic modes are characterized by low surface wind speed and stable weather conditions or high relative humidity (A or C type) over central China due to a high-pressure system or a southwest trough and low-pressure system, blocking pollutants dispersion. Sensitivity simulations show that these two heavy pollution processes are mainly contributed by local emission sources with ∼82 % for A type and ∼85 % for C type, respectively. The other two patterns lead to pollution of transport characteristics affected by northerly or southerly winds (NW or SW type), carrying air pollution from northern or southern China to central China. The contribution of pollution transmission from northern and southern China is 36.9 % and 7.6 %, respectively of PM2.5, and local emission sources contribute 41 % and 69 %, respectively. We also estimate the effectiveness of emission reduction in these four typical severe pollution synoptic processes. By only reducing SO2 and NOx emission and not controlling NH3, the enhanced nitrate counteracts the effect of sulfate reduction on PM2.5 mitigation, with a less than 4 % decrease in PM2.5. In addition, to effectively mitigate haze pollution of NW- and SW-type synoptic-controlled episodes, local emission control actions should be in coordination with regional collaborative actions.
- Article
(18584 KB) - Full-text XML
-
Supplement
(6094 KB) - BibTeX
- EndNote


The regional pollution of fine particles (PM2.5) has attracted worldwide attention from the public and in the scientific community (Cheng et al., 2016; Li et al., 2017c; Lin et al., 2018; Bi et al., 2019) due to its detrimental effect on visibility (Wang et al., 2020) and public health (Agarwal et al., 2017; Zhang et al., 2017). PM2.5 pollution in China has been continuously reducing since 2013 as a result of the implementation of the Air Pollution Prevention and Control Action Plan (Zheng et al., 2018; Zhang et al., 2019), especially in the Beijing–Tianjin–Hebei region (BTH) (Li et al., 2017b; Cheng et al., 2019), the Yangtze River Delta (YRD) region, and the Pearl River Delta (PRD) region. However, severe particle pollution still occurs frequently in autumn and winter, which is the major reason restricting the PM2.5 from reaching the national standard. For example, 12 extremely severe and persistent PM2.5 pollution episodes occurred in Beijing in January 2013, February 2014, December 2015, December 2016, and January 2017 (Zhong et al., 2018; Sun et al., 2016; Wang et al., 2018). Currently, researching how to effectively reduce emissions in autumn and winter is the key to mitigating haze pollution in China.
The contribution of emission sources has been widely recognized as the decisive factor of PM2.5 pollution over urban agglomerations, including industrial exhaust, urban transportation, residential emission, power plants, agricultural activities, and bio-combustion (Huang et al., 2014; Tian et al., 2016; Wu et al., 2018; An et al., 2019). The outbreak, persistence, and dissipation of particle pollution generally depends on meteorological conditions and regional synoptic patterns controlled by the large-scale or synoptic-scale atmospheric circulation (Chuang et al., 2008; Zhang et al., 2012; Russo et al., 2014; Zheng et al., 2015; Shu et al., 2017; Li et al., 2019).
Many studies have tried to reveal the relationship between synoptic patterns and severe particle pollution and estimate the meteorological contributions to these pollution episodes. The YRD is mainly affected by pollutants transmitted from northern and the southern China when the East Asian major trough is located at its front (Liao et al., 2017; Shu et al., 2017; Li et al., 2019). Liao et al. (2020) have confirmed that the relative position of the PRD to high-pressure systems imposes significant impacts on the diffusion conditions and the PM2.5 distributions in the PRD region. For the North China Plain (NCP), a high frequency of stagnant weather accompanied by a small pressure gradient and near-surface wind speed and a shallow mixing layer are major reasons of aerosol pollution over this region in winter (He et al., 2018). The aerosol pollution formation process in the Sichuan Basin (SCB) is often controlled by the large-scale high-pressure circulation at sea level (Sun et al., 2020). In the Guanzhong Basin, pollution events are generally governed by both the large-scale synoptic situation and the small-scale local circulation. The downhill wind not only forms a convergence zone in the basin but also makes pollutants flow back from the mountain region to the basin (Bei et al., 2017). Leung et al. (2018) also find strong correlations of daily PM2.5 variability with several synoptic patterns, including monsoon flows and cold-front channels in northern China related to the Siberian High, onshore flows in eastern China, and frontal rainstorms in southern China. These previous studies have highlighted that different levels of PM2.5 pollution are closely related to the dominant synoptic patterns in different regions, and they attribute the large spatial variability of pollution to the regional transport contributions and the different local sources of PM2.5. Thus, heavy pollution prevention and control needs to consider the weather situation, otherwise local emission reduction measures will not work well. However, how to effectively reduce local and regional emissions under different synoptic conditions to control haze pollution is rarely reported.
Various key regions have issued an emergency preplan against the winter haze episodes, but these schemes can only be targeted at a certain city (The People's Government of Beijing Municipality, 2018; The People's Government of Shanghai Municipality, 2018) or a certain urban agglomeration (The People's Government of Guangdong Province, 2014). Although there are many studies targeted PM2.5 mitigation at a regional scale (Ding et al., 2019; Zhang et al., 2019; Xing et al., 2018, 2019; Fu et al., 2017; etc.), their results can not be directly applied to reduce winter PM2.5 pollution under various synoptic controls. Moreover, current emission reduction policies in China mainly target sulfur dioxide (SO2) and nitrogen dioxide (NO2) reduction, ignoring the effective emission reduction for ammonia (NH3), although some modeling work has discussed the effectiveness of ammonia emission reduction for PM2.5 mitigation (Liu et al., 2019; Ye et al., 2019; Xu et al., 2019; Bai et al., 2019). Compared to remarkable reduction in SO2, NO2, and primary PM emissions, NH3 emissions has remained stable during 2014–2018 in China (Zheng et al., 2018). In addition, given the important roles of other PM2.5 precursors (e.g., non-methane volatile organic compounds) in aerosol formation (Geng et al., 2019), cutting emissions other than SO2, NO2, and PM should be proposed as a next-step mitigation strategy. Therefore, for PM2.5 mitigation in a specific region during winter haze episodes forced by various synoptic conditions, whether the air pollution emergency management and control schemes are effective and how to improve them have become an urgent scientific questions to be answered.
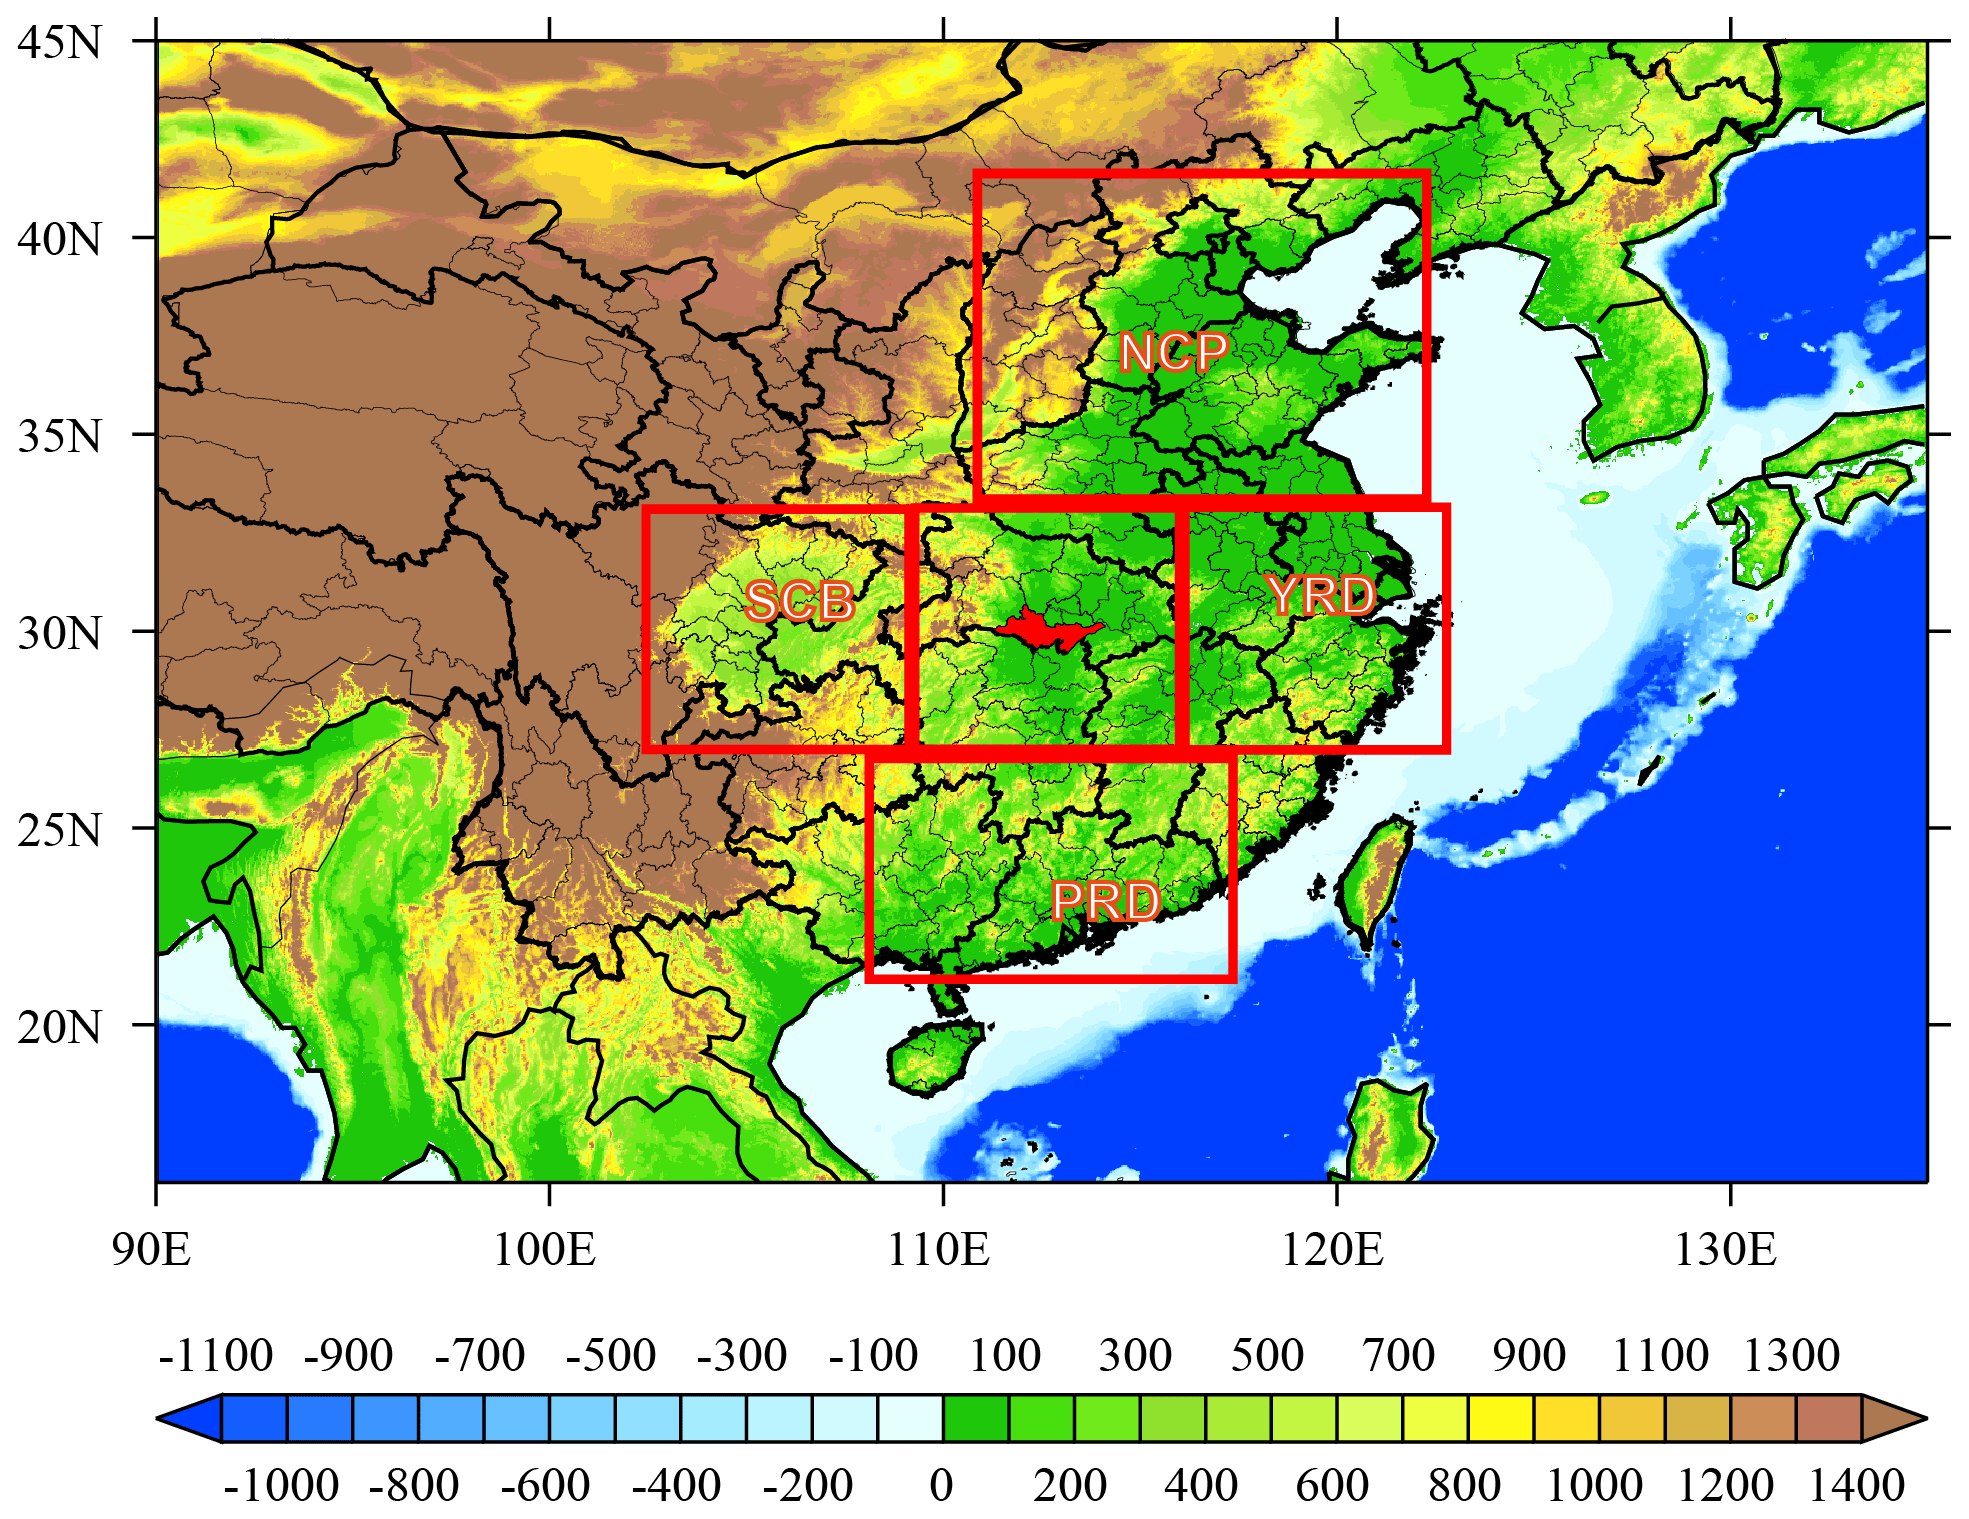
Figure 1The location of Jingzhou (red area) and the major haze pollution regions of the NCP, YRD, PRD, and SCB. The areas framed in red are used to investigate the inter-regional impacts using GEOS-Chem sensitivity simulations. The overlaid map shows the surface elevation (m) from 2 min gridded global relief data (ETOPO2v2) available from the NGDC Marine Trackline Geophysical database (http://www.ngdc.noaa.gov/mgg/global/etopo2.html, last access: 27 February 2021).
In order to investigate the effectiveness of emission control for reducing PM2.5 pollution during winter haze episodes under various potential synoptic controls (PSCs), we take the severe particle pollution of winter haze episodes over Jingzhou, in the hinterland of the Yangtze River middle basin in central China, as an example. Central China is geographically surrounded by major haze pollution regions: the SCB to the west, the PRD to the south, the YRD to the east, and the NCP to the north (Fig. 1). As a regional pollutant transport hub with sub-basin topography, central China is a region of transmission pollution characteristics affected by two reported transport pathways from the vast flatland in central eastern China (Yu et al., 2020) and from the NCP region (H. Zheng et al., 2019). In combination with high anthropogenic emissions (Wu et al., 2018) and secondary aerosol formation (Huang et al., 2020), central China often suffers severe pollution episodes in winter caused by PM2.5 (Gong et al., 2015; Xu et al., 2017). In this study, we conduct a circulation classification to differentiate the synoptic modes during the severe particle pollution episodes in winter over central China from 2013 to 2018 by using the Lamb–Jenkinson method. Following this, we simulate the PM2.5 chemical components and the contributions of local sources and transboundary transport of PM2.5 under different synoptic conditions. Finally, the effectiveness of emission reduction in the main potential synoptic patterns is evaluated by GEOS-Chem model simulations. This study combines atmospheric (circulation classification) and environmental (chemical transport modeling) research methods and could provide a reference for emission control of severe winter haze pollution under different weather types and provide a basis for regional air quality policy-making.
2.1 Data
Hourly mass concentrations of PM2.5 at Jingzhou (112.18∘ E, 30.33∘ N, 33.7 m) from November 2013 to December 2018 are obtained from Hubei Environmental Monitoring Central Station (http://sthjt.hubei.gov.cn/, last access: 27 February 2021). We screen the pollution days with daily mean PM2.5 concentrations larger than 150 for circulation classification.
We use the daily mean sea level pressure (SLP) between 2013 and 2018 from the National Centers for Environmental Prediction/National Center for Atmospheric Research (NCEP/NCAR) Final (FNL) Operational Global Analysis data (horizontal resolution: 1∘ × 1∘; temporal resolution: 6 h; https://rda.ucar.edu/datasets/ds083.3/, last access: 27 February 2021) to conduct the classification of Lamb–Jenkinson circulation types.
The meteorological data of surface observations at Jingzhou, including ambient temperature, relative humidity, wind speed, wind direction, and atmospheric pressure, are obtained from the Hubei Meteorological Information and Technology Support Center (http://hb.cma.gov.cn/qxfw/index.html, last access: 27 February 2021). The data from November 2013 to February 2014 are used to analyze the meteorological characteristics during the period that four severe particle pollution events occurred in succession over central China (Fig. S1).
In order to better evaluate the GEOS-Chem model performance, we also use the PM2.5 observations (a total of 633 sites; from November 2013 to February 2014) from the Ministry of Ecology and Environment of China (MEE, http://www.mee.gov.cn/, last access: 27 February 2021) to conduct the model–observation comparison.
2.2 Lamb–Jenkinson circulation classification
The atmospheric circulation classification adopts the Lamb–Jenkinson method proposed by Lamb et al. (1950) and developed by Jenkinson et al. (1977). Compared to the objective classification method principal component analysis (PCA) used in some studies (Chang and Zhan, 2017; Dai et al., 2021), this Lamb–Jenkinson method is a combination of subjective and objective methods. After the objective judgment of the circulation, we also make subjective considerations to overcome the weaknesses of the method, leading to better synoptic significance. Many works of circulation classification have used the Lamb–Jenkinson method and reported that the analysis can respond well to the classification results (Philipp et al., 2016; Santurtun et al., 2015; Pope et al., 2015; Russo et al., 2014; Pope et al., 2014; Trigo and DaCamara, 2000).
To calculate the circulation types of Jingzhou, we mark total 16 points (97.5–127.5∘ E, 20–40∘ N) at every 10∘ longitudes and 5∘ latitude with a center point located at 112.5∘ E and 30∘ N (Fig. S2). Using the sea level pressure of 16 points, we calculate six circulation indexes using the following scheme of central difference:
where is the sea level pressure at the nth point; α, α1, and α2 are the latitude values of points C, A1, and A2, respectively; V is the geostrophic wind; u and v are the latitudinal and meridional components of the geostrophic wind; ξ is the geostrophic vorticity; ξu is the u meridional gradient; and ξv is the v latitudinal gradient.
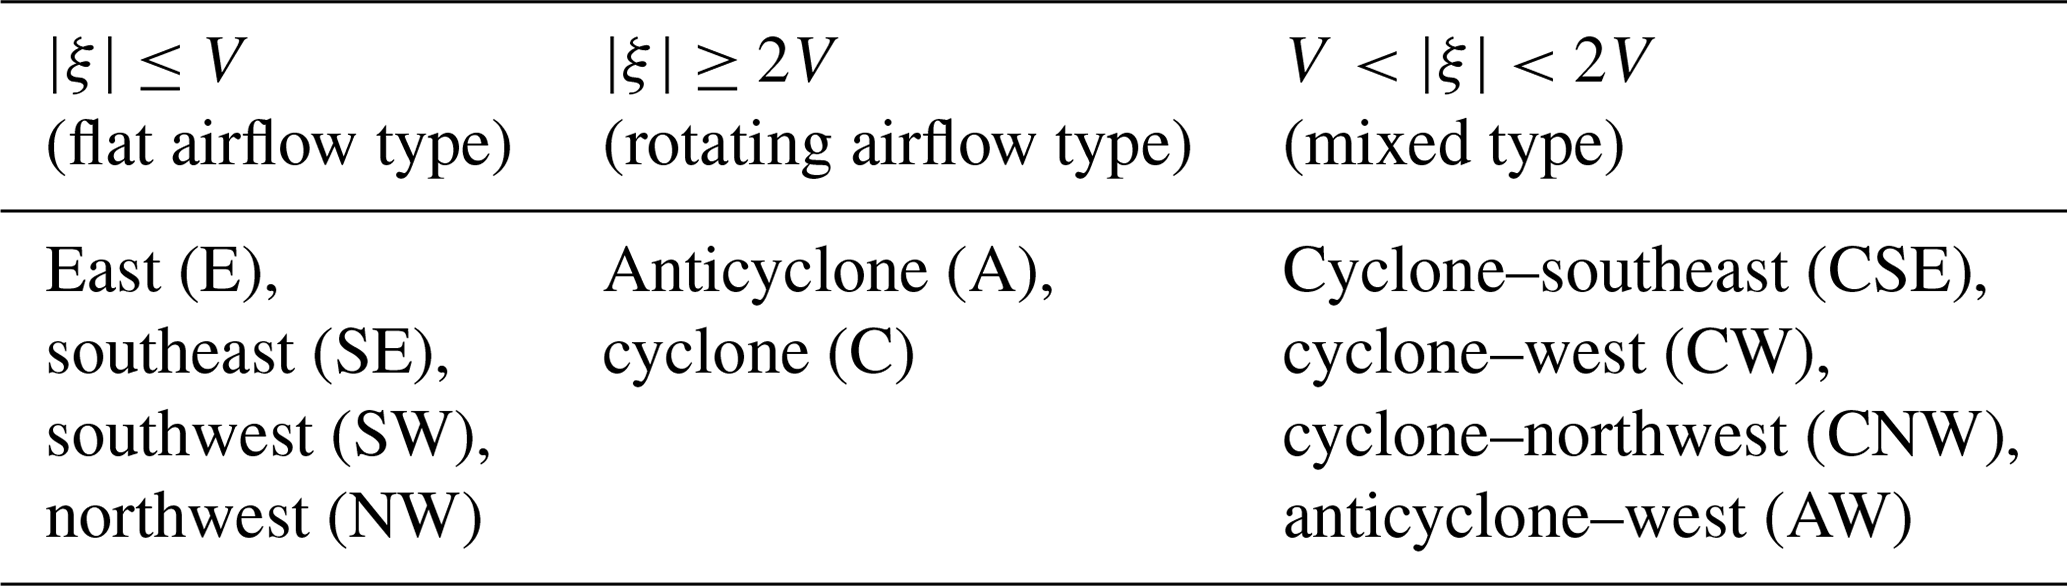
Taking the latitude of the center point as the reference frame, the unit of the six circulation indexes is hectopascals per 10∘ longitude, the direction of geostrophic wind can be determined by u and v, and cyclones and anticyclones can be determined by ξ. According to the geostrophic wind speed, wind direction, and vorticity value, the circulation is divided into 10 types. The classification standard and corresponding types are shown in Table 1.
2.3 GEOS-Chem simulations
The GEOS-Chem chemistry transport model is used (http://acmg.seas.harvard.edu/geos/, last access: 27 February 2021) to simulate the spatiotemporal distribution of PM2.5. The nested model, covering China (15∘ S–55∘ N, 70–140∘ E), is run with a horizontal resolution of 0.25∘ latitude × 0.3125∘ longitude and 72 vertical layers. The boundary condition of the nested model is provided by the GEOS-Chem global model with a horizontal resolution of 2∘ latitude × 2.5∘ longitude (Fig. S3). Both global and nested simulations, driven by the GEOS-FP assimilated meteorological data, include detailed tropospheric ozone, NOx, volatile organic compounds (VOCs), HOx, and aerosol chemistry. More details are shown in Yan et al. (2019). In the models, anthropogenic and natural sources are fully considered in GEOS-Chem. Tables S1 and S2 show a list of emission inventories in the global model and nested simulation, respectively. In China, the monthly grid data of 0.25∘ × 0.25∘ from the MEIC inventory (http://meicmodel.org, last access: 27 February 2021) for CO, NOx, SO2, and non-methane volatile organic compounds (NMVOCs) in 2013–2014 is used. Over central China, anthropogenic sources of these species are from our group SEEA (Source Emission and Environment Research) inventory with grid data of 0.1∘ × 0.1∘ (not shown). The SEEA emission inventory was developed based on the year 2017 for the Wuhan city cluster, and it has been successfully adopted for the air quality simulation and forecasting of the 7th CISM Military World Games in 2019. Other emission descriptions are shown in Sect. S1 in the Supplement.
In order to better simulate the spatiotemporal distribution of PM2.5 over central China, especially during heavy pollution winter periods, the standard v11-01 of GEOS-Chem is optimized according to the actual situation in China (see details in Sect. S2 in the Supplement), including optimizing PM2.5 sources and increasing the proportion of sulfate primary emission (Yan et al., 2020). The PM2.5 primary anthropogenic emissions enhance the PM2.5 concentrations over central China by 5–20 in winter (Fig. S4). Compared with the results before the model optimization (Fig. S5), the sulfate concentration simulated by the optimized model increased from 10–20 to 30–50 . Further comparisons of PM2.5 with observations and inorganic salts (sulfate, nitrate, and ammonium) with reported values from previous studies are shown in Sect. 3.3.

Figure 2Frequency distributions of 10 circulation types for the heavy pollution days of 2013–2018 over Jingzhou. The occurrence numbers of each type are shown. The 10 circulation types include southwest (SW), northwest (NW), anticyclone (A), cyclone (C), anticyclone–west (AW), cyclone–west (CW), Cyclone–southeast (CSE), Cyclone–northwest (CNW), southeast (SE) and east (E), respectively.
3.1 Classification of PSCs
As shown in Fig. 2, among the circulation patterns of pollution days in Jingzhou from 2013 to 2018, the frequency of SW-type circulation is the highest, accounting for 29 % of the total pollution days. The frequencies of NW type, A type, and C type are also high, accounting for 27 %, 19 %, and 12 %, respectively. The other six circulation patterns are less frequent, with frequencies of less than 5 %. Thus, the above four typical circulation types are considered the main potential synoptic controls on severe particle pollution episodes over central China.
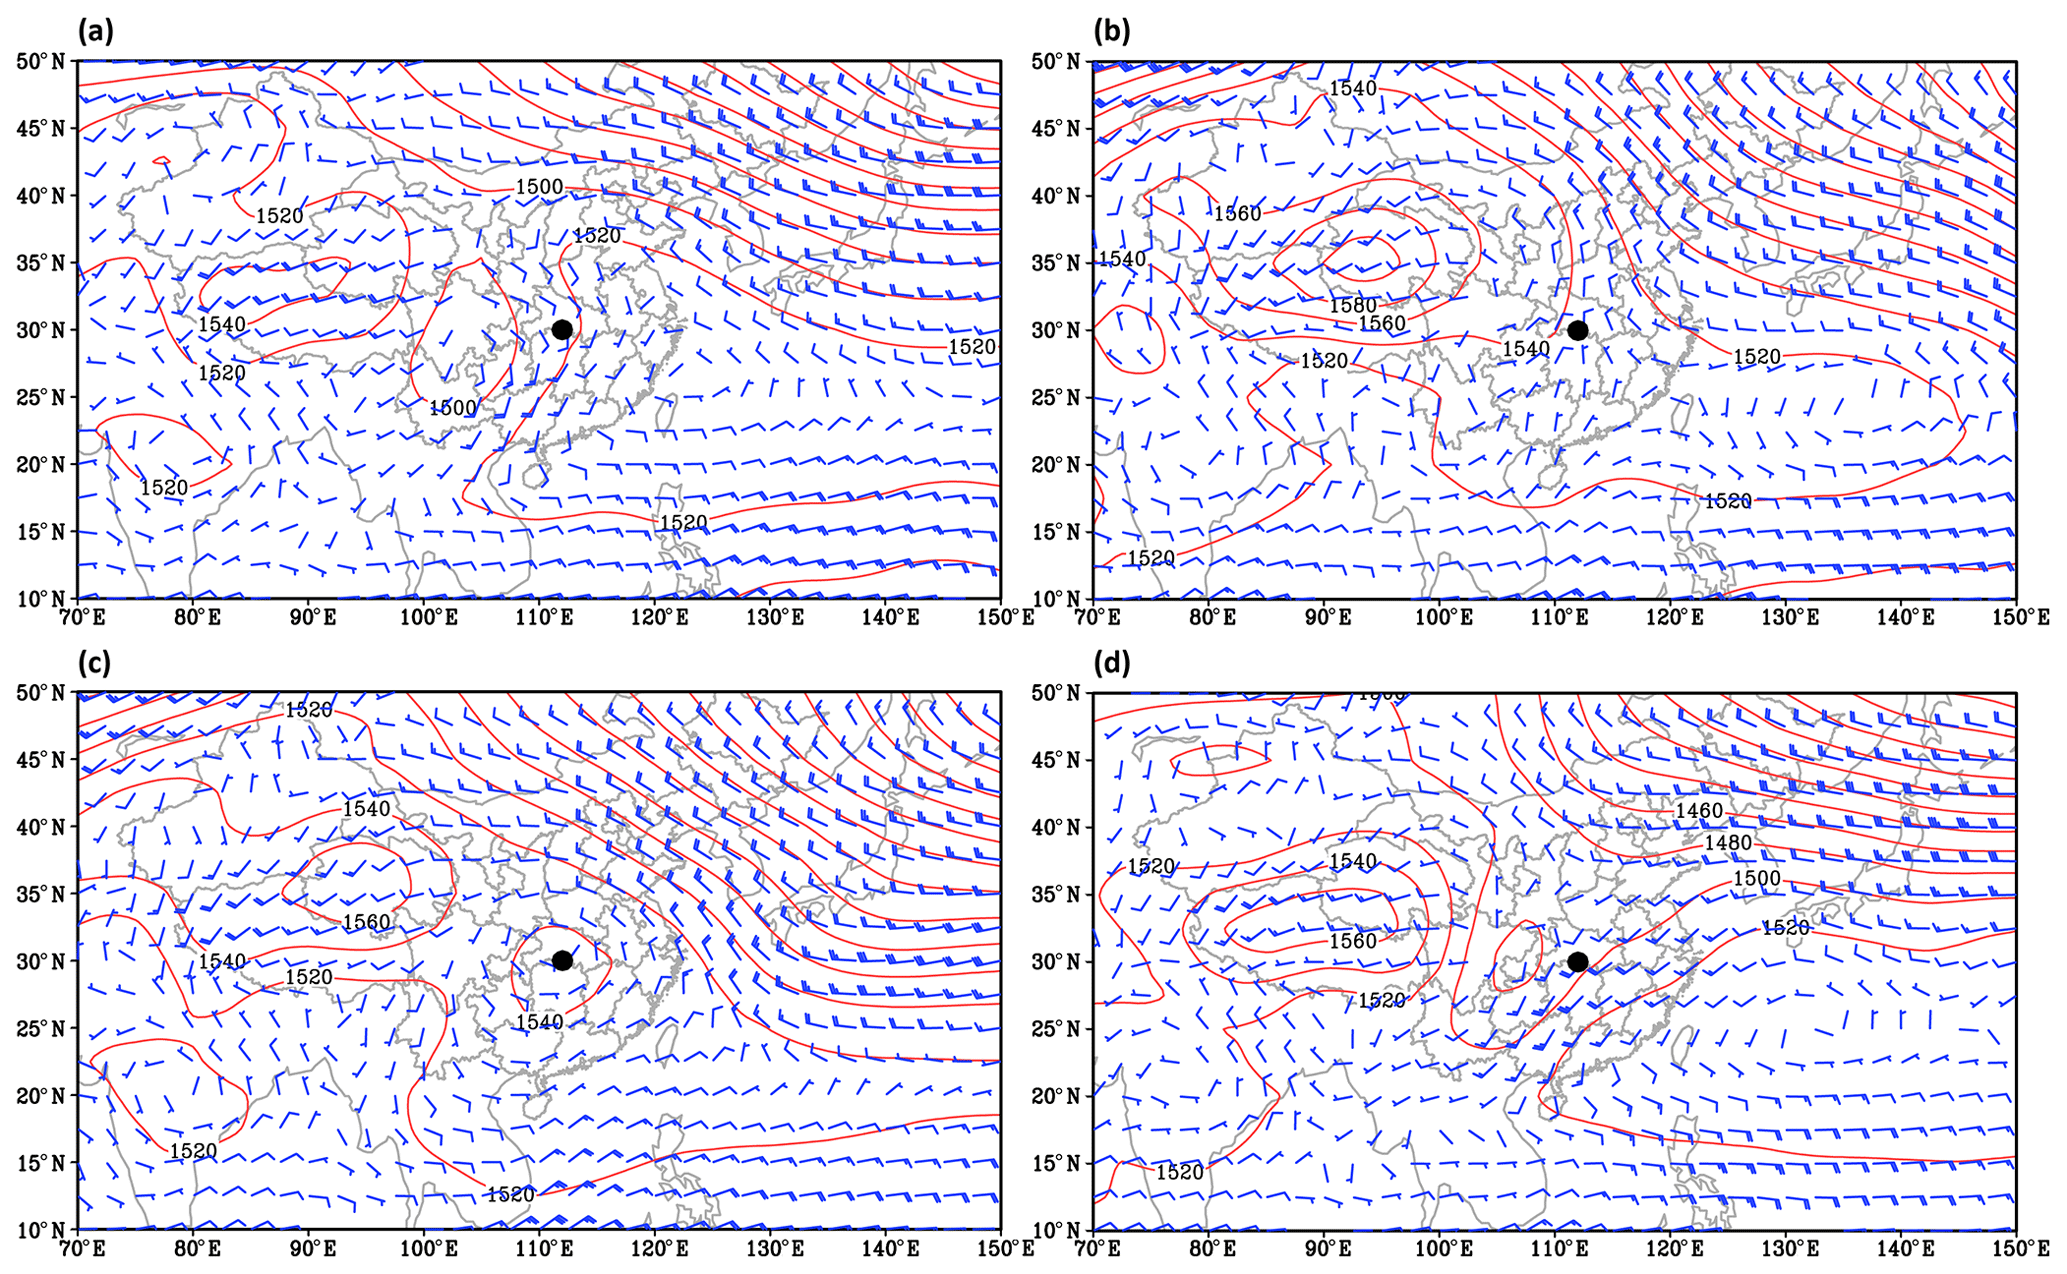
Figure 3Spatial distribution of 850 hPa geopotential height and wind vector for SW-type (a), NW-type (b), A-type (c), and C-type (d) synoptic control averaged over 2013–2018. The black dot indicates the location of Jingzhou.
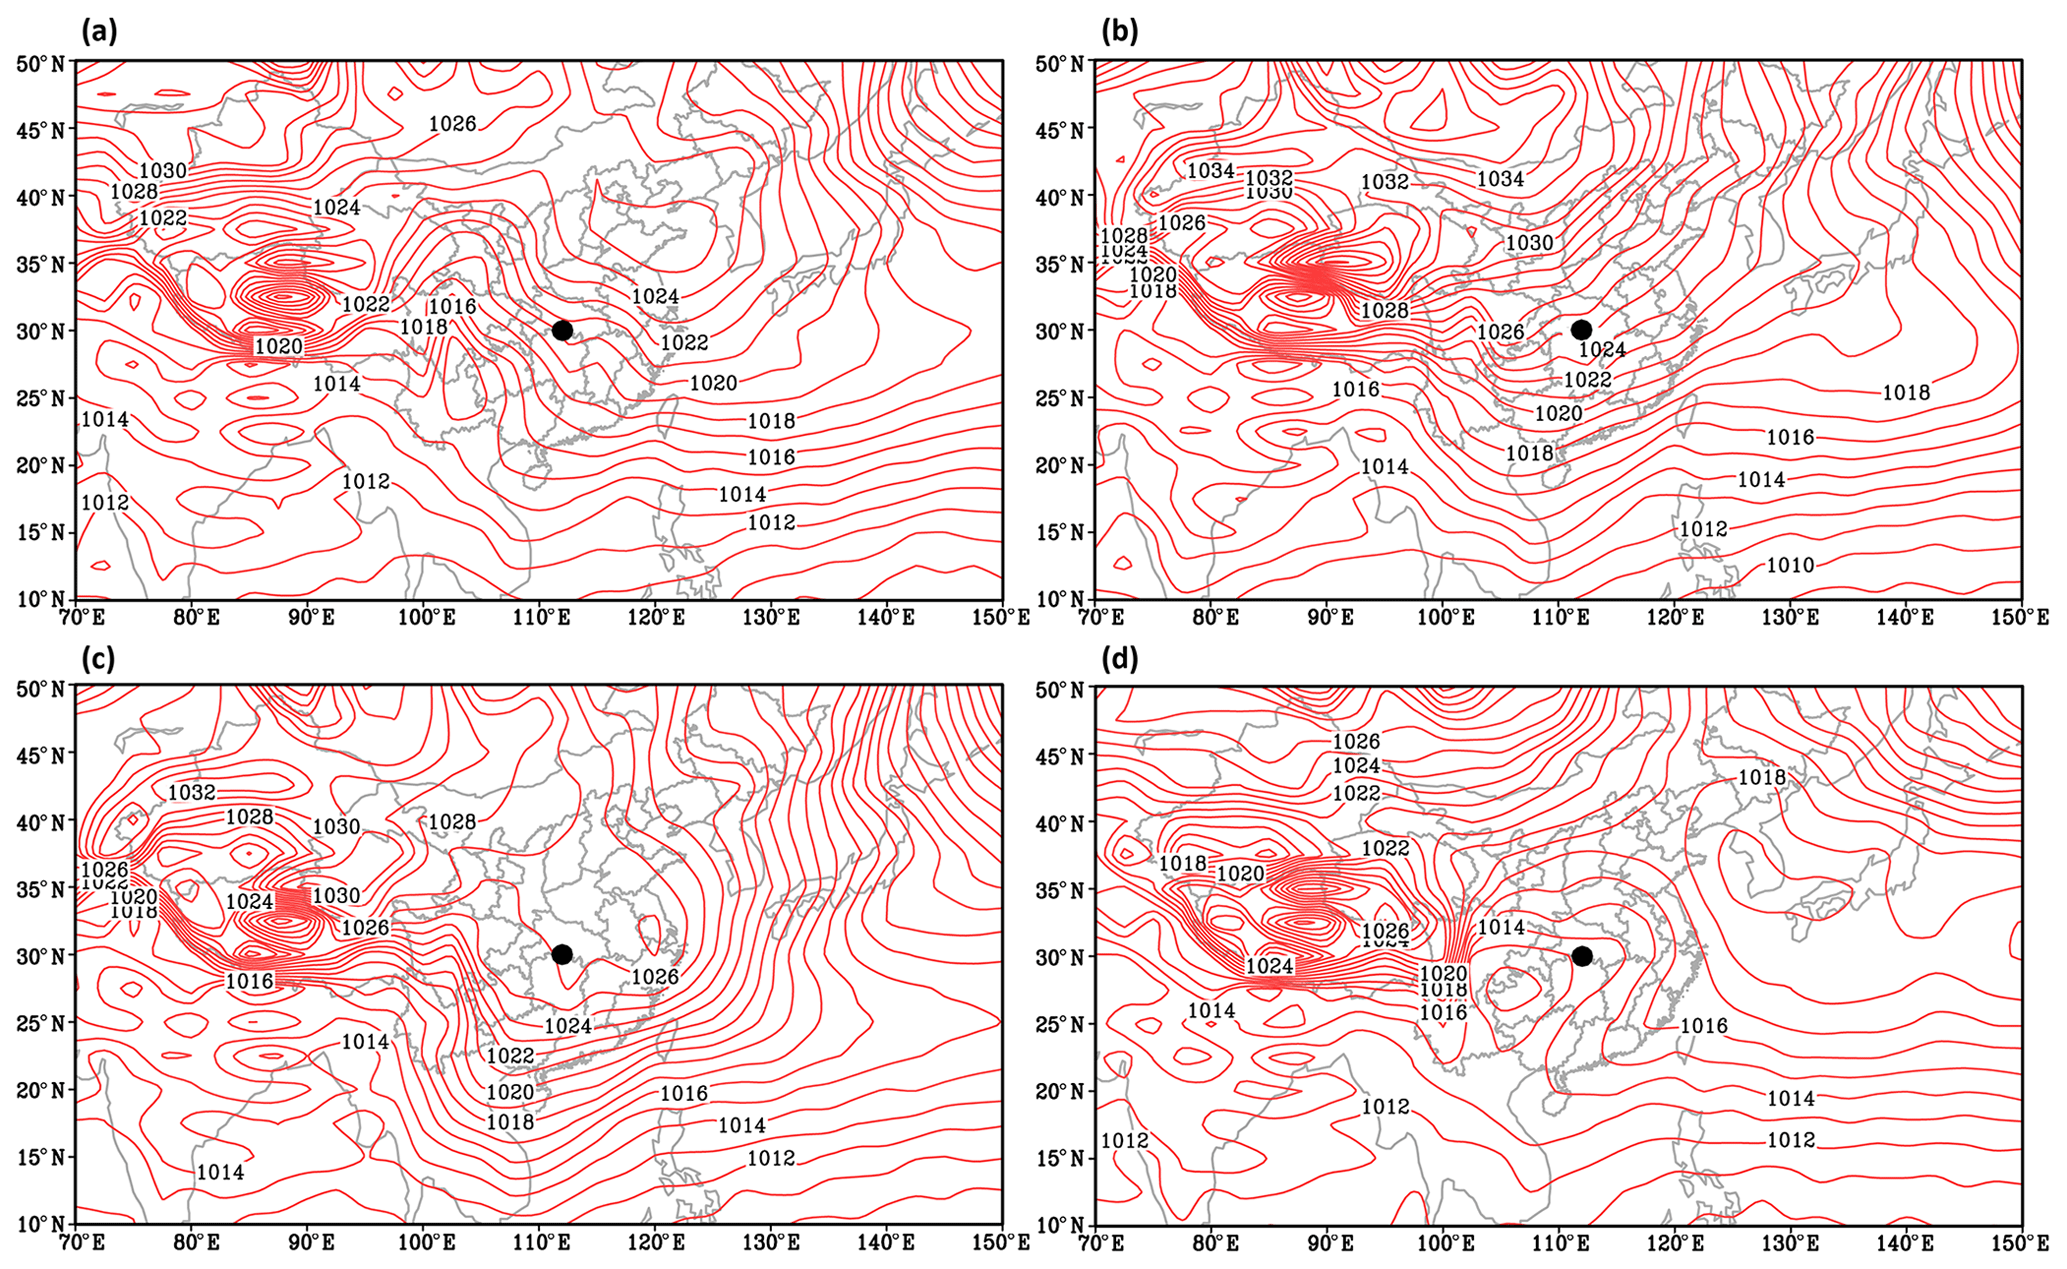
Figure 4Spatial distribution of sea level pressure for SW-type (a), NW-type (b), A-type (c), and C-type (d) synoptic control averaged over 2013–2018. The black dot indicates the location of Jingzhou.
3.2 Characteristics of the four main PSCs
SW-type circulation is the predominant PSC of severe PM2.5 pollution episodes. The circulation at 500 hPa is relatively flat, and the whole East Asia region is affected by the westerly flow (Fig. S6a). The westerly belt fluctuates greatly at 700 hPa, and there are two ridges and a southwest trough in the middle latitudes of Asia (Fig. S7a). Jingzhou is located in the front of a trough, prevailing the weak southwest airflow. At 850 hPa, the cold high-pressure center is formed in Xinjiang, China. Warm low pressure appears in the low-latitude area and weak high pressure appears in the East China Sea (Fig. 3a). In combination with the surface field, a high–low–high saddle-like field forms from west to east (Fig. 4a). Such a synoptic type is also the dominant weather system of eastern China (Shu et al., 2017; Yang et al., 2018). Jingzhou is located in the back of the Bohai Sea northeast high-pressure area and the front of southwest warm low-pressure area. Thus, it is affected by the southerly airflow, which could be conducive to the transport of air pollutants formed over southern China to central China. Associated with low local surface wind speed (<3 m/s) at Jingzhou, the dispersion of local and transported pollutants is inhibited.
NW-type circulation mainly occurs in the early winter (December and January). This synoptic pattern is also reported as one of the main types to affect the aerosol distributions over eastern China (Zheng et al., 2015). Circulation at 500 hPa is controlled by one trough and one ridge, with the weak ridge located in the northwest of China and the shallow trough located in the northeast of China (Fig. S6b). All of East Asia is affected by the westerly current. The trough and ridge at 700 hPa are deepened. Jingzhou is located at the bottom of the shallow trough, prevailing the west-northwest airflow, and affected by the flow around the plateau (Fig. S7b). At 850 hPa, the cold high-pressure center is formed in Xinjiang, and Jingzhou is affected by the northerly airflow, due to being in the front of the high-pressure area (Fig. 3b). For the sea level pressure, the cold high-pressure area is located in western of Mongolia and Xinjiang (Fig. 4b). Jingzhou is located in a region with weak fluctuation in the front of the high-pressure area, and the surface wind speed is slower than 2 m/s. The haze episodes induced by the NW-type synoptic pattern are similar to the transmission–accumulation pollution caused by the SW type, but the transmission path is from northern China to central China.
A-type circulation also mainly occurs in the early winter. The high-altitude circulation field is controlled by one trough and one ridge (Figs. S6c and S7c). East Asia is affected by west-northwest air flow, and the SLP is controlled by a huge high-pressure area, with the center located in the southwest of Lake Baikal (Fig. 4c). A surface high-pressure area favors accumulation of air pollutants, especially over the regions with a high-pressure center (Leung et al., 2018). Jingzhou is in a sparse pressure field in front of the high-pressure area (Figs. 3c and 4c), with an average surface wind speed of ∼1.3 m/s. The uniform west-northwest air flow at high altitude leads to low water vapor content and fewer clouds, which is conducive to radiation cooling at night. In addition, due to the weak high-pressure ridge in the north, it is not conducive to the eastward and southward movement of cold air, leading to the stable weather situation and thus severe haze pollution at Jingzhou. This type is also responsible for most of the severe particulate pollution days in the BTH and YRD regions (Li et al., 2019).
C-type circulation mainly occurs in late winter and early spring, when the relative humidity is large with an average value of 74 %. East Asia is controlled by the straight westerly flow, and the southwest shallow trough is obvious at 500 hPa (Fig. S6d). Additionally, the West Pacific subtropical high extends to the west, and central China is affected by the southwest flow. The southwest trough is deepened at 700 hPa, and Jingzhou is located in front of the trough and controlled by the southwest airflow (Fig. S7d). High pressure to the south of Xinjiang and the north of the Tibetan Plateau is strengthened at 850 hPa, and the southwest low-pressure center is formed there (Fig. 3d). Jingzhou is located in the low-pressure system on the SLP field (Fig. 4d), with low surface wind speed (0–3 m/s). Together with the large relative humidity, which can promote the hygroscopic growth of particulate matter (Twohy et al., 2009; Zheng et al., 2015), the haze pollution is persistent and serious at Jingzhou. The impact of low-pressure systems on winter heavy air pollution has also been reported in the northwestern Sichuan Basin (Ning et al., 2018).

Figure 5(a) Daily mean values of modeled (red line) and observed (black line) PM2.5 concentration () at Jingzhou and four severe pollution events (grey area) from November 2013 to February 2014. (b) Observed daily mean wind speed (red line) and wind direction (black dots). (c) Observed temperature (black line), relative humidity (red line), and sea level pressure (blue line).
3.3 PM2.5 and chemical components under the four main PSCs in control simulations
The spatiotemporal distribution of PM2.5 and its components under the four typical synoptic controls over central China was simulated by an optimized GEOS-Chem model. In order to reduce the simulation cost, the continuous four severe haze episodes that occurred during November 2013–February 2014 are selected. These four haze episodes are controlled by the synoptic pattern of SW type (18–25 November 2013), NW type (19–26 December 2013), A type (14–21 January 2014), and C type (26 January–2 February 2014). The air quality at Jingzhou during the four pollution episodes is between grade 5 (PM2.5>150 ) and grade 6 heavy pollution (PM2.5>250 , as shown in Fig. 5a and S1a ). The simulation time is started at 1 November 2013, with the first 2 weeks used as spin up to eliminate the impact of initial conditions.
Table 2Description of sensitivity simulations by the GEOS-Chem model. The NCP, YRD, PRD, and SCB are the areas framed in red shown in Fig. 1.
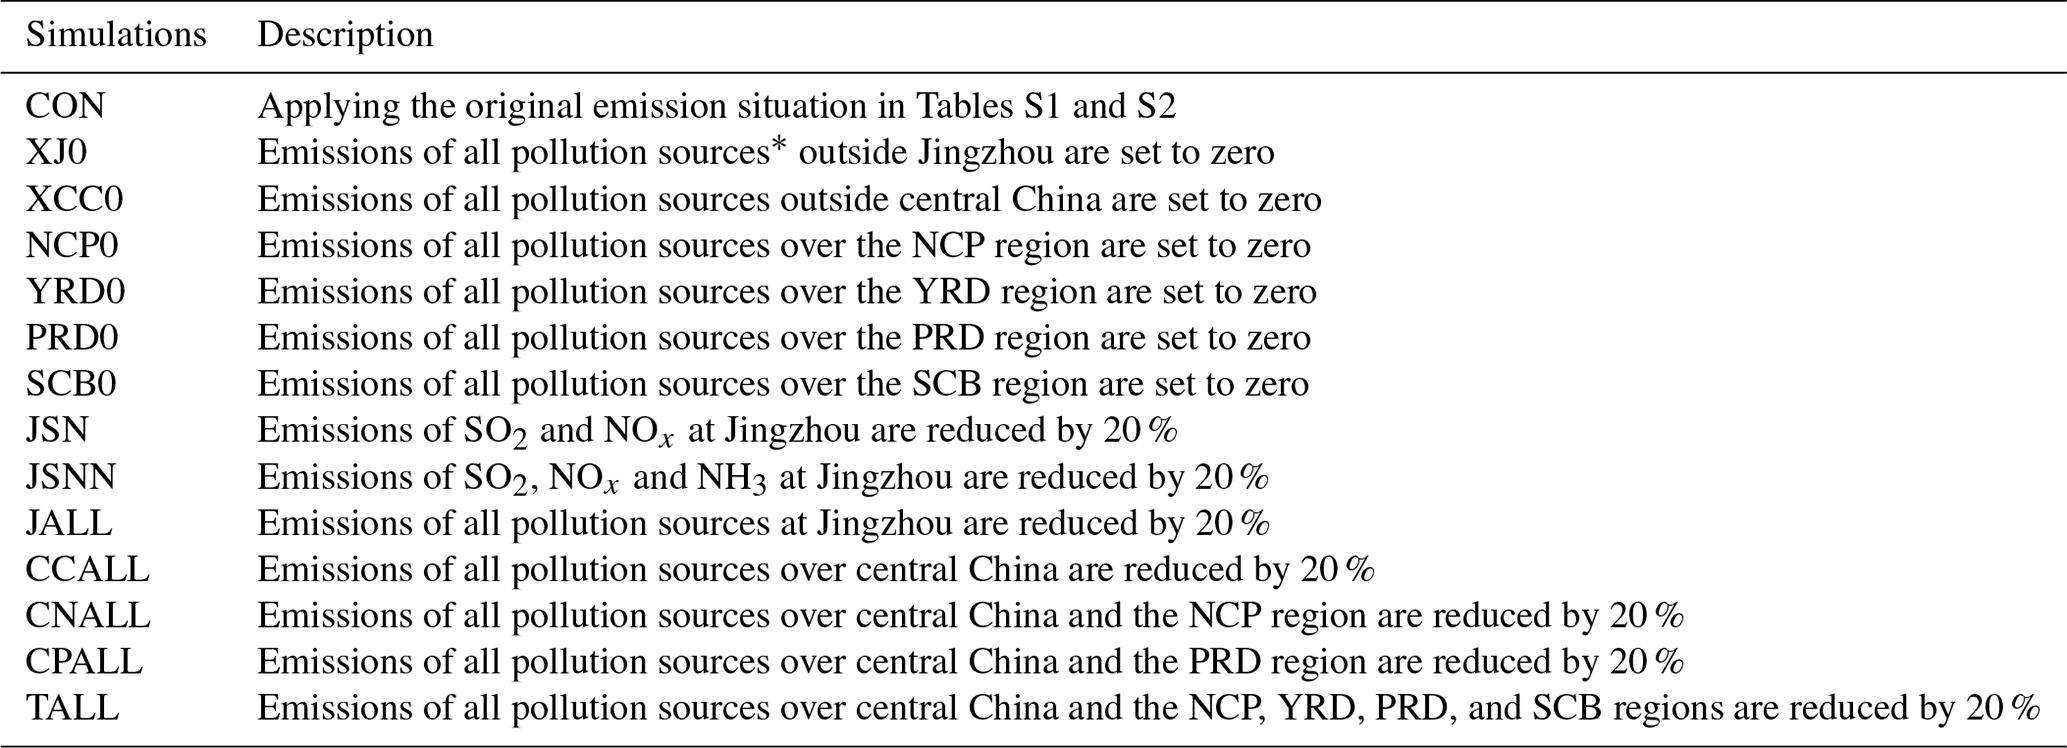
∗ All pollution sources includes emissions of SO2, nitrogen oxide (NOx), NH3, carbon monoxide (CO), black carbon (BC), organic carbon (OC), and NMVOCs.
The daily and hourly mean PM2.5 concentrations at Jingzhou in the four typical heavy pollution processes simulated by the control (CON) simulation (Table 2) are compared with the observations (Fig. 5a and Fig. S1a, respectively). The model underestimates the observed PM2.5 concentrations (by 43.3 on average), especially in the high PM2.5 periods (by 116.8 at the maximum, which occurred from 21 to 23 November 2013). The possible causes for underestimation are meteorological field deviations (an overestimate in temperature and wind speed and an underestimate in humidity; Table S3) and emission errors. Anthropogenic emissions for PM2.5 precursors used here are for the year 2017 over central China from the SEEA inventory (Table S4). From 2013 to 2017, anthropogenic NOx, SO2, and primary PM2.5 emissions in central China have declined substantially (Table S4) due to implementation of stringent emission control measures for the 12th and 13th Five-Year Plan (Zheng et al., 2018). The anthropogenic emissions biases may affect our simulations and PM2.5 attribution results to some extent. Additionally, the underestimation is on a national scale when compared with the MEE observations, with a bias of −29.3, −18.7, −39.0, and −21.4 on average for SW-type, NW-type, A-type, and C-type synoptic-controlled episodes, respectively (Fig. 6). The national negative biases may be also attributed to the insufficient resolution of the model (Yan et al., 2014) and imperfect chemical mechanisms (Yan et al., 2019). Nevertheless, the model can reproduce the evolution of each severe particle pollution episode well, including the accumulation of pollutants, the continuing process and the gradual dissipation of pollution (Fig. 5a/Fig. S1a).
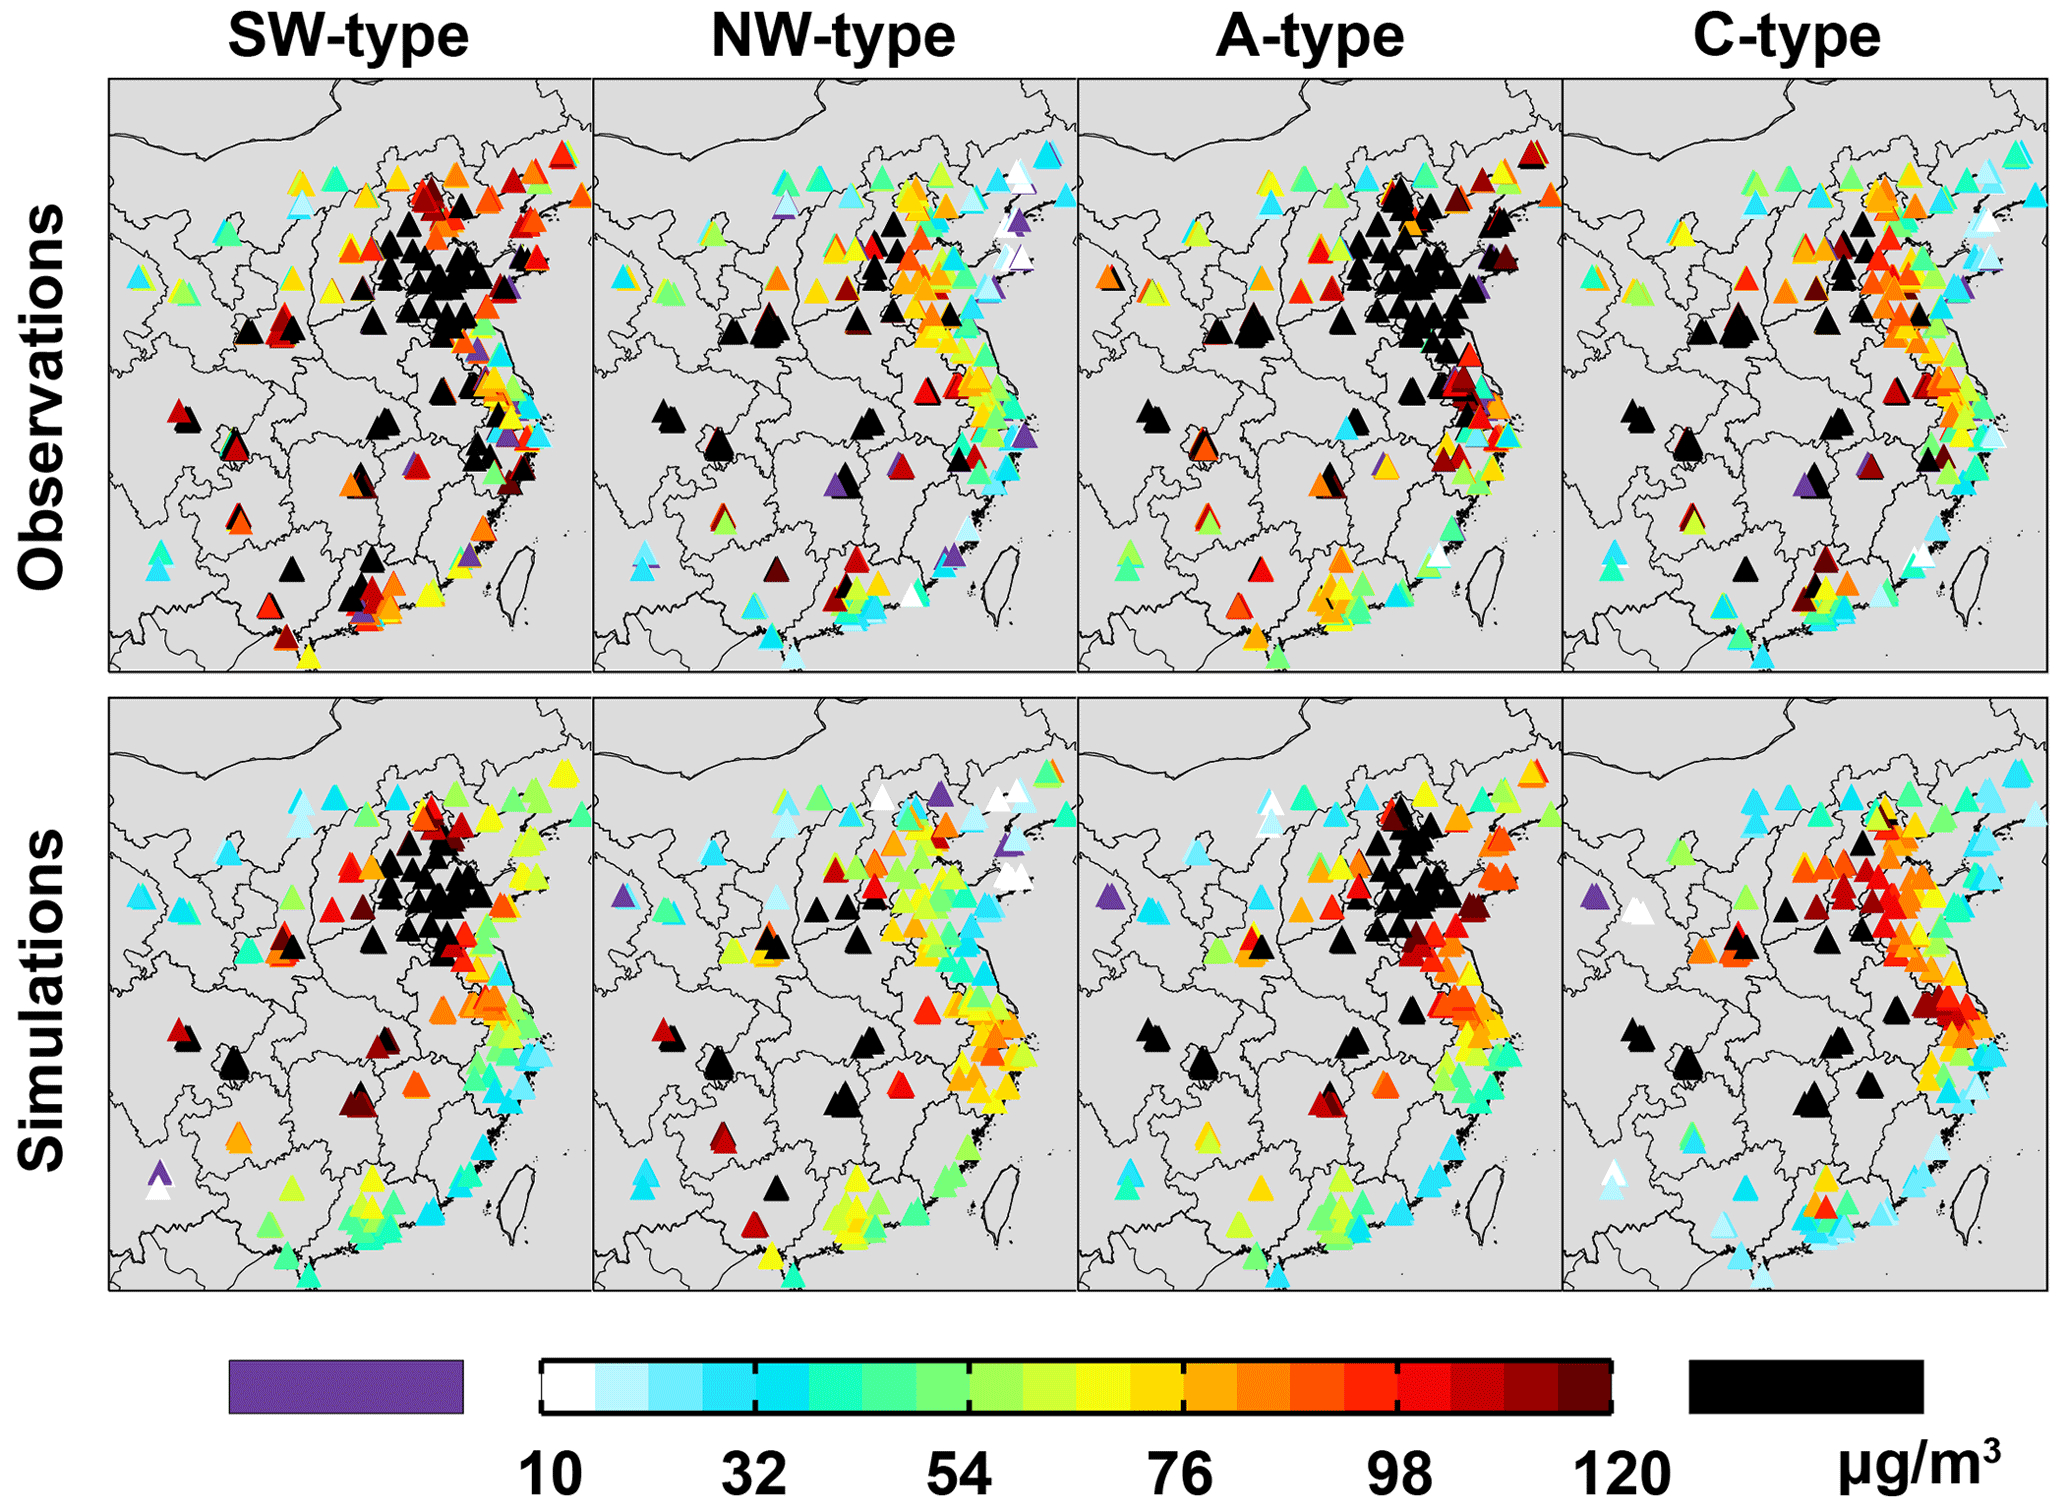
Figure 6Spatial distribution of observed (top row) and modeled (bottom row, by CON case) PM2.5 concentrations () averaged over four severe pollution episodes controlled by a SW-type (first column), NW-type (second column), A-type (third column), and C-type (fourth column) synoptic pattern.
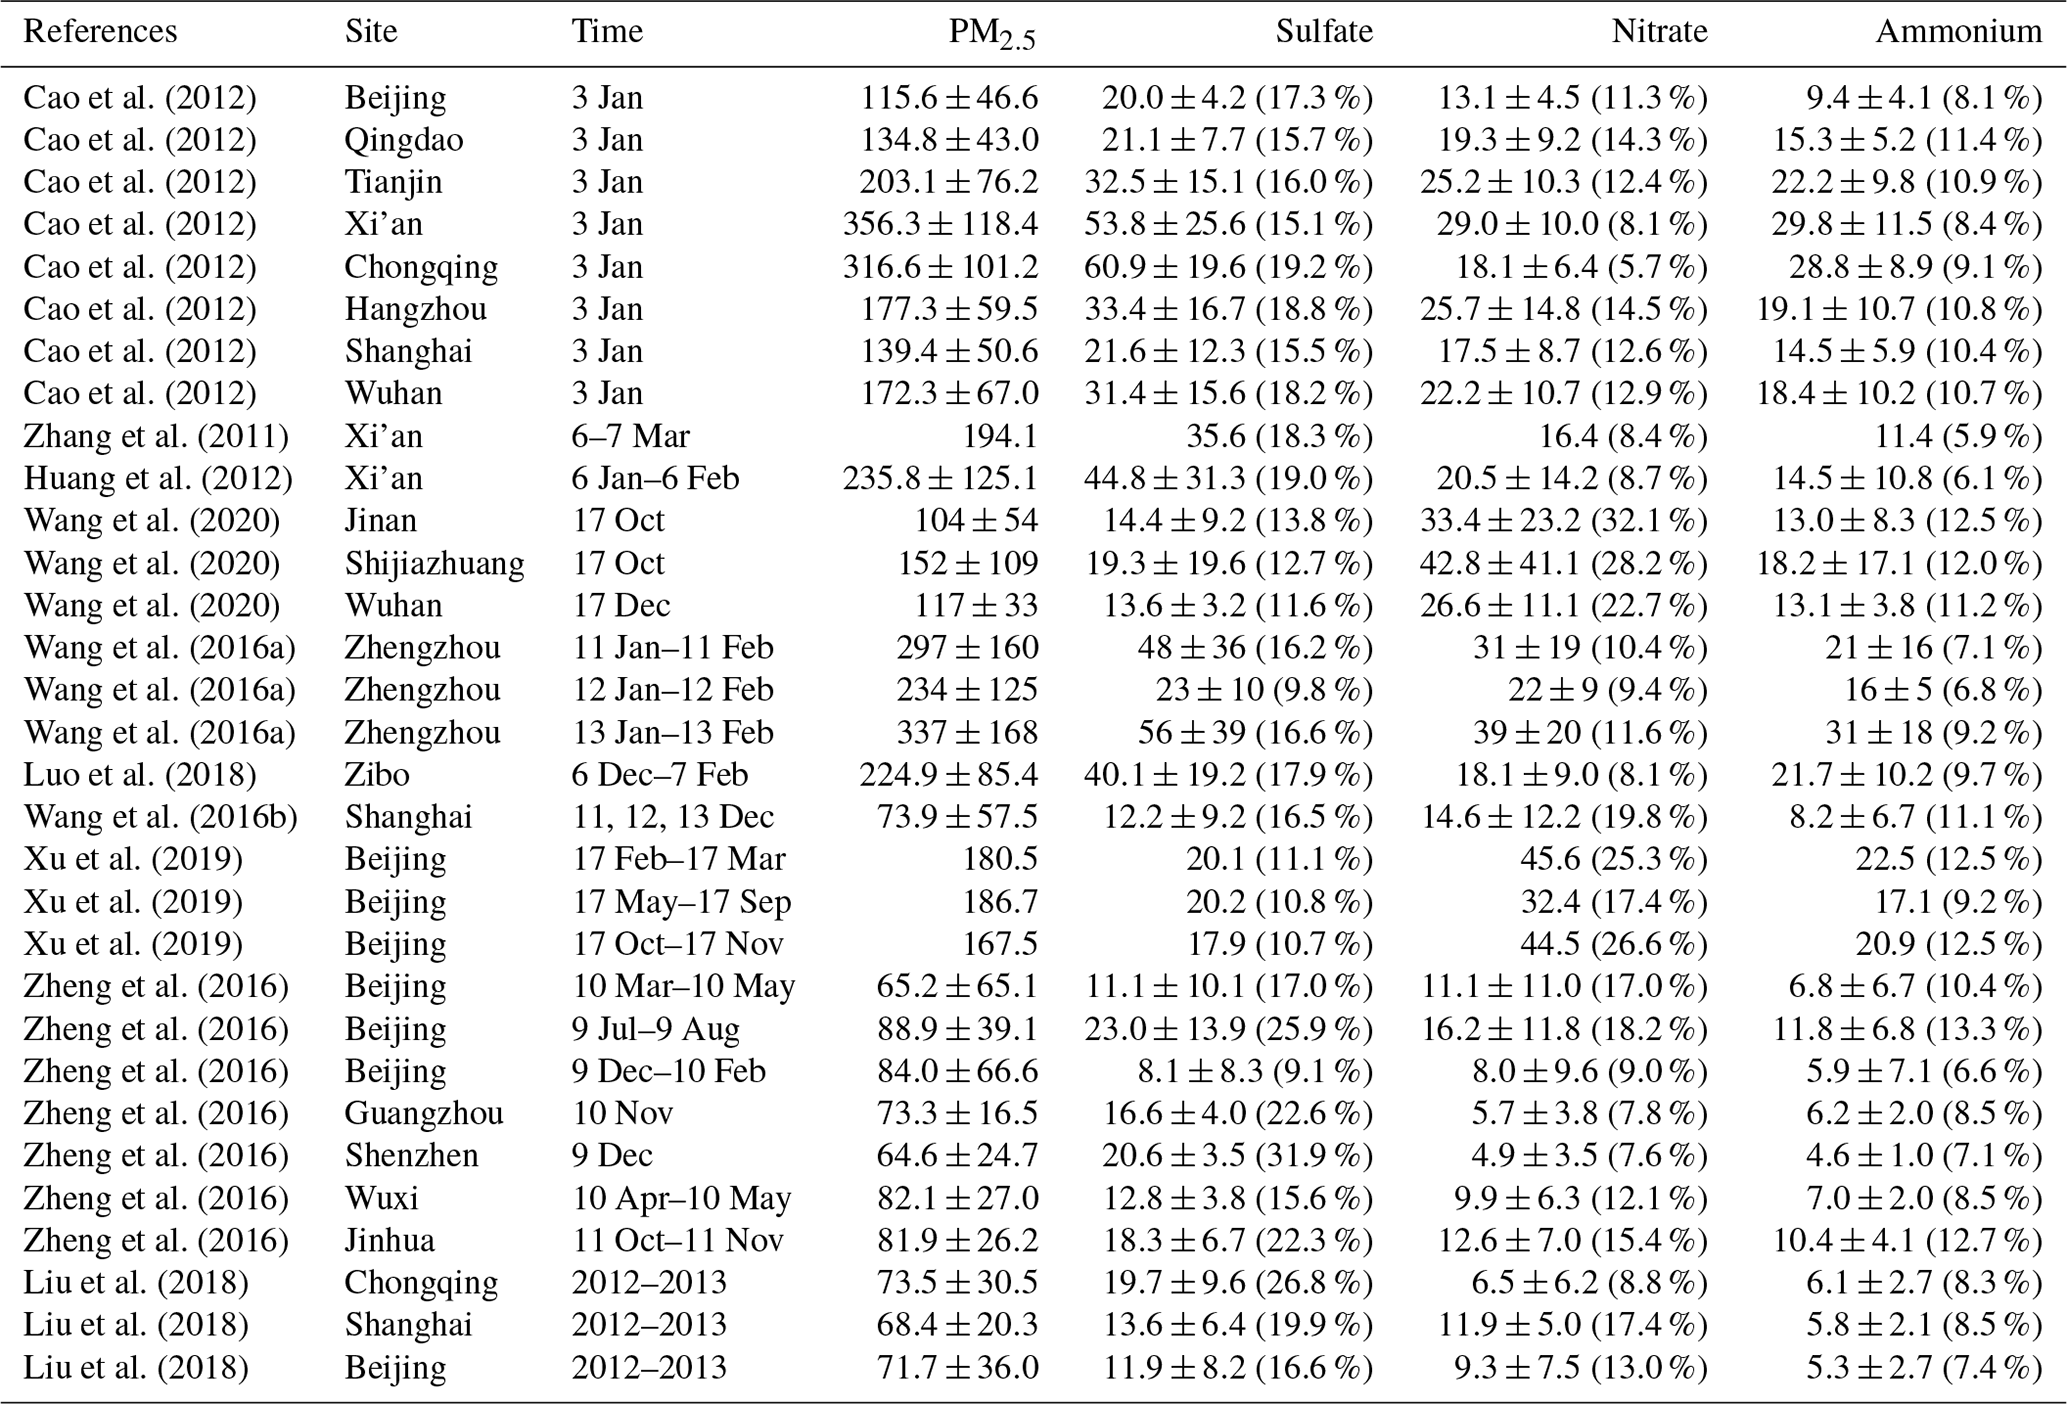
In order to examine the model performances in the PM2.5 chemical compositions, we have reviewed the reported concentrations of PM2.5 and the three inorganic salts (sulfate, nitrate, and ammonium) in other cities (Table 4). The contributions of sulfate, nitrate, and ammonium are 9.1 %–31.9 %, 5.7 %–32.1 %, and 5.9 %–13.3 %, respectively. Figures S8 and S9 show the modeled spatial distribution of PM2.5, sulfate, nitrate, and ammonium concentrations averaged in the four typical heavy pollution processes over Jingzhou and China. The fractions of each inorganic salt in PM2.5 for these four heavy pollution episodes are also shown in Fig. S10. Over central China, the main components of PM2.5 are the three inorganic salts in these pollution episodes, with the averaged contributions of sulfate, nitrate, and ammonium being ∼20 %, ∼18 %, and ∼13 %, respectively (Table 3). Our modeling results are comparable to the previous observed results (Table 4). Huang et al. (2014) have also reported that the three secondary inorganic particles rank the highest fraction among the PM2.5 species in central eastern China. As shown in Table 3, in addition to inorganic salts, other chemical components include dust (∼15 %), black carbon (∼7 %), primary organic aerosol (∼14 %), and second organic aerosol (∼13 %). In these four pollution events, the differences in mass percentages of each chemical component ranged from 0.1 % (dust) to 6.2 % (sulfate) (Table 3). See details in Sect. 3.4 for further analysis of the causes for the differences.
Table 3Simulated PM2.5 concentrations and associated chemical components averaged for the four typical heavy pollution episodes at Jingzhou. Also shown in brackets are the percentages of each component in PM2.5.
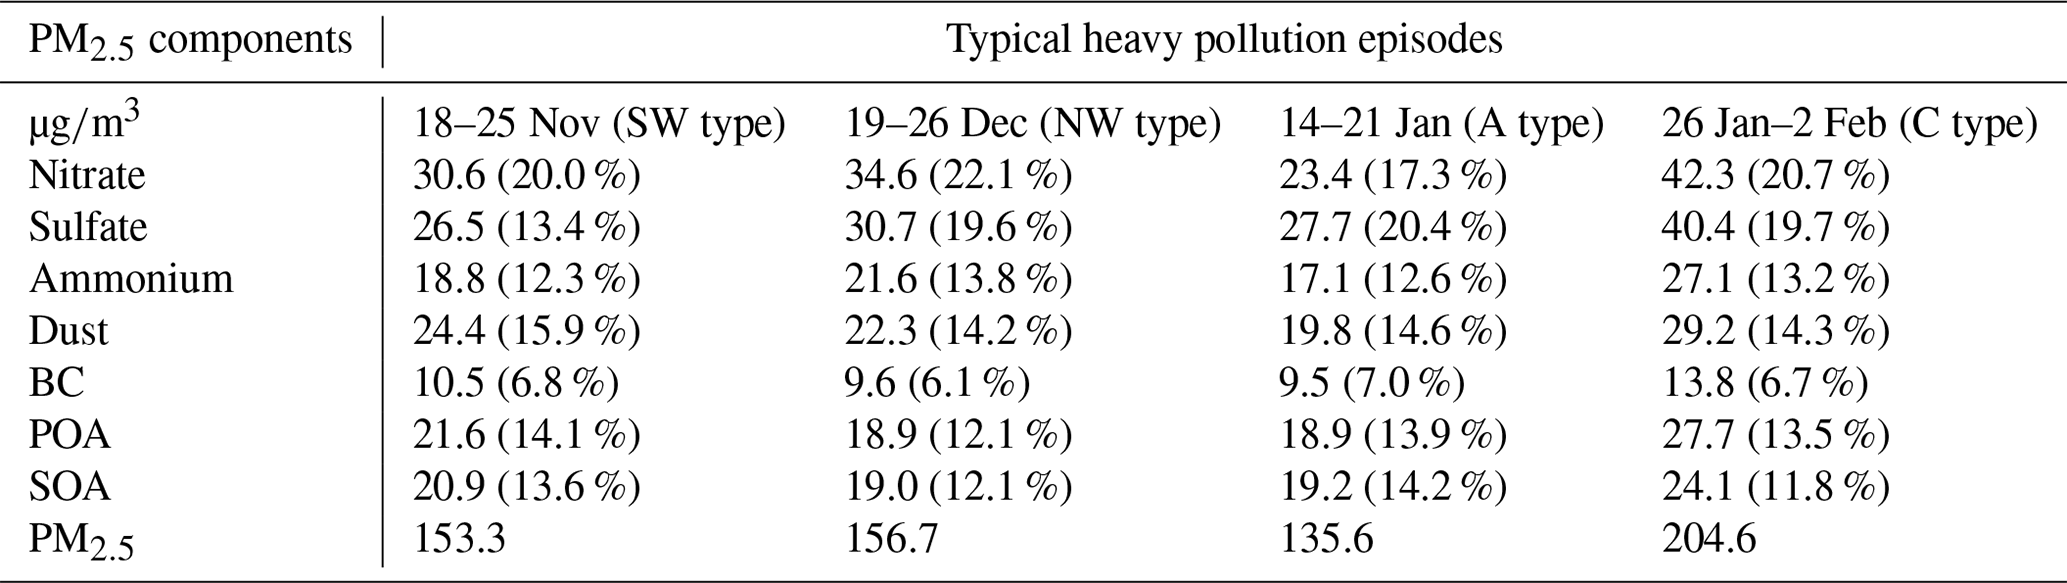
Table 4The reported concentrations of PM2.5 and the three inorganic salts (sulfate, nitrate, and ammonium, in ) in other cities.
3.4 Local emissions versus transmission contributions to PM2.5 under the four main PSCs
In order to investigate the effectiveness of emission control to reduce PM2.5 pollution of central China in the four typical severe particle pollution episodes, firstly we estimate the local sources versus transmission contributions of PM2.5 by GEOS-Chem sensitivity simulations (Table 2). Results of XJ0 (emissions outside Jingzhou are zero) indicate the contribution of local emission sources to the PM2.5 pollution over Jingzhou. The difference between CON and XCC0 (emissions outside central China are zero) shows the transmission contribution of PM2.5 outside central China to Jingzhou. The difference between CON and NCP0, YRD0, PRD0, and SCB0 (emissions over the NCP, YRD, PRD, and SCB are zero, respectively) represents the contribution of pollution transport from the NCP, YRD, PRD, and SCB regions to Jingzhou, respectively.
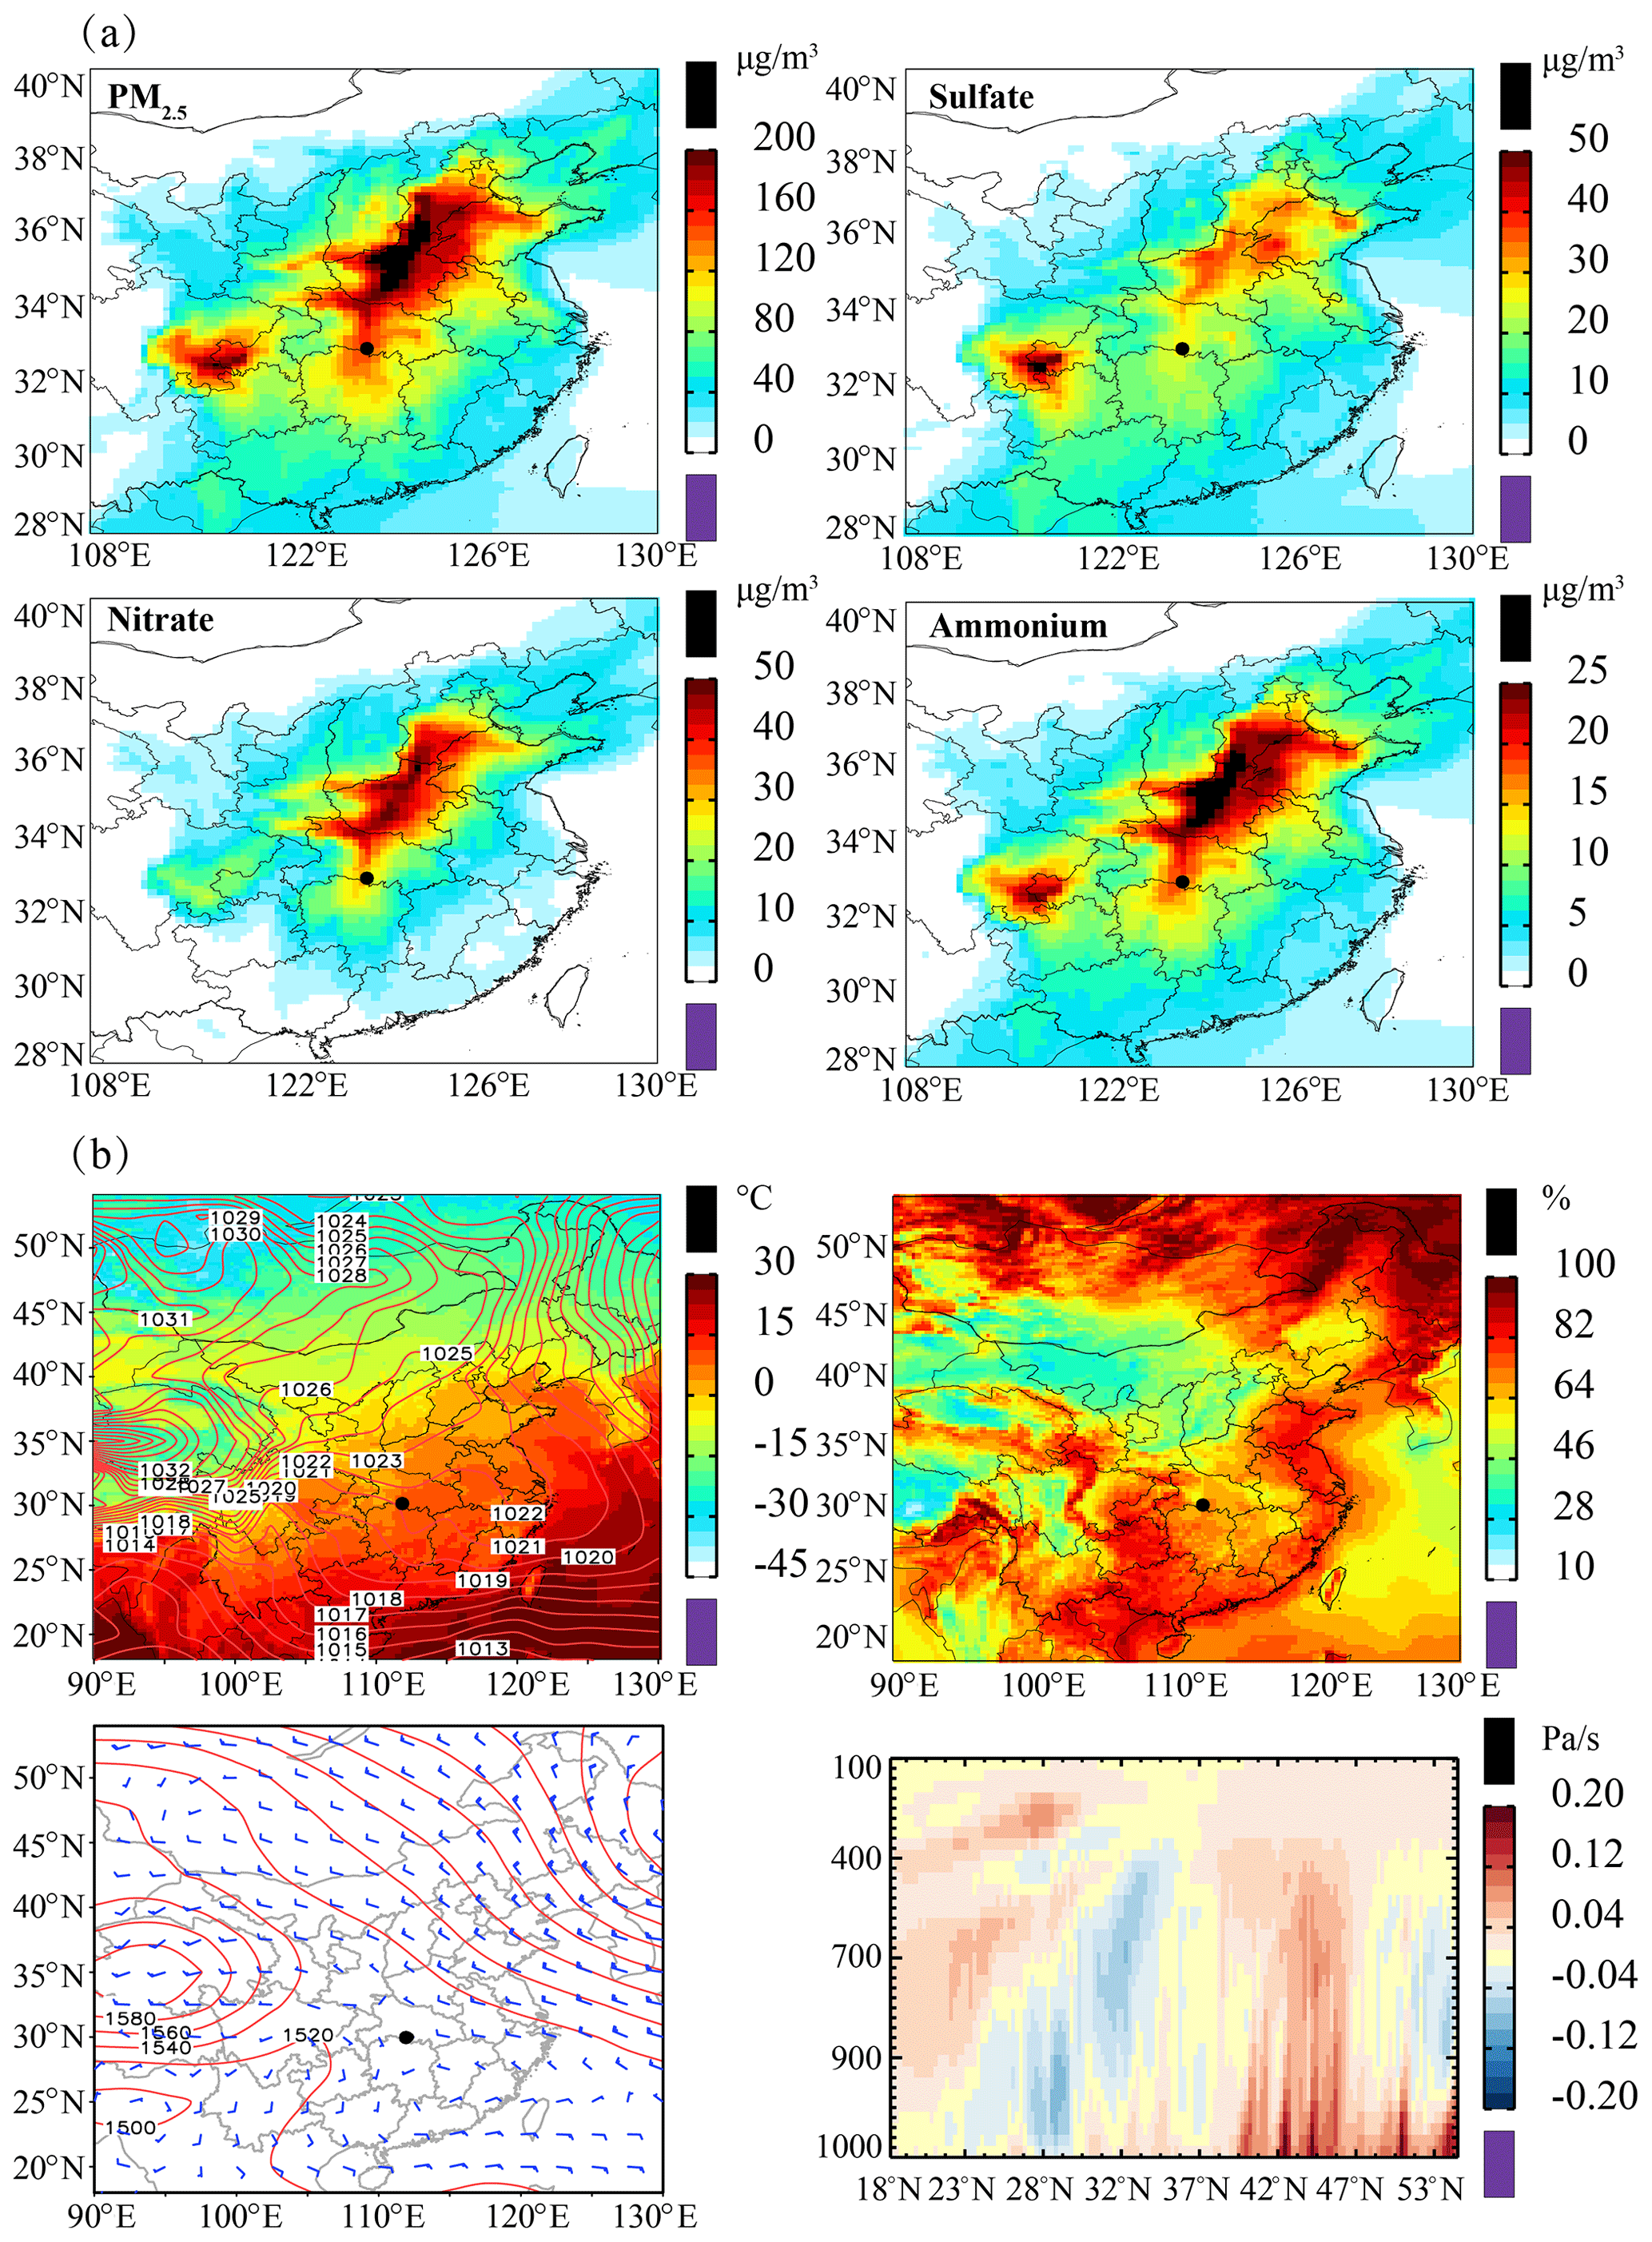
Figure 7(a) Spatial distribution of PM2.5, sulfate, nitrate, and ammonium concentrations averaged over SW-type synoptic controls (18–25 November 2013) simulated by GEOS-Chem control simulation (). (b) Meteorological conditions of the SW type: sea level pressure (red line) and temperature (color shades), surface relative humidity (%) fields, 850 hPa wind and geopotential height (red line), and height–latitude cross sections of vertical velocity (Pa/s).
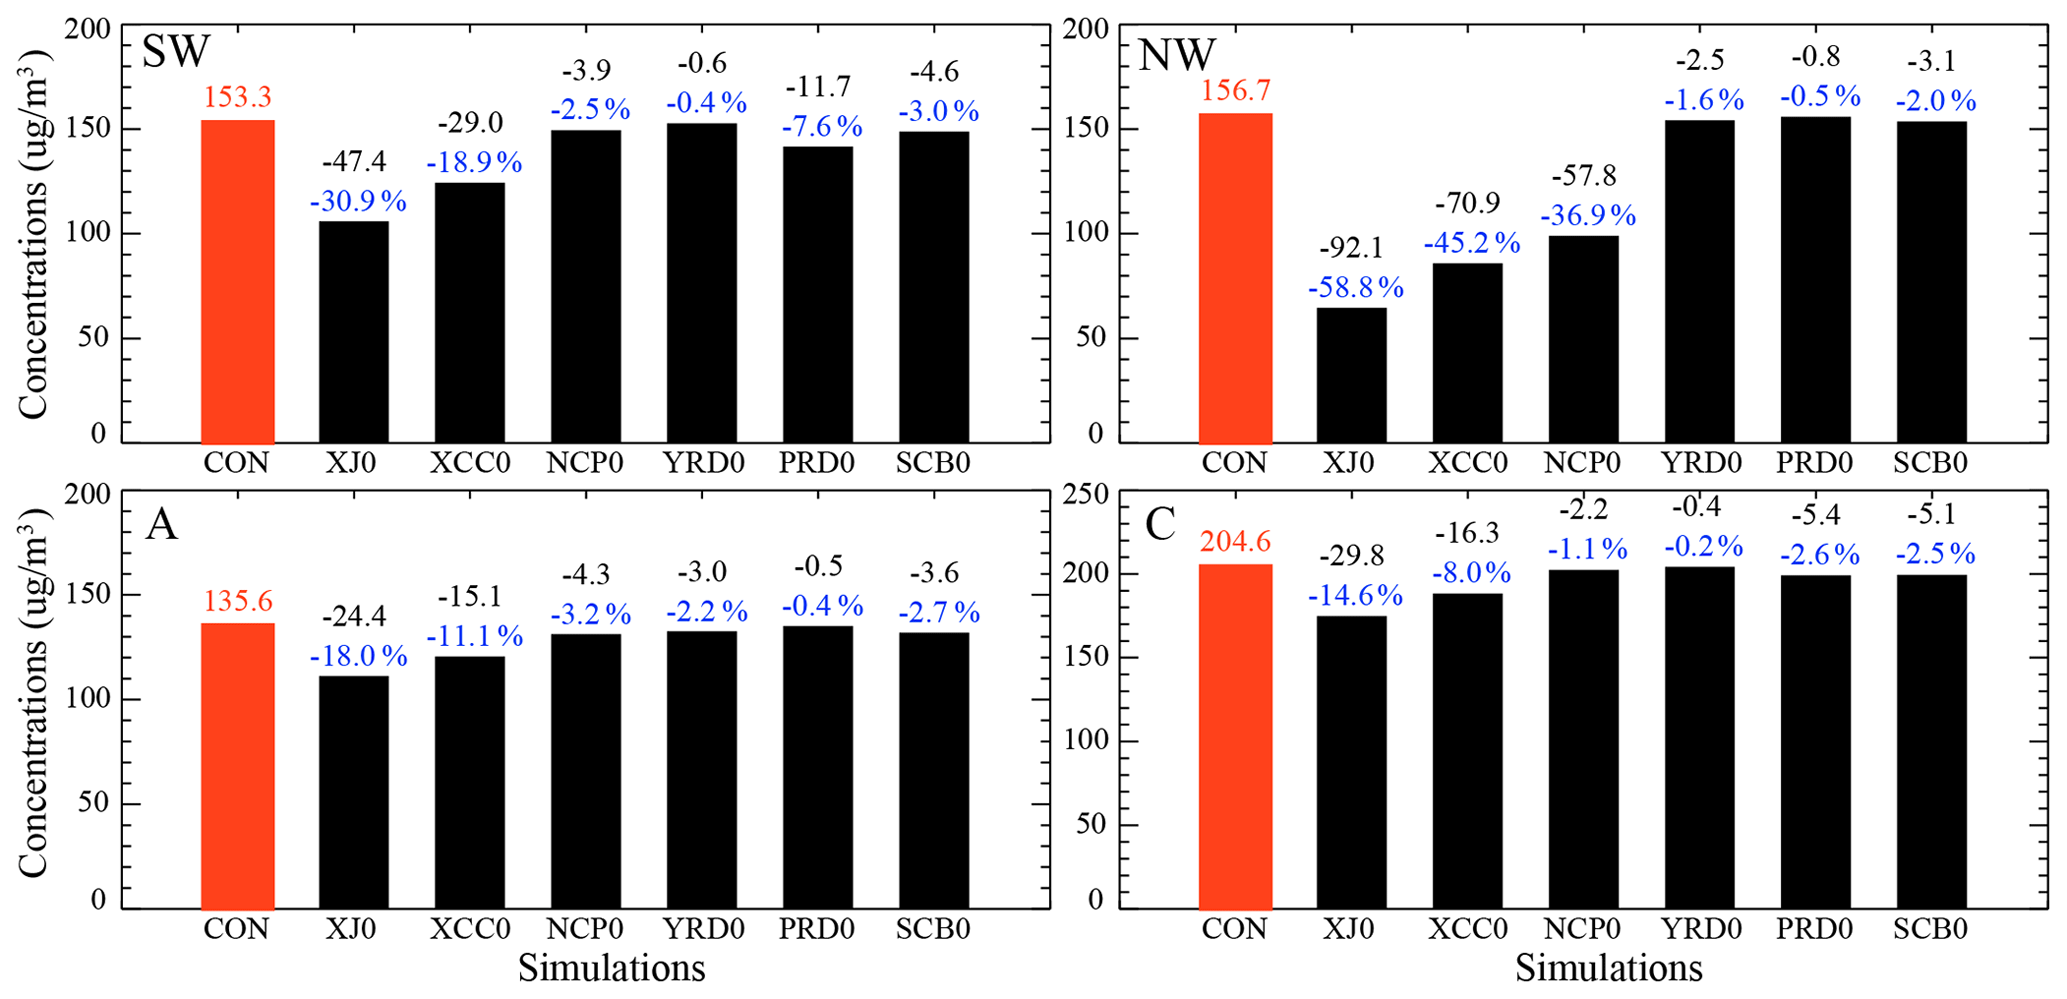
Figure 8Modeled concentrations () of PM2.5 at Jingzhou in the GEOS-Chem control (red bar) and sensitivity (black bar) simulations in view of the regional transportation and the differences (black numbers show mass concentrations; blue numbers show mass percentages) between the sensitivity and the control simulations. The abbreviations for each simulation are found in Table 2.
For the SW-type synoptic situation, differences between the simulation results of NCP0, YRD0, SCB0, and CON show that pollution controlled by SW-type circulation over central China is almost unaffected by the emission sources from northern China, eastern China, or the Sichuan Basin. The concentrations of PM2.5 and three inorganic salts simulated by NCP0, YRD0, and SCB0 are similar to those simulated by CON, with a difference of less than 3.0 % (Fig. 8). However, as they are affected by the southerly airflow at 850 hPa (Fig. 7), air pollutants formed over southern China could be transmitted to central China, with a transport contribution of 7.6 %. In addition, the contributions from transboundary transport from non-Jingzhou central China is simulated at 12.0 % by comparing the results of XJ0 and XCC0. The transport of air pollutants from the south leads to the smallest proportion of the three inorganic salts (45.7 %) in Jingzhou among the four pollution episodes (50.3 %–55.5 % for the other three episodes) because the emissions of SO2, NO2, and NH3 in the south (especially in Guangxi and Guizhou province) are smaller than those in central China (Li et al., 2017a). The low surface wind speed of 2.1 m/s on average (Fig. 5) and the weak ascending in the vertical direction (Fig. 7) at Jingzhou mean that it is not conducive to the dispersion of local pollutants (Zheng et al., 2015). The high PM2.5 concentrations are mainly accumulated by local emissions. The simulations of XJ0 and CON show that local emission sources over Jingzhou contribute ∼70 % to PM2.5.
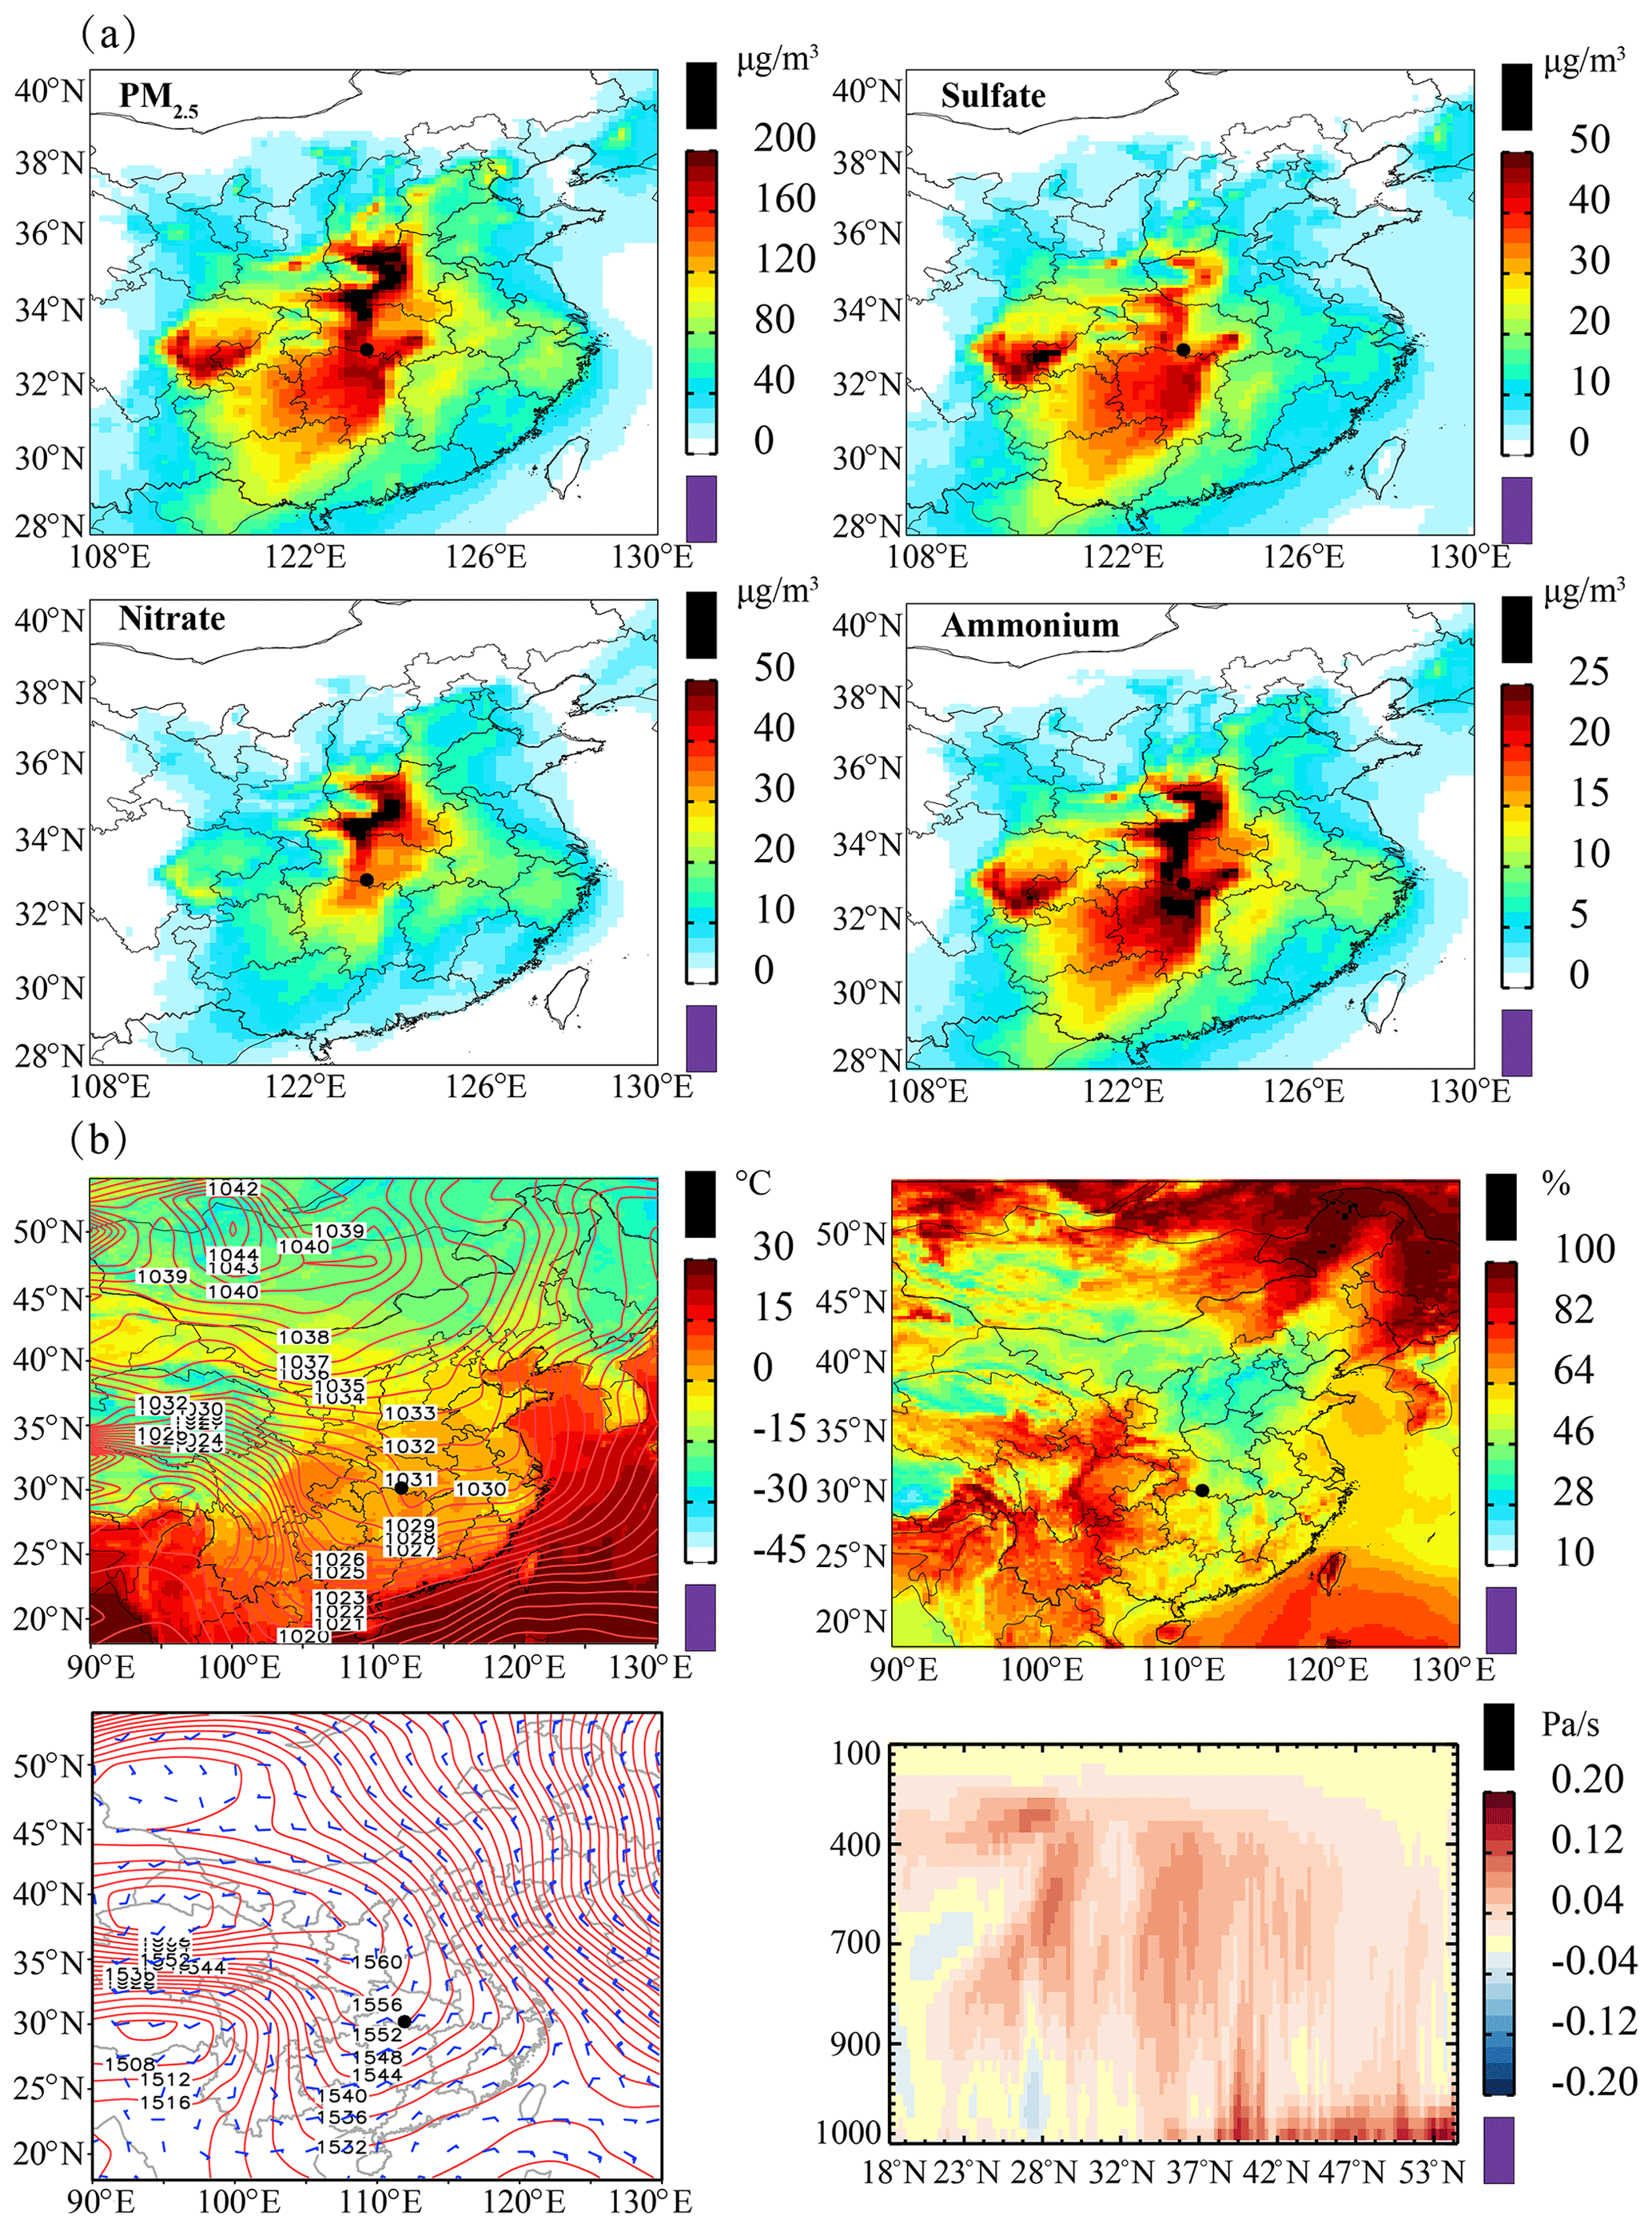
Figure 9The same as Fig. 7 but for NW-type synoptic control (19–26 December 2013).
For the NW-type synoptic mode, affected by the northerly airflow (Fig. 9), it is conducive to the southward movement of air pollutants in northern China (He et al., 2018; Leung et al., 2018). Influenced by the local and surrounding terrain over central China (Fig. 1), two transmission channels are formed from north to south and from northeast to southwest (Fig. 9). In addition, due to the local low wind speed (1.4 m/s on average) near the ground (Fig. 5) and the weak convection and the warm ridge along the East Asian coast (Fig. 9), the local and transported pollutants accumulate in central China. The average concentration of PM2.5 in Jingzhou is 179.4 . Due to the transport contribution of pollutants from northern China (with much higher anthropogenic emissions of SO2, NO2 and NH3) (Li et al., 2017a), the total proportion of the three inorganic salts is the highest (55.5 %). The PM2.5 concentration simulated in NCP0 is 63.1 % of that by CON simulation (Fig. 8), indicating that the transmission contribution from northern China in this heavy pollution episode is as high as 36.9 %. The contribution of local emission sources is much smaller than that of SW-type synoptic pattern, only 41.2 % (comparison between XJ0 and CON).

Figure 10The same as in Fig. 7 but for A-type synoptic control (14–21 January 2014).
Under the A-type circulation, Jingzhou is controlled by a high-pressure system (Fig. 10), which can lead to stable weather conditions caused by radiation inversion (Guo et al., 2015), and subsidence inversion (Kurita et al., 1985), which is favorable to continuous accumulation of local pollutants (Guo et al., 2015). The distribution of PM2.5 in China is similar to that of the SW-type weather condition, with an averaged PM2.5 concentration of 128.6 over central China. Unlike the SW type, the PM2.5 at Jingzhou in this synoptic pattern is less affected by transboundary transport, with the total transport contribution of the surrounding four major pollution regions being less than 9 %. The contribution of local emission sources is about 82 % (Fig. 8).
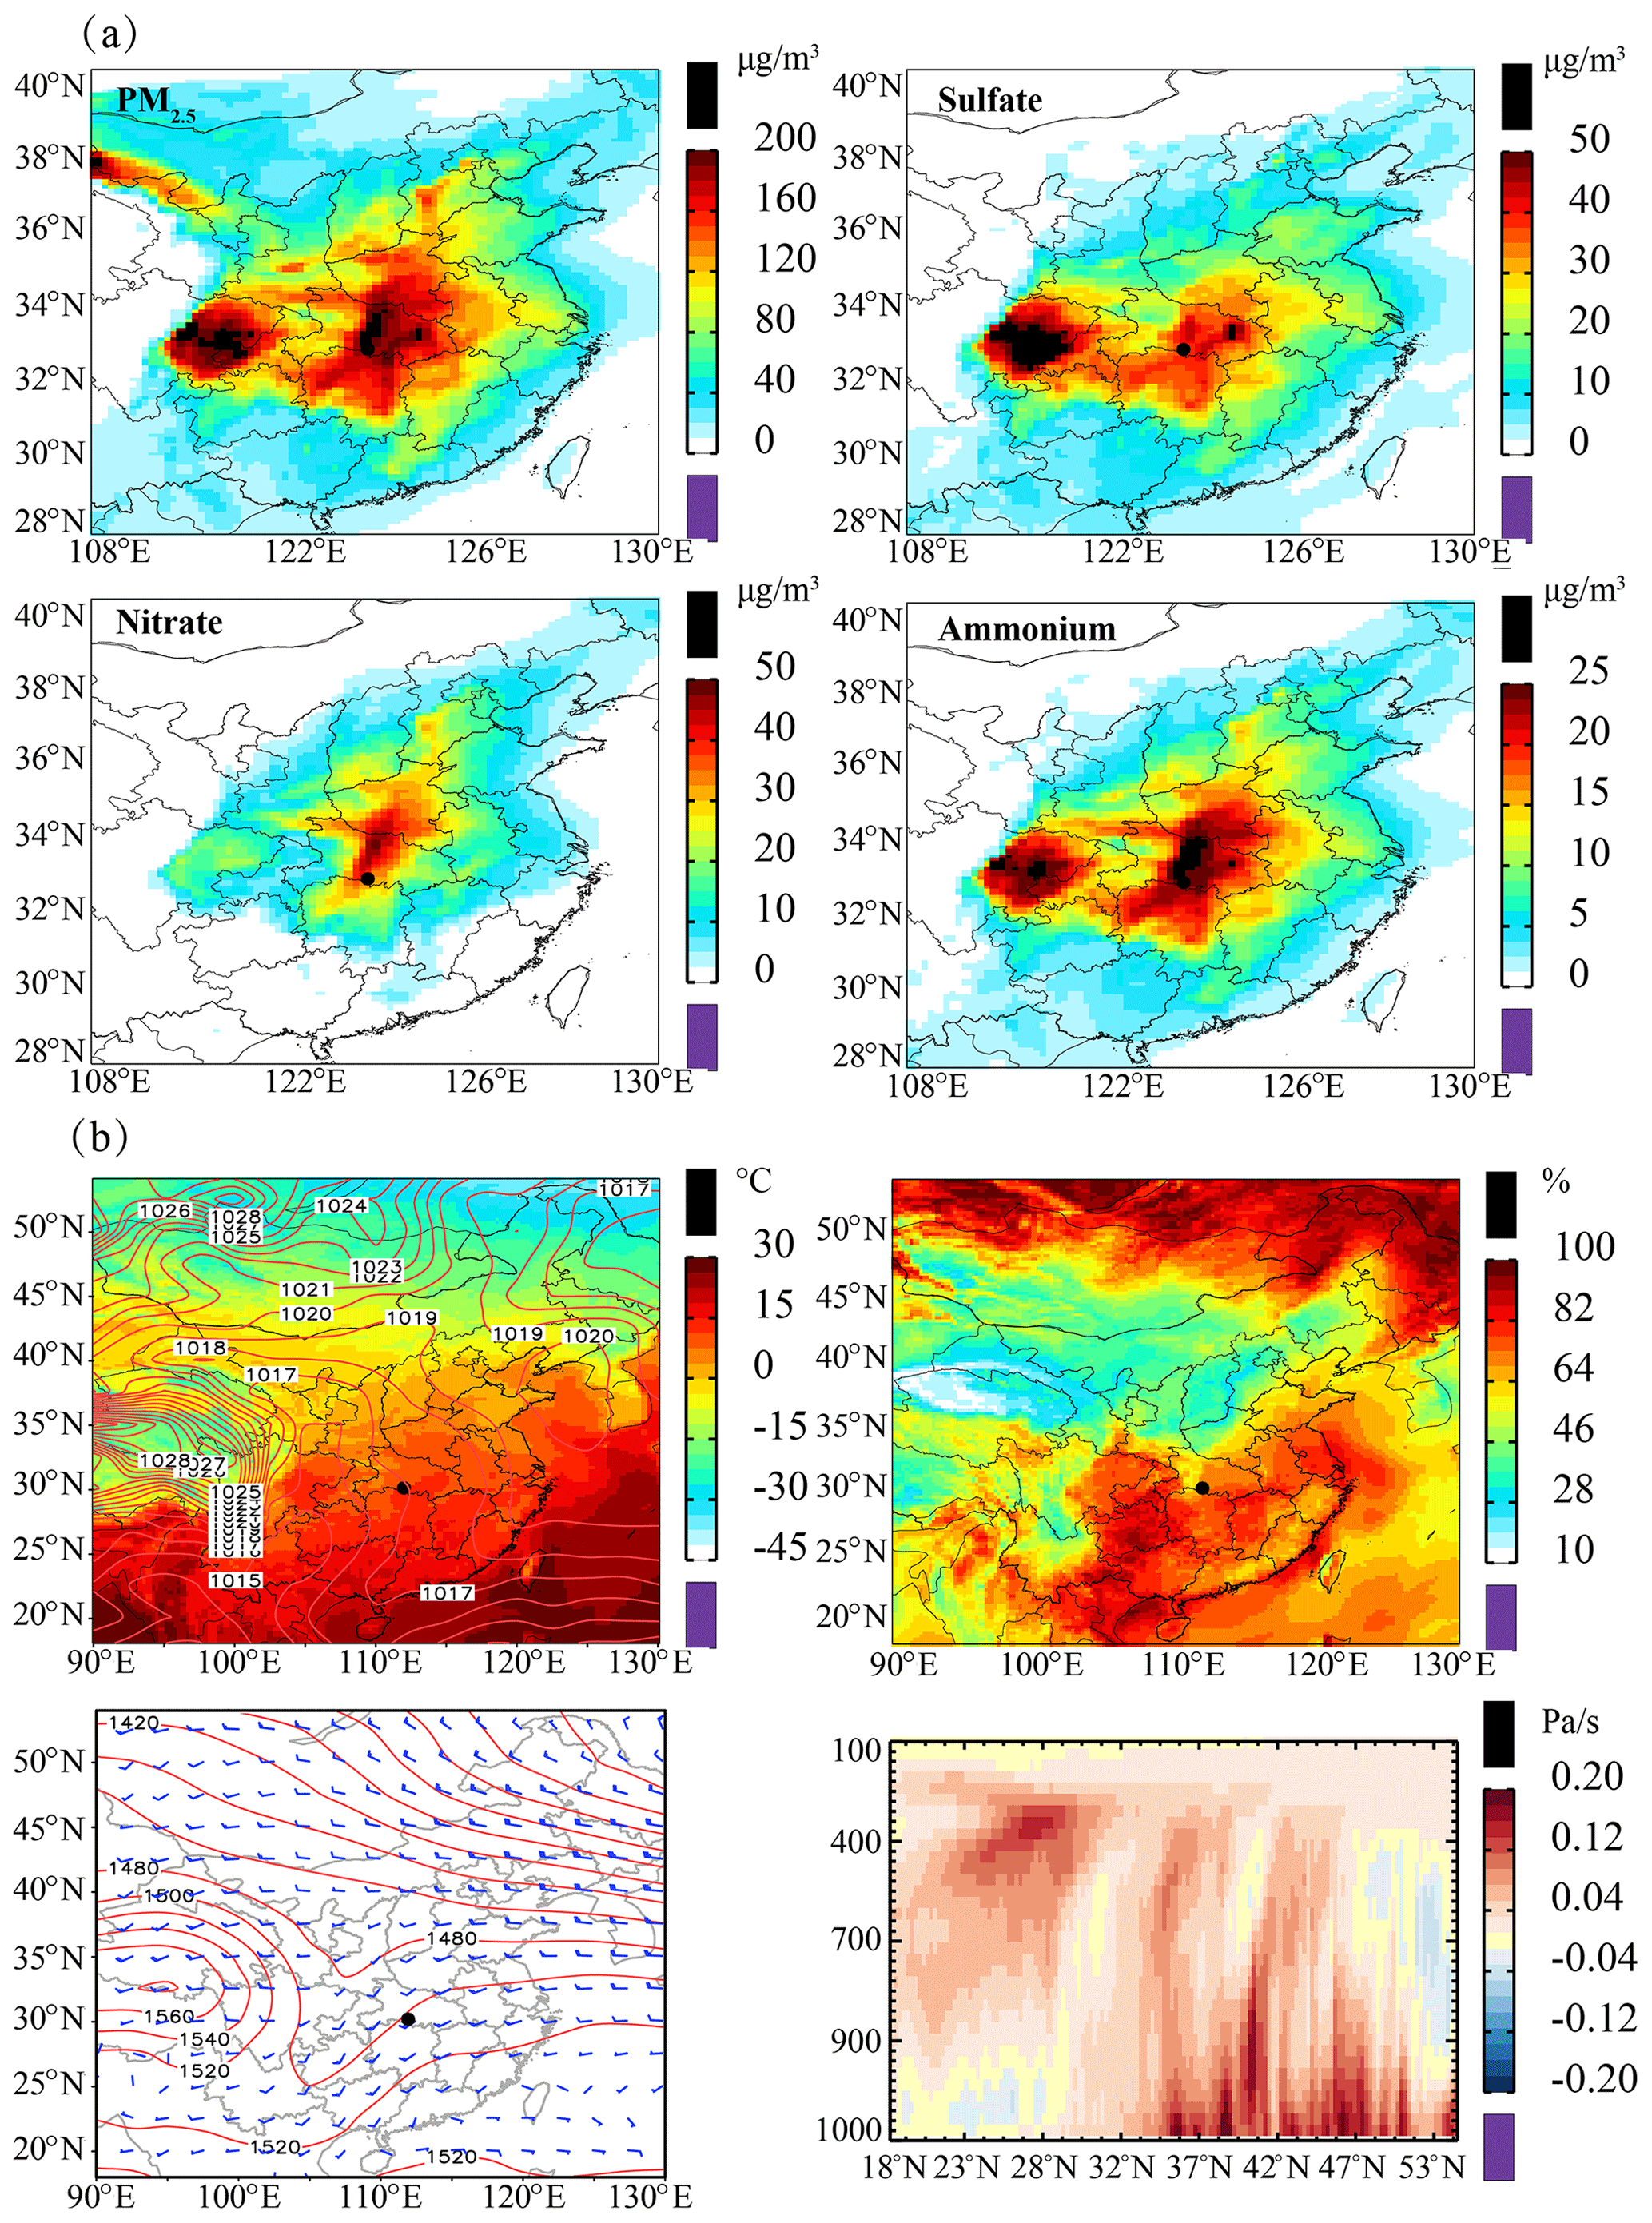
Figure 11The same as in Fig. 7 but for C-type synoptic control (26 January–2 February 2014).
Under the C-type synoptic pattern, the southwest low-pressure center is formed at 850 hPa, and Jingzhou is located in the low-pressure system of the SLP field (Fig. 11). In combination with the large relative humidity (78 % on average because the occurrence season of the C type is late winter to early spring; see Fig. 5), it can promote the haze pollution due to its impact on hydrophilic aerosols (Twohy et al., 2009; Zheng et al., 2015). Together with the low wind speed (less than 4 m/s; Fig. 5), it is easy to cause the accumulation of pollutants. The average concentration of PM2.5 over central China is as high as 203.7 . Air pollution controlled by this weather condition is the most serious of the four typical synoptic controls. However, in this weather situation, pollutants in northern China are easy to diffuse (Miao et al., 2017; Li et al., 2019), and the concentration of PM2.5 is significantly lower than that in the former three weather situations (Figs. 11 and S9). The contribution of pollution transport from regions other than central China simulated by GEOS-Chem is less than 8 %, and the contribution of local emission sources at Jingzhou is more than 85 % (Fig. 7).
3.5 Effectiveness of emission reduction under the four main PSCs
In order to estimate the effectiveness of emission reduction in severe pollution events forced by the four potential synoptic controls, we conduct sensitivity simulations by applying seven emission scenarios (Table 2). All emission scenarios use the reduction ratio of 20 %, which is close to the average of the target emission reduction of all provinces in the 13th Five-Year Plan (The State Council of the People's Republic of China, 2016). Although the base year of emission reduction is 2015 for the 13th Five-Year Plan, it does not affect the use of the simulation results of emission scenarios (with the reduction ratio of 20 % applied to the simulated year 2013/2014) to explore the emission reduction effect of specific haze pollution events. The differences in model results between CON (control simulation) and JSN, JSNN, and JALL (emissions of SO2+NOx, , and all pollution sources, respectively, reduced by 20 % at Jingzhou) represent the environmental benefits caused by different local emission reduction scenarios. The potential PM2.5 mitigation by joint prevention and control in different regions is calculated by sensitivity experiments of CCALL (emissions of all pollution sources over central China reduced by 20 %), CNALL (over central China and NCP region), CPALL (over central China and PRD region) and TALL (over central China and the NCP, YRD, PRD, and SCB regions).
In the JSN emission reduction scenario, the sulfate and ammonium concentrations over Jingzhou are significantly reduced by 3.2–5.8 (12.7 %–14.5 %) and 0.6–1.9 (3.2 %–5.9 %) in these four pollution events, respectively. However, the concentration of nitrate increases (1.3 %–1.7 %). This is because there is a competition mechanism between nitrate and sulfate. Ammonium ions always react with sulfate ions first to generate ammonium sulfate, which will continue to react with nitrate ions to generate ammonium nitrate when ammonium ions are rich (Mao et al., 2010). Thus, the reduction of SO2 emission increases the concentration of nitrate, which offset the contribution of sulfate particle reduction to the environment to some extent. Therefore, the application of JSN emission reduction scheme only reduces the PM2.5 concentrations by 3.1–7.2 (2.0 %–3.5 %, Fig. 12). This inefficient emission reduction scheme has been most widely used in heavy pollution areas over China over the past decade, ignoring the synergistic effect of various precursors.
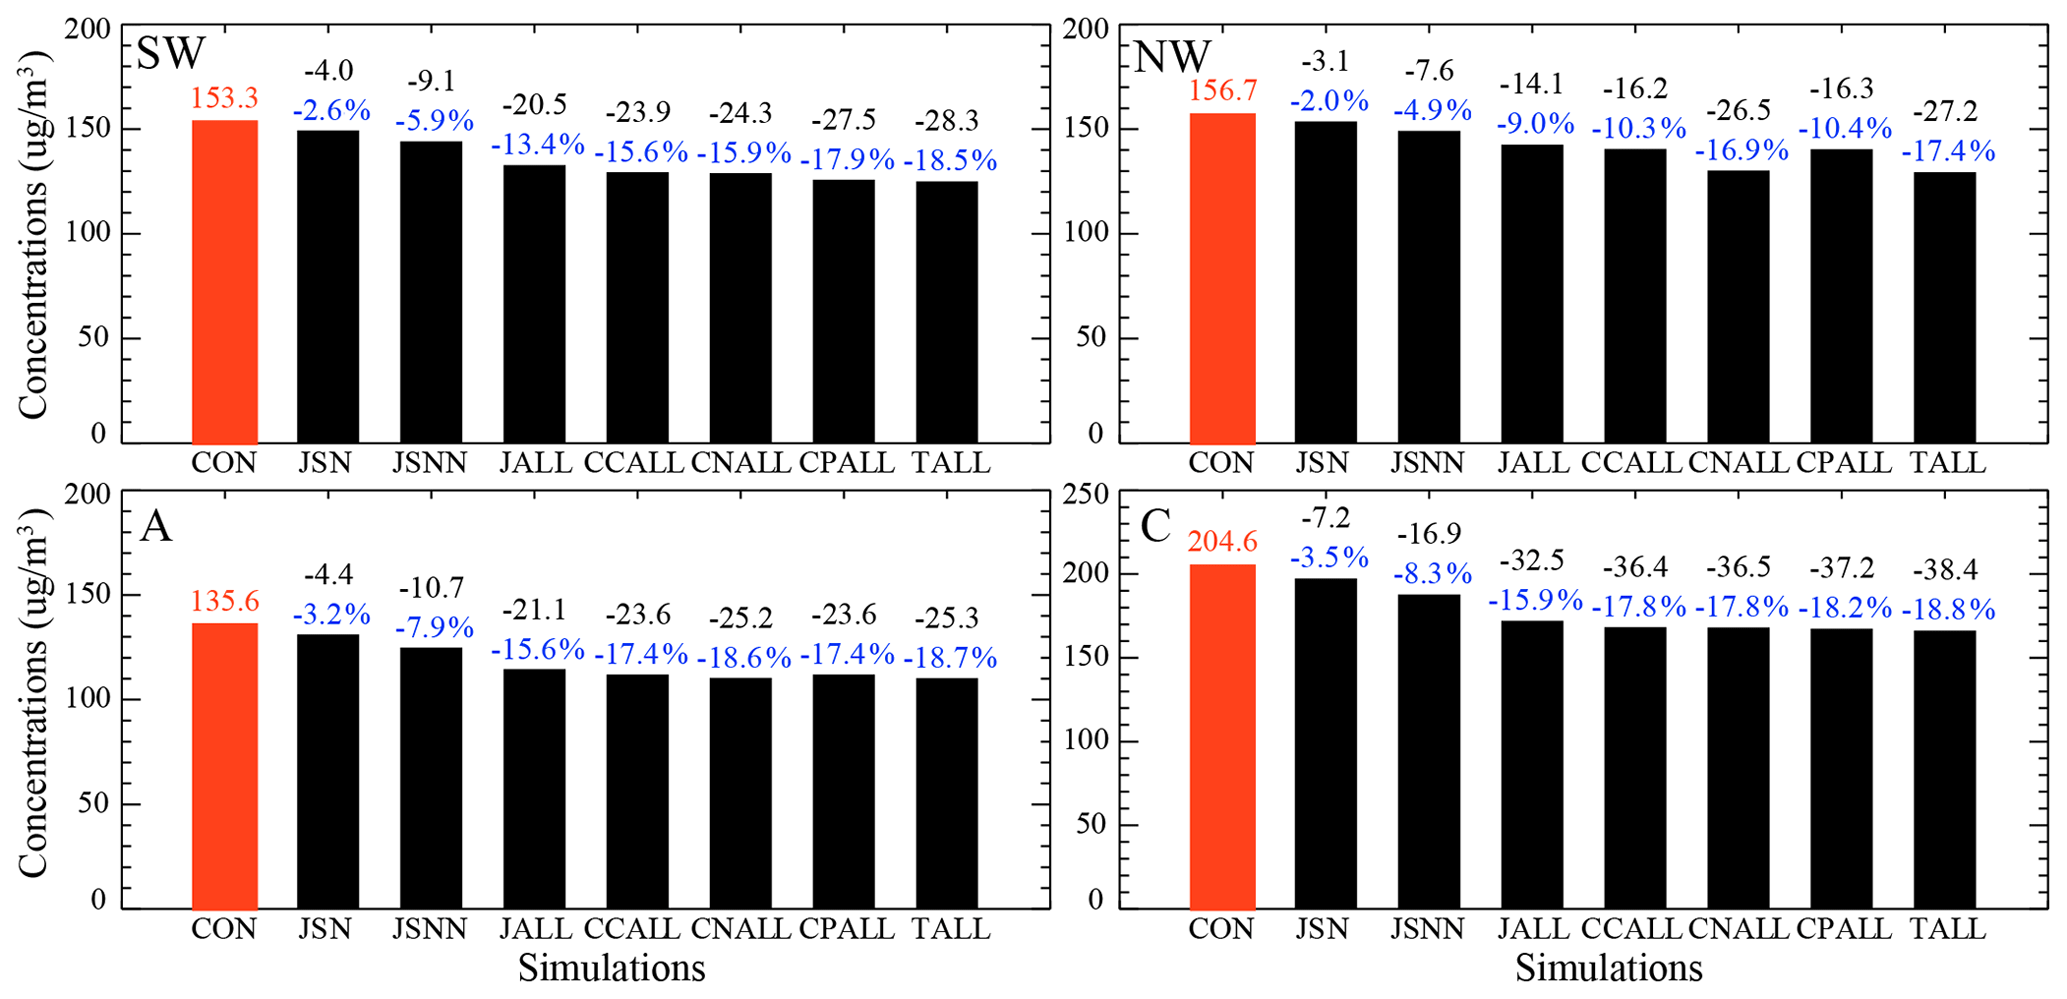
Figure 12Modeled concentrations () of PM2.5 at Jingzhou in the GEOS-Chem control (red bar) and sensitivity (black bar) simulations for emission reduction and the differences (black numbers show mass concentrations; blue numbers show mass percentages) between the sensitivity and the control simulations. The abbreviations of each simulation are given in Table 2.
By applying the JSNN and JALL emission reduction scenarios, we aim to evaluate the synergistic effect of multiple precursors on emission reduction. These two scenarios reduce the average sulfate concentration in Jingzhou by 2.8–6.7 (11.3 %–17.3 %) and 2.9–7.2 (11.7 %–17.9 %) and the ammonium concentration by 2.0–4.8 (12.1 %–16.5 %) and 2.2–4.7 (13.2 %–17.3 %), respectively. Unlike the increments of nitrate in JSN emission reduction scenario, the nitrate decreases (JSNN: 0.3–1.2 ; JALL: 0.4–1.5 ). Therefore, through the application of JSNN and JALL emission reduction schemes, PM2.5 concentrations decrease by 4.9 %–8.3 % and 9.0 %–15.9 %, respectively (Fig. 12), which is much higher than the improvement in the JSN scenario. M. Zheng et al. (2019) have also evaluated the sensitiveness of NH3 control to PM2.5 reduction based on observations. However, these results indicate that it is unrealistic to substantially reduce local emissions to achieve the national air quality standard in the long term.
Additionally, the sensitivity simulations that exclude emission sources over upwind regions are conducted to estimate the potential PM2.5 mitigation of inter-regional and intra-regional joint control. Our results show that after applying the TALL emission reduction scenario, PM2.5 concentrations have been significantly improved, with the improvement rates increased from 9.0 %–15.9 % (by JALL scenario) to 17.4 %–18.8 % (Fig. 12). The NW-type synoptic-controlled air pollution episode shows the best effect of joint prevention, followed by the SW type. For the NW type, PM2.5 concentrations are reduced by 26.5 (16.9 %) by reducing emissions over central China and Northern China (CNALL scheme), which is much more effective than the JALL emission reduction scheme (14.1 , 9.0 %). In an SW-type controlled pollution episode, this should be otherwise to decrease the emissions over Southern China in addition to central China.
The PM2.5 pollution in autumn and winter haze periods is now the key obstacle for further improving air quality in China. The extremely severe and persistent PM2.5 pollution episodes are attributed to adverse synoptic conditions in addition to high precursor emissions. For the PM2.5 mitigation during winter haze episodes in specific regions forced by various potential synoptic controls, how to effectively reduce emissions has become an urgent scientific question that needs to be answered. Our results over central China could provide reference for regional air quality policy-making.
Using the Lamb–Jenkinson circulation classification, the top four potential synoptic controls of heavy PM2.5 pollution days (totally 109 d) over central China from 2013 to 2018 are decomposed as follows: SW type, NW type A type, and C type, accounting for 29 %, 27 %, 19 %, and 12 % of the total pollution days, respectively. In these four PSCs, three inorganic salt aerosols (sulfate: ∼20 %; nitrate: ∼18 %; ammonium: ∼13 %) accounted for ∼51 % of PM2.5 concentrations simulated by optimized GEOS-Chem modeling.
In the SW-type (NW-type) synoptic situation, affected by the southerly (northerly) airflow, pollutants over southern (northern) China could be transmitted to central China, with the transport contribution of 7.6 %/37 %. Under A-type (C-type) weather, affected by stable weather conditions (high relative humidity), the pollution processes are less affected by the emission sources from non-local regions, and the local emission sources dominate the contribution of 82 % (85 %) to PM2.5.
By only reducing SO2 and NOx emission and not controlling NH3, due to the competition mechanism between nitrate and sulfate, the concentrations of sulfate and ammonium decrease, but the concentration of nitrate increases instead. The enhanced nitrate counteracts the effect of sulfate reduction on PM2.5 mitigation, with a less than 4 % decrease in PM2.5. Even if the NH3 emission is also reduced, the PM2.5 concentration reduction is less than 9 %. By applying the TALL emission reduction scenario, PM2.5 concentrations would decrease significantly, with the improvement rate increased from 9.0 %–15.9 % (by JALL scenario) to 17.4 %–18.8 %.
These results provide an opportunity to effectively mitigate haze pollution via local emission control actions in coordination with regional collaborative actions according to different synoptic patterns. The NW-type synoptic-controlled air pollution episode shows the best effect of joint prevention, followed by the SW type. It is noted that in this study the division of transmission areas is relatively rough, and more accurate source area identification and refined assessment of the emission reduction effect of multiple pollutants from source groups are needed in follow-up studies.
Observational data are obtained from individual sources: the Hubei Environmental Monitoring Central Station (http://sthjt.hubei.gov.cn/, last access: 27 February 2021), the Ministry of Ecology and Environment of China (MEE, http://www.mee.gov.cn/, last access: 27 February 2021), National Centers for Environmental Prediction/National Center for Atmospheric Research (NCEP/NCAR) Final (FNL) Operational Global Analysis data (https://rda.ucar.edu/datasets/ds083.3/, last access: 27 February 2021), and the Hubei Meteorological Information and Technology Support Center (http://hb.cma.gov.cn/qxfw/index.html, last access: 27 February 2021). Model results are available upon request. Model code is available on a collaborative basis.
The supplement related to this article is available online at: https://doi.org/10.5194/acp-21-3143-2021-supplement.
YY and SK conceived and designed the research. YY performed the data processing, model simulations, and analyses. YZ assisted in the circulation classification. JW provided the emission data over central China. SK, TZ, and DL contributed the funding acquisition. YY wrote the paper with input from all authors.
The authors declare that they have no conflict of interest.
We acknowledge the free use of observational PM2.5 data from Hubei Environmental Monitoring Central Station (http://sthjt.hubei.gov.cn/, last access: 27 February 2021) and the Ministry of Ecology and Environment of China (MEE, http://www.mee.gov.cn/, last access: 27 February 2021) and the use of meteorological data from the National Centers for Environmental Prediction/National Center for Atmospheric Research (NCEP/NCAR) Final (FNL) Operational Global Analysis data (https://rda.ucar.edu/datasets/ds083.3/, last access: 27 February 2021) and the Hubei Meteorological Information and Technology Support Center (http://hb.cma.gov.cn/qxfw/index.html, last access: 27 February 2021).
This study was financially supported by the National Natural Science Foundation of China (grant nos. 41830965, 41775115, and 41905112), the Key Program of Ministry of Science and Technology of the People's Republic of China (grant nos. 2017YFC0212602 and 2016YFA0602002), the Key Program for Technical Innovation of Hubei Province (grant no. 2017ACA089), the Program for Environmental Protection in Hubei Province (grant no. 2017HB11), and the China Postdoctoral Science Foundation (grant no. 258572). The research was also funded by the Fundamental Research Funds for the Central Universities, China University of Geosciences (Wuhan) (grant nos. G1323519230, 201616, 26420180020, and CUG190609), and the Start-up Foundation for Advanced Talents (grant no. 162301182756).
This paper was edited by Pedro Jimenez-Guerrero and reviewed by two anonymous referees.
Agarwal, N. K., Sharma, P., and Agarwal, S. K.: Particulate matter air pollution and cardiovascular disease, Med. Sci., 21, 270–279, 2017.
An, Z., Huang, R. J., Zhang, R., Tie, X., Li, G., Cao, J., Zhou, W., Shi, Z., Han, Y., Gu, Z., and Ji, Y.: Severe haze in northern China: A synergy of anthropogenic emissions and atmospheric processes, P. Natl. Acad. Sci. USA, 116, 8657–8666, https://doi.org/10.1073/pnas.1900125116, 2019.
Bai, Z., Winiwarter, W., Klimont, Z., Velthof, G., Misselbrook, T., Zhao, Z., Jin, X., Oenema, O., Hu, C., and Ma, L.: Further Improvement of Air Quality in China Needs Clear Ammonia Mitigation Target, Environ. Sci. Technol., 53, 10542–10544, https://doi.org/10.1021/acs.est.9b04725, 2019.
Bei, N., Zhao, L., Xiao, B., Meng, N., and Feng, T.: Impacts of local circulations on the wintertime air pollution in the Guanzhong Basin, China, Sci. Total Environ., 592, 373–390, https://doi.org/10.1016/j.scitotenv.2017.02.151, 2017.
Bi, X., Dai, Q., Wu, J., Zhang, Q., Zhang, W., Luo, R., Cheng, Y., Zhang, J., Wang, L., Yu, Z., Zhang, Y., Tian, Y., and Feng, Y.: Characteristics of the main primary source profiles of particulate matter across China from 1987 to 2017, Atmos. Chem. Phys., 19, 3223–3243, https://doi.org/10.5194/acp-19-3223-2019, 2019.
Cao, J.-J., Shen, Z.-X., Chow, J. C., Watson, J. G., Lee, S.-C., Tie, X.-X., Ho, K.-F., Wang, G.-H., and Han, Y.-M.: Winter and Summer PM2.5 Chemical Compositions in Fourteen Chinese Cities, J. Air Waste Ma., 62, 1214–1226, https://doi.org/10.1080/10962247.2012.701193, 2012.
Chang, W. and Zhan, J.: The association of weather patterns with haze episodes: Recognition by PM2.5 oriented circulation classification applied in Xiamen, Southeastern China, Atmos. Res., 197, 425–436, https://doi.org/10.1016/j.atmosres.2017.07.024, 2017.
Cheng, J., Su, J., Cui, T., Li, X., Dong, X., Sun, F., Yang, Y., Tong, D., Zheng, Y., Li, Y., Li, J., Zhang, Q., and He, K.: Dominant role of emission reduction in PM2.5 air quality improvement in Beijing during 2013–2017: a model-based decomposition analysis, Atmos. Chem. Phys., 19, 6125–6146, https://doi.org/10.5194/acp-19-6125-2019, 2019.
Cheng, Z., Luo, L., Wang, S., Wang, Y., Sharma, S., Shimadera, H., Wang, X., Bressi, M., de Miranda, R. M., Jiang, J., Zhou, W., Fajardo, O., Yan, N., and Hao, J.: Status and characteristics of ambient PM2.5 pollution in global megacities, Environ. Int., 89/90, 212–221, https://doi.org/10.1016/j.envint.2016.02.003, 2016.
Chuang, M. T., Chiang, P. C., Chan, C. C., Wang, C. F., Chang, E. E., and Lee, C. T.: The effects of synoptical weather pattern and complex terrain on the formation of aerosol events in the Greater Taipei area, Sci. Total Environ., 399, 128–146, https://doi.org/10.1016/j.scitotenv.2008.01.051, 2008.
Dai, H., Zhu, J., Liao, H., Li, J., Liang, M., Yang, Y., and Yue, X.: Co-occurrence of ozone and PM2.5 pollution in the Yangtze River Delta over 2013–2019: Spatiotemporal distribution and meteorological conditions, Atmos. Res., 249, 105363, https://doi.org/10.1016/j.atmosres.2020.105363, 2021.
Ding, A., Huang, X., Nie, W., Chi, X., Xu, Z., Zheng, L., Xu, Z., Xie, Y., Qi, X., Shen, Y., Sun, P., Wang, J., Wang, L., Sun, J., Yang, X.-Q., Qin, W., Zhang, X., Cheng, W., Liu, W., Pan, L., and Fu, C.: Significant reduction of PM2.5 in eastern China due to regional-scale emission control: evidence from SORPES in 2011–2018, Atmos. Chem. Phys., 19, 11791–11801, https://doi.org/10.5194/acp-19-11791-2019, 2019.
Fu, X., Wang, S., Xing, J., Zhang, X., Wang, T., and Hao, J.: Increasing Ammonia Concentrations Reduce the Effectiveness of Particle Pollution Control Achieved via SO2 and NOX Emissions Reduction in East China, Environ. Sci. Technol. Lett., 4, 221–227, https://doi.org/10.1021/acs.estlett.7b00143, 2017.
Geng, G., Xiao, Q., Zheng, Y., Tong, D., Zhang, Y., Zhang, X., Zhang, Q., He, K., and Liu, Y.: Impact of China's Air Pollution Prevention and Control Action Plan on PM2.5 chemical composition over eastern China, Science China-Earth Sciences, 62, 1872–1884, https://doi.org/10.1007/s11430-018-9353-x, 2019.
Gong, W., Zhang, T., Zhu, Z., Ma, Y., Ma, X., and Wang, W.: Characteristics of PM1.0, PM2.5, and PM10, and Their Relation to Black Carbon in Wuhan, Central China, Atmosphere, 6, 1377–1387, https://doi.org/10.3390/atmos6091377, 2015.
Guo, L., Guo, X., Fang, C., and Zhu, S.: Observation analysis on characteristics of formation, evolution and transition of a long-lasting severe fog and haze episode in North China, Science China-Earth Sciences, 58, 329–344, https://doi.org/10.1007/s11430-014-4924-2, 2015.
He, J., Gong, S., Zhou, C., Lu, S., Wu, L., Chen, Y., Yu, Y., Zhao, S., Yu, L., and Yin, C.: Analyses of winter circulation types and their impacts on haze pollution in Beijing, Atmos. Environ., 192, 94–103, https://doi.org/10.1016/j.atmosenv.2018.08.060, 2018.
Huang, R. J., Zhang, Y., Bozzetti, C., Ho, K. F., Cao, J. J., Han, Y., Daellenbach, K. R., Slowik, J. G., Platt, S. M., Canonaco, F., Zotter, P., Wolf, R., Pieber, S. M., Bruns, E. A., Crippa, M., Ciarelli, G., Piazzalunga, A., Schwikowski, M., Abbaszade, G., Schnelle-Kreis, J., Zimmermann, R., An, Z., Szidat, S., Baltensperger, U., El Haddad, I., and Prevot, A. S. H.: High secondary aerosol contribution to particulate pollution during haze events in China, Nature, 514, 218–222, https://doi.org/10.1038/nature13774, 2014.
Huang, W., Cao, J., Tao, Y., Dai, L., Lu, S.-E., Hou, B., Wang, Z., and Zhu, T.: Seasonal Variation of Chemical Species Associated With Short-Term Mortality Effects of PM2.5 in Xi'an, a Central City in China, Am. J. Epidemiol., 175, 556–566, https://doi.org/10.1093/aje/kwr342, 2012.
Huang, X., Ding, A., Gao, J., Zheng, B., Zhou, D., Qi, X., Tang, R., Wang, J., Ren, C., Nie, W., Chi, X., Xu, Z., Chen, L., Li, Y., Che, F., Pang, N., Wang, H., Tong, D., Qin, W., Cheng, W., Liu, W., Fu, Q., Liu, B., Chai, F., Davis, S. J., Zhang, Q., and He, K.: Enhanced secondary pollution offset reduction of primary emissions during COVID-19 lockdown in China, Natl. Sci. Rev., 8, 137, https://doi.org/10.1093/nsr/nwaa137, 2020.
Jenkinson, A. F. and Collison, F. P.: An initial climatology of gales over the North Sea. Synoptic Climatology Branch Memorandum, Bracknell Meteorological Office, 62, 1–18, 1977.
Kurita, H., Sasaki, K., Muroga, H., Ueda, H., and Wakamatsu, S.: Long-range transport of air pollution under light gradient wind conditions, J. Clim. Appl. Meteorol., 24, 425–434, https://doi.org/10.1175/1520-0450(1985)024<0425:lrtoap>2.0.co;2, 1985.
Lamb, H. H.: Types and spells of weather around the year in the British Isles, Q. J. Roy. Meteor. Soc., 76, 393–438, 1950.
Leung, D. M., Tai, A. P. K., Mickley, L. J., Moch, J. M., van Donkelaar, A., Shen, L., and Martin, R. V.: Synoptic meteorological modes of variability for fine particulate matter (PM2.5) air quality in major metropolitan regions of China, Atmos. Chem. Phys., 18, 6733–6748, https://doi.org/10.5194/acp-18-6733-2018, 2018.
Li, J., Liao, H., Hu, J., and Li, N.: Severe particulate pollution days in China during 2013–2018 and the associated typical weather patterns in Beijing-Tianjin-Hebei and the Yangtze River Delta regions, Environ. Pollut., 248, 74–81, https://doi.org/10.1016/j.envpol.2019.01.124, 2019.
Li, M., Zhang, Q., Kurokawa, J.-I., Woo, J.-H., He, K., Lu, Z., Ohara, T., Song, Y., Streets, D. G., Carmichael, G. R., Cheng, Y., Hong, C., Huo, H., Jiang, X., Kang, S., Liu, F., Su, H., and Zheng, B.: MIX: a mosaic Asian anthropogenic emission inventory under the international collaboration framework of the MICS-Asia and HTAP, Atmos. Chem. Phys., 17, 935–963, https://doi.org/10.5194/acp-17-935-2017, 2017a.
Li, X., Zhang, Q., Zhang, Y., Zhang, L., Wang, Y., Zhang, Q., Li, M., Zheng, Y., Geng, G., Wallington, T. J., Han, W., Shen, W., and He, K.: Attribution of PM2.5 exposure in Beijing-Tianjin-Hebei region to emissions: implication to control strategies, Sci. Bull., 62, 957–964, https://doi.org/10.1016/j.scib.2017.06.005, 2017b.
Li, Z., Guo, J., Ding, A., Liao, H., Liu, J., Sun, Y., Wang, T., Xue, H., Zhang, H., and Zhu, B.: Aerosol and boundary-layer interactions and impact on air quality, Natl. Sci. Rev., 4, 810–833, https://doi.org/10.1093/nsr/nwx117, 2017c.
Liao, Z., Gao, M., Sun, J., and Fan, S.: The impact of synoptic circulation on air quality and pollution-related human health in the Yangtze River Delta region, Sci. Total Environ., 607, 838–846, https://doi.org/10.1016/j.scitotenv.2017.07.031, 2017.
Liao, Z., Xie, J., Fang, X., Wang, Y., Zhang, Y., Xu, X., and Fan, S.: Modulation of synoptic circulation to dry season PM2.5 pollution over the Pearl River Delta region: An investigation based on self-organizing maps, Atmos. Environ., 230, 117482, https://doi.org/10.1016/j.atmosenv.2020.117482, 2020.
Lin, Y., Zou, J., Yang, W., and Li, C. Q.: A Review of Recent Advances in Research on PM2.5 in China, Int. J. Env. Res. Pub. He., 15, 438, https://doi.org/10.3390/ijerph15030438, 2018.
Liu, M., Huang, X., Song, Y., Tang, J., Cao, J., Zhang, X., Zhang, Q., Wang, S., Xu, T., Kang, L., Cai, X., Zhang, H., Yang, F., Wang, H., Yu, J. Z., Lau, A. K. H., He, L., Huang, X., Duan, L., Ding, A., Xue, L., Gao, J., Liu, B., and Zhu, T.: Ammonia emission control in China would mitigate haze pollution and nitrogen deposition, but worsen acid rain, P. Natl. Acad. Sci. USA, 116, 7760–7765, https://doi.org/10.1073/pnas.1814880116, 2019.
Liu, Z., Gao, W., Yu, Y., Hu, B., Xin, J., Sun, Y., Wang, L., Wang, G., Bi, X., Zhang, G., Xu, H., Cong, Z., He, J., Xu, J., and Wang, Y.: Characteristics of PM2.5 mass concentrations and chemical species in urban and background areas of China: emerging results from the CARE-China network, Atmos. Chem. Phys., 18, 8849–8871, https://doi.org/10.5194/acp-18-8849-2018, 2018.
Luo, Y., Zhou, X., Zhang, J., Xiao, Y., Wang, Z., Zhou, Y., and Wang, W.: PM2.5 pollution in a petrochemical industry city of northern China: Seasonal variation and source apportionment, Atmos. Res., 212, 285–295, https://doi.org/10.1016/j.atmosres.2018.05.029, 2018.
Mao, J., Jacob, D. J., Evans, M. J., Olson, J. R., Ren, X., Brune, W. H., Clair, J. M. St., Crounse, J. D., Spencer, K. M., Beaver, M. R., Wennberg, P. O., Cubison, M. J., Jimenez, J. L., Fried, A., Weibring, P., Walega, J. G., Hall, S. R., Weinheimer, A. J., Cohen, R. C., Chen, G., Crawford, J. H., McNaughton, C., Clarke, A. D., Jaeglé, L., Fisher, J. A., Yantosca, R. M., Le Sager, P., and Carouge, C.: Chemistry of hydrogen oxide radicals (HOx) in the Arctic troposphere in spring, Atmos. Chem. Phys., 10, 5823–5838, https://doi.org/10.5194/acp-10-5823-2010, 2010.
Miao, Y., Guo, J., Liu, S., Liu, H., Li, Z., Zhang, W., and Zhai, P.: Classification of summertime synoptic patterns in Beijing and their associations with boundary layer structure affecting aerosol pollution, Atmos. Chem. Phys., 17, 3097–3110, https://doi.org/10.5194/acp-17-3097-2017, 2017.
Ning, G., Wang, S., Yim, S. H. L., Li, J., Hu, Y., Shang, Z., Wang, J., and Wang, J.: Impact of low-pressure systems on winter heavy air pollution in the northwest Sichuan Basin, China, Atmos. Chem. Phys., 18, 13601–13615, https://doi.org/10.5194/acp-18-13601-2018, 2018.
Philipp, A., Beck, C., Huth, R., and Jacobeit, J.: Development and comparison of circulation type classifications using the COST 733 dataset and software, Int. J. Climatol., 36, 2673–2691, https://doi.org/10.1002/joc.3920, 2016.
Pope, R. J., Savage, N. H., Chipperfield, M. P., Arnold, S. R., and Osborn, T. J.: The influence of synoptic weather regimes on UK air quality: analysis of satellite column NO2, Atmos. Sci. Lett., 15, 211–217, https://doi.org/10.1002/asl2.492, 2014.
Pope, R. J., Savage, N. H., Chipperfield, M. P., Ordóñez, C., and Neal, L. S.: The influence of synoptic weather regimes on UK air quality: regional model studies of tropospheric column NO2, Atmos. Chem. Phys., 15, 11201–11215, https://doi.org/10.5194/acp-15-11201-2015, 2015.
Russo, A., Trigo, R. M., Martins, H., and Mendes, M. T.: NO2, PM10 and O3 urban concentrations and its association with circulation weather types in Portugal, Atmos. Environ., 89, 768–785, https://doi.org/10.1016/j.atmosenv.2014.02.010, 2014.
Santurtun, A., Carlos Gonzalez-Hidalgo, J., Sanchez-Lorenzo, A., and Teresa Zarrabeitia, M.: Surface ozone concentration trends and its relationship with weather types in Spain (2001–2010), Atmos. Environ., 101, 10–22, https://doi.org/10.1016/j.atmosenv.2014.11.005, 2015.
Shu, L., Xie, M., Gao, D., Wang, T., Fang, D., Liu, Q., Huang, A., and Peng, L.: Regional severe particle pollution and its association with synoptic weather patterns in the Yangtze River Delta region, China, Atmos. Chem. Phys., 17, 12871–12891, https://doi.org/10.5194/acp-17-12871-2017, 2017.
Sun, Y., Niu, T., He, J., Ma, Z., Liu, P., Xiao, D., Hu, J., Yang, J., and Yan, X.: Classification of circulation patterns during the formation and dissipation of continuous pollution weather over the Sichuan Basin, China, Atmos. Environ., 223, 117244, https://doi.org/10.1016/j.atmosenv.2019.117244, 2020.
Sun, Y. L., Chen, C., Zhang, Y. J., Xu, W. Q., Zhou, L. B., Cheng, X. L., Zheng, H. T., Ji, D. S., Li, J., Tang, X., Fu, P. Q., and Wang, Z. F.: Rapid formation and evolution of an extreme haze episode in Northern China during winter 2015, Sci. Rep., 6, 27151, https://doi.org/10.1038/srep27151, 2016.
The People's Government of Beijing Municipality (PGBM): Emergency plan for severe air pollution in Beijing, available at: http://www.beijing.gov.cn/zhengce/zhengcefagui/201905/t20190522_61613.html (last access: 14 July 2018), 2018 (in Chinese).
The People's Government of Guangdong Province (PGGP): Emergency plan for severe air pollution in Pearl River Delta, available at: http://www.gd.gov.cn/gkmlpt/content/0/142/post_142657.html (last access: 14 July 2018), 2014 (in Chinese).
The People's Government of Shanghai Municipality (PGSM): Special emergency plan for heavy air pollution in Shanghai, available at: http://www.shanghai.gov.cn/nw2/nw2314/nw2319/nw31973/nw32019/nw32022/nw32023/u21aw1316153.html (last access: 14 July 2018), 2018 (in Chinese).
The State Council of the People's Republic of China (SCPPC): The Thirteenth Five-Year Plan for Energy Saving and Emission Reduction, available at: http://www.gov.cn/gongbao/content/2017/content_5163448.html (last access: 14 July 2018), 2016 (in Chinese).
Tian, S. L., Pan, Y. P., and Wang, Y. S.: Size-resolved source apportionment of particulate matter in urban Beijing during haze and non-haze episodes, Atmos. Chem. Phys., 16, 1–19, https://doi.org/10.5194/acp-16-1-2016, 2016.
Trigo, R. M. and DaCamara, C. C.: Circulation weather types and their influence on the precipitation regime in Portugal, Int. J. Climatol., 20, 1559–1581, https://doi.org/10.1002/1097-0088(20001115)20:13<1559::aid-joc555>3.0.co;2-5, 2000.
Twohy, C. H., Coakley Jr., J. A., and Tahnk, W. R.: Effect of changes in relative humidity on aerosol scattering near clouds, J. Geophys. Res.-Atmos., 114, D05205, https://doi.org/10.1029/2008jd010991, 2009.
Wang, H. L., Qiao, L. P., Lou, S. R., Zhou, M., Ding, A. J., Huang, H. Y., Chen, J. M., Wang, Q., Tao, S., Chen, C. H., Li, L., and Huang, C.: Chemical composition of PM2.5 and meteorological impact among three years in urban Shanghai, China, J. Clean. Prod., 112, 1302–1311, https://doi.org/10.1016/j.jclepro.2015.04.099, 2016a.
Wang, J., Li, X., Zhang, W., Jiang, N., Zhang, R., and Tang, X.: Secondary PM2.5 in Zhengzhou, China: Chemical Species Based on Three Years of Observations, Aerosol Air Qual. Res., 16, 91–104, https://doi.org/10.4209/aaqr.2015.01.0007, 2016b.
Wang, Q., Fang, J., Shi, W., and Dong, X.: Distribution characteristics and policy-related improvements of PM2.5 and its components in six Chinese cities, Environ. Pollut., 266, 115299, https://doi.org/10.1016/j.envpol.2020.115299, 2020.
Wang, X., Wei, W., Cheng, S., Li, J., Zhang, H., and Lv, Z.: Characteristics and classification of PM2.5 pollution episodes in Beijing from 2013 to 2015, Sci. Total Environ., 612, 170–179, https://doi.org/10.1016/j.scitotenv.2017.08.206, 2018.
Wang, Y., Chen, Y., Wu, Z., Shang, D., Bian, Y., Du, Z., Schmitt, S. H., Su, R., Gkatzelis, G. I., Schlag, P., Hohaus, T., Voliotis, A., Lu, K., Zeng, L., Zhao, C., Alfarra, M. R., McFiggans, G., Wiedensohler, A., Kiendler-Scharr, A., Zhang, Y., and Hu, M.: Mutual promotion between aerosol particle liquid water and particulate nitrate enhancement leads to severe nitrate-dominated particulate matter pollution and low visibility, Atmos. Chem. Phys., 20, 2161–2175, https://doi.org/10.5194/acp-20-2161-2020, 2020.
Wu, J., Kong, S., Wu, F., Cheng, Y., Zheng, S., Yan, Q., Zheng, H., Yang, G., Zheng, M., Liu, D., Zhao, D., and Qi, S.: Estimating the open biomass burning emissions in central and eastern China from 2003 to 2015 based on satellite observation, Atmos. Chem. Phys., 18, 11623–11646, https://doi.org/10.5194/acp-18-11623-2018, 2018.
Xing, J., Ding, D., Wang, S., Zhao, B., Jang, C., Wu, W., Zhang, F., Zhu, Y., and Hao, J.: Quantification of the enhanced effectiveness of NOx control from simultaneous reductions of VOC and NH3 for reducing air pollution in the Beijing–Tianjin–Hebei region, China, Atmos. Chem. Phys., 18, 7799–7814, https://doi.org/10.5194/acp-18-7799-2018, 2018.
Xing, J., Ding, D., Wang, S., Dong, Z., Kelly, J. T., Jang, C., Zhu, Y., and Hao, J.: Development and application of observable response indicators for design of an effective ozone and fine-particle pollution control strategy in China, Atmos. Chem. Phys., 19, 13627–13646, https://doi.org/10.5194/acp-19-13627-2019, 2019.
Xu, G., Jiao, L., Zhang, B., Zhao, S., Yuan, M., Gu, Y., Liu, J., and Tang, X.: Spatial and temporal variability of the PM2.5/PM10 ratio in Wuhan, Central China, Aerosol Air Qual. Res., 17, 741–751, https://doi.org/10.4209/aaqr.2016.09.0406, 2017.
Xu, Q., Wang, S., Jiang, J., Bhattarai, N., Li, X., Chang, X., Qiu, X., Zheng, M., Hua, Y., and Hao, J.: Nitrate dominates the chemical composition of PM2.5 during haze event in Beijing, China, Sci. Total Environ., 689, 1293–1303, https://doi.org/10.1016/j.scitotenv.2019.06.294, 2019.
Xu, Z., Liu, M., Zhang, M., Song, Y., Wang, S., Zhang, L., Xu, T., Wang, T., Yan, C., Zhou, T., Sun, Y., Pan, Y., Hu, M., Zheng, M., and Zhu, T.: High efficiency of livestock ammonia emission controls in alleviating particulate nitrate during a severe winter haze episode in northern China, Atmos. Chem. Phys., 19, 5605–5613, https://doi.org/10.5194/acp-19-5605-2019, 2019.
Yan, Q., Kong, S., Yan, Y., Liu, H., Wang, W., Chen, K., Yin, Y., Zheng, H., Wu, J., Yao, L., Zeng, X., Cheng, Y., Zheng, S., Wu, F., Niu, Z., Zhang, Y., Zheng, M., Zhao, D., Liu, D., and Qi, S.: Emission and simulation of primary fine and submicron particles and water-soluble ions from domestic coal combustion in China, Atmos. Environ., 224, 117308, https://doi.org/10.1016/j.atmosenv.2020.117308, 2020.
Yan, Y., Cabrera-Perez, D., Lin, J., Pozzer, A., Hu, L., Millet, D. B., Porter, W. C., and Lelieveld, J.: Global tropospheric effects of aromatic chemistry with the SAPRC-11 mechanism implemented in GEOS-Chem version 9-02, Geosci. Model Dev., 12, 111–130, https://doi.org/10.5194/gmd-12-111-2019, 2019.
Yan, Y.-Y., Lin, J.-T., Kuang, Y., Yang, D., and Zhang, L.: Tropospheric carbon monoxide over the Pacific during HIPPO: two-way coupled simulation of GEOS-Chem and its multiple nested models, Atmos. Chem. Phys., 14, 12649–12663, https://doi.org/10.5194/acp-14-12649-2014, 2014.
Yang, Y., Zheng, X., Gao, Z., Wang, H., Wang, T., Li, Y., Lau, G. N. C., and Yim, S. H. L.: Long-term trends of persistent synoptic circulation events in planetary boundary layer and their relationships with haze pollution in winter half year over Eastern China, J. Geophys. Res.-Atmos., 123, 10991–11007, https://doi.org/10.1029/2018jd028982, 2018.
Ye, Z., Guo, X., Cheng, L., Cheng, S., Chen, D., Wang, W., and Liu, B.: Reducing PM2.5 and secondary inorganic aerosols by agricultural ammonia emission mitigation within the Beijing-Tianjin-Hebei region, China, Atmos. Environ., 219, 116989, https://doi.org/10.1016/j.atmosenv.2019.116989, 2019.
Yu, C., Zhao, T., Bai, Y., Zhang, L., Kong, S., Yu, X., He, J., Cui, C., Yang, J., You, Y., Ma, G., Wu, M., and Chang, J.: Heavy air pollution with a unique “non-stagnant” atmospheric boundary layer in the Yangtze River middle basin aggravated by regional transport of PM2.5 over China, Atmos. Chem. Phys., 20, 7217–7230, https://doi.org/10.5194/acp-20-7217-2020, 2020.
Zhang, J. P., Zhu, T., Zhang, Q. H., Li, C. C., Shu, H. L., Ying, Y., Dai, Z. P., Wang, X., Liu, X. Y., Liang, A. M., Shen, H. X., and Yi, B. Q.: The impact of circulation patterns on regional transport pathways and air quality over Beijing and its surroundings, Atmos. Chem. Phys., 12, 5031–5053, https://doi.org/10.5194/acp-12-5031-2012, 2012.
Zhang, Q., Jiang, X., Tong, D., Davis, S. J., Zhao, H., Geng, G., Feng, T., Zheng, B., Lu, Z., Streets, D. G., Ni, R., Brauer, M., van Donkelaar, A., Martin, R. V., Huo, H., Liu, Z., Pan, D., Kan, H., Yan, Y., Lin, J., He, K., and Guan, D.: Transboundary health impacts of transported global air pollution and international trade, Nature, 543, 705–709, https://doi.org/10.1038/nature21712, 2017.
Zhang, Q., Zheng, Y., Tong, D., Shao, M., Wang, S., Zhang, Y., Xu, X., Wang, J., He, H., Liu, W., Ding, Y., Lei, Y., Li, J., Wang, Z., Zhang, X., Wang, Y., Cheng, J., Liu, Y., Shi, Q., Yan, L., Geng, G., Hong, C., Li, M., Liu, F., Zheng, B., Cao, J., Ding, A., Gao, J., Fu, Q., Huo, J., Liu, B., Liu, Z., Yang, F., He, K., and Hao, J.: Drivers of improved PM2.5 air quality in China from 2013 to 2017, P. Natl. Acad. Sci. USA, 116, 24463–24469, https://doi.org/10.1073/pnas.1907956116, 2019.
Zhang, T., Cao, J. J., Tie, X. X., Shen, Z. X., Liu, S. X., Ding, H., Han, Y. M., Wang, G. H., Ho, K. F., Qiang, J., and Li, W. T.: Water-soluble ions in atmospheric aerosols measured in Xi'an, China: Seasonal variations and sources, Atmos. Res., 102, 110–119, https://doi.org/10.1016/j.atmosres.2011.06.014, 2011.
Zheng, B., Tong, D., Li, M., Liu, F., Hong, C., Geng, G., Li, H., Li, X., Peng, L., Qi, J., Yan, L., Zhang, Y., Zhao, H., Zheng, Y., He, K., and Zhang, Q.: Trends in China's anthropogenic emissions since 2010 as the consequence of clean air actions, Atmos. Chem. Phys., 18, 14095–14111, https://doi.org/10.5194/acp-18-14095-2018, 2018.
Zheng, H., Kong, S., Wu, F., Cheng, Y., Niu, Z., Zheng, S., Yang, G., Yao, L., Yan, Q., Wu, J., Zheng, M., Chen, N., Xu, K., Yan, Y., Liu, D., Zhao, D., Zhao, T., Bai, Y., Li, S., and Qi, S.: Intra-regional transport of black carbon between the south edge of the North China Plain and central China during winter haze episodes, Atmos. Chem. Phys., 19, 4499–4516, https://doi.org/10.5194/acp-19-4499-2019, 2019.
Zheng, J., Hu, M., Peng, J., Wu, Z., Kumar, P., Li, M., Wang, Y., and Guo, S.: Spatial distributions and chemical properties of PM2.5 based on 21 field campaigns at 17 sites in China, Chemosphere, 159, 480–487, https://doi.org/10.1016/j.chemosphere.2016.06.032, 2016.
Zheng, M., Wang, Y., Bao, J., Yuan, L., Zheng, H., Yan, Y., Liu, D., Xie, M., and Kong, S.: Initial Cost Barrier of Ammonia Control in Central China, Geophys. Res. Lett., 46, 14175–14184, https://doi.org/10.1029/2019gl084351, 2019.
Zheng, X. Y., Fu, Y. F., Yang, Y. J., and Liu, G. S.: Impact of atmospheric circulations on aerosol distributions in autumn over eastern China: observational evidence, Atmos. Chem. Phys., 15, 12115–12138, https://doi.org/10.5194/acp-15-12115-2015, 2015.
Zhong, J., Zhang, X., Dong, Y., Wang, Y., Liu, C., Wang, J., Zhang, Y., and Che, H.: Feedback effects of boundary-layer meteorological factors on cumulative explosive growth of PM2.5 during winter heavy pollution episodes in Beijing from 2013 to 2016, Atmos. Chem. Phys., 18, 247–258, https://doi.org/10.5194/acp-18-247-2018, 2018.