the Creative Commons Attribution 4.0 License.
the Creative Commons Attribution 4.0 License.
 | 12 Jan 2021
Satellite-based radiative forcing by light-absorbing particles in snow across the Northern Hemisphere
Jiecan Cui
Tenglong Shi
Dongyou Wu
Snow is the most reflective natural surface on Earth and consequently plays an important role in Earth's climate. Light-absorbing particles (LAPs) deposited on the snow surface can effectively decrease snow albedo, resulting in positive radiative forcing. In this study, we used remote-sensing data from NASA's Moderate Resolution Imaging Spectroradiometer (MODIS) and the Snow, Ice, and Aerosol Radiative (SNICAR) model to quantify the reduction in snow albedo due to LAPs before validating and correcting the data against in situ observations. We then incorporated these corrected albedo-reduction data in the Santa Barbara DISORT (Discrete Ordinate Radiative Transfer) Atmospheric Radiative Transfer (SBDART) model to estimate Northern Hemisphere radiative forcing except for midlatitude mountains in December–May for the period 2003–2018. Our analysis reveals an average corrected reduction in snow albedo () of ∼ 0.021 under all-sky conditions, with daily radiative forcing () values of ∼ 2.9 W m−2, over land areas with complete or near-complete snow cover and with little or no vegetation above the snow in the Northern Hemisphere. We also observed significant spatial variations in and , with the lowest respective values (∼ 0.016 and ∼ 2.6 W m−2) occurring in the Arctic and the highest (∼ 0.11 and ∼ 12 W m−2) in northeastern China. From MODIS retrievals, we determined that the LAP content of snow accounts for 84 % and 70 % of the spatial variability in albedo reduction and radiative forcing, respectively. We also compared retrieved radiative forcing values with those of earlier studies, including local-scale observations, remote-sensing retrievals, and model-based estimates. Ultimately, estimates of radiative forcing based on satellite-retrieved data are shown to represent true conditions on both regional and global scales.
- Article
(7969 KB) - Full-text XML
-
Supplement
(2142 KB) - BibTeX
- EndNote


Seasonal snow cover affects 30 % of Earth's land surface and exerts a cooling influence on global climate through its direct interaction with the surface radiance budget (Painter et al., 1998; Flanner et al., 2011). However, snow surface darkening due to light-absorbing particles (LAPs) such as black carbon (BC), organic carbon (OC), dust, and algae can significantly alter the reflective properties of snow (Warren, 1982, 1984; Hadley and Kirchstetter, 2012). When deposited on the snow surface, LAPs increase the absorption of solar radiation (Painter et al., 2012a; Liou et al., 2014; Wang et al., 2014, 2019; Dang et al., 2017), thereby reducing the snow albedo (Warren and Brandt, 2008; Kaspari et al., 2014). As a result, radiative forcing of LAPs in snow (RFLS) plays a critical role in snow-cover decline on both regional and global scales (Wiscombe and Warren, 1980), perturbing the climate system and impacting hydrological cycles (Barnett et al., 2005; Qian et al., 2011).
One of the primary LAPs, BC, is derived from the incomplete combustion of fossil fuels and biomass (Bond et al., 2013; Dang et al., 2015) and is second only to CO2 in its contribution to climate forcing (Hansen and Nazarenko, 2004; Ramanathan and Carmichael, 2008; Bond et al., 2013). Yet, despite considerable efforts to measure the BC content of Northern Hemisphere snow and ice (Doherty et al., 2010, 2014; Huang et al., 2011; Ye et al., 2012; Wang et al., 2013, 2017; Shi et al., 2020), the inherent challenges presented by a temporospatially variable snow cover mean our understanding of LAPs in snow is far from complete. As a result, persistent uncertainties remain in regional- and global-scale RFLS estimates based on field measurements (Zhao et al., 2014).
Several previous investigations have utilized numerical models to estimate RFLS, including that of Hansen and Nazarenko (2004), who concluded that BC in snow and ice exerts a positive climate forcing throughout the Northern Hemisphere of +0.3 W m−2, explaining approximately one-fourth of observed global warming. More recently, Flanner et al. (2007) employed an aerosol–chemical-transport general-circulation model, coupled with the Snow, Ice, and Aerosol Radiative (SNICAR) model (Flanner et al., 2007, 2009), to estimate globally averaged radiative forcing values of +0.054 (range of 0.007–0.13) and +0.049 (0.007–0.12) W m−2 for a strong (1998) and weak (2001) boreal fire years, respectively. Using the Weather Research and Forecasting (WRF) model (Skamarock et al., 2008) coupled with a chemistry component (Chem) (Grell et al., 2005) and SNICAR modeling, Zhao et al. (2014) demonstrated that RFLS over northern China in January–February 2010 was ∼ 10 W m−2. However, despite their potentially valuable contribution, climate models contain significant uncertainties in representations of LAP emissions, transport, deposition, and post-depositional processes that can propagate into simulations of LAP concentrations and their climate forcing (Qian et al., 2015; Lee et al., 2016). Zhao et al. (2014) also confirmed that, relative to observational data, modeled LAPs and radiative forcing estimates exhibit biases that are difficult to explain and quantify. These shortcomings underscore the need for a refined approach to estimating real-time RFLS that minimizes the mismatch between field observations and model simulations.
In addition to modeling, remote sensing has been used to assess the physical characteristics of snow cover (Nolin and Dozier, 1993, 2000; Painter et al., 2009, 2012a, 2013; Miller et al., 2016). Nolin and Dozier (2000), for example, retrieved grain size data from satellite-derived reflectance at near-infrared (NIR) wavelengths following the rationale that snow-grain size, in conjunction with solar zenith angle, dictates the path length of penetrating photons (Wiscombe and Warren, 1980) and thus influences albedo in the NIR. Similarly, recent studies have attempted to employ satellite-derived snow albedo at visible (VIS) wavelengths to retrieve RFLS data (Seidel et al., 2016; Pu et al., 2019). Briefly, this retrieval method exploits the imaginary component of the complex refractive index for ice (Kice), which is very low at VIS wavelengths and results in the extremely high VIS albedo for pure snow. In contrast, the imaginary component of the complex refractive index for LAPs (KLAPs) at VIS wavelengths is orders of magnitude greater, resulting in the reduction in VIS snow albedo (Wiscombe and Warren, 1980). Moreover, albedo variability at VIS wavelengths is dominated by even minor concentrations of LAPs (Brandt et al., 2011; Painter et al., 2012b).
Painter et al. (2012a) employed surface-reflectance data provided by NASA's Moderate Resolution Imaging Spectroradiometer (MODIS) for the upper Colorado River basin and Hindu Kush Himalaya (HKH) to make the first quantitative, remote-sensing-based retrievals of instantaneous surface radiative forcing (RF) due to LAPs. Relative to the Western Energy Balance of Snow (WEBS) network (Painter et al., 2007), that study established that MODIS-derived radiative forcing exhibits a positive bias at lower RF values and a slightly negative bias at higher values. A more recent study by Seidel et al. (2016) used remote sensing to constrain instantaneous melt-season RFLS values of 20–200 W m−2 for the Sierra Nevada and Rocky Mountains, while Pu et al. (2019) reported MODIS-derived values of 22–65 W m−2 for northern China in January–February (regional average of ∼ 45 W m−2). Acknowledging this demonstrated efficacy of remote-sensing retrievals for establishing RFLS on regional scales, we note that this approach has so far not captured spatial variability in RFLS on a global scale.
In this study, we employed MODIS data to determine the reduction in the Northern Hemisphere snow albedo due to LAPs. Retrievals were validated and corrected according to ground-based snow observations, after which spatial variability in albedo reduction and radiative forcing over mapped snow-covered area in the Northern Hemisphere was assessed quantitatively. Finally, we compared our satellite-derived radiative forcing values with the modeling results of CESM2 (Eyring et al., 2016; Danabasoglu et al., 2020). Despite the persistence of non-negligible uncertainties and biases, our satellite-based retrievals constitute the first hemisphere-scale assessment of RFLS and provide valuable information for improving climate model simulations.
2.1 Remote-sensing data
To investigate the impact of LAPs on snow albedo, we utilized the following MODIS data sets: surface albedo (MCD43C3; 0.05∘ × 0.05∘ resolution), snow cover (MYD10C1; 0.05∘ × 0.05∘ resolution), land cover type (MCD12C1; 0.05∘ × 0.05∘ resolution), and atmospheric parameters (MYD08_D3; 1∘ × 1∘ resolution). Each data set corresponds to December–May for the period 2003–2018 (https://earthdata.nasa.gov, last access: 20 January 2019). MCD43C3 is the daily combined MODIS output derived from both the Terra and Aqua satellites and provides black-sky albedo (directional hemispherical reflectance, DHF) and white-sky albedo (bi-hemispherical reflectance, BHF) at local solar noon for bands 1–7 (band 1, 620–670 nm; band 2, 841–876 nm; band 3, 459–479 nm; band 4, 545–565 nm; band 5, 1230–1250 nm; band 6, 1628–1652 nm; band 7, 2105–2155 nm) as well as values for quality control, local noon solar zenith angle, and associated parameters. MCD43C3 observations are weighted to estimate albedo on the ninth day of each 16 d period and have been corrected for the influence of local slope and aspect, atmospheric gases, and aerosols.
Snow-cover data are provided daily by MYD10C1 as a report of the snow-cover fraction (SCF), derived from the Normalized Difference Snow Index (NDSI). MCD12C1 provides a spatially aggregated and reprojected land cover type, which is derived from the supervised classification of MODIS reflectance data, while MODIS MYD08_D3 reports values of solar azimuth angle.
Daily average solar radiances and cloud fraction were obtained from NASA's Clouds and the Earth's Radiant Energy System (CERES: https://ceres.larc.nasa.gov, last access: 12 April 2019), part of the Earth Observing System comprising the Aqua, Terra, and S-NPP satellites. CERES provides instantaneous measurements of solar radiances, which are then converted to daily average flux by angular dependence and empirical diurnal albedo modeling as the satellite passes through the point of descent (Doelling et al., 2013; Su et al., 2015; Loeb et al., 2018). We used the total downward shortwave flux and cloud fraction at the surface, provided by the “CERES Single Scanner Footprint 1.08 (SSF1deg)” product, to estimate daily average RFLS under all-sky conditions.
Shuttle Radar Topography Mission (SRTM) digital elevation data are provided by the US Geological Survey (https://www.usgs.gov/, last access: 9 December 2018) to adjust slope- and aspect-induced changes in surface solar irradiance in complex terrain. The spatial resolution of SRTM data for the Northern Hemisphere is 30 m.
2.2 Snow depth data
Estimates of snow depth were obtained from the European Centre for Medium-Range Weather Forecasts (ECMWF) Interim Reanalysis (ERA-Interim) (https://www.ecmwf.int, last access: 15 January 2019). ERA-Interim is a new generation of reanalysis based on a 12-hourly and four-dimensional variational data assimilation (4D-Var) covering the period 1979–present. ERA-Interim performs better in model physics frameworks, data quality control, and background error criteria than previous versions (Berrisford et al., 2011; Brun et al., 2013). In this study, we used snow-water equivalent (SWE) data for December–May covering the period 2003–2018. These data were generated by forecast models and updated according to a Cressman analysis of snow observations (Drusch et al., 2004; Dee et al., 2011). We note that the previous occurrence of false snow-free patches, arising from the application of Cressman analysis in regions of sparse ground control, has been mitigated by ECMWF upgrades (Dee et al., 2011). Finally, SWE is converted to snow depth by assuming that average December–May snow density is ∼ 300 kg m−3, consistent with snow depth estimates by the Canadian Meteorological Centre (CMC) (Sturm et al., 1995; Brown and Mote, 2009).
2.3 In situ measurements of LAPs in snow
To correct the satellite retrievals, we collected a comprehensive set of in situ measurements of BC concentrations from the field campaigns in the Arctic in spring of 2005–2009 (Doherty et al., 2010); North America in January–March of 2013 (Doherty et al., 2014); northern China in January–February of 2010, 2012, and 2014 (Ye et al., 2012; Wang et al., 2013, 2017). The BC concentrations are measured by the two-sphere integrating-sandwich (TSI) spectrophotometer in the Arctic, North America, and northern China (Grenfell et al., 2011; Wang et al., 2020). Briefly, TSI produces a diffuse radiation field when the white light illumination is transmitted into an integrating sphere; then the diffuse radiation passes through the filter and is detected by a spectrometer. The TSI technique acquires the light attenuation spectrum due to the LAPs loaded on the sample filter (Grenfell et al., 2011). Then, the light attenuation spectrum of the sample filter is transformed into an equivalent BC mass (unit: g cm−2) loading by comparing against the standard filters. The equivalent BC has been defined by Doherty et al. (2010), which briefly as the amount of BC in the snow accounted for the wavelength-integrated total light absorption in the wavelengths of 300–750 nm by all particulate constituents. In this study, we used BCequiv for all LAPs to calculate the in situ snow albedo reduction and radiative forcing (Fig. S3).
2.4 Climate model simulations
We compared our remotely sensed retrievals of daily average RFLS for the 2003–2014 study period with simulated results derived from CESM2 (https://esgf-node.llnl.gov/, last access: 15 July 2019). In this study, we employed simulations of snow BC concentrations derived from the CESM2 historical experiments in conjunction with ERA-Interim SWE, MODIS-retrieved snow grain size, and CERES total downward shortwave flux data under all-sky conditions, to model daily average RFLS for the study period. Simulations were performed using the Snow, Ice, and Aerosol Radiative (SNICAR) and Santa Barbara DISORT (Discrete Ordinate Radiative Transfer) Atmospheric Radiative Transfer (SBDART) models, and the model output was compared with satellite-based retrievals.
3.1 Radiative-transfer model
In this study, we used the Santa Barbara DISORT Atmospheric Radiative Transfer (SBDART) model to calculate spectral surface solar irradiance. Constituting one of the most widely applied models for calculating the atmospheric radiative transfer at Earth's surface, under both clear- and cloudy-sky conditions (Ricchiazzi et al., 1998), SBDART combines a low-resolution atmospheric transmission model, Discrete Ordinate Radiative Transfer (DISORT) module, and Mie scattering output for the scattering of light by ice crystals and water droplets (Stamnes et al., 1988; Fu et al., 2017). Radiative-transfer equations for a vertically inhomogeneous, non-isothermal, plane-parallel atmosphere are integrated numerically using the DISORT module. SBDART comprises multiple standard atmospheric profiles, cloud models, and basic surface types as well as vertical-distribution models for aerosols and gas absorption and enables users to specify these input parameters in real values. In our study, the subarctic and midlatitude winter standard atmospheric conditions are assumed, and the tropospheric and stratospheric background aerosols are archived in SBDART (Tanre et al., 1990). According to Dang et al. (2017), the cloud optical depth at high latitudes and midlatitudes was assumed to be 11 and 20 under cloudy-sky conditions, respectively. The spectral irradiance from SBDART is only used for integrating the spectral MODIS albedo to achieve broadband albedo; thus the uncertainty in solar irradiance from the assumed atmospheric properties has limited influence on the retrieval of radiative forcing (see Sect. 3.2). Average incident direct and diffuse solar spectra for December–May under clear and cloudy skies are shown in Fig. S1.
The Snow, Ice, and Aerosol Radiative (SNICAR) model is a two-stream multiple-scattering radiative-transfer model (Flanner et al., 2007, 2009) that has been used widely both to simulate the albedo, transmission, and vertical absorptivity of LAP-contaminated snowpack and to estimate RFLS (Painter et al., 2012a; Bryant et al., 2013; Miller et al., 2016). SNICAR employs the theory proposed by Wiscombe and Warren (1980) and Toon et al. (1989). Specifically, snow is considered to be composed of aggregated ice grains with optical effective radii (Reff) of 50–1500 µm, lognormal distribution, and spherical grain shape. SNICAR also accounts for the incident radiation at the surface and its spectral distribution, solar zenith angle, snow depth and density, snow layer number, and the type and concentration of LAPs in the snowpack. The model's ability to provide realistic simulations of snow albedo has been verified by several previous studies (Hadley and Kirchstetter, 2012; Meinander et al., 2013; Zhong et al., 2017; Wang et al., 2017).
3.2 Retrieval of quantitative snow properties from remote sensing
The variability in spectral snow albedo depends on the LAP content, grain size, grain shape, and depth of the snowpack, in addition to solar zenith angle. As shown in Fig. 1a, the deposition of BC (as representative of LAPs generally) serves to decrease the albedo of snow significantly, particularly in the ultraviolet (UV) and VIS wavelengths, which account for approximately half of all direct solar irradiance and the majority of diffuse solar irradiance (Fig. S1). In contrast, the impact of BC on albedo is considerably smaller in NIR wavelengths and can be negligible at > ∼ 1150 nm. Snow depth plays a similar role to LAP content and primarily affects albedo in UV and VIS wavelengths (Fig. 1b).
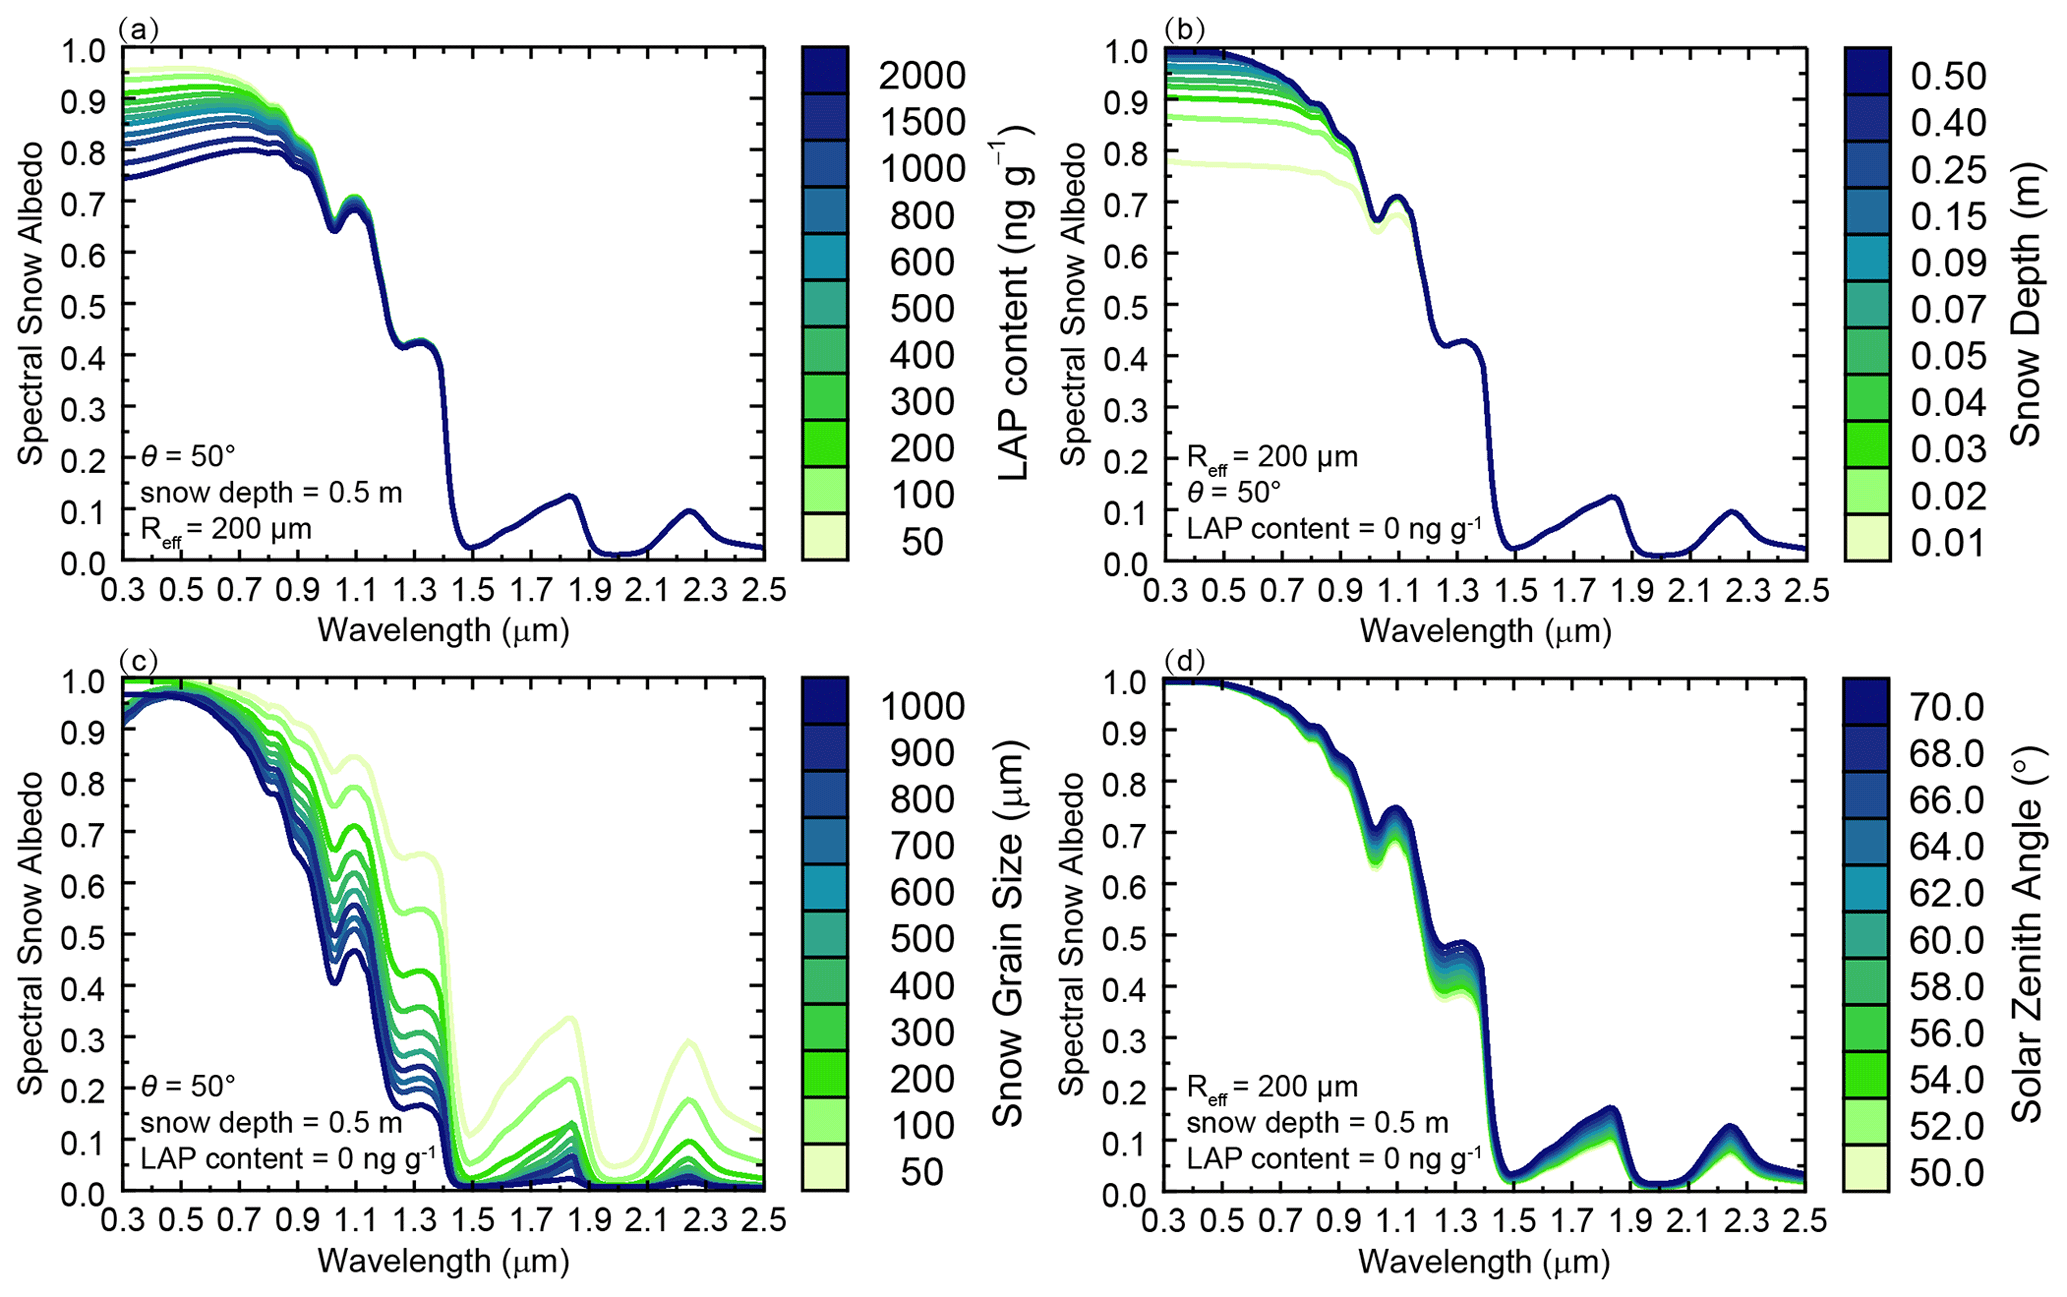
Figure 1Variations in spectral snow albedo due to (a) LAP content (ng g−1), (b) snow depth (m), (c) snow grain size (µm), and (d) solar zenith angle (∘) while the other three parameters are kept constant.
Although snow albedo decreases with snow depth, previous studies have tended to assume a semi-infinite snowpack for which albedo is independent of depth. As a consequence, the role of LAPs in albedo reduction has been overestimated for those areas where the snowpack is thin (Warren, 2013). In this study, we incorporated ERA-Interim SWE data in our SNICAR model simulations to correct for the snow depth overestimation effect. In contrast, snow grain size and solar zenith angle influence the snow albedo chiefly in NIR wavelengths (Fig. 1c, d). Specifically, albedo tends to decrease with increasing snow grain size and declining solar zenith angle. In this study, we derived quantitative snow parameters (grain size, albedo reduction, and RFLS) from MODIS data in conjunction with the SNICAR and SBDART models. The specific workflow for retrieving RFLS from satellite data is shown in Fig. 2.
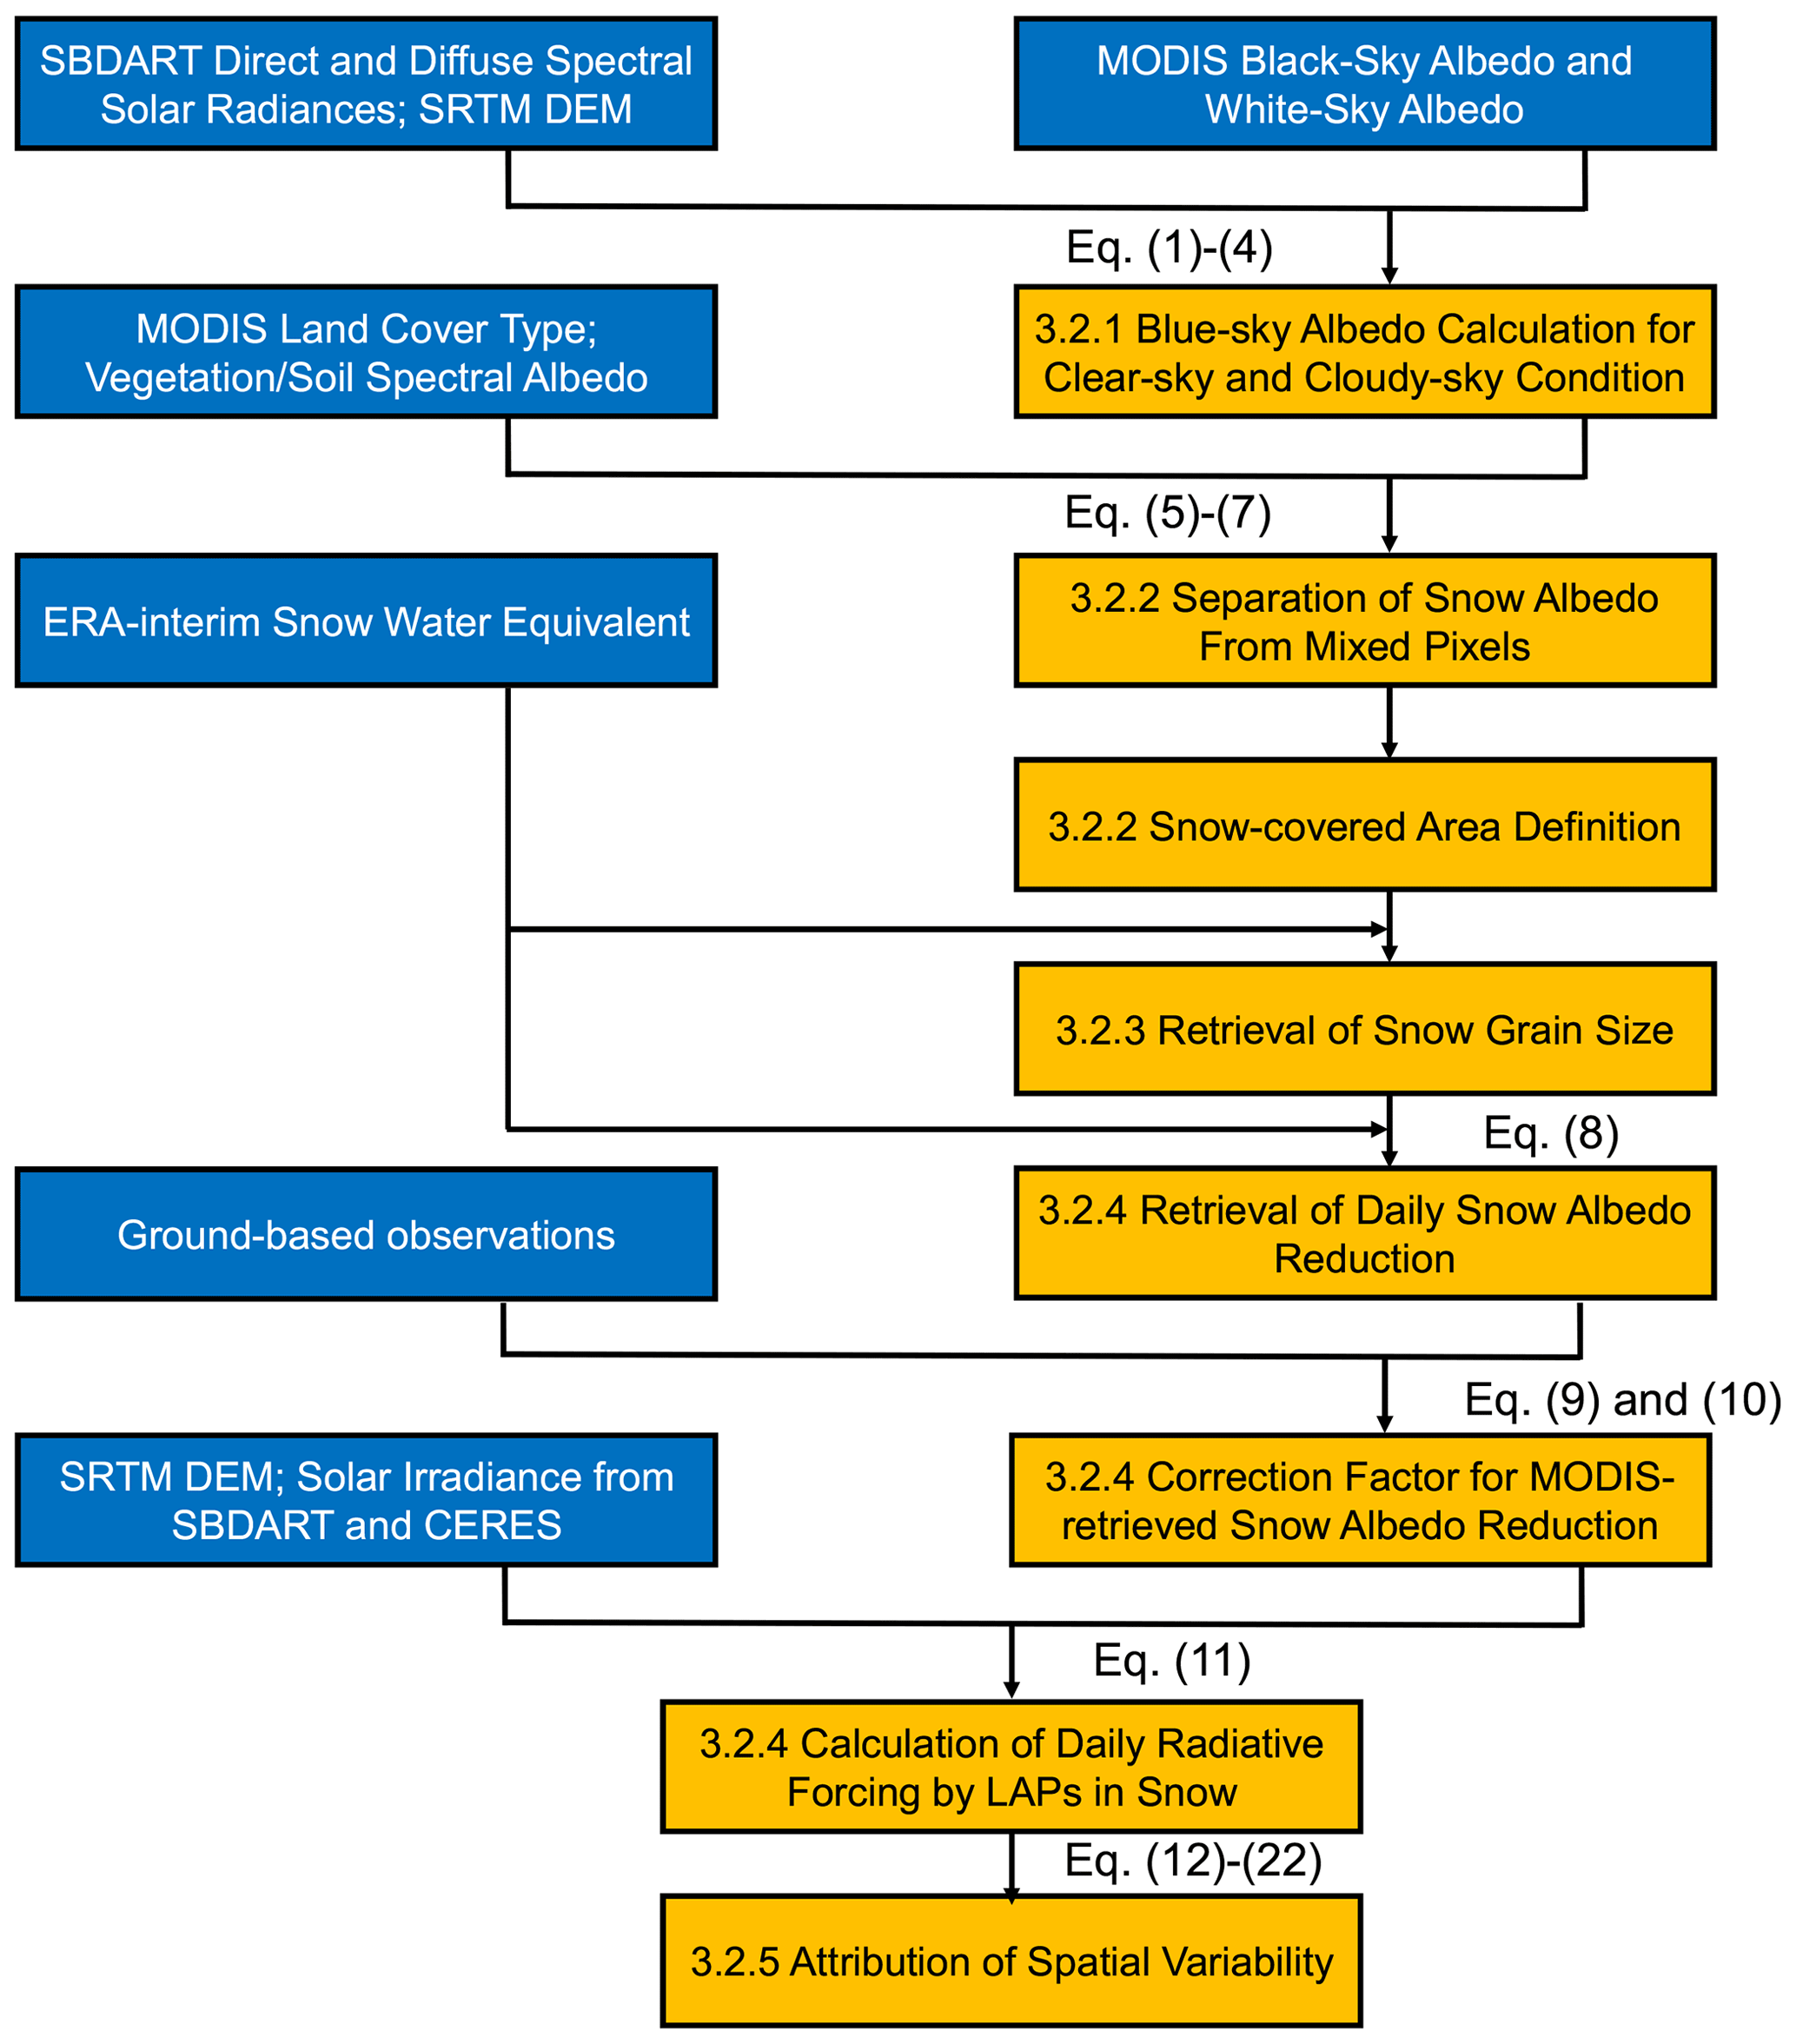
Figure 2Workflow depicting the calculation and validation of radiative forcing of LAPs in snow: the blue boxes denote the external input data, while the orange boxes are used for calculations in this study.
3.2.1 Retrieval of blue-sky albedo
MCD43 provides black-sky and white-sky albedo, which are defined as albedo in the absence of the diffuse and direct competent of solar irradiance. Accordingly, the actual spectral albedo for a land surface at wavelength λ (also called blue-sky albedo: ) under clear-sky conditions can be calculated as follows:
where and are MODIS-derived values for white-sky and black-sky albedo, respectively, and is the ratio of diffuse irradiance to the total solar irradiance under clear skies (Lewis and Barnsley, 1994). The latter is calculated as follows:
where φ is latitude; denotes the diffuse spectral irradiance on a horizontal surface; and denotes the direct spectral irradiance on a surface perpendicular to the sun, derived from the SBDART model under clear-sky conditions. β represents local solar zenith angle, which is obtained using the topographic correction method (Teillet et al., 1982; Negi and Kokhanovsky, 2011):
for which θ0 represents the solar zenith angle for a horizontal surface; ϕ0 is the solar azimuth angle; and θT and ϕT denote slope inclination and aspect, respectively. Similarly, we can derive the blue-sky albedo for cloudy-sky conditions (). Then, we used cloud fraction (fcloud) from CERES to weight clear-sky albedo and cloudy-sky albedo to obtain actual all-sky albedo ():
3.2.2 Retrieval of snow cover and albedo values
As shown in Fig. 2, the snow-covered area is mapped according to the actual all-sky albedo () in band 4 (band center ∼ 555 nm) and the Normalized Difference Snow Index (NDSI), both of which are required to exceed 0.6 (Negi and Kokhanovsky, 2011). According to the MODIS Snow Products Collection 6 user guide (http://nsidc.org/data, last access: 1 October 2020), the fractional snow cover (FSC) can be calculated as follows:
Accordingly, the identified snow-covered area (ISCA) has an FSC value of > 86 % but not always 100 %. Therefore, the MODIS-derived albedo for a particular ISCA is a combination of values representing both snow and the snow-free underlying surface. Following Pu et al. (2019), the snow albedo () can be distinguished from the mixed albedo by the equation
where Eall-sky,λ is total solar irradiance under all-sky conditions, a linear combination of direct and diffuse components of solar irradiance under clear skies and cloudy skies using a similar strategy via Eqs. (1)–(4); αunderlying,λ represents the albedo of the underlying surface and was obtained from Siegmund and Menz (2005). As depicted in Fig. 3b, vegetation and bare soil are the main types of underlying surface in the ISCA.
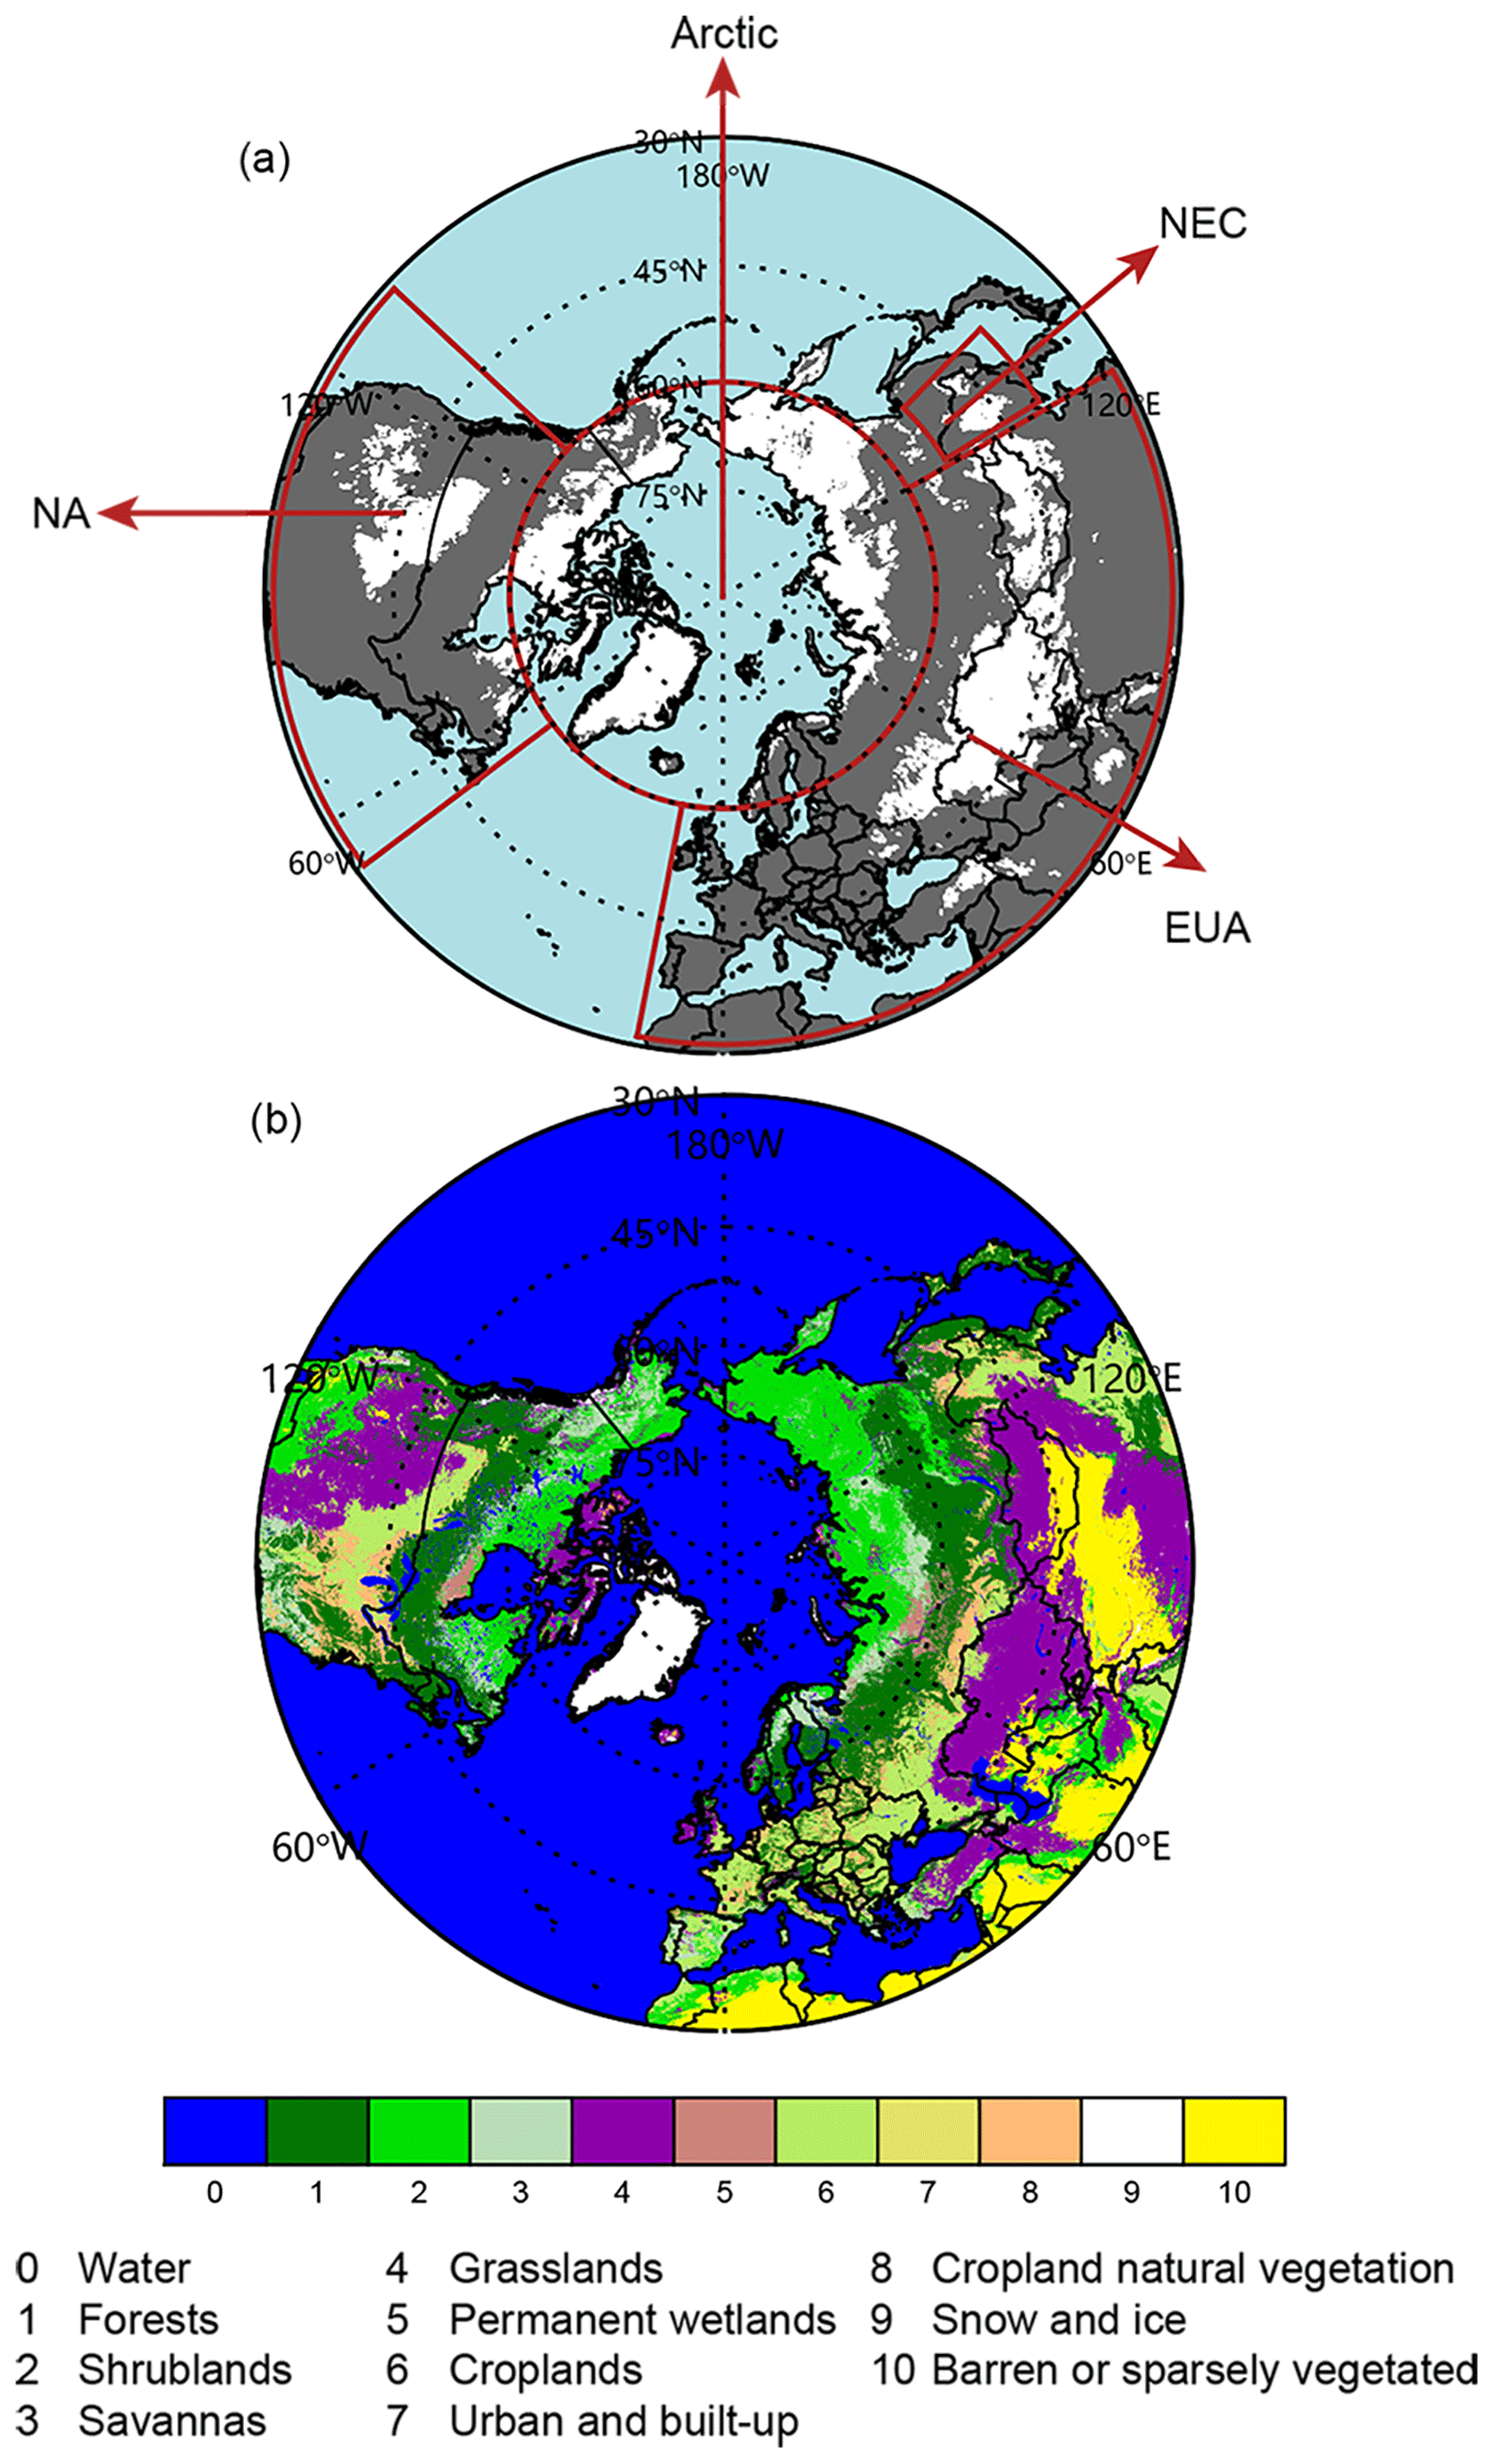
Figure 3Spatial distributions of (a) the identified snow-covered area (ISCA) and (b) the different land cover types based on MODIS data for the Northern Hemisphere. ISCAs (white) can be separated into northeastern China (NEC), Eurasia (EUA), North America (NA), and the Arctic.
3.2.3 Retrieval of snow grain size
The snow optical-equivalent grain size (Reff) is retrieved by fitting SNICAR-simulated snow albedo to MODIS-derived snow albedo at 1240 nm (the central wavelength of MODIS band 5) following the protocol of Nolin and Dozier (2000). This retrieval method is not influenced by liquid water and water vapor and has been employed widely in previous studies (e.g., Painter et al., 2013; Seidel et al., 2016). Both Nolin and Dozier (2000) and Pu et al. (2019) reported that the retrieved Reff compares favorably with ground-based measurements of snow grain size. In this study, we chose to exclude the ISCA, where MODIS-derived snow albedo at 1240 nm is < 0.3, to avoid misrepresenting Reff (Tedesco and Kokhanovsky, 2007).
3.2.4 Retrieval of snow albedo reduction and RFLS
The spectrally integrated reduction in snow albedo due to LAPs () is estimated for local-noon and all-sky conditions using solar irradiance and the difference between MODIS-derived spectral snow albedo () and simulated pure snow albedo (). Because MODIS provides only four VIS bands, we fitted snow albedo data obtained via MODIS to a continuous 300–2500 nm spectrum (, with a 10 nm interval) following the method provided by Pu et al. (2019). Thereafter, the broadband albedo reduction due to LAPs retrieved from MODIS () can be calculated as follows:
where is the pure snow albedo simulated by SNICAR using MODIS-derived Reff and ERA-Interim snow depth data, is the continuous snow albedo derived from MODIS retrievals, and Δλ is 10 nm.
Following Miller et al. (2016), we assumed that the properties for snow and LAPs remain invariable throughout the day. Based on calculated and at local noon, the diurnal variation in pure and polluted snow albedo can be simulated by SNICAR from sunrise to sunset. Then, daily average snow albedo reduction () can be derived by integrating the diurnal snow albedo reduction, which is weighted by simultaneous solar irradiance from SBDART. Similarly, we used measurements of LAPs in contaminated snow to calculate the in situ reduction in snow albedo (). To derive a correction factor for MODIS retrievals, we applied a similar validation strategy to that of Zhu et al. (2017):
where c is the correction factor for , and n is the number of the respective in situ measurements. Accordingly, the corrected albedo reduction () is calculated as follows:
The daily average, spectrally integrated RFLS () is calculated for all-sky conditions as follows:
where SWall-sky represents the daily average total downward shortwave fluxes, obtained from CERES under all-sky conditions.
3.2.5 Attribution of spatial variability in snow albedo reductions and radiative forcing
As demonstrated above, reductions in snow albedo and RFLS are dependent primarily on LAP content, Reff, snow depth (SD), solar zenith angle, surface topography, and solar irradiance, the latter three of which can be categorized as the geographic factor (G). We used an impurity index (ILAPs) to represent the LAP content of the snowpack (Di Mauro et al., 2015; Pu et al., 2019) following the equation
where and are the MODIS-derived snow albedo values for bands 4 and 5, respectively. We then calculated as follows:
The spatial variability in snow albedo reduction due to ILAPs can be expressed as
where , and indicate spatial-mean values of Reff, SD, and G, with requiring spatially constant values for the solar zenith angle, surface topography, and solar irradiance parameters. The following three equations were applied in a similar manner:
We then fitted through multiple linear regression:
where is the fitted snow albedo reduction, and a, b, c, and d denote the regression coefficients. Figure S3a illustrates how can explain 99 % of the variance in . Therefore, the attribution of spatial variance in can be replaced with , enabling Eq. (18) to be written as follows:
where is the snow albedo reduction anomaly (). Then, Eq. (19) can be written as
According to Huang and Yi (1991) and Pu et al. (2019), the fractional contribution of LAP content to the variability in snow albedo reduction () can be calculated as
where m denotes the length of the data set. Values for , , and can be derived in the same way. Similarly, we can obtain the fractional contribution for daily radiative forcing (, , , and ).
4.1 Study area
Figure 3a depicts the ISCA employed in this study. Most are located in Eurasia, North America, and the Arctic, which are dominated by grassland, shrublands, and bare-soil surfaces (Fig. 3b). Several mid–high-latitude regions that typically support a deep snowpack, including southern Russia, western Europe, and the eastern US, are not identified by MODIS as ISCA due to the broad distributions of forest in those areas (Fig. 3b). This pattern is supported by Bond et al. (2006), who demonstrated that, under such vegetated conditions, LAPs in snow exert a relatively minor influence on radiative forcing. On the other hand, the snowpack over midlatitude mountains at such a coarse resolution (0.05∘ × 0.05∘) is too low to identify. In addition, midlatitude mountains are characterized as complex terrain, which will lead to high biases in radiative forcing retrieval at the coarse resolution in spite of topographic correction. Therefore, we did not report the results over midlatitude mountains in this study.
As illustrated in Fig. 3a, ISCAs can be separated into four general regions according to geographical distribution and pollution conditions (Fig. S2a, b): northeastern China (NEC), Eurasia (EUA), North America (NA), and the Arctic. The following analysis of snow albedo reduction and RFLS only concerns ISCA, and the results mainly represent winter for midlatitudes (because spring is mostly snow-free) and spring for the Arctic (because albedos cannot be derived during polar night).
4.2 Global characteristics
Previous studies have highlighted the dominant role of BC in light absorption by snow (Wang et al., 2013; Dang et al., 2017). The spatial distribution of BC emissions density for the Northern Hemisphere in December–May is shown in Fig. S2a. Emissions density exhibits a strong spatial inhomogeneity, ranging from < 10−1 to > 104 g km−2 per month over ISCA. The highest values occur in NEC, where the emissions are considerably higher than EUA and NA, and the lowest values occur in the Arctic. The wet and dry deposition of BC constitute the primary mechanisms for BC accumulation in snow. As shown in Fig. S2b, the distribution of BC deposition (i.e., the sum of dry and wet deposition) is similar to BC emissions density, with the highest and lowest regional averages corresponding to NEC and the Arctic, respectively. Together, these data indicate that the NEC snowpack is heavily polluted, and thus snow albedo reduction is likely to be highest, while the Arctic snowpack is the least contaminated.
In addition to LAP content, the physical properties of the snowpack, such as depth and grain size, also impact snow albedo (Fig. 1). As depicted in Fig. 4a, the average snowpack in EUA (0.15 m thick) is thinner than in both NA (0.24 m) and NEC (0.19 m), implying a greater impact of snow depth on snow albedo and radiative forcing in EUA. The greatest snow depths occur in the Arctic (> 1 m) and can be considered semi-infinite, meaning that the impact of depth on albedo and radiative forcing is negligible. Figure 4b shows the spatial distribution of MODIS-derived snow grain radius (Reff). In contrast to BC emissions density, BC deposition, and snow depth, Reff exhibits minor spatial variability, with regional-average values for NEC, EUA, NA, and the Arctic of 237, 227, 237, and 215 µm, respectively. These values align with the findings of several previous studies (Painter et al., 2013; Seidel et al., 2016; Pu et al., 2019) and imply that the contribution of Reff to spatial variability in snow albedo reduction and radiative forcing is negligible.
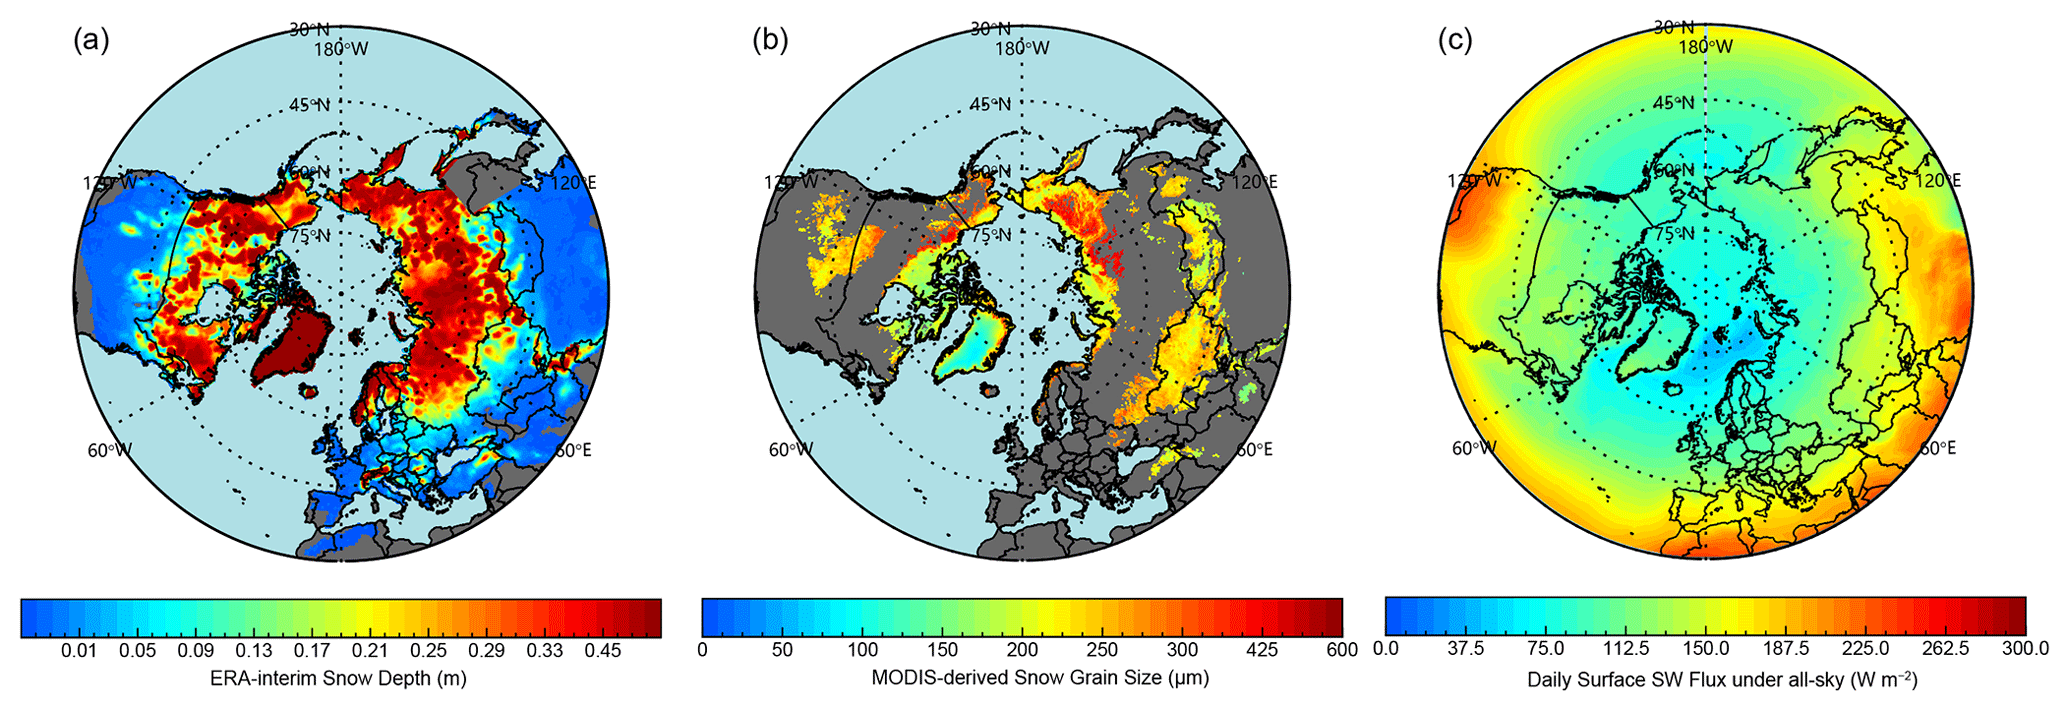
Figure 4Spatial distributions of 2003–2018 averaged (a) snow depth from ERA-Interim, (d) snow grain size retrieved by MODIS, and (c) total downward shortwave flux at the surface during December–May from CERES.
According to Eq. (11), local solar radiation is an important factor for determining RFLS. Figure 4c depicts the December–May averaged total downward surface shortwave flux under all-sky conditions. Average solar radiative flux values for EUA and NA are comparable to one another but high relative to NEC, which lies at a generally higher latitude (> 40∘). The lowest values occur in the Arctic due to that region's extreme latitude. The Arctic goes through the polar night during winter so that the radiative effect of LAPs in the Arctic mainly appears in spring. Figure S2d shows the March–May averaged downward surface shortwave flux. As can be seen, the values in the Arctic in March–May are higher than those at midlatitudes in December–February (Fig. S2c). We note that snow albedo reduction and radiative forcing are only calculated over the period when snow-covered area was mapped, which implies that the RFLS will be higher in the Arctic than at midlatitudes for the same snow albedo reduction.
4.3 Corrections based on in situ observations
Albedo reduction calculated using in situ observed LAPs () was used to quantitatively correct MODIS retrievals through comparison with MODIS-retrieved snow albedo reduction (). Figure S4 displays scatterplots of the ratios of to () for each sampling site (Ye et al., 2012; Wang et al., 2013, 2017; Doherty et al., 2010, 2014). Briefly, for NA, EUA, and the Arctic, where the snowpack is relatively clean, the values for mostly range between 2 and 10. In contrast, the heavily polluted snowpack in NEC returns values ranging from 0.5 to 2.5, indicating a negative correlation between the biases of and snow contamination, thus supporting the findings of previous studies (Painter et al., 2012a; Pu et al., 2019). To improve the quality of MODIS retrievals, we developed the correction factors for different regions. According to Eq. (10), the correction factors for NEC, EUA, NA, the Canadian Arctic, the Russian Arctic, and Greenland are 1.6, 4.1, 4.1, 4.4, 5.4, and 6.0, respectively. Hereafter, our analyses are based on the corrected MODIS retrievals. Figure 5 compares the corrected MODIS retrievals to measurement-based results, and the mean absolute error (MAE), root mean square error (RMSE), and correlation coefficient of relative to are given in Table S1. Together, these results imply that the corrected MODIS retrievals are plausible. Nevertheless, we note that the correction used in this study is spatially rough due to the low density of in situ measurements and thus that both the uncertainty and bias are non-negligible. To address this issue, we presented further discussion about the accuracy of radiative forcing retrievals (see Sect. 4.5). We also conducted a comprehensive series of comparisons between the MODIS-derived retrievals and values provided via surface measurements, model simulations, and remote sensing (see Sect. 5). We concluded that further field-based measurements of snow albedo are required to improve the quality of satellite retrievals.
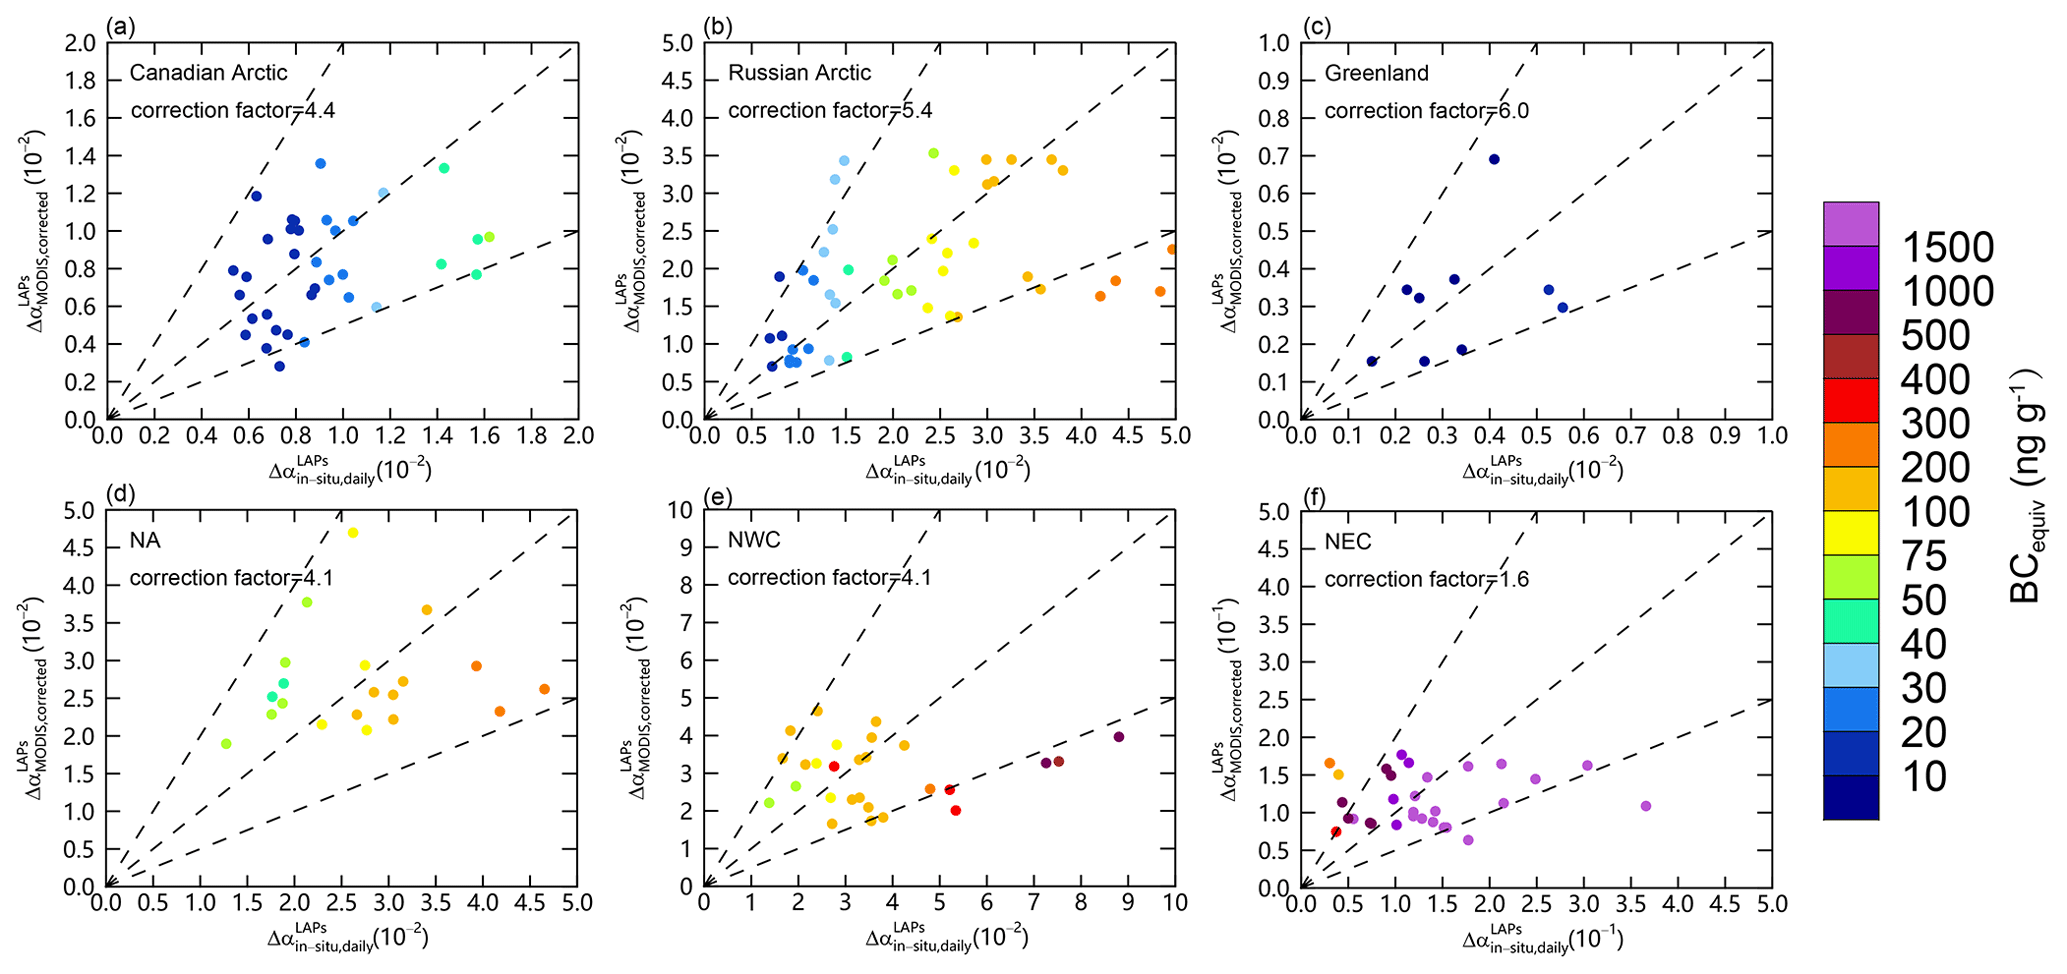
Figure 5Scatterplots of versus . Panels (a)–(f) represent the snow samples collected in the Canadian Arctic, Russian Arctic, Greenland, North America, northwestern China, and northeastern China, respectively.
4.4 Spatial distributions of snow albedo reduction and radiative forcing
Figure 6a shows the spatial distributions of MODIS-based albedo reduction and daily radiative forcing, and statistics are shown in Fig. 6b and Table 1. On average, and provide respective values of 0.021 and 2.9 W m−2 for Northern Hemisphere ISCA. The highest occurs in NEC, where the regional average of ∼ 0.11 exceeds those of EUA (∼ 0.031) and NA (∼ 0.027) by a factor of ∼ 3–4. This feature reflects the relatively high rate of emissions over NEC, which results in the highest level of BC deposition over ISCA (Fig. S2a, b). In contrast, being located far from major sources of pollution, the relatively clean Arctic snowpack returns the lowest (∼ 0.016) of the entire Northern Hemisphere. Consistent with snow albedo reduction, the highest regional-average daily radiative forcing () occurs in NEC, with values of ∼ 12 W m−2, and the lowest regional average occurs in the Arctic, with values of ∼ 2.6 W m−2. Regional-average radiative forcing for NA and EUA are both intermediate, with values of ∼ 3.1 and ∼ 3.5 W m−2, respectively.
Table 1Statistics for regionally averaged (5th and 95th quantiles) albedo reduction () and daily radiative forcing (; W m−2).

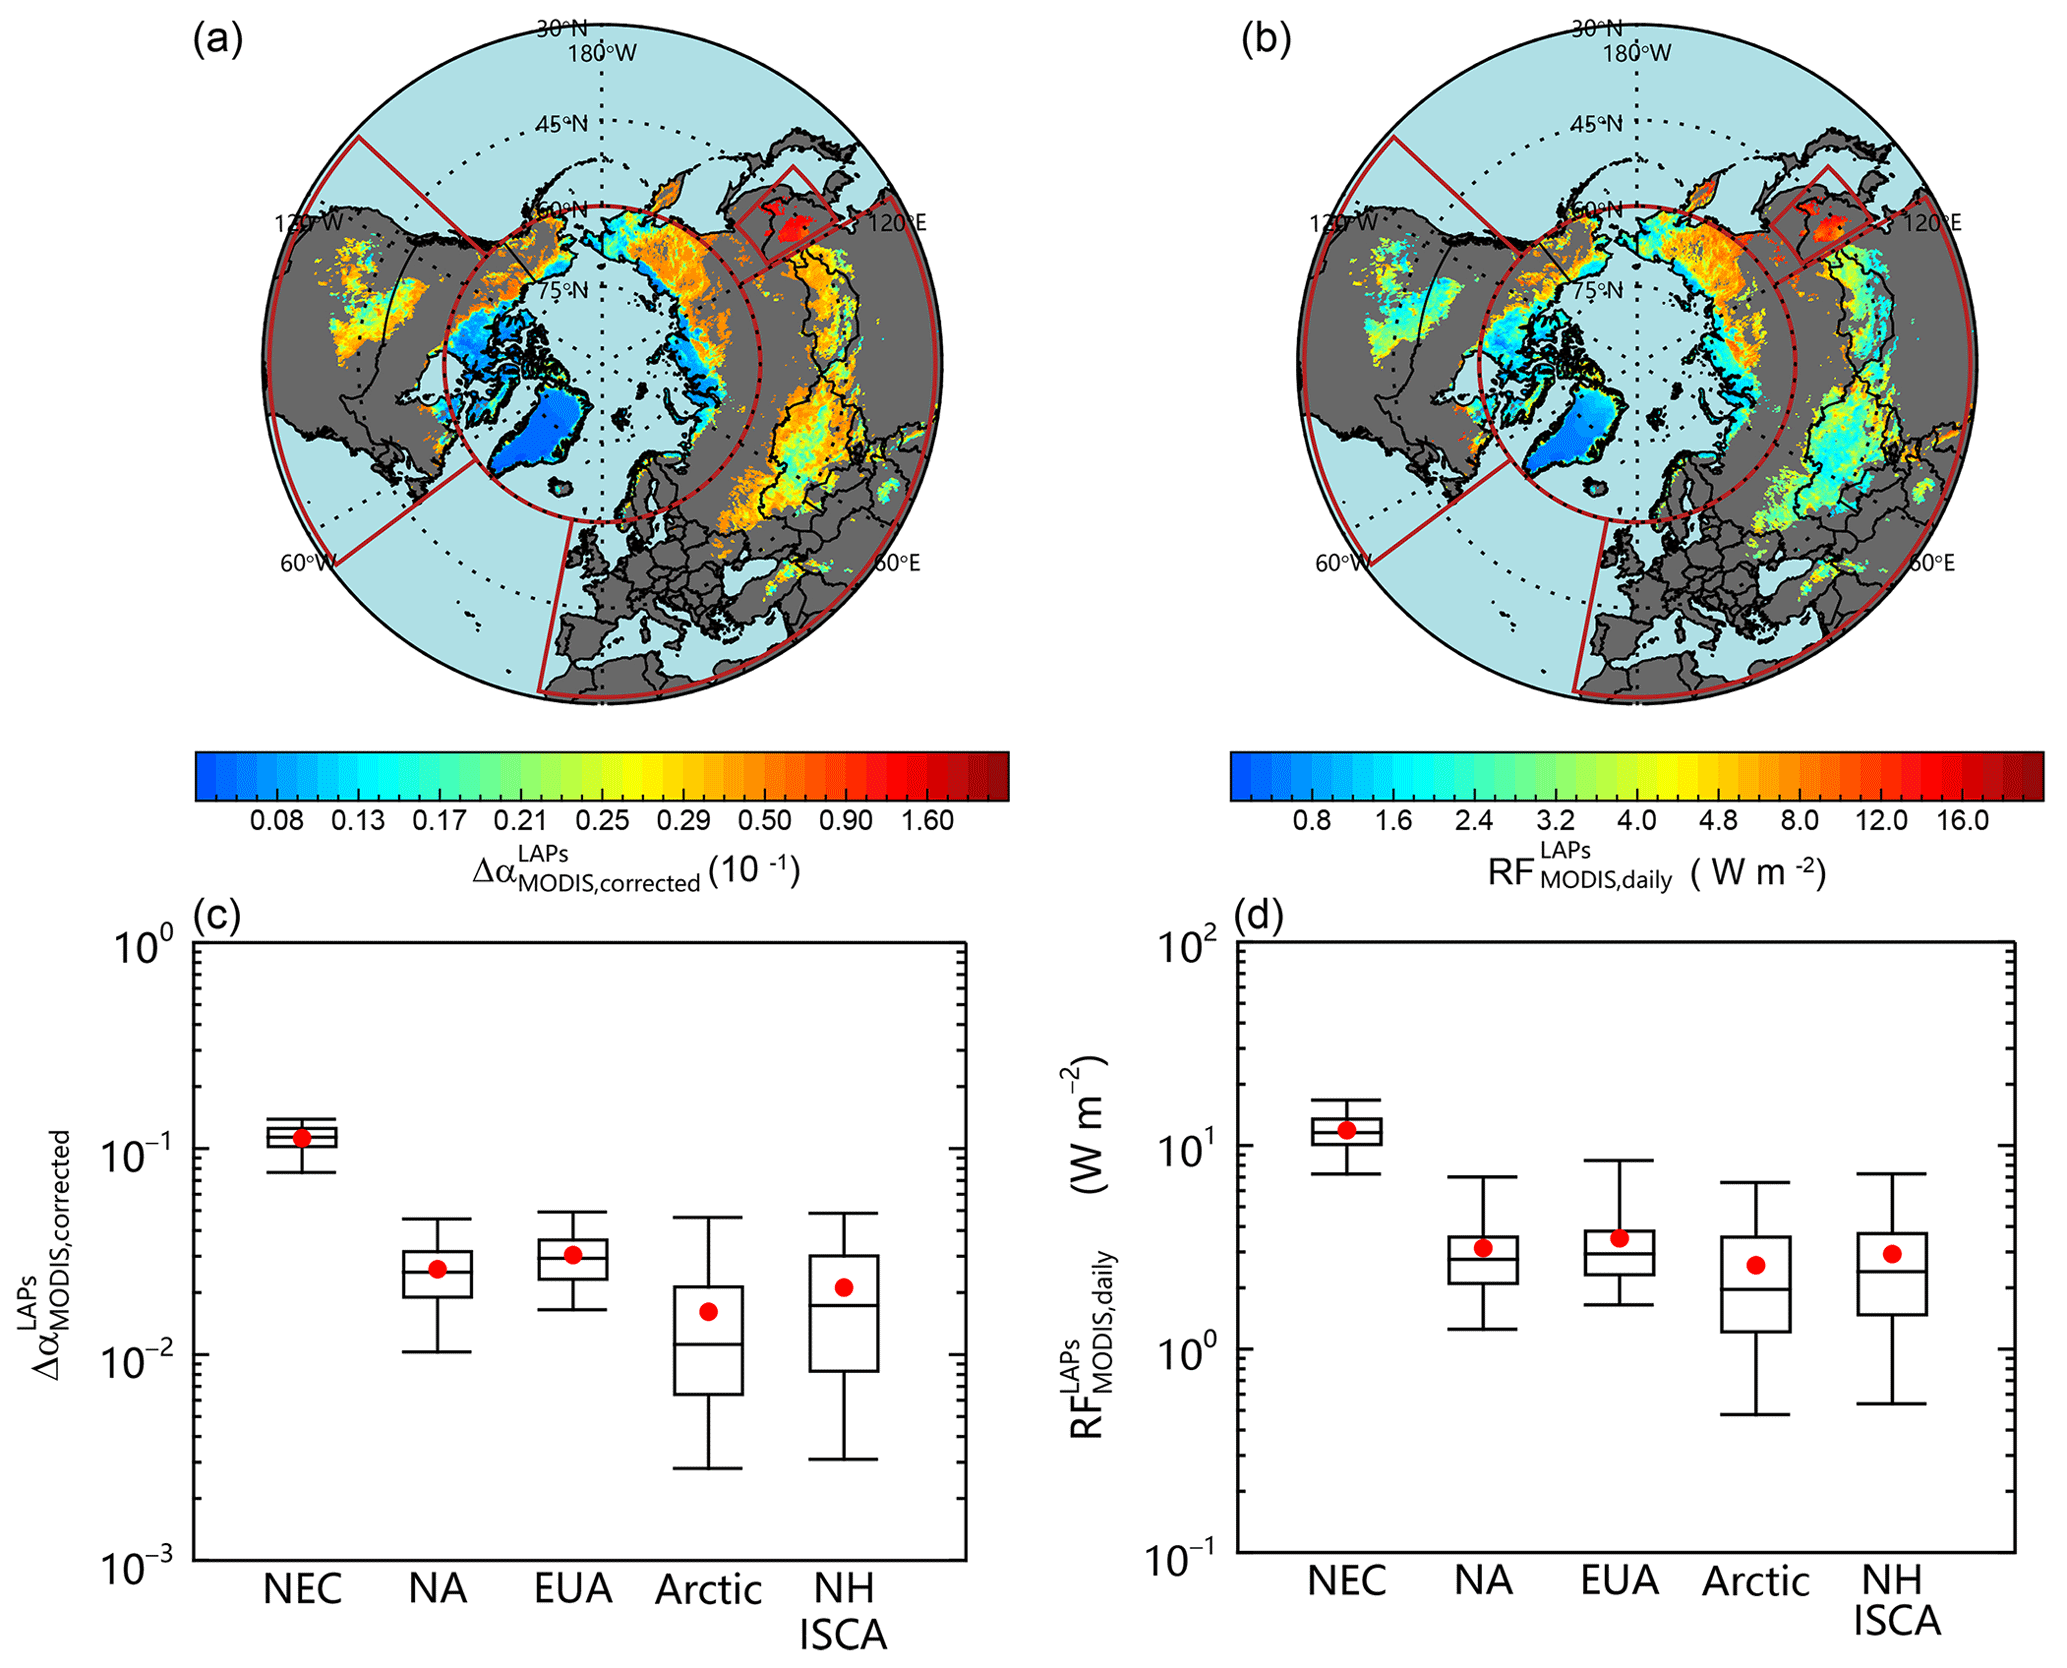
Figure 6Spatial distributions of averaged (a) and (b) and statistics for regionally averaged (c) and (d) for the Northern Hemisphere ISCA in December–May during the period 2003–2018. The boxes denote the 25th and 75th quantiles, and the horizontal lines represent the 50th quantiles (medians); the averages are shown as red dots; the whiskers denote the 5th and 95th quantiles.
On a regional level, NEC falls primarily within the range ∼ 0.077–0.14, and intra-regional variability is relatively small due to pervasive heavy pollution (Fig. S2). Compared to snow albedo reduction, the radiative forcing for NEC exhibits a slightly greater spatial variability due to latitude-dependent differences in the flux of surface solar radiances, ranging from ∼ 7.2 W m−2 to ∼ 17 W m−2. In NA, where the principal ISCAs are located in southern Canada, the western US, and northern US Great Plains, and tend to range between ∼ 0.014–0.046 and ∼ 1.3–7.0 W m−2, respectively. In EUA, and fall largely within the respective ranges of ∼ 0.017–0.049 and ∼ 1.6–8.4 W m−2. Central Asia and Mongolia exhibit relatively high values for (> 0.04) and (> 2 W m−2), while this pattern likely reflects the influence of anthropogenic BC in addition to natural dust (Pu et al., 2017; Zhou et al., 2019) (Fig. S2a–b).
In the Arctic, and both present quite large intra-regional variabilities, from ∼ 0.0028 to ∼ 0.046 and ∼ 0.48 to 6.6 W m−2. Greenland has the cleanest snow, with and of ∼ 0.011–0.023 and ∼ 0.40–3.3 W m−2. In the Canadian Arctic, and are mainly in a range of ∼ 0.012–0.055 and ∼ 0.59–6.1 W m−2. In addition, the relatively high values are found around the edge of ISCA to the west of the Canadian Arctic. The possible reason is that these areas are suffering from faster snow melting compared with the rest of the Canadian Arctic in spring, which is characterized by higher snow grain size (Fig. 4b). Hence, more LAPs are accumulated in the surface snow, resulting in higher snow albedo reduction. In the Russian Arctic, and values increase with altitude by ∼ 0.012–0.048 and ∼ 1.0–7.3 W m−2. The snow albedo reduction in eastern Siberia is quite high and comparable with the values at midlatitudes. Moreover, benefiting from the higher solar radiances in eastern Siberia in spring (Fig. S2d) than those at midlatitudes in winter–spring (Figs. 4c and S2c), in eastern Siberia is higher than parts of the midlatitudes. Even different from the findings in previous modeling studies (e.g., Flanner et al., 2007, 2009), the results seem to be comparable with the limited ground-based estimates (Fig. S3). The serious biomass burning in eastern Siberia in spring may be responsible for such high values (Warneke et al., 2010; Hegg et al., 2009). Overall, the Arctic spatial pattern of and in our study is consistent with the previous studies based on field experiments (Dang et al., 2017) and model simulation (Flanner et al., 2007). Nevertheless, we note that readers should be cautious about our reported high values in the Russian Arctic, and more field experiments are necessary for validating the results.
As mentioned above, the assumption of semi-infinite snowpack will trigger an overestimate for radiative forcing when snow depth is not thick enough. Figure 7 shows the spatial distribution of the ratio of retrieved radiative forcing using semi-infinite snow to radiative forcing using ERA-Interim snow depth. As can be seen, semi-infinite snowpack assumption will lead to an overestimate of up to ∼ 25 % in midlatitude areas, where snow depth is thin. In contrast, the influence of snow depth on radiative forcing is negligible in the Arctic, where snow is thick enough to become semi-infinite snowpack. These results demonstrated the important impact of snow depth on radiative forcing retrievals, which must be considered to reduce the overestimate for the following study.
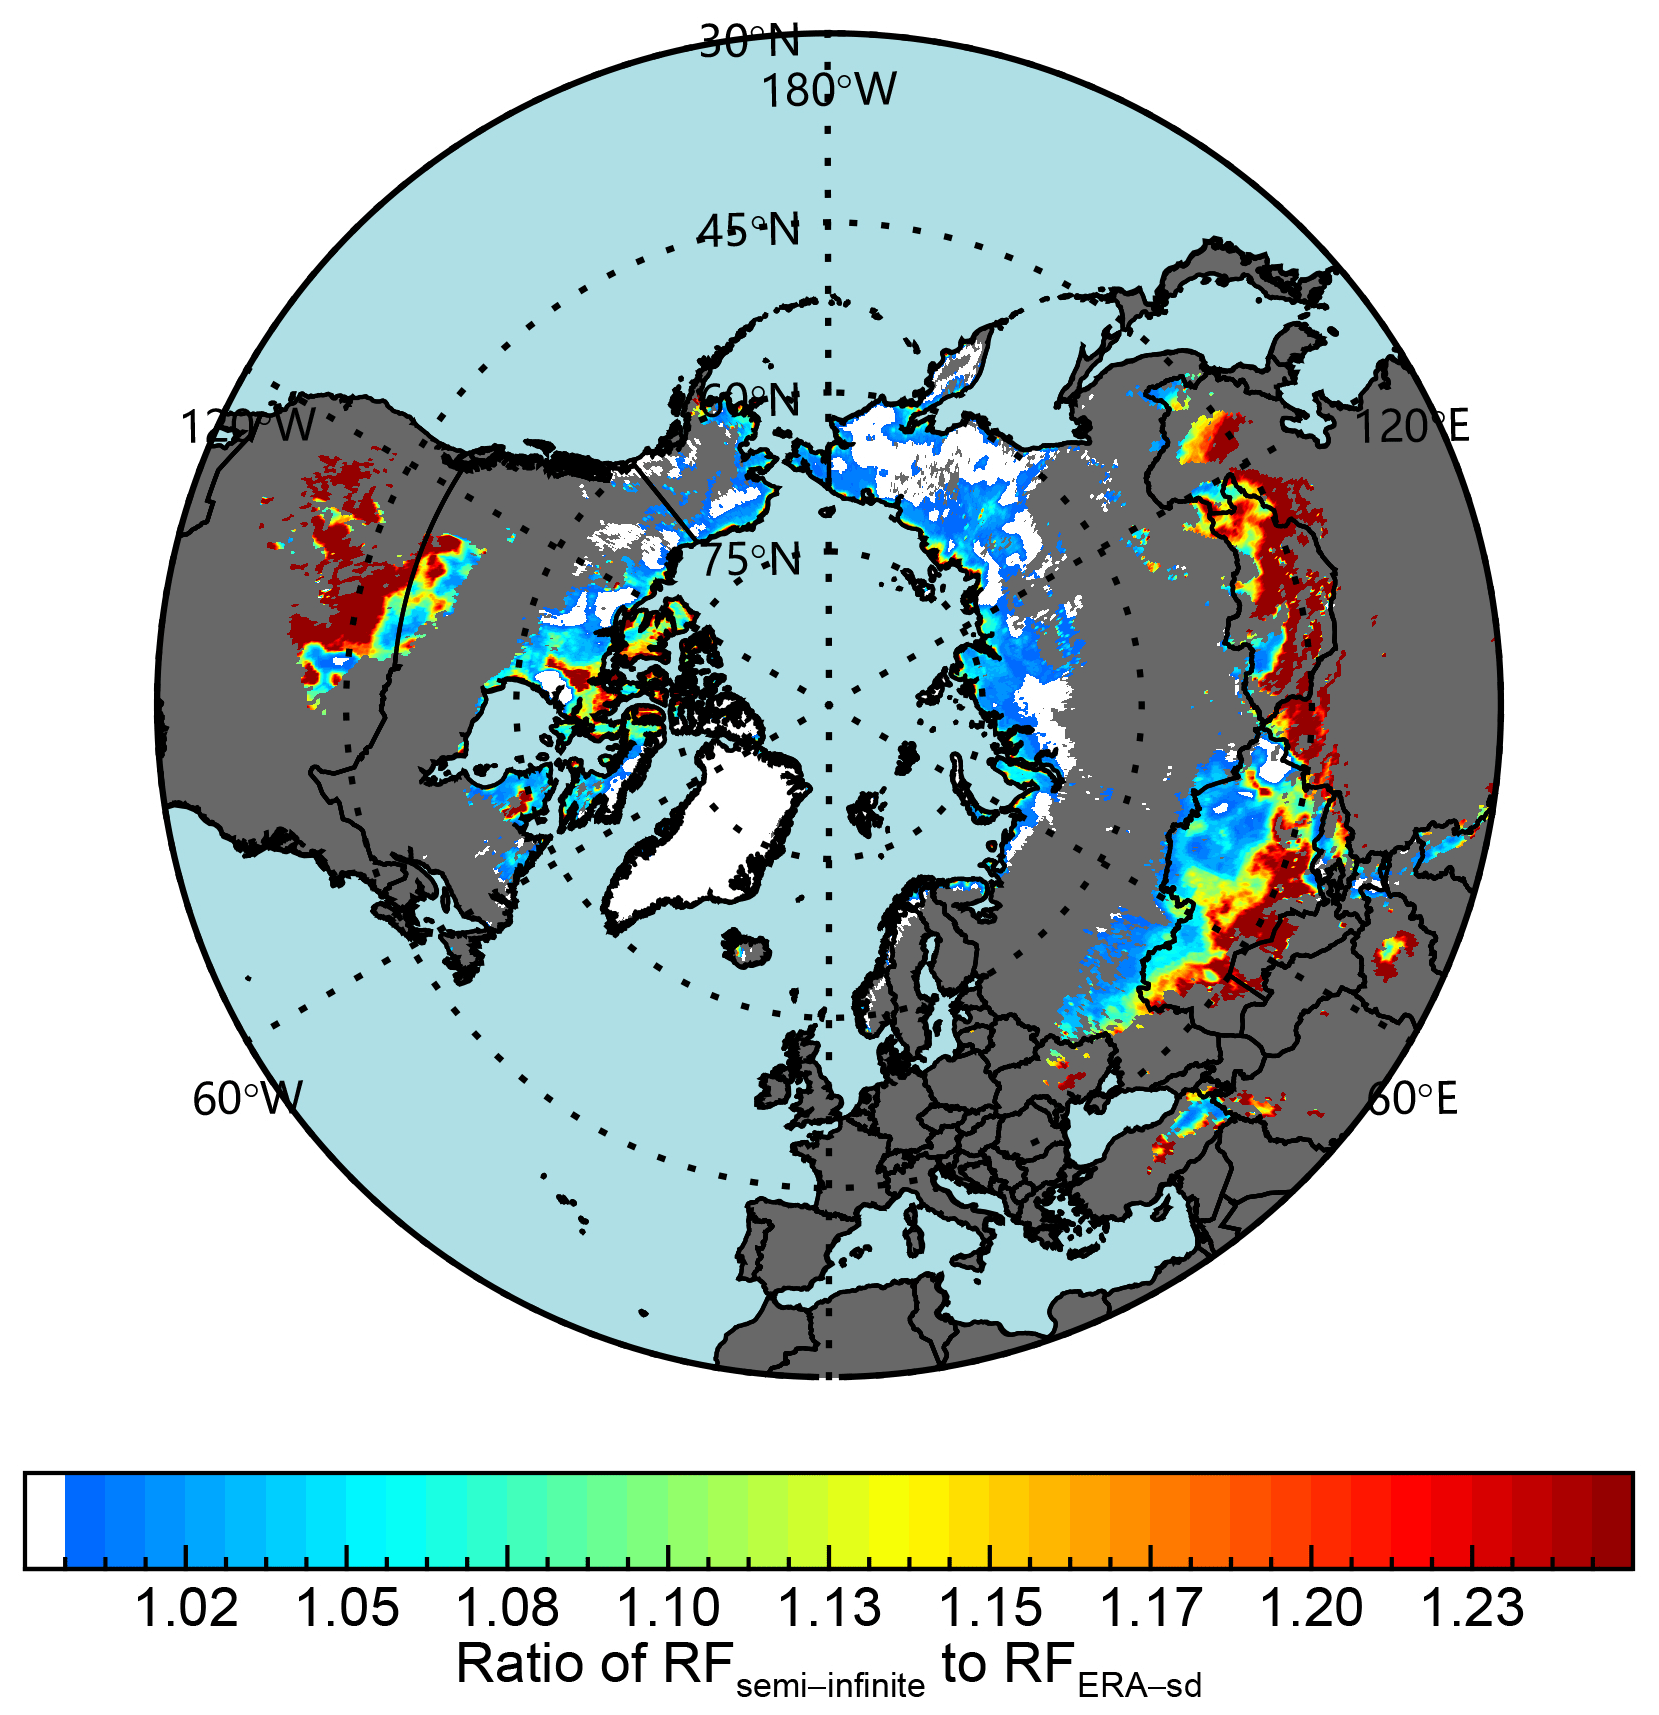
Figure 7The spatial distribution of the ratio of retrieved radiative forcing using semi-infinite snow to radiative forcing using ERA-Interim snow depth.
4.5 Accuracy discussion
In spite of the rigorous processes for radiative forcing retrieval, the uncertainty still existed. For example, light-absorbing particles in the atmosphere will reduce the accuracy of MODIS surface reflectance retrieval even though the atmospheric correction has been conducted. In addition, previous studies have pointed out a high scatter when converting NDSI to FSC using Eq. (5), which will induce bias in snow albedo retrieval (Rittger et al., 2013; Riggs et al., 2016; Bair et al., 2019). Furthermore, the method for snow grain size retrieval is only based on a single MODIS band at 1.24 µm, which could lead to higher uncertainties. Above all, all of these factors will result in a non-negligible uncertainty for radiative forcing retrieval, which needs to be further discussed.
To account for this issue, we consider that the accuracy of atmospheric correction is typically ±(0.005 + 0.05 × reflectance) under conditions under which aerosol optical depth (AOD) is less than 5.0, and solar zenith angle is less than 75∘ according to the MODIS Surface Reflectance user's guide (Collection 6; https://modis.gsfc.nasa.gov/data/dataprod/mod09.php, last access: 1 October 2020). In addition, the bias for FSC calculation is assumed to be 10 % according to Riggs et al. (2016). The bias for snow grain size retrieval is assumed to be 30 % according to the studies of Pu et al. (2019) and Wang et al. (2017). Figure 8 shows the overall uncertainty in radiative forcing retrieval due to all these factors, while Fig. S6 shows the uncertainty caused by each factor. In general, the upper (lower) bound of the uncertainty falls within a range of 15 %–108 % (−106 % to −20 %), with atmospheric correction and FSC calculation contributing more to the uncertainty than snow grain size retrieval. The highest uncertainty occurs in the Arctic, while the lowest uncertainty occurs in NEC. Furthermore, the uncertainty shows a negative correlation with retrieved radiative forcing. The results indirectly demonstrated the reasonability of different correction factors performed in different regions. For example, the value of 1.6 used in NEC suggests that the correction approach works well for heavily polluted snow, while the value of 6.0 used in Greenland for relatively clean snow suggests that the method becomes not accurate enough.
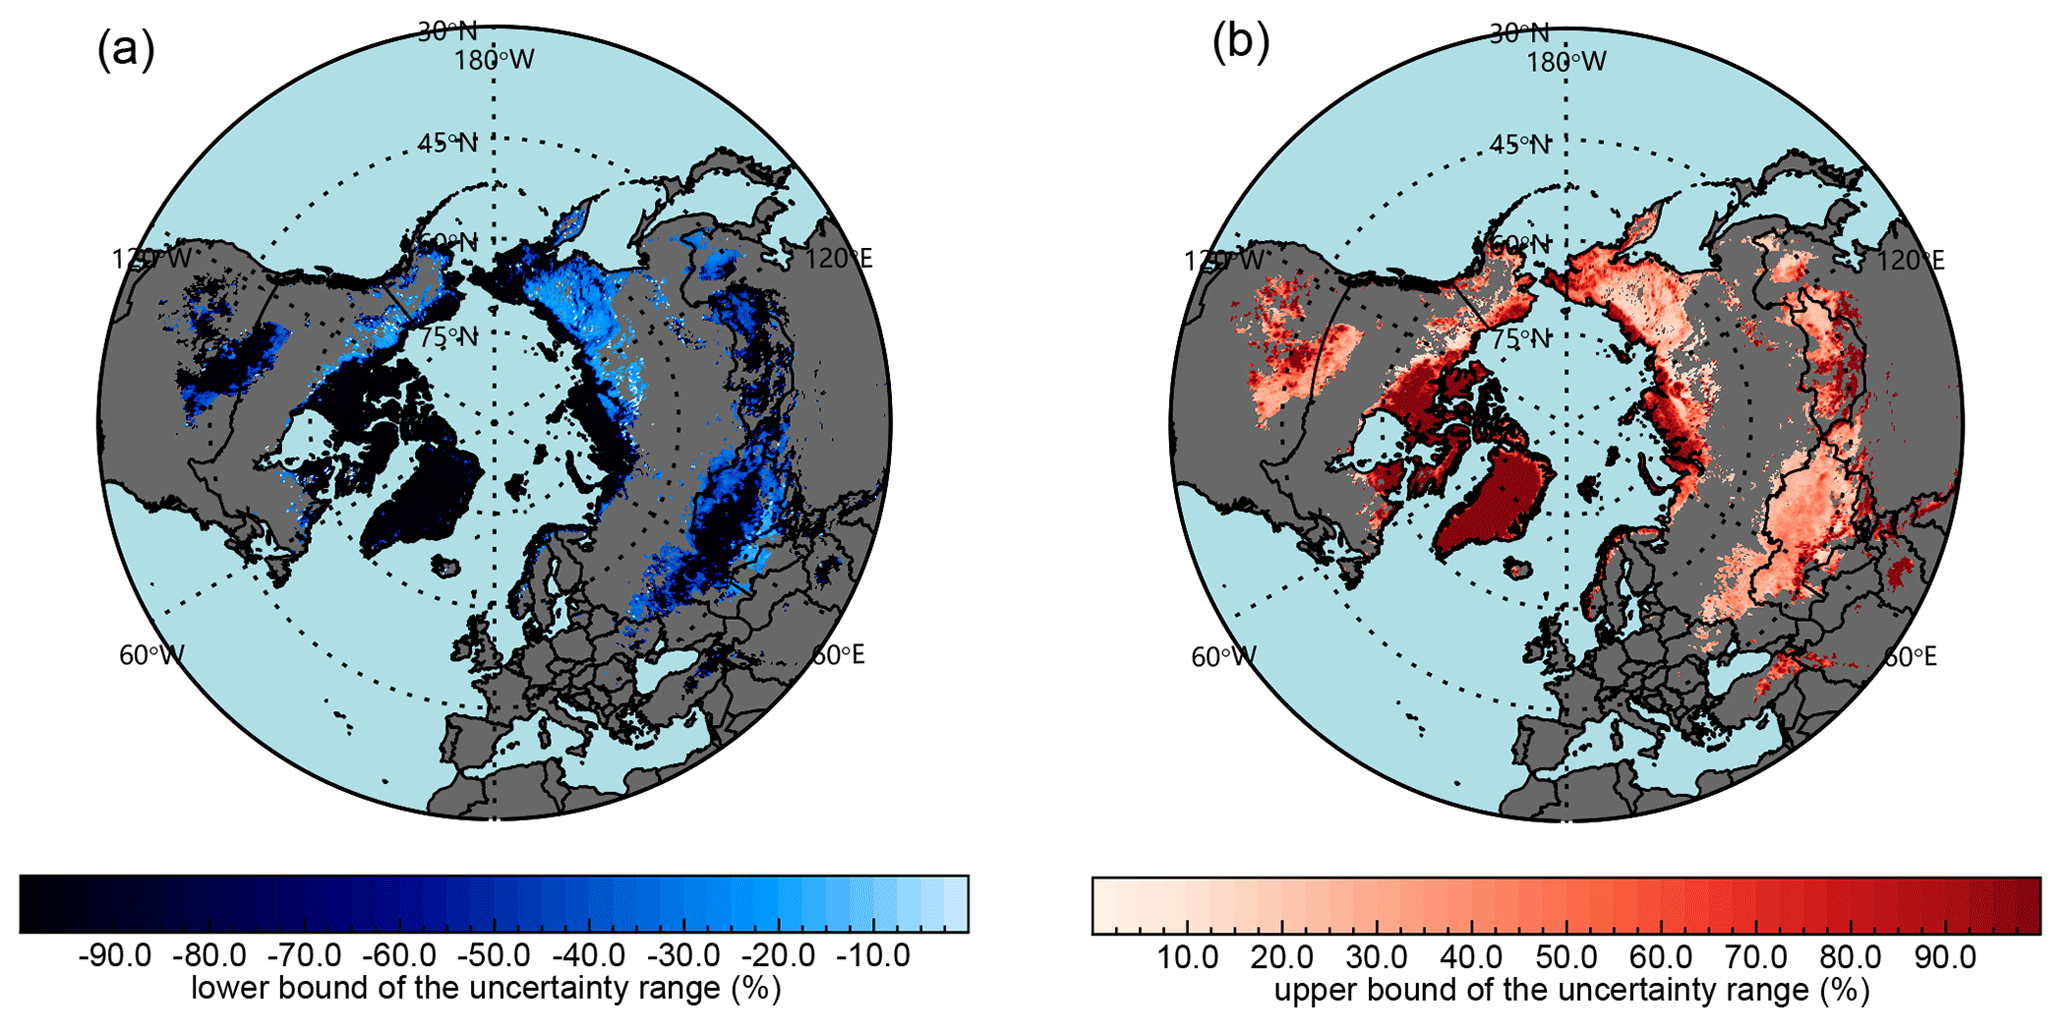
Figure 8The overall lower bound and upper bound of the uncertainty range of radiative forcing retrieval due to atmospheric correction, MODIS-derived snow grain size retrieval, and snow cover fraction calculation.
It is worth noting that the uncertainties from these factors could not fully explain the high correction factor in clean snow. The reason for why the ratio is larger than 1 is most likely the effect of snow surface roughness (Manninen et al., 2020) and vegetation (Pu et al., 2019). This effect is not accounted for in SNICAR and probably reduces the derived albedo from MODIS and therefore results in an overestimation of the albedo reduction attributed to LAPs. Moreover, there are other potential factors causing errors: (1) MODIS has variably spaced and discrete spectral bands and thus cannot provide a continuous spectral measurement of reflectance, resulting in a non-negligible uncertainty in retrieving the radiative forcing by LAPs in snow (Painter et al., 2012a); (2) we use the retrieved radiative forcing in a pixel size of 0.05∘ × 0.05∘ to compare with the in situ radiative forcing calculated from the measured BCequiv concentration with a sample site located somewhere within the pixel; however, such a comparison may not be representative at some sites due to the inhomogeneous spatial distribution of LAP contents, which will influence radiative forcing retrieval; (3) in situ measurements also have uncertainties, which may cause a high bias for snow albedo reduction in clean snow. For example, a 10 % bias for 50 ng g−1 BC can result in an 8 % bias for snow albedo reduction.
4.6 Attribution to the spatial variability in snow albedo reduction and radiative forcing
Here, we address the attributions to the spatial variability in snow albedo reduction and radiative forcing. As discussed in Sect. 3.2.5, the spatial variability in snow albedo reduction and radiative forcing is largely dependent on LAP content, snow grain radius, snow depth, and the geographic factor. Figure 9 illustrates the fractional contributions of each factor within the study regions. For the Northern Hemisphere ISCA as a whole, LAPs (ILAPs) are the greatest contributor (84.3 %) to snow albedo reduction, followed by SD (13.7 %); Reff and G have only a minor influence (1.9 % and < 1 %, respectively) (Fig. 9a). This result confirms that the concentration of LAPs in the snowpack plays a fundamental role in spatial variability in snow albedo reduction.

Figure 9Fractional contributions of LAPs, snow grain size (Reff), geographic factor (G), and snow depth (SD) to the spatial variations in (a) snow albedo reduction and (b) daily radiative forcing.
LAPs also constitute the dominant contributors to snow albedo reduction on a regional scale, accounting for 96.0 % of the Arctic signal, 56.7 % in EUA, and 49.9 % in NA, and are the second-largest contributor in NEC (40.3 %). The contribution of SD is greatest in NEC (56.3 %), with slightly lower values in EUA (40.3 %) and NA (48.8 %), reflecting the significant spatial variability in SD across these regions. In the Arctic, the snowpack is sufficiently thick to be considered a homogeneous, semi-infinite snowpack, and thus the contribution of SD is negligible. In contrast, Reff makes only minor contributions in NEC (3.3 %), NA (1.3 %), EUA (2.8 %), and the Arctic (1.4 %). Finally, G makes the smallest contribution to snow albedo reduction (< 1 %), both on regional and global scales.
On a hemispheric scale, the greatest contributors to radiative forcing are LAP content (70.0 %) and G (22.3 %), followed by SD (7.6 %). As with snow albedo reduction, Reff plays only a minor role. The influence of G on spatial variability in radiative forcing is attributed to the high degree of variability in latitude-dependent solar radiative fluxes among ISCA. On a regional scale, the respective contributions of LAP content, G, and SD are also comparable among the four study areas, accounting for 34.1 %, 11.1 %, and 52.0 % of radiative forcing in NEC; 39.2 %, 13.9 %, and 46.4 % in NA; and 48.0 %, 19.3 %, and 31.6 % in EUA. The Arctic radiative forcing is dominated by LAPs (85.6 %) and G (12.7 %).
In summary, LAPs play a dominant role in the spatial variability in snow albedo reduction and radiative forcing. Our results also highlight the significant contribution of SD to snow albedo reduction and of G to radiative forcing.
4.7 Comparisons with model simulations
To investigate the global distribution and variance of RFLS, previous studies have tended to rely on Earth system models with minimal cross-checking from in situ measurements or remote-sensing observations (Qian et al., 2015; Skiles et al., 2018). In this study, we compared MODIS retrievals with CESM2 to improve our understanding of the magnitude of RFLS on a global scale.
Employing snow BC concentrations from CESM2, we also calculated December–May daily radiative forcing (RFCESM2) for the Northern Hemisphere ISCA during the period 2003–2014 (Fig. 10a). Statistics are presented in Fig. S7. Briefly, RFCESM2 exhibits strong spatial inhomogeneity, with values ranging from 0.20 to 5.6 W m−2. The highest regional average in RFCESM2 occurs in NEC (≥10 W m−2) and the lowest in the Arctic (≤0.5 W m−2), consistent with .
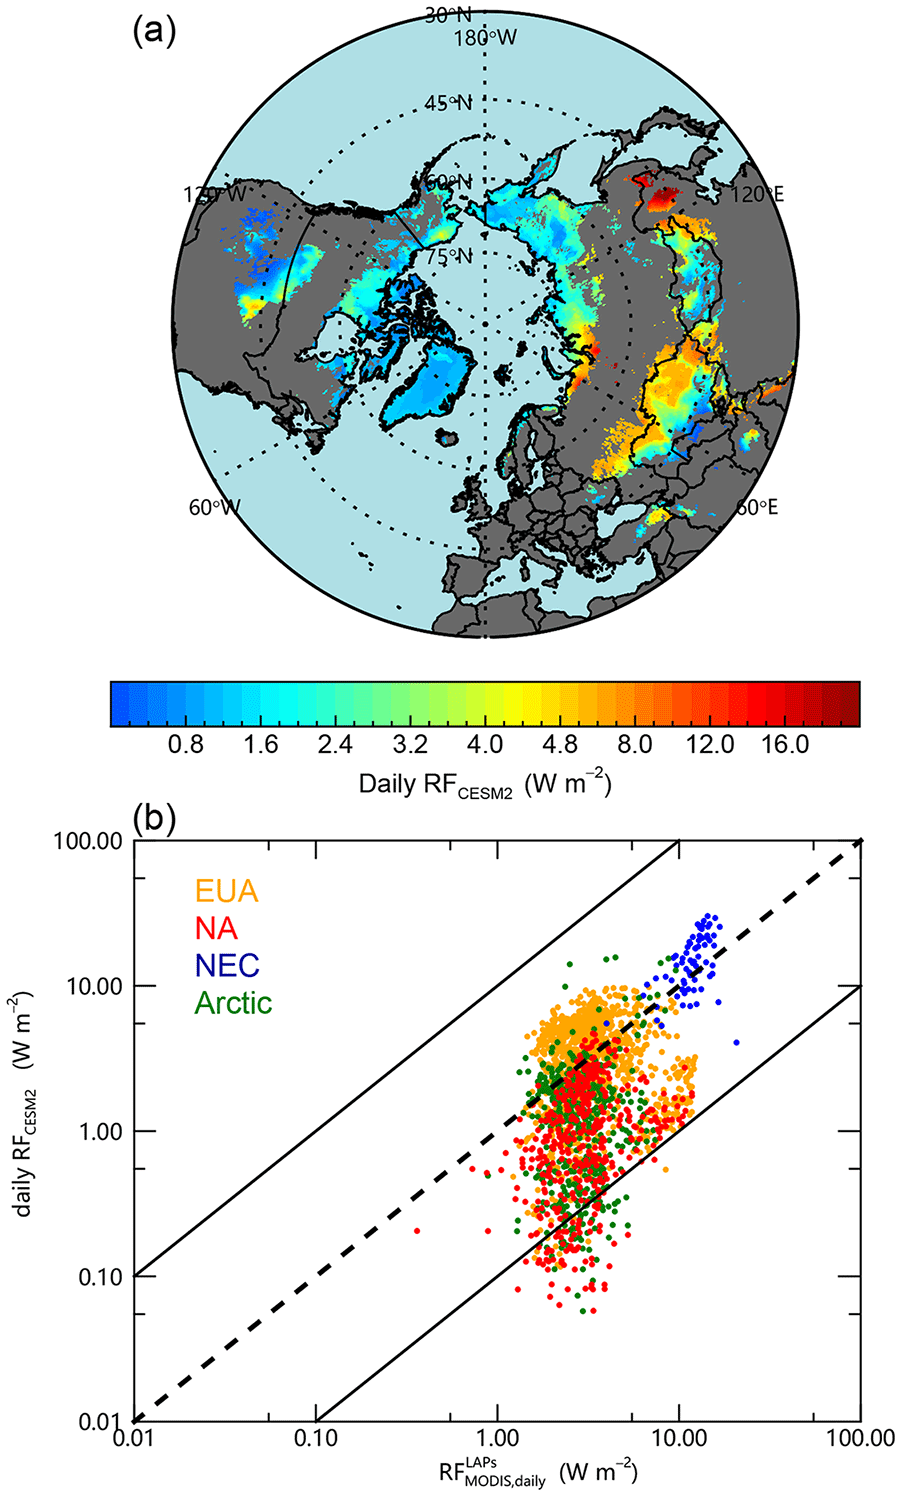
Figure 10(a) Spatial distributions of daily average radiative forcing (RFCESM2) based on the CESM2 soot content of snow in December–May for the period 2003–2014. (b) Scatterplot of versus RFCESM2.
Figure 10b depicts the comparison of and RFCESM2. In NEC, RFCESM2 (15 W m−2) compares well with (12 W m−2), with a significant correlation at the 99 % confidence level. For EUA, RFCESM2 (3.8 W m−2) is similar to (3.5 W m−2). For NA, RFCESM2 (1.2 W m−2) is lower than (3.1 W m−2), and the spatial correlation between them is poor. In the Arctic, RFCESM2 is correlated with at the 99 % confidence level. However, RFCESM2 (1.7 W m−2) is lower than (2.6 W m−2) by a factor of 1.5.
Overall, the RFLS derived from our MODIS retrievals and modeling-based estimates exhibits the same magnitude over the Northern Hemisphere. In NEC, the MODIS-derived and model-derived estimates show good general agreement, indicating the satisfactory performance of CESM2 in this heavily polluted region. In EUA, average radiative forcing values are comparable, but the spatial correlation is relatively poor, while MODIS retrievals for the Arctic are significantly higher than those simulations.
In recent decades, there has been increasing scientific interest in snow LAPs due to their role in the climate system, and numerous studies have attempted to evaluate RFLS. In addition to making global-scale comparisons between our MODIS retrievals and model-based estimates, this study collects a comprehensive set of radiative forcing estimates based on local-scale observations and remote sensing to make quantitative regional- and global-scale comparisons and synthetically evaluate the magnitude of RFLS (Table 2). This approach also affords the opportunity to examine the MODIS retrievals used in our study.
Table 2Comparisons of radiative forcing due to LAPs in snow (this study) with observed and model-simulated values from previous studies.
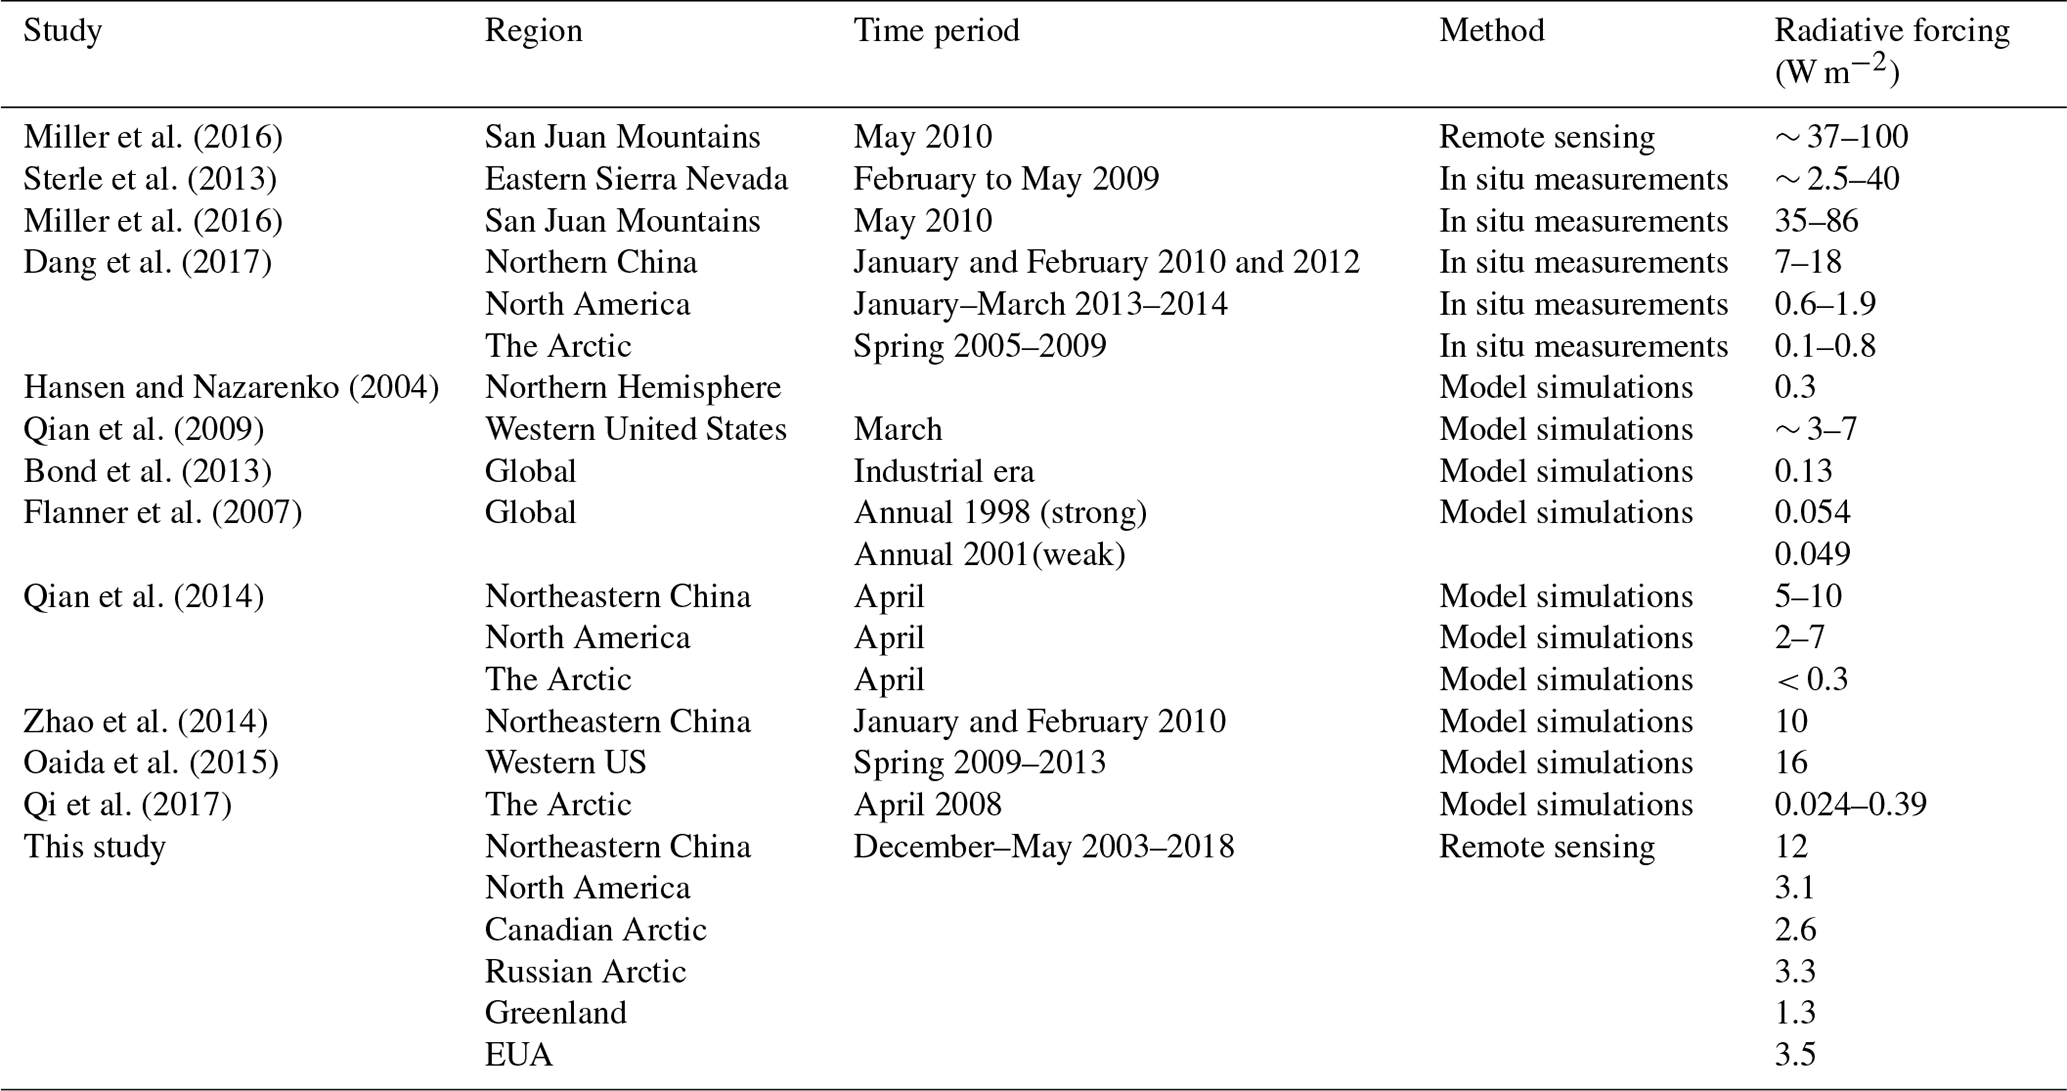
Dang et al. (2017) reported RFLS values of 7–18, 0.6–1.9, and 0.1–0.8 W m−2 for northern China, North America, and the Arctic, respectively, which only focused on the period of January–March and therefore are smaller than our retrievals. In NA, Sterle et al. (2013) estimated a daily averaged RFLS of ∼ 2.5–40 W m−2 for the eastern Sierra Nevada in February–May 2009, while Miller et al. (2016) reported a daily RFLS of ∼ 35–86 (37–100) W m−2 based on in situ (remote-sensing) measurements in the San Juan Mountains in May 2010. Both values are higher than our estimate (∼ 3.1 W m−2), potentially due to the significant dust deposition in those areas.
We also collected the daily average RFLS simulated by regional and/or global climate models (Table 2). For NEC, Zhao et al. (2014) and Qian et al. (2014) reported values of 10 W m−2 in January–February and 5–10 W m−2 in April, respectively. In NA, Qian et al. (2009) provided an estimate of 3–7 W m−2 for the central Rockies and southern Alberta in March, while Oaida et al. (2015) reported an average RFLS of 16 W m−2 over the western US in spring. Finally, Qian et al. (2014) and Qi et al. (2017) estimated RFLS values of < 0.3 and 0.024–0.39 W m−2 for the Arctic in April, respectively. We consider our retrievals for NEC to be comparable with these regional model simulations, despite some disparity. However, we note that our result is significantly lower than those of previous studies in NA but higher in the Arctic.
On a global scale, Hansen and Nazarenko (2004) reported an RFLS of 0.3 W m−2, while Flanner et al. (2007) showed an RFLS of ∼ 0.05 W m−2. For the Northern Hemisphere as a whole, Bond et al. (2013) estimated a climate forcing of 0.13 W m−2. Each of these previous values is significantly lower than our retrieval (∼ 2.9 W m−2). However, those studies included all areas regardless of snow cover throughout the whole year, while our results are only for Northern Hemisphere ISCA from December to May.
Overall, we consider our MODIS-based retrievals to be physically realistic on both regional and global scales, although we note a number of differences between our results and those generated by different methods. On the other hand, while in situ measurements are the most precise, their spatial coverage is restricted by logistical limitations and the extreme environments involved. Conversely, models can provide broad perspectives of climatic impacts yet are typically undermined by large uncertainty. Therefore, we argue that remote sensing provides a powerful technique with high spatial and temporal resolutions that can bridge the gap between in situ measurements and climate models and reduce the uncertainties associated with the latter. Further retrieval of remote-sensing data, including the use of multiple satellites and sensors, is therefore warranted to exploit this opportunity fully. We also indicate the fact that in parts of central EUA and the Russian Arctic, however, studies are barely performed but desired. Finally, we note that in situ observations remain limited, and more field campaigns are needed to constrain remote-sensing retrievals and modeling simulations.
We presented a global-scale evaluation of the daily radiative forcing of LAPs in the Northern Hemisphere snowpack (RFLS), estimated from remote-sensing data. The satellite-retrieved RFLS also has implications for expanding the value of limited in situ measurements, which can provide valuable information for climate models and help optimize model simulations.
Based on the corrected snow albedo reduction (), we calculated daily average RFLS () during December–May for the period 2003–2018. For the identified snow-covered area over the Northern Hemisphere as a whole, average is ∼ 0.021, and is ∼ 2.9 W m−2. We also observed distinct spatial variability in snow albedo reduction and RFLS. The highest regional-average (∼ 0.11) and (∼ 12 W m−2) occur in northeastern China, while the lowest regional averages of ∼ 0.016 and ∼ 2.6 W m−2, respectively, are observed in the Arctic. Moreover, we indicated that the semi-infinite assumption could overestimate up to ∼ 25 % of RFLS, especially for thin and patchy snow, such as midlatitudes in Eurasia and NA. In addition, if the ground-based corrections are not considered, the total uncertainty in RFLS retrievals is in the range of 15 %–108 % (lower bound of −106 % to −20 %) due to atmospheric correction, snow cover fraction calculation, and snow grain size retrieval.
Following this assessment, we made quantitative attributions of the spatial variability in snow albedo reduction and radiative forcing. Our results indicate that the LAP content is the largest contributor (84.3 %) to spatial variance in snow albedo reduction, followed by snow depth (13.7 %), whereas snow grain size (1.9 %) and the geographic factor G (< 1 %) are only minor contributors on a northern-hemispheric scale. LAP content and G account for 70.0 % and 22.3 % of the spatial variability in radiative forcing, respectively, followed by SD (7.6 %) over the Northern Hemisphere.
Retrieved RFLS values are compared spatially with the model-derived estimates of the CESM2. Our results indicate that MODIS retrievals show the same magnitude with modeled estimates for the Northern Hemisphere. However, although the CESM2 performs well in NEC, there remain large uncertainties in the Arctic. To evaluate and examine the MODIS retrievals synthetically, we then compared the retrieved RFLS to previously published estimates, including local-scale observations, remote-sensing retrievals, and regional- and global-scale model simulations. The results of this evaluation suggest that MODIS retrievals are generally realistic, despite a number of important differences among the various methods.
Finally, we urge the community to expand the ground-based measurements of the global snowpack, particularly in those regions currently lacking in situ observations. Such development would help further constrain and improve satellite-based retrievals in the future. We propose that climate models validated by these refined remote-sensing retrievals should be able to capture the RFLS more accurately, thereby providing more reliable estimates of the future impacts of global climate change.
MODIS data can be found at https://earthdata.nasa.gov/ (Schaaf and Wang, 2015; Hall and Riggs, 2016; Platnick et al., 2015; Friedl and Sulla-Menashe, 2015) (last access: 20 January 2019). CERES data can be found from NASA's Clouds and the Earth's Radiant Energy System at https://ceres.larc.nasa.gov (NASA/LARC/SD/ASDC, 2017) (last access: 12 April 2019). Shuttle Radar Topography Mission (SRTM) digital elevation data are provided by the US Geological Survey at https://www.usgs.gov/ (Jarvis et al., 2008) (last access: 9 December 2018). Snow depth can be found from ERA-Interim at https://www.ecmwf.int (Dee et al., 2011) (last access: 15 January 2019). BC emission data can be found at http://inventory.pku.edu.cn (R. Wang et al., 2014) (last access: 5 June 2019). BC deposition data can be found at https://gmao.gsfc.nasa.gov/reanalysis/MERRA-2/ (Randles t al., 2017) (last access: 5 June 2019). CMIP6 data can be found at https://esgf-node.llnl.gov/ (Eyring et al., 2016) (last access: 15 July 2019). Surface measurement data sets are from Wang et al. (2013, 2017), Ye et al. (2012), and Doherty et al. (2010, 2014). Springtime radiative forcing due to LAPs in snow is derived from a global circulation model (GCM) run by Flanner et al. (2007).
The supplement related to this article is available online at: https://doi.org/10.5194/acp-21-269-2021-supplement.
WP and XW designed the study and developed the overarching research goals and aims. JC carried the study out and wrote the first draft with contributions from all co-authors. JC and TS applied formal techniques such as statistical, mathematical, and computational methods to analyze study data. YZ prepared input data and managed activities to annotate, scrub data, and maintain research data. DW completed the implementation of the computer code and supporting algorithms used for the calculations in this study. WP and XW assumed oversight and leadership responsibility for the research activity planning and execution. All authors contributed to the improvement of results and revised the final paper.
The authors declare that they have no conflict of interest.
This research was supported jointly by the National Key R&D Program of China (grant no. 2019YFA0606801), the National Natural Science Foundation of China (grant nos. 41975157, 41775144, and 41875091), and the China Postdoctoral Science Foundation (grant no. 2020M673530). We are grateful for the constructive comments and suggestions from the editor Nikos Hatzianastassiou and the referee Edward Bair as well as the two anonymous referees.
This research has been supported by the National Key R&D Program of China (grant no. 2019YFA0606800), the National Natural Science Foundation of China (grant nos. 41975157, 41775144, and 41875091), and the China Postdoctoral Science Foundation (grant no. 2020M673530).
This paper was edited by Nikos Hatzianastassiou and reviewed by Edward Bair and two anonymous referees.
Bair, E. H., Rittger, K., Skiles, S. M., and Dozier, J.: An Examination of Snow Albedo Estimates From MODIS and Their Impact on Snow Water Equivalent Reconstruction, Water Resour. Res., 55, 7826–7842, https://doi.org/10.1029/2019wr024810, 2019.
Barnett, T. P., Adam, J. C., and Lettenmaier, D. P.: Potential impacts of a warming climate on water availability in snow-dominated regions, Nature, 438, 303–309, https://doi.org/10.1038/nature04141, 2005.
Berrisford, P., Kållberg, P., Kobayashi, S., Dee, D., Uppala, S., Simmons, A. J., Poli, P., and Sato, H.: Atmospheric conservation properties in ERA-Interim, Q. J. Roy. Meteor. Soc., 137, 1381–1399, https://doi.org/10.1002/qj.864, 2011.
Bond, T. C., Habib, G., and Bergstrom, R. W.: Limitations in the enhancement of visible light absorption due to mixing state, J. Geophys. Res.,111, D20211, https://doi.org/10.1029/2006jd007315, 2006.
Bond, T. C., Doherty, S. J., Fahey, D. W., Forster, P. M., Berntsen, T., DeAngelo, B. J., Flanner, M. G., Ghan, S., Kärcher, B., Koch, D., Kinne, S., Kondo, Y., Quinn, P. K., Sarofim, M. C., Schultz, M. G., Schulz, M., Venkataraman, C., Zhang, H., Zhang, S., Bellouin, N., Guttikunda, S. K., Hopke, P. K., Jacobson, M. Z., Kaiser, J. W., Klimont, Z., Lohmann, U., Schwarz, J. P., Shindell, D., Storelvmo, T., Warren, S. G., and Zender, C. S.: Bounding the role of black carbon in the climate system: A scientific assessment, J. Geophys. Res.-Atmos., 118, 5380–5552, https://doi.org/10.1002/jgrd.50171, 2013.
Brandt, R. E., Warren, S. G., and Clarke, A. D.: A controlled snowmaking experiment testing the relation between black carbon content and reduction of snow albedo, J. Geophys. Res., 116, D08109, https://doi.org/10.1029/2010jd015330, 2011.
Brown, R. D. and Mote, P. W.: The Response of Northern Hemisphere Snow Cover to a Changing Climate, J. Climate, 22, 2124–2145, https://doi.org/10.1175/2008jcli2665.1, 2009.
Brun, E., Vionnet, V., Boone, A., Decharme, B., Peings, Y., Valette, R., Karbou, F., and Morin, S.: Simulation of Northern Eurasian Local Snow Depth, Mass, and Density Using a Detailed Snowpack Model and Meteorological Reanalyses, J. Hydrometeorol., 14, 203–219, https://doi.org/10.1175/jhm-d-12-012.1, 2013.
Bryant, A. C., Painter, T. H., Deems, J. S., and Bender, S. M.: Impact of dust radiative forcing in snow on accuracy of operational runoff prediction in the Upper Colorado River Basin, Geophys. Res. Lett., 40, 3945–3949, https://doi.org/10.1002/grl.50773, 2013.
Danabasoglu, G., Lamarque, J. F., Bacmeister, J., Bailey, D. A., DuVivier, A. K., Edwards, J., Emmons, L. K., Fasullo, J., Garcia, R., Gettelman, A., Hannay, C., Holland, M. M., Large, W. G., Lauritzen, P. H., Lawrence, D. M., Lenaerts, J. T. M., Lindsay, K., Lipscomb, W. H., Mills, M. J., Neale, R., Oleson, K. W., Otto-Bliesner, B., Phillips, A. S., Sacks, W., Tilmes, S., Kampenhout, L., Vertenstein, M., Bertini, A., Dennis, J., Deser, C., Fischer, C., Fox-Kemper, B., Kay, J. E., Kinnison, D., Kushner, P. J., Larson, V. E., Long, M. C., Mickelson, S., Moore, J. K., Nienhouse, E., Polvani, L., Rasch, P. J., and Strand, W. G.: The Community Earth System Model Version 2 (CESM2), J. Adv. Model. Earth Sy., 12, e2019MS001916, https://doi.org/10.1029/2019ms001916, 2020.
Dang, C., Brandt, R. E., and Warren, S. G.: Parameterizations for narrowband and broadband albedo of pure snow and snow containing mineral dust and black carbon, J. Geophys. Res.-Atmos., 120, 5446–5468, https://doi.org/10.1002/2014jd022646, 2015.
Dang, C., Warren, S. G., Fu, Q., Doherty, S. J., Sturm, M., and Su, J.: Measurements of light-absorbing particles in snow across the Arctic, North America, and China: Effects on surface albedo, J. Geophys. Res.-Atmos., 122, 10149–10168, 2017.
Dee, D. P., Uppala, S. M., Simmons, A. J., Berrisford, P., Poli, P., Kobayashi, S., Andrae, U., Balmaseda, M. A., Balsamo, G., Bauer, P., Bechtold, P., Beljaars, A. C. M., van de Berg, L., Bidlot, J., Bormann, N., Delsol, C., Dragani, R., Fuentes, M., Geer, A. J., Haimberger, L., Healy, S. B., Hersbach, H., Hólm, E. V., Isaksen, L., Kållberg, P., Köhler, M., Matricardi, M., McNally, A. P., Monge-Sanz, B. M., Morcrette, J. J., Park, B. K., Peubey, C., de Rosnay, P., Tavolato, C., Thépaut, J. N., and Vitart, F.: The ERA-Interim reanalysis: configuration and performance of the data assimilation system, Q. J. Roy. Meteor. Soc., 137, 553–597, https://doi.org/10.1002/qj.828, 2011.
Di Mauro, B., Fava, F., Ferrero, L., Garzonio, R., Baccolo, G., Delmonte, B., and Colombo, R.: Mineral dust impact on snow radiative properties in the European Alps combining ground, UAV, and satellite observations, J. Geophys. Res.-Atmos., 120, 6080–6097, https://doi.org/10.1002/2015jd023287, 2015.
Doelling, D. R., Loeb, N. G., Keyes, D. F., Nordeen, M. L., Morstad, D., Nguyen, C., Wielicki, B. A., Young, D. F., and Sun, M.: Geostationary Enhanced Temporal Interpolation for CERES Flux Products, J. Atmos. Ocean. Tech., 30, 1072–1090, https://doi.org/10.1175/jtech-d-12-00136.1, 2013.
Doherty, S. J., Warren, S. G., Grenfell, T. C., Clarke, A. D., and Brandt, R. E.: Light-absorbing impurities in Arctic snow, Atmos. Chem. Phys., 10, 11647–11680, https://doi.org/10.5194/acp-10-11647-2010, 2010.
Doherty, S. J., Dang, C., Hegg, D. A., Zhang, R., and Warren, S. G.: Black carbon and other light-absorbing particles in snow of central North America, J. Geophys. Res.-Atmos., 119, 807–831, https://doi.org/10.1002/2014jd022350, 2014.
Drusch, M., Vasiljevic, D., and Viterbo, P.: ECMWF's Global Snow Analysis: Assessment and Revision Based on Satellite Observations, J. Appl. Meteorol., 43, 1282–1294, https://doi.org/10.1175/1520-0450(2004)043<1282:egsaaa>2.0.co;2, 2004.
Eyring, V., Bony, S., Meehl, G. A., Senior, C. A., Stevens, B., Stouffer, R. J., and Taylor, K. E.: Overview of the Coupled Model Intercomparison Project Phase 6 (CMIP6) experimental design and organization, Geosci. Model Dev., 9, 1937–1958, https://doi.org/10.5194/gmd-9-1937-2016, 2016.
Flanner, M. G., Zender, C. S., Randerson, J. T., and Rasch, P. J.: Present-day climate forcing and response from black carbon in snow, J. Geophys. Res., 112, D11202, https://doi.org/10.1029/2006jd008003, 2007.
Flanner, M. G., Zender, C. S., Hess, P. G., Mahowald, N. M., Painter, T. H., Ramanathan, V., and Rasch, P. J.: Springtime warming and reduced snow cover from carbonaceous particles, Atmos. Chem. Phys., 9, 2481–2497, https://doi.org/10.5194/acp-9-2481-2009, 2009.
Flanner, M. G., Shell, K. M., Barlage, M., Perovich, D. K., and Tschudi, M. A.: Radiative forcing and albedo feedback from the Northern Hemisphere cryosphere between 1979 and 2008, Nat. Geosci., 4, 151–155, https://doi.org/10.1038/ngeo1062, 2011.
Friedl, M. and Sulla-Menashe, D.: MCD12C1 MODIS/Terra+Aqua Land Cover Type Yearly L3 Global 0.05Deg CMG V006, NASA EOSDIS Land Processes DAAC, https://doi.org/10.5067/MODIS/MCD12C1.006, 2015.
Fu, Y., Zhu, J., Yang, Y., Yuan, R., Liu, G., Xian, T., and Liu, P.: Grid-cell aerosol direct shortwave radiative forcing calculated using the SBDART model with MODIS and AERONET observations: An application in winter and summer in eastern China, Adv. Atmos. Sci., 34, 952–964, https://doi.org/10.1007/s00376-017-6226-z, 2017.
Grell, G. A., Peckham, S. E., Schmitz, R., McKeen, S. A., Frost, G., Skamarock, W. C., and Eder, B.: Fully coupled “online” chemistry within the WRF model, Atmos. Environ., 39, 6957–6975, https://doi.org/10.1016/j.atmosenv.2005.04.027, 2005.
Grenfell, T. C., Doherty, S. J., Clarke, A. D., and Warren, S. G.: Light absorption from particulate impurities in snow and ice determined by spectrophotometric analysis of filters, Appl. Optics, 50, 2037–2048, https://doi.org/10.1364/AO.50.002037, 2011.
Hadley, O. L. and Kirchstetter, T. W.: Black-carbon reduction of snow albedo, Nat. Clim. Change, 2, 437–440, https://doi.org/10.1038/nclimate1433, 2012.
Hall, D. K. and Riggs, G. A.: MODIS/Aqua Snow Cover Daily L3 Global 0.05Deg CMG Version 6, NASA National Snow and Ice Data Center Distributed Active Archive Center, https://doi.org/10.5067/MODIS/MYD10C1.006, 2016.
Hansen, J. and Nazarenko, L.: Soot climate forcing via snow and ice albedos, P. Natl. Acad. Sci. USA, 101, 423–428, 2004.
Hegg, D. A., Warren, S. G., Grenfell, T. C., Doherty, S. J., Larson, T. V., and Clarke, A. D.: Source attribution of black carbon in Arctic snow, Environ. Sci. Technol., 43, 4016–4021, https://doi.org/10.1021/es803623f, 2009.
Huang, J. P. and Yi, Y. H.: Inversion of a nonlinear dynamic-model from the observation, Sci. China Chem., 34, 1246–1246, 1991.
Huang, J., Fu, Q., Zhang, W., Wang, X., Zhang, R., Ye, H., and Warren, S. G.: Dust and Black Carbon in Seasonal Snow Across Northern China, B. Am. Meteorol. Soc., 92, 175–181, https://doi.org/10.1175/2010bams3064.1, 2011.
Jarvis, A., Reuter, H. I., Nelson, A., and Guevara, E.: Hole-filled seamless SRTM data V4, International Centre for Tropical Agriculture (CIAT), available at: http://srtm.csi.cgiar.org (last access: 1 October 2020), 2008.
Kaspari, S., Painter, T. H., Gysel, M., Skiles, S. M., and Schwikowski, M.: Seasonal and elevational variations of black carbon and dust in snow and ice in the Solu-Khumbu, Nepal and estimated radiative forcings, Atmos. Chem. Phys., 14, 8089–8103, https://doi.org/10.5194/acp-14-8089-2014, 2014.
Lee, L. A., Reddington, C. L., and Carslaw, K. S.: On the relationship between aerosol model uncertainty and radiative forcing uncertainty, P. Natl. Acad. Sci. USA, 113, 5820–5827, https://doi.org/10.1073/pnas.1507050113, 2016.
Lewis, P. and Barnsley, M.: Influence of the sky radiance distribution on various formulations of the earth surface albedo, in: 6th International Symposium on Physical Measurements and Signatures in Remote Sensing, Val d'Isère, France, 17–21 January 1994, 707–715, 1994.
Liou, K. N., Takano, Y., He, C., Yang, P., Leung, L. R., Gu, Y., and Lee, W. L.: Stochastic parameterization for light absorption by internally mixed BC/dust in snow grains for application to climate models, J. Geophys. Res.-Atmos., 119, 7616–7632, https://doi.org/10.1002/2014jd021665, 2014.
Loeb, N. G., Doelling, D. R., Wang, H., Su, W., Nguyen, C., Corbett, J. G., Liang, L., Mitrescu, C., Rose, F. G., and Kato, S.: Clouds and the Earth's Radiant Energy System (CERES) Energy Balanced and Filled (EBAF) Top-of-Atmosphere (TOA) Edition-4.0 Data Product, J. Climate, 31, 895–918, https://doi.org/10.1175/jcli-d-17-0208.1, 2018.
Manninen, T., Anttila, K., Jääskeläinen, E., Riihelä, A., Peltoniemi, J., Räisänen, P., Lahtinen, P., Siljamo, N., Thölix, L., Meinander, O., Kontu, A., Suokanerva, H., Pirazzini, R., Suomalainen, J., Hakala, T., Kaasalainen, S., Kaartinen, H., Kukko, A., Hautecoeur, O., and Roujean, J.-L.: Effect of small-scale snow surface roughness on snow albedo and reflectance, The Cryosphere Discuss., https://doi.org/10.5194/tc-2020-154, in review, 2020.
Meinander, O., Kazadzis, S., Arola, A., Riihelä, A., Räisänen, P., Kivi, R., Kontu, A., Kouznetsov, R., Sofiev, M., Svensson, J., Suokanerva, H., Aaltonen, V., Manninen, T., Roujean, J.-L., and Hautecoeur, O.: Spectral albedo of seasonal snow during intensive melt period at Sodankylä, beyond the Arctic Circle, Atmos. Chem. Phys., 13, 3793–3810, https://doi.org/10.5194/acp-13-3793-2013, 2013.
Miller, S. D., Wang, F., Burgess, A. B., Skiles, S. M., Rogers, M., and Painter, T. H.: Satellite-Based Estimation of Temporally Resolved Dust Radiative Forcing in Snow Cover, J. Hydrometeorol., 17, 1999–2011, 2016.
NASA/LARC/SD/ASDC: CERES and GEO-Enhanced TOA, Within-Atmosphere and Surface Fluxes, Clouds and Aerosols Daily Terra-Aqua Edition4A, NASA Langley Atmospheric Science Data Center DAAC, https://doi.org/10.5067/Terra+Aqua/CERES/SYN1degDay_L3.004A, 2017.
Negi, H. S. and Kokhanovsky, A.: Retrieval of snow grain size and albedo of western Himalayan snow cover using satellite data, The Cryosphere, 5, 831–847, https://doi.org/10.5194/tc-5-831-2011, 2011.
Nolin, A. W. and Dozier, J.: Estimating snow grain size using AVIRIS data, Remote Sens. Environ., 44, 231–238, https://doi.org/10.1016/0034-4257(93)90018-s, 1993.
Nolin, A. W. and Dozier, J.: A Hyperspectral Method for Remotely Sensing the Grain Size of Snow, Remote Sens. Environ., 74, 207–216, https://doi.org/10.1016/s0034-4257(00)00111-5, 2000.
Oaida, C. M., Xue, Y., Flanner, M. G., Skiles, S. M., De Sales, F., and Painter, T. H.: Improving snow albedo processes in WRF/SSiB regional climate model to assess impact of dust and black carbon in snow on surface energy balance and hydrology over western US, J. Geophys. Res.-Atmos., 120, 3228–3248, https://doi.org/10.1002/2014jd022444, 2015.
Painter, T. H., Roberts, D. A., Green, R. O., and Dozier, J.: The Effect of Grain Size on Spectral Mixture Analysis of Snow-Covered Area from AVIRIS Data, Remote Sens. Environ., 65, 320–332, https://doi.org/10.1016/s0034-4257(98)00041-8, 1998.
Painter, T. H., Barrett, A. P., Landry, C. C., Neff, J. C., Cassidy, M. P., Lawrence, C. R., McBride, K. E., and Farmer, G. L.: Impact of disturbed desert soils on duration of mountain snow cover, Geophys. Res. Lett., 34, L12502, https://doi.org/10.1029/2007gl030284, 2007.
Painter, T. H., Rittger, K., McKenzie, C., Slaughter, P., Davis, R. E., and Dozier, J.: Retrieval of subpixel snow covered area, grain size, and albedo from MODIS, Remote Sens. Environ., 113, 868–879, https://doi.org/10.1016/j.rse.2009.01.001, 2009.
Painter, T. H., Bryant, A. C., and Skiles, S. M.: Radiative forcing by light absorbing impurities in snow from MODIS surface reflectance data, Geophys. Res. Lett., 39, L17502, https://doi.org/10.1029/2012gl052457, 2012a.
Painter, T. H., Skiles, S. M., Deems, J. S., Bryant, A. C., and Landry, C. C.: Dust radiative forcing in snow of the Upper Colorado River Basin: 1. A 6 year record of energy balance, radiances, and dust concentrations, Water Resour. Res., 48, W07522, https://doi.org/10.1029/2012wr011985, 2012b.
Painter, T. H., Seidel, F. C., Bryant, A. C., McKenzie Skiles, S., and Rittger, K.: Imaging spectroscopy of albedo and radiative forcing by light-absorbing impurities in mountain snow, J. Geophys. Res.-Atmos., 118, 9511–9523, https://doi.org/10.1002/jgrd.50520, 2013.
Platnick, S., King, M., and Hubanks, P.: MODIS Atmosphere L3 Daily Product, NASA MODIS Adaptive Processing System, https://doi.org/10.5067/MODIS/MYD08_D3.061, 2015.
Pu, W., Wang, X., Wei, H., Zhou, Y., Shi, J., Hu, Z., Jin, H., and Chen, Q.: Properties of black carbon and other insoluble light-absorbing particles in seasonal snow of northwestern China, The Cryosphere, 11, 1213–1233, https://doi.org/10.5194/tc-11-1213-2017, 2017.
Pu, W., Cui, J., Shi, T., Zhang, X., He, C., and Wang, X.: The remote sensing of radiative forcing by light-absorbing particles (LAPs) in seasonal snow over northeastern China, Atmos. Chem. Phys., 19, 9949–9968, https://doi.org/10.5194/acp-19-9949-2019, 2019.
Qi, L., Li, Q., Henze, D. K., Tseng, H.-L., and He, C.: Sources of springtime surface black carbon in the Arctic: an adjoint analysis for April 2008, Atmos. Chem. Phys., 17, 9697–9716, https://doi.org/10.5194/acp-17-9697-2017, 2017.
Qian, Y., Gustafson, W. I., Leung, L. R., and Ghan, S. J.: Effects of soot-induced snow albedo change on snowpack and hydrological cycle in western United States based on Weather Research and Forecasting chemistry and regional climate simulations, J. Geophys. Res., 114, D03108, https://doi.org/10.1029/2008jd011039, 2009.
Qian, Y., Flanner, M. G., Leung, L. R., and Wang, W.: Sensitivity studies on the impacts of Tibetan Plateau snowpack pollution on the Asian hydrological cycle and monsoon climate, Atmos. Chem. Phys., 11, 1929–1948, https://doi.org/10.5194/acp-11-1929-2011, 2011.
Qian, Y., Wang, H., Zhang, R., Flanner, M. G., and Rasch, P. J.: A sensitivity study on modeling black carbon in snow and its radiative forcing over the Arctic and Northern China, Environ. Res. Lett., 9, 064001, https://doi.org/10.1088/1748-9326/9/6/064001, 2014.
Qian, Y., Yasunari, T. J., Doherty, S. J., Flanner, M. G., Lau, W. K. M., Ming, J., Wang, H., Wang, M., Warren, S. G., and Zhang, R.: Light-absorbing particles in snow and ice: Measurement and modeling of climatic and hydrological impact, Adv. Atmos. Sci., 32, 64–91, https://doi.org/10.1007/s00376-014-0010-0, 2015.
Ramanathan, V. and Carmichael, G.: Global and regional climate changes due to black carbon, Nat. Geosci., 1, 221–227, https://doi.org/10.1038/ngeo156, 2008.
Randles, C. A., da Silva, A. M., Buchard, V., Colarco, P. R., Darmenov, A., Govindaraju, R., Smirnov, A., Holben, B., Ferrare, R., Hair, J., Shinozuka, Y., and Flynn, C. J.: The MERRA-2 Aerosol Reanalysis, 1980 Onward, Part I: System Description and Data Assimilation Evaluation, J. Climate, 30, 6823–6850, https://doi.org/10.1175/jcli-d-16-0609.1, 2017.
Ricchiazzi, P., Yang, S., Gautier, C., and Sowle, D.: SBDART: A Research and Teaching Software Tool for Plane-Parallel Radiative Transfer in the Earth's Atmosphere, B. Am. Meteorol. Soc., 79, 2101–2114, https://doi.org/10.1175/1520-0477(1998)079<2101:sarats>2.0.co;2, 1998.
Riggs, G. A., Hall, D. K., and Román, M. O.: MODIS snow products collection 6 user guide, National Snow and Ice Data Center, Boulder, CO, USA, 66 pp., 2016.
Rittger, K., Painter, T. H., and Dozier, J.: Assessment of methods for mapping snow cover from MODIS, Adv. Water Resour., 51, 367–380, https://doi.org/10.1016/j.advwatres.2012.03.002, 2013.
Seidel, F. C., Rittger, K., Skiles, S. M., Molotch, N. P., and Painter, T. H.: Case study of spatial and temporal variability of snow cover, grain size, albedo and radiative forcing in the Sierra Nevada and Rocky Mountain snowpack derived from imaging spectroscopy, The Cryosphere, 10, 1229–1244, https://doi.org/10.5194/tc-10-1229-2016, 2016.
Schaaf, C. and Wang, Z.: MCD43C3 MODIS/Terra+Aqua BRDF/Albedo Albedo Daily L3 Global 0.05Deg CMG V006, NASA EOSDIS Land Processes DAAC, https://doi.org/10.5067/MODIS/MCD43C3.006, 2015.
Shi, T., Pu, W., Zhou, Y., Cui, J., Zhang, D., and Wang, X.: Albedo of Black Carbon-Contaminated Snow Across Northwestern China and the Validation With Model Simulation, J. Geophys. Res.-Atmos., 125, e2019JD032065, https://doi.org/10.1029/2019JD032065, 2020.
Siegmund, A. and Menz, G.: Fernes nah gebracht – Satelliten- und Luftbildeinsatz zur Analyse von Umweltveränderungen im Geographieunterricht, Geographie und Schule, 154, 2–10, 2005.
Skamarock, W. C., Klemp, J. B., Dudhia, J., Gill, D. O., Barker, D. M., Duda, M. G., Huang, X., Wang, W., and Powers, J. G.: A description of the advanced research WRF version 3, NCARTech. Note, NCAR/TN-475CSTR, National Center for Atmospheric Research, Boulder, CO, USA, available at: http://www.mmm.ucar.edu/wrf/users/docs/arw_v3.pdf (last access: 10 October 2020), 2016.
Skiles, S. M., Flanner, M., Cook, J. M., Dumont, M., and Painter, T. H.: Radiative forcing by light-absorbing particles in snow, Nat. Clim. Change, 8, 964–971, https://doi.org/10.1038/s41558-018-0296-5, 2018.
Stamnes, K., Tsay, S. C., Wiscombe, W., and Jayaweera, K.: Numerically stable algorithm for discrete-ordinate-method radiative transfer in multiple scattering and emitting layered media, Appl. Optics, 27, 2502–2509, https://doi.org/10.1364/AO.27.002502, 1988.
Sterle, K. M., McConnell, J. R., Dozier, J., Edwards, R., and Flanner, M. G.: Retention and radiative forcing of black carbon in eastern Sierra Nevada snow, The Cryosphere, 7, 365–374, https://doi.org/10.5194/tc-7-365-2013, 2013.
Sturm, M., Holmgren, J., and Liston, G. E.: A Seasonal Snow Cover Classification System for Local to Global Applications, J. Climate, 8, 1261–1283, https://doi.org/10.1175/1520-0442(1995)008<1261:assccs>2.0.co;2, 1995.
Su, W., Corbett, J., Eitzen, Z., and Liang, L.: Next-generation angular distribution models for top-of-atmosphere radiative flux calculation from CERES instruments: validation, Atmos. Meas. Tech., 8, 3297–3313, https://doi.org/10.5194/amt-8-3297-2015, 2015.
TanrÉ, D., Deroo, C., Duhaut, P., Herman, M., Morcrette, J. J., Perbos, J., and Deschamps, P. Y.: Technical note Description of a computer code to simulate the satellite signal in the solar spectrum: the 5S code, Int. J. Remote Sens., 11, 659–668, https://doi.org/10.1080/01431169008955048, 1990.
Tedesco, M. and Kokhanovsky, A. A.: The semi-analytical snow retrieval algorithm and its application to MODIS data, Remote Sens. Environ., 111, 228–241, https://doi.org/10.1016/j.rse.2007.02.036, 2007.
Teillet, P. M., Guindon, B., and Goodenough, D. G.: On the Slope-Aspect Correction of Multispectral Scanner Data, Can. J. Remote Sens., 8, 84–106, https://doi.org/10.1080/07038992.1982.10855028, 1982.
Toon, O. B., McKay, C. P., Ackerman, T. P., and Santhanam, K.: Rapid calculation of radiative heating rates and photodissociation rates in inhomogeneous multiple scattering atmospheres, J. Geophys. Res., 94, 16287, https://doi.org/10.1029/JD094iD13p16287, 1989.
Wang, R., Tao, S., Balkanski, Y., Ciais, P., Boucher, O., Liu, J. F., Piao, S. L., Shen, H. Z., Vuolo, M. R., Valari, M., Chen, H., Chen, Y. C., Cozic, A., Huang, Y., Li, B. G., Li, W., Shen, G. F., Wang, B., and Zhang, Y. Y.: Exposure to ambient black carbon derived from a unique inventory and high-resolution model, P. Natl. Acad. Sci. USA, 111, 2459–2463, https://doi.org/10.1073/pnas.1318763111, 2014.
Wang, X., Doherty, S. J., and Huang, J.: Black carbon and other light-absorbing impurities in snow across Northern China, J. Geophys. Res.-Atmos., 118, 1471–1492, https://doi.org/10.1029/2012jd018291, 2013.
Wang, X., Xu, B., and Ming, J.: An overview of the studies on black carbon and mineral dust deposition in snow and ice cores in East Asia, J. Meteorol. Res., 28, 354–370, https://doi.org/10.1007/s13351-014-4005-7, 2014.
Wang, X., Pu, W., Ren, Y., Zhang, X., Zhang, X., Shi, J., Jin, H., Dai, M., and Chen, Q.: Observations and model simulations of snow albedo reduction in seasonal snow due to insoluble light-absorbing particles during 2014 Chinese survey, Atmos. Chem. Phys., 17, 2279–2296, https://doi.org/10.5194/acp-17-2279-2017, 2017.
Wang, X., Wei, H., Liu, J., Xu, B., Wang, M., Ji, M., and Jin, H.: Quantifying the light absorption and source attribution of insoluble light-absorbing particles on Tibetan Plateau glaciers between 2013 and 2015, The Cryosphere, 13, 309–324, https://doi.org/10.5194/tc-13-309-2019, 2019.
Wang, X., Zhang, X., and Di, W.: Development of an improved two-sphere integration technique for quantifying black carbon concentrations in the atmosphere and seasonal snow, Atmos. Meas. Tech., 13, 39–52, https://doi.org/10.5194/amt-13-39-2020, 2020.
Warneke, C., Froyd, K. D., Brioude, J., Bahreini, R., Brock, C. A., Cozic, J., de Gouw, J. A., Fahey, D. W., Ferrare, R., Holloway, J. S., Middlebrook, A. M., Miller, L., Montzka, S., Schwarz, J. P., Sodemann, H., Spackman, J. R., and Stohl, A.: An important contribution to springtime Arctic aerosol from biomass burning in Russia, Geophys. Res. Lett., 37, L01801, https://doi.org/10.1029/2009gl041816, 2010.
Warren, S. G.: Optical properties of snow, Rev. Geophys., 20, 67–89, https://doi.org/10.1029/RG020i001p00067, 1982.
Warren, S. G.: Impurities in Snow: Effects on Albedo and Snowmelt (Review), Ann. Glaciol., 5, 177–179, https://doi.org/10.3189/1984AoG5-1-177-179, 1984.
Warren, S. G.: Can black carbon in snow be detected by remote sensing?, J. Geophys. Res.-Atmos., 118, 779–786, https://doi.org/10.1029/2012jd018476, 2013.
Warren, S. G. and Brandt, R. E.: Optical constants of ice from the ultraviolet to the microwave: A revised compilation, J. Geophys. Res., 113, D14220, https://doi.org/10.1029/2007jd009744, 2008.
Wiscombe, W. J. and Warren, S. G.: A Model for the Spectral Albedo of Snow, I: Pure Snow, J. Atmos. Sci., 37, 2712–2733, https://doi.org/10.1175/1520-0469(1980)037<2712:amftsa>2.0.co;2, 1980.
Ye, H., Zhang, R., Shi, J., Huang, J., Warren, S. G., and Fu, Q.: Black carbon in seasonal snow across northern Xinjiang in northwestern China, Environ. Res. Lett., 7, 044002, https://doi.org/10.1088/1748-9326/7/4/044002, 2012.
Zhao, C., Hu, Z., Qian, Y., Ruby Leung, L., Huang, J., Huang, M., Jin, J., Flanner, M. G., Zhang, R., Wang, H., Yan, H., Lu, Z., and Streets, D. G.: Simulating black carbon and dust and their radiative forcing in seasonal snow: a case study over North China with field campaign measurements, Atmos. Chem. Phys., 14, 11475–11491, https://doi.org/10.5194/acp-14-11475-2014, 2014.
Zhong, E., Li, Q., Sun, S., Chen, S., and Chen, W.: Analysis of euphotic depth in snow with SNICAR transfer scheme, Atmos. Sci. Lett., 18, 484–490, https://doi.org/10.1002/asl.792, 2017.
Zhou, Y., Wen, H., Liu, J., Pu, W., Chen, Q., and Wang, X.: The optical characteristics and sources of chromophoric dissolved organic matter (CDOM) in seasonal snow of northwestern China, The Cryosphere, 13, 157–175, https://doi.org/10.5194/tc-13-157-2019, 2019.
Zhu, C., Kobayashi, H., Kanaya, Y., and Saito, M.: Size-dependent validation of MODIS MCD64A1 burned area over six vegetation types in boreal Eurasia: Large underestimation in croplands, Sci. Rep.-UK, 7, 4181, https://doi.org/10.1038/s41598-017-03739-0, 2017.