the Creative Commons Attribution 4.0 License.
the Creative Commons Attribution 4.0 License.
 | 17 Feb 2021
Effects of marine organic aerosols as sources of immersion-mode ice-nucleating particles on high-latitude mixed-phase clouds
Xiaohong Liu
Susannah M. Burrows
Yang Shi
Mixed-phase clouds are frequently observed in high-latitude regions and have important impacts on the surface energy budget and regional climate. Marine organic aerosol (MOA), a natural source of aerosol emitted over ∼ 70 % of Earth's surface, may significantly modify the properties and radiative forcing of mixed-phase clouds. However, the relative importance of MOA as a source of ice-nucleating particles (INPs) in comparison to mineral dust, and MOA's effects as cloud condensation nuclei (CCN) and INPs on mixed-phase clouds are still open questions. In this study, we implement MOA as a new aerosol species into the Community Atmosphere Model version 6 (CAM6), the atmosphere component of the Community Earth System Model version 2 (CESM2), and allow the treatment of aerosol–cloud interactions of MOA via droplet activation and ice nucleation. CAM6 reproduces observed seasonal cycles of marine organic matter at Mace Head and Amsterdam Island when the MOA fraction of sea spray aerosol in the model is assumed to depend on sea spray biology but fails when this fraction is assumed to be constant. Model results indicate that marine INPs dominate primary ice nucleation below 400 hPa over the Southern Ocean and Arctic boundary layer, while dust INPs are more abundant elsewhere. By acting as CCN, MOA exerts a shortwave cloud forcing change of −2.78 W m−2 over the Southern Ocean in the austral summer. By acting as INPs, MOA enhances the longwave cloud forcing by 0.35 W m−2 over the Southern Ocean in the austral winter. The annual global mean net cloud forcing changes due to CCN and INPs of MOA are −0.35 and 0.016 W m−2, respectively. These findings highlight the vital importance for Earth system models to consider MOA as an important aerosol species for the interactions of biogeochemistry, hydrological cycle, and climate change.
- Article
(6007 KB) - Full-text XML
-
Supplement
(3931 KB) - BibTeX
- EndNote


Ice crystals in clouds play a critical role in determining cloud phase, lifetime, electrification, and radiative properties. As a result, cloud ice influences precipitation and cloud radiative forcing. To quantify the impact of ice crystals on the hydrologic cycle and energy budget of the Earth system, it is important to advance the process-based understanding of initiation and evolution of ice particles. Ice particles can be initialized by homogeneous freezing or by heterogeneous nucleation. Homogeneous freezing of cloud droplets and aerosol solution droplets happens when air temperature is below approximately −38 ∘C. In mixed-phase clouds in which air temperature is between −38 and 0 ∘C, ice is initialized only by heterogeneous nucleation on ice-nucleating particles (INPs) (Vali et al., 2015).
INPs have different characteristics depending on their composition and origin. Previous studies (Hoose and Möhler, 2012; Murray et al., 2012; Kanji et al., 2017) have shown that mineral dust, primary bioaerosols (e.g., fungal spores, bacteria, and pollen), and volcanic ash can be effective INPs. However, large uncertainties exist surrounding the ice-nucleating properties of black carbon (Schill et al., 2020; Vergara-Temprado et al., 2018) and organic carbon from biomass burning and fossil fuel combustion. A majority of INPs are of terrestrial origin. Due to its large emission quantities and high efficiency at forming ice, mineral dust may play a dominant role in ice formation over continents. However, in remote oceanic regions where terrestrial INPs are rare, the aerosol species contributing to INPs and the mechanisms for ice initialization remain poorly understood. Recent observational and modeling studies have shown that marine organic aerosol (MOA) is potentially an important source of INPs over remote oceanic regions (Wilson et al., 2015; DeMott et al., 2016; Vergara-Temprado et al., 2017; Huang et al., 2018; McCluskey et al., 2019).
MOA can be generated from both primary and secondary processes during ocean biological activities, producing either water-soluble or insoluble organic aerosols. Previous studies have inferred that water-insoluble marine organic matter is mainly derived from the primary emissions of sea spray aerosols (SSAs) (Ceburnis et al., 2008). In this production process, SSAs and associated organic matter are injected into the marine boundary layer when bubbles burst at the air–sea interface. Long-term measurements of seasonal variability in SSAs (O'Dowd et al., 2004; Yoon et al., 2007; Rinaldi et al., 2013) and organic matter in remote marine air (Sciare et al., 2009) are consistent with the hypothesis that the amount of organic matter is associated with ocean biological activity. Laboratory experiments have also demonstrated that the presence of phytoplankton blooms can be associated with significant changes in the number flux and size distribution of emitted SSAs (Ault et al., 2013, Alpert et al., 2015; Rastelli et al., 2017; Forestieri et al., 2018; Christiansen et al., 2019), as well as the SSA organic content (Facchini et al., 2008; Ault et al., 2013).
Parameterizations for the primary emission of MOA have been developed with the intention to be used in models. Most of these parameterizations relate MOA emission flux to ocean chlorophyll a concentration [Chl a]. An advantage of this approach is that [Chl a] is globally available from satellite-based measurements, especially over the remote oceans where ground-based observations are difficult to conduct. Although [Chl a] makes up only a minor fraction of the organic matter in the ocean (Gardner et al., 2006), it has a long history as a widely used proxy for the biomass of phytoplankton in ocean surface waters (Steele, 1962; Cullen, 1982) and has been used to derive empirical relationships between satellite-observed [Chl a] and the observed MOA contribution to submicron SSAs. Several studies have also found that measured organic matter in SSA correlates more strongly with ocean [Chl a] than with other satellite-retrieved ocean chemistry variables, such as particulate organic carbon, dissolved organic carbon, and colored dissolved and detrital organic matter (O'Dowd et al., 2004; Sciare et al., 2009; Gantt et al., 2011; Rinaldi et al., 2013).
O'Dowd et al. (2008) proposed a MOA emission parameterization, which was further modified by Langmann et al. (2008) and Vignati et al. (2010). In this parameterization, the fraction of emitted organic matter in SSA has a linear relationship with ocean [Chl a] and is not dependent on surface wind speed. Gantt et al. (2011) took a step further, and developed an emission parameterization in which the organic matter fraction is an empirical function of ocean [Chl a], 10 m wind speed, and aerosol size. Both parameterizations from Gantt et al. (2011) and Vignati et al. (2010) were found to capture the magnitude of MOA concentrations compared to observations, but the parameterization from Gantt et al. (2011) had a better representation of seasonal variability of MOA concentrations at Amsterdam Island and Mace Head, Ireland (Meskhidze et al., 2011). Rinaldi et al. (2013) also developed a MOA emission parameterization that depends on surface wind speed and [Chl a], and by assuming an 8–10 d time lag between upwind ocean [Chl a] and enhanced production of MOA, the correlation between enriched MOA and [Chl a] was improved. Burrows et al. (2014) proposed a physically based approach to represent the MOA emission process (i.e., OCEANFILMS) instead of using the empirical [Chl a]. This method was implemented in the DOE Energy Exascale Earth System Model version 1 (E3SMv1) (Golaz et al., 2019; Rasch et al., 2019), and the cloud condensation nuclei (CCN) effect of MOA on cloud droplet activation was investigated (Burrows et al., 2018).
Recent observational evidence continuously shows the importance of MOA as INPs in natural clouds (Wilson et al., 2015; DeMott et al., 2016; McCluskey et al., 2018a, b). However, there have only been very limited modeling studies to quantify the effects of MOA INPs on clouds. Yun and Penner (2013) conducted the first global study of MOA on ice formation and radiative forcing using the CAM3 model. Their study indicated that MOA INPs are the dominant INPs for mixed-phase clouds over the Southern Hemisphere (SH), and after including MOA INPs the model generated a more reasonable ice water path (IWP) compared to the International Satellite Cloud Climatology Project (ISCCP) observation data. In their study, the model simulated the frozen fraction of MOA at −15 ∘C is 3.75 % for their lowest size bin (0.05–0.63 µm) and 100 % for their larger size bins. These values may be too high compared with both historical and recent measurements of the ice nucleation efficiency of sea surface material (Schnell and Vali, 1975; Wilson et al., 2015) and SSAs (DeMott et al., 2016; McCluskey et al., 2018b).
With more measurements of MOA and sea spray INPs becoming available, recent modeling studies have been able to improve upon past MOA INP parameterizations. Huang et al. (2018) used the ECHAM6-HAM2 model to study the MOA influence on ice formation and climate. They followed the [Chl a]-based method of Rinaldi et al. (2013) to represent the MOA emission and compared two empirical methods for calculating the MOA INP efficiency (Wilson et al., 2015; DeMott et al., 2016). They found that MOA influenced the cloud ice number concentration and effective radius only slightly, and MOA did not exert a significant influence on the global radiative balance due to compensating cloud responses. However, these conclusions also depend on the sensitivity of their model to the change in INP number concentration.
In contrast to the findings of Huang et al. (2018), Vergara-Temprado et al. (2017) and McCluskey et al. (2019) found that MOA was the dominant source of INPs over the Southern Ocean. Vergara-Temprado et al. (2017) used the Global Model of Aerosol Processes (GLOMAP) to investigate the relative importance of feldspar and MOA for ice nucleation. Ice nucleation by MOA follows the Wilson et al. (2015) parameterization. This study also found that on 10 %–30 % of days in the study period there were more MOA INPs than feldspar INPs over the Northern Hemisphere (NH) ocean. McCluskey et al. (2019) used the aerosol concentrations calculated offline from the Community Atmosphere Model version 5 (CAM5) to show that MOA is the dominant INP over the Southern Ocean. Ice nucleation by MOA follows the McCluskey et al. (2018b) parameterization.
Isolating the INP effect of MOA on clouds and radiative forcing has rarely been examined directly, which motivates our study to address MOA ice nucleation process and to better understand the climate influence of MOA INPs. Our approach is different from previous studies. For example, we use a more physically based approach (Burrows et al., 2014) to represent MOA emission instead of the empirical [Chl a]-based method used in Huang et al. (2018). Instead of the offline evaluation of INP parameterizations in CAM5 (McCluskey et al., 2019), this study implements the MOA emission and other process representations in the Community Atmosphere Model version 6 (CAM6), the latest atmosphere component of Community Earth System Model version 2 (CESM2), and allows for the impacts of MOA on modeled clouds and radiative forcing interactively. Lastly, we isolate the INP effect from the CCN effect of MOA in order to better understand the MOA influence on clouds via these two mechanisms.
This paper is organized as follows. Section 2 presents the model, the parameterizations of MOA, and the model experiments. Section 3 describes the model results and a comparison with the observations. Section 4 discusses the remaining questions. Section 5 summarizes and draws the conclusions of this study.
2.1 Model and parameterizations
CAM6 with the finite-volume (FV) dynamical core (Lin and Rood, 1997) is used in this study. CAM6 treats important physical processes in the atmosphere, including radiative transfer, deep convection, cloud macrophysics, cloud microphysics, shallow convection, and planetary boundary layer turbulence. Cloud and aerosol interactions with longwave and shortwave radiation transfer are treated by the Rapid Radiative Transfer Model for GCMs (RRTM-G) scheme (Iacono et al., 2008; Mlawer et al., 1997). A double-moment scheme (Gettelman and Morrison, 2015) is used to describe the microphysical processes of cloud and precipitation hydrometeors in large-scale stratiform clouds, while the deep convection is represented by the Zhang and McFarlane (1995) scheme. CAM6 uses the Cloud Layers Unified By Binormals (CLUBB) scheme (Golaz et al., 2002; Larson et al., 2002) to unify the representations of cloud macrophysics, turbulence, and shallow convection.
Table 1Aerosol species in MAM4 modes.
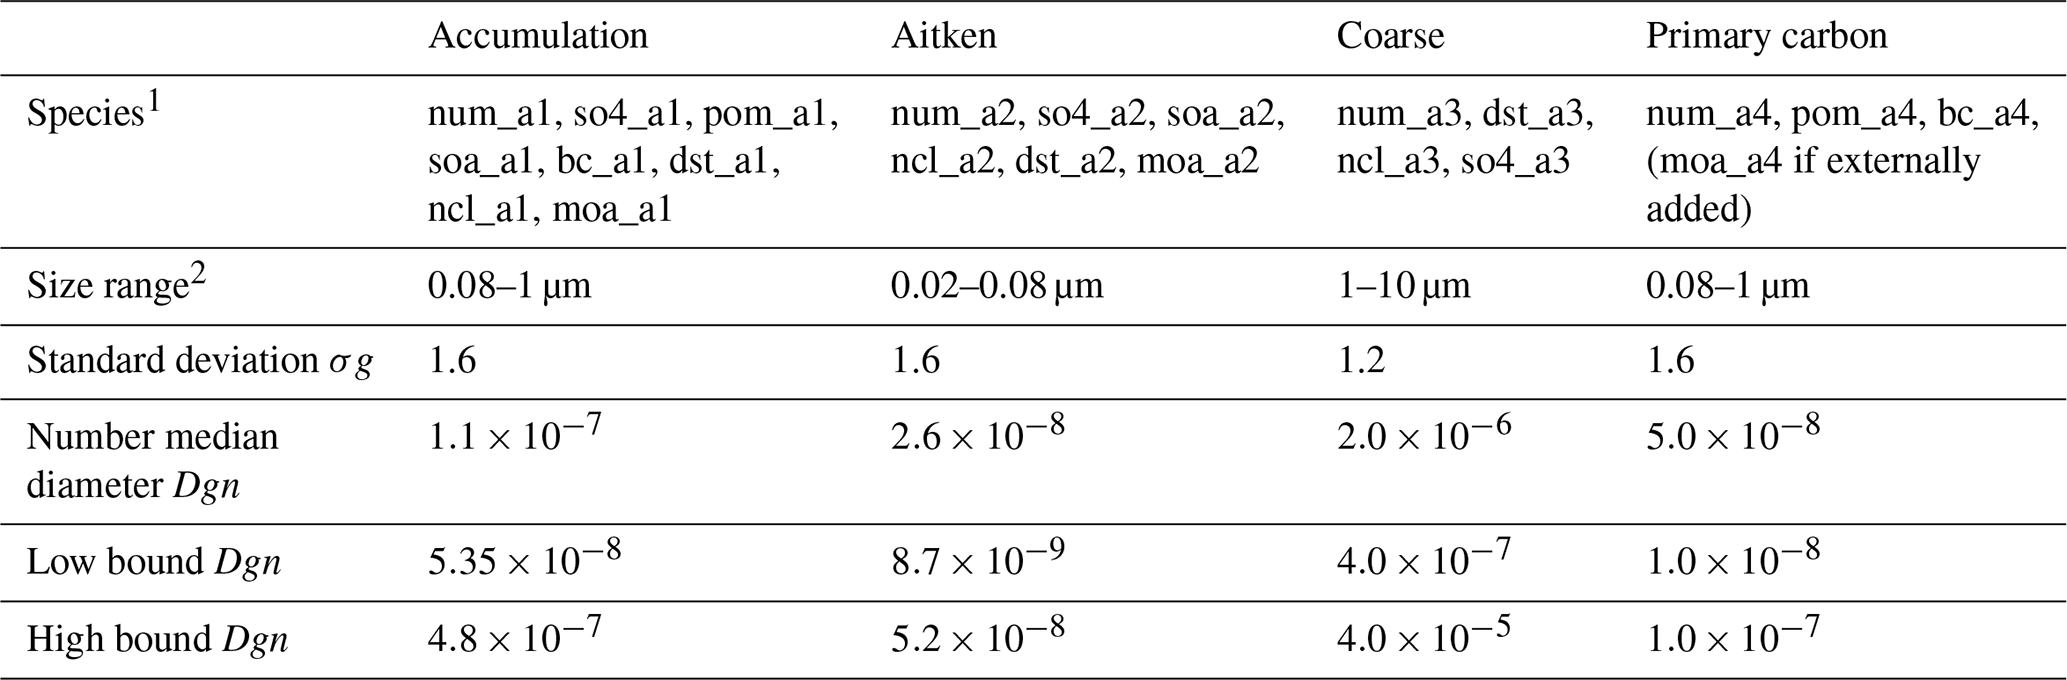
The abbreviations used in the table are defined as follows: 1 so4_aX: sulfate mass mixing ratio in mode X;
pom_aX: particulate organic matter (POM) mass mixing ratio in
mode X; soa_aX: secondary organic aerosol (SOA) mass mixing
ratio in mode X; bc_aX: black carbon (BC) mass mixing ratio
in mode X; dst_aX: dust mass mixing ratio in mode X;
ncl_aX: sea salt mass mixing ratio in mode X;
moa_aX: marine organic aerosol (MOA) mass mixing ratio in
mode X; and num_aX: number mixing ratio of mode X. The modes are indicated using the following abbreviations:
*_a1: accumulation mode; *_a2: Aitken mode;
*_a3: coarse mode; and *_a4: coarse mode.
2 The size ranges are only used for sea salt and MOA emissions. MOA
emitted in the size range of 0.08–1 µm is assigned to the primary carbon mode or accumulation mode, depending on the mixing state of MOA with sea salt (Burrows et al., 2018).
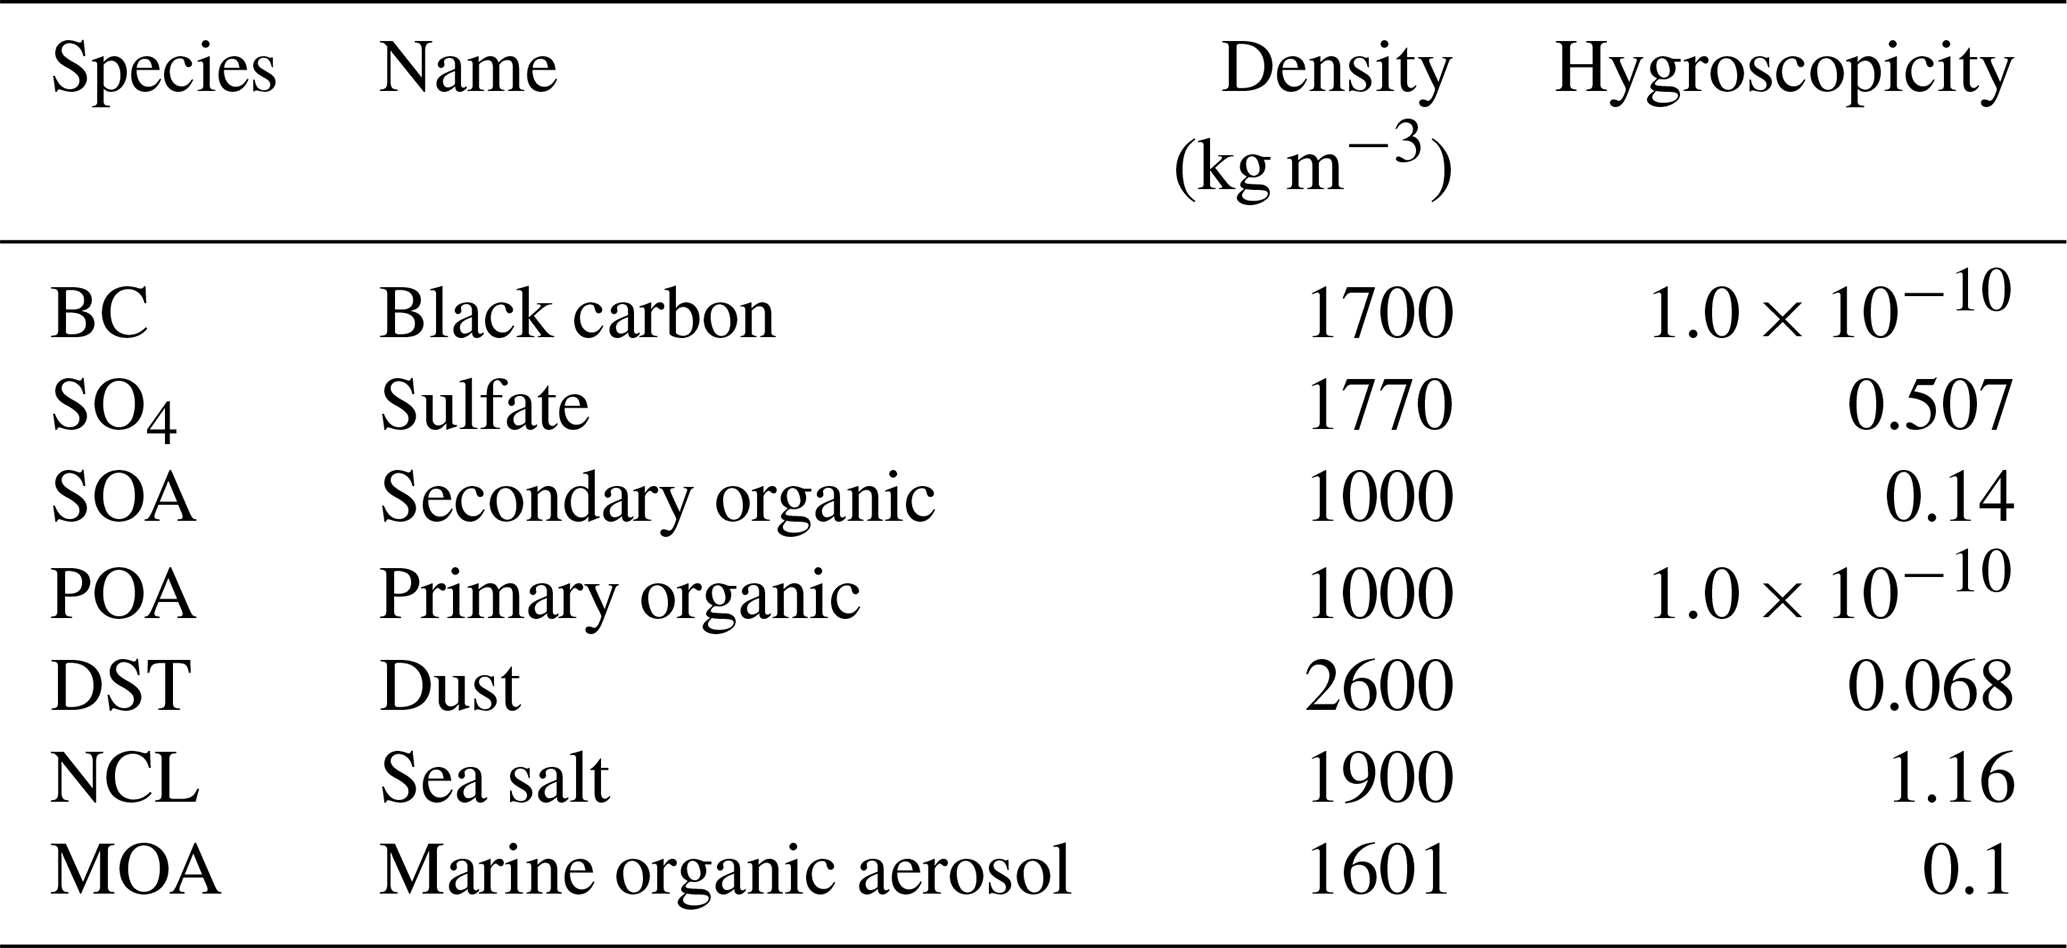
The four-mode version of the Modal Aerosol Module (MAM4), which is an extension of the three-mode version of MAM (Liu et al., 2012), is used to describe the aerosol properties and processes in CAM6 (Liu et al., 2016). MAM4 uses the modal method to represent the size distributions of four aerosol modes: Aitken, accumulation, coarse, and primary carbon. The original MAM4 encompasses six aerosol species: black carbon, dust, primary organic aerosol, sea salt, secondary organic aerosol, and sulfate (Table 1). The primary organic aerosol here refers to non-marine sources of organic matter, usually from terrestrial biomass burning, fossil fuel, and biofuel burning. Aerosol species are internally mixed within a mode and externally mixed between modes. Then the lognormal size distribution can be determined for each mode based on a prescribed geometric standard deviation (Table 1). Different aerosol species are characterized by a variety of properties such as hygroscopicity, density, and optical properties (Table 2).
MAM in CAM6 adopts the modal approach, where aerosol species are assumed to be internally mixed within a mode and externally mixed between modes. MOA is emitted into the fine aerosol modes with different assumptions of mixing state with inorganic sea salt: (1) MOA is emitted into the Aitken and accumulation modes together with sea salt in the case of internally mixed with sea salt, or (2) MOA is emitted into the Aitken and primary carbon mode separately from sea salt in the case of externally mixed with sea salt. In addition, there is another assumption of whether the experimentally derived parameterizations of SSA mass emission flux represent the total emission of MOA and sea salt or only account for the emission of sea salt. In the former case, MOA will replace the mass and number emission fluxes of sea salt. In the latter case, MOA will add onto the sea salt mass and number emission fluxes. Burrows et al. (2018) tested different combinations of the two assumptions and found that the “internally mixed” and “added” MOA approach provides the most physically realistic configuration compared to the observations. Thus, in our study we use this configuration but acknowledge that current observations do not provide precise constraints on the mixing state.
While anthropogenic aerosol and precursor gas emissions are prescribed for model simulations, emissions of natural aerosols (e.g., SSA, dust) are calculated interactively in the model. SSA in MAM is emitted following the parameterization of Mårtensson et al. (2003) for dry particle diameters from 0.020 to 2.8 µm, and Monahan et al. (1986) from 2.8 to 10 µm. The Mårtensson et al. (2003) parameterization is derived from laboratory experiments in which particles were produced by bubble bursting using a sintered glass filter in synthetic seawater. The emission rate depends linearly on the sea surface temperature and is proportional to 10 m wind speed, raised to the power of 3.41 (Monahan et al., 1986; Gong et al., 1997).
2.2 MOA in CAM6
In this study, several modifications are implemented in CAM6 in order to explicitly quantify the influence of marine organic matter on aerosols, clouds, and radiation. These modifications are comprised of (1) emission schemes of MOA, as introduced in Sect. 2.2.1, and (2) ice nucleation parameterizations for MOA, as introduced in Sect. 2.2.2.
2.2.1 Emission of MOA
Three different methods for online MOA emissions are implemented in CAM6. These methods parameterize the organic mass fraction of sea spray and use the fraction to compute MOA emissions based on the emission rate of SSA.
The mass fraction of MOA in total SSA, is defined as follows:
in which MMOA is the mass mixing ratio of MOA and Msea salt is the mass mixing ratio of sea salt. Thus, the emitted MOA mass mixing ratio can be computed as follows:
The MOA number emission flux is calculated based on the MOA mass emission flux for a given particle diameter within the emission size range (from 0.020 to 2.8 µm for the Mårtensson et al., 2003 parameterization) and particle density of MOA, the latter of which is set to be 1601 kg m−3 (Liu et al., 2012), as given in Table 2.
Differences between the three emission methods lie in how to determine the organic mass fraction . These methods are compared in this study: the first is the Langmuir isotherm-based parameterization by Burrows et al. (2014) (B14); the second is based on wind speed and [Chl a] by Gantt et al. (2011) (G11); and the third, which represents a null hypothesis, assumes a fixed mass fraction between organic matter and sea salt (NULL).
G11 emission scheme
A chlorophyll-based emission scheme of MOA was derived based on the [Chl a] and the 10 m wind speed (Gantt et al., 2011, hereafter referred to as G11). In this method, the organic mass fraction of sea spray is parameterized as follows:
where Dp is the dry diameter of particles.
B14 emission scheme
Different from the earlier empirical chlorophyll-based scheme, a physically based scheme named OCEANFILMS was proposed for modeling the relationship between emitted SSA chemistry and ocean biogeochemistry (Burrows et al. (2014), hereafter referred to as B14). The Langmuir isotherm-based mechanism is adopted to describe the organic enrichment on the bubble film. When the bubble film bursts, the film breaks up into film drops, which are suspended in the air. After evaporation of water from these droplets, the remaining suspending materials form MOA and sea salt aerosol particles. In this method, the organic matter on one side of the bubble film (per area) is determined by
where Sm is the organic mass per area at saturation (Table 3), and θ is the surface coverage fraction of organics calculated based on the Langmuir adsorption equilibrium assumption:
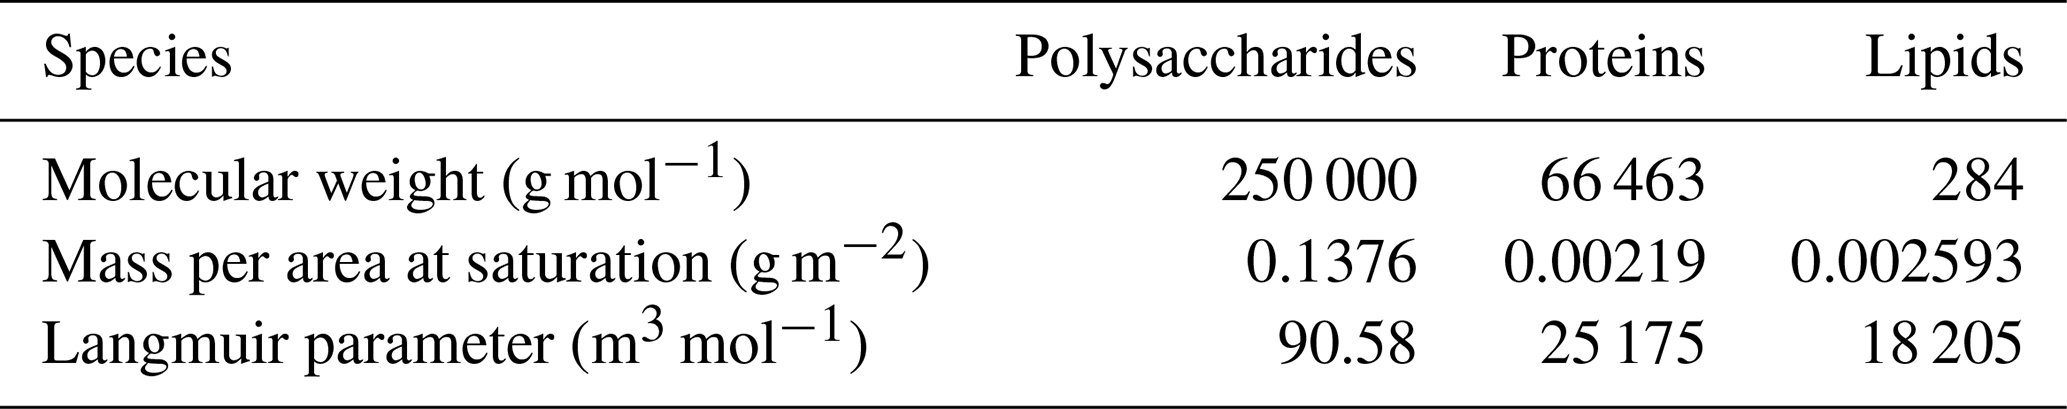
where α is the Langmuir parameter as prescribed in Table 3 and CM is the mass concentration of organic matters in the ocean. CM is prescribed from the monthly mean surface distribution of macromolecule concentrations, which is generated by ocean biogeochemical simulations (Burrows et al., 2014). In this method, three different organic classes are considered with molecular weights and mass per area at saturation as prescribed in Table 3.
Table 3Molecular weights, mass at saturation, and Langmuir parameters of the three ocean macromolecules.
Based on Eqs. (1), (4), and (5), the organic mass fraction of sea spray is expressed as follows:
where Ms_sea salt is the sea salt mass per area of bubble surface, which is set to be 0.0035875 g m−2.
Null emission hypothesis
Null hypothesis assumes that the organic mass fraction of SSA is constant and does not vary geographically or seasonally. If we are to adopt a parameterization for the seasonal dependence of MOA, it is desirable to demonstrate that the agreement with observations of MOA is improved by such a parameterization compared to the null hypothesis that no such relationship exists. The choice of the “null” hypothesis is motivated in part by Quinn et al. (2014) and Bates et al. (2020), who measured roughly constant values of in SSAs generated at sea by using a floating device to generate and sample spray during five sea-going ship campaigns. These studies measured values of roughly 0.7–0.9 in sub-0.180 µm particles and roughly 0.05–0.3 in sub-1.1 µm particles.
Loosely following the results of Quinn et al. (2014) and Bates et al. (2020), we set to 0.8 in the Aitken mode and to 0.05 in the accumulation mode (see Table 1 for the size ranges of Aitken and accumulation modes). For comparison, Facchini et al. (2008) measured SSA generated from oceanic water for its organic and salt content and found that organic matter comprised roughly 75 % of particles in the size range 0.125–0.250 µm and that this fraction decreased with increasing particle size to about 5 % of 1 µm particles. Similarly, Prather et al. (2013) analyzed sea spray generated in a wave tank during a mesocosm bloom experiment and reported that about 80 % of 0.080 µm particles were classified as organic carbon by transmission electron microscopy (TEM) with an energy-dispersive X-ray (EDX), while a low percentage of 1 µm particles were classified as either organic carbon or biological species by the aerosol TOF mass spectrometry (ATOFMS).
2.2.2 Effects of MOA on clouds as CCN and INPs
MOA is emitted into different aerosol modes depending on mixing state of MOA and sea salt (Burrows et al., 2014, 2018). In the internally mixed emission approach, MOA is emitted into the accumulation and Aitken modes along with sea salt, as shown in Table 1. In contrast, MOA is emitted into the Aitken and primary carbon modes in the externally mixed emission approach. Furthermore, the emission of MOA can replace or be added to sea salt emission in terms of mass and number in the model. Burrows et al. (2018) found that simulated MOA amounts, seasonal cycles, and impacts on CCN over the Southern Ocean show better agreement with observations under the assumption that emitted MOA is added to and internally mixed with sea salt. Thus, we used the internally mixed and added approaches for MOA emission in this study. As shown in Table 2, the hygroscopicity of MOA is set to be 0.1 following Burrows et al. (2014, 2018) compared to 1.16 for sea salt. The mode hygroscopicity is calculated as the volume-weighted average of hygroscopicities of all species in a mode, which is then used in the Abdul-Razzak and Ghan (2000) droplet activation parameterization in CAM6. The mode hygroscopicity is reduced due to lower hygroscopicity of MOA. However, based on the method to calculate sea salt emission (Liu et al., 2012) for a given aerosol mode, the added MOA mass increases the number concentrations of particles in the Aitken and accumulation modes, which overcomes the reduction in mode hygroscopicity to activate more CCN.
In this study, in addition to the CCN effect of MOA, we also include its effect on clouds as INPs. For this purpose, two different ice nucleation parameterizations for MOA are implemented in CAM6. Additionally, we examine the relative importance of MOA to dust INPs with different ice nucleation parameterizations.
W15 ice nucleation scheme of MOA
An INP parameterization for MOA was proposed based on immersion-freezing measurements of materials aerosolized from sea surface microlayer (SML) water samples collected in the North Atlantic and Arctic oceans (Wilson et al., 2015). In this parameterization (referred to hereafter as W15), the number concentration of MOA INPs is a function of temperature (T) and the total organic carbon (TOC) mass concentration, given as follows:
In which TOC is calculated as , where the , following McCluskey et al. (2018a).
W15 is developed based on the TOC in the sea surface microlayer samples, which may not be representative of ambient MOA. W15 assumes that relationship between TOC and INPs in airborne sea spray is the same as that in SML samples due to limited measurement data in the early stage. However, recent research suggests that INPs may be transferred differently from TOC during the sea spray production (Wang et al., 2017), calling this assumption into question. The quantitative importance of this selective transfer of INPs from SML to the SSAs is a topic requiring further research beyond the scope of the current study and is not accounted for here. Additionally, this approach did not attempt to correct for the possible entrainment of multiple ice-nucleating entities into a single sea spray particle.
M18 ice nucleation scheme of MOA
Another empirical INP parameterization of MOA was derived based on the correlation between ambient aerosols and INPs measured during the “clean scenario” at Mace Head Station in August 2015 (McCluskey et al., 2018a, hereafter as M18). Therefore, M18 includes the effect of physiochemical selective emission and aerosol chemistry in the air that is missed in W15. This parameterization follows the same functional form as the surface-active site density (ns) parameterization of Niemand et al. (2012) for dust but with different coefficients for MOA as given below:
MOA INP number concentration is then calculated by NINP(T)=NtotSaens(T), where Sae and Ntot are the total surface area and number mixing ratio of SSA, calculated for the Aitken and accumulation modes, respectively.
N12 ice nucleation scheme of dust
A surface-active site density-based ice nucleation scheme for immersion freezing on dust was derived by Niemand et al. (2012) (hereafter referred to as N12) based on measurements of the Aerosol Interaction and Dynamics in the Atmosphere (AIDA) cloud chamber. N12 relates the number concentration of dust INPs to the dust aerosol number concentration (Ntot), dust particle surface area (Sae, calculated based on dry diameter of particles), and the density of ice-active surface sites (ns(T)) at a given temperature T, shown as follows:
in which ns(T) is given as follows:
N12 is valid in the temperature range from −36 to −12∘.
D15 ice nucleation scheme of dust
As the N12 scheme relates INPs to all sizes of dust aerosol, it may overestimate INPs, since smaller dust aerosol (< 0.5 µm) may not be effective as INPs. An empirical ice nucleation scheme for the immersion freezing on dust aerosol with sizes larger than 0.5 µm was derived based on field and laboratory measurements (DeMott et al., 2015) (hereafter referred to as D15). The dust INP number concentration is calculated as follows:
where a = 3, b = 1.25, c = −0.46, d = 11.6, and n0.5 are the number concentrations of dust particles with diameters larger than 0.5 µm.
We note that the above ice nucleation parameterizations (W15, M18, N12, and D15) are based on empirical formulations. The default heterogeneous ice nucleation parameterization in CAM6 follows the classical nucleation theory (CNT) (Wang et al., 2014). CNT is a stochastic scheme that links the freezing rate to the number concentrations of dust and black carbon aerosols through different heterogeneous ice nucleation mechanisms (deposition, contact, and immersion). Due to large uncertainties in heterogeneous nucleation parameterizations, we conducted several ice nucleation sensitivity experiments in CAM6, as will be discussed in Sect. 2.3.
2.3 Model configurations and experiments
In this study, we carried out several numerical experiments to investigate the influence of MOA on aerosols and CCN and INP activities (Table 4). All simulations were performed for 10 years with prescribed climatological sea surface temperatures and sea ice. The first year of simulations was treated as model spin-up, and the last 9 years of simulations were used in analyses. The simulations were driven by the present-day (year 2000) aerosol and precursor gas emissions with given greenhouse gas concentrations. The model was run for 32 vertical levels from the surface up to 3 hPa with a horizontal resolution of 0.9∘ (latitudes) by 1.25∘ (longitude). We conducted two sets of experiments. The first set of experiments, as listed in Table 4, are used to test the model sensitivity to different MOA emission schemes. The baseline experiment (BASE) uses the default CAM6 model, which does not account for MOA emission and related physical processes. In addition to the BASE experiment, the B14 experiment addresses emission, advection, dry/wet deposition, and CCN effect of MOA using the Burrows et al. (2014) emission scheme. We also designed two additional experiments (G11 and NULL) to address the model sensitivity to emission methods. These simulations (B14 and G11) were conducted with the added and internally mixed MOA approaches, following Burrows et al. (2018). The INP effect of MOA is not considered in this set of experiments.
Table 4List of experiments to test model sensitivity to different emission and ice nucleation schemes.
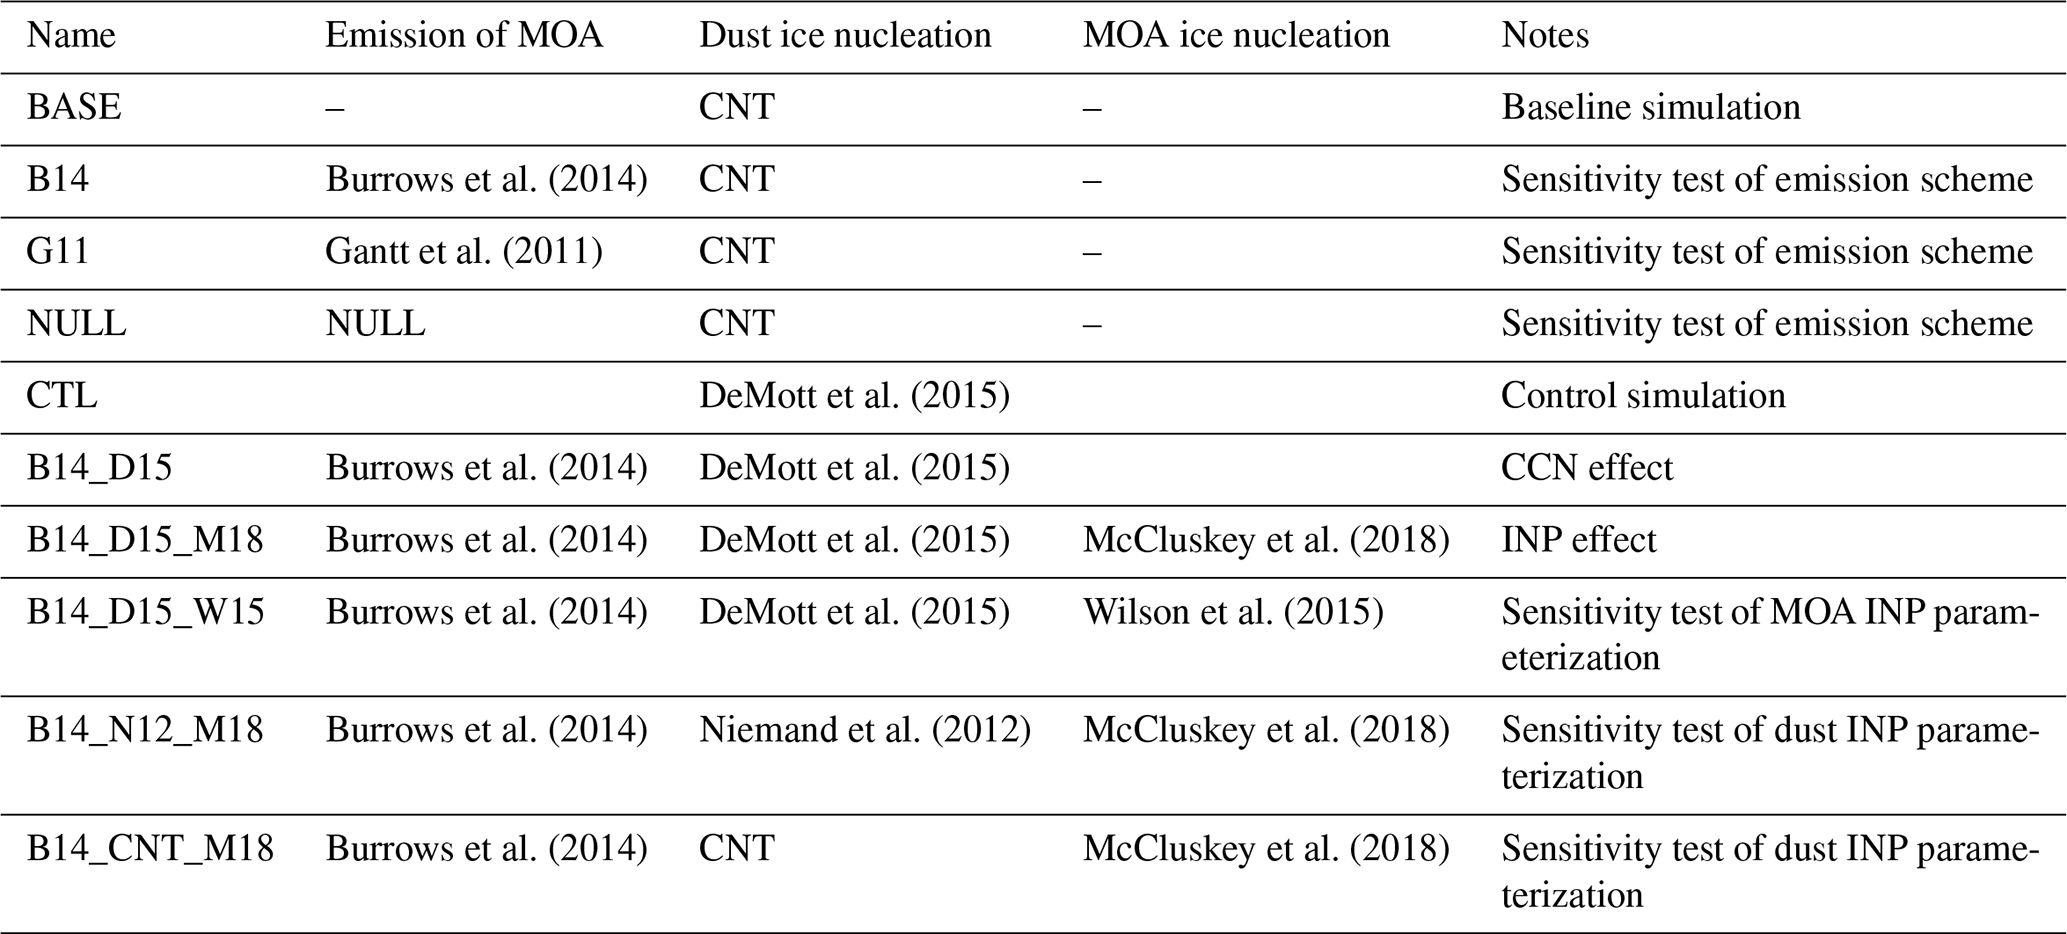
We conducted another set of experiments to investigate both CCN and INP effects of MOA, as listed in Table 4. The control experiment (CTL) is the same as BASE except that the D15 dust ice nucleation scheme was used to replace the CNT scheme in BASE because D15 gave a better model performance compared to observations in our previous study (Shi and Liu, 2019). The B14_D15, which is based on CTL, considers the MOA emission from B14 and the CCN effect of MOA. The B14_D15_M18 experiment, which is based on B14_D15, additionally considers the INP effect of MOA based on M18. The comparison between CTL and B14_D15 shows the CCN effect of MOA, while the comparison between B14_D15 and B14_D15_M18 shows its INP effect.
We further conducted three experiments to examine the model sensitivity to a different MOA ice nucleation parameterization (i.e., W15) in B14_D15_W15 and to two different dust ice nucleation parameterizations (i.e., N12 and CNT) in B14_N12_ M18 and B14_CNT_M18 by comparing them with the B14_D15_M18 experiment, respectively.
3.1 Evaluation of modeled MOA
Given that a realistic representation of MOA emissions is a prerequisite for models to quantify its influence on ice nucleation, we evaluate three different MOA emission parameterizations in this section. We also analyze the processes contributing to MOA burden such as emission, transport, and removal because the burden pattern largely determines the INP distribution pattern. Comparisons with available observations are made to examine the performance of different MOA emission schemes.
Table 5Annual global mean emissions and burdens of MOA and sea salt.
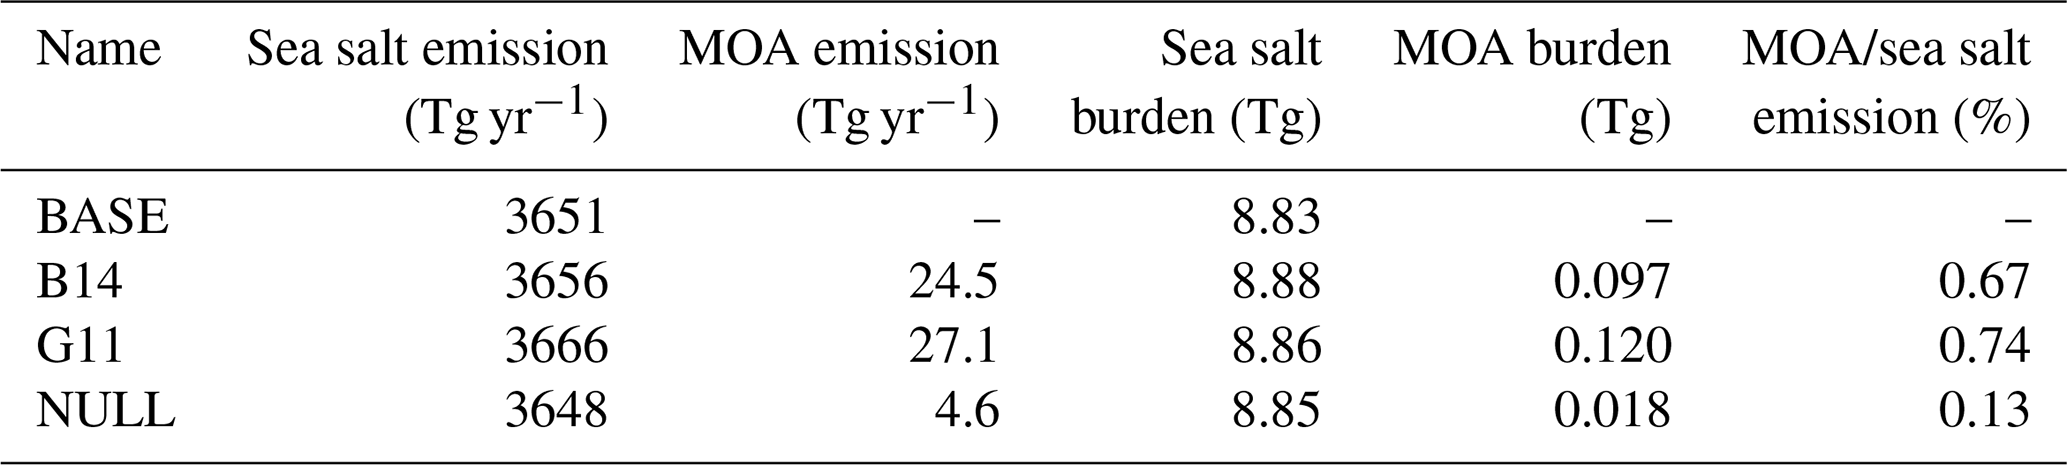
Table 5 lists the annual global mean emissions and burdens of MOA and sea salt from different simulations. Overall, the G11 method generates the largest global MOA emission (27.1 Tg yr−1) followed by the B14 method (24.5 Tg yr−1). The magnitudes of MOA emissions are within the range of previous studies (Huang et al., 2018; Meskhidze et al., 2011; Langmann et al., 2008). The ratios of MOA emission to sea salt emission are 0.67 % and 0.74 % for the B14 and G11 experiments, respectively, which are also comparable to previous studies ranging from 0.3 % to 3.2 % (Huang et al., 2018; Meskhidze et al., 2011). The NULL approach only gives an annual global MOA emission of 4.6 Tg yr−1, with the ratio of MOA emission to sea salt emission of 0.13 %. These values are much lower than those of B14 and G11 approaches. We note that emissions and burdens of sea salt include the contribution from the coarse mode, which dominates the total sea salt emissions and burdens. We further evaluate aerosol mass mixing ratios and number concentrations in each aerosol mode in the B14 experiment, where MOA is added and internally mixed with sea salt. In B14, the ratio of MOA to sea salt mass burdens reaches up to 2.3 and 1.0 for the Aitken and accumulation modes, respectively. Number concentrations of accumulation mode aerosols near the surface are increased by up to 50 % over some regions of the Southern Ocean and Arctic.
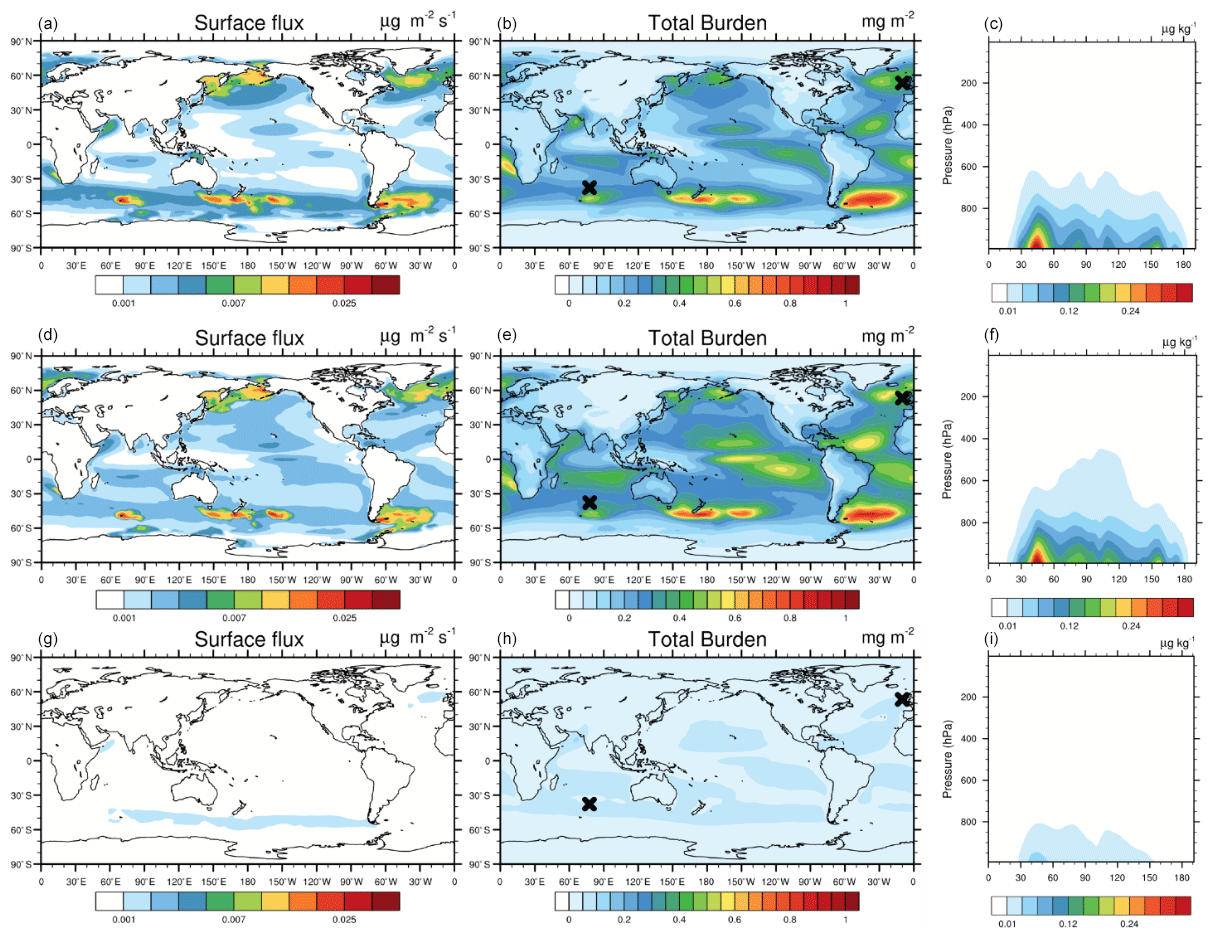
Figure 1Spatial distributions of annual mean surface flux (first column, in units of µg m−2 s−1) and vertically integrated (column) burden of MOA (second column, in units of mg m−2) and latitude–pressure cross sections of annual mean MOA mixing ratio (third column, in units of µg kg−1) from the B14 (first row), G11 (second row), and NULL (third row) experiments. The right-hand black cross in the second row indicates the position of Mace Head, and the left-hand black cross indicates the position of Amsterdam Island.
Despite the fact that there are differences in the global annual mean value, B14 and G11 generate similar spatial patterns of MOA emission rates (Fig. 1), while G11 tends to give higher emission rates than B14. Large emission rates are located in the midlatitude storm tracks, equatorial upwelling, and coastal regions as shown in Fig. 1. These locations largely reflect the geographic distribution of primary ocean productivity as indicated by [Chl a] (in G11) or organic matter concentrations (in B14).
Here we illustrate the influence of surface wind speeds (Fig. S1 in the Supplement) on the emission of MOA. Although high MOA emissions are mostly co-located with vigorous oceanic biological activities, the oceanic area with smaller or larger wind speed tends to have a decreased or elevated emission rate relative to their biological activities. For instance, due to weak wind speeds (∼ 5 m s−1), a strong signal of oceanic organic matter concentration does not correspond to a large emission rate on the western coast of South America. On the contrary, because of strong wind speeds (∼ 10 m s−1), moderate emission rates are noticed over the subtropical northern Pacific Ocean and subtropical southern Indian Ocean despite relatively small [Chl a] or organic matter concentrations. This wind-speed-dependent pattern is more clearly shown in the B14 results than in the G11 results because in the B14 emission scheme is not related to the wind speed while SSA emission is proportional to the surface wind speed, as described in Sect. 2.2.1. Conversely, is inversely related to the wind speed in G11, which results in a more complicated relationship between wind speed and MOA emission rate in G11.
The global mean MOA burden is 0.097 Tg in B14, which is in close agreement with previous studies that suggested a range of 0.031 to 0.131 Tg (Huang et al., 2018; Burrows et al., 2018). The global distribution of MOA column burden shares a similar pattern between G11 and B14, with the peak burden around 1 mg m−2 over the midlatitude to high-latitude Southern Ocean (Fig. 1). Despite the fact that large burdens are usually related to locations of high emissions, they are also influenced by advection (dependent on 3-D wind), dry deposition (dependent on particle size), and wet deposition (dependent on precipitation). The oceanic regions with small annual precipitation rates (Fig. S1) lead to considerable accumulations of MOA in G11 and B14. For instance, the peak burdens with maximum values of 0.4 to 0.6 mg m−2 on either side of the Pacific tropical convection zone correspond to the subsidence induced dry zone (i.e., subsiding branch of Walker and Hadley circulations).
Zonally averaged vertical distributions of MOA mass mixing ratio illustrate the vertical transport of MOA (Fig. 1). Simulations from G11 and B14 exhibit a maximum value of 0.35 µg kg−1 within the boundary layer, located in 40–50∘ S of the Southern Ocean, while the maximum value is only 0.05 µg kg−1 in NULL. Globally, G11 shows slightly higher MOA mass mixing ratios over all latitudes compared with B14 and transports more MOA to high altitudes over the tropical regions. It is clear that MOA is accumulated in the lower troposphere, i.e. below 600 hPa in G11 and B14 and below 800 hPa in NULL. The reason is that MOA is generated over the oceans, especially over the storm track regions with high precipitation, limiting MOA mainly to the lower troposphere.
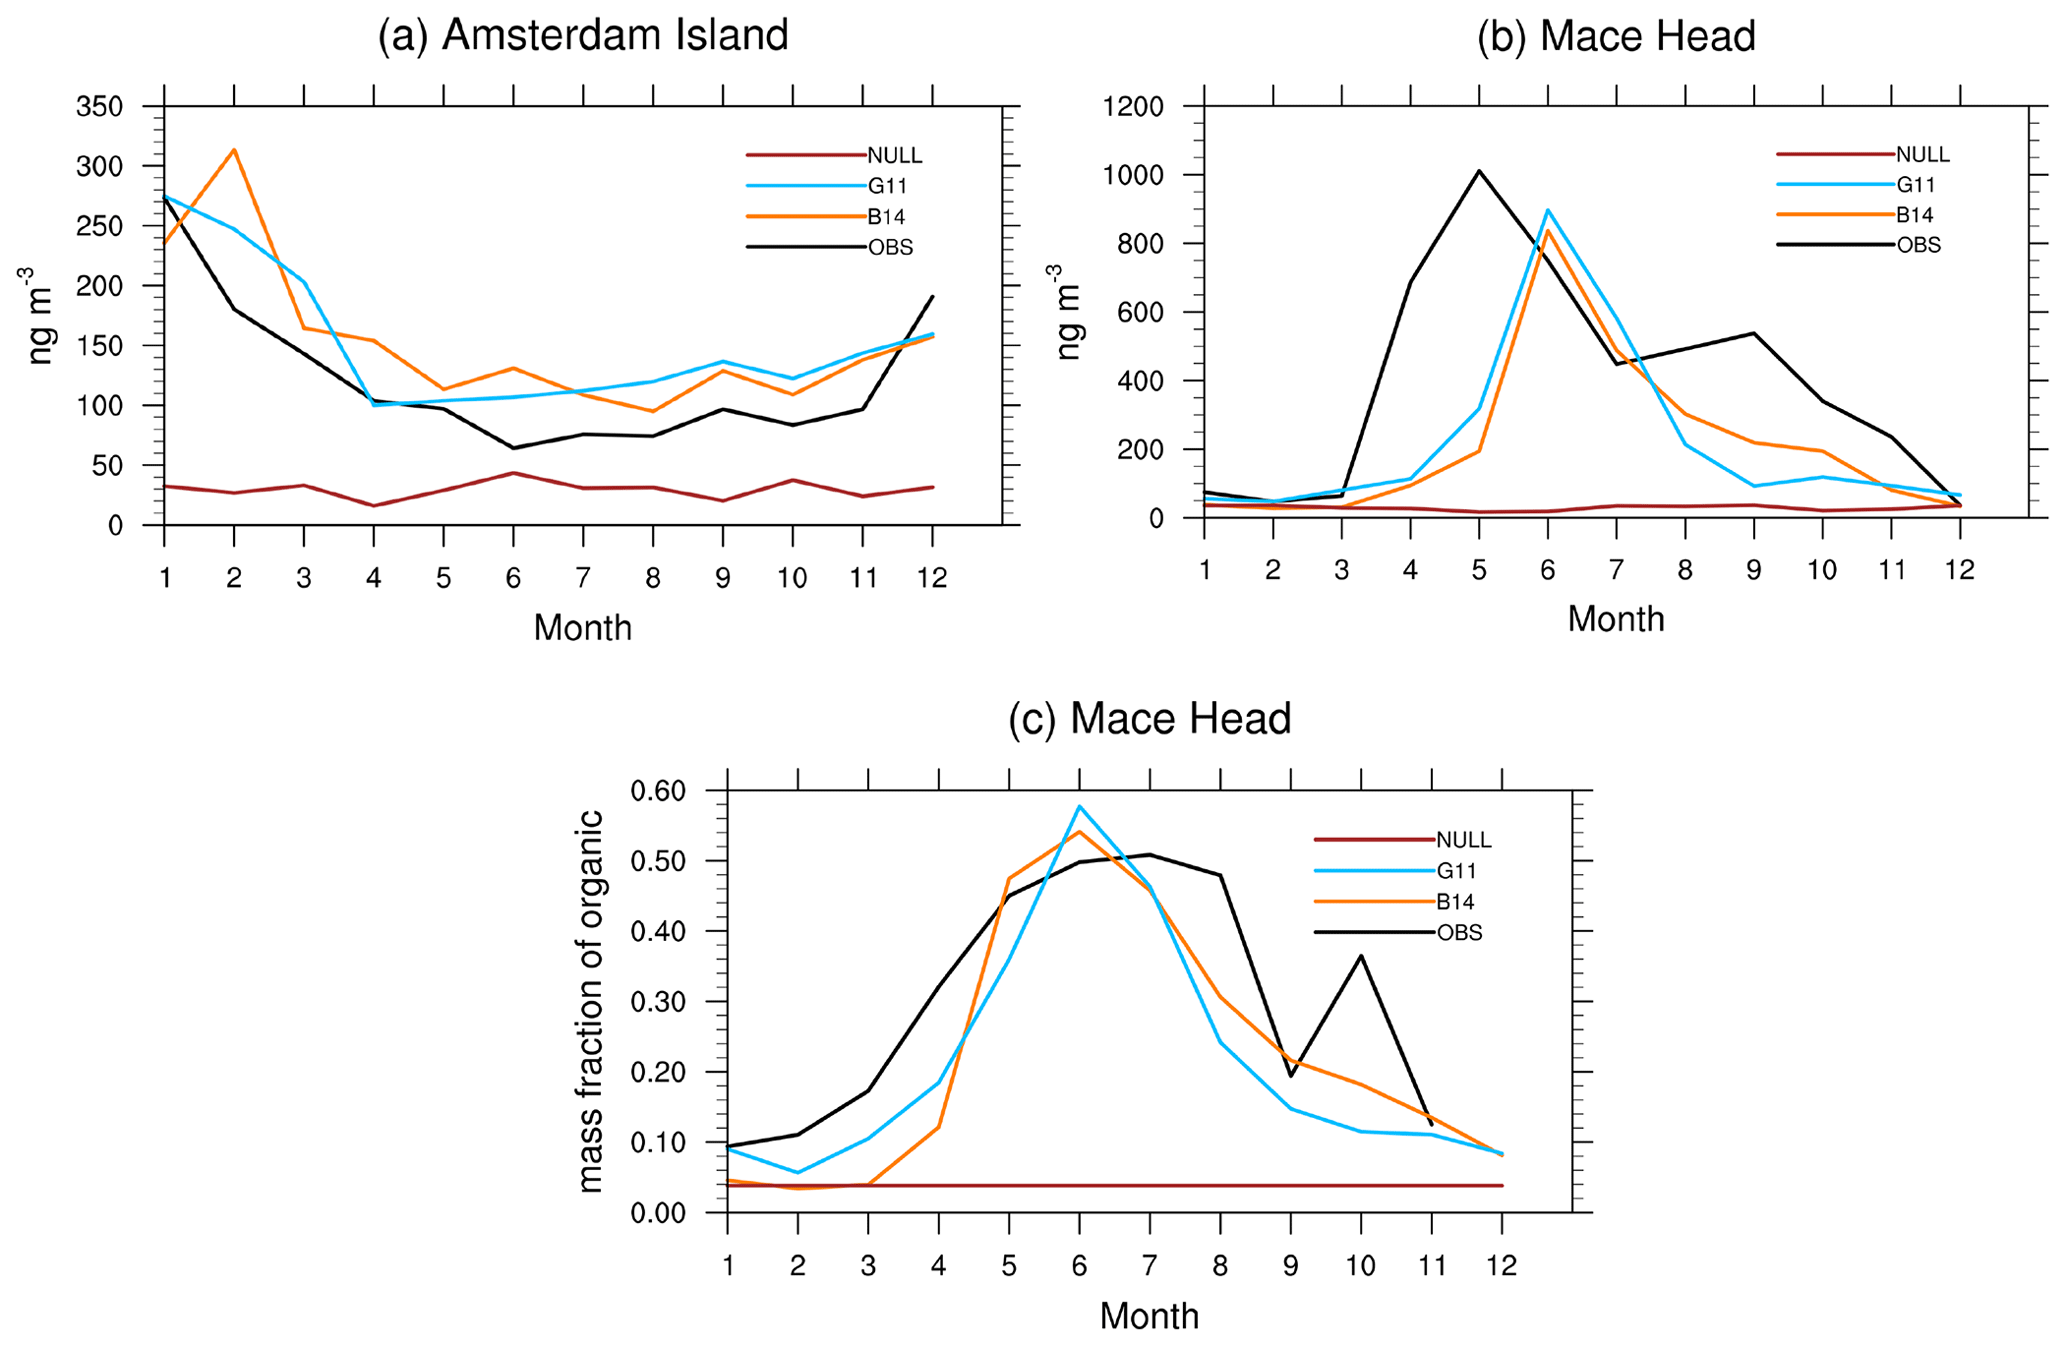
Figure 2Monthly averaged concentrations of MOA at (a) Amsterdam Island and (b) Mace Head, Ireland, and (c) monthly averaged mass fraction of MOA in SSA at Mace Head, Ireland. The locations of Amsterdam Island and Mace Head, Ireland, are shown in Fig. 1.
We further evaluate model simulated MOA concentrations with measurements at Mace Head (Ireland) and Amsterdam Island (Fig. 2). The B14 and G11 methods do well in capturing the observed seasonal variation of MOA concentrations at Amsterdam Island (Fig. 2a), although the model produces slightly higher MOA concentrations. At Mace Head, the two methods produce delayed concentration peaks by about 1 month compared with observations (Fig. 2b). The mass fraction of MOA in SSA (Fig. 2c) shows a better agreement between the model and observation. Both the simulated and observed organic mass fraction increase from March and reaches a peak in July, although the observed peak is broader. The sea ice extent prescribed in the model as a boundary condition has a strong seasonal variation over the Southern Ocean, as shown in Fig. S2. This can greatly impact the emission of MOA there (e.g., low emissions during the austral winter and early spring). The NULL approach does not reproduce observed seasonal cycles of MOA and significantly underestimates observed MOA concentrations due to the prescribed mass fraction (0.05) in the accumulation mode.
Based on our analyses and comparisons with observations, we show that B14 implementation of MOA emission into CAM6 reasonably captures the concentrations and seasonal variations of MOA. Next we will study the MOA effects on clouds via acting as CCN (Sect. 3.2) and INPs (Sect. 3.3), based on model experiments with the B14 emission (Table 4).
3.2 Impact of MOA on CCN
After introducing MOA in the model, we notice an obvious increase in oceanic surface CCN concentrations at high latitudes. Figure 3 shows the spatial distribution of annual mean percentage changes in surface CCN concentrations at a supersaturation of 0.1 % due to MOA derived from the two experiments (CTL and B14_D15). From Fig. 3, the annual mean CCN concentration increases by 15 %–35 % over much of the ocean from 30 to 70∘ S, with a maximum increase of 45 % located over the Southern Ocean (60∘ S, 55∘ E). Other regions showing significant increases of CCN are over the pristine high latitudes, with increases of 25 %–35 % from 60∘ S to Antarctica in the SH and from 60 to 80∘ N in the NH. These results are comparable with previous results, with an average increase of 12 % and up to 20 % of CCN over the Southern Ocean (Meskhidze et al., 2011). Over low-latitude and midlatitude oceans, CCN changes due to MOA are smaller. Generally, the distribution of CCN change is consistent with the MOA emission pattern. The vertical profiles of CCN concentrations from the two model experiments and observations during the eight field campaigns are shown in Fig. 3. Clear increases of CCN concentrations in the boundary layer due to MOA are evident for campaigns over the ocean or coastal regions (SOCEX1, SOCEX2, ACE1, FIRE1, and ASTEX), with the maximum increase (26 %) in ACE1. Observed CCN from FIRE1 shows a strong inversion of CCN below 800 hPa, and this inversion is challenging for the model due to its coarse vertical resolution. An obvious underestimation of CCN in the model is noticed at FIRE3 over the Arctic Ocean in spring, which is attributed to the underestimated transport of air pollution caused by too strong wet scavenging in the model (Liu et al., 2012).

Figure 3Spatial distribution of annual mean percentage changes of surface CCN concentrations at 0.1 % supersaturation due to MOA (by comparing B14_D15 and BASE), and vertical distribution of CCN concentrations at 0.1 % supersaturation from eight measurements (solid gray lines), BASE (solid orange line), and B14_D15 (solid green line). Dashed lines outline a range of 10th and 90th percentiles for measurements in the following field campaigns. The FIRE1 (First International Satellite Cloud Climatology Project Reginal Experiment), which was located at 33∘ N and 238∘ E on the California coast; the data were collected during June and July 1987. The FIRE3, which was located at 72∘ N and 210∘ E in the Arctic Ocean; the data were collected during May 1998. The ASTEX (Atlantic Stratocumulus Transition Experiment), which was located at 38∘ N and 332∘ E in the Azores; the data were collected during June 1992. The SOCEX1 (Southern Ocean Cloud Experiment), which was located at −42∘ S and 142∘ E in Tasmania; the data were collected during July 1993. The data of SOCEX2 were collected during January and February 1995. The ACE1 (Aerosol Characterization Experiment), which was located at −45∘ S, 145∘ E in Tasmania; the data were collected during November and December 1995. The ENA_JJA (Eastern North Atlantic), which was located at 39∘ N and 332∘ E in the eastern North Atlantic (the data were collected from June to August), while ENA_DJF data were collected during December, January, and February from 2006 to 2020.
3.3 Impact of MOA on INPs
In order to examine the importance of MOA INPs, we compare modeled INPs from MOA versus dust and compare them with observations from several field campaigns at high latitudes (Fig. 4). Modeled INP concentrations from MOA are calculated online using M18 and W15 parameterizations (from B14_D15_M18 and B14_D15_W15 experiments, respectively), while dust INP concentrations are calculated online using D15, CNT, and N12 parameterizations (from B14_D15_M18, B14_CNT_M18, and B14_N12_M18 experiments, respectively). Modeled INP concentrations are computed based on aerosol concentrations at different temperatures and are selected at the same altitudes and locations as the observations. The measured INP data were obtained from Mace Head, the CAPRICORN campaign (Clouds, Aerosols, Precipitation, Radiation, and Atmospheric Composition over the Southern Ocean), Oliktok Point, and Zeppelin (McCluskey et al., 2018a, b; Creamean et al., 2018; Tobo et al., 2019).
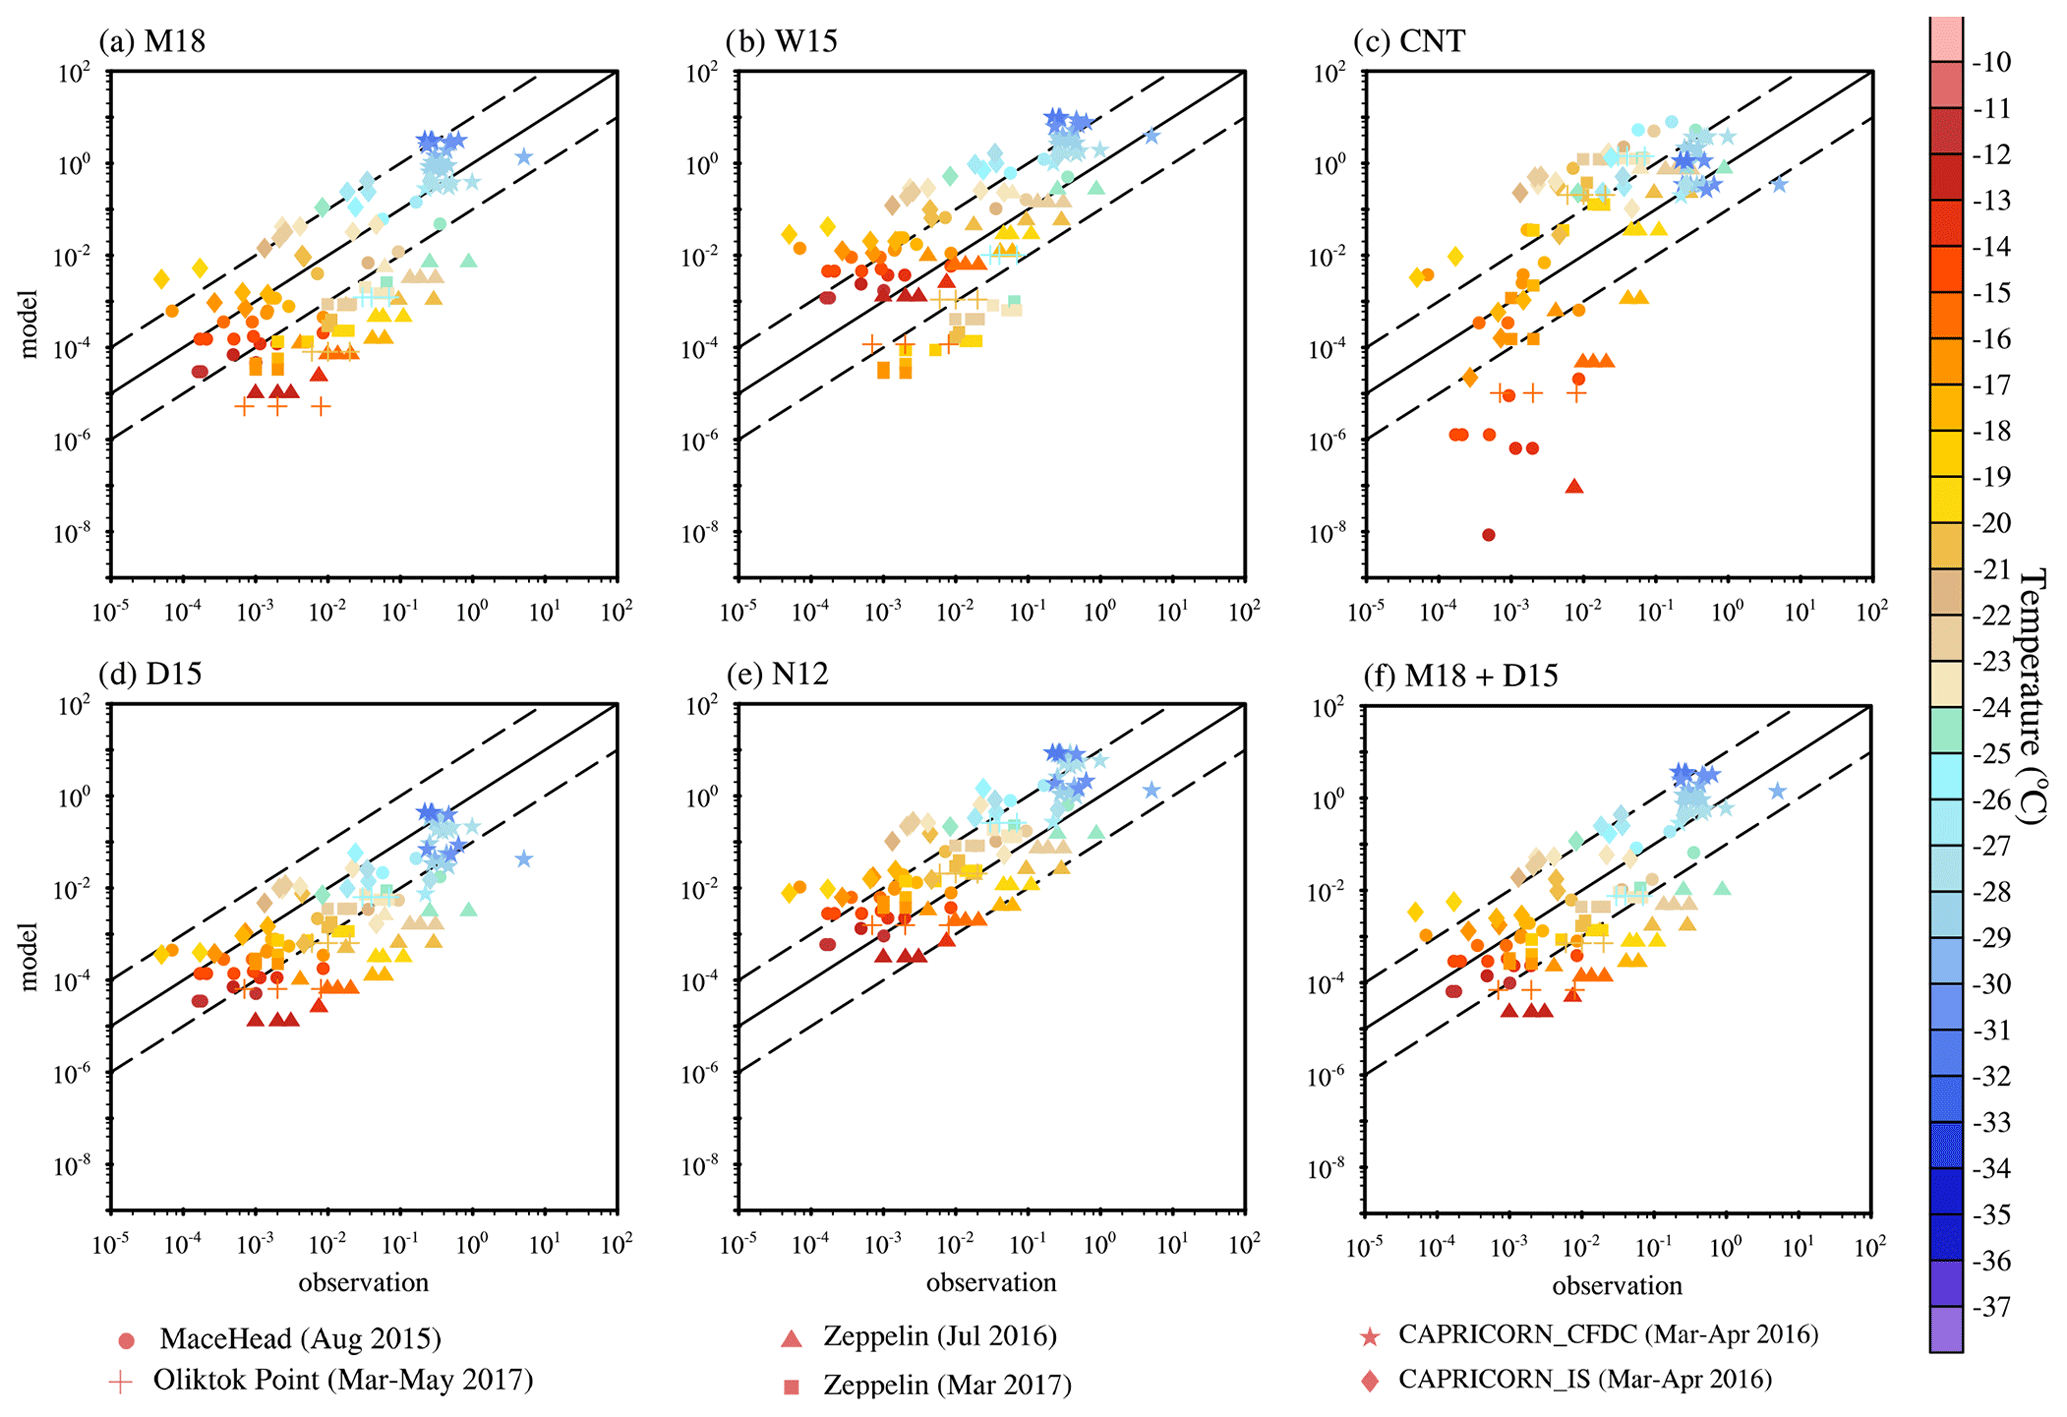
Figure 4Comparison of simulated versus observed INP number concentrations for different simulations: (a) MOA INPs from M18 (McCluskey et al., 2018), (b) MOA INPs from W15 (Wilson et al., 2015), (c) dust INPs from CNT (Wang et al., 2014), (d) dust INPs from D15 (DeMott et al., 2015), (e) dust INPs from N12 (Niemand et al., 2012), and (f) the sum of dust and MOA INPs from D15 and M18. Simulated INP data are sampled at the same pressures, longitudes, and latitudes as the field measurements. Dashed lines outline a factor of 10 about the 1 : 1 line (solid) in all the panels. The color bar shows the observed temperature in degrees Celsius, while different markers represent different field campaigns. The Zeppelin site is located at 78.9081∘ N, 11.8814∘ E, 475 m above mean sea level in Ny Ålesund, Svalbard; the INP data were collected during July 2016 and March 2017 (Tobo et al., 2019). The Oliktok Point site is located at 70.50∘ N 149.89∘ W; the INP data were collected from March to May 2017 (Creamean et al., 2018). The CAPRICORN (Clouds, Aerosols, Precipitation, Radiation, and Atmospheric Composition over the Southern Ocean) INP data were collected on ships from 13 March to 15 April in 2016 over the Southern Ocean (McCluskey, et al., 2018a). The Mace Head site is located at 53.32∘ N, 9.90∘ W; the INP data were collected during August 2015 (McCluskey et al., 2018b).
As illustrated in Fig. 4, the M18 parameterization tends to underestimate observed INP concentrations except at temperatures colder than −25∘. On the other hand, the W15 parameterization overestimates observed INP concentrations except at temperatures warmer than −20∘. Under the same MOA scenario, the W15 parameterization is more efficient at producing INPs than M18. This is because the M18 parameterization was derived from MOA in the atmosphere, which accounts for the effect of physiochemical selective emission and aerosol chemistry in the air. In contrast, the W15 parameterization was derived based on the total organic carbon in sea surface microlayer samples, which contain higher organic mass concentrations compared with ambient MOA.
The dust INP concentration calculated with CNT shows an underestimation when temperature is warmer than −20∘ and an overestimation when temperature is between −30 and −20∘. This is consistent with previous work by Wang et al. (2014). The D15 parameterization indicates a clear underestimation. The N12 scheme has the better performance than D15 in Fig. 4. However, the field campaigns used in Fig. 4 are marine aerosol dominant or contained scenario campaigns. MOA is identified as an important INP source during these campaigns from measurements (McCluskey et al., 2018b, a). Thus, dust should not be expected to be the dominant INP, as indicated by the N12 scheme, which only considers dust INPs. This suggests that N12 may overestimate dust INPs, which is consistent with our earlier study (Shi and Liu, 2019). These results suggest that the N12 parameterization is more efficient in producing dust INPs than the D15 parameterization under the same dust loading. INP concentrations from N12 are calculated based on the coarse, accumulation, and Aitken mode dust aerosol, which account for fine dust particles, while INP concentrations from D15 are calculated based on the number concentration of dust particles with diameters larger than 0.5 µm (DeMott et al., 2015). Simulated total INPs, the sum of dust and MOA INPs from D15 and M18, gives a better agreement with observations than D15 and M18 alone, although underestimations still exist at warmer temperatures.
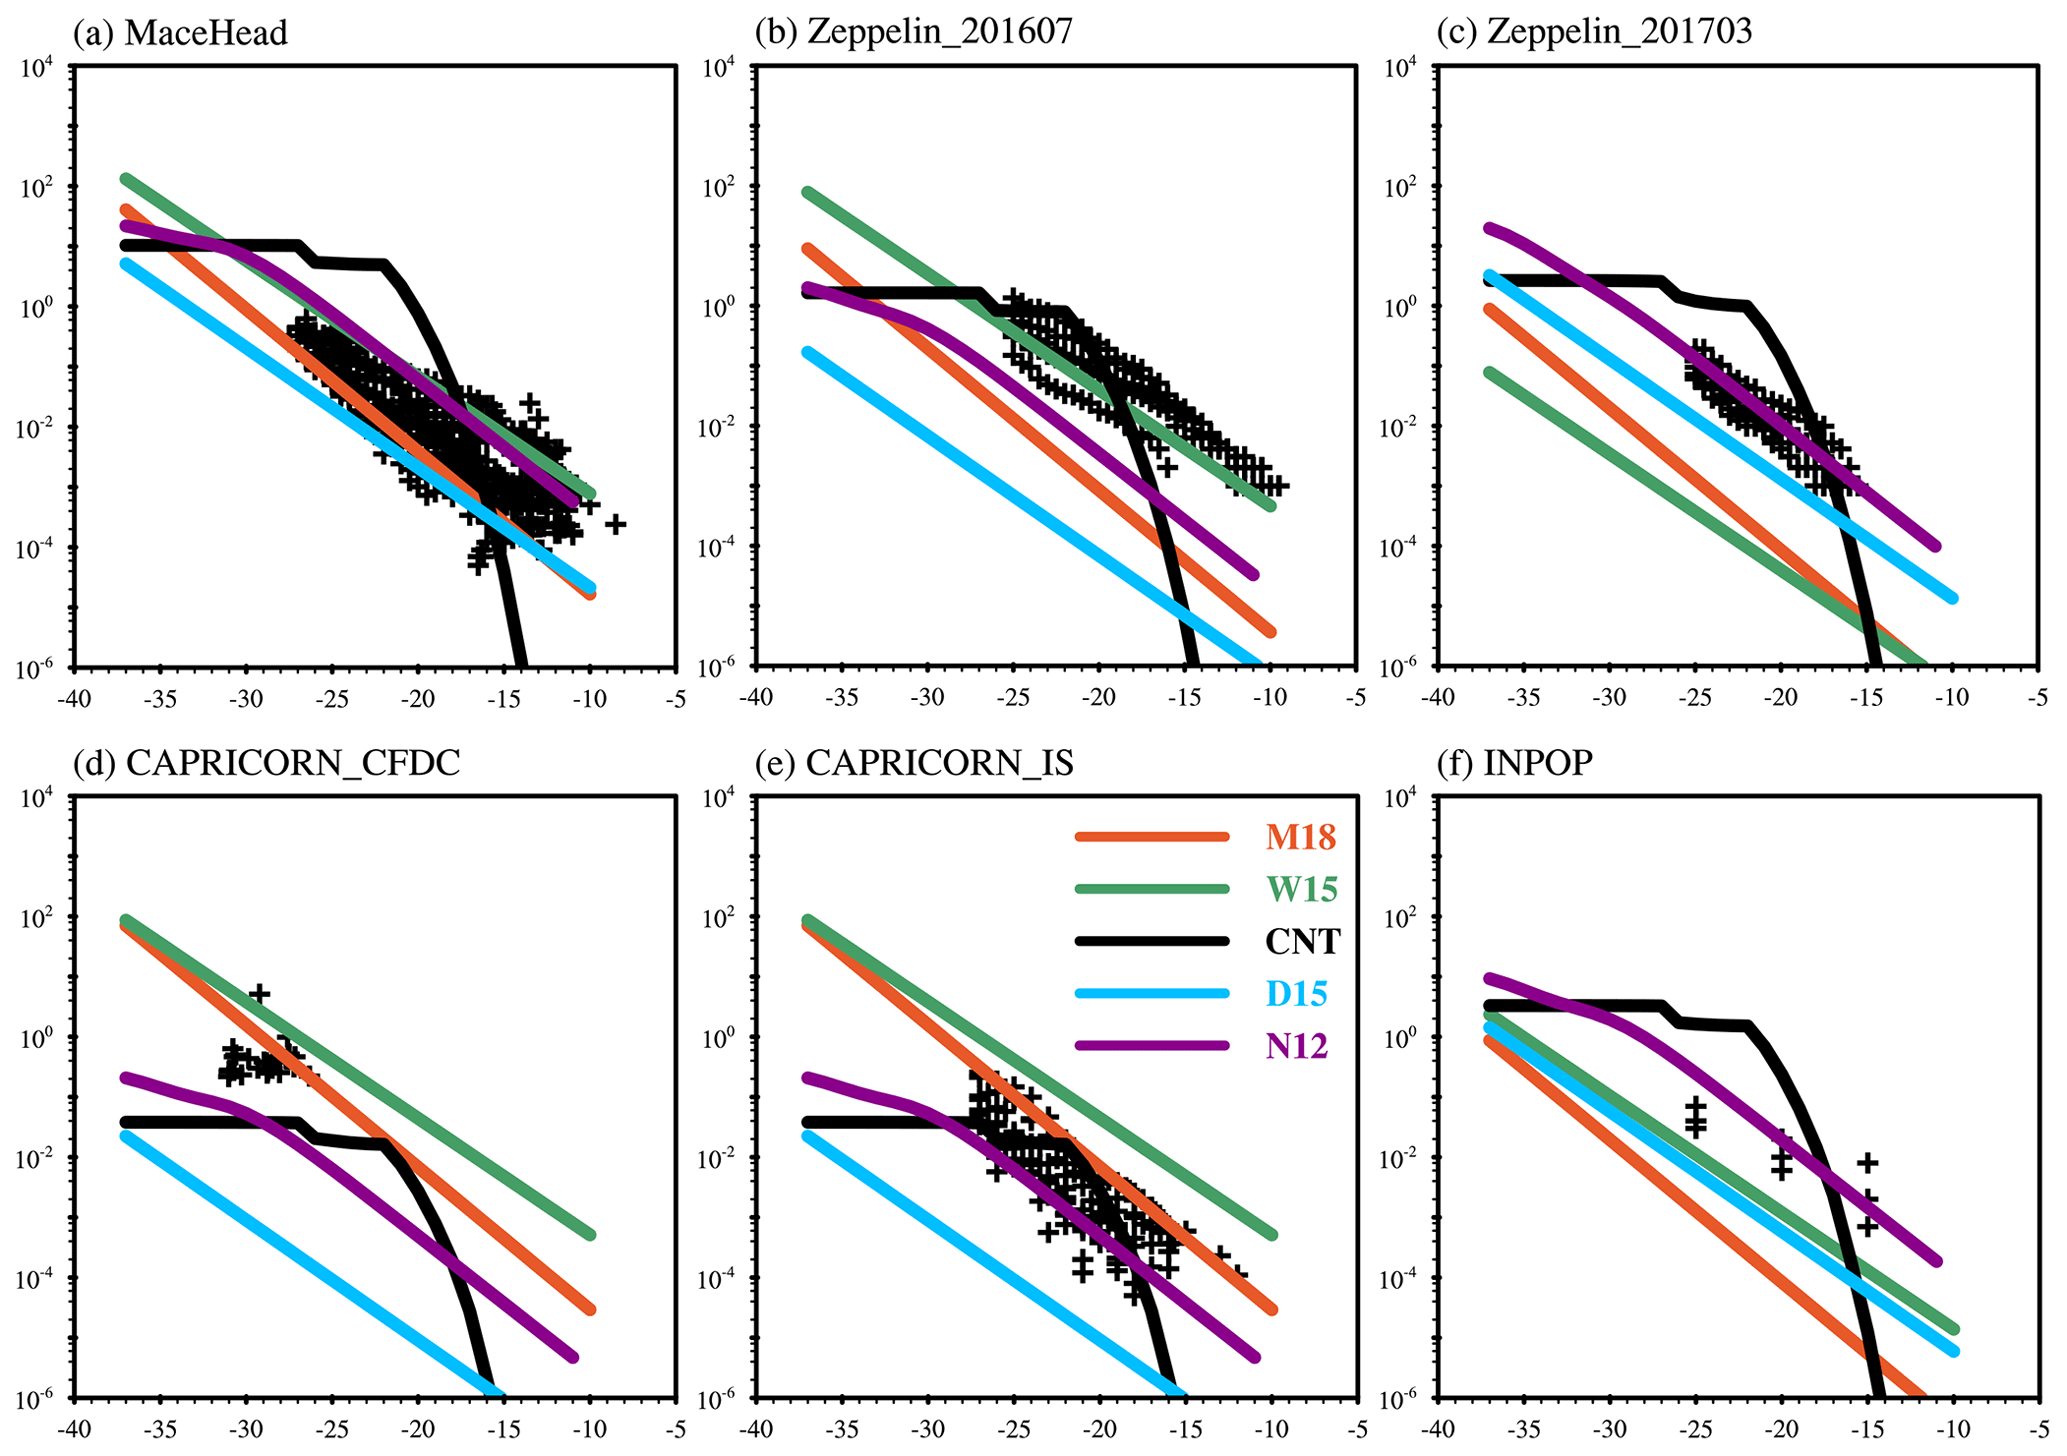
Figure 5Modeled and observed INP concentrations as a function of temperature. The black crosses indicate INP measurements, and lines show model results from different parameterizations (Table 4). Simulated INP data are sampled at the same pressures, longitudes, and latitudes as the field measurements.
Figure 5 shows the comparison between simulated and measured INPs from five parameterization schemes as a function of temperature for the same field campaigns as in Fig. 4. Generally, an inverse linear relationship is revealed between log10(INPs) and temperature in the measurements. This relationship is also shown in simulated INP number concentrations from the empirical parameterizations (N12, D15, W15, M18). However, for CNT nearly constant INP number concentrations are presented at temperatures from −35 to −20∘, and then a rapid decrease is seen with increasing temperature when the temperature is warmer than −20∘. At temperatures higher than −15∘, nearly no INPs are produced by CNT, leading to the underestimation of INPs in the CNT method at these temperatures.
We notice higher INP number concentrations are produced from M18 compared with W15 at Zeppelin during March 2017. The most distinctive feature of this campaign is its very low aerosol loadings. For example, simulated SSA mass mixing ratio is around 0.6 µg kg−1 with the maximum value at 1.8 µg kg−1 below 850 hPa, and the dust mass mixing ratio is around 0.3 µg kg−1. We note that simulated dust INP number concentrations from N12 are always higher than those from D15 and that both N12 and D15 are more efficient in producing INPs than CNT when temperature is warmer than −20∘.
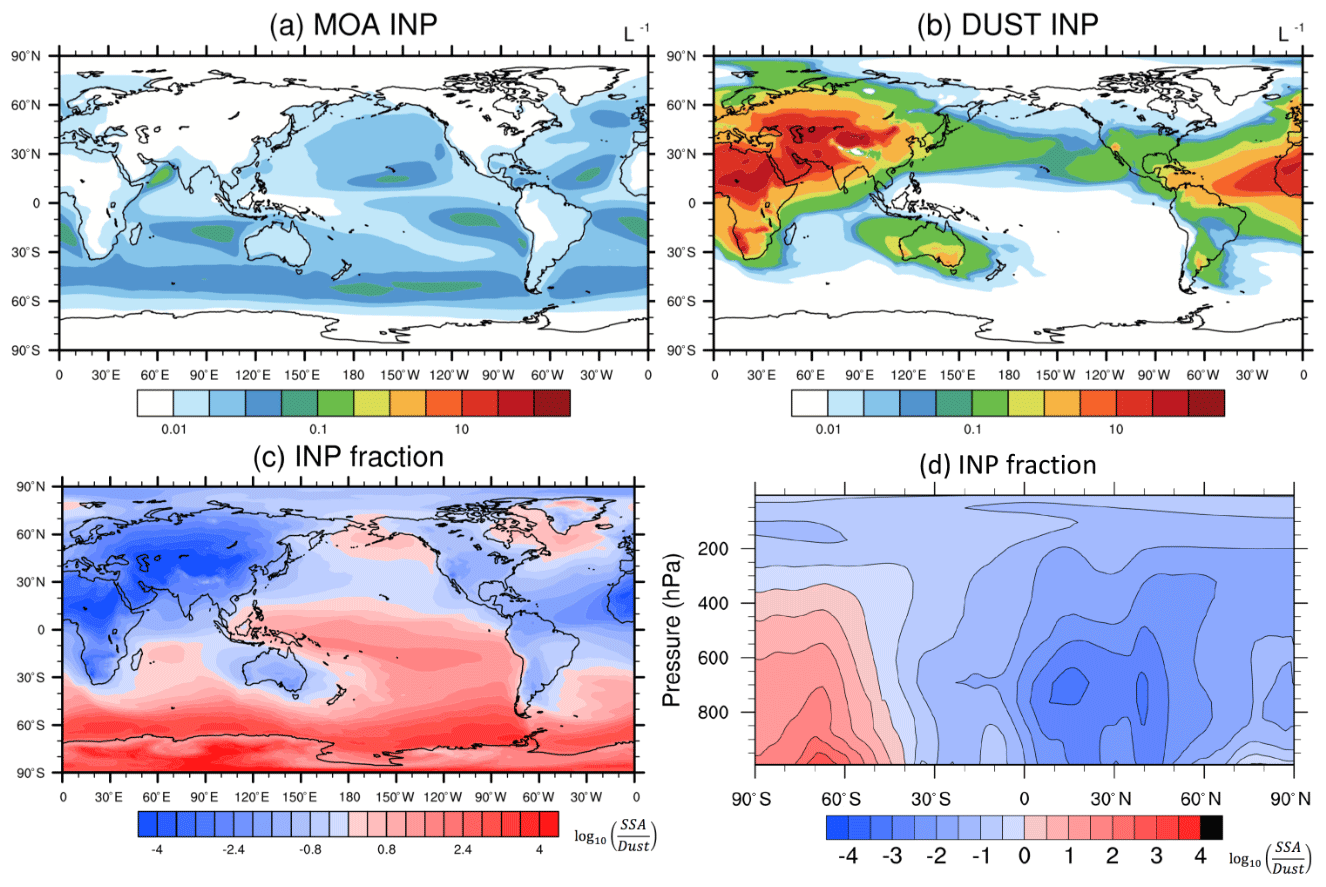
Figure 6Spatial distribution of annual mean concentrations of (a) MOA INPs and (b) dust INPs, (c) the ratio of MOA INP concentration to dust INP concentration at 950 hPa, and (d) vertical cross sections of the ratio of MOA INP concentration to dust INP concentration. INP concentrations are diagnosed at a temperature of −25∘.
The global distribution pattern of annual mean MOA INP concentrations at 950 hPa at a temperature of −25∘ is similar to that of MOA column burden concentrations, as shown in Fig. 6a. The MOA INPs are spread over the oceans, with peaks (∼ 0.1 L−1) over 40 to 60∘ S in the Southern Ocean, the subtropical southern Indian Ocean, the subtropical Atlantic Ocean, and the subtropical eastern Pacific Ocean. Meanwhile, dust INP concentrations diagnosed at the same pressure and at the same temperature (Fig. 6b) are dominant over the NH and downwind of dust source regions in the SH (e.g., around Australia and extended to 50∘ S).
Figure 6c shows the horizontal distribution of the ratio of MOA INP concentration to dust INP concentration at 950 hPa. It is clear that MOA INPs are more important than dust INPs at 40∘ S south in the SH, where MOA INP concentrations can be up to 1000 times higher than those of dust INPs. The zonal mean vertical distribution of the ratio of MOA INP concentration to dust INP concentration is illustrated in Fig. 6d. The ratio peaks near 65∘ S, indicating that MOA INPs are more important than dust INPs over the Southern Ocean from the surface up to 400 hPa and that it extends poleward to 90∘ S. Above the 400 hPa altitude, dust particles are still more important INPs. Because dust particles are emitted over drier deserts (i.e., with lower precipitation and thus less wet scavenging), dust can be subject to long-range transport at high elevations. In contrast, most MOA particles are generated over the storm track regions with high occurrences of precipitation. Taking emission, transport, and wet scavenging of MOA and dust particles into account results in MOA INPs dominating below 400 hPa over the Southern Ocean, whereas dust INPs are generally more important elsewhere.
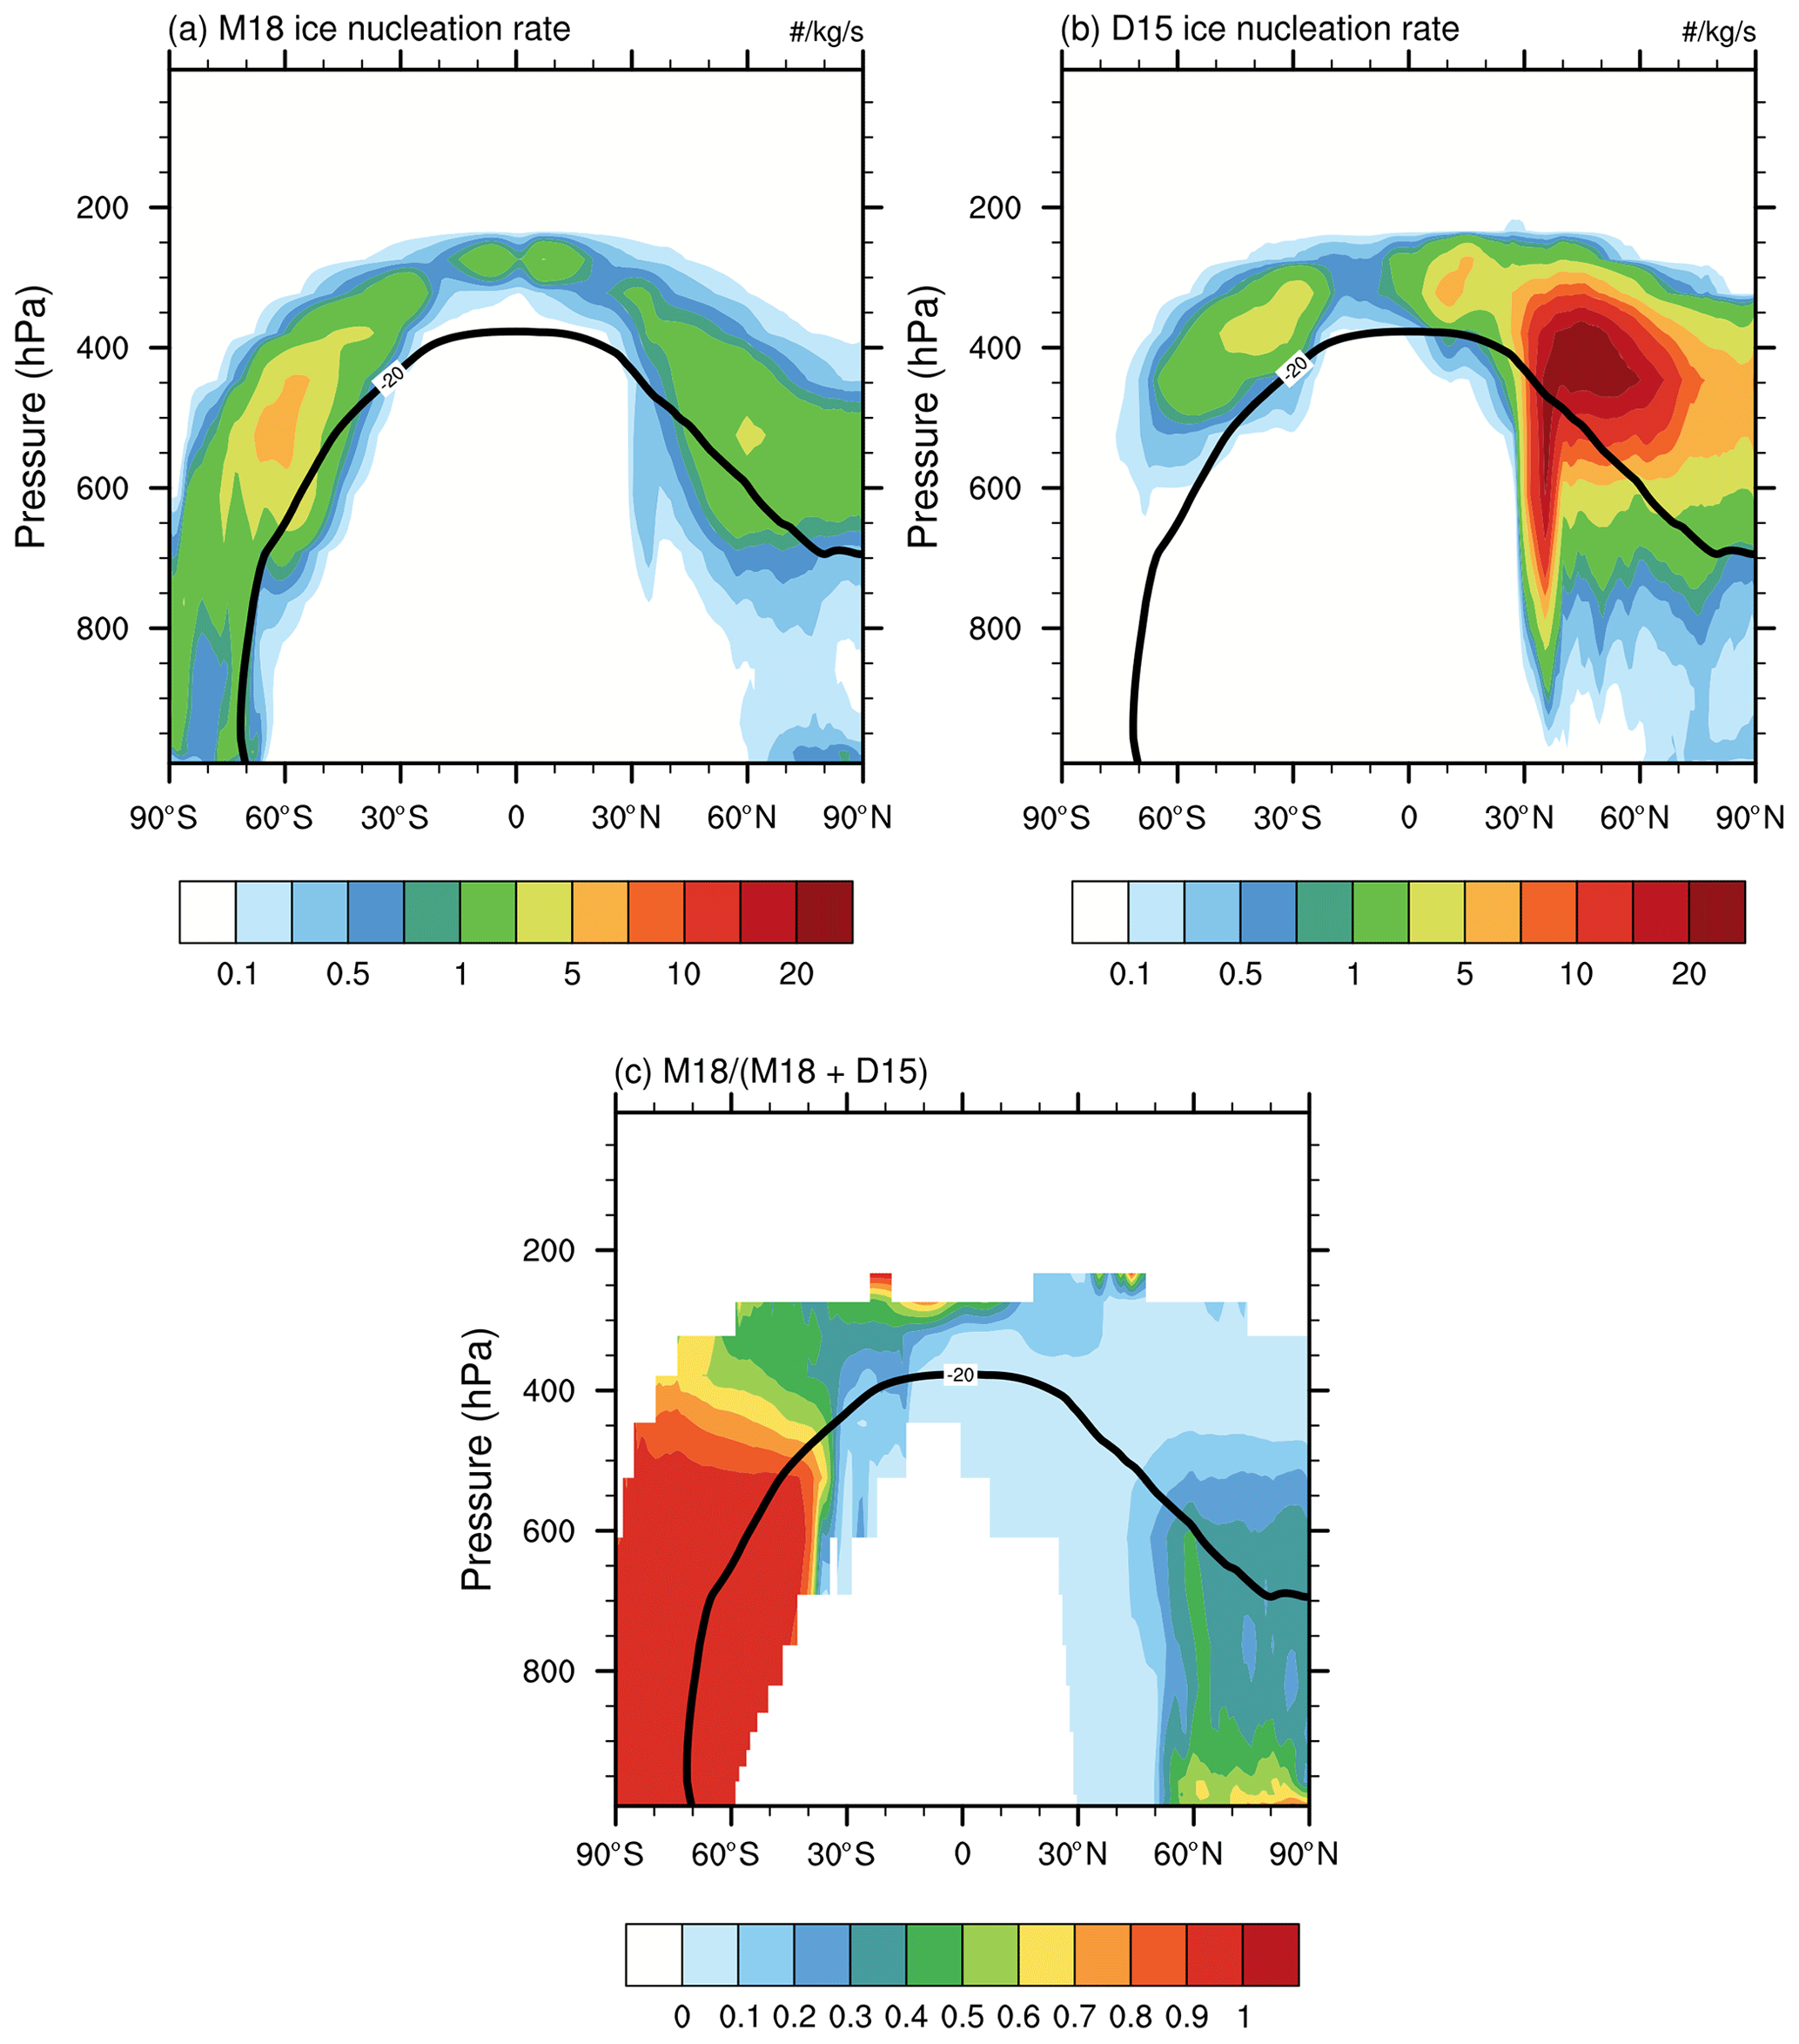
Figure 7Annual zonal mean pressure–latitude cross sections of ice nucleation rates from (a) MOA, (b) dust, and (c) MOA fraction of total ice production rate.
Immersion freezing on MOA in mixed-phase clouds requires that there are cloud droplets at temperatures colder than −4∘. Ice nucleation consumes cloud liquid water and thus will compete with other processes for cloud liquid water (e.g., autoconversion of cloud water to rain, accretion of cloud water by rain and snow). This competition is expected to result in a reduction in the ice nucleation rate of MOA compared with the offline calculation of ice nucleation rate, as in McCluskey et al. (2019). Figure 7 shows the annual zonal mean ice production rates from the immersion freezing of MOA and dust, which are calculated online for the cloud ice production tendency in the B14_D15_M18 experiment. Over the NH, the immersion freezing of dust dominates the primary ice production, giving an averaged ice production rate of 5 kg−1 s−1, which can increase to up to 20 kg−1 s−1 over 40∘ N at 400 hPa (Fig. 7b), while the MOA ice production rate is around 1 kg−1 s−1 (Fig. 7a). However, in the Arctic boundary layer, the MOA fraction of total ice production rate is around 0.6–0.7 (Fig. 7c), indicating that MOA INPs are more important for generating ice crystals than dust INPs in that region. Over the SH, the immersion freezing rate of MOA dominates the primary ice production below 400 hPa with the MOA fraction close to 1. The zonal average ice nucleation rate of MOA is around 1 kg−1 s−1, and increases to up to 5 kg−1 s−1 at 65∘ S in the Southern Ocean at 400–600 hPa. The immersion freezing rate of dust is around 1 kg−1 s−1 above 500 hPa, and smaller than 0.1 kg−1 s−1 below the 600 hPa altitude in the SH. Analysis of the seasonal variation of ice nucleation rate of MOA indicates that a maximum rate of about 16 kg−1 s−1 occurs at 400–600 hPa over 60∘ S in July (austral winter). In summary, the annual mean immersion freezing of MOA dominates the primary ice production over the SH below 400 hPa altitude and in the Arctic boundary layer.
3.4 Impact of MOA on clouds and radiative forcing
Table 6 displays the differences of cloud and precipitation variables between the CTL and B14_D15_M18 experiments. With added MOA aerosol, the global annual mean surface concentration of CCN at 0.1 % supersaturation changes from 103.3 cm−3 in CTL to 106.6 cm−3 in B14_D15_M18. This increase of 3.28 cm−3 is comparable to other model estimates of 3.66 cm−3 (Burrows et al., 2018) and 2.6–3.0 cm−3 (Meskhidze et al., 2011). The vertically integrated cloud droplet number concentration (CDNUMC) increases by 7.5 × 104 cm−2 (5.25 % in percent change) on the global annual mean and by 1.1 × 104 cm−2 (0.94 %) and 3.2 × 105 cm−2 (16.89 %) over 20–90∘ S during the austral winter (June–July–August) and summer (December–January–February), respectively, by comparing B14_D15_M18 with CTL. This reflects a strong seasonal variation of MOA emissions due to changes in the sea ice extent and biological activity. The global annual mean liquid water path (LWP), ice water path (IWP), longwave cloud forcing (LWCF), and total cloud fraction (CLDTOT) do not show obvious changes between CTL and B14_D15_M18. The global annual mean shortwave cloud forcing is stronger by −0.41 W m−2 due to MOA. During the austral summer over 20–90∘ S, we notice an increase of 4.57 g m−2 (5.10 %) in LWP and a 1.35 % (2.52 %) increase in low-cloud fraction. As a consequence, shortwave cloud forcing (SWCF) is enhanced by −2.87 W m−2 (Table 6), which is comparable to −3.5 W m−2 estimated in Burrows et al. (2018). Ice number concentration on −15 ∘C isotherm level increases by 9.34 % during the austral winter. There does not appear to be a significant change in LWCF, which is consistent with the result of Huang et al. (2018).
Table 6Mean changes and relative changes (%) between CTL and B14_D15_M18 experiments. Included in the table are surface CCN concentrations at 0.1 % (CCN); ice particle number concentration at −15∘C thermal level (Ni_15); vertically integrated cloud droplet number concentration (CDNUMC); total grid box cloud liquid water path (LWP); total grid box cloud ice water path (IWP); shortwave and longwave cloud forcings (SWCF, LWCF); total cloud fraction (CLDTOT); high, mid-level, and low-level clouds (CLDHGH, CLDMED, CLDLOW); and total surface precipitation rate (PRECT), with bold font indicating relative changes larger than 3 %.
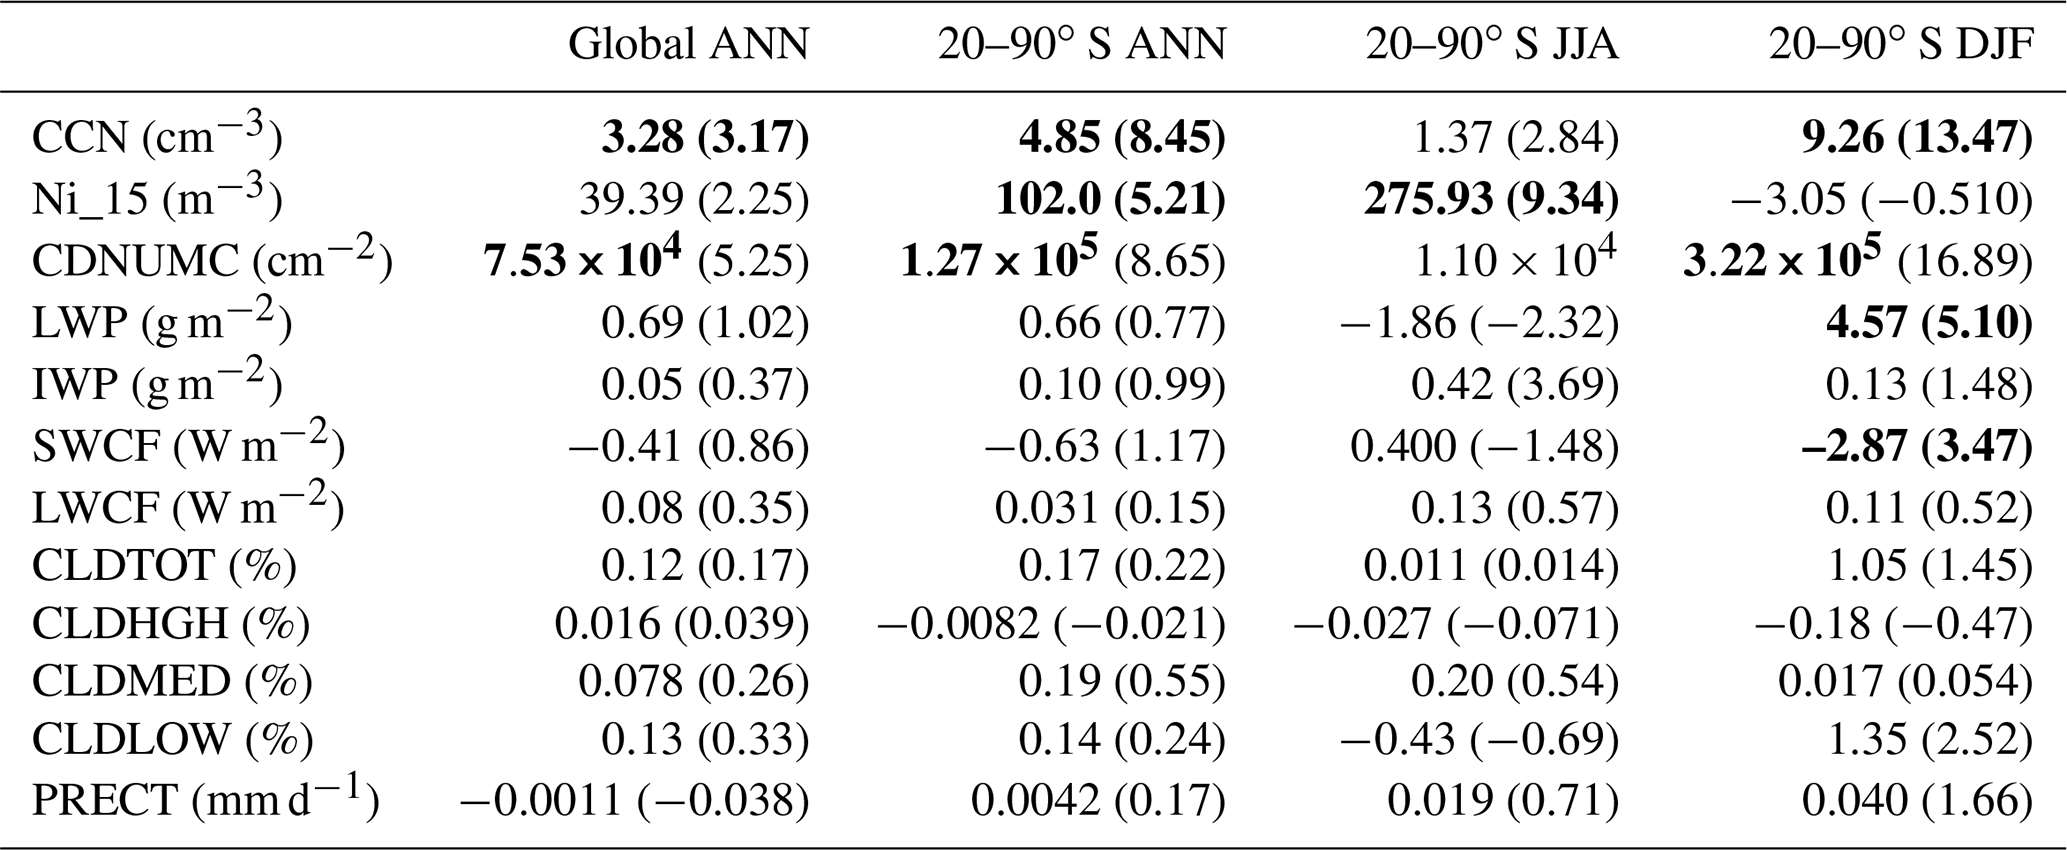
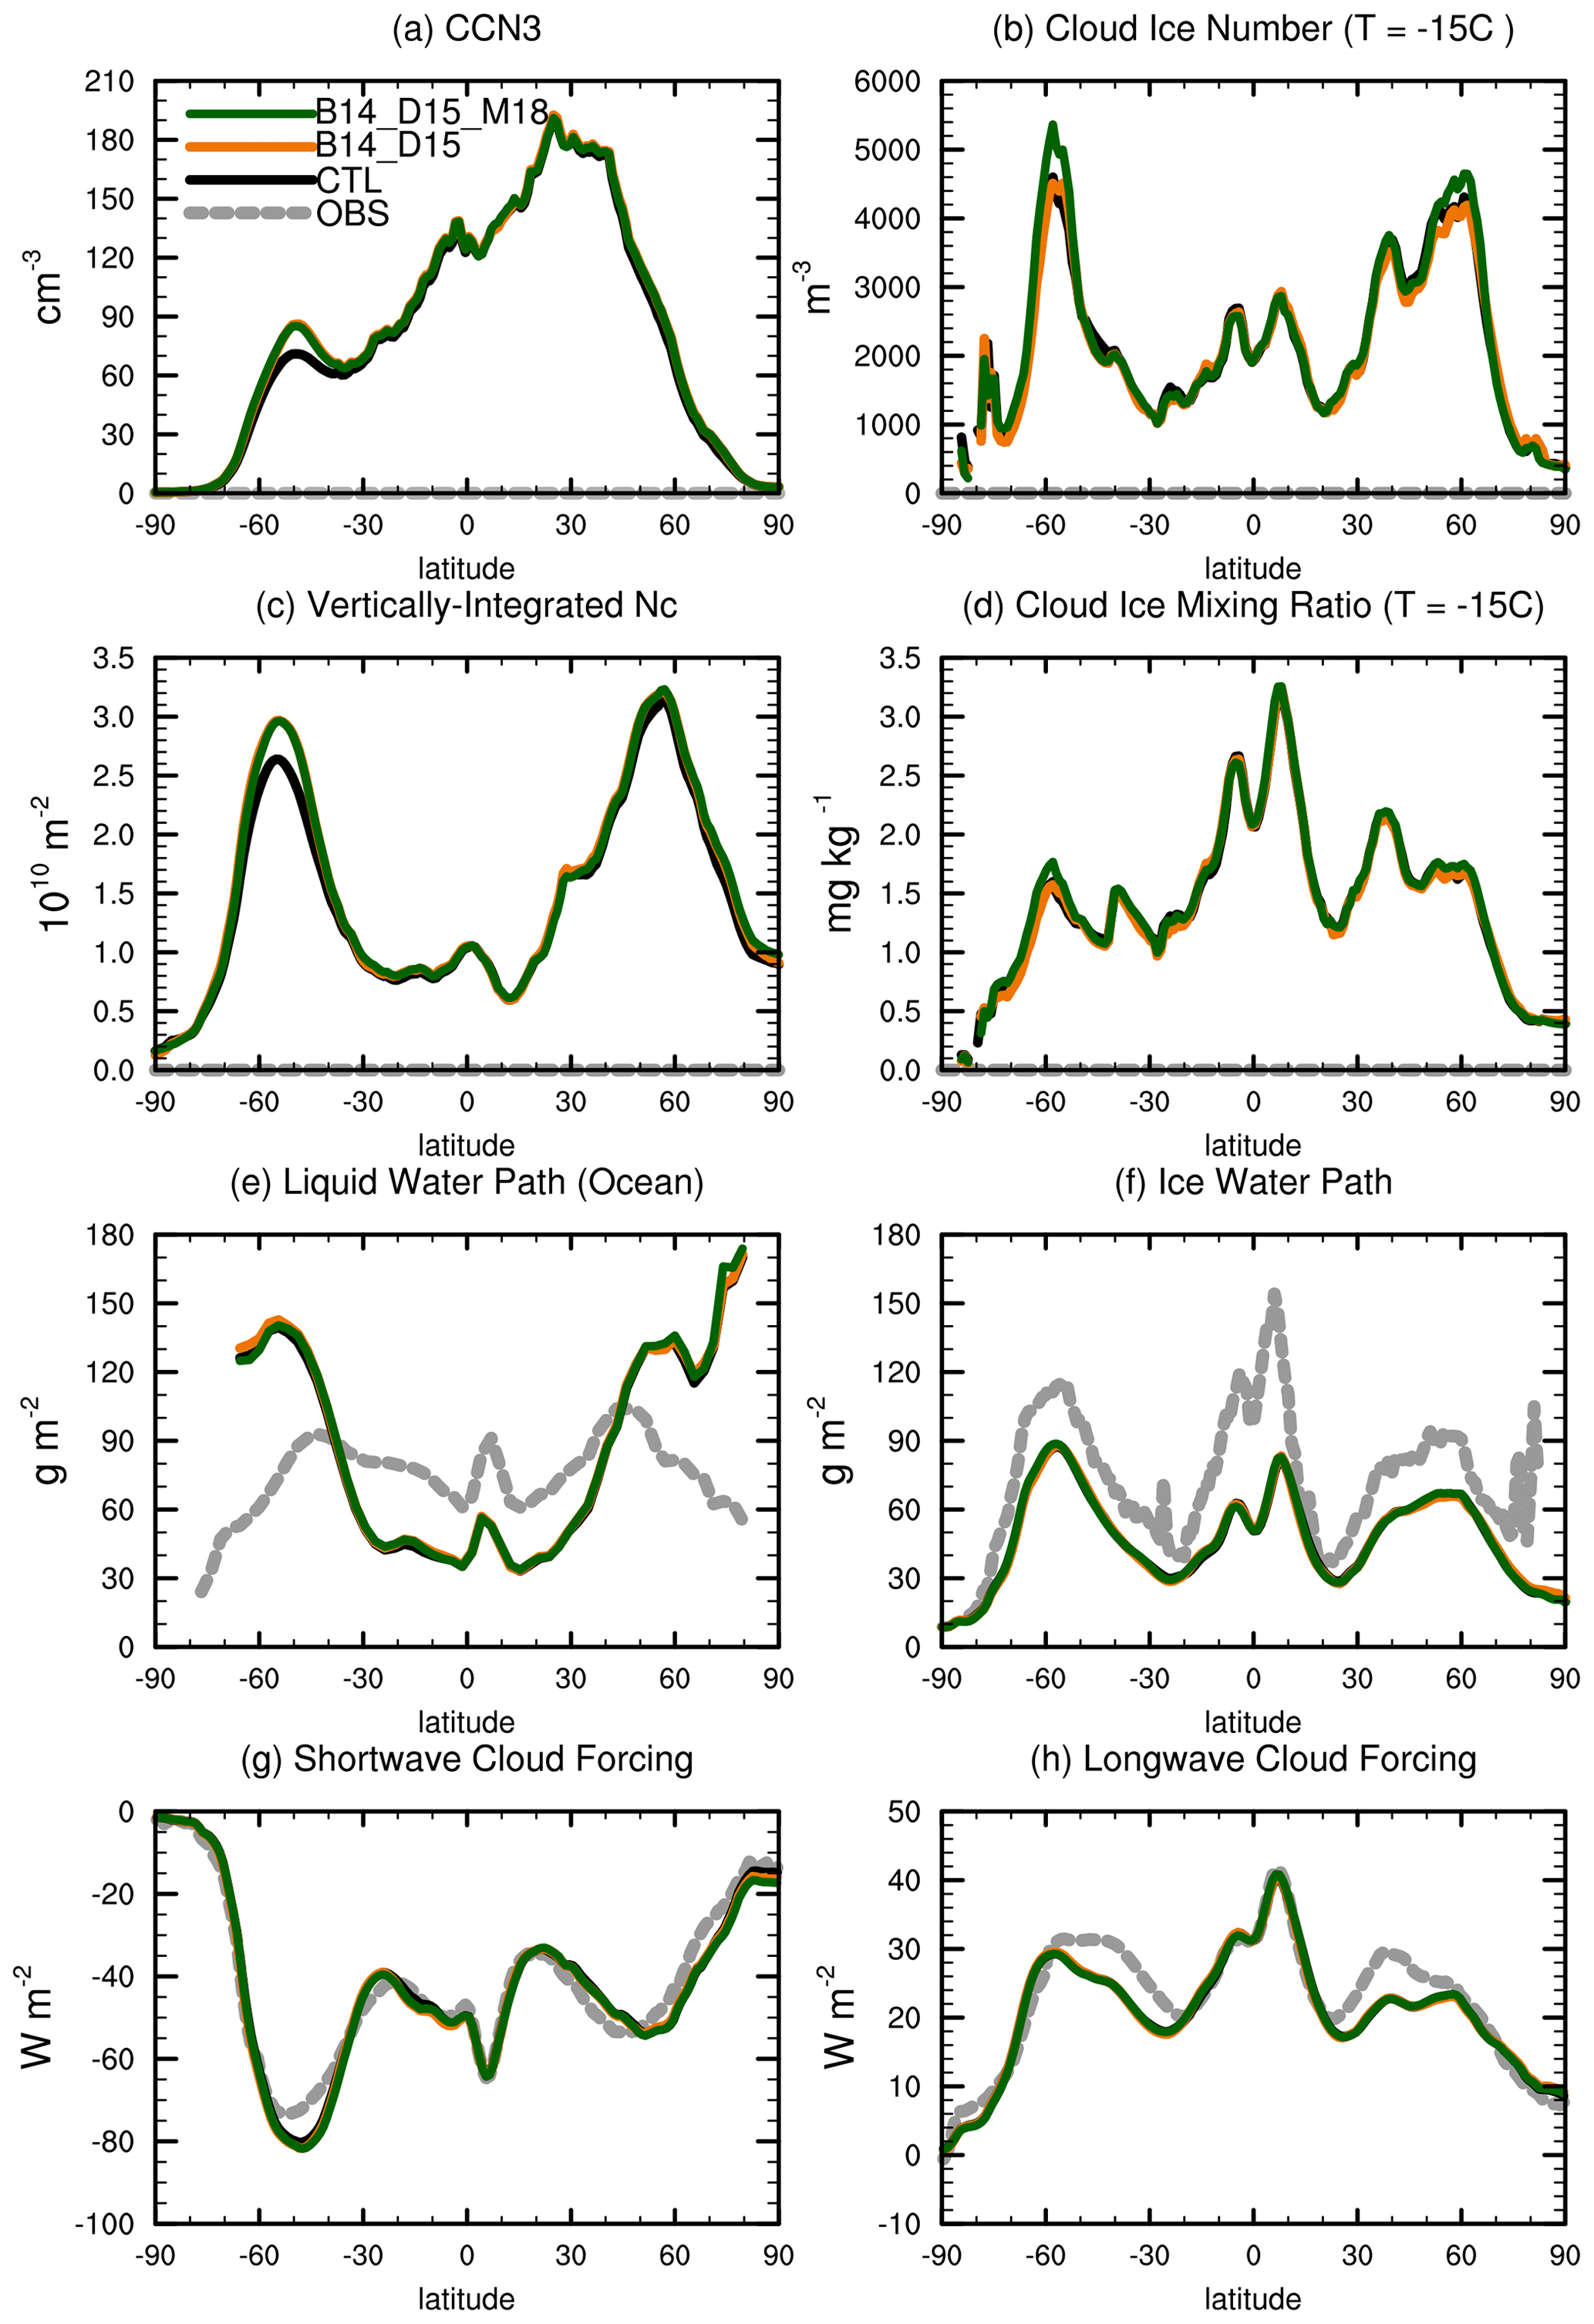
Figure 8Annual zonal-mean distributions of (a) surface CCN concentration at S = 0.1 %; (b) cloud ice number concentration on T = −15∘ isotherm level; (c) vertically integrated cloud droplet number concentration; (d) cloud ice mass mixing ratio on T = −15∘ isotherm level; (e) liquid water path over ocean; (f) ice water path; (g) shortwave cloud forcing; and (h) longwave cloud forcing for CTL (black), B14_D15 (orange), and B14_D15_M18 (green), along with available observations (dashed gray lines) as a reference. The −15∘ isotherm level was selected in panels (b) and (d) to better represent the mixed-phase cloud feature.
A strong CCN effect of MOA on clouds (in terms of significant changes in CCN and CDNUMC) tends to occur only in the SH over 40–60∘ S, while a strong INP effect (in terms of significant changes in cloud ice mass and number concentrations) is notable over 50–70∘ in both hemispheres (Fig. 8). Over 40–60∘ S, a significant increase from 70 to 90 cm−3 in the annual zonal mean surface CCN concentration is observed. The CCN concentration there is nearly 30 % higher in B14_D15 and B14_D15_M18 than in CTL. As a result, CDNUMC increases from 2.6 × 10¹⁰ m−2 in CTL to 3.0 × 10¹⁰ m−2 in B14_D15 and B14_D15_M18 over 40–60∘ S, leading to an increase in LWP due to the aerosol indirect effect (Fig. 8). Furthermore, we notice a stronger SWCF at 40–60∘ S by 3 W m−2 in B14_D15 compared with CTL. After considering the INP effect of MOA in the model, we notice that cloud ice number concentration and cloud ice mass mixing ratio increase in mixed-phase clouds, which led to a slight decrease in CDNUMC. As indicated in Fig. 8b and d, cloud ice number concentration increases from 4500 kg−1 in B14_D15 to 5500 kg−1 in B14_D15_M18 at ∼ 60∘ S, with cloud ice mass mixing ratio increased by 0.25 mg kg−1. Over 60∘N, cloud ice number concentration increases from 4200 kg−1 in B14_D15 to 5200 kg−1 in B14_D15_M18, with cloud ice mass mixing ratio increased by 0.1 mg kg−1.
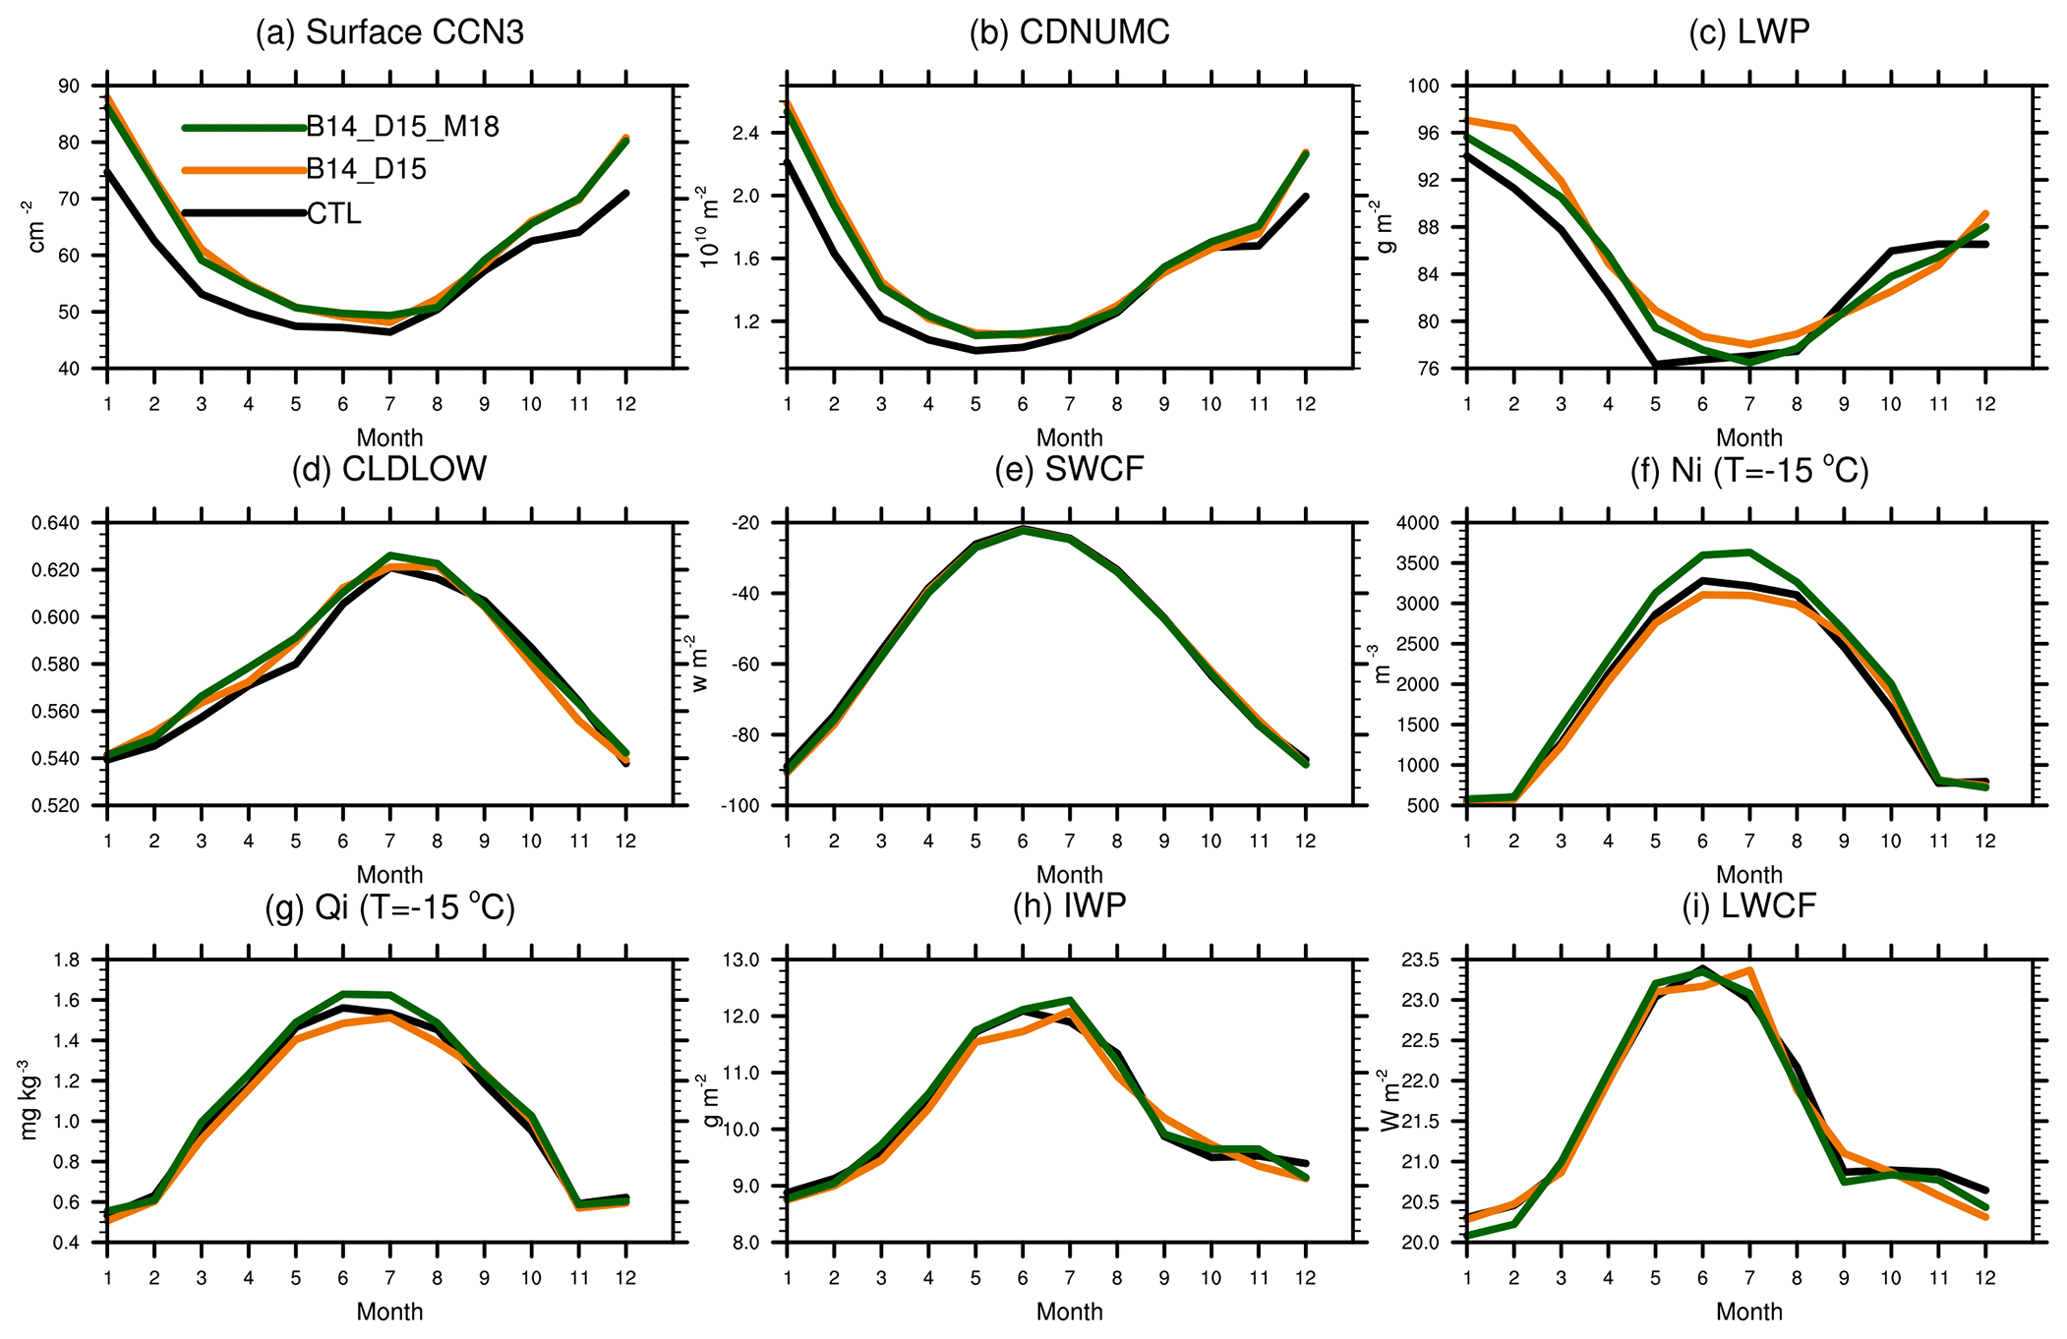
Figure 9Seasonal cycle of (a) surface CCN at 0.1 % supersaturation; (b) vertically integrated cloud droplet number concentration; (c) liquid water path, (d) low cloud amount, (e) shortwave cloud forcing; (f) cloud ice number concentration on T = −15∘ isotherm level; (g) cloud ice mass mixing ratio on T = −15∘ isotherm level; (h) ice water path (IWP); and (i) LWCF for CTL (black), B14_D15 (orange), and B14_D15_M18 (green).
Figure 9 shows the seasonal variations of cloud properties and cloud radiative forcing averaged over the 20–90∘ S in the SH in response to the introduction of MOA as CCN and INPs. The seasonal variation of surface CCN concentration at 0.1 % supersaturation shows a maximum value of 72 cm−3 in the austral summer and a minimum value of ∼ 50 cm−3 in the austral winter in CTL. Similar seasonal variation patterns are also noted for CDNUMC and LWP. With the inclusion of MOA in the model, B14_D15 and B14_D15_M18 produce more surface CCN, with an increase of up to 14 cm−3 (∼ 20 %) in January compared with CTL. Accordingly, CDNUMC increases from 2.1 × 10¹⁰ m−2 in CTL to 2.5 × 10¹⁰ m−2 in B14_D15 in January, and LWP increases from 93 g m−2 in CTL to 97 g m−2 in B14_D15 in January. As a consequence, SWCF is stronger by −3.5 W m−2 in B14_D15 compared to CTL during the austral summer. We also notice that CCN, CDNUMC, and SWCF show smaller changes during the austral winter due to weaker oceanic biological activity and larger sea ice extent.
Different from the warm cloud features above, seasonal variations of ice properties in mixed-phase clouds (i.e., cloud ice mass mixing ratio and number concentration on −15 ∘C isotherm level, IWP) clearly show winter maxima. After introducing the INP effect of MOA in the model, ice number concentration on −15 ∘C isotherm level increases by comparing B14_D15 with B14_D15_M18, with obvious increases of up to 27 % in June. Ice mass mixing ratio on −15 ∘C isotherm level increases by 0.19 mg kg−1 (13 %) in June. Increases in both cloud ice number and mass contribute to the increase of IWP by 0.5 g m−2 in austral winter. The seasonal change of LWCF is not well correlated with changes in ice number concentration and mass mixing ratio in mixed-phase clouds because LWCF is controlled more by high clouds. Our introduction of MOA INPs mainly occurs in mixed-phase clouds and thus has only a small influence on LWCF.
Table 7CCN and INP effects of MOA on SWCF; the values in the table are the mean change and relative change (%). The CCN effect is calculated between the CTL and B14_D15 experiments, and the INP effect is calculated between the B14_D15 and B14D15_M18 experiments, with the bold font indicating the maximum change.

Table 8CCN and INP effect of MOA on LWCF; the values in the table are the mean change and relative change (%). The CCN effect is calculated between the CTL and B14_D15 experiments, and the INP effect is calculated between the B14_D15 and B14D15_M18 experiments, with the bold font indicating the maximum change.
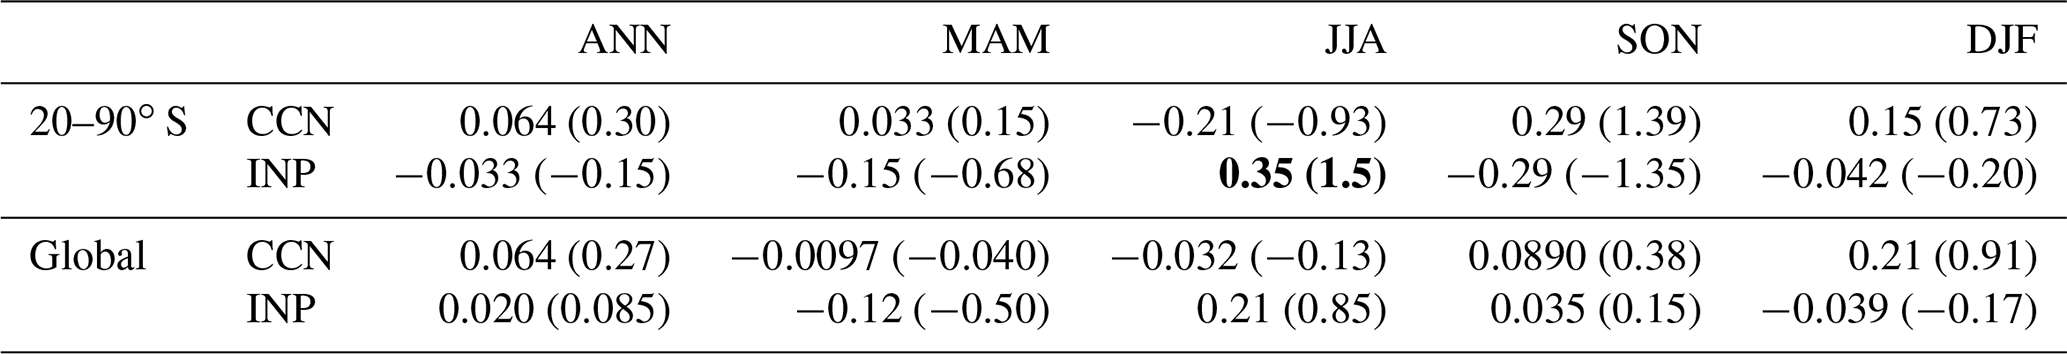
As shown in Table 7, the CCN effect of MOA on SWCF is strongest in the austral summer, with the value of −2.78 W m−2 over 20–90∘ S in the SH. In contrast, the INP effect of MOA on LWCF is strongest in the austral winter, with a value of 0.35 W m−2 (Table 8). For the net cloud forcing (SWCF + LWCF), the CCN effect of MOA is 2.65 W m−2 in austral summer, and the INP effect is 0.65 W m−2 in austral spring over the 20–90∘ S. The annual global mean CCN and INP effects of MOA on the net cloud forcing are −0.35 and 0.016 W m−2, respectively. From an annual mean perspective, the CCN effect of MOA on SWCF is −0.84 W m−2 over 20–90∘ S and is about twice as much as the global mean value (−0.41 W m−2), which indicates that the global annual mean SWCF change due to MOA is dominated by SH contributions.
In this study, for the MOA emission process, we only considered the generation of MOA during the film drop breakup in B14, and the generation of MOA from jet drops is not currently included. The film drops form from bubble-cap films bursting, while the jet drops generate from the base of breaking bubbles. Particles from jet drops, with a diameter of around a single supermicrometer, are considered larger than particles from film drops (Wang et al., 2017). These large aerosol particles from jet drops are more effective as CCN and INPs. Extending the current emission scheme to include MOA emissions through jet drops (Wang et al., 2017) may be possible with more measurements and an improved understanding of the physical mechanisms that determine the sea spray organic emission.
For the ice nucleation efficiency of MOA, the M18 parameterization only includes the more persistent, heat-stable component observed in ambient sea spray aerosol INP sampling. This neglects the heat-labile organic INPs (McCluskey et al., 2018b). Regarding ice nucleation mechanisms, only the immersion mode of ice nucleation is implemented in this study; however, recent laboratory experiments (Wolf et al., 2019) have indicated a potentially important role of MOA in the deposition mode at temperatures below −40 ∘C. Future work will focus on improving the limitations of the current understanding of MOA emission and ice nucleation in the model.
In this study, potential INP species other than dust and MOA, such as ash, biomass-burning particles, or other land-borne biological particles (Hoose et al., 2010; Jahn et al., 2020; Schill et al., 2020), are not represented in the model. These INP species can be regionally important at certain temperature regimes of mixed-phase clouds. Accounting for these species may increase the INP concentrations predicted in the model and change the mixed-phase cloud properties, particularly at warmer temperatures > −15 ∘C. The impacts of these INP species will be quantified in our future studies.
Recent studies indicated an underestimation of ice formation in CAM6 (D'Alessandro et al., 2019) that results in too much cloud liquid and too little cloud ice in mixed-phase clouds. In addition to ice nucleation undertaken in this study, other factors may contribute to this model bias. For example, the CLUBB scheme used in CAM6 for turbulence and shallow convection treats only liquid-phase condensation, lacking ice formation in the model's large-scale cloud macrophysics (Zhang et al., 2020). Furthermore, CAM6 misses the representation of several important mechanisms of secondary ice formation. Observed secondary ice formation processes include rime splintering, ice–ice collision fragmentation, droplet shattering during freezing, and fragmentation during sublimation of ice bridges (Field et al., 2016). Currently, only the rime splintering is considered in CAM6. Lastly, CAM6 with a horizontal resolution of approximately 100 km may not resolve the subgrid cloud processes and heterogeneous distributions of cloud hydrometeors (Tan et al., 2016; Zhang et al., 2019). These issues will be addressed in future studies.
This study introduces MOA into CAM6 as a new aerosol species and treats the chemistry, advection, and wet or dry deposition of MOA in the model. This paper also considers the MOA influences on droplet activation and ice nucleation, particularly focusing on quantifying the INP effect of MOA on cloud properties and radiation. Here we summarize our main findings.
-
Three different emission schemes (B14, G11, and NULL) of MOA were implemented in the model, and simulated MOA concentrations were evaluated with available observations. The global simulation indicates that high MOA burden centers are mostly co-located with regions of vigorous oceanic biological activities and high wind speeds, such as in midlatitude storm tracks, the equatorial upwelling, and coastal regions. The global MOA emission is 24.5 Tg yr−1 in B14, 27.1 Tg yr−1 in G11, and 4.6 Tg yr−1 in the NULL emission approach. On the global scale, the MOA mass emission is 0.67 %, 0.74 %, and 0.13 % of the sea salt mass emission from B14, G11, and NULL, respectively. We show that observed seasonal cycles of marine organic matter at Mace Head and Amsterdam Island are reproduced when the MOA fraction of SSA is assumed to depend on sea spray biology (B14, G11) but are not reproduced when this fraction is assumed to be constant (NULL). Our study does not support the constant organic mass fraction of SSA emissions (Quinn et al., 2014; Saliba et al., 2019; Bates et al., 2020).
-
After introducing MOA in the model, annual mean CCN concentrations (at supersaturation of 0.1 %) are increased by 15 %–30 % over the oceans ranging from 30 to 70∘ S. Two different ice nucleation schemes of MOA (M18 and W15) are implemented and compared with available measurements. The INPs from MOA by the M18 parameterization show a reasonable agreement with observations at NH and SH high latitudes, while simulated total INPs, the sum of MOA INPs from M18 and dust INPs from D15, give a better agreement with observations. W15 for MOA alone overestimates the observed INP concentrations across all temperatures. At −25∘, MOA INP concentrations can be 1000 times higher than those of dust INPs over 40–60∘ S in the SH boundary layer, while dust INP concentrations are higher above 400 hPa altitude over SH and NH.
-
We notice a strong CCN effect of MOA over 40–60∘ S only in the SH, while a strong INP effect of MOA is identified over 50–70∘ in both hemispheres. For seasonal variations, the CCN effect is stronger during the austral summer than in winter, while the INP effect is stronger in the austral winter than in summer. The CCN effect of MOA on SWCF is strongest in the austral summer over the SH with a value of −2.78 W m−2, while the INP effect on LWCF is strongest in the austral winter over the SH with a value of 0.35 W m−2. The annual global mean CCN and INP effect of MOA on the net cloud forcing is −0.35 and 0.016 W m−2, respectively. This work is a stepping stone towards better climate models because of the important role of MOA in biogeochemistry, hydrological cycle, and climate change.
The code from the Community Earth System Model version 2 (CESM) is freely available at http://www.cesm.ucar.edu/models/cesm2 (last access: 3 February 2021, Danabasoglu et al., 2020). The model datasets and marine organic aerosol code are archived at the NCAR Cheyenne supercomputer and are available upon request.
The supplement related to this article is available online at: https://doi.org/10.5194/acp-21-2305-2021-supplement.
XZ and XL conceptualized the analysis and wrote the manuscript with input from the co-authors. XZ modified the code, carried out the simulations, and performed the analysis. SB provided scientific suggestions for the manuscript and provided the model code for the emission of marine organic aerosol. YS provided help in setting up the global climate model, designing the model runs, and creating the figures. XL was involved with obtaining the project grant and supervised the study. All authors were involved in helpful discussions and contributed to the manuscript.
The authors declare that they have no conflict of interest.
Xi Zhao, Xiaohong Liu, and Yang Shi acknowledge the funding support from the US Department of Energy (DOE) Atmospheric System Research (ASR) Program (grant no. DE-SC0020510). Susannah Burrows was supported by the U.S. DOE Early Career Research Program. We would like to acknowledge the use of computational resources for conducting the model simulations at the NCAR-Wyoming Supercomputing Center provided by the NSF and the State of Wyoming and supported by NCAR's Computational and Information Systems Laboratory.
This research has been supported by the US DOE Atmospheric System Research (ASR) Program (grant no. DE-SC0020510) and the U.S. DOE Early Career Research Program.
This paper was edited by Manish Shrivastava and reviewed by Cyril Brunner and two anonymous referees.
Abdul-Razzak, H. and Ghan, S. J.: A parameterization of aerosol activation 2. Multiple aerosol types, J. Geophys. Res.-Atmos., 105, 6837–6844, https://doi.org/10.1029/1999JD901161, 2000.
Alpert, P. A., Kilthau, W. P., Bothe, D. W., Radway, J. A. C., Aller, J. Y., and Knopf, D. A.: The influence of marine microbial activities on aerosol production: A laboratory mesocosm study, J. Geophys. Res., 120, 8841–8860, https://doi.org/10.1002/2015JD023469, 2015.
Ault, A. P., Moffet, R. C., Baltrusaitis, J., Collins, D. B., Ruppel, M. J., Cuadra-Rodriguez, L. A., Zhao, D., Guasco, T. L., Ebben, C. J., Geiger, F. M., Bertram, T. H., Prather, K. A., and Grassian, V. H.: Size-dependent changes in sea spray aerosol composition and properties with different seawater conditions, Environ. Sci. Technol., 47, 5603–5612, https://doi.org/10.1021/es400416g, 2013.
Bates, T. S., Quinn, P. K., Coffman, D. J., Johnson, J. E., Upchurch, L., Saliba, G., Lewis, S., Graff, J., Russell, L. M., and Behrenfeld, M. J.: Variability in Marine Plankton Ecosystems Are Not Observed in Freshly Emitted Sea Spray Aerosol Over the North Atlantic Ocean, Geophys. Res. Lett., 47, e2019GL085938, https://doi.org/10.1029/2019GL085938, 2020.
Burrows, S. M., Ogunro, O., Frossard, A. A., Russell, L. M., Rasch, P. J., and Elliott, S. M.: A physically based framework for modeling the organic fractionation of sea spray aerosol from bubble film Langmuir equilibria, Atmos. Chem. Phys., 14, 13601–13629, https://doi.org/10.5194/acp-14-13601-2014, 2014.
Burrows, S. M., Easter, R., Liu, X., Ma, P.-L., Wang, H., Elliott, S. M., Singh, B., Zhang, K., and Rasch, P. J.: OCEANFILMS sea-spray organic aerosol emissions – Part 1: implementation and impacts on clouds, Atmos. Chem. Phys. Discuss. [preprint], https://doi.org/10.5194/acp-2018-70, in review, 2018.
Ceburnis, D., O'Dowd, C. D., Jennings, G. S., Facchini, M. C., Emblico, L., Decesari, S., Fuzzi, S., and Sakalys, J.: Marine aerosol chemistry gradients: Elucidating primary and secondary processes and fluxes, Geophys. Res. Lett., 35, L07804, https://doi.org/10.1029/2008GL033462, 2008.
Christiansen, S., Salter, M. E., Gorokhova, E., Nguyen, Q. T., and Bilde, M.: Sea Spray Aerosol Formation: Laboratory Results on the Role of Air Entrainment, Water Temperature, and Phytoplankton Biomass, Environ. Sci. Technol., 53, 13107–13116, https://doi.org/10.1021/acs.est.9b04078, 2019.
Creamean, J. M., Kirpes, R. M., Pratt, K. A., Spada, N. J., Maahn, M., de Boer, G., Schnell, R. C., and China, S.: Marine and terrestrial influences on ice nucleating particles during continuous springtime measurements in an Arctic oilfield location, Atmos. Chem. Phys., 18, 18023–18042, https://doi.org/10.5194/acp-18-18023-2018, 2018.
Cullen, J. J.: The Deep Chlorophyll Maximum: Comparing Vertical Profiles of Chlorophyll a, Can. J. Fish. Aquat. Sci., 39, 791–803, https://doi.org/10.1139/f82-108, 1982.
D'Alessandro, J. J., Diao, M., Wu, C., Liu, X., Jensen, J. B., and Stephens, B. B.: Cloud phase and relative humidity distributions over the Southern Ocean in austral summer based on in situ observations and CAM5 simulations, J. Climate, 32, 2781–2805, https://doi.org/10.1175/JCLI-D-18-0232.1, 2019.
Danabasoglu, G., Lamarque, J. F., Bacmeister, J., Bailey, D. A., DuVivier, A. K., Edwards, J., Emmons, L. K., Fasullo, J., Garcia, R., Gettelman, A., Hannay, C., Holland, M. M., Large, W. G., Lauritzen, P. H., Lawrence, D. M., Lenaerts, J. T. M., Lindsay, K., Lipscomb, W. H., Mills, M. J., Neale, R., Oleson, K. W., Otto-Bliesner, B., Phillips, A. S., Sacks, W., Tilmes, S., van Kampenhout, L., Vertenstein, M., Bertini, A., Dennis, J., Deser, C., Fischer, C., Fox-Kemper, B., Kay, J. E., Kinnison, D., Kushner, P. J., Larson, V. E., Long, M. C., Mickelson, S., Moore, J. K., Nienhouse, E., Polvani, L., Rasch, P. J., and Strand, W. G.: The Community Earth System Model Version 2 (CESM2), J. Adv. Model. Earth Syst., 12, e2019MS001916, https://doi.org/10.1029/2019MS001916, 2020 (code available at: http://www.cesm.ucar.edu/models/cesm2, last access: 3 February 2021).
DeMott, P. J., Prenni, A. J., McMeeking, G. R., Sullivan, R. C., Petters, M. D., Tobo, Y., Niemand, M., Möhler, O., Snider, J. R., Wang, Z., and Kreidenweis, S. M.: Integrating laboratory and field data to quantify the immersion freezing ice nucleation activity of mineral dust particles, Atmos. Chem. Phys., 15, 393–409, https://doi.org/10.5194/acp-15-393-2015, 2015.
DeMott, P. J., Hill, T. C. J., McCluskey, C. S., Prather, K. A., Collins, D. B., Sullivan, R. C., Ruppel, M. J., Mason, R. H., Irish, V. E., Lee, T., Hwang, C. Y., Rhee, T. S., Snider, J. R., McMeeking, G. R., Dhaniyala, S., Lewis, E. R., Wentzell, J. J. B., Abbatt, J., Lee, C., Sultana, C. M., Ault, A. P., Axson, J. L., Martinez, M. D., Venero, I., Santos-Figueroa, G., Stokes, M. D., Deane, G. B., Mayol-Bracero, O. L., Grassian, V. H., Bertram, T. H., Bertram, A. K., Moffett, B. F., and Franc, G. D.: Sea spray aerosol as a unique source of ice nucleating particles, P. Natl. Acad. Sci. USA, 113, 5797–5803, 2016.
Facchini, M. C., Rinaldi, M., Decesari, S., Carbone, C., Finessi, E., Mircea, M., Fuzzi, S., Ceburnis, D., Flanagan, R., Nilsson, E. D., de Leeuw, G., Martino, M., Woeltjen, J., and O'Dowd, C. D.: Primary submicron marine aerosol dominated by insoluble organic colloids and aggregates, Geophys. Res. Lett., 35, L17814, https://doi.org/10.1029/2008GL034210, 2008.
Field, P. R., Lawson, R. P., Brown, P. R. A., Lloyd, G., Westbrook, C., Moisseev, D., Miltenberger, A., Nenes, A., Blyth, A., Choularton, T., Connolly, P., Buehl, J., Crosier, J., Cui, Z., Dearden, C., DeMott, P., Flossmann, A., Heymsfield, A., Huang, Y., Kalesse, H., Kanji, Z. A., Korolev, A., Kirchgaessner, A., Lasher-Trapp, S., Leisner, T., McFarquhar, G., Phillips, V., Stith, J., and Sullivan, S.: Secondary Ice Production – current state of the science and recommendations for the future, Meteorological Monographs, 58, 7.1–7.20, https://doi.org/10.1175/amsmonographs-d-16-0014.1, 2016.
Forestieri, S. D., Moore, K. A., Martinez Borrero, R., Wang, A., Stokes, M. D., and Cappa, C. D.: Temperature and Composition Dependence of Sea Spray Aerosol Production, Geophys. Res. Lett., 45, 7218–7225, https://doi.org/10.1029/2018GL078193, 2018.
Gantt, B., Meskhidze, N., Facchini, M. C., Rinaldi, M., Ceburnis, D., and O'Dowd, C. D.: Wind speed dependent size-resolved parameterization for the organic mass fraction of sea spray aerosol, Atmos. Chem. Phys., 11, 8777–8790, https://doi.org/10.5194/acp-11-8777-2011, 2011.
Gardner, W. D., Mishonov, A., and Richardson, M. J.: Global POC concentrations from in-situ and satellite data, Deep-Sea Res., 53, 718–740, 2006.
Gettelman, A. and Morrison, H.: Advanced Two-Moment Bulk Microphysics for Global Models. Part I: Off-Line Tests and Comparison with Other Schemes, J. Climate, 28, 1268–1287, 2015.
Golaz, J. C., Larson, V. E., and Cotton, W. R.: A PDF-based model for boundary layer clouds. Part I: Method and model description, J. Atmos. Sci., 59, 3540–3551, https://doi.org/10.1175/1520-0469(2002)059<3540:APBMFB>2.0.CO;2, 2002.
Golaz, J.-C., Caldwell, P. M., Van Roekel, L. P., Petersen, M. R., Tang, Q., Wolfe, J. D., Abeshu, G., Anantharaj, V., Asay-Davis, X. S., Bader, D. C., Baldwin, S. A., Bisht, G., Bogenschutz, P. A., Branstetter, M., Brunke, M. A., Brus, S. R., Burrows, S. M., Cameron-Smith, P. J., Donahue, A. S., Deakin, M., Easter, R. C., Evans, K. J., Feng, Y., Flanner, M., Foucar, J. G., Fyke, J. G., Griffin, B. M., Hannay, C., Harrop, B. E., Hoffman, M. J., Hunke, E. C., Jacob, R. L., Jacobsen, D. W., Jeffery, N., Jones, P. W., Keen, N. D., Klein, S. A., Larson, V. E., Leung, L. R., Li, H. Y., Lin, W., Lipscomb, W. H., Ma, P. L., Mahajan, S., Maltrud, M. E., Mametjanov, A., McClean, J. L., McCoy, R. B., Neale, R. B., Price, S. F., Qian, Y., Rasch, P. J., Reeves Eyre, J. E. J., Riley, W. J., Ringler, T. D., Roberts, A. F., Roesler, E. L., Salinger, A. G., Shaheen, Z., Shi, X., Singh, B., Tang, J., Taylor, M. A., Thornton, P. E., Turner, A. K., Veneziani, M., Wan, H., Wang, H., Wang, S., Williams, D. N., Wolfram, P. J., Worley, P. H., Xie, S., Yang, Y., Yoon, J. H., Zelinka, M. D., Zender, C. S., Zeng, X., Zhang, C., Zhang, K., Zhang, Y., Zheng, X., Zhou, T., and Zhu, Q.: The DOE E3SM Coupled Model Version 1: Overview and Evaluation at Standard Resolution, J. Adv. Model. Earth Sy., 11, 2089-2129, https://doi.org/10.1029/2018MS001603, 2019.
Gong, S. L., Barrie, L. A., and Blanchet, J. P.: Modeling sea-salt aerosols in the atmosphere 1. Model development, J. Geophys. Res.-Atmos., 102, 3805–3818, https://doi.org/10.1029/96jd02953, 1997.
Hoose, C. and Möhler, O.: Heterogeneous ice nucleation on atmospheric aerosols: a review of results from laboratory experiments, Atmos. Chem. Phys., 12, 9817–9854, https://doi.org/10.5194/acp-12-9817-2012, 2012.
Hoose, C., Kristjánsson, J. E., and Burrows, S. M.: How important is biological ice nucleation in clouds on a global scale?, Environ. Res. Lett., 5, 024009, https://doi.org/10.1088/1748-9326/5/2/024009, 2010.
Huang, W. T. K., Ickes, L., Tegen, I., Rinaldi, M., Ceburnis, D., and Lohmann, U.: Global relevance of marine organic aerosol as ice nucleating particles, Atmos. Chem. Phys., 18, 11423–11445, https://doi.org/10.5194/acp-18-11423-2018, 2018.
Iacono, M. J., Delamere, J. S., Mlawer, E. J., Shephard, M. W., Clough, S. A., and Collins, W. D.: Radiative forcing by long-lived greenhouse gases: Calculations with the AER radiative transfer models, J. Geophys. Res.-Atmos., 113, D13103, https://doi.org/10.1029/2008JD009944, 2008.
Jahn, L. G., Polen, M. J., Jahl, L. G., Brubaker, T. A., Somers, J., and Sullivan, R. C.: Biomass combustion produces ice-active minerals in biomass-burning aerosol and bottom ash, P. Natl. Acad. Sci. USA, 117, 21928–21937, https://doi.org/10.1073/pnas.1922128117, 2020.
Kanji, Z. A., Ladino, L. A., Wex, H., Boose, Y., Burkert-Kohn, M., Cziczo, D. J., and Kramer, M.: Overview of Ice Nucleating Particles, Meteor. Mon., 58, 1.1–1.33, https://doi.org/10.1175/Amsmonographs-D-16-0006.1, 2017.
Langmann, B., Scannell, C., and O'Dowd, C.: New Directions: Organic matter contribution to marine aerosols and cloud condensation nuclei, Atmos. Environ., 42, 7821–7822, 2008.
Larson, V. E., Golaz, J.-C., and Cotton, W. R.: Small-Scale and Mesoscale Variability in Cloudy Boundary Layers: Joint Probability Density Functions, J. Atmos. Sci., 59, 3519–3539, https://doi.org/10.1175/1520-0469(2002)059<3519:SSAMVI>2.0.CO;2, 2002.
Lin, S. J. and Rood, R. B.: An explicit flux-form semi-Lagrangian shallow-water model on the sphere, Q. J. Roy. Meteor. Soc., 123, 2477–2498, 1997.
Liu, X., Easter, R. C., Ghan, S. J., Zaveri, R., Rasch, P., Shi, X., Lamarque, J.-F., Gettelman, A., Morrison, H., Vitt, F., Conley, A., Park, S., Neale, R., Hannay, C., Ekman, A. M. L., Hess, P., Mahowald, N., Collins, W., Iacono, M. J., Bretherton, C. S., Flanner, M. G., and Mitchell, D.: Toward a minimal representation of aerosols in climate models: description and evaluation in the Community Atmosphere Model CAM5, Geosci. Model Dev., 5, 709–739, https://doi.org/10.5194/gmd-5-709-2012, 2012.
Liu, X., Ma, P.-L., Wang, H., Tilmes, S., Singh, B., Easter, R. C., Ghan, S. J., and Rasch, P. J.: Description and evaluation of a new four-mode version of the Modal Aerosol Module (MAM4) within version 5.3 of the Community Atmosphere Model, Geosci. Model Dev., 9, 505–522, https://doi.org/10.5194/gmd-9-505-2016, 2016.
Mårtensson, E. M., Nilsson, E. D., de Leeuw, G., Cohen, L. H., and Hansson, H. C.: Laboratory simulations and parameterization of the primary marine aerosol production, J. Geophys. Res.-Atmos., 108, 4297–4312, https://doi.org/10.1029/2002jd002263, 2003.
McCluskey, C. S., Hill, T. C. J., Humphries, R. S., Rauker, A. M., Moreau, S., Strutton, P. G., Chambers, S. D., Williams, A. G., McRobert, I., Ward, J., Keywood, M. D., Harnwell, J., Ponsonby, W., Loh, Z. M., Krummel, P. B., Protat, A., Kreidenweis, S. M., and DeMott, P. J.: Observations of Ice Nucleating Particles Over Southern Ocean Waters, Geophys. Res. Lett., 45, 911989–911997, https://doi.org/10.1029/2018GL079981, 2018a.
McCluskey, C. S., Ovadnevaite, J., Rinaldi, M., Atkinson, J., Belosi, F., Ceburnis, D., Marullo, S., Hill, T. C. J., Lohmann, U., Kanji, Z. A., O'Dowd, C., Kreidenweis, S. M., and DeMott, P. J.: Marine and Terrestrial Organic Ice-Nucleating Particles in Pristine Marine to Continentally Influenced Northeast Atlantic Air Masses, J. Geophys. Res.-Atmos., 123, 6196–6212, 2018b.
McCluskey, C. S., DeMott, P. J., Ma, P. L., and Burrows, S. M.: Numerical Representations of Marine Ice-Nucleating Particles in Remote Marine Environments Evaluated Against Observations, Geophys. Res. Lett., 46, 7838–7847, https://doi.org/10.1029/2018gl081861, 2019.
Meskhidze, N., Xu, J., Gantt, B., Zhang, Y., Nenes, A., Ghan, S. J., Liu, X., Easter, R., and Zaveri, R.: Global distribution and climate forcing of marine organic aerosol: 1. Model improvements and evaluation, Atmos. Chem. Phys., 11, 11689–11705, https://doi.org/10.5194/acp-11-11689-2011, 2011.
Mlawer, E. J., Taubman, S. J., Brown, P. D., Iacono, M. J., and Clough, S. A.: Radiative transfer for inhomogeneous atmospheres: RRTM, a validated correlated-k model for the longwave, J. Geophys. Res.-Atmos., 102, 16663–16682, 1997.
Monahan, E. C., Spiel, D. E., and Davidson, K. L.: A Model of Marine Aerosol Generation Via Whitecaps and Wave Disruption BT – Oceanic Whitecaps: And Their Role in Air-Sea Exchange Processes, edited by: Monahan, E. C. and Mac Niocaill, G., Springer Netherlands, 167–174, https://doi.org/10.1007/978-94-009-4668-2_16, 1986.
Murray, B. J., O'Sullivan, D., Atkinson, J. D., and Webb, M. E.: Ice nucleation by particles immersed in supercooled cloud droplets, Chem. Soc. Rev., 41, 6519–6554, https://doi.org/10.1039/c2cs35200a, 2012.
Niemand, M., Möhler, O., Vogel, B., Vogel, H., Hoose, C., Connolly, P., Klein, H., Bingemer, H., DeMott, P., Skrotzki, J., and Leisner, T.: A Particle-Surface-Area-Based Parameterization of Immersion Freezing on Desert Dust Particles, J. Atmos. Sci., 69, 3077–3092, https://doi.org/10.1175/JAS-D-11-0249.1, 2012.
O'Dowd, C. D., Facchini, M. C., Cavalli, F., Ceburnis, D., Mircea, M., Decesari, S., Fuzzi, S., Yoon, Y. J., and Putaud, J. P.: Biogenically driven organic contribution to marine aerosol, Nature, 431, 676–680, 2004.
O'Dowd, C. D., Langmann, B., Varghese, S., Scannell, C., Ceburnis, D., and Facchini, M. C.: A combined organic-inorganic sea-spray source function, Geophys. Res. Lett., 35, L01801, https://doi.org/10.1029/2007GL030331, 2008.
Prather, K. A., Bertram, T. H., Grassian, V. H., Deane, G. B., Stokes, M. D., DeMott, P. J., Aluwihare, L. I., Palenik, B. P., Azam, F., Seinfeld, J. H., Moffet, R. C., Molina, M. J., Cappa, C. D., Geiger, F. M., Roberts, G. C., Russell, L. M., Ault, A. P., Baltrusaitis, J., Collins, D. B., Corrigan, C. E., Cuadra-Rodriguez, L. A., Ebben, C. J., Forestieri, S. D., Guasco, T. L., Hersey, S. P., Kim, M. J., Lambert, W. F., Modini, R. L., Mui, W., Pedler, B. E., Ruppel, M. J., Ryder, O. S., Schoepp, N. G., Sullivan, R. C., and Zhao, D.: Bringing the ocean into the laboratory to probe the chemical complexity of sea spray aerosol, P. Natl. Acad. Sci. USA, 110, 7550–7555, https://doi.org/10.1073/pnas.1300262110, 2013.
Quinn, P. K., Bates, T. S., Schulz, K. S., Coffman, D. J., Frossard, A. A., Russell, L. M., Keene, W. C., and Kieber, D. J.: Contribution of sea surface carbon pool to organic matter enrichment in sea spray aerosol, Nat. Geosci., 7, 228–232, https://doi.org/10.1038/ngeo2092, 2014.
Rasch, P. J., Xie, S., Ma, P. L., Lin, W., Wang, H., Tang, Q., Burrows, S. M., Caldwell, P., Zhang, K., Easter, R. C., Cameron-Smith, P., Singh, B., Wan, H., Golaz, J. C., Harrop, B. E., Roesler, E., Bacmeister, J., Larson, V. E., Evans, K. J., Qian, Y., Taylor, M., Leung, L. R., Zhang, Y., Brent, L., Branstetter, M., Hannay, C., Mahajan, S., Mametjanov, A., Neale, R., Richter, J. H., Yoon, J. H., Zender, C. S., Bader, D., Flanner, M., Foucar, J. G., Jacob, R., Keen, N., Klein, S. A., Liu, X., Salinger, A. G., Shrivastava, M., and Yang, Y.: An Overview of the Atmospheric Component of the Energy Exascale Earth System Model, J. Adv. Model. Earth Sy., 11, 2377–2411, https://doi.org/10.1029/2019MS001629, 2019.
Rastelli, E., Corinaldesi, C., Dell'anno, A., Lo Martire, M., Greco, S., Cristina Facchini, M., Rinaldi, M., O'Dowd, C., Ceburnis, D., and Danovaro, R.: Transfer of labile organic matter and microbes from the ocean surface to the marine aerosol: An experimental approach, Sci. Rep.-UK, 7, 1–10, https://doi.org/10.1038/s41598-017-10563-z, 2017.
Rinaldi, M., Fuzzi, S., Decesari, S., Marullo, S., Santoleri, R., Provenzale, A., von Hardenberg, J., Ceburnis, D., Vaishya, A., O'Dowd, C. D., and Facchini, M. C.: Is chlorophyll-a the best surrogate for organic matter enrichment in submicron primary marine aerosol?, J. Geophys. Res.-Atmos., 118, 4964–4973, 2013.
Saliba, G., Chen, C. L., Lewis, S., Russell, L. M., Rivellini, L. H., Lee, A. K. Y., Quinn, P. K., Bates, T. S., Haëntjens, N., Boss, E. S., Karp-Boss, L., Baetge, N., Carlson, C. A., and Behrenfeld, M. J.: Factors driving the seasonal and hourly variability of sea-spray aerosol number in the North Atlantic, P. Natl. Acad. Sci. USA, 116, 20309–20314, https://doi.org/10.1073/pnas.1907574116, 2019.
Schill, G. P., DeMott, P. J., Emerson, E. W., Rauker, A. M. C., Kodros, J. K., Suski, K. J., Hill, T. C. J., Levin, E. J. T., Pierce, J. R., Farmer, D. K., and Kreidenweis, S. M.: The contribution of black carbon to global ice nucleating particle concentrations relevant to mixed-phase clouds, P. Natl. Acad. Sci. USA, 117, 22705–22711, https://doi.org/10.1073/pnas.2001674117, 2020.
Schnell, R. C. and Vali, G.: Freezing nuclei in marine waters, Tellus, 27, 321–323, https://doi.org/10.3402/tellusa.v27i3.9911, 1975.
Sciare, J., Favez, O., Sarda-Esteve, R., Oikonomou, K., Cachier, H., and Kazan, V.: Long-term observations of carbonaceous aerosols in the Austral Ocean atmosphere: Evidence of a biogenic marine organic source, J. Geophys. Res.-Atmos., 114, D15302, https://doi.org/10.1029/2009JD011998, 2009.
Shi, Y. and Liu, X.: Dust Radiative Effects on Climate by Glaciating Mixed-Phase Clouds, Geophys. Res. Lett., 46, 6128–6137, https://doi.org/10.1029/2019GL082504, 2019.
Steele, J. H.: Environmental Control Of Photosynthesis In The Sea, Limnol. Oceanogr., 7, 137–150, https://doi.org/10.4319/lo.1962.7.2.0137, 1962.
Tan, I., Storelvmo, T., and Zelinka, M. D.: Observational constraints on mixed-phase clouds imply higher climate sensitivity, Science, 352, 224–227, https://doi.org/10.1126/science.aad5300, 2016.
Tobo, Y., Adachi, K., DeMott, P. J., Hill, T. C. J., Hamilton, D. S., Mahowald, N. M., Nagatsuka, N., Ohata, S., Uetake, J., Kondo, Y., and Koike, M.: Glacially sourced dust as a potentially significant source of ice nucleating particles, Nat. Geosci., 12, 253, https://doi.org/10.1038/s41561-019-0314-x, 2019.
Vali, G., DeMott, P. J., Möhler, O., and Whale, T. F.: Technical Note: A proposal for ice nucleation terminology, Atmos. Chem. Phys., 15, 10263–10270, https://doi.org/10.5194/acp-15-10263-2015, 2015.
Vergara-Temprado, J., Murray, B. J., Wilson, T. W., O'Sullivan, D., Browse, J., Pringle, K. J., Ardon-Dryer, K., Bertram, A. K., Burrows, S. M., Ceburnis, D., DeMott, P. J., Mason, R. H., O'Dowd, C. D., Rinaldi, M., and Carslaw, K. S.: Contribution of feldspar and marine organic aerosols to global ice nucleating particle concentrations, Atmos. Chem. Phys., 17, 3637–3658, https://doi.org/10.5194/acp-17-3637-2017, 2017.
Vergara-Temprado, J., Holden, M. A., Orton, T. R., O'Sullivan, D., Umo, N. S., Browse, J., Reddington, C., Baeza-Romero, M. T., Jones, J. M., Lea-Langton, A., Williams, A., Carslaw, K. S., and Murray, B. J.: Is Black Carbon an Unimportant Ice-Nucleating Particle in Mixed-Phase Clouds?, J. Geophys. Res.-Atmos., 123, 4273–4283, https://doi.org/10.1002/2017JD027831, 2018.
Vignati, E., Facchini, M. C., Rinaldi, M., Scannell, C., Ceburnis, D., Sciare, J., Kanakidou, M., Myriokefalitakis, S., Dentener, F., and O'Dowd, C. D.: Global scale emission and distribution of sea-spray aerosol: Sea-salt and organic enrichment, Atmos. Environ., 44, 670–677, 2010.
Wang, X., Deane, G. B., Moore, K. A., Ryder, O. S., Stokes, M. D., Beall, C. M., Collins, D. B., Santander, M. V., Burrows, S. M., Sultana, C. M., and Prather, K. A.: The role of jet and film drops in controlling the mixing state of submicron sea spray aerosol particles, P. Natl. Acad. Sci. USA, 114, 6978–6983, https://doi.org/10.1073/pnas.1702420114, 2017.
Wang, Y., Liu, X., Hoose, C., and Wang, B.: Different contact angle distributions for heterogeneous ice nucleation in the Community Atmospheric Model version 5, Atmos. Chem. Phys., 14, 10411–10430, https://doi.org/10.5194/acp-14-10411-2014, 2014.
Wilson, T. W., Ladino, L. A., Alpert, P. A., Breckels, M. N., Brooks, I. M., Browse, J., Burrows, S. M., Carslaw, K. S., Huffman, J. A., Judd, C., Kilthau, W. P., Mason, R. H., McFiggans, G., Miller, L. A., Najera, J. J., Polishchuk, E., Rae, S., Schiller, C. L., Si, M., Temprado, J. V., Whale, T. F., Wong, J. P. S., Wurl, O., Yakobi-Hancock, J. D., Abbatt, J. P. D., Aller, J. Y., Bertram, A. K., Knopf, D. A., and Murray, B. J.: A marine biogenic source of atmospheric ice-nucleating particles, Nature, 525, 234–238, https://doi.org/10.1038/nature14986, 2015.
Wolf, M. J., Coe, A., Dove, L. A., Zawadowicz, M. A., Dooley, K., Biller, S. J., Zhang, Y., Chisholm, S. W., and Cziczo, D. J.: Investigating the Heterogeneous Ice Nucleation of Sea Spray Aerosols Using Prochlorococcus as a Model Source of Marine Organic Matter, Environ. Sci. Technol., 53, 1139–1149, https://doi.org/10.1021/acs.est.8b05150, 2019.
Yoon, Y. J., Ceburnis, D., Cavalli, F., Jourdan, O., Putaud, J. P., Facchini, M. C., Decesari, S., Fuzzi, S., Sellegri, K., Jennings, S. G., and O'Dowd, C. D.: Seasonal characteristics of the physicochemical properties of North Atlantic marine atmospheric aerosols, J. Geophys. Res.-Atmos., 112, D04206, https://doi.org/10.1029/2005JD007044, 2007.
Yun, Y. X. and Penner, J. E.: An evaluation of the potential radiative forcing and climatic impact of marine organic aerosols as heterogeneous ice nuclei, Geophys. Res. Lett., 40, 4121–4126, 2013.
Zhang, G. J. and Mcfarlane, N. A.: Sensitivity of Climate Simulations to the Parameterization of Cumulus Convection in the Canadian Climate Center General-Circulation Model, Atmos. Ocean, 33, 407–446, 1995.
Zhang, M., Liu, X., Diao, M., D'Alessandro, J. J., Wang, Y., Wu, C., Zhang, D., Wang, Z., and Xie, S.: Impacts of Representing Heterogeneous Distribution of Cloud Liquid and Ice on Phase Partitioning of Arctic Mixed-Phase Clouds with NCAR CAM5, J. Geophys. Res.-Atmos., 124, 13071–13090, https://doi.org/10.1029/2019JD030502, 2019.
Zhang, M., Xie, S., Liu, X., Lin, W., Zhang, K., Ma, H. Y., Zheng, X., and Zhang, Y.: Toward Understanding the Simulated Phase Partitioning of Arctic Single-Layer Mixed-Phase Clouds in E3SM, Earth Space Sci., 7, e2020EA001125, https://doi.org/10.1029/2020ea001125, 2020.