the Creative Commons Attribution 4.0 License.
the Creative Commons Attribution 4.0 License.
 | 23 Dec 2021
Measurement report: Three years of size-resolved eddy-covariance particle number flux measurements in an urban environment
Agnes Straaten
Stephan Weber
Size-resolved particle number fluxes in the size range of 10 nm < particle diameter (Dp) < 200 nm were measured over a 3-year period (April 2017–March 2020) using the eddy-covariance technique at an urban site in Berlin, Germany. The observations indicated the site as a net source of particles with a median total particle number flux of FTNC=0.86 × 10⁸ m−2 s−1. The turbulent surface–atmosphere exchange of particles was clearly dominated by ultrafine particles (Dp < 100 nm) with a share of 96 % of total particle number flux (FUFP=0.83 × 10⁸ m−2 s−1).
Annual estimates of median FTNC and FUFP slightly decreased by −9.6 % (−8.9 % for FUFP) from the first to the second observation year and a further −5.9 % (−6.1 % for FUFP) from the second to the third year. The annual variation might be due to different reasons such as the variation of flux footprints in the individual years, a slight reduction of traffic intensity in the third year, or a progressive transition of the vehicle fleet towards a higher share of low-emission standards or electric drive. Size-resolved measurements illustrated events of bidirectional fluxes, i.e. simultaneous emission and deposition fluxes within the size spectrum, which occurred more often in spring, late summer, and autumn than in winter. Multi-year observations of size-resolved particle fluxes proved to be important for a deeper understanding of particle exchange processes with the urban surface and the pronounced influence of traffic at this urban site.
- Article
(14573 KB) - Full-text XML
- BibTeX
- EndNote


Airborne particles, especially ultrafine particles (UFPs) with diameters of Dp < 100 nm, may enter the circulatory system and are associated with acute and chronic effects on human health (Oberdörster et al., 1995; Nemmar et al., 2002; HEI Review Panel on Ultrafine Particles, 2013; Schraufnagel, 2020). UFPs are abundant in cities due to a number of different anthropogenic emission sources such as private and public traffic or commercial and industrial combustion (Tsang et al., 2008; Tie et al., 2009; Bäfver et al., 2011; Weber et al., 2013; Kumar et al., 2014; Gerling et al., 2020). In order to understand the spatiotemporal variation of population exposure to ultrafine particles, information on the strength and location of sources and sinks and the turbulent exchange between the surface and atmosphere are essential (Buzorius et al., 2000; Longley et al., 2003; Mårtensson et al., 2006; Weber et al., 2013).
The turbulent surface–atmosphere exchange of pollutants may be quantified using the micrometeorological eddy-covariance (EC) method (e.g. Baldocchi 2003; Burba and Anderson, 2010; Aubinet et al., 2012). During the past decades EC was applied over non-urban and urban terrain to quantify gaseous pollutant and particle fluxes (e.g. Buzorius et al., 1998; Suni et al., 2003; Damay et al., 2009; Ripamonti et al., 2013; Gioli et al., 2013; Deventer et al., 2018).
Urban particle number flux measurements using EC with varying lower cut-off diameters of the particle counting instruments were conducted in a couple of cities across Europe (cf. Table 1). These studies generally report the city to be a net source of particles, i.e. a positive average particle number flux, which by convention indicates an upward-directed emission flux to the atmosphere in contrast to a negative (downward-directed) deposition flux. A significant contribution to the particle number flux is attributed to vehicle traffic with peak mode diameters of fresh traffic emission in the size range of Dp < 30 nm (Wiedensohler et al., 2002; Zhu et al., 2007; Rönkkö et al., 2017). In the diurnal cycle, particle number fluxes are relatively small at night but increase in the early-morning hours due to anthropogenic activity and enhanced turbulence, resulting in peak upward fluxes at around noon or in the early afternoon (Dorsey et al., 2002; Mårtensson et al., 2006; Deventer et al., 2013; Conte et al., 2018). Variation in particle number fluxes is shown to be related to different land use within the flux source area with lower emission fluxes from vegetated surfaces or residential areas and higher fluxes from urban land use with intense traffic (e.g. Järvi et al., 2009; Ripamonti et al., 2013).
Although aerosol processes and dynamics such as particle deposition or the influence on human health are strongly related to the particle diameter, information on size-resolved urban particle number fluxes, especially in the ultrafine size range, remains scarce. Size-resolved fluxes, however, help to deepen understanding of particle sources and dynamics in the urban boundary layer. Additionally, the flux data are essential to parameterize dry-deposition velocities and to validate models of urban air quality (Saylor et al., 2019; Farmer et al., 2021). Size-resolved flux observations may point to situations of bidirectional particle fluxes, i.e. simultaneously occurring upward and downward fluxes in different ranges of the particle size spectrum (Schmidt and Klemm, 2008; Deventer et al., 2015). Usually upward fluxes tend to occur in the smaller size ranges and may point to emission sources such as vehicle traffic, whereas downward fluxes mainly occur in larger size ranges, i.e. accumulation mode particles.
Particle flux studies usually comprise observation periods of a few weeks or months within different seasons of the year. Only a few studies report observations for longer periods such as 1-year or multi-annual periods (e.g. Ripamonti et al., 2013; Deventer et al., 2015; cf. Table 1). This is especially true for size-resolved particle number fluxes from urban areas for which multi-annual data have not been available yet. These longer-term studies, however, are important to analyse temporal variation of urban particle number fluxes and their driving mechanisms.
Here, we report on 3 years of size-resolved urban particle number fluxes in the diameter size range of 10 nm < Dp < 200 nm. The measurements were carried out in central Berlin, Germany, in the framework of the urban-climate research project [UC]2-3DO (Urban Climate Under Change, Three-Dimensional Observation of Atmospheric Processes in Cities; Scherer et al., 2019). We analyse the diurnal, seasonal, and annual variation of ultrafine and size-resolved particle number fluxes and study the contribution from surface drivers such as land use on temporal variation of particle fluxes.
Table 1Overview of total particle number fluxes of measurement campaigns from 10 different cities. In the right column, the information in brackets specifies the data basis of the individual studies for estimating the observed particle fluxes. IQR: interquartile range.
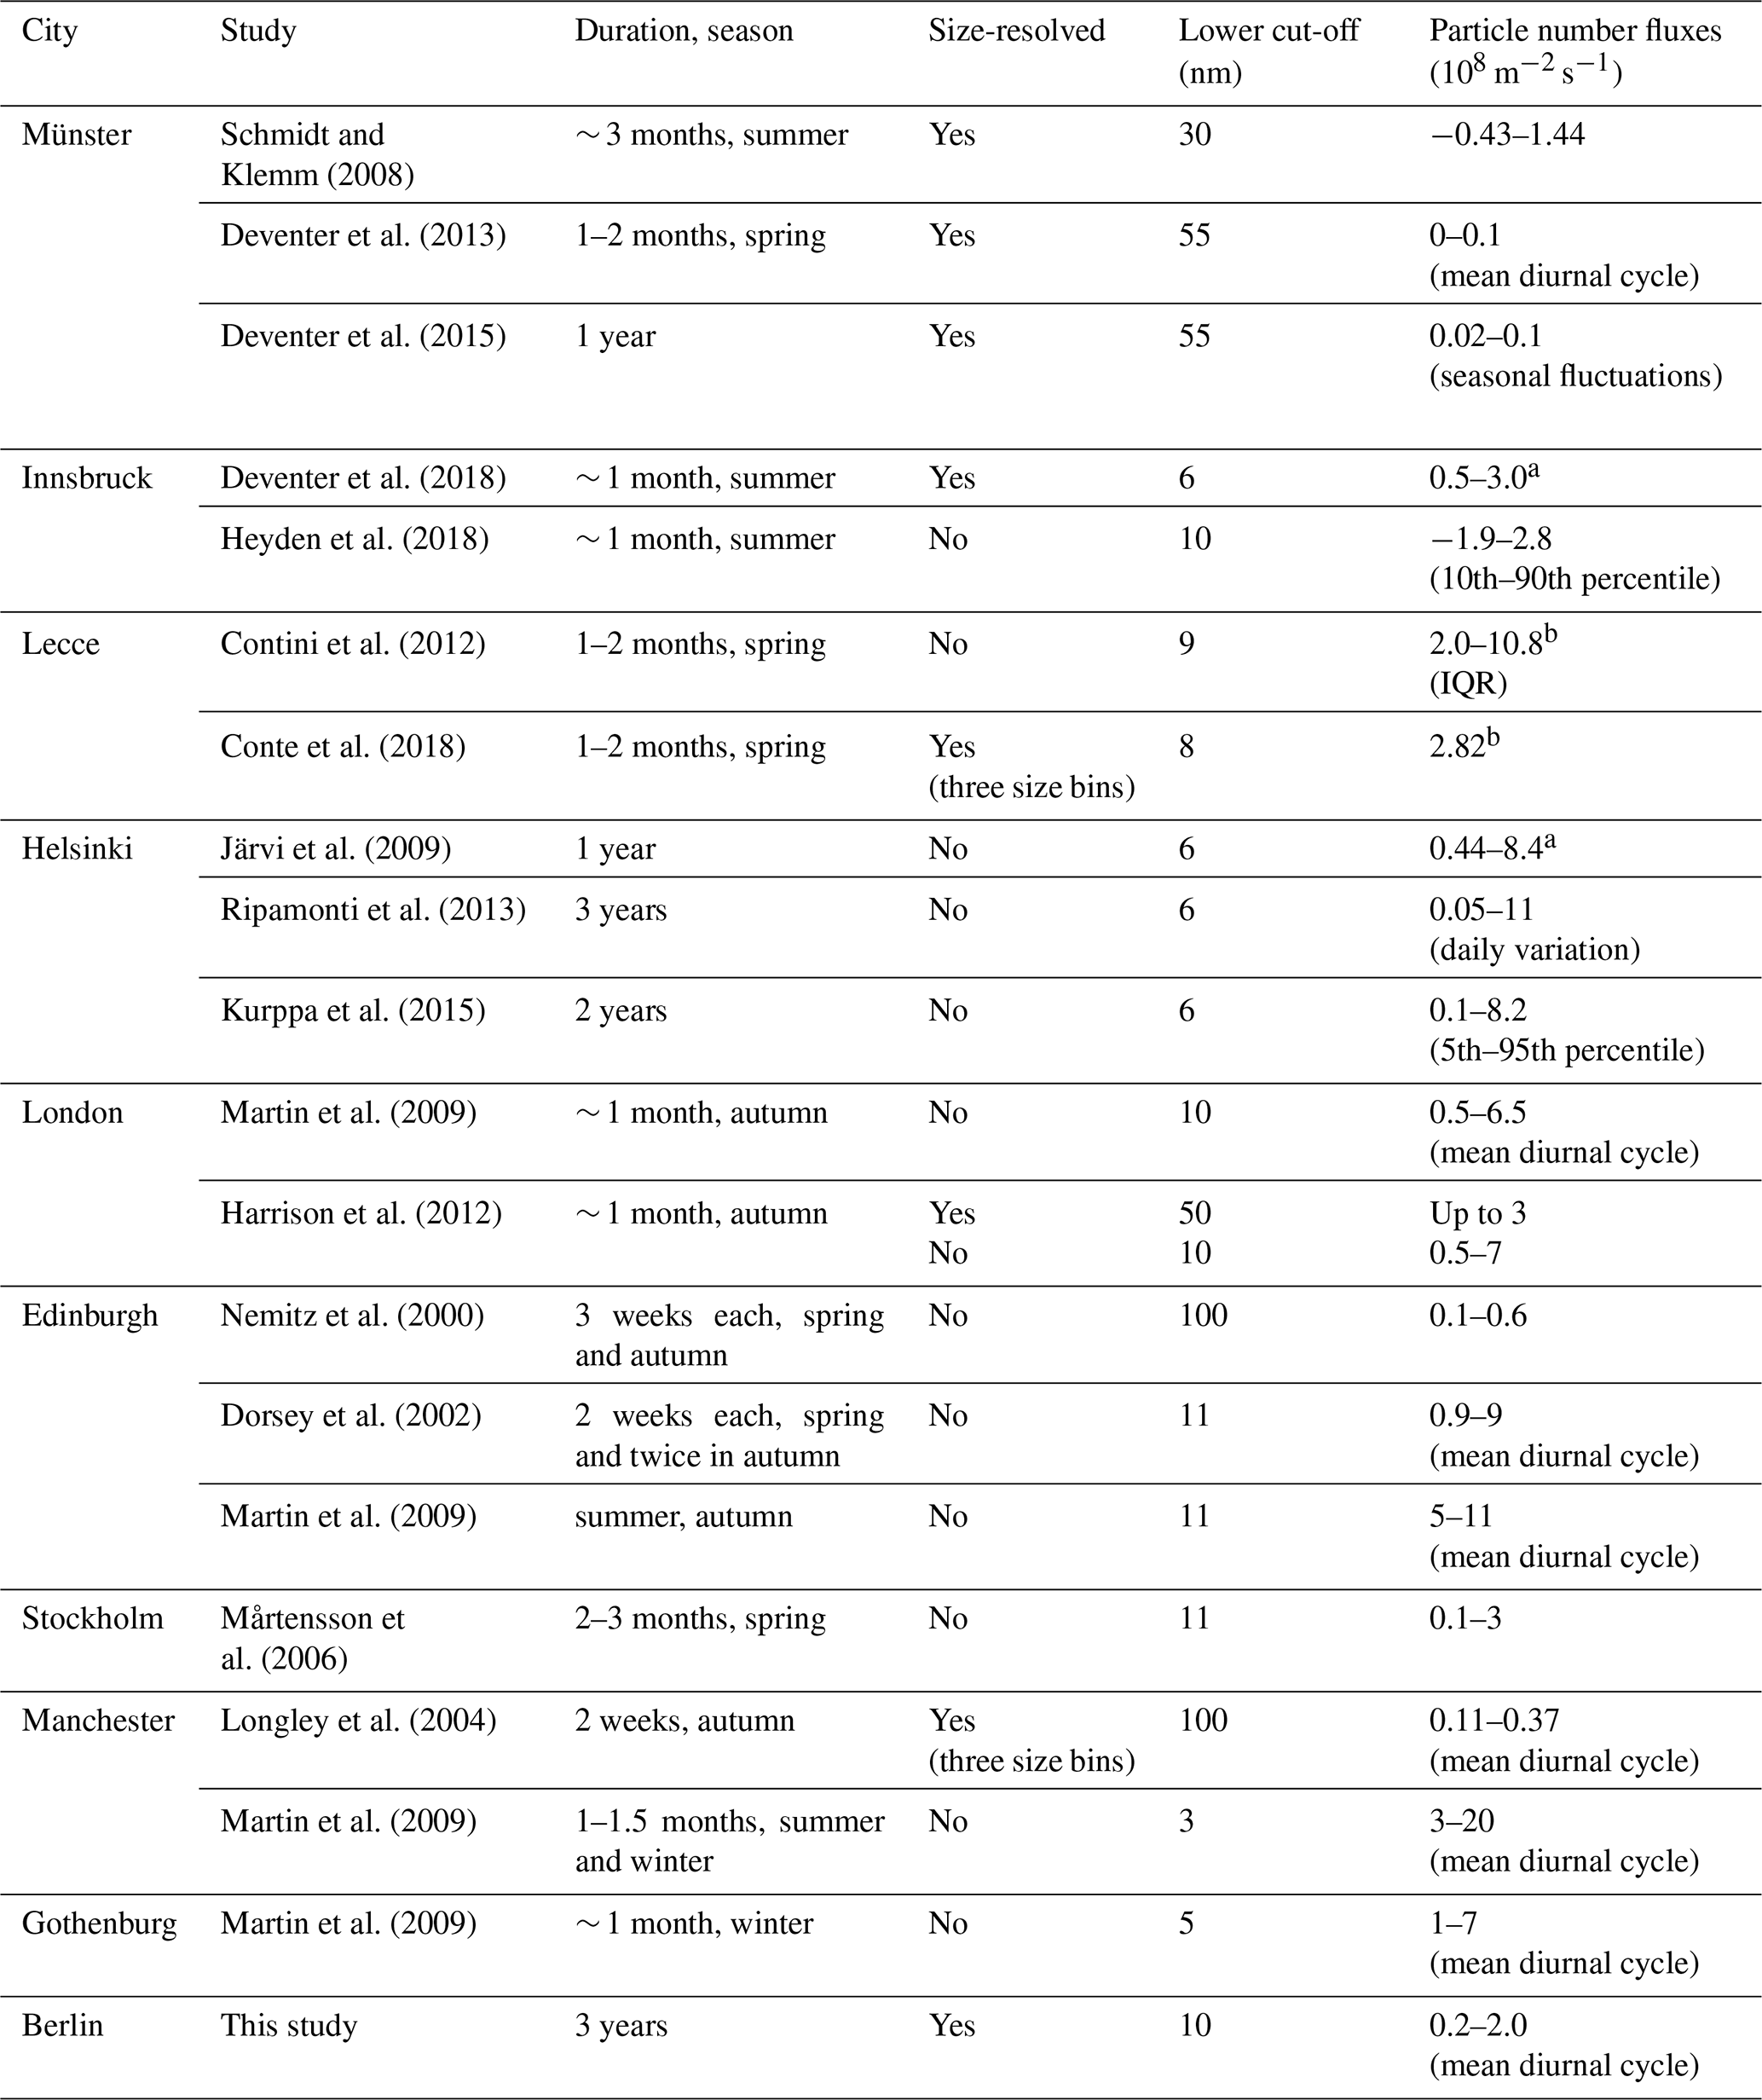
a Average daytime emission. b Measurement height of 14 m (roughness sublayer).
2.1 Measurement site
Size-resolved particle number fluxes were measured from 1 April 2017 to 31 March 2020 near “Ernst-Reuter-Platz” in central Berlin, Germany, atop the main building of Technische Universität Berlin. The site surroundings comprise residential built-up surfaces, traffic, and green areas (Fig. 1). To the north of the flux site, the busy main road “Straße des 17. Juni” with an average daily traffic intensity of about 37 300 vehicles d−1 is located (Umweltatlas Berlin, 2017). To represent traffic intensity in the flux footprint, data from two traffic counting stations at “Hardenbergstraße” (HS, south-west of the measurement site) and Straße des 17. Juni (S17J, east of the site) were available (cf. Fig. 1). Data were provided by the Traffic Information Centre Berlin (VMZ Berlin Betreibergesellschaft mbH) at hourly resolution.
2.2 Instrumentation
The particle flux instrumentation consisted of an electric mobility particle sizer (Engine Exhaust Particle Sizer Spectrometer, EEPS 3090, TSI Inc., Minnesota, USA) and a 3D ultrasonic anemometer (USA-1, Metek GmbH, Elmshorn, Germany). Both instruments synchronously sampled at a frequency of 10 Hz. The EEPS measures the particle number size distribution (PNSD) over the size range of 5.6 nm < Dp < 560 nm in 32 size channels. Through a stainless-steel tube of 0.01 m diameter, the air was sampled at a flow rate of 10 L min−1, resulting in a laminar sampling flow (Reynolds number of ≈ 1300; Hinds, 1999). The steel tube was attached to a 10 m meteorological rooftop mast with the sample inlet located next to the sonic anemometer at a height of 57 m above ground level. We sampled dry aerosol using a Nafion dryer (MD-700, Perma Pure LLC, length 0.9 m) to keep relative humidity in sample air < 40 %.
The particle spectrometer EEPS 3090 classifies particles based on their differential electrical mobility. Charged particles entering the electric field are reflected outwards where the charge is delivered to 22 electrodes and converted into particle number concentrations (TSI Inc., 2015). To limit baseline noise in the electrometer readings as can be caused by dirt, the instrument electrometers were zero-checked every second to third day using the instrument firmware. The instrument was primarily developed for measurements of engine exhaust emissions that show higher particle concentrations than usually observed in the urban background. Hence, EEPS readings of specific size channels may fall below the analyser's minimum threshold concentration, resulting in non-valid concentration readings. To avoid data gaps within the PNSD, a cubic natural spline interpolation was used as a gap-filling strategy to obtain complete PNSDs (cf. Sect. 2.3).
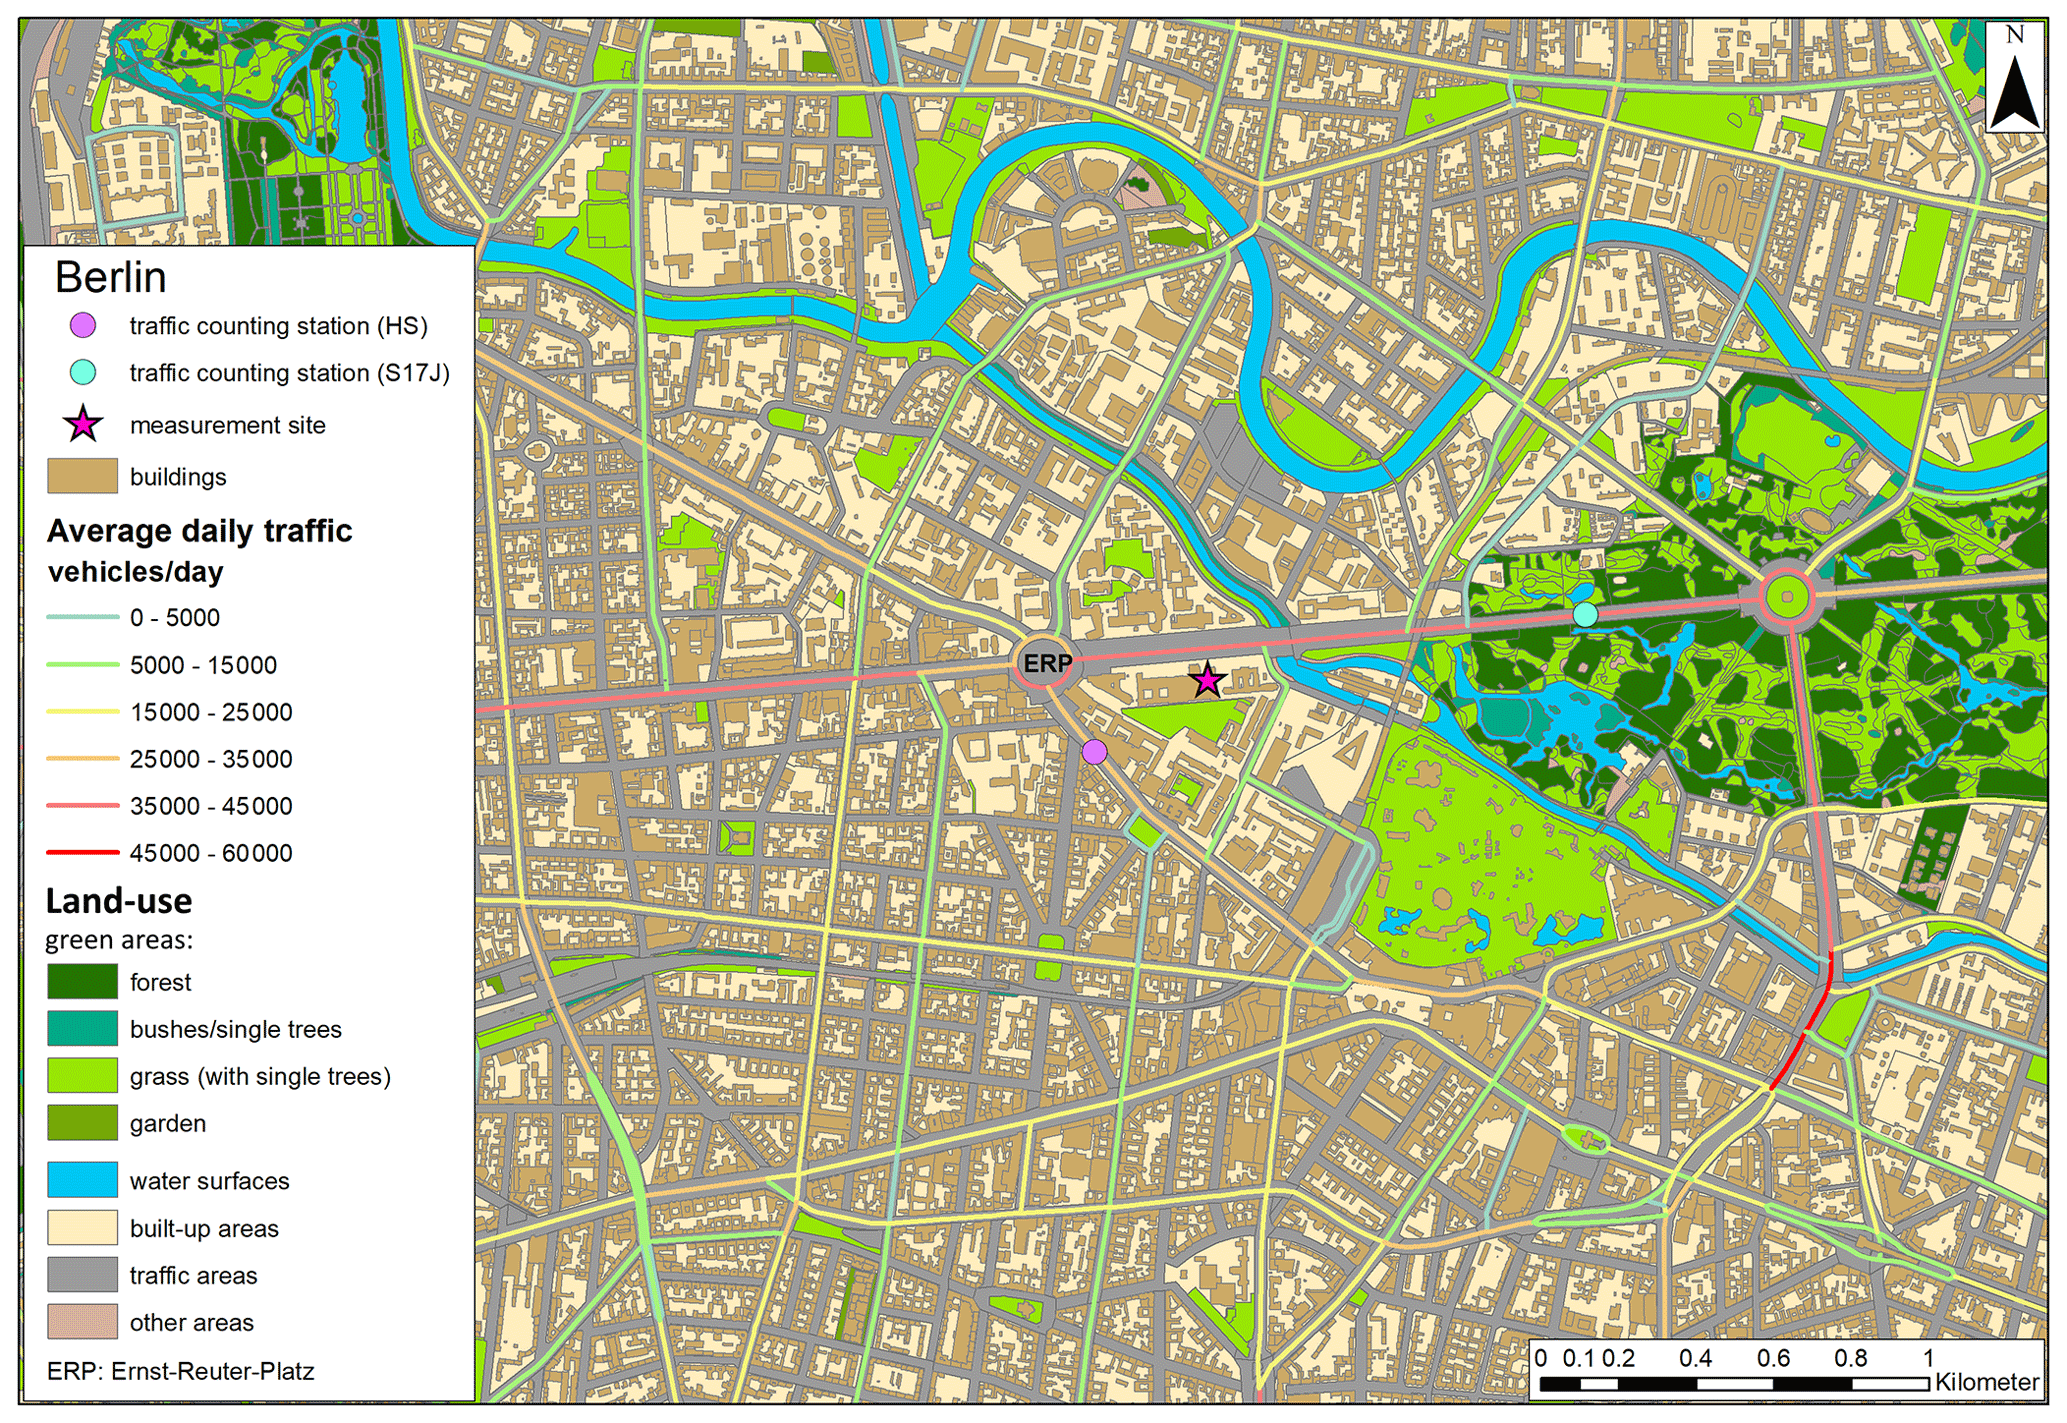
Figure 1Eddy-covariance measurement site in central Berlin near Ernst-Reuter-Platz (ERP; data sources: Geoportal Berlin, 2014 (modified), 2021; Umweltatlas Berlin, 2017).
To quality-check EEPS measurements for concentrations and fluxes, an on-site inter-comparison to a water-based condensation particle counter (WCPC 3787, TSI Inc., Minnesota, USA) was carried out.
2.3 Data handling
The post-processing of particle data and fluxes comprised the following procedures.
Size-dependent diffusional particle losses within the sampling line and the Nafion dryer were corrected according to Hinds (1999). The Nafion dryer (MD-700) was assumed to be a stainless-steel tube of 0.9 m length, as no specific correction factors were available for the dryer.
Subsequently, gaps in the PNSD (cf. Sect. 2.2) were filled using a natural spline interpolation following Meyer-Kornblum et al. (2019). As the gap-filling procedure caused larger uncertainties in the boundary regions of the PNSD, the size spectrum was limited to 21 size channels in the size range of 10 nm < Dp < 200 nm. According to Meyer-Kornblum et al. (2019), PNSDs were gap-filled as long as less than 9 gaps in total (minimum of 12 remaining data points within the PNSD) or 5 contiguous gaps (5 neighbouring size channels) occurred in that size range. PNSDs not fulfilling these requirements were discarded. We measured a total of 8.43 × 10⁸ PNSDs during the entire study period, of which 85.4 % were gap-filled, 14.0 % were rejected, and 0.6 % were without gaps and did not need to be gap-filled. The total particle number concentration (TNC, 10 nm < Dp < 200 nm); ultrafine particles (UFPs, 10 nm < Dp < 100 nm); and three modal concentrations, i.e. nucleation mode (NUC, 10 nm < Dp < 30 nm), Aitken mode (AIT, 30 nm < Dp < 100 nm), and accumulation mode (ACC, 100 nm < Dp < 200 nm) were calculated from gap-filled PNSDs.
For particle flux calculation, the missing-sample allowance for each half-hourly block average was set to 20 %. Wind vectors and particle number concentrations were checked for plausibility concerning a realistic range of absolute values, and spikes were removed following Vickers and Mahrt (1997). Additionally, double coordinate rotation for tilt correction and spectral corrections of high-pass (Moncrieff et al., 2004) and low-pass (Moncrieff et al., 1997) filtering effects were applied. For time lag compensation between particle and sonic data, we used covariance maximization with a specified time lag window. Following other studies of urban particle flux, we applied linear detrending (e.g. Mårtensson et al., 2006; Vogt et al., 2011a; Deventer et al., 2013, 2018; Heyden et al., 2018). The particle flux calculation was performed using the software EddyPro® v6.2.2. To calculate particle number fluxes for WCPC data (cf. Sect. 2.2), the same procedure as described above was adopted. By definition, positive flux values indicate upward (emission) fluxes to the atmosphere, whereas negative values denote downward (deposition) fluxes to the surface.
The response time of the EEPS for fast changes in concentration was reported as 0.5 s (Johnson et al., 2003, 2004). This response time is similar to other CPCs or size spectrometers used in particle flux measurements (e.g. Buzorius, 2001; Dorsey et al., 2002; Vogt et al., 2011b; Deventer et al., 2015). Limited sensor response is one reason for underestimation of turbulent particle fluxes. We corrected for sensor response according to Horst (1997), resulting in an average flux correction of between +2.4 % and +3.0 % in the 21 size channels. Finally, particle number fluxes with quality flags > 6 according to Foken et al. (2004) were discarded from subsequent analysis.
For the flux footprint prediction, we used the 2D parameterization of Kljun et al. (2015). To analyse the impact of varying amounts of major and minor roads in the annual flux footprints, we calculated a footprint-weighted average daily traffic (ADT) intensity. For this, the ADT shapefile (data source: Umweltatlas Berlin, 2017) was converted into a raster grid (4 km × 4 km with 4 m spatial resolution, comparable to the footprint climatology raster) and weighted with the footprint climatology to calculate ADT.
2.4 Data availability
For the entire 3-year period, data availability was 59.2 % for total particle number flux (FTNC) (59.3 % for UFP flux, FUFP). For the individual observation years, data availability of FTNC decreased from 62.9 % (FUFP: 63.0 %) in the first year to 61.1 % (FUFP: 61.2 %) in the second and 53.6 % (FUFP: 53.6 %) in the third year. Data availability varied due to different reasons such as quality checks, PNSDs that not fulfil the requirements for the gap-filling procedure, and off times due to maintenance of the EEPS. The lower data availability in the third year was due to a 2-month period (22 May–24 July 2019) during which the EEPS was not available at the site due to inter-comparison measurements. Data availability was generally lower at night (higher rejection of EC data due to quality flags as is common in EC measurements due to reduced turbulence and stronger stability) and showed the highest diurnal average data availability for FUFP in autumn (69 %), followed by winter (58 %), spring (56 %), and summer (54 %).
2.5 Quantification of measurement uncertainty
Atmospheric observations are prone to measurement uncertainty, e.g. sampling errors as well as sensor and gap-filling uncertainty. In the following, we briefly outline the approach of quantifying the potential sources of uncertainty.
The gap-filling procedure of size channels below the minimum threshold concentration of the EEPS causes uncertainty due to the natural spline interpolation method (Meyer-Kornblum et al., 2019). Hence, percentage errors resulting from the interpolation process are dependent on the number of gaps within a PNSD and the particle diameter. The highest average percentage errors of 13.2 % up to 31.6 % due to the gap-filling procedure occur in the size range of 10–20 nm. The corresponding uncertainty estimates for the size ranges of 20–50, 50–100, and 100–200 nm were between 5.6 %–17.2 %, 2.0 %–3.7 %, and 2.2 %–6.7 %, respectively (Meyer-Kornblum et al., 2019).
The random error for eddy-covariance flux measurements was estimated according to Finkelstein and Sims (2001). The median random flux error varies between 27 % and 40 % for the different size channels (25 % for FUFP and FTNC) and generally increases towards the boundary size regions of the PNSD. This coincides with random flux errors of between 28 % and 39 % as reported by Deventer et al. (2018).
2.6 Land-use regression analysis
A multiple linear land-use regression (LUR) analysis was carried out to estimate the relationship of FTNC and FUFP with land use in the flux footprint. The land-use types were determined based on a biotope type mapping provided by city authorities (Geoportal Berlin, 2014). We binned data into 16 wind sectors, which consisted of three land-use types, namely “built-up areas”, “traffic areas”, and “green areas”. Green areas (cf. Fig. 1) were not classified into more specific subtypes, since the surface fractions of forest, bushes/single trees, and garden areas in the flux footprints were small (cf. Fig. 5). Additionally, the available data on specific subtypes of green areas were limited and could not be differentiated, for instance, between grass areas with or without single trees. The land-use types “water surfaces” and “other areas” were eliminated to avoid collinearity due to their high correlation (Pearson's r≥0.6 or .6) with other land-use types and the small amount of these surface types within the footprint. Since the analysis is thought to provide an estimate of the variation of particle emission and deposition with land use, non-significant variables were not eliminated.
3.1 Meteorological characterization of the study period
For an overview of the meteorological situation in the measurement period, data from the German Weather Service (Deutscher Wetterdienst) station “Berlin Tempelhof” (7 km south-east of the flux site) was used. The average annual air temperatures during the study period were 10.3, 12.5, and 12.0 ∘C (average annual temperature 1981–2010: 9.9 ∘C). In terms of annual precipitation, the first observation year (April 2017–March 2018) with an annual precipitation sum of 798 mm was significantly wetter than the long-term average of 577 mm (1981–2010). However, precipitation in the second year (April 2018–March 2019) and the third year (April 2019–March 2020) amounted to only 384 and 433 mm, with the year 2018 characterized by a summer drought and hot spells. Wind at the Tempelhof site blows dominantly from the south-west (average wind direction in 1981–2010: 243∘). The annual average wind direction only slightly varied with 255, 272, and 248∘ over the 3 years, respectively (Figs. 2 and A1).
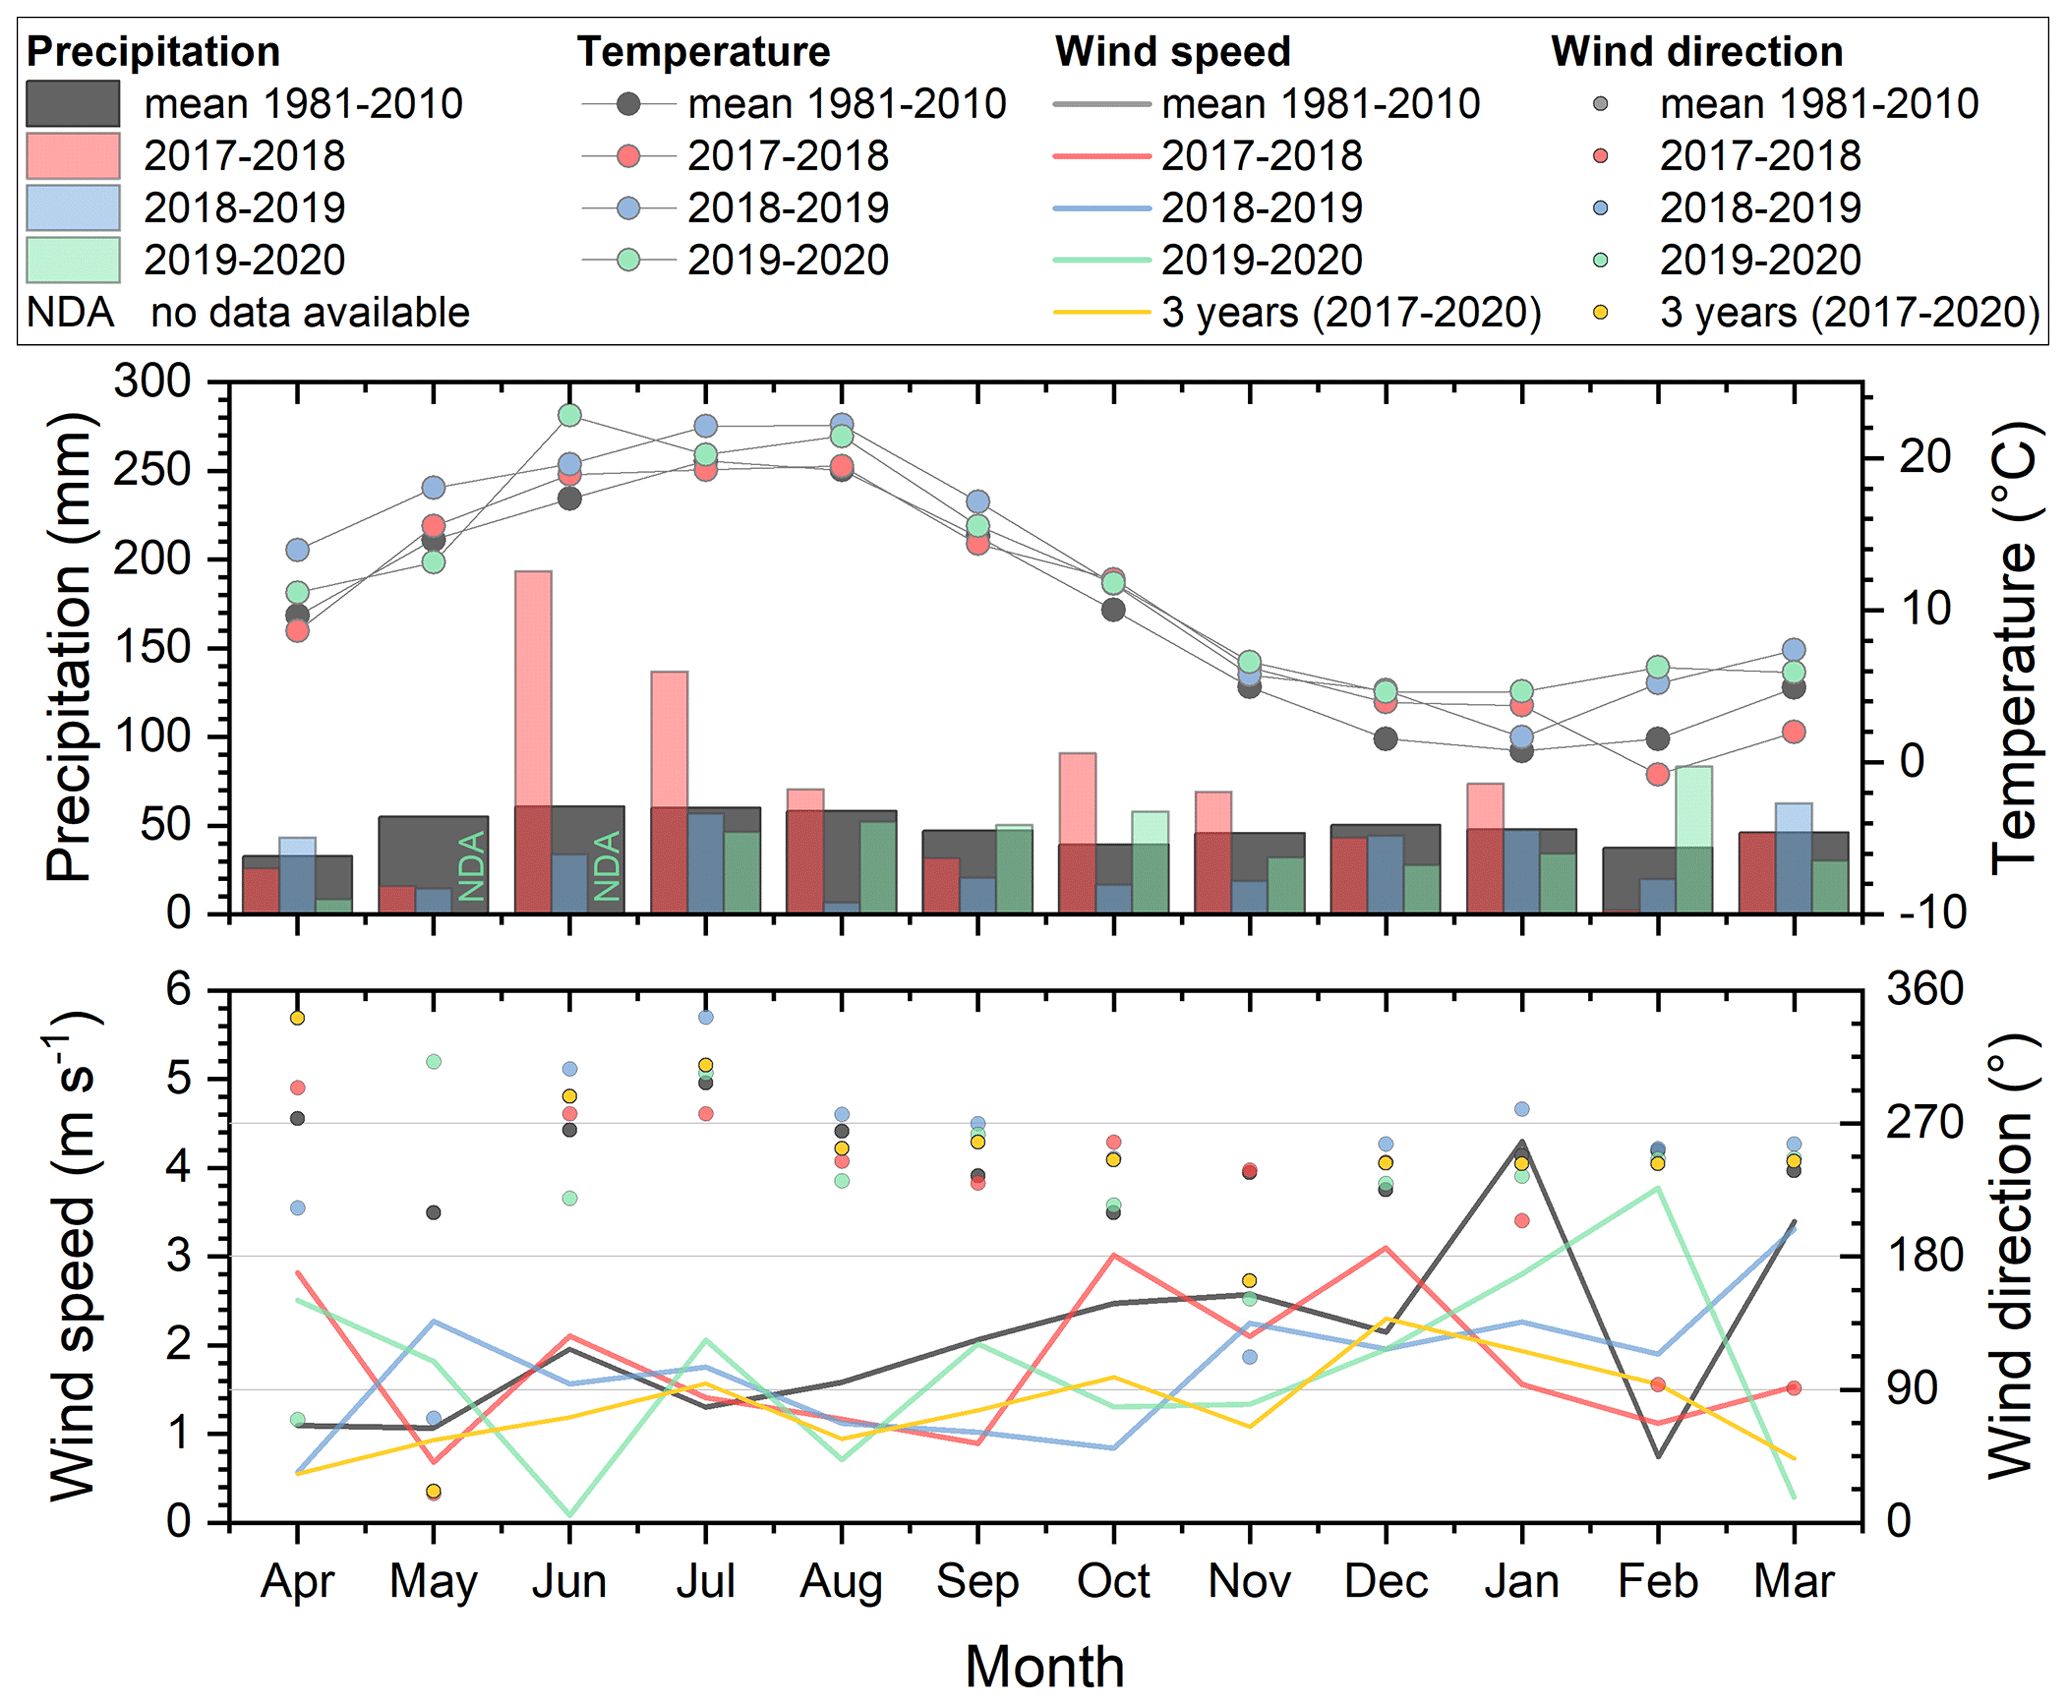
Figure 2Meteorological data such as temperature, precipitation, wind speed, and wind direction from the German Weather Service station Berlin Tempelhof (German Weather Service site ID: 433) located 7 km south-east of the flux site.
3.2 Data quality assurance and quality control
3.2.1 Quality check of the EEPS
The on-site inter-comparison of particle number concentration between the EEPS and WCPC (cf. Sect. 2.2) indicated good agreement with an average relative deviation of 10.6 % (slope of 0.94, R2=0.84; Fig. A2a). It has to be noted that we compare the WCPC data (lower cut-off of 5 nm) with the gap-filled EEPS data (10 nm < Dp < 200 nm). The deviation in particle concentrations is plausible, as it is caused by different lower and upper cut-off diameters.
The time series of WCPC and EEPS fluxes were strongly correlated (r=0.91), although the EEPS underestimated fluxes measured by the WCPC (slope 0.66, R2=0.84, average relative deviation of 26 %; Fig. A2b). We argue that the underestimation is due to the lower WCPC cut-off (5 nm) and the dominance of nucleation mode fluxes at the present site (cf. Sect. 3.5).
3.2.2 Spectral analysis
Spectral analysis is used in EC applications to study the frequency response of the measurement setup. The measured cospectra were compared either to ideal cospectra (e.g. Kaimal et al., 1972) or to the sonic sensible-heat flux cospectrum, which often resembles an ideal cospectrum (Aubinet et al., 2012).
We calculated normalized daytime cospectra for FUFP for all wind directions under neutral stratification. Most of the cospectra values were positive (blue dots), indicating the frequent occurrence of emission fluxes (Fig. 3). The particle flux cospectrum agreed well with sensible heat and the ideal Kaimal spectrum. Furthermore, the cospectrum follows the theoretical slope in the inertial subrange, indicating reasonable sensor frequency response.
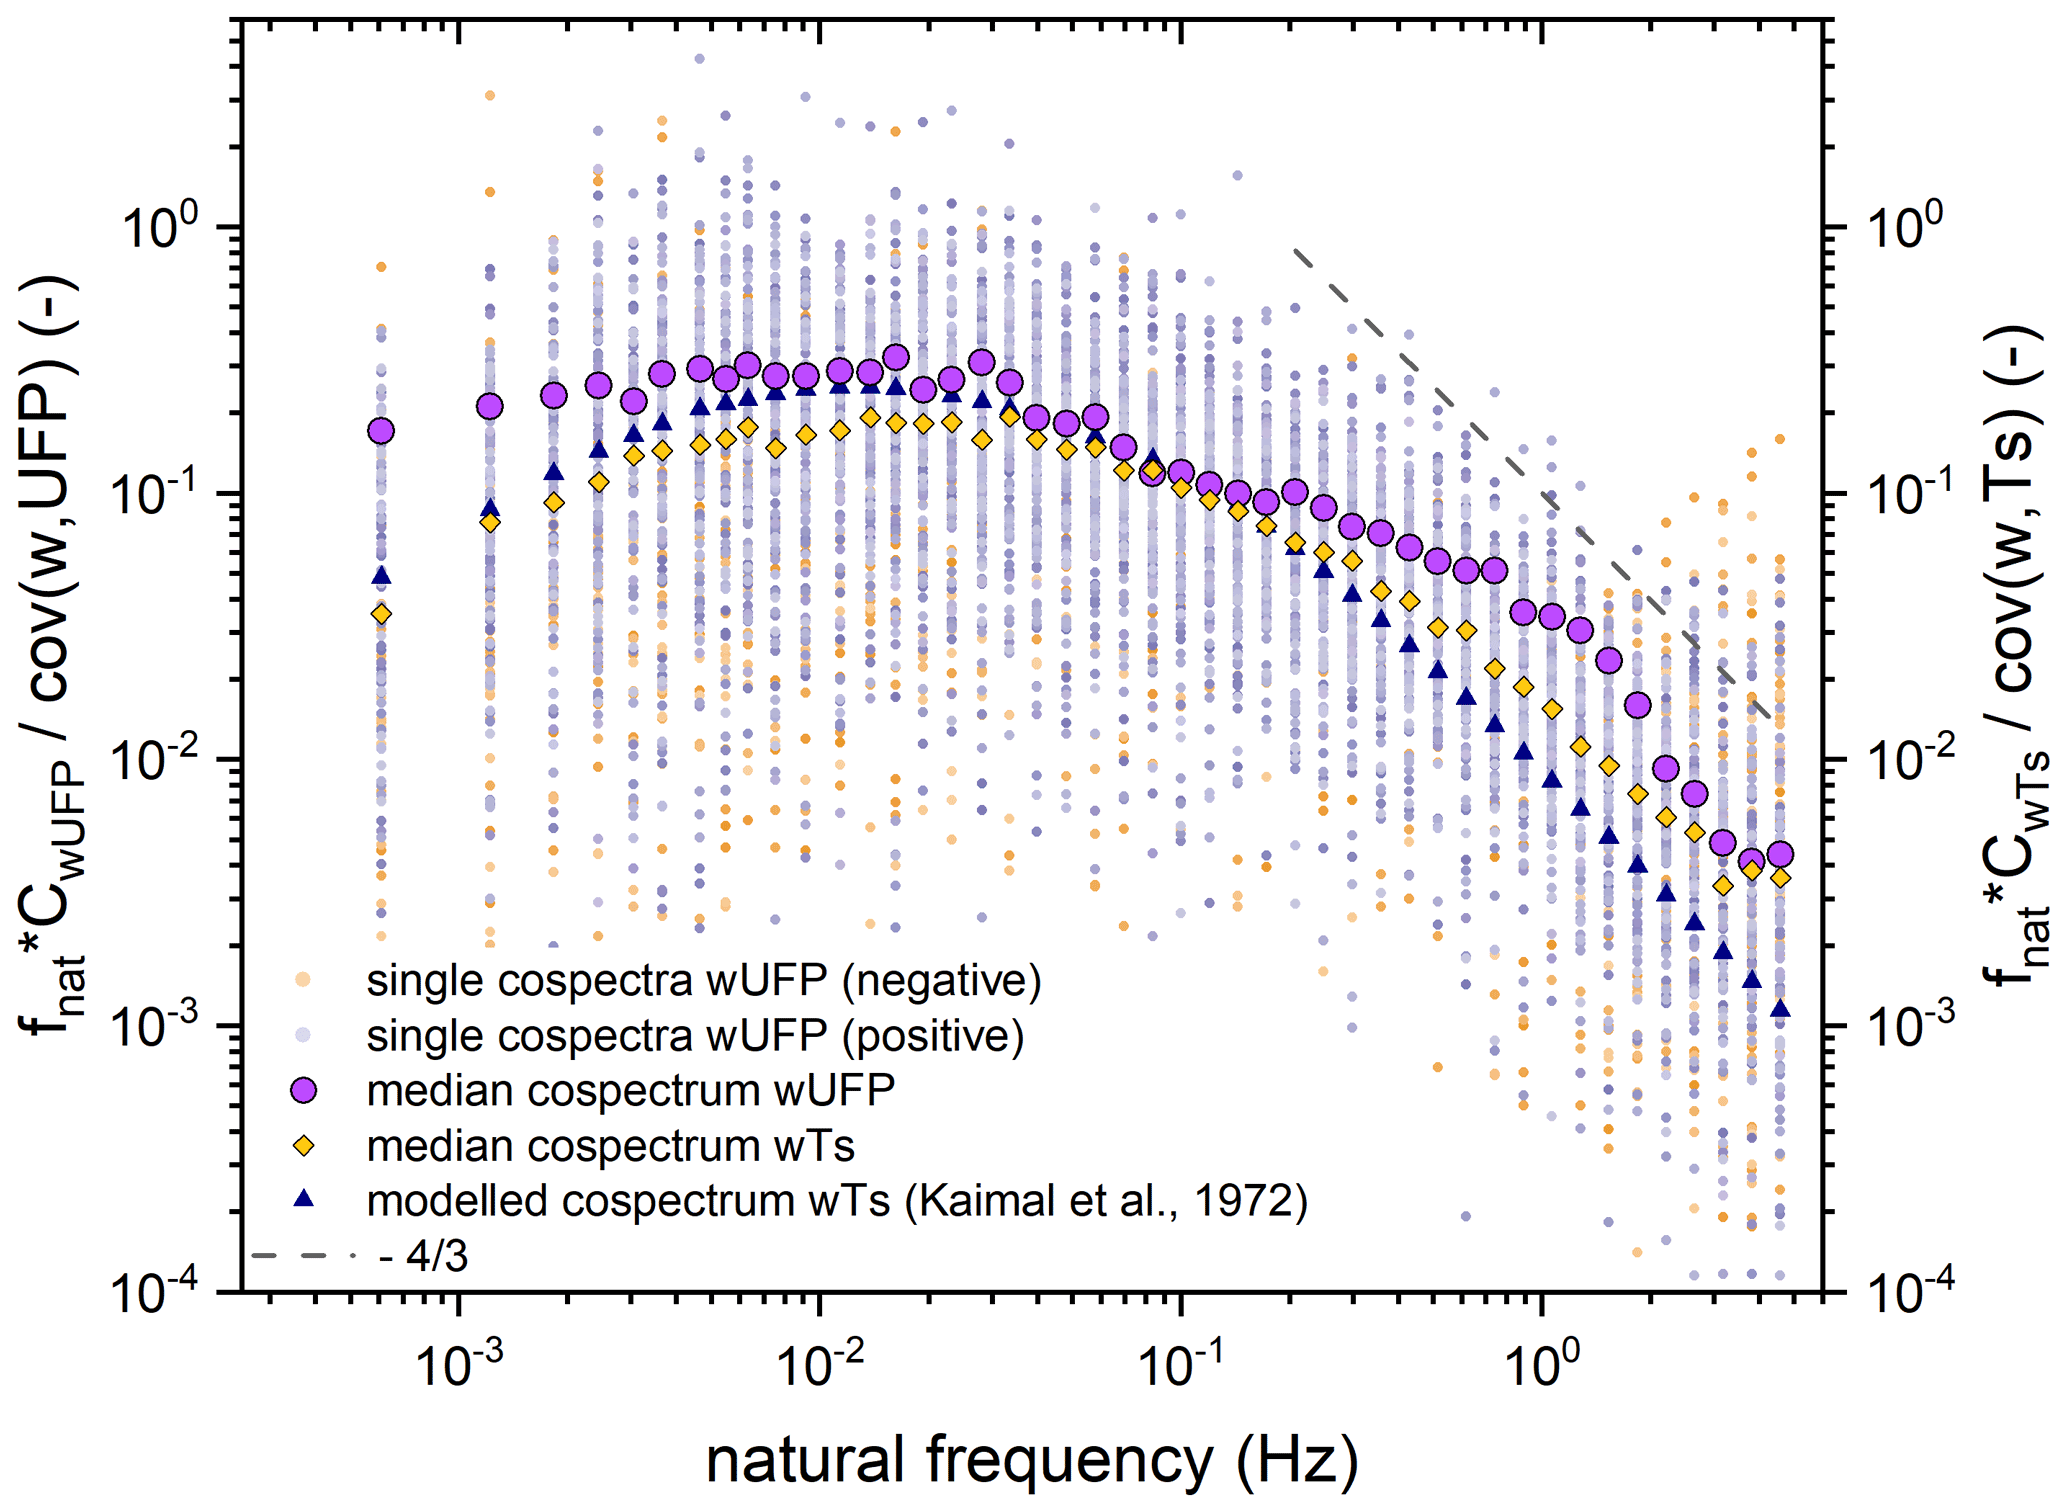
Figure 3Normalized (median) cospectra of FUFP (n=160), sonic sensible-heat flux, and ideal cospectrum after Kaimal et al. (1972). Additionally, the slope in the inertial subrange is indicated. Blue dots represent positive values of the cospectrum; yellow dots represent negative values with an inverse sign. The y axes represent the natural frequency multiplied with the quotient of the cospectrum and covariance of each vertical wind velocity w with the ultrafine particle number concentration UFP and the sonic temperature Ts.
3.3 Particle number concentrations
Over the course of the 3-year study period, we observed median concentrations of 7300 cm−3 for TNC and 6450 cm−3 for UFP, respectively (cf. Table 2). The half-hourly average TNC varied between a minimum of 3099 cm−3 and a maximum of 53 879 cm−3. Ultrafine particles dominated rooftop concentrations as indicated by an average UFP TNC ratio of 0.9. The majority of particles in the UFP size range occurred in the NUC mode.
Table 2Statistical quantities of TNC and UFP as well as particle number concentrations of the modes NUC, AIT, and ACC.

3.4 Footprint analysis
The particle fluxes measured at our rooftop site represented a surface area of about 5.3 km2 (with respect to the 80 % contour line). The flux peak contribution, however, was from an area situated to the west or south-west of the site at a distance of about 50 to 350 m (Fig. 4). The peak contribution source area slightly shifted northwards in the second year and southwards in the third year. However, the source areas were very similar in the individual years. A detailed analysis of source-area-weighted contribution of land use indicates 60 % of built-up areas, 26 % traffic areas, 11 % green areas, and 2 %–3 % water surfaces in the flux footprint (Fig. 5). Green areas were mainly characterized by grass with or without single trees, whereas forests, bushes/single trees, and gardens contribute little to the flux footprint. The land-use fractions were similar in the individual study years. However, it has to be taken into account that streets vary in terms of traffic intensity so that the strength of traffic-related sources might differ between individual years.
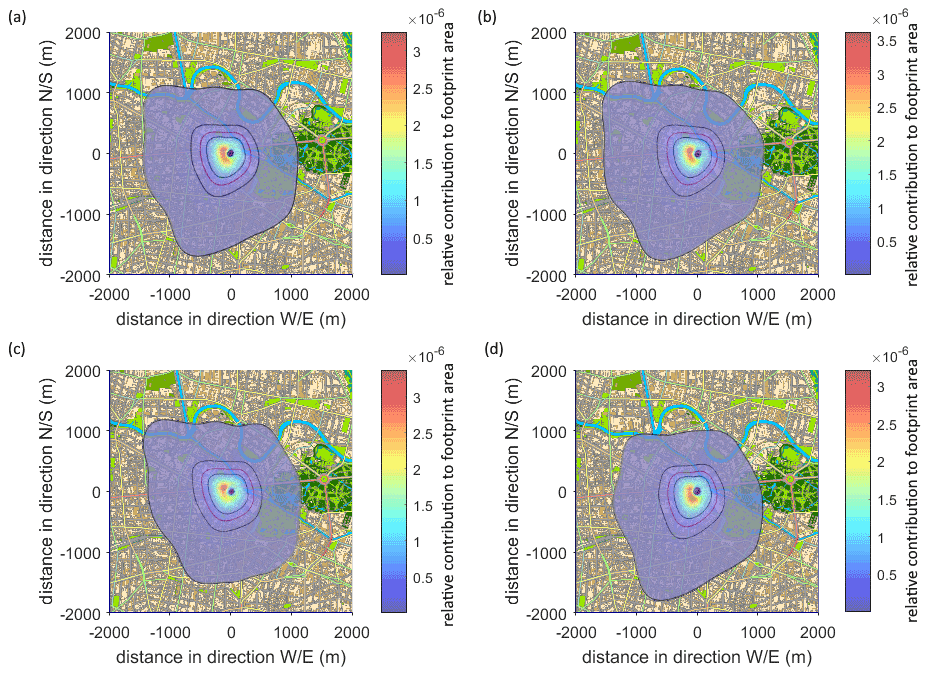
Figure 4Footprint climatology of (a) the entire 3-year period, (b) the first year, (c) the second year, and (d) the third year. Flux footprints were calculated for a 4 km × 4 km area (4 m spatial resolution). For reasons of clarity only the 40 %, 50 % (purple), 60 %, and 80 % contour lines are shown (footprint model: Kljun et al., 2015; map data sources: Geoportal Berlin, 2014 (modified), 2021; Umweltatlas Berlin, 2017).
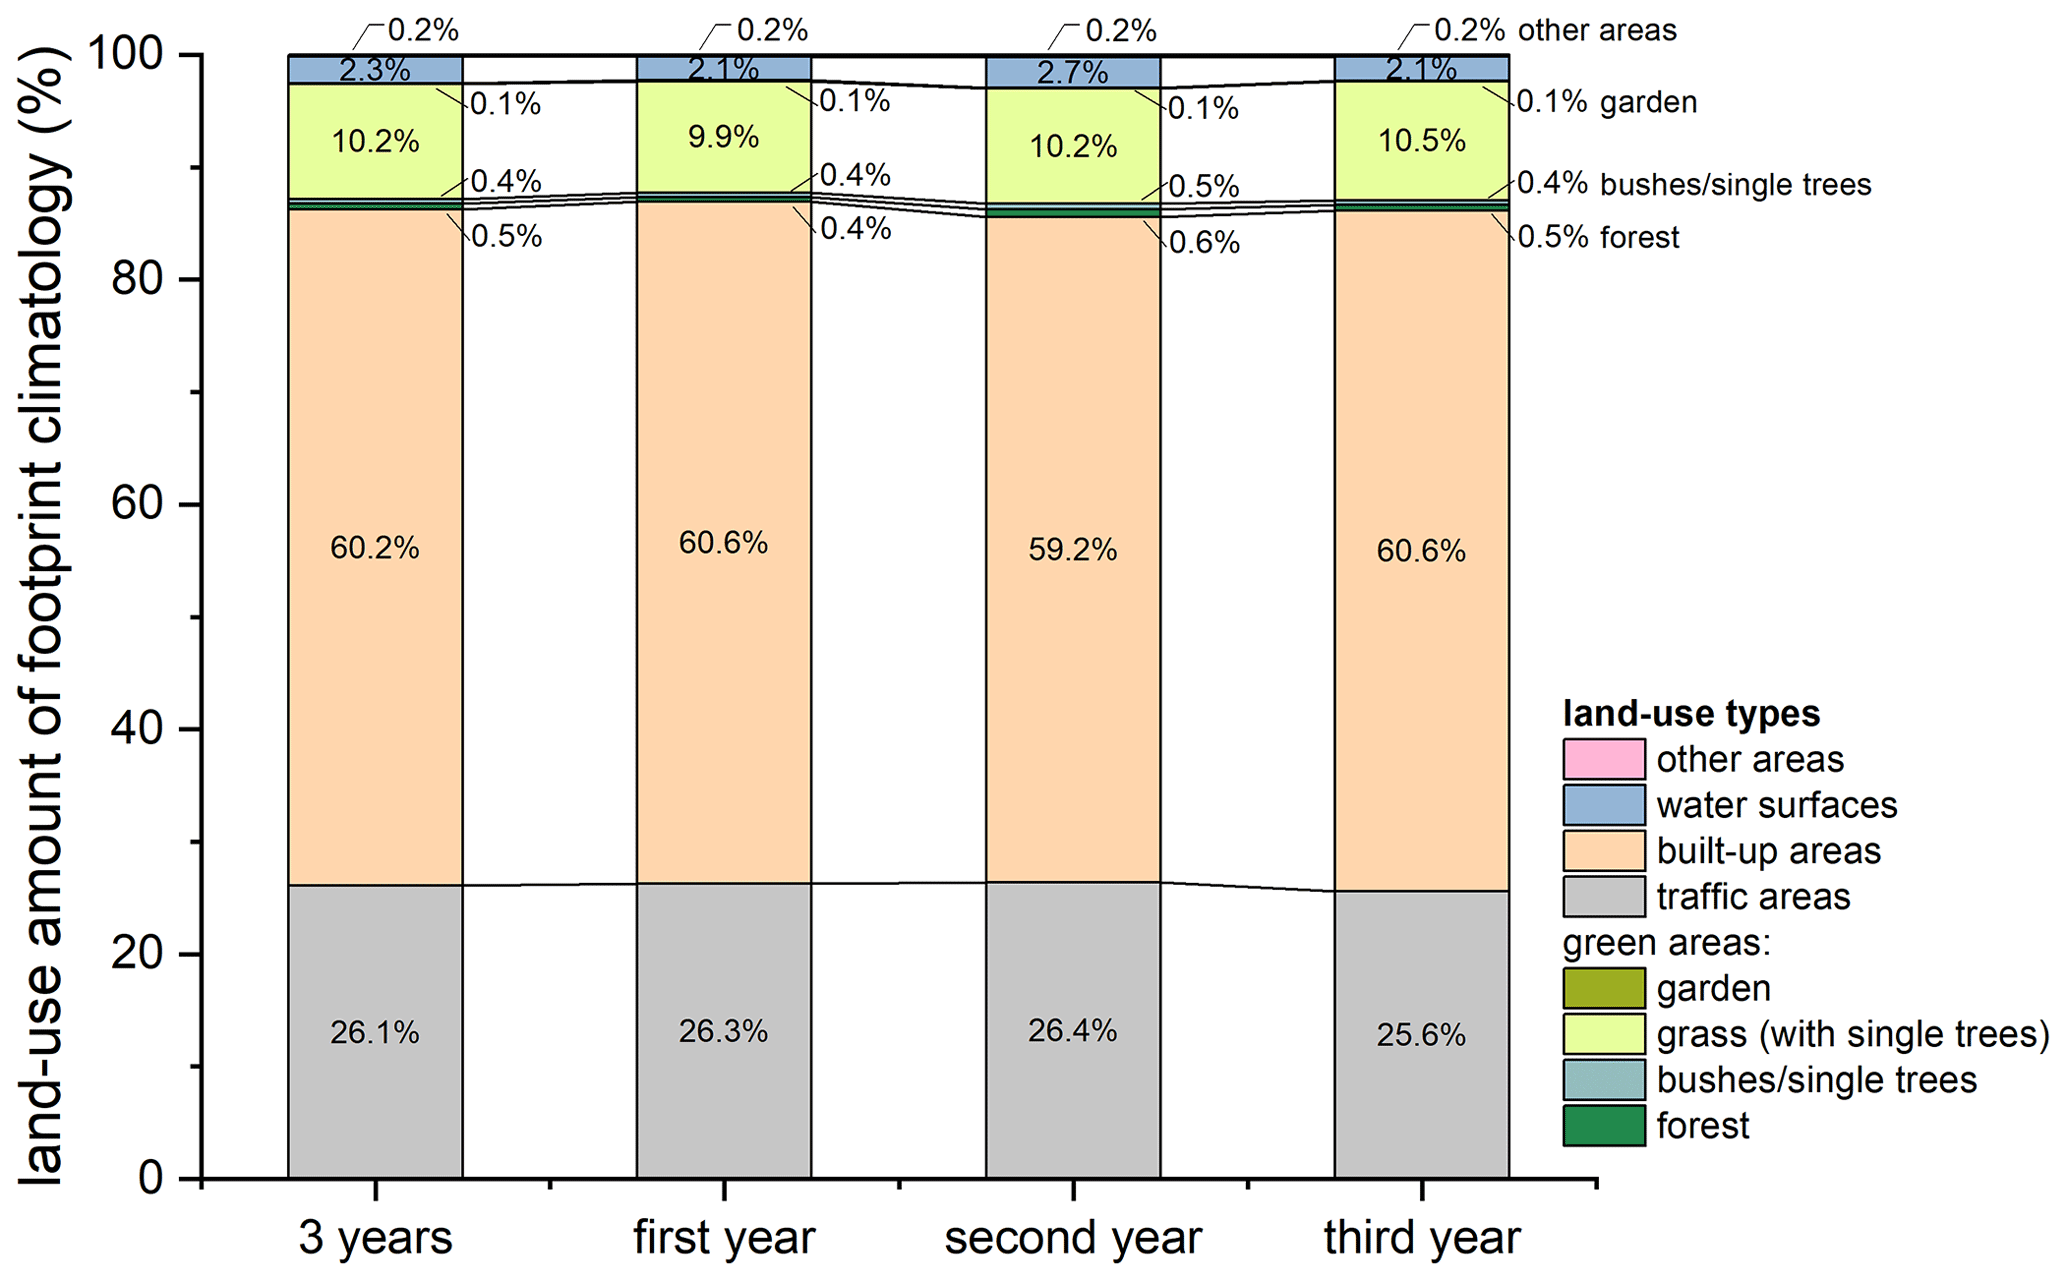
Figure 5Amount of land use contributing to the flux footprint climatologies separated according to the different time periods of measurement. For data analysis, the footprint information in a 4 km × 4 km grid centred on the measurement site was used (4 m spatial resolution). This footprint area completely includes the 80 % contour line.
3.5 Total and ultrafine particle number fluxes
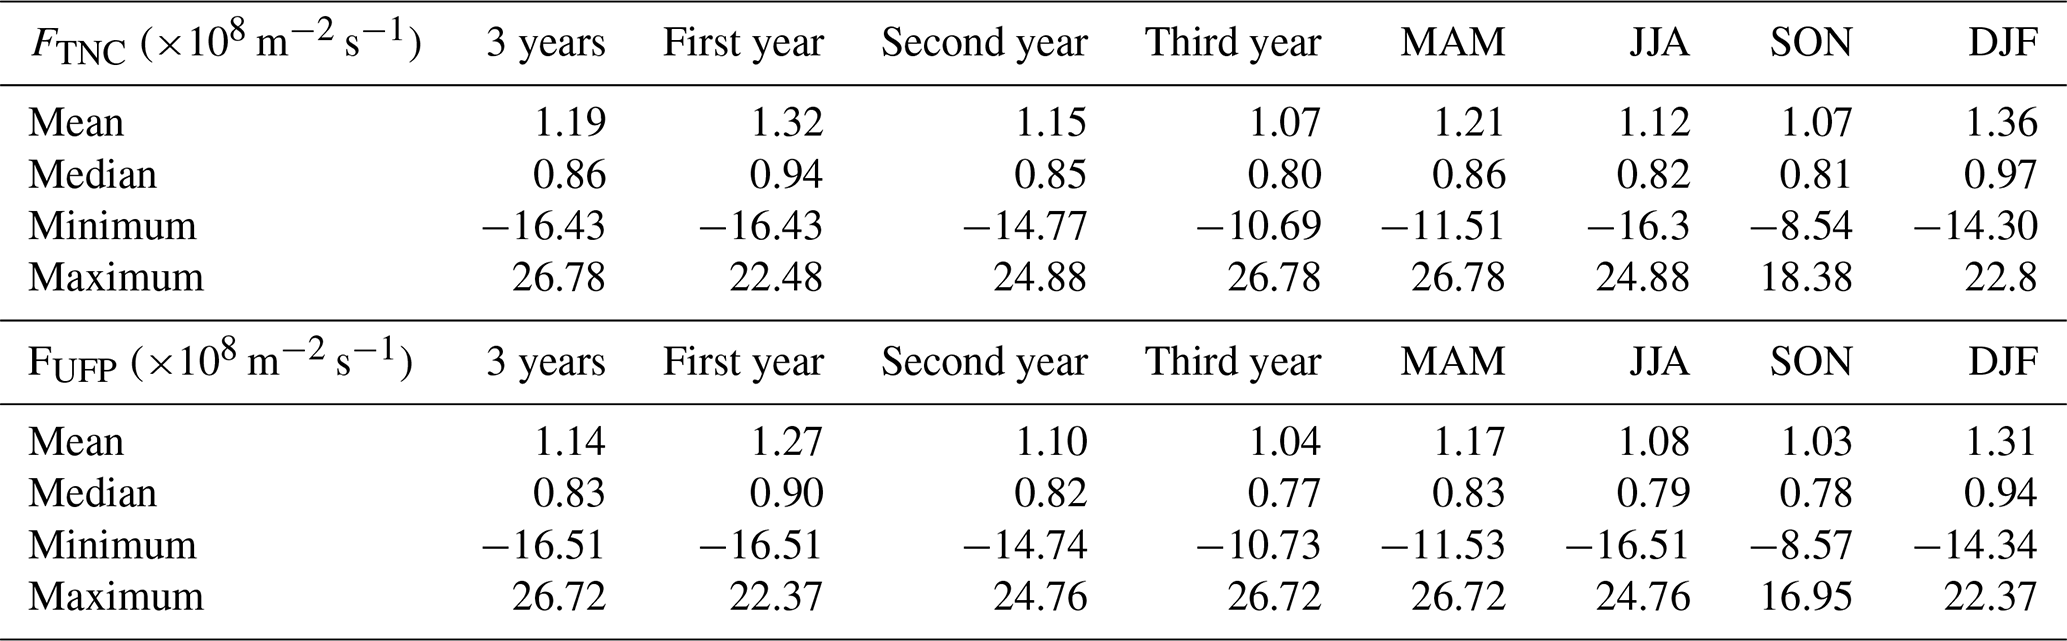
The measured particle number fluxes indicated that the study area in central Berlin is a net source of particles with a 3-year median FTNC of 0.86 × 10⁸ and 0.83 × 10⁸ m−2 s−1 for FUFP (cf. Table 3). The majority (91.4 %) of fluxes were upward (emission) fluxes, whereas 8.6 % of data showed downward (deposition) fluxes. Annual estimates of median FTNC and FUFP showed a decrease by −9.6 % (−8.9 % for FUFP) from the first to the second year and a further −5.9 % (−6.1 % for FUFP) from the second to the third year (Fig. 6a, Table 3). We observed a limited frequency of higher FUFP values (e.g. > 1.2 × 10⁸ m−2 s−1) both in the second and third year (Fig. 6b). The ratio of FUFP to FTNC is 0.96, whereas the average nucleation mode particle flux (FNUC) accounted for 63 % of FTNC (data not shown here). As the ultrafine size range clearly dominated FTNC, we will focus on FUFP in subsequent analysis.
Table 3Mean, median, minimum, and maximum FTNC and FUFP for the 3 measurement years and the four meteorological seasons of spring (MAM; March–April–May), summer (JJA; June–July–August), autumn (SON; September–October–November), and winter (DJF; December–January–February).
FUFP was characterized by distinct seasonal variation; i.e. the largest average fluxes occurred in winter whereas fluxes were lower in autumn and summer (Fig. 7, Table 3). Generally, a lower frequency of deposition events and higher emission fluxes prevailed during winter. However, due to consistently positive monthly median values the site footprint was a net particle emission source in every single month.
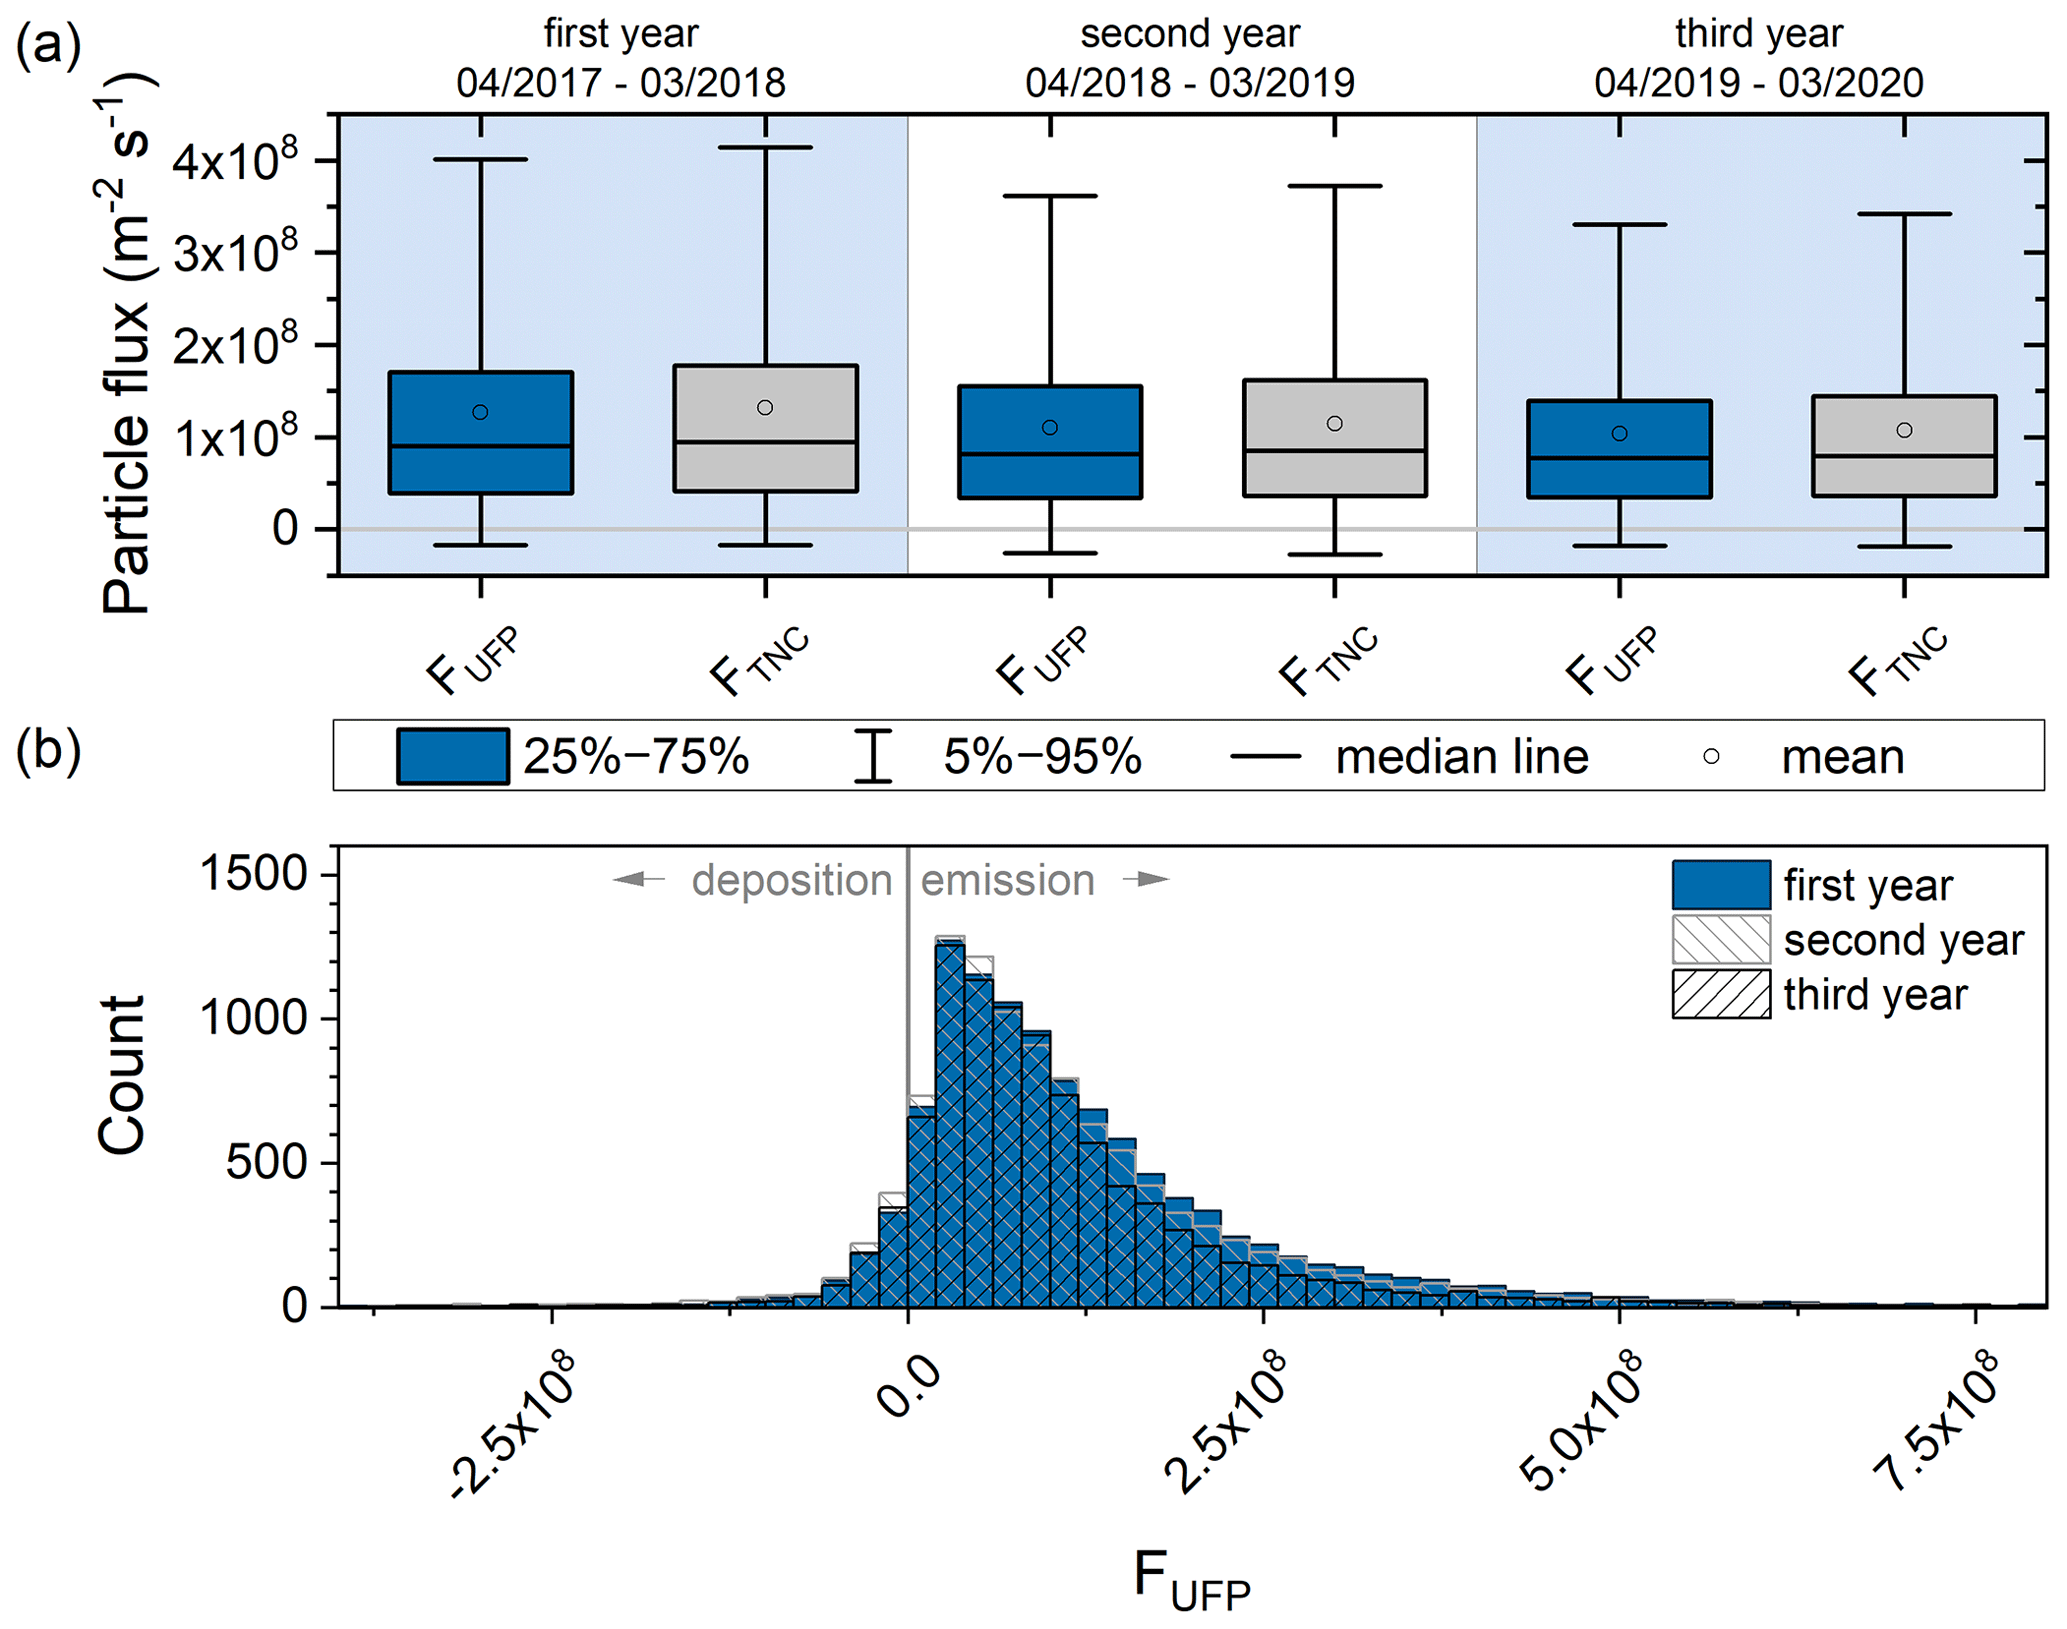
Figure 6(a) Range of FTNC and FUFP and (b) the frequency distributions of FUFP for each of the 3 years of measurement. Please note that the date format used in this figure is month/year.
The seasonal pattern is also evident on the mean diurnal cycle (Fig. 8a). The strongest emission fluxes occurred in winter with a maximum FUFP of about 2.0 × 10⁸ m−2 s−1, whereas the lowest fluxes were observed in autumn and summer. FUFP increased after sunrise and showed two local maxima at around 09:30 LT and in the early afternoon (12:30 to 14:00 LT). The moderate decrease at around noon was related to reduced traffic intensity (cf. Fig. 8d). Average FUFP varied between 0.2 × 10⁷ m−2 s−1 at night and 2.0 × 10⁸ m−2 s−1 during the day. The morning increase in FUFP coincided with an increase in atmospheric turbulence and a more unstable boundary layer. In the evening, FUFP decreased as atmospheric stratification changed from unstable to neutral conditions (Fig. 8c).
The daily amplitude of FUFP clearly differed between working days and weekends (Fig. 8b). Whereas working days showed a strong morning increase of FUFP and a large amplitude over the diurnal course, the weekend was characterized by a reduced morning increase and only half the amplitude in comparison to working days. This difference was in accordance with the variation of traffic intensity between working days and weekends (Fig. 8d).
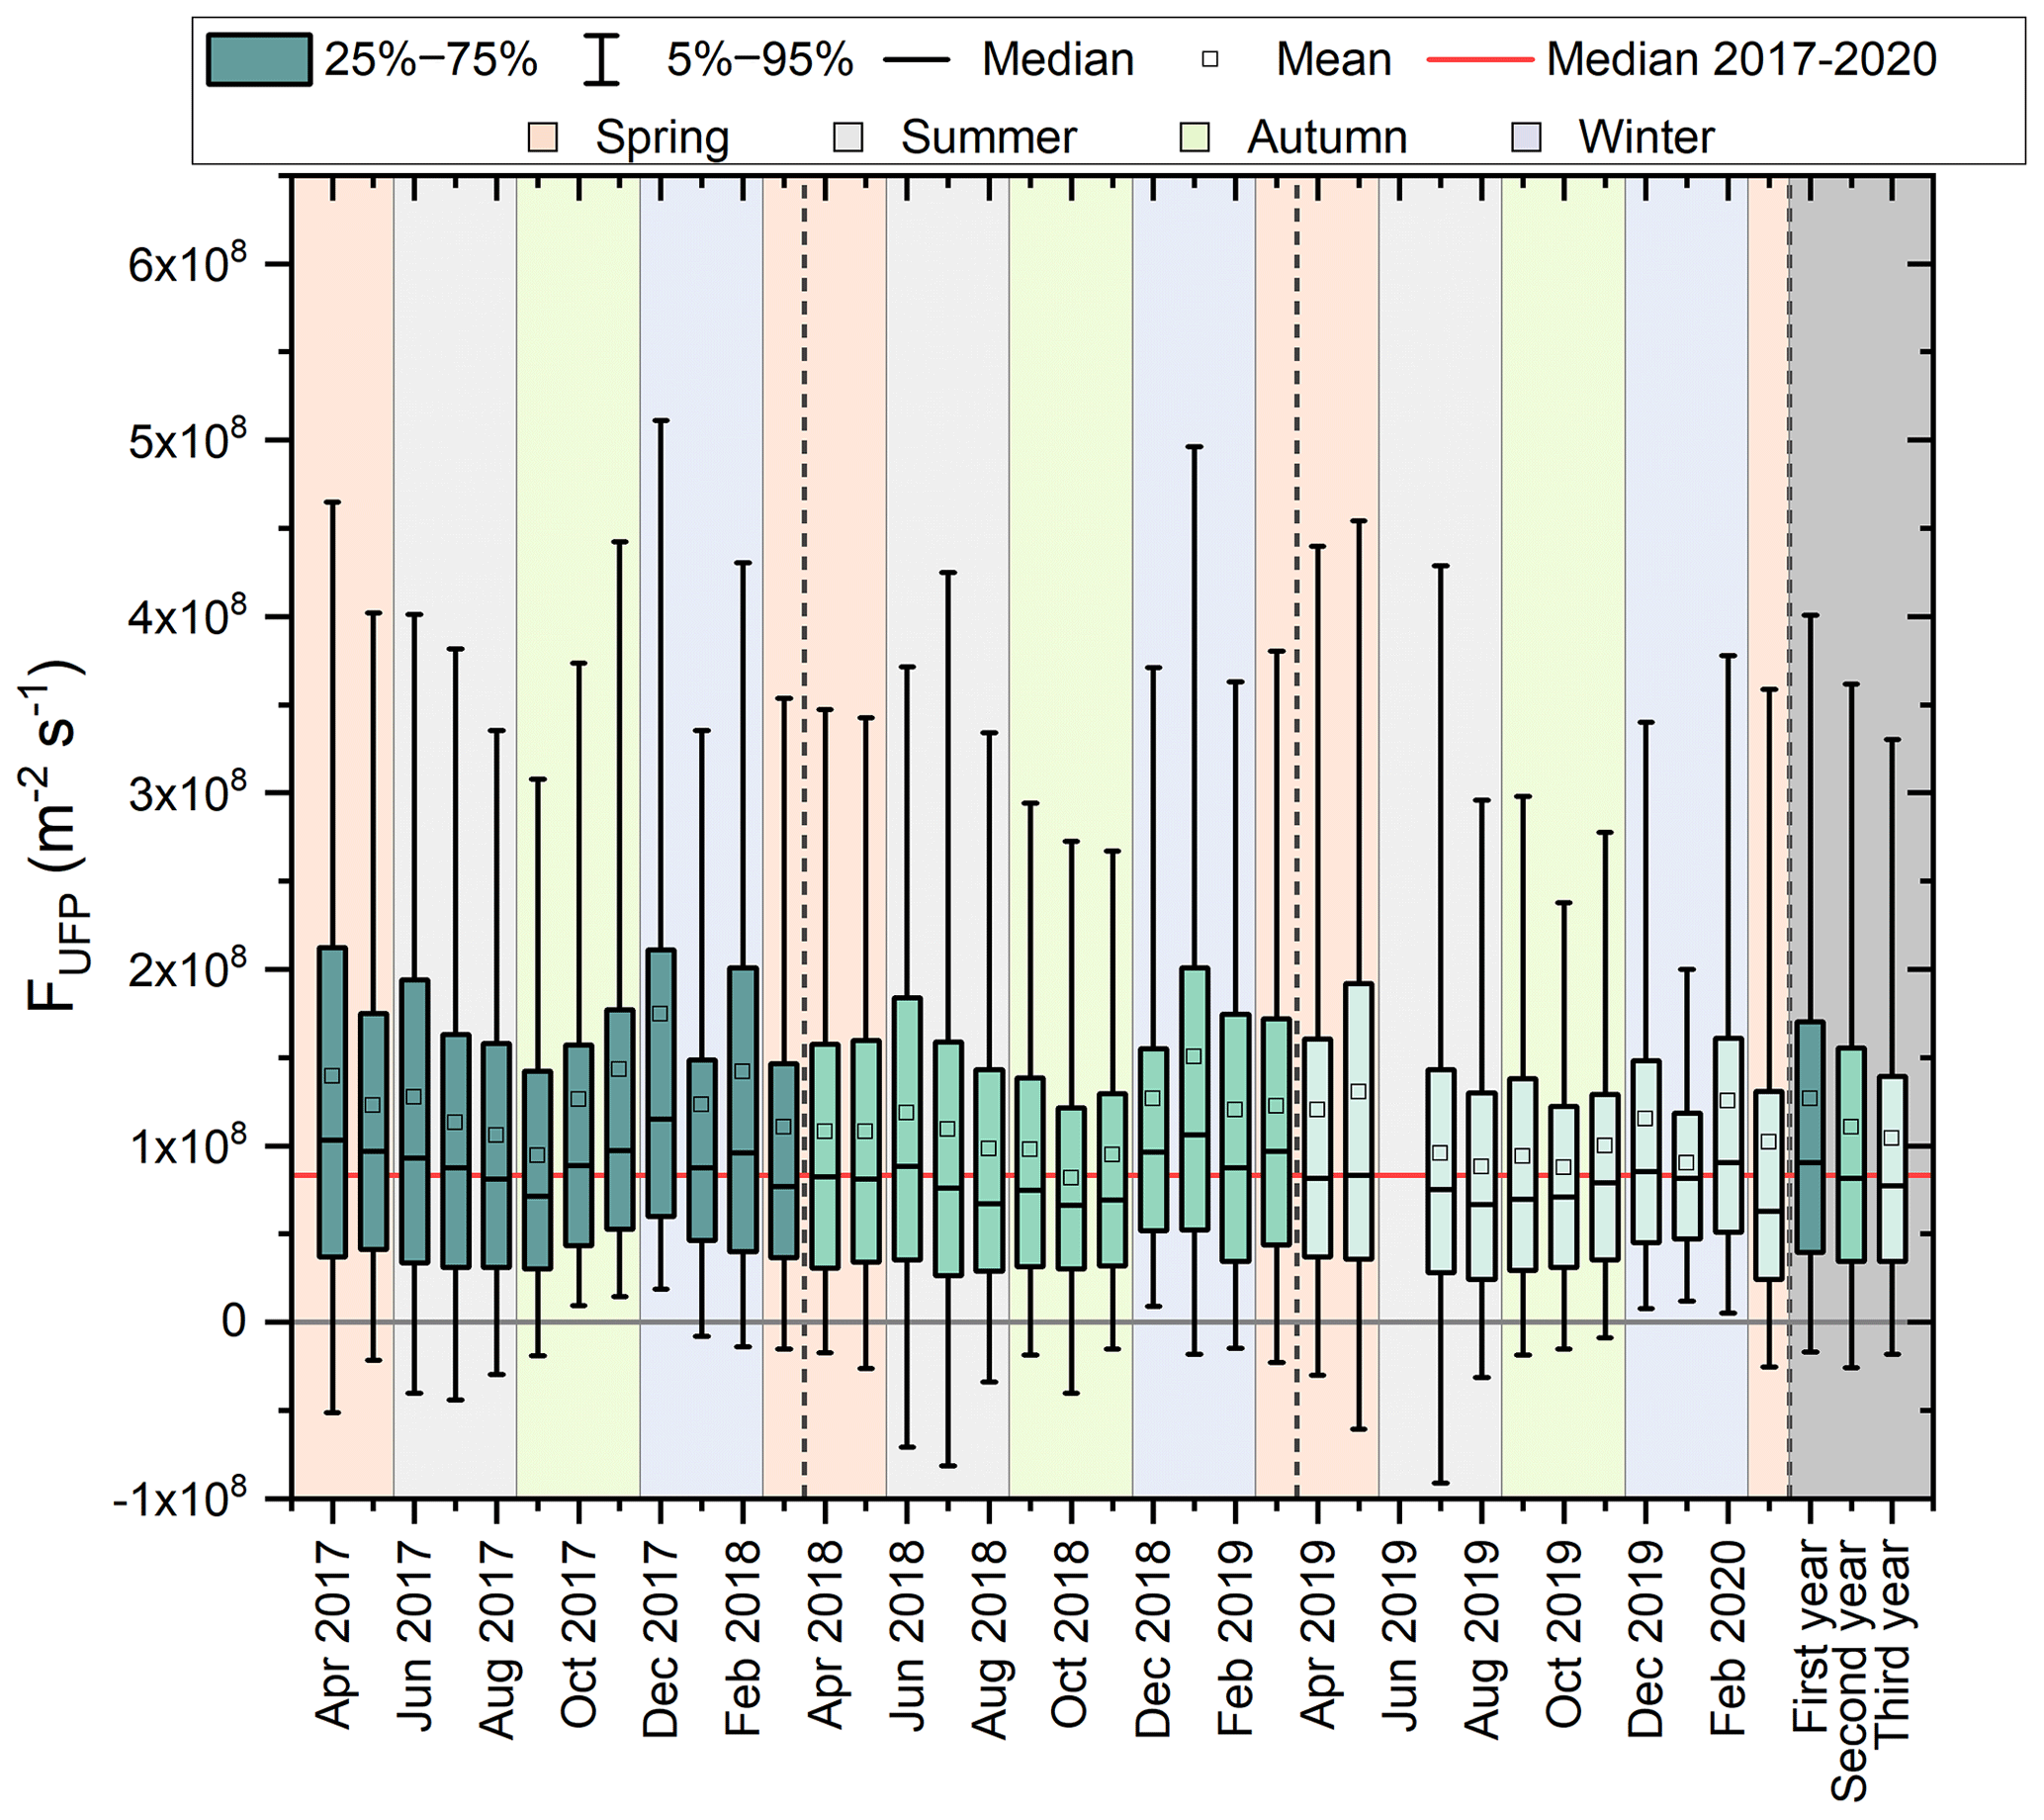

Figure 8Diurnal cycles of (a) average and seasonal FUFP; (b) average FUFP for weekdays and weekends with the standard deviation (SD); (c) the median stability parameter for each season and the whole measurement period with measurement height (z), displacement height (d), and Monin–Obukhov length (L); and (d) the average traffic intensity at HS and S17J.
3.6 Size-resolved particle number fluxes
Size-resolved particle number fluxes were characterized by distinct temporal variation on the diurnal cycle (Fig. 9a). The strongest emission prevailed in the smallest size bin (Dp < 12 nm) with a maximum in the early afternoon. Coarser particles (Dp > 100 nm), however, showed little variation regardless of the day of the week. Although deposition fluxes occurred (Fig. 9b), positive average fluxes were prevailing in all size ranges, emphasizing the dominance of net particle emission from the flux footprint. The frequency of particle deposition events peaked in the ACC mode (Fig. 9b). On working days, the deposition frequency of UFPs was highest at night, especially in the second half of the night. On weekends, UFP deposition more often occurred in the morning to pre-noon hours. The timing of deposition fluxes was associated with the daily minimum in FUFP, low traffic intensity, and a neutral or stable atmosphere (cf. Fig. 8). Generally, NUC mode particles showed higher deposition probabilities than AIT mode particles. This was evident during the entire day and for every day of the week.
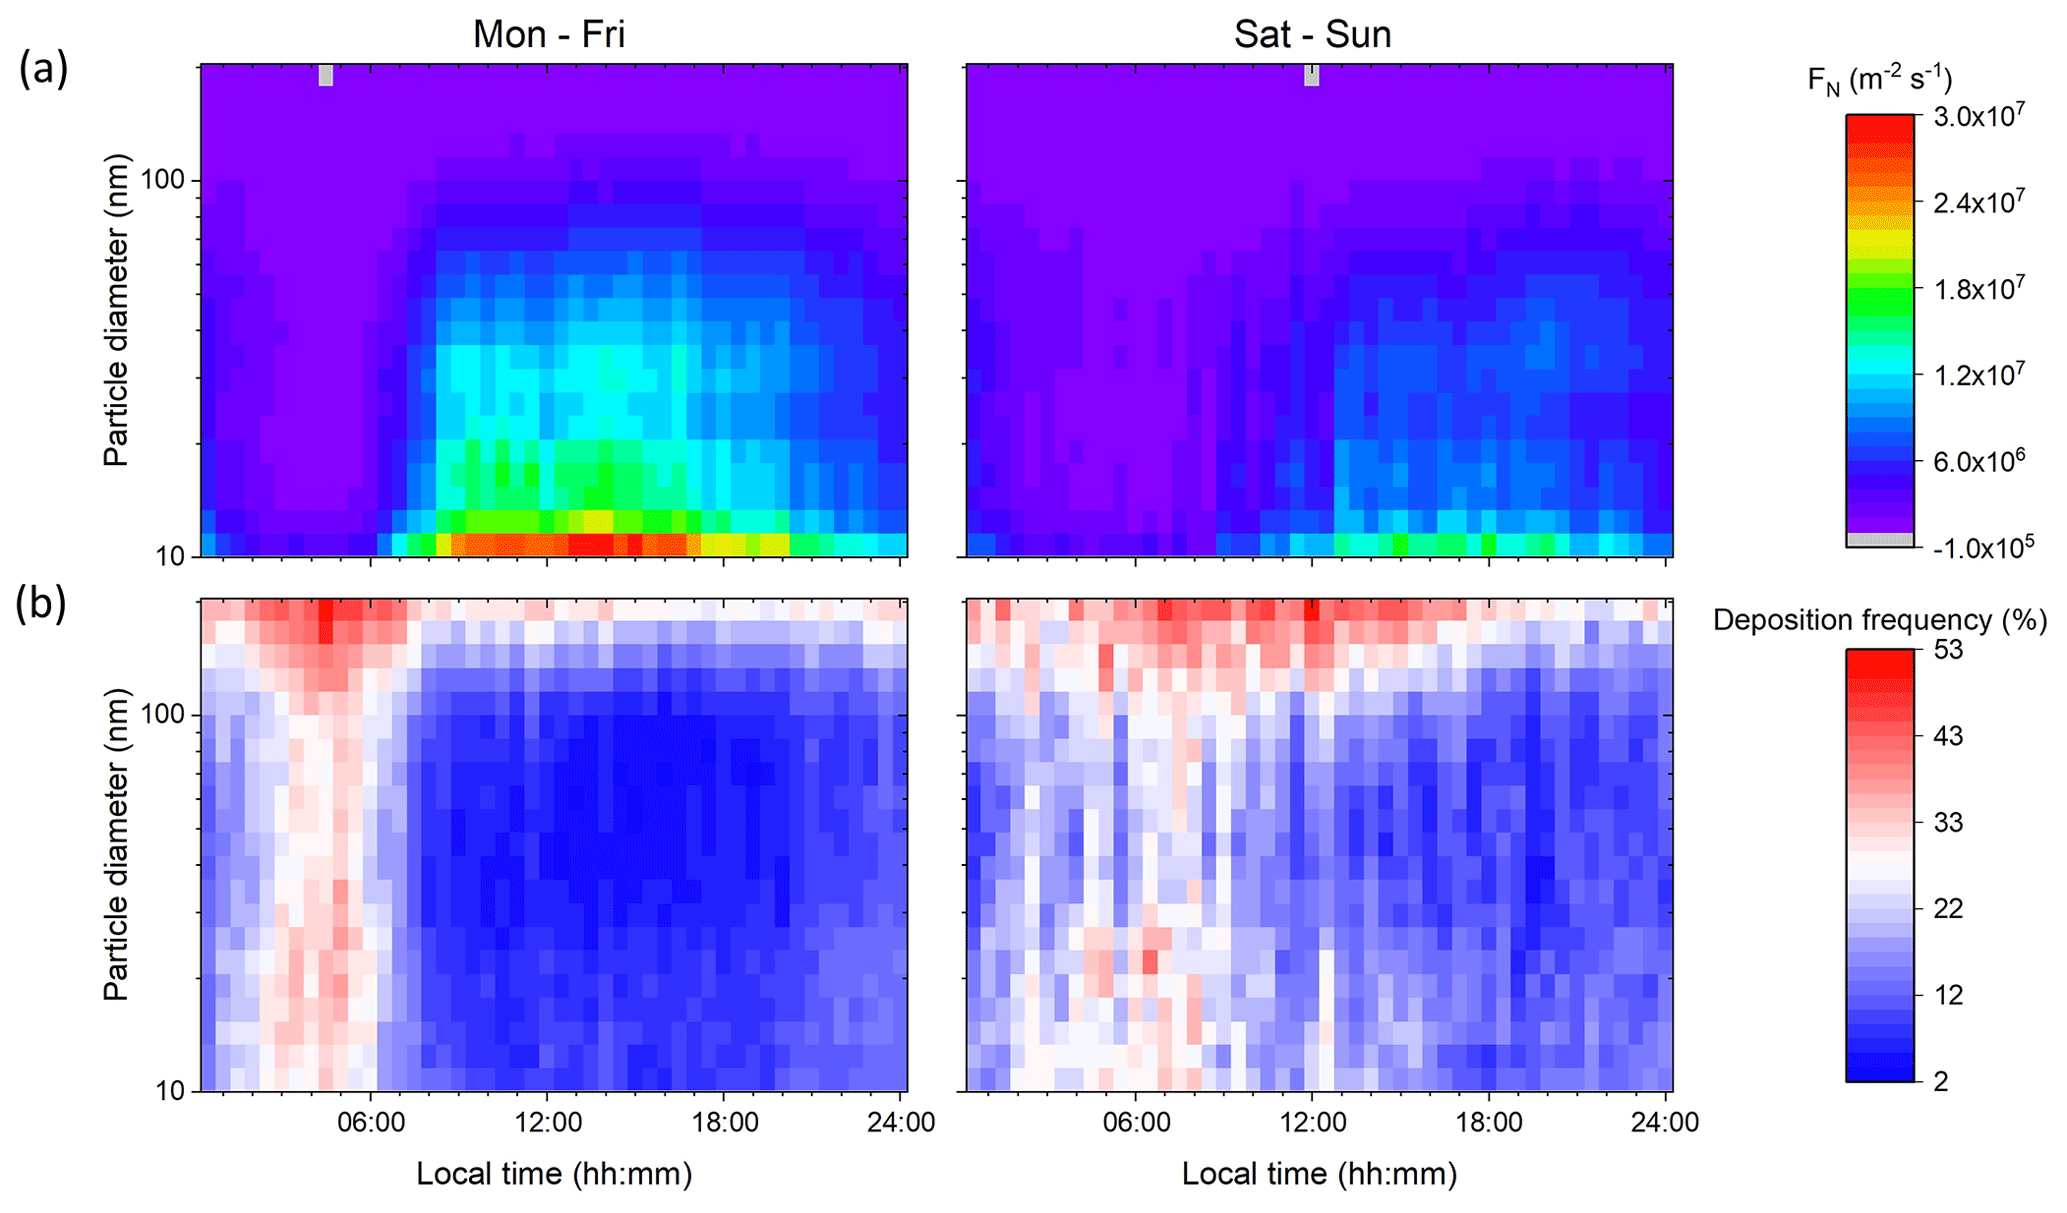
Figure 9Diurnal cycles for a weekday (Monday–Friday) and a day during the weekend (Saturday–Sunday) of (a) size-resolved average particle number fluxes (FN) and (b) the frequency of particle deposition. In panel (a) colours indicate the strength of emission fluxes, while the grey colour symbolizes a slight particle deposition.
On the seasonal cycle, the highest emission fluxes predominantly occurred in the smallest size bins (Dp < 30 nm) during winter (average FTNC of 1.44 × 10⁸ m−2 s−1 and FUFP of 1.38 × 10⁸ m−2 s−1 in December; Fig. 10a and b). The lowest average particle number fluxes were evident in late summer and autumn. Additionally, the frequency of particle deposition events was higher in summer–autumn with a maximum in August and September (Fig. 10c). The variation in the frequency of deposition fluxes over the size spectrum pointed to the occurrence of bidirectional fluxes.
The difference between the maximum and minimum of deposition frequencies in a monthly size spectrum (max. Δ deposition frequency; Fig. 10c) might be interpreted as a measure to quantify the occurrence of bidirectional fluxes. Thus, bidirectionality in particle fluxes occurred more frequently in spring, late summer, and autumn than in winter. Bidirectionality was often associated with simultaneous emission fluxes in the ultrafine and deposition fluxes in the coarser-particle size range. The months of May, June, and July showed fewer particle deposition events but higher FTNC and FUFP than the other months in spring and summer. This was probably due to the variation of wind direction and, consequently, flux source area. The average 3-year wind directions were from the north-north-east in May, west-north-west in June, and north-west in July. Strong particle sources such as the busy road Straße des 17. Juni and the traffic circle Ernst-Reuter-Platz were located in those directions (cf. Fig. 1).
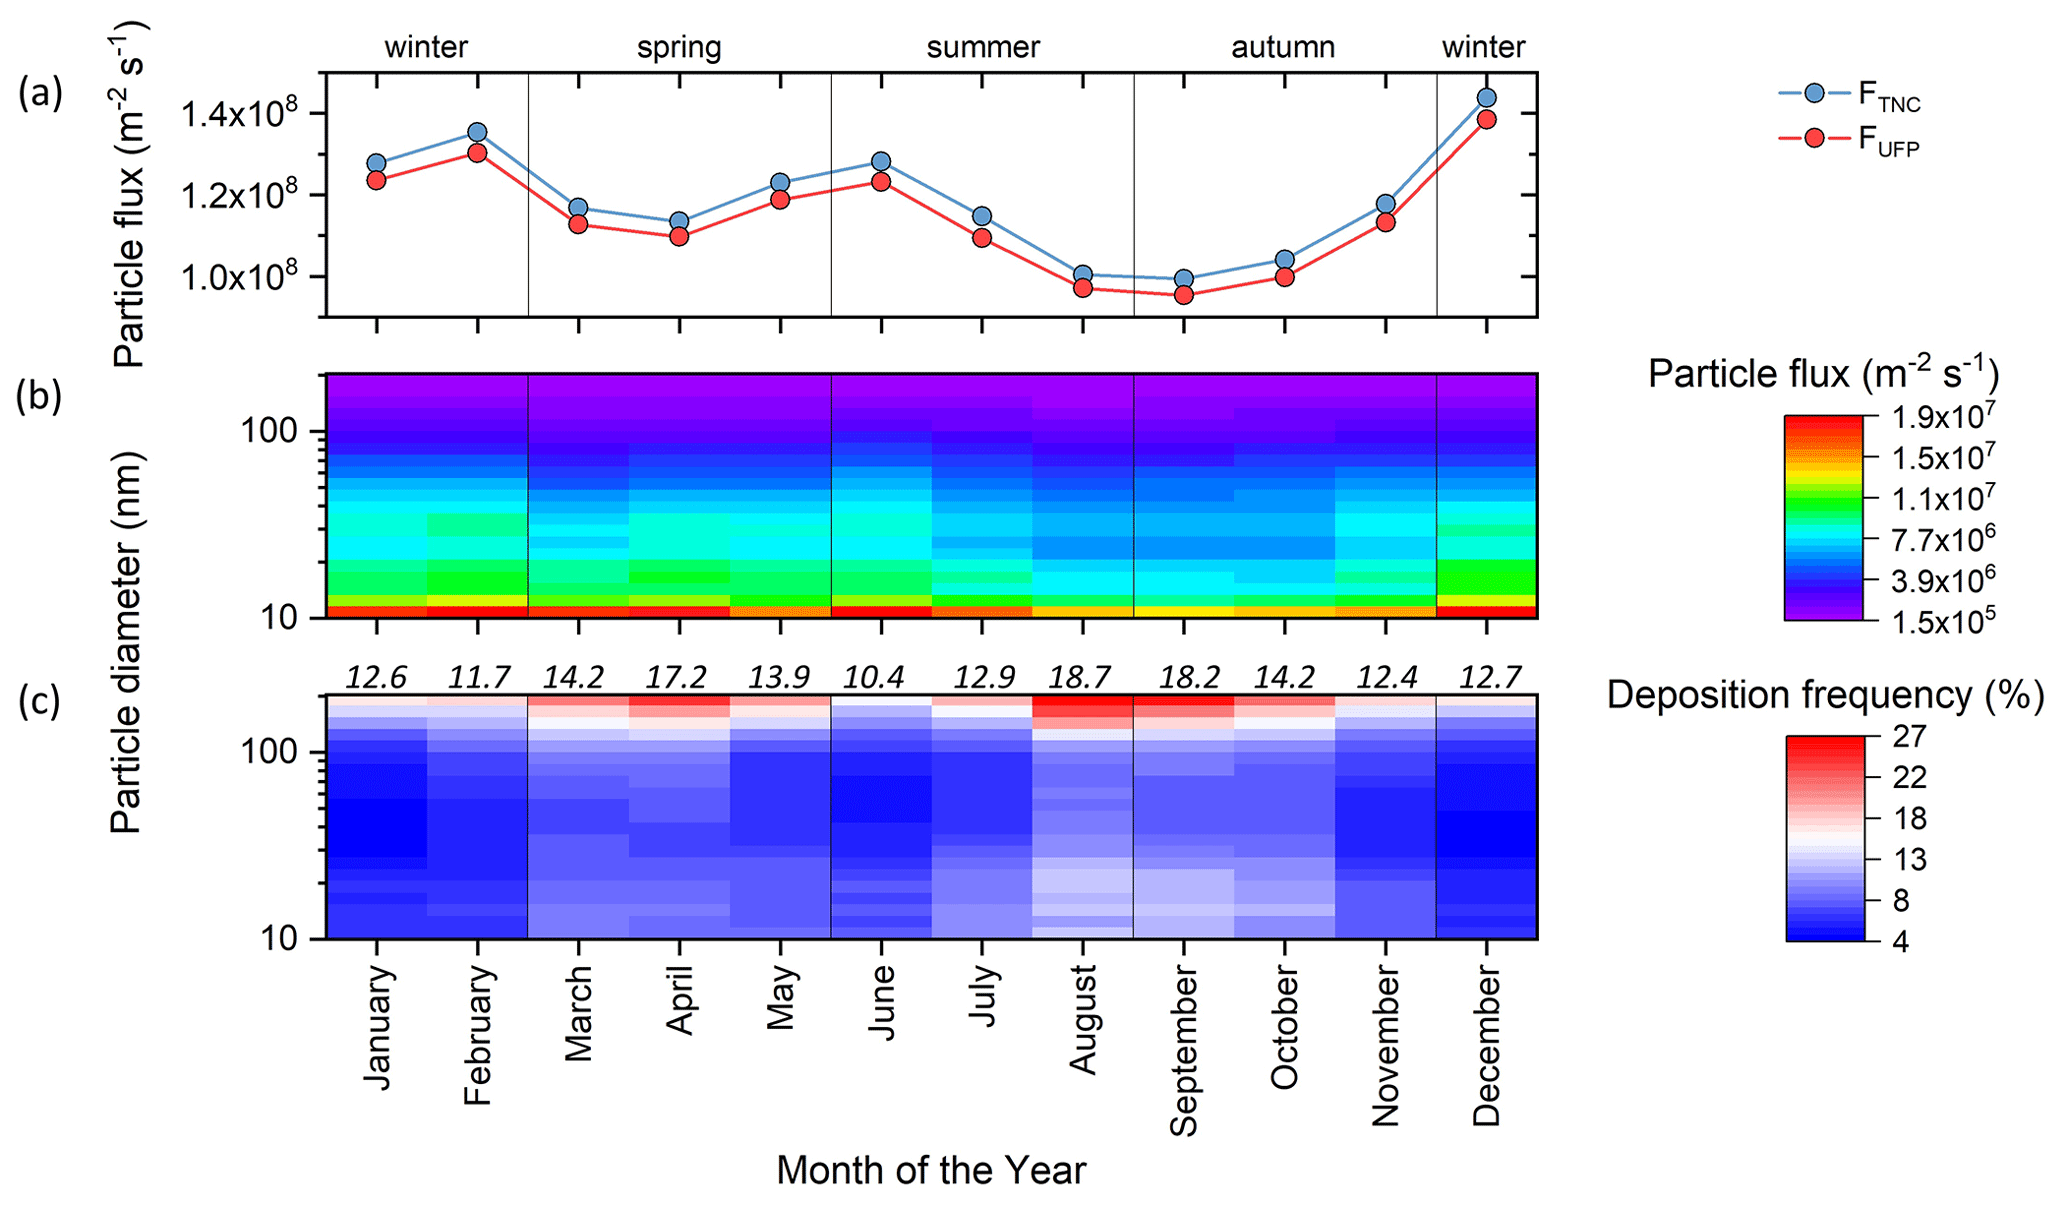
Figure 10Monthly variation of (a) average FTNC and FUFP, (b) size-resolved average particle number fluxes, and (c) the size-resolved frequency of particle deposition. In panel (c) the values given in italics quantify the maximum difference in deposition frequency within each monthly size spectrum (max. Δ deposition frequency, given in percentage points).
3.7 Wind sector analysis of modal particle number fluxes
The wind sector-based analysis indicated net emission of particles from every wind sector (Fig. 11a). The largest average FTNC values were observed for westerly and northerly wind directions (west, north, and north-east), i.e. the direction in which Straße des 17. Juni and the traffic circle Ernst-Reuter-Platz are located (cf. Fig. 1). In contrast, particle fluxes from easterly and southerly wind directions were smaller. Vegetated green spaces, built-up areas, and a main road (Hardenbergstraße) were located in this direction. For all wind directions, the highest particle number fluxes prevailed in the NUC mode (57 %–72 %), followed by particles in the AIT (26 %–38 %) and ACC modes (2 %–5 %; Fig. 11b).
When net fluxes were differentiated into emission and deposition fluxes, the emission fluxes indicated similar behaviour such as the average FTNC due to the high frequency of emission events (cf. Sect. 3.5 and Fig. 12a). Strongest emission fluxes occurred for wind from the west to the north-east, whereas the most frequent emission fluxes were evident for wind from 180 to 315∘ (Fig. 12c). The strongest deposition fluxes prevailed under north-westerly wind, whereas lower deposition was evident for the remaining directions (Fig. 12b). However, the most frequent deposition fluxes were observed under winds from southerly and north-westerly directions (Fig. 12d). Since particle deposition occurred most often at night (cf. Fig. 9b), the wind-direction-related frequency distribution of deposition fluxes (Fig. 12d) was similar to the nighttime wind rose (not shown here), which was characterized by most frequent winds from southerly and north-westerly directions. The wind-direction-related frequency distribution of emission fluxes, however, was similar to the daytime wind rose (not shown here). Generally, ACC particles were more frequently characterized by deposition fluxes than other particle modes.

Figure 11(a) Average particle number fluxes and (b) fraction of specific particle mode fluxes binned into 22.5∘ sectors for FNUC, FAIT, and FACC.
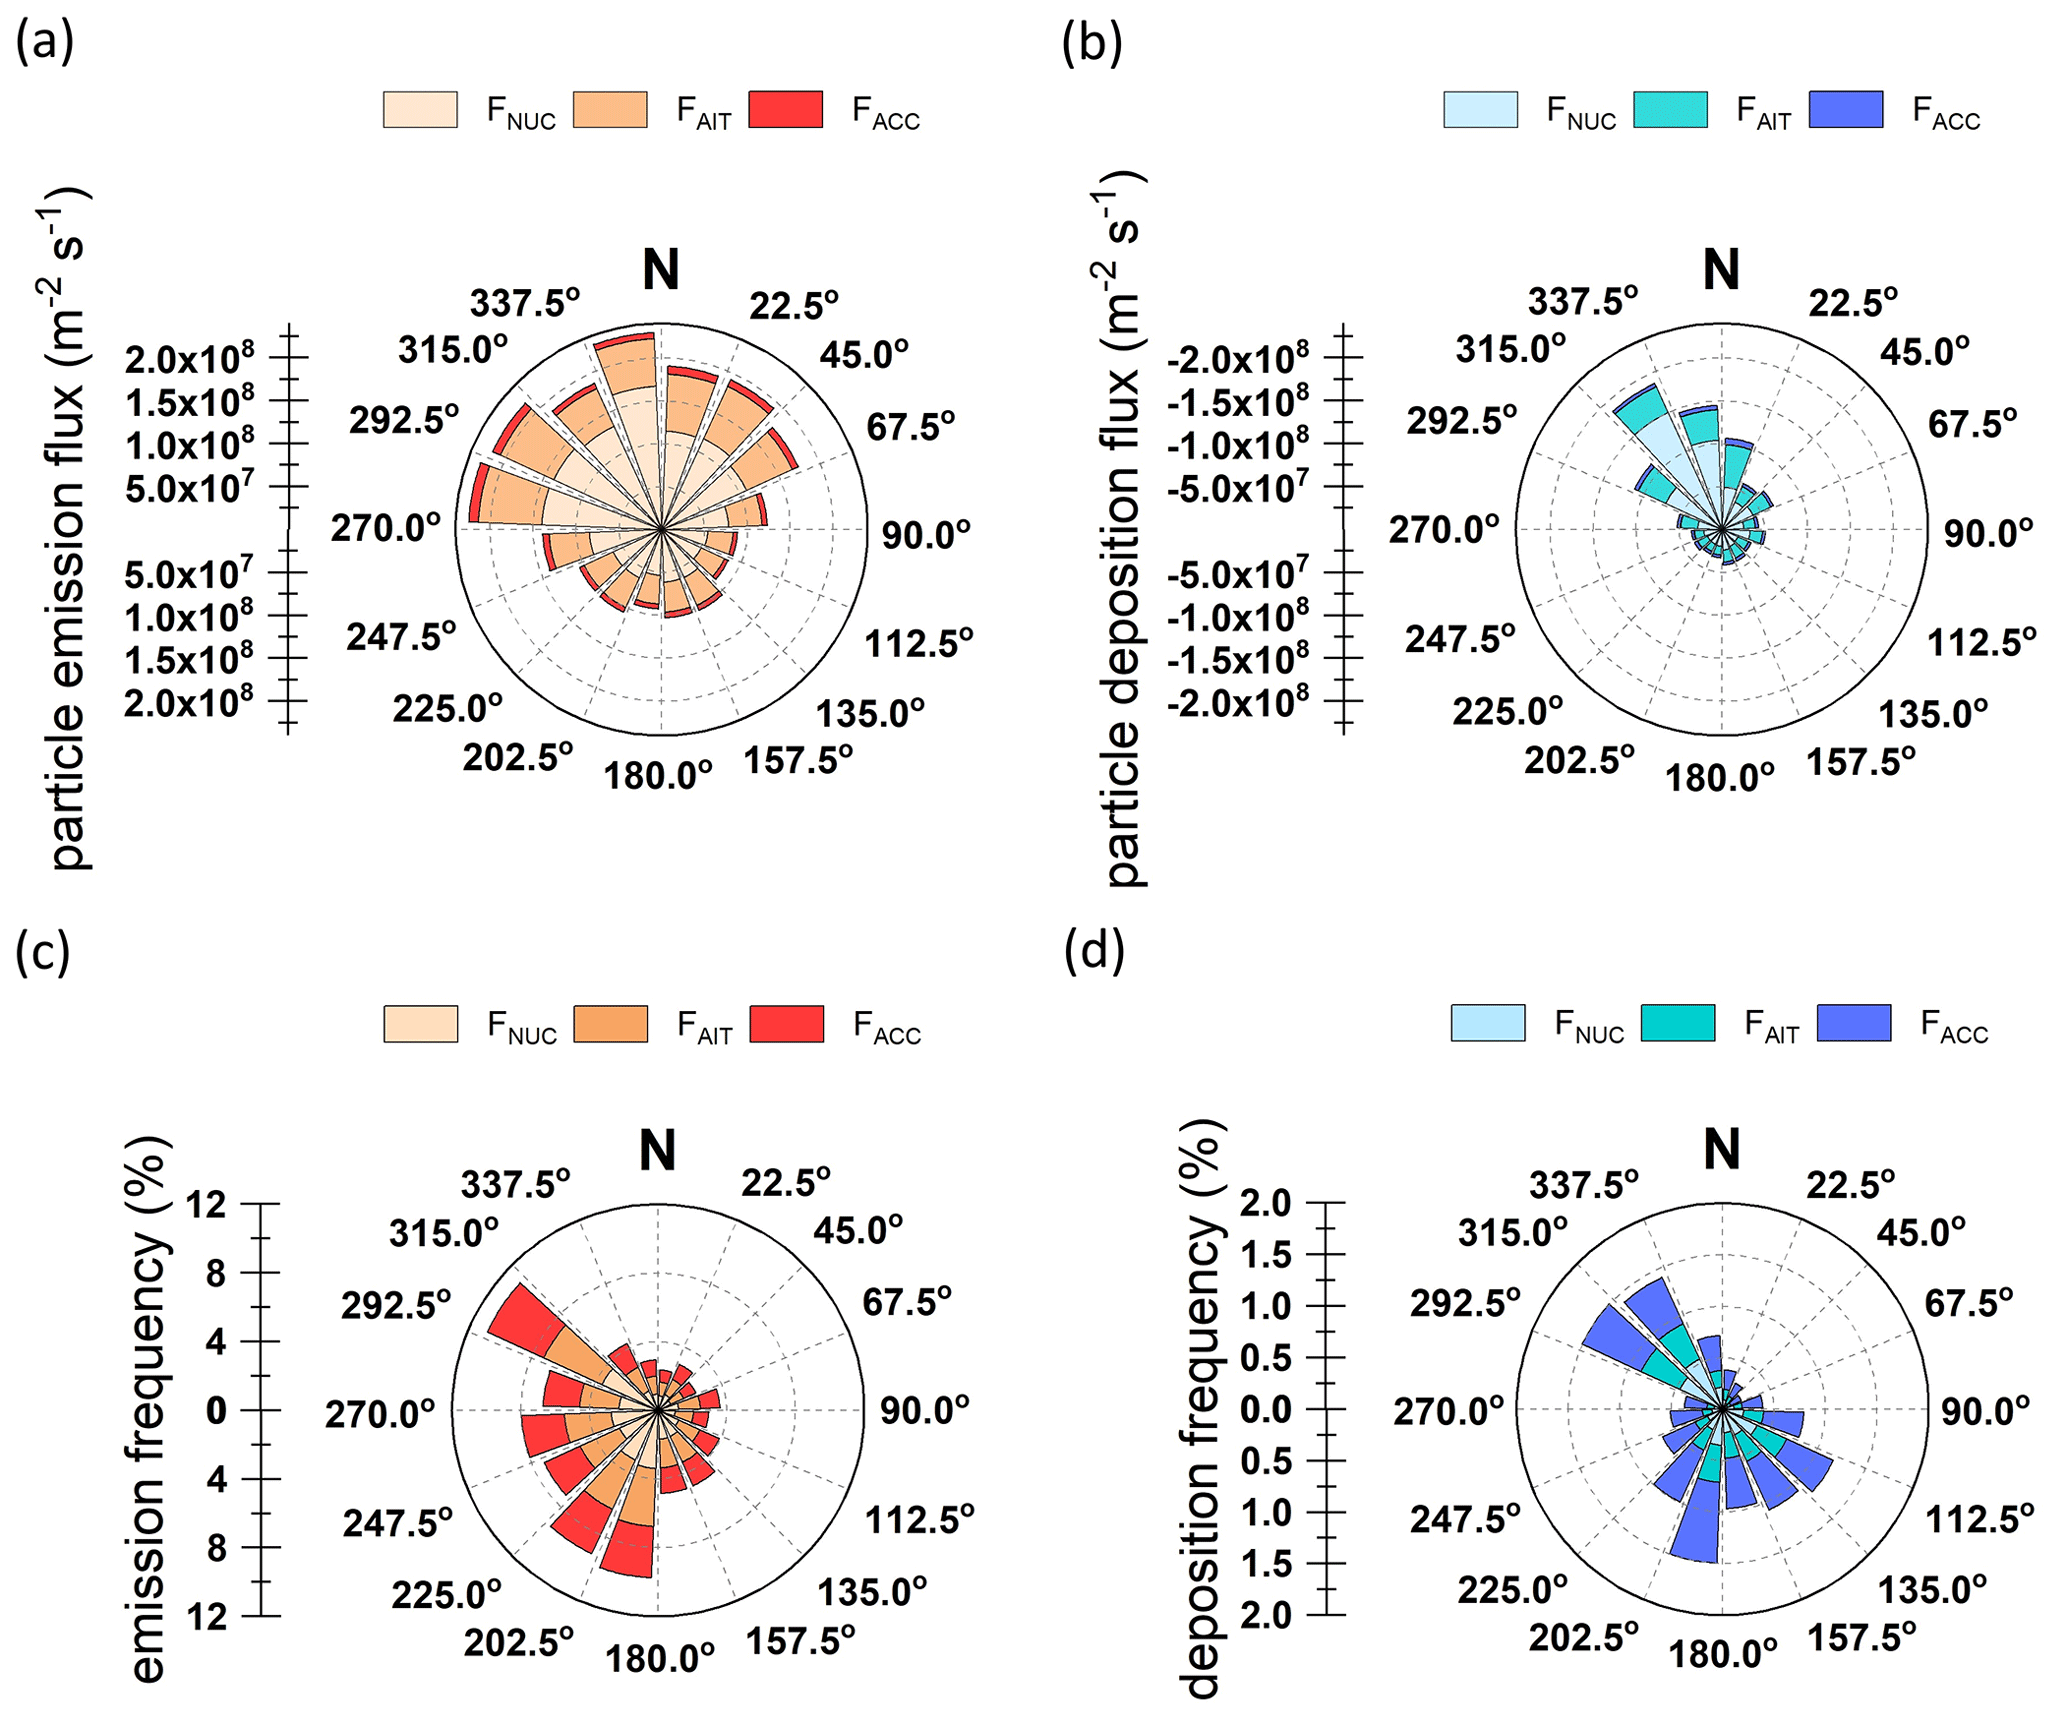
Figure 12Average (a) emission and (b) deposition particle number fluxes as well as the frequencies of (c) emission and (d) deposition events per wind direction sector for FNUC, FAIT, and FACC.
3.8 Land-use regression analysis
The 3-year data set was analysed with regard to the variation of land use across the flux footprint (cf. Fig. 13). We observed the sectors with the highest fraction of traffic areas to match with the highest particle fluxes, e.g. the sector with the highest traffic fraction of 53 % resulted in the largest particle emission flux with 2.05 × 10⁸ m−2 s−1.
To further analyse this relationship, a LUR analysis was carried out for FTNC and FUFP in the 16 wind sectors. At a confidence level of 95 %, only the land-use type traffic areas was highly significant with a p value < 0.001 (Table 4).

Figure 13Fraction of land use per wind direction sector contributing to the 3-year flux footprint. For data analysis the flux footprint was defined as a circle centred on the flux site with a radius of 2 km.
The LUR analysis based on the 3-year data set gives further evidence for the important role of traffic as a UFP emission source. Traffic areas emitted an FUFP value of 3.44 × 10⁸ m−2 s−1, followed by built-up areas with 4.87 × 10⁷ m−2 s−1 (not significant; Table 4). Green areas seem to be a sink of particles with an FUFP value of −1.46 × 10⁷ m−2 s−1, although the relationship was statistically not significant. However, the analysis does not take temporal variation of traffic intensity into account. A comparison of hourly traffic data from counting stations with particle number fluxes showed a distinct increase in FUFP with intensifying traffic (Fig. 14). The strongest increase was obvious for FNUC, followed by FAIT. FACC only slightly increased with traffic intensity.
Table 4Coefficients of the LUR analysis concerning FTNC and FUFP in the different wind sectors. Significant variables (significance level p<0.001) are highlighted (*).
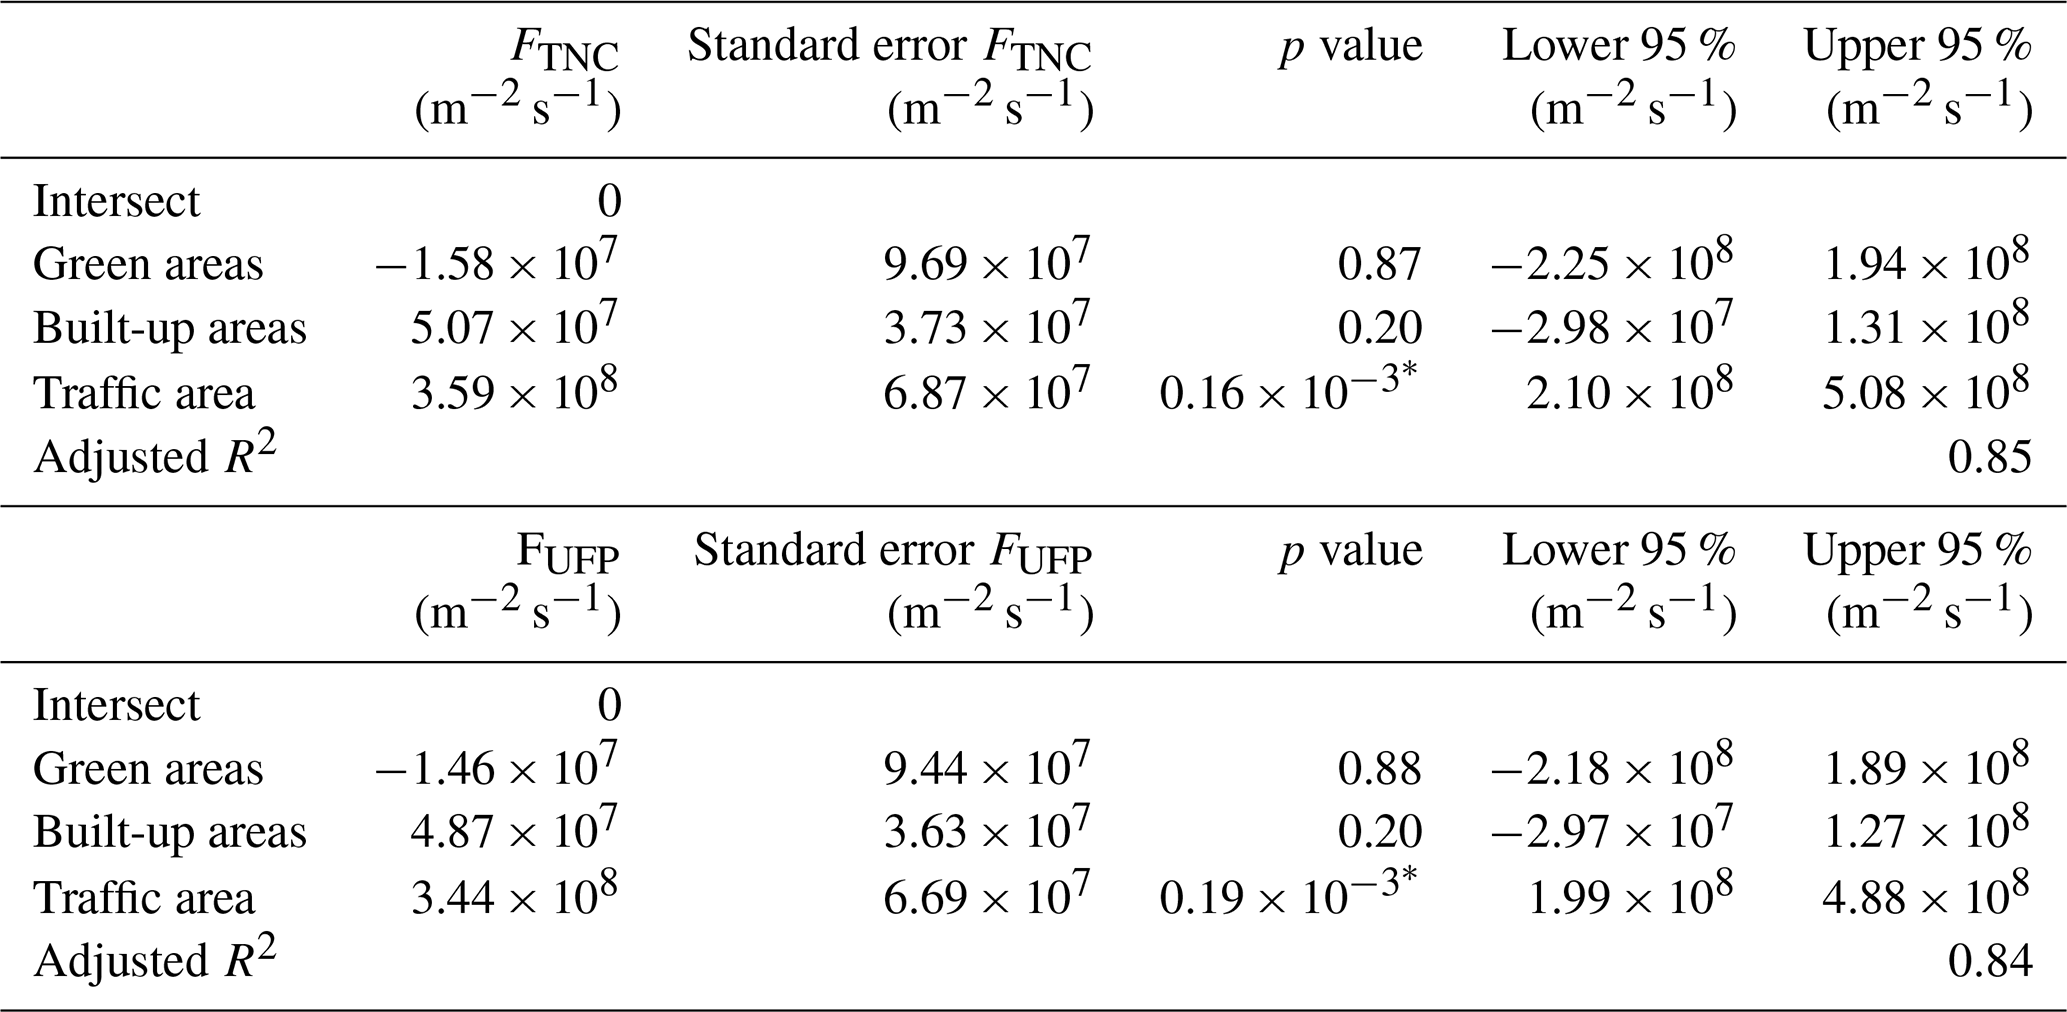
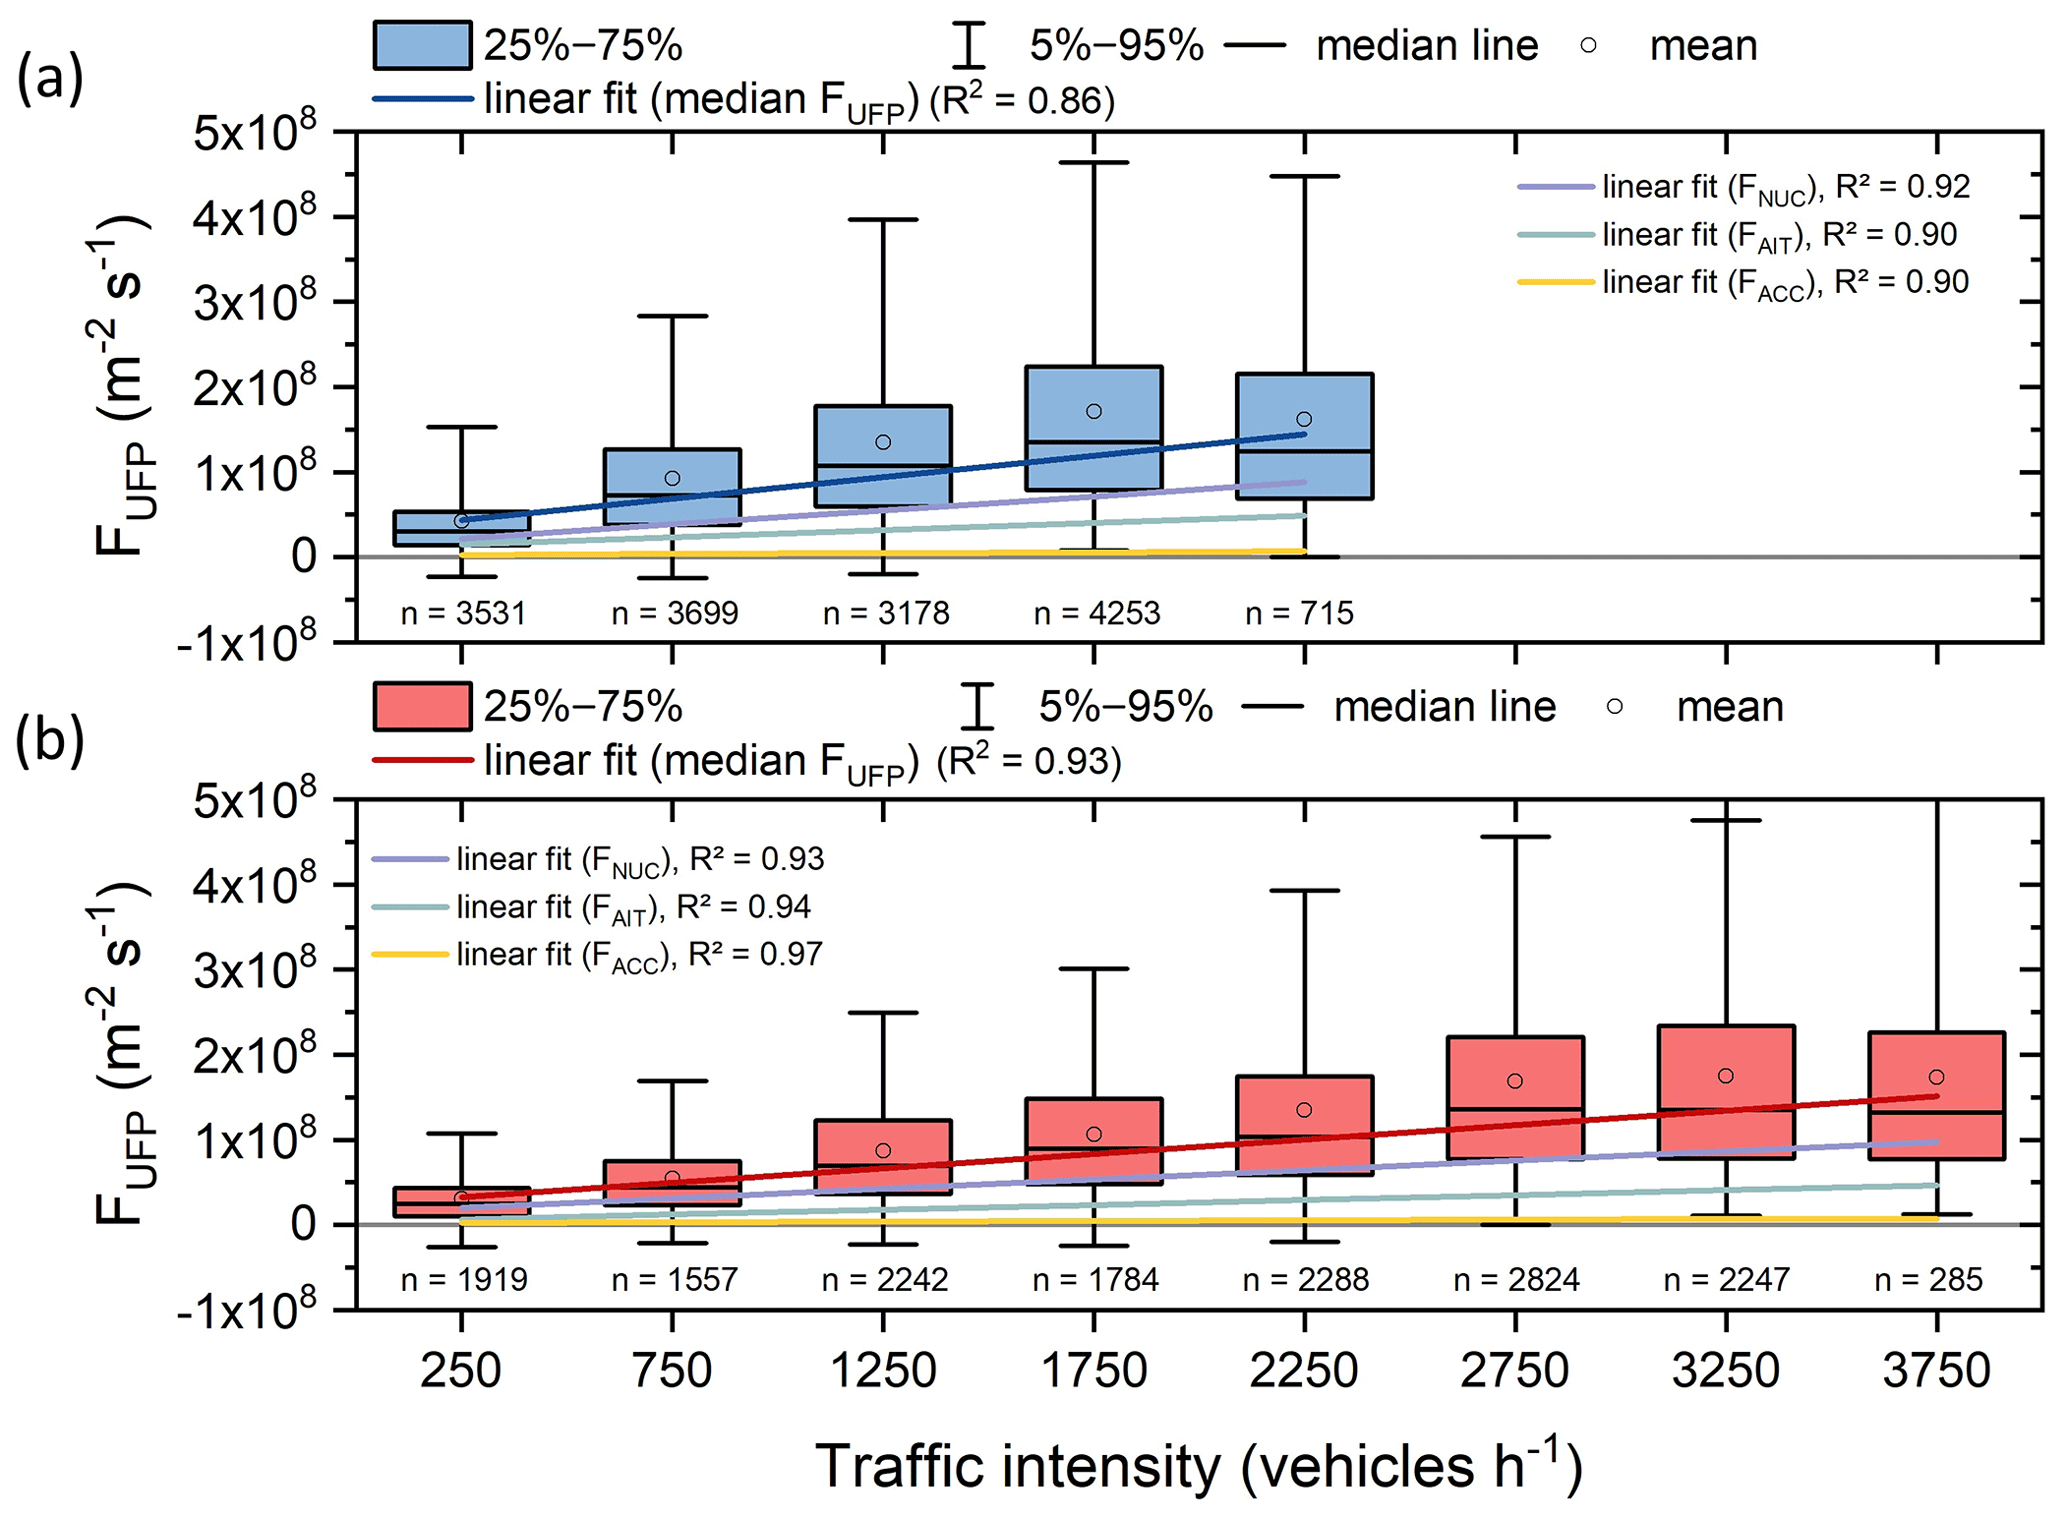
Figure 14Relationship between FUFP and traffic intensity at (a) Hardenbergstraße (HS) and (b) Straße des 17. Juni (S17J). Linear regression lines for the particle mode fluxes FNUC, FAIT, and FACC are given.
The particle number fluxes observed at the Berlin site show dominance of particle emission with a 3-year median FTNC of 0.86 × 10⁸ m−2 s−1 and FUFP of 0.83 × 10⁸ m−2 s−1, which makes the site a net emission source of ultrafine particles to the urban boundary layer. Measurements of urban particle number fluxes from different locations are, however, not easy to compare given the different diameter cut-offs of particle counting instruments. Due to the dominating impact of UFPs on the number flux, the lower cut-off is of particular importance. However, our results coincide with other studies from cities across Europe using a similar lower cut-off in the particle counting instruments (cf. Table 1). Average total number fluxes in Stockholm (Mårtensson et al., 2006), Innsbruck (Deventer et al., 2018; Heyden et al., 2018), and Lecce (Conte et al., 2018) are in the same order of magnitude, varying between 0.5 and 3.0 × 10⁸ m−2 s−1.
Although the 3 observation years point to constant emission of ultrafine particles from the urban surface, annual estimates show a median FUFP decrease of −8.9 % from the first to the second and −6.1 % from the second to the third observation year. The observed decrease might be due to several reasons. Analysing the temporal variation of traffic count data, we found a slight reduction in the third year (Fig. A3b). This could be one reason for the lower median FUFP in the third observation year. In addition, the decrease might be associated with the slight spatial shift of the peak contribution location in the flux footprint towards southerly directions. These source areas are characterized by a lower fraction of traffic areas and reduced traffic intensity in comparison to northerly directions. In the second year, the average wind direction and also the peak contribution location in the flux footprint shifted towards north-westerly directions. These were related to stronger particle deposition fluxes (cf. Fig. 12) that tend to reduce FUFP. As traffic areas in the flux footprint have different traffic intensity (i.e. major and minor roads), the annual variation of surface fractions of traffic areas in the flux footprints might not be sufficient to explain particle number flux differences. However, the variation of traffic impact can be estimated using a footprint-weighted ADT, which estimates the annual variation of traffic influence by quantifying the amount of major and minor roads contributing to the annual flux footprint (Fig. A3a). This indicates a relationship between particle fluxes and footprint-weighted traffic contribution, which we assume to be the major reason for the observed variation in annual average particle fluxes. Additionally, the transition of the vehicle fleet towards a higher share of low-emission standards or electric drive might play a role. According to official car registration data, the proportion of electric vehicles in Berlin increased by a factor of 3 in the time period from 2017 to 2020 (Kraftfahrt-Bundesamt, 2021). In the third observation year lower traffic intensity due to the COVID-19 lockdown restrictions starting in mid-March 2020 might have influenced our measurements and may explain the local minimum fluxes in March 2020 (cf. Fig. 7). However, an in-depth analysis of effects related to reduced traffic intensity during the COVID-19 lockdown is beyond the scope of this study but will be addressed in future work.
The analysis of size-resolved particle number fluxes points to the dominance of emission fluxes over the diurnal cycle. The strongest emission fluxes occur during daytime with a maximum of smallest particles in the early afternoon (e.g. Schmidt and Klemm, 2008; Deventer et al., 2018). The diurnal courses of particle fluxes coincided with traffic intensity, demonstrating the strong influence of traffic on FNUC. The delayed increase and reduced amplitude of traffic intensity on weekends compared to weekdays was clearly evident in particle flux data. At this time of low traffic intensity, particle deposition occurred much more frequently. While coarse particles (Dp > 180 nm) were deposited with a frequency of > 20 % at any time throughout the day, UFP deposition preferably occurred in the second half of the night or other low-emission periods, e.g. weekend mornings. The simultaneous occurrence of upward- and downward-directed fluxes, i.e. bidirectional fluxes, was recently reported from other cities (Schmidt and Klemm, 2008; Deventer et al., 2013, 2015, 2018). A tipping point, which defines the particle diameter separating average emission from average deposition fluxes, was reported for 160 < Dp < 190 nm (Deventer et al., 2013, 2015). On the mean diurnal cycle, no such tipping point can be identified at the present site, since our data do not show simultaneously occurring average upward and downward fluxes across the size spectrum.
We found a dominating contribution of FUFP to the total flux (96 %), which corresponds to findings from Innsbruck (99 %; size range: 6 nm <Dp < 637 nm; Deventer et al., 2018) and London (Harrison et al., 2012). In addition, the diurnal course of FUFP showing a nocturnal minimum and an early-afternoon maximum that is driven by traffic intensity and atmospheric stability is comparable to other findings (Dorsey et al., 2002; Deventer et al., 2013; Conte et al., 2018). A typical double rush-hour pattern of traffic intensity that does often not occur in particle flux data (Dorsey et al., 2002; Järvi et al., 2009; Martin et al., 2009; Deventer et al., 2015) is slightly evident in the diurnal cycle of average FUFP in Berlin. Also the differences in the diurnal cycles of FUFP between weekdays and the weekend point to the dominating influence of traffic on the measured fluxes at our site. This was confirmed by wind-dependent analysis of flux variation, the regression of fluxes against land use in the flux source area (LUR analysis), and the temporal variation with traffic data from counting stations. Similar findings of higher fluxes from traffic areas and lower fluxes from areas with higher amounts of green surfaces and buildings were reported by Järvi et al. (2009), Ripamonti et al. (2013), and Mårtensson et al. (2006).
In each wind direction sector, we found the highest particle number fluxes in the nucleation mode (FNUC≥57 % of average FTNC; cf. Fig. 11b). Road traffic is the main source of particles in the size range below 50 nm (Morawska et al., 2008). Especially rush-hour periods are characterized by a maximum of traffic-related particle emission in the size range between 20 and 30 nm (Wiedensohler et al., 2002). Thus, the large contribution of FNUC confirms the high influence of traffic intensity on fluxes at this site.
The deposition frequency seems to be related to the strength of local sources as indicated by the increase of deposition frequency with decreasing FUFP and FTNC (cf. Fig. 10). This may also be the reason for the higher frequency of particle deposition in ACC than UFP, since ACC emission fluxes are significantly lower than AIT and NUC mode fluxes (cf. Fig. 9a). The occurrence of bidirectional fluxes in the annual course also seems to depend on the strength of the surrounding sources with a more frequent appearance in seasons with lower emissions. Thus, they occur more often in summer and autumn than in winter (cf. Fig. 10c). Deventer et al. (2015) also reported differences in particle deposition between summer and winter and found an increase of deposition fluxes for Dp > 170 nm in spring and summer.
The highest particle number fluxes were observed in winter (cf. Fig. 10a) due to a larger number of emission sources (e.g. domestic heating) and reduced atmospheric dilution. However, the LUR analysis illustrates that the relationship between sources from built-up areas and particle number fluxes is statistically not significant and that emission fluxes from built-up areas are 1 order of magnitude smaller than traffic area fluxes (cf. Table 4). Thus, other local emission sources such as domestic heating in winter are of limited influence for particle number fluxes at this site in contrast to traffic-related sources.
We report on the first multi-annual data set of urban size-resolved particle number fluxes that were measured over the size range of 10 nm < Dp < 200 nm from April 2017 to March 2020 in an urban area of Berlin, Germany, using the eddy-covariance technique. The Berlin site was a net source of particles with a majority of ultrafine particle emission as indicated by a ratio of 0.96. The magnitude and temporal variation of FTNC and FUFP were rather similar in the individual observation years; however, a reduction of median FUFP of −8.9 % and −6.1 % for the second and third years was evident. This might be related to variation in the flux source area, a modification in the vehicle fleet, and an effect of reduced traffic intensity in the third measurement year.
The results clearly point to traffic as the dominant influence on ultrafine particle number fluxes at the Berlin site. Due to the health effects associated with UFPs, measures that result in reduced traffic intensity, e.g. by promoting alternative urban-mobility concepts, or a transition of the traffic fleet towards a higher share of electric or low-emission vehicles may help to reduce personal exposure towards UFPs. Long-term observations of size-resolved particle number fluxes from different urban environments would be an important tool to monitor and assess the success of different mobility strategies and reduction measures.
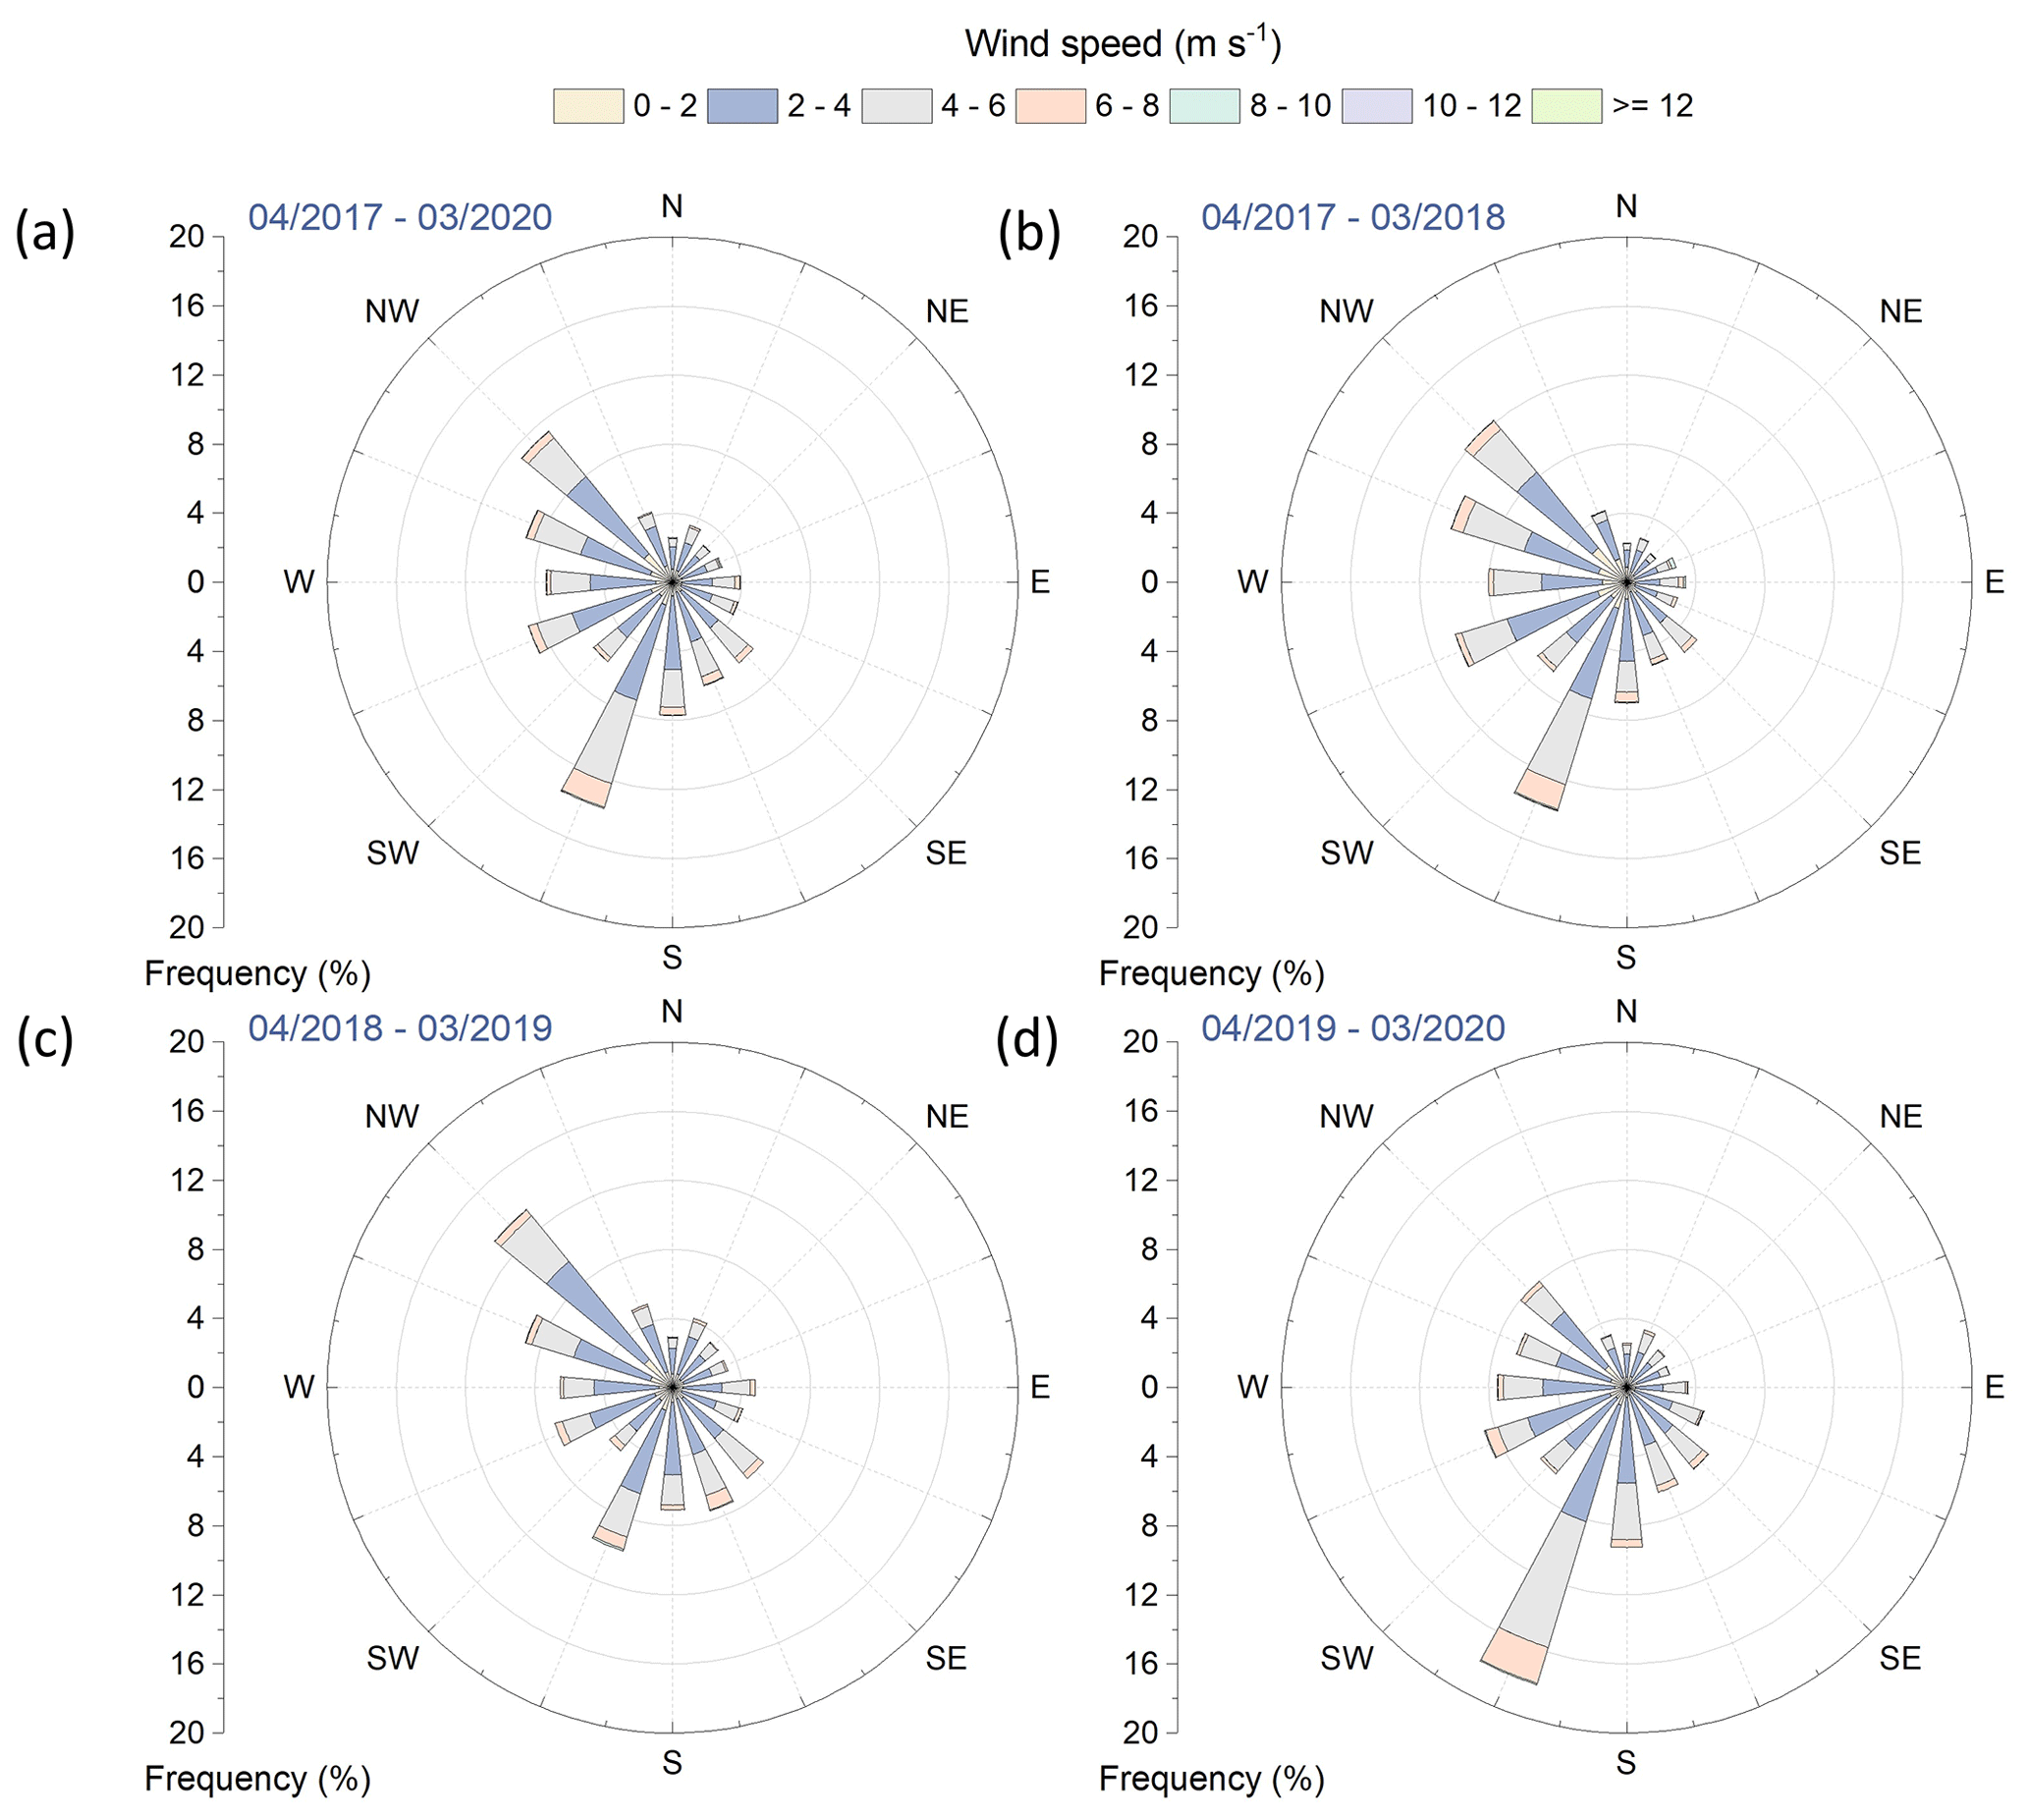
Figure A1Wind roses for (a) the whole 3-year period, (b) the first year, (c) the second year, and (d) the third year. Please note that the date format used in this figure is month/year.
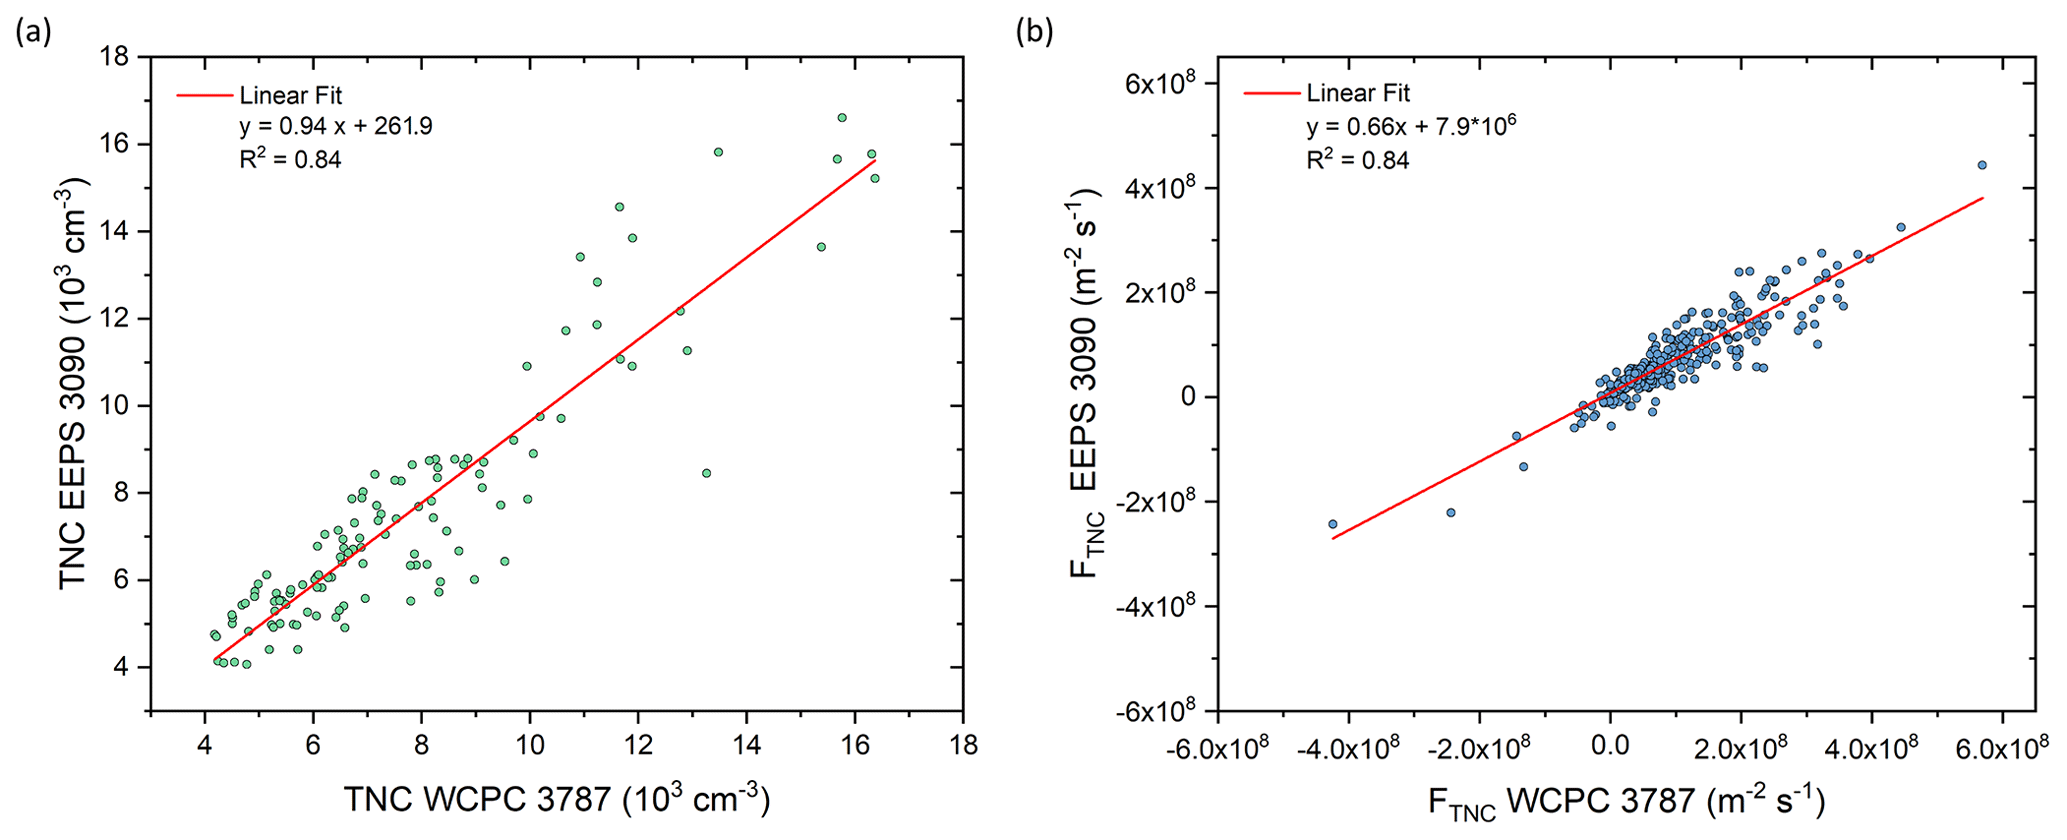
Figure A2Measurement comparison of the EEPS 3090 with the WCPC 3787 at the Berlin site concerning (a) total particle number concentration (TNC, 4 d, July 2020) and (b) total particle number flux (FTNC, 12 d, September 2020). The EEPS data relate to particle sizes between 10 and 200 nm, whereas the WCPC counts particles with Dp > 5 nm.
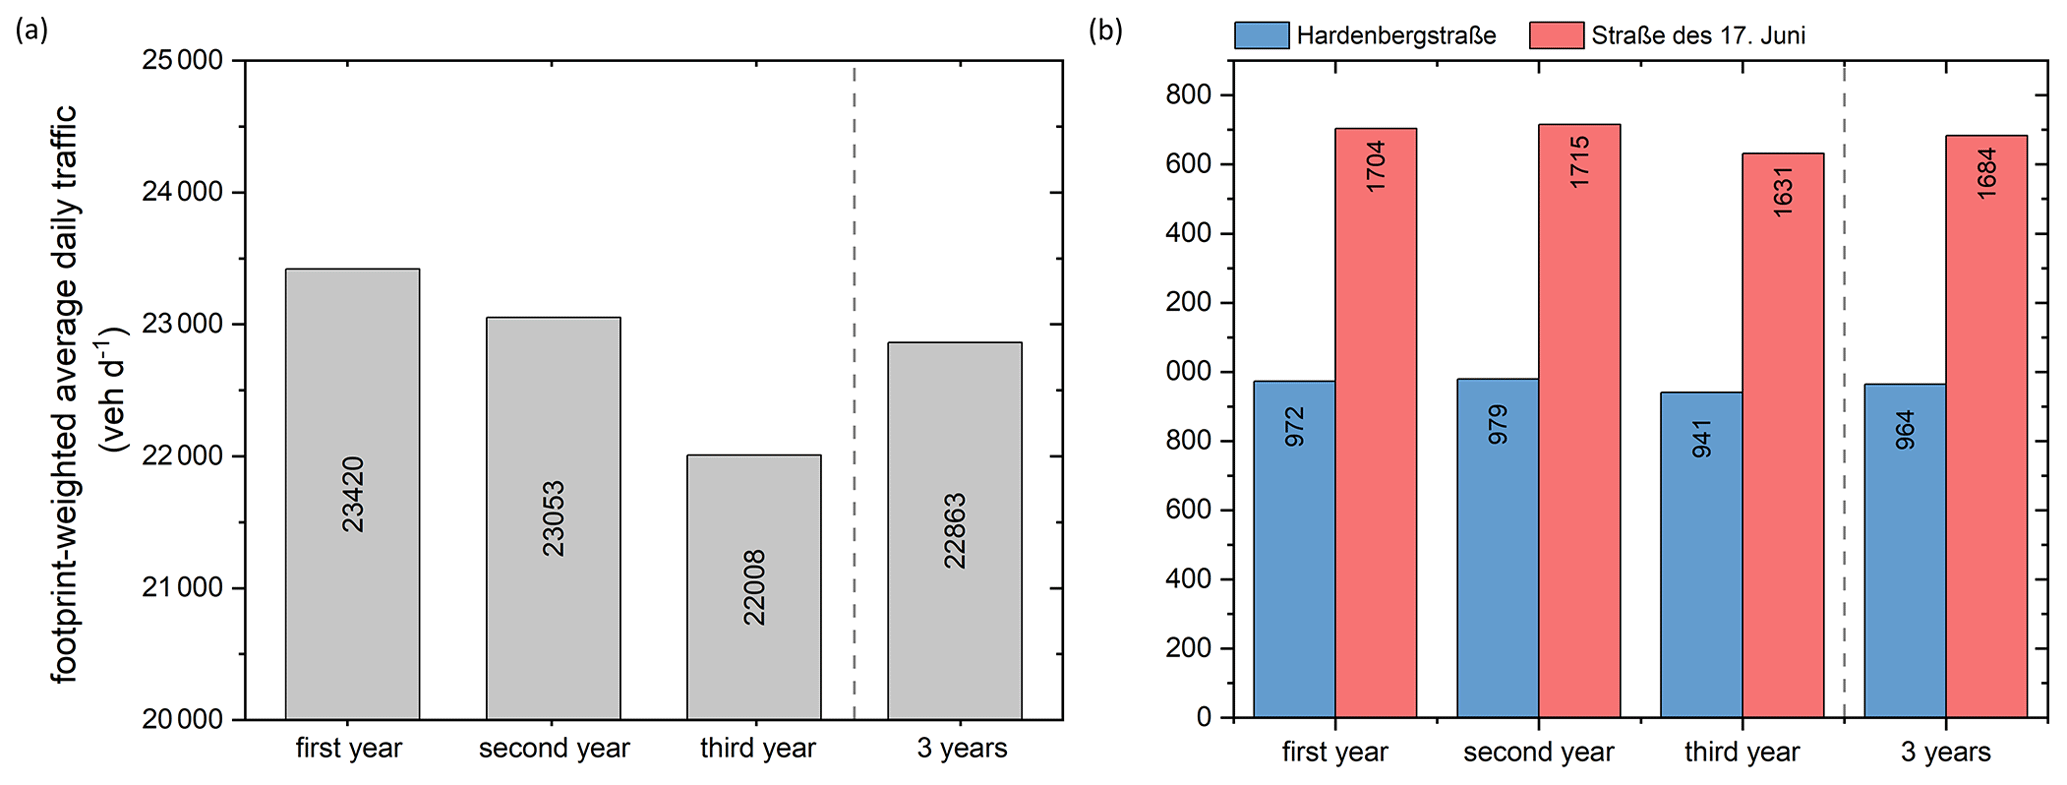
Figure A3(a) Footprint-weighted average daily traffic intensity (data source: Umweltatlas, 2017) and (b) average traffic intensity measured at the two traffic counting stations, Hardenbergstraße (HS) and Straße des 17. Juni (S17J), for the entire measurement period and each observation year.
The data used in this study are publicly available as “Three years of size-resolved eddy-covariance particle number flux measurements in Berlin, Germany” on https://doi.org/10.24355/dbbs.084-202107221337-0 (Straaten and Weber, 2021).
SW acted as the supervisor with responsibilities concerning conceptualization, funding acquisition, and project administration as well as reviewing and editing of the paper draft. Together with AS, he designed the experiments. AS took care of data curation, maintaining the flux site, formal data analysis, measurement operation and data collection, methodology, software use and development for data analysis, and data visualization. Additionally, AS prepared the original draft of this paper.
The contact author has declared that neither they nor their co-author has any competing interests.
Publisher's note: Copernicus Publications remains neutral with regard to jurisdictional claims in published maps and institutional affiliations.
We would like to thank Andreas Müer from VMZ Berlin Betreibergesellschaft mbH for providing traffic data from two counting stations. Furthermore, we would like to thank our project partners (Fred Meier and Dieter Scherer) of the Chair of Climatology, Institute for Ecology, Technische Universität Berlin for providing hourly measurement data of the mixing-layer height for flux footprint prediction and for being able to install sensors at their site. We thank Hagen Mittendorf of Technische Universität Braunschweig for his support in setting up and maintaining the flux site.
This study was supported by the German Federal Ministry of Education and
Research (BMBF; grant nos. FKZ 01 LP 1602 D – Urban Climate Under Change,
Module 3DO – and FKZ 01 LP 1912 D – Urban Climate Under Change, phase II,
Module 3DO+M).
This open-access publication was funded by Technische Universität Braunschweig.
This paper was edited by Leiming Zhang and reviewed by two anonymous referees.
Aubinet, M., Vesala, T., and Papale, D. (Eds.): Eddy Covariance. A Practical Guide to Measurement and Data Analysis, Springer Netherlands, Dordrecht, https://doi.org/10.1007/978-94-007-2351-1, 2012.
Bäfver, L. S., Leckner, B., Tullin, C., and Berntsen, M.: Particle emissions from pellets stoves and modern and old-type wood stoves, Biomass Bioenerg., 35, 3648–3655, https://doi.org/10.1016/j.biombioe.2011.05.027, 2011.
Baldocchi, D.: Assessing the eddy covariance technique for evaluating carbon dioxide exchange rates of ecosystems: past, present and future, Glob. Change Biol., 9, 479–492, 2003.
Burba, G. and Anderson, D.: A brief practical Guide to Eddy Covariance Flux Measurements, Principles and workflow examples for scientific and industrial applications, LI-COR Biosciences, Lincoln, Nebraska, USA, 2010.
Buzorius, G.: Cut-Off Sizes and Time Constants of the CPC TSI 3010 Operating at 1–3 lpm Flow Rates, Aerosol Sci. Tech., 35, 577–585, https://doi.org/10.1080/02786820121505, 2001.
Buzorius, G., Rannik, Ü., Mäkelä, J. M., Vesala, T., and Kulmala, M.: Vertical aerosol particle fluxes measured by eddy covariance technique using condensational particle counter, J. Aerosol Sci., 29, 157–171, https://doi.org/10.1016/S0021-8502(97)00458-8, 1998.
Buzorius, G., Rannik, Ü., Mäkelä, J. M., Keronen, P., Vesala, T., and Kulmala, M.: Vertical aerosol fluxes measured by the eddy covariance method and deposition of nucleation mode particles above a Scots pine forest in southern Finland, J. Geophys. Res., 105, 19905–19916, https://doi.org/10.1029/2000JD900108, 2000.
Conte, M., Donateo, A., and Contini, D.: Characterisation of particle size distributions and corresponding size-segregated turbulent fluxes simultaneously with CO2 exchange in an urban area, Sci. Total Environ., 622–623, 1067–1078, https://doi.org/10.1016/j.scitotenv.2017.12.040, 2018.
Contini, D., Donateo, A., Elefante, C., Grasso, F. M.: Analysis of particles and carbon dioxide concentrations and fluxes in an urban area. Correlation with traffic rate and local micrometeorology, Atmos. Environ., 46, 25–35, https://doi.org/10.1016/j.atmosenv.2011.10.039, 2012.
Damay, P. E., Maro, D., Coppalle, A., Lamaud, E., Connan, O., Hébert, D., Talbaut, M., and Irvine, M.: Size-resolved eddy covariance measurements of fine particle vertical fluxes, J. Aerosol Sci., 40, 1050–1058, https://doi.org/10.1016/j.jaerosci.2009.09.010, 2009.
Deventer, M. J., Griessbaum, F., and Klemm, O.: Size-resolved flux measurement of sub-micrometer particles over an urban area, Metz, 22, 729–737, https://doi.org/10.1127/0941-2948/2013/0441, 2013.
Deventer, M. J., El-Madany, T., Griessbaum, F., and Klemm, O.: One-year measurement of size-resolved particle fluxes in an urban area, Tellus B, 67, 25531, https://doi.org/10.3402/tellusb.v67.25531, 2015.
Deventer, M. J., Heyden, L. von der, Lamprecht, C., Graus, M., Karl, T., and Held, A.: Aerosol particles during the Innsbruck Air Quality Study (INNAQS), Fluxes of nucleation to accumulation mode particles in relation to selective urban tracers, Atmos. Environ., 190, 376–388, https://doi.org/10.1016/j.atmosenv.2018.04.043, 2018.
Dorsey, J. R., Nemitz, E., Gallagher, M. W., Fowler, D., Williams, P. I., Bower, K. N., and Beswick, K. M.: Direct measurements and parameterisation of aerosol flux, concentration and emission velocity above a city, Atmos. Environ., 36, 791–800, https://doi.org/10.1016/S1352-2310(01)00526-X, 2002.
Farmer, D. K., Boedicker, E. K., and DeBolt, H. M.: Dry Deposition of Atmospheric Aerosols. Approaches, Observations, and Mechanisms, Annu. Rev. Phys. Chem., 72, 375–397, https://doi.org/10.1146/annurev-physchem-090519-034936, 2021.
Finkelstein, P. L. and Sims, P. F.: Sampling error in eddy correlation flux measurements, J. Geophys. Res., 106, 3503–3509, https://doi.org/10.1029/2000JD900731, 2001.
Foken, T., Göockede, M., Mauder, M., Mahrt, L., Amiro, B., and Munger, W.: Post-Field Data Quality Control, in: Handbook of Micrometeorology, edited by: Lee, X., Massman, W., and Law, B., Atmos. Ocean. Sci. Lib., 29, Springer, Dordrecht, https://doi.org/10.1007/1-4020-2265-4_9, 2004.
Geoportal Berlin: Biotoptypen (Umweltatlas), license “dl-de/by-2-0”, available at: https://fbinter.stadt-berlin.de/fb/berlin/service_intern.jsp?id=s_fb_berlinbtk@senstadt&type=WFS (last access: 20 May 2021), 2014.
Geoportal Berlin: ALKIS Berlin Gebäude, license “dl-de/by-2-0”, available at: https://fbinter.stadt-berlin.de/fb/berlin/service_intern.jsp?id=s_wfs_alkis_gebaeudeflaechen@senstadt&type=WFS, last access: 20 May 2021.
Gerling, L., Löschau, G., Wiedensohler, A., and Weber, S.: Statistical modelling of roadside and urban background ultrafine and accumulation mode particle number concentrations using generalized additive models, Sci. Total Environ., 703, 134570, https://doi.org/10.1016/j.scitotenv.2019.134570, 2020.
Gioli, B., Toscano, P., Zaldei, A., Fratini, G., and Miglietta, F.: CO2, CH4 and Particles Flux Measurements in Florence, Italy, Enrgy. Proced., 40, 537–544, https://doi.org/10.1016/j.egypro.2013.08.062, 2013.
Harrison, R. M., Dall'Osto, M., Beddows, D. C. S., Thorpe, A. J., Bloss, W. J., Allan, J. D., Coe, H., Dorsey, J. R., Gallagher, M., Martin, C., Whitehead, J., Williams, P. I., Jones, R. L., Langridge, J. M., Benton, A. K., Ball, S. M., Langford, B., Hewitt, C. N., Davison, B., Martin, D., Petersson, K. F., Henshaw, S. J., White, I. R., Shallcross, D. E., Barlow, J. F., Dunbar, T., Davies, F., Nemitz, E., Phillips, G. J., Helfter, C., Di Marco, C. F., and Smith, S.: Atmospheric chemistry and physics in the atmosphere of a developed megacity (London): an overview of the REPARTEE experiment and its conclusions, Atmos. Chem. Phys., 12, 3065–3114, https://doi.org/10.5194/acp-12-3065-2012, 2012.
HEI Review Panel on Ultrafine Particles: Understanding the Health Effects of Ambient Ultrafine Particles, HEI Perspectives 3, Health Effects Institute, Boston, MA, available at: https://www.healtheffects.org/system/files/Perspectives3.pdf (last access: 20 December 2021), 2013.
Heyden, L. von der, Deventer, M. J., Graus, M., Karl, T., Lamprecht, C., and Held, A.: Aerosol particles during the Innsbruck Air Quality Study (INNAQS), The impact of transient fluxes on total aerosol number exchange, Atmos. Environ., 190, 389–400, https://doi.org/10.1016/j.atmosenv.2018.07.041, 2018.
Hinds, W. C.: Aerosol technology, Properties, behavior, and measurement of airborne particles, 2nd Edn., Wiley, New York, 1999.
Horst, T. W.: A simple formula for attenuation of eddy fluxes measured with first-order-response scalar sensors, Bound. Lay.-Meteorol., 82, 219–233, https://doi.org/10.1023/A:1000229130034, 1997.
Järvi, L., Rannik, Ü., Mammarella, I., Sogachev, A., Aalto, P. P., Keronen, P., Siivola, E., Kulmala, M., and Vesala, T.: Annual particle flux observations over a heterogeneous urban area, Atmos. Chem. Phys., 9, 7847–7856, https://doi.org/10.5194/acp-9-7847-2009, 2009.
Johnson, T., Caldow, R., Pöcher, A., Mirme, A., and Kittelson, D.: An Engine Exhaust Particle Sizer Spectrometer for Transient Emission Particle Measurements, Conference: 9th Diesel Engine Emissions Reduction (DEER) Workshop 2003, Newport, RI (US), 24–28 August 2003.
Johnson, T., Caldow, R., Pöcher, A., Mirme, A., and Kittelson, D.: A New Electrical Mobility Particle Sizer Spectrometer for Engine Exhaust Particle Measurements, SAE Technical Paper Series 2004-01-1341, SEA International, USA, ISBN 0-7680-1319-4, 2004.
Kaimal, J. C., Wyngaard, J. C., Izumi, Y., and Coté, O. R.: Spectral characteristics of surface-layer turbulence, Q. J. Roy. Meteor. Soc., 98, 563–589, https://doi.org/10.1002/qj.49709841707, 1972.
Kljun, N., Calanca, P., Rotach, M. W., and Schmid, H. P.: A simple two-dimensional parameterisation for Flux Footprint Prediction (FFP), Geosci. Model Dev., 8, 3695–3713, https://doi.org/10.5194/gmd-8-3695-2015, 2015.
Kraftfahrt-Bundesamt: Anzahl der Personenkraftwagen mit Elektroantrieb im Bundesland Berlin im Zeitraum der Jahre 2012 bis 2020, available at: https://de.statista.com/statistik/daten/studie/709212/umfrage/personenkraftwagen-mit-elektroantrieb-in-berlin/, last access: 21 July 2021.
Kumar, P., Morawska, L., Birmili, W., Paasonen, P., Hu, M., Kulmala, M., Harrison, R. M., Norford, L., and Britter, R.: Ultrafine particles in cities, Environ. Int., 66, 1–10, https://doi.org/10.1016/j.envint.2014.01.013, 2014.
Kurppa, M., Nordbo, A., Haapanala, S., and Järvi, L.: Effect of seasonal variability and land use on particle number and CO2 exchange in Helsinki, Finland, Urban Clim., 13, 94–109, https://doi.org/10.1016/j.uclim.2015.07.006, 2015.
Longley, I. D., Gallagher, M. W., Dorsey, J. R., Flynn, M., Allan, J. D., Alfarra, M. R., and Inglis, D.: A case study of aerosol (4.6 nm < Dp < 10 µm) number and mass size distribution measurements in a busy street canyon in Manchester, UK, Atmos. Environ., 37, 1563–1571, https://doi.org/10.1016/S1352-2310(03)00010-4, 2003.
Longley, I. D., Gallagher, M. W., Dorsey, J. R., and Flynn, M.: A case-study of fine particle concentrations and fluxes measured in a busy street canyon in Manchester, UK, Atmos. Environ., 38, 3595–3603, https://doi.org/10.1016/j.atmosenv.2004.03.040, 2004.
Mårtensson, E. M., Nilsson, E. D., Buzorius, G., and Johansson, C.: Eddy covariance measurements and parameterisation of traffic related particle emissions in an urban environment, Atmos. Chem. Phys., 6, 769–785, https://doi.org/10.5194/acp-6-769-2006, 2006.
Martin, C. L., Longley, I. D., Dorsey, J. R., Thomas, R. M., Gallagher, M. W., and Nemitz, E.: Ultrafine particle fluxes above four major European cities, Atmos. Environ., 43, 4714–4721, https://doi.org/10.1016/j.atmosenv.2008.10.009, 2009.
Meyer-Kornblum, A., Gerling, L., and Weber, S.: Gap-filling Fast Electrical Mobility Spectrometer Measurements of Particle Number Size Distributions for Eddy Covariance Application, Aerosol Air Qual. Res., 19, 2721–2731, https://doi.org/10.4209/aaqr.2019.06.0291, 2019.
Moncrieff, J., Clement, R., Finnigan, J., and Meyers, T.: Averaging, Detrending, and Filtering of Eddy Covariance Time Series, in: Handbook of Micrometeorology, edited by: Lee, X., Massman, W., and Law, B., Atmos. Ocean. Sci. Lib., 29, Springer, Dordrecht, 2004.
Moncrieff, J. B., Massheder, J. M., Bruin, H. de, Elbers, J., Friborg, T., Heusinkveld, B., Kabat, P., Scott, S., Soegaard, H., and Verhoef, A.: A system to measure surface fluxes of momentum, sensible heat, water vapour and carbon dioxide, J. Hydrol., 188–189, 589–611, 1997.
Morawska, L., Ristovski, Z., Jayaratne, E. R., Keogh, D. U., and Ling, X.: Ambient nano and ultrafine particles from motor vehicle emissions. Characteristics, ambient processing and implications on human exposure, Atmos. Environ., 42, 8113–8138, https://doi.org/10.1016/j.atmosenv.2008.07.050, 2008.
Nemitz, E., Fowler, D., Dorsey, J. R., Theobald, M. R., McDonald, A. D., Bower, K. N., Beswick, K. M., Williams, P. I., and Gallagher, M. W.: Direct measurements of size-segregated particle fluxes above a city, J. Aerosol Sci., 31, 116–117, https://doi.org/10.1016/S0021-8502(00)90123-X, 2000.
Nemmar, A., Hoet, P. H. M., Vanquickenborne, B., Dinsdale, D., Thomeer, M., Hoylaerts, M. F., Vanbilloen, H., Mortelmans, L., and Nemery, B.: Passage of Inhaled Particles Into the Blood Circulation in Humans, Circulation, 105, 411–414, https://doi.org/10.1161/hc0402.104118, 2002.
Oberdörster, G., Gelein, R. M., Ferin, J., and Weiss, B.: Association of particulate air pollution and acute mortality. Involvement of ultrafine particles?, Inhal. Toxicol., 7, 111–124, https://doi.org/10.3109/08958379509014275, 1995.
Ripamonti, G., Järvi, L., Mølgaard, B., Hussein, T., Nordbo, A., and Hämeri, K.: The effect of local sources on aerosol particle number size distribution, concentrations and fluxes in Helsinki, Finland, Tellus B, 65, 19786, https://doi.org/10.3402/tellusb.v65i0.19786, 2013.
Rönkkö, T., Kuuluvainen, H., Karjalainen, P., Keskinen, J., Hillamo, R., Niemi, J. V., Pirjola, L., Timonen, H. J., Saarikoski, S., Saukko, E., Järvinen, A., Silvennoinen, H., Rostedt, A., Olin, M., Yli-Ojanperä, J., Nousiainen, P., Kousa, A., and Dal Maso, M.: Traffic is a major source of atmospheric nanocluster aerosol, P. Natl. Acad. Sci. USA, 114, 7549–7554, https://doi.org/10.1073/pnas.1700830114, 2017.
Saylor, R. D., Baker, B. D., Lee, P., Tong, D., Pan, L., and Hicks, B. B.: The particle dry deposition component of total deposition from air quality models. Right, wrong or uncertain?, Tellus B, 71, 1–22, https://doi.org/10.1080/16000889.2018.1550324, 2019.
Scherer, D., Ament, F., Emeis, S., Fehrenbach, U., Leitl, B., Scherber, K., Schneider, C., and Vogt, U.: Three-Dimensional Observation of Atmospheric Processes in Cities, Metz, 28, 121–138, https://doi.org/10.1127/metz/2019/0911, 2019.
Schmidt, A. and Klemm, O.: Direct determination of highly size-resolved turbulent particle fluxes with the disjunct eddy covariance method and a 12 – stage electrical low pressure impactor, Atmos. Chem. Phys., 8, 7405–7417, https://doi.org/10.5194/acp-8-7405-2008, 2008.
Schraufnagel, D. E.: The health effects of ultrafine particles, Exp. Mol. Med., 52, 311–317, https://doi.org/10.1038/s12276-020-0403-3, 2020.
Straaten, A. and Weber, S.: Three years of size-resolved eddy-covariance particle number flux measurements in Berlin, Germany, Publication server of Technische Universtität Braunschweig [data set], https://doi.org/10.24355/dbbs.084-202107221337-0, 2021.
Suni, T., Rinne, J., Reissell, A., Altimir, N., Keronen, P., Rannik, Ü., Dal Maso, M., Kulmala, M., and Vesala, T.: Long-term measurements of surface fluxes above a Scots pine forest in Hyytiälä, southern Finland, 1996–2001, Boreal Environ. Res., 8, 287–301, 2003.
Tie, X., Wu, D., and Brasseur, G.: Lung cancer mortality and exposure to atmospheric aerosol particles in Guangzhou, China, Atmos. Environ., 43, 2375–2377, https://doi.org/10.1016/j.atmosenv.2009.01.036, 2009.
Tsang, H., Kwok, R., and Miguel, A. H.: Pedestrian Exposure to Ultrafine Particles in Hong Kong Under Heavy Traffic Conditions, Aerosol Air Qual. Res., 8, 19–27, 2008.
TSI, Inc.: Engine Exhaust Particle Sizer (EEPSTM) Spectrometer Model 3090/3090AK, Operation and Service Manual, TSI Incorporated, Minnesota, USA, 2015.
Umweltatlas Berlin: Verkehrsmengen DTV 2014 (Umweltatlas), license “dl-de/by-2-0”, available at: https://fbinter.stadt-berlin.de/fb/berlin/service_intern.jsp?id=wfs_07_01verkmeng2014@senstadt&type=WFS (last access: 20 May 2021), 2017.
Vickers, D. and Mahrt, L.: Quality Control and Flux Sampling Problems for Tower and Aircraft Data, J. Atmos. Ocean. Tech., 14, 512–526, https://doi.org/10.1175/1520-0426(1997)014<0512:QCAFSP>2.0.CO;2, 1997.
Vogt, M., Nilsson, E. D., Ahlm, L., Mårtensson, E. M., and Johansson, C.: Seasonal and diurnal cycles of 0.25–2.5 µm aerosol fluxes over urban Stockholm, Sweden, Tellus B, 63, 935–951, https://doi.org/10.1111/j.1600-0889.2011.00551.x, 2011a.
Vogt, M., Nilsson, E. D., Ahlm, L., Mårtensson, E. M., Struthers, H., and Johansson, C.: Traffic aerosol emission velocity derived from direct flux measurements over urban Stockholm, Sweden, Atmos. Environ., 45, 5725–5731, https://doi.org/10.1016/j.atmosenv.2011.07.026, 2011b.
Weber, S., Kordowski, K., and Kuttler, W.: Variability of particle number concentration and particle size dynamics in an urban street canyon under different meteorological conditions, Sci. Total Environ., 449, 102–114, https://doi.org/10.1016/j.scitotenv.2013.01.044, 2013.
Wiedensohler, A, Wehner, B., and Birmili, W.: Aerosol Number Concentrations and Size Distributions at Mountain-Rural, Urban-Influenced Rural, and Urban-Background Sites in Germany, J. Aerosol Med., 15, 237–243, 2002.
Zhu, Y., Eiguren-Fernandez, A., Hinds, W. C., and Miguel, A. H.: In-cabin commuter exposure to ultrafine particles on Los Angeles freeways, Environ. Sci. Technol., 41, 2138–2145, https://doi.org/10.1021/es0618797, 2007.