the Creative Commons Attribution 4.0 License.
the Creative Commons Attribution 4.0 License.
 | 17 Dec 2021
The spatiotemporal relationship between PM2.5 and aerosol optical depth in China: influencing factors and implications for satellite PM2.5 estimations using MAIAC aerosol optical depth
Qingqing He
Mengya Wang
Satellite aerosol retrievals have been a popular alternative to monitoring the surface-based PM2.5 concentration due to their extensive spatial and temporal coverage. Satellite-derived PM2.5 estimations strongly rely on an accurate representation of the relationship between ground-level PM2.5 and satellite aerosol optical depth (AOD). Due to the limitations of satellite AOD data, most studies have examined the relationship at a coarse resolution (i.e., ≥ 10 km); thus, more effort is still needed to better understand the relationship between “in situ” PM2.5 and AOD at finer spatial scales. While PM2.5 and AOD could have obvious temporal variations, few studies have examined the diurnal variation in their relationship. Therefore, considerable uncertainty still exists in satellite-derived PM2.5 estimations due to these research gaps. Taking advantage of the newly released fine-spatial-resolution satellite AOD data derived from the Multi-Angle Implementation of Atmospheric Correction (MAIAC) algorithm and real-time ground aerosol and PM2.5 measurements, this study explicitly explored the relationship between PM2.5 and AOD as well as its plausible impact factors, including meteorological parameters and topography, in mainland China during 2019, at various spatial and temporal scales. The coefficient of variation, the Pearson correlation coefficient and the slope of the linear regression model were used. Spatially, stronger correlations mainly occurred in northern and eastern China, and the linear slope was larger on average in northern inland regions than in other areas. Temporally, the PM2.5–AOD correlation peaked at noon and in the afternoon, and reached a maximum in winter. Simultaneously, considering relative humidity (RH) and the planetary boundary layer height (PBLH) in the relationship can improve the correlation, but the effect of RH and the PBLH on the correlation varied spatially and temporally with respect to both strength and direction. In addition, the largest correlation occurred at 400–600 m primarily in basin terrain such as the Sichuan Basin, the Shanxi–Shaanxi basins and the Junggar Basin. MAIAC 1 km AOD can better represent the ground-level fine particulate matter in most domains with exceptions, such as in very high terrain (i.e., Tibetan Plateau) and northern central China (i.e., Qinghai and Gansu). The findings of this study have useful implications for satellite-based PM2.5 monitoring and will further inform the understanding of the aerosol variation and PM2.5 pollution status of mainland China.
- Article
(12127 KB) - Full-text XML
-
Supplement
(2721 KB) - BibTeX
- EndNote


Aerosols play an important role in regional and global climate change via both their direct and indirect effects (King et al., 1992; Li et al., 2007; Z. Liu et al., 2019, 2020; Liu et al., 2018). Fine particulate matter (PM2.5) has attracted a lot of concern from scientists, policymakers and the public due to its negative impact on the environment (Li et al., 2020; Y. Yang et al., 2018, 2020; Yim et al., 2019a) and human health (Schwartz, 1996; Pope III et al., 2002; Gu et al., 2018, 2020; Gu and Yim, 2016; Hou et al., 2019; Shi et al., 2020; Yim et al., 2015). With an extended spatial and temporal coverage, retrieval of the near-surface PM2.5 concentration from satellite aerosol optical depth (AOD) has become a popular approach to bridging the gap left by the ground-level monitoring network. The use of satellite AOD retrievals facilitates the detection of the large-scale and long-term aerosol loading as well as transboundary transport and also assists in the determination of the population exposure level for epidemiological and health studies (Liu et al., 2017; Zou et al., 2019). The theoretical basis of this technique rests on the strong link between satellite AOD retrievals and ground-level PM2.5 concentration (Wang and Christopher, 2003). Therefore, it is of great importance to examine the PM2.5–AOD relationship, not only with respect to the relationship itself but also regarding the underlying physical understanding involved.
Due to rapid urbanization and industrialization, China has been suffering from serious air pollution (Zhao et al., 2019; Guo et al., 2011; He et al., 2019). Given the heavy haze pollution in China (Luo et al., 2018; Tong et al., 2018b, a; Y. Yang et al., 2019; Yim, 2020; Yim et al., 2019b), observation studies have demonstrated and investigated the PM2.5–AOD relationship in China (Wang et al., 2014; Guo et al., 2017, 2009; Kong et al., 2016; Shao et al., 2017; Xin et al., 2016; Q. Yang et al., 2019). For instance, the Moderate Resolution Imaging Spectroradiometer (MODIS) Dark Target (DT) and Deep Blue (DB) 10 km AOD products have been widely used for quantifying the PM2.5–AOD relationship at both regional (Kong et al., 2016; Shao et al., 2017) and national scales (Guo et al., 2017; Q. Yang et al., 2019). The relationship found is not always concordant and exhibits large spatiotemporal variability. With the development of satellite remote sensing techniques, a high-spatial-resolution global daily aerosol product – the Multi-Angle Implementation of Atmospheric Correction (MAIAC) 1 km AOD product – has recently been released, providing local-scale aerosol gradients and details missed by previous coarse-resolution (10 km) products (Lyapustin et al., 2018). Because the ground-level PM2.5 concentration is generally measured at an in situ point, whereas the satellite AOD is reported on a grid (e.g., 1 km × 1 km for MAIAC AOD and 10 km × 10 km for DT AOD), the relationship between a “point” PM2.5 and a “gridded” AOD at a coarse resolution might mask their discrepancy or correspondence at a finer spatial resolution. Due to the characterization of fine-resolution aerosol heterogeneity as well as the changes in the retrieval scheme and accuracy (Guo et al., 2017), the use of the high-resolution AOD data probably introduces different/additional uncertainties into the PM2.5–AOD association, leading to a different spatiotemporal pattern and further affecting the performance of satellite-derived PM2.5 predictions. Thus, further exploring the relationship between near-surface PM2.5 and MAIAC AOD over China seems critically imperative based on AOD products at a much finer resolution.
The PM2.5–AOD link has been widely recognized to vary in space and time, which is associated with the defined difference between surface PM2.5 measurements and satellite AOD stemming from variations in aerosol type, meteorological conditions and topography (Kloog et al., 2014; Lee et al., 2016a; Ma et al., 2014; Wang et al., 2014; Zhang and Li, 2015). Ground-level air quality monitoring equipment contains a dynamic heating system to evaporate water vapor in particles; thus, it measures the dry mass concentration for the PM2.5 concentration, which is inevitably different from satellite AOD that interprets aerosol extinction without considering the humidity conditions. The vertical structure of aerosols can induce uncertainty between PM2.5 and AOD, as satellite AOD is an integration of aerosol extinction in the entire atmosphere, whereas the ambient PM2.5 concentration is only measured at the ground surface. Irrespective of the different conditions, meteorological factors may have a confounding influence, affecting the PM2.5–AOD relationship to different extents and even leading to contrary results (i.e., improvement or deterioration). In addition, topography is another major contributor to uncertainty in the PM2.5–AOD relationship, but its impact is difficult to quantify due to its complex structure. Therefore, further explicit analyses are required to explore the effect of both terrain and meteorological factors, including hygroscopicity and the vertical structure of aerosols on the PM2.5–AOD relationship, especially for mainland China, which has complex terrain and land cover types.
Capturing the diurnal cycle of the surface PM2.5 concentration has various applications, e.g., establishing the short-term health impact of PM2.5 as well as aerosol–cloud interactions (Arola et al., 2013; Guo et al., 2016; Kim et al., 2010; Lee et al., 2016b; Zheng et al., 2020). To successfully capture the diurnal variation in the PM2.5–AOD relationship and represent the diurnal cycle of PM2.5, understanding the diurnal variation involved in the data is crucial. However, this is easily ignored when studying the relationship between surface PM2.5 and satellite AOD due to the limitations of hourly satellite aerosol observations and the difficulty involved in making hourly PM2.5–AOD co-locations. To the best of our knowledge, few studies have considered the diurnal cycle in the data when investigating the PM2.5–AOD relationship.
Therefore, this study aimed at comprehensively investigating the spatiotemporal relationship between ground-level PM2.5 and satellite AOD in mainland China using the MAIAC 1 km aerosol product with multi-scale analyses in space and time as well as an emphasis on the difference in the spatial variation and temporal trend against previous relationships dependent on coarse-resolution data. We carried out correlation analyses, measured by the Pearson correlation coefficient and the slope of the linear regression, to explore the PM2.5–AOD relationship at 1500 monitoring stations, in more than 360 cities and 11 urban agglomerations, by taking the latent impact of the diurnal variation in aerosol particles, relative humidity (RH), the planetary boundary layer height (PBLH) and elevation into account. In addition to monthly variation, seasonality and the annual pattern, real-time ground aerosol observations were also employed in this study to uncover the diurnal variability and its impact on the PM2.5–AOD relationship using hourly comparisons during a day when Terra and Aqua data were available. The remainder of this study is organized as follows: descriptions of the data used, including the ground-level PM2.5 measurements, the MAIAC AOD, RH, the PBLH and elevation in China, are given in Sect. 2. The results of the correlation and the linear slope analyses, with respect to the PM2.5–AOD relationship and its impact factors, are presented in Sect. 3 and are discussed in Sect. 4. The major conclusions are summarized in Sect. 5.
2.1 Study area and urban agglomerations
The study area is mainland China (excluding Taiwan, Hong Kong and Macau), covering more than 360 cities and 11 urban agglomerations. The 11 urban agglomerations include five national urban agglomerations, i.e., Beijing–Tianjin–Hebei (BTH), Yangtze River Delta (YRD), Pearl River Delta (PRD), Triangle of Central China (TCC) and Chengdu–Chongqing (CDCQ), and six regional urban agglomerations, i.e., central and southern Liaoning (CSL), Shandong Peninsula (SDP), Harbin–Changchun (HC), Central Plain (CP), Guanzhong Plain (GZP) and northern Tianshan (NTS). According to the “National New-type Urbanization Plan (2014–2020)” (http://www.gov.cn/zhengce/2014-03/16/content_2640075.htm; last access: 10 November 2021), these agglomerations are densely populated and have relatively well-developed urban systems. The locations of these agglomerations and the associated cities are detailed in Fig. S1 in the Supplement.
2.2 Data collection and preprocessing
Hourly ground-level PM2.5 measurements from ∼ 1500 monitoring stations for 2019 were collected from the official website of the Ministry of Ecology and Environment of China (https://www.mee.gov.cn, last access: 10 November 2021). These observed PM2.5 mass concentrations are measured using the tapered-element oscillating microbalance or beta-attenuation method with quality control (National Ambient Air Quality Standards, GB3095-2012; http://english.mee.gov.cn/Resources/standards/Air_Environment/quality_standard1/201605/t20160511_337502.shtml, last access: 10 November 2021). Hourly concentrations < 1 µg m−3 were discarded, as they are below the monitors' measurement limit. Daily PM2.5 values were averaged from hourly concentrations for the period from 00:00 to 23:00 LT (local time), and days with at least 75 % valid hourly observations were kept for statistical analyses.
The MODIS 1 km AOD data archived in Collection 6, derived using the MAIAC algorithm over China in 2019, were used in this study. This new aerosol dataset not only represents aerosol retrievals at a high spatial resolution (Chudnovsky et al., 2013; Lyapustin et al., 2018) but also achieves a comparable accuracy to the previous popular coarse-resolution AOD product (Zhang et al., 2019; N. Liu et al., 2019; Martins et al., 2017), making it possible to detect local aerosol variability. Both Terra (overpass time of 10:30 LT) and Aqua (crossover time of 13:30 LT) MAIAC AOD data were downloaded from the NASA Level-1 and Atmosphere Archive and Distribution System (LAADS) Distributed Active Archive Center (DAAC). To investigate the aerosol diurnal variation, ground-level AOD observations from the Version 3.0 Aerosol Robotic Network (AERONET) dataset with assured quality (Level 2.0) were obtained.
Meteorological variables including the RH, PBLH and terrain were used for impact factor analysis. RH data were obtained from the China Meteorological Data Service Center (http://data.cma.cn/, last access: 10 November 2021), and PBLH data were downloaded from the reanalysis dataset provided by the European Centre for Medium-Range Weather Forecasts (ECMWF, https://www.ecmwf.int/, last access: 10 November 2021). The Advanced Spaceborne Thermal Emission and Reflection Radiometer (ASTER) global digital elevation model (GDEM) was used to measure the terrain in terms of elevation.
2.3 Data co-location and analytical methods
According to previous studies, such as N. Liu et al. (2019), the MAIAC AOD data also confront the missing data problem due to their coarse spatial resolution. To tackle this issue and improve the number of daily co-locations with ground PM2.5 measurements, an imputation method was conducted to fill the missing AOD values for one satellite when the other was available, and the improved AOD data served as the daily mean AOD for the co-location with daily PM2.5 averages. The imputation method was similar to our previous studies (He et al., 2020, 2019): a relationship was constructed between Terra and Aqua retrievals for each observation day, and the obtained coefficients were applied to predict the missing values. In addition, hourly co-location was also accomplished to support the hourly analyses in this study, which directly co-located the hourly PM2.5 measurements at each observational site with the Aqua/Terra AOD retrievals within the hour of the satellite's overpass. All of the daily and hourly co-locations required that the ground-level monitors spatially fell into the 1 km AOD grid cell. That is, we used the 1 km AOD grid to match the in situ PM2.5 measurements and averaged those PM2.5 observations from multiple monitors located within a 1 km grid cell.
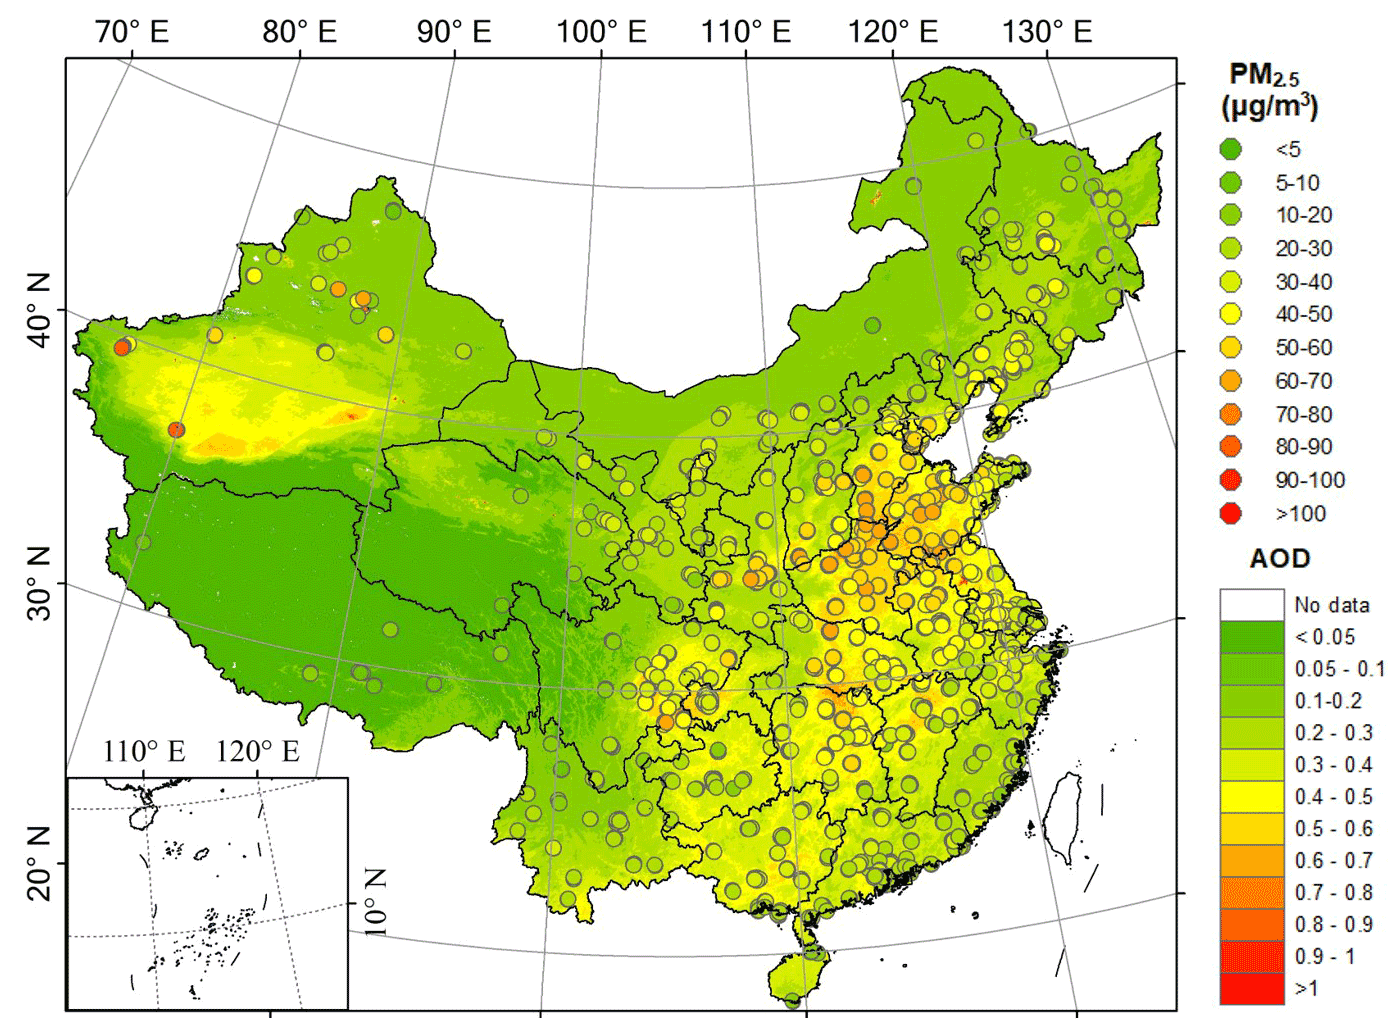
Figure 1The spatial distribution of annual mean ground-level PM2.5 and satellite AOD averages in China in 2019. The mean value of the ground-level PM2.5 concentration was calculated from all measured days, covering almost the whole study period, whereas the mean AOD value was calculated using fewer days because the MAIAC algorithm could not make retrievals over areas with high cloud cover.
The coefficient of variation (CV), defined as the ratio of the standard deviation to the mean, which is used to measure the dispersion of data points around the mean, allows us to compare the degree of difference between ground PM2.5 and columnar AOD. The relationship between ground PM2.5 and satellite AOD was quantified using the Pearson correlation coefficient (r). The linear regression model was applied using AOD as an independent variable and PM2.5 a dependent variable. The estimated slopes of the linear models were used for the statistical analysis.
To examine the impact of hygroscopicity the and vertical structure of aerosols on the PM2.5–AOD relationship, an RH correction and a vertical correction were applied to obtain respective RH-corrected PM2.5 and PBLH-corrected AOD for the subsequent correlation analyses. Following previous studies (Kong et al., 2016; Wang et al., 2014), the respective RH-corrected PM2.5 and PBLH-corrected AOD were calculated as follows:
where corrected PM2.5 (µg m−3) represents PM2.5 corrected by relative humidity (PM2.5 is the daily mean PM2.5 concentration measured by the ground-level air quality network), RH stands for relative humidity (ranging from 0 to 100), and corrected AOD (m−1) represents AOD corrected by the PBLH (planetary boundary layer height, in meters).
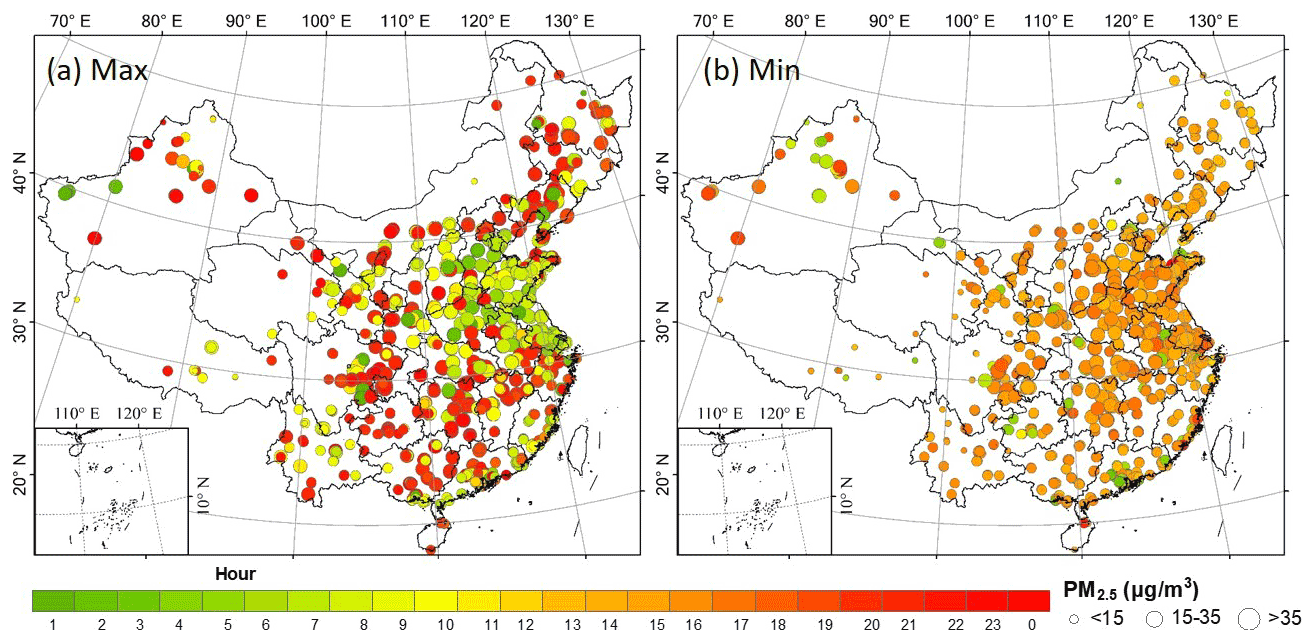
Figure 2Spatial distribution of diurnal PM2.5 averaged over the 2019 period according to the (a) maximum and (b) minimum mean PM2.5 concentration over 24 h. The solid color and the size of the circle denote the hour with the maximum and minimum diurnal mean concentration and the corresponding concentration value over each monitoring station, respectively.
3.1 Characteristics of the variation in surface PM2.5 and satellite AOD
Figure 1 illustrates the annual mean PM2.5 from in situ data and AOD from all of the satellite-observed grid cells throughout mainland China in 2019. The typical hot spot polluted by fine particles could be identified in the North China Plain (NCP), in particular in the southeastern Hebei, western Shandong and northern Henan provinces, where the peak PM2.5 concentration can reach 55 µg m−3 or even higher. It is noted that southern and western Xinjiang, the margin of the Taklimakan Desert, had a very high annual concentration exceeding 75 µg m−3, and this area is highlighted as a PM2.5 pollution center. In general, the MAIAC AOD shared a similar spatial pattern to PM2.5. That is, areas with high AOD values congruously correspond to those with high PM2.5 concentrations except for the typical mismatch in southwestern China. For example, higher mean AOD values of 0.5–0.8 are found in the Chengdu–Chongqing (CDCQ) agglomeration, which had AOD values as high as those in the NCP, contrary to the relatively low mean PM2.5 concentration of 38.93 µg m−3 (mean concentration for the NCP was 49.32 µg m−3).
Figure S3 in the Supplement shows the temporal profile of PM2.5 and AOD for the entire country in 2019. The national PM2.5 mean was 38.53 µg m−3, and the annual mean AOD was 0.22. The monthly changes in the two indicators show a different temporal pattern. The monthly PM2.5 concentration shows a U-shaped trend, which remained low and stable between June and August, and the monthly concentration in the summer months was almost a third of those in winter months. Compared with winter, summer is generally associated with lower anthropogenic air pollutant emissions (e.g., reduced coal and biomass burning for heating during summer) and favorable meteorological conditions for pollution dispersion (e.g., enhanced convection and more precipitation during summer) (Zhang and Cao, 2015), which may account for the summertime minimum. This result is consistent with the findings reported in previous research (X. Yang et al., 2018). In contrast, the monthly AOD variation shows a rough inverse U-shaped curve with a plateau between March and August. The amplitude of monthly AOD variation was also less than that of PM2.5: the maximum AOD level of 0.28 occurred in March, which was 0.1 (∼ 35.42 %) higher than the AOD level in the lowest month (November). This further demonstrates the difference between ground-level PM2.5 and satellite AOD observations in Fig. 1.
The diurnal characteristics of PM2.5 variations in China in 2019 were investigated. In general, the national maximum PM2.5 diurnal mean concentration occurred in the morning and evening, whereas the minimum mean values appeared in afternoon (Fig. S4 in the Supplement), which is generally consistent with the diurnal pattern revealed in previous studies (Guo et al., 2017). The two peaks that appeared in the overall diurnal PM2.5 curves were linked to PM2.5 spatial variation. Figure 2 shows the spatial distribution of the hours when the maximum and minimum PM2.5 concentration occurred as well as the corresponding concentration value. Among the 1494 monitoring stations, the largest diurnal PM2.5 concentration appeared in the evening (19:00–23:00 LT) at 638 sites (∼ 42.70 %), 567 sites (∼ 37.95 %) displayed a maximum concentration in morning (07:00–11:00 LT), 50 sites (∼ 3.35 %) reached a maximum in the afternoon (12:00–18:00 LT) and the remaining 239 sites (∼ 16.00 %) had their maximum after midnight (00:00–06:00 LT). To be more specific, significant spatial variability was found in the highest diurnal PM2.5 concentration. The morning PM2.5 peak generally occurred in the NCP, whereas the evening maximum prevailed in southern and northeastern China where an afternoon PM2.5 maximum also sporadically appeared. Furthermore, the highest diurnal mean concentration in the morning peak (mean of 46.60 µg m−3) was generally greater than that in the evening (mean of 42.24 µg m−3). Among the 413 sites in the NCP, there were more than 94 % sites with concentrations exceeding 35 µg m−3, pinpointing the serious PM2.5-pollution risk in the NCP region. We note that there was almost no spatial difference in the minimum hourly mean concentration, which uniformly appeared between 14:00 and 17:00 LT.
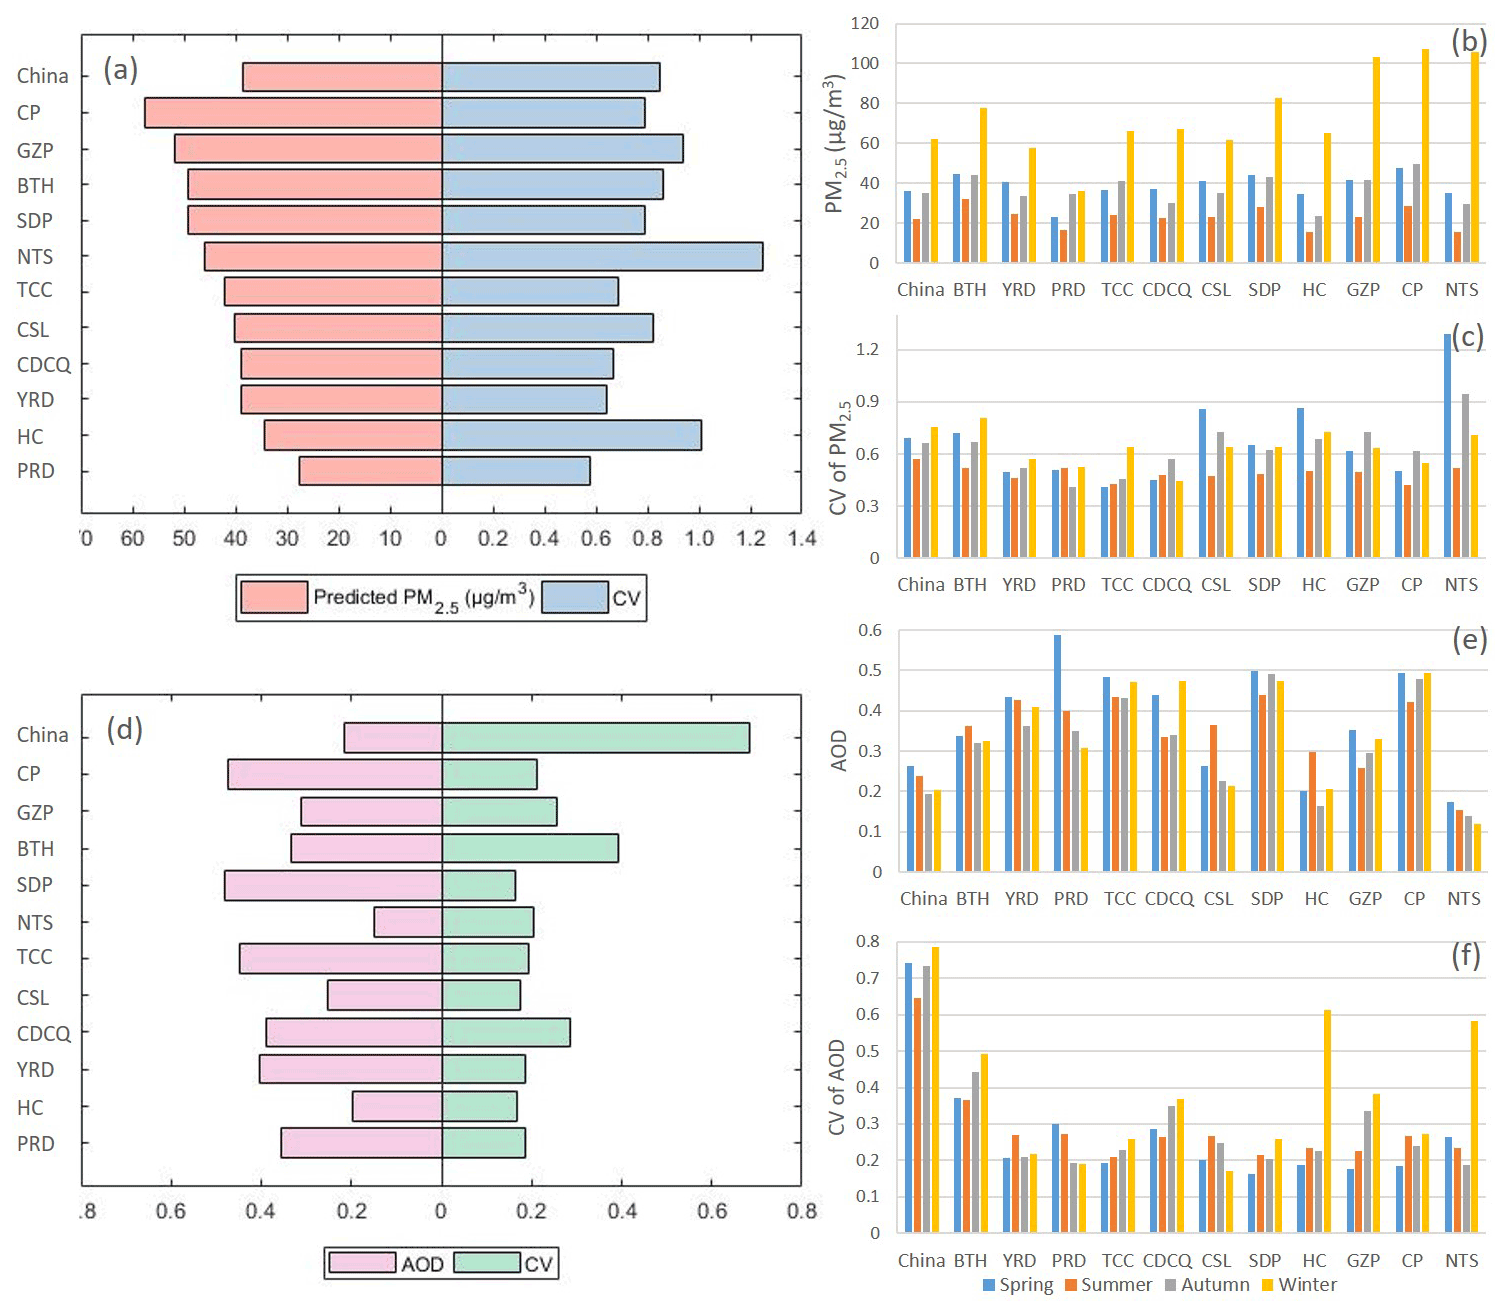
Figure 3Regional mean values and coefficient of variation (CV) values for PM2.5 and AOD in 2019. Panel (a) shows the mean PM2.5 and its CV for 11 urban agglomerations for the whole study period, and panels (b) and (c) show the mean PM2.5 and the CV values for each respective season. Panel (d) shows the mean AOD and its CV in regions for the whole year, and panels (e) and (f) show the mean AOD and the CV values in each respective season.
The CV analysis was conducted based on temporally averaged PM2.5 and AOD values to evaluate the spatial variation of aerosol particles over a given region. As shown in Fig. 3a, the ambient PM2.5 concentration in 2019 over the CP region was the highest (multiyear mean value of 57.69 µg m−3) and was associated with moderate spatial variability (CV of 0.79), suggesting that the CP region was the most polluted of the 11 urban agglomerations and that the majority of cities within this area were exposed to very dangerous PM2.5 levels. In contrast, with the lowest PM2.5 concentration (27.43 µg m−3) and the smallest CV value (0.58), almost all PRD cities experienced relatively clean ambient air. The PM2.5 concentration in the NTS urban agglomeration remained at a moderate level (45.96 µg m−3), but the CV value was the largest (CV = 1.25), implying a distinct contrast in air quality between cities in the region. Figure 3 also presents a different regional pattern in both mean AOD and CV values.
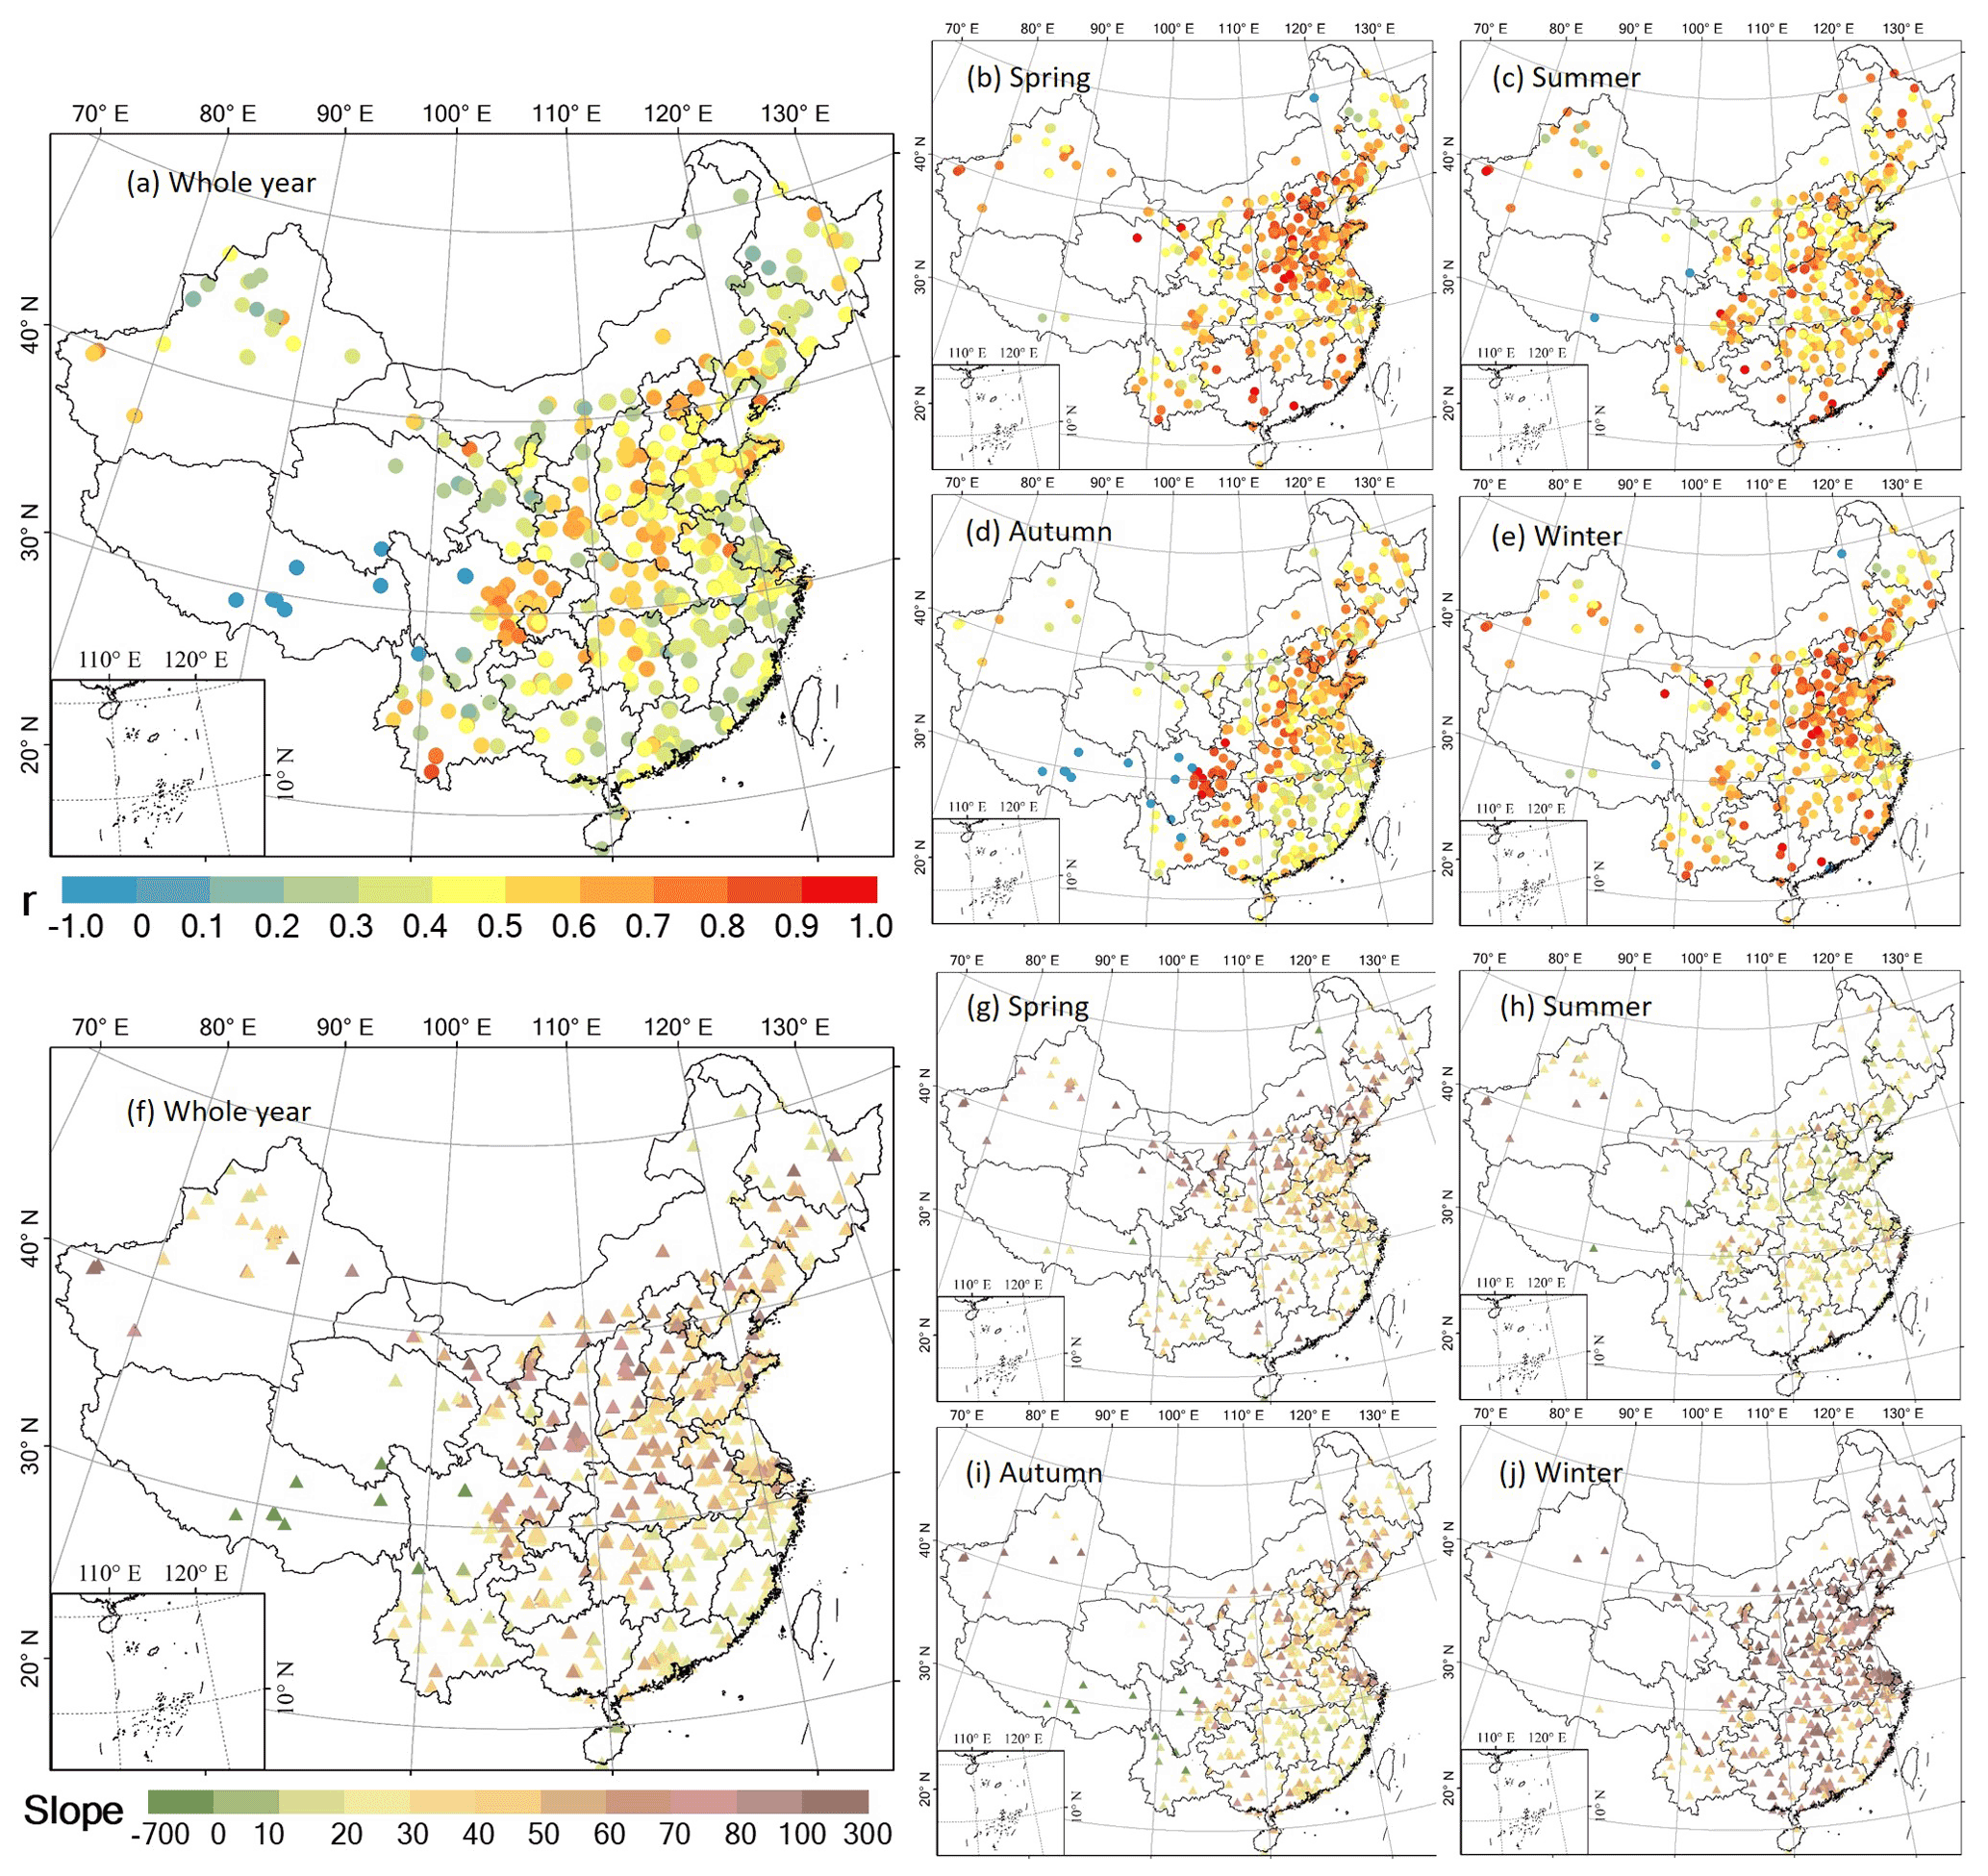
Figure 4Spatial distributions of the relationship between ambient PM2.5 and satellite AOD pairs over China in 2019. Panel (a) shows the correlation coefficient for the whole year, and panels (b)–(e) show the correlation coefficients for each respective season. Panels (f)–(j) are based on the slope values of the linear regression model. Please note that only statistically significant results, i.e., p level < 0.05, are presented here.
3.2 Spatiotemporal variability in the PM2.5–AOD relationship
Figure 4 presents the spatial distribution of the correlation coefficients (Fig. 4a–e) and linear trend (Fig. 4f–j) between the daily mean PM2.5 concentration and AOD for the entire study period and for the four respective seasons over all monitoring sites. With correlation coefficient (r) values ranging from −0.5 to −0.18, abnormal negative associations between PM2.5 and AOD were observed in the Tibetan Plateau (TP), where the altitudes are almost higher than 4000 m. In addition to the TP, the correlation coefficient for each monitoring site ranged from 0.15 to 0.84. In general, the stronger correlations (r > 0.4) were mostly concentrated in northern and eastern China, whereas r values for most observational sites dropped below 0.4 in southern areas.
Particularly, the Sichuan Basin (SCB) was highlighted as showing the strongest correlation (r > 0.6) in Fig. 4a, whereas very low correlations (r < 0.3) were found in northern Xinjiang and northern central China. Figure 4b–e exhibits a distinct seasonal variability in the PM2.5–AOD relationship, even though the spatial pattern in each season is generally similar to that shown by all data pairs in Fig. 4a. The overall correlation coefficient in winter was relatively higher, with an overall r value of 0.61, which demonstrates that the light extinction in the atmosphere in wintertime may be mainly caused by fine particles near the surface, followed by spring (0.57) and then autumn (0.55). The r value was the lowest in summer (0.47). The distribution of correlations along with various PM2.5 levels may account for the seasonal difference. As shown in Fig. S5 in the Supplement, correlations between PM2.5 and AOD were the strongest at extremely high PM2.5 concentration levels; coincidentally, higher PM2.5 concentrations typically occurred in winter, leading to a better PM2.5–AOD relationship in this season. Furthermore, the seasonal variation was probably related to the lower RH in winter and the unstable atmospheric conditions in summer.
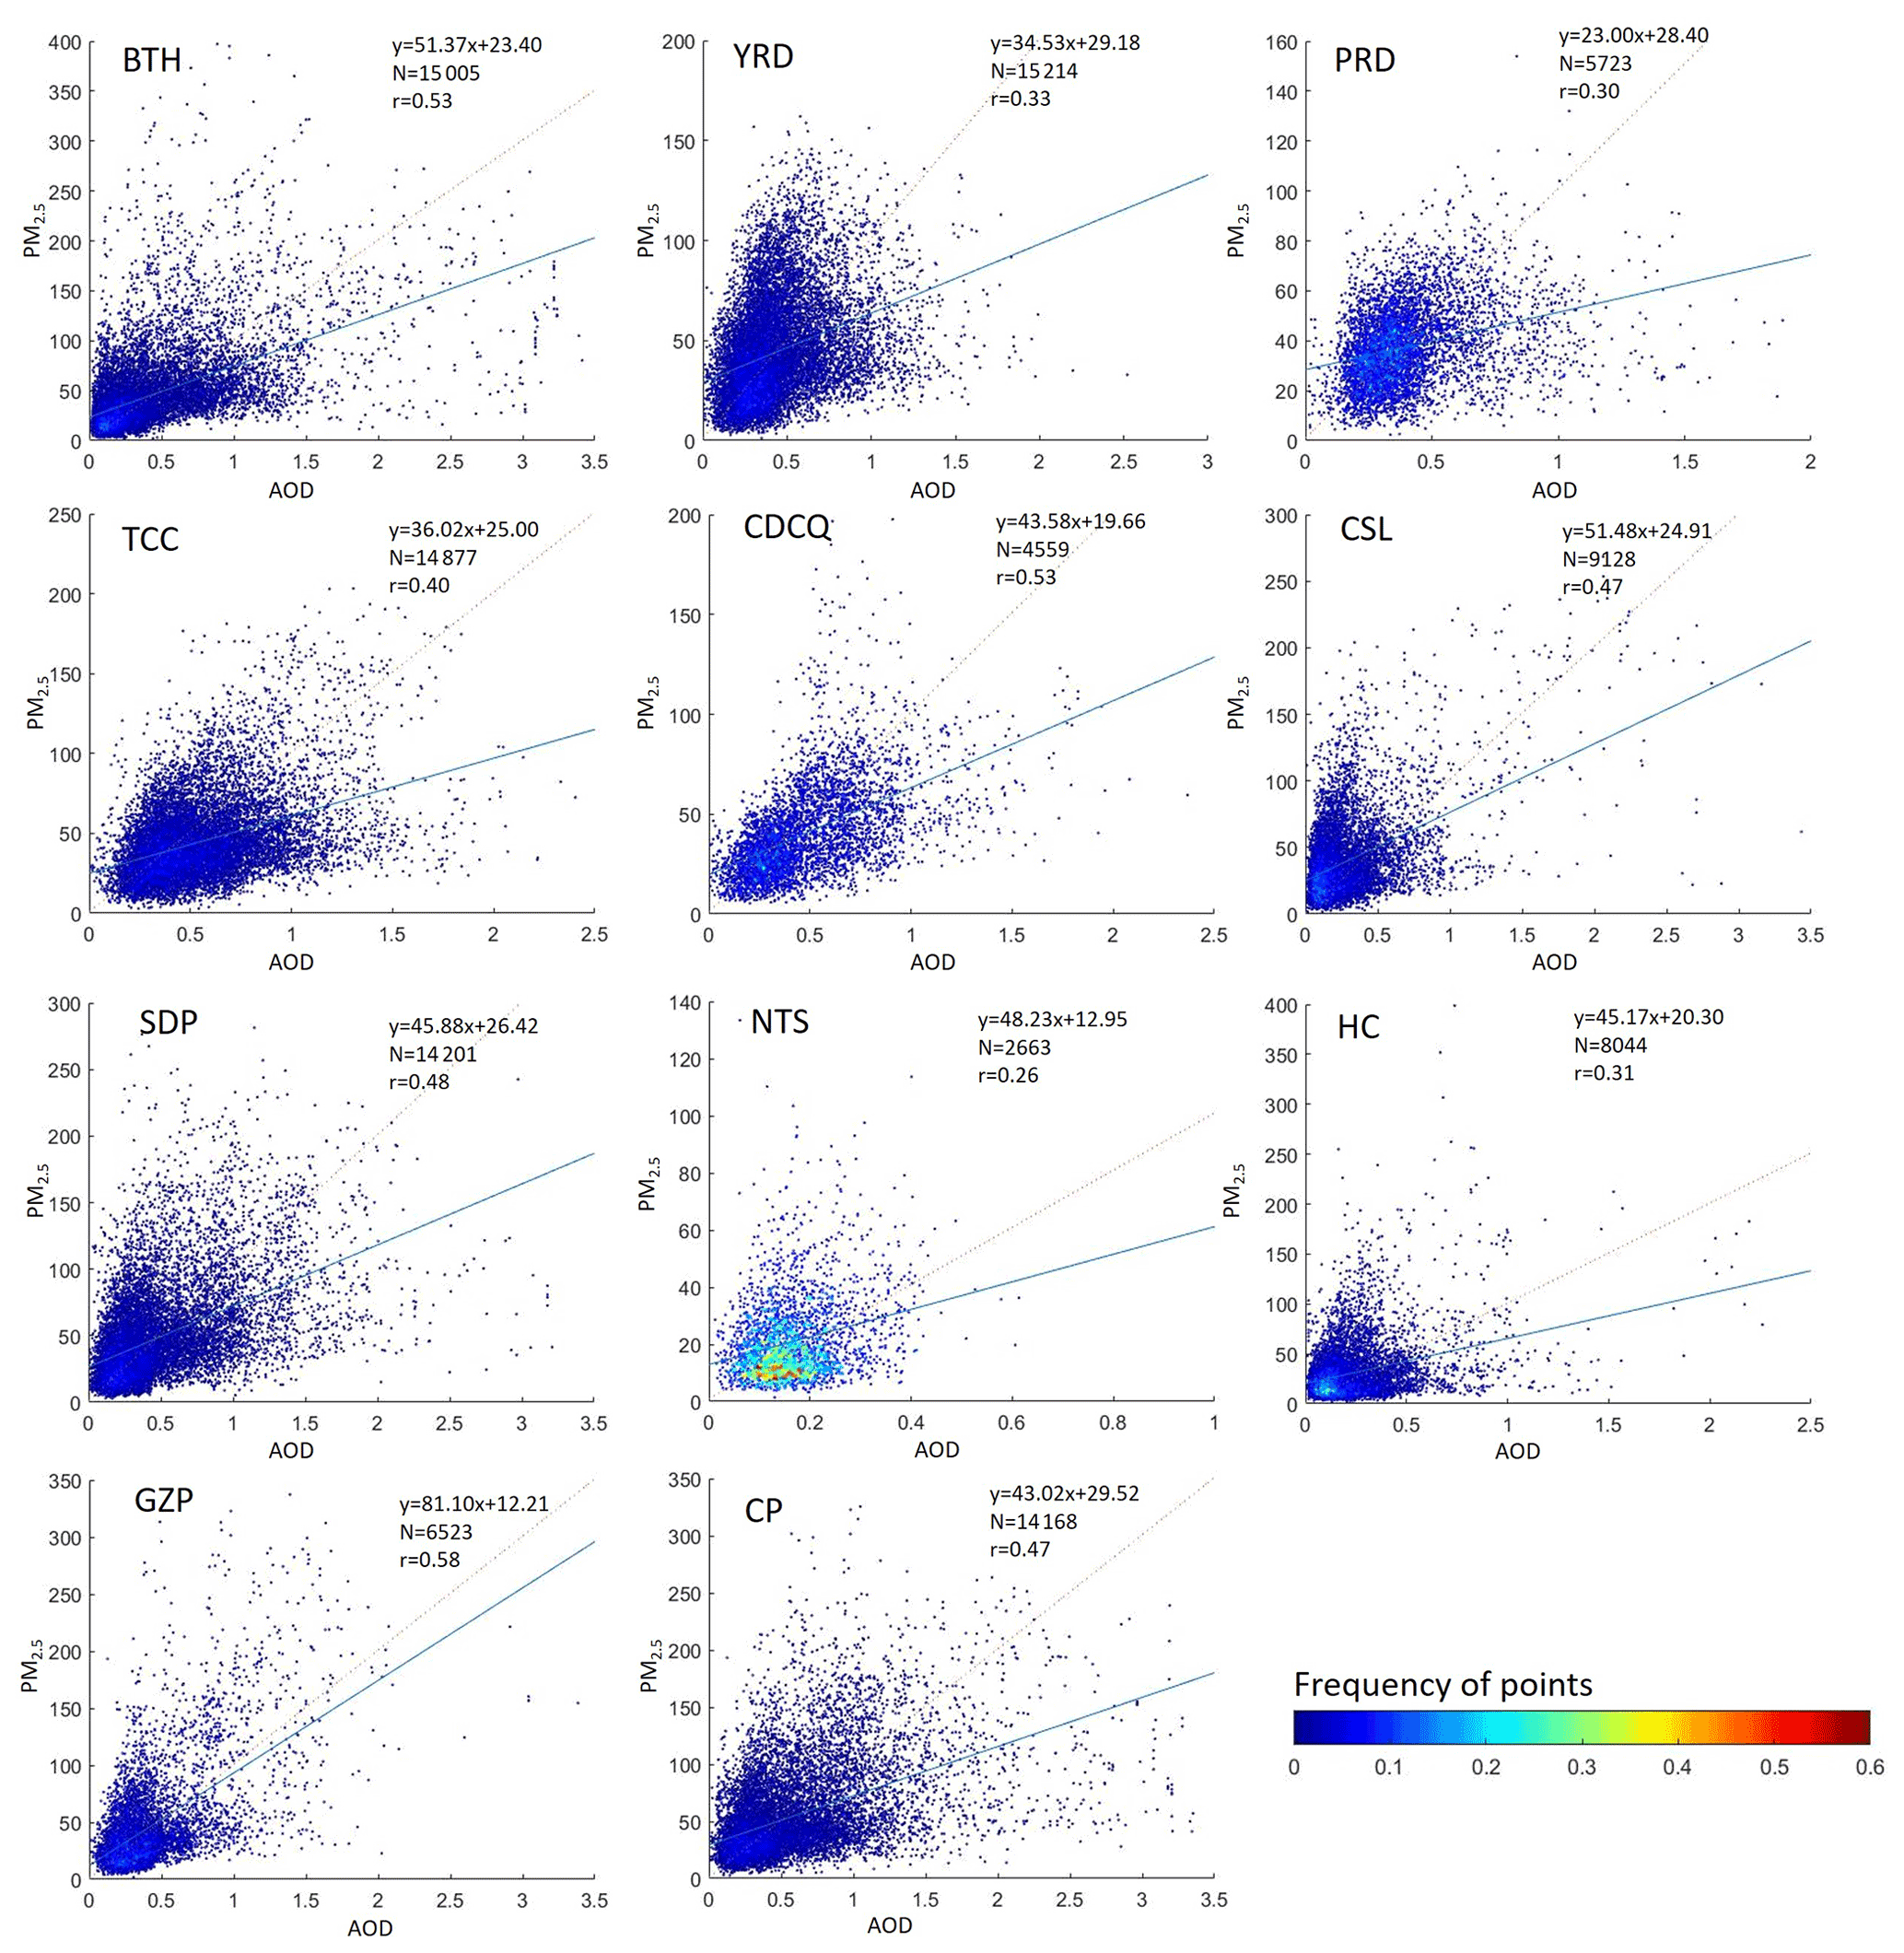
Figure 5Scatterplots for the paired PM2.5 concentration (µg m−3) and satellite AOD values over the 11 urban agglomerations in China including Beijing–Tianjin–Hebei (BTH), Yangtze River Delta (YRD), Pearl River Delta (PRD), Triangle of Central China (TCC), Chengdu–Chongqing (CDCQ), central and southern Liaoning (CSL), Shandong Peninsula (SDP), Harbin–Changchun (HC), Central Plain (CP), Guanzhong Plain (GZP) and northern Tianshan (NTS). The solid line represents the linear trend.
Figure 4f–j shows the spatial distribution of the slopes (S) of the linear regressions between daily PM2.5 and AOD for each monitoring site. Corresponding to the correlation analysis in Fig. 4a–e, the slope values in the TP were also negative; for the other areas over mainland China, the slopes of linear regressions ranged from 9.37 to 158.45 over the entire observation period (Fig. 4f) with significant spatial and seasonal variability (Fig. 4g–j).
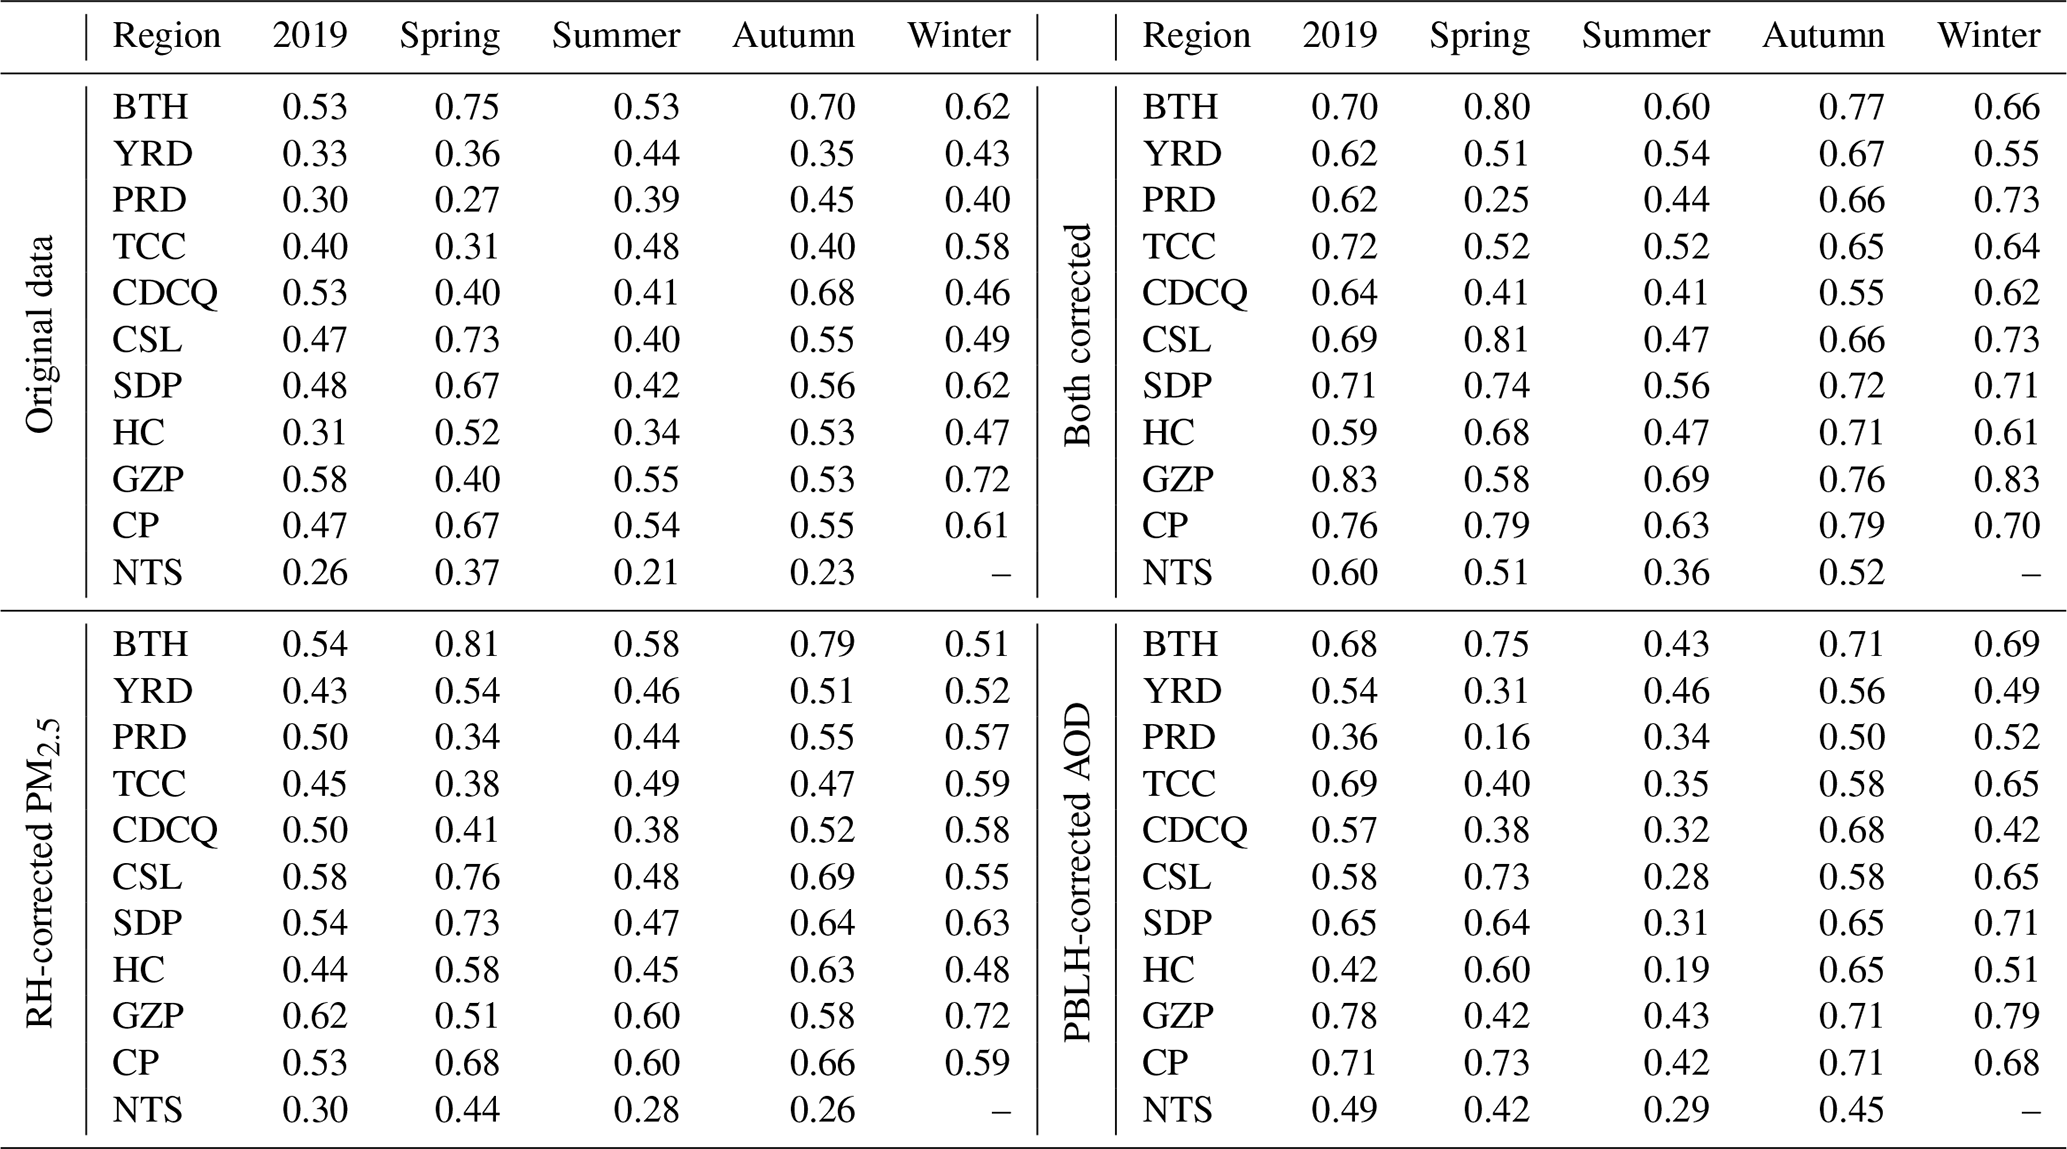
Table 1Correlation coefficients between (RH-corrected) PM2.5 and (PBLH-corrected) AOD over various urban agglomerations in China during the study period, including Beijing–Tianjin–Hebei (BTH), Yangtze River Delta (YRD), Pearl River Delta (PRD), Triangle of Central China (TCC), Chengdu–Chongqing (CDCQ), central and southern Liaoning (CSL), Shandong Peninsula (SDP), Harbin–Changchun (HC), Central Plain (CP), Guanzhong Plain (GZP) and northern Tianshan (NTS).
To better represent the spatiotemporal features, correlation analyses between ground-level PM2.5 and satellite AOD were conducted for all of the monitoring stations (Fig. 4) as well as at the urban-agglomeration scale (Fig. 5). In general, the PM2.5–AOD relationships at the regional scale mirrored those at the observational-site scale. In terms of the correlation coefficient, higher values were found in urban agglomerations located in northern and eastern China, such as the GZP, BTH and CDCQ agglomerations which had r values greater than 0.50; the weakest relationship (r of 0.26) occurred in the NTS agglomeration. As for the slope of the regression function, the maximum slope (81.10) was observed in the GZP region, followed by the CSL (51.48) and BTH (51.37) agglomerations; the lowest value was observed in the PRD urban agglomeration with a slope of 23.00.
Figure S7 in the Supplement demonstrates that the spatial distribution of the PM2.5–AOD correlations during the study period using Terra and Aqua AOD matched with PM2.5 measurements at the respective overpass hour. It is intriguing that correlations for almost all monitoring sites at 14:00 LT were greater than those at 11:00 LT, and the overall correlation at 14:00 LT was 0.54, which was also obviously higher than that of 0.47 at 11:00 LT. To determine whether the difference is caused by aerosol retrieval accuracy from Terra (i.e., at 11:00 LT) and Aqua (i.e., at 14:00 LT), we conducted a comparison analysis using hourly ground PM2.5 and the spatiotemporally co-located AERONET AOD observations. Figure S8 in the Supplement indicates that the diurnal correlations between ambient PM2.5 and AERONET AOD were also larger in afternoon.
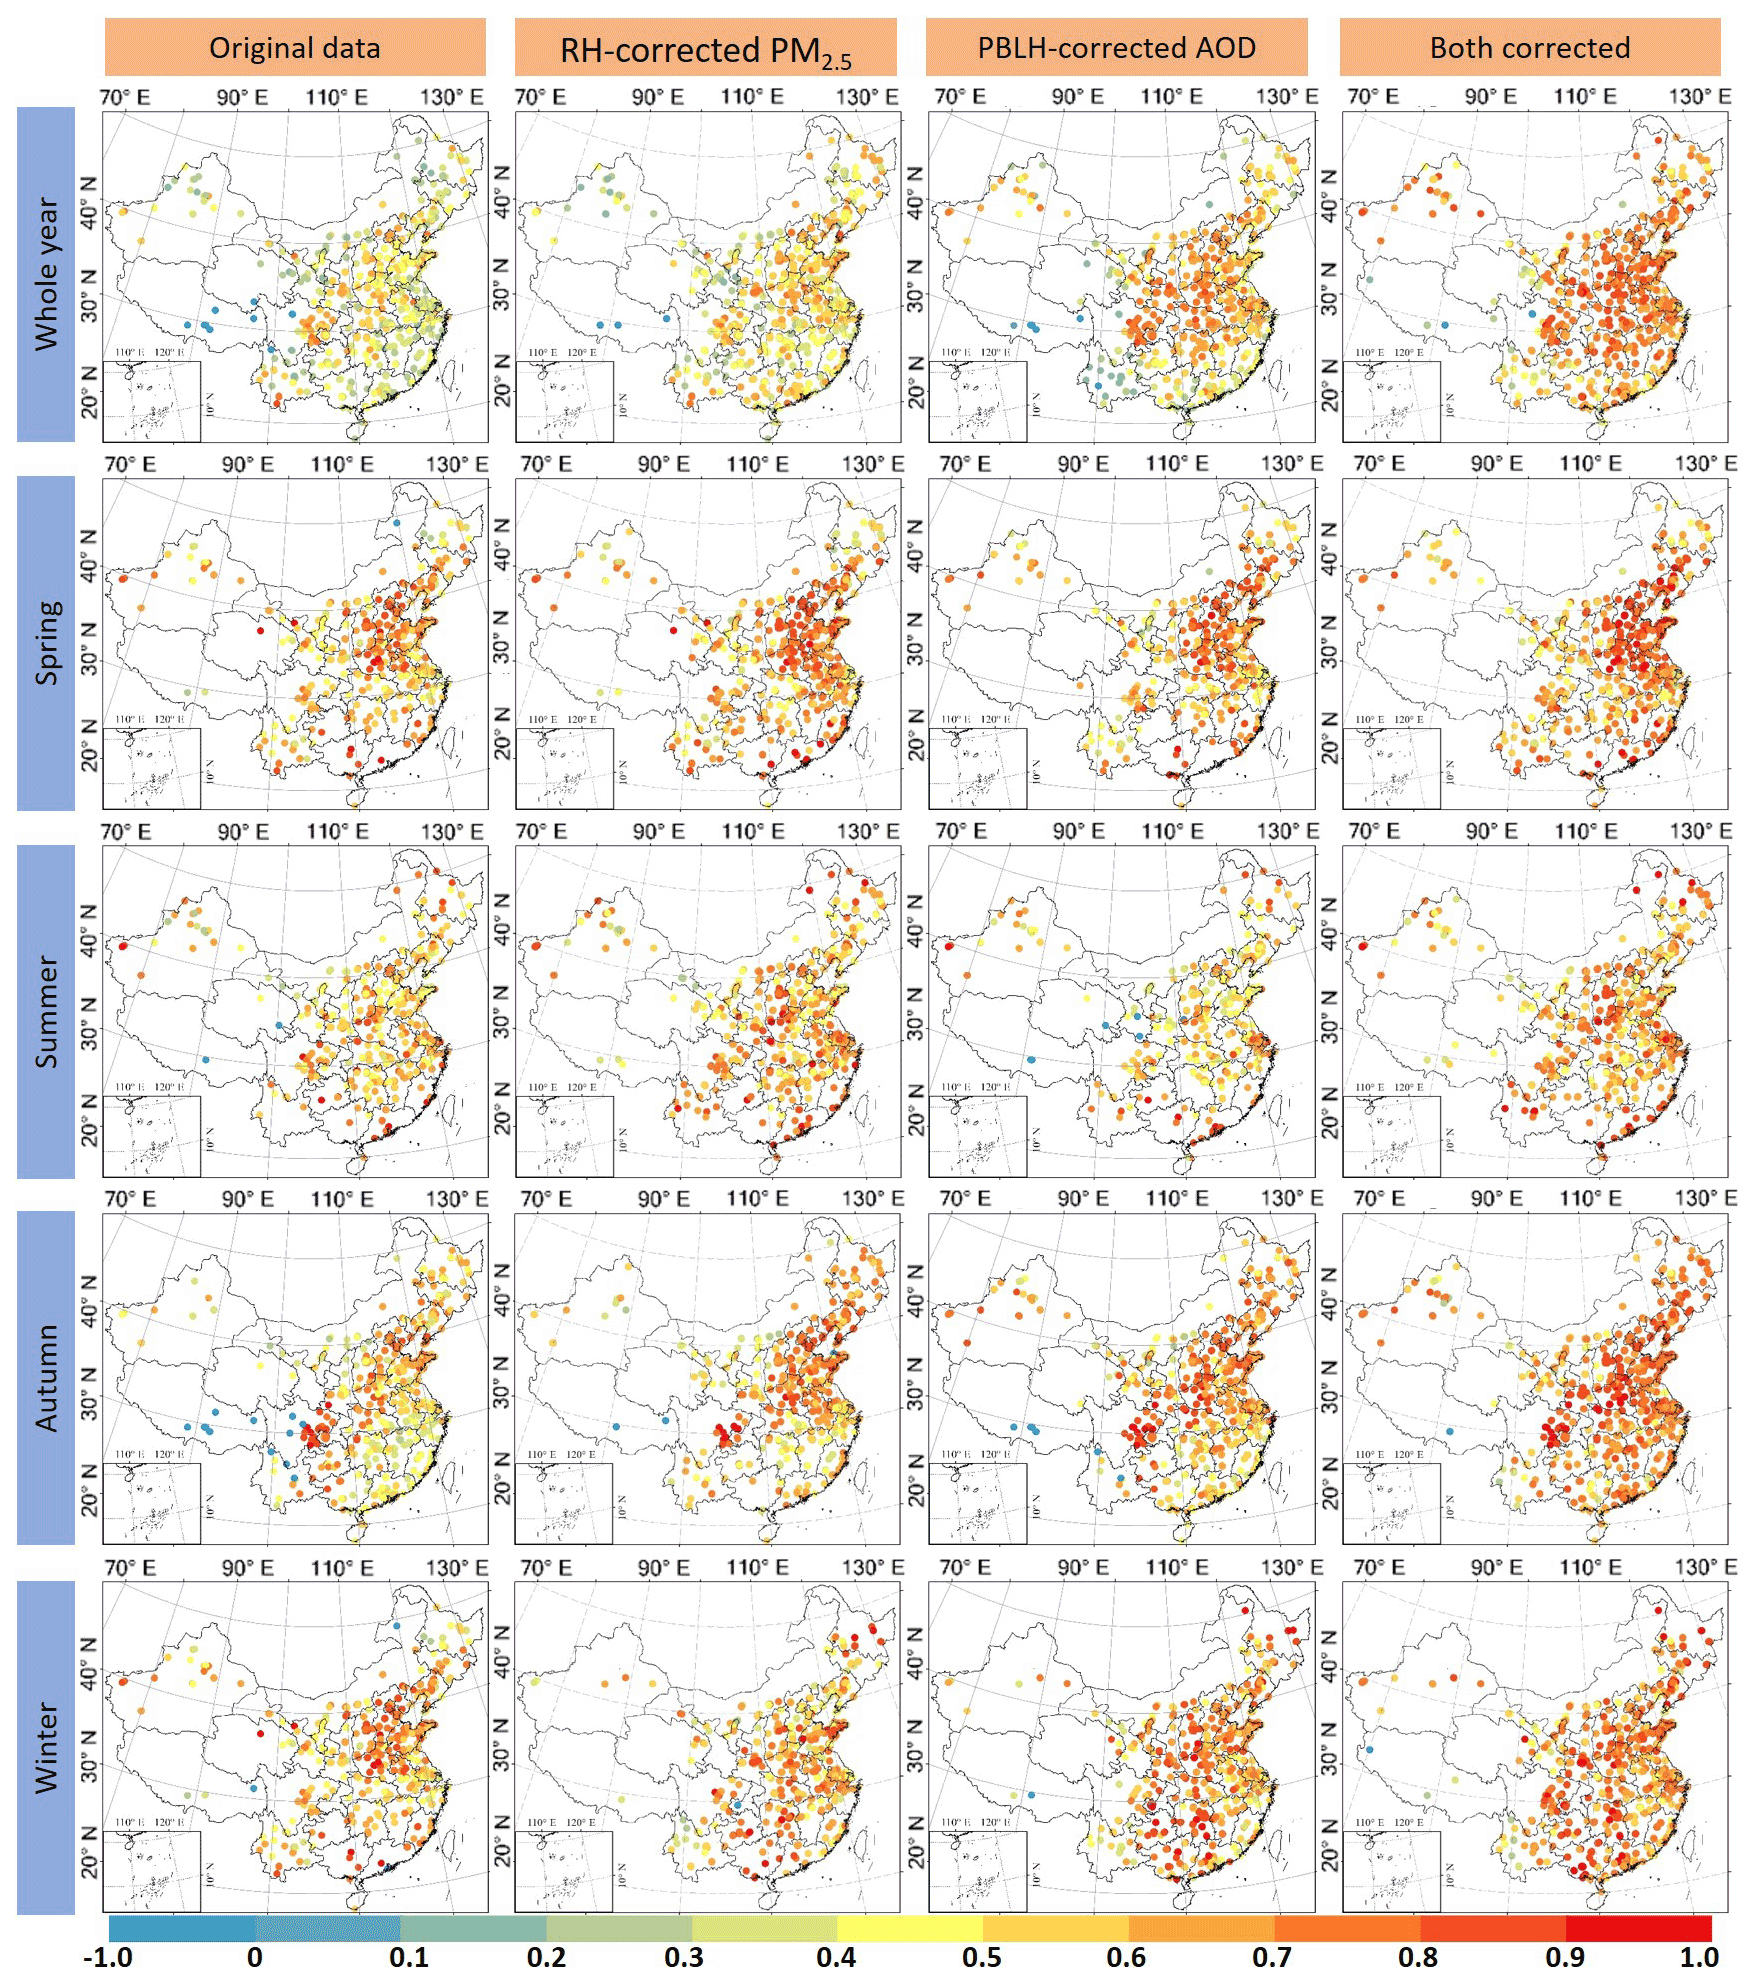
Figure 6The relationship between PM2.5 and AOD in China for the entire year 2019 and for each respective season based on the original PM2.5 and AOD observations (left column), only PM2.5 corrected by RH (middle left column), only AOD corrected by the PBLH (middle right column) and both corrected data (right column). Please note that only stations with statistically significant results (i.e., p level < 0.5) are presented in this figure.
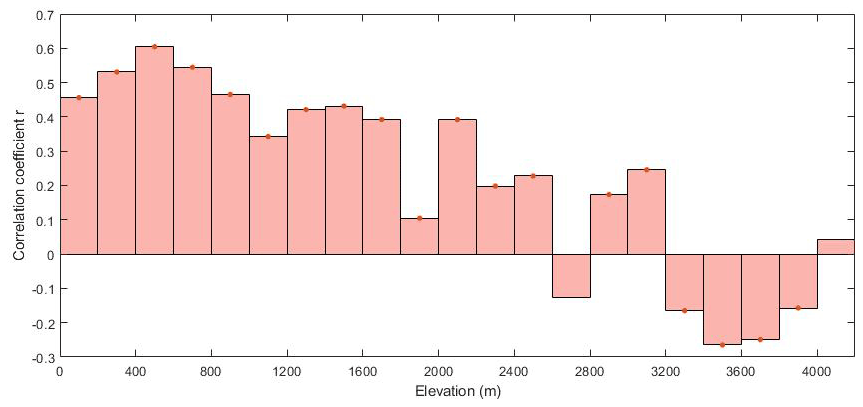
Figure 7Correlation coefficients of PM2.5–AOD pairs plotted against binned elevations. Note that the red asterisk indicates the statistically significant level at p < 0.05.
3.3 Influence of meteorology on the PM2.5–AOD correlation
To examine the spatiotemporal effect of the RH and PBLH on the daily PM2.5–AOD relationship, we conducted a correlation analyses using RH-corrected PM2.5 data and PBLH-corrected AOD data for monitoring sites (Fig. 6) and for the 11 agglomerations (Table 1). The details of the correction method for PM2.5 and AOD are provided in Sect. 2.3. In general, after correction by the RH and PBLH (Fig. 6), the mean correlation coefficient (r) reached 0.71, and the r values at ∼ 16 % of sites increased to >0.80, which presented a notable improvement in the PM2.5–AOD relationship compared with those based on uncorrected data (mean r = 0.44 and 0.25 % of sites with r >0.80). For individual observational sites, ∼ 96 % of monitoring sites had enhanced PM2.5–AOD correlations after both corrections, increasing by 0.01–0.61. The correlation after RH correction slightly increased by an average of ∼ 0.07, and the vertical correction achieved a better improvement in the PM2.5–AOD relationship than the former, which contributed to the average r increase of ∼ 0.18. Specifically, ∼ 22 % of monitoring sites, primarily located in the Guangdong, Guangxi, Yunnan and Heilongjiang provinces, had larger r values after RH correction than vertical correction. These results indicate that the spatial difference in the influence of the RH and vertical correction on the relationship between PM2.5 and AOD cannot be ignored due to the significant impact of these parameters on the relationship at most monitoring sites. It should be noted that there was an obvious negative increment after both corrections, in particular at most monitoring stations in Yunnan Province.
There was also significant seasonal discrepancy with respect the improvement of the PM2.5–AOD relationship due to meteorological effects. As shown in the seasonal patterns in Fig. 6, after both corrections were carried out, the correlations had the largest improvement in autumn (the mean r value increased by 0.21), followed by spring (0.11) and winter (0.10), and summer had the smallest improvement (an increase of 0.09). Specifically, in spring and autumn, both the RH and vertical corrections imposed a positive effect on the PM2.5–AOD correlation, although the strength of the effect was different. In spring, the RH correction had a greater contribution to improving the PM2.5–AOD correlation than the vertical correction, and the r value based on RH-corrected data was 0.02 larger at an average level. In autumn, the vertical correction exerted a more important influence than the RH correction, with a mean r value of 0.68 vs. 0.65. It should be noted that the correlation revised by the PBLH was lower than the original condition in summer, with the mean r value decreasing by 0.05, especially for monitoring stations in central China, such as the Jiangxi, Shaanxi and Henan provinces, where significant decreases in r values (changes of < −0.15) occurred.
Table 1 illustrates the statistics of the PM2.5–AOD relationship based on both corrected and uncorrected data over the 11 urban agglomerations. It follows that there are also obvious spatial and seasonal discrepancies in the influence of humidity and the vertical distribution on the regional PM2.5–AOD association. In summer, the correlation coefficient (r) of AOD, vertically revised by the PBLH, and ground-based PM2.5 showed a significant decrease over the original relationship, except for in the NTS and YRD regions. Despite a generally weak relationship in the NTS region, PBLH-corrected AOD showed a superior relationship with surface PM2.5 observations compared with the original correlation, not only in summer (0.29 vs. 0.21) but also in spring (0.42 vs. 0.37) and autumn (0.45 vs. 0.23).
3.4 Impact of terrain on the PM2.5–AOD correlation
The effect of topography on the PM2.5–AOD correlation analyses was investigated by separating the co-located samples into 21 elevation bins with an interval of 200 m. As shown in Fig. 7, a distinct trend and pattern can be identified between terrain and the PM2.5–AOD relationship. Corresponding to the abnormal negative relationship over Tibetan areas found in Fig. 4, the correlation coefficients between PM2.5 and AOD at a higher elevation, namely, greater than ∼ 3200 m, were also less than zero. The correlation peaked at 400–600 m with an r value of 0.60 and p < 0.05. These samples were then overlaid onto the spatial map of topography (Fig. S9 in the Supplement), and it was found that the maximum r values were primarily located in basin terrain such as the Sichuan Basin, the Shanxi–Shaanxi basins and the Junggar Basin.
Our results show a mismatch between satellite AOD values and ground-level PM2.5 concentrations, especially in southwestern China. The main cause of the PM2.5–AOD mismatch lies in the fundamental discrepancy in the physical concept. AOD is a unitless variable that denotes the total extinction induced by aerosols in the entire atmospheric column, whereas PM2.5 represents the mass concentration of fine aerosol particles measured at ground level. Another reason was likely the different available observations between the two metrics of aerosol loading: AOD derived from satellite only offered relatively fewer effective retrievals over this area due to cloud contamination (Fig. S2 in the Supplement), whereas surface PM2.5 observations have almost no such limitations. Consequently, the limited satellite AOD samples cannot fully represent the actual aerosol loading. If the missing AOD values are not filled in, excessive uncertainty will be induced to the subsequent PM2.5-related health research. Thus, particular attention should be paid to the mismatch between satellite AOD and ground PM2.5 caused by the number of observations.
We found that mean AOD and CV values had a different regional pattern. This result suggests that the SDP was uniformly polluted by aerosol particles throughout the atmosphere, as the largest mean AOD value (0.48) was observed in this region with the smallest CV value (0.16). In addition, the regional CV with respect to PM2.5 generally exhibited larger values than AOD, revealing that the extent of the spatial non-stationarity shown by PM2.5 was obviously stronger compared with AOD in each individual region. Notably, the national CV of AOD was remarkably larger than the regional values and contrarily higher than the PM2.5 CV, implying that the overall degree of spatial variability represented by ground-level PM2.5 measurements was weaker than that of satellite AOD at a national scale. This is probably due to the fact that the monitoring stations are only sparsely located in urban areas, whereas satellite AOD can cover almost the whole study domain. Thus, the PM2.5 measurements represent the pollution level at a particular location, whereas the satellite AOD interprets the average extinction level for a 1 km “area”. This further corroborates the mismatch between the PM2.5 and AOD patterns observed in Figs. 1 and S3.
With respect to the spatiotemporal variability in the PM2.5–AOD relationship, the TP shows abnormal negative associations between retrieved PM2.5 and AOD. According to Lyapustin et al. (2018), the MAIAC algorithm did not make reliable aerosol retrievals at very high elevations, and a fixed climatology value should be applied instead; thus, the PM2.5–AOD relationship over the TP contrasts with other areas. While we found a large spatial discrepancy in the correlation coefficient for each monitoring site, which was consistent with previous studies using MODIS DT aerosol data (Guo et al., 2017; Q. Yang et al., 2019), the relatively low r values (< 0.4) in southern areas were slightly different from previous studies (Guo et al., 2017). Based on the MODIS DT AOD dataset, Guo et al. (2017) reported that the correlation coefficients between PM2.5 and AOD in eastern China were apparently larger than those in the western China, as the DT algorithm had a larger uncertainty in the western arid and semiarid areas. Unlike the DT algorithm, which can only derive reliable AOD values over surfaces with low albedos, MAIAC could provide aerosol retrievals from both bright and dark targets. As shown in Fig. S2, the MAIAC aerosol product can provide more retrievals over the northern arid and semiarid areas than over southern China. Moreover, according to N. Liu et al. (2019), the accuracy of MAIAC AOD over unoccupied land, built-up areas and mixed regions was evidently better than that of DT. Hence, the abovementioned evidence results in relatively lower biases for the PM2.5–AOD relationship under these conditions and also partly accounts for the difference in the spatial pattern of the PM2.5–AOD association between the MAIAC and DT AOD products. In addition to the accuracy and data availability of aerosol retrieval algorithms, the natural condition, including climate and terrain, also had obvious influences on the relationship between PM2.5 and AOD. For example, compared with southern China, the RH in the north was generally lower, which contributed to the harmony in the PM2.5–AOD association in terms of the humidity conditions. In addition, the monsoon could cause aerosols to be unstable in the subtropical climate zone, which may weaken correlations in these areas.
It is obvious that spatial variation in the PM2.5–AOD correlation and the slopes of the linear regressions between daily PM2.5 and AOD for each monitoring site was observed in our results. The largest correlation in the SCB was most likely due to its bowl topography. The surrounding terrain is not favorable for pollutant dispersion and, thus, causes pollutant accumulation in the local environment (Ning et al., 2018, 2019, 2020). This explains the good agreement between ground-level PM2.5 and total column AOD. For the low correlation in northern central China, e.g., the Qinghai and Gansu provinces, MAIAC AOD retrievals were replaced by a mean value over a mesoscale area of 150 km (Lyapustin et al., 2018), which cannot resolve the 1 km aerosol variability found elsewhere and, thus, introduces additional biases into the correlation between PM2.5 and AOD, leading to incongruous associations between PM2.5 and AOD over these areas. Regarding the slopes of the linear regression between daily PM2.5 and AOD, a larger slope suggests less aerosol extinction. The higher S values in inland areas and during winter indicate that, under these circumstances, AOD was not very sensitive to PM2.5 change. This was probably attributed to the spatial discrepancy and seasonal variation under humid conditions. Due to increased hygroscopicity, the size of aerosol particles become larger than dry particles (Silva et al., 2015), which allows more light to be scattered in the context of higher RH, e.g., over coastal areas and during summer. In addition to humid conditions, the aerosol type was another reason to account for the spatial variability in the slope of the PM2.5–AOD relationship. Previous studies have reported that the regression function between the ambient PM2.5 concentration and AOD corresponds to the typical air masses over a specific region (Kong et al., 2016) and that the aerosol extinction property cannot be as sensitive in areas dominated by coarse-mode aerosols (Kong et al., 2016; Xin et al., 2014). As indicated by the spatial distribution of the mean Ångström exponent (AE or α) in Fig. S6 in the Supplement, aerosol particles with a larger size (smaller AE), such as dust, primarily dominated in northern areas over China, whereas fine-mode aerosols prevail in the south, thereby leading to a greater slope of the PM2.5–AOD relationship in northern China. It should be noted that the regional pattern of the PM2.5–AOD relationship was a little different from the pattern shown by individual monitors, as the regional association was an integration of observational sites within an urban agglomeration rather than a simple averaging of all sites within the region. Moreover, we found that most of the regional correlations based on MAIAC AOD in this study were closed to (and even slightly higher than) those by MODIS DT AOD in previous studies (Guo et al., 2017; Q. Yang et al., 2019). For example, the correlations over the BTH, PRD, SDP and CP regions were 0.55, 0.38, 0.42 and 0.39, respectively, whereas the corresponding correlations in this study were 0.53, 0.30, 0.48 and 0.47, respectively. This was because MAIAC AOD (1 km spatial resolution) had a refined spatial resolution compared with DT AOD (10 km), thereby reducing the variability in aerosol inside a grid cell co-located with the in situ measurements. The improved overall retrieval accuracy of the MAIAC algorithm (Zhang et al., 2019; N. Liu et al., 2019) may be another reason for the bias reduction in the correlation analysis for the PM2.5–AOD relationship. These findings suggest that the MAIAC AOD product is a better indicator of fine particle pollution than the MODIS coarse-resolution aerosol product.
We also found a significant effect of meteorology on the PM2.5–AOD correlation using Terra and Aqua AOD. A previous study evaluated the MAIAC retrieval performance of the Terra and Aqua AOD datasets against ground-level aerosol observations and found that AOD data from the two satellites presented a similar retrieval accuracy (Zhang et al., 2019). Thus, we deduced that the difference in the correlation between the two times (11:00 and 14:00 LT) was most likely due to the diurnal variability in climatology (e.g., the PBLH). The diurnal cycle of the PBLH was more likely one important factor leading to the noon and afternoon maximum. This is because a higher PBLH, which is often observed at noon and in the afternoon (Liu and Liang, 2010; Zhang et al., 2018), would definitely allow air pollutants to be mixed vertically such that the PM2.5–AOD relationship should be closer. At nighttime, the relative stable atmosphere may be favorable for the accumulation of aerosol particles near the ground surface; thus, the AOD values may not be able to reflect the ground-level aerosol concentration as well as they do during the daytime. Our results show a significant improvement in the PM2.5–AOD correlation after RH and vertical correction, suggesting the importance of applying the correction for the retrieval work. It should be noted that there was an obvious negative increment after both corrections, in particular at most monitoring stations in Yunnan Province. The poorer correlation may be attributed to the vertical correction, as the single correction for humidity can slightly enhance the PM2.5–AOD correlation, contributing to an increase of 0.01 in the r values on average, but the correlations revised by vertical data are remarkably reduced by 0.04–0.42 for individual sites. Due to the East Asian and Indian monsoons, extraneous aerosols such as smoke and dust transported from India, Burma and desert regions in northern China can form elevated aerosol layers in the Yunnan–Guizhou Plateau (Zhu et al., 2017; Liu et al., 2016), leading to the local AOD that is vertically corrected by the PBLH being poorly related to the ground-observed PM2.5 in this region. The effect of meteorology on the improvement of the PM2.5–AOD relationship was also found to vary seasonally. Nevertheless, our results show that a vertical correction in summer may not be useful to improve the PM2.5–AOD relationship in central China, such as in the Jiangxi, Shaanxi and Henan provinces. Central China is located in a typical subtropical monsoon climate zone, and the summer monsoon causes the frequent occurrence of unstable weather and increases the dissipation of local aerosols associated with the scour effect of rainfall and atmospheric convection (Gong et al., 2017; Wang et al., 2011), which may account for the weaker PM2.5–AOD correlation corrected for the PBLH. The RH correction has a weaker influence in winter, during which the averaged coefficient was found to increase by less than 0.01, which may be related to the dry climate in this season. These findings signify that seasonal variability in the data plays an important role in improving the PM2.5–AOD relationship and cannot be ignored, despite the existing differences in the corrected correlations. On the other hand, PBLH-correction can effectively improve the PM2.5–AOD relationship in northwestern China. Contrary to the poor effect of vertical revision in summer and spring, seasonal PM2.5 revised by humidity was more closely linked to satellite AOD than the uncorrected relationship in almost all agglomeration areas, except for summer and autumn in the CDCQ area and winter in the BTH and CP regions. This further corroborates the fact that the regional pattern was a little different from the pattern presented by monitoring stations and that the RH and vertical corrections did not improve the correlation between ground-measured PM2.5 and satellite AOD with significant scope and should instead be tailored to specific areas.
Besides meteorology, terrain was also found to have impact on the PM2.5–AOD correlation, especially in basin areas. This may be because basin terrain tends to form a local atmospheric environment where aerosol particles can mix well in the entire atmosphere. Moreover, the complex topography protects the basins from transboundary transport of air pollution (Ning et al., 2019, 2020). These two reasons contributed to the consistency between near-surface PM2.5 and column AOD. Figure 7 also shows that the r values tend to become lower as the elevation rises, which indicates a deterioration in the PM2.5–AOD correlation with altitude, especially in eastern China where the majority of observational sites are in operation. Due to the spatially uneven distribution of air quality monitoring stations, there were only 23.68 % pairs of matched samples located at elevations higher than 1000 m; thus, Figs. 7 and S9 mainly represent the effect of terrain on the PM2.5–AOD relationship in eastern China.
Finally, it is necessary to discuss the implications for ground PM2.5 derived from satellite AOD. With the release of the MODIS MAIAC aerosol product, an emerging application of this high-spatial-resolution AOD dataset has become the inference of fine particulate matters in China. This study profiled the spatiotemporal variations in the ground-level PM2.5 and the 1 km satellite AOD and analyzed the underlying factors that contribute to the current pattern. Generally consistent with previous studies (Q. Yang et al., 2019; Shao et al., 2017; Wang et al., 2014), the PM2.5–AOD association in this study presents a significant spatiotemporal variation. The meteorological parameters and topography have a complicated influence on the PM2.5–AOD relationship, posing extreme challenges for ground PM2.5 estimations. For example, the PBLH has an adverse impact on the relationship in Yunnan, whereas humidity may not be useful for improving the association in winter. The aerosol type is another contributor accounting for the uncertainties involved; however, as our results show, the pattern based on the 1 km MAIAC AOD is a little different from previous studies using coarse-resolution aerosol products, such as the MODIS 10 km DT or DB AOD datasets (Guo et al., 2017; Q. Yang et al., 2019), which should be noted for PM2.5 predictions. For example, the aerosol retrieval scheme implemented by the MAIAC algorithm at very high altitudes brings about the unnatural negative PM2.5–AOD correlation over Tibetan region and, thus, has a direct effect on the PM2.5 estimation ability. To clarify this issue, we established two separate multiple linear regression models using the same daily samples – one for areas with an elevation higher than 3200 m and one for the remaining area – and obtained significantly different R2 values of 0.14 vs. 0.41 at p < 0.01. This result suggests that the PM2.5 prediction model should treat very high-altitude areas with caution or additional uncertainty within the data may hinder the acquisition of model parameters and further attenuate the prediction accuracy. Therefore, a discreet attitude is required to apply the newly released aerosol product to PM2.5, especially for large areas with a complicated terrain and land cover.
In this study, surface PM2.5 measurements in 2019 across China were spatially and temporally matched with MAIAC 1 km AOD and combined with humidity, vertical data and topography to perform explicit correlation analyses, which are the cornerstone of retrieving ground-level PM2.5 from satellite aerosol loading. From a MAIAC high-resolution perspective, we found that the relationship between surface PM2.5 and column AOD was generally in good agreement with previous results but also showed a slight difference in spatiotemporal variability; thus, caution is required for applications to both aerosol-related and PM2.5-related studies. The findings of this study are helpful with respect to better understanding the PM2.5 pollution status in China as well as its relationship with column AOD, thereby facilitating the reconstruction of high-resolution PM2.5 from satellite aerosol retrievals.
The relationship between PM2.5 and AOD varied notably in mainland China, both spatially and temporally, in terms of correlation coefficients and the slopes of the linear regression. Spatially, stronger correlations mainly occurred in northern and eastern China, and the linear slope in northern inland regions was larger on average than those in other areas. Temporally, the PM2.5–AOD correlation peaked at noon and in the afternoon and varied greatly between seasons: the maximum correlation occurred in winter (r = 0.61). MAIAC 1 km AOD can better represent the ground-level fine particulate matter in most domains with the exception of in very high terrain (i.e., the Tibetan Plateau) and northern central China (i.e., Qinghai and Gansu), where MAIAC does not interpret the actual 1 km aerosol loading, resulting in unnatural or weaker PM2.5–AOD relationships for these domains. This merits more attention regarding the application of PM2.5 estimations.
As far as the confounding impact of meteorology on the relationship between PM2.5 and AOD was concerned, we found that simultaneously considering the RH and PBLH in the relationship could improve the correlation, but the effect of the RH and PBLH on the relationship varied spatially and temporally with respect to both strength and direction. The diurnal cycle of the PBLH coincided with that of the PM2.5–AOD correlation, and the PBLH may impose an adverse impact on the daily relationship in Yunnan Province and weaken the seasonal relationship in summer in central China, such as in the Jiangxi, Shaanxi and Henan provinces. Compared with the PBLH, the RH exerted a greater contribution to improving the PM2.5–AOD correlation in spring and had a weaker influence in winter. In addition, the correlation peaked at 400–600 m primarily in basin terrain such as the Sichuan Basin, the Shanxi–Shaanxi basins and the Junggar Basin. Nevertheless, despite the publicly available high-resolution AOD data during the satellite era, an accurate high-resolution reconstruction from satellite remote sensing remains greatly challenging, not only due to the uncertainties existing in the satellite aerosol retrievals but also due to the uncertainties inherent in the PM2.5 and AOD measurements, which covary with topography and meteorological conditions. Even though the individual effects of humidity, the vertical structure of aerosols and terrain have been clarified, the synthetic impact of these factors could also be core to regulating the statistical relationship between near-surface PM2.5 and total column AOD, which requires elucidation in the future. Therefore, more work in this regard is urgently needed. In addition, aerosol properties, such as aerosol type, are plausible factors that could modulate the PM2.5–AOD relationship and are worthy of more attention in the future.
PM2.5 measurements were sourced from the official website of the Ministry of Ecology and Environment of China: https://www.mee.gov.cn (MEEC, 2021). MAIAC aerosol data are available from the NASA LAADS website: https://ladsweb.modaps.eosdis.nasa.gov/search/ (NASA, 2021a). AERONET data are publicly available from https://aeronet.gsfc.nasa.gov/ (NASA, 2021b).
The supplement related to this article is available online at: https://doi.org/10.5194/acp-21-18375-2021-supplement.
QH and SHLY designed the experiment. QH developed the experiment code, and implemented and validated it. The paper was written by QH and revised by SHLY and MW.
The authors declare that they have no conflict of interest.
Publisher's note: Copernicus Publications remains neutral with regard to jurisdictional claims in published maps and institutional affiliations.
We express our sincere appreciation to NASA for providing the MAIAC and AERONET data.
This research was funded by the Vice-Chancellor's Discretionary Fund of The Chinese University of Hong Kong (grant no. 4930744), the Dr. Stanley Ho Medicine Development Foundation (grant no. 8305509) and the National Natural Science Foundation of China (grant no. 41901324).
This paper was edited by Evangelos Gerasopoulos and reviewed by three anonymous referees.
Arola, A., Eck, T. F., Huttunen, J., Lehtinen, K. E. J., Lindfors, A. V., Myhre, G., Smirnov, A., Tripathi, S. N., and Yu, H.: Influence of observed diurnal cycles of aerosol optical depth on aerosol direct radiative effect, Atmos. Chem. Phys., 13, 7895–7901, https://doi.org/10.5194/acp-13-7895-2013, 2013.
Chudnovsky, A. A., Kostinski, A., Lyapustin, A., and Koutrakis, P.: Spatial scales of pollution from variable resolution satellite imaging, Environ. Pollut., 172, 131–138, 2013.
Gong, W., Huang, Y., Zhang, T., Zhu, Z., Ji, Y., and Xiang, H.: Impact and Suggestion of Column-to-Surface Vertical Correction Scheme on the Relationship between Satellite AOD and Ground-Level PM2.5 in China, Remote Sens.-Basel, 9, 1038, https://doi.org/10.3390/rs9101038, 2017.
Gu, Y. and Yim, S. H. L.: The air quality and health impacts of domestic trans-boundary pollution in various regions of China, Environ. Int., 97, 117–124, https://doi.org/10.1016/j.envint.2016.08.004, 2016.
Gu, Y., Wong, T. W., Law, C. K., Dong, G. H., Ho, K. F., Yang, Y., and Yim, S. H. L.: Impacts of sectoral emissions in China and the implications: air quality, public health, crop production, and economic costs, Environ. Res. Lett., 13, 084008, https://doi.org/10.1088/1748-9326/aad138, 2018.
Gu, Y., Zhang, W., Yang, Y., Wang, C., Streets, D. G., and Yim, S. H. L.: Assessing outdoor air quality and public health impact attributable to residential black carbon emissions in rural China, Resour. Conserv. Recy., 159, 104812, https://doi.org/10.1016/j.resconrec.2020.104812, 2020.
Guo, J., Zhang, X., Wu, Y., Zhaxi, Y., Che, H., La, B., Wang, W., and Li, X.: Spatio-temporal variation trends of satellite-based aerosol optical depth in China during 1980–2008, Atmos. Environ., 45, 6802–6811, 2011.
Guo, J., Deng, M., Lee, S. S., Wang, F., Li, Z., Zhai, P., Liu, H., Lv, W., Yao, W., and Li, X.: Delaying precipitation and lightning by air pollution over the Pearl River Delta. Part I: Observational analyses, J. Geophys. Res.-Atmos., 121, 6472–6488, https://doi.org/10.1002/2015JD023257, 2016.
Guo, J., Xia, F., Zhang, Y., Liu, H., Li, J., Lou, M., He, J., Yan, Y., Wang, F., and Min, M.: Impact of diurnal variability and meteorological factors on the PM2.5-AOD relationship: Implications for PM2.5 remote sensing, Environ. Pollut., 221, 94–104, 2017.
Guo, J.-P., Zhang, X.-Y., Che, H.-Z., Gong, S.-L., An, X., Cao, C.-X., Guang, J., Zhang, H., Wang, Y.-Q., and Zhang, X.-C.: Correlation between PM concentrations and aerosol optical depth in eastern China, Atmos. Environ., 43, 5876–5886, 2009.
He, Q., Gu, Y., and Zhang, M.: Spatiotemporal patterns of aerosol optical depth throughout China from 2003 to 2016, Sci. Total Environ., 653, 23–35, 2019.
He, Q., Gu, Y., and Zhang, M.: Spatiotemporal trends of PM2.5 concentrations in central China from 2003 to 2018 based on MAIAC-derived high-resolution data, Environ. Int., 137, 105536, https://doi.org/10.1016/j.envint.2020.10553, 2020.
Hou, X., Chan, C. K., Dong, G. H., and Yim, S. H. L.: Impacts of transboundary air pollution and local emissions on PM2.5 pollution in the Pearl River Delta region of China and the public health, and the policy implications, Environ. Res. Lett., 14, 034005, https://doi.org/10.1088/1748-9326/aaf493, 2019.
Kim, K.-M., Lau, W. K. M., Sud, Y. C., and Walker, G. K.: Influence of aerosol-radiative forcings on the diurnal and seasonal cycles of rainfall over West Africa and Eastern Atlantic Ocean using GCM simulations, Clim. Dynam., 35, 115–126, https://doi.org/10.1007/s00382-010-0750-1, 2010.
King, M. D., Kaufman, Y. J., Menzel, W. P., and Tanre, D.: Remote sensing of cloud, aerosol, and water vapor properties from the Moderate Resolution Imaging Spectrometer (MODIS), IEEE T. Geosci. Remote, 30, 2–27, 1992.
Kloog, I., Chudnovsky, A. A., Just, A. C., Nordio, F., Koutrakis, P., Coull, B. A., Lyapustin, A., Wang, Y., and Schwartz, J.: A new hybrid spatio-temporal model for estimating daily multi-year PM2.5 concentrations across northeastern USA using high resolution aerosol optical depth data, Atmos. Environ., 95, 581–590, https://doi.org/10.1016/j.atmosenv.2014.07.014, 2014.
Kong, L., Xin, J., Zhang, W., and Wang, Y.: The empirical correlations between PM2.5, PM 10 and AOD in the Beijing metropolitan region and the PM2.5, PM10 distributions retrieved by MODIS, Environ. Pollut., 216, 350–360, 2016.
Lee, H. J., Chatfield, R. B., and Strawa, A. W.: Enhancing the applicability of satellite remote sensing for PM2.5 estimation using MODIS deep blue AOD and land use regression in California, United States, Environ. Sci. Technol., 50, 6546–6555, 2016a.
Lee, S. S., Guo, J., and Li, Z.: Delaying precipitation by air pollution over the Pearl River Delta: 2. Model simulations, J. Geophys. Res.-Atmos., 121, 11,739-711,760, https://doi.org/10.1002/2015JD024362, 2016b.
Li, Z., Xia, X., Cribb, M., Mi, W., Holben, B., Wang, P., Chen, H., Tsay, S. C., Eck, T., and Zhao, F.: Aerosol optical properties and their radiative effects in northern China, J. Geophys. Res.-Atmos, 112, D22S01, https://doi.org/10.1029/2006JD007382, 2007.
Li, Z., Yim, S. H.-L., and Ho, K.-F.: High temporal resolution prediction of street-level PM2.5 and NOx concentrations using machine learning approach, J. Clean. Prod., 268, 121975, https://doi.org/10.1016/j.jclepro.2020.121975, 2020.
Liu, M., Huang, Y., Ma, Z., Jin, Z., Liu, X., Wang, H., Liu, Y., Wang, J., Jantunen, M., Bi, J., and Kinney, P. L.: Spatial and temporal trends in the mortality burden of air pollution in China: 2004–2012, Environ. Int., 98, 75–81, https://doi.org/10.1016/j.envint.2016.10.003, 2017.
Liu, N., Zou, B., Feng, H., Wang, W., Tang, Y., and Liang, Y.: Evaluation and comparison of multiangle implementation of the atmospheric correction algorithm, Dark Target, and Deep Blue aerosol products over China, Atmos. Chem. Phys., 19, 8243–8268, https://doi.org/10.5194/acp-19-8243-2019, 2019.
Liu, S. and Liang, X.-Z.: Observed Diurnal Cycle Climatology of Planetary Boundary Layer Height, J. Climate, 23, 5790–5809, https://doi.org/10.1175/2010JCLI3552.1, 2010.
Liu, X., Chen, Q., Che, H., Zhang, R., Gui, K., Zhang, H., and Zhao, T.: Spatial distribution and temporal variation of aerosol optical depth in the Sichuan basin, China, the recent ten years, Atmos. Environ., 147, 434–445, 2016.
Liu, Z., Yim, S. H. L., Wang, C., and Lau, N. C.: The Impact of the Aerosol Direct Radiative Forcing on Deep Convection and Air Quality in the Pearl River Delta Region, Geophys. Res. Lett., 45, 4410–4418, https://doi.org/10.1029/2018GL077517, 2018.
Liu, Z., Ming, Y., Wang, L., Bollasina, M., Luo, M., Lau, N.-C., and Yim, S. H.-L.: A Model Investigation of Aerosol-Induced Changes in the East Asian Winter Monsoon, Geophys. Res. Lett., 46, 10186–10195, https://doi.org/10.1029/2019GL084228, 2019.
Liu, Z., Ming, Y., Zhao, C., Lau, N. C., Guo, J., Bollasina, M., and Yim, S. H. L.: Contribution of local and remote anthropogenic aerosols to a record-breaking torrential rainfall event in Guangdong Province, China, Atmos. Chem. Phys., 20, 223–241, https://doi.org/10.5194/acp-20-223-2020, 2020.
Luo, M., Hou, X., Gu, Y., Lau, N.-C., and Yim, S. H.-L.: Trans-boundary air pollution in a city under various atmospheric conditions, Sci. Total Environ., 618, 132–141, https://doi.org/10.1016/j.scitotenv.2017.11.001, 2018.
Lyapustin, A., Wang, Y., Korkin, S., and Huang, D.: MODIS Collection 6 MAIAC algorithm, Atmos. Meas. Tech., 11, 5741–5765, https://doi.org/10.5194/amt-11-5741-2018, 2018.
Ma, Z., Hu, X., Huang, L., Bi, J., and Liu, Y.: Estimating Ground-Level PM2.5 in China Using Satellite Remote Sensing, Environ. Sci. Technol., 48, 7436–7444, https://doi.org/10.1021/es5009399, 2014.
Martins, V., Lyapustin, A., Carvalho, L., Barbosa, C., and Novo, E.: Validation of high-resolution MAIAC aerosol product over South America, J. Geophys. Res.-Atmos., 122, 7537–7559, https://doi.org/10.1002/2016JD026301, 2017.
MEEC: Ministry of Ecology and Environment of the People's Republic of China, available at: https://www.mee.gov.cn/, last access: 10 November 2021.
NASA: Level-1 and Atmosphere Archive & Distribution System (LAADS) Distributed Active Archive Center (DAAC), available at: https://ladsweb.modaps.eosdis.nasa.gov/search/, last access: 10 November 2021a.
NASA: AERONET, available at: https://aeronet.gsfc.nasa.gov/, last access: 10 November 2021b.
Ning, G., Wang, S., Yim, S. H. L., Li, J., Hu, Y., Shang, Z., Wang, J., and Wang, J.: Impact of low-pressure systems on winter heavy air pollution in the northwest Sichuan Basin, China, Atmos. Chem. Phys., 18, 13601–13615, https://doi.org/10.5194/acp-18-13601-2018, 2018.
Ning, G., Yim, S. H. L., Wang, S., Duan, B., Nie, C., Yang, X., Wang, J., and Shang, K.: Synergistic effects of synoptic weather patterns and topography on air quality: a case of the Sichuan Basin of China, Clim. Dynam., 53, 6729–6744, https://doi.org/10.1007/s00382-019-04954-3, 2019.
Ning, G., Yim, S. H. L., Yang, Y., Gu, Y., and Dong, G.: Modulations of synoptic and climatic changes on ozone pollution and its health risks in mountain-basin areas, Atmos. Environ., 240, 117808, https://doi.org/10.1016/j.atmosenv.2020.117808, 2020.
Pope III, C. A., Burnett, R. T., Thun, M. J., Calle, E. E., Krewski, D., Ito, K., and Thurston, G. D.: Lung cancer, cardiopulmonary mortality, and long-term exposure to fine particulate air pollution, JAMA-J. Am. Med. Assoc., 287, 1132–1141, 2002.
Schwartz, J.: Air pollution and hospital admissions for respiratory disease, Epidemiology, 7, 20–28, 1996.
Shao, P., Xin, J., An, J., Kong, L., Wang, B., Wang, J., Wang, Y., and Wu, D.: The empirical relationship between PM2.5 and AOD in Nanjing of the Yangtze River Delta, Atmos. Pollut. Res., 8, 233–243, 2017.
Shi, C., Nduka, I. C., Yang, Y., Huang, Y., Yao, R., Zhang, H., He, B., Xie, C., Wang, Z., and Yim, S. H. L.: Characteristics and meteorological mechanisms of transboundary air pollution in a persistent heavy PM2.5 pollution episode in Central-East China, Atmos. Environ., 223, 117239, https://doi.org/10.1016/j.atmosenv.2019.117239, 2020.
Silva, H., Conceicao, R., Wright, M., Matthews, J., Pereira, S., and Shallcross, D.: Aerosol hygroscopic growth and the dependence of atmospheric electric field measurements with relative humidity, J. Aerosol Sci., 85, 42–51, 2015.
Tong, C. H. M., Yim, S. H. L., Rothenberg, D., Wang, C., Lin, C.-Y., Chen, Y. D., and Lau, N. C.: Projecting the impacts of atmospheric conditions under climate change on air quality over the Pearl River Delta region, Atmos. Environ., 193, 79–87, https://doi.org/10.1016/j.atmosenv.2018.08.053, 2018a.
Tong, C. H. M., Yim, S. H. L., Rothenberg, D., Wang, C., Lin, C.-Y., Chen, Y. D., and Lau, N. C.: Assessing the impacts of seasonal and vertical atmospheric conditions on air quality over the Pearl River Delta region, Atmos. Environ., 180, 69–78, https://doi.org/10.1016/j.atmosenv.2018.02.039, 2018b.
Wang, J. and Christopher, S. A.: Intercomparison between satellite-derived aerosol optical thickness and PM2.5 mass: implications for air quality studies, Geophys. Res. Lett., 30, 2095, https://doi.org/10.1029/2003GL018174, 2003.
Wang, Y., Xin, J., Li, Z., Wang, S., Wang, P., Hao, W. M., Nordgren, B. L., Chen, H., Wang, L., and Sun, Y.: Seasonal variations in aerosol optical properties over China, J. Geophys. Res.-Atmos., 116, D18209, https://doi.org/10.1029/2010JD015376, 2011.
Wang, Z., Chen, L., Tao, J., Liu, Y., Hu, X., and Tao, M.: An empirical method of RH correction for satellite estimation of ground-level PM concentrations, Atmos. Environ., 95, 71–81, 2014.
Xin, J., Zhang, Q., Wang, L., Gong, C., Wang, Y., Liu, Z., and Gao, W.: The empirical relationship between the PM2.5 concentration and aerosol optical depth over the background of North China from 2009 to 2011, Atmos. Res., 138, 179–188, 2014.
Xin, J., Gong, C., Liu, Z., Cong, Z., Gao, W., Song, T., Pan, Y., Sun, Y., Ji, D., and Wang, L.: The observation-based relationships between PM2.5 and AOD over China, J. Geophys. Res.-Atmos., 121, 10701–10716, https://doi.org/10.1002/2015JD024655, 2016.
Yang, Q., Yuan, Q., Yue, L., Li, T., Shen, H., and Zhang, L.: The relationships between PM2.5 and aerosol optical depth (AOD) in mainland China: About and behind the spatio-temporal variations, Environ. Pollut., 248, 526–535, https://doi.org/10.1016/j.envpol.2019.02.071, 2019.
Yang, X., Jiang, L., Zhao, W., Xiong, Q., Zhao, W., and Yan, X.: Comparison of ground-based PM2.5 and PM10 concentrations in China, India, and the US, International Journal of Environmental Research and Public Health, 15, 1382, https://doi.org/10.3390/ijerph15071382, 2018.
Yang, Y., Zheng, X., Gao, Z., Wang, H., Wang, T., Li, Y., Lau, G. N. C., and Yim, S. H. L.: Long-Term Trends of Persistent Synoptic Circulation Events in Planetary Boundary Layer and Their Relationships With Haze Pollution in Winter Half Year Over Eastern China, J. Geophys. Res.-Atmos., 123, 10991–11007, https://doi.org/10.1029/2018JD028982, 2018.
Yang, Y., Yim, S. H. L., Haywood, J., Osborne, M., Chan, J. C. S., Zeng, Z., and Cheng, J. C. H.: Characteristics of Heavy Particulate Matter Pollution Events Over Hong Kong and Their Relationships With Vertical Wind Profiles Using High-Time-Resolution Doppler Lidar Measurements, J. Geophys. Res.-Atmos., 124, 9609–9623, https://doi.org/10.1029/2019JD031140, 2019.
Yang, Y., Zheng, Z., Yim, S. Y. L., Roth, M., Ren, G., Gao, Z., Wang, T., Li, Q., Shi, C., Ning, G., and Li, Y.: PM2.5 Pollution Modulates Wintertime Urban Heat Island Intensity in the Beijing–Tianjin–Hebei Megalopolis, China, Geophys. Res. Lett., 47, e2019GL084288, https://doi.org/10.1029/2019GL084288, 2020.
Yim, S. H. L.: Development of a 3D Real-Time Atmospheric Monitoring System (3DREAMS) Using Doppler LiDARs and Applications for Long-Term Analysis and Hot-and-Polluted Episodes, Remote Sens.-Basel, 12, 1036, https://doi.org/10.3390/rs12061036, 2020.
Yim, S. H. L., Lee, G. L., Lee, I. H., Allroggen, F., Ashok, A., Caiazzo, F., Eastham, S. D., Malina, R., and Barrett, S. R. H.: Global, regional and local health impacts of civil aviation emissions, Environ. Res. Lett., 10, 034001, https://doi.org/10.1088/1748-9326/10/3/034001, 2015.
Yim, S. H. L., Gu, Y., Shapiro, M. A., and Stephens, B.: Air quality and acid deposition impacts of local emissions and transboundary air pollution in Japan and South Korea, Atmos. Chem. Phys., 19, 13309–13323, https://doi.org/10.5194/acp-19-13309-2019, 2019a.
Yim, S. H. L., Hou, X., Guo, J., and Yang, Y.: Contribution of local emissions and transboundary air pollution to air quality in Hong Kong during El Niño-Southern Oscillation and heatwaves, Atmos. Res., 218, 50–58, https://doi.org/10.1016/j.atmosres.2018.10.021, 2019b.
Zhang, W., Guo, J., Miao, Y., Liu, H., Song, Y., Fang, Z., He, J., Lou, M., Yan, Y., Li, Y., and Zhai, P.: On the Summertime Planetary Boundary Layer with Different Thermodynamic Stability in China: A Radiosonde Perspective, J. Climate, 31, 1451–1465, https://doi.org/10.1175/JCLI-D-17-0231.1, 2018.
Zhang, Y. and Li, Z.: Remote sensing of atmospheric fine particulate matter (PM2.5) mass concentration near the ground from satellite observation, Remote Sens. Environ., 160, 252–262, https://doi.org/10.1016/j.rse.2015.02.005, 2015.
Zhang, Y.-L. and Cao, F.: Fine particulate matter (PM2.5) in China at a city level, Scientific Reports, 5, 2015.
Zhang, Z., Wu, W., Fan, M., Wei, J., Tan, Y., and Wang, Q.: Evaluation of MAIAC aerosol retrievals over China, Atmos. Environ, 202, 8–16, 2019.
Zhao, C., Liu, Z., Wang, Q., Ban, J., Chen, N. X., and Li, T.: High-resolution daily AOD estimated to full coverage using the random forest model approach in the Beijing–Tianjin–Hebei region, Atmos. Environ., 203, 70–78, 2019.
Zheng, Z., Zhao, C., Lolli, S., Wang, X., Wang, Y., Ma, X., Li, Q., and Yang, Y.: Diurnal variation of summer precipitation modulated by air pollution: observational evidences in the beijing metropolitan area, Environ. Res. Lett., 15, 094053, https://doi.org/10.1088/1748-9326/ab99fc, 2020.
Zhu, J., Xia, X., Wang, J., Zhang, J., Wiedinmyer, C., Fisher, J. A., and Keller, C. A.: Impact of Southeast Asian smoke on aerosol properties in Southwest China: First comparison of model simulations with satellite and ground observations, J. Geophys. Res.-Atmos., 122, 3904–3919, 2017.
Zou, B., You, J., Lin, Y., Duan, X., Zhao, X., Fang, X., Campen, M. J., and Li, S.: Air pollution intervention and life-saving effect in China, Environ. Int., 125, 529–541, 2019.