the Creative Commons Attribution 4.0 License.
the Creative Commons Attribution 4.0 License.
 | 16 Dec 2021
Modeling secondary organic aerosol formation from volatile chemical products
Elyse A. Pennington
Karl M. Seltzer
Benjamin N. Murphy
Momei Qin
John H. Seinfeld
Volatile chemical products (VCPs) are commonly used consumer and industrial items that are an important source of anthropogenic emissions. Organic compounds from VCPs evaporate on atmospherically relevant timescales and include many species that are secondary organic aerosol (SOA) precursors. However, the chemistry leading to SOA, particularly that of intermediate-volatility organic compounds (IVOCs), has not been fully represented in regional-scale models such as the Community Multiscale Air Quality (CMAQ) model, which tend to underpredict SOA concentrations in urban areas. Here we develop a model to represent SOA formation from VCP emissions. The model incorporates a new VCP emissions inventory and employs three new classes of emissions: siloxanes, oxygenated IVOCs, and nonoxygenated IVOCs. VCPs are estimated to produce 1.67 µg m−3 of noontime SOA, doubling the current model predictions and reducing the SOA mass concentration bias from −75 % to −58 % when compared to observations in Los Angeles in 2010. While oxygenated and nonoxygenated intermediate-volatility VCP species are emitted in similar quantities, SOA formation is dominated by the nonoxygenated IVOCs. Formaldehyde and SOA show similar relationships to temperature and bias signatures, indicating common sources and/or chemistry. This work suggests that VCPs contribute up to half of anthropogenic SOA in Los Angeles and models must better represent SOA precursors from VCPs to predict the urban enhancement of SOA.
- Article
(2227 KB) - Full-text XML
-
Supplement
(1246 KB) - BibTeX
- EndNote


Organic aerosol (OA) is a major component of fine particulate matter (PM2.5) in urban areas throughout the world (Zhang et al., 2007). PM2.5 influences human health (Lim et al., 2012), climate (Intergovernmental Panel on Climate Change, 2014), and visibility (Hyslop, 2009), so understanding OA composition is an important step in mitigating the adverse effects of PM2.5. Secondary organic aerosol (SOA) is often the dominant component of OA (Jimenez et al., 2009) and is formed when gas-phase volatile organic compounds (VOCs) react with atmospheric oxidants to form products that condense into the aerosol phase, where they can undergo further reaction. SOA is formed via thousands of atmospheric reactions (Goldstein and Galbally, 2007), so understanding its sources remains a challenge.
Volatile chemical products (VCPs) are an important source of organic emissions that lead to SOA formation (McDonald et al., 2018; Qin et al., 2021). As vehicle exhaust becomes cleaner and mobile source emissions decline, the relative importance of VCP emissions increases (Khare and Gentner, 2018). Previous work suggests that during the 2010 California Research at the Nexus of Air Quality and Climate Change (CalNex) campaign in southern California (Ryerson et al., 2013), VCPs contributed approximately 1.1 µg m−3, or 41 %, of observed SOA above background levels in the Los Angeles Basin (Qin et al., 2021).
Modeling the formation of SOA in three-dimensional (3D) chemical transport models (CTMs) is challenging due to the complexity of VOC chemistry and computational constraints of regional-scale modeling. Models have tended to underpredict SOA mass in urban locations for a variety of reasons. For one, the SOA formation potential of intermediate-volatility organic compounds (IVOCs) and semivolatile organic compounds (SVOCs) – or S/IVOCs – is not well constrained. Observations made during the CalNex campaign demonstrate that S/IVOCs are important sources of SOA, making up 10 % of total gas-phase organic compound concentrations (Zhao et al., 2014) while contributing up to 80 % of above-background SOA mass (Hayes et al., 2015). Although it is often impossible to identify all individual species contributing to ambient S/IVOCs, these compounds may be classified based on their properties (e.g., volatility). Volatility basis set (VBS) models (Donahue et al., 2011) are often used to represent S/IVOC chemistry and partitioning and have improved model estimates of SOA (Woody et al., 2016; Hayes et al., 2015; Robinson et al., 2007). Murphy et al. (2017) integrated a VBS model into the Community Multiscale Air Quality (CMAQ) model version 5.2 to represent the multigenerational aging of semivolatile primary organic aerosol (POA) leading to the production of SOA. Other studies have parameterized VBS models to represent S/IVOCs from mobile emissions (Lu et al., 2020; Jathar et al., 2017), but none have parameterized SOA formation from VCP S/IVOC emissions. Additionally, the emissions of S/IVOCs are not well constrained and are often not included in detailed emissions inventories (Zhao et al., 2015). However even when S/IVOCs are included in emissions inventories, they are often assigned to nonreactive or nonvolatile model surrogates that do not participate in model chemistry (Shah et al., 2020b). Improving the representation of SOA chemistry in CMAQ will allow for more accurate exposure estimates in health studies and source apportionment for air quality management decisions.
Another source of error in CTMs is the lack of representation of oxygenated SOA precursors. Historically, mechanism development has focused on the oxidation chemistry of species emitted primarily from vehicles (e.g., BTEX – benzene, toluene, ethylbenzene, and xylene) or biogenic sources (e.g., isoprene, monoterpenes). While VCPs do emit some of these species, they also emit many oxygenated compounds (Seltzer et al., 2021; McDonald et al., 2018). The implications of a few important oxygenated precursors for air quality have recently been quantified (e.g., Janechek et al., 2017; Charan et al., 2020; Li and Cocker, 2018; Li et al., 2018), but many oxygenated precursors have not been studied in a laboratory setting. For the few oxygenated VCPs that have been studied in laboratory chambers, SOA yields were reported under unrealistic atmospheric conditions, e.g., high OH and aerosol seed concentrations (Charan et al., 2021). So, the SOA yields of these compounds have primarily been estimated using models such as the Statistical Oxidation Model (SOM; Cappa and Wilson, 2012) or VBS (McDonald et al., 2018; Shah et al., 2020a). These oxygenated species are not included as SOA precursors in most models, and their chemistry is needed to improve predictions of SOA mass.
In this work, we introduce a chemical mechanism to represent SOA formation from VCPs. Specifically, the potential of both oxygenated and nonoxygenated IVOCs to form SOA is developed and evaluated. We utilize a new VCP emissions inventory known as VCPy (Seltzer et al., 2021) to represent organic emissions from VCPs and to parameterize model species behavior in the chemical mechanism. The chemistry and emissions inventory are implemented in the CMAQ model version 5.3.2 to simulate air quality during the CalNex campaign in California in 2010. The model predictions are compared to measurements made in Pasadena during CalNex, and the speciation of predicted SOA is examined.
2.1 VCPy emissions inventory implementation
VCPy is a modeling framework that estimates reactive organic carbon emissions from VCPs (Seltzer et al., 2021). Within this framework, the complete VCP sector is disaggregated into several product use categories (PUCs; e.g., cleaning products, personal care products, adhesives and sealants, paints and coatings). US nationwide usage of each PUC is estimated, and survey data are then used to quantify the mass fraction of organic, inorganic, and water proportions, as well as to speciate the organic fraction. Physiochemical properties of each organic component are used to estimate the characteristic evaporation timescale, which is then compared to an assigned use timescale to determine whether a compound is retained or evaporated from each PUC. In the initial implementation of VCPy (version 1.0), which is representative of 2016 conditions, the predicted nationwide and Los Angeles County VCP emission rates were 9.5 and 8.2 kg per person per year, respectively. These emission rates are consistent with the low end of values seen in a previous study that used a top-down approach to estimate VCP emissions (Qin et al., 2021). In our work, product use is based on data from 2010 with composition specified using data from the early 2000s to overlap with the CalNex campaign.
Since the speciation of organic emissions from VCPy is explicit, the underlying chemical and physical properties of emissions are output from the framework. These properties, many of which are relevant to atmospheric oxidation and subsequent SOA formation, include the oxidation rate with the hydroxyl radical (kOH), molecular weight (MW), effective saturation concentration (C∗), and oxygen-to-carbon ratio (O:C). SOA mass yields, which are defined as the mass of SOA formed per mass of VOC precursor reacted, were assigned based on compound-specific structure and volatility (Seltzer et al., 2021).
A key step in implementing this inventory into CMAQ is ensuring that all compounds predicted to be emitted by VCPy are mapped to either an existing or a new model surrogate. Emissions of low-volatility organic vapors (C∗ < 106.5 µg m−3) from all sources are prime SOA precursors but traditionally discarded from the gas-phase chemical mechanism used in many CTMs (e.g., represented as nonvolatile (NVOL), nonreactive (NROG), or unspecified IVOC species that are not used in the chemical mechanism of CMAQ). As a result, these species do not participate in atmospheric chemistry and thus do not impact radical concentrations or SOA mass. In addition, oxygenated compounds are not currently included as SOA precursors in many mechanisms because of the historic focus on SOA formation from nonoxygenated vehicle exhaust and traditional VOCs like single-ring aromatics and biogenic hydrocarbons. The work of Qin et al. (2021) specifically identifies this loss of emitted reactive carbon mass as a reason for underestimated SOA from the personal care sector in the CMAQ model. To account for the SOA potential of this previously neglected organic mass, all compounds currently mapped to NROG, NVOL, and IVOC are reviewed, with most of this mass routed to one of three newly added categories of model surrogates: siloxanes (SILOX), oxygenated IVOCs (SOAOXY), or nonoxygenated IVOCs (IVOCP3, IVOCP4, IVOCP5, IVOCP6, IVOCP5ARO, and IVOCP6ARO). The updated mechanism (with SOA pathways described in Sect. 2.2) with the newly implemented speciation mapping is henceforth described as SAPRC07TIC_AE7I_VCP, and the complete list of assignment rules is provided in the Methods section of the Supplement.
County-level VCPy emissions (Seltzer et al., 2021) were gridded at a 4 km scale to fit the CalNex domain (Baker et al., 2015) using a variety of spatial surrogates. The spatial surrogates used depend on the category of VCP emissions being described: agricultural land is used as a proxy for all agricultural pesticide emissions, the density of oil and gas wells for the oil and gas solvent emissions, and population for all remaining VCP sources. While some categories of VCP emissions could feature more refined spatial surrogate proxies, the uncertainty associated with spatial allocation of sources may be lower than uncertainty in individual source strength. More specifically, if an entire VCP category could be matched to a single surrogate, allocation methods would still assume there is no variation in the strength of individuals within the population of that surrogate (Li et al., 2021).
All VCP emissions feature a sinusoidal diurnal profile with a peak at noon, with no application of day-of-week or seasonal profiles. Since the simulation period used in this study is a single month, no seasonal changes would be observable over this time frame, and previous work suggests little seasonal variability in VCP emissions (Gkatzelis et al., 2021). Other emission sectors (e.g., mobile sources, agriculture) are adjusted for seasonal impacts based on meteorological conditions and known activity data.
2.2 Parameterizing SOA formation from VCPs
To better represent the atmospheric chemistry of VCPs, SOA formation is added for the three new categories of emissions (siloxanes, oxygenated IVOCs, and nonoxygenated IVOCs) in the SAPRC07TIC_AE7I_VCP chemical mechanism within CMAQ (Table 1).
Table 1Properties of the VCP surrogates added to CMAQ version 5.3.2.
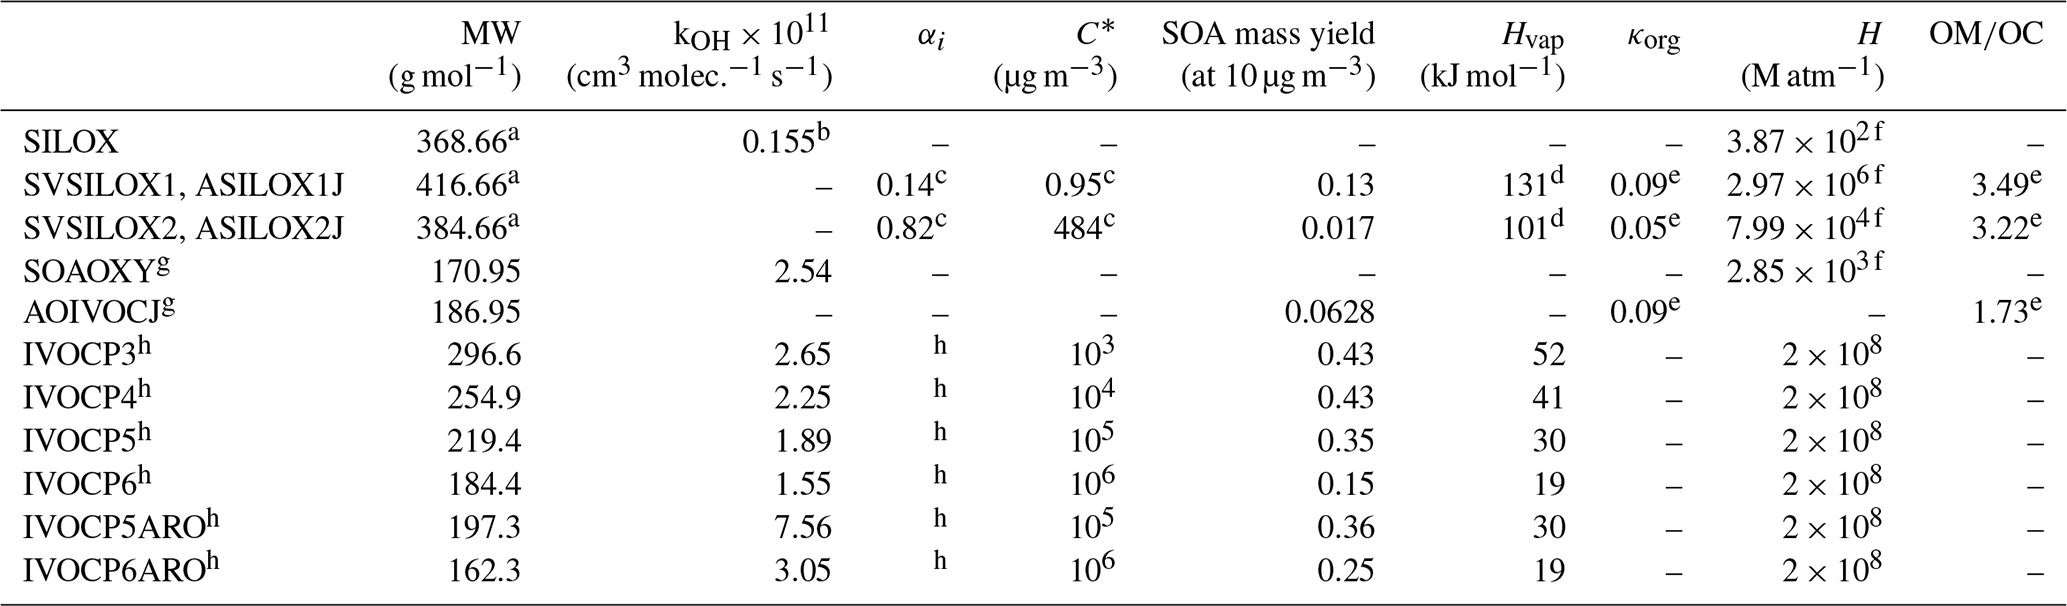
a The gas-phase siloxane (SILOX) MW is the average of the MW of all VCPy siloxane and silane species weighted by Los Angeles County emission rates. The MW of the higher-volatility siloxane products (SVSILOX2, ASILOX2J) is approximated as the sum of the MW of SILOX and one oxygen. The MW of the lower-volatility products (SVSILOX1, ASILOX1J) has an additional two oxygens to represent its significant decrease in volatility. b The gas-phase siloxane (SILOX) kOH is given in Janechek et al. (2017). c The stoichiometric product yields (αi) and C∗ of the siloxanes are given in Janechek et al. (2019). d Enthalpy of vaporization (Hvap) values for the siloxanes are estimated according to the method in Epstein et al. (2010). e All ratios and hygroscopicity parameters (κorg) are estimated using Eqs. (5) and (12), respectively, in Pye et al. (2017). f Henry's law constants (H) at 298.15 K are estimated using the surrogate-based method in Hodzic et al. (2014). g The MW, kOH, C∗, and SOA yield of SOAOXY (gas) and AOIVOCJ (aerosol) are calculated as a mass-weighted average of the oxygenated IVOC emissions from VCPs in Los Angeles County. Because AOIVOC is formed via a single reaction with a constant SOA yield, it is treated as nonvolatile and therefore is not assigned a C∗ or Hvap value. h All nonoxygenated IVOC surrogate properties – including four stoichiometric product yields (αi) for each surrogate used in the multigenerational scheme – are described in Lu et al. (2020).
Cyclic volatile methylsiloxanes (cVMSs), or siloxanes for short, are present in many personal care products, adhesives, and sealants. Collectively, siloxanes represent a large fraction of VCP emissions (Seltzer et al., 2021). Decamethylcyclopentasiloxane (D5 siloxane) is the most prevalent siloxane in urban atmospheres (Wang et al., 2013), and laboratory studies have found D5-siloxane SOA yields ranging from 0 % (Charan et al., 2021) to 50 % (Janechek et al., 2019). The explicit oxidation mechanism is unknown, and the SOA yields of other siloxanes are not well understood (Coggon et al., 2018). Here, siloxanes are treated separately from other oxygenated VCP species due to their anomalously low OH oxidation rate (Table 1). The mechanism of SOA formation used here utilizes an existing two-product model from Janechek et al. (2019) that was parameterized using oxidation flow reactor (OFR) experiments and photooxidation chamber data from Wu and Johnston (2017). In this implementation, the OH oxidation rate constant for D5 siloxane matches the rate reported in Janechek et al. (2017), and the hydroxyl radical is replenished after reaction.
Few laboratory chamber studies have investigated the oxidation processes of other oxygenated gas-phase species (e.g., Charan et al., 2020; Li and Cocker, 2018), so few experimental data exist about the SOA yields or oxidation products of oxygenated SOA precursors. Additionally, many models that predict the products of oxidation reactions (e.g., SOM and VBS) have not been parameterized or evaluated using oxygenated precursors. Without these models and laboratory studies, little is known about the oxidation products of these precursors, which limits our ability to develop a detailed model of their SOA formation. Therefore, all non-siloxane oxygenated IVOC emissions are represented by a single surrogate (SOAOXY) that undergoes a one-step gas-phase reaction with the hydroxyl radical to form a nonvolatile aerosol surrogate (AOIVOC). This simple mechanism reduces the reliance on many parameters that are not well constrained. The MW, kOH, C∗, and SOA yield of this surrogate are calculated as a mass-weighted average of the oxygenated IVOC emissions from VCPs in Los Angeles County, which are generally consistent with what would be calculated using nationwide information.
Nonoxygenated IVOC emissions are represented using the model described by Lu et al. (2020), which uses a VBS model and multigenerational aging scheme to represent the SOA from gasoline, diesel, and aircraft sources. Six surrogates are differentiated by structure (alkane vs. aromatic) and effective saturation concentration, and each is assigned a four-product yield distribution, generating SVOCs after one oxidation step. Many of the nonoxygenated IVOC species from mobile and VCP emission sources have similar structures (i.e., long and branched alkanes and aromatics), volatilities, and SOA yields (see Fig. S1 in the Supplement), making the Lu et al. (2020) model a good representation of oxidation and SOA formation from nonoxygenated VCP IVOCs.
2.3 CMAQ model implementation
2.3.1 CalNex model configuration
The updated chemical mechanism and VCPy-derived emissions were implemented in CMAQ version 5.3.2 (U.S. EPA, 2020). CMAQ version 5.3 and the subsequent minor releases are documented in Appel et al. (2021). The model was used to simulate air quality during the CalNex campaign from 15 May to 15 June 2010, with an additional 14 d spin-up period. Outside the VCP updates, the model configuration matches the implementation used in Qin et al. (2021) and Lu et al. (2020). The model domain has 4 km × 4 km horizontal resolution (325×225 grid cells) covering California and Nevada with 36 vertical levels reaching 50 mbar. Meteorological inputs are derived from the Weather Research and Forecasting (WRF) Advanced Research WRF core model version 3.8.1 (Skamarock et al., 2008). Gas-phase chemistry is represented using SAPRC07TIC (Pye et al., 2013; Xie et al., 2013) with the addition of the VCP chemical mechanism summarized in Table 1. Aerosol-phase chemistry is simulated using an extended version of the AERO7 mechanism, depicted in Fig. 1, which includes all AERO7 reactions plus those of the new VCP mechanism (boxed in red) and mobile IVOCs (boxed in red in the lower left) that participate in the multigenerational aging shown in the orange boxes (Lu et al., 2020). This diagram also includes a representation of the aqueous-phase cloud chemistry and removal used in the Asymmetric Convection Model (ACM) version 2 module (Binkowski and Roselle, 2003), which has been updated to include wet deposition properties for the new aerosol surrogates (Table 1).

Figure 1Treatment of OA chemistry in the CMAQv5.3.2+VCP model. The thick black box surrounds all aerosol-phase species. All smaller black boxes depict species undergoing gas-phase oxidation from VOCs to semivolatile or nonvolatile SOA species. Orange font depicts the VBS model for S/IVOCs. Red font depicts particle-phase accretion reactions, and purple font depicts particle-phase hydrolysis reactions. Green font represents heterogeneous processes. Blue font shows cloud-processed aerosol, and yellow font shows aerosol water associated with the organic phase. Gray boxes are nonvolatile primary organic aerosol (POA) species. Double-headed arrows represent reversible processes, and single-headed arrows represent irreversible processes. Dashed lines represent processes that are dependent on relative humidity. The diagram includes the AERO7 mechanism plus the three VCP-forming pathways specific to this work (thick boxes in red). See U.S. EPA (2016) for species descriptions.
All non-VCP anthropogenic emissions are based on the 2011 National Emissions Inventory (NEI) version 2 (U.S. EPA, 2015). VCP emissions in the NEI are removed and replaced with VCPy-predicted emissions using the Detailed Emissions Scaling, Isolation, and Diagnostic (DESID) module (Murphy et al., 2021). Mobile NOx emissions were reduced by 25 % in all simulations to better match observational data from the CalNex campaign (Qin et al., 2021). Mobile IVOC emissions and the semivolatile treatment of mobile POA were treated according to the methods described in Lu et al. (2020). The IVOCs are assigned to the appropriate IVOCP3, IVOCP4, IVOCP5, IVOCP6, IVOCP5ARO, and IVOCP6ARO surrogates that are also used to treat nonoxygenated IVOCs from VCPs. Wind-blown dust emissions are neglected in this study. Biogenic emissions are calculated online using the Biogenic Emission Inventory System (BEIS) version 3.6.1 (Bash et al., 2016) as are sea spray aerosol emissions.
2.3.2 Simulation cases
Three simulations were evaluated against the observations collected during the CalNex campaign. A “zero VCP” case removes all VCP emissions. The “CMAQv5.3.2” case is a standard CMAQ simulation with base emissions (i.e., VCP emissions from the NEI) and base chemistry (i.e., no new VCP chemistry). Finally, the “CMAQv5.3.2+VCP” case both adds the VCP chemistry described above (i.e., SAPRC07TIC_AE7I_VCP) and replaces all NEI VCP emissions with VCPy-derived VCP emissions. Comparisons between the zero VCP case and the CMAQv5.3.2+VCP case illustrate the complete impact of VCPy emissions on modeled SOA. In contrast, comparisons between the CMAQv5.3.2 case and the CMAQv5.3.2+VCP case illustrate the impact of the new representation of VCP emissions and chemistry against the current status of VCPs in CMAQ. Results from the CMAQv5.3.2 case are presented primarily in the Supplement.
2.3.3 Comparison with observations
Observational data are provided by a suite of instruments deployed during the 2010 CalNex campaign in Pasadena. There were two data collection sites in the CalNex campaign – Pasadena and Bakersfield – and model predictions are compared to measurements made at the Pasadena site, which is located in the Los Angeles Basin approximately 18 km downwind of the urban core (Ryerson et al., 2013). PM1 (fine particulate matter with diameter <1 µm) OA data were obtained with an aerosol mass spectrometer (AMS) and have been analyzed via positive matrix factorization (PMF) to determine their composition (Hayes et al., 2013). Formaldehyde (HCHO) data are provided in Warneke et al. (2011) and carbon monoxide (CO) data are available from Santoni et al. (2014). Ozone data throughout California were obtained from the EPA AQS monitoring network for 178 sites operating during the simulation period (U.S. EPA, 2013). Hourly ozone concentrations were used to calculate daily maximum 8 h average (MDA8) ozone concentrations.
3.1 VCP emissions and implications for SOA
VCP emissions were split almost equally between species that do and do not form SOA. The SAPRC07TIC_AE7I_VCP speciation mapping (Fig. 2) indicates 56.4 % (4.8×10⁷ kg yr−1) of Los Angeles County VCP emitted mass does not form SOA. This mass includes small species commonly used as solvents, such as ethanol, acetone, and small alkanes. The remaining 43.6 % (3.7 × 10⁷ kg yr−1) of Los Angeles County emissions are assigned to model surrogates that form SOA. Of the total emissions, 3.5 % are assigned to siloxanes; 7.8 % to oxygenated IVOCs; 11.8 % to nonoxygenated IVOCs; and 20.4 % to traditional SOA precursors, such as VOC alkanes, toluene, and other aromatics. The volatility and SOA yields of species in each category are summarized in Fig. S1.
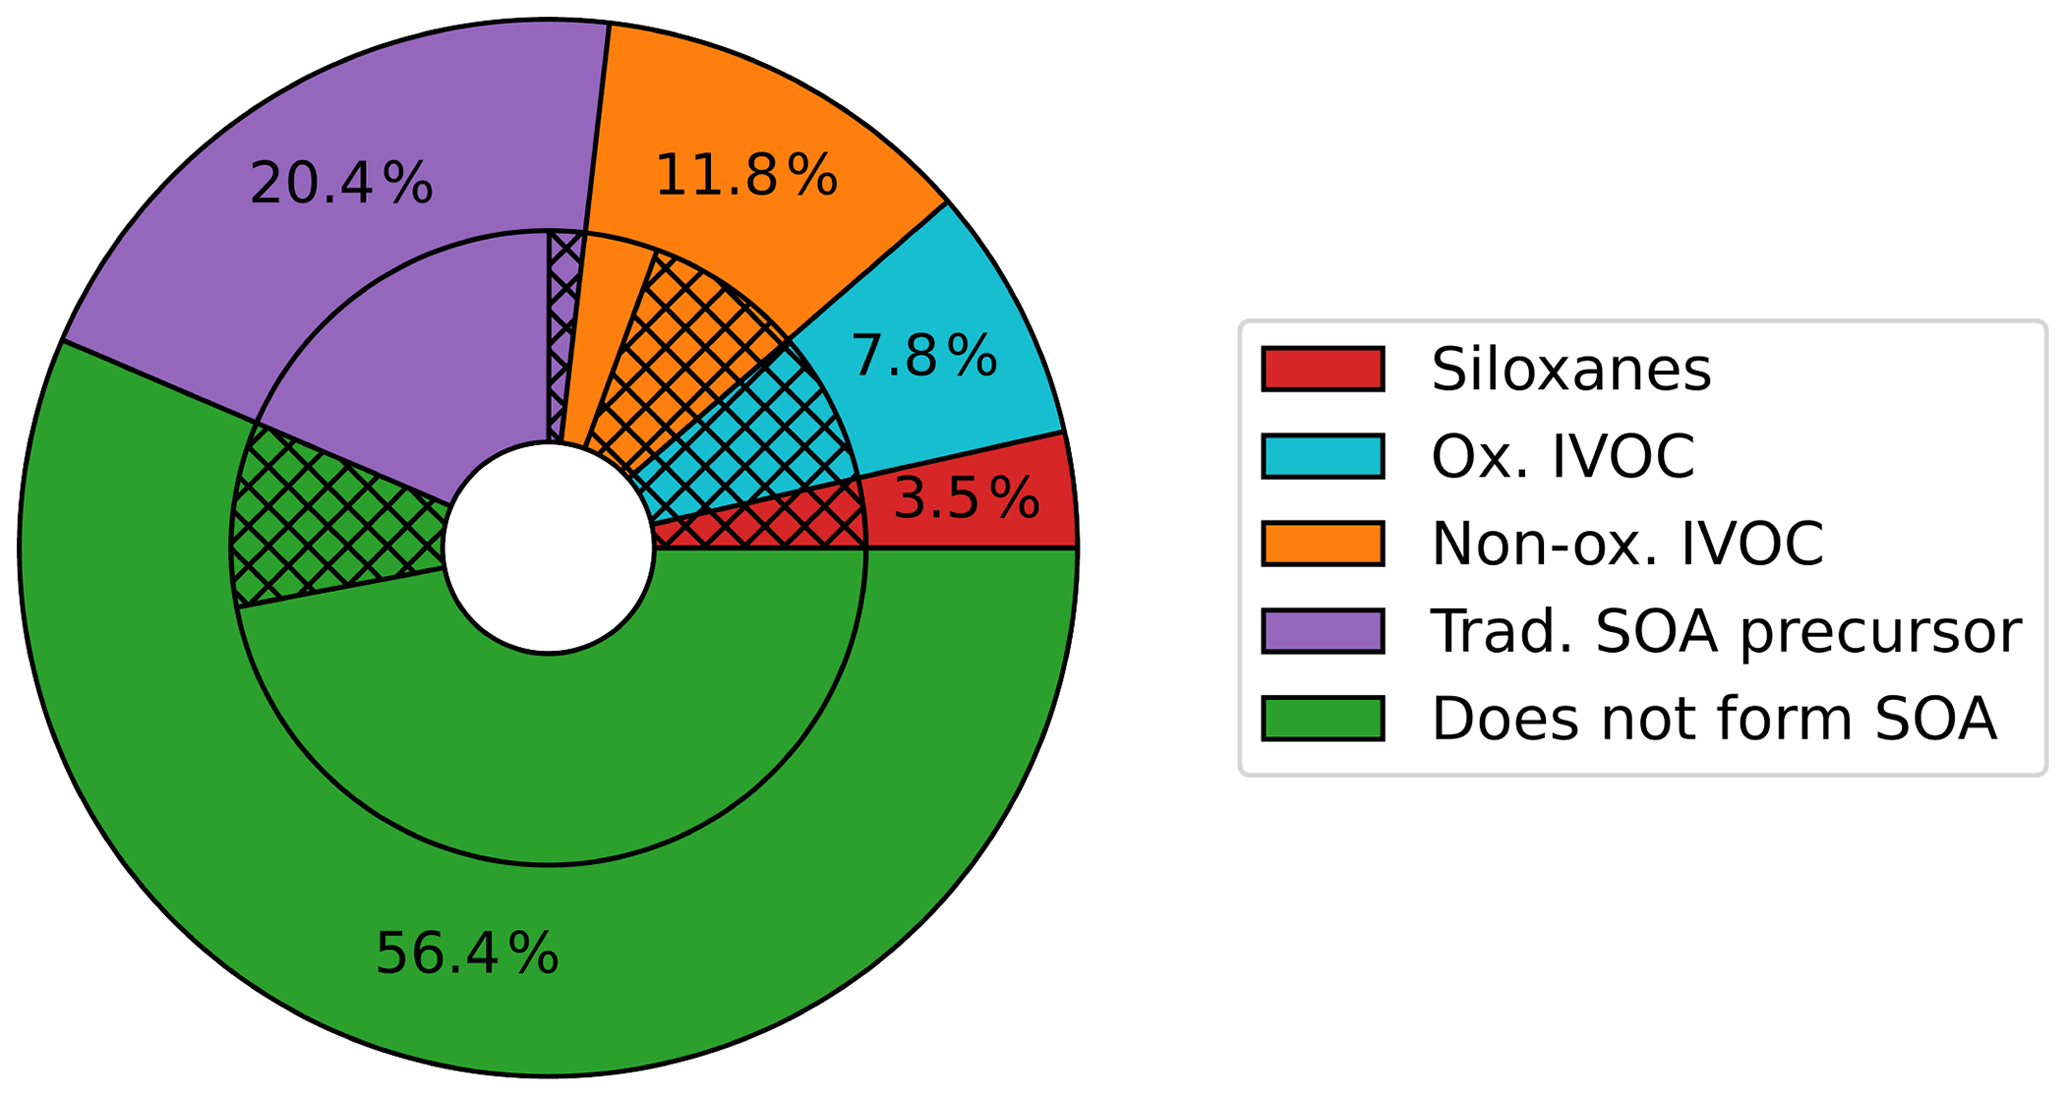
Figure 2Percentage of the VCP emissions assigned to each category of CMAQ surrogates using the SAPRC07TIC_AE7I_VCP speciation profiles. The total rate of VCP emissions in Los Angeles County is 8.3×10⁷ kg yr−1. The outer ring depicts the percentage of total VCPy-derived emissions assigned to each of the three new VCP categories (siloxanes in red, oxygenated IVOCs in blue, and nonoxygenated IVOCs in orange), the traditional SOA precursors described by existing model surrogates (purple), and existing surrogates that do not form SOA (green). The inner ring gives an indication of the original assignments of each of the outer ring categories. Hatching indicates emissions originally assigned to model surrogates that do not participate in model chemistry: IVOC, NVOL, and NROG. Solid colors represent other surrogate assignments.
Figure 2 indicates that in traditional model processing, precursors to SOA are systematically discarded from chemistry calculations. As described in Sect. 2.1, low-volatility emissions (i.e., NROG, NVOL, and IVOC) do not participate in SOA or radical chemistry in the traditional SAPRC07TIC_AE7I mechanism, which is a key issue in representing SOA mass. The inner ring of Fig. 2 depicts the fraction of each category that was originally assigned to inactive species (NROG, NVOL, and IVOC; hatched) versus other existing surrogates (solid). Of the total VCP emissions, 2.6×10⁷ kg yr−1 (30.7 %) was originally assigned to these surrogates and did not participate in any atmospheric chemistry processes. Using the new speciation and mechanism, 1.8×10⁷ kg yr−1 (21.2 % of total VCP emissions) was reassigned to surrogates that form SOA in the model (hatched inner ring – red, blue, orange, and purple). The remaining 8.0×10⁶ kg yr−1 (9.4 % of total VCP emissions, inner ring hatched green) is comprised of species with SOA yields of zero and was not reassigned to SOA-forming surrogates.
Averaged over the duration of the CalNex campaign, VCPs are predicted to be a larger source of IVOCs than mobile sources, as shown by the increase in gas-phase IVOC mass in the CMAQv5.3.2+VCP case compared to the zero VCP case (Fig. S2). Across mobile and VCP sources during CalNex, CMAQ predicts 6.4 µg m−3 of the gas-phase IVOC mass is nonoxygenated and 2.6 µg m−3 of the IVOC mass is oxygenated (Fig. S2). The observed campaign-average total IVOC concentration was 10.5 µg m−3 (Zhao et al., 2014), with 6.3 µg m−3 attributed to hydrocarbon-like IVOCs and 4.2 µg m−3 attributed to oxygenated IVOCs. However, this observed estimate of oxygenated IVOCs is conservative (lower bound) based on the experimental method employed by Zhao et al. (2014). Thus, the predicted nonoxygenated IVOC mass, which includes contributions from both mobile and VCP sources, reproduces observations with high fidelity. CMAQ, which only considers IVOCs from VCP and mobile sectors, underpredicts the mass of oxygenated IVOCs by 38 %, suggesting additional missing products of oxidation or emissions.
The new SOA systems combined with traditional SOA precursors in CMAQ resulted in an effective SOA yield for the VCP sector – defined as the emission-weighted average of the individual species' mass-based SOA yields – of 5.6 % for Los Angeles County. This Los Angeles County yield is in good agreement with the work of Qin et al. (2021), which found that a 5 % yield led to SOA predictions that were consistent with ambient observational constraints. The US effective VCP SOA yield (5.3 %) is only slightly lower than the yield expected for Los Angeles, due to differences stemming from the variability in the composition of VCP emissions nationwide versus in Los Angeles.
3.2 CMAQ results – SOA, ozone, and formaldehyde
Modeled PM1 SOA increased considerably in response to the newly implemented VCP emissions and chemistry, bringing model predictions into closer agreement with observations. Daily maximum PM1 SOA concentrations increased from 1.4 µg m−3 (−79 % mean bias) in the zero VCP case to 2.8 µg m−3 (−58 % mean bias) in the CMAQv5.3.2+VCP case, compared to the observed peak value of 6.6 µg m−3 (Fig. 3a). The diurnal distributions resulted from photochemistry and the sinusoidal distribution of VCP emissions that peak at 12:00 LT. Modeled PM1 SOA concentrations improved for all mass loadings and all hours of the day, with the slope of modeled-versus-observed concentrations increasing from 0.23 in the zero VCP case to 0.43 in the CMAQv5.3.2+VCP case (Fig. 4a). Results for the CMAQv5.3.2 case are given in Figs. S3 and S4. Modeled PM2.5 SOA displayed similar behavior to PM1 SOA; i.e., the organic fraction and secondary organic fraction of PM2.5 were only marginally smaller than the corresponding fractions of PM1 and followed the same diurnal pattern.
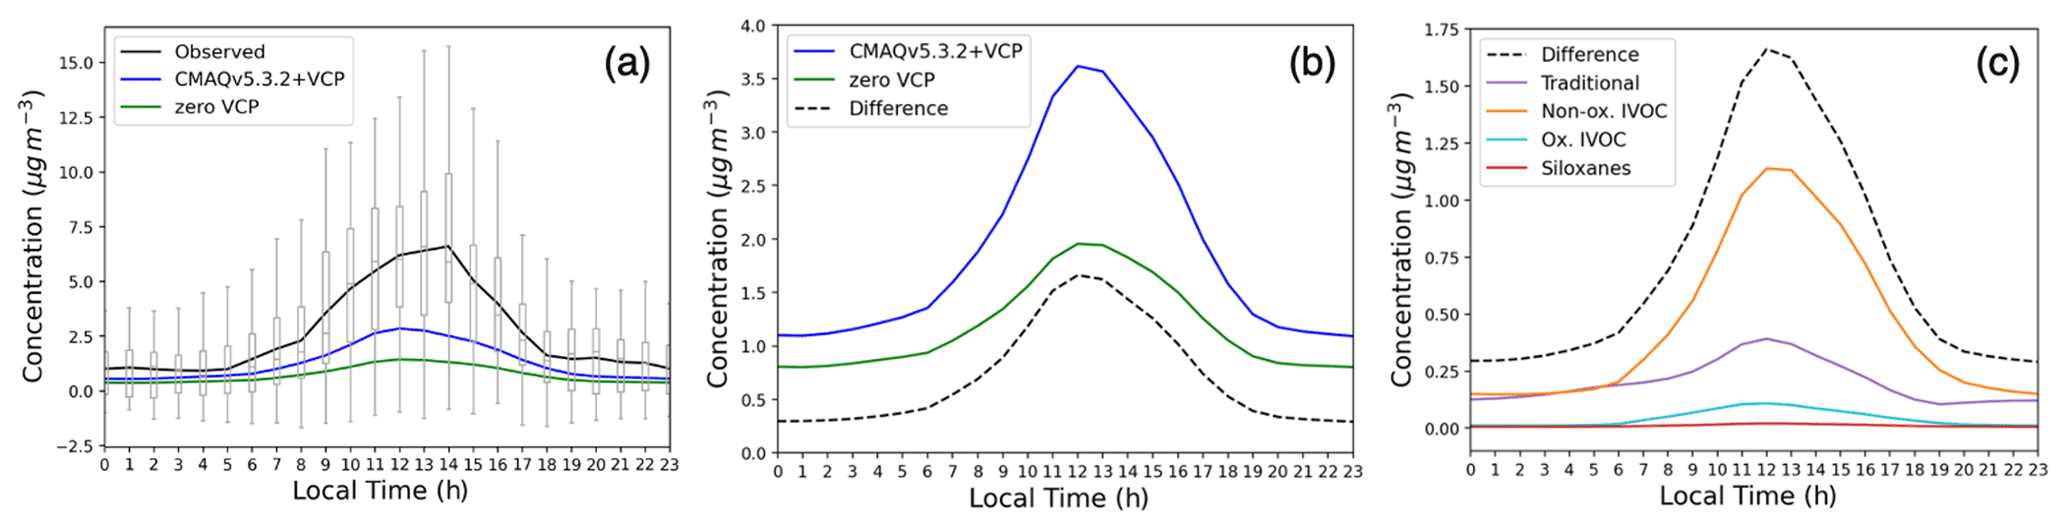
Figure 3(a) Average hourly concentrations of background-corrected PM1 SOA observed and simulated by the zero VCP and CMAQv5.3.2+VCP modeling cases 15 May–15 June. Boxes and whiskers show all hourly concentrations observed by the AMS at the CalNex site. A constant background value was removed from all observed concentrations according to the method in Hayes et al. (2015). The background value of each simulation was determined by averaging the lower 50 % of hourly concentrations from 00:00 to 04:00 LT and subtracting that from each curve. (b) Average hourly concentration of total (not size-resolved) SOA for the two simulation cases and their difference (CMAQv5.3.2+VCP – zero VCP). (c) Difference in hourly concentrations of total SOA by category.
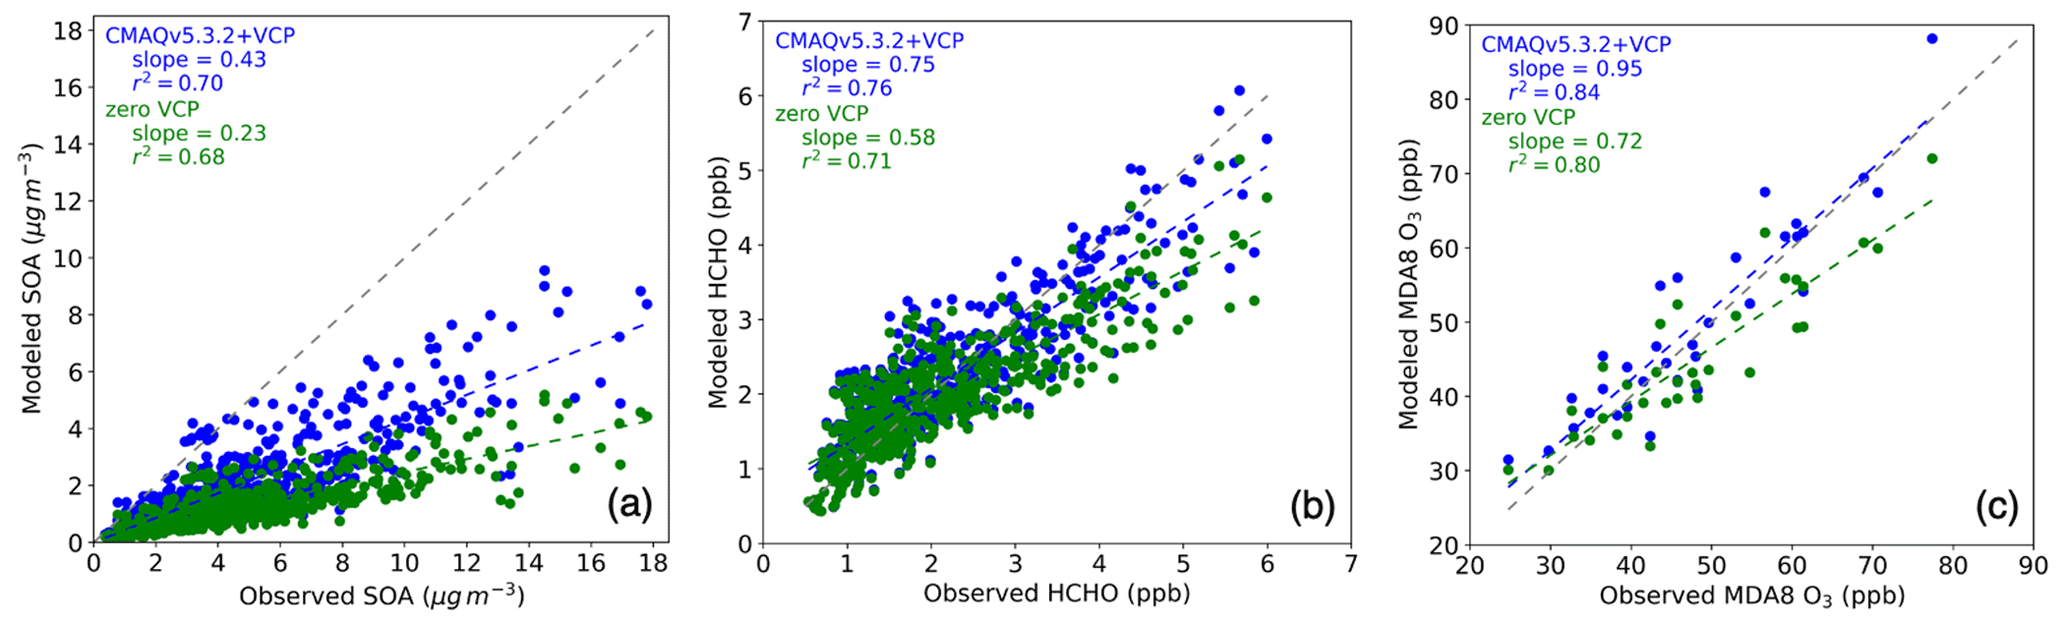
Figure 4Modeled concentrations predicted by CMAQ zero VCP case (green) and CMAQv5.3.2+VCP case (blue) vs. observations from the CalNex Pasadena ground site. The line with a slope of 1 is indicated with a dashed gray line. (a) Hourly PM1 SOA. (b) Hourly formaldehyde (HCHO). (c) MDA8 O3. Background values were not removed from any panels.
The difference between hourly averaged total (i.e., not size-resolved) SOA concentrations in the zero VCP and CMAQv5.3.2+VCP cases is shown in Fig. 3b, and the contributions to that difference from categories of SOA surrogates are shown in Fig. 3c. Of the three new categories of VCP emissions, nonoxygenated IVOC precursors formed the most SOA in CMAQ. The increased SOA from the nonoxygenated IVOC VCP precursors reached a peak concentration of 1.14 µg m−3, equal to 69 % of the total noontime difference. This can be explained by the high SOA yields of the individual species (Fig. S1) and the model surrogates.
SOA from oxygenated IVOC VCP precursors reached a peak concentration of 0.11 µg m−3 (6.7 % of the SOA difference). While oxygenated IVOC emissions were similar in abundance to nonoxygenated IVOC emissions (Fig. 2), these species lead to less SOA formation due to their lower SOA yields (Fig. S1); higher degrees of oxygenation tend to promote fragmentation upon reaction with OH (Jimenez et al., 2009), producing smaller molecules with higher volatilities and lower potential to form SOA. It is possible that the net yield of modeled SOA from oxygenated IVOC precursors will increase as the results from more laboratory studies become available or if a more detailed model is used. For example, particle-phase oligomerization reactions from oxygenated IVOC precursors would produce nonvolatile aerosol products, but this chemistry has not yet been investigated in an atmospheric chamber.
Siloxanes formed very little SOA, reaching a maximum of 21 ng m−3 (1.3 % of the SOA difference) at noon. Despite having nonnegligible SOA yields (Fig. S1) and emission rates (Fig. 2), siloxanes react with OH on long timescales (Table 1). As such, this results in low localized SOA mass, which is consistent with other modeling and laboratory studies that have predicted siloxanes to form SOA on the order of ng m−3 or less (Charan et al., 2021; Milani et al., 2021; Janechek et al., 2017). The low resultant SOA mass demonstrates that while gas-phase siloxanes serve as a useful tracer for personal care product and adhesive emissions from VCPs (Gkatzelis et al., 2021), particle-phase products from siloxane oxidation may not form quickly enough to serve as a reliable tracer for these emissions.
While traditional species accounted for the greatest fraction of VCP SOA precursor emissions that lead to SOA formation (Fig. 2), they contributed only 23 % (0.39 µg m−3) of the increased noontime SOA in the CMAQv5.3.2+VCP case. These traditional SOA precursors form SOA less efficiently than the IVOC surrogates (Fig. S1), so they result in less SOA formation than IVOCs despite higher emissions.
While this work indicates oxygenated IVOCs form much less SOA than nonoxygenated IVOCs, more work is needed to determine if this result is robust across all emission sectors and in future conditions. Oxygenated IVOCs represent a class of emissions that has traditionally been discarded from regional models but has become an important research focus with the rising importance of VCP emissions (Khare and Gentner, 2018). The contribution of oxygenated IVOCs and siloxanes to ambient conditions may be spatially variable and continue to evolve as product formulations shift towards exempt VOCs that tend to be oxygenated. Oxygenated IVOCs from other emission sources, such as meat cooking or wood burning, could be abundant but were not considered here. Additionally, we do not know if SOA from these precursors has a health impact higher or lower than that of average PM2.5.
The SOA from VCP IVOCs reached a daily maximum of 1.25 µg m−3 on average at noon (Fig. 3c). IVOCs from mobile sources contributed an additional 1.1 µg m−3 at noon (Lu et al., 2020). Therefore this updated CMAQ model predicted a total IVOC-derived SOA concentration of 2.35 µg m−3, equivalent to 35 % of the total observed above-background PM1 SOA concentration (6.6 µg m−3). Previous work stated that 40 %–85 % of above-background SOA concentrations in Pasadena are attributable to S/IVOCs (Hayes et al., 2015), suggesting that additional processes are still needed in the model. This will be discussed further in Sect. 3.3.
Formaldehyde is one of the most abundant VOCs in the atmosphere, and observations of this compound can serve many purposes. Biomass burning, vehicles, and other urban sources emit formaldehyde, and because of its short lifetime (∼ hours), it can serve as a proxy for local organic emissions. It is also formed in the atmosphere when VOCs undergo radical reactions, oxidize, and fragment, so it serves as an indicator for SOA chemistry since it is formed by many of the same reactions that also lead to SOA formation (Seinfeld and Pandis, 2016). In addition, it is depleted by photolysis and is an important source of radical initiation reactions (Griffith et al., 2016). Formaldehyde can be retrieved directly by satellites (Levelt et al., 2018), which can be used to validate ground data, evaluate model predictions, and predict OA concentrations remotely (Liao et al., 2019). For all of these reasons, formaldehyde is a useful indicator of VOC chemistry in a model.
Predicted formaldehyde concentrations improved in response to the new VCP emissions and chemistry, indicating that model updates improve the representation of VOC chemistry beyond SOA in the model. Similarly to predicted SOA, formaldehyde concentrations increased at all times, with the ratio of modeled-to-observed values increasing from 0.58 in the zero VCP case to 0.75 in the CMAQv5.3.2+VCP case (Fig. 4b). The diurnal profile of hourly averaged formaldehyde concentrations is given in Fig. S3. This work focused primarily on improving the representation of SOA from VCPs, so radical chemistry for the new SOA precursors was treated using existing alkane-like behavior (surrogates ALK1, ALK2, ALK3, ALK4, ALK5). With a more detailed representation of VCP radical chemistry, predicted formaldehyde concentrations may improve further.
The bias in predicted ozone concentrations was also reduced by including VCP chemistry. The ratio of modeled-to-observed concentrations increased from 0.72 in the zero VCP case to 0.95 in the CMAQv5.3.2+VCP case (Fig. 4c). Improved ozone is also seen for all operational AQS sites in the California modeling domain, with the modeled-to-observed ratio increasing from 0.63 in the zero VCP case to 0.70 in the CMAQv5.3.2+VCP case (Fig. S5). The diurnal profile of hourly averaged ozone concentrations is given in Fig. S3. This study focused on VCP behavior in relation to SOA formation and used existing model species to capture ozone formation. Future work focusing on the ozone chemistry of VCPs could change the magnitude and diurnal profile of predicted ozone.
SOA can be facilitated by increases in oxidant abundance and chemical pathways from precursors to semivolatile or low-volatility products. Average noontime total SOA mass increased from 1.96 µg m−3 in the zero VCP case to 3.62 µg m−3 in the CMAQv5.3.2+VCP case (Fig. 3b), an increase of 84.7 %. Ozone concentration can be used as an indicator of oxidant burdens and oxidation rates although OH concentrations may not scale linearly (Qin et al., 2021). The average noontime ozone concentration increased from 43.0 ppb in the zero VCP case to 49.2 ppb in the CMAQv5.3.2+VCP case (Fig. S3c), an increase of 14.4 %. Assuming ozone can serve as a proxy for oxidation rates, the improved ozone concentration suggests that ∼ 14.4 % of increased model SOA concentrations are due to an increase in the oxidant burden and oxidation rates. The SOA mass increased by a larger percentage (84.7 %), indicating emissions and chemistry updates combined were approximately 5 times [] more effective than enhanced oxidant levels alone in increasing SOA. This is consistent with the work of Qin et al. (2021), which found that the lack of key emitted precursors in models – rather than their associated radical chemistry – had the largest impact on PM2.5 formation. Additionally, we note that the default CMAQ model (CMAQv5.3.2) with baseline chemistry and VCP emissions predicted about the same amount of SOA as the zero VCP case (Fig. S3a). In contrast, ozone increased in the default CMAQv5.3.2 model with VCPs (Fig. S3c). Since the oxidant burden increased noticeably in the CMAQv5.3.2 case but did not equate to a large increase in PM1 SOA, results suggest the oxidant level alone does not have a large influence on enhancing SOA if the relevant precursor pathways are not also implemented.
The response of formaldehyde can similarly be compared to the change in oxidant burden due to VCPs. At noontime, average formaldehyde increased from 2.41 ppb in the zero VCP case to 2.80 ppb in the CMAQv5.3.2+VCP case, an increase of 16.2 %. As above, we attribute ∼ 14.4 % of the increase in pollutant concentration to the increase in oxidation rates. While formaldehyde does contribute to the oxidant burden via photolysis and radical initiation, the contribution of formaldehyde to the ROx radical budget is likely small and on the order of 10 % (e.g., Griffith et al., 2016; Kaiser et al., 2015; Luecken et al., 2018). Thus, the increase in formaldehyde concentrations between simulation cases is likely due primarily to the increase in the oxidation rate. The increase in formaldehyde between simulation cases, therefore, cannot be largely attributed to the addition of S/IVOC emissions and their ability to form formaldehyde as a byproduct of oxidation. This is consistent with the work of Coggon et al. (2021), which showed that vehicle VOCs perturb formaldehyde to a larger degree than VCP VOCs do, suggesting that VCP emissions and fragmentation chemistry may not be directly responsible for formaldehyde but rather modulate formaldehyde formation via changes in oxidant abundance.
3.3 Features of remaining model bias
The residual PM1 SOA bias in Pasadena is well correlated with ambient temperature (Fig. 5a). PM1 SOA bias is defined as modeled hourly concentrations minus observed hourly concentrations. At cooler temperatures in the overnight hours, bias is low and fluctuates around zero. However, as temperature increases towards midday and SOA concentrations increase, the bias becomes more negative, indicating greater model underprediction.
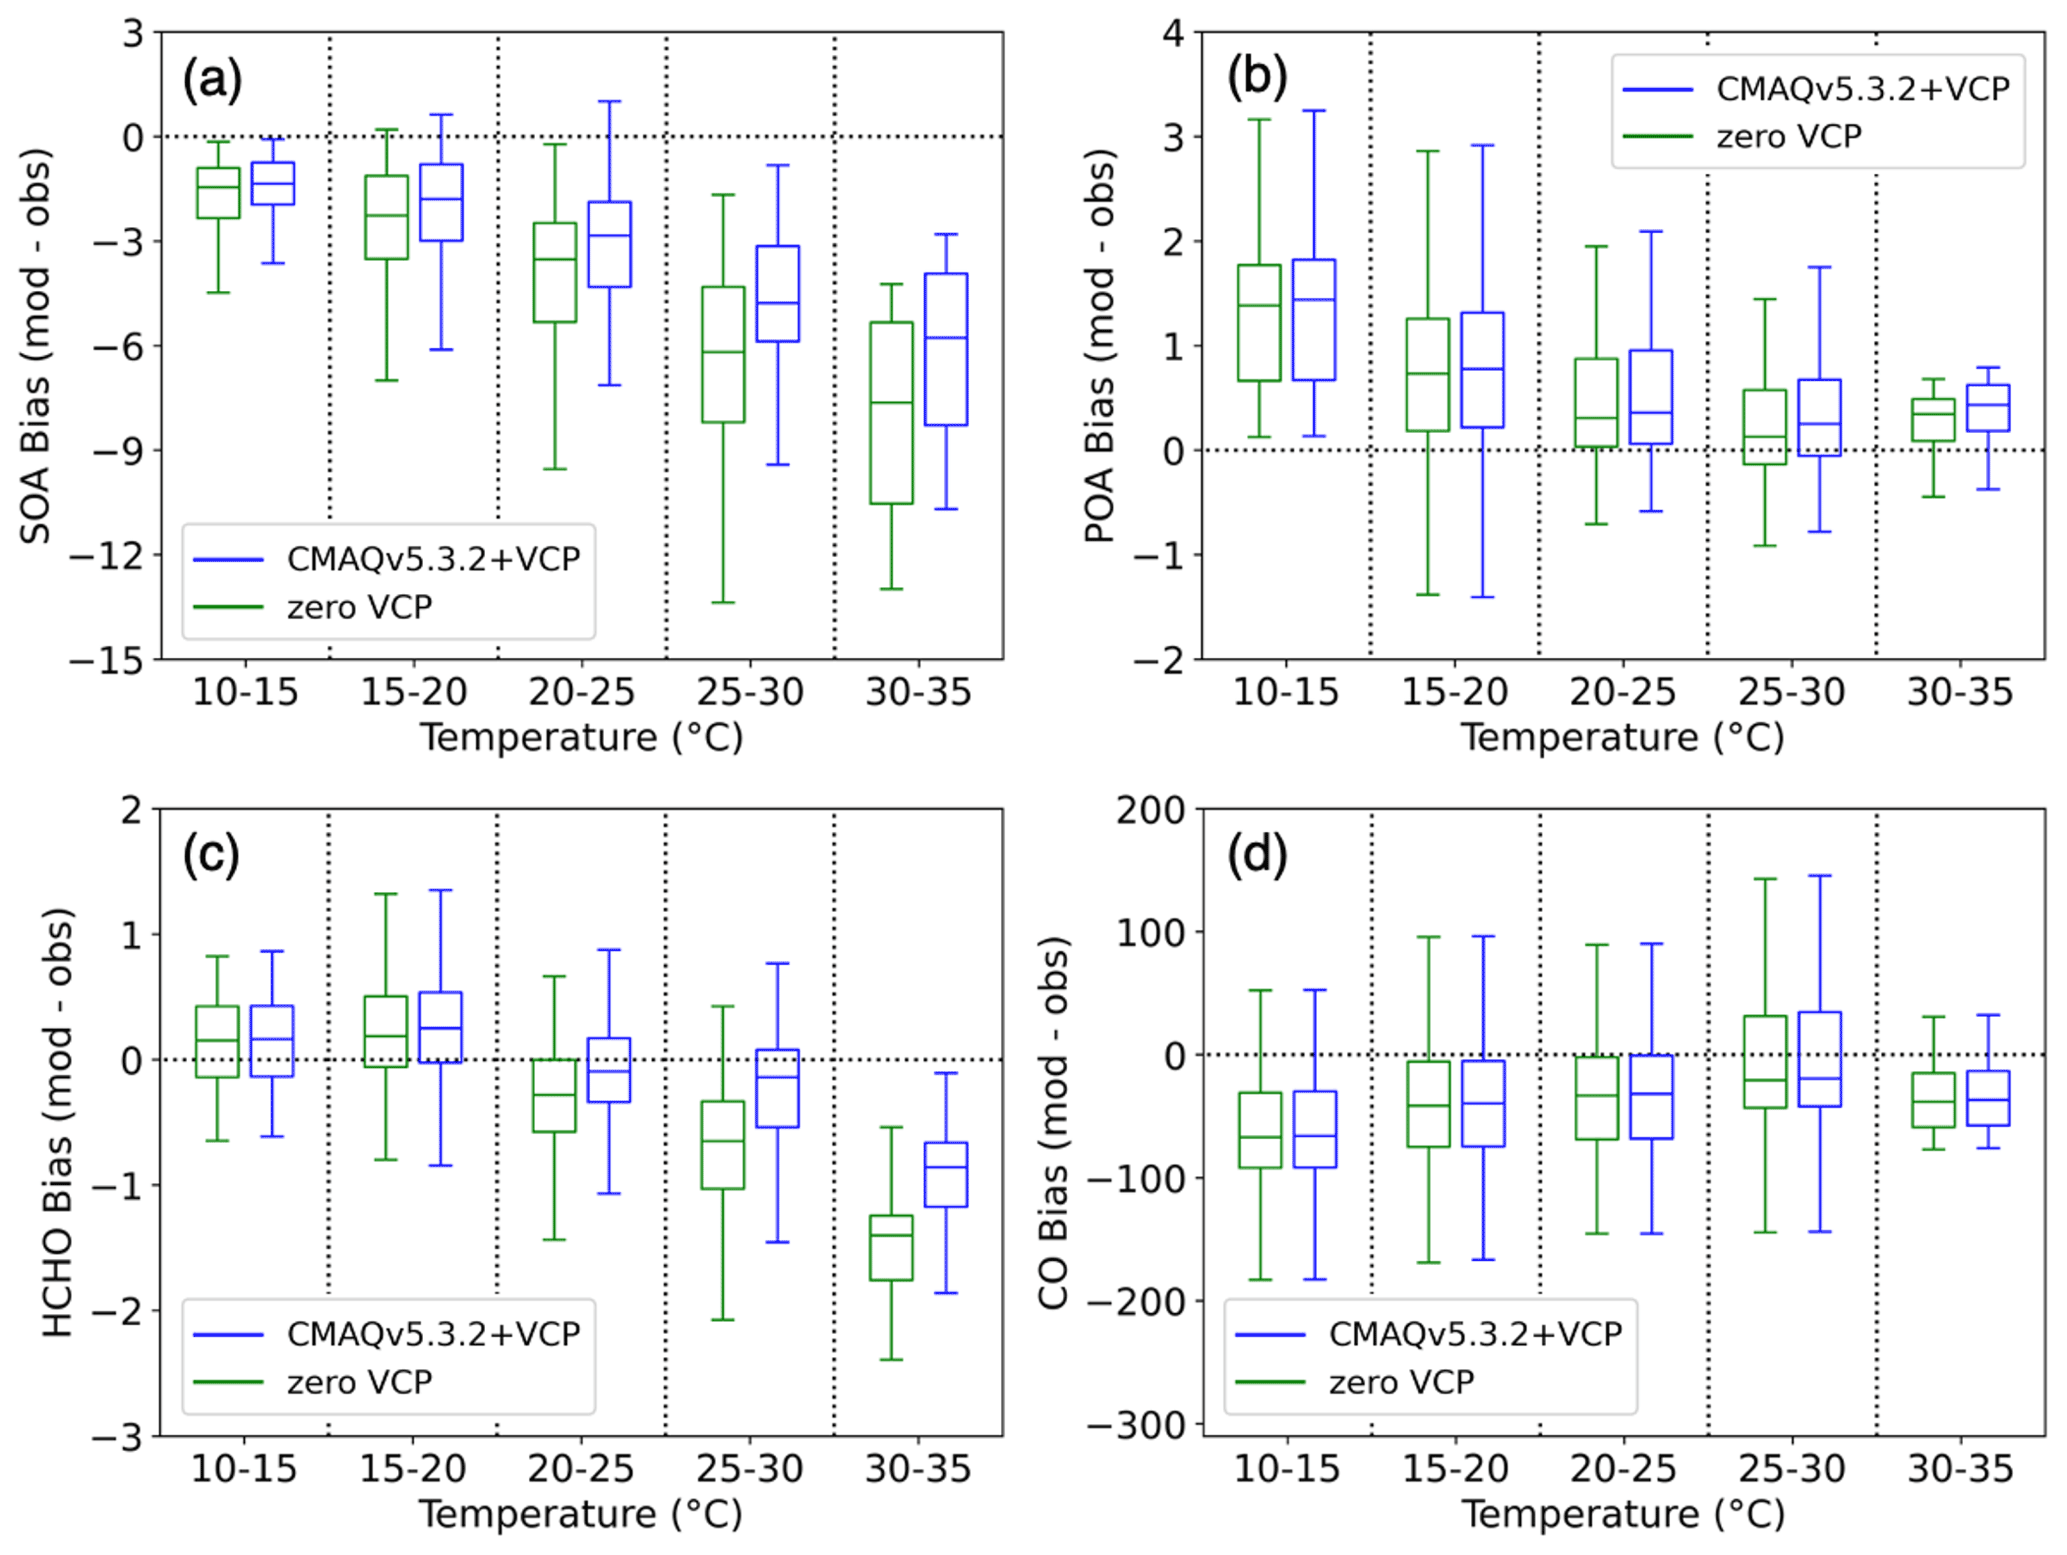
Figure 5Bias (modeled − observed) of hourly concentrations vs. modeled temperature for the zero VCP case (green) and CMAQv5.3.2+VCP case (blue). Hourly concentrations are binned into five temperature ranges of 5 ∘C each, and the data in each bin are represented by a box-and-whisker plot. The horizontal midline depicts the median of the data; the edges of the box extend from the lower to upper quartile of the data, and the whiskers extend from the minimum to the maximum of the data. (a) PM1 SOA bias (µg m−3). (b) PM1 POA bias (µg m−3). (c) Formaldehyde (HCHO) bias (ppb). (d) CO bias (ppb).
SOA concentrations can be a function of temperature based on precursor emissions and chemistry throughout the day. Previous work has demonstrated that observed OA in Los Angeles is positively correlated with temperature, and declining OA concentrations have been due largely to reductions in temperature-independent OA. Because this corresponds to a decline in anthropogenic emissions, Nussbaumer and Cohen (2021) suggest that anthropogenically derived OA is largely temperature-independent while biogenically derived OA is largely temperature-dependent. Modeled OA is positively correlated with temperature, consistent with the observed Los Angeles OA, and is driven by the larger, secondary portion of OA, rather than POA (Fig. S7). However, the improvement to predicted SOA between simulation cases was seen unequally at different temperatures, as indicated by the larger reduction in absolute model bias at higher temperatures (Fig. 5a). This suggests that the SOA derived from VCP species has a temperature-dependent response, in addition to the biogenic emissions cited in Nussbaumer and Cohen (2021). In particular, because nonoxygenated IVOCs were the dominant source of increased SOA predicted by the CMAQv5.3.2+VCP simulation, this work suggests that S/IVOCs are an important source of temperature-dependent SOA in Los Angeles.
Because S/IVOCs have been shown to be a major constituent of modeled SOA and contribute to the correlation between SOA bias and temperature, other sources of S/IVOC emissions may account for some of the remaining residual SOA bias in the model. For example, asphalt emissions are proposed to contribute 8 %–30 % of total S/IVOC emissions in the South Coast Air Basin in southern California and have SOA mass yields exceeding 10 % (Khare et al., 2020). Their potential to form SOA is very large, and because asphalt emissions are highly temperature-dependent, the SOA increase would be seen largely around midday, resulting in an improvement in high-temperature SOA bias. In addition, the underprediction of oxygenated gas-phase IVOCs (Sect. 3.1) suggests that additional sources of oxygenated IVOC precursors may be missing from the complete inventory. One possible explanation of the temperature dependence of the SOA bias is that modeled SOA volatility is too high. But oxygenated SOA is nonvolatile and nonoxygenated IVOC SOA is continually processed to lower volatility through gas-phase OH oxidation.
Formaldehyde, CO, and POA are often used to understand the atmospheric evolution of SOA because they are products of the same anthropogenic activity and/or VOC oxidation chemistry that forms SOA. As such, they can be used to better understand the remaining sources of error in the model. POA is formed via combustion from vehicles, industrial processes, cooking, and biomass burning (Jathar et al., 2014; Huffman et al., 2009). CO and formaldehyde are emitted from many processes and formed as products of atmospheric VOC oxidation (Seinfeld and Pandis, 2016). These species are often used to understand the effect of dilution on SOA (Hayes et al., 2013). Dilution is caused by both atmospheric transport away from emission sources and the change in planetary boundary layer (PBL) height over the diurnal cycle. VCPs do not emit POA, CO, or formaldehyde, so any changes observed in their simulated concentrations were caused by chemical and physical processing in the existing model.
The POA bias did not express the same temperature dependence as SOA, and thus POA is not affected in the same way in the model by the processes causing the temperature dependence of SOA bias. Since VCPs do not emit POA and all other emission sources were consistent between simulation cases, the slight increase in POA concentrations between the zero VCP and CMAQv5.3.2+VCP cases (Figs. 5 and S7) is due to increased partitioning of semivolatile POA into the particle-phase resulting from higher total OA mass loadings (the treatment of semivolatile POA in CMAQ is described in Murphy et al., 2017). The POA bias can be exclusively attributed to errors in combustion source emissions inventories and meteorological effects. The combustion source inventories also include emissions of gaseous SOA precursors, which may be incorrectly modeled even if the POA emissions are accurate, especially for cooking and biomass burning sources. While the POA bias does decrease with increasing temperature, it is positive at all temperatures and does not have larger underpredictions at higher temperatures (Fig. 5b). Due to the inconsistency between POA and SOA behavior, errors influencing the emission and transport of POA can likely not be used to describe the temperature dependence of SOA bias. The POA bias also does not provide information about the error in vapor emissions from combustion sources – including S/IVOCs – and their temperature dependence, and improving combustion emissions inventories may help to close the model–observation gap for SOA.
CO is often used to account for the effects of dilution by scaling SOA to CO enhancement (ΔCO = CO − CObackground). Negligible changes in the CO concentration were found between simulation cases considered here (Fig. S3), and the model CO bias is uncorrelated with temperature (Fig. 5d). The consistency of predicted CO concentration between cases implies that CO is not affected by the emissions changes to the VCP sector and thus cannot separate SOA formation efficiency from a lack of emitted precursors. CO enhancement serves as an effective indicator and correction factor for mobile source emissions in urban areas (e.g., Hayes et al., 2013; Ensberg et al., 2014; Woody et al., 2016), but this work indicates that CO is not an effective tracer for distinguishing VCPs from other sources. The lack of correlation between CO and temperature also implies that errors in the modeled PBL height at different times of day (and potential impact on the dilution of pollutant concentrations) are not an important driver of the SOA bias temperature dependence.
In contrast to POA and CO, the formaldehyde bias demonstrated the same trend with temperature as SOA (Fig. 5c). This suggests that formaldehyde is affected by emissions, chemistry, and dilution changes similarly to SOA. This is supported by the stronger correlation seen between SOA and formaldehyde compared to the correlation between SOA and POA or CO (Fig. S8). Therefore, formaldehyde may provide more information about the errors in modeling VOC chemistry and possibly SOA formation. It is possible that remaining formaldehyde bias is due to missing formaldehyde emissions. The VCP inventory includes near-zero emissions of formaldehyde, but formaldehyde is emitted from wooden furniture and emission rates increase with temperature (Wang et al., 2021). This may account for some of the temperature dependence of formaldehyde bias but likely not the entirety since the VCP emissions inventory has been evaluated with select ambient VOC measurements with low error (Seltzer et al., 2021). One possible explanation of the temperature dependence of both the SOA and the formaldehyde biases is missing sources of emissions and resulting chemistry. Previous work has shown that formaldehyde formation is particularly sensitive to the emissions/chemistry of alkenes (e.g., isoprene) and, to a lesser extent, alkanes and aromatics (Luecken et al., 2018), so these precursors likely indicate missing emissions as a source of error in our model. While the radical chemistry of these hydrocarbon precursors is included in the model, additional missing chemistry may be causing some of the error. Chemical processes that have not been included in the mechanism include autooxidation (Crounse et al., 2013) – which forms low-volatility SOA – and formaldehyde potentially formed from the fragmentation of S/IVOC precursors into SOA. The inclusion of these missing emissions and/or chemistry would further impact oxidant levels, which we have shown to be an important source of modeled SOA and formaldehyde. As stated above, the behavior of POA and CO bias suggests that errors in combustion emissions and PBL height cannot fully describe the temperature dependence of SOA bias, and POA and CO are better indicators of mobile and industrial sources. Formaldehyde may instead serve as a better indicator of SOA production in urban areas where VCPs are important atmospheric constituents. While many factors may contribute to the temperature dependence of SOA and formaldehyde bias, future work must investigate the importance of these factors, and tracking the response of formaldehyde to these changes alongside SOA could provide insight.
We have shown that VCPs are a major source of SOA in urban atmospheres by introducing updated emissions and VCP-relevant chemistry into CMAQ that better represents SOA precursors emitted from these sources. This includes three new categories of emissions: siloxanes, oxygenated IVOCs, and nonoxygenated IVOCs. VCP emissions from the VCPy framework (Seltzer et al., 2021) were used to parameterize the new chemistry, and the mapping of VCP emitted species to model surrogates was reviewed and updated based on species structure, volatility, and estimated SOA yield.
The new model chemistry and emissions inventory doubles the predicted SOA concentrations above background levels, increasing the average daily maximum PM1 SOA concentration by 1.4 µg m−3, equating to a 21 % decrease in the absolute mean bias. Most of the increased SOA mass was formed from nonoxygenated IVOC VCP precursors, followed by SOA formed from traditional VOC precursors and oxygenated IVOC precursors, with little SOA formed from siloxanes. Improvements were additionally seen in simulated formaldehyde and ozone concentrations.
Future work should consider how VCP emissions have evolved over time. VCPy version 1.0 requires information about VCP product composition and usage patterns from broad sources, including product surveys, economic statistics, and population distributions. These metrics change over time and will affect both the speciation and emission rates of organic compounds from VCPs. Diurnal and seasonal patterns of VCP emissions should also be updated to reflect more recent observations (Gkatzelis et al., 2021).
The remaining error in VCP-derived SOA predictions may reflect our lack of understanding about the oxidation pathways of low-volatility and/or oxygenated species. More information is needed about the structure, volatility, and reactivity of the products of atmospheric oxidation reactions, plus the impacts of wall loss and NOx concentrations on SOA yields from experiments, so that models and parameterizations like the VBS can be developed. As these data become available, models can be improved to represent SOA formation from oxygenated precursors and S/IVOCs emitted from VCPs. In addition, the correlation between SOA concentration bias and temperature suggests residual model error is associated with missing sources of S/IVOC emissions, including emissions from asphalt (Khare et al., 2020), combustion sources, or other S/IVOCs that have large potential to form SOA. The formaldehyde bias demonstrates a similar relationship to temperature to the SOA bias, implying that investigations of formaldehyde could provide insight into VOC chemistry leading to the formation of SOA from VCPs. Including S/IVOC emissions and their atmospheric chemistry will be important for future air quality models.
CalNex observations are publicly available at https://www.esrl.noaa.gov/csd/groups/csd7/measurements/2010calnex/ (last access: 7 July 2021) (CalNex measurement data, 2012). The full VCPy dataset is available by downloading VCPyv1.0 at https://doi.org/10.23719/1520157 (U.S. EPA, 2021a). The SAPRC07TIC_AE7I_VCP speciation profile, CMAQ chemical mechanism source code, and CMAQ output are posted at https://doi.org/10.23719/1522655 (U.S. EPA, 2021b).
The supplement related to this article is available online at: https://doi.org/10.5194/acp-21-18247-2021-supplement.
HOTP, KMS, and EAP designed the research. EAP and KMS implemented the mechanism in 65 CMAQv5.3.2 and ran the simulations. EAP, KMS, HOTP, BNM, MQ, and JHS participated in data analysis and discussions. EAP drafted the paper with input from all co-authors.
The contact author has declared that neither they nor their co-authors have any competing interests.
Although this work was contributed by research staff in the Environmental
Protection Agency and has been reviewed and approved for publication, it
does not reflect official policy of the EPA. The views expressed in this
document are solely those of the authors and do not necessarily reflect those of
the agency. EPA does not endorse any products or commercial services
mentioned in this publication.
Publisher’s note: Copernicus Publications remains neutral with regard to jurisdictional claims in published maps and institutional affiliations.
The authors thank Christopher Cappa, Wyat Appel, and Ben Schulze for modeling support and helpful discussions.
Karl Seltzer and Elyse Pennington were supported by the Oak Ridge Institute for Science and Education (ORISE) Research Participation Program for the US Environmental Protection Agency (EPA). Elyse Pennington was also supported by a Global Research Outreach (GRO) award from the Samsung Advanced Institute of Technology (SAIT).
This paper was edited by Manabu Shiraiwa and reviewed by three anonymous referees.
Appel, K. W., Bash, J. O., Fahey, K. M., Foley, K. M., Gilliam, R. C., Hogrefe, C., Hutzell, W. T., Kang, D., Mathur, R., Murphy, B. N., Napelenok, S. L., Nolte, C. G., Pleim, J. E., Pouliot, G. A., Pye, H. O. T., Ran, L., Roselle, S. J., Sarwar, G., Schwede, D. B., Sidi, F. I., Spero, T. L., and Wong, D. C.: The Community Multiscale Air Quality (CMAQ) model versions 5.3 and 5.3.1: system updates and evaluation, Geosci. Model Dev., 14, 2867–2897, https://doi.org/10.5194/gmd-14-2867-2021, 2021.
Baker, K. R., Carlton, A. G., Kleindienst, T. E., Offenberg, J. H., Beaver, M. R., Gentner, D. R., Goldstein, A. H., Hayes, P. L., Jimenez, J. L., Gilman, J. B., de Gouw, J. A., Woody, M. C., Pye, H. O. T., Kelly, J. T., Lewandowski, M., Jaoui, M., Stevens, P. S., Brune, W. H., Lin, Y.-H., Rubitschun, C. L., and Surratt, J. D.: Gas and aerosol carbon in California: comparison of measurements and model predictions in Pasadena and Bakersfield, Atmos. Chem. Phys., 15, 5243–5258, https://doi.org/10.5194/acp-15-5243-2015, 2015.
Bash, J. O., Baker, K. R., and Beaver, M. R.: Evaluation of improved land use and canopy representation in BEIS v3.61 with biogenic VOC measurements in California, Geosci. Model Dev., 9, 2191–2207, https://doi.org/10.5194/gmd-9-2191-2016, 2016.
Binkowski, F. S. and Roselle, S. J.: Models-3 Community Multiscale Air Quality (CMAQ) model aerosol component 1. Model description, J. Geophys. Res.-Atmos., 108, 4183, https://doi.org/10.1029/2001JD001409, 2003.
CalNex measurement data: NOAA Earth System Research Laboratory, CalNex 2010 [data set], available at: https://www.esrl.noaa.gov/csd/groups/csd7/measurements/2010calnex/ (last access: 7 July 2021), 2012.
Cappa, C. D. and Wilson, K. R.: Multi-generation gas-phase oxidation, equilibrium partitioning, and the formation and evolution of secondary organic aerosol, Atmos. Chem. Phys., 12, 9505–9528, https://doi.org/10.5194/acp-12-9505-2012, 2012.
Charan, S. M., Buenconsejo, R. S., and Seinfeld, J. H.: Secondary organic aerosol yields from the oxidation of benzyl alcohol, Atmos. Chem. Phys., 20, 13167–13190, https://doi.org/10.5194/acp-20-13167-2020, 2020.
Charan, S. M., Huang, Y., Buenconsejo, R. S., Li, Q., Cocker III, D. R., and Seinfeld, J. H.: Secondary Organic Aerosol Formation from the Oxidation of Decamethylcyclopentasiloxane at Atmospherically Relevant OH Concentrations, Atmos. Chem. Phys. Discuss. [preprint], https://doi.org/10.5194/acp-2021-353, in review, 2021.
Coggon, M. M., McDonald, B. C., Vlasenko, A., Veres, P. R., Bernard, F., Koss, A. R., Yuan, B., Gilman, J. B., Peischl, J., Aikin, K. C., DuRant, J., Warneke, C., Li, S.-M., and de Gouw, J. A.: Diurnal Variability and Emission Pattern of Decamethylcyclopentasiloxane (D5) from the Application of Personal Care Products in Two North American Cities, Environ. Sci. Technol., 52, 5610–5618, https://doi.org/10.1021/acs.est.8b00506, 2018.
Coggon, M. M., Gkatzelis, G. I., McDonald, B. C., Gilman, J. B., Schwantes, R. H., Abuhassan, N., Aikin, K. C., Arend, M. F., Berkoff, T. A., Brown, S. S., Campos, T. L., Dickerson, R. R., Gronoff, G., Hurley, J. F., Isaacman-VanWertz, G., Koss, A. R., Li, M., McKeen, S. A., Moshary, F., Peischl, J., Pospisilova, V., Ren, X., Wilson, A. Wu, Y., Trainer, M., and Warneke, C.: Volatile chemical product emissions enhance ozone and modulate urban chemistry, P. Natl. Acad. Sci. USA, 118, e2026653118, https://doi.org/10.1073/pnas.2026653118, 2021.
Crounse, J. D., Nielsen, L. B., Jørgensen, S., Kjaergaard, H. G., and Wennberg, P. O.: Autoxidation of Organic Compounds in the Atmosphere, J. Phys. Chem. Lett., 4, 3513–3520, https://doi.org/10.1021/jz4019207, 2013.
Donahue, N. M., Epstein, S. A., Pandis, S. N., and Robinson, A. L.: A two-dimensional volatility basis set: 1. organic-aerosol mixing thermodynamics, Atmos. Chem. Phys., 11, 3303–3318, https://doi.org/10.5194/acp-11-3303-2011, 2011.
Ensberg, J. J., Hayes, P. L., Jimenez, J. L., Gilman, J. B., Kuster, W. C., de Gouw, J. A., Holloway, J. S., Gordon, T. D., Jathar, S., Robinson, A. L., and Seinfeld, J. H.: Emission factor ratios, SOA mass yields, and the impact of vehicular emissions on SOA formation, Atmos. Chem. Phys., 14, 2383–2397, https://doi.org/10.5194/acp-14-2383-2014, 2014.
Epstein, S. A., Riipinen, I., and Donahue, N. M.: A Semiempirical Correlation between Enthalpy of Vaporization and Saturation Concentration for Organic Aerosol, Environ. Sci. Technol., 44, 743–748, https://doi.org/10.1021/es902497z, 2010.
Gkatzelis, G. I., Coggon, M. M., McDonald, B. C., Peischl, J., Aikin, K. C., Gilman, J. B., Trainer, M., and Warneke, C.: Identifying Volatile Chemical Product Tracer Compounds in U.S. Cities, Environ. Sci. Technol., 55, 188–199, https://doi.org/10.1021/acs.est.0c05467, 2021.
Goldstein, A. H. and Galbally, I. E.: Known and Unexplored Organic Constituents in the Earth's Atmosphere, Environ. Sci. Technol., 41, 1514–1521, https://doi.org/10.1021/es072476p, 2007.
Griffith, S. M., Hansen, R. F., Dusanter, S., Michoud, V., Gilman, J. B., Kuster, W. C., Veres, P. R., Graus, M., Gouw, J. A. de, Roberts, J., Young, C., Washenfelder, R., Brown, S. S., Thalman, R., Waxman, E., Volkamer, R., Tsai, C., Stutz, J., Flynn, J. H., Grossberg, N., Lefer, B., Alvarez, S. L., Rappenglueck, B., Mielke, L. H., Osthoff, H. D., and Stevens, P. S.: Measurements of hydroxyl and hydroperoxy radicals during CalNex-LA: Model comparisons and radical budgets, J. Geophys. Res.-Atmos., 121, 4211–4232, https://doi.org/10.1002/2015JD024358, 2016.
Hayes, P. L., Ortega, A. M., Cubison, M. J., Froyd, K. D., Zhao, Y., Cliff, S. S., Hu, W. W., Toohey, D. W., Flynn, J. H., Lefer, B. L., Grossberg, N., Alvarez, S., Rappenglück, B., Taylor, J. W., Allan, J. D., Holloway, J. S., Gilman, J. B., Kuster, W. C., de Gouw, J. A., Massoli, P., Zhang, X., Liu, J., Weber, R. J., Corrigan, A. L., Russell, L. M., Isaacman, G., Worton, D. R., Kreisberg, N. M., Goldstein, A. H., Thalman, R., Waxman, E. M., Volkamer, R., Lin, Y.H., Surratt, J. D., Kleindienst, T. E., Offenberg, J. H., Dusanter, S., Griffith, S., Stevens, P. S., Brioude, J., Angevine, W. M., and Jimenez, J. L.: Organic aerosol composition and sources in Pasadena, California, during the 2010 CalNex campaign, J. Geophys. Res.-Atmos., 118, 9233–9257, https://doi.org/10.1002/jgrd.50530, 2013.
Hayes, P. L., Carlton, A. G., Baker, K. R., Ahmadov, R., Washenfelder, R. A., Alvarez, S., Rappenglück, B., Gilman, J. B., Kuster, W. C., de Gouw, J. A., Zotter, P., Prévôt, A. S. H., Szidat, S., Kleindienst, T. E., Offenberg, J. H., Ma, P. K., and Jimenez, J. L.: Modeling the formation and aging of secondary organic aerosols in Los Angeles during CalNex 2010, Atmos. Chem. Phys., 15, 5773–5801, https://doi.org/10.5194/acp-15-5773-2015, 2015.
Hodzic, A., Aumont, B., Knote, C., Lee-Taylor, J., Madronich, S., and Tyndall, G.: Volatility dependence of Henry's law constants of condensable organics: Application to estimate depositional loss of secondary organic aerosols, Geophys. Res. Lett., 41, 4795–4804, https://doi.org/10.1002/2014GL060649, 2014.
Huffman, J. A., Docherty, K. S., Mohr, C., Cubison, M. J., Ulbrich, I. M., Ziemann, P. J., Onasch, T. B., and Jimenez, J. L.: Chemically-Resolved Volatility Measurements of Organic Aerosol from Different Sources, Environ. Sci. Technol., 43, 5351–5357, https://doi.org/10.1021/es803539d, 2009.
Hyslop, N. P.: Impaired visibility: The air pollution people see, Atmos. Environ., 43, 182–195, https://doi.org/10.1016/j.atmosenv.2008.09.067, 2009.
Intergovernmental Panel on Climate Change: Anthropogenic and Natural Radiative Forcing, in: Climate Change 2013 – The Physical Science Basis: Working Group I Contribution to the Fifth Assessment Report of the Intergovernmental Panel on Climate Change, Cambridge University Press, 659–740, https://doi.org/10.1017/CBO9781107415324.018, 2014.
Janechek, N. J., Hansen, K. M., and Stanier, C. O.: Comprehensive atmospheric modeling of reactive cyclic siloxanes and their oxidation products, Atmos. Chem. Phys., 17, 8357–8370, https://doi.org/10.5194/acp-17-8357-2017, 2017.
Janechek, N. J., Marek, R. F., Bryngelson, N., Singh, A., Bullard, R. L., Brune, W. H., and Stanier, C. O.: Physical properties of secondary photochemical aerosol from OH oxidation of a cyclic siloxane, Atmos. Chem. Phys., 19, 1649–1664, https://doi.org/10.5194/acp-19-1649-2019, 2019.
Jathar, S. H., Gordon, T. D., Hennigan, C. J., Pye, H. O. T., Pouliot, G., Adams, P. J., Donahue, N. M., and Robinson, A. L.: Unspeciated organic emissions from combustion sources and their influence on the secondary organic aerosol budget in the United States, P. Natl. Acad. Sci. USA, 111, 10473–10478, https://doi.org/10.1073/pnas.1323740111, 2014.
Jathar, S. H., Woody, M., Pye, H. O. T., Baker, K. R., and Robinson, A. L.: Chemical transport model simulations of organic aerosol in southern California: model evaluation and gasoline and diesel source contributions, Atmos. Chem. Phys., 17, 4305–4318, https://doi.org/10.5194/acp-17-4305-2017, 2017.
Jimenez, J. L., Canagaratna, M. R., Donahue, N. M., Prevot, A. S. H., Zhang, Q., Kroll, J. H., DeCarlo, P. F., Allan, J. D., Coe, H., Ng, N. L., Aiken, A. C., Docherty, K. S., Ulbrich, I. M., Grieshop, A. P., Robinson, A. L., Duplissy, J., Smith, J. D., Wilson, K. R., Lanz, V. A., Hueglin, C., Sun, Y. L., Tian, J., Laaksonen, A., Raatikainen, T., Rautiainen, J., Vaattovaara, P., Ehn, M., Kulmala, M., Tomlinson, J. M., Collins, D. R., Cubison, M. J., Dunlea, E. J., Huffman, J. A., Onasch, T. B., Alfarrap, M. R., Williams, P. I., Bower, K., Kondo, Y., Schneider, J., Drewnick, F., Borrmann, S., Weimer, S., Demerjian, K., Salcedo, D., Cottrell, L., Griffin, R., Takami, A., Miyoshi, T., Hatakeyama, S., Shimono, A., Sun, J. Y., Zhang, Y. M., Dzepina, K., Kimmel, J. R., Sueper, D., Jayne, J. T., Herndon, S. C., Trimborn, A. M., Williams, L. R., Wood, E. C., Middlebrook, A. M., Kolb, C. E., Baltensperger, U., and Worsnop, D. R.: Evolution of Organic Aerosols in the Atmosphere, Science, 326, 1525–1529, https://doi.org/10.1126/science.1180353, 2009.
Kaiser, J., Wolfe, G. M., Bohn, B., Broch, S., Fuchs, H., Ganzeveld, L. N., Gomm, S., Häseler, R., Hofzumahaus, A., Holland, F., Jäger, J., Li, X., Lohse, I., Lu, K., Prévôt, A. S. H., Rohrer, F., Wegener, R., Wolf, R., Mentel, T. F., Kiendler-Scharr, A., Wahner, A., and Keutsch, F. N.: Evidence for an unidentified non-photochemical ground-level source of formaldehyde in the Po Valley with potential implications for ozone production, Atmos. Chem. Phys., 15, 1289–1298, https://doi.org/10.5194/acp-15-1289-2015, 2015.
Khare, P. and Gentner, D. R.: Considering the future of anthropogenic gas-phase organic compound emissions and the increasing influence of non-combustion sources on urban air quality, Atmos. Chem. Phys., 18, 5391–5413, https://doi.org/10.5194/acp-18-5391-2018, 2018.
Khare, P., Machesky, J., Soto, R., He, M., Presto, A. A., and Gentner, D. R.: Asphalt-related emissions are a major missing nontraditional source of secondary organic aerosol precursors, Science Adv., 6, eabb9785, https://doi.org/10.1126/sciadv.abb9785, 2020.
Levelt, P. F., Joiner, J., Tamminen, J., Veefkind, J. P., Bhartia, P. K., Stein Zweers, D. C., Duncan, B. N., Streets, D. G., Eskes, H., van der A, R., McLinden, C., Fioletov, V., Carn, S., de Laat, J., DeLand, M., Marchenko, S., McPeters, R., Ziemke, J., Fu, D., Liu, X., Pickering, K., Apituley, A., González Abad, G., Arola, A., Boersma, F., Chan Miller, C., Chance, K., de Graaf, M., Hakkarainen, J., Hassinen, S., Ialongo, I., Kleipool, Q., Krotkov, N., Li, C., Lamsal, L., Newman, P., Nowlan, C., Suleiman, R., Tilstra, L. G., Torres, O., Wang, H., and Wargan, K.: The Ozone Monitoring Instrument: overview of 14 years in space, Atmos. Chem. Phys., 18, 5699–5745, https://doi.org/10.5194/acp-18-5699-2018, 2018.
Li, L. and Cocker, D. R.: Molecular structure impacts on secondary organic aerosol formation from glycol ethers, Atmos. Environ., 180, 206–215, https://doi.org/10.1016/j.atmosenv.2017.12.025, 2018.
Li, W., Li, L., Chen, C., Kacarab, M., Peng, W., Price, D., Xu, J., and Cocker, D. R.: Potential of select intermediate-volatility organic compounds and consumer products for secondary organic aerosol and ozone formation under relevant urban conditions, Atmos. Environ., 178, 109–117, https://doi.org/10.1016/j.atmosenv.2017.12.019, 2018.
Li, Y., Rodier, C., Lea, J. D., Harvey, J., and Kleeman, M. J.: Improving spatial surrogates for area source emissions inventories in California, Atmos. Environ., 247, 117665, https://doi.org/10.1016/j.atmosenv.2020.117665, 2021.
Liao, J., Hanisco, T. F., Wolfe, G. M., St. Clair, J., Jimenez, J. L., Campuzano-Jost, P., Nault, B. A., Fried, A., Marais, E. A., Gonzalez Abad, G., Chance, K., Jethva, H. T., Ryerson, T. B., Warneke, C., and Wisthaler, A.: Towards a satellite formaldehyde – in situ hybrid estimate for organic aerosol abundance, Atmos. Chem. Phys., 19, 2765–2785, https://doi.org/10.5194/acp-19-2765-2019, 2019.
Lim, S. S., Vos, T., Flaxman, A. D., Danaei, G., Shibuya, K., Adair-Rohani, H., AlMazroa, M. A., Amann, M., Anderson, H. R., Andrews, K. G., Aryee, M., Atkinson, C., Bacchus, L. J., Bahalim, A. N., Balakrishnan, K., Balmes, J., Barker-Collo, S., Baxter, A., Bell, M. L., Blore, J. D., Blyth, F., Bonner, C., Borges, G., Bourne, R., Boussinesq, M., Brauer, M., Brooks, P., Bruce, N. G., Brunekreef, B., Bryan-Hancock, C., Bucello, C., Buchbinder, R., Bull, F., Burnett, R. T., Byers, T. E., Calabria, B., Carapetis, J., Carnahan, E., Chafe, Z., Charlson, F., Chen, H., Chen, J. S., Cheng, A. T.-A., Child, J. C., Cohen, A., Colson, K. E., Cowie, B. C., Darby, S., Darling, S., Davis, A., Degenhardt, L., Dentener, F., Jarlais, D. C. D., Devries, K., Dherani, M., Ding, E. L., Dorsey, E. R., Driscoll, T., Edmond, K., Ali, S. E., Engell, R. E., Erwin, P. J., Fahimi, S., Falder, G., Farzadfar, F., Ferrari, A., Finucane, M. M., Flaxman, S., Fowkes, F. G. R., Freedman, G., Freeman, M. K., Gakidou, E., Ghosh, S., Giovannucci, E., Gmel, G., Graham, K., Grainger, R., Grant, B., Gunnell, D., Gutierrez, H. R., Hall, W., Hoek, H. W., Hogan, A., Hosgood, H. D., Hoy, D., Hu, H., Hubbell, B. J., Hutchings, S. J., Ibeanusi, S. E., Jacklyn, G. L., Jasrasaria, R., Jonas, J. B., Kan, H., Kanis, J. A., Kassebaum, N., Kawakami, N., Khang, Y.-H., Khatibzadeh, S., Khoo, J.-P., Kok, C., Laden, F., Lalloo, R., Lan, Q., Lathlean, T., Leasher, J. L., Leigh, J., Li, Y., Lin, J. K., Lipshultz, S. E., London, S., Lozano, R., Lu, Y., Mak, J., Malekzadeh, R., Mallinger, L., Marcenes, W., March, L., Marks, R., Martin, R., McGale, P., McGrath, J., Mehta, S., Memish, Z. A., Mensah, G. A., Merriman, T. R., Micha, R., Michaud, C., Mishra, V., Hanafiah, K. M., Mokdad, A. A., Morawska, L., Mozaffarian, D., Murphy, T., Naghavi, M., Neal, B., Nelson, P. K., Nolla, J. M., Norman, R., Olives, C., Omer, S. B., Orchard, J., Osborne, R., Ostro, B., Page, A., Pandey, K. D., Parry, C. D., Passmore, E., Patra, J., Pearce, N., Pelizzari, P. M., Petzold, M., Phillips, M. R., Pope, D., Pope, C. A., Powles, J., Rao, M., Razavi, H., Rehfuess, E. A., Rehm, J. T., Ritz, B., Rivara, F. P., Roberts, T., Robinson, C., Rodriguez-Portales, J. A., Romieu, I., Room, R., Rosenfeld, L. C., Roy, A., Rushton, L., Salomon, J. A., Sampson, U., Sanchez-Riera, L., Sanman, E., Sapkota, A., Seedat, S., Shi, P., Shield, K., Shivakoti, R., Singh, G. M., Sleet, D. A., Smith, E., Smith, K. R., Stapelberg, N. J., Steenland, K., Stöckl, H., Stovner, L. J., Straif, K., Straney, L., Thurston, G. D., Tran, J. H., Dingenen, R. V., Donkelaar, A. van, Veerman, J. L., Vijayakumar, L., Weintraub, R., Weissman, M. M., White, R. A., Whiteford, H., Wiersma, S. T., Wilkinson, J. D., Williams, H. C., Williams, W., Wilson, N., Woolf, A. D., Yip, P., Zielinski, J. M., Lopez, A. D., Murray, C. J., Ezzati, M.: A Comparative Risk Assessment of Burden of Disease and Injury Attributable to 67 Risk Factors and Risk Factor Clusters in 21 Regions, 1990–2010: A Systematic Analysis for the Global Burden of Disease Study 2010, Lancet, 380, 2224–2260, https://doi.org/10.1016/S0140-6736(12)61766-8, 2012.
Lu, Q., Murphy, B. N., Qin, M., Adams, P. J., Zhao, Y., Pye, H. O. T., Efstathiou, C., Allen, C., and Robinson, A. L.: Simulation of organic aerosol formation during the CalNex study: updated mobile emissions and secondary organic aerosol parameterization for intermediate-volatility organic compounds, Atmos. Chem. Phys., 20, 4313–4332, https://doi.org/10.5194/acp-20-4313-2020, 2020.
Luecken, D. J., Napelenok, S. L., Strum, M., Scheffe, R., and Phillips, S.: Sensitivity of Ambient Atmospheric Formaldehyde and Ozone to Precursor Species and Source Types Across the United States, Environ. Sci. Technol., 52, 4668–4675, https://doi.org/10.1021/acs.est.7b05509, 2018.
McDonald, B. C., Gouw, J. A. de, Gilman, J. B., Jathar, S. H., Akherati, A., Cappa, C. D., Jimenez, J. L., Lee-Taylor, J., Hayes, P. L., McKeen, S. A., Cui, Y. Y., Kim, S.-W., Gentner, D. R., Isaacman-VanWertz, G., Goldstein, A. H., Harley, R. A., Frost, G. J., Roberts, J. M., Ryerson, T. B., and Trainer, M.: Volatile chemical products emerging as largest petrochemical source of urban organic emissions, Science, 359, 760–764, https://doi.org/10.1126/science.aaq0524, 2018.
Milani, A., Al-Naiema, I. M., and Stone, E. A.: Detection of a secondary organic aerosol tracer derived from personal care products, Atmos. Environ., 246, 118078, https://doi.org/10.1016/j.atmosenv.2020.118078, 2021.
Murphy, B. N., Woody, M. C., Jimenez, J. L., Carlton, A. M. G., Hayes, P. L., Liu, S., Ng, N. L., Russell, L. M., Setyan, A., Xu, L., Young, J., Zaveri, R. A., Zhang, Q., and Pye, H. O. T.: Semivolatile POA and parameterized total combustion SOA in CMAQv5.2: impacts on source strength and partitioning, Atmos. Chem. Phys., 17, 11107–11133, https://doi.org/10.5194/acp-17-11107-2017, 2017.
Murphy, B. N., Nolte, C. G., Sidi, F., Bash, J. O., Appel, K. W., Jang, C., Kang, D., Kelly, J., Mathur, R., Napelenok, S., Pouliot, G., and Pye, H. O. T.: The Detailed Emissions Scaling, Isolation, and Diagnostic (DESID) module in the Community Multiscale Air Quality (CMAQ) modeling system version 5.3.2, Geosci. Model Dev., 14, 3407–3420, https://doi.org/10.5194/gmd-14-3407-2021, 2021.
Nussbaumer, C. M. and Cohen, R. C.: Impact of OA on the Temperature Dependence of PM2.5 in the Los Angeles Basin, Environ. Sci. Technol., 55, 3549–3558, https://doi.org/10.1021/acs.est.0c07144, 2021.
Pye, H. O. T., Pinder, R. W., Piletic, I. R., Xie, Y., Capps, S. L., Lin, Y.-H., Surratt, J. D., Zhang, Z., Gold, A., Luecken, D. J., Hutzell, W. T., Jaoui, M., Offenberg, J. H., Kleindienst, T. E., Lewandowski, M., and Edney, E. O.: Epoxide Pathways Improve Model Predictions of Isoprene Markers and Reveal Key Role of Acidity in Aerosol Formation, Environ. Sci. Technol., 47, 11056–11064, https://doi.org/10.1021/es402106h, 2013.
Pye, H. O. T., Murphy, B. N., Xu, L., Ng, N. L., Carlton, A. G., Guo, H., Weber, R., Vasilakos, P., Appel, K. W., Budisulistiorini, S. H., Surratt, J. D., Nenes, A., Hu, W., Jimenez, J. L., Isaacman-VanWertz, G., Misztal, P. K., and Goldstein, A. H.: On the implications of aerosol liquid water and phase separation for organic aerosol mass, Atmos. Chem. Phys., 17, 343–369, https://doi.org/10.5194/acp-17-343-2017, 2017.
Qin, M., Murphy, B. N., Isaacs, K. K., McDonald, B. C., Lu, Q., McKeen, S. A., Koval, L., Robinson, A. L., Efstathiou, C., Allen, C., and Pye, H. O. T.: Criteria pollutant impacts of volatile chemical products informed by near-field modelling, Nat. Sustain., 4, 129–137, https://doi.org/10.1038/s41893-020-00614-1, 2021.
Robinson, A. L., Donahue, N. M., Shrivastava, M. K., Weitkamp, E. A., Sage, A. M., Grieshop, A. P., Lane, T. E., Pierce, J. R., and Pandis, S. N.: Rethinking Organic Aerosols: Semivolatile Emissions and Photochemical Aging, Science, 315, 1259–1262, https://doi.org/10.1126/science.1133061, 2007.
Ryerson, T. B., Andrews, A. E., Angevine, W. M., Bates, T. S., Brock, C. A., Cairns, B., Cohen, R. C., Cooper, O. R., de Gouw, J. A., Fehsenfeld, F. C., Ferrare, R. A., Fischer, M. L., Flagan, R. C., Goldstein, A. H., Hair, J. W., Hardesty, R. M., Hostetler, C. A., Jimenez, J. L., Langford, A. O., McCauley, E., McKeen, S. A., Molina, L. T., Nenes, A., Oltmans, S. J., Parrish, D. D., Pederson, J. R., Pierce, R. B., Prather, K., Quinn, P. K., Seinfeld, J. H., Senff, C. J., Sorooshian, A., Stutz, J., Surratt, J. D., Trainer, M., Volkamer, R., Williams, E. J., and Wofsy, S. C.: The 2010 California Research at the Nexus of Air Quality and Climate Change (CalNex) field study, J. Geophys. Res.-Atmos., 118, 5830–5866, https://doi.org/10.1002/jgrd.50331, 2013.
Santoni, G. W., Daube, B. C., Kort, E. A., Jiménez, R., Park, S., Pittman, J. V., Gottlieb, E., Xiang, B., Zahniser, M. S., Nelson, D. D., McManus, J. B., Peischl, J., Ryerson, T. B., Holloway, J. S., Andrews, A. E., Sweeney, C., Hall, B., Hintsa, E. J., Moore, F. L., Elkins, J. W., Hurst, D. F., Stephens, B. B., Bent, J., and Wofsy, S. C.: Evaluation of the airborne quantum cascade laser spectrometer (QCLS) measurements of the carbon and greenhouse gas suite – CO2, CH4, N2O, and CO – during the CalNex and HIPPO campaigns, Atmos. Meas. Tech., 7, 1509–1526, https://doi.org/10.5194/amt-7-1509-2014, 2014.
Seinfeld, J. H. and Pandis, S. N.: From Air Pollution to Climate Change, 3rd edn., in: Atmospheric Chemistry and Physics, John Wiley & Sons, Inc., Hoboken, New Jersey, 2016.
Seltzer, K. M., Pennington, E., Rao, V., Murphy, B. N., Strum, M., Isaacs, K. K., and Pye, H. O. T.: Reactive organic carbon emissions from volatile chemical products, Atmos. Chem. Phys., 21, 5079–5100, https://doi.org/10.5194/acp-21-5079-2021, 2021.
Shah, R. U., Coggon, M. M., Gkatzelis, G. I., McDonald, B. C., Tasoglou, A., Huber, H., Gilman, J., Warneke, C., Robinson, A. L., and Presto, A. A.: Urban Oxidation Flow Reactor Measurements Reveal Significant Secondary Organic Aerosol Contributions from Volatile Emissions of Emerging Importance, Environ. Sci. Technol., 54, 714–725, https://doi.org/10.1021/acs.est.9b06531, 2020a.
Shah, T., Shi, Y., Beardsley, R., and Yarwood, G.: Speciation Tool User's Guide Version 5.0, Ramboll US Corporation, Novato, California, 41 pp., 2020b.
Skamarock, W. C., Klemp, J. B., Dudhia, J., Gill, D. O., and Barker, D.: A Description of the Advanced Research WRF Version 3 (NCAR/TN-475+STR), University Corporation for Atmospheric Research, 113 pp., https://doi.org/10.5065/D68S4MVH, 2008.
U.S. EPA: Air Quality System (AQS), U.S. EPA [data set], available at: https://www.epa.gov/aqs (last access: 4 February 2021), 2013.
U.S. EPA: National Emissions Inventory (NEI), U.S. EPA [code], available at: https://www.epa.gov/air-emissions-inventories/national-emissions-inventory-nei (last access: 23 June 2021), 2015.
U.S. EPA: AE7I Species Table, U.S. EPA [code], available at: https://github.com/USEPA/CMAQ/blob/72ec4e5681e1ed0b4917792a9a240b0302a303a7/CCTM/src/MECHS/mechanism_information/saprc07tic_ae7i_aq/AE7I_species_table.md (last access: 23 June 2021), 2016.
U.S. EPA: CMAQ, Zenodo [code], https://doi.org/10.5281/zenodo.4081737, 2020.
U.S. EPA: Reactive Organic Carbon Emissions from Volatile Chemical Products, U.S. EPA Office of Research and Development (ORD) [data set], https://doi.org/10.23719/1520157, 2021a.
U.S. EPA: Data for Modeling secondary organic aerosol formation from volatile chemical products, U.S. EPA Office of Research and Development (ORD) [data set], https://doi.org/10.23719/1522655, 2021b.
Wang, D.-G., Norwood, W., Alaee, M., Byer, J. D., and Brimble, S.: Review of recent advances in research on the toxicity, detection, occurrence and fate of cyclic volatile methyl siloxanes in the environment, Chemosphere, 93, 711–725, https://doi.org/10.1016/j.chemosphere.2012.10.041, 2013.
Wang, Y., Wang, H., Tan, Y., Liu, J., Wang, K., Ji, W., Sun, L., Yu, X., Zhao, J., Xu, B., and Xiong, J.: Measurement of the key parameters of VOC emissions from wooden furniture, and the impact of temperature. Atmos. Environ., 259, 118510, https://doi.org/10.1016/j.atmosenv.2021.118510, 2021.
Warneke, C., Veres, P., Holloway, J. S., Stutz, J., Tsai, C., Alvarez, S., Rappenglueck, B., Fehsenfeld, F. C., Graus, M., Gilman, J. B., and de Gouw, J. A.: Airborne formaldehyde measurements using PTR-MS: calibration, humidity dependence, inter-comparison and initial results, Atmos. Meas. Tech., 4, 2345–2358, https://doi.org/10.5194/amt-4-2345-2011, 2011.
Woody, M. C., Baker, K. R., Hayes, P. L., Jimenez, J. L., Koo, B., and Pye, H. O. T.: Understanding sources of organic aerosol during CalNex-2010 using the CMAQ-VBS, Atmos. Chem. Phys., 16, 4081–4100, https://doi.org/10.5194/acp-16-4081-2016, 2016.
Wu, Y. and Johnston, M. V.: Aerosol Formation from OH Oxidation of the Volatile Cyclic Methyl Siloxane (cVMS) Decamethylcyclopentasiloxane, Environ. Sci. Technol., 51, 4445–4451, https://doi.org/10.1021/acs.est.7b00655, 2017.
Xie, Y., Paulot, F., Carter, W. P. L., Nolte, C. G., Luecken, D. J., Hutzell, W. T., Wennberg, P. O., Cohen, R. C., and Pinder, R. W.: Understanding the impact of recent advances in isoprene photooxidation on simulations of regional air quality, Atmos. Chem. Phys., 13, 8439–8455, https://doi.org/10.5194/acp-13-8439-2013, 2013.
Zhang, Q., Jimenez, J. L., Canagaratna, M. R., Allan, J. D., Coe, H., Ulbrich, I., Alfarra, M. R., Takami, A., Middlebrook, A. M., Sun, Y. L., Dzepina, K., Dunlea, E., Docherty, K., DeCarlo, P. F., Salcedo, D., Onasch, T., Jayne, J. T., Miyoshi, T., Shimono, A., Hatakeyama, S., Takegawa, N., Kondo, Y., Schneider J., Drewnick, F., Borrmann, S., Weimer, S., Demerjian, K., Williams, P., Bower, K., Bahreini, R., Cottrell, L., Griffin, R. J., Rautiainen, J., Sun, J. Y., Zhang, Y. M., and Worsnop, D. R.: Ubiquity and dominance of oxygenated species in organic aerosols in anthropogenically-influenced Northern Hemisphere midlatitudes, Geophys. Res. Lett., 34, L13801, https://doi.org/10.1029/2007GL029979, 2007.
Zhao, Y., Hennigan, C. J., May, A. A., Tkacik, D. S., de Gouw, J. A., Gilman, J. B., Kuster, W. C., Borbon, A., and Robinson, A. L.: Intermediate-Volatility Organic Compounds: A Large Source of Secondary Organic Aerosol, Environ. Sci. Technol., 48, 13743–13750, https://doi.org/10.1021/es5035188, 2014.
Zhao, Y., Nguyen, N. T., Presto, A. A., Hennigan, C. J., May, A. A., and Robinson, A. L.: Intermediate Volatility Organic Compound Emissions from On-Road Diesel Vehicles: Chemical Composition, Emission Factors, and Estimated Secondary Organic Aerosol Production, Environ. Sci. Technol., 49, 11516–11526, https://doi.org/10.1021/acs.est.5b02841, 2015.