the Creative Commons Attribution 4.0 License.
the Creative Commons Attribution 4.0 License.
 | 16 Dec 2021
Is the ocean surface a source of nitrous acid (HONO) in the marine boundary layer?
Louisa J. Kramer
Francis D. Pope
Chris Reed
James D. Lee
Lucy J. Carpenter
Lloyd D. J. Hollis
Stephen M. Ball
William J. Bloss
Nitrous acid, HONO, is a key net photolytic precursor to OH radicals in the atmospheric boundary layer. As OH is the dominant atmospheric oxidant, driving the removal of many primary pollutants and the formation of secondary species, a quantitative understanding of HONO sources is important to predict atmospheric oxidising capacity. While a number of HONO formation mechanisms have been identified, recent work has ascribed significant importance to the dark, ocean-surface-mediated conversion of NO2 to HONO in the coastal marine boundary layer. In order to evaluate the role of this mechanism, here we analyse measurements of HONO and related species obtained at two contrasting coastal locations – Cabo Verde (Atlantic Ocean, denoted Cape Verde herein), representative of the clean remote tropical marine boundary layer, and Weybourne (United Kingdom), representative of semi-polluted northern European coastal waters. As expected, higher average concentrations of HONO (70 ppt) were observed in marine air for the more anthropogenically influenced Weybourne location compared to Cape Verde (HONO < 5 ppt). At both sites, the approximately constant ratio at night pointed to a low importance for the dark, ocean-surface-mediated conversion of NO2 into HONO, whereas the midday maximum in the ratios indicated significant contributions from photo-enhanced HONO formation mechanisms (or other sources). We obtained an upper limit to the rate coefficient of dark, ocean-surface HONO-to-NO2 conversion of CHONO = 0.0011 ppb h−1 from the Cape Verde observations; this is a factor of 5 lower than the slowest rate reported previously. These results point to significant geographical variation in the predominant HONO formation mechanisms in marine environments and indicate that caution is required when extrapolating the importance of such mechanisms from individual study locations to assess regional and/or global impacts on oxidising capacity. As a significant fraction of atmospheric processing occurs in the marine boundary layer, particularly in the tropics, better constraint of the possible ocean surface source of HONO is important for a quantitative understanding of chemical processing of primary trace gases in the global atmospheric boundary layer and associated impacts upon air pollution and climate.
- Article
(2843 KB) - Full-text XML
-
Supplement
(793 KB) - BibTeX
- EndNote


Chemical processing moderates the link between emissions and abundance for many atmospheric constituents, affecting climate, biogeochemical cycling and health impacts. The dominant atmospheric oxidant is the hydroxyl radical (OH•). OH initiates the daytime degradation of many constituents including air pollutants such as NO2, volatile organic compounds (VOCs) and greenhouse gases such as methane. This chemistry forms secondary species including ozone and organic and inorganic aerosol particles, which are harmful to human health and the environment, and affect radiation transfer and hence climate. Consequently, quantitative understanding of the OH budget and hence the abundance of OH precursor species is of critical importance for atmospheric science.
In the atmospheric boundary layer, nitrous acid (HONO) is an important photolytic precursor to OH production (Reaction 1). HONO can be formed in the gas phase via the reaction between NO and OH (Reaction 2); in the absence of other HONO formation or loss mechanisms or direct HONO emission sources, Reactions (1) and (2) can reach a photo-stationary steady state (PSS), with HONO representing an OH (and NO) reservoir. Reaction with OH (Reaction 3) represents a further sink for HONO but is considered to be minor compared to photolysis (Reaction 1) under typical tropospheric (daytime) conditions.
During the day at mid-latitudes, HONO has a relatively short atmospheric lifetime with respect to photolysis (of the order of tens of minutes), and yet numerous field studies report non-negligible daytime HONO concentrations (see Kleffmann et al., 2005; Lee et al., 2016; Michoud et al., 2014; Pusede et al., 2015; Villena et al., 2011). Calculations of daytime HONO concentrations based on the photo-stationary steady state (Reactions 1–3) significantly underestimate the observed daytime HONO concentrations pointing to the existence of other unknown HONO sources or formation mechanisms (Crilley et al., 2016; Michoud et al., 2014; Sörgel et al., 2011; VandenBoer et al., 2013). This overall conclusion is robust to the challenges of applying PSS in study locations with significant spatial heterogeneity of sources and consequent lack of photochemical equilibrium (Crilley et al., 2016; Lee et al., 2013), and additional HONO formation mechanisms (Reaction 4) are commonly required to satisfactorily reproduce observed HONO levels. These sources lead to further HONO production (above and beyond Reaction 2), and hence net OH (and NO) formation, following Reaction (1).
A number of additional sources of HONO (Reaction 4) have been identified in the literature, including direct emissions (e.g. vehicles); biological activity (e.g. soil bacterial activity); possible homogeneous gas-phase reactions; heterogeneous reactions on aerosol, the ground and vegetation; and surface photolysis (see reviews by Kleffmann, 2007; Spataro and Ianniello, 2014). However, an overall understanding of the source strengths and mechanisms remains elusive, and multiple HONO production mechanisms are likely to occur in parallel, to differing extents, in contrasting environments.
The contribution of HONO to the primary OH budget may be readily evaluated from atmospheric field observations, and in continental boundary layer locations it has been shown to range from 33 % in forested areas (Kleffmann et al., 2005) to 80.4 % in semi-rural locations (Kim et al., 2014). The contribution of HONO has also been shown to be significant in urban areas, ranging from 40 %–83 % of the primary OH budget (Emmerson et al., 2005; Lee et al., 2016; Ren et al., 2006; Slater et al., 2020). These figures relate to primary OH production, i.e. neglecting radical recycling via, for example, HO2+NO.
Oceans account for more than 70 % of the Earth's surface. As a result, the marine boundary layer (MBL) is an important environment globally when considering oxidation; for example, the marine lower troposphere has been shown to account for 25 % of the global chemical sink of methane (Bloss et al., 2005). There are, however, only very limited measurements of HONO within the marine boundary layer reported in the literature to date. Večeřa et al. (2008) performed measurements on a ship cruise in the Aegean Sea and observed HONO concentrations that were typically low (< 50 ppt), except in fresh ship plumes (< 10 ppb). Ye et al. (2016) conducted aircraft measurements over the North Atlantic Ocean and reported average HONO levels within the marine boundary layer of 11.3±1.6 ppt. Low levels of HONO were also reported by Reed et al. (2017) at a coastal site in Cabo Verde (denoted Cape Verde herein), representative of the remote marine boundary layer, where HONO peaked at an average of 3.5 ppt. In contrast, other studies report much greater HONO concentrations: for example, Cui et al. (2019) reported shipboard HONO measurements from an area with heavy shipping traffic (East China Sea), at an average of 480±210 ppt within 30 km of the coastline, decreasing slightly to 400±180 ppt at distances up to 100 km. Land-based measurements from Chinese coastal sites report a similar range of abundance: Zha et al. (2014) reported mean mixing ratios of 126±95 ppt and 4.06±3.29 ppb for HONO and NO2, respectively, at a clean coastal site near Hong Kong. Similar levels were reported for Tuoji Island in the eastern Bohai Sea, China, by Wen et al. (2019) of 200±200 ppt and 5.3±4.1 ppb for HONO and NO2, respectively. Wojtal et al. (2011) observed high concentrations of HONO (500–1500 ppt) and NO2 (< 50 ppb) during night-time measurements at a coastal site that experienced regular outflow of air pollution from nearby Vancouver, Canada.
The scarcity of HONO measurements within the marine boundary layer makes it difficult to ascertain “typical” levels, but the studies to date point to HONO abundance within the parts per trillion (ppt) range at mid-latitudes (Cui et al., 2019; Večeřa et al., 2008; Wen et al., 2019; Ye et al., 2016; Zha et al., 2014; Reed et al., 2017). Owing to this paucity of HONO measurements, estimates of the contribution of HONO to the OH budget in the MBL are limited. Calculations by Cui et al. (2019) showed average daytime OH production from HONO photolysis (1.35±0.69 ppb h−1) was 1.6 times that calculated from O3 photolysis (daytime average levels of 300–600 ppt for HONO and 40–70 ppb and for O3), suggesting an important role for HONO photolysis in the oxidising capacity of the MBL.
Recent work has presented indirect evidence for rapid production of HONO on the ocean surface. Based on night-time field measurements at coastal sites around the Bohai Sea and South China Sea, Zha et al. (2014) observed that the ratio increased more rapidly in air masses which passed over the sea, compared with those which passed over land. Assuming that all the measured HONO derived solely from NO2 conversion, this observation implied a higher NO2-to-HONO conversion rate over the sea compared to the land, and this was attributed to the existence of a source of HONO from the ocean's surface. Enhanced nocturnal NO2 conversion to HONO for marine air relative to land was also observed in subsequent studies in these locations (Cui et al., 2019; Wen et al., 2019) and was again attributed to heterogeneous processes occurring on the ocean surface.
This result is somewhat counter-intuitive, as HONO ought to be highly soluble in seawater (due to seawater being slightly alkaline, pH of 8) and would dissociate in solution to H+ and ions. Therefore, one would expect the ocean surface to be a net sink of HONO. However, the sea-surface organic microlayer may inhibit contact of gas-phase species with the bulk seawater, restricting the ability of the ocean surface to act as a HONO sink – rather, the surface microlayer may indeed provide a medium or surface for HONO formation reactions.
Heterogeneous processes are a prominent HONO formation mechanism (Kleffmann, 2007), occurring mainly via the dark conversion of NO2 on wet surfaces (Finlayson-Pitts et al., 2003):
HONO can also be formed by photo-enhanced reduction of NO2 on organic substrates (George et al., 2015; Stemmler et al., 2006):
Organic films comprising humic acids have been shown to support HONO production (Bartels-Rausch et al., 2010; Stemmler et al., 2006), and the sea-surface microlayer of organic material is known to contain humic acids (Williams et al., 1986). As a result, the photo-reduction of NO2 on the sea-surface organic microlayer (via Reaction 6) may be a potential source of HONO in the marine boundary layer (Wen et al., 2019; Wojtal et al., 2011; Yu et al., 2021). It seems likely that HONO production is driven by the ocean's surface rather than aerosol particles, because the ocean surface area is typically much larger than aerosol surface area (e.g. 15-fold during the day, based on a typical particle surface area for the marine boundary layer of 150 µm2 cm−3 (VandenBoer et al., 2013) and a daytime boundary layer height of 1000 m; this ratio is even larger at night). Aerosols can be a source of HONO in the marine boundary layer via the rapid photolysis of nitrate-containing particles; however, there is significant uncertainty to the importance of this route, with reported rates spanning 3 orders of magnitude (Kasibhatla et al., 2018; Reed et al., 2017; Shi et al., 2021; Ye et al., 2016). Zhang et al. (2016) included a parameterisation for an enhanced NO2-to-HONO conversion rate over the sea surface based upon the results by Zha et al. (2014) and calculated that this marine source accounted for 9 % of the observed HONO mixing ratio in Hong Kong (implying a significant influence over OH production). The results from these studies (Zha et al., 2014; Zhang et al., 2016) suggest the ocean surface may be a significant source of HONO in some coastal and marine areas.
In the current work, we evaluate the potential role of the ocean surface as a source of HONO into the marine boundary layer through the analysis of ground-level field measurements of HONO performed at two contrasting coastal locations. The two sites are the following: the Cape Verde Atmospheric Observatory (CVAO) in the tropical North Atlantic Ocean, representative of the global tropical remote marine boundary layer (Carpenter et al., 2010), and the Weybourne Atmospheric Observatory (WAO) on the east coast of the United Kingdom, representative of semi-polluted marine boundary layer environments around Europe (Forster et al., 2012).
2.1 Measurement of HONO
Nitrous acid (HONO) was measured at each site using a long-path absorption photometer (LOPAP-03 QUMA Elektronik & Analytik GmbH), as described in detail in Heland et al. (2001) and Kleffmann et al. (2002). Briefly, the LOPAP is a wet-chemistry technique where gas-phase HONO is sampled within a stripping coil into an acidic solution where it is derivatised into an azo dye. The absorption of light at 550 nm by the azo dye is then measured with a spectrometer using an optical path length of 2.4 m. The LOPAP was operated and calibrated according to the standard procedures described in Kleffmann and Wiesen (2008) at both sites. Further details on the operation of the LOPAP at CVAO can be found in Reed et al. (2017). The resultant time resolution of the LOPAP was 5 min, and baseline measurements were taken at frequent intervals (every 6–8 h) at each site. The detection limit (2σ) was determined to be 0.2 ppt at CVAO and 0.7 ppt at WAO. The same LOPAP instrument was used at each site and was operated according to the same procedures; this should remove any variability that might otherwise arise when comparing measurements made by different instruments (Crilley et al., 2019; Pinto et al., 2014). The two-channel approach of the LOPAP has also been shown to be necessary in clean environments where the HONO concentration is expected to be low, as it successfully accounts for possible interferences (Kleffmann and Wiesen, 2008).
2.2 Site descriptions
2.2.1 Remote marine: Cape Verde Atmospheric Observatory
The Cape Verde Atmospheric Observatory (CVAO) is located in the tropical North Atlantic (16∘ 51′ N, 24∘ 52′ W) on the north-west coast of the island of São Vincente and is a global World Meteorological Organisation (WMO) Global Atmospheric Watch (GAW) station. CVAO is considered representative of the clean marine boundary layer with typical sampled air masses originating from either the open Atlantic Ocean or Saharan Africa (Carpenter et al., 2010). At CVAO, long-term routine measurements of NOx, O3, meteorology and photolysis rates are performed, with further details of methodology and climatology presented in Lee et al. (2009) and Andersen et al. (2021). The instrument detection limit (2σ) for NO2 measurements was 8.4 ppt (Andersen et al., 2021). In addition to these routine measurements, for this study in November 2015, the concentration of HONO was measured with a sampling height of approx. 3 m a.g.l.
2.2.2 Semi-polluted marine: Weybourne Atmospheric Observatory
The Weybourne Atmospheric Observatory (WAO) is a regional Global Atmospheric Watch station located on the north Norfolk coast, United Kingdom (52.95∘ N, 1.13∘ E) and has been described in detail by Penkett et al. (1999). WAO is approximately 170 km north-east of London and experiences air masses from a number of sources including relatively clean maritime air and pollution outflow from the UK and continental Europe (Forster et al., 2012). Measurements were conducted in July 2015 as part of the Integrated Chemistry of Ozone in the Atmosphere (ICOZA) project, which aimed to explore the chemistry of ozone production. During ICOZA, the LOPAP sampled at a height of approx. 3 m a.g.l. Measurements of NO were performed by chemiluminescence using a calibrated NOx (Air Quality Designs Inc) monitor described in Reed et al. (2016). Absolute spectroscopic measurements of NO2 were performed by broadband cavity-enhanced absorption spectroscopy in the wavelength range 430–485 nm (typical 1σ detection limit =0.035 ppbv in 1 min in the presence of ambient aerosol) (Thalman et al., 2015). The NO2 inlet line sampled air at approx. 4.7 m a.g.l. A spectral radiometer (MetCon GmbH, Germany) was used to measure the photolysis rates of some 40 photolabile molecules including NO2, HONO, and O3→O(1D) (Edwards and Monks, 2003). In addition, routine measurements of the meteorology, gaseous species and particle measurements were performed at WAO. In this study we utilise measurements of SO2 (fluorescence, Thermo 43i), ozone (UV photometry, Thermo 49i) and particle concentration (TSI 3025a).
2.3 Data analysis
Wind rose plots, diurnal cycles and polar plot analyses were performed using the “openair” package (Carslaw and Ropkins, 2012) in the R software package.
3.1 Comparison of measured concentrations: WAO vs. CVAO
The measured NOx and HONO mixing ratios from each site are summarised in Table 1 and presented as measurement time series in Figs. 1 (CVAO) and 2 (WAO). In both cases, significant but contrasting variability was observed, with levels of both NOx and HONO much higher for WAO than CVAO, by factors of 60 and 80, respectively (mean mixing ratios observed during periods of marine air). These differences reflect the remote, unpolluted nature of Cape Verde and proximity of the Weybourne site to a wide range of anthropogenic emissions from the UK and continental Europe. Overall, despite the higher absolute concentrations of NOx and HONO at WAO compared to CVAO, the ratios were remarkably consistent between the two sites, suggesting some degree of commonality in behaviour in the chemical NOy space.
Table 1Mean mixing ratios of HONO, NO, NO2 and O3 at WAO (July 2015) and CVAO (25 November–3 December 2015). Ozone diurnal profiles are provided in the Supplement (Figs. S1 and S2). WAO data including averages over the whole measurement period (“all”) and subdivided into periods when the local wind direction was from the ocean (NW, N, NE: “marine”, ca. 23 % of all data) or other sectors (“non-marine”, predominantly SE–SW). Averages correspond to periods for which measurements of all four species were available simultaneously; uncertainty is 1 SD of the observed levels. The ratios were determined by linear regression between all data points (Fig. S3 in the Supplement).
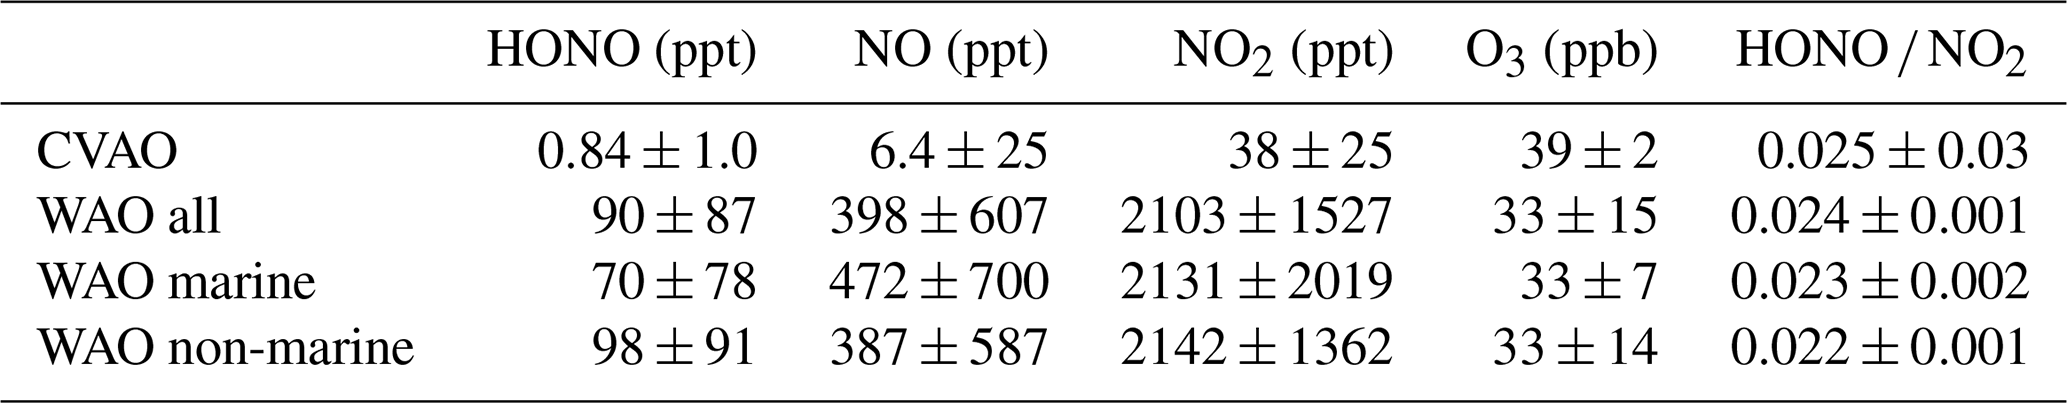
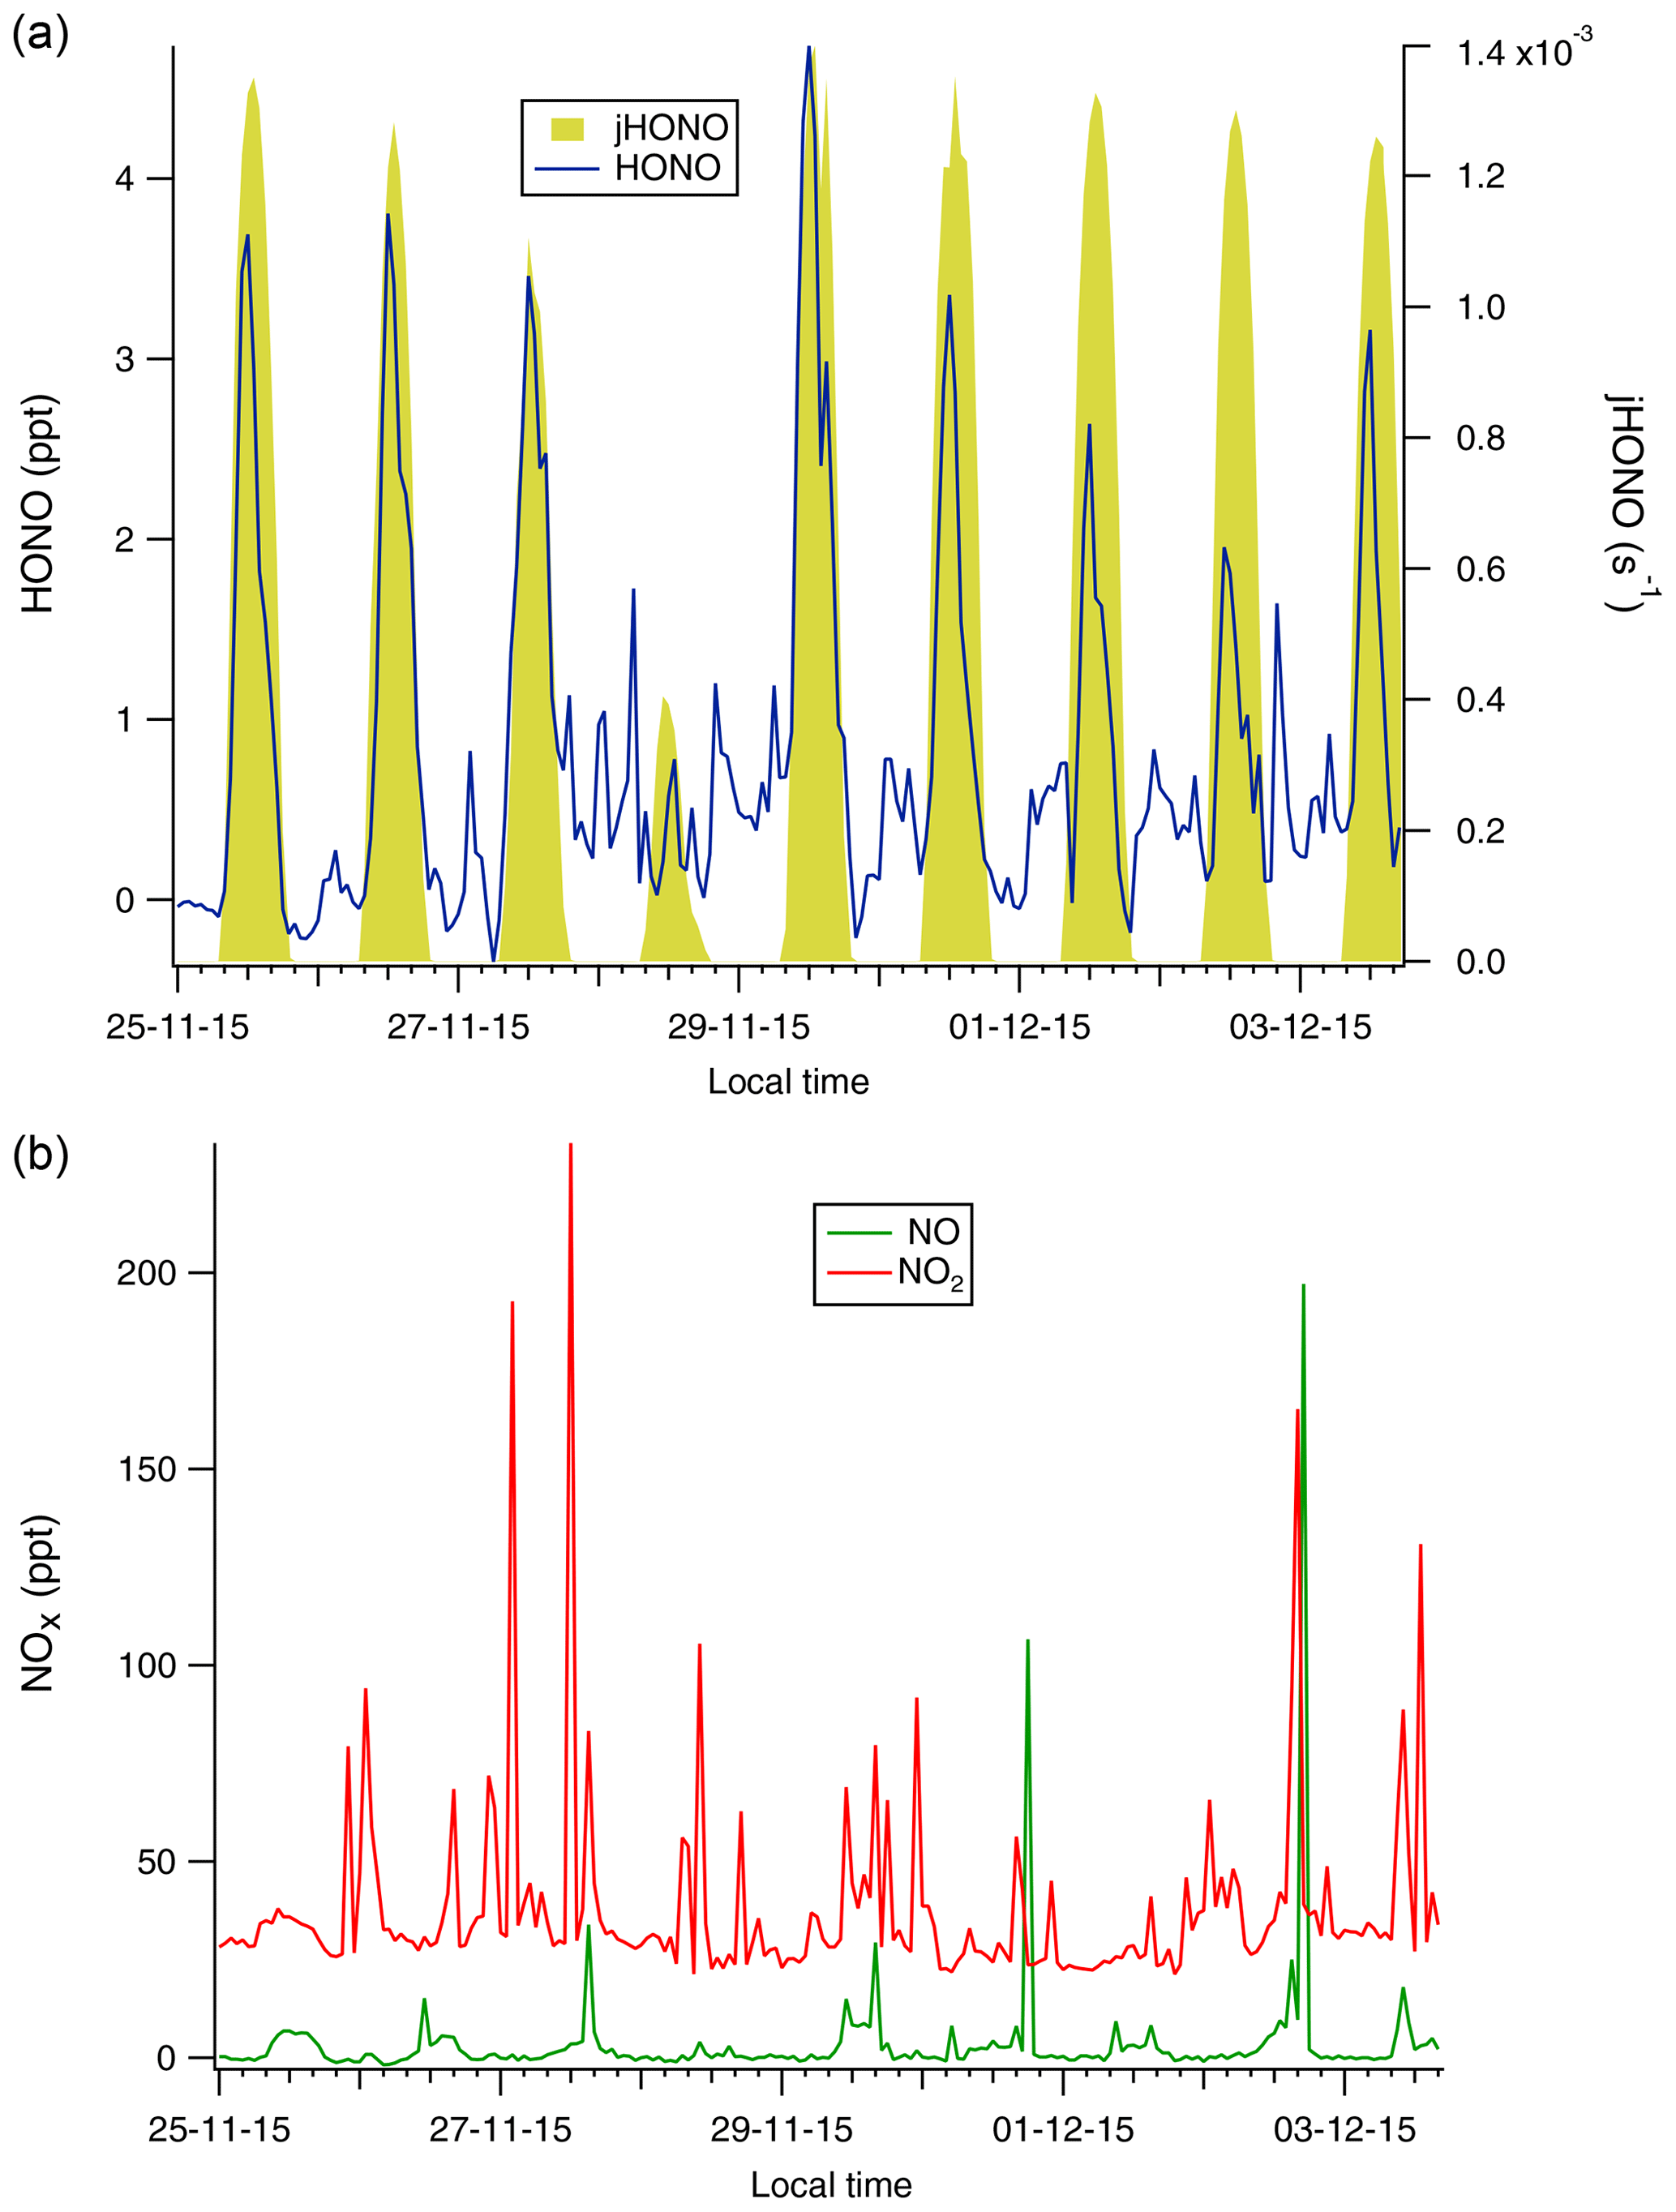

Figure 2Time series of the measured HONO and jHONO (a) and NOx (b) mixing ratios at WAO. Red bars on the HONO time series x axis indicate marine air periods at WAO. Note the larger vertical axis scales, indicating that greater concentrations of HONO and NOx were observed at WAO compared to the CVAO data shown in Fig. 1.
The local wind direction at Cape Verde during the campaign period was wholly from the NE quadrant, and overwhelmingly from the NE/ENE directions (See Fig. S4 in the Supplement), corresponding to the open ocean sector from the shoreline observatory's location. Back trajectory analysis confirmed that the air mass was from the open ocean (Fig. S5, in the Supplement). A consistent diurnal variation in HONO was observed, with the exception of the 28 November 2015. The NO and NO2 concentrations (but not HONO measurements) were characterised by a number of sharp spikes, thought to be shipping plumes (Lee et al., 2009), and with the exception of these plumes, the observed NOx levels showed little diurnal variability (Fig. 1 and left panels of Fig. 3). Measured NO and NO2 concentrations in the current work were in broad agreement with previous measurements at CVAO for the corresponding time of year (Lee et al., 2009; Read et al., 2008).

Figure 3Diurnal profiles of HONO, NO2 and NO at CVAO (a, c, e) and WAO marine (b, d, f). Shaded areas represent the 95 % confidence intervals of the measurement precision. Note the very different y-axis scales.
At Weybourne, the concentrations of both HONO and NOx demonstrated a large variability, with the time series spanning periods of generally high levels early in the time series, and lower mean and peak concentrations later in the dataset. Air masses were classified as marine for the NW–NE local wind sector, corresponding to the direction of the North Sea relative to the sampling site, and accounted for 23 % of the measurements; during these periods, the mean concentrations of HONO were lower, relative to the non-marine period (Table 1 and Fig. 2). For a significant portion of the campaign (namely 29 June to the 10 July), back trajectory analysis indicated that air masses were mainly from the south-west (see example trajectories in Fig. S6 in the Supplement) and therefore in the pollution outflow from London (Forster et al., 2012), which likely explains the higher HONO and NOx concentrations. During periods of marine air, back trajectory analysis indicated that the air masses travelled over the ocean for 6 h prior to arriving at the sampling site, but before this had passed over land in the northern Britain (Fig. S7 in the Supplement). For the remainder of the analysis presented here, for the Weybourne dataset, we focus only on times when the local wind direction was from the ocean (NW, N and NE), referred to as “WAO marine”.
3.2 Diurnal trends in HONO and NOx
Distinct diurnal profiles were observed for HONO and NO (Fig. 3). At CVAO, both HONO and NO were very low at night and peaked during the day at around local solar noon at 12:00 LT (Fig. 3). At midday the lifetime of HONO with respect to photolysis was short (∼ 13 min), and in the presumed absence of any local emission sources and because these data are dominated by marine air masses, the observed diurnal cycle suggests a significant photolytic source term for HONO (see Sect. 3.3 below). In contrast, the NO2 levels at CVAO showed almost no diurnal variation, with any deviations from the mean being due to spikes of NO2 from advection of (distant) shipping plumes (Andersen et al., 2021).
Figure 3 also presents diurnal trends for marine air at WAO, which were broadly consistent with the observed diurnal trends for the non-marine period (Fig. S8, in the Supplement). At WAO a complex diurnal profile was observed, with peak HONO concentrations occurring at night (midnight to 05:00 LT) and mid-morning (09:00 LT) and a minimum at 18:00 LT during late afternoon (Fig. 3), whereas NO2 levels peaked overnight. The increasing concentration of HONO during the darkness from 20:00 LT (sunset) to 06:00 LT (sunrise) points to a sustained, non-photolytic source term.
The absolute ratios of were similar at both sites (Table 1) along with similar diurnal trends observed (Fig. 4). A pronounced peak in was observed at CVAO in the middle of the day. The highest ratio was also seen around the middle of the day at WAO, although the diurnal profile was more structured (the drop observed at 12:00 LT for WAO marine air is likely due to unfortunately limited data coverage at this hour). At both sites, the ratio was relatively constant at night although the absolute values differed: the mean ratios calculated between 20:00–06:00 LT were 0.012 ± 0.004 and 0.033 ± 0.005 for CVAO and WAO marine, respectively.

Figure 4Diurnal profiles of ratios and HONO photolysis rates at CVAO (a) and WAO marine (b). Shaded areas represent the 95 % confidence intervals of the measurement precision.
If neglecting any effects due to changing boundary layer height and if there were appreciable dark conversion of NO2 to HONO on the sea surface, then we would expect to observe a steady increase in during the night. This is not observed; the ratio for marine air sectors is approximately constant (slopes (± 1 SD) of and 0.0007±0.0008 for CVAO and WAO marine, respectively) at night for both sites (Fig. 4). In the following sections, we place these qualitative discussions of marine HONO formation and ocean surface production on a more quantitative basis.
3.3 Are ocean surfaces a source of HONO?
3.3.1 Clean marine environment (CVAO)
At CVAO, the wind was consistently from the ocean (Fig. S4); therefore, dark NO2-to-HONO conversion on ocean surfaces, if it occurs at the rates suggested in recent literature studies (Wen et al., 2019; Wojtal et al., 2011; Zha et al., 2014), would be expected to result in an accumulation of HONO overnight (in the absence of ventilation effects). Zha et al. (2014) report an ocean surface dark NO2-to-HONO conversion rate (CHONO) of 0.033 h−1 and parameterised MBL HONO production via Eq. (1):
As per Reaction (5), the overall reaction between NO2 and water is not a first-order reaction; however, there could be a first-order component for HONO production via Reaction (6). Hence the empirically derived Eq. (1) is a significant simplification of the chemistry involved as it neglects the role of surface properties but one that reflects the importance of NO2 concentrations on the reaction kinetics (Finlayson-Pitts et al., 2003; Spataro and Ianniello, 2014). Using the mean nightly NO2 mixing ratio at CVAO (35 ppt, Fig. 3), Eq. (1) produces a HONO growth rate of 1.2 ppt h−1 and minimum HONO levels at dawn (after 12 h of darkness) of around 14 ppt. This is not consistent with the observation; if HONO were increasing at the 1.2 ppt h−1 rate implied by the CHONO value of Zha et al. (2014), then we would expect the HONO concentration to exceed the approx. constant, observed [HONO] = 0.3 ± 0.1 ppt by a factor of 4 within the first hour after sunset and to continue increasing through the night. Wen at al. (2019) reported that when the ambient night-time temperature was above 15 ∘C, the CHONO was equal to or higher than 0.02 h−1 (but lower than assumed in Eq. 1). During the measurement period at CVAO, the mean ambient night-time temperature was 24 ± 0.5 ∘C. Substituting CHONO = 0.02 h−1 (as a lower limit) into Eq. (1) implies a growth in HONO mixing ratio of 0.7 ppt h−1 (for an NO2 level of 35 ppt), also still significantly in excess of the observations. The observed HONO and NO2 levels display no statistically significant trend with time overnight ( ppt h−1) within precision; the CVAO HONO data are consistent with an upper limit of CHONO < 0.0011 h−1, obtained by applying the methodology of Zha et al. (2014) to the mean HONO measured between midnight and 06:00 LT shown in the diurnal plot in Fig. 3. In comparison, Wen et al. (2019) calculated CHONO for 8 nights with stable meteorology in the MBL over the Bohai Sea, China, and determined values ranging between 0.006 and 0.036 h−1 (average of 0.018 h−1). These values are still between 6 times and 33 times greater than the upper limit on CHONO we obtain from the CVAO dataset and are not consistent with the observed (near-constant) temporal behaviour in HONO overnight. This suggests that there was little NO2-to-HONO conversion occurring on the ocean surface around Cape Verde at night.
To explore the impact of NO2 conversion to HONO at the rates proposed by Zha et al. (2014) during daylight, we extended Eq. (1) to incorporate HONO photolysis and hence estimate the daytime steady-state HONO concentration (excluding any other processes). The resulting Eq. (2) uses measured NO2 levels and HONO photolysis frequencies derived from the spectral radiometer measurements at Cape Verde:
Using a value of 0.033 h−1 for CHONO, we obtain a daytime minimum for [HONO]ocean of 0.23 ppt (Fig. S9, in the Supplement), which is well below the levels observed at CVAO during the day and with the opposite diurnal behaviour. The contribution of Reaction (2) to HONO production is estimated at around 10 % (midday) using previously measured OH concentrations for CVAO (Whalley et al., 2010). We conclude that for NOx levels found in the remote, clean tropical marine environment, as represented by the Cape Verde data, the proposed ocean surface conversion mechanism is unlikely to be an important source of HONO at the rate found in the East China Sea.
3.3.2 Semi-polluted marine environment (WAO)
An equivalent analysis was performed for the semi-polluted marine environment using the Weybourne (WAO) dataset. The air mass history is more complex at this location (more variable meteorology), as illustrated in polar plots for HONO and NO2 (Fig. 5). Owing to the short atmospheric lifetime of HONO during daylight, we focus on local meteorology (i.e. wind direction), as this is more relevant when considering local sources of HONO rather than, for example, back trajectories. We did not use this approach for CVAO, because the wind and trajectories were consistently from the NE or open ocean sector (Fig. S4).
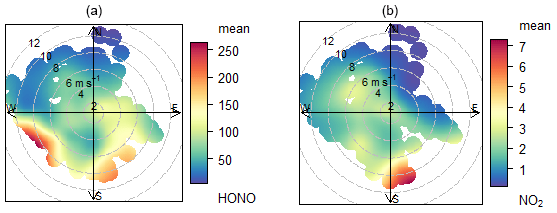
Figure 5Polar plot of mean HONO (a, ppt) and NO2 (b, ppb) mixing ratio for whole time series at WAO (marine + non-marine). The coast is towards the north of the measurement site.
Polar plots indicate that the highest source regions for both HONO and NO2 correspond to southerly/south-westerly directions and higher wind speeds, pointing to regional influence from inland conurbations (ultimately, London). The short lifetime of HONO in daylight (10 min at solar zenith angle SZA = 40∘) means the high concentration of HONO observed in the S and SW wind directions was more probably the result of an increased availability of precursors in pollution outflow (e.g. NO2 reactant for Reactions 5 and 6) rather than long-range transport of HONO itself. Similarly, regional emissions of HONO from, for example, road traffic (Kramer et al., 2020) and/or near-site terrestrial sources (see Sect. 4) are likely unimportant. The polar plots for HONO remain broadly similar (Fig. S10, in the Supplement) when the data are divided into daytime and night-time data, again indicating that the land (and not the ocean) was the dominant HONO source at WAO.
Non-negligible concentrations of HONO were observed at WAO when the wind was from the ocean sector. Following the methodology by Zha et al. (2014) and Wen et al. (2019), we examined the measurement time series to look for nights where the wind was consistently from the ocean and the HONO concentration was observed to increase overnight. One such night in the WAO dataset met these conditions (2–3 July). While the HONO concentration was observed to increase overnight, the ratio was relatively stable (0.02–0.025; Fig. 6) as the NO2 mixing ratio was also increasing; this stable ratio does not suggest any net NO2 to HONO conversion, in the absence of ventilation effects.
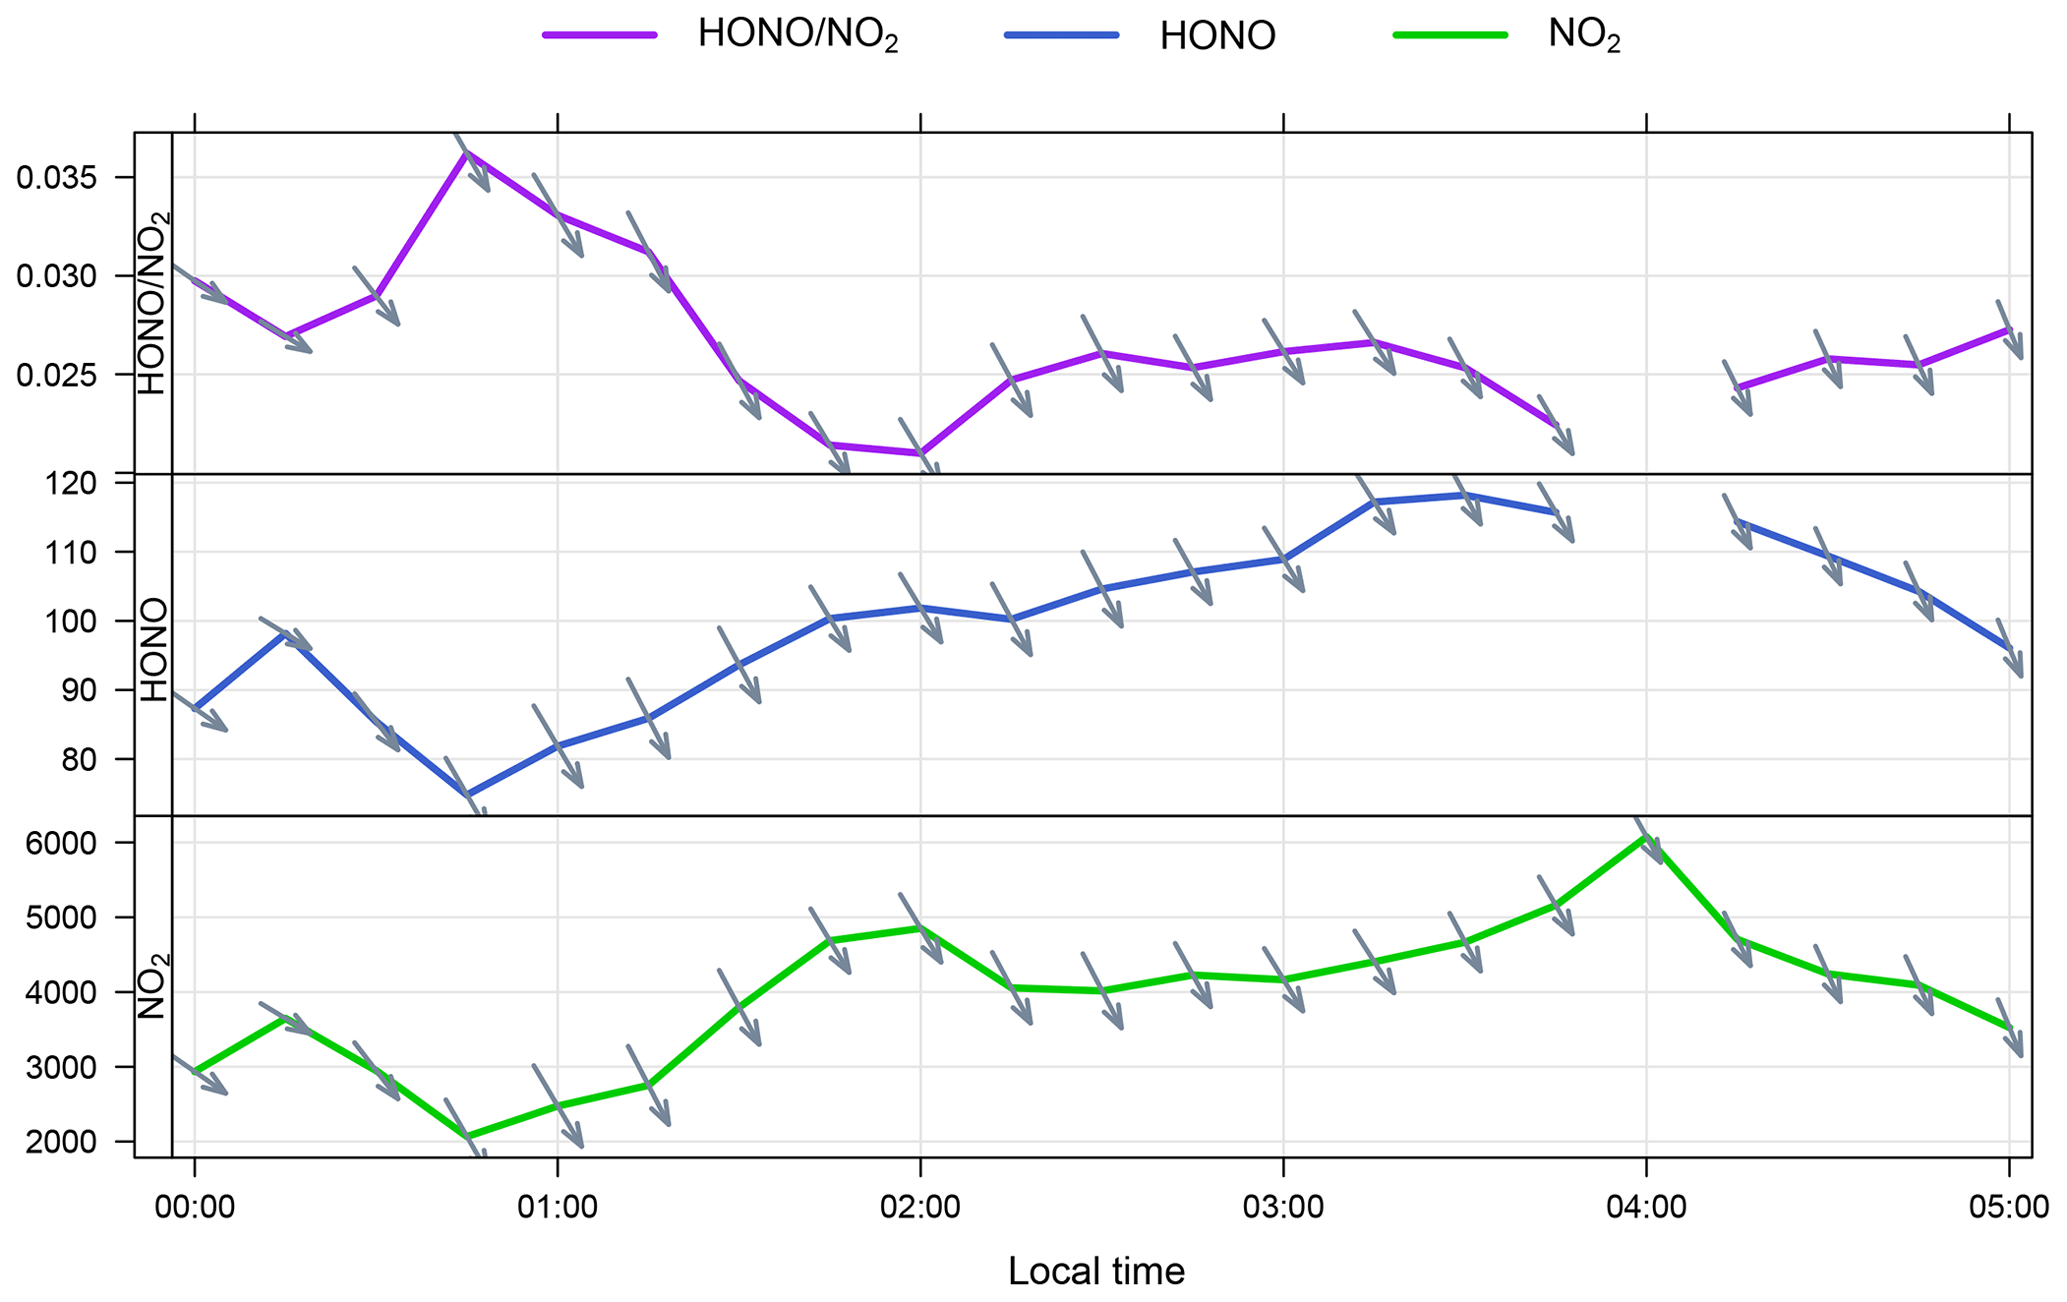
Figure 6Time series of , HONO (ppt) and NO2 (ppt) at WAO on the night of 2–3 July. The arrows indicate the local wind direction – the marine sector spans WNW–ENE from the WAO station. The break in the HONO time series at 04:00 LT is due to LOPAP auto-zeroing.
The increasing HONO concentration observed in the case study of the night of 2–3 July may point to some ocean HONO production. Thus, we applied Eq. (1) to calculate the night-time HONO levels that would result from the proposed ocean surface conversion mechanism using the [NO2] measured on this night and the full range of values for CHONO:0.033 (Zha et al., 2014), 0.018 (Cui et al., 2019) and 0.0011 h−1 (CVAO, current work – upper limit). Figure 7 compares the calculation's results with the observations. The CHONO values by Zha et al. (2014) and Cui et al. (2019) substantially overpredict the observations; the significantly smaller upper limit value derived from the Cape Verde observations is consistent with the measured data but indicates a minimal contribution to HONO formation from the ocean-surface mechanism at WAO. While Cape Verde is a remote location with very low NOx, the NO2 levels at WAO during the case study night (mean of 4 ppb) were similar to those observed by Zha et al. (2014) and Cui et al. (2019), at approx. 1 to 3 and 4 to 7 ppb, respectively.
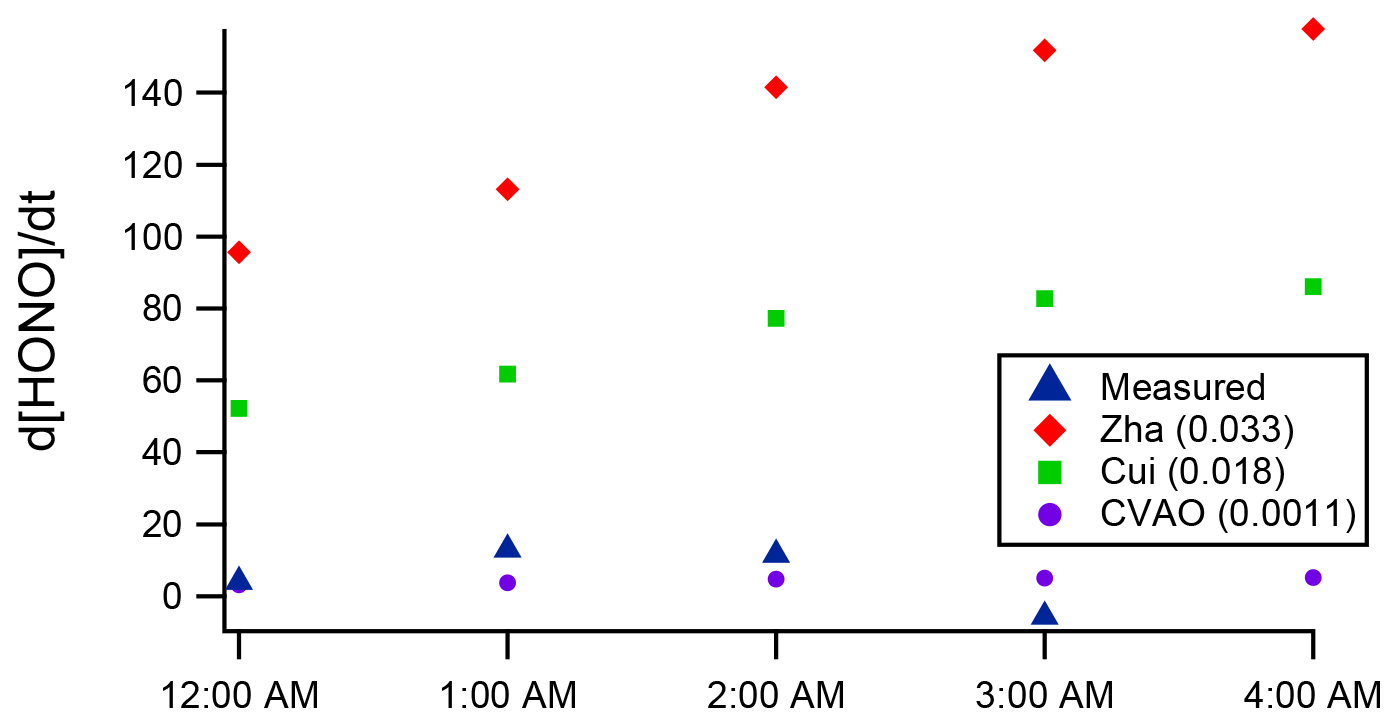
Figure 7Measured (blue) night-time HONO production, (ppt h−1), during the 3 July case study night at WAO, compared to calculations via Eq. (1) for a range of CHONO values.
Next, we applied the steady-state Eq. (2) to estimate daytime HONO formation at WAO through the ocean-surface mechanism alone. For periods of marine air only and assuming CHONO = 0.033 h−1, we obtain HONO mixing ratios of 8 to 27 ppt between 07:00 and 16:00 LT, reaching a photolysis-driven minimum at 13:00 LT. (Fig. S9). This does not match the shape of the diurnal profile of the HONO measurements (Fig. 3), which show a midday peak; although the upper end of the calculated HONO levels from the possible ocean source are the same order of magnitude as the observed HONO (17–80 ppt, Fig. 3). This would suggest that, within the constraints of the WAO data, there is scope for some daytime NO2-to-HONO conversion over the sea surface if a different, possibly photochemical, mechanism also operates, as suggested by Cui et al. (2019).
The results reported here were obtained from locations (Cape Verde, Weybourne) that are rather distinct from the Bohai Sea and South China Sea environments studied in previous work (Cui et al., 2019; Wen et al., 2019; Zha et al., 2014), although the levels of key precursor species (NOx) are similar for WAO. The results reported here are in agreement with recent laboratory work by Yu et al. (2021), who observed little uptake of NO2 on bulk sea water under dark conditions (); however, this may not take into account any effect of the organic sea-surface microlayer (SML) on NO2 heterogeneous conversion. Variability in the observed behaviour overnight may reflect geographical differences in the organic composition of the SML, which will vary in response to changes in local near-term biological activity, underlying surface water composition, anthropogenic inputs, wind speed and solar radiation (see Sabbaghzadeh et al., 2017; Stolle et al., 2020; Wurl et al., 2011; Wurl and Obbard, 2004). The geographical/spatial variability in SML composition is not well known (Engel et al., 2017). Modelling work by Wurl et al. (2011) suggests that on a global scale the Pacific and Atlantic oceans between 30∘ N and 30∘ S may be more significantly covered with SML than north of 30∘ N and south of 30∘ S. Based on this, if HONO production was dependent on the SML, we would expect different CHONO rates to occur at WAO (52.95∘ N) compared to CVAO (16.864∘ N) – yet this was not what we observed. The observed similarity in CHONO rates at WAO and CVAO are more in agreement with the findings by Sabbaghzadeh et al. (2017), who observed Atlantic Ocean SML was more uniform and ubiquitous between 50∘ N and 50∘ S. Overall, due to the current lack of knowledge on the geographic variability and chemical composition of the SML, it is difficult to explore if discrepancies between the current work and the literature are related to changes in SML. Further work is required to verify whether the SML does or does not facilitate conversion of NO2 to HONO and hence parameterise the variability in the potential night-time NO2-to-HONO conversion rate on the ocean surface.
A possible alternative marine source of HONO could be shipping emissions. Marine traffic is a significant emitter of NOx (6.5 Tg N yr−1, 78 % of traffic emissions; Eyring et al., 2005), and HONO has been observed in shipping plumes (Cui et al., 2019; Večeřa et al., 2008), with a ratio of 0.51 ± 0.18 % for fresh plumes (Sun et al., 2020). At CVAO, the observed spikes in NO2 and NO mixing ratio, typically ascribed to shipping plumes, did not correspond with any spikes in HONO (Fig. 1). This suggests that shipping plumes were not a major source of HONO at CVAO, because possibly only aged shipping emissions reached the sampling point during the measurements. At WAO, shipping plumes can be positively identified via sharp spikes in the measured SO2 concentrations, and while such SO2 spikes were observed during the campaign, they did not coincide with any HONO peaks (Fig. S11, in the Supplement). Furthermore, analysis of the correlations between SO2 and HONO as a function of wind direction revealed that, for sectors from the ocean (NE, N and NW), the correlation coefficient was not markedly stronger compared to other sectors.
As noted in the introduction, a range of HONO production mechanisms have been reported in the literature, and these processes likely occur, in parallel but to differing degrees of significance, in different boundary layer environments. In the remote marine boundary layer, the observed diurnal trends (and particularly the noontime maximum in [HONO] at CVAO) point to a dominant source related to sunlight, i.e. photolysis. Recent work has demonstrated that rapid photolysis of particle nitrate can be a significant source of HONO in the marine boundary layer (Kasibhatla et al., 2018; Reed et al., 2017; Ye et al., 2016). Using a 0-D box model, Reed et al. (2017) were only able to reproduce the observed diurnal trends in HONO and NOx at CVAO by including the rapid photolysis of particle nitrate. Although significant uncertainty remains over the importance of nitrate photolysis (Shi et al., 2021), the modelling result by Reed et al suggests that particle nitrate photolysis may represent the dominant daytime source of HONO at CVAO, as opposed to photochemical conversion of NO2 to HONO on the ocean surface.
We present measurements of HONO and NOx at two sites located in close proximity to the marine boundary layer: a remote location representative of the open ocean tropical marine boundary layer (Cape Verde, CVAO) and a semi-polluted location representative of the seas around Europe (Weybourne, WAO). The data are analysed to assess the potential contribution to HONO levels and hence OH formation from sea-surface-mediated conversion of NO2 to HONO, at night and during the daytime, as posited by Zha et al. (2014). The observed HONO abundance and the ratio at the Cape Verde observatory (for which air masses were overwhelming representative of the global remote tropical marine atmosphere) are not consistent with the conversion of NO2 through a dark, sea-surface mechanism. We find an upper limit of CHONO = 0.0011 h−1 for the conversion rate coefficient of NO2 to HONO on the sea surface, which is a factor of 6 smaller than the slowest conversion rate obtained from previous studies around the Chinese coast. The situation at Weybourne is more complex, with multiple HONO formation mechanisms likely occurring in parallel; the night-time WAO data cannot be reconciled with an ocean-surface mechanism producing HONO at the rates observed around China, but the WAO data are consistent with the upper limit on CHONO we obtained from the Cape Verde data. At both locations, the noontime maximum in the diurnal profile of the ratio provides strong evidence for photo-enhanced HONO formation, potentially including both aerosol and sea-surface components. The night-time observations reported here can only be reconciled with night-time marine HONO formation rates reported in the literature if there exists substantial regional variability in the rate of a dark, ocean-surface NO2-to-HONO conversion mechanism, which could possibly be explained by variability in the sea-surface microlayer composition. Consequently, caution should be adopted in extrapolating such conversion rates from a given location to perform regional (and wider) predictions of HONO production and hence OH levels and oxidation budgets in the MBL. As the marine boundary layer is an important environment globally, better constraint on ocean sources of HONO are critical for understanding global atmospheric oxidative capacity and the lifetime of long-lived species such as CH4 that impact pollution and climate.
Data used in this study are publicly available from the Centre for Environmental Data Analysis (CEDA; https://catalogue.ceda.ac.uk/uuid/ddf1032d626b45f78ce1c5e94f289a66, last access: 13 December 2021, Crilley et al., 2018). The Cape Verde data can be accessed from CEDA: https://catalogue.ceda.ac.uk/uuid/6035249fcd5e7643f63a85e0c113fafc, last access: 13 December 2021, (National Centre for Atmospheric Science 2010).
The supplement related to this article is available online at: https://doi.org/10.5194/acp-21-18213-2021-supplement.
This study was conceived by LRC and WJB. Measurements, data curation and investigation were performed by LRC, LJK, CR, JDL, LDJH and WJB. Formal data analysis was performed by LRC, LJK, and WJB. Supervision was done by LJC, JDL, SJB, and WJB. LRC wrote the original draft with contributions from all co-authors.
The contact author has declared that neither they nor their co-authors have any competing interests.
Publisher’s note: Copernicus Publications remains neutral with regard to jurisdictional claims in published maps and institutional affiliations.
The authors would like to thank Luis Neves, Instituto Nacional de Meteorologia e Geofisica (INMG), Cape Verde, for day-to-day running of the CVAO NOx measurements. The University of Leicester authors thank Roberto Sommariva for his technical and organisational input into the WAO campaign and Roland Leigh (now at EarthSense Systems Ltd) for processing the spectral radiometer data from WAO. This work was supported by the Natural Environment Research Council (NERC), UK, through projects ICOZA (Integrated Chemistry of Ozone in the Atmosphere, NE/K012169/1), SNAABL (Sources of Nitrous Acid in the Atmospheric Boundary Layer, NE/M013545/1 (Birmingham) and NE/M010554/1 (Leicester)), Atmospheric Reactive Nitrogen Cycling over the Ocean (NE/S000518/1), and Assessment of ClNO2 as a missing oxidant in the UK atmosphere (NE/K004069/1).
This research has been supported by the Natural Environment Research Council (grant nos. NE/K012169/1, NE/M013545/1, NE/M010554/1, NE/S000518/1 and NE/K004069/1).
This paper was edited by John Orlando and reviewed by two anonymous referees.
Andersen, S. T., Carpenter, L. J., Nelson, B. S., Neves, L., Read, K. A., Reed, C., Ward, M., Rowlinson, M. J., and Lee, J. D.: Long-term NOx measurements in the remote marine tropical troposphere, Atmos. Meas. Tech., 14, 3071–3085, https://doi.org/10.5194/amt-14-3071-2021, 2021.
Bartels-Rausch, T., Brigante, M., Elshorbany, Y. F., Ammann, M., D'Anna, B., George, C., Stemmler, K., Ndour, M., and Kleffmann, J.: Humic acid in ice: Photo-enhanced conversion of nitrogen dioxide into nitrous acid, Atmos. Environ., 44, 5443–5450, https://doi.org/10.1016/j.atmosenv.2009.12.025, 2010.
Bloss, W. J., Evans, M. J., Lee, J. D., Sommariva, R., Heard, D. E., and Pilling, M. J.: The oxidative capacity of the troposphere: Coupling of field measurements of OH and a global chemistry transport model, Faraday Discuss., 130, 425–436, https://doi.org/10.1039/B419090D, 2005.
Carpenter, L. J., Fleming, Z. L., Read, K. A., Lee, J. D., Moller, S. J., Hopkins, J. R., Purvis, R. M., Lewis, A. C., Müller, K., Heinold, B., Herrmann, H., Fomba, K. W., van Pinxteren, D., Müller, C., Tegen, I., Wiedensohler, A., Müller, T., Niedermeier, N., Achterberg, E. P., Patey, M. D., Kozlova, E. A., Heimann, M., Heard, D. E., Plane, J. M. C., Mahajan, A., Oetjen, H., Ingham, T., Stone, D., Whalley, L. K., Evans, M. J., Pilling, M. J., Leigh, R. J., Monks, P. S., Karunaharan, A., Vaughan, S., Arnold, S. R., Tschritter, J., Pöhler, D., Frieß, U., Holla, R., Mendes, L. M., Lopez, H., Faria, B., Manning, A. J., and Wallace, D. W. R.: Seasonal characteristics of tropical marine boundary layer air measured at the Cape Verde Atmospheric Observatory, J. Atmos. Chem., 67, 87–140, https://doi.org/10.1007/s10874-011-9206-1, 2010.
Carslaw, D. C. and Ropkins, K.: openair – An R package for air quality data analysis, Environ. Modell. Softw., 27–28, 52–61, https://doi.org/10.1016/j.envsoft.2011.09.008, 2012.
Crilley, L. R., Kramer, L., Pope, F. D., Whalley, L. K., Cryer, D. R., Heard, D. E., Lee, J. D., Reed, C., and Bloss, W. J.: On the interpretation of: In situ HONO observations via photochemical steady state, Faraday Discuss., 189, 191–212, https://doi.org/10.1039/c5fd00224a, 2016.
Crilley, L. R., Kramer, L. J., Ouyang, B., Duan, J., Zhang, W., Tong, S., Ge, M., Tang, K., Qin, M., Xie, P., Shaw, M. D., Lewis, A. C., Mehra, A., Bannan, T. J., Worrall, S. D., Priestley, M., Bacak, A., Coe, H., Allan, J., Percival, C. J., Popoola, O. A. M., Jones, R. L., and Bloss, W. J.: Intercomparison of nitrous acid (HONO) measurement techniques in a megacity (Beijing), Atmos. Meas. Tech., 12, 6449–6463, https://doi.org/10.5194/amt-12-6449-2019, 2019.
Crilley, L., Kramer, L., Reed, C., Lee, J.D., Massey-Woodward, R., Whalley, L., Forster, G., Bandy, B.: ICOZA: Atmospheric species measurements of OH, HONO, HO2, NO, NO2, NOy, O3, SO2 and CO from Weybourne Atmosphere Observatory July 2015, Centre for Environmental Data Analysis [data set], available at: https://catalogue.ceda.ac.uk/uuid/ddf1032d626b45f78ce1c5e94f289a66, last access: 13 December 2021, 2018.
Cui, L., Li, R., Fu, H., Li, Q., Zhang, L., George, C., and Chen, J.: Formation features of nitrous acid in the offshore area of the East China Sea, Sci. Total Environ., 682, 138–150, https://doi.org/10.1016/j.scitotenv.2019.05.004, 2019.
Edwards, G. D. and Monks, P. S.: Performance of a single-monochromator diode array spectroradiometer for the determination of actinic flux and atmospheric photolysis frequencies, J. Geophys. Res.-Atmos., 108, 8546, https://doi.org/10.1029/2002JD002844, 2003.
Emmerson, K. M., Carslaw, N., and Pilling, M. J.: Urban Atmospheric Chemistry During the PUMA Campaign 2: Radical Budgets for OH, HO2 and RO2, J. Atmos. Chem., 52, 165–183, https://doi.org/10.1007/s10874-005-1323-2, 2005.
Engel, A., Bange, H. W., Cunliffe, M., Burrows, S. M., Friedrichs, G., Galgani, L., Herrmann, H., Hertkorn, N., Johnson, M., Liss, P. S., Quinn, P. K., Schartau, M., Soloviev, A., Stolle, C., Upstill-Goddard, R. C., van Pinxteren, M., and Zäncker, B.: The Ocean's Vital Skin: Toward an Integrated Understanding of the Sea Surface Microlayer, Front. Mar. Sci., 4, 165, https://doi.org/10.3389/fmars.2017.00165, 2017.
Eyring, V., Köhler, H. W., Van Aardenne, J., and Lauer, A.: Emissions from international shipping: 1. The last 50 years, J. Geophys. Res.-Atmos., 110, D17305, https://doi.org/10.1029/2004JD005619, 2005.
Finlayson-Pitts, B. J., Wingen, L. M., Sumner, A. L., Syomin, D., and Ramazan, K. A.: The heterogeneous hydrolysis of NO2 in laboratory systems and in outdoor and indoor atmospheres: An integrated mechanism, Phys. Chem. Chem. Phys., 5, 223–242, 2003.
Forster, G. L., Sturges, W. T., Fleming, Z. L., Bandy, B. J., and Emeis, S.: A year of H2 measurements at Weybourne Atmospheric Observatory, UK, Tellus B, 64, 17771, https://doi.org/10.3402/tellusb.v64i0.17771, 2012.
George, C., Ammann, M., D'Anna, B., Donaldson, D. J., and Nizkorodov, S. A.: Heterogeneous photochemistry in the atmosphere, Chem. Rev., 115, 4218–4258, 2015.
Heland, J., Kleffmann, J., Kurtenbach, R., and Wiesen, P.: A New Instrument To Measure Gaseous Nitrous Acid (HONO) in the Atmosphere, Environ. Sci. Technol., 35, 3207–3212, https://doi.org/10.1021/es000303t, 2001.
Kasibhatla, P., Sherwen, T., Evans, M. J., Carpenter, L. J., Reed, C., Alexander, B., Chen, Q., Sulprizio, M. P., Lee, J. D., Read, K. A., Bloss, W., Crilley, L. R., Keene, W. C., Pszenny, A. A. P., and Hodzic, A.: Global impact of nitrate photolysis in sea-salt aerosol on NOx, OH, and O3 in the marine boundary layer, Atmos. Chem. Phys., 18, 11185–11203, https://doi.org/10.5194/acp-18-11185-2018, 2018.
Kim, S., VandenBoer, T. C., Young, C. J., Riedel, T. P., Thornton, J. A., Swarthout, B., Sive, B., Lerner, B., Gilman, J. B., and Warneke, C.: The primary and recycling sources of OH during the NACHTT-2011 campaign: HONO as an important OH primary source in the wintertime, J. Geophys. Res.-Atmos., 119, 6886–6896, 2014.
Kleffmann, J.: Daytime sources of nitrous acid (HONO) in the atmospheric boundary layer, ChemPhysChem, 8, 1137–1144, 2007.
Kleffmann, J. and Wiesen, P.: Technical Note: Quantification of interferences of wet chemical HONO LOPAP measurements under simulated polar conditions, Atmos. Chem. Phys., 8, 6813–6822, https://doi.org/10.5194/acp-8-6813-2008, 2008.
Kleffmann, J., Heland, J., Kurtenbach, R., Lorzer, J., and Wiesen, P.: A new instrument (LOPAP) for the detection of nitrous acid (HONO), Environ. Sci. Pollut. R., 1, 48–54, 2002.
Kleffmann, J., Gavriloaiei, T., Hofzumahaus, A., Holland, F., Koppmann, R., Rupp, L., Schlosser, E., Siese, M., and Wahner, A.: Daytime formation of nitrous acid: A major source of OH radicals in a forest, Geophys. Res. Lett., 32, L05818, https://doi.org/10.1029/2005GL022524, 2005.
Kramer, L. J., Crilley, L. R., Adams, T. J., Ball, S. M., Pope, F. D., and Bloss, W. J.: Nitrous acid (HONO) emissions under real-world driving conditions from vehicles in a UK road tunnel, Atmos. Chem. Phys., 20, 5231–5248, https://doi.org/10.5194/acp-20-5231-2020, 2020.
Lee, J. D., Moller, S. J., Read, K. A., Lewis, A. C., Mendes, L., and Carpenter, L. J.: Year-round measurements of nitrogen oxides and ozone in the tropical North Atlantic marine boundary layer, J. Geophys. Res.-Atmos., 114, D21302, https://doi.org/10.1029/2009JD011878, 2009.
Lee, B. H., Wood, E. C., Herndon, S. C., Lefer, B. L., Luke, W. T., Brune, W. H., Nelson, D. D., Zahniser, M. S., and Munger, J. W.: Urban measurements of atmospheric nitrous acid: A caveat on the interpretation of the HONO photostationary state, J. Geophys. Res.-Atmos., 118, 12274–12281, 2013.
Lee, J. D., Whalley, L. K., Heard, D. E., Stone, D., Dunmore, R. E., Hamilton, J. F., Young, D. E., Allan, J. D., Laufs, S., and Kleffmann, J.: Detailed budget analysis of HONO in central London reveals a missing daytime source, Atmos. Chem. Phys., 16, 2747–2764, https://doi.org/10.5194/acp-16-2747-2016, 2016.
Michoud, V., Colomb, A., Borbon, A., Miet, K., Beekmann, M., Camredon, M., Aumont, B., Perrier, S., Zapf, P., Siour, G., Ait-Helal, W., Afif, C., Kukui, A., Furger, M., Dupont, J. C., Haeffelin, M., and Doussin, J. F.: Study of the unknown HONO daytime source at a European suburban site during the MEGAPOLI summer and winter field campaigns, Atmos. Chem. Phys., 14, 2805–2822, https://doi.org/10.5194/acp-14-2805-2014, 2014.
National Centre for Atmospheric Science: Cape Verde Atmospheric Observatory: NOxy measurements, NCAS British Atmospheric Data Centre [data set], available at: https://catalogue.ceda.ac.uk/uuid/6035249fcd5e7643f63a85e0c113fafc, last access: 13 December 2021, 2010.
Penkett, S. A., Plane, J. M. C., Comes, F. J., Clemitshaw, K. C., and Coe, H.: The Weybourne atmospheric observatory, J. Atmos. Chem., 33, 107–110, 1999.
Pinto, J. P., Dibb, J., Lee, B. H., Rappenglück, B., Wood, E. C., Levy, M., Zhang, R., Lefer, B., Ren, X., and Stutz, J.: Intercomparison of field measurements of nitrous acid (HONO) during the SHARP campaign, J. Geophys. Res.-Atmos., 119, 5583–5601, 2014.
Pusede, S. E., VandenBoer, T. C., Murphy, J. G., Markovic, M. Z., Young, C. J., Veres, P. R., Roberts, J. M., Washenfelder, R. A., Brown, S. S., and Ren, X.: An atmospheric constraint on the NO2 dependence of daytime near-surface nitrous acid (HONO), Environ. Sci. Technol., 49, 12774–12781, 2015.
Read, K. A., Mahajan, A. S., Carpenter, L. J., Evans, M. J., Faria, B. V. E., Heard, D. E., Hopkins, J. R., Lee, J. D., Moller, S. J., and Lewis, A. C.: Extensive halogen-mediated ozone destruction over the tropical Atlantic Ocean, Nature, 453, 1232–1235, 2008.
Reed, C., Brumby, C. A., Crilley, L. R., Kramer, L. J., Bloss, W. J., Seakins, P. W., Lee, J. D., and Carpenter, L. J.: HONO measurement by differential photolysis, Atmos. Meas. Tech., 9, 2483–2495, https://doi.org/10.5194/amt-9-2483-2016, 2016.
Reed, C., Evans, M. J., Crilley, L. R., Bloss, W. J., Sherwen, T., Read, K. A., Lee, J. D., and Carpenter, L. J.: Evidence for renoxification in the tropical marine boundary layer, Atmos. Chem. Phys., 17, 4081–4092, https://doi.org/10.5194/acp-17-4081-2017, 2017.
Ren, X., Brune, W. H., Mao, J., Mitchell, M. J., Lesher, R. L., Simpas, J. B., Metcalf, A. R., Schwab, J. J., Cai, C., Li, Y., Demerjian, K. L., Felton, H. D., Boynton, G., Adams, A., Perry, J., He, Y., Zhou, X., and Hou, J.: Behavior of OH and HO2 in the winter atmosphere in New York City, Atmos. Environ., 40, 252–263, https://doi.org/10.1016/j.atmosenv.2005.11.073, 2006.
Sabbaghzadeh, B., Upstill-Goddard, R. C., Beale, R., Pereira, R., and Nightingale, P. D.: The Atlantic Ocean surface microlayer from 50∘ N to 50∘ S is ubiquitously enriched in surfactants at wind speeds up to 13 m s−1, Geophys. Res. Lett., 44, 2852–2858, https://doi.org/10.1002/2017GL072988, 2017.
Shi, Q., Tao, Y., Krechmer, J. E., Heald, C. L., Murphy, J. G., Kroll, J. H., and Ye, Q.: Laboratory Investigation of Renoxification from the Photolysis of Inorganic Particulate Nitrate, Environ. Sci. Technol., 55, 854–861, https://doi.org/10.1021/acs.est.0c06049, 2021.
Slater, E. J., Whalley, L. K., Woodward-Massey, R., Ye, C., Lee, J. D., Squires, F., Hopkins, J. R., Dunmore, R. E., Shaw, M., Hamilton, J. F., Lewis, A. C., Crilley, L. R., Kramer, L., Bloss, W., Vu, T., Sun, Y., Xu, W., Yue, S., Ren, L., Acton, W. J. F., Hewitt, C. N., Wang, X., Fu, P., and Heard, D. E.: Elevated levels of OH observed in haze events during wintertime in central Beijing, Atmos. Chem. Phys., 20, 14847–14871, https://doi.org/10.5194/acp-20-14847-2020, 2020.
Sörgel, M., Regelin, E., Bozem, H., Diesch, J.-M., Drewnick, F., Fischer, H., Harder, H., Held, A., Hosaynali-Beygi, Z., Martinez, M., and Zetzsch, C.: Quantification of the unknown HONO daytime source and its relation to NO2, Atmos. Chem. Phys., 11, 10433–10447, https://doi.org/10.5194/acp-11-10433-2011, 2011.
Spataro, F. and Ianniello, A.: Sources of atmospheric nitrous acid: State of the science, current research needs, and future prospects, J. Air Waste Manage., 64, 1232–1250, 2014.
Stemmler, K., Ammann, M., Donders, C., Kleffmann, J., and George, C.: Photosensitized reduction of nitrogen dioxide on humic acid as a source of nitrous acid, Nature, 440, 195–198, 2006.
Stolle, C., Ribas-Ribas, M., Badewien, T. H., Barnes, J., Carpenter, L. J., Chance, R., Damgaard, L. R., Quesada, A. M. D., Engel, A., Frka, S., Galgani, L., Gašparović, B., Gerriets, M., Mustaffa, N. I. H., Herrmann, H., Kallajoki, L., Pereira, R., Radach, F., Revsbech, N. P., Rickard, P., Saint, A., Salter, M., Striebel, M., Triesch, N., Uher, G., Upstill-Goddard, R. C., van Pinxteren, M., Zäncker, B., Zieger, P., and Wurl, O.: The Milan Campaign: Studying diel light effects on the air – sea interface, B. Am. Meteorol. Soc., 101, 146–166, https://doi.org/10.1175/BAMS-D-17-0329.1, 2020.
Sun, L., Chen, T., Jiang, Y., Zhou, Y., Sheng, L., Lin, J., Li, J., Dong, C., Wang, C., Wang, X., Zhang, Q., Wang, W., and Xue, L.: Ship emission of nitrous acid (HONO) and its impacts on the marine atmospheric oxidation chemistry, Sci. Total Environ., 735, 139355, https://doi.org/10.1016/j.scitotenv.2020.139355, 2020.
Thalman, R., Baeza-Romero, M. T., Ball, S. M., Borrás, E., Daniels, M. J. S., Goodall, I. C. A., Henry, S. B., Karl, T., Keutsch, F. N., Kim, S., Mak, J., Monks, P. S., Muñoz, A., Orlando, J., Peppe, S., Rickard, A. R., Ródenas, M., Sánchez, P., Seco, R., Su, L., Tyndall, G., Vázquez, M., Vera, T., Waxman, E., and Volkamer, R.: Instrument intercomparison of glyoxal, methyl glyoxal and NO2 under simulated atmospheric conditions, Atmos. Meas. Tech., 8, 1835–1862, https://doi.org/10.5194/amt-8-1835-2015, 2015.
VandenBoer, T. C., Brown, S. S., Murphy, J. G., Keene, W. C., Young, C. J., Pszenny, A. A. P., Kim, S., Warneke, C., de Gouw, J. A., and Maben, J. R.: Understanding the role of the ground surface in HONO vertical structure: High resolution vertical profiles during NACHTT-11, J. Geophys. Res.-Atmos., 118, 10–155, 2013.
Večeřa, Z., Mikuška, P., Smolík, J., Eleftheriadis, K., Bryant, C., Colbeck, I., and Lazaridis, M.: Shipboard measurements of nitrogen dioxide, nitrous acid, nitric acid and ozone in the Eastern Mediterranean Sea, Water, Air, Soil Pollut, Focus, 8, 117–125, 2008.
Villena, G., Wiesen, P., Cantrell, C. A., Flocke, F., Fried, A., Hall, S. R., Hornbrook, R. S., Knapp, D., Kosciuch, E., and Mauldin, R. L.: Nitrous acid (HONO) during polar spring in Barrow, Alaska: A net source of OH radicals?, J. Geophys. Res.-Atmos., 116, D00R07, https://doi.org/10.1029/2011JD016643, 2011.
Wen, L., Chen, T., Zheng, P., Wu, L., Wang, X., Mellouki, A., Xue, L., and Wang, W.: Nitrous acid in marine boundary layer over eastern Bohai Sea, China: Characteristics, sources, and implications, Sci. Total Environ., 670, 282–291, 2019.
Whalley, L. K., Furneaux, K. L., Goddard, A., Lee, J. D., Mahajan, A., Oetjen, H., Read, K. A., Kaaden, N., Carpenter, L. J., Lewis, A. C., Plane, J. M. C., Saltzman, E. S., Wiedensohler, A., and Heard, D. E.: The chemistry of OH and HO2 radicals in the boundary layer over the tropical Atlantic Ocean, Atmos. Chem. Phys., 10, 1555–1576, https://doi.org/10.5194/acp-10-1555-2010, 2010.
Williams, P. M., Carlucci, A. F., Henrichs, S. M., Van Vleet, E. S., Horrigan, S. G., Reid, F. M. H., and Robertson, K. J.: Chemical and microbiological studies of sea-surface films in the Southern Gulf of California and off the West Coast of Baja California, Mar. Chem., 19, 17–98, 1986.
Wojtal, P., Halla, J. D., and McLaren, R.: Pseudo steady states of HONO measured in the nocturnal marine boundary layer: a conceptual model for HONO formation on aqueous surfaces, Atmos. Chem. Phys., 11, 3243–3261, https://doi.org/10.5194/acp-11-3243-2011, 2011.
Wurl, O. and Obbard, J. P.: A review of pollutants in the sea-surface microlayer (SML): a unique habitat for marine organisms, Mar. Pollut. Bull., 48, 1016–1030, 2004.
Wurl, O., Wurl, E., Miller, L., Johnson, K., and Vagle, S.: Formation and global distribution of sea-surface microlayers, Biogeosciences, 8, 121–135, https://doi.org/10.5194/bg-8-121-2011, 2011.
Ye, C., Zhou, X., Pu, D., Stutz, J., Festa, J., Spolaor, M., Tsai, C., Cantrell, C., Mauldin, R. L., Campos, T., Weinheimer, A., Hornbrook, R. S., Apel, E. C., Guenther, A., Kaser, L., Yuan, B., Karl, T., Haggerty, J., Hall, S., Ullmann, K., Smith, J. N., Ortega, J., and Knote, C.: Rapid cycling of reactive nitrogen in the marine boundary layer, Nature, 532, 489–491, https://doi.org/10.1038/nature17195, 2016.
Yu, C., Wang, Z., Ma, Q., Xue, L., George, C., and Wang, T.: Measurement of heterogeneous uptake of NO2 on inorganic particles, sea water and urban grime, J. Environ. Sci., 106, 124–135, https://doi.org/10.1016/j.jes.2021.01.018, 2021.
Zha, Q., Xue, L., Wang, T., Xu, Z., Yeung, C., Louie, P. K. K., and Luk, C. W. Y.: Large conversion rates of NO2 to HNO2 observed in air masses from the South China Sea: Evidence of strong production at sea surface?, Geophys. Res. Lett., 41, 7710–7715, https://doi.org/10.1002/2014GL061429, 2014.
Zhang, L., Wang, T., Zhang, Q., Zheng, J., Xu, Z., and Lv, M.: Potential sources of nitrous acid (HONO) and their impacts on ozone: A WRF-Chem study in a polluted subtropical region, J. Geophys. Res.-Atmos., 121, 3645–3662, https://doi.org/10.1002/2015JD024468, 2016.