the Creative Commons Attribution 4.0 License.
the Creative Commons Attribution 4.0 License.
 | 13 Dec 2021
Measurement report: High contributions of halocarbon and aromatic compounds to atmospheric volatile organic compounds in an industrial area
Ahsan Mozaffar
Yu-Chi Lin
Feng Xie
Mei-Yi Fan
Fang Cao
Volatile organic compounds (VOCs) are key components of tropospheric chemistry. We investigated ambient VOCs in an industrial area in Nanjing, China, between July 2018 and May 2020. The sum of the suite of measured total VOC (TVOC) concentrations was 59.8 ± 28.6 ppbv (part per billion by volume) during the investigation period. About twice the TVOC concentrations were observed in the autumn (83 ± 20 ppbv) and winter (77.5 ± 16.8 ppbv) seasons compared to those in spring (39.6 ± 13.1 ppbv) and summer (38.8 ± 10.2 ppbv). In previous studies in Nanjing, oxygenated VOCs (OVOCs) and halocarbons were not measured, and the current TVOC concentration without halocarbons and OVOCs was similar to the previous investigation in the same study area. However, it was twofold higher than the one reported in the nonindustrial suburban area of Nanjing. Due to the industrial influence, the halocarbons VOC group (14.3 ± 7.3 ppbv, 24 %) was the second-largest contributor to the TVOCs after alkanes (21 ± 7 ppbv, 35 %), which is in contrast with the previous studies in Nanjing and also in almost all other regions in China. Relatively high proportions of halocarbons and aromatics were observed in autumn (25.7 % and 19.3 %, respectively) and winter (25.8 % and 17.6 %, respectively) compared to those in summer (20.4 % and 11.8 %, respectively) and spring (20.3 % and 13.6 %, respectively). According to the potential source contribution function (PSCF), short-distance transport from the surrounding industrial areas and cities was the main reason for the high VOC concentrations in the study area. According to positive matrix factorization (PMF) model results, vehicle-related emissions (33 %–48 %) contributed to the major portion of the ambient VOC concentrations. Aromatics, followed by alkenes, were the top contributors to the loss rate of OH radicals (LOH; 37 % and 32 %, respectively). According to the empirical kinetic modelling approach (EKMA) and relative incremental reactivity (RIR) analysis, the study area was in the VOC-sensitive regime for ozone (O3) formation during all measurement seasons. Therefore, alkenes and aromatics emissions from automobiles need to be decreased to reduce secondary air pollution formation in the study area.
- Article
(4627 KB) - Full-text XML
-
Supplement
(4588 KB) - BibTeX
- EndNote


Air pollution characterized by severe ozone (O3) and haze pollution is a big problem in urban and industrial areas in China (He et al., 2019; Hui et al., 2018, 2019; Tan et al., 2018b; Jia et al., 2016; Feng et al., 2016). In recent years, O3 concentrations above the national standard and severe haze events have been frequently reported (He et al., 2019; Hui et al., 2019; Sheng et al., 2018; Feng et al., 2016; Tan et al., 2018b; Jia et al., 2016). As a precursor of O3 and secondary organic aerosol (SOA), volatile organic compounds (VOCs) are largely responsible for the severe air pollution in China (Song et al., 2018; Hui et al., 2019, 2018; He et al., 2019). Unfortunately, anthropogenic VOC emissions have been increasing over the last 2 decades in China, and they are expected to do so in the future (Mozaffar and Zhang, 2020, and references therein).
Atmospheric VOC has plenty of sources; it can be emitted from various anthropogenic and biogenic sources. Besides, it can also be formed in the atmosphere. Anthropogenic VOC sources mainly include industrial emissions, vehicle exhaust, solvent usage, biomass burning, and fuel evaporation. On the other hand, vegetation is the main biogenic source of VOC. In developed areas in China, vehicle exhaust and industrial emissions are the two major VOC sources (He et al., 2019; Hui et al., 2018, 2019; Mo et al., 2017; Song et al., 2018; An et al., 2014; Mozaffar and Zhang, 2020). Vehicle-related sources are more dominant in the North China Plain (NCP), central China (CC), and the Pearl River Delta (PRD) regions. But industry-related sources are more influential in the Yangtze River Delta (YRD) area (Zhang et al., 2017, 2018; Meng et al., 2015; Sun et al., 2019; He et al., 2019; An et al., 2017; Mozaffar and Zhang, 2020; Shao et al., 2016). Alkanes, alkenes, aromatics, oxygenated VOCs (OVOCs), and halocarbons are the most common VOC groups in the atmosphere (Hui et al., 2019, 2018; Hung-Lung et al., 2007; Song et al., 2018; Tiwari et al., 2010; He et al., 2019; Na et al., 2001). The seasonal change affects VOC concentration and composition. For example, the contribution from biogenic and solvent utilization increases in summer, and the contribution from combustion sources increases in winter (Mo et al., 2017; Song et al., 2018; An et al., 2014). The chemical reactivity of VOCs depends on their chemical composition. For instance, alkenes and aromatics are generally more reactive than alkanes (Carter, 2010). An analysis of the OH radical loss rate (LOH) is commonly used to understand the chemical reactivity of VOCs (Hui et al., 2018).
Industries are an important source of VOCs, and different reactive and hazardous VOC emissions from industries have already been reported in different areas of the Earth (Z. Zhang et al., 2018; Na et al., 2001; Hung-Lung et al., 2007; Yan et al., 2016; Tiwari et al., 2010; Shi et al., 2015). For instance, Z. Zhang et al. (2018) reported a high concentration of alkanes (21.3 ± 17.8 mg m−3 out of the total 23.1 ± 24.5 mg m−3) and a lifetime cancer risk from different aromatics and halocarbons in a petroleum refinery in Guangzhou, China. A high concentration of OVOCs (829.7 ± 1076.7 ppb C, where ppb is parts per billion, out of a total of 1317.3 ± 1184.5 ppb C) was observed in an industrial area in Ulsan, South Korea (Na et al., 2001). Hung-Lung et al. (2007) mentioned a high concentration of aromatics (∼ 90 ppb out of a total of ∼ 160 ppb) in an industrial area in Taiwan. A high concentration of halocarbons (9590.2 mg m−3 out of a total of 19 652 mg m−3) was observed in an iron smelting plant in Liaoning, China (Shi et al., 2015). Y. Zhang et al. (2018) mentioned a high concentration of alkanes (39.4 ppbv, parts per billion by volume, out of a total of 94.15 ppbv) and aromatics (18.9 ppbv out of a total of 94.15 ppbv) in a petrochemical industrial area in Shanghai, China. Therefore, VOC composition varies among the industries/industrial areas in different regions. Mostly, short-term investigations are performed to characterize the VOCs in industry-affected areas. In the current study, we carried out a comprehensive investigation on VOC in an industrial area in Nanjing between July 2018 and May 2020. Several VOC investigations have already been performed in the Nanjing industrial area, but OVOCs and halocarbons were not measured in those studies (An et al., 2017, 2014). However, OVOCs and halocarbons are already mentioned as being one of the highest concentrated VOC groups in other industrial regions (Na et al., 2001; Shi et al., 2015). In the current study area, a high concentration of alkanes (19.6 ppbv out of the total 43.5 ppbv) and alkenes (11.1 ppbv out of the total 43.5 ppbv) was observed in a previous investigation (An et al., 2014). Besides the incomplete VOC measurements, O3 formation sensitivity to its precursors was not investigated properly by using a photochemical box model in Nanjing. Moreover, the source apportionment of VOCs was not conducted for different seasons of a year.
In the current study, we report the variations in concentrations and compositions of VOC during the observation period. We present the possible source areas and potential sources of VOC based on a potential source contribution function (PSCF) and positive matrix factorization (PMF) model analysis. We also report the chemical reactivity of the VOC using LOH. We also present the sensitivity analysis of O3 formation using the empirical kinetic modelling approach (EKMA) and relative incremental reactivity (RIR) analysis. Therefore, this study provides valuable information to the scientific community and policymakers.
2.1 Sampling site description, gases analysis, and meteorology data
Field measurements were carried out at the Nanjing University of Information Science and Technology (32.1∘ N, 118.4∘ E) for about 1 month in winter, spring, and summer and 3 months in autumn between July 2018 and May 2020. The sampling site was on the rooftop of a building (∼ 20 m). The sampling site is surrounded by different chemical and petrochemical industries, steel plants, gas stations, high traffic roads, and residential areas. A detailed description of the sampling site can be found elsewhere (Mozaffar et al., 2020).
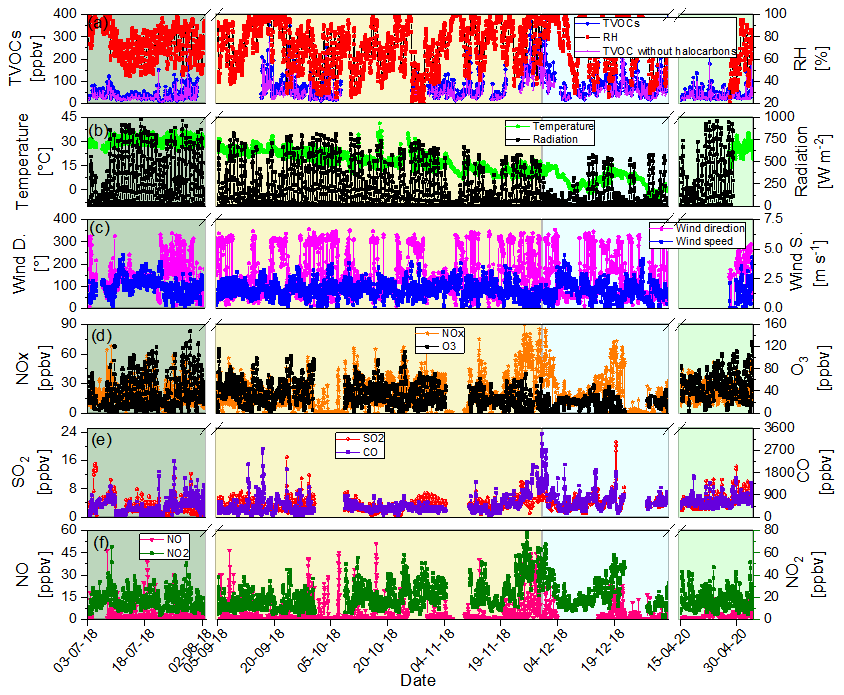
Figure 1Time series of hourly meteorological parameters, inorganic air pollutants, TVOCs, and TVOCs without halocarbon concentrations during the observation period at Nanjing. The green, yellow, cyan, and light green shaded areas indicate summer, autumn, winter, and spring seasons, respectively. The discontinuity of the measured data is due to instrument failure.
We analysed ambient air VOCs using an online gas chromatography flame ionization detector mass spectrometer (GC-FID/MS) instrument (AC-GCMS 1000; Guangzhou HeXin Instrument Co., LTD., China). The FID detector analysed C2–C5 VOCs, and the MS analysed C6–C12 VOCs. The instrument analysed one sample every hour. During the investigation period, we inspected and calibrated the instrument regularly to ensure the accuracy of the data (Mozaffar et al., 2020). We monitored the O3 concentrations using a 49i O3 analyser (Thermo Fisher Scientific Inc., USA). NO, NO2, and NOx concentrations were measured using a 42i NO–NO2-NOx analyser (Thermo Fisher Scientific Inc., USA). SO2 concentrations were followed using a 43i SO2 analyser (Thermo Fisher Scientific Inc., USA), and CO concentrations were measured using a 48i CO analyser (Thermo Fisher Scientific Inc., USA). We also measured temperature and relative humidity, wind speed, wind direction, and solar radiation with HMP155 (Vaisala, Finland), 010C (Met One Instruments, Inc., USA), 020C (Met One Instruments, Inc., USA), and CNR4 (Kipp & Zonen, The Netherlands) analysers, respectively. A detailed description of the instrumentation, sampling procedure, analysis, quality control, and calibration procedure can be found elsewhere (Mozaffar et al., 2020).
2.2 Positive matrix factorization (PMF) model and potential source contribution function (PSCF)
We used the positive matrix factorization (PMF) model (U.S. Environmental Protection Agency, U.S. EPA, version 5.0) for the source apportionment of VOCs. A detailed description of the model can be found elsewhere (Hui et al., 2019; Song et al., 2018). We used 20 potential VOC tracers (Figs. S1–S4) in the PMF model. The error fraction was set to 20 % for the sample data uncertainty estimation. We explored the PMF factor number from 4 to 8 to determine the optimal number of sources. Finally, we decided to choose a 7- to 8-factor solution for different seasons, as was ∼ 1.0, ranged from 0.99 to 1.45 (Hui et al., 2019), and strong correlations (0.7–0.8) were observed between the concentrations extracted from the model and the observed concentrations of each compound (He et al., 2019).
We used the potential source contribution function (PSCF) to locate possible source areas of VOCs for different seasons during the investigation period. We used ZeFir analysis software to do the PSCF analysis and the Hysplit4 model to cluster the backward trajectories (Petit et al., 2017). Backward trajectories at the sampling site were estimated using the National Centres for Environmental Prediction data (ftp://arlftp.arlhq.noaa.gov/pub/archives/gdas1, last access: 27 September 2020). We estimated 72 h of backward trajectories 24 times a day, arriving at 500 m above the ground surface, using the HYSPLIT4 model. For the PSCF analysis, we divided the geographic region covered by the back trajectories into an array of grid cells. The mean TVOC concentration was used as the VOC reference value. More details about the PSCF analysis can be found in previous studies (Chen et al., 2018).
2.3 OH radical loss rate (LOH)
To evaluate the daytime photochemistry of VOCs, we estimated their OH radical loss rate (LOH). The following equation was used to estimate the LOH (s−1) (Zhang et al., 2020).
where [VOC]i is the concentration of VOC species i (molecules per cubic centimetre), and kOH,i (cubic centimetres per molecule per second) is the reaction rate constant of i VOC with the OH radical. The kOH values for the VOCs are collected from Carter (2010; Table S1).
2.4 Empirical kinetic modelling approach (EKMA) and relative incremental reactivity (RIR)
The empirical kinetic modelling approach (EKMA) is a well-known procedure to develop the O3 formation reduction strategy by testing the relationship between ambient O3 and its precursors (He et al., 2019; Hui et al., 2018; Vermeuel et al., 2019; Tan et al., 2018b). To obtain data for the EKMA isopleth, we used the Framework for 0-D Atmospheric Model (F0AM; v3.2; Wolfe et al., 2016), a photochemical box model run by Master Chemical Mechanism (MCM) v3.2 chemistry (Jenkin et al., 1997, 2003, 2015; Saunders et al., 2003). The F0AM-MCM box model can simulate 16 940 reactions of 5733 chemical species. The box model was run using the VOCs and gas concentrations and the meteorological data as input. In total, 61 VOCs were constrained in the model as the rest of the observed VOC species reactions are not included yet in MCM. These constrained VOCs are listed in Table S1. To generate the O3 isopleth from the model-simulated data, a total of 121 reduction scenarios (11 NOx × 11 VOC concentrations) were simulated, and the maximum O3 produced at each model scenario was saved.
The relative incremental reactivity (RIR; Cardelino and Chameides, 1995) is also used to test the O3 formation sensitivity of its precursors. We also utilized the F0AM-MCM box model data to estimate the RIR. The RIR is simply defined as the percentage change in O3 formation per percentage change in the precursor's concentration. In this study, we reduced the precursor concentration by 10 % for the RIR estimation. The RIR was estimated using the following equation.
where [X] is the observed concentration of a precursor X, and [ΔX] is the changes in the concentration of X. and –ΔX) are the simulated net O3 production, using the observed and reduced concentration of the precursor X, respectively.
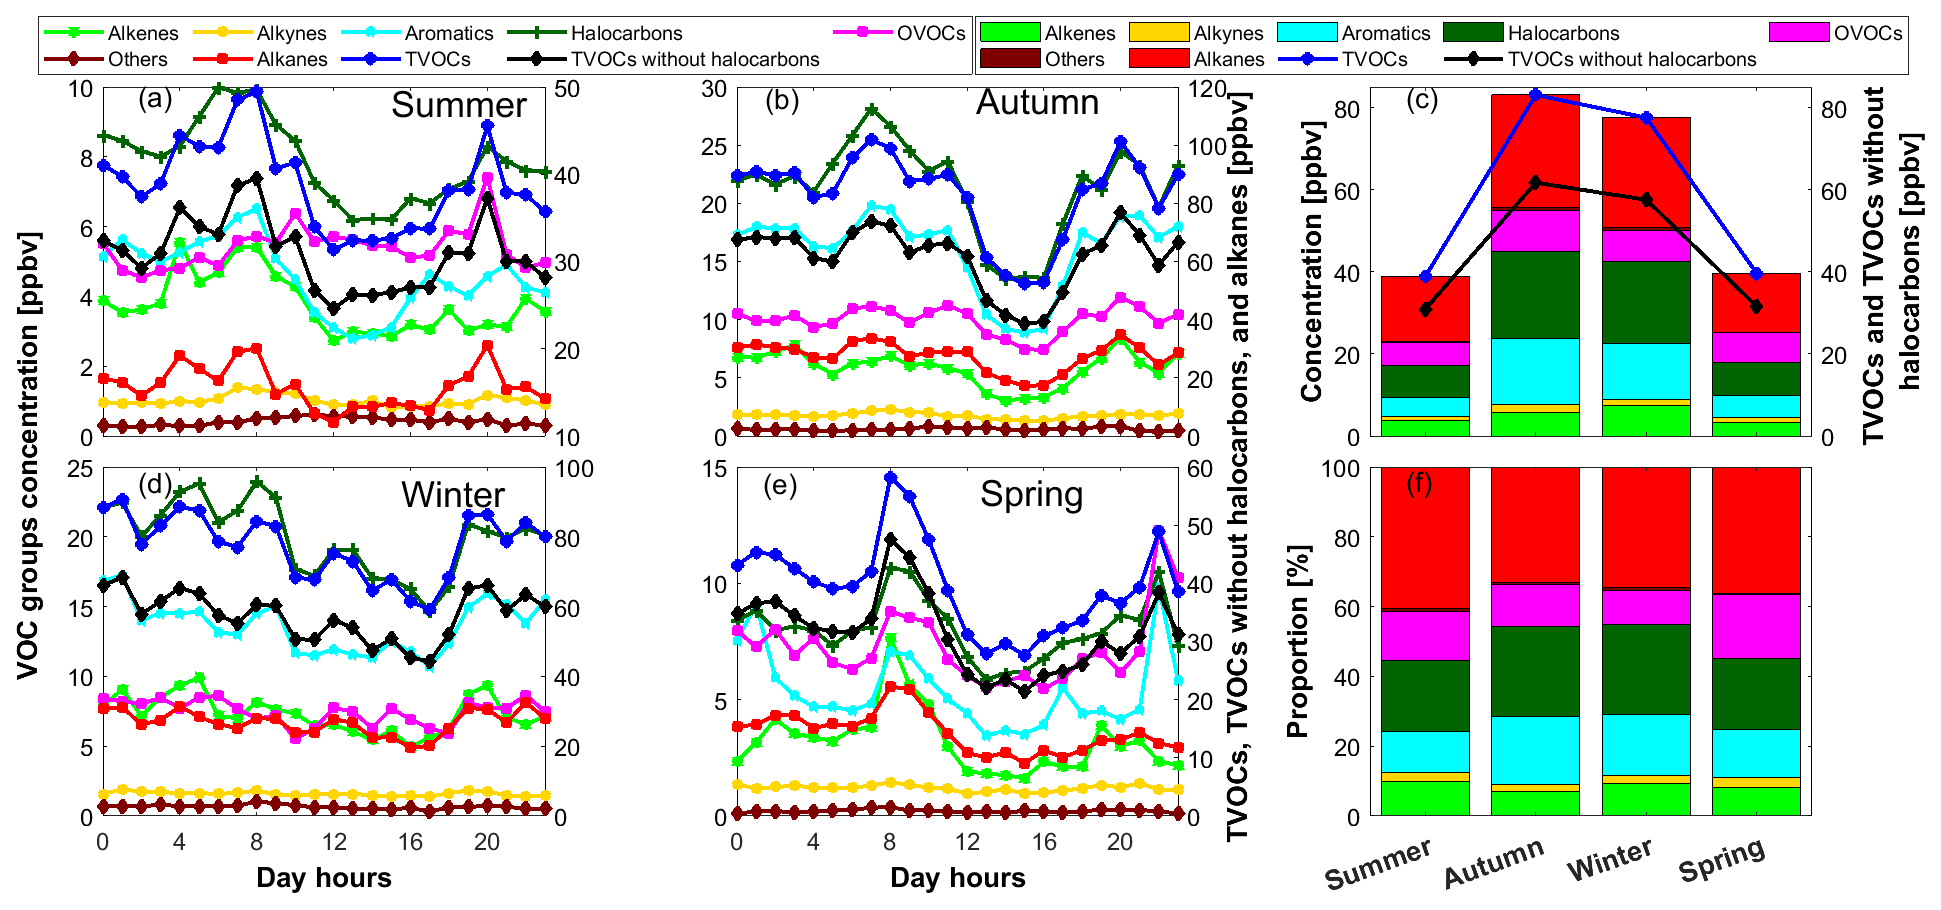
Figure 2Diurnal variations in different VOC groups, TVOCs, and TVOCs without halocarbons concentrations in different seasons (a, b, d, e). Seasonal variations in average concentrations and the proportion of different VOC groups, TVOCs, and TVOCs without halocarbons (c, f).
3.1 Overview of the metrological conditions and air pollutants concentrations
The time series of the hourly data is shown in Fig. 1. The discontinuity of the time series data is due to the failure of the instruments and the COVID-19-related lockdowns. The data measured between July and August 2018 are termed summertime data. Similarly, data collected between September and November 2018 are autumn time data, data collected between December 2018 and January 2019 are wintertime data, and data collected between April and May 2020 are springtime data. Overall, the observed temperature and solar radiation gradually decreased from summer to winter and increased back to the summertime level in spring. The temperature ranged between −5.7 and 41.4 ∘C during the measurement period. The relative humidity values varied from 18 % to 100 %; high values were generally observed in winter and autumn. During the observation period, wind speeds ranged between 0.1 and 7.5 ms−1. Wind prevailed at the sampling site from many directions during the measurement periods; more details about the wind direction will be discussed in Sect. 3.3.2. The O3 and NOx concentrations varied from 2 to 160 ppbv and 0.4 to 90 ppbv, respectively. Whereas high O3 concentrations (>80 ppbv) were observed in summer and spring, high NOx concentrations were measured in winter and at the end of autumn. The CO and SO2 concentrations ranged from 83 to 3398 ppbv and 0.5 to 21 ppbv, respectively. In general, high CO and SO2 concentrations were observed in the winter and spring. The measured NO and NO2 concentrations varied from 0.4 to 51 ppbv and 1 to 79 ppbv, respectively. In general, high NO and NO2 concentrations were observed in autumn and winter. The TVOC concentrations estimated with all the measured VOCs varied between 9 and 393 ppbv during the observation period, and the high values were measured in autumn and winter. More details about the above-mentioned parameters will be discussed in the following section.
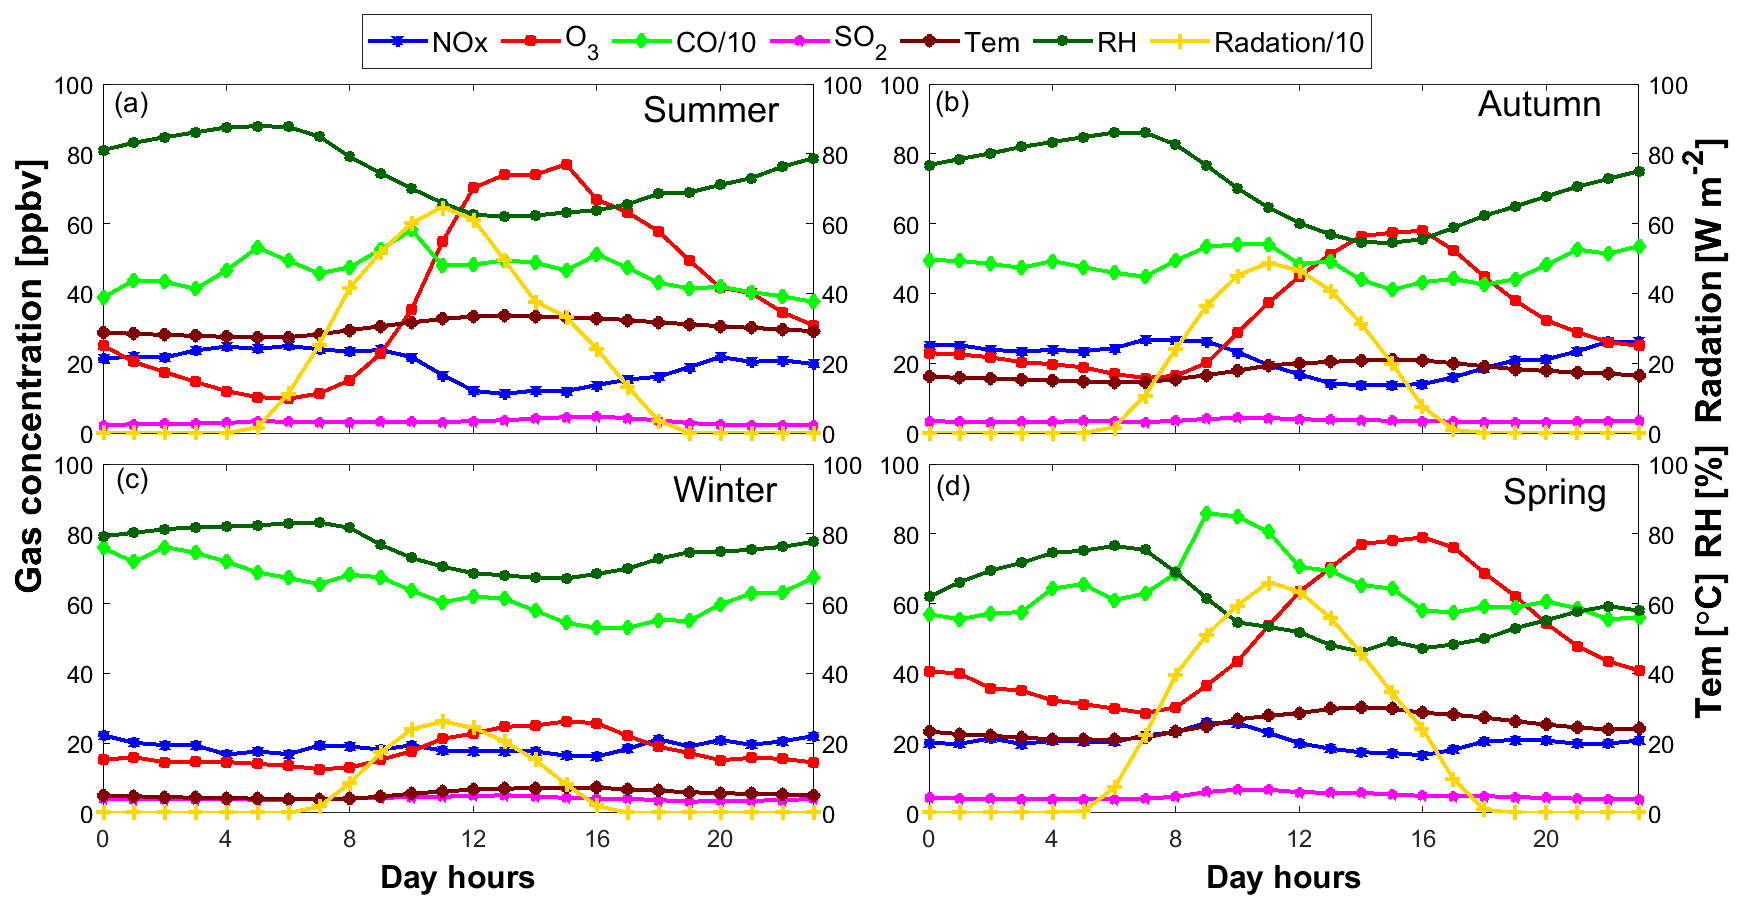
Figure 3Diurnal variations in weather conditions and NOx, O3, CO, and SO2 concentrations in different seasons. Note that the plotted CO concentrations and solar radiation values are reduced 10-fold for a better visualization.
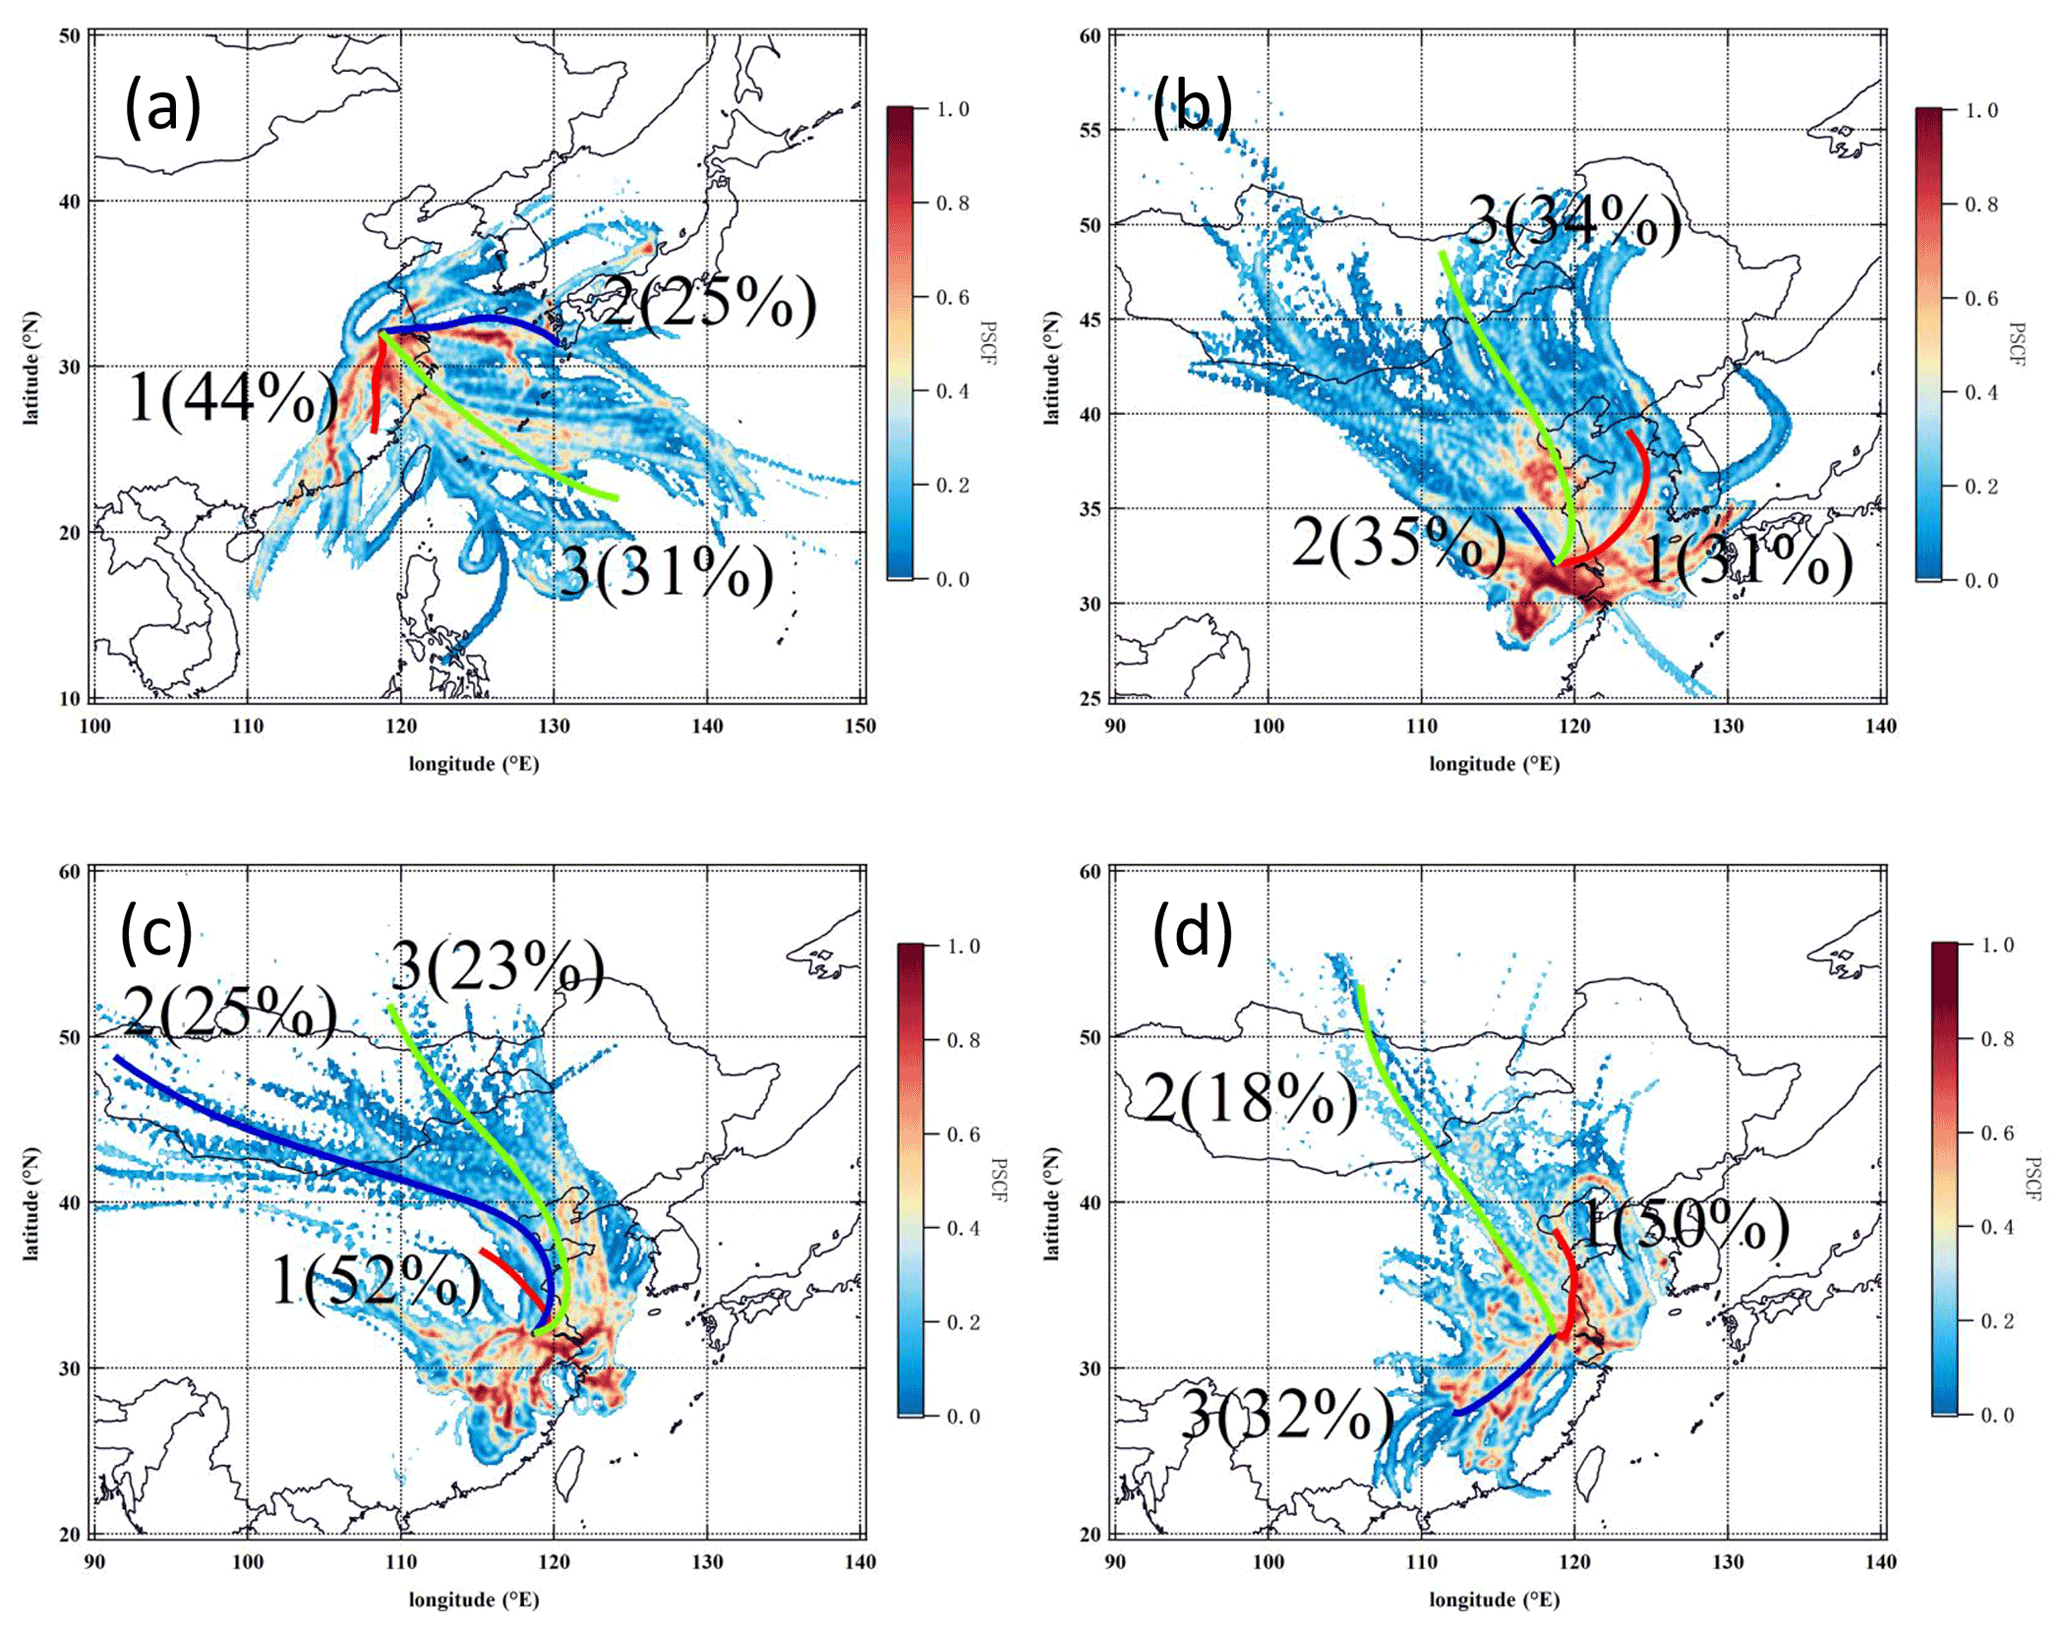
Figure 4Wind cluster and PSCF analysis during (a) summer (b) autumn, (c) winter, and (d) spring, based on the 72 h backward air mass trajectories from the study area.
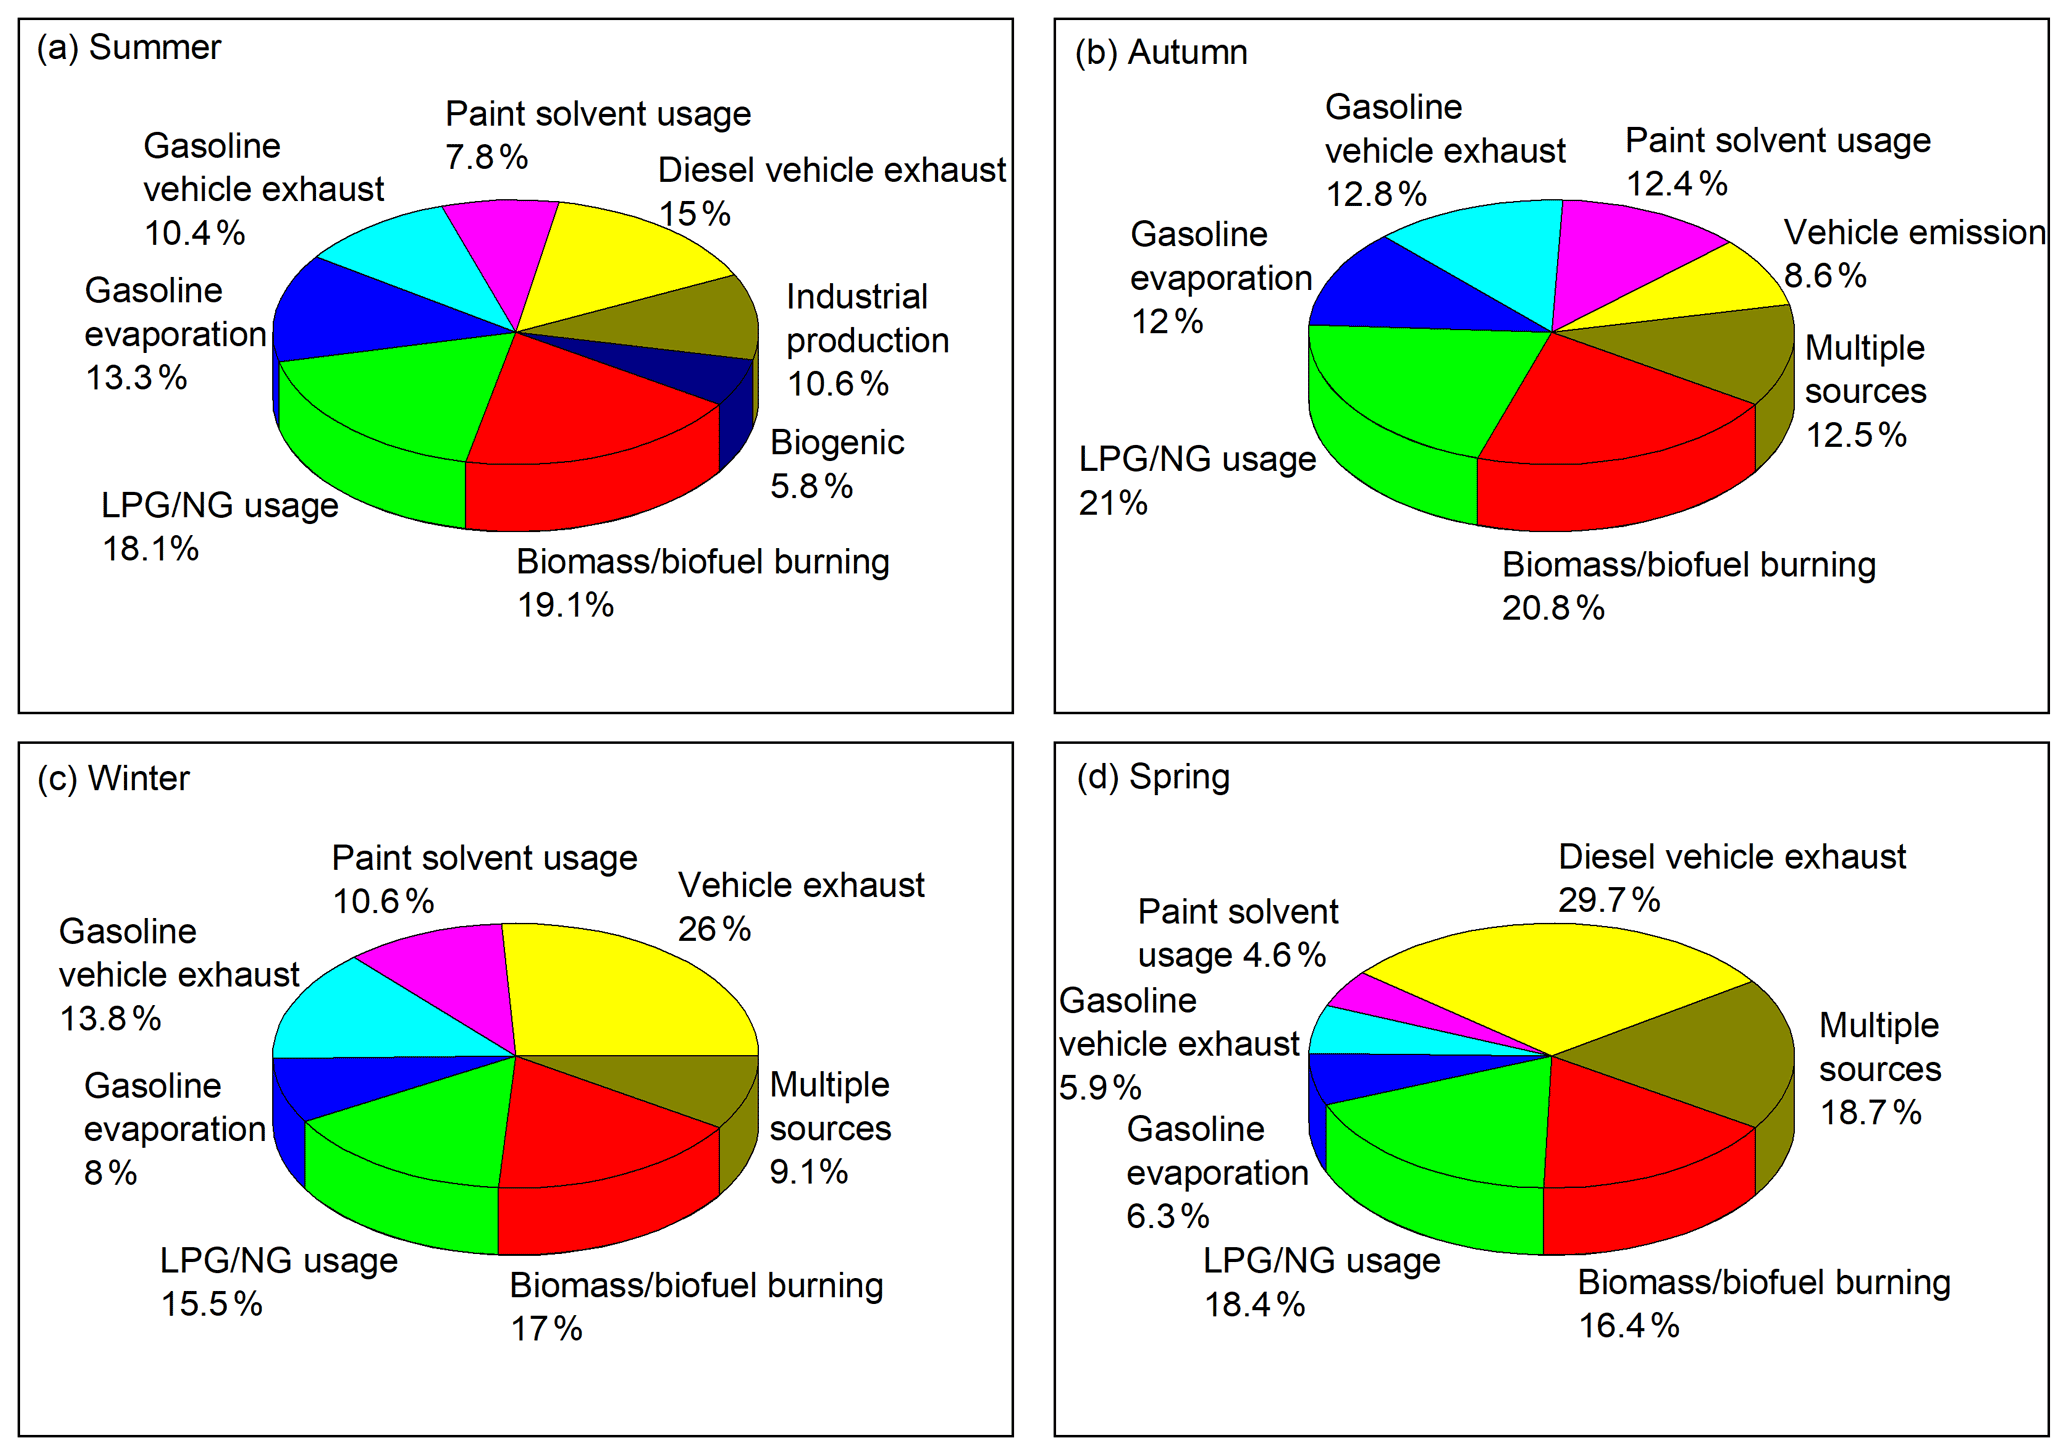
Figure 5Relative contributions of different sources to ambient VOCs in the Nanjing industrial area during different seasons.
3.2 Concentration and composition of VOCs
In total, 100 VOCs were observed in the Nanjing industrial area, including 27 alkanes, 11 alkenes, 1 alkyne, 17 aromatics, 31 halocarbons, 12 OVOCs, and 1 other (carbon disulfide; Table S2). Ethane (5.8 ± 2.5 ppbv), propane (4.2 ± 1.5 ppbv), and ethylene (3 ± 1.6 ppbv) were the most abundant VOCs in the study area during the observation period. However, we observed season-wise variations in the order of abundant VOC species (Table S2). For instance, acetone was the third-highest concentrated VOC in spring. The above-mentioned four VOC species are also frequently mentioned as being the most abundant VOCs in different regions in China (Deng et al., 2019; He et al., 2019; Li et al., 2018; Ma et al., 2019). We compared the individual VOC concentrations with the available data presented in recent investigations. The individual VOC concentrations in the current observation were similar to those reported in the previous investigation in the same study area (An et al., 2017). However, they were almost twice those found in a nonindustrial suburban area in Nanjing (Wu et al., 2020; Table S2). Some of the differences may be due to the differences in the observation period. The reported yearly concentrations (Wu et al., 2020) were probably estimated over continuous measurement data for a year. However, in the current observation, the measurements were not continuously performed during all the days of a year. Individual VOC concentrations in autumn were about 1.4 times lower than those measured in Beijing in October and November (Li et al., 2015). The wintertime individual VOC concentrations were also about 1.4 times lower than those measured in Shanghai during November–January (Y. Zhang et al., 2018). But, the yearly individual VOC concentrations in the current observation were similar to those measured in Guangzhou from June to May (Zou et al., 2015). During the observation period, the concentrations of different VOC groups were of the order of alkanes (21 ± 7 ppbv; 35 %) > halocarbons (14.3 ± 7.3 ppbv; 24 %) > aromatics (9.9 ± 5.8 ppbv; 17 %) > OVOCs (7.5 ± 1.9 ppbv; 13 %) > alkenes (5 ± 1.9 ppbv; 8 %) > alkynes (1.4 ± 0.3 ppbv; 2 %) > others (0.5 ± 0.2 ppbv; 1 %). Relatively high proportions of halocarbons and aromatics were observed in autumn (25.7 % and 19.3 %, respectively) and winter (25.8 % and 17.6 %, respectively) compared to those measured in summer (20.4 % and 11.8 %, respectively) and spring (20.3 % and 13.6 %, respectively; Fig. 2f). It could be related to the burning of biomass and fossil fuel for additional heating. Similar to the observation in the current study, the alkane family is generally the most abundant VOC group in China (Mozaffar and Zhang, 2020). The relatively high contribution of halocarbons to the TVOCs could be related to the industrial emissions in the study area. However, halocarbons and OVOCs were neither measured in previous investigations in the same study area (An et al., 2014, 2017; Shao et al., 2016) nor in another suburban area in Nanjing (Wu et al., 2020). Either the aromatics or alkenes group was mentioned as being the second most abundant VOC group in those studies in Nanjing, which is the third and fifth most abundant VOC group in the current investigation. The TVOC concentration estimated with all the measured VOCs was 59.8 ± 28.6 ppbv over the whole observation period, and relatively higher TVOC concentrations were measured in autumn (83 ± 20 ppbv) and winter (77.5 ± 16.8 ppbv), compared to those observed in spring (39.6 ± 13.1 ppbv) and summer (38.8 ± 10.2 ppbv). The TVOC concentrations without halocarbons were 45.4 ± 20.4, 61.7 ± 14.6, 57.4 ± 11.8, 31.6 ± 10.9, and 30.9 ± 8.2 ppbv during the whole observation period, autumn, winter, spring, and summer, respectively. As mentioned before, halocarbons and OVOCs were not reported in the previous investigations in Nanjing (An et al., 2017; Wu et al., 2020). The current TVOC concentration without halocarbons and OVOCs was similar to the previous investigation in the same study area; however, it was twofold higher than the one reported in the nonindustrial suburban area in Nanjing. The diurnal variation in the TVOC, alkenes, aromatics, halocarbons, OVOC, and alkanes concentrations showed a double-hump structure (Fig. 2a, b, d, e). This double-hump pattern indicates the contribution of traffic emissions during the rush hours in the morning and evening. The lowest concentration of the TVOCs and different VOC groups was reached between 12:00 and 16:00 LT (local time). Conversely, the highest concentration of O3 was reached in that period (Fig. 3). The lowest O3 concentrations were observed in winter, which was consistent with the solar radiation.

Figure 6Contribution to OH loss rates of different VOC groups and the top 10 VOC species in different seasons.
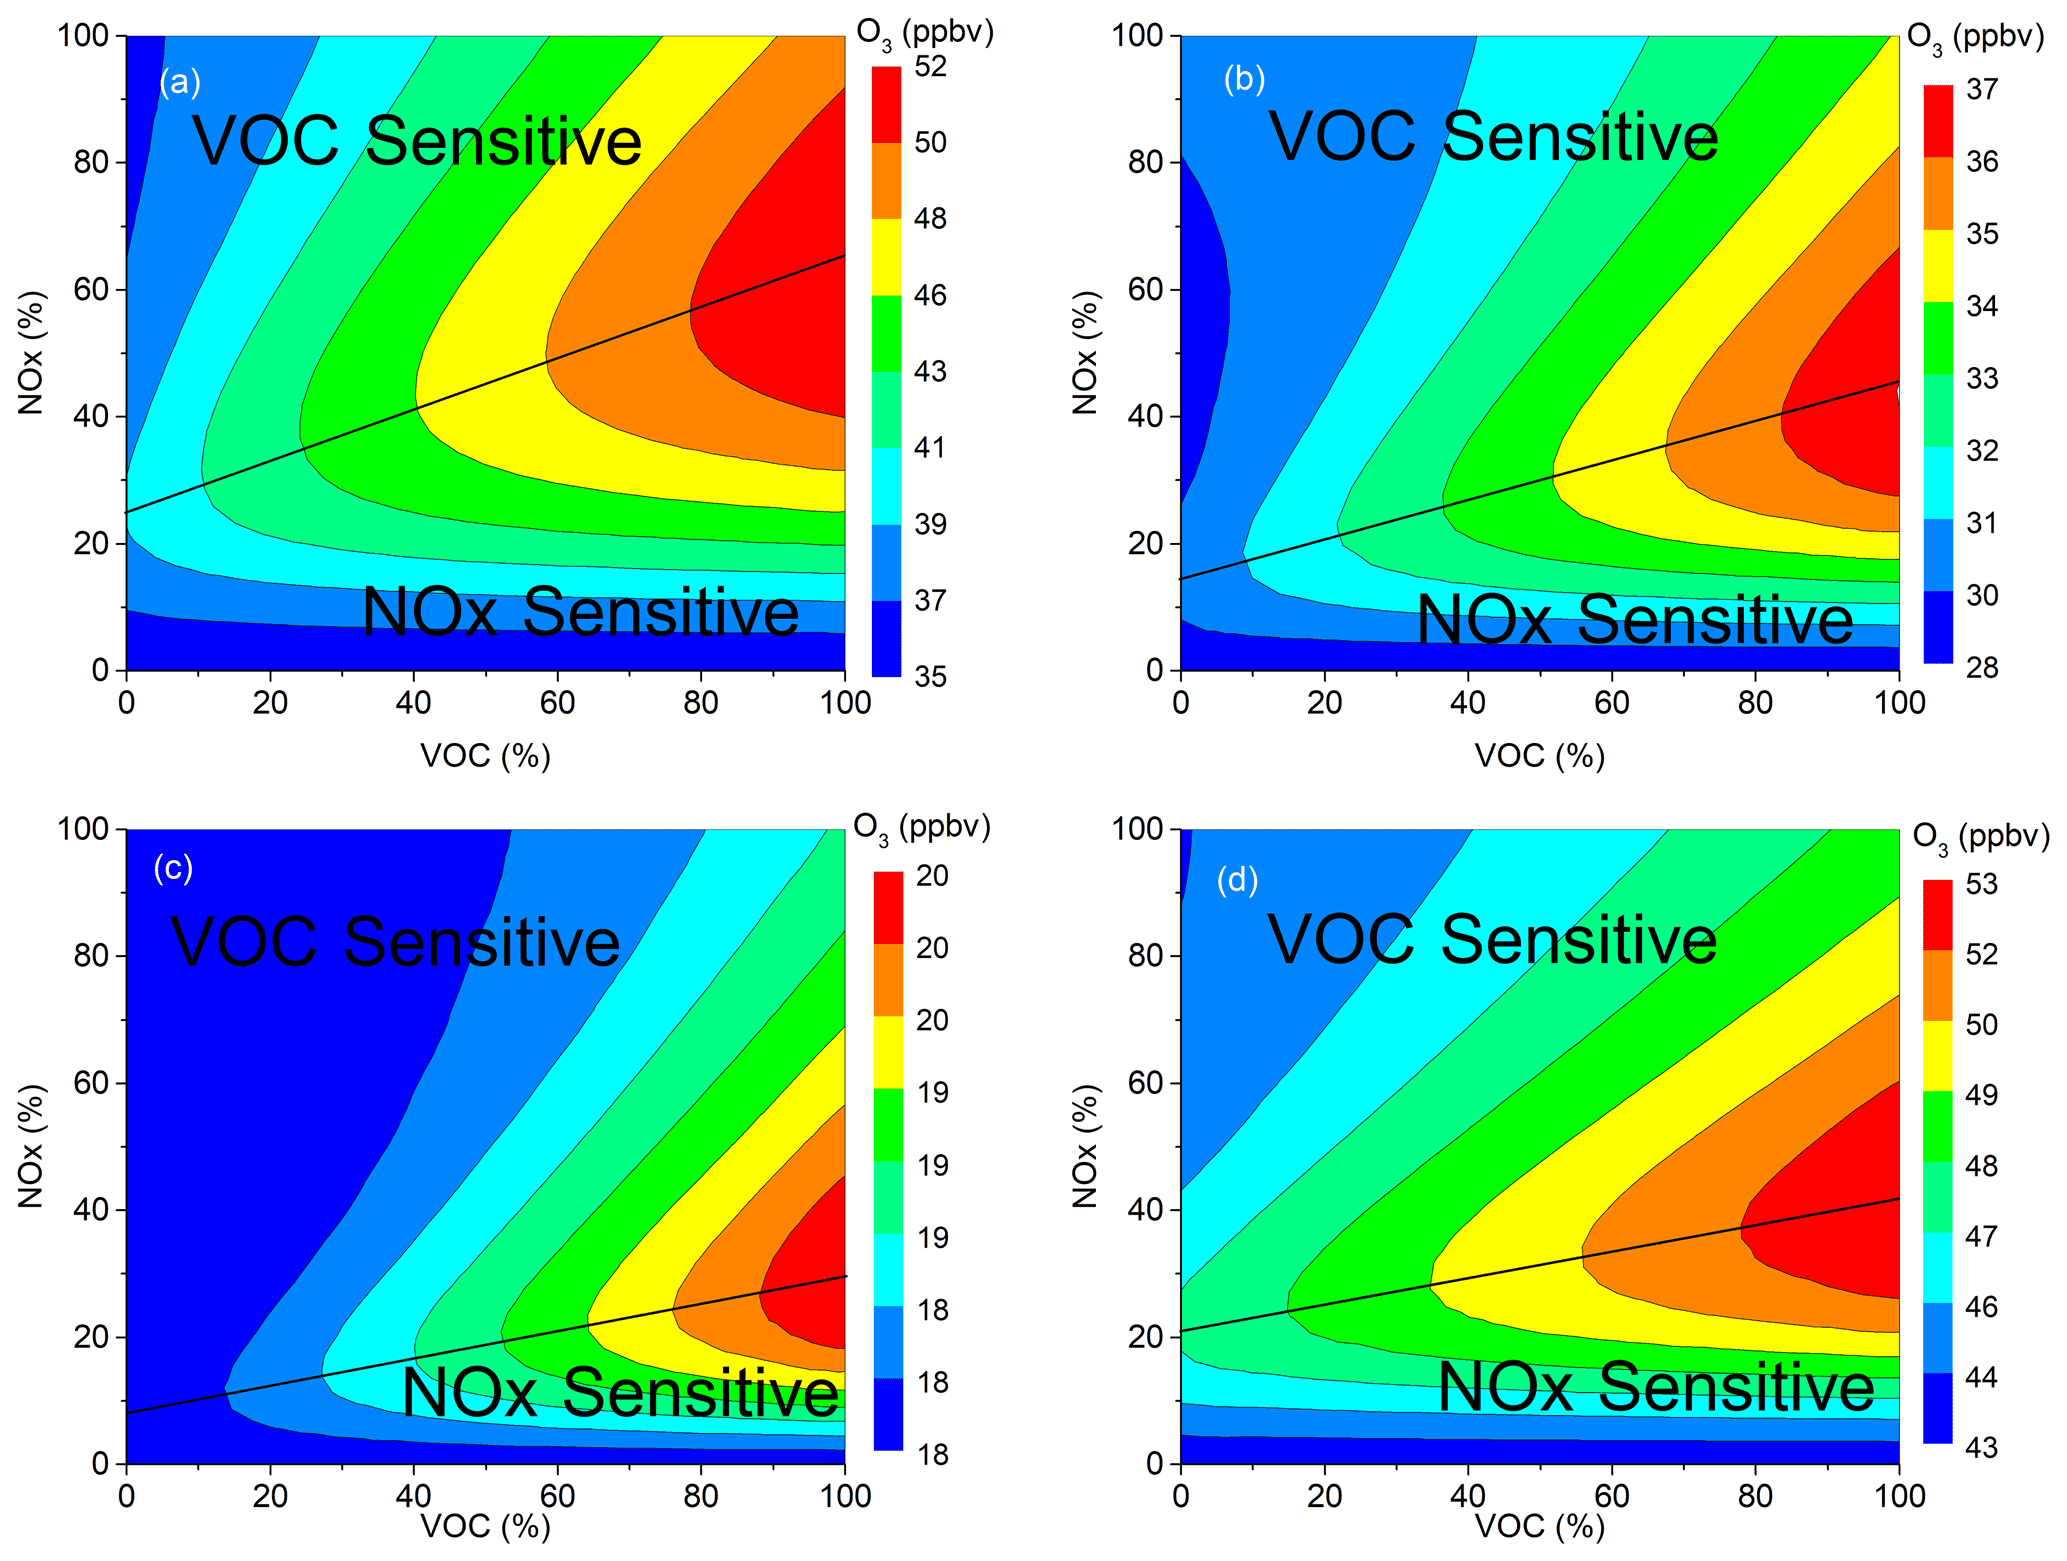
Figure 7An O3 isopleth diagram for (a) summer (b) autumn, (c) winter, and (d) spring, based on percentage changes in VOCs and NOx concentrations in Nanjing and the corresponding modelled O3 production.
3.3 Sources of VOCs
3.3.1 Potential source contribution function (PSCF)
Besides the local sources, both the long-distance and short-distance transport of air mass could bring VOCs to the study area. Figure 4 shows the wind cluster and PSCF analysis results for different seasons. During summer, the major air masses were short-distance transport from the southern (44 %) direction and two long-distance types of transport from the southeastern (31 % and 25 %) direction. High PSCF values were in the nearby southern and southeastern directions; therefore, VOC pollution in the study area was mainly affected by short-distance transport from the southern and eastern directions. During autumn, the dominant air masses were short-distance transport from the northwestern direction (35 %) and long-distance transport from the northern (34 %) direction. However, according to the PSCF analysis, VOC pollution was mainly influenced by the short-distance transport from the southern direction. During winter, short-distance transport from the northwestern (52 %) direction was the major incoming air masses to the study area. According to the PSCF values, the short-distance air masses from the south and north mainly transported VOC to the receptor site. During the spring, air masses were primarily transported from the north (50 %) and the southwest (32 %). A minor long-distance air mass was transported from the northwestern (18 %) direction. Atmospheric VOCs were mainly transported by these air masses to the study site, mostly from the nearby areas. Overall, the high PSCF values were concentrated around the measurement site. Therefore, short-distance transport from the surrounding areas and cities was the main reason for the high VOC concentration. The above conclusion makes perfect sense as the sampling site is surrounded by different chemical and petrochemical industries, steel plants, gas stations, high traffic roads, and residential areas.
3.3.2 PMF model analysis
According to the PMF model analysis, five VOC sources were common during all the measurement seasons. They were biomass/biofuel burning, liquefied petroleum gas/natural gas (LPG/NG) usage, gasoline evaporation, gasoline vehicle exhaust, and paint solvent usage (Sect. S1). The biogenic source was distinguished only in the summer. Figure 5 shows the relative contributions of different sources to ambient VOCs during different seasons. Overall, vehicle-related sources contributed the most to the ambient VOC concentrations. The total contributions of vehicle-related emissions were about 39 %, 33 %, 48 %, and 42 % in summer, autumn, winter, and spring, respectively. The contributions of biomass/biofuel burning sources were about 19 %, 21 %, 17 %, and 16.4 % in summer, autumn, winter, and spring, respectively. Besides these two sources, LPG/NG usage (18 %, 21 %, 16 %, and 18 %, respectively) and paint solvent usage (8 %, 12 %, 11 %, 5 %, respectively) were two other important VOC sources during those four seasons.
3.4 Chemical reactivity (LOH)
The estimated loss rates of OH radical (LOH) with VOCs were about twofold higher in autumn (13.7 s−1) and winter (13.5 s−1) compared to those in summer (7 s−1) and spring (7.5 s−1) (Fig. 6a). The relatively high LOH values in autumn and winter were due to the relatively high VOC concentrations in these seasons (Fig. 2). The average LOH value was 10.4 ± 3.6 s−1 over the four seasons. It was in a similar range to the values determined in Guangzhou (10.9 s−1), Chongqing (10 s−1), Xian (1.6–16.2 s−1), and Tokyo (7.7–13.4 s−1) but higher than the values estimated in Shanghai (2.9–5, 6.2 s−1) and Beijing (7 s−1; Tan et al., 2019; Zhu et al., 2019; Yoshino et al., 2012; Song et al., 2020). While alkene was the highest contributor to the LOH in summer (3 s−1; 43 %) and spring (2.6 s−1; 35 %), aromatics were the maximum contributor in autumn (6.9 s−1; 50 %) and winter (5.9 s−1; 44 %; Fig. 6d). An increase in the OH loss rate by OVOCs was observed in spring (17 %) compared to the other seasons (10 %, 8 %, and 9 % in summer, autumn, and winter, respectively). Over the four seasons, the contribution of VOC groups to LOH exhibited the following trend: aromatics > alkenes > alkanes > OVOCs > halocarbons. Similar to the current study, the aromatic group is also mentioned as being the maximum contributor to LOH in different regions in China. However, the alkene group is generally reported as being the top contributor to LOH (Zhang et al., 2020; Zhao et al., 2020; Hui et al., 2018; Song et al., 2020). Figure 6 also shows the top 10 VOCs contributing to LOH for the different seasons. Whereas isoprene was the highest contributor to LOH in summer, it was styrene in autumn and winter. On the other hand, naphthalene was the main contributor to LOH in the spring. Overall, styrene, naphthalene, ethylene, and isoprene were the main contributors to LOH. In previous studies in China, these compounds are also mentioned as being one of the highest contributors to LOH (Zhao et al., 2020; Hui et al., 2018; Song et al., 2020).
3.5 Sensitivity analysis of O3 formation
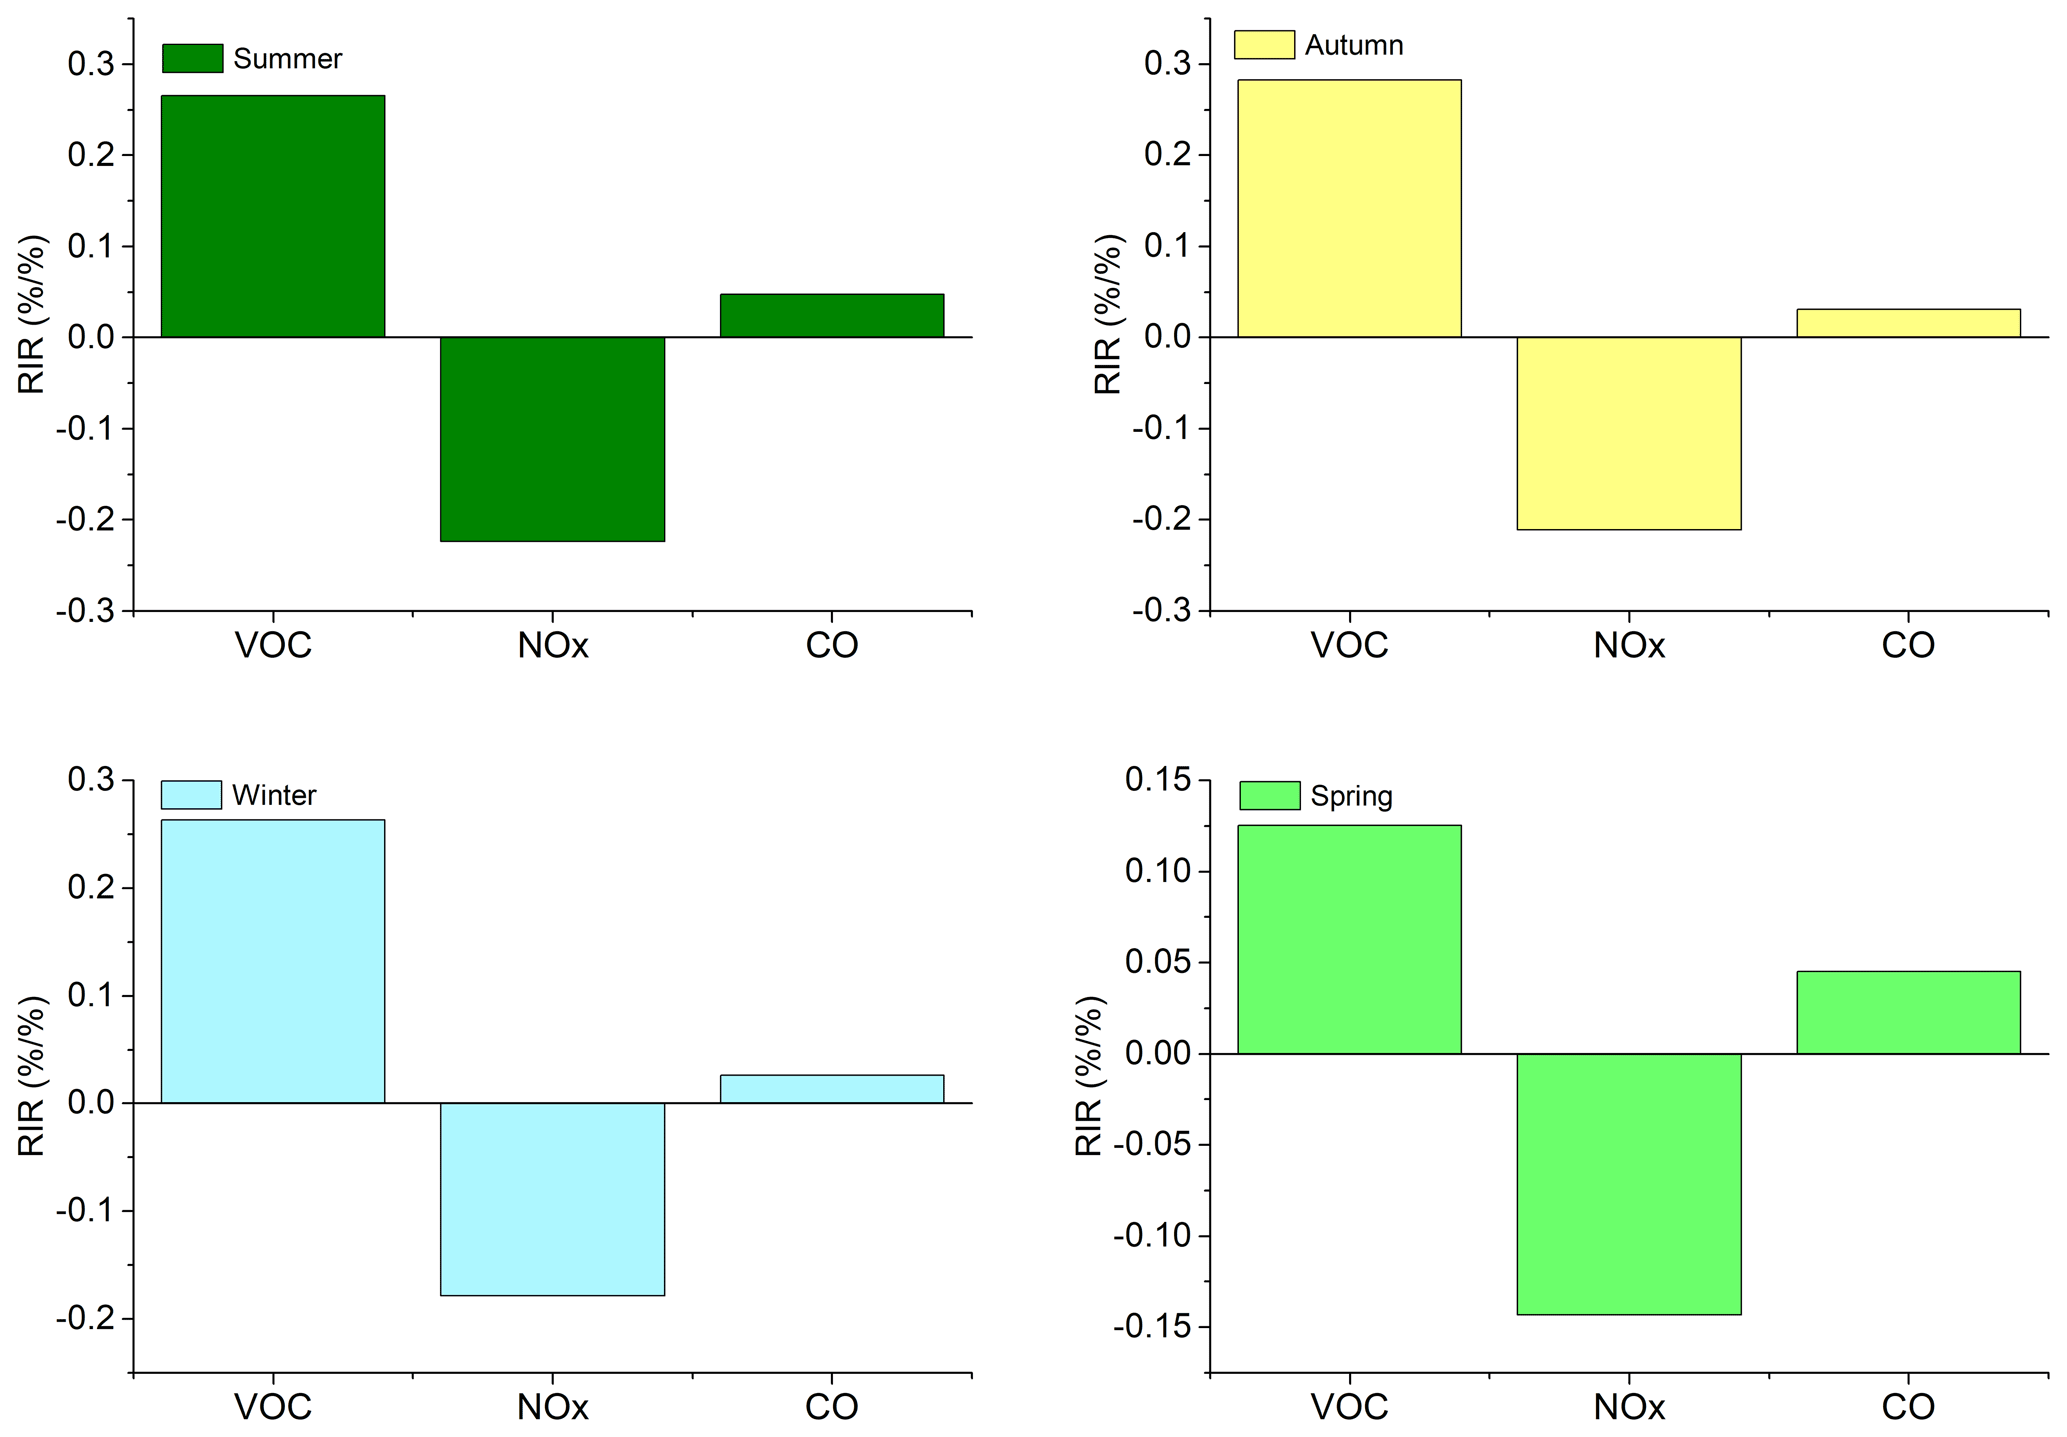
Figure 7 shows the EKMA isopleth diagrams of O3 for different seasons. In all the diagrams, VOC and NOx = 100 % is the base case. The ridgeline divided the diagrams into two regimes, with the VOC-sensitive regime above the line and NOx-sensitive regime below the line. For all the seasons, the study area fell above the ridgeline. Moreover, O3 production decreased with the decrease in VOC concentration. Therefore, the study area was in the VOC-sensitive regime for O3 formation during all the seasons. As a case study, O3 formation sensitivity to its precursors was tested on a high O3 concentration day (29 July 2018; maximum 126 ppbv). During the high O3 episode, the study area was also in the VOC-sensitive regime for O3 formation (Fig. S5). We also employed the RIR analysis to evaluate the O3 production sensitivity to VOC, NOx, and CO concentrations (Fig. 8). The RIR value of VOC was the highest during all the seasons. It indicates that the O3 production was more sensitive to the reduction in the VOC concentration. This finding is consistent with the EKMA isopleth diagrams (Fig. 7). Except for the spring, the RIR values of CO were very small relative to those for the VOC. It indicates that the CO concentrations were relatively less important for the O3 formation during those seasons. The RIR values for NOx were negative during all the seasons, implying that the O3 formation was in the NOx-titration regime in the study area. From the above analysis, it is evident that a reduction in the VOC concentration in the study area will be the most efficient way to reduce the O3 formation. The previous two studies performed in Nanjing also concluded with the same finding based on VOC NOx ratios and RIR analysis (An et al., 2015; Xu et al., 2017). Our findings are also consistent with the previous studies performed in other regions of China (Tan et al., 2018b; He et al., 2019; Feng et al., 2019; Ma et al., 2019). However, the NOx-sensitive regions for O3 formation are also found in China (Tan et al., 2018a; Jia et al., 2016).
Nanjing is one of the biggest industrial cities in China. We performed a long-term investigation of ambient VOCs in Nanjing. Compared to the previous investigation in the current study area, similar TVOC concentrations were observed. However, about twofold higher TVOC concentrations were observed compared to the one previously reported in a nonindustrial suburban area in Nanjing. TVOC concentrations were about twice as high in autumn and winter compared to those observed in summer and spring. Generally, haze pollution occurs most frequently in autumn and winter. Therefore, VOC concentration reduction in these seasons is an important step to reduce haze pollution in the study area. The halocarbon group was the second-largest contributor to the TVOCs following alkanes, indicating the impact of industrial emissions on the local air. As halocarbons are carcinogenic, their emissions need to be reduced. The short-distance air mass from the surrounding areas and cities was the main reason for the high VOC concentration. Hence, local emissions need to be reduced. Vehicle-related emissions were the major VOC source in the study area; thus, emission reduction from this source should have a higher priority. Aromatics and alkenes were the major contributors to the LOH. Therefore, these two VOC groups should have a higher priority in emission reduction policies and strategies. During all the seasons, the study area was in the VOC-sensitive regime for O3 formation. Therefore, VOC emission reduction is the most effective way to decrease the local O3 formation.
All the data presented in this article can be accessed through https://osf.io/bm6cs/ (last access: 17 December 2020; Mozaffar, 2021).
The supplement related to this article is available online at: https://doi.org/10.5194/acp-21-18087-2021-supplement.
YLZ designed and supervised the project. MYF, FX, YCL, FC, and AM conducted the measurements. AM analysed the data and prepared the paper. All authors contributed to the discussions in order to improve the article.
The authors declare that they have no conflict of interest.
The authors are thankful for the funding support from the National Nature Science Foundation of China (grant no. 41977305), the Provincial Natural Science Foundation of Jiangsu (grant no. BK20180040), and the Jiangsu Innovation and Entrepreneurship Team. We are also grateful to Zijin Zhang and Meng-Yao Cao, for their help with the sampling.
Publisher’s note: Copernicus Publications remains neutral with regard to jurisdictional claims in published maps and institutional affiliations.
This research has been supported by the National Nature Science Foundation of China (grant no. 41977305), the Provincial Natural Science Foundation of Jiangsu (grant no. BK20180040), and the Jiangsu Innovation and Entrepreneurship Team.
This paper was edited by Nga Lee Ng and reviewed by four anonymous referees.
An, J., Zhu, B., Wang, H., Li, Y., Lin, X., and Yang, H.: Characteristics and source apportionment of VOCs measured in an industrial area of Nanjing, Yangtze River Delta, China, Atmos. Environ., 97, 206–214, https://doi.org/10.1016/j.atmosenv.2014.08.021, 2014.
An, J., Zou, J., Wang, J., Lin, X., and Zhu, B.: Differences in ozone photochemical characteristics between the megacity Nanjing and its suburban surroundings, Yangtze River Delta, China, Environ. Sci. Pollut. Res., 22, 19607–19617, https://doi.org/10.1007/s11356-015-5177-0, 2015.
An, J., Wang, J., Zhang, Y., and Zhu, B.: Source Apportionment of Volatile Organic Compounds in an Urban Environment at the Yangtze River Delta, China, Archives of Environmental Contamination and Toxicology, 72, 335–348, https://doi.org/10.1007/s00244-017-0371-3, 2017.
Cardelino, C. A. and Chameides, W. L.: An observation-based model for analyzing ozone precursor relationships in the urban atmosphere, J. Air Waste Manage. Assoc., 45, 161–180, https://doi.org/10.1080/10473289.1995.10467356, 1995.
Carter, W. P. L.: Development of the SAPRC-07 chemical mechanism, Atmos. Environ., 44, 5324–5335, https://doi.org/10.1016/j.atmosenv.2010.01.026, 2010.
Chen, Y., Ge, X., Chen, H., Xie, X., Chen, Y., Wang, J., and Chen, M.: Seasonal light absorption properties of water-soluble brown carbon in atmospheric fine particles in Nanjing, China, Atmos. Environ., 187, 230–240, https://doi.org/10.1016/j.atmosenv.2018.06.002, 2018.
Deng, Y., Li, J., Li, Y., Wu, R., and Xie, S.: Characteristics of volatile organic compounds, NO2, and effects on ozone formation at a site with high ozone level in Chengdu, J. Environ. Sci., 75, 334–345, https://doi.org/10.1016/j.jes.2018.05.004, 2019.
Feng, R., Wang, Q., Huang, C. chen, Liang, J., Luo, K., Fan, J., and Zheng, H. J.: Ethylene, xylene, toluene and hexane are major contributors of atmospheric ozone in Hangzhou, China, prior to the 2022 Asian Games, Environ. Chem. Lett., 17, 1151–1160, https://doi.org/10.1007/s10311-018-00846-w, 2019.
Feng, T., Bei, N., Huang, R.-J., Cao, J., Zhang, Q., Zhou, W., Tie, X., Liu, S., Zhang, T., Su, X., Lei, W., Molina, L. T., and Li, G.: Summertime ozone formation in Xi'an and surrounding areas, China, Atmos. Chem. Phys., 16, 4323–4342, https://doi.org/10.5194/acp-16-4323-2016, 2016.
He, Z., Wang, X., Ling, Z., Zhao, J., Guo, H., Shao, M., and Wang, Z.: Contributions of different anthropogenic volatile organic compound sources to ozone formation at a receptor site in the Pearl River Delta region and its policy implications, Atmos. Chem. Phys., 19, 8801–8816, https://doi.org/10.5194/acp-19-8801-2019, 2019.
Hui, L., Liu, X., Tan, Q., Feng, M., An, J., Qu, Y., and Jiang, M.: Characteristics, source apportionment and contribution of VOCs to ozone formation in Wuhan, Central China, Atmos. Environ., 192, 55–71, https://doi.org/10.1016/j.atmosenv.2018.08.042, 2018.
Hui, L., Liu, X., Tan, Q., Feng, M., An, J., Qu, Y., and Cheng, N.: VOC characteristics, sources and contributions to SOA formation during haze events in Wuhan, Central China, Sci. Tot. Environ., 650, 2624–2639, https://doi.org/10.1016/j.scitotenv.2018.10.029, 2019.
Hung-Lung, C., Jiun-Horng, T., Shih-Yu, C., Kuo-Hsiung, L., and Sen-Yi, M.: VOC concentration profiles in an ozone non-attainment area: A case study in an urban and industrial complex metroplex in southern Taiwan, Atmos. Environ., 41, 1848–1860, https://doi.org/https://doi.org/10.1016/j.atmosenv.2006.10.055, 2007.
Jenkin, M. E., Young, J. C., and Rickard, A. R.: The MCM v3.3.1 degradation scheme for isoprene, Atmos. Chem. Phys., 15, 11433–11459, https://doi.org/10.5194/acp-15-11433-2015, 2015.
Jenkin, M. E., Saunders, S. M., and Pilling, M. J. : The tropospheric degradation of volatile organic compounds: A protocol for mechanism development, Atmos. Environ., 31, 81–104, https://doi.org/10.1016/S1352-2310(96)00105-7, 1997.
Jia, C., Mao, X., Huang, T., Liang, X., Wang, Y., Shen, Y., and Gao, H.: Non-methane hydrocarbons (NMHCs) and their contribution to ozone formation potential in a petrochemical industrialized city, Northwest China, Atmos. Res., 169, 225–236. https://doi.org/10.1016/j.atmosres.2015.10.006, 2016.
Li, J., Xie, S. D., Zeng, L. M., Li, L. Y., Li, Y. Q., and Wu, R. R.: Characterization of ambient volatile organic compounds and their sources in Beijing, before, during, and after Asia-Pacific Economic Cooperation China 2014, Atmos. Chem. Phys., 15, 7945–7959, https://doi.org/10.5194/acp-15-7945-2015, 2015.
Li, J., Zhai, C., Yu, J., Liu, R., Li, Y., Zeng, L., and Xie, S.: Spatiotemporal variations of ambient volatile organic compounds and their sources in Chongqing, a mountainous megacity in China, Sci. Tot. Environ., 627, 1442–145, https://doi.org/10.1016/j.scitotenv.2018.02.010, 2018.
Ma, Z., Liu, C., Zhang, C., Liu, P., Ye, C., Xue, C., and Mu, Y.: The levels , sources and reactivity of volatile organic compounds in a typical urban area of Northeast China, J. Environ. Sci., 79, 121–134, https://doi.org/10.1016/j.jes.2018.11.015, 2019.
Meng, H. A. N., Xueqiang, L. U., Chunsheng, Z., Liang, R. A. N., and Suqin, H. A. N.: Characterization and Source Apportionment of Volatile Organic Compounds in Urban and Suburban Tianjin, China, Adv. Atmos. Sci., 32, 439–444, https://doi.org/10.1007/s00376-014-4077-4.1, 2015.
Mo, Z., Shao, M., Lu, S., Niu, H., Zhou, M., and Sun, J.: Characterization of non-methane hydrocarbons and their sources in an industrialized coastal city , Yangtze River Delta, China, Sci. Tot. Environ., 593, 641–653, https://doi.org/10.1016/j.scitotenv.2017.03.123, 2017.
Mozaffar, A. and Zhang, Y. L.: Atmospheric Volatile Organic Compounds (VOCs) in China: a Review, Current Pollution Reports, 6, 250–263, https://doi.org/10.1007/s40726-020-00149-1, 2020.
Mozaffar, A., Zhang, Y. L., Fan, M., Cao, F., and Lin, Y. C.: Characteristics of summertime ambient VOCs and their contributions to O3 and SOA formation in a suburban area of Nanjing, China, Atmos. Res., 240, 104923, https://doi.org/10.1016/j.atmosres.2020.104923, 2020.
Mozaffar, A.: VOC in Nanjing, available at: https://osf.io/bm6cs/, [data set], last access: 17 December 2020, 2021.
Na, K., Kim, Y. P., Moon, K.-C., Moon, I., and Fung, K.: Concentrations of volatile organic compounds in an industrial area of Korea, Atmos. Environ., 35, 2747–2756, https://doi.org/https://doi.org/10.1016/S1352-2310(00)00313-7, 2001.
Petit, J. E., Favez, O., Albinet, A., and Canonaco, F.: A user-friendly tool for comprehensive evaluation of the geographical origins of atmospheric pollution: Wind and trajectory analyses, Environ. Modell. Softw., 88, 183–187, https://doi.org/10.1016/j.envsoft.2016.11.022, 2017.
Saunders, S. M., Jenkin, M. E., Derwent, R. G., and Pilling, M. J.: Protocol for the development of the Master Chemical Mechanism, MCM v3 (Part A): tropospheric degradation of non-aromatic volatile organic compounds, Atmos. Chem. Phys., 3, 161–180, https://doi.org/10.5194/acp-3-161-2003, 2003.
Shao, P., An, J., Xin, J., Wu, F., Wang, J., Ji, D., and Wang, Y.: Source apportionment of VOCs and the contribution to photochemical ozone formation during summer in the typical industrial area in the Yangtze River Delta, China, Atmos. Res., 176, 64–74, https://doi.org/10.1016/j.atmosres.2016.02.015, 2016.
Shi, J., Deng, H., Bai, Z., Kong, S., Wang, X., Hao, J., and Ning, P.: Emission and profile characteristic of volatile organic compounds emitted from coke production, iron smelt, heating station and power plant in Liaoning Province, China, Sci. Tot. Environ., 515, 101–108, https://doi.org/10.1016/j.scitotenv.2015.02.034, 2015.
Song, M., Li, X., Yang, S., Yu, X., Zhou, S., Yang, Y., Chen, S., Dong, H., Liao, K., Chen, Q., Lu, K., Zhang, N., Cao, J., Zeng, L., and Zhang, Y.: Spatiotemporal variation, sources, and secondary transformation potential of volatile organic compounds in Xi'an, China, Atmos. Chem. Phys., 21, 4939–4958, https://doi.org/10.5194/acp-21-4939-2021, 2021.
Song, M., Tan, Q., Feng, M., Qu, Y., and Liu, X.: Source Apportionment and Secondary Transformation of Atmospheric Nonmethane Hydrocarbons in Chengdu , Southwest China, J. Geophys. Res.-Atmos., 123, 9741–9763, https://doi.org/10.1029/2018JD028479, 2018.
Sun, J., Shen, Z., Zhang, Y., Zhang, Z., Zhang, Q., Zhang, T., and Li, X.: Urban VOC profiles, possible sources, and its role in ozone formation for a summer campaign over Xi'an, China, Environ. Sci. Pollut. Res., 26, 27769–27782, https://doi.org/10.1007/s11356-019-05950-0, 2019.
Tan, Z., Lu, K., Dong, H., Hu, M., Li, X., Liu, Y., and Zhang, Y.: Explicit diagnosis of the local ozone production rate and the ozone-NOx-VOC sensitivities, Sci. Bull., 63, 1067–1076, https://doi.org/10.1016/j.scib.2018.07.001, 2018a.
Tan, Z., Lu, K., Jiang, M., Su, R., Dong, H., Zeng, L., and Zhang, Y.: Exploring ozone pollution in Chengdu, southwestern China: A case study from radical chemistry to O3-VOC-NOx sensitivity, Sci. Tot. Environ., 636, 775–786, https://doi.org/10.1016/J.SCITOTENV.2018.04.286, 2018b.
Tan, Z., Lu, K., Jiang, M., Su, R., Wang, H., Lou, S., Fu, Q., Zhai, C., Tan, Q., Yue, D., Chen, D., Wang, Z., Xie, S., Zeng, L., and Zhang, Y.: Daytime atmospheric oxidation capacity in four Chinese megacities during the photochemically polluted season: a case study based on box model simulation, Atmos. Chem. Phys., 19, 3493–3513, https://doi.org/10.5194/acp-19-3493-2019, 2019.
Tiwari, V., Hanai, Y., and Masunaga, S.: Ambient levels of volatile organic compounds in the vicinity of petrochemical industrial area of Yokohama, Japan, Air Quality, Atmos. Health, 3, 65–75, https://doi.org/10.1007/s11869-009-0052-0, 2010.
Vermeuel, M. P., Novak, G. A., Alwe, H. D., Hughes, D. D., Kaleel, R., Dickens, A. F., and Bertram, T. H.: Sensitivity of Ozone Production to NOx and VOC Along the Lake Michigan Coastline, J. Geophys. Res.-Atmos., 124, 10989–11006, https://doi.org/10.1029/2019JD030842, 2019.
Wolfe, G. M., Marvin, M. R., Roberts, S. J., Travis, K. R., and Liao, J.: The Framework for 0-D Atmospheric Modeling (F0AM) v3.1, Geosci. Model Dev., 9, 3309–3319, https://doi.org/10.5194/gmd-9-3309-2016, 2016.
Wu, R., Zhao, Y., Zhang, J., and Zhang, L.: Variability and sources of ambient volatile organic compounds based on online measurements in a suburban region of nanjing, eastern China, Aerosol Air Qual. Res., 20, 606–619, https://doi.org/10.4209/aaqr.2019.10.0517, 2020.
Xu, Z., Huang, X., Nie, W., Chi, X., and Xu, Z.: Influence of synoptic condition and holiday effects on VOCs and ozone production in the Yangtze River Delta region, China, Atmos. Environ., 168, 112–124, https://doi.org/10.1016/j.atmosenv.2017.08.035, 2017.
Yan, Y., Yang, C., Peng, L., Li, R., and Bai, H.: Emission characteristics of volatile organic compounds from coal-, coal gangue-, and biomass-fired power plants in China, Atmos. Environ., 143, 261–269, https://doi.org/10.1016/j.atmosenv.2016.08.052, 2016.
Yoshino, A., Nakashima, Y., Miyazaki, K., Kato, S., Suthawaree, J., Shimo, N., and Kajii, Y.: Air quality diagnosis from comprehensive observations of total OH reactivity and reactive trace species in urban central Tokyo, Atmos. Environ., 49, 51–59, https://doi.org/10.1016/j.atmosenv.2011.12.029, 2012.
Zhang, F., Shang, X., Chen, H., Xie, G., Fu, Y., Wu, D., and Chen, J.: Significant impact of coal combustion on VOCs emissions in winter in a North China rural site, Sci. Tot. Environ., 720, 137617, https://doi.org/10.1016/j.scitotenv.2020.137617, 2020.
Zhang, H., Li, H., Zhang, Q., Zhang, Y., Zhang, W., Wang, X., and Xia, F.: Atmospheric volatile organic compounds in a typical urban area of beijing: Pollution characterization, health risk assessment and source apportionment, Atmosphere, 8, 61, https://doi.org/10.3390/atmos8030061, 2017.
Zhang, Y., Li, R., Fu, H., Zhou, D., and Chen, J.: Observation and analysis of atmospheric volatile organic compounds in a typical petrochemical area in Yangtze River, J. Environ. Sci., 71, 233–248, https://doi.org/10.1016/j.jes.2018.05.027, 2018.
Zhang, Z., Yan, X., Gao, F., Thai, P., Wang, H., Chen, D., and Wang, B.: Emission and health risk assessment of volatile organic compounds in various processes of a petroleum refinery in the Pearl River Delta, Environ. Pollut., 238, 452–461, https://doi.org/10.1016/j.envpol.2018.03.054, 2018.
Zhao, R., Dou, X., Zhang, N., Zhao, X., Yang, W., Han, B., and Bai, Z.: The characteristics of inorganic gases and volatile organic compounds at a remote site in the Tibetan Plateau, Atmos. Res., 234, 104740, https://doi.org/10.1016/j.atmosres.2019.104740, 2020.
Zhu, J., Wang, S., Wang, H., Jing, S., Lou, S., Saiz-Lopez, A., and Zhou, B.: Observationally constrained modeling of atmospheric oxidation capacity and photochemical reactivity in Shanghai, China, Atmos. Chem. Phys., 20, 1217–1232, https://doi.org/10.5194/acp-20-1217-2020, 2020.
Zou, Y., Deng, X. J., Zhu, D., Gong, D. C., Wang, H., Li, F., Tan, H. B., Deng, T., Mai, B. R., Liu, X. T., and Wang, B. G.: Characteristics of 1 year of observational data of VOCs, NOx and O3 at a suburban site in Guangzhou, China, Atmos. Chem. Phys., 15, 6625–6636, https://doi.org/10.5194/acp-15-6625-2015, 2015.