the Creative Commons Attribution 4.0 License.
the Creative Commons Attribution 4.0 License.
 | 06 Dec 2021
Traces of urban forest in temperature and CO2 signals in monsoon East Asia
Keunmin Lee
Je-Woo Hong
Jeongwon Kim
Sungsoo Jo
Cities represent a key space for a sustainable society in a changing environment, and our society is steadily embracing urban green space for its role in mitigating heat waves and anthropogenic CO2 emissions. This study reports 2 years of surface fluxes of energy and CO2 in an artificially constructed urban forest measured by the eddy covariance method to examine the impact of urban forests on air temperature and net CO2 exchange. The urban forest site shows typical seasonal patterns of forest canopies with the seasonal march of the East Asian summer monsoon. This study shows that the urban forest reduces both the warming trend and urban heat island intensity compared to the adjacent high-rise urban areas and that photosynthetic carbon uptake is large despite relatively small tree density and leaf area index. During the significant drought period in the second year, gross primary production and evapotranspiration decreased, but their reduction was not as significant as those in natural forest canopies. We speculate that forest management practices, such as artificial irrigation and fertilization, enhance vegetation activity. Further analysis reveals that ecosystem respiration in urban forests is more pronounced than for typical natural forests in a similar climate zone. This can be attributed to the substantial amount of soil organic carbon due to intensive historical soil use and soil transplantation during forest construction, as well as relatively warmer temperatures in urban heat domes. Our findings suggest the need for caution in soil management when aiming to reduce CO2 emissions in urban areas.
- Article
(15867 KB) - Full-text XML
- BibTeX
- EndNote


Cities make up only 2 % of the Earth's land surface but hold more than 55 % of the world's population. It is expected that the urban population will reach 68 % by 2050 (UN, 2019). With the unprecedented rapid urbanization in the last century, human civilization heavily depends on urban structures and functions. Current concern is regarding the disastrous impacts of climatic events (e.g., heat waves, flooding, and drought) and environmental changes (e.g., air pollution and land degradation) on our socioeconomic system in a changing climate (McCarthy et al., 2010; Rahmstorf and Coumou, 2011). Accordingly, it remains an urgent issue to implement integrated policies for climate change mitigation and adaption toward sustainable cities against global warming and related natural disasters.
Urban green infrastructures, such as urban forests, have been recognized as a key solution toward alleviating climatic and environmental disasters (e.g., Chiesura, 2004; Haaland and van den Bosch, 2015; Oke et al., 2017; Kroeger et al., 2018). Green spaces in cities are exposed to wide ranges of environmental and climatic conditions across geographical locations. Especially when green spaces replace gray infrastructures during urban redevelopment, it remains unclear whether their benefits emerge in real conditions and thereby overcome their maintenance cost and other harmful effects (e.g., allergy and ozone increase). To leverage their full potential benefits, it is necessary to assess the biophysical effects of urban forests based on direct long-term monitoring in urban areas.
Urban forests are a key part of green infrastructures in a city, and two of their benefits, which have been addressed in previous studies, are thermal mitigation and carbon uptake (Roy et al., 2012; Oke et al., 2017). Firstly, urban forests mitigate direct sunlight and diminish the incoming radiant energy on the land surface, thereby reducing surface temperature. Additionally, urban forests supply water to the atmosphere through transpiration and retain water for longer than the impervious surfaces of urban structures. These processes contribute to reducing air temperature by partitioning more available energy to latent heat flux (QE) than sensible heat flux (QH), thus creating favorable conditions for mitigating heat waves and related health problems (e.g., Oke, 1982; Hong et al., 2019a). Eventually, this cooling effect reduces the electrical energy load by air conditioning as well as greenhouse gas emissions. Previous studies have reported cooling effects of urban forests at scales from street trees to parks (Oke, 1989; Bowler et al., 2010; Norton et al., 2015; Shashua-Bar and Hoffman, 2000). Such cooling effects depend not only on tree species and structures (Feyisa et al., 2014) but also on the size and vegetation density of urban green areas (Yu and Hien, 2006; Chang et al., 2007; Hamada and Ohta, 2010; Feyisa et al., 2014). However, despite the strong temperature-controlling factors of evapotranspiration (ET) and sensible heat fluxes over urban forest canopies, only a few studies have reported on surface energy balance (SEB) in urban forests in relation to thermal mitigation based on direct measurements (e.g., Oke, 1989; Spronken-Smith et al., 2000; Coutts et al., 2007a; Ballinas and Barradas, 2016; Hong and Hong, 2016). Moreover, it is noticeable that forest cooling intensity depends on geography and forests can even produce a warming trend as a result of their low albedo (Bonan, 2008; Wang et al., 2018). The lack of direct urban forest measurements hinders proper assessment of their influences on the climate and environment.
Furthermore, urban forests mitigate anthropogenic carbon emissions by photosynthetic CO2 uptake. Traditionally, carbon uptake by urban forests has been estimated by empirical relationships (e.g., biomass allometric equation) or short-term inventory of biomass data and vegetation growth rates, which have limitations of spatiotemporal coverage (Rowntree and Nowak, 1991; Nowak, 1993; Nowak et al., 2008; Weissert et al., 2014). Currently, the eddy covariance (EC) method is being applied in various ecosystems from grasslands and natural forests to urban areas because it provides continuous net CO2 flux measurements at the neighborhood scale every half hour (Christen, 2014). From this perspective, the EC method is useful for studying the net CO2 exchange (FC) from diurnal to interannual variations, with its simultaneous measurement of surface energy fluxes. Recently, direct FC measurements have been performed using the EC method in urban green spaces to examine turbulent exchanges of energy and carbon (Coutts et al., 2007a, b; Awal et al., 2010; Kordowski and Kuttler, 2010; Bergeron and Strachan, 2011; Crawford et al., 2011; Peters and McFadden, 2012; Velasco et al., 2013; Ward et al., 2013; Ueyama and Ando, 2016; Hong et al., 2019b). However, the EC method provides only the net effects of CO2 exchange from various carbon sources and sinks, which limits the physical interpretation and assessment of the benefits and costs of urban forests. It is challenging to partition FC into individual sources and sinks in urban areas because of the complex contributions from biogenic (e.g., vegetation photosynthesis, respiration of vegetation, soil, and humans) and extra anthropogenic (e.g., fossil fuel combustion by transportation or in households and commercial buildings) processes (Pataki et al., 2003).
With this background, the objectives of this study include (1) reporting temporal changes in air temperature after the artificial construction of an urban forest park in the Seoul Metropolitan Area with a hot and humid summer and cold and dry winter seasons and (2) quantifying the carbon uptake of urban forests based on partitioning of FC data measured by the eddy covariance method and meteorological data (Lee et al., 2021a). Here, we highlight the biotic and abiotic factors controlling the carbon cycle in urban forests and the impact of urban forests on the thermal environment after forest park construction.
2.1 Urban surface energy and CO2 balances
The SEB is expressed as
where Q∗ is the net all-wave radiation of the sum of outgoing and incoming short- and long-wave radiative fluxes, QF is the anthropogenic heat flux, QH is the turbulent sensible heat flux, QE is the latent heat flux, ΔQS is the net storage heat flux, and ΔQA is the net heat advection (definitions of variables in Appendix A).
The surface CO2 budget in an urban forest is formulated as follows:
where FC is the net CO2 exchange at the city–atmosphere interface, and ER and EB are the anthropogenic CO2 emissions from fossil fuel combustion by vehicles and heating in a building, respectively. GPP and RE are biotic contributions to FC; GPP is the gross primary production by photosynthetic CO2 uptake, and RE is the ecosystem respiration. Urban ecosystem respiration considers not only the autotrophic and heterotrophic respirations of vegetation and soil but also human respiration (Moriwaki and Kanda, 2004; Velasco and Roth, 2010; Ward et al., 2013, 2015; Hong et al., 2020). Human respiration by park visitors is negligible with 0.4 µmol m2 s−1 at most.
Additionally, NBE is the net biome CO2 exchange and is typically defined as the net ecosystem exchange (NEE) by RE − GPP for natural vegetation. Put differently, NBE refers to carbon losses in heterotrophic respiration minus the net primary production on natural vegetative surfaces; thus, negative NBE indicates the net carbon uptake by the natural ecosystem (Kirschbaum et al., 2001; Randerson et al., 2002). Unlike natural ecosystems, the FC between an urban forest and atmosphere is a complex mixture of biogenic (i.e., GPP and RE) and anthropogenic (i.e., ER and EB) processes across various spatial and temporal scales. In urban environments, anthropogenic emissions depend on the local characteristics (e.g., transport options, fuel types, heating demand, climate, population density, levels of industrial activity, and existing carbon intensity of electricity supply) of the city (Feigenwinter et al., 2012; Kennedy et al., 2014; Lietzke et al., 2015; Stagakis et al., 2019).
2.2 Site description
2.2.1 Seoul Forest Park
Micrometeorological measurements were taken at the Seoul Forest Park (SFP) in the Seoul Metropolitan Area, Korea (37.5446∘ N, 127.0379∘ E). SFP is the third largest park in Seoul with an area of 1.16 km2 (Fig. 1a). This area had been used as a horse racetrack and a golf course inside the track since 1950 and was surrounded by cement factories to the west (Fig. 1b). The local government initially planned this area as a commercial district with a high-rise multi-purpose building complex but changed its plan to redevelop the area as a green space in the late 1990s. The construction of the SFP began in December 2003, and it was opened to the public in June 2005 (Fig. 1c).
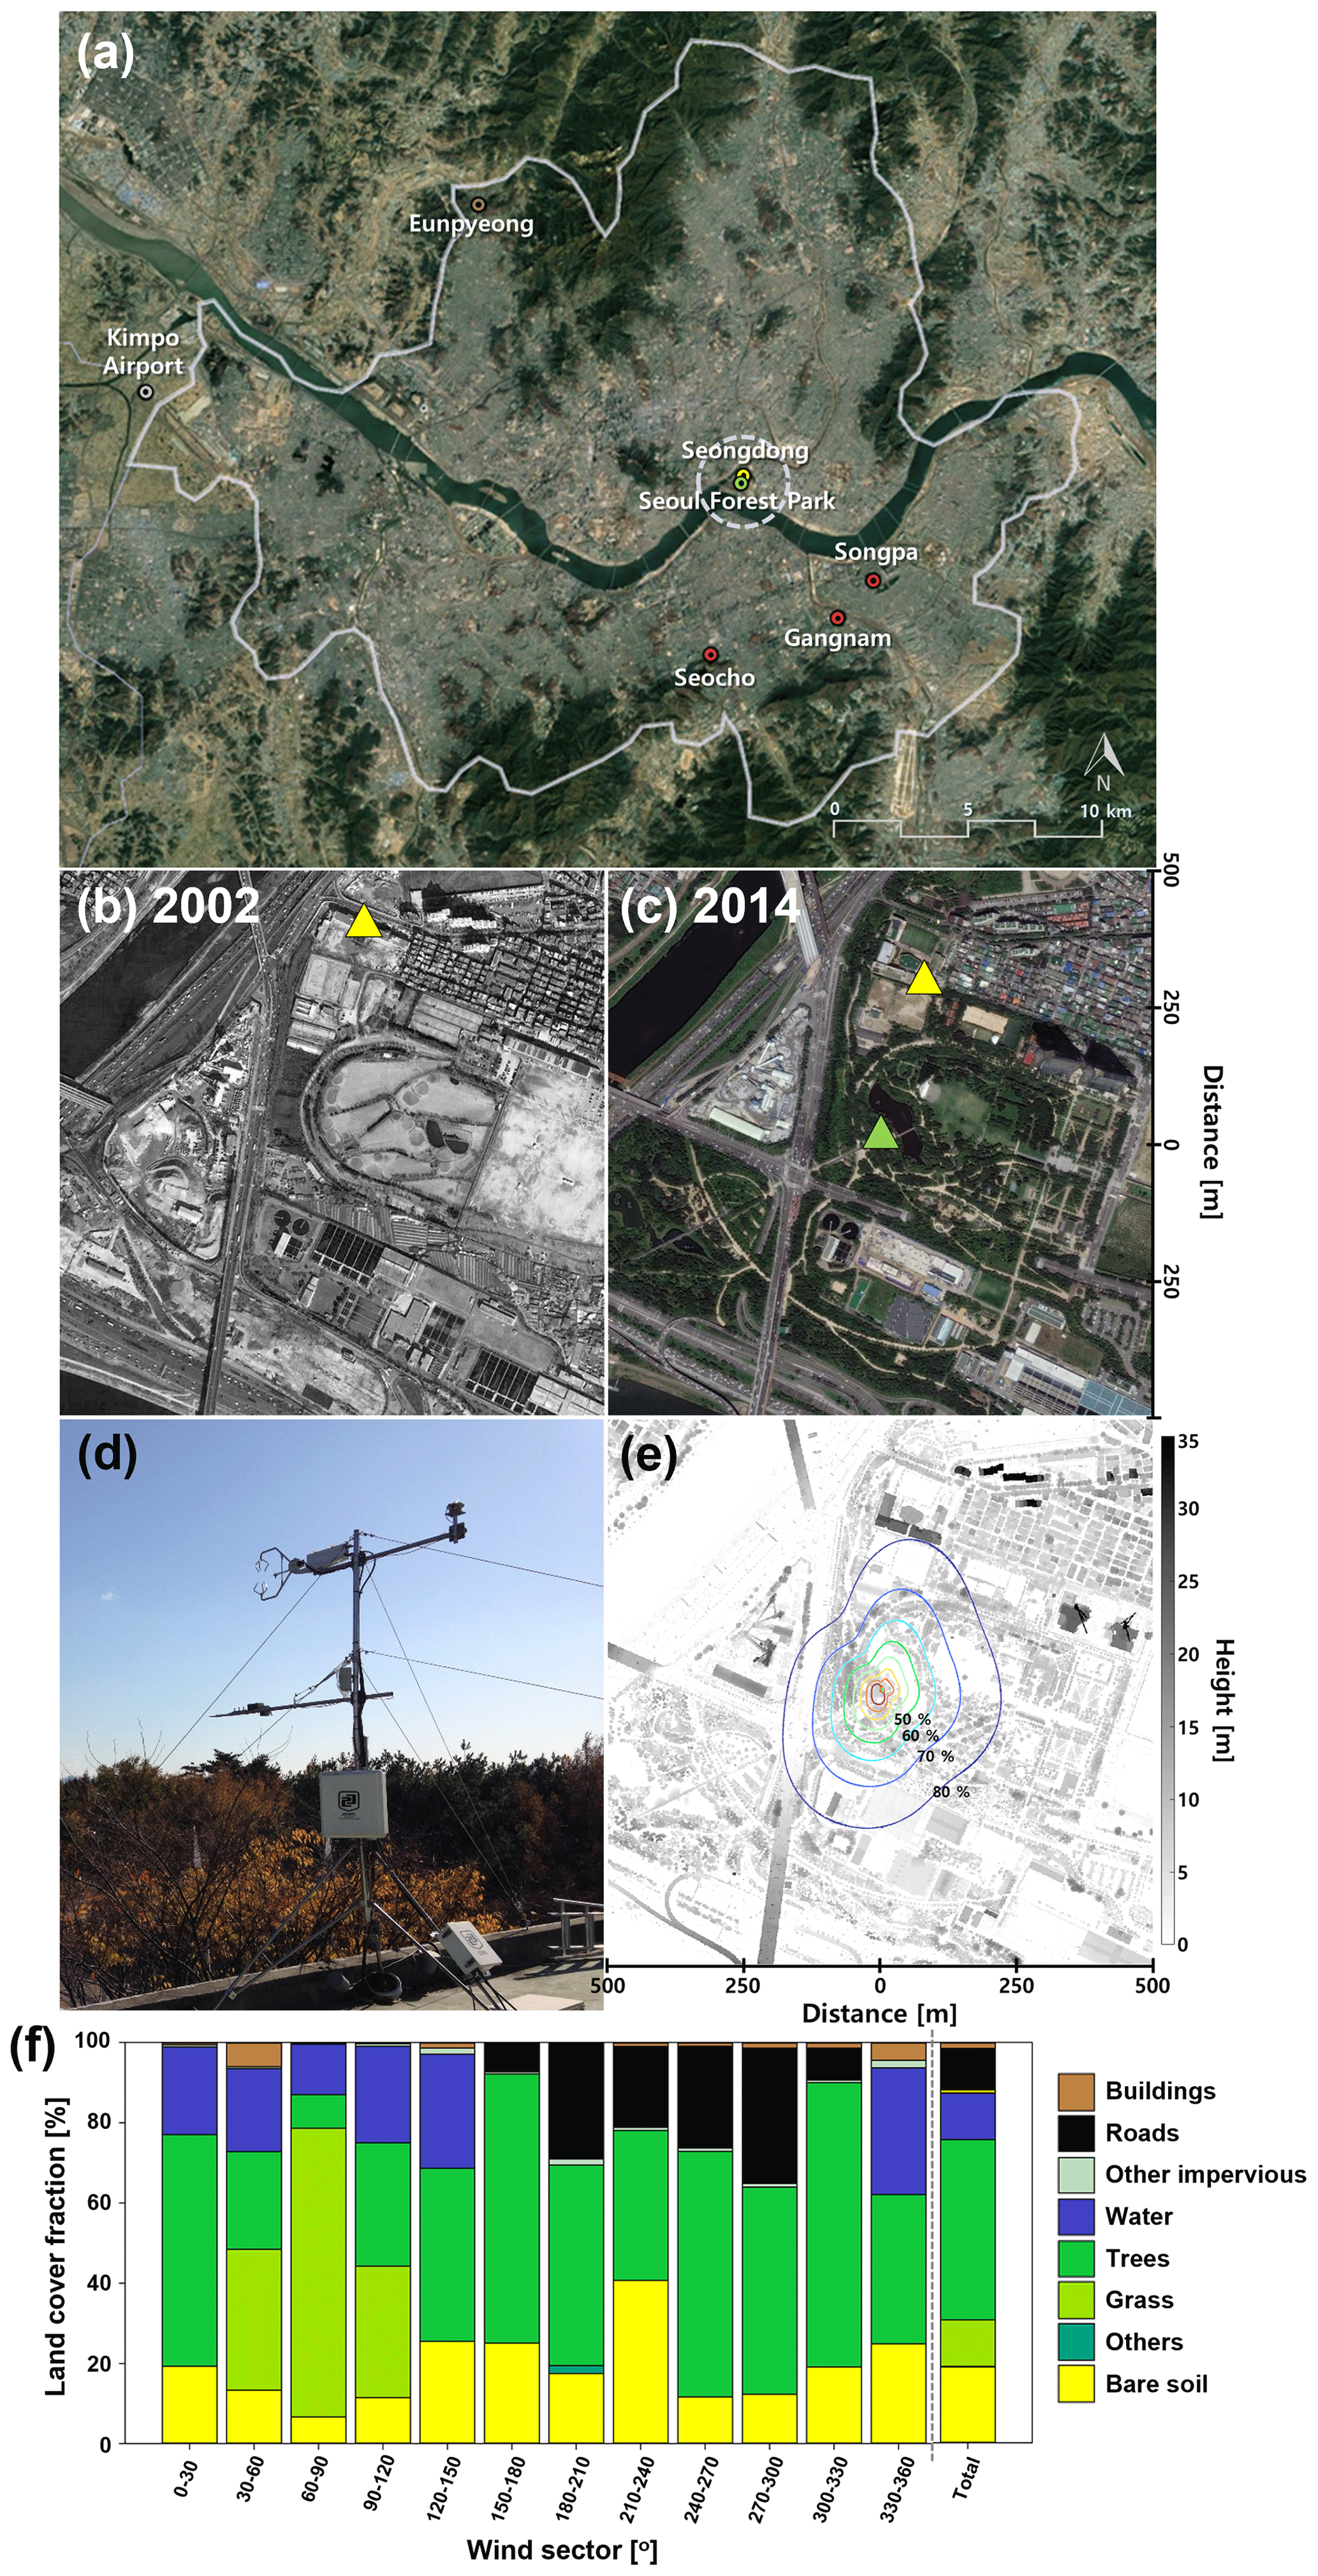
Figure 1Site descriptions. (a) Location of the stations in Seoul (modified from map data © Google Earth 2019), (b) aerial photographs around Seoul Forest Park (SFP) in 2002 before the creation of the park and (c) in 2014 during the observation period (SFP, green triangle; SD, yellow triangle), (d) photograph of the SFP station, (e) footprint climatology (Hsieh et al., 2000) with the height of obstacles around the SFP station, and (f) land cover fraction within a 150 m radius around the flux tower.
The mean tree height (hc) is approximately 7.5 m and ranges between 5.8–9.5 m. Analysis and estimation of roughness elements and integral turbulence characteristics are reported in Kent et al. (2018), and here we explain the key information on the values from Macdonald (Macdonald et al., 1998) and Kanda (Kanda et al., 2013) methods with vegetation in Kent et al. (2017). One-meter horizontal resolution digital terrain and digital surface model data are analyzed for roughness parameters and tree heights. The mean roughness length (z0) and zero-plane displacement height (zd) range between 0.3–0.6 and 4.1–8.2 m with wind directions, respectively. z0 and zd have seasonal and directional variations depending on the variability of the leaves on the vegetation (Lee, 2015; Kent et al., 2018). z0 and zd change from approximately 0.6 and 5.0 m during leaf-on period (June–August) to 1.2 and 3.0 m during the leaf-off periods (December–February).
Approximately 80 % of the footprint area of the SFP tower is within 250 m (Fig. 1e), and the dominant land cover within this range is a deciduous forest with irrigated grass lawns (Zoysia), oak (Quercus acutissima), ginkgo (Ginkgo biloba), and ash trees (Fraxinus rhynchophylla), which correspond to the local climate zone (LCZ) “A”, dense trees (Stewart and Oke, 2012). The maximum leaf area index (LAI) of 300 × 300 m2 around the SFP tower is approximately 1.6 (Copernicus Service information, 2020). On the east side (0–120∘), there are trees (approximately 230 stems ha−1) with a small artificial lake and grasslands beyond it. Trees mainly occupy the south and west sectors of a tower (120–330∘) within a 100 m radius area (approximately 540 stems ha−1), and traffic roads lie outside of the park (Fig. 1f).
The measurement system was installed on the rooftop of the SFP facility building (Fig. 1d). A three-dimensional sonic anemometer (CSAT3A, Campbell Scientific, USA) and enclosed infrared gas analyzer (EC155, Campbell Scientific, USA) were mounted 12.2 m above the ground level (2.8 m above the roof of an 8.4 m high building) in June 2013 for 2 years (Fig. 1d). The eddy covariance data were recorded using the data logger (CR3000, Campbell Scientific, USA) with a 10 Hz sampling rate and a 30 min averaging time. The gas analyzer was calibrated with standard CO2 gas every 3 months. The measurement height (zm) satisfied the tower height requirement over forested or more structurally complex ecosystems in most of wind directions (i.e., ), and turbulent flow is in the skimming flow region (Grimmond and Oke, 1999; Munger et al., 2012; Kent et al., 2018). Turbulent flow can be in the wake regime in the west direction (210–330∘) during the non-growing season (Grimmond and Oke, 1999). Two radiometers (NR Lite2 and CMP3, Kipp & Zonen, Netherlands) were used to measure the radiative fluxes. An auxiliary measurement included a humidity and temperature probe (HMP155A, Vaisala, Finland) and EVI (enhanced vegetation index) by in situ LED sensors.
The roads consist of 8 and 10 lanes carrying heavy traffic throughout the day (∼ 100 000 vehicles d−1) to the south and west of the tower (Fig. 1c). Hourly traffic volume, which is used for surface flux partitioning, is evaluated on the road adjacent to the SFP tower every year by the Seoul Metropolitan Government (https://topis.seoul.go.kr, last access: 14 January 2020). Across the road on the western side of the tower, a cement factory still exists, although its size is smaller than it used to be in the past (Fig. 1b and c).
2.2.2 Climate conditions
Climatic condition shows a distinct seasonal variation with the seasonal march of the East Asian summer monsoon (Fig. 2). The mean climatological values (1981–2010) of the screen-level air temperature (Tair) and precipitation were 12.5 ∘C and 1450 mm yr−1, respectively. During the study period (June 2013–May 2015), the observed Tair was higher than the climatological mean. Higher temperatures lasted longer in the summer of 2013 with the stagnation of the migratory anticyclones (June) and North Pacific anticyclone (July–August). There were strong heat waves in the spring seasons of 2014 and 2015 (Hong et al., 2019a). Wind direction also shows seasonal variation with the monsoon system. Prevailing wind is southwesterly in spring and summer and changes to northeasterly in autumn and northwesterly in winter (Fig. 3). Main wind comes from vegetative surface in the park, but other land cover types are included differently with seasons. Accordingly, road fraction in the flux footprint is larger in spring and summer, and building emission is included only in the winter season with northeasterly wind (Figs. 1f and 2).
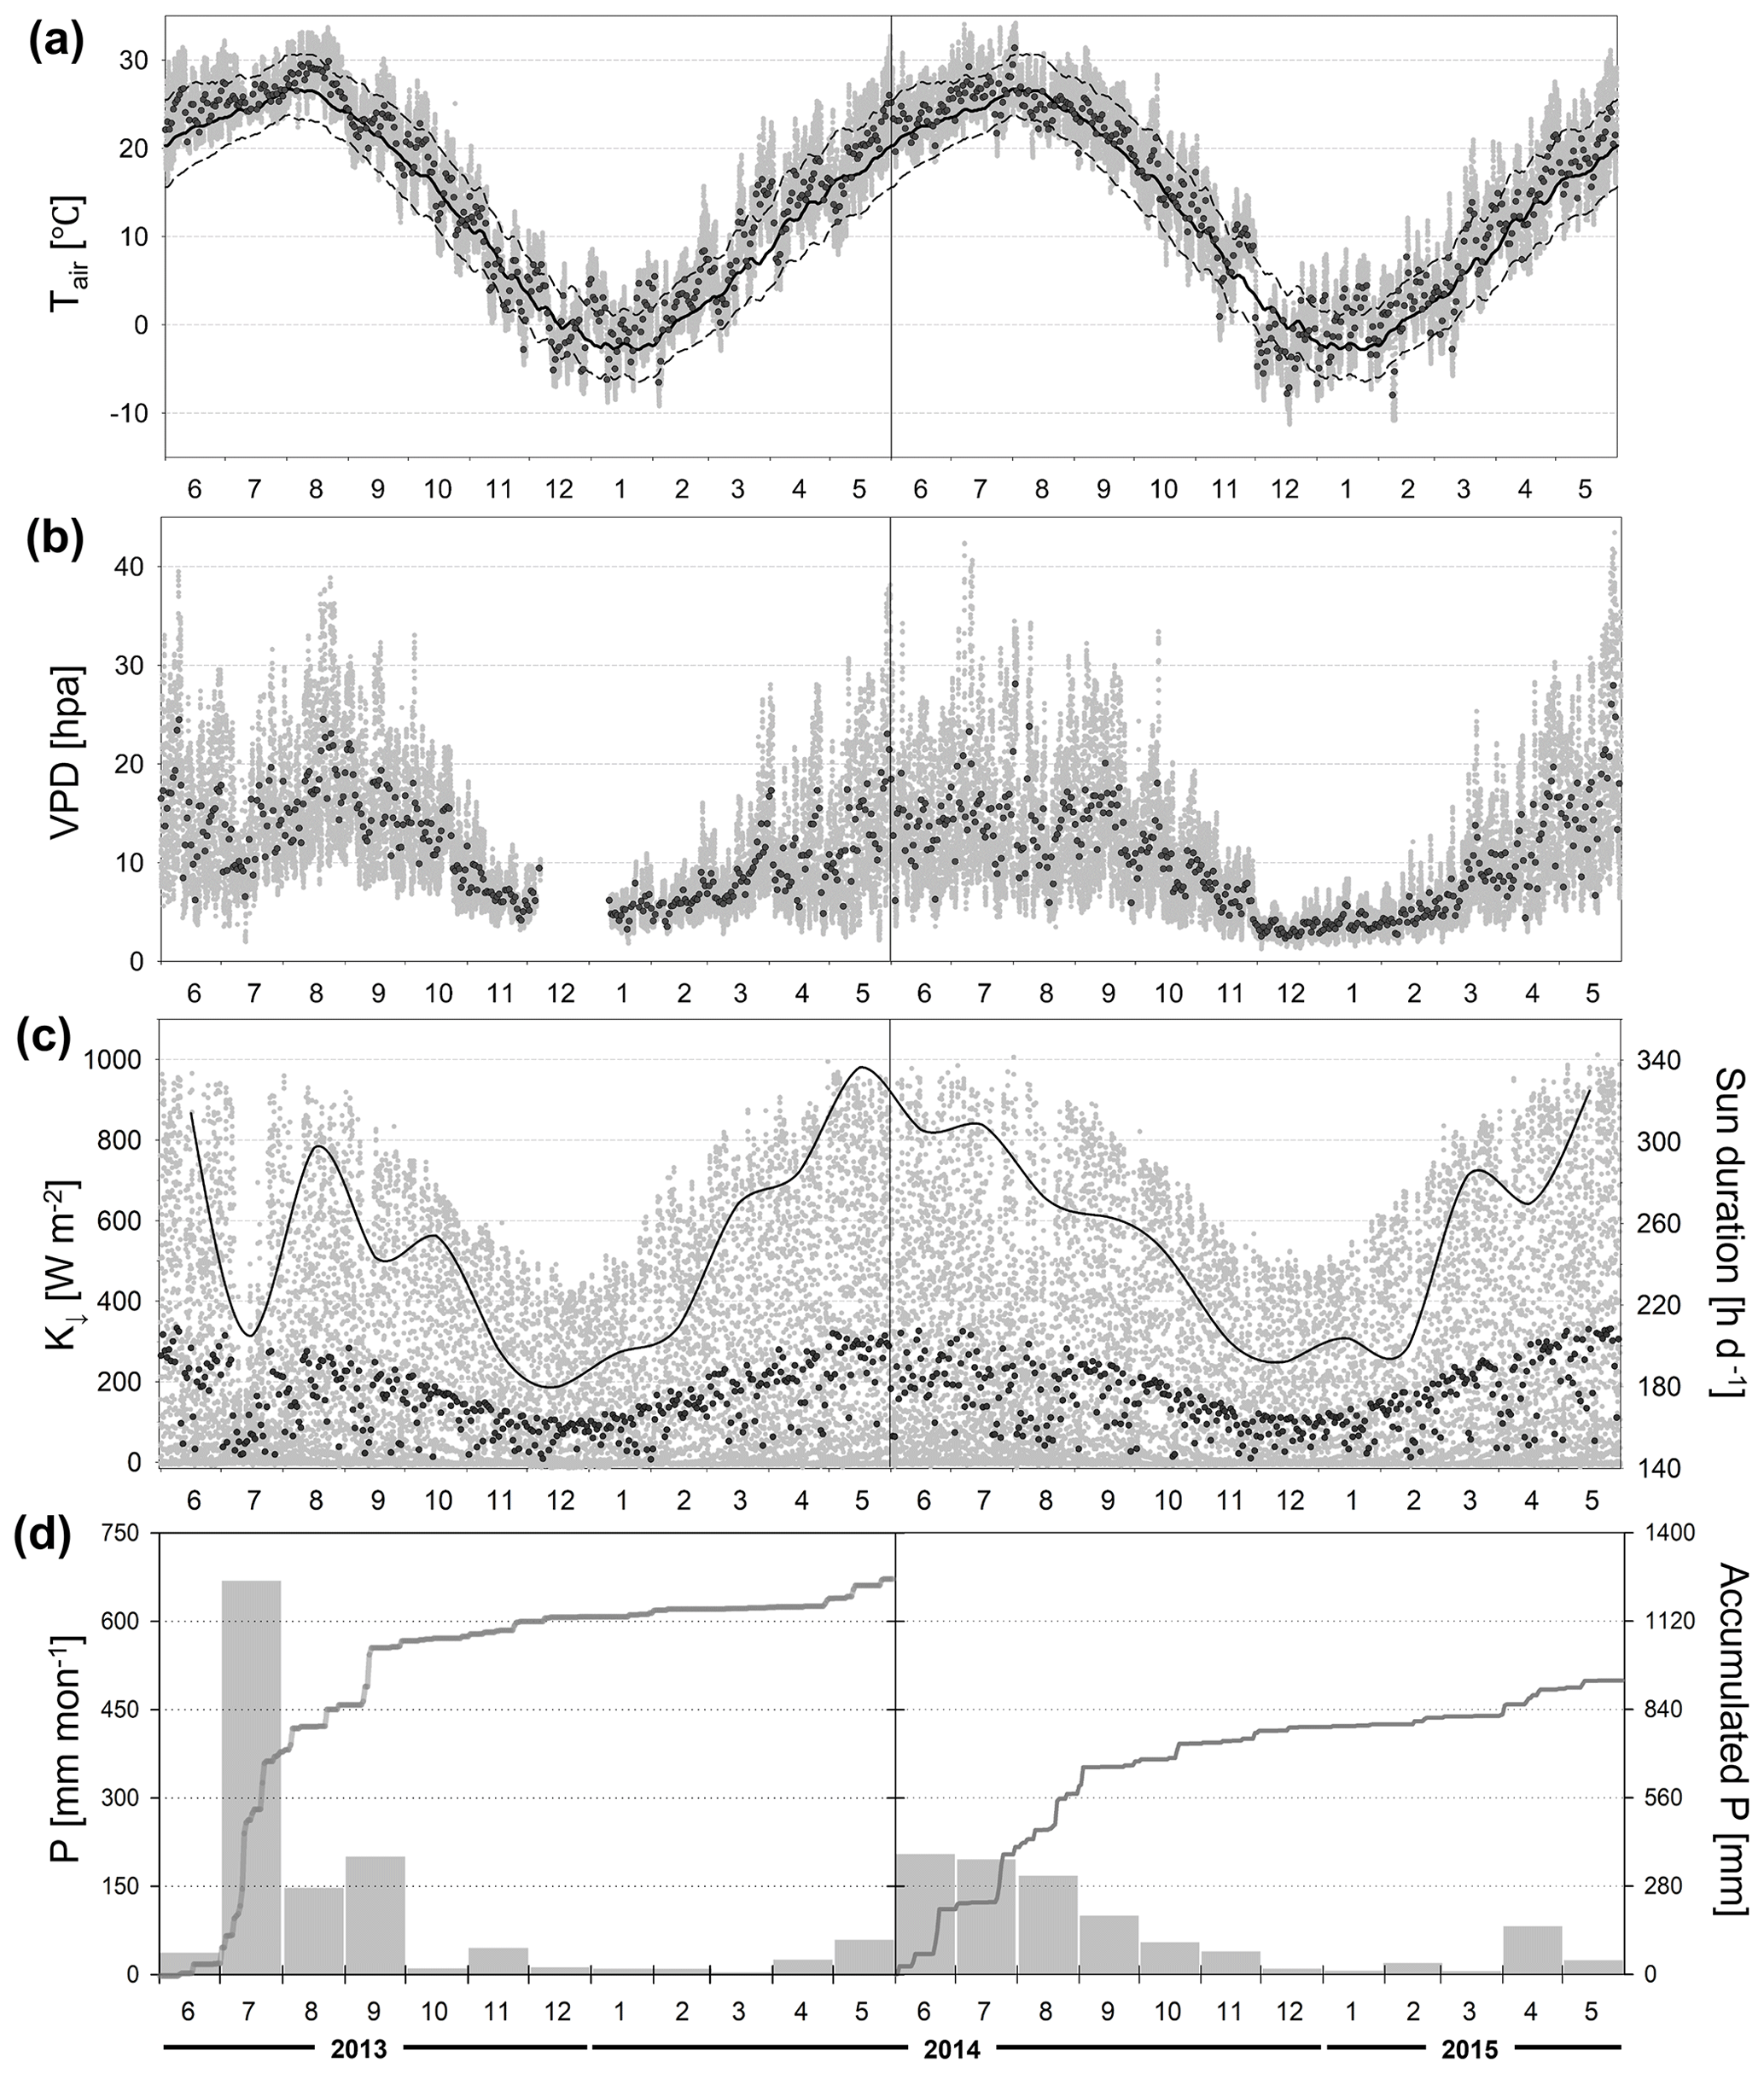
Figure 2Climatic conditions of the SFP for 2 years from June 2013 to May 2015: 30 min (gray dots) and daily mean (black dots) (a) air temperature with 30-year normal values of Seoul (daily mean, solid line; min and max, dashed lines), (b) vapor pressure deficit (VPD) and missing data existing on December 2013, (c) downward shortwave radiation (K↓) and monthly averaged sunshine duration per day (black line), and (d) monthly precipitation (gray bars) and yearly accumulated precipitation (solid line).

Notably, seasonal precipitation shows a contrasting pattern between two consecutive years (Fig. 2d). In the first year (June 2013–May 2014), annual precipitation was 1256 mm, which corresponded to approximately 90 % of the climatological mean. In addition, approximately 50 % of the annual rainfall was concentrated in the summer with an estimated 650 mm occurring only in July 2013; however, in the second year the annual rainfall was 932 mm (i.e., 67 % of the climatological mean) (i.e., the smallest annual precipitation in the past 20 years). The monthly precipitation values in July and August of 2014 were 198 and 169 mm, respectively, which represented only approximately 35 % of the climate mean. Accordingly, the vapor pressure deficit (VPD) and downward shortwave radiation (K↓) in July 2013 were relatively smaller than those in July 2014 (Figs. 3b and c).
2.2.3 Observations in the Seoul Metropolitan Area
Meteorological data from six stations (one eddy covariance station, one aerodrome meteorological observation station, and four automatic weather stations) in the Seoul Metropolitan Area are analyzed to examine the heat mitigation and CO2 reduction effects of urban vegetation in the SFP (Table 1 and Fig. 1a). The Eunpyeong eddy covariance site (EP; 37.6350∘ N, 126.9287∘ E) is for surface flux observations in the northwest of Seoul, where there was a recent urban redevelopment to high-rise and high-population residential areas from low-rise areas (Hong and Hong, 2016; Hong et al., 2019b). Flux observations at the site have been conducted since 2012, and they show the surface energy fluxes and turbulence characteristics of a typical urban residential area. Because the area around the SFP was originally planned to be redeveloped to high-rise and high-population residential buildings, EP is selected for comparative analysis as an antipodal place for the SFP region because the sites are close to each other and so have the similar synoptic conditions.
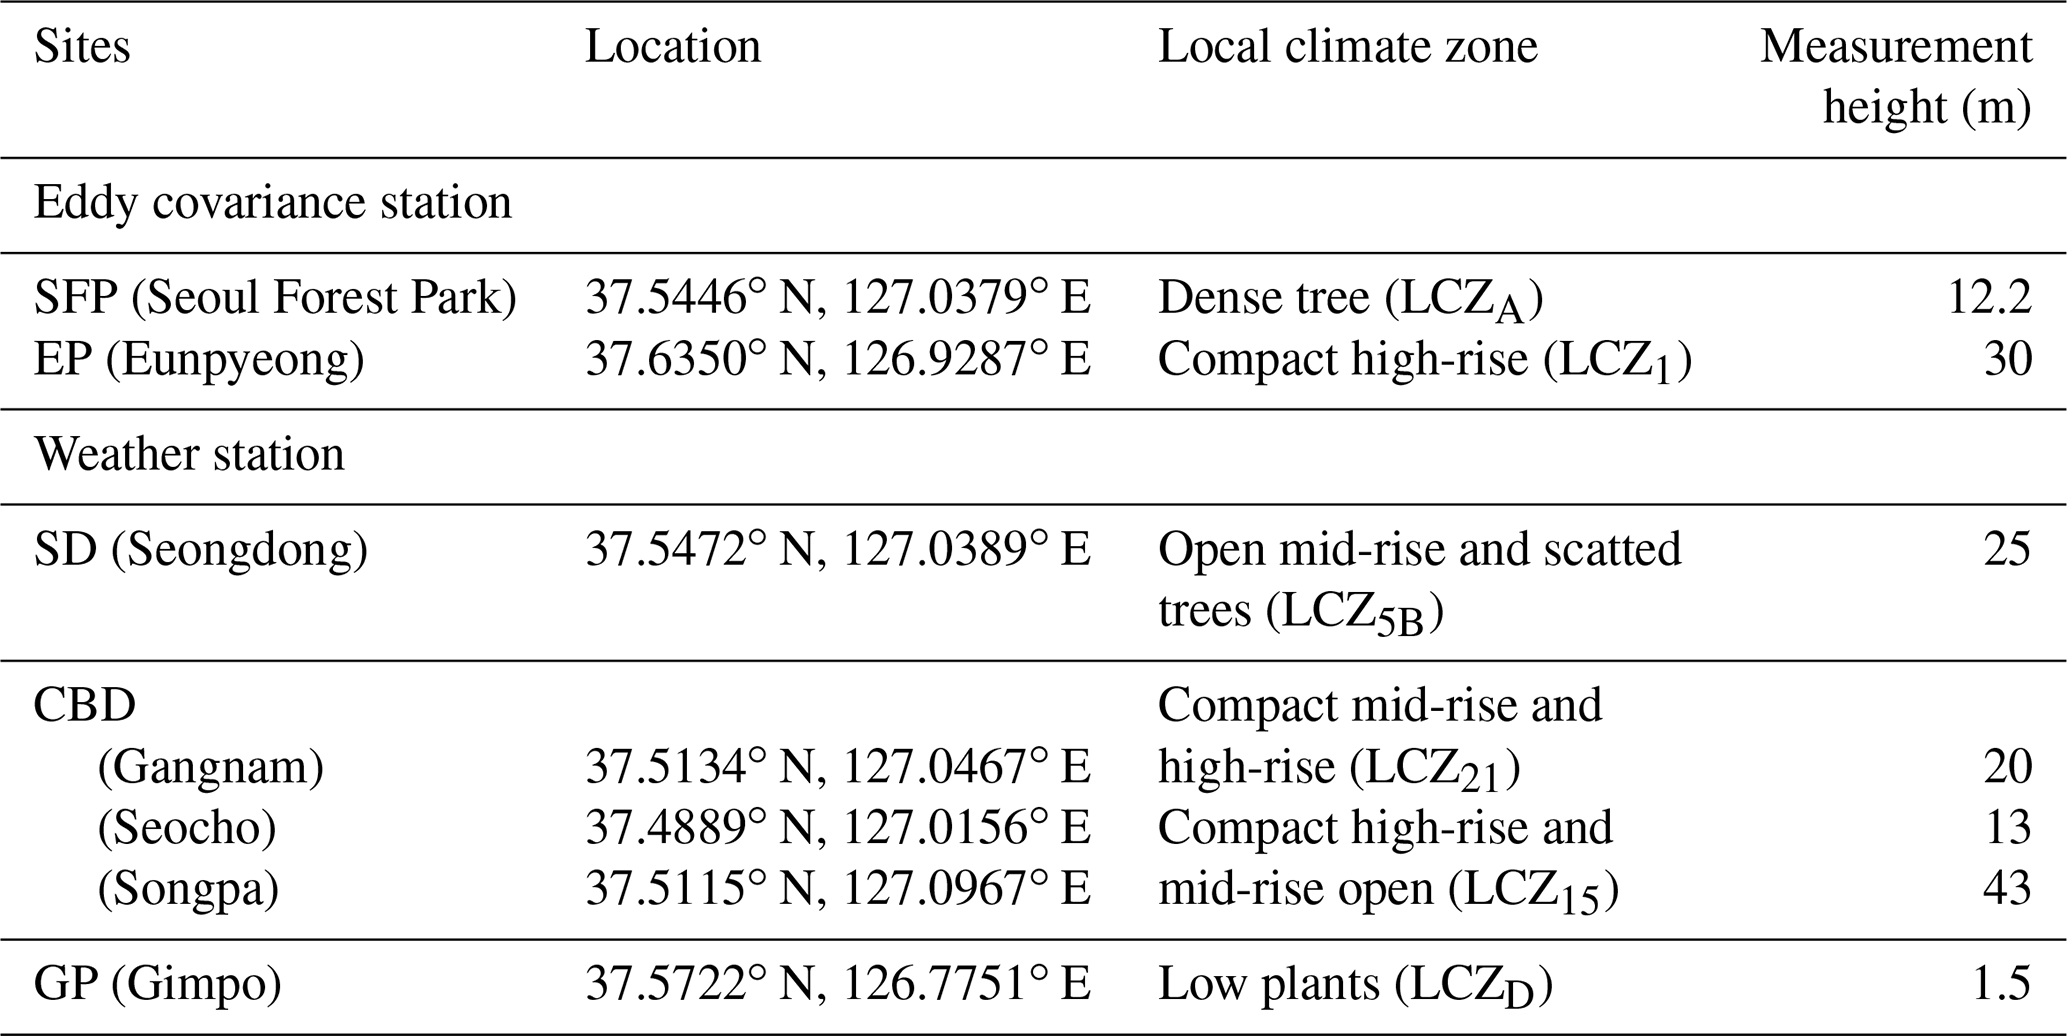
The Gimpo Airport weather station (GP; 37.5722∘ N, 126.7751∘ E) is located on the western boundary of Seoul, and it is surrounded by grasslands and croplands, which corresponds to LCZ “D”. As the dominant wind comes from the west, the GP site is generally affected by the same synoptic weather conditions as Seoul. The GP station represents the rural environment of the Seoul Metropolitan Area because urban development is restricted around the airport. In this study, we select the GP site as a reference point and calculate the urban heat island intensity (UHIi) as the synchronous difference in Tair between the urban and rural areas accordingly (Stewart, 2011).
The Seongdong weather station (SD; 37.5472∘ N, 127.0389∘ E), the closest station to the SFP, is located approximately 300 m north of the SFP tower (Fig. 1c). Since the station began observations in August 2000, the meteorological data at SD are useful for analyzing temperature changes before and after the construction of the SFP. Accordingly, it is used to analyze local climatic changes caused by the SFP. Moreover, SD provides auxiliary weather variables (e.g., precipitation) that are not observed in SFP station and reference data for the gap filling.
The Gangnam, Seocho, and Songpa weather stations (hereafter denoted as CBD) are located in Seoul's central business district, which corresponds to LCZ 1 or 2. These sites are also close to the SFP (∼ 5 km); thus, temperatures in these regions can be assumed to be exposed to the same synoptic condition. The annual mean maximum UHIi of CBD ranges from 3.7 to 5 ∘C and is similar to that of the SD. These regions show greater UHIi than other parts of Seoul because of dense skyscrapers (Hong et al., 2013, 2019a). The average temperature of these three automatic weather stations is used to evaluate the temperature and UHIi reduction effects of the SFP construction. All meteorological data from the automatic weather station and aerodrome meteorological observation station are observed every minute, and they are averaged for 1 h for UHIi analysis. All the meteorological data are processed for quality control on the National Climate Data Portal of the Korea Meteorological Administration (http://data.kma.go.kr, last access: 2 December 2019).
2.3 Data processing procedures
Turbulent fluxes are computed using EddyPro (6.2.0 version, LI-COR), with the applications of the double rotation, time lag compensation using covariance maximization, quality test, and spectral corrections (Hong et al., 2020, and references therein). We apply the following post processes for quality control: (1) plausible value check, (2) spike removal, and (3) discarding the negative FC flux during the nighttime (i.e., no photosynthesis at night) (Hong et al., 2020). Negative nocturnal FC occurs occasionally (n = 485), and its accumulated value is 1.4 % of the total FC. The total study period from installation (31 May 2013) to termination (3 June 2015) is approximately 2 years (35 174 potential 30 min data), and in December 2013, there was a gap for approximately 4 weeks due to the power system failure. The total available data are approximately 90.1 %, 88.3 %, and 85.4 % (n = 31 709, 31 064, and 30 028) for QH, QE, and FC, respectively.
The flux partitioning and gap filling methods are well documented in previous studies of Lee et al. (2021a) and Hong et al. (2019b), and here we describe the core of the methods. Missing values in turbulent exchange of energy and CO2 are filled with an artificial neural network (ANN) of a backpropagation algorithm. The ANN uses the cosine transformed time of the day and day of the year, air temperature, relative humidity, wind speed and direction, atmospheric pressure, precipitation, downward shortwave radiation, cloud cover, soil temperature, and EVI.
Flux partitioning into photosynthesis and ecosystem respiration from the EC measured FC requires additional information and data processing (e.g., Stoy et al., 2006). Stochastic FC partitioning methods were recently applied by reprocessing EC observation data with auxiliary data and provided useful knowledge on the carbon cycle (Hiller et al., 2011; Crawford and Christen, 2015; Menzer and McFadden, 2017; Stagakis et al., 2019). Here we partition the measured FC into four contributing components (i.e., RE, GPP, ER, and EB in Eq. 2) to investigate their biotic and abiotic controlling factors in an artificially constructed park. Menzer and McFadden (2017) estimates anthropogenic emissions with traffic volume and air temperature in winter with wind directions when anthropogenic emission is dominant in net CO2 fluxes. This study extends the statistical partitioning method by Menzer and McFadden (2017). Similar to Menzer and McFadden (2017), our partitioning method chooses temporal subsets so that some components in Eq. (2) are insignificant with footprint-weighted road fraction so that the statistical partitioning is applicable even when ER is not negligible. In this way, RE is estimated as a function of temperature first, and GPP is finally estimated after modeling ER and EB based on the traffic volume and high-resolution footprint-weighted road fraction (see Fig. 1a and Table 1 in Lee et al., 2021a). Our estimations on anthropogenic emission from vehicle and building show good correlation with inventory data such as visitor counts, traffic volume, and natural gas consumption in the park. More information and relevant figures on the flux partitioning are available in Lee et al. (2021a).
3.1 Surface energy fluxes
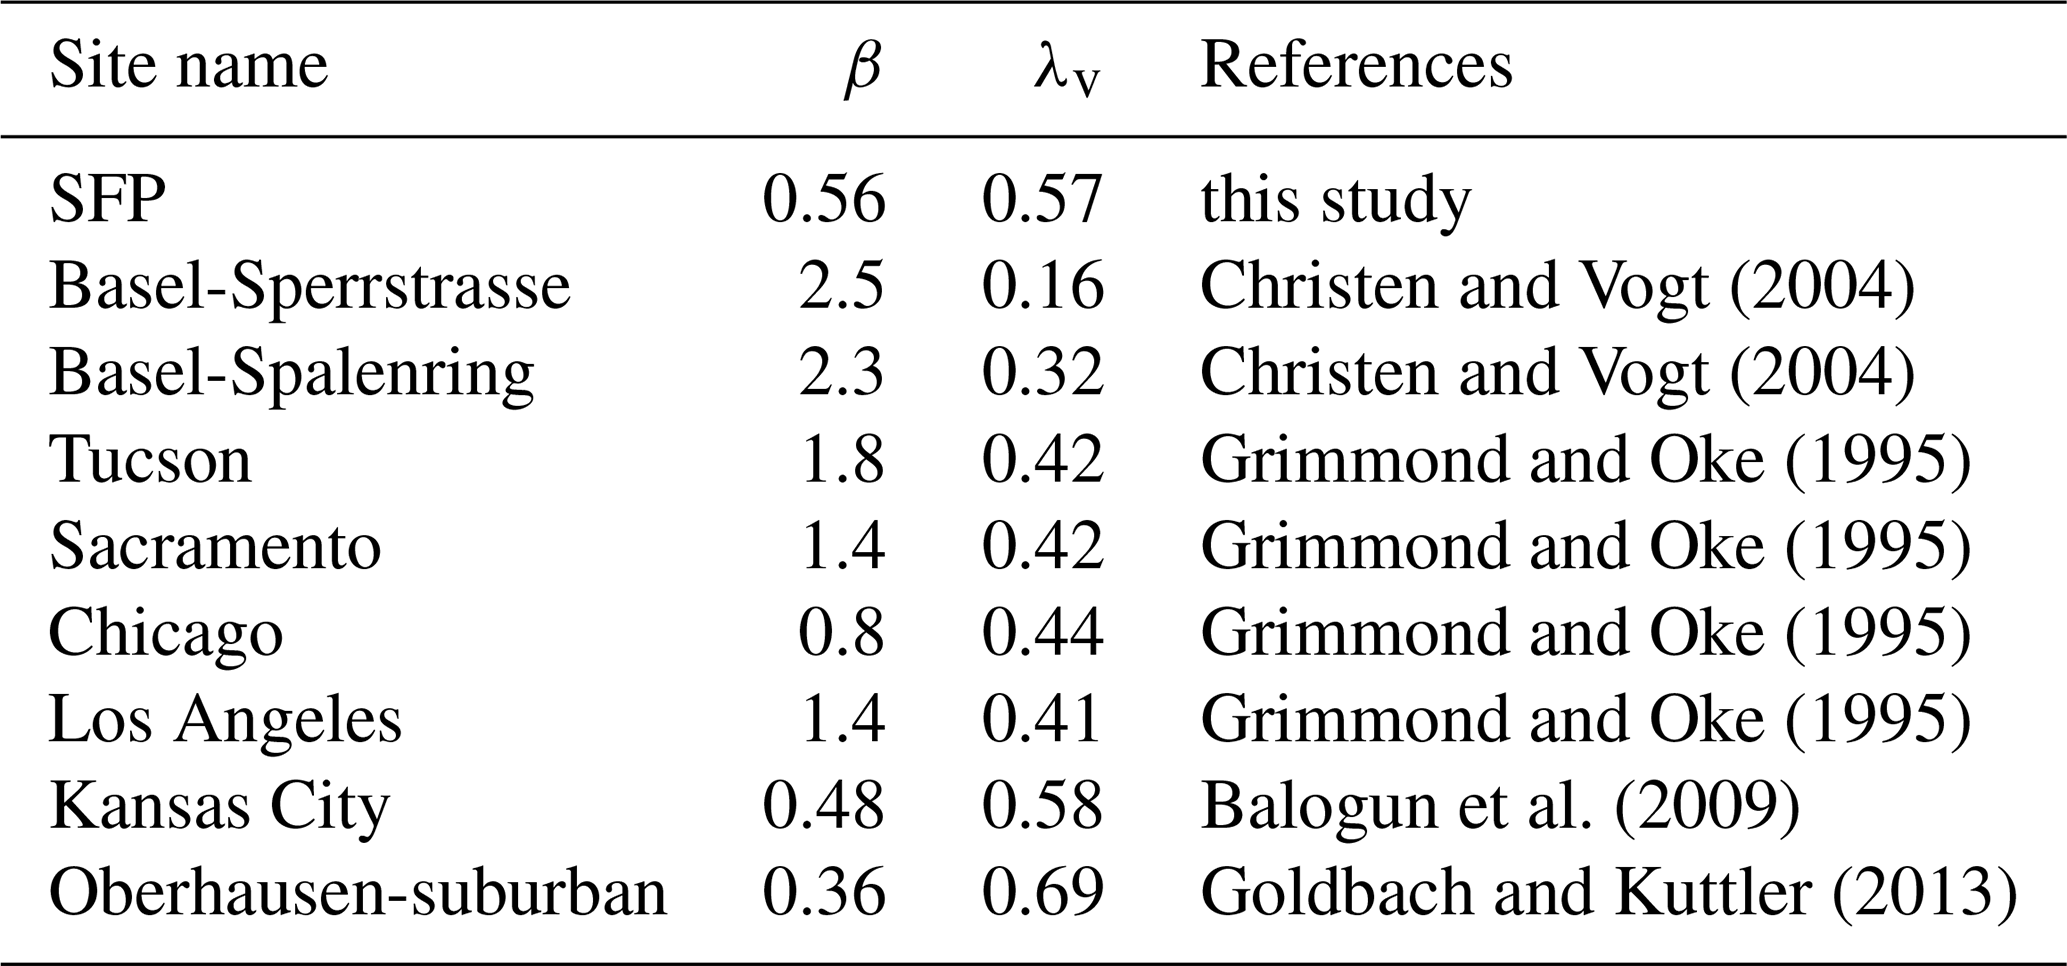
Surface energy fluxes at the SFP show typical seasonal variations over natural forest canopies with the seasonal march of the East Asian monsoon (Fig. 4) (Hong and Kim, 2011; Hong et al., 2019b, 2020). There are lengthy rainy spells and large temporal variabilities of meteorological conditions during the East Asian summer monsoon period (Fig. 2d). This heavy rainfall causes substantial decreases in K↓ and thus Q∗, with large temporal variations, thereby leading to the mid-summer depression of surface fluxes (Figs. 2c and 4). Q∗ also reaches its maximum in spring rather than in summer and decreases gradually from spring to winter (Fig. 4). The annual ration of QE to Q∗ at the SFP is smaller than its global average of 0.55 and values over forest canopies at similar latitudes in the East Asia (Falge et al., 2001; Suyker and Verma, 2008; Khatun et al., 2011). In summer, about 50 % of Q∗ is partitioned to QE, and QH is minimum because of the ample water supply from the summer rainfall. QH is maximum in spring and even larger in winter, despite the relatively smaller Q∗, because of the cold and dry climatic conditions induced by the winter monsoon. Accordingly, the seasonal mean Bowen ratio ranges from near zero (summer) to approximately 4 (winter), with its daily maximum around 9 in early January 2015 (Fig. 5). β in the SFP is consistently lower than the high-rise, high-density residential area (i.e., the EP site) because of the ET from the vegetative canopies and the unpaved surfaces in the urban forest. Daytime Bowen ratio in summer is about 0.6, which is smaller in other urban sites but is similar to suburban sites of the similar vegetation cover mainly because of the small fraction of impervious spaces around the SFP station (Table 2).
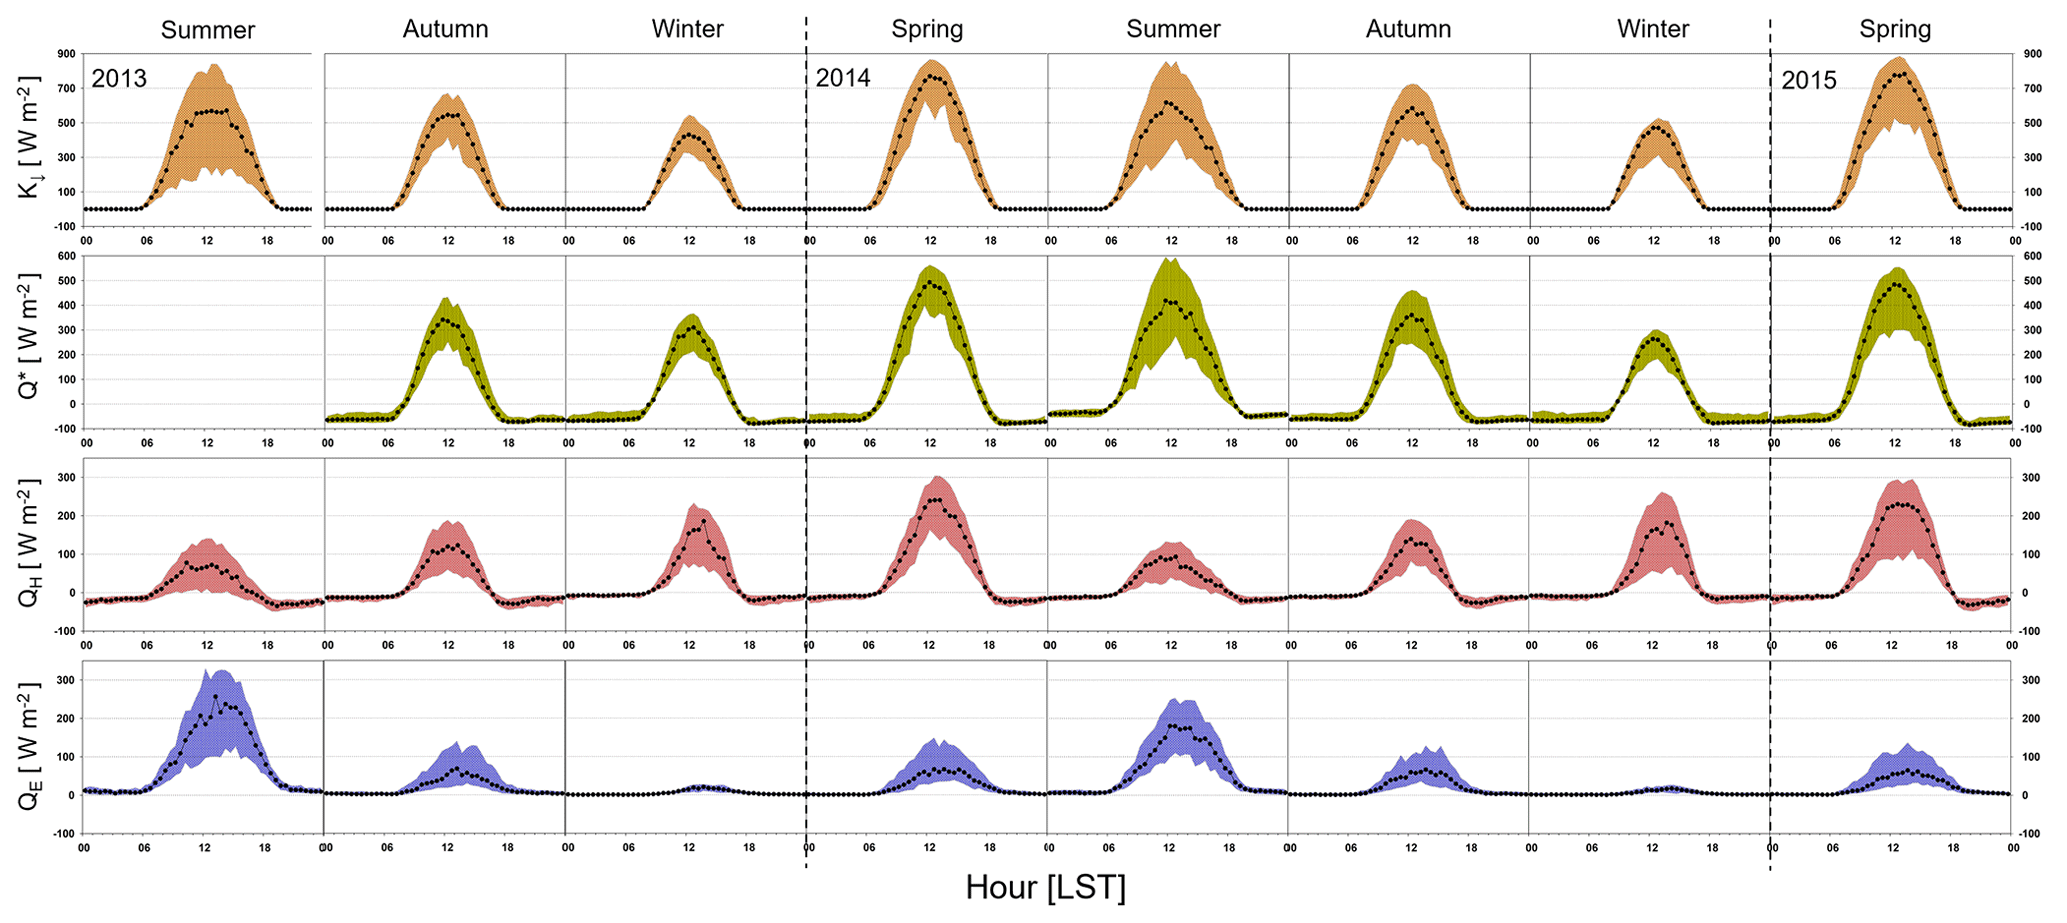
Figure 4Diurnal variations of surface energy fluxes. Seasonal median diurnal variations (points) and interquartile ranges (shaded) of 30 min downward shortwave radiation (K↓), net radiation (Q∗), sensible heat flux (QH), and latent heat flux (QE) for 2 years. Since the net radiation system was installed in September 2013, there was no Q∗ value in the first summer.

Figure 5Daily Bowen ratio (; dots), monthly Bowen ratio (lines), and gap-filled monthly evapotranspiration (ET; bars) for 2 years (SFP; green, EP; brown).
Table 2Daytime Bowen ratio () in summer at the SFP and other urban sites with vegetation cover fraction (λv).
Surface energy fluxes also shows annual variabilities influenced by the timing of the onset and duration of the summer monsoon, similarly to natural forest in East Asia (Hong and Kim, 2011) (Figs. 3, 4, and 5). As discussed in Sect. 2.2.2, annual precipitation is much larger in the first year than in the second year because of the interannual variations in the East Asian summer monsoon activity, thereby making substantial differences in surface radiative fluxes. Furthermore, QE shows the difference between the first and second years of the observation, particularly by responding to such interannual variability of radiation. In the first year, QE is more than 300 W m−2 and has a relatively larger temporal variability because of the frequent rainfall events in summer, compared to the second year. However, it is notable that interannual variability of surface fluxes is relatively weaker than natural forest in this region, which will be better manifested in ET and its ratio to precipitation.
Table 3Gap-filled annual budgets for surface energy fluxes and precipitation (P).
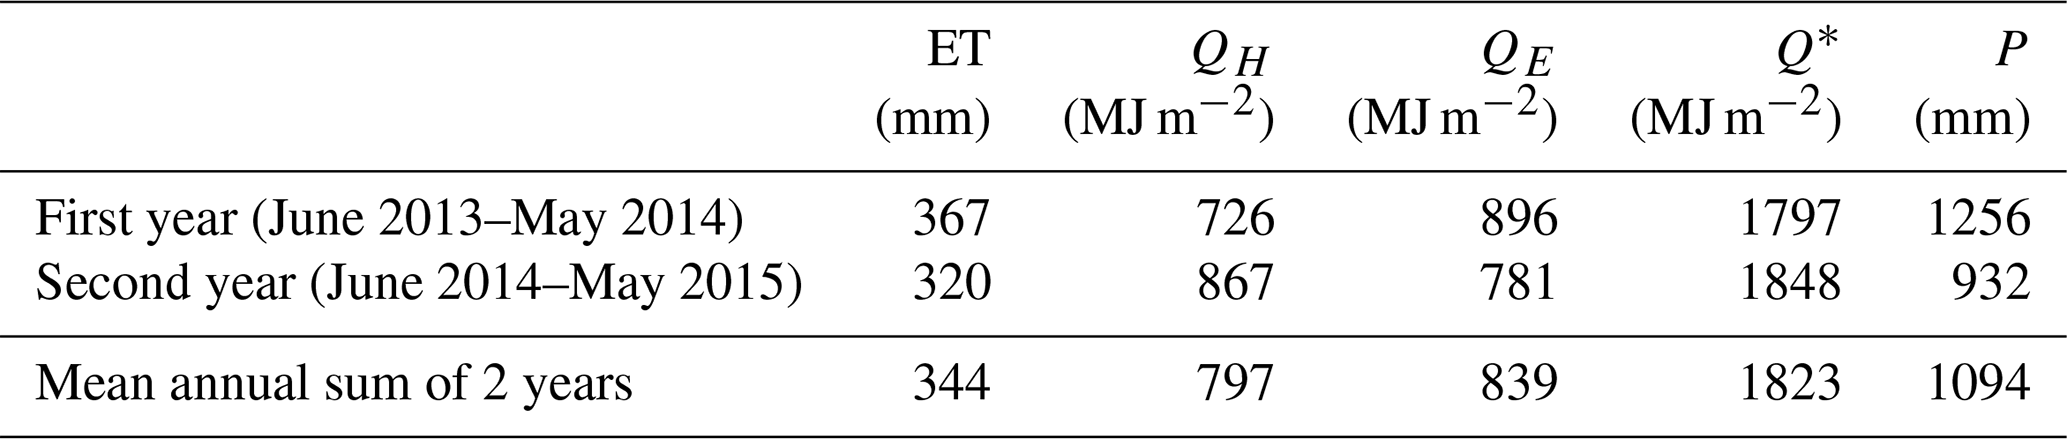
Evapotranspiration rate, which is equivalent to QE, ranges from 5 mm per month in January 2015 to 74 mm per month in August 2013, and the annual ET values are 367 and 320 mm yr−1 in the first and second years, respectively (Figs. 3 and 5 and Table 3). The ET values correspond to 29.3 % and 34.3 % of the annual precipitations and 49 % and 42 % of net radiation, respectively. The annual ET in the second year is smaller than that in the first year, with extensive drought in the second year. The difference in ET between the 2 consecutive years (i.e., 48 mm) mainly occurred in summer (42 mm), especially in August (30 mm) (Fig. 5). However, the ET in the second year shows only an approximately 12 % decrease, despite a substantial decrease in precipitation (26 % decrease) and the similar net radiation in the second year, compared to the first year (Table 3). Although the summer monsoon provides ample water to the ecosystem, its delay and weakness result in severe drought and stress to the ecosystem in this region (Hong and Kim, 2011); however, such ecosystem stress, such as the shrinking of ET and carbon uptake, has not been extensively investigated for the urban forest. We speculate that artificial irrigation by a sprinkler mitigated ecosystem stress to a certain degree in the urban forest.
3.2 Urban heat island intensity
The influence of urban forests on summer temperature is evident in UHIi. Apparently, the UHIi of the SFP (UHIiS hereafter) and CBD (UHIiC hereafter) gradually increases after mid-afternoon and is the largest at night (Fig. 6). This diurnal pattern is consistent with previous reports in cities exposed to different geographical and climatic conditions because rural areas cool faster than urban areas (Oke et al., 2017). Additionally, UHIiC is positive throughout all days ranging from 0.2–2.2 ∘C (i.e., warmer than rural area, GP) and is greater than UHIiS by 0–1.5 ∘C. The reason for this stronger UHIiC is that the CBD stations are in the central business district; thus, the densities of buildings surrounding these stations are much higher than those surrounding the SFP station. At night (19:00–06:00 KST), UHIiC and UHIS are approximately 1.8 and 1.4 ∘C, respectively. The maximum UHIi difference between the CBD and SFP was 0.7 ∘C in 2013 and 0.5 ∘C in 2014.
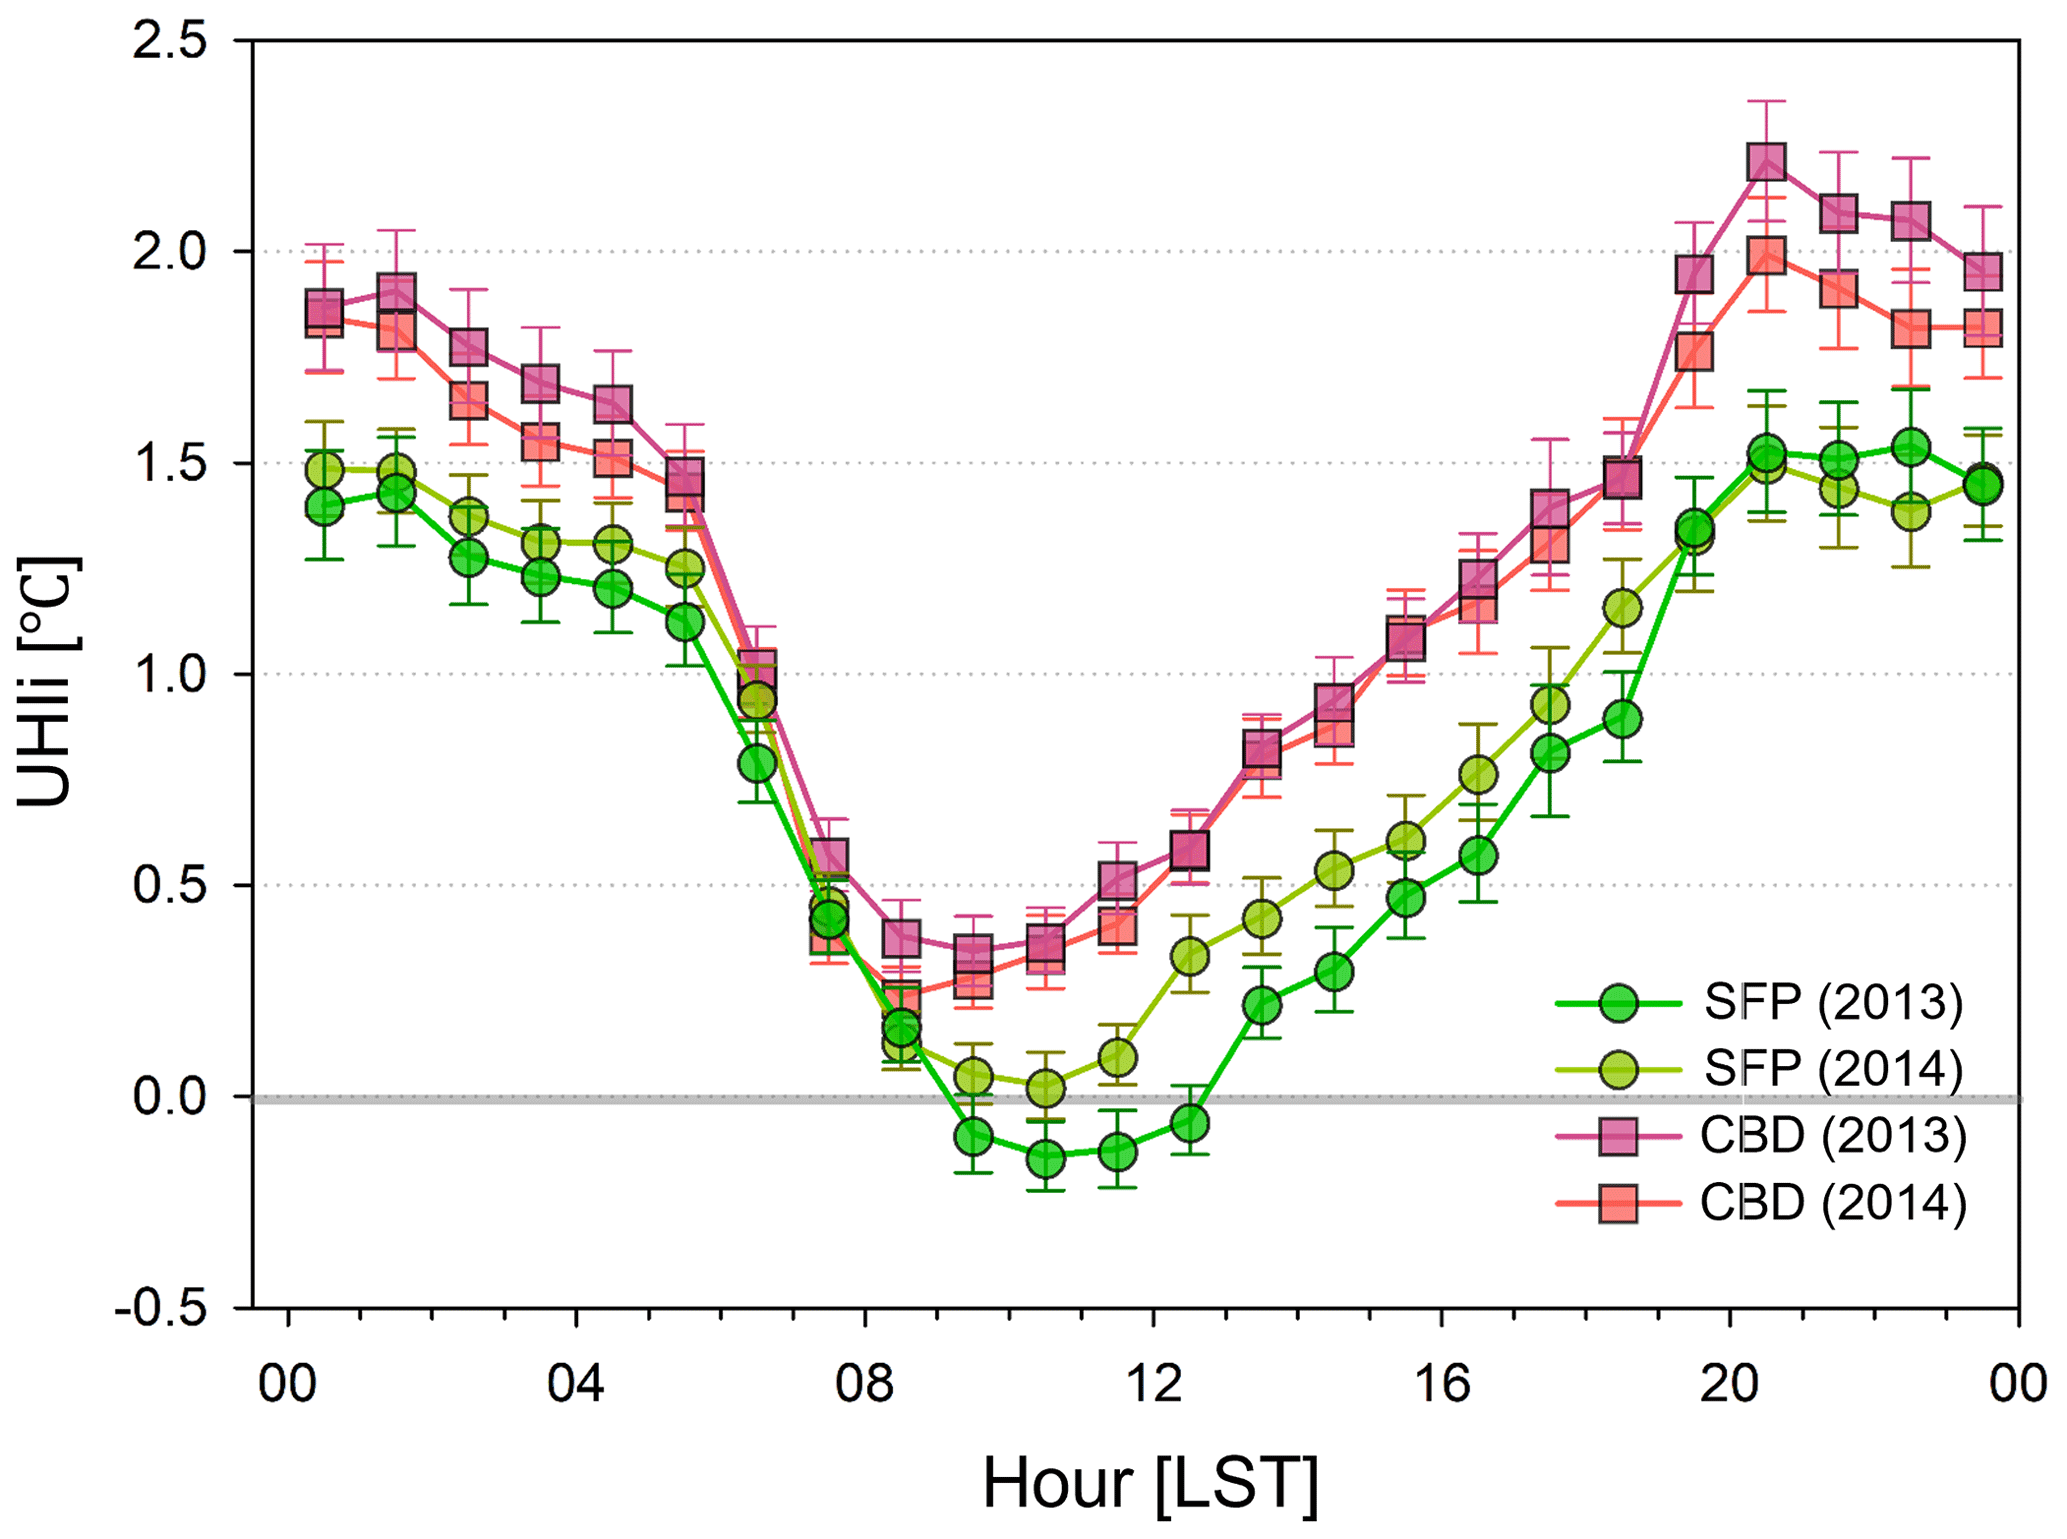
Figure 6Hourly mean diurnal variation of the urban heat island intensity (UHIi) of the SFP and CBD in the summer of 2013 and 2014. The error bars represent standard errors.
Around sunrise, sharp declines in the UHIi are observed because the air temperature near the urban area increases relatively slowly as urban fabrics, such as asphalt, brick, and concrete, have larger heat capacities and lower sky view factors than the rural areas (Oke et al., 2017). Eventually, this slow increase in the air temperature reduces the differences in Tair among the stations, thereby reducing the UHIi. The minimum UHIiC values were 0.3 ∘C (2013) at 09:30 KST and 0.2 ∘C (2014) at 08:30 KST, while the minimum UHIiS occurs at 10:30 KST with values of −0.1 ∘C (2013) and 0.0 ∘C (2014). This implies that the timing of the minimum UHIi is delayed in the SFP compared to the CBD. Notably, when there is strong ET (i.e., the first year) and more time is required to warm the SFP surface, the urban–rural difference in thermal admittance becomes relatively small. This can be attributed to the higher thermal capacity of the wetter soil of the SFP because of artificial irrigation and the absence of impervious surfaces (Oke et al., 1991). The diurnal variations in UHIiS also show the interannual variability in both amplitude and steepness over the 2 consecutive years. Despite the similar summertime UHIiC for both years, the daytime UHIiS in 2013 was approximately 0.2 ∘C lower than that in 2014. Notably, the summer QE was greater in 2013 than in 2014, and this observed summertime asymmetric difference between the SFP and CBD stations was not found in the winter when ET was negligible (not shown here).
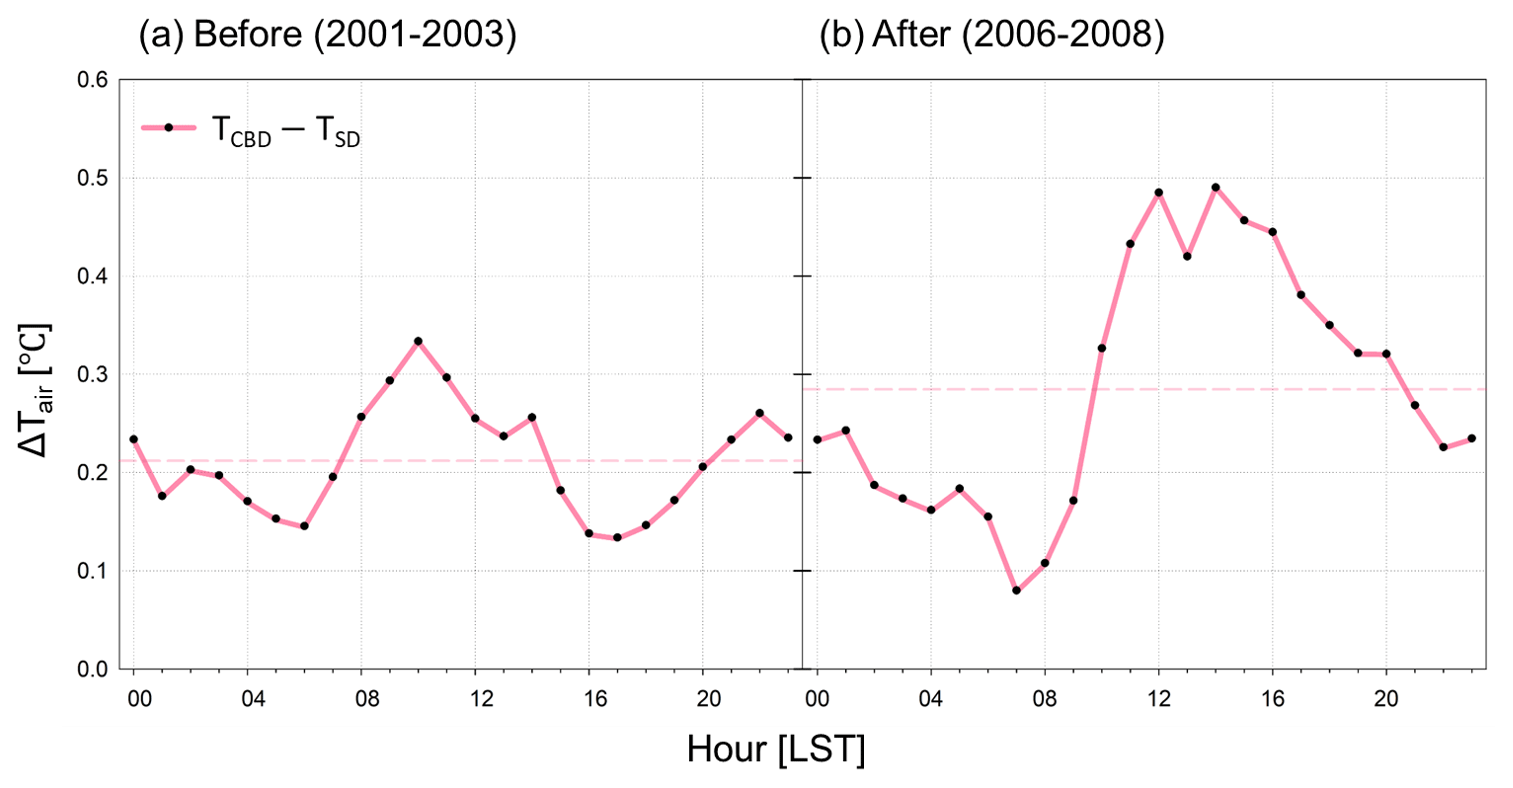
Figure 7Mean diurnal pattern of air temperature difference (ΔTair) between CBD and SD in summer (a) before and (b) after the construction of the park. CBD indicates an average of three automatic weather stations (Gangnam, Seocho, Songpa) in Seoul. The red dash line indicates the mean ΔTair before and after the construction of the park.
ΔTair is always positive during the entire summer season (i.e., CBD is warmer than SD) and shows distinct impacts on magnitude and diurnal variability after the park construction (Fig. 7). This difference will be larger if we consider that the measurement height at the CBD is higher than that at the SD (Table 1). Notably, this temperature contrast mainly occurs in the afternoon when ET is dominant. The maximum ΔTair is approximately 0.3 ∘C around 10:00 KST before the park construction (Fig. 7a) and increases up to approximately 0.5 ∘C, with its peak occurrence shifting from the morning to the afternoon (i.e., around 14:00 KST) after the construction (Fig. 7b). This peak time in the afternoon is coincident with the time when photosynthesis and QE are highest. The annual mean of the maximum UHIi in the SD is about 4 ∘C and does not change significantly after the park construction compared to the CBD regions (Hong et al., 2019a). On the contrary, the daytime maximum UHIi of the SD in summer decreases after the park construction (not shown here). Our results indicate that the thermal mitigation of the urban forest is important because of the wetter soil surface of the park and subsequent increases in QE, compared to the impervious surfaces in urban areas. This is especially true if we consider that the SFP area was originally planned to be developed as a high-population multi-purpose building complex. Our findings emphasize that the heat mitigation of the urban forest depends on the ratio of QE to net radiation. Indeed, there is an evident negative relationship between daytime QE and air temperature differences between the SFP and CBD stations (Fig. 8). As K↓ is more partitioned to QE, Tair of the SFP decreases more than that of the CBD, and the maximum temperature difference is observed in the summer season. The SFP is cooler than the CBD by up to 0.6 ∘C, but the SFP is warmer than the CBD during the winter-dormant season when ET is small. Our findings confirm that urban forests are responsible for substantial changes in the thermal environment in terms of QH and QE, as well as their related air and surface temperatures because of more evaporative cooling in green spaces compared to impervious surfaces such as roads and buildings in urban areas (Oke et al., 2017).
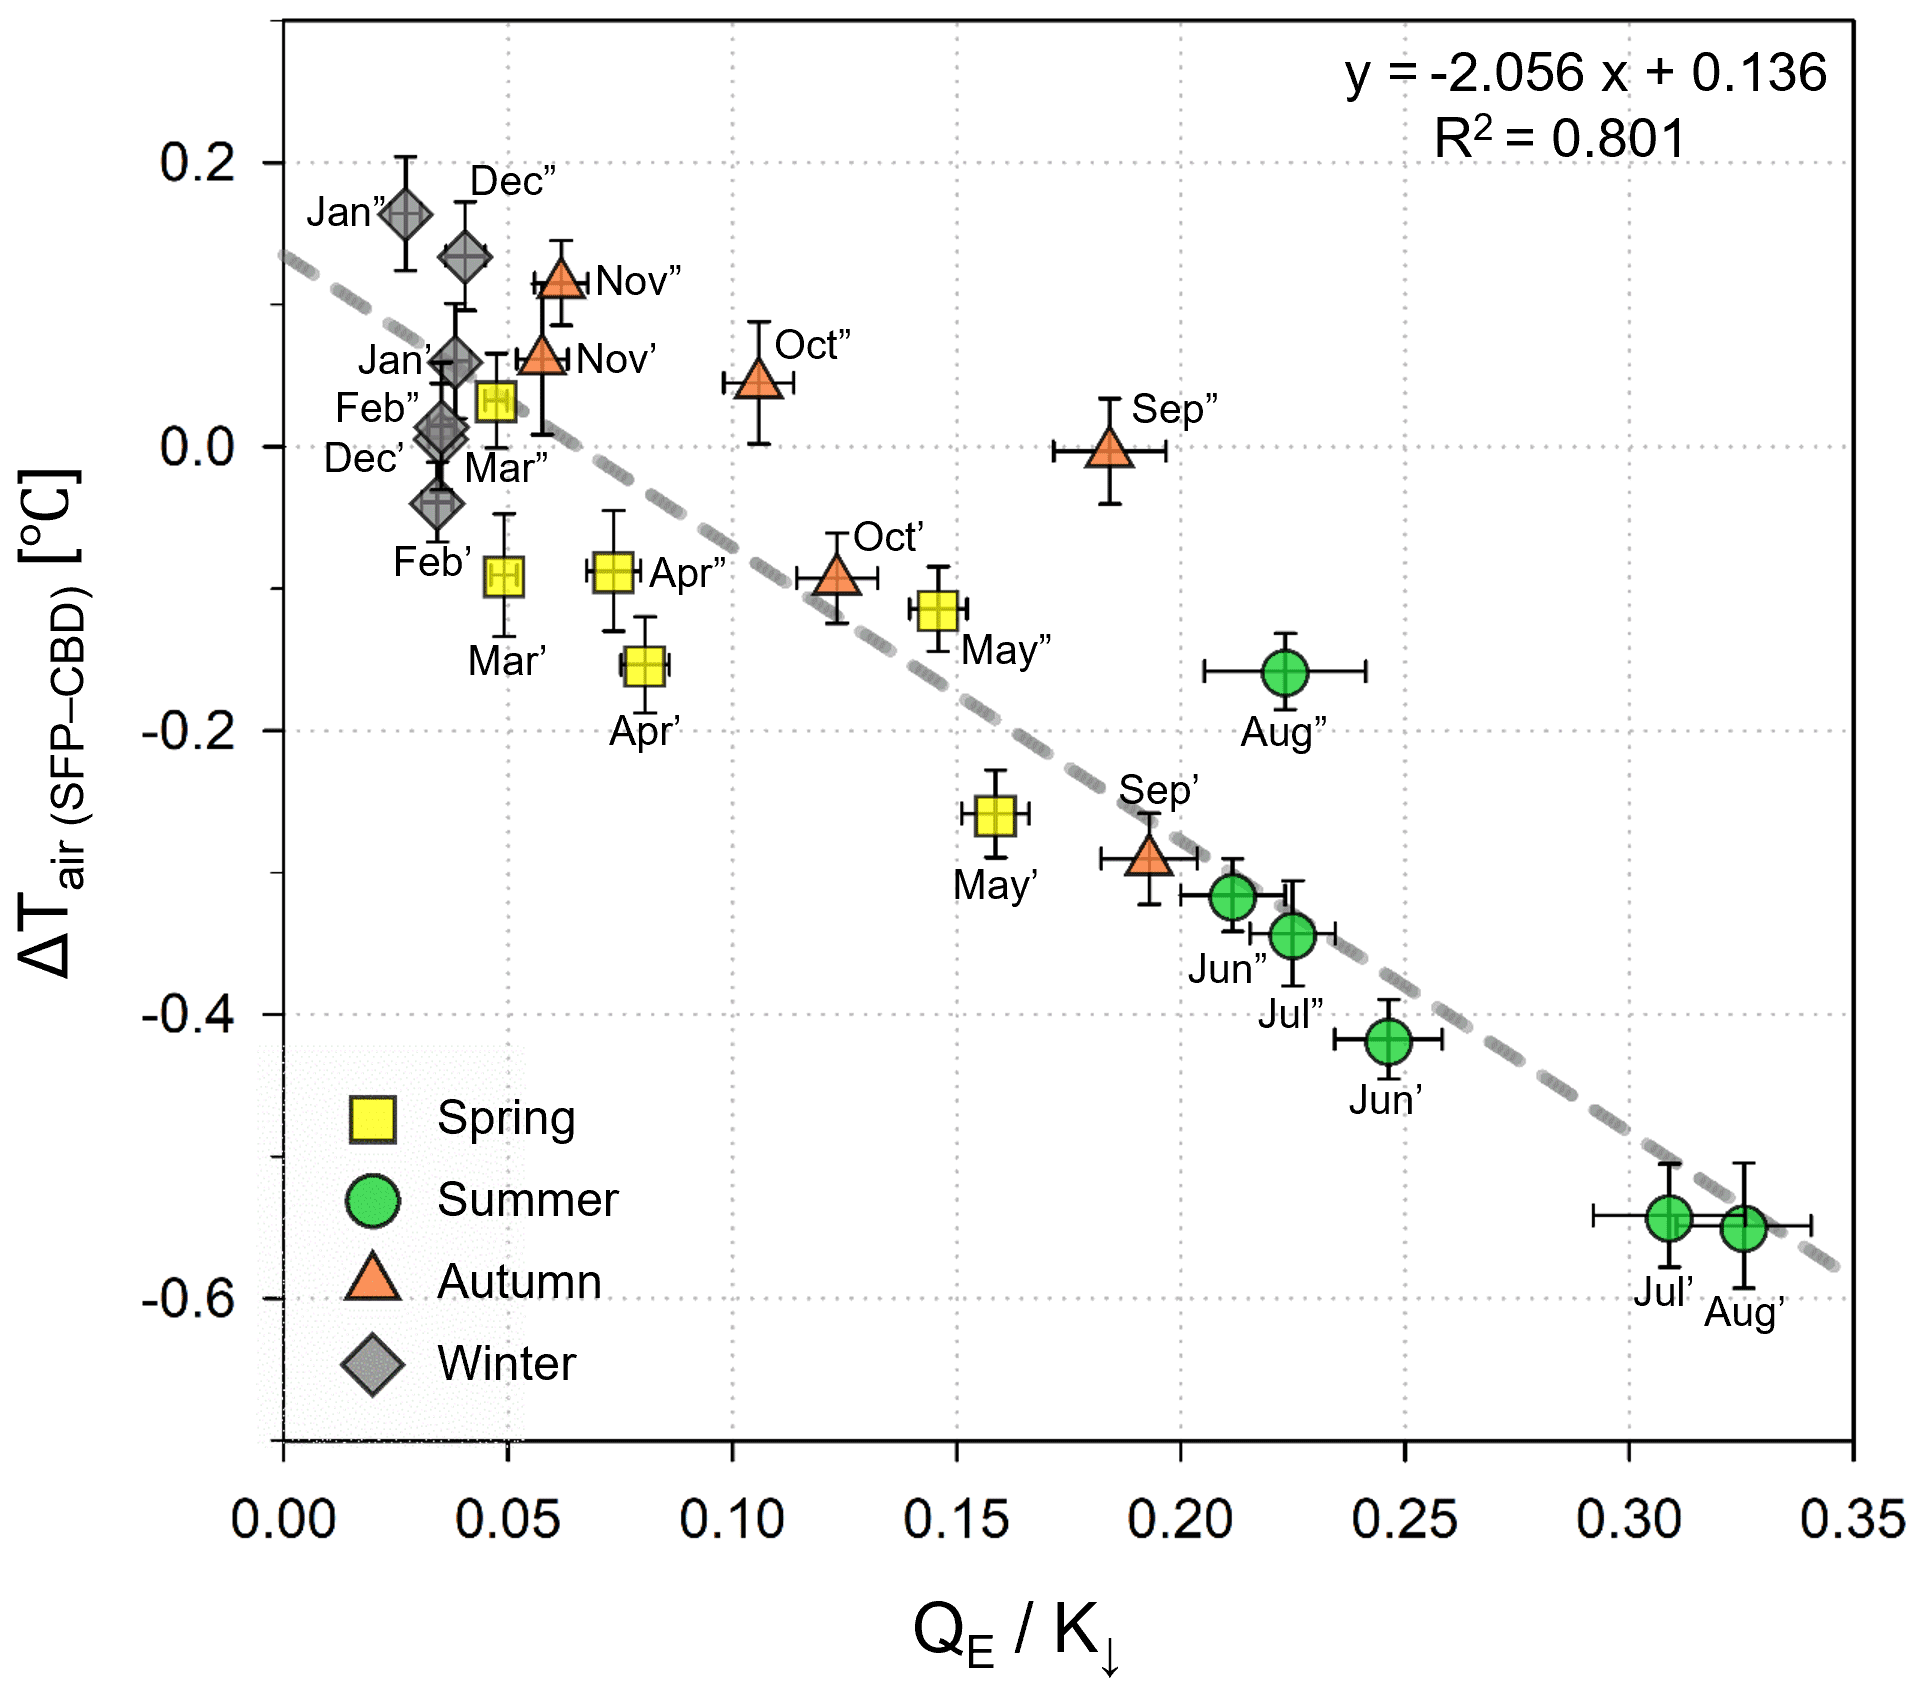
Figure 8Relationship between the ratio of monthly QE to K↓ and mean air temperature difference between SFP and CBD during the daytime (K↓ > 120 W m−2) for 2 years. The quotation and double-quotation marks on the scatter indicate the first and second year of the observation period, respectively. The error bars represent standard errors based on daily values, and the gray dotted line is calculated using linear regression model considering errors in both axes (York et al., 2004).
3.3 Temporal dynamics of net CO2 exchange
Overall, the mean daytime FC is negative (i.e., carbon uptake) in the summer (June–August), indicating that photosynthesis, the only carbon sink, is dominant in the growing season (Fig. 9). This carbon uptake period is coincident with the active vegetation manifested by increases in EVI (not shown here). Summertime photosynthetic carbon uptake (GPP) has a daily average of 7.6 µmol m−2 s−1 with a maximum of 18.9 µmol m−2 s−1 around 12:30 KST (Figs. 9 and 10). A daily minimum FC also occurs around 12:30 KST with the maximum photosynthetic carbon uptake during this time. CO2 uptake is highest in June, with a maximum of approximately 13 µmol m−2 s−1 (Fig. 9a). In the middle of summer (2-week data from the 4th and 31st in Fig. 9a), CO2 uptake decreases significantly because photosynthesis is limited because of the reduced K↓ by cloud and rainfall with the onset of the summer monsoon (Fig. 2c). This mid-summer depression of carbon uptake has been reported in the Asian natural vegetation (e.g., Kwon et al., 2009; Hong and Kim, 2011; Hong et al., 2014). Greater reduction in CO2 uptake observed in 2013 than in 2014 was attributed to a longer monsoon period in 2013. Indeed, from 8 to 21 July 2013 (2-week data from the 4th in Fig. 9a), the accumulated precipitation was approximately 400 mm for 2 weeks, and the daily averaged K↓ was only 70 W m−2.
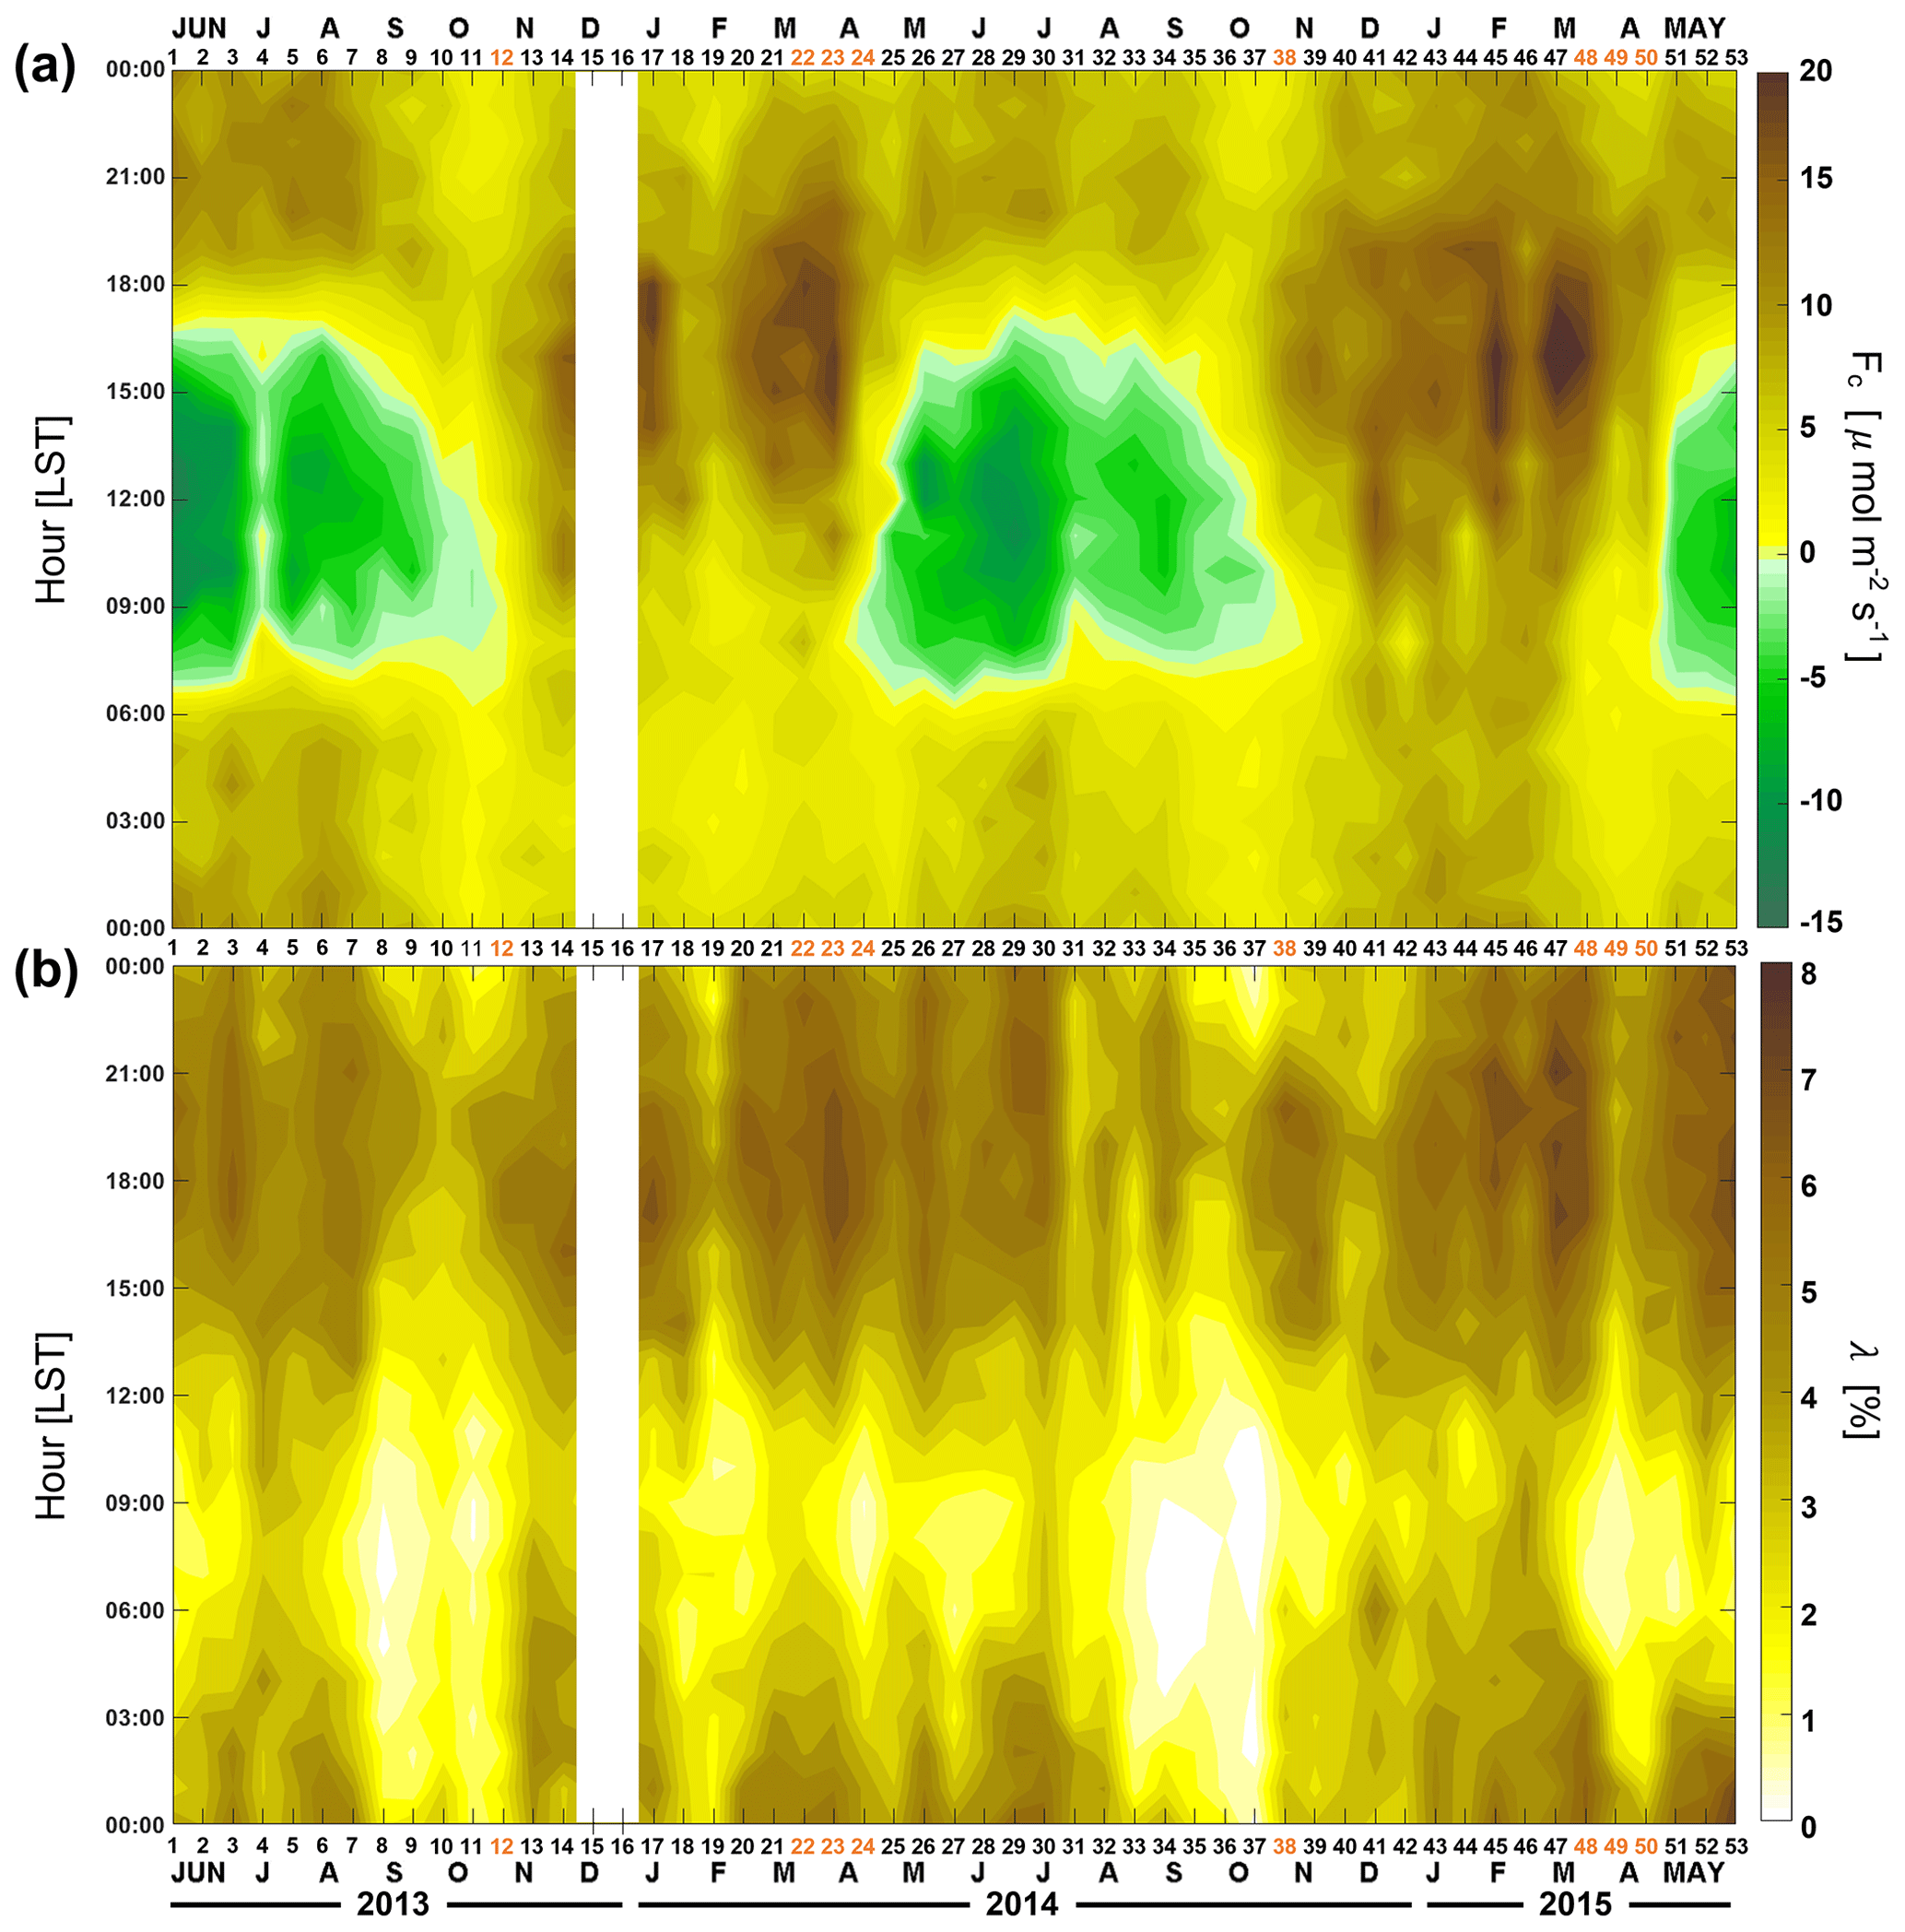
Figure 9(a) Temporal variation of hourly averaged FC and (b) footprint-weighted road fraction (λ) as every 2-week average (x axis: the date; y axis: time of day). In December 2013, there was a gap for approximately 4 weeks due to the power system failure. The yellow numbers in the x axis indicate the transition period when traffic emissions (ER) contribute to the observed FC significantly.

Figure 10Monthly boxplots of daytime (K↓ > 120 W m−2) FC by wind direction. Boxes have a minimum of 20 samples. Box limits are upper and lower quartiles, and whiskers are distances of 1.5 times the interquartile range from each quartile. Median and mean values are indicated by the black and pink horizontal lines. The average source-area-weighted road fractions (λ) are shown below the graph, and wind sectors with λ greater than 1 % are shaded in gray.
The vegetation around the SFP absorbs more CO2 than is emitted by local carbon sources, and FC is negative only during the summer daytime. Because of substantial amounts of anthropogenic emissions and ecosystem respiration, FC changes from negative (i.e., carbon sink) to positive values (i.e., carbon source) even around 16:30 KST in summer unlike in natural ecosystems, despite the substantial downward shortwave radiation (e.g., Desai et al., 2008; Hong et al., 2009; Alekseychik et al., 2017; Chatterjee et al., 2020). As photosynthesis decreases, FC changes to positive values from November. During the non-growing season (i.e., late autumn, winter, and early spring), anthropogenic emissions were also dominant because photosynthesis and ecosystem respiration decrease with smaller K↓ and lower temperatures. During these periods, FC had minimum values at 04:00–05:00 KST and increases until 15:00–16:00 KST. The diurnal variations in FC mainly followed the traffic volume. There also is a clear positive relationship between FC and λ (Fig. 4 in Lee et al., 2021a). It is also noteworthy that the peak time of FC (16:00 KST) is earlier than the peak time of λ (18:00 KST) from December to early March because EB is the largest at around 15:00–16:00 KST, indicating that ER and EB are the controlling factor of FC in this period.
The seasonal FC variation also depends on the spatiotemporal distribution of CO2 sources and flux footprint because the latter covers various land use with changes in wind direction and atmospheric stability (Fig. 10). In autumn, the main wind direction changes to the north as the synoptic conditions change as discussed in Sect. 2 (Fig. 3); therefore, λ is smaller in autumn compared to other seasons (Fig. 9b). For example, the road fraction is smallest at < 1 % from midnight to midday and < 3 % during the afternoon in October and November (2-week data from the 11th, 12th, 36th, and 37th in Fig. 9b). In these periods, the nighttime FC shows the lowest value of approximately 2.9 µmol m−2 s−1, which is attributable to the smallest road fraction, lower respiration, and minimal heating usage.
In early spring, λ is generally larger; thus, ER plays a significant role in FC, and EB remains non-zero until early April because of anthropogenic emission by hot water and space heating in the building within the footprint, thereby resulting in the largest FC in this period. With a shutdown of the heating system (i.e., zero EB) and the sprouting of leaves in April, there is a sharp decrease in FC (Fig. 10b). From December to March, CO2 emissions increase up to 30 µmol m−2 s−1 with larger variability because of intermittent anthropogenic emissions from the park facility building in the southwest directions (due to space heating and boiling water), as well as the relatively increased contribution of vehicles on the road in the western part of the site (Fig. 10b).
Although the positive FC in the winter decreases in spring, its magnitude shows directional differences (Fig. 10b). On the eastern side, the mean FC shows a negative value in May, whereas it remains positive on the western side (210–270∘) until May. These findings further indicate the different contributions of various carbon sources and sinks among the different wind directions. For the wind directions from the north to the east (0–120∘), FC shows a relatively weaker carbon sink than other directions because of the relatively low tree fraction in this direction (Fig. 10). On the southern side (150–180∘) having the highest tree cover fraction, a maximum carbon uptake is about 15 µmol m−2 s−1 in June. However, despite the dense vegetation on the south and west side (120–330∘), the FC magnitude was much smaller than that of other natural forests. This is related to the anthropogenic emissions from vehicles on the roads, which is discussed in Sect. 3.5.
3.4 Light use efficiency of biogenic CO2 components
FC at the SFP shows a typical light response to the photosynthetically active radiation (PAR) in a way similar to natural ecosystems in spite of anthropogenic CO2 sources from vehicles (Fig. 11). However, this light response in the urban forest is a distinct contrast to FC in high-rise, high-population residential areas in Seoul under the same climatic conditions that does not respond to PAR (i.e., EP station). Importantly, GPP, NBE, and FC show different trends with PAR depending on the direction. As stated in Sects. 2.2.1 and 3.3, the western side has a higher density of trees as against more grass on the eastern side, and biotic CO2 uptake from the western side is substantially larger than that on the eastern side. Accordingly, the slope of the light-response curve for PAR on the western side is steeper than on the eastern side. FC at zero PAR (FC_0) is larger on the western side (9.7 µmol m−2 s−1) than on the eastern side (5.1 µmol m−2 s−1) because of a contribution of ER from roads on the western side of the tower.
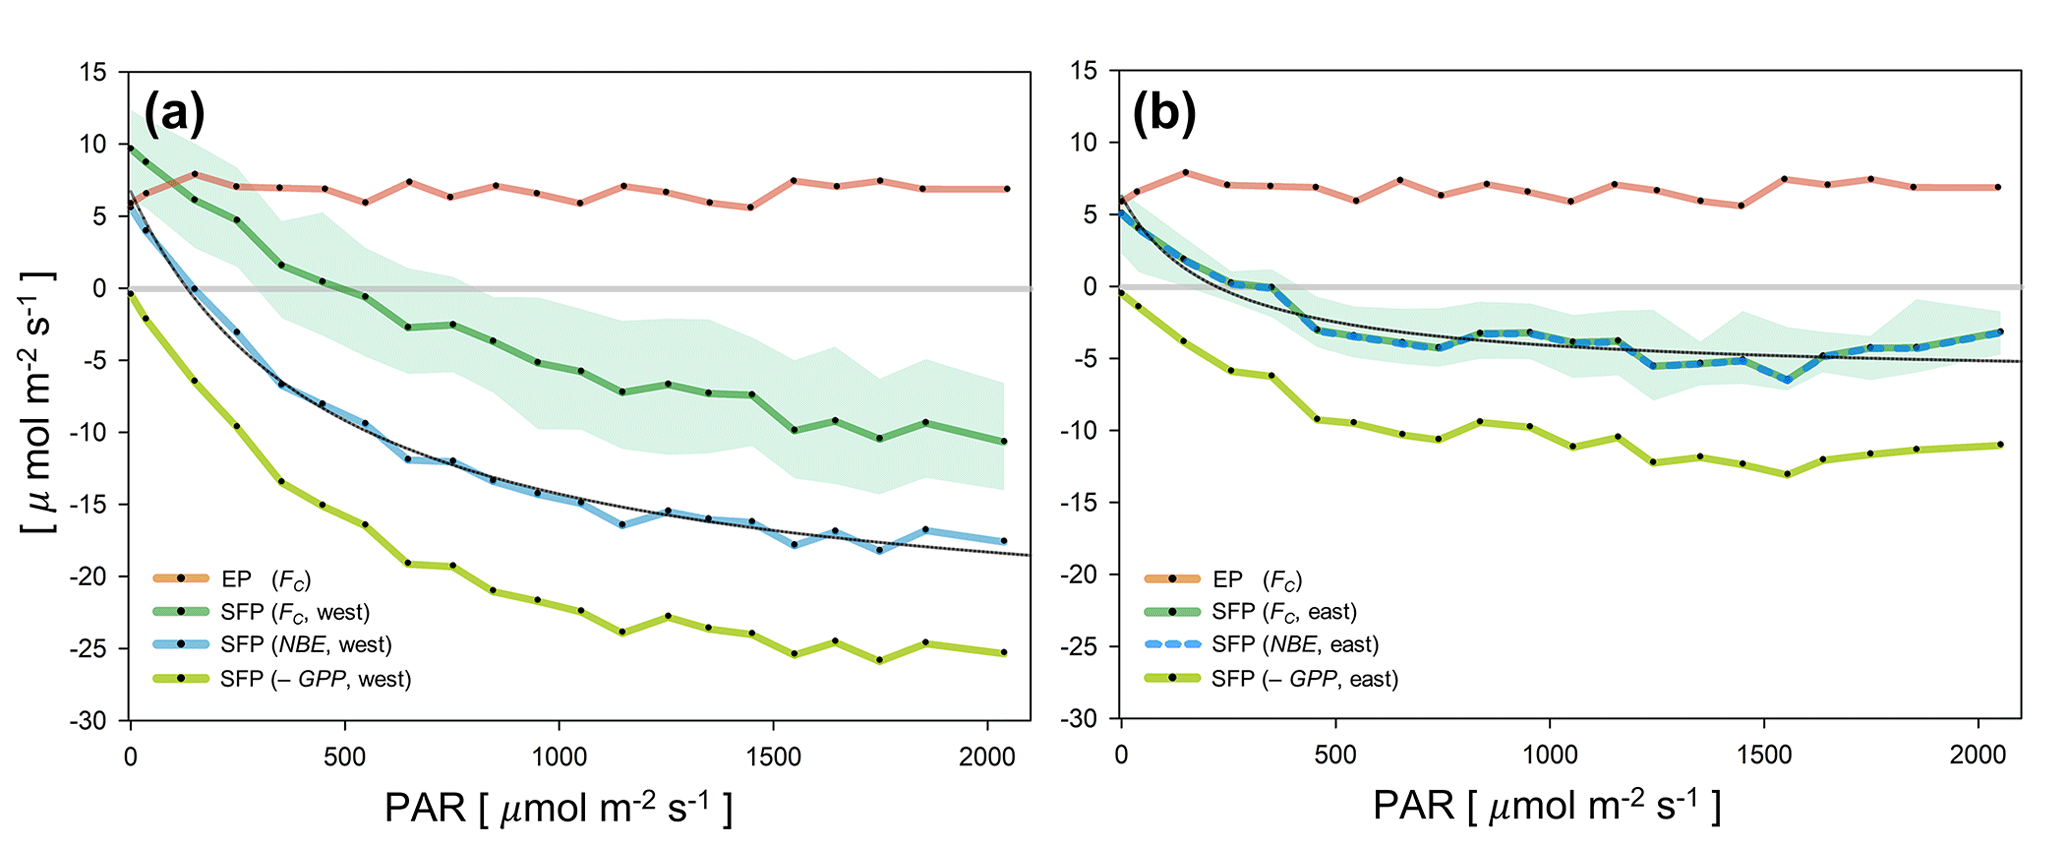
Figure 11During the growing season (June–August 2013, 2014) when EB is negligible, light-response curves as a function of photosynthetically active radiation (PAR, in bins of 100 µmol m−2 s−1): (a) for the western sectors (150∘ < Φ < 300∘) and (b) for the eastern sectors (30∘ < Φ < 90∘). Black line is a rectangular hyperbolic equation fitting net biome exchange (NBE = RE − GPP ) to PAR, and EP (brown line) is a light-response curve for the high-rise, high-population residential area in Seoul. The shaded areas indicate interquartile range.
NBE shows a comparable light response to natural vegetation (e.g., Schmid et al., 2003). A rectangular hyperbolic equation has been used to examine the light response of NBE and elucidate the directional differences in carbon uptake:
α is approximately 0.0651 and 0.0558 µmol CO2 (µmol photon)−1 on the western and eastern sides, respectively. Notably, α on the western side is comparable to the high initial quantum yield in crops and subtropical forests in East Asia (Hong et al., 2019b; Emmel et al., 2020). Additionally, GPPsat is 30.9 and 12.7 µmol m−2 s−1 on the western and eastern sides, respectively. In addition, the light saturation points are at a PAR of 1500 µmol m−2 s−1 on the eastern side, which occur at a relatively lower PAR than on the western side. Daytime respiration estimates from Eq. (3) are 6.7 and 6.3 µmol m−2 s−1 on the western and eastern sides, respectively. Because GPP is related to PAR, the difference in monthly cumulative GPP between the 2 years shows a close relationship with the difference in the monthly sunshine duration (r2=0.75, not shown here), suggesting a possible impact of change in the onset of the summer monsoon on urban forests.
The magnitude of NBE from the western side is larger than that from a suburban area with about 50 % vegetative fraction in Montreal, Canada (Fig. 7b in Bergeron and Strachan, 2011), and FC from a highly vegetated environment of about 67 % vegetative fraction in Baltimore, USA (Crawford et al., 2011). Also, GPP from the western side is comparable to the dense forest canopies in subtropical forests in Korea (Hong et al., 2019b), deciduous forest ecosystems (Goulden et al., 1996), and a mixed hardwood forest ecosystem (Schmid et al., 2000). However, NBE from the eastern side is similar to FC from the suburban areas of about 44 %, 50 %, and 64 % vegetative fraction in Swindon, UK (Ward et al., 2013); Montreal, Canada (Bergeron and Strachan, 2011); and Ochang, Korea, in the same climate zone (Hong et al., 2019b), respectively.
3.5 Annual budget of CO2 sources and sink
The annual sums of the GPP and RE in the SFP are 4.6 kg CO2 m−2 yr−1 (1244 g C m−2 yr−1) and 5.1 kg CO2 m−2 yr−1 (1378 g C m−2 yr−1), respectively (Table 4). This photosynthetic carbon uptake is smaller than its global mean GPP in natural deciduous broadleaf forests with similar annual precipitation and annual mean air temperature (total 8 years of data from four sites of the FLUXNET2015 dataset reported in Pastorello et al., 2020) and similar to that of deciduous broadleaf forests in East Asia (Awal et al., 2010; Kwon et al., 2009) (Table 5). However, we note that this GPP is relatively larger if we consider the low vegetation fraction and leaf area index (LAI) at our urban park. Previous studies have shown that the GPP of urban vegetation is scaled with vegetation cover fraction with an increase of about 0.7 kg CO2 m−2 yr−1 per 10 % increase in vegetation cover fraction (Awal et al., 2010; Crawford and Christen, 2015; Velasco et al., 2016; Menzer and McFadden, 2017). Indeed, GPP at the SFP with a 46.6 % vegetation cover fraction is approximately 1.5 kg CO2 m−2 yr−1, which is larger than values reported in other urban sites if it is scaled with the vegetation cover fraction (Fig. 12a).
Table 4Gap-filled annual budgets for FC (observed by EC measurement) and its components, indicating ecosystem respiration (RE), photosynthetic uptake by vegetation (GPP), vehicle emissions (ER), and building emissions (EB). All fluxes are in kg CO2 m−2 yr−1.
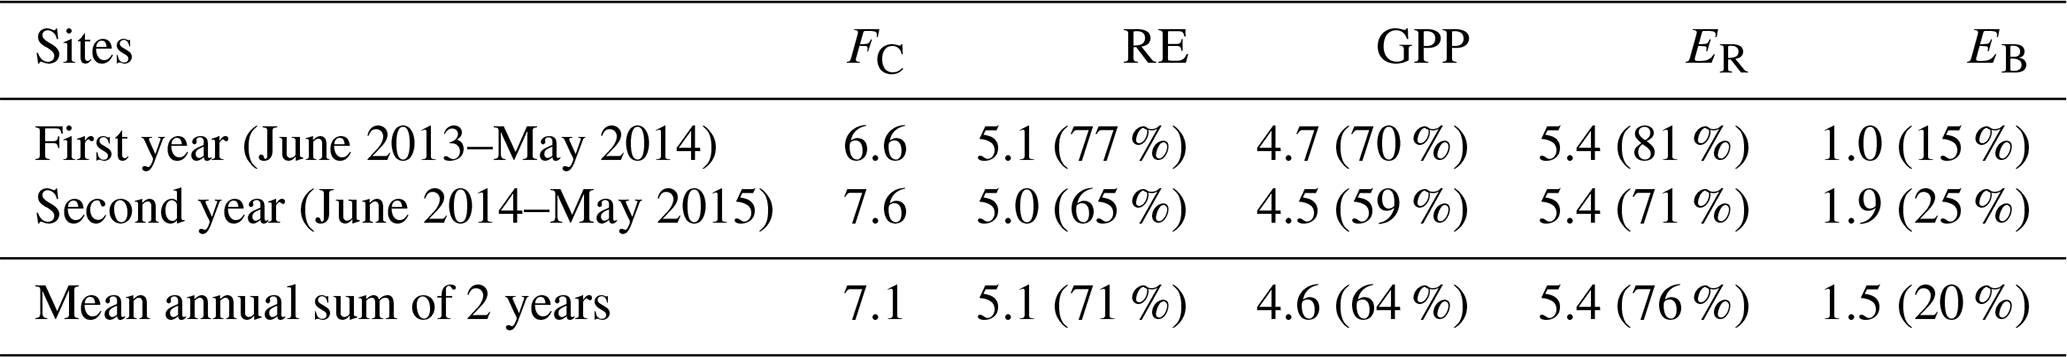
Table 5Annual budgets of biogenic FC components and ratios in deciduous broadleaf forests in similar climatic conditions reported in previous studies. All fluxes are in kg CO2 m−2 yr−1.
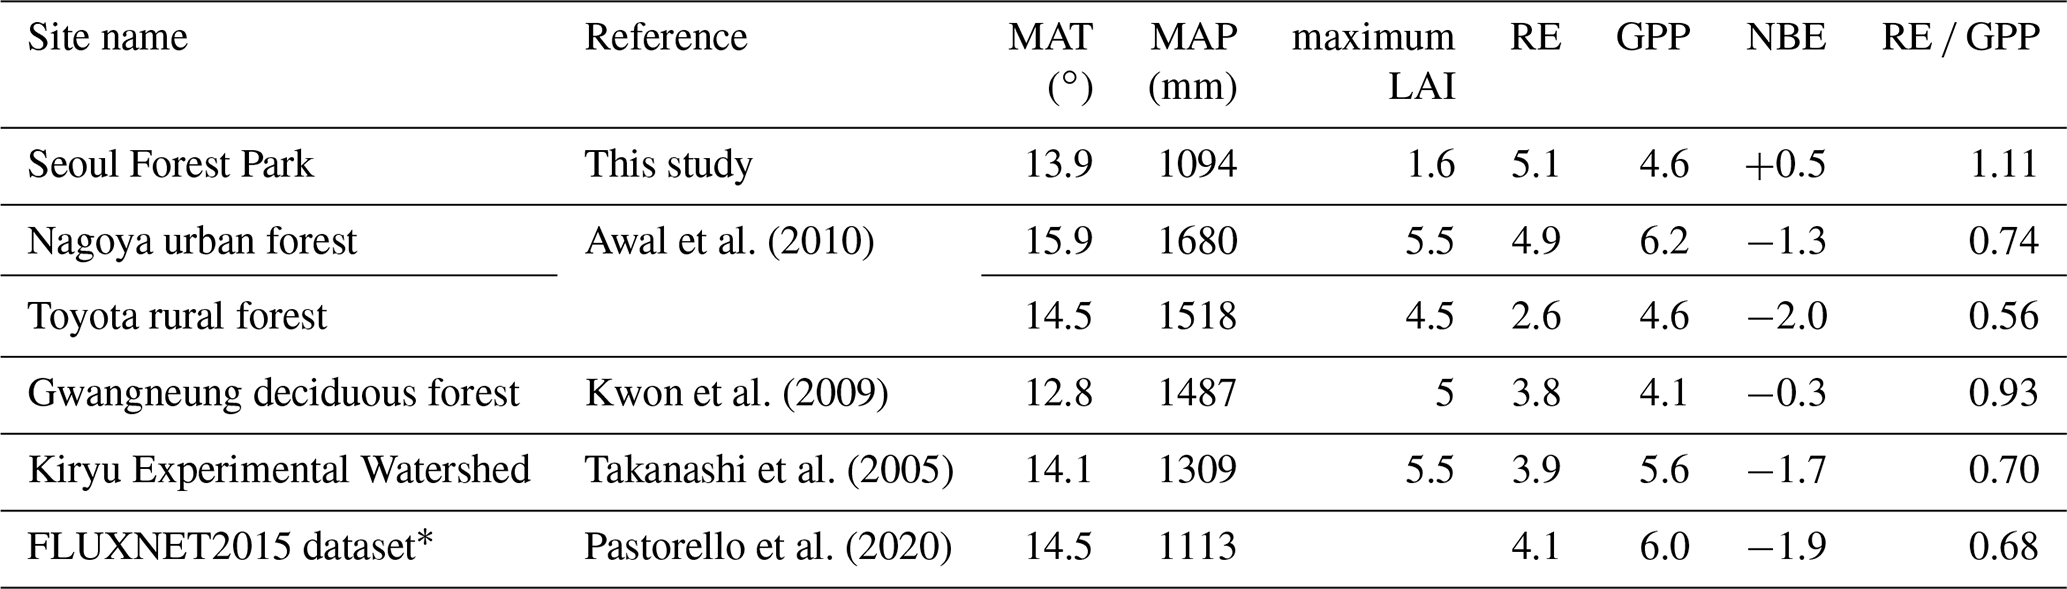
∗ Average value of 8-year data from four sites having mean annual temperature (MAT) of 12–16∘ and mean annual precipitation (MAP) of 900–2000 mm.
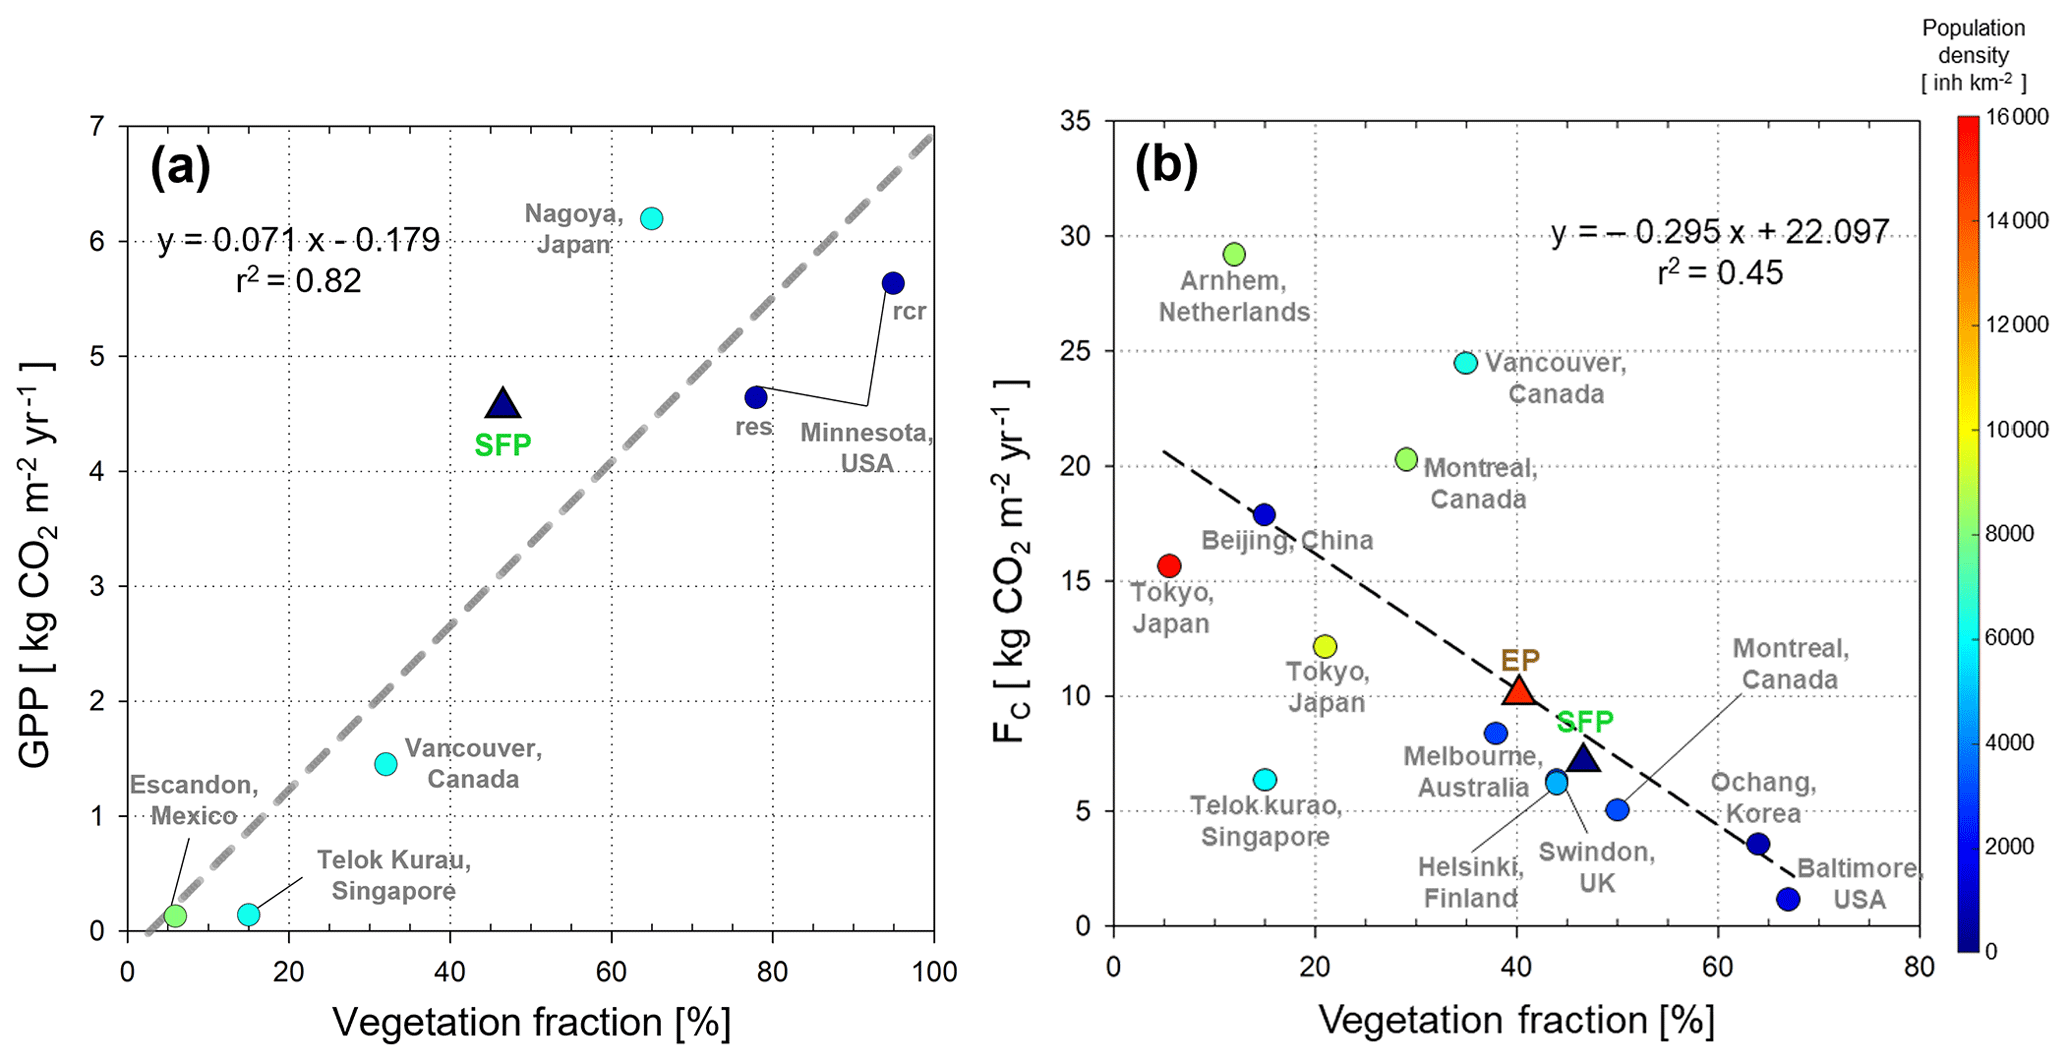
Figure 12Relationship between vegetation fraction (a) annual GPP and (b) annual FC in urban sites. Dashed line in panel (a) and (b) indicates a linear regression of GPP in urban sites from Awal et al. (2010), Crawford and Christen (2015), Velasco et al. (2016), and Menzer and McFadden (2017) as well as NEE from Hong et al. (2019b) and references therein scaled with vegetation fraction, respectively. See main texts for more information.
Despite this larger GPP resulting in smaller FC eventually, there is no substantial decrease in FC when they are scaled by vegetation fraction, suggesting large contribution of RE (Fig. 12b). There was a linear decrease in FC of approximately 3.0 kg CO2 m−2 yr−1 per 10 % increase in vegetation cover fraction based on the observed FC across an urbanization gradient (Hong et al., 2019b, and references therein). The annual FC in the SFP is not so much different from other similar cities and this scaled relationship. Meanwhile, RE at our site is much larger than that in natural temperate deciduous forests in the similar climate zone (Takanashi et al., 2005; Kwon et al., 2009) and similar to that in the urban forest in East Asia (Awal et al., 2010), as well as to the global mean RE over forests with similar annual precipitation and annual mean air temperatures (Pastorello et al., 2020). Put differently, the urban forest considered in our study is an outlier compared to other natural forest canopies and urban forests because RE GPP > 1 (Table 5). Autotrophic respiration is considered to be approximately half of GPP as a rule of thumb (Piao et al., 2010), which corresponds to approximately 45 % of the RE at our site, thereby indicating a large contribution of heterotrophic respiration to RE. Indeed, it was reported that soil respiration at the same site was approximately 4 kg CO2 m−2 yr−1 (Bae and Ryu, 2017). The reason for the large soil organic carbon was mainly because rice cultivation was carried out in this region before the 1950s, organic carbon-rich soil was transplanted during the SFP construction, and fertilizers were applied regularly. It has also been reported that RE is enhanced in urban areas because of the relatively warmer temperature in urban regions (i.e., UHI) (Awal et al., 2010). Notably, Q10 (the rate by which respiration is multiplied when temperature increases by 10 ∘C) is about 1.9 at the site and matches the Q10 value for ecosystem respiration (2.2 ± 0.7) calculated for natural forests across 42 FLUXNET sites (Mahecha et al., 2010). Further analysis based on the observed Q10 and the UHIi at the SFP indicates that UHI leads to an approximately 5 % increase in RE.

Figure 13Monthly sums for gap-filled FC (yellow bar) with RE (red bar), ER (blue bar), EB (gray bar), and −GPP (green bar).
Seasonal variations in the strength of carbon sources and sink as well as FC are mainly regulated by the biogenic component in summer and the anthropogenic component in winter (Fig. 13). Furthermore, FC is minimum in June, despite the similar GPP from June to August because of the relatively smaller RE during the summer season. Even in summer, photosynthetic carbon uptake is balanced with ecosystem respiration and does not offset all biotic and anthropogenic emissions, thus resulting in positive FC values throughout the year. In winter, EB is dominant, with negligible GPP and RE due to cold temperatures, and ER also becomes larger than RE from November. ER shows apparent seasonal variation in wind direction and atmospheric stability. Its magnitude is about 0.0666 µmol m−2 per vehicle half hour per second in neutral condition and consistent with the value in the inventory data (Lee et al., 2021a). The average monthly traffic speed for the road in front of the SFP is 50–60 km h−1 (based on the January 2014 data from the Seoul Metropolitan Government Traffic Speed Report), and the CO2 emission rate is approximately 0.15 kg CO2 km−1 per vehicle based on the emission data at this speed (Kim et al., 2011). With the width of the 10-lane road (25–30 m), the inventory-based slope (i.e., CO2 emission rate per vehicle per area per half hour) is approximately in the range of 0.0631–0.0757 µmol m−2 per vehicle half hour per second (≅ 150 g CO2 km−1 per vehicle or m mol g CO km m µmol mol half hour s−1).
There is an evident yearly difference in individual carbon sources and sink in 2 consecutive years. EB is mainly caused by heating buildings and hot water in park facilities using natural gas. Notably, EB is highly correlated with gas consumption in SFP during winter on a monthly basis (R2=0.94; Fig. 6 in Lee et al., 2021a). EB is smaller in the first year because of the relatively smaller number of park visitors and consequently smaller gas consumption, compared to the second year. Eventually, these annual differences lead to a smaller annual mean totalFC in the first year than in the second year (Table 4). RE is maximum in August of the first year, while it is highest in July in the second year because the monthly mean air temperature is highest in August of the first year and July of the second year, with annual variations in air temperature with changes in the timing and duration of the East Asian summer monsoon, of which impacts have also been reported in natural vegetation in the same region (Hong and Kim, 2011; Hong et al., 2019b). GPP in summer is relatively smaller in the first year due to the mid-summer depression of solar radiation because of the elongated monsoon period, but annual sums of GPP are similar in 2 years (Table 4 and Fig. 13). GPP does not shrink in the second year of significant drought because of ample water supply by a sprinkler. Eventually, FC in the SFP is approximately 3.0 kg CO2 m−2 yr−1 less than that in recently developed high-rise, high-population urban areas in Seoul. Our results suggest that efficient management of urban forests, such as regular irrigation and fertilization, can be an efficient way to adapt and mitigate climate change by increasing CO2 uptake in artificial forest constructions in East Asia.
This study reported 2-year surface fluxes of energy and CO2 measured by the eddy covariance method in order to examine the role of artificially generated urban forests in mitigating air temperature and anthropogenic CO2 emissions. The study area is an urban park with an artificially planted forest in the Seoul Metropolitan Area redeveloped from a racetrack and factory in the mid-2000s, where it is influenced by a lengthy summer rainy season during the East Asian summer monsoon. To examine the mitigation of air temperature, this study compares meteorological conditions in the urban forest with the surrounding high-rise, high-population urban areas. This study applies for the ANN-based gap filling (Hong et al., 2019b; Lee et al., 2021a) and a statistical CO2 flux partitioning method (Lee et al., 2021a) based on temporal subsets of flux data and high-resolution footprint-weighted land use data to understand the abiotic and biotic contributions to FC.
Surface energy fluxes in the SFP are influenced by the summer monsoon, and more energy is distributed to QE than QH in the summer in the growing season, similarly to natural forests in this climate zone. The Bowen ratio in this urban forest ranges from near 0 (summer) to about 4 (winter), which is lower throughout the year than that of high-rise and high-density residential areas in Seoul. This suggests that the vegetation and unpaved surfaces of urban forests facilitate more evaporative cooling compared to the impervious surfaces in urban areas. During the measurement period, the second year is contrasted with the first year because of the drought compared to the normal climate condition in the first year. Notably, ET decreases in the second year, but this drop is not as much as the reduced precipitation and its related changes in radiative forcing during the drought because of the artificial irrigation by a sprinkler-mitigated ecosystem.
It is also evident that the urban forest reduced the warming trend and UHIi around the study area. Air temperature in the SFP is lower than the surrounding area, but this coolness is reinforced after the park was created. The warming trend diminishes after the construction of the park and is smaller than that in other urban regions in the Seoul Metropolitan Area. In addition, the construction of the park delays the timing of the maximum temperature difference between the urban forest and high-rise commercial buildings from the morning to the afternoon, coinciding with the timing of the maximum QE. The SFP shows a typical diurnal UHIi variation pattern, which has a higher temperature at night than in rural areas. However, the UHIi in SFP is lower by 0.6 ∘C in summer compared to the surrounding urban area, and the time of the minimum peak time is delayed, possibly because vegetation and permeable soils in SFP have a larger thermal capacity. Notably, UHIi decreases more in the partitioning of incoming energy into latent heat fluxes, and there was cooling by 0.2 ∘C compared to the surrounding urban area if increased by 10 % in this study.
Net CO2 exchange at the urban forest shows typical temporal variations in natural forest canopies influenced by the East Asian summer monsoon. A mid-summer depression of carbon uptake is observed with the onset of the summer monsoon, like vegetation in the East Asian monsoon region. The GPP is estimated by the statistical partitioning method, and the non-zero GPP period is coincident with the active vegetation of the significant vegetation index. Summertime photosynthetic carbon uptake has a daily average of 7.6 µmol m−2 s−1 with a maximum of 18.9 µmol m−2 s−1 around 12:30 KST. However, even during the growing season, vegetative carbon uptake is insufficient to offset anthropogenic CO2 emissions and ecosystem respiration on a timescale of > 1 d. Our estimations of anthropogenic CO2 emissions from vehicles and buildings agree with the estimations based on inventory data such as CO2 emission rate of vehicles and monthly gas consumption, and their annual budgets each have a comparable magnitude to GPP.
Annual GPP of the urban forest is relatively smaller than that of the forest in East Asia exposed to similar climatic conditions because of the relatively smaller vegetation cover fraction and LAI. However, it is larger than the GPP expected from the relationship from previous urban studies if it is normalized by the vegetation cover fraction. RE is, however, much larger than that in the temperate East Asian forests and is similar to the urban forest in East Asia. We speculate that soil respiration enhances such large RE by relatively warmer temperatures in a city and rich soil organic carbon in the SFP. The annual mean total FC is 7.1 kg CO2 m−2 yr−1, which is smaller than the estimate from the scaling between annual total FC and vegetation fraction (Hong et al., 2019b). Because of the spatial heterogeneity, FC and its components showed directional changes. NBE from the eastern side is similar to that in suburban areas with approximately 44 %, 50 %, and 64 % vegetative fraction in Swindon, UK (Ward et al., 2013); Montreal, Canada (Bergeron and Strachan, 2011); and Ochang, Korea in the same climate zone (Hong et al., 2019b), respectively. However, the NBE and GPP from the western side are comparable to dense forest canopies in subtropical forests in Korea (Hong et al., 2019b), deciduous forest ecosystems (Goulden et al., 1996), and a mixed hardwood forest ecosystem (Schmid et al., 2000).
Our results emphasize the important role of forest management in enhancing carbon uptake and evaporative cooling despite the low vegetation fraction. Our key findings are that urban forests in East Asia are highly influenced by the East Asian monsoon like natural forests in this region, but such influence is mitigated by artificial irrigation and fertilization in urban forests. Our results emphasize the importance of forest management for efficient carbon uptake and evaporative cooling despite the low vegetation fraction. Furthermore, our observation study also indicates that caution in soil management is necessary to reduce CO2 emissions in urban forests, mainly resulting from large soil organic carbon and a warm environment.
| Abbreviation | Definitions |
| CBD | the Gangnam, Seocho, and Songpa observatories at central business district |
| EB | CO2 emission from buildings |
| EC | eddy covariance |
| EP | the Eunpyeong site |
| ER | CO2 emission from vehicles on roads |
| ET | evapotranspiration |
| EVI | enhanced vegetation index |
| FC | net CO2 exchange |
| FC_0 | FC at zero PAR |
| GP | the Gimpo weather station |
| GPP | gross primary production |
| GPPsat | potential rate of ecosystem CO2 uptake |
| K↓ | downward shortwave radiation |
| LCZ | local climate zone |
| MAP | mean annual precipitation |
| MAT | mean annual temperature |
| NBE | net biome exchange of CO2 (RE − GPP) |
| P | precipitation |
| PAR | photosynthetic active radiation |
| QE | latent heat flux |
| QF | anthropogenic heat flux |
| QH | sensible heat flux |
| Q∗ | net radiation |
| Q10 | the rate by which respiration is multiplied when temperature increases by 10∘ |
| RE | ecosystem respiration |
| SD | the Seongdong weather station |
| SEB | surface energy balance |
| SFP | the Seoul Forest Park |
| Tair | the screen-level air temperature |
| Tair_CBD | air temperature at the CBD regions |
| Tair_SD | air temperature at the SD |
| UHI | urban heat island |
| UHIi | urban heat island intensity |
| UHIiC | UHIi at CBD |
| UHIiS | UHIi at SFP |
| VPD | vapor pressure deficit |
| ΔTair | Tair_CBD−Tair_SD |
| ΔQS | the net storage heat flux |
| ΔQA | the net heat advection |
| hc | mean canopy height |
| z0 | mean roughness length |
| zd | zero-plane displacement height |
| zm | measurement height |
| α | quantum yield efficiency |
| β | Bowen ratio |
| λ | source-area-weighted road ratio |
| λv | vegetation cover fraction |
All data and codes are available in Lee et al. (2021b, https://doi.org/10.22647/EAPL-SFP_202101) and upon request to the corresponding author (jhong@yonsei.ac.kr, https://eapl.yonsei.ac.kr, last access: 4 December 2021).
KL, JWH, and JH contributed to the observation, experimental design, data analysis, and manuscript preparation. JK and SJ contributed to the writing and data interpretation.
The contact author has declared that neither they nor their co-authors have any competing interests.
Publisher’s note: Copernicus Publications remains neutral with regard to jurisdictional claims in published maps and institutional affiliations.
Our thanks go to the editor and reviewers for their constructive comments to improve our study.
This research has been supported by the Korea Meteorological Administration Research and Development Program (grant no. KMI2021-01610).
This paper was edited by Christoph Gerbig and reviewed by two anonymous referees.
Alekseychik, P., Mammarella, I., Karpov, D., Dengel, S., Terentieva, I., Sabrekov, A., Glagolev, M., and Lapshina, E.: Net ecosystem exchange and energy fluxes measured with the eddy covariance technique in a western Siberian bog, Atmos. Chem. Phys., 17, 9333–9345, https://doi.org/10.5194/acp-17-9333-2017, 2017.
Awal, M. A., Ohta, T., Matsumoto, K., Toba, T., Daikoku, K., Hattori, S., Hiyama, T., and Park, H.: Comparing the carbon sequestration capacity of temperate deciduous forests between urban and rural landscapes in central Japan, Urban For. Urban Gree., 9, 261–270, 2010.
Bae, J. and Ryu, Y.: Spatial and temporal variations in soil respiration among different land cover types under wet and dry years in an urban park, Landscape Urban Plan., 167, 378–385, 2017.
Ballinas, M. and Barradas, V. L.: The urban tree as a tool to mitigate the urban heat island in Mexico City: A simple phenomenological model, J. Environ. Qual., 45, 157–166, 2016.
Balogun, A. A., Adegoke, J. O., Vezhapparambu, S., Mauder, M., McFadden, J. P., and Gallo, K.: Surface energy balance measurements above an exurban residential neighbourhood of Kansas City, Missouri, Bound.-Lay. Meteorol., 133, 299–321, 2009.
Bergeron, O. and Strachan, I. B.: CO2 sources and sinks in urban and suburban areas of a northern mid-latitude city, Atmos. Environ., 45, 1564–1573, 2011.
Bonan, G. B.: Forests and climate change: forcings, feedbacks, and the climate benefits of forests, Science, 320, 1444–1449, 2008.
Bowler, D. E., Buyung-Ali, L., Knight, T. M., and Pullin, A. S.: Urban greening to cool towns and cities: A systematic review of the empirical evidence, Landscape Urban Plan., 97, 147–155, 2010.
Chang, C. R., Li, M. H., and Chang, S. D.: A preliminary study on the local cool-island intensity of Taipei city parks, Landscape Urban Plan., 80, 386–395, 2007.
Chatterjee, S., Swain, C. K., Nayak, A. K., Chatterjee, D., Bhattacharyya, P., Mahapatra, S. S., Debnath, M., Tripathi, R., Guru, P. K., and Dhal, B.: Partitioning of eddy covariance-measured net ecosystem exchange of CO2 in tropical lowland paddy, Paddy Water Environ., 18, 623–636, 2020.
Chiesura, A.: The role of urban parks for the sustainable city, Landscape Urban Plan., 68, 129–138, 2004.
Christen, A.: Atmospheric measurement techniques to quantify greenhouse gas emissions from cities, Urban Climate, 10, 241–260, 2014.
Christen, A. and Vogt, R.: Energy and radiation balance of a central European city, Int. J. Climatol., 24, 1395–1421, 2004.
Copernicus Service information: Copernicus Global Land Service Site, available at: https://land.copernicus.eu/global/, last access: 10 April 2020.
Coutts, A. M., Beringer, J., and Tapper, N. J.: Impact of increasing urban density on local climate: Spatial and temporal variations in the surface energy balance in Melbourne, Australia, J. Appl. Meteorol. Clim., 46, 477–493, 2007a.
Coutts, A. M., Beringer, J., and Tapper, N. J.: Characteristics influencing the variability of urban CO2 fluxes in Melbourne, Australia, Atmos. Environ., 41, 51–62, 2007b.
Crawford, B. and Christen, A.: Spatial source attribution of measured urban eddy covariance CO2 fluxes, Theor. Appl. Climatol., 119, 733–755, 2015.
Crawford, B., Grimmond, C. S. B., and Christen, A.: Five years of carbon dioxide fluxes measurements in a highly vegetated suburban area, Atmos. Environ., 45, 896–905, 2011.
Desai, A. R., Richardson, A. D., Moffat, A. M., Kattge, J., Hollinger, D. Y., Barr, A., Falge, E., Noormets, A., Papale, D., Reichstein, M., and Stauch, V. J.: Cross-site evaluation of eddy covariance GPP and RE decomposition techniques, Agr. Forest Meteorol., 148, 821–838, 2008.
Emmel, C., D'Odorico, P., Revill, A., Hörtnagl, L., Ammann, C., Buchmann, N., and Eugster, W.: Canopy photosynthesis of six major arable crops is enhanced under diffuse light due to canopy architecture, Glob. Change Biol., 26, 5164–5177, 2020.
Falge, E., Baldocchi, D., Olson, R., Anthoni, P., Aubinet, M., Bernhofer, C., Burba, G., Ceulemans, R., Clement, R., Dolman, H., Granier, A., Gross, P., Grünwald, T., Hollinger, D., Jensen, N., Katul, G., Keronen, P., Kwalski, A., Lai, C., Law, B., Meyers, T., Moncrieff, J., Moors, E., Munger, W., Pilegaard, K., Rannik, Ü., Rebmann, C., Suyker, A., Tenhunen, J., Tu, K., Verma, S., Vesala, T., Wilson, K., and Wofsy, S.: Gap filling strategies for long term energy flux data sets, Agr. Forest Meteorol., 107, 71–77, 2001.
Feigenwinter, C., Vogt, R., and Christen, A.: Eddy covariance measurements over urban areas, in: Eddy Covariance, Springer, Dordrecht, the Netherlands, 377–397, 2012.
Feyisa, G. L., Dons, K., and Meilby, H.: Efficiency of parks in mitigating urban heat island effect: An example from Addis Ababa, Landscape Urban Plan., 123, 87–95, 2014.
Goldbach, A. and Kuttler, W.: Quantification of turbulent heat fluxes for adaptation strategies within urban planning, Int. J. Climatol., 33, 143–159, 2013.
Goulden, M. L., Munger, J. W., Fan, S. M., Daube, B. C., and Wofsy, S. C.: Measurements of carbon sequestration by long-term eddy covariance: Methods and a critical evaluation of accuracy, Glob. Change Biol., 2, 169–182, 1996.
Grimmond, C. S. B. and Oke, T. R.: Comparison of heat fluxes from summertime observations in the suburbs of four North American cities, J. Appl. Meteorol., 34, 873–889, 1995.
Grimmond, C. S. B. and Oke, T. R.: Aerodynamic properties of urban areas derived from analysis of surface form, J. Appl. Meteorol. Clim., 38, 1262–1292, 1999.
Haaland, C. and van Den Bosch, C. K.: Challenges and strategies for urban green-space planning in cities undergoing densification: A review, Urban For. Urban Gree., 14, 760–771, 2015.
Hamada, S. and Ohta, T.: Seasonal variations in the cooling effect of urban green areas on surrounding urban areas, Urban For. Urban Gree., 9, 15–24, 2010.
Hiller, R. V., McFadden, J. P., and Kljun, N.: Interpreting CO2 fluxes over a suburban lawn: the influence of traffic emissions, Bound.-Lay. Meteorol., 138, 215–230, 2011.
Hong, J. and Kim, J.: Impact of the Asian monsoon climate on ecosystem carbon and water exchanges: a wavelet analysis and its ecosystem modeling implications, Glob. Change Biol., 17, 1900–1916, 2011.
Hong, J., Kwon, H., Lim, J., Byun, Y., Lee, J., and Kim, J.: Standardization of KoFlux eddy-covariance data processing, Korean J. Agric. For. Meteorol., 11, 19–26, 2009.
Hong, J., Takagi, K., Ohta, T., and Kodama, Y.: Wet surface resistance of forest canopy in monsoon Asia: Implications for eddy-covariance measurement of evapotranspiration, Hydrol. Process., 28, 37–42, 2014.
Hong, J. W. and Hong, J.: Changes in the Seoul metropolitan area urban heat environment with residential redevelopment, J. Appl. Meteorol. Clim., 55, 1091–1106, 2016.
Hong, J. W., Hong, J., Lee, S. E., and Lee, J.: Spatial distribution of urban heat island based on local climate zone of automatic weather station in Seoul metropolitan area, Atmosphere, 23, 413–424, 2013.
Hong, J. W., Hong, J., Kwon, E. E., and Yoon, D.: Temporal dynamics of urban heat island correlated with the socio-economic development over the past half-century in Seoul, Korea, Environ. Pollut., 254, 112934, https://doi.org/10.1016/j.envpol.2019.07.102, 2019a.
Hong, J.-W., Hong, J. Chun, J., Lee, Y., Chang, L., Lee, J., Yi, K., Park, Y., Byun, B., and Joo, S.: Comparative assessment of net CO2 exchange across an urbanization gradient in Korea based on in situ observation, Carbon Balance and Management, 14, 13, https://doi.org/10.1186/s13021-019-0128-6, 2019b.
Hong, J. W., Lee, S. D., Lee, K., and Hong, J.: Seasonal variations in the surface energy and CO2 flux over a high-rise, high-population, residential urban area in the East Asian monsoon region, Int. J. Climatol., 40, 4384–4407, https://doi.org/10.1002/joc.6463, 2020.
Hsieh, C. I., Katul, G., and Chi, T. W.: An approximate analytical model for footprint estimation of scalar fluxes in thermally stratified atmospheric flows, Adv. Water Resour., 23, 765–772, 2000.
Kanda, M., Inagaki, A., Miyamoto, T., Gryschka, M., and Raasch, S.: A new aerodynamic parametrization for real urban surfaces, Bound.-Lay. Meteorol., 148, 357–377, 2013.
Kennedy, C. A., Ibrahim, N., and Hoornweg, D.: Low-carbon infrastructure strategies for cities, Nat. Clim. Change, 4, 343–346, 2014.
Kent, C. W., Grimmond, S., and Gatey, D.: Aerodynamic roughness parameters in cities: Inclusion of vegetation, J. Wind Eng. Ind. Aerod., 169, 168–176, 2017.
Kent, C. W., Lee, K., Ward, H. C., Hong, J. W., Hong, J., Gatey, D., and Grimmond, S.: Aerodynamic roughness variation with vegetation: analysis in a suburban neighbourhood and a city park, Urban Ecosyst., 21, 227–243, 2018.
Khatun, R., Ohta, T., Kotani, A., Asanuma, J., Gamo, M., Han, S., Hirano, T., Nakai, Y., Saigusa, N., Takagi, K., and Wang, H.: Spatial variations in evapotranspiration over East Asian forest sites. I. Evapotranspiration and decoupling coefficient, Hydrological Research Letters, 5, 83–87, 2011.
Kim, Y., Woo, S. K., Park, S., Kim, M., and Han, D.: A Study on Evaluation Methodology of Greenhouse Gas and Air Pollutant Emissions on Road Network – Focusing on Evaluation Methodology of CO2 and NOx Emissions from Road. Korea: The Korea Transport Institute, Annual Report, Sejong, Korea, https://doi.org/10.23000/TRKO201300014649, 2011.
Kirschbaum, M. U. F., Eamus, D., Gifford, R. M., Roxburgh, S. H., and Sands, P. J.: Definitions of some ecological terms commonly used in carbon accounting, in: Proceedings Net Ecosystem Exchange CRC Workshop, 18–20 April 2001, Canberra, Australia, 2–5, 2001.
Kordowski, K. and Kuttler, W.: Carbon dioxide fluxes over an urban park area, Atmos. Environ., 44, 2722–2730, 2010.
Kroeger, T., McDonald, R. I., Boucher, T., Zhang, P., and Wang, L.: Where the people are: Current trends and future potential targeted investments in urban trees for PM10 and temperature mitigation in 27 US cities, Landscape Urban Plan., 177, 227–240, 2018.
Kwon, H., Park, T. Y., Hong, J., Lim, J. H., and Kim, J.: Seasonality of Net Ecosystem Carbon Exchange in Two Major Plant Functional Types in Korea, Asia-Pac. J. Atmos. Sci., 45, 149–163, 2009.
Lee, K.: Energy, water and CO2 exchanges in an artificially constructed urban forest, Master Degree Dissertation, Yonsei University, Seoul, Korea, 2015.
Lee, K., Hong, J. W., Kim, J., and Hong, J.: Partitioning of net CO2 exchanges at the city-atmosphere interface into biotic and abiotic components, MethodsX, 8, 101231, https://doi.org/10.1016/j.mex.2021.101231, 2021a.
Lee, K., Hong, J. W., Kim, J., and Hong, J.: CO2 flux partitioning program and example data over the urban forest, Yonsei University [data set], https://doi.org/10.22647/EAPL-SFP_202101, 2021b.
Lietzke, B., Vogt, R., Feigenwinter, C., and Parlow, E.: On the controlling factors for the variability of carbon dioxide flux in a heterogeneous urban environment, Int. J. Climatol., 35, 3921–3941, 2015.
Macdonald, R. W., Griffiths, R. F., and Hall, D. J.: An improved method for the estimation of surface roughness of obstacle arrays, Atmos. Environ., 32, 1857–1864, 1998.
Mahecha, M. D., Reichstein, M., Carvalhais, N., Lasslop, G., Lange, H., Seneviratne, S. I., Vargas, R., Ammann, C., Arain, M. A., Cescatti, A., Janssens, I., Migliavacca, M., Montagnani, L., and Richardson, A.: Global convergence in the temperature sensitivity of respiration at ecosystem level, Science, 329, 838–840, 2010.
McCarthy, M. P., Best, M. J., and Betts, R. A.: Climate change in cities due to global warming and urban effects, Geophys. Res. Lett., 37, L09705, https://doi.org/10.1029/2010GL042845, 2010.
Menzer, O. and McFadden, J. P.: Statistical partitioning of a three-year time series of direct urban net CO2 flux measurements into biogenic and anthropogenic components, Atmos. Environ., 170, 319–333, 2017.
Moriwaki, R. and Kanda, M.: Seasonal and diurnal fluxes of radiation, heat, water vapor, and carbon dioxide over a suburban area, J. Appl. Meteorol., 43, 1700–1710, 2004.
Munger, J. W., Loescher, H. W., and Luo, H.: Measurement, tower, and site design considerations, in: Eddy Covariance, Springer, Dordrecht, the Netherlands, 21–58, 2012.
Norton, B. A., Coutts, A. M., Livesley, S. J., Harris, R. J., Hunter, A. M., and Williams, N. S.: Planning for cooler cities: A framework to prioritise green infrastructure to mitigate high temperatures in urban landscapes, Landscape Urban Plan., 134, 127–138, 2015.
Nowak, D. J.: Atmospheric carbon reduction by urban trees, J. Environ. Manage., 37, 207–217, 1993.
Nowak, D. J., Crane, D. E., Stevens, J. C., Hoehn, R. E., Walton, J. T., and Bond, J.: A ground-based method of assessing urban forest structure and ecosystem services, Aboriculture and Urban Forestry, 34, 347–358, 2008.
Oke, T. R.: The energetic basis of the urban heat island, Q. J. Roy. Meteor. Soc., 108, 1–24, 1982.
Oke, T. R.: The micrometeorology of the urban forest, Philos. T. Roy. Soc. B, 324, 335–349, 1989.
Oke, T. R., Johnson, G. T., Steyn, D. G., and Watson, I. D.: Simulation of surface urban heat islands under “ideal” conditions at night part 2: Diagnosis of causation, Bound.-Lay. Meteorol., 56, 339–358, 1991.
Oke, T. R., Mills, G., Christen, A., and Voogt, J. A.: Urban Climates, Cambridge University Press, Cambridge, UK, 2017.
Pastorello, G., Trotta, C., Canfora, E., Chu, H., Christianson, D., Cheah, Y. W., Poindexter, C., Chen, J., Elbashandy, A., Humphrey, M., Isaac, P., Polidori, D., Ribeca, A., van Ingen, C., Zhang, L., Amiro, B., Ammann, C., Arain, M. A., Ardö, J., Arkebauer, T., Arndt, S. K., Arriga, N., Aubinet, M., Aurela, M., Baldocchi, D., Barr, A., Beamesderfer, E., Marchesini, L. B., Bergeron, O., Beringer, J., Bernhofer, C., Berveiller, D., Billesbach, D., Black, T. A., Blanken, P. D., Bohrer, G., Boike, J., Bolstad, P. V., Bonal, D., Bonnefond, J.-M., Bowling, D. R., Bracho, R., Brodeur, J., Brümmer, C., Buchmann, N., Burban, B., Burns, S. P., Buysse, P., Cale, P., Cavagna, M., Cellier, P., Chen, S., Chini, I., Christensen, T. R., Cleverly, J., Collalti, A., Consalvo, C., Cook, B. D., Cook, D., Coursolle, C., Cremonese, E., Curtis, P. S., D'Andrea, E., da Rocha, H., Dai, X., Davis, K. J., De Cinti, B., de Grandcourt, A., De Ligne, A., De Oliveira, R. C., Delpierre, N., Desai, A. R., Di Bella, C. M., di Tommasi, P., Dolman, H., Domingo, F., Dong, G., Dore, S., Duce, P., Dufrêne, E., Dunn, A., Dušek, J., Eamus, D., Eichelmann, U., ElKhidir, H. A. M., Eugster, W., Ewenz, C. M., Ewers, B., Famulari, D., Fares, S., Feigenwinter, I., Feitz, A., Fensholt, R., Filippa, G., Fischer, M., Frank, J., Galvagno, M., Gharun, M., Gianelle, D., Gielen, B., Gioli, B., Gitelson, A., Goded, I., Goeckede, M., Goldstein, A. H., Gough, C. M., Goulden, M. L., Graf, A., Griebel, A., Gruening, C., Grünwald, T., Hammerle, A., Han, S., Han, X., Hansen, B. U., Hanson, C., Hatakka, J., He, Y., Hehn, M., Heinesch, B., Hinko-Najera, N., Hörtnagl, L., Hutley, L., Ibrom, A., Ikawa, H., Jackowicz-Korczynski, M., Janouš, D., Jans, W., Jassal, R., Jiang, S., Kato, T., Khomik, M., Klatt, J., Knohl, A., Knox, S., Kobayashi, H., Koerber, G., Kolle, O., Kosugi, Y., Kotani, A., Kowalski, A., Kruijt, B., Kurbatova, J., Kutsch, W. L., Kwon, H., Launiainen, S., Laurila, T., Law, B., Leuning, R., Li, Y., Liddell, M., Limousin, J.-M., Lion, M., Liska, A. J., Lohila, A., López-Ballesteros, A., López-Blanco, E., Loubet, B., Loustau, D., Lucas-Moffat, A., Lüers, J., Ma, S., Macfarlane, C., Magliulo, V., Maier, R., Mammarella, I., Manca, G., Marcolla, B., Margolis, H. A., Marras, S., Massman, W., Mastepanov, M., Matamala, R., Matthes, J. H., Mazzenga, F., McCaughey, H., McHugh, I., McMillan, A. M. S., Merbold, L., Meyer, W., Meyers, T., Miller, S. D., Minerbi, S., Moderow, U., Monson, R. K., Montagnani, L., Moore, C. E., Moors, E., Moreaux, V., Moureaux, C., Munger, J. W., Nakai, T., Neirynck, J., Nesic, Z., Nicolini, G., Noormets, A., Northwood, M., Nosetto, M., Nouvellon, Y., Novick, K., Oechel, W., Olesen, J. E., Ourcival, J.-M., Papuga, S. A., Parmentier, F.-J., Paul-Limoges, E., Pavelka, M., Peichl, M., Pendall, E., Phillips, R. P., Pilegaard, K., Pirk, N., Posse, G., Powell, T., Prasse, H., Prober, S. M., Rambal, S., Rannik, Ü., Raz-Yaseef, N., Reed, D., de Dios, V. R., Restrepo-Coupe, N., Reverter, B. R., Roland, M., Sabbatini, S., Sachs, T., Saleska, S. R., Sánchez-Ca nete, E. P., Sanchez-Mejia, Z. M., Schmid, H. P., Schmidt, M., Schneider, K., Schrader, F., Schroder, I., Scott, R. L., Sedlák, P., Serrano-Ortíz, P., Shao, C., Shi, P., Shironya, I., Siebicke, L., Šigut, L., Silberstein, R., Sirca, C., Spano, D., Steinbrecher, R., Stevens, R. M., Sturtevant, C., Suyker, A., Tagesson, T., Takanashi, S., Tang, Y., Tapper, N., Thom, J., Tiedemann, F., Tomassucci, M., Tuovinen, J.-P., Urbanski, S., Valentini, R., van der Molen, M., van Gorsel, E., van Huissteden, K., Varlagin, A., Verfaillie, J., Vesala, T., Vincke, C., Vitale, D., Vygodskaya, N., Walker, J. P., Walter-Shea, E., Wang, H., Weber, R., Westermann, S., Wille, C., Wofsy, S., Wohlfahrt, G., Wolf, S., Woodgate, W., Li, Y., Zampedri, R., Zhang, J., Zhou, G., Zona, D., Agarwal, D., Biraud, S., Torn, M., and Papale, D.: The FLUXNET2015 dataset and the ONEFlux processing pipeline for eddy covariance data, Scientific Data, 7, 1–27, 2020.
Pataki, D. E., Bowling, D. R., and Ehleringer, J. R.: Seasonal cycle of carbon dioxide and its isotopic composition in an urban atmosphere: Anthropogenic and biogenic effects, J. Geophys. Res.-Atmos., 108, 4735, https://doi.org/10.1029/2003JD003865, 2003.
Peters, E. B. and McFadden, J. P.: Continuous measurements of net CO2 exchange by vegetation and soils in a suburban landscape, J. Geophys. Res.-Biogeo., 117, G03005, https://doi.org/10.1029/2011JG001933, 2012.
Piao, S., Luyssaert, S., Ciais, P., Janssens, I. A., Chen, A., Cao, C., Fang, J., Friedlingstein, P., Luo, Y., and Wang, S.: Forest annual carbon cost: A global-scale analysis of autotrophic respiration, Ecology, 91, 652–661, 2010.
Rahmstorf, S. and Coumou, D.: Increase of extreme events in a warming world, P. Natl. Acad. Sci. USA, 108, 17905–17909, 2011.
Randerson, J. T., Chapin III, F. S., Harden, J. W., Neff, J. C., and Harmon, M. E.: Net ecosystem production: a comprehensive measure of net carbon accumulation by ecosystems, Ecol. Appl., 12, 937–947, 2002.
Rowntree, R. A. and Nowak, D. J.: Quantifying the role of urban forests in removing atmospheric carbon dioxide, Journal of Arboriculture, 17, 269–275, 1991.
Roy, S., Byrne, J., and Pickering, C.: A systematic quantitative review of urban tree benefits, costs, and assessment methods across cities in different climatic zones, Urban For. Urban Gree., 11, 351–363, 2012.
Schmid, H. P., Grimmond, C. S. B., Cropley, F., Offerle, B., and Su, H. B.: Measurements of CO2 and energy fluxes over a mixed hardwood forest in the mid-western United States, Agr. Forest Meteorol., 103, 357–374, 2000.
Schmid, H. P., Su, H. B., Vogel, C. S., and Curtis, P. S.: Ecosystem-atmosphere exchange of carbon dioxide over a mixed hardwood forest in northern lower Michigan, J. Geophys. Res.-Atmos., 108, 4417, https://doi.org/10.1029/2002JD003011, 2003.
Shashua-Bar, L. and Hoffman, M. E.: Vegetation as a climatic component in the design of an urban street: An empirical model for predicting the cooling effect of urban green areas with trees, Energ. Buildings, 31, 221–235, 2000.
Spronken-Smith, R. A., Oke, T. R., and Lowry, W. P.: Advection and the surface energy balance across an irrigated urban park, Int. J. Climatol., 20, 1033–1047, 2000.
Stagakis, S., Chrysoulakis, N., Spyridakis, N., Feigenwinter, C., and Vogt, R.: Eddy Covariance measurements and source partitioning of CO2 emissions in an urban environment: Application for Heraklion, Greece, Atmos. Environ., 201, 278–292, 2019.
Stewart, I. D.: A systematic review and scientific critique of methodology in modern urban heat island literature, Int. J. Climatol., 31, 200–217, 2011.
Stewart, I. D. and Oke, T. R.: Local climate zones for urban temperature studies, B. Am. Meteorol. Soc., 93, 1879–1900, 2012.
Stoy, P. C., Katul, G. G., Siqueira, M. B., Juang, J. Y., Novick, K. A., Uebelherr, J. M., and Oren, R.: An evaluation of models for partitioning eddy covariance-measured net ecosystem exchange into photosynthesis and respiration, Agr. Forest Meteorol., 141, 2–18, 2006.
Suyker, A. E. and Verma, S. B.: Interannual water vapor and energy exchange in an irrigated maize-based agroecosystem, Agr. Forest Meteorol., 148, 417–427, 2008.
Takanashi, S., Kosugi, Y., Tanaka, Y., Yano, M., Katayama, T., Tanaka, H., and Tani, M.: CO2 exchange in a temperate Japanese cypress forest compared with that in a cool-temperate deciduous broad-leaved forest, Ecol. Res., 20, 313–324, 2005.
Ueyama, M. and Ando, T.: Diurnal, weekly, seasonal, and spatial variabilities in carbon dioxide flux in different urban landscapes in Sakai, Japan, Atmos. Chem. Phys., 16, 14727–14740, https://doi.org/10.5194/acp-16-14727-2016, 2016.
United Nations (UN): World Urbanization Prospects: The 2018 Revision (ST/ESA/SER.A/420), Department of Economic and Social Affairs, Population Division, United Nations, New York, USA, 2019.
Velasco, E. and Roth, M.: Cities as net sources of CO2: Review of atmospheric CO2 exchange in urban environments measured by eddy covariance technique, Geography Compass, 4, 1238–1259, 2010.
Velasco, E., Roth, M., Tan, S. H., Quak, M., Nabarro, S. D. A., and Norford, L.: The role of vegetation in the CO2 flux from a tropical urban neighbourhood, Atmos. Chem. Phys., 13, 10185–10202, https://doi.org/10.5194/acp-13-10185-2013, 2013.
Velasco, E., Roth, M., Norford, L., and Molina, L. T.: Does urban vegetation enhance carbon sequestration?, Landscape Urban Plan., 148, 99–107, 2016.
Wang, L., Lee, X., Schultz, N., Chen, S., Wei, Z., Fu, C., Gao, Y., Yang, Y, and Lin, G.: Response of surface temperature to afforestation in the Kubuqi Desert, Inner Mongolia, J. Geophys. Res.-Atmos., 123, 948–964, 2018.
Ward, H. C., Evans, J. G., and Grimmond, C. S. B.: Multi-season eddy covariance observations of energy, water and carbon fluxes over a suburban area in Swindon, UK, Atmos. Chem. Phys., 13, 4645–4666, https://doi.org/10.5194/acp-13-4645-2013, 2013.
Ward, H. C., Kotthaus, S., Grimmond, C. S. B., Bjorkegren, A., Wilkinson, M., Morrison, W. T. J., Evans, J. G., Morison, J. I. L., and Iamarino, M.: Effects of urban density on carbon dioxide exchanges: Observations of dense urban, suburban and woodland areas of southern England, Environ. Pollut., 198, 186–200, 2015.
Weissert, L. F., Salmond, J. A., and Schwendenmann, L.: A review of the current progress in quantifying the potential of urban forests to mitigate urban CO2 emissions, Urban Climate, 8, 100–125, 2014.
York D., Evensen N., Martinez M., and Delgado J.: Unified equations for the slope, intercept, and standard errors of the best straight line, Am. J. Phys., 72, 367–375, 2004.
Yu, C. and Hien, W. N.: Thermal benefits of city parks, Energ. Buildings, 38, 105–120, 2006.