the Creative Commons Attribution 4.0 License.
the Creative Commons Attribution 4.0 License.
 | 06 Dec 2021
Combining POLDER-3 satellite observations and WRF-Chem numerical simulations to derive biomass burning aerosol properties over the southeast Atlantic region
Alexandre Siméon
Fabien Waquet
Jean-Christophe Péré
Fabrice Ducos
François Thieuleux
Fanny Peers
Solène Turquety
Isabelle Chiapello
Aerosol absorption is a key property to assess the radiative impacts of aerosols on climate at both global and regional scales. The aerosol physico-chemical and optical properties remain not sufficiently constrained in climate models, with difficulties to properly represent both the aerosol load and their absorption properties in clear and cloudy scenes, especially for absorbing biomass burning aerosols (BBA). In this study we focus on biomass burning (BB) particle plumes transported above clouds over the southeast Atlantic (SEA) region off the southwest coast of Africa, in order to improve the representation of their physico-chemical and absorption properties. The methodology is based on aerosol regional numerical simulations from the WRF-Chem coupled meteorology–chemistry model combined with a detailed inventory of BB emissions and various sets of innovative aerosol remote sensing observations, both in clear and cloudy skies from the POLDER-3/PARASOL space sensor. Current literature indicates that some organic aerosol compounds (OC), called brown carbon (BrOC), primarily emitted by biomass combustion absorb the ultraviolet-blue radiation more efficiently than pure black carbon (BC). We exploit this specificity by comparing the spectral dependence of the aerosol single scattering albedo (SSA) derived from the POLDER-3 satellite observations in the 443–1020 nm wavelength range with the SSA simulated for different proportions of BC, OC and BrOC at the source level, considering the homogeneous internal mixing state of particles. These numerical simulation experiments are based on two main constraints: maintaining a realistic aerosol optical depth both in clear and above cloudy scenes and a realistic mass ratio. Modelling experiments are presented and discussed to link the chemical composition with the absorption properties of BBA and to provide estimates of the relative proportions of black, organic and brown carbon in the African BBA plumes transported over the SEA region for July 2008. The absorbing fraction of organic aerosols in the BBA plumes, i.e. BrOC, is estimated at 2 % to 3 %. The simulated mean SSA are 0.81 (565 nm) and 0.84 (550 nm) in clear and above cloudy scenes respectively, in good agreement with those retrieved by POLDER-3 (0.85±0.05 at 565 nm in clear sky and at 550 nm above clouds) for the studied period.
- Article
(10862 KB) - Full-text XML
- BibTeX
- EndNote


The SEA region which includes the southeastern Atlantic Ocean (SEAO) and the western and southern parts of Africa is an excellent natural laboratory to better understand the complexity of aerosol–cloud interactions (Keil and Haywood, 2003; Stier et al., 2013; Peers et al., 2016; Zuidema et al., 2016a, b). Africa accounts for about half of the global annual carbon emissions produced by BB (Giglio et al., 2003; Giglio, 2006; Reid et al., 2009; Giglio and Randerson, 2010; Werf et al., 2010). These BB emissions, mostly large scale and man-made (e.g. deforestation, agricultural, domestic practices), are frequent and occur every year mainly during the dry season from June to October in central, eastern and southern Africa (Roberts et al., 2009). BBA are then regularly emitted from these source areas and transported over the SEAO above one of the three largest persistent stratocumulus layers on the planet (Knippertz et al., 2017). This westward aerosol transport is favoured by prevailing easterlies winds at 850 and 700 hPa (Zuidema et al., 2018b).
The presence of absorbing aerosols (AA) above clouds decreases the amount of light reflected by clouds into space, thus causing a reduction of the planet's albedo and a positive regional radiative forcing (warming). Significant positive radiative forcing has been measured in this region (Graaf et al., 2012; de Graaf et al., 2014, 2020; Peers et al., 2015). Strong differences persist between simulations of climate models, resulting in high uncertainties in estimating their radiative forcing, especially in this part of the world (Boucher et al., 2013; Myhre et al., 2013a; Stier et al., 2013). Over the SEAO, the BBA direct radiative forcing estimated at the top of the atmosphere (TOA) by the 16 global models of the AeroCom project (Huneeus et al., 2011; Myhre et al., 2013b; Bian et al., 2017) is highly variable, with large deviations observed within the range of these climate numerical models: from −1.16 W m−2 (cooling effect) for the GMI MERRA model up to +1.62 W m−2 (warming effect) for the CAM5.1 MAM3 model (Zuidema et al., 2016b). The absorption of solar radiation by BBA above clouds causes a warming where the aerosol layer is located. This warming would alter the thermodynamic properties of the atmosphere, which would impact the vertical development of low clouds. Clouds under these BBA layers would then be optically thicker, and the altitude of their cloud top would be lower. This semi-direct effect has been observed off the coasts of Angola and Namibia (Wilcox, 2012; Deaconu et al., 2019). Modelling studies have shown that the BBA semi-direct radiative forcing above stratocumulus clouds over the SEA region is primarily negative at the TOA. It was estimated on average at −2.6 W m−2 over the July–September period by Sakaeda et al. (2011) or at −30.5 W m−2 during few days of study (period 5–10 August 2016, Gordon et al., 2018). Recent modelling studies have also shown that African BBA could have an indirect radiative effect of −10.1 W m−2 (5–10 August 2016, Gordon et al., 2018) and −8.05 W m−2 (1 August to 30 September 2014, Lu et al., 2018) over the SEA region during the dry season. There are sometimes cases of contact by the cloud top or BBA transport in the lower layers impacting the cloud properties such as the increase in liquid water path (Costantino and Bréon, 2013). It is worth noting that the transport of BBA in the boundary layer has also been reported by recent ground-based and airborne observations (Zuidema et al., 2018b; Haslett et al., 2019; Denjean et al., 2020; Kacarab et al., 2020; Redemann et al., 2021; Zhang and Zuidema, 2021). As with semi-direct effects, it should be noted that there is still no consensus on quantifying the indirect effects of BBA over the SEA region.
These disagreements between AeroCom models on the properties of aerosols above clouds are explained by differences in parameterizations on the aerosol injection height, the aerosol lifetime (related to the processes of deposition, removal, etc.) and on the aerosol absorption (Peers et al., 2016). The literature reports a wide range of mass ratio values for African BBA plumes depending on the different types of burned vegetation in Africa (extratropical forests, tropical forests, savannahs, grasslands and crop residues). These carbonaceous aerosol mixing ratios can be highly variable, ranging from 0.06 to 0.33 at the level of BBA emission sources (Bond et al., 2004; Liousse et al., 2010; Werf et al., 2010; Akagi et al., 2011) and from 0.11 to 0.24 during the transport of BBA plumes (Ruellan et al., 1999; Formenti et al., 2003; Kirchstetter et al., 2003; Capes et al., 2008). In addition, a wide range of BC spectral refractive indices is reported in the literature (from 1.6 to 2.0 for its real part and from 0.45 to 1.1 for its imaginary part – Bond and Bergstrom, 2006; Bond et al., 2013; Liu et al., 2018), which can be explained by the diversity of experimental techniques implemented with their own uncertainties or by not perfectly pure sample collection (i.e. contaminated by other chemical species) (Bond and Bergstrom, 2006; Bond et al., 2013). Current uncertainties are also related to combustion conditions, types of burned fuels, and BC ageing and its fractal morphology (Sorensen, 2001; Bond and Bergstrom, 2006). The presence of BrOC and its proportion in the BB plumes (Arola, 2011; Laskin et al., 2015), the variability of its spectral refractive index values (Kirchstetter et al., 2004; Alexander et al., 2008; Chen and Bond, 2010; Hoffer et al., 2016, 2017; Sumlin et al., 2017), and its atmospheric lifetime (Samset et al., 2014; Wang et al., 2014) prevent accurate representation of this chemical compound in climate models. Uncertainties about emitted amounts of black and primary organic carbon (Giglio and Randerson, 2010; Werf et al., 2010; Wiedinmyer et al., 2011; Kaiser et al., 2012; Turquety et al., 2014; Andreae, 2019; Pan et al., 2019) are other key elements highly influencing the BBA absorption properties.
In this context, the SEA region has been the subject of several scientific studies and publications focusing on aerosol–radiation and aerosol–cloud interactions and their climate impacts (e.g. Wilcox, 2012; Meyer et al., 2013; de Graaf et al., 2014; Peers et al., 2016; Zuidema et al., 2016b). International research programmes have been in place since the 1990s (SAFARI-1992, Lindesay et al., 1996) and until very recently around southern Africa (Zuidema et al., 2016b; Pistone et al., 2019; Denjean et al., 2020; Taylor et al., 2020; Haywood et al., 2021; Redemann et al., 2021). In particular, the SAFARI-2000 field campaign provided a set of airborne and ground measurements of aerosol absorption properties over the South African region, including their single scattering albedo (Swap et al., 2002; Haywood et al., 2003). The SSA of aerosols could thus be estimated at 0.85±0.02 at 550 nm on a regional average and during the BB season, confirming the highly absorbing nature of the aerosols emitted from vegetation fires in this region (Leahy et al., 2007). Nevertheless, some questions about the aerosol absorption spectral dependence or its evolution during aerosol transport have not been resolved with these pioneering campaigns (Formenti et al., 2019). SAFARI-2000's observations also showed that these AA could exert a positive direct radiative forcing above clouds (Keil and Haywood, 2003). More recently, several new observation campaigns have been put in place during the 2016–2018 period to advance the characterization of BBA in this region and to better understand their interactions with clouds and their radiative effects (Zuidema et al., 2016b). These field campaigns have been initiated by various international teams with, in particular, the American ORACLES (ObseRvations of Aerosols above CLouds and their intEractionS – Redemann et al., 2021) and LASIC (Layered Atlantic Smoke Interactions with Clouds – Zuidema et al., 2018a) and the British CLARIFY-2017 (CLoud-Aerosol-Radiation Interaction and Forcing: Year 2017 – Haywood et al., 2021) projects. The French teams conducted a field campaign on the Namibian Atlantic coast during the summer of 2017 as part of the French National Research Agency AEROCLO-sA project, deploying a set of ground-based and airborne measurements (Formenti et al., 2019). This coordinated international effort has provided a comprehensive set of ground and airborne measurements of aerosol and cloud properties over southern Africa and the south tropical Atlantic region. Innovative satellite observations of aerosols and clouds derived from the Polarization and Directionality of the Earth's Reflectances (POLDER-3) space sensor in clear sky (Dubovik et al., 2011, 2014) and above clouds (Waquet et al., 2013a, b; Peers et al., 2015) and from the Spinning Enhanced Visible and InfraRed Imager (SEVIRI) were also recently developed (Peers et al., 2019, 2020) and offer new opportunities (e.g. daily coverage, high spatial and temporal resolutions).
Progress towards more accurate modelling of BBA transported above clouds and their associated radiative effects in the SEA region requires robust representation of their loads and their physico-chemical and absorption properties (Stier et al., 2013; Zuidema et al., 2016b; Mallet et al., 2020). Here we use the WRF-Chem coupled meteorology–chemistry regional model, which allows simulations at higher spatial and temporal resolutions than current global climate models with a better representation of aerosol processes to simulate the life cycle of aerosols, their loads and their absorption properties (Grell et al., 2005; Fast et al., 2006; Peckham, 2012; Powers et al., 2017) over the SEA region. Coincident POLDER-3 innovative satellite aerosol retrievals, available both in clear and cloudy conditions, are used to constrain the chemical composition of BBA simulated with the WRF-Chem model. The methodology consists in adjusting the aerosol absorption properties in WRF-Chem by analysing its sensitivity to different input parameters, i.e. the amount of black and primary organic carbon emitted by biomass combustion at the source level, the mass ratio, and the black and brown carbon absorption. This approach leads to an optimized configuration of WRF-Chem for aerosol simulations over the SEA region, with constrained aerosol key parameters (AOD, SSA and their spectral dependence) above clouds in the model, in order to properly calculate their forcing and heating rates and subsequently to better quantify their feedbacks on clouds. Because of the availability of POLDER-3 coincident satellite data, our study focuses on July 2008 since this period allowed us to observe many strongly absorbing BB events associated with strong direct radiative effects (Waquet et al., 2020) and potential semi-direct and indirect effects on clouds.
The structure of this article is as follows. Section 2 describes the modelling tool and satellite data as well as the strategy used to improve the representation of BBA distribution and absorption properties in regional climate models. Section 3 reports results for the meteorology; reports the aerosol load, size, and horizontal and vertical distribution; and then focuses on aerosol absorption properties. Section 4 summarizes the main results and conclusions of our study.
2.1 WRF-Chem: a regional meteorological model coupled with chemistry
2.1.1 Description
WRF-Chem (Weather Research and Forecasting Model coupled with Chemistry) is a regional model whose specialty is to couple atmospheric chemistry with meteorology (Grell et al., 2005; Fast et al., 2006). Particulate pollution influences climate change because aerosols affect the radiative transfer properties of the atmosphere. Also, climate change can alter the mechanisms of formation, transport, ageing and scavenging of atmospheric particles. WRF-Chem captures this complexity. It is a chemistry–transport model coupled with a mesoscale weather model designed for atmospheric research and operational forecasting applications (Skamarock et al., 2005, 2008). WRF-Chem is used in many types of air quality and climate research and offers a wide range of options for modelling of gas and particulate chemistry (Grell et al., 2004; Grell and Baklanov, 2011; Baklanov et al., 2014; Powers et al., 2017). The main physical and chemical options selected for the detailed simulation of atmospheric chemistry with WRF-Chem V3.9.1.1 initial configuration are shown in Table 1.
Table 1WRF-Chem V3.9.1.1 main physico-chemical options selected for the study of the biomass burning aerosol optical properties and their climate forcing over the southeast Atlantic region.
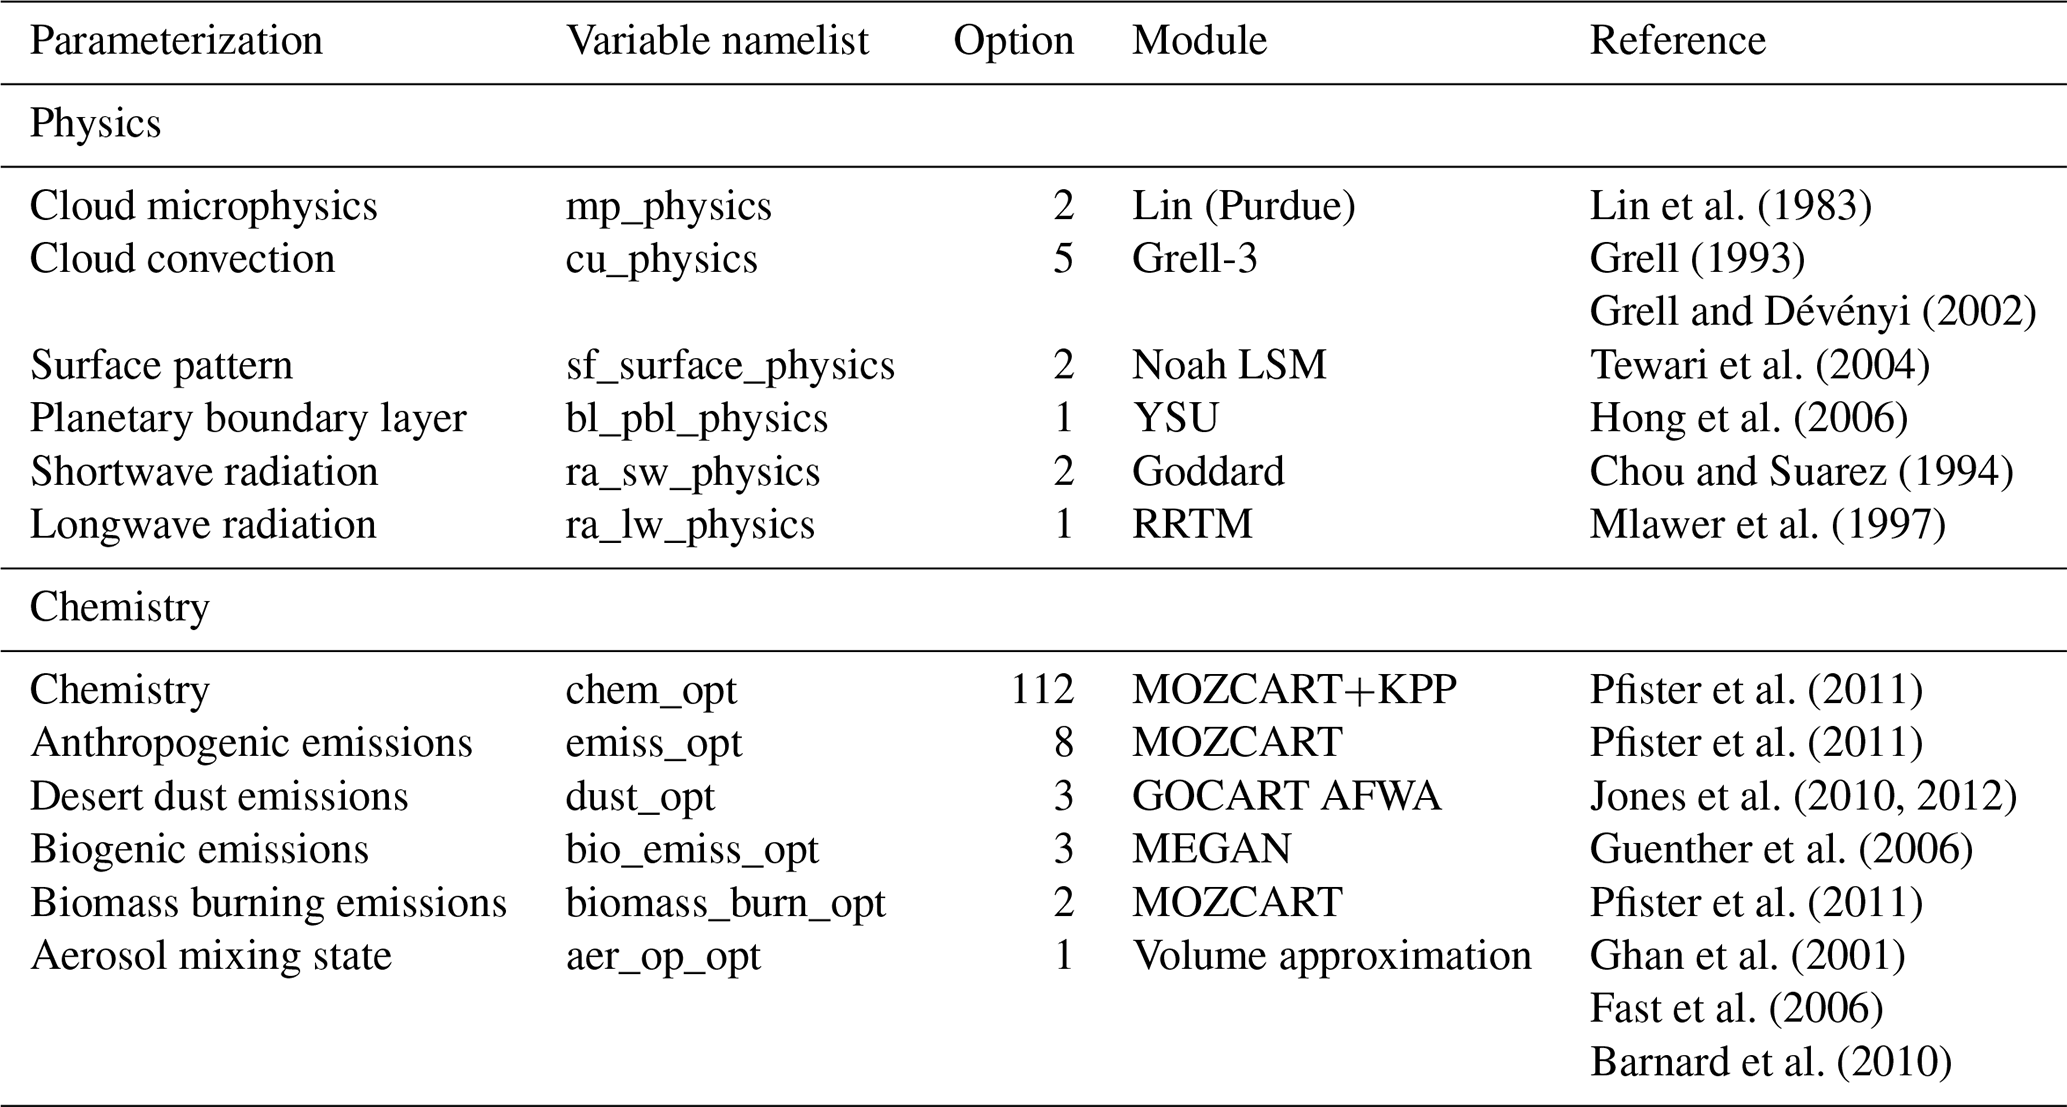
We chose the MOZCART chemistry scheme (Pfister et al., 2011) which links the MOZART (Model for OZone And Related chemical Tracers) gas phase chemistry module (Emmons et al., 2010) with the GOCART (Global Ozone Chemistry Aerosol Radiation and Transport) aerosol module (Chin et al., 2000a, b; Ginoux et al., 2001; Chin et al., 2002) because it is well suited for BB chemistry (Emmons et al., 2015; Lassman et al., 2017). MOZCART simulates the life cycle of the main aerosol types, i.e. black carbon (BC), organic carbon (OC), sulfates (SO), desert dust aerosols (DUST), and sea salt aerosols (SEAS), as well as a large number of gaseous species (85 species evolving according to 196 chemical reactions including 39 photolysis). MOZCART calculates their transport, their chemical ageing (Helfand and Labraga, 1988; Allen et al., 1996; Lin and Rood, 1996), and their dry (Fuchs et al., 1965; Wesely, 1989) and wet (Giorgi and Chameides, 1986; Balkanski et al., 1993) depositions.
For meteorological input data, we used the meteorological reanalyses from NCEP (National Centers for Environmental Prediction) global reanalysis provided by GFS (Global Forecast System) at 1∘ horizontal spatial resolution updated every 6 h (Kalnay et al., 1996).
We chose the homogeneous internal mixing state of particles in our WRF-Chem numerical simulations because this type of mixture is consistent with that considered in the POLDER-3 satellite inversion algorithms used to retrieve aerosol optical properties. The aerosol radiative feedbacks are not taken into account in the present study.
2.1.2 Configuration
Our domain of study centred on the SEA region is illustrated in Fig. 1 with the black frame (20∘ W–30∘ E, 39.4∘ S–10∘ N). This domain corresponds to the area affected by transport of BBA plumes off the southwest coasts of Africa. We have simulated an extended area (34.1∘ W–45.1∘ E, 39.4∘ S–33∘ N) in order to take into account all desert, marine, biogenic, anthropogenic and BB emissions of aerosols that could impact our region of interest. The horizontal spatial resolution of the simulations performed with WRF-Chem in this area is 30×30 km2. The temporal resolution of the WRF-Chem numerical simulations is hourly. The atmospheric layer is divided into 50 vertical levels using the hybrid sigma-pressure vertical coordinate. The vertical levels are terrain-following near the surface, with a finer resolution than at the upper pressure level set at 50 hPa.
We have simulated the first half of July 2008 (plus 15 d spin-up) for the numerical experiments to reduce numerical costs. The computation time for a numerical simulation was about 3 d for this time period and about 6 d for the whole month (plus 15 d spin-up). Furthermore, the first half of July 2008 appears to be representative of July 2008. Indeed, the above-cloud aerosol optical depth (ACAOD) and the above-cloud single scattering albedo (ACSSA) retrieved by POLDER-3/AERO-AC at 550 nm are respectively 0.45 and 0.85 over the first half of July 2008 and 0.46 and 0.85 over July 2008 on average over our combined studied areas (black frames in Fig. 2). These values confirm significant amounts of AA transported above clouds of the SEAO during this time of the year.
The studied area for the optical properties of BBA is separated into two distinct areas (black frames in Fig. 2). The first area (a, 12–30∘ E, 10–0∘ S) corresponds to the BBA emission sources over the southern African continent and will be analysed in clear atmosphere for comparisons with the POLDER-3/GRASP data (Dubovik et al., 2011, 2014). The second area (b, 0–15∘ E, 15–5∘ S) corresponds to the transport of BBA plumes above clouds over the SEAO and will be analysed in cloudy atmosphere for comparisons with the POLDER-3/AERO-AC data (Waquet et al., 2013a, b; Peers et al., 2015). The purpose of this distinction is to better differentiate the various physico-chemical mechanisms involved between the emissions and transport of BBA (changes in the size and chemical composition of particles) impacting their optical properties. This differentiation also maximizes the number of satellite observations available (see Fig. 2).
We choose the RETRO (REanalysis of the TROpospheric chemical composition, Schultz et al., 2007) global inventory for the anthropogenic emissions at a horizontal spatial resolution of 0.5×0.5∘ and at a monthly temporal resolution over the 1960–2000 period. Biogenic emissions are calculated by WRF-Chem from surface, vegetation and weather data using MEGAN2.1 (Model of Emissions of Gases and Aerosols from Nature version 2.1, Guenther et al., 2012) at a horizontal spatial resolution of 1×1 km2 and at a monthly temporal resolution. Emissions of desert dust and sea salt particles are calculated online by WRF-Chem using the GOCART aerosol module from meteorological and surface parameters.
We use the APIFLAMEv1 (Analysis and Prediction of the Impact of Fires on Air Quality Modeling, version 1.0) detailed French global inventory for BB emissions (Turquety et al., 2014), which is connected to a smoke plume rise model (Freitas et al., 2006, 2007; Grell et al., 2011). This time-dependent 1D cloud model explicitly simulates the rise of the plumes from the source level in function of the convective transport mechanisms and the ambient weather and thermodynamic conditions calculated by WRF-Chem. APIFLAMEv1 calculates daily emissions of 49 chemical compounds produced by BB such as the BC, the OC or the carbon monoxide (CO, considered as a fire tracer) at a horizontal spatial resolution of 1×1 km2. The methodology is based on burned areas and combustion temperatures from remote sensing data as well as emission factors specific to burnt vegetation from the Akagi et al. (2011) database. Comparison of APIFLAMEv1's CO emissions with those from three other BB emission inventories often used in the scientific community, GFEDv3 (Global Fire Emissions Database, version 3.0 – Giglio and Randerson, 2010; Werf et al., 2010), FINNv1 (Fire INventory from NCAR, version 1.0 – Wiedinmyer et al., 2011) and GFASv1 (Global Fire Assimilation System, version 1.0 – Kaiser et al., 2012), showed good spatial–temporal correlations of 0.9 (Turquety et al., 2014). These three global emission inventories also rely on MODIS observations for fire detection. The validation study of APIFLAMEv1 conducted by Turquety et al. (2014) showed uncertainties of a factor of 2 to 4 on the emitted amounts of carbonaceous species linked in particular to the wide variability of emission factors by vegetation type. However, these uncertainties are similar to those associated with other BB emission inventories (Wiedinmyer et al., 2011). It is worth noting that the global total emission amounts of carbonaceous aerosols differ by a factor of 3 to 4, ranging from 1.65 to 5.54 Tg for BC and from 13.76 to 51.93 Tg for OC (Pan et al., 2019). Figure 1 illustrates the monthly mass concentrations (in g m−2) of PM10 emitted at surface by BB during the July–September 2008 period (from left to right) in Africa from APIFLAMEv1 (Turquety et al., 2014) used in WRF-Chem V3.9.1.1.
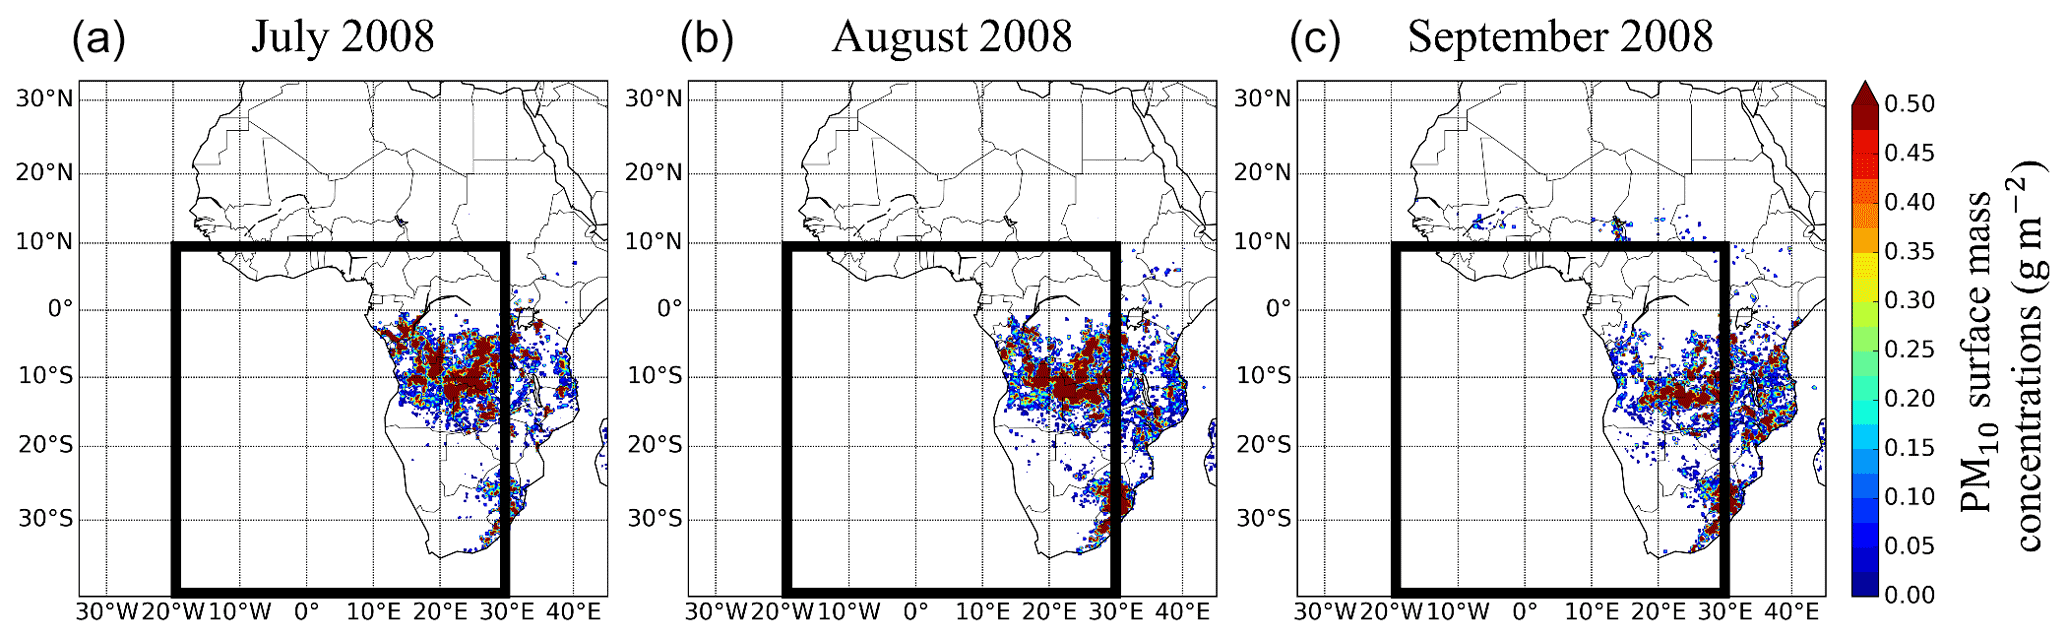
Figure 1Monthly mass concentrations of PM10 (in g m−2) emitted at the surface by African biomass burning in July (a), August (b) and September (c) 2008 from the APIFLAMEv1 biomass burning emission inventory (Turquety et al., 2014). The black frames (20∘ W–30∘ E, 39.4∘ S–10∘ N) represent the area of study.
Figure 1 indicates the location of wildfire sources with significant activity which are mainly in the southern half of Africa during the simulated period. During the dry season, which extends from May to October, the sources of wildfires gradually move south and east, in agreement with previous studies in this region (Cahoon et al., 1992; Roberts et al., 2009). Figure 1 shows that the BB emission inventory of Turquety et al. (2014) reflects the expected variability in the detection of BBA sources in Africa.
2.2 A-Train aerosols and clouds satellite data
2.2.1 POLDER-3/PARASOL
The clear-sky Generalized Retrieval of Aerosol and Surface Properties (GRASP) inversion algorithm allows the retrieval of the atmospheric properties of aerosols either from combined or separate observations from different passive and active remote sensing tools (satellite, ground, airborne) (Dubovik et al., 2011, 2014). Applied on POLDER-3's measurements of linearly polarized radiance (490, 670 and 865 nm) and total radiance (443, 490, 565, 670, 865 and 1020 nm), POLDER-3/GRASP allows us to derive surface properties (e.g. albedo, reflectance), aerosol optical properties (e.g. total extinction optical depth, total absorption optical depth, fine-mode optical depth, coarse-mode optical depth, Ångström exponent, single scattering albedo, refractive index), aerosol microphysical properties (e.g. particle size distribution, fine and coarse modes, spherical fraction of particles) and the average altitude of the aerosol layer. In this study, we will use the so-called “optimized” version of POLDER-3/GRASP, which includes some approximations on radiative transfer calculations in order to obtain the best possible compromise between processing speed and accuracy of the results. This processing allowed the entire POLDER-3/PARASOL archive (March 2005–October 2013) to be analysed for the first time with this type of algorithm. Comparisons with coincident AERONET data have shown that the total aerosol optical depth (AOD) is retrieved within an uncertainty range of about ±15 % (per pixel estimate) over land and ocean (Dubovik et al., 2011; Popp et al., 2016; Chen et al., 2018, 2019, 2020; Li et al., 2019). The maximum error on the SSA was estimated to be about ±0.05 % (per pixel estimate) over land surfaces and in cases of high aerosol loads (Chen et al., 2020). In this study, we will use the total extinction optical depth at 565 nm and its spectral dependence (443, 490, 565, 670, 865 and 1020 nm) derived from POLDER-3/GRASP in clear-sky conditions to assess the WRF-Chem model in terms of BB emission sources over land. The spectral retrievals of the single scattering albedo from 443 to 1020 nm will be used to study the absorption properties and chemical composition of the emitted simulated aerosols.
The AEROsol Above Clouds (POLDER-3/AERO-AC) inversion algorithm retrieves the aerosol optical and microphysical properties above liquid water clouds by combining POLDER-3's multidirectional and multispectral measurements of polarized (670 and 865 nm) and total (490 and 865 nm) radiances (Waquet et al., 2013a, b; Peers et al., 2015). POLDER-3/AERO-AC retrieves the aerosol extinction optical depth (ACAODext) and their single scattering albedo (ACSSA) at 490, 550, 670, and 865 nm and their Ångström exponent (ACAE670−865) simultaneously with the optical depth of the underlying cloud (COD) at a spatial resolution of 6×6 km2 and an almost daily temporal resolution. Retrievals are only provided in cases of optically thick (COD>3) and homogeneous liquid water clouds, fractional cloud covers, and cloud edges being eliminated. Scenes corresponding to cirrus clouds above liquid clouds are identified from coincident measurements acquired in thermal infrared by the MODIS instrument and are also discarded (Waquet et al., 2013a, b; Peers et al., 2015). This innovative inversion method was the first to allow the retrieval of aerosol properties above cloudy scenes at a global scale (Waquet et al., 2013a). Sensitivity studies for POLDER-3/AERO-AC indicate maximum relative errors of ±20 % on the extinction optical depth and ±0.05 % on the single scattering albedo of BB particles transported above liquid clouds (Peers et al., 2015). This inversion technique has been compared with retrievals from the CALIOP lidar (Deaconu et al., 2017). The analysis of the extinction optical depth retrieved by the CALIOP depolarization product (Hu et al., 2009) showed deviations of less than 20 % compared to POLDER-3/AERO-AC on the ACAODext for the fine particles of BB. Differences between POLDER-3/AERO-AC and CALIOP are increasing for mineral dust and especially for a complex mixture of aerosols (e.g. BB and urban pollution). In this study, we will use the aerosol extinction optical depth at 550 nm and its spectral dependence (490, 550, 670 and 865 nm) to assess the WRF-Chem model in terms of BBA content transported above marine stratocumulus over the SEAO. Spectral retrievals of the single scattering albedo from 490 to 865 nm above clouds will be used to study the absorption properties and chemical composition of simulated aerosols off the coasts of southern Africa.
The aerosol parameters simulated with WRF-Chem have been spatially and temporally collocated with the remote sensing parameters to be quantitatively comparable. First, the POLDER-3/GRASP and POLDER-3/AERO-AC data initially at a horizontal spatial resolution of 6×6 km2 are aggregated onto the model's grid (30×30 km2). Then, POLDER-3's clear-sky and cloudy-sky masks were applied to the data simulated with WRF-Chem. Finally, the model meteorological–optical–chemical parameters are averaged between 13:00 and 14:00 (all time references are in local time) to be consistent with the PARASOL satellite transit time (about 13:30 over the SEA region). Thus, each pixel simulated with WRF-Chem can be compared to a coincident aggregated pixel retrieved by the POLDER-3 space sensor in clear sky (GRASP) and above clouds (AERO-AC). Finally, the aerosol optical properties simulated with WRF-Chem at four wavelengths (300, 400, 600 and 1000 nm) in the shortwave radiation are recalculated at the wavelengths of the POLDER-3 aerosol retrievals. The single scattering albedo (SSA) is linearly interpolated. The aerosol optical depth (AOD) is interpolated using the Ångström power law according to the following relationship:
where λinterpol is the wavelength to be interpolated between λ1=400 nm and λ2=600 nm if 400 nm nm or between λ1=600 nm and λ2=1000 nm if 600 nm nm.
Figure 2 illustrates the number of observation days in clear (a) and cloudy (b) skies available from the POLDER-3 space sensor during the first half of July 2008.
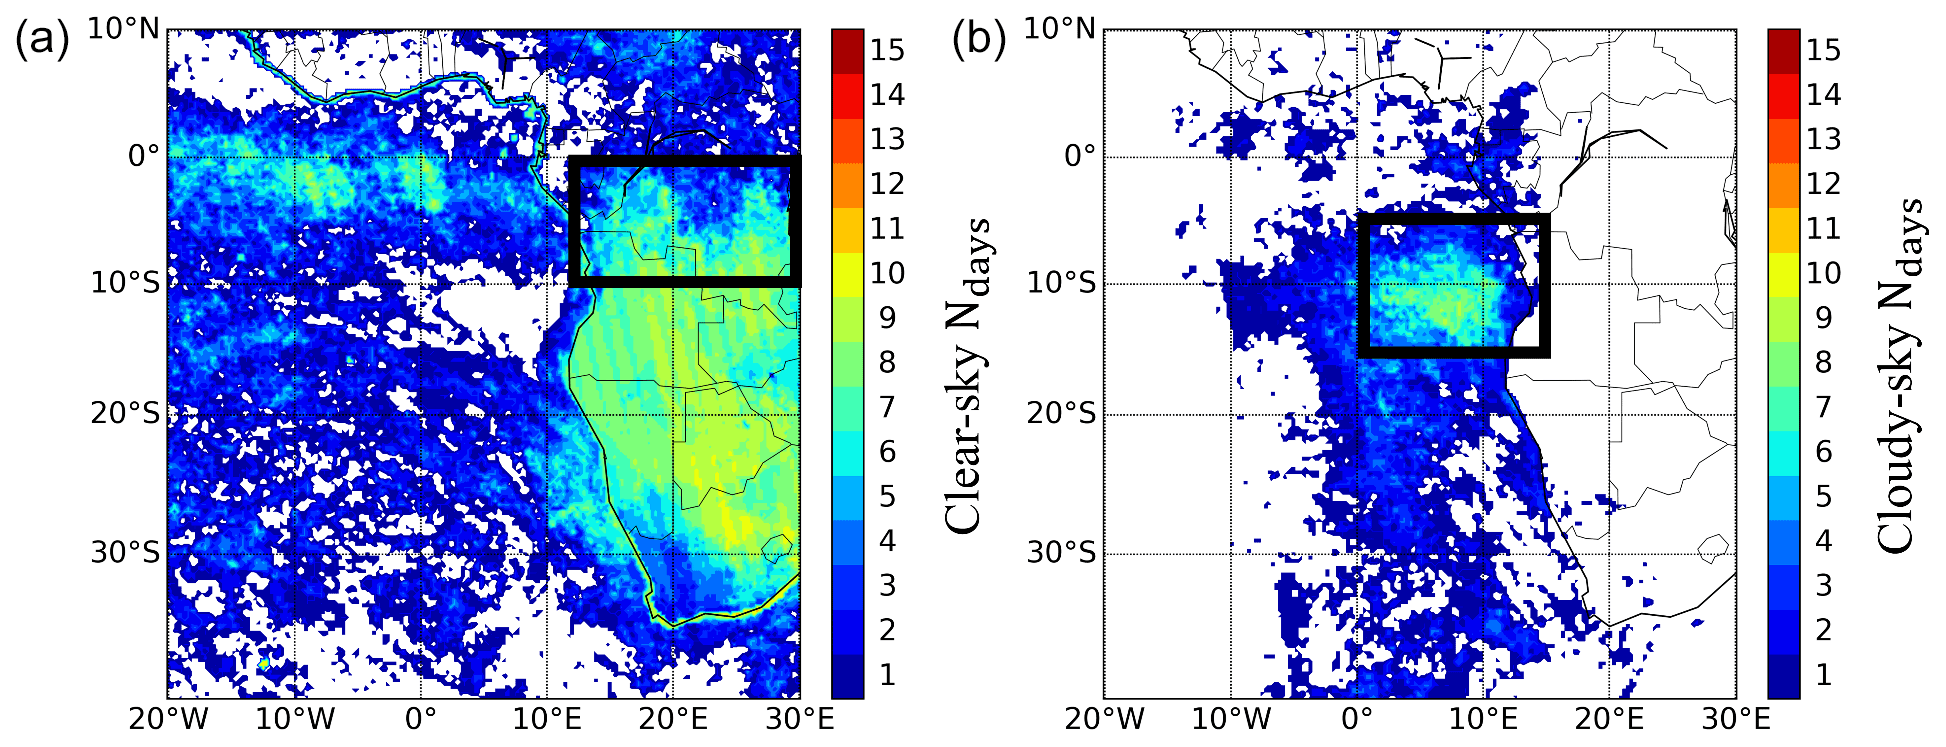
Figure 2Number of observation days (Ndays) in clear atmosphere (a) and cloudy atmosphere (b) available from the POLDER-3 space sensor during the 1–15 July 2008 period. The black frames indicate the two areas of study of the biomass burning aerosol optical properties in clear sky over land (12–30∘ E, 10–0∘ S, a) and above clouds over the southeastern Atlantic Ocean (0–15∘ E, 15–5∘ S, b).
Figure 2 indicates the state of the sky (clear or cloudy) over the SEA region during the first half of July 2008. This figure shows the semi-permanent layer of marine stratocumulus inside the area (0–15∘ E, 15–5∘ S) characterized by the absence of satellite data in clear sky (a) and by the largest number of satellite data in cloudy sky (b).
Filters were applied to the POLDER-3 satellite observations to keep the signal associated with the lowest uncertainties on the retrieved aerosol optical properties. In clear-sky conditions, POLDER-3/GRASP aerosol optical depth and single scattering albedo were filtered according to the criterion AODobs(443 nm)≥0.4 (Dubovik et al., 2011, 2014). Above cloudy scenes, we used the POLDER-3 AERO-AC-quality-assured-absorption-6 km product, which uses criteria to ensure the quality of the retrieval of the aerosol absorption above clouds (Waquet et al., 2020). These criteria restrict the retrievals of aerosol absorption above clouds to scenes with significant aerosol loading above clouds and optically thick clouds for which the sensitivity of the retrieval absorption method is maximal (Peers et al., 2015, 2016).
2.2.2 Ancillary data from CALIOP/CALIPSO
The operational inversion method applied to the CALIOP lidar level 2 data mainly retrieves the AOD in clear sky and above clouds, the Ångström exponent (AE) above clouds, and the vertical profiles of the aerosol backscatter and extinction coefficients from the backscattering signal measured at 532 and 1064 nm and the depolarization ratio (Winker et al., 2009). The altitudes of the base and the top of the clouds and the aerosols are also provided. In this study, we will use the vertical profiles of the aerosol extinction coefficient at 532 nm to evaluate that simulated with WRF-Chem at 550 nm. We will also use the altitudes of the aerosol and cloud layers provided by CALIOP to assess their vertical distributions simulated with WRF-Chem.
2.3 Methodology
Our approach is summarized in Fig. 3, with the main aerosol parameters investigated in the WRF-Chem numerical experiments reported in Table 2.
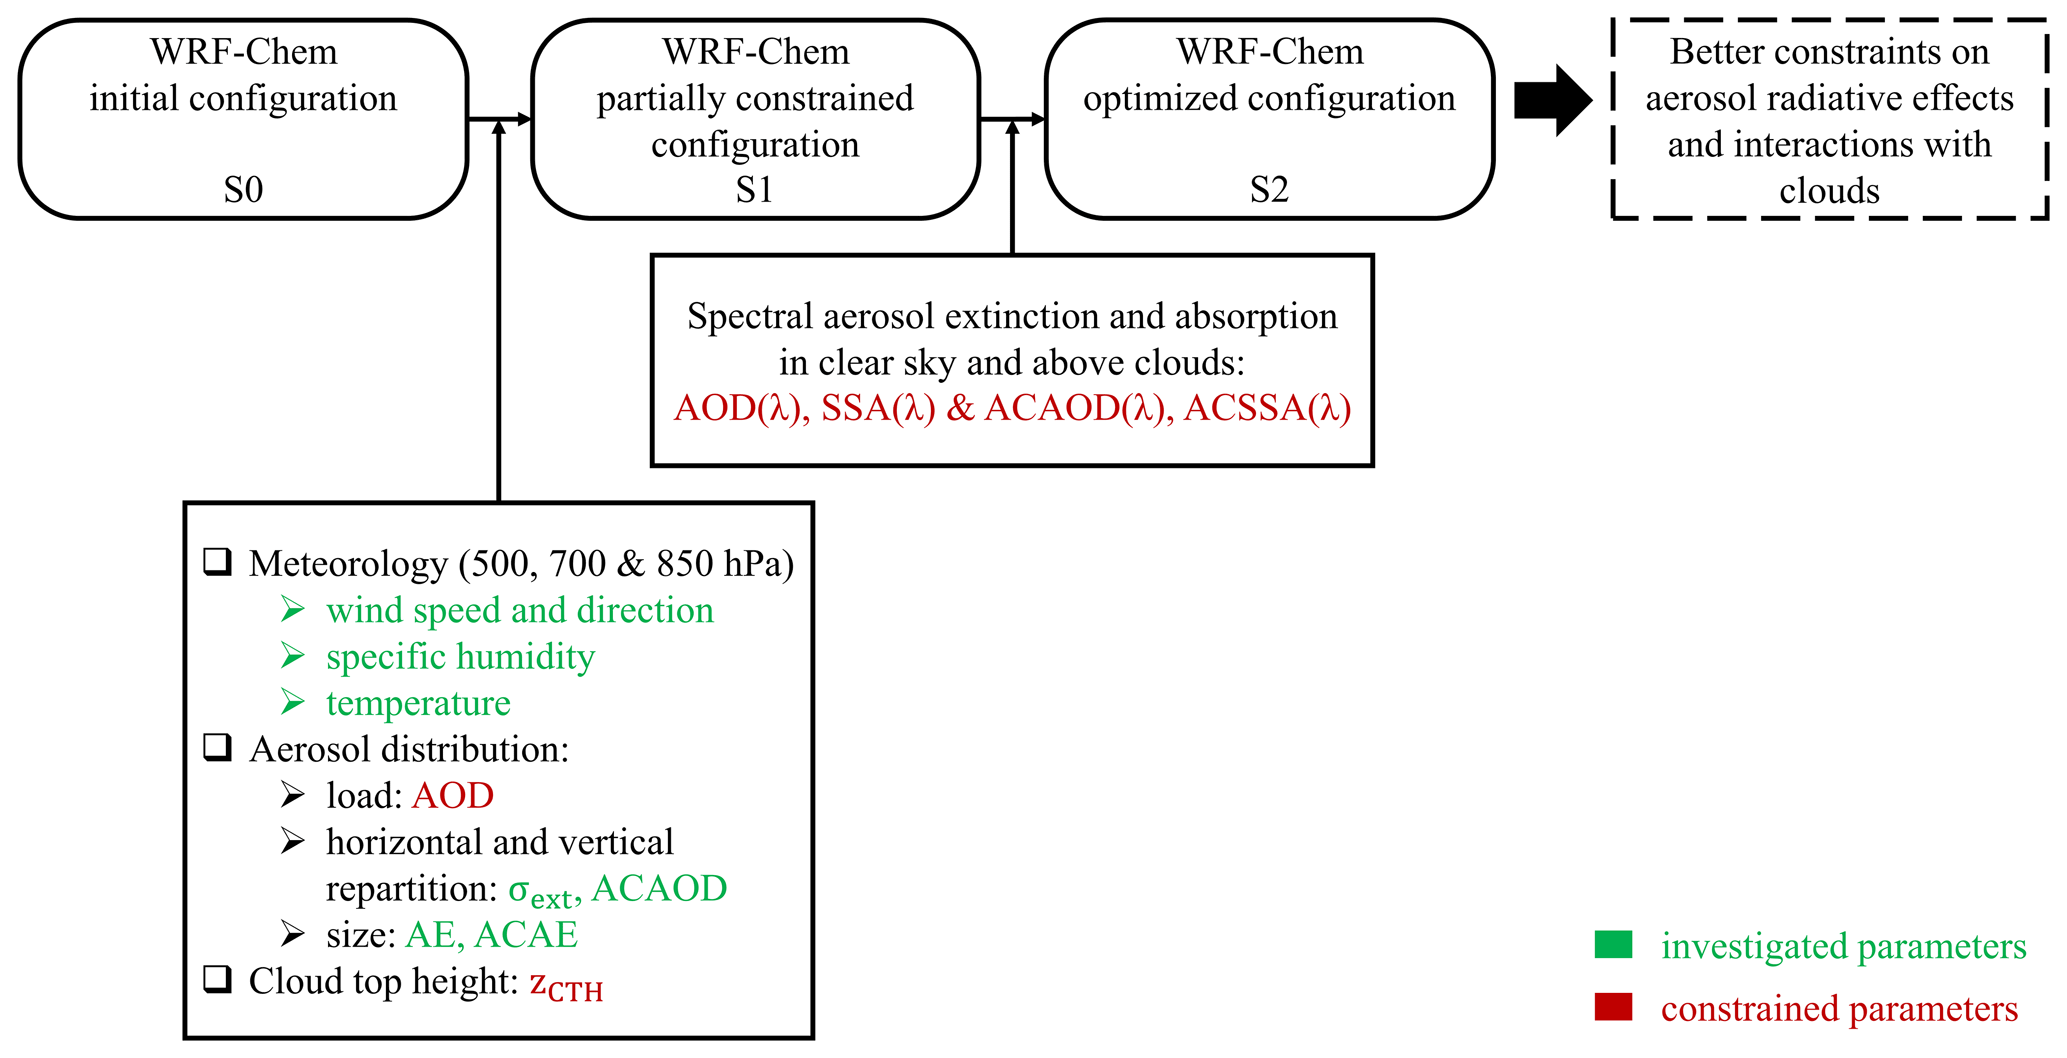
Figure 3Schematic diagram of the general approach applied to constrain WRF-Chem simulations of aerosols using A-Train satellite coincident retrievals of the distributions of aerosols and clouds. AOD, ACAOD, SSA, ACSSA, σext, AE, ACAE and zCTH stand for aerosol optical depth, above-cloud aerosol optical depth, single scattering albedo, above-cloud single scattering albedo, aerosol extinction coefficient, Ångström exponent, above-cloud Ångström exponent and cloud top height, respectively.
As a first step, we use the ECMWF ERA-Interim reanalysis and the aerosol and cloud satellite observations from the A-Train to test the performance of the model in its initial configuration (S0, in Fig. 3) in terms of simulations of meteorology and aerosol horizontal and vertical distribution, including their load. The simulated intensity of the BBA emissions over the South African sources is evaluated using the AOD from POLDER-3/GRASP. Potential biases are then corrected by adjusting the emission inventories. Desert dust emissions from North African sources are also considered as they may contribute to the total aerosol load over our studied area. The transport of mineral dust off the coast of the SEAO is notably supported by recent satellite and airborne observations performed in the northern part of our domain (Deaconu et al., 2019; Denjean et al., 2020). Table 2 provides the uncertainties associated with the emissions of these two aerosol types (Turquety et al., 2014; Flaounas et al., 2016) along with the correction factors tested in the WRF-Chem numerical simulations.
The injection height of BBA at the source level is evaluated using the aerosol vertical distribution provided by CALIOP. It should be noted that the parameterization used in WRF-Chem (smoke plume rise model, Freitas et al., 2006, 2007; Grell et al., 2011) allows aerosols to be injected high enough into the atmosphere to simulate the transport of the BBA plumes above clouds over the SEAO. In addition, the simulation of the cloud top height in WRF-Chem is investigated and evaluated, as this has a direct impact on the ability of the model to compute realistic above-cloud aerosol loads.
Finally, we evaluate the aerosol size distributions simulated with WRF-Chem, because of their known influence on the calculation of the SSA. This analysis will help to separate the impact of the aerosol size from the aerosol chemical composition when comparing the simulated and the satellite-derived SSA.
Following the evaluation of the model's performance, the possible biases are corrected by adjusting the emissions at the source level within their reported uncertainties. The partially constrained (PC, hereafter) configuration of WRF-Chem (S1, in Fig. 3) corresponds to the configuration using the corrected emissions. It is worth noting that the assessment conducted in the first step is done for the whole month of July 2008.
The second step of our approach consists in simultaneously constraining the load and the chemical composition of the BBA simulated with WRF-Chem using the spectral extinction (clear-sky and above-cloud AOD) and the spectral absorption (clear-sky and above-cloud SSA) from POLDER-3, in order to set up an optimized configuration of the model (S2, in Fig. 3). Simulations are performed with WRF-Chem in its PC configuration using different amounts of BC, OC and BrOC at the source level. The range of and ratios used in this experiment have been selected according to uncertainties from the literature (Werf et al., 2010; Akagi et al., 2011) and are reported in Table 2. The set of BC, OC and BrOC amounts that reproduces the satellite observations the best corresponds to the optimized configuration (S2, in Fig. 3). These simulation experiments also take into account complex refractive indices of pure species for BC and BrOC (see Table 2). We have tested two values of the BC refractive index. First, the one recommended by Bond and Bergstrom (2006), , which is commonly used as input data into climate models and implemented by default in WRF-Chem. Secondly, we have tested the BC refractive index of Williams et al. (2007), , which is more absorbing and could be more realistic than that of Bond and Bergstrom (2006) since it underestimates by only 4 % (30 % for that of Bond and Bergstrom, 2006) the mass absorption cross-section reference value (MAC) for freshly emitted BC, i.e. unaged and uncoated (Bond and Bergstrom, 2006; Liu et al., 2020).
The spectral BrOC refractive index provided by Hoffer et al. (2016, 2017), i.e. at 550 nm, has been used in our numerical experiments with three values of absorbing fractions of OC (0, 0.025 and 0.05) based on preliminary sensitivity tests. Hoffer et al. (2016, 2017) are the first, to our knowledge, to propose a direct experimental measurement of the absorption of BrOC particles from the ultraviolet to the near-infrared using an aethalometer with seven spectral bands (370–950 nm).
Table 2Main parameters investigated, with range of values tested in simulations experiments performed with WRF-Chem, considering the range of values reported in the literature. As indicated in Fig. 3, S1 corresponds to the WRF-Chem partially constrained simulation and S2 to the WRF-Chem optimized configuration. BC, OC and BrOC represent the black carbon, organic carbon and brown carbon in biomass burning aerosols emitted by WRF-Chem.
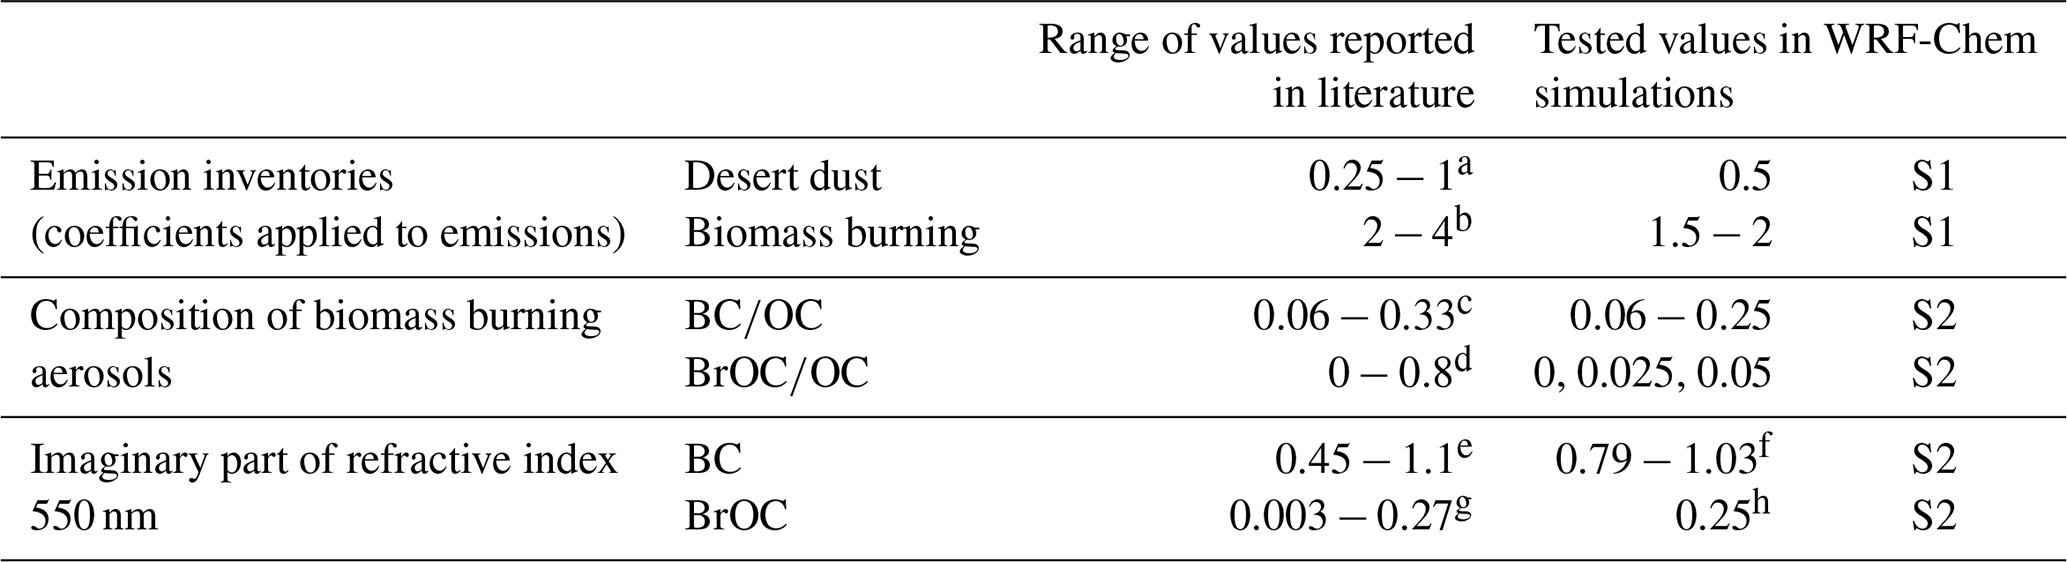
a Flaounas et al. (2016). b Turquety et al. (2014). c Werf et al. (2010) and Akagi et al. (2011). d Feng et al. (2013). e Liu et al. (2018). f Bond and Bergstrom (2006) and Williams et al. (2007). g Alexander et al. (2008) and Sumlin et al. (2017). h Hoffer et al. (2016, 2017).
It should be noted that other parameterizations in the model governing the life cycle of aerosols, such as ageing, mixing, deposition or entrainment, have not been modified or tested, but they may also have an impact on the AOD and the SSA. The performance of the WRF-Chem numerical simulations will be assessed using commonly used statistical parameters (see Appendix A) (Thunis et al., 2011; Lingard et al., 2013): the Pearson correlation coefficient (R), the mean bias (MB), the mean absolute error (MAE) and the root mean square error (RMSE).
3.1 Meteorology in the WRF-Chem initial configuration (S0)
Figure 4, Fig. 5 and Fig. 6 show the spatial distributions of monthly averaged wind speed (in m s−1) and direction, specific humidity (in g kg−1), and temperature (in ∘C) respectively. The parameters at 850 hPa (left), 700 hPa (middle) and 500 hPa (right) for July 2008 simulated with WRF-Chem in its initial configuration (bottom) are compared to the ECMWF ERA-Interim reanalysis (top).

Figure 4Monthly averaged wind speed (m s−1) and direction at 850 hPa (a, d), 700 hPa (b, e) and 500 hPa (c, f) from ECMWF ERA-Interim reanalysis (a, b, c) and simulated with the WRF-Chem initial configuration (d, e, f) for July 2008.
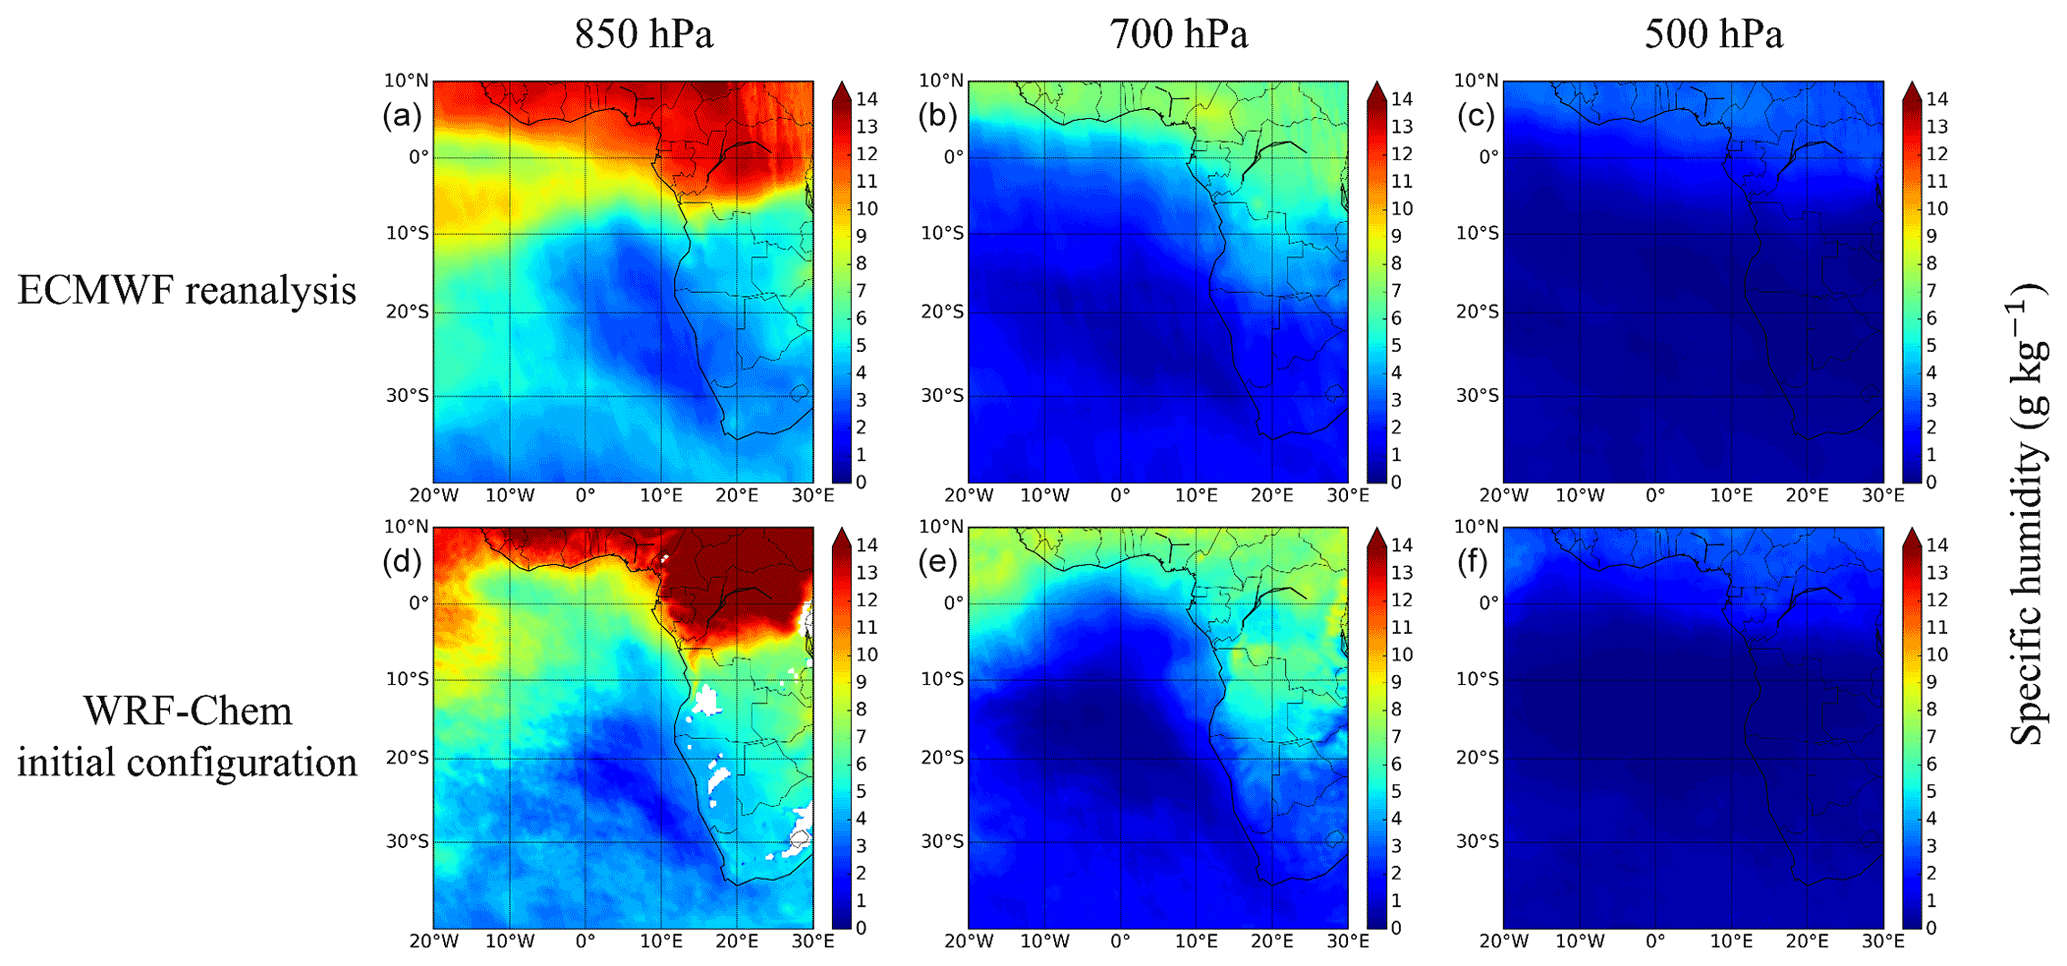
Figure 5Same as Fig. 4 but for specific humidity (in g kg−1).
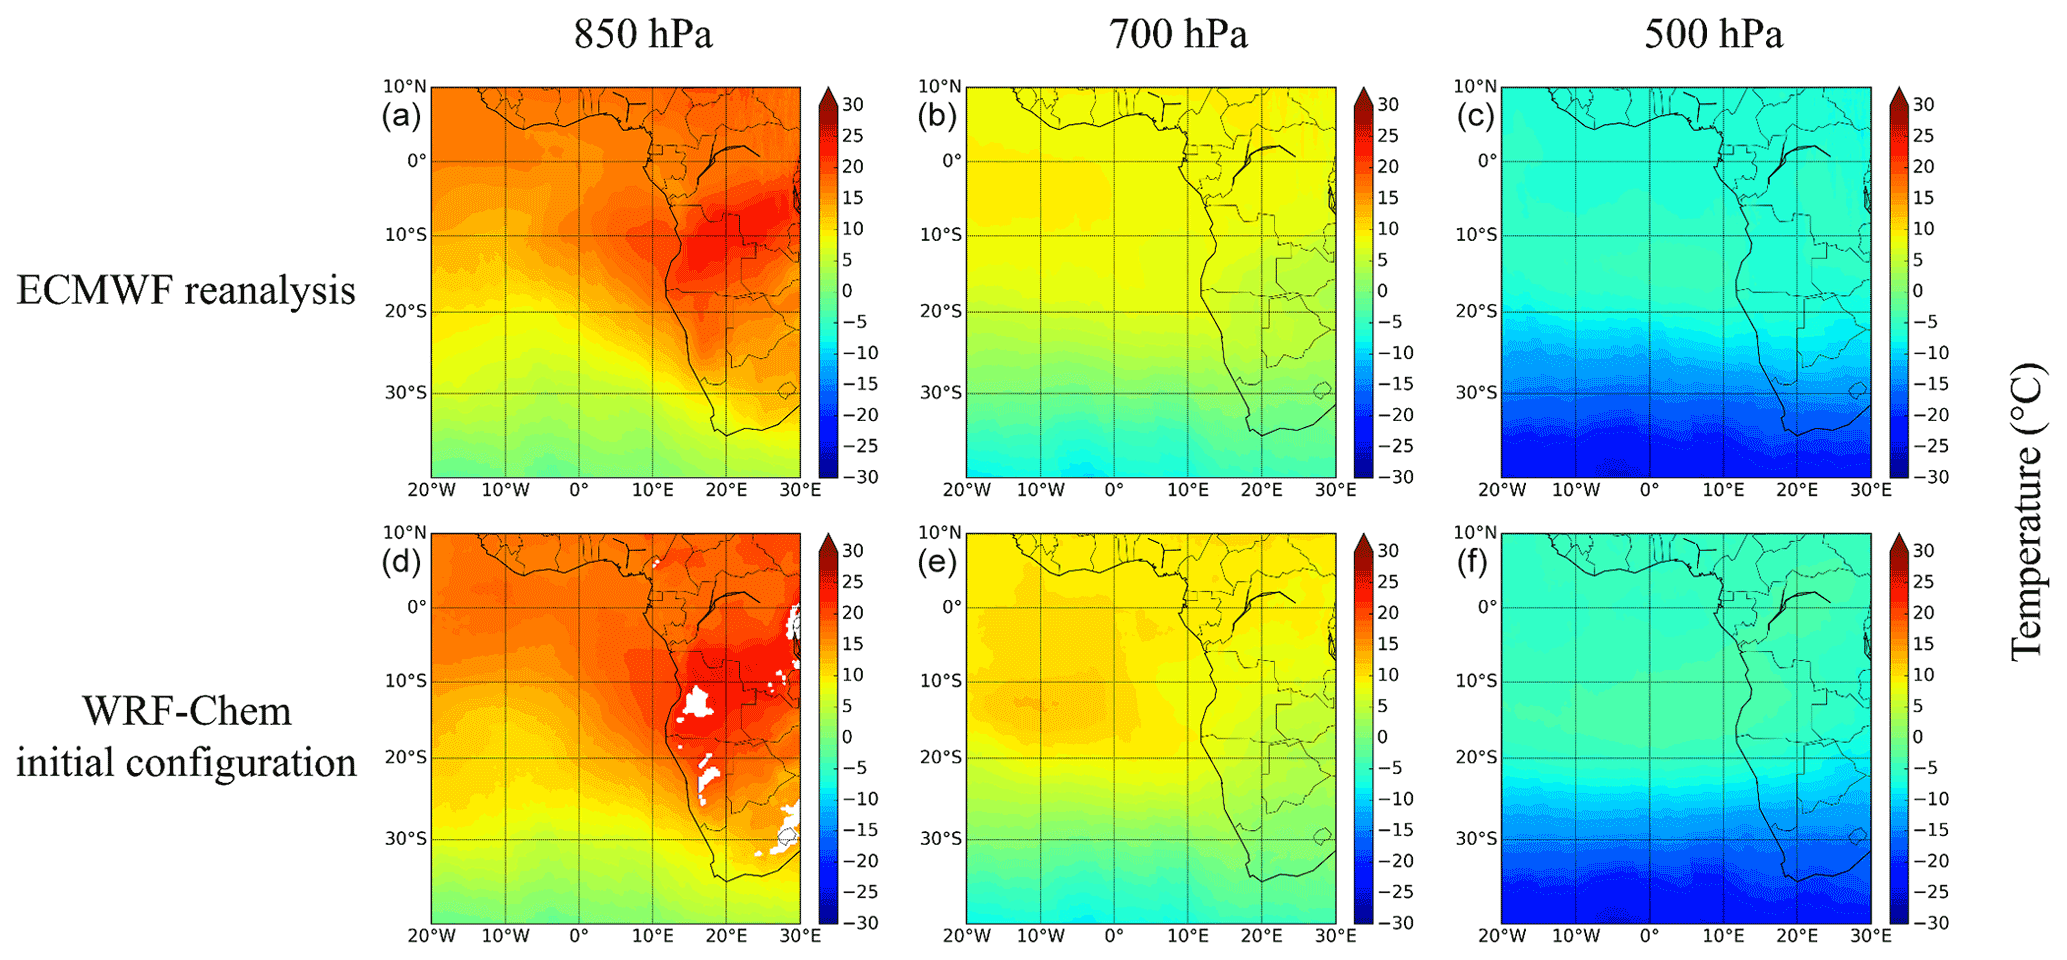
Figure 6Same as Fig. 4 but for temperature (in ∘C).
Figure 4, Fig. 5 and Fig. 6 show that the WRF-Chem initial configuration correctly simulates the general pattern of wind speed, wind direction, humidity and temperature in terms of both magnitude and location at the three pressure levels, with only local minor differences. North of the 20th parallel south, the mean simulated winds blow westward off of land and favour a westward transport of BBA plumes emitted from the southern African continent. The WRF-Chem initial configuration slightly overestimates the magnitude of the wind speed with positive mean biases of only 1.18 m s−1 at 850 hPa, 0.68 m s−1 at 700 hPa, and 0.60 m s−1 at 500 hPa and with low root mean square errors (<1.9 m s−1). The WRF-Chem initial configuration slightly underestimates the magnitude of the specific humidity at 850 and 500 hPa with a negative mean bias of only 0.19 g kg−1 for both pressure levels and low root mean square errors (≤1.1 g kg−1), which could impact the column-integrated/above-cloud AOD. Finally, the WRF-Chem initial configuration slightly overestimates the magnitude of temperature for the three pressure levels with low positive mean biases of 0.93∘C at 850 hPa, 0.94∘C at 700 hPa and 1.17∘C at 500 hPa.
Table 3Meteorology performance statistics of WRF-Chem initial configuration compared to ECMWF ERA-Interim reanalyses. WSPD, WDIR, Q and T represent the wind speed, the wind direction, the specific humidity and the temperature respectively. N, ME, MAE, RMSE and CORR represent the number of coincident data pairs, the mean error, the mean absolute error, the root mean square error and the spatial Pearson correlation coefficient, respectively. The units of the statistical parameters are the same as meteorological variables.
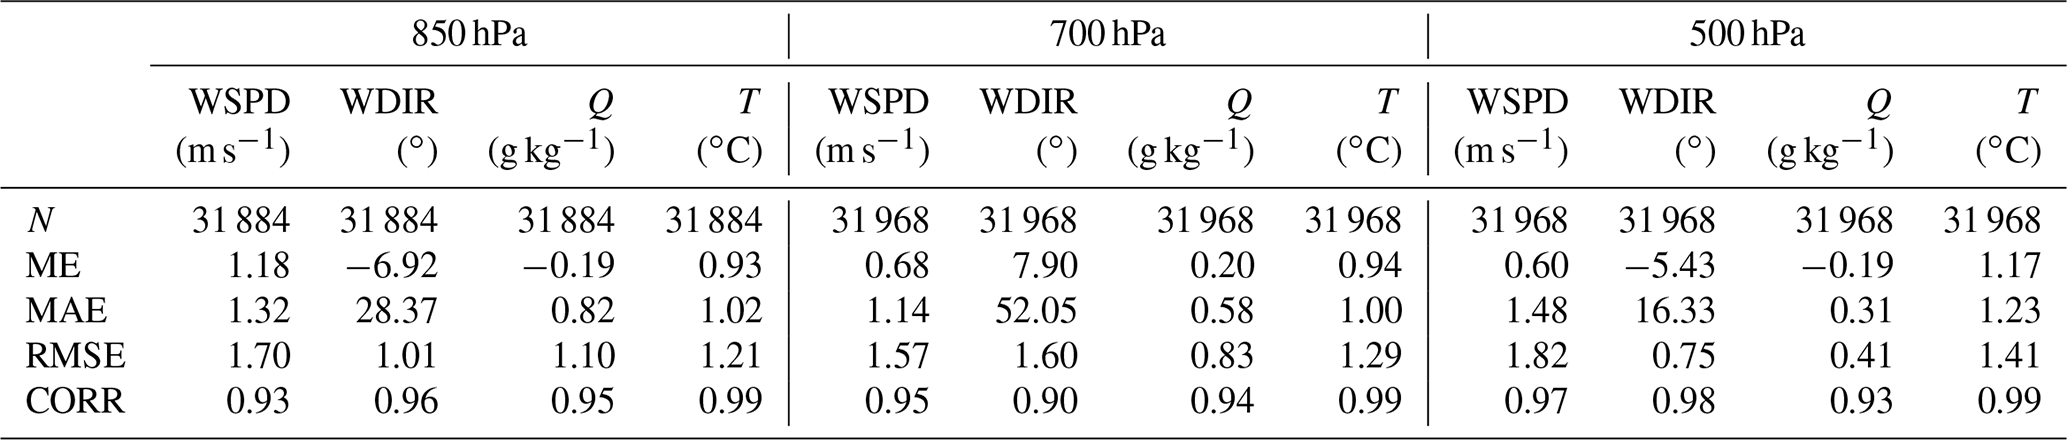
Table 3 summarizes the statistics of the comparisons between the simulated and ECMWF wind speed (WSPD, in m s−1), wind direction (WDIR, in ∘), specific humidity (Q, in g kg−1) and temperature (T, in ∘C) at 850, 700 and 500 hPa on average over the SEA region for July 2008. The statistical results shown in Table 3 confirm the overall good agreement between the WRF-Chem initial configuration and the ECMWF reanalysis with spatial correlation coefficients between 0.90 and 0.99. In summary, this evaluation strongly suggests that the WRF-Chem initial configuration is able to correctly reproduce the local meteorology for the domain and the period considered in this study.
3.2 Aerosol distribution and size in the WRF-Chem partially constrained configuration (S1)
3.2.1 Strength of aerosol emissions
The column-integrated AOD that reflects the vertically integrated aerosol concentration is used here to assess the strength of the simulated aerosol emission sources. Figure 7 illustrates the spatial distribution of monthly averaged AOD at 565 nm in clear sky retrieved by POLDER-3/GRASP (a) and simulated with the initial configuration (b) and with the PC configuration (c) of WRF-Chem for July 2008.

Figure 7Monthly averaged aerosol optical depth (AOD) at 565 nm in clear sky retrieved by POLDER-3/GRASP (a) and simulated with the WRF-Chem initial configuration (b) and with the WRF-Chem partially constrained configuration (c) for July 2008, with the associated histograms of differences between the model and the satellite observations over the whole domain (d, e). The black frames (20∘ W–30∘ E, 39.9∘ S–10∘ N) represent the area of study.
Figure 7 shows that the WRF-Chem initial configuration (mean AOD) significantly underestimates, by a factor of 2 on average, the AOD retrieved by POLDER-3/GRASP (mean AOD) at 565 nm in clear sky over the BB emission sources (12–30∘ E, 10–0∘ S) for July 2008. This bias could be due to an underestimation of the fire activity in the BB emission inventory. The assessment of APIFLAMEv1 by Turquety et al. (2014) indicates possible biases of a factor of 2 to 4 on all amounts of emitted gas and particulate species by BB. We have thus tested three multiplying factors (1, 1.5 and 2). As a result, the adjustment factor of 1.5 represented the best compromise to reproduce the AODs retrieved by POLDER-3/GRASP both over land and above the ocean, even if small biases were still present. Therefore, we have chosen to correct the APIFLAMEv1 BB emission inventory with a moderate multiplicative factor of 1.5 on all the gas and particulate species, in agreement with the uncertainties provided by Turquety et al. (2014). It is worth noting that this scaling is a common practice in climate modelling studies for BBA to better reproduce the observed satellite AODs (Johnson et al., 2016) with emission factors generally higher than 1 (up to 6, Reddington et al., 2016).
Figure 7 also shows that, over the northern half of Africa in the Sahara and Sahel region, the average values of AOD are highly overestimated in the WRF-Chem initial configuration (mean mean AOD) compared to the POLDER-3/GRASP retrievals (mean AOD). The GOCART AFWA desert dust emission module used in WRF-Chem (Jones et al., 2010, 2012), based on the Marticorena and Bergametti (1995) scheme, seems to raise too much mineral dust over the Sahara/Sahel area. According to the recommendations of Flaounas et al. (2016), who made an assessment of atmospheric dust modelling performance by WRF-Chem (version 3.6) against MODIS observations on arid and semi-arid regions around the Mediterranean, we have applied the adjustment coefficient of 0.5 on the desert dust emission surface fluxes in the GOCART AFWA scheme. This corrected version of WRF-Chem, in terms of BB and desert dust emissions, is the so-called PC configuration (S1).
Figure 7 shows that the WRF-Chem PC configuration better reproduces the magnitude of both BB and desert dust emission sources over land and their transport above ocean compared to WRF-Chem in its initial configuration, even if some biases still remain.
3.2.2 Aerosols and clouds vertical distribution
Besides the simulated aerosol loads, the major factors that may influence the WRF-Chem ACAOD are the BBA injection height, the cloud top height and the vertical distribution of both aerosols and clouds.
The injection height of BBA conditions their transport and their potential interactions with cloud layers (Hansen et al., 1997; Podgorny and Ramanathan, 2001; Rosenfeld et al., 2014; Lee et al., 2016). BBA simulated with the WRF-Chem PC configuration are injected into the atmosphere up to an altitude of about 6 km, consistent with CALIOP observations analysed in this part of the world (Koffi et al., 2012, 2016). This allows them to be transported over a long distance. One of WRF-Chem's strengths for the simulation of BBA is that their injection height is dynamically calculated according to the thermodynamic conditions of fires, whereas it is generally prescribed in climate models (Freitas et al., 2006, 2007; Grell et al., 2011).
The cloud top height from satellite is based on the POLDER oxygen pressure method (Vanbauce et al., 2003; Ferlay et al., 2010; Deaconu et al., 2019). Deaconu et al. (2019) showed that the oxygen pressure method underestimates the cloud top height by about 200–300 m for low liquid clouds compared to the CALIOP retrievals. We applied their proposed empirical relationship to correct the altitude of the cloud top height retrieved by POLDER-3 which is valid for our study area. The advantage of the corrected POLDER-3 data is the much greater spatial coverage than that of the CALIOP lidar, which allows us to obtain better statistics. The estimation of the cloud top height is not directly provided by WRF-Chem. As a first approach, we have only selected clouds with a vertical monolayer structure in the model, i.e. for which the simulated vertical profile of the cloud liquid water content (QCLOUD) has one maximum. We have qualified these clouds as homogeneous (in the vertical sense) in the following. Clouds with a complex vertical structure have been qualified as heterogeneous. For these last situations, the simulated QCLOUD vertical profile has several maximums, and the top of the stratocumulus cannot, therefore, be easily defined. The main advantage of this technique is to guarantee the selection of uniform monolayer cloud situations, consistent with data obtained from the POLDER-3/AERO-AC inversion algorithm (Waquet et al., 2013a, b; Peers et al., 2015). Situations with cirrus clouds are rejected as in the POLDER-3/AERO-AC product. The cloud top height is then determined by scanning the cloud profile from the bottom to the top and stopping at a threshold value of liquid water content (LWC). A statistical study was carried out to determine the optimal value of this threshold. We have considered threshold values between 50 % and 100 %, corresponding to a fraction of the vertically integrated QCLOUD in the WRF-Chem PC configuration. This analysis showed that, statistically, the closest results to the POLDER-3 retrievals were obtained with a threshold of 95 % (see Fig. 8). Below this value, the cloud top heights simulated with the WRF-Chem PC configuration shift towards the lowest value classes, enhancing the underestimation of the simulated values compared to the POLDER-3 retrievals. For a threshold of 100 %, the number of cases for the highest classes increases, enhancing the overestimation of the values simulated with the WRF-Chem PC configuration in comparison with those retrieved by POLDER-3. Figure 8 illustrates the spatial distribution of monthly averaged cloud top heights retrieved by POLDER-3 (a) and simulated with the WRF-Chem PC configuration with the threshold of 95 % (b) for July 2008.
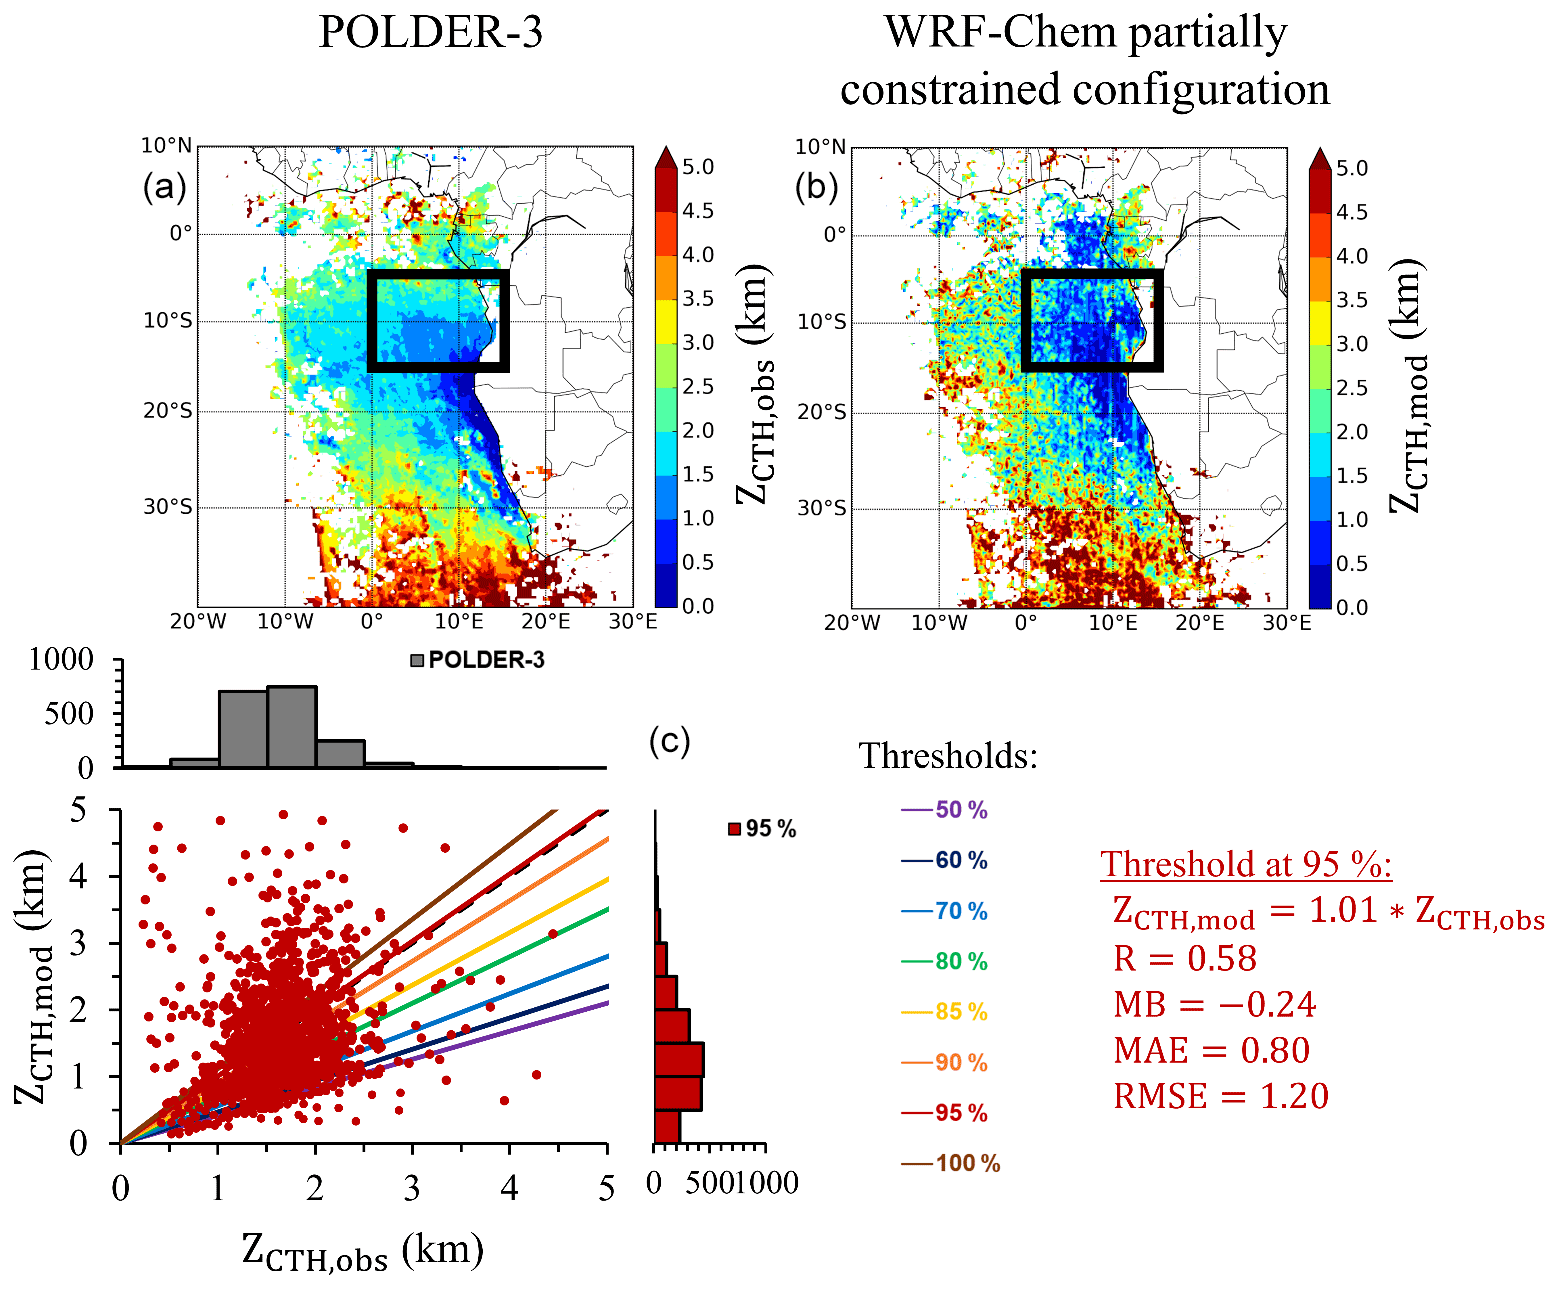
Figure 8Monthly averaged cloud top heights retrieved by POLDER-3 (a) and simulated with the WRF-Chem partially constrained configuration with the threshold of 95 % (b) for July 2008, with an associated statistical analysis of the threshold values of the cloud top height tested in the model (c). The black frames (0–15∘ E, 15–5∘ S) represent the area of study.
Figure 8 shows that along Angola and Namibia, the WRF-Chem PC configuration simulates well the low cloud area typically observed in these regions (Deaconu et al., 2019). In the studied area (black frame), Fig. 8 shows that the WRF-Chem PC configuration slightly underestimates the mean altitudes of the cloud top compared to the POLDER retrievals. South of the studied area as well as north over land (Congo, Gabon), cloud convection is fairly well reproduced with the WRF-Chem PC configuration, with a mean cloud top height above 2 km. In contrast, a major difference is observed to the west of the studied area, with the WRF-Chem PC configuration simulating cumulus clouds with a mean cloud top height greater than 2.5 km, unlike POLDER-3 that retrieves low clouds with a mean cloud top height around 1.5–2.0 km. The difference between the model and the POLDER-3 retrievals could come from the planetary boundary layer scheme (YSU, Hong et al., 2006) used in the WRF-Chem PC configuration.
Figure 9 illustrates the vertical profiles of the aerosol extinction coefficient (σext, in km−1) retrieved by CALIOP at 532 nm (orange dotted lines) and simulated with the WRF-Chem PC configuration at 550 nm (red solid lines) for 12 July 2008 (a) and 28 July 2008 (b). These two specific days were selected due to dense BBA plumes transported above marine clouds over the SEAO. The extinction of aerosols retrieved by CALIOP above clouds has been corrected with POLDER-3/AERO-AC according to Deaconu et al. (2019). Deaconu et al. (2017) have shown that CALIOP underestimates the aerosol load above clouds by a factor of 2 to 4 in comparison with the POLDER-3/AERO-AC retrievals and other advanced CALIOP products such as the so-called depolarization ratio method (Hu et al., 2009). Vertical profiles of the simulated aerosol extinction coefficients are averaged under the CALIOP track aggregated over the area (0–15∘ E, 15–5∘ S). This area is characterized by the presence of a semi-permanent layer of marine stratocumulus (see Fig. 2). The mean cloud top heights retrieved by CALIOP (green dotted lines) and simulated with the WRF-Chem PC configuration (blue solid lines) are also shown in Fig. 9.

Figure 9Mean vertical profiles of the aerosol extinction coefficients retrieved by CALIOP at 532 nm (orange dotted lines) and simulated with the WRF-Chem partially constrained configuration at 550 nm (red solid lines) under the CALIOP track inside the study area (0–15∘ E, 15–5∘ S) for 12 July 2008 (a) and 28 July 2008 (b). Mean cloud top heights retrieved by CALIOP (green dotted lines) and simulated with the WRF-Chem partially constrained configuration (blue solid lines) are also incorporated into the graphics. CALIOP data, initially at a horizontal spatial resolution of 5×5 km2, were aggregated onto the WRF-Chem mesh (30×30 km2), and only the coincident pixels were selected for the comparison study.
In Fig. 9, similarities are observed between the vertical profiles from CALIOP and from the WRF-Chem PC configuration with two distinct aerosol layers and the presence of a low cloud layer for both case studies. However, mean altitudes of the aerosol and the cloud layers differ slightly and appear to be systematically underestimated in the WRF-Chem PC configuration compared to the CALIOP retrievals. For 12 July 2008, the aerosol layer located between 0 and 0.8 km above sea level, generally detected by CALIOP and simulated with the WRF-Chem PC configuration, corresponds to sea salt aerosols in the model, as usually observed in the boundary marine layer (Deaconu et al., 2019; Peers et al., 2019). The aerosol layer located between 1.4 and 4.0 km in the CALIOP observations and between 0.8 and 3.4 km in the WRF-Chem PC configuration corresponds to BBA plumes usually observed in this region at this time of the year (Koffi et al., 2012, 2016; Zuidema et al., 2016b; Formenti et al., 2019). Regarding clouds, the WRF-Chem PC configuration underestimates by about 200 m (300 m) the mean cloud top height on 12 July 2008 (28 July 2008) compared to the CALIOP retrievals. It is worth noting that many models share these aerosol layer altitude biases over this region (Shinozuka et al., 2020) and that the BBA altitude may decrease during the transport (Deaconu et al., 2019). Even if the altitudes of the simulated BBA layers are too low in comparison with the CALIOP retrievals, most of the modelled aerosol extinction is located above clouds, and, therefore, we can conclude that the WRF-Chem PC configuration reproduces well the aerosol load integrated above clouds.
3.2.3 Particle size
The SSA of aerosols, which accounts for their absorption properties, depends on both the particles size and their chemical composition (Abel et al., 2003; Laing et al., 2016). The aerosol size can be qualitatively estimated by the AE, with the highest values corresponding to the finest particles (Ångström, 1929). Figure 10 shows the evolution of the vertically integrated (whole atmospheric column) volume size distribution of aerosols simulated with the WRF-Chem PC configuration during the transport of BBA plumes averaged over July 2008.
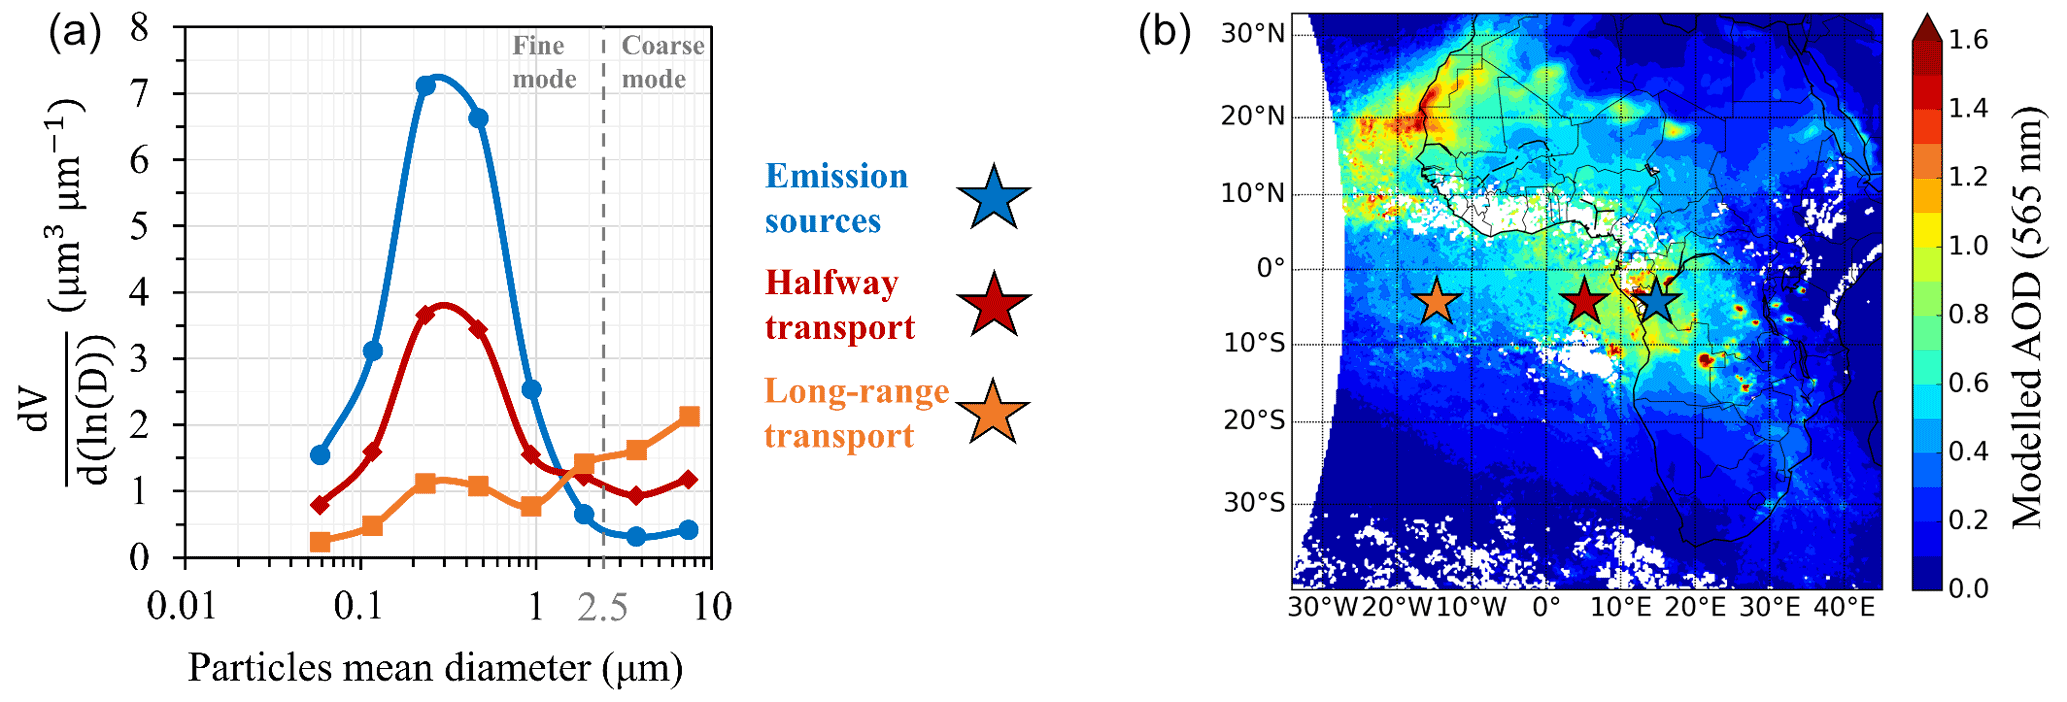
Figure 10Evolution of the vertically integrated (whole atmospheric column) volume size distribution of aerosols (a) simulated with the WRF-Chem partially constrained configuration for three areas representative of the emission sources and transport progress of the biomass burning aerosol plume (b) on average for July 2008. The blue star corresponds to the pixel (14.83∘ E, 4.00∘ S) and symbolizes the emission sources of biomass burning particles. The red star corresponds to the pixel (4.82∘ E, 4.00∘ S) and symbolizes the biomass burning aerosol plume transported halfway westward over the southeastern Atlantic Ocean. The orange star corresponds to the pixel (14.93∘ W, 4.00∘ S) and symbolizes the long-range transport of the biomass burning aerosol plume.
Figure 10 indicates that fine-mode particles dominate the aerosol volume size distribution near BBA emission sources, with a mean particle diameter centred at 0.3 µm corresponding to the accumulation mode. During the aerosol transport, there is a gradual appearance of larger particles (diameter >1 µm), which may be linked to ageing processes and also to a slightly more pronounced influence of other larger particles, such as sea salt aerosols mostly in the boundary layer and possibly desert dust aerosols at higher altitudes, which may come across the BBA plumes over the SEAO.
Figure 11 shows the spatial distributions of the AE retrieved by POLDER-3 (a, d) and simulated with the WRF-Chem PC configuration (b, e) in clear sky (AE670−865, a, b) and above clouds (ACAE670−865, d, e) on average for July 2008.
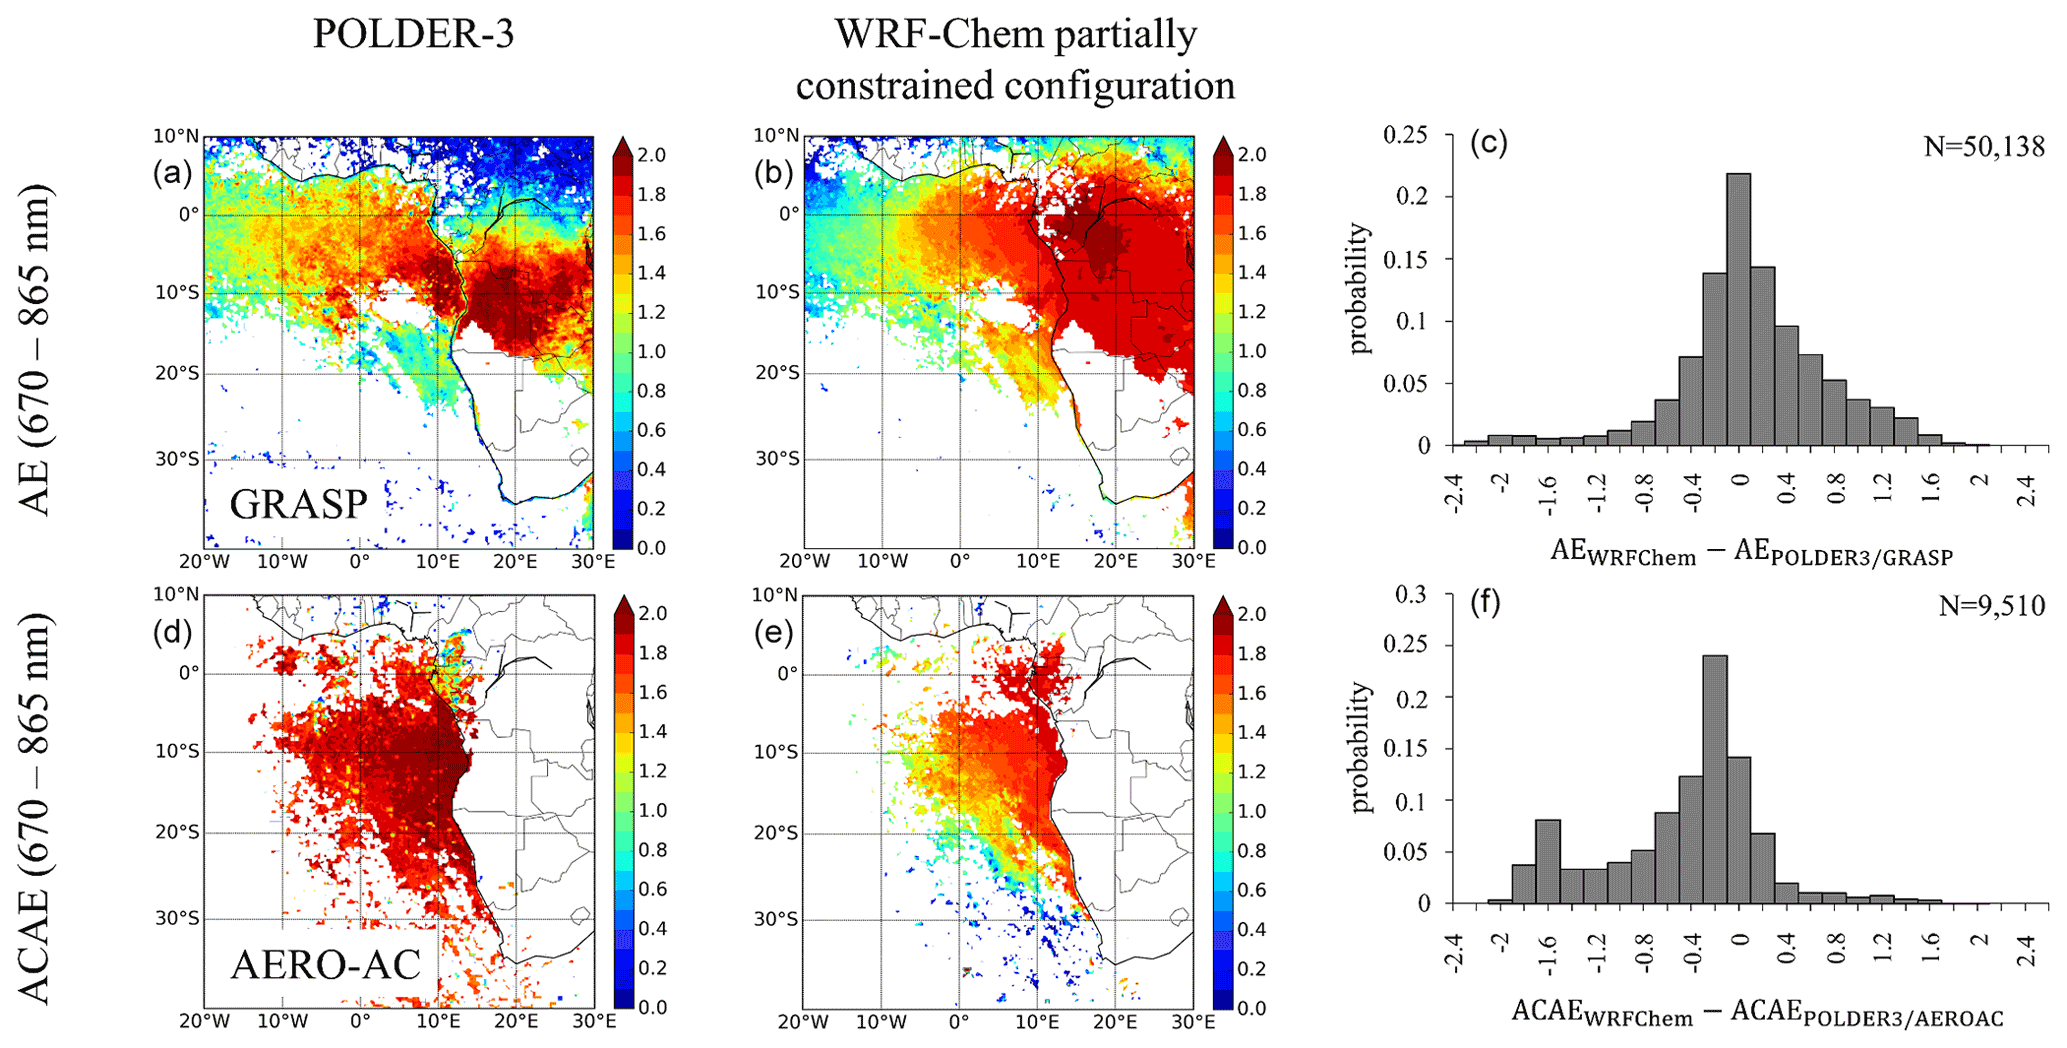
Figure 11Monthly averaged Ångström exponent retrieved by POLDER-3 in clear sky with GRASP (AE670−865, a) and above clouds with AERO-AC (ACAE670−865, d) and simulated with the WRF-Chem partially constrained configuration (b, e) for July 2008, with the associated histograms of differences between the model and the satellite observations over the whole domain (c, f).
Figure 11 shows a good agreement between the POLDER-3/GRASP retrievals (a) and the WRF-Chem PC configuration in clear sky (b) with simulated AE670−865 values greater than 1 over the SEA region and close to 2 over BB emission sources, with these values being very comparable to those derived from POLDER-3. These values are typical of fine BB particles usually observed in this region (Dubovik et al., 2002). Above clouds over the SEAO, Fig. 11 suggests a decrease in the ACAE associated with the westward progression of the BBA plumes, particularly in the WRF-Chem PC configuration (e). Such an evolution could be related to a gradual growth of BB particles size and/or changes of the overall chemical composition of BBA plumes. Indeed, a decrease in the relative amount of fine BB particles and an increase in the proportion of coarse-mode particles (sea salt and desert dust aerosols) could occur during the transport of BBA plumes over the SEAO, as shown in Fig. 10.
Overall, Fig. 11 indicates that the particle sizes simulated with the WRF-Chem PC configuration are realistic, considering BBA plumes in clear sky and above clouds, with only few minor differences compared to the POLDER-3 retrievals. Therefore, in the following, we assume that the potential difference between the simulated and the observed SSA is primarily due to the chemical composition.
3.3 Sensitivity analysis of aerosol absorption in the WRF-Chem partially constrained configuration
Figure 12 illustrates the monthly averaged PM2.5 chemical composition simulated with the WRF-Chem PC configuration, including organic aerosols (OA, in green), secondary inorganic aerosols (SIA, in grey), organic carbon (OC, in brown), black carbon (BC, in black), desert dust aerosols (DUST, in yellow), and sea salt aerosols (SEAS, in blue), as well as their relative proportions over the southern African continent in clear sky (spatial average over 12–30∘ E, 10–0∘ S, a) and above clouds over the SEAO (spatial average over 0–15∘ E, 15–5∘ S, b) for July 2008.
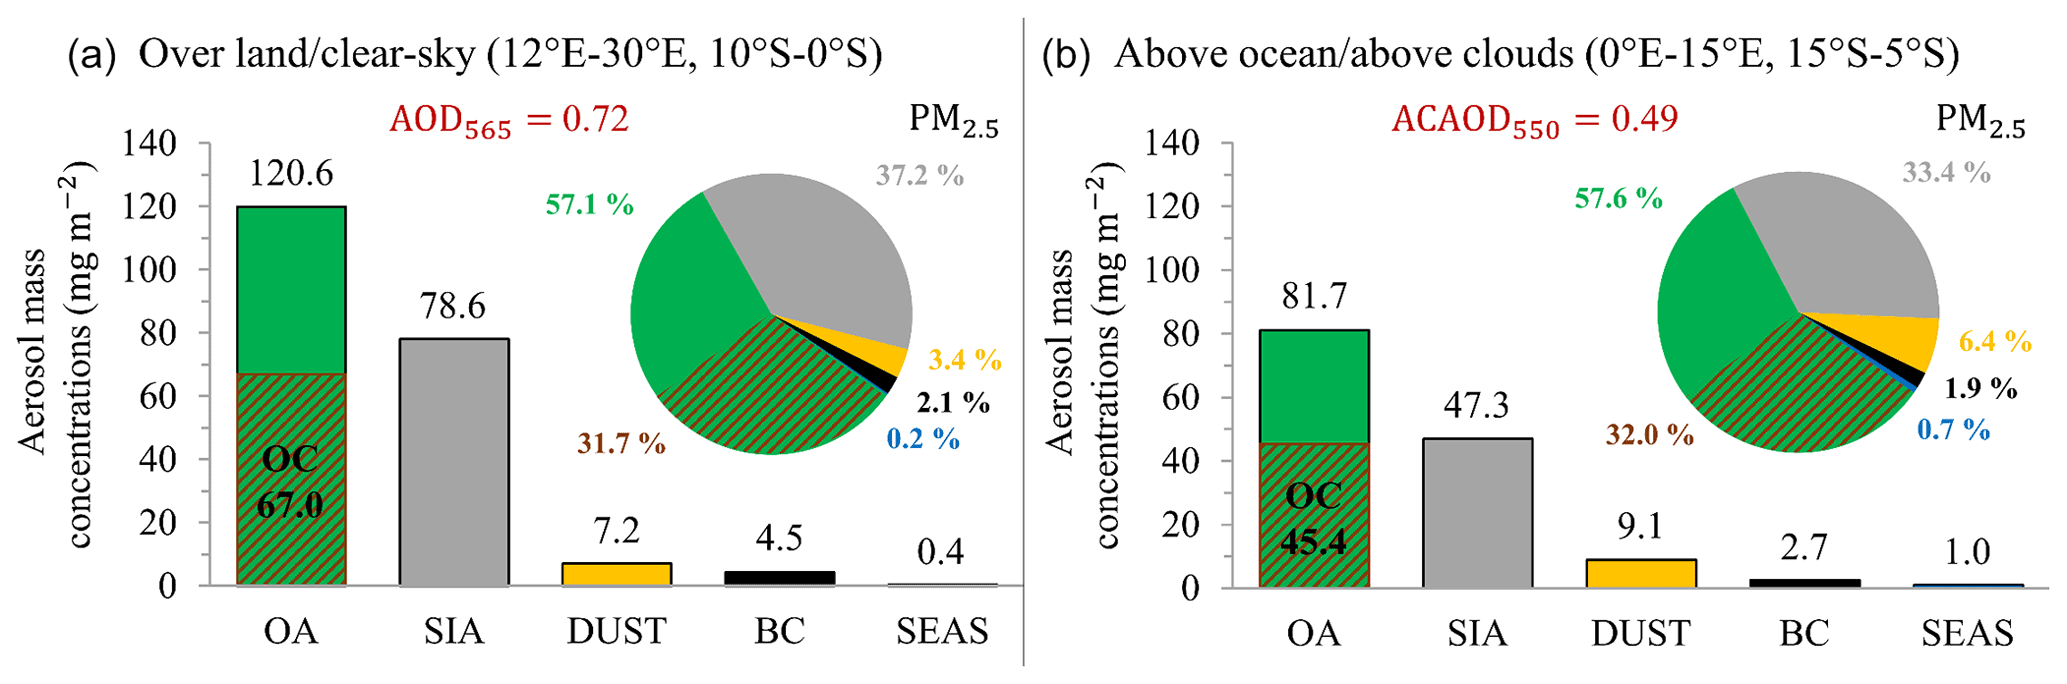
Figure 12Evolution of the PM2.5 chemical composition simulated with the WRF-Chem partially constrained configuration between the southern African continent in clear sky (12–30∘ E, 10–0∘ S, a) and the southeastern Atlantic Ocean above clouds (0–15∘ E, 15–5∘ S, b). Mass concentrations (in mg m−2) of the main aerosol compounds of biomass burning, i.e. black carbon (BC, black), organic carbon (OC, brown hatching), organic aerosols (OA, green), and secondary inorganic aerosols (SIA, grey), as well as desert dust aerosols (DUST, yellow) and sea salt aerosols (SEAS, blue), are vertically integrated over the atmospheric column on average for July 2008.
In the region of BB emission sources (12–30∘ E, 10–0∘ S), organic aerosols (OA, green) are the majority species, with a vertically integrated mass of 120.6 mg m−2 and representing 57.1 % of the total composition of PM2. Secondary inorganic aerosols (SIA, grey), i.e. sulfates, nitrates and ammonium, are the second dominant species, representing 37.2 % of the total composition of PM2 with a vertically integrated mass of 78.6 mg m−2, followed by organic carbon (OC, brown hatching) with a vertically integrated mass of 67.0 mg m−2 (relative proportion of 31.7 %). Vertically integrated mass concentration of black carbon (BC, black) is 4.5 mg m−2 (relative proportion of 2.1 %). During the transport of the BBA plumes above clouds over the SEAO (0–15∘ E, 15–5∘ S), mass concentrations of these BBA decrease due to the deposition processes. Figure 12 shows that the influence of desert dust and sea salt aerosols, although relatively low, increases during transport over the SEAO, from 7.2 to 9.1 mg m−2 for desert dust aerosols and from 0.4 to 1.0 mg m−2 for sea salt aerosols.
The chemical compositions of aerosols simulated with the WRF-Chem PC configuration appear realistic in comparison with the recent observations obtained from DACCIWA (Dynamics–aerosol–chemistry–cloud interactions in West Africa, Flamant et al., 2017) in southern West Africa (i.e. further north). Specifically, results obtained during the DACCIWA airborne campaigns showed that OA dominated by over 50 % the total mass of aerosols, that SIA contributed to about 34 % and that the contribution of BC was under 15 % (Haslett et al., 2019). However, we can note that BC contributions simulated with the WRF-Chem PC configuration (≤2.1 %) in our studied areas are smaller than those measured during DACCIWA and LASIC (Zuidema et al., 2018b; Zhang and Zuidema, 2021) campaigns.
Figure 13 illustrates the monthly averaged SSA in clear sky (a, b) and above clouds (d, e) retrieved by the GRASP/AERO-AC inversion algorithms (a, d) and simulated with the WRF-Chem PC configuration (b, e) at nm respectively for July 2008.
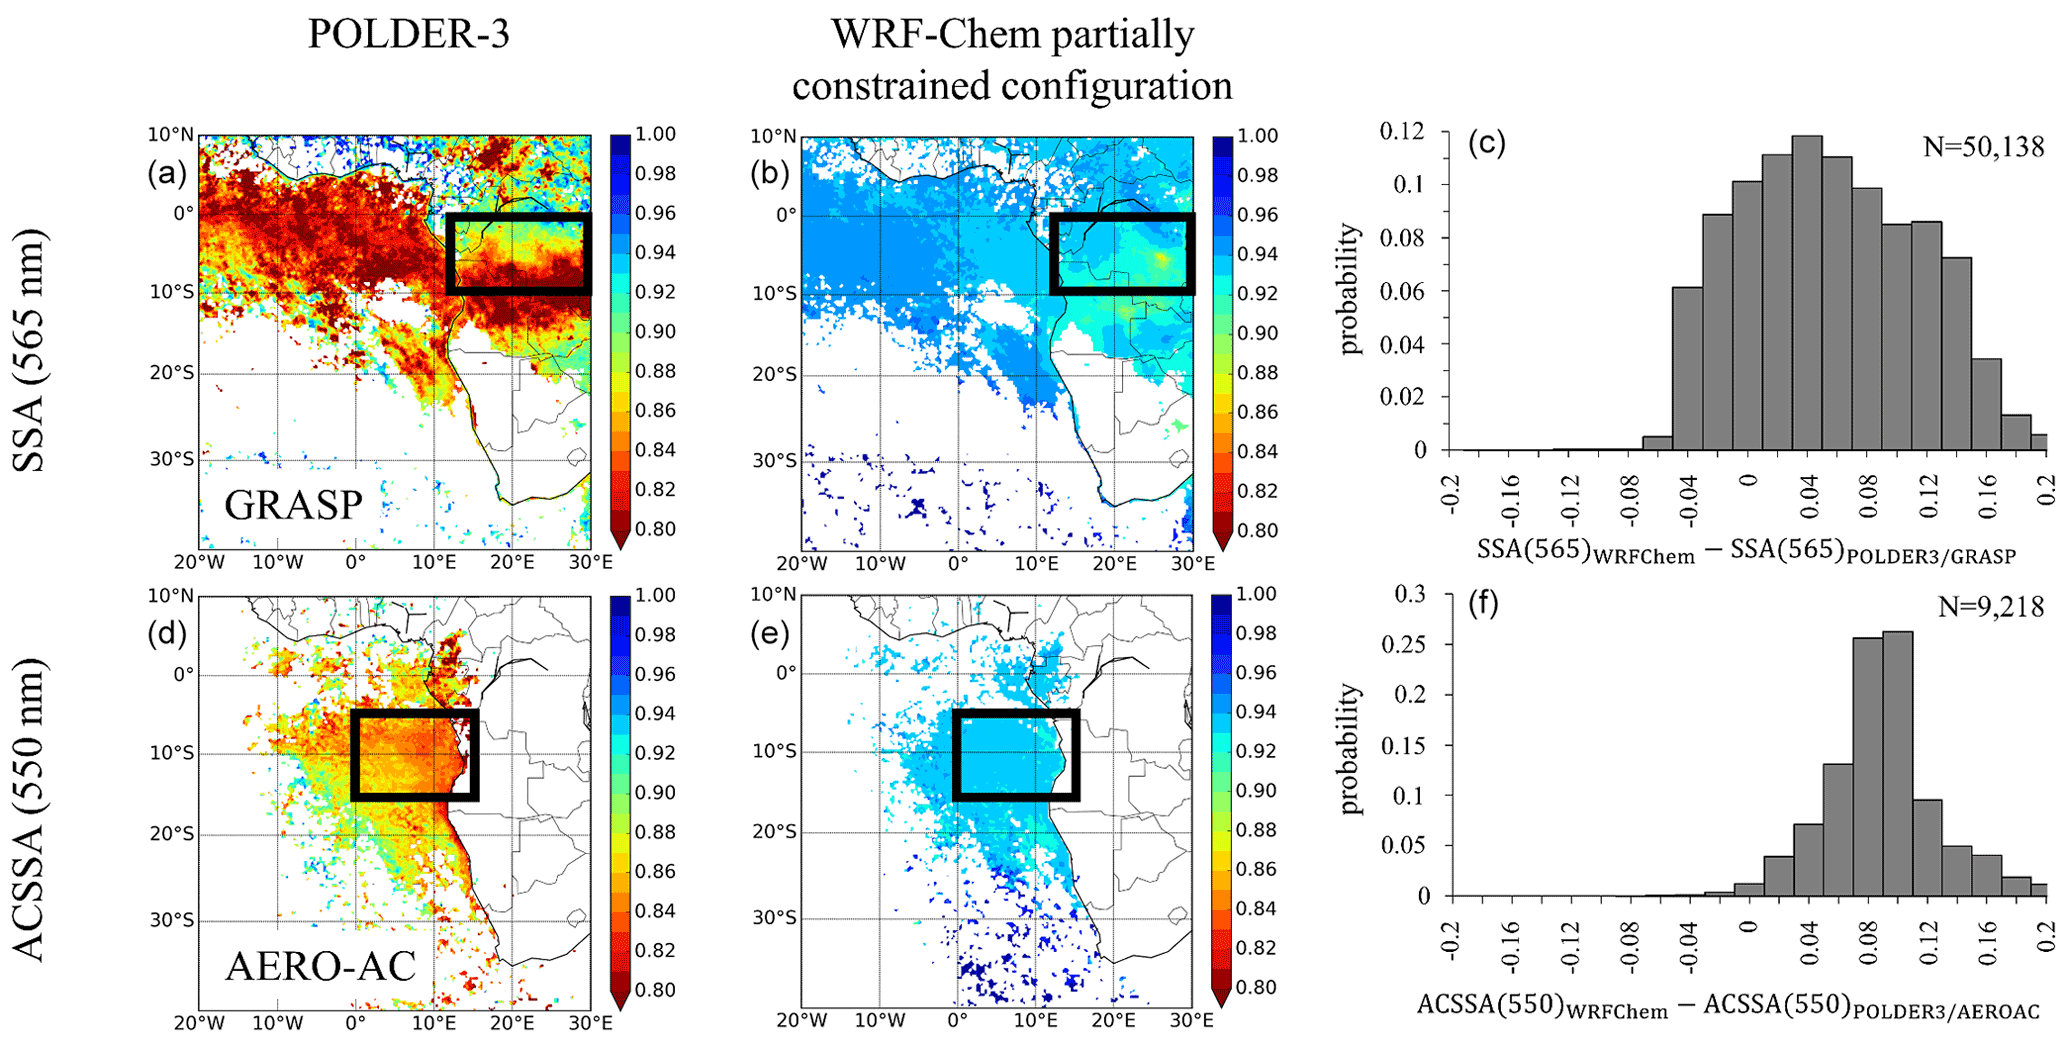
Figure 13Monthly averaged single scattering albedo of aerosols at 565 nm in clear sky (a, b) and at 550 nm above clouds (d, e) retrieved by POLDER-3 (a, d) and simulated with the WRF-Chem partially constrained configuration (b, e) for July 2008, with the associated histograms of differences between the model and the satellite observations over the whole domain (c, f). The black frames (12–30∘ E, 10–0∘ S) and (0–15∘ E, 15–5∘ S) represent respectively the two study regions, in clear sky (a, b) and above clouds (d, e).
Figure 13 clearly shows that the aerosols simulated with the WRF-Chem PC configuration, in which only BC absorbs solar radiation in the BBA plumes, are too scattering with a mean positive bias of about 0.08 between the simulated SSA and the one retrieved by POLDER-3, both in clear sky and above clouds, for July 2008. In the continental area in clear sky (12–30∘ E, 10–0∘ S), the mean SSA simulated with the WRF-Chem PC configuration is 0.93 at 565 nm, while the SSA retrieved by POLDER-3/GRASP is 0.85 at 565 nm. In the oceanic area above clouds (0–15∘ E, 15–5∘ S), the mean SSA simulated with the WRF-Chem PC configuration is 0.93 at 550 nm, which is well above the value of 0.85 at 550 nm retrieved by POLDER-3/AERO-AC. Furthermore, we can also observe a strong disagreement between the SSA from the WRF-Chem PC configuration and the SSA retrieved by POLDER-3/GRASP over the SEAO in clear atmosphere. On average, POLDER-3/GRASP retrieves a very low SSA of around 0.80 at 565 nm in this region, which the WRF-Chem PC configuration fails to reproduce. To explain the large discrepancies between the WRF-Chem PC configuration and the POLDER-3 retrievals, four hypotheses can be made. (i) There is not enough BC in the BBA plumes simulated with the WRF-Chem PC configuration. (ii) There is too much scattering organic aerosol in the simulated BBA plumes. (iii) The refractive index of BC used in the WRF-Chem PC configuration is not realistic enough. (iv) The presence of other absorbing species in the BBA plumes, such as the BrOC, needs to be considered in the WRF-Chem PC configuration.
Thus, we have analysed the sensitivity of the SSA to the chemical composition of BB carbonaceous aerosols through a set of numerical simulations as a lookup table (reported Table 4).
Table 4Table of numerical experiments performed with the WRF-Chem partially constrained configuration to test the impact of a range of organic carbon (OC), black carbon (BC) and brown carbon (BrOC) proportions on simulated biomass burning aerosols properties.
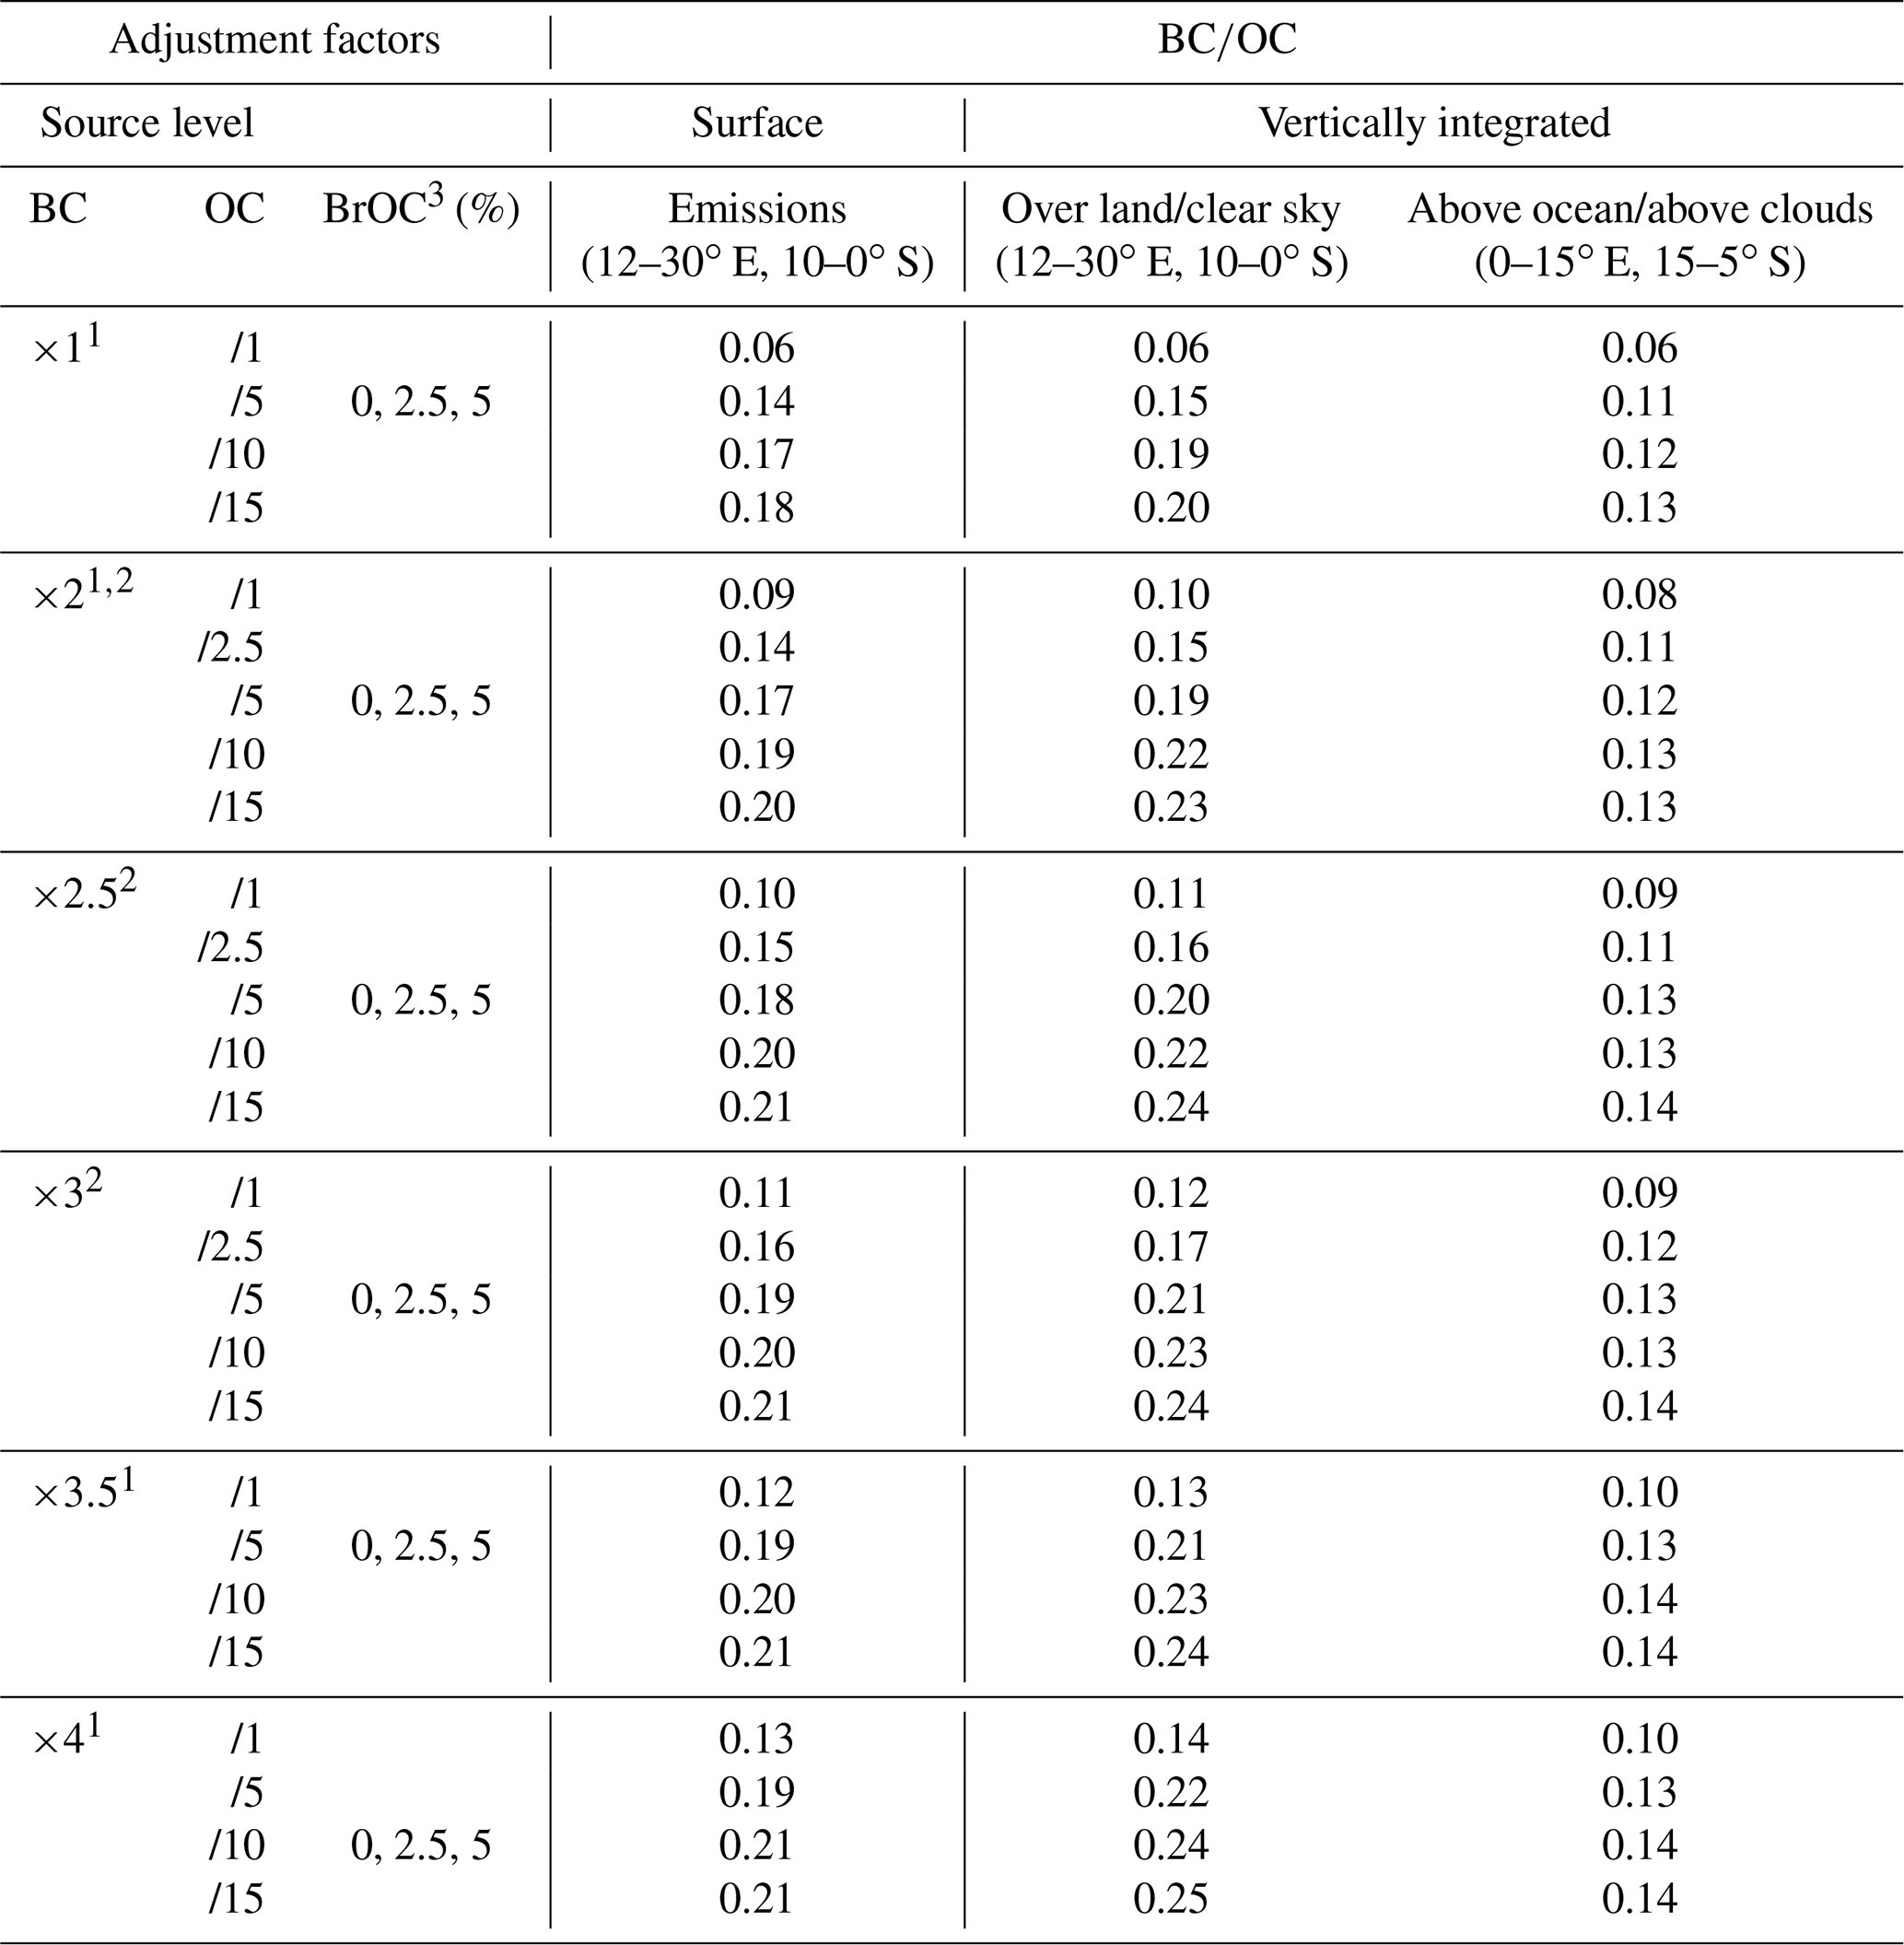
1 (Bond and Bergstrom, 2006). 2 (Williams et al., 2007). 3 (Hoffer et al., 2016, 2017).
We have considered adjustment factors up to 4 for BC and down to for primary OC (POC) at the source level, consistent with the uncertainties in the APIFLAMEv1 BB emission inventory (Turquety et al., 2014). For example, the possible underestimation of BC emissions could be due to an underestimation of the BC emission factor for savannahs (0.37±0.20 g kg−1) in Akagi et al. (2011) used in APIFLAMEv1 compared to the more recent BC emission factor of 0.53±0.35 g kg−1 for savannahs in Andreae (2019). Although the and reduction factors of POC can be considered outside of the POC emission uncertainties (70 % of uncertainty in APIFLAMEv1), the corresponding simulations are used to show the impact of an increased aerosol absorption due to a strong increased BC fraction. Each couple of BC and OC adjustment factors is associated with a varying contribution of BrOC equal to 0 %, 2.5 % or 5 %. The mass mixing ratio at the surface for all numerical experiments ranges from 0.06 to 0.21 and remains in the order of magnitude of those reported in the literature for African BB (see Table 2). These values are generally around 0.13–0.14 during the transport of the BBA plumes above clouds over the SEAO, consistent with southern Africa airborne measurements (Formenti et al., 2003; Kirchstetter et al., 2003; Capes et al., 2008).
The selection process of the best WRF-Chem solution is described as follows. A score is computed for each WRF-chem numerical simulation. The score is equal to the number of times the result of the simulation is included within the range of the retrieval uncertainties. This score is computed over all the pixels for the two selected areas (with and without clouds) and over all available spectral aerosol parameters (i.e. AOD, SSA, four spectral bands for AERO-AC and six for GRASP).
As a result, with the BC refractive index of Bond and Bergstrom (2006), , we were unable to find a realistic solution of WRF-Chem within the uncertainties of APIFLAMEv1 (Turquety et al., 2014). With the BC refractive index of Williams et al. (2007), , an optimized configuration of WRF-Chem was obtained. It corresponds to the combination of the following carbonaceous aerosol mixture: BC×2, with 2.5 % of BrOC. This WRF-Chem configuration is the one that statistically reproduces the spectral AOD and SSA retrieved by POLDER-3 the best, both in clear and cloudy atmospheres.
3.4 Aerosol optical properties in the WRF-Chem optimized configuration (S2)
Figure 14 illustrates the spectral dependencies of AOD (a, c) and SSA (b, d) simulated with the WRF-Chem optimized configuration (BC×2, with 2.5 % of BrOC, red curves) and retrieved by POLDER-3/GRASP in clear sky (black curves, a, b) and by POLDER-3/AERO-AC above clouds (black curves, c, d). Aerosol optical properties are averaged geographically on their respective studied areas (black frames in Fig. 2) and temporally over the first half of July 2008.
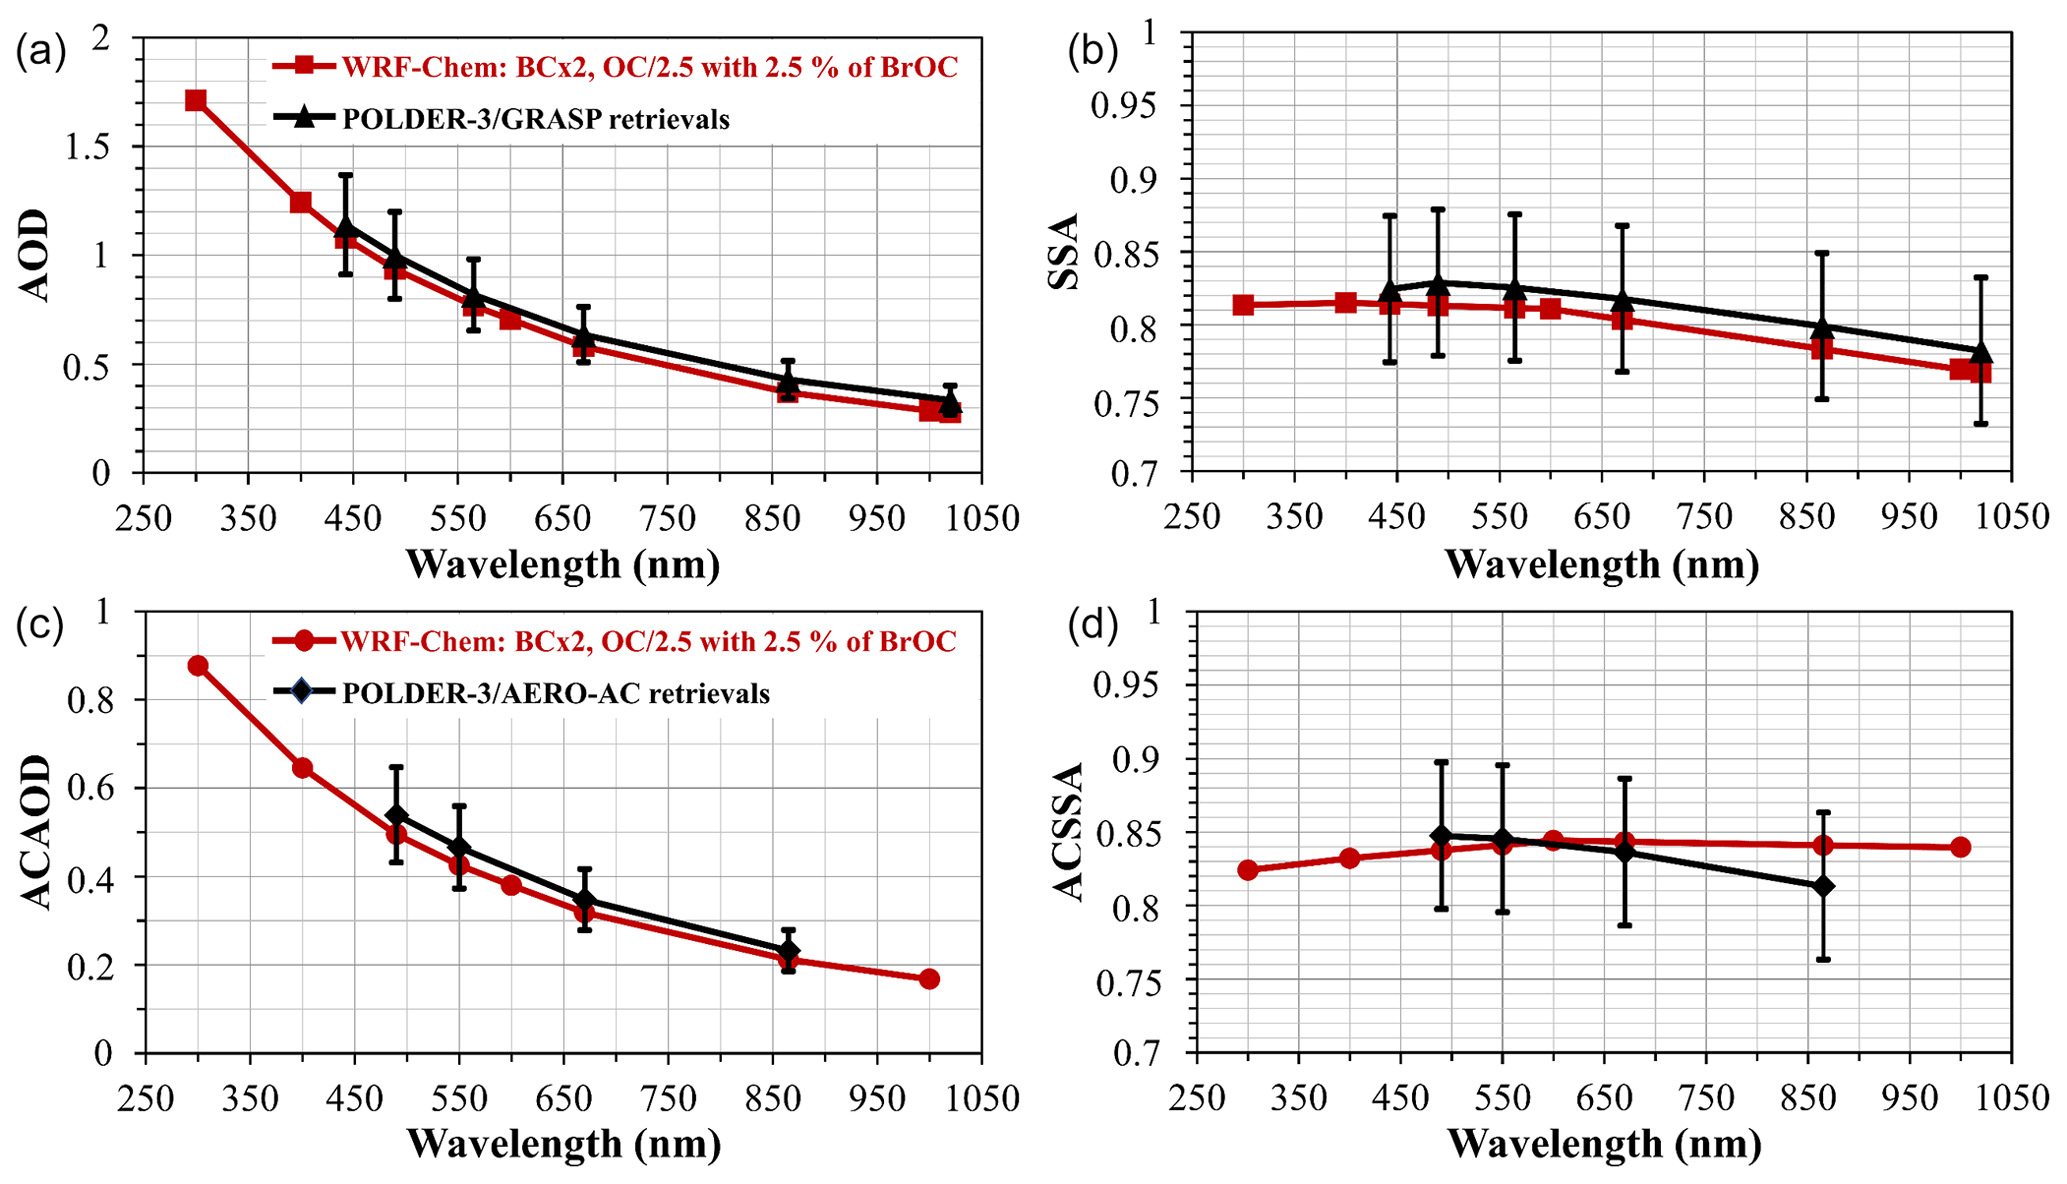
Figure 14Spectral dependencies of AOD (a) and SSA (b) retrieved by POLDER-3/GRASP in clear sky (a, b, black curves) and by POLDER-3/AERO-AC above clouds (c, d, black curves) and simulated with the WRF-Chem optimized configuration (BC × 2, with 2.5 % of BrOC, red curves). Black vertical error bars correspond to the uncertainties associated with POLDER-3 data with an accuracy of ±15 % (per pixel estimate) on the aerosol optical depth and ±0.05 % (per pixel estimate) on the single scattering albedo over the entire spectral domain. Values are averaged geographically on their respective study areas – (12–30∘ E, 10–0∘ S) over the southern African continent in clear sky and (0–15∘ E, 15–5∘ S) above clouds over the southeastern Atlantic Ocean – and temporally over the first half of July 2008.
On Fig. 14, we can see an increase in the AOD and the ACAOD spectral values with decreasing wavelength (a, c) and a decrease in the SSA and the ACSSA spectral values with increasing wavelength (b, d) retrieved by POLDER-3 (black curves in Fig. 14). These trends are characteristic of fine-mode aerosols containing BC, here BB (Dubovik et al., 2002; Bergstrom et al., 2007). Figure 14 shows a general good agreement between the WRF-Chem optimized configuration (red curves) and the POLDER-3 retrievals (black curves) on average for the first half of July 2008, with simulated spectral values of (AC) AOD and (AC) SSA included within the ranges of uncertainties associated with the POLDER-3 retrievals both in clear sky and above clouds.
Over the southern African continent in clear sky (12∘ E–30∘ E, 10∘ S–0∘ S), the spectral values of the AOD are slightly underestimated in the WRF-Chem optimized configuration (red curve, a) compared to those retrieved by POLDER-3/GRASP, with an average bias of about −0.06 from visible to near-infrared. The spectral values of the SSA are also slightly underestimated in the WRF-Chem optimized configuration (red curve, b), with an average bias of about −0.02 over the entire spectrum, reflecting a slightly higher aerosol absorption than that retrieved by POLDER-3/GRASP. This difference is reduced at shorter wavelengths (average bias of −0.01 at 443 nm) due to the consideration of BrOC absorption (highly absorbing especially in ultraviolet-blue, Kirchstetter et al., 2004; Hoffer et al., 2006) in the WRF-Chem optimized configuration (2.5 % of BrOC).
Above clouds over the SEAO (0–15∘ E, 15–5∘ S), the spectral values of the ACAOD are slightly underestimated in the WRF-Chem optimized configuration (red curve, c), with an average bias ranging from −0.04 to −0.02 from 490 to 865 nm compared to those retrieved by POLDER-3/AERO-AC. Regarding the spectral behaviour of the ACSSA, the WRF-Chem optimized configuration (red curve, d) simulates an upward trend from 300 to 600 nm due to the presence of BrOC in the BBA plumes and then a slightly decreasing trend in the near-infrared with increasing wavelength. However, the lack of data above clouds in the ultraviolet spectrum with POLDER-3/AERO-AC does not allow us to assess the reliability of the increase in absorption below 490 nm due to the addition of BrOC to the WRF-Chem optimized configuration. In the near-infrared, the decrease in ACSSA values is more pronounced in the POLDER-3/AERO-AC retrieval, with a positive average bias of 0.03 at 865 nm between the WRF-Chem optimized configuration and the POLDER-3/AERO-AC retrieval. This difference could be due to the larger particle sizes simulated by WRF-Chem than those retrieved by POLDER-3 (see Sect. 3.2.3).
Figure 15 illustrates the averaged PM2.5 chemical composition simulated with the WRF-Chem optimized configuration, including organic aerosols (OA, in green), secondary inorganic aerosols (SIA, in grey), organic carbon (OC, in brown), black carbon (BC, in black), brown carbon (BrOC, in purple), desert dust aerosols (DUST, in yellow), and sea salt aerosols (SEAS, in blue), as well as their relative proportions over the southern African continent in clear sky (spatial average over 12–30∘ E, 10–0∘ S, a) and above clouds over the SEAO (spatial average over 0–15∘ E, 15–5∘ S, b) for the first half of July 2008.
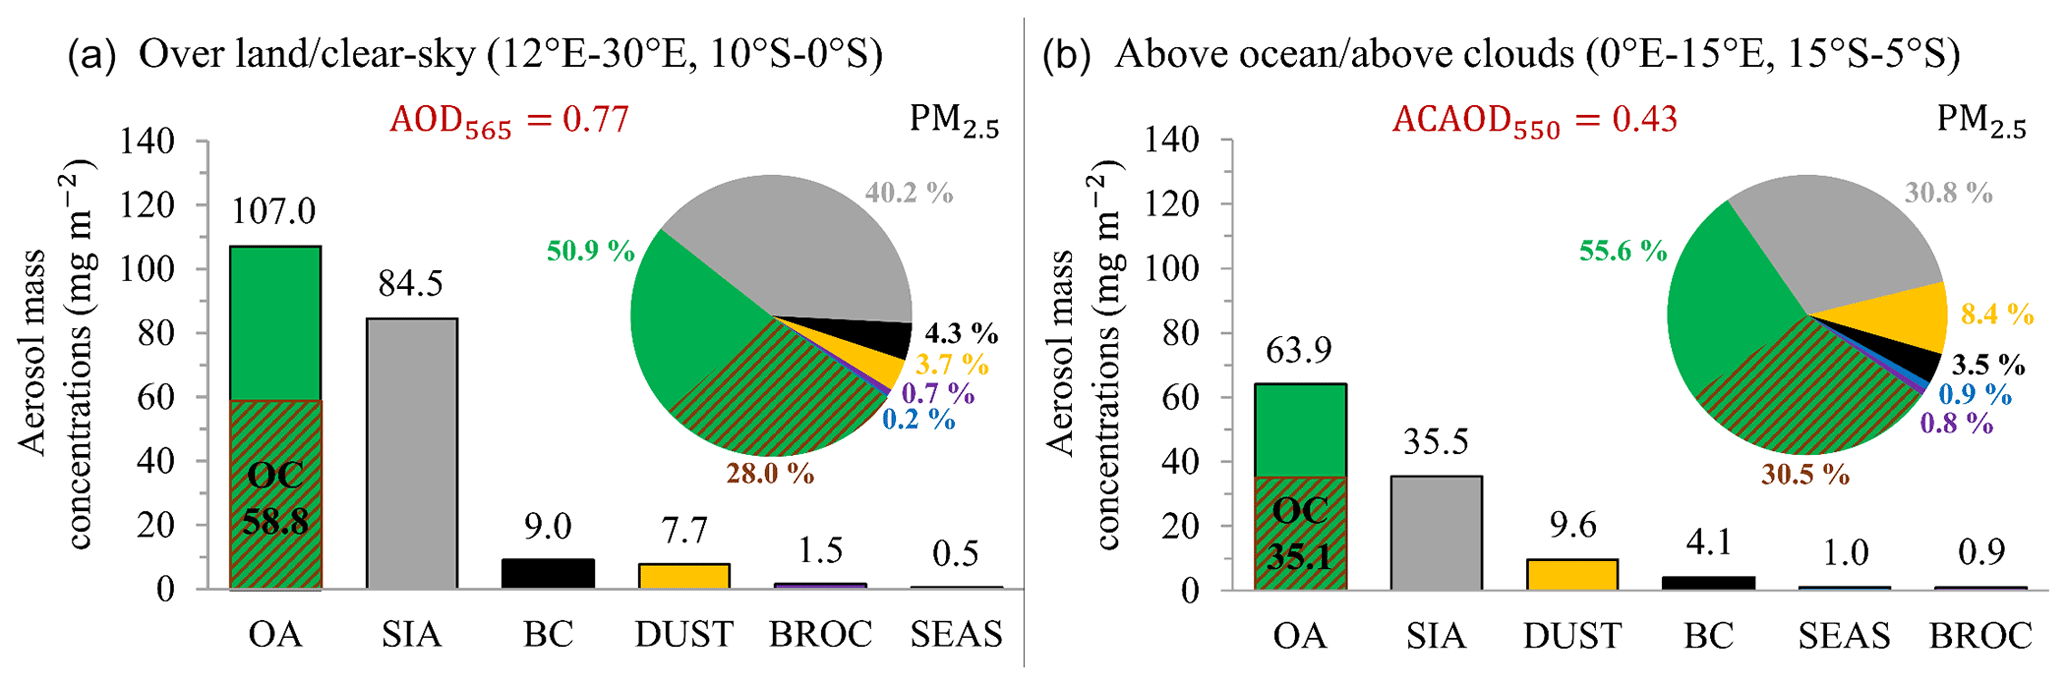
Figure 15Evolution of the PM2.5 chemical composition simulated with the WRF-Chem optimized configuration between the southern African continent in clear sky (12–30∘ E, 10–0∘ S, a) and the southeastern Atlantic Ocean above clouds (0–15∘ E, 15–5∘ S, b). Mass concentrations (in mg m−2) of the main aerosol compounds of biomass burning, i.e. black carbon (BC, in black), organic carbon (OC, in brown hatching), brown carbon (BrOC, in purple), organic aerosols (OA, in green), and secondary inorganic aerosols (SIA, in grey), as well as desert dust aerosols (DUST, in yellow) and sea salt aerosols (SEAS, in blue), are vertically integrated over the atmospheric column on average for the first half of July 2008.
Figure 15 shows that the chemical composition of PM2.5 simulated with the WRF-Chem optimized configuration still remains realistic in comparison with the observations from previous field campaigns (Haslett et al., 2019; Denjean et al., 2020): organic aerosols (OA, in green) still dominate, both at the BB sources (50.9 % of PM2.5, a) and over the transport region (55.6 % of PM2.5, b). Compared to the chemical composition of PM2.5 simulated with the WRF-Chem PC configuration (see Fig. 12), the contribution of black carbon (BC, in black) in the BBA plumes is greater in our studied area (≥3.5 %). The contribution of organic carbon (OC, brown hatching) is slightly lower: from 58.8 mg m−2 (28.0 % of PM2.5) to 35.1 mg m−2 (30.5 % of PM2.5) for the WRF-Chem optimized configuration and from 67.0 mg m−2 (31.7 % of PM2.5) to 45.4 mg m−2 (32.0 % of PM2.5) for the WRF-Chem PC configuration, between sources and transport areas. As with the WRF-Chem PC configuration, the influence of desert dust aerosols (DUST, in yellow) increases during the progression of the BBA plumes off the SEAO with a vertically integrated mass increasing on average from 7.7 mg m−2 (3.7 % of PM2.5) to 9.6 mg m−2 (8.4 % of PM2.5). The contribution of sea salt aerosols (SEAS, in blue) is negligible both over the southern African continent (0.2 % of PM2.5) and above clouds over the SEAO (0.9 % of PM2.5). Finally, the contribution of brown carbon (BrOC, in purple) is less than 1 % in our study area.
Figure 16 illustrates the spatial distributions of the monthly averaged AOD (a, b) and SSA (d, e) at 565 nm in clear sky retrieved by POLDER-3/GRASP (a, d) and simulated with the WRF-Chem optimized configuration (b, e) for July 2008.
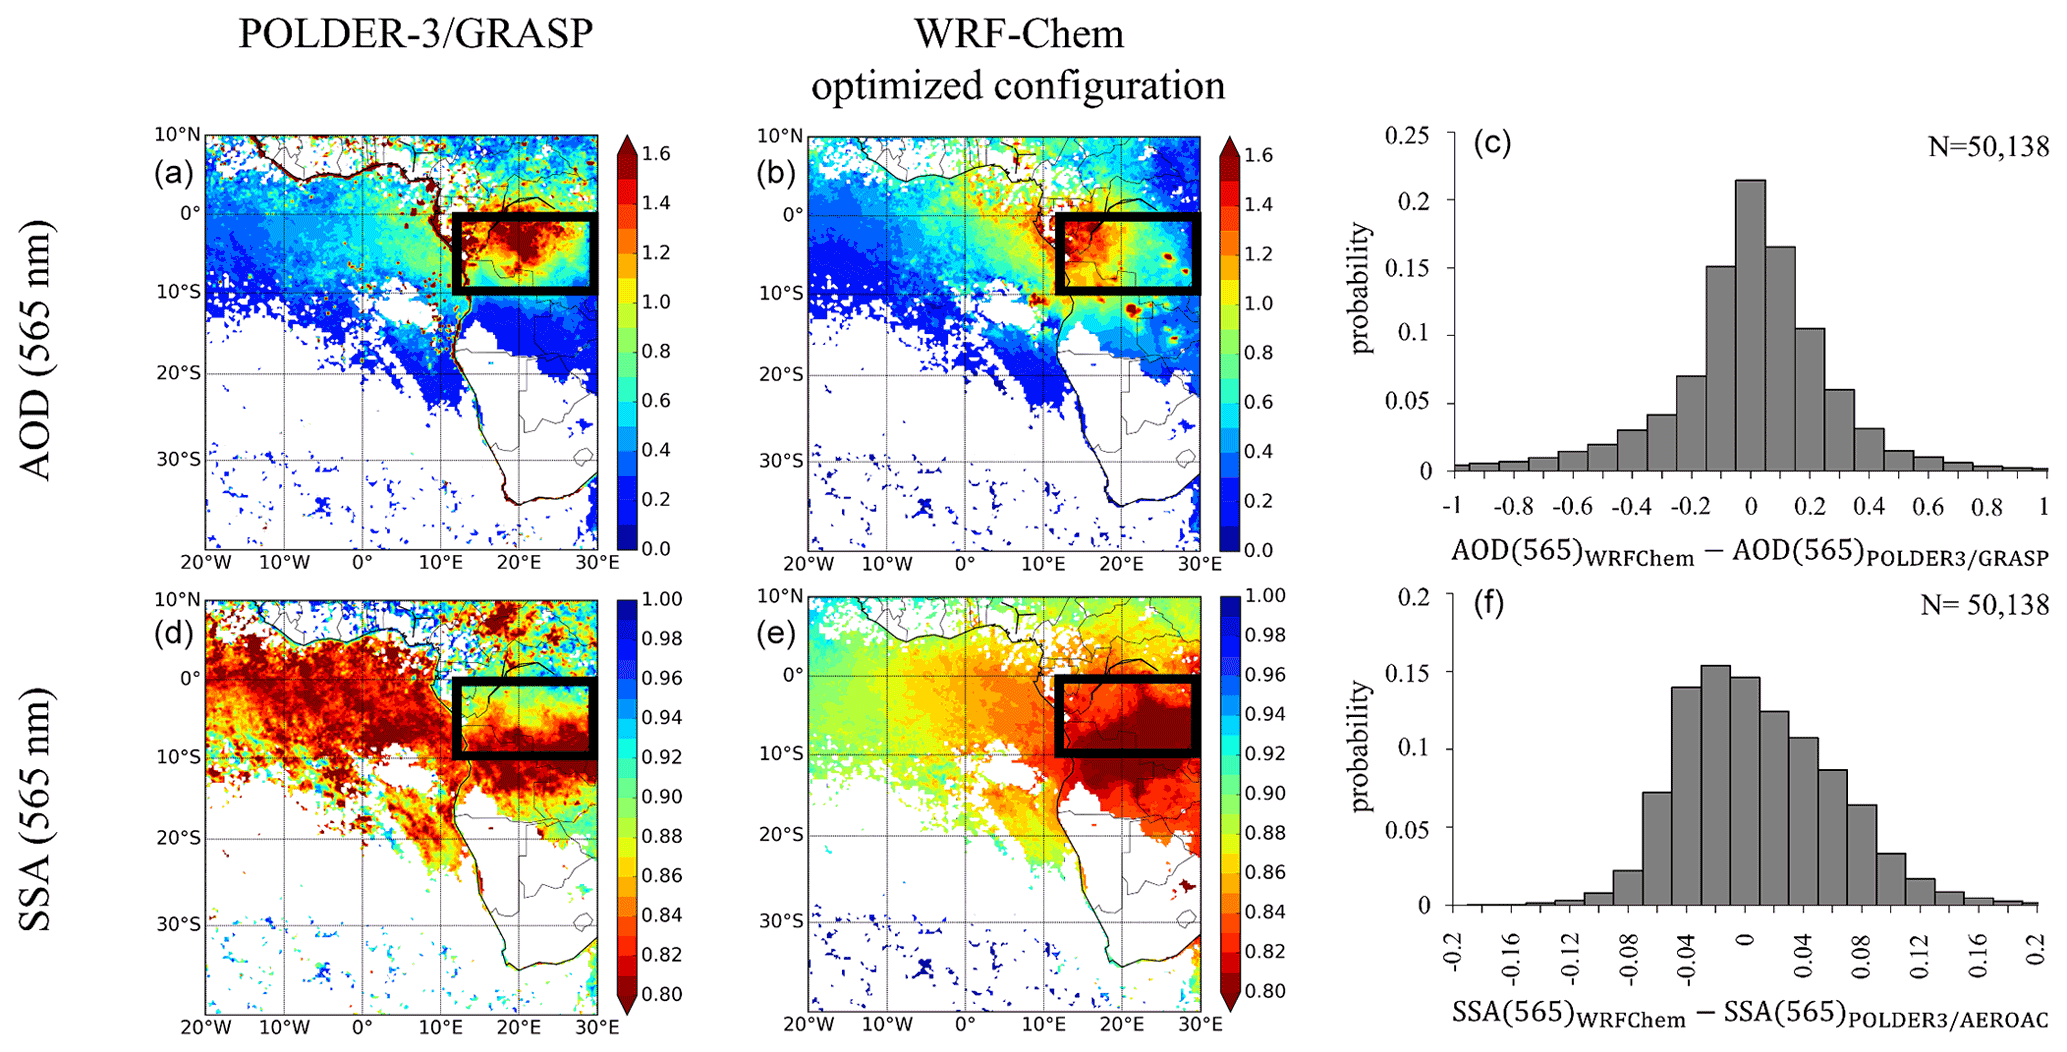
Figure 16Comparison of monthly averaged AOD (a, b) and SSA (d, e) at 565 nm in clear sky retrieved by POLDER-3/GRASP (a, d) and simulated with the WRF-Chem optimized configuration (b, e) over the southeast Atlantic region for July 2008, with the associated histograms of differences between the model and the satellite observations over the whole domain (c, f). The black frames (12–30∘ E, 10–0∘ S) represent the area of study.
Figure 16 shows that the results obtained with the WRF-Chem optimized configuration in clear sky are overall satisfying on average for July 2008. Over the southern African continent (12–30∘ E, 10–0∘ S), simulated mean AOD is 1.02 compared to 1.10±0.22 at 565 nm for POLDER-3/GRASP, indicating a slight underestimation of the intensity of BBA emission sources in the WRF-Chem optimized configuration. Their location is also somewhat different to the simulated emission sources located further west than those observed by POLDER-3/GRASP, resulting in a spatial correlation coefficient of 0.50 and an average bias of −0.08 at 565 nm. The simulated mean SSA is 0.81 compared to 0.85±0.05 at 565 nm for POLDER-3/GRASP, showing a good agreement although the aerosol absorption is slightly overestimated in the WRF-Chem optimized configuration. Figure 16 also shows that the aerosol absorption is more uniform in the WRF-Chem optimized configuration in comparison to POLDER-3/GRASP, which retrieves more scattering aerosols north of 12–30∘ E, 5–0∘ S. In this area, a contribution of other aerosol species to the BB plume is not excluded (mixture with desert dust aerosols) and could explain why POLDER-3 retrieves higher SSA than the model. This difference translates into a spatial correlation coefficient of 0.59 and an average bias of −0.04 at 565 nm. We can note that the mean SSA simulated with the WRF-Chem optimized configuration at the Mongu, Zambia, site (about 0.83 at 565 nm) in clear sky in July 2008 is consistent with the one retrieved by AERONET (about 0.81 at 550 nm) at the same location during July 1997 to 2005 (Eck et al., 2013). Over the SEAO far from the continent, in situ measurements from LASIC (Zuidema et al., 2018b) and CLARIFY-2017 (Taylor et al., 2020) indicated a strong BBA absorption, consistent with the observations from POLDER-3/GRASP (mean SSA less than 0.80 at 565 nm). This may be due to coating and lens effects of BC, which appear to be important for very old BBA plumes transported off the coast of southern Africa (Zuidema et al., 2018b; Denjean et al., 2020; Taylor et al., 2020; Wu et al., 2020). We remind that we do not consider coating in our approach and that, over this area, large discrepancies remain between POLDER-3 and the WRF-Chem optimized configuration.
Figure 17 illustrates the spatial distributions of monthly averaged ACAOD (a, b) and ACSSA (d, e) at 550 nm retrieved by POLDER-3/AERO-AC (a, d) and simulated with the WRF-Chem optimized configuration (b, e) for July 2008.
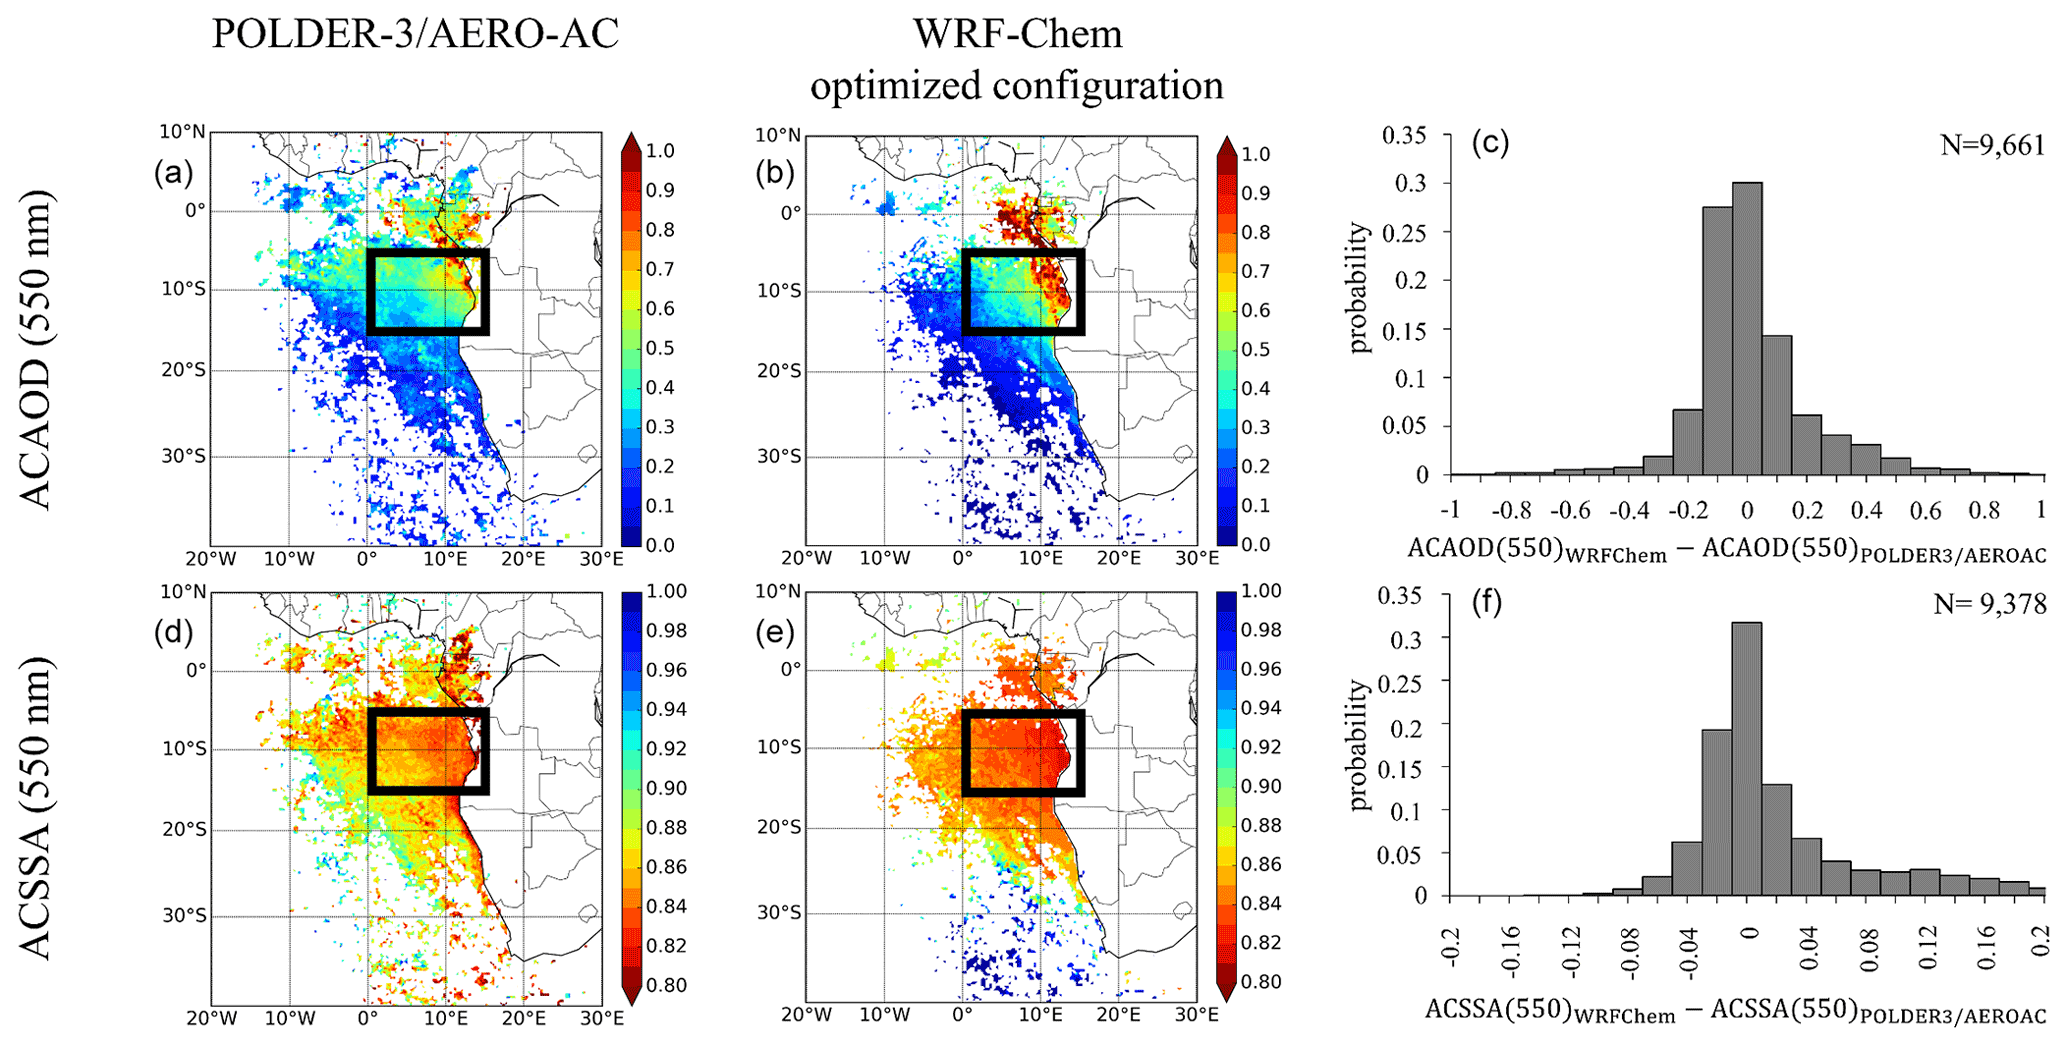
Figure 17Comparison of monthly averaged ACAOD (a, b) and ACSSA (d, e) at 550 nm above clouds retrieved by POLDER-3/AERO-AC (a, d) and simulated with the WRF-Chem optimized configuration (b, e) over the southeast Atlantic region for July 2008, with the associated histograms of differences between the model and the satellite observations over the whole domain (c, f). The black frames (0–15∘ E, 15–5∘ S) represent the area of study.
Figure 17 shows a very good agreement between the WRF-Chem optimized configuration and the POLDER-3/AERO-AC retrievals on the spatial distributions of both the ACAOD and the ACSSA at 550 nm averaged over July 2008. The simulated mean ACAOD is 0.48 compared to 0.46±0.09 at 550 nm for POLDER-3/AERO-AC, indicating a good estimate of the amounts of aerosols transported above clouds over the SEAO. Few minor differences can be observed within the studied area (0–15∘ E, 15–5∘ S), resulting in a spatial correlation coefficient of 0.64 and an average bias of 0.02 at 550 nm. The simulated mean ACSSA is 0.84 compared to 0.85±0.05 at 550 nm for POLDER-3/AERO-AC, indicating a good estimate of the aerosol absorption in the WRF-Chem optimized configuration. Some small differences can be observed within the studied area (0–15∘ E, 15–5∘ S), leading to a spatial correlation coefficient of 0.66, an average absolute error of only 0.01 and an average quadratic error of only 0.02.
In summary, the BBA absorption properties are significantly improved with the WRF-Chem optimized configuration while maintaining a realistic content of aerosols transported above marine stratocumulus. Thus, the WRF-Chem optimized configuration correctly simulates the content of BBA and their absorption properties over the SEA region on average for July 2008. In particular, the simulated mean SSA is consistent with the mean value of 0.85±0.02 observed during SAFARI-2000, although not fully representative of the same period of the BB season (Leahy et al., 2007).
This study shows that the WRF-Chem regional meteorological model coupled with chemistry combined with innovative POLDER-3 satellite aerosol inversion algorithms provided a satisfying estimate of the load and absorption properties of BBA over the SEA region, both in clear sky and above clouds on average for July 2008.
The adjustment of the chemistry at the source level in the WRF-Chem optimized configuration (BC×2, with 2.5 % BrOC) is consistent with the uncertainties present in APIFLAMEv1 BB emission inventory (Turquety et al., 2014) used in our study. This aerosol chemical composition is obtained with the homogeneous internal mixing state. The mean mass mixing ratio simulated with this optimal scenario of WRF-Chem is estimated at 0.15 over the southern African continent and 0.11 above clouds over the SEAO. These values are also in good agreement with previous in situ measurements over this region, such as the SAFARI-2000 airborne campaign (Formenti et al., 2003). In addition, the absorbing fraction of OA in the BBA plumes, i.e. BrOC, is estimated at 2 %–3 % for the studied period. This value could vary geographically and temporally. Importantly, this BrOC contribution allows the increase in absorption retrieved by POLDER-3/GRASP at the shortest wavelengths of the visible spectrum, characteristic of the presence of BrOC in the BBA plumes, to be well simulated with WRF-Chem over the BB source areas. However, the lack of available POLDER-3 data for the SSA in the blue and in the ultraviolet spectrum above clouds did not enable us to constrain with certainty the BrOC content in cases of BBA plumes transported over stratocumulus off the coasts of Namibia and Angola. This limitation is mainly related to the used inversion algorithm and may be exceeded in future work. The simulated mean SSA are 0.81 (565 nm) and 0.84 (550 nm) in clear and above cloudy scenes respectively, in good agreement with those retrieved by POLDER-3 (0.85±0.05 at 565 nm in clear sky and at 550 nm above clouds) for the studied period. Significant differences between modelled and measured SSA are only observed in remote ocean areas, at least 2000 km from the sources. These differences could be explained by the hypothesis of the homogeneous internal mixture that we used in our study.
Our results highlight the fact that BC refractive index of Williams et al. (2007), which is more absorbing than that more commonly used of Bond and Bergstrom (2006), provides the best estimates of BBA properties, allowing us to reproduce the retrievals from the POLDER-3 satellite both in clear and cloudy skies. Other studies have shown that the Williams et al. (2007) BC refractive index was more suitable for the assessment of the mass absorption cross section (MAC m2 g−1) associated with freshly emitted BC. In this sense, our work is consistent with the conclusions of the study on the light absorption properties of BC from Liu et al. (2020).
The methodology developed during this study can be summarized as follows: using optimized regional simulations to constrain the emission factors of big families of chemical species present in BB inventories through the adjustment of the chemistry. This adjustment of the chemistry is made possible by the use of new satellite observations providing the SSA of aerosols and its spectral dependence from space both in clear and cloudy skies. These recently available new observations used in synergy with a regional model of meteorology coupled with chemistry, such as WRF-Chem, enable us to obtain new constraints on the aerosol chemistry in climate modelling exercises.
Our results can be considered the first step of a larger study, which aims at providing more robust estimates of the climate impacts of BBA over the SEA region, including their interactions with clouds, using the optimized configuration of the WRF-Chem model. In particular, the influence of BrOC absorption on direct and semi-direct radiative effects of aerosols will be investigated. In addition, clouds' response to contact with BBA plumes will be assessed at the indirect effects level.
In parallel, the methodology developed in this study could be applied throughout the summer 2008 dry season to evaluate the temporal variability and absorption cycle of BBA present in this region. First, results show that the WRF-Chem optimized configuration struggles to represent very satisfyingly the seasonal cycle of ACSSA retrieved by POLDER-3/AERO-AC, which is characterized by a decreased aerosol absorption (increase in ACSSA values) during the advance of the fire season. This suggests that the chemical composition of the BBA plumes, and especially the amount of carbonaceous aerosols emitted in the atmosphere, changes during the dry season, which is likely in relation to a change in the type of fuel burned and in the combustion conditions (Zuidema et al., 2016b, 2018b; Pan et al., 2019; Pistone et al., 2019). Thus, an interesting development would be the elaboration of a parameterization of the BrOC content in WRF-Chem according to the evolution of fire activity during the dry season. To progress on this aspect, a synergy between satellite observations provided by the POLDER-3 and the Ozone Monitoring Instrument (OMI) space sensors would allow us to expand the retrieval of the SSA of aerosols to the ultraviolet range, a spectral domain particularly sensitive to the presence of BrOC.
Another outlook will consist in applying our methodology to the more recent French AEROCLO-sA airborne campaign that took place in the SEA region in August–September 2017, using other satellite datasets than POLDER-3, for which observations ended in 2013. Other international measurement campaigns have also taken place in this region (CLARIFY, LASIC and ORACLES) in recent years (Zuidema et al., 2016b). They will provide detailed reference observations on the BBA properties bringing additional constraints on their radiative and climate effects.
Finally, the methodology combining regional simulations and satellite observations of aerosols could be applied to other regions under the influence of BB, such as those located in the Northern Hemisphere or South America, particularly in the Amazon. Boreal forest fires are of interest because they are characterized by a very low carbonaceous mass mixing ratio and a slow combustion without flames. This type of fire is thus potentially richer in organic aerosols, making it a potentially important contributor of BrOC. For this type of plume, BrOC concentrations could therefore be much higher than for the BBA plumes observed over the SEA region, implying a potentially more pronounced BrOC effect on climate for these regions.
The Pearson correlation coefficient (R) is calculated as follows:
where Mi, Oi, , , and N are respectively the simulated value, the observed value, the average of the simulated and observed values, and the total number of pixels. R is between −1 and +1, with a value tending towards zero indicating no linear correlation.
The mean bias (MB) is the average of the difference between a simulated and an observed value over an area or over a specified period:
If the difference between the simulated value and the observed value is non-zero then the simulated value is said to be biased positively in the case of overestimation and negatively otherwise.
The mean absolute error (MAE) is calculated from the absolute value of the difference between a simulated and an observed value:
This quantity is therefore always positive and tends towards zero when the simulated values are close to those observed. This statistical parameter is more restrictive than the average bias because it avoids possible error compensations.
The root mean square error (RMSE) is calculated from the square root of the root mean square difference between the simulated and observed values:
Occasional large biases can produce a high RMSE value. This statistical parameter is therefore commonly used as a measure of the overall performance of a model.
The AERO-AC product is developed at the ICARE data and services centre (https://www.icare.univ-lille.fr, last access: 30 November 2021) in Lille (France) in the frame of the POLDER/PARASOL mission and supported by the Centre National d'Etudes Spatiales and the Programme National de Télédétection Spatiale (CNES and PNTS; https://doi.org/10.25326/82, Waquet et al., 2020). The authors would like to acknowledge the use of POLDER/PARASOL Level-1 data originally provided by CNES (http://www.icare.univ-lille1.fr/, last access: 30 November 2021) processed at Laboratoire d'Optique Atmosphérique with GRASP software (https://www.grasp-open.com, last access: 30 November 2021) (Grasp Open, 2021) developed by Dubovik et al. (2011, 2014).
AS, FW, JCP and IC developed the concept of this paper. AS performed the WRF-Chem simulations and carried out the analyses of the POLDER and CALIOP data. ST developed the APIFLAME biomass burning emission inventory. FW and FP developed the POLDER-3/AERO-AC products, and the data were processed by FT and FD. AS wrote the manuscript with contributions from all co-authors.
The authors declare that they have no conflict of interest.
Publisher’s note: Copernicus Publications remains neutral with regard to jurisdictional claims in published maps and institutional affiliations.
This article is part of the special issue “New observations and related modelling studies of the aerosol–cloud–climate system in the Southeast Atlantic and southern Africa regions (ACP/AMT inter-journal SI)”. It is not associated with a conference.
This work has been supported by the CaPPA (Chemical and Physical Properties of the Atmosphere) project, which is funded by the French National Research Agency (ANR) through the Programme d'Investissement d'Avenir (PIA) under contract R-LABEX0-20-007-CAPPA and by the Regional Council of Hauts-de-France and the European Regional Development Fund (ERDF); the University of Lille (France); the Programme National de Télédétection Spatiale (PNTS, https://programmes.insu.cnrs.fr/transverse/pnts, last access: 30 November 2021, grant no. PNTS-2013-10); and by the French Centre National d'Etudes Spatiales (CNES). The authors also thank the Hauts-de-France region, the Ministère de l'Enseignement Supérieur et de la Recherche (CPER Climibio), and the ERDF for their financial support. The authors acknowledge the AEROCLIM project of comparison of models and satellite data for climate studies, which is funded by CNES. The authors are also grateful to Oleg Dubovik and Pavel Litvinov for providing the GRASP data and their validation against AERONET data used in this study. The authors would like to thank the AEROCLO-sA team and project. The AEROCLO-sA project was supported by the ANR under grant agreement no. ANR-15-CE01-0014-01, the French national programme LEFE/INSU, the PNTS (grant no. PNTS-2016-14), and by the South African National Research Foundation (NRF) under grant UID 105958.
This work was mainly funded by the CaPPA (Chemical and Physical Properties of the Atmosphere) project, which is funded by the French National Research Agency (ANR) through the Programme d'Investissement d'Avenir (PIA) under contract R-LABEX0-20-007-CAPPA and by the Regional Council of Hauts-de-France and the European Regional Development Fund (ERDF); the University of Lille (France); the Programme National de Télédétection Spatiale (PNTS) under grant no. PNTS-2013-10; and by the French Centre National d'Etudes Spatiales (CNES).
This paper was edited by Paquita Zuidema and reviewed by three anonymous referees.
Abel, S. J., Haywood, J. M., Highwood, E. J., Li, J., and Buseck, P. R.: Evolution of biomass burning aerosol properties from an agricultural fire in southern Africa, Geophys. Res. Lett., 30, 1783, https://doi.org/10.1029/2003GL017342, 2003.
Akagi, S. K., Yokelson, R. J., Wiedinmyer, C., Alvarado, M. J., Reid, J. S., Karl, T., Crounse, J. D., and Wennberg, P. O.: Emission factors for open and domestic biomass burning for use in atmospheric models, Atmos. Chem. Phys., 11, 4039–4072, https://doi.org/10.5194/acp-11-4039-2011, 2011.
Alexander, D. T. L., Crozier, P. A., and Anderson, J. R.: Brown Carbon Spheres in East Asian Outflow and Their Optical Properties, Science, 321, 833–836, https://doi.org/10.1126/science.1155296, 2008.
Allen, D. J., Kasibhatla, P., Thompson, A. M., Rood, R. B., Doddridge, B. G., Pickering, K. E., Hudson, R. D., and Lin, S.-J.: Transport-induced interannual variability of carbon monoxide determined using a chemistry and transport model, J. Geophys. Res.-Atmos., 101, 28655–28669, https://doi.org/10.1029/96JD02984, 1996.
Andreae, M. O.: Emission of trace gases and aerosols from biomass burning – an updated assessment, Atmos. Chem. Phys., 19, 8523–8546, https://doi.org/10.5194/acp-19-8523-2019, 2019.
Ångström, A.: On the Atmospheric Transmission of Sun Radiation and on Dust in the Air, Geogr. Ann. A, 11, 156–166, https://doi.org/10.1080/20014422.1929.11880498, 1929.
Arola, A., Schuster, G., Myhre, G., Kazadzis, S., Dey, S., and Tripathi, S. N.: Inferring absorbing organic carbon content from AERONET data, Atmos. Chem. Phys., 11, 215–225, https://doi.org/10.5194/acp-11-215-2011, 2011.
Baklanov, A., Schlünzen, K., Suppan, P., Baldasano, J., Brunner, D., Aksoyoglu, S., Carmichael, G., Douros, J., Flemming, J., Forkel, R., Galmarini, S., Gauss, M., Grell, G., Hirtl, M., Joffre, S., Jorba, O., Kaas, E., Kaasik, M., Kallos, G., Kong, X., Korsholm, U., Kurganskiy, A., Kushta, J., Lohmann, U., Mahura, A., Manders-Groot, A., Maurizi, A., Moussiopoulos, N., Rao, S. T., Savage, N., Seigneur, C., Sokhi, R. S., Solazzo, E., Solomos, S., Sørensen, B., Tsegas, G., Vignati, E., Vogel, B., and Zhang, Y.: Online coupled regional meteorology chemistry models in Europe: current status and prospects, Atmos. Chem. Phys., 14, 317–398, https://doi.org/10.5194/acp-14-317-2014, 2014.
Balkanski, Y. J., Jacob, D. J., Gardner, G. M., Graustein, W. C., and Turekian, K. K.: Transport and residence times of tropospheric aerosols inferred from a global three-dimensional simulation of 210Pb, J. Geophys. Res.-Atmos., 98, 20573–20586, https://doi.org/10.1029/93JD02456, 1993.
Barnard, J. C., Fast, J. D., Paredes-Miranda, G., Arnott, W. P., and Laskin, A.: Technical Note: Evaluation of the WRF-Chem “Aerosol Chemical to Aerosol Optical Properties” Module using data from the MILAGRO campaign, Atmos. Chem. Phys., 10, 7325–7340, https://doi.org/10.5194/acp-10-7325-2010, 2010.
Bergstrom, R. W., Pilewskie, P., Russell, P. B., Redemann, J., Bond, T. C., Quinn, P. K., and Sierau, B.: Spectral absorption properties of atmospheric aerosols, Atmos. Chem. Phys., 7, 5937–5943, https://doi.org/10.5194/acp-7-5937-2007, 2007.
Bian, H., Chin, M., Hauglustaine, D. A., Schulz, M., Myhre, G., Bauer, S. E., Lund, M. T., Karydis, V. A., Kucsera, T. L., Pan, X., Pozzer, A., Skeie, R. B., Steenrod, S. D., Sudo, K., Tsigaridis, K., Tsimpidi, A. P., and Tsyro, S. G.: Investigation of global particulate nitrate from the AeroCom phase III experiment, Atmos. Chem. Phys., 17, 12911–12940, https://doi.org/10.5194/acp-17-12911-2017, 2017.
Bond, T. C. and Bergstrom, R. W.: Light Absorption by Carbonaceous Particles: An Investigative Review, Aerosol Sci. Tech., 40, 27–67, https://doi.org/10.1080/02786820500421521, 2006.
Bond, T. C., Streets, D. G., Yarber, K. F., Nelson, S. M., Woo, J.-H., and Klimont, Z.: A technology-based global inventory of black and organic carbon emissions from combustion, J. Geophys. Res.-Atmos., 109, D14203, https://doi.org/10.1029/2003JD003697, 2004.
Bond, T. C., Doherty, S. J., Fahey, D. W., Forster, P. M., Berntsen, T., DeAngelo, B. J., Flanner, M. G., Ghan, S., Kärcher, B., Koch, D., Kinne, S., Kondo, Y., Quinn, P. K., Sarofim, M. C., Schultz, M. G., Schulz, M., Venkataraman, C., Zhang, H., Zhang, S., Bellouin, N., Guttikunda, S. K., Hopke, P. K., Jacobson, M. Z., Kaiser, J. W., Klimont, Z., Lohmann, U., Schwarz, J. P., Shindell, D., Storelvmo, T., Warren, S. G., and Zender, C. S.: Bounding the role of black carbon in the climate system: A scientific assessment, J. Geophys. Res.-Atmos., 118, 5380–5552, https://doi.org/10.1002/jgrd.50171, 2013.
Boucher, O., Randall, D., Artaxo, P., Bretherton, C., Feingold, G., Forster, P., Kerminen, V.-M., Kondo, Y., Liao, H., Lohmann, U., Rasch, P., Satheesh, S. K., Sherwood, S., Stevens, B., and Zhang, X. Y.: Intergovernmental Panel on Climate Change, Clouds and aerosols, in: Climate Change 2013 – The Physical Science Basis: Working Group I Contribution to the Fifth Assessment Report of the Intergovernmental Panel on Climate Change, Cambridge University Press, UK, 571–658, https://doi.org/10.1017/CBO9781107415324.016, 2013.
Cahoon, D. R., Stocks, B. J., Levine, J. S., Cofer, W. R., and O'Neill, K. P.: Seasonal distribution of African savanna fires, Nature, 359, 812–815, https://doi.org/10.1038/359812a0, 1992.
Capes, G., Johnson, B., McFiggans, G., Williams, P. I., Haywood, J., and Coe, H.: Aging of biomass burning aerosols over West Africa: Aircraft measurements of chemical composition, microphysical properties, and emission ratios, J. Geophys. Res.-Atmos., 113, D00C15, https://doi.org/10.1029/2008JD009845, 2008.
Chen, Y. and Bond, T. C.: Light absorption by organic carbon from wood combustion, Atmos. Chem. Phys., 10, 1773–1787, https://doi.org/10.5194/acp-10-1773-2010, 2010.
Chen, C., Dubovik, O., Henze, D. K., Lapyonak, T., Chin, M., Ducos, F., Litvinov, P., Huang, X., and Li, L.: Retrieval of desert dust and carbonaceous aerosol emissions over Africa from POLDER/PARASOL products generated by the GRASP algorithm, Atmos. Chem. Phys., 18, 12551–12580, https://doi.org/10.5194/acp-18-12551-2018, 2018.
Chen, C., Dubovik, O., Henze, D. K., Chin, M., Lapyonok, T., Schuster, G. L., Ducos, F., Fuertes, D., Litvinov, P., Li, L., Lopatin, A., Hu, Q., and Torres, B.: Constraining global aerosol emissions using POLDER/PARASOL satellite remote sensing observations, Atmos. Chem. Phys., 19, 14585–14606, https://doi.org/10.5194/acp-19-14585-2019, 2019.
Chen, C., Dubovik, O., Fuertes, D., Litvinov, P., Lapyonok, T., Lopatin, A., Ducos, F., Derimian, Y., Herman, M., Tanré, D., Remer, L. A., Lyapustin, A., Sayer, A. M., Levy, R. C., Hsu, N. C., Descloitres, J., Li, L., Torres, B., Karol, Y., Herrera, M., Herreras, M., Aspetsberger, M., Wanzenboeck, M., Bindreiter, L., Marth, D., Hangler, A., and Federspiel, C.: Validation of GRASP algorithm product from POLDER/PARASOL data and assessment of multi-angular polarimetry potential for aerosol monitoring, Earth Syst. Sci. Data, 12, 3573–3620, https://doi.org/10.5194/essd-12-3573-2020, 2020.
Chin, M., Savoie, D. L., Huebert, B. J., Bandy, A. R., Thornton, D. C., Bates, T. S., Quinn, P. K., Saltzman, E. S., and Bruyn, W. J. D.: Atmospheric sulfur cycle simulated in the global model GOCART: Comparison with field observations and regional budgets, J. Geophys. Res.-Atmos., 105, 24689–24712, https://doi.org/10.1029/2000JD900385, 2000a.
Chin, M., Rood, R. B., Lin, S.-J., Müller, J.-F., and Thompson, A. M.: Atmospheric sulfur cycle simulated in the global model GOCART: Model description and global properties, J. Geophys. Res.-Atmos., 105, 24671–24687, https://doi.org/10.1029/2000JD900384, 2000b.
Chin, M., Ginoux, P., Kinne, S., Torres, O., Holben, B. N., Duncan, B. N., Martin, R. V., Logan, J. A., Higurashi, A., and Nakajima, T.: Tropospheric Aerosol Optical Thickness from the GOCART Model and Comparisons with Satellite and Sun Photometer Measurements, J. Atmos. Sci., 59, 461–483, https://doi.org/10.1175/1520-0469(2002)059<0461:TAOTFT>2.0.CO;2, 2002.
Chou, M.-D. and Suarez, M. J.: An efficient thermal infrared radiation parameterization for use in general circulation models, 92, 1994.
Costantino, L. and Bréon, F.-M.: Aerosol indirect effect on warm clouds over South-East Atlantic, from co-located MODIS and CALIPSO observations, Atmos. Chem. Phys., 13, 69–88, https://doi.org/10.5194/acp-13-69-2013, 2013.
de Graaf, M., Tilstra, L. G., Wang, P., and Stammes, P.: Retrieval of the aerosol direct radiative effect over clouds from spaceborne spectrometry, J. Geophys. Res.-Atmos., 117, D07207, https://doi.org/10.1029/2011JD017160, 2012.
de Graaf, M., Bellouin, N., Tilstra, L. G., Haywood, J., and Stammes, P.: Aerosol direct radiative effect of smoke over clouds over the southeast Atlantic Ocean from 2006 to 2009, Geophys. Res. Lett., 41, 7723–7730, https://doi.org/10.1002/2014GL061103, 2014.
de Graaf, M., Schulte, R., Peers, F., Waquet, F., Tilstra, L. G., and Stammes, P.: Comparison of south-east Atlantic aerosol direct radiative effect over clouds from SCIAMACHY, POLDER and OMI–MODIS, Atmos. Chem. Phys., 20, 6707–6723, https://doi.org/10.5194/acp-20-6707-2020, 2020.
Deaconu, L. T., Waquet, F., Josset, D., Ferlay, N., Peers, F., Thieuleux, F., Ducos, F., Pascal, N., Tanré, D., Pelon, J., and Goloub, P.: Consistency of aerosols above clouds characterization from A-Train active and passive measurements, Atmos. Meas. Tech., 10, 3499–3523, https://doi.org/10.5194/amt-10-3499-2017, 2017.
Deaconu, L. T., Ferlay, N., Waquet, F., Peers, F., Thieuleux, F., and Goloub, P.: Satellite inference of water vapour and above-cloud aerosol combined effect on radiative budget and cloud-top processes in the southeastern Atlantic Ocean, Atmos. Chem. Phys., 19, 11613–11634, https://doi.org/10.5194/acp-19-11613-2019, 2019.
Denjean, C., Bourrianne, T., Burnet, F., Mallet, M., Maury, N., Colomb, A., Dominutti, P., Brito, J., Dupuy, R., Sellegri, K., Schwarzenboeck, A., Flamant, C., and Knippertz, P.: Overview of aerosol optical properties over southern West Africa from DACCIWA aircraft measurements, Atmos. Chem. Phys., 20, 4735–4756, https://doi.org/10.5194/acp-20-4735-2020, 2020.
Dubovik, O., Holben, B., Eck, T. F., Smirnov, A., Kaufman, Y. J., King, M. D., Tanré, D., and Slutsker, I.: Variability of Absorption and Optical Properties of Key Aerosol Types Observed in Worldwide Locations, J. Atmos. Sci., 59, 590–608, https://doi.org/10.1175/1520-0469(2002)059<0590:VOAAOP>2.0.CO;2, 2002.
Dubovik, O., Herman, M., Holdak, A., Lapyonok, T., Tanré, D., Deuzé, J. L., Ducos, F., Sinyuk, A., and Lopatin, A.: Statistically optimized inversion algorithm for enhanced retrieval of aerosol properties from spectral multi-angle polarimetric satellite observations, Atmos. Meas. Tech., 4, 975–1018, https://doi.org/10.5194/amt-4-975-2011, 2011.
Dubovik, O., Lapyonok, T., Litvinov, P., Herman, M., Fuertes, D., Ducos, F., Torres, B., Derimian, Y., Huang, X., Lopatin, A., Chaikovsky, A., Aspetsberger, M., and Federspiel, C.: GRASP: a versatile algorithm for characterizing the atmosphere, SPIE Newsroom, 25, 10.1117, 2–1201408 https://doi.org/10.1117/2.1201408.005558, 2014.
Eck, T. F., Holben, B. N., Reid, J. S., Mukelabai, M. M., Piketh, S. J., Torres, O., Jethva, H. T., Hyer, E. J., Ward, D. E., Dubovik, O., Sinyuk, A., Schafer, J. S., Giles, D. M., Sorokin, M., Smirnov, A., and Slutsker, I.: A seasonal trend of single scattering albedo in southern African biomass-burning particles: Implications for satellite products and estimates of emissions for the world's largest biomass-burning source, J. Geophys. Res.-Atmos., 118, 6414–6432, https://doi.org/10.1002/jgrd.50500, 2013.
Emmons, L. K., Walters, S., Hess, P. G., Lamarque, J.-F., Pfister, G. G., Fillmore, D., Granier, C., Guenther, A., Kinnison, D., Laepple, T., Orlando, J., Tie, X., Tyndall, G., Wiedinmyer, C., Baughcum, S. L., and Kloster, S.: Description and evaluation of the Model for Ozone and Related chemical Tracers, version 4 (MOZART-4), Geosci. Model Dev., 3, 43–67, https://doi.org/10.5194/gmd-3-43-2010, 2010.
Emmons, L. K., Arnold, S. R., Monks, S. A., Huijnen, V., Tilmes, S., Law, K. S., Thomas, J. L., Raut, J.-C., Bouarar, I., Turquety, S., Long, Y., Duncan, B., Steenrod, S., Strode, S., Flemming, J., Mao, J., Langner, J., Thompson, A. M., Tarasick, D., Apel, E. C., Blake, D. R., Cohen, R. C., Dibb, J., Diskin, G. S., Fried, A., Hall, S. R., Huey, L. G., Weinheimer, A. J., Wisthaler, A., Mikoviny, T., Nowak, J., Peischl, J., Roberts, J. M., Ryerson, T., Warneke, C., and Helmig, D.: The POLARCAT Model Intercomparison Project (POLMIP): overview and evaluation with observations, Atmos. Chem. Phys., 15, 6721–6744, https://doi.org/10.5194/acp-15-6721-2015, 2015.
Fast, J. D., Gustafson, W. I., Easter, R. C., Zaveri, R. A., Barnard, J. C., Chapman, E. G., Grell, G. A., and Peckham, S. E.: Evolution of ozone, particulates, and aerosol direct radiative forcing in the vicinity of Houston using a fully coupled meteorology-chemistry-aerosol model, J. Geophys. Res.-Atmos., 111, D21305, https://doi.org/10.1029/2005JD006721, 2006.
Feng, Y., Ramanathan, V., and Kotamarthi, V. R.: Brown carbon: a significant atmospheric absorber of solar radiation?, Atmos. Chem. Phys., 13, 8607–8621, https://doi.org/10.5194/acp-13-8607-2013, 2013.
Ferlay, N., Thieuleux, F., Cornet, C., Davis, A. B., Dubuisson, P., Ducos, F., Parol, F., Riédi, J., and Vanbauce, C.: Toward New Inferences about Cloud Structures from Multidirectional Measurements in the Oxygen A Band: Middle-of-Cloud Pressure and Cloud Geometrical Thickness from POLDER-3/PARASOL, J. Appl. Meteorol. Clim., 49, 2492–2507, https://doi.org/10.1175/2010JAMC2550.1, 2010.
Flamant, C., Knippertz, P., Fink, A. H., Akpo, A., Brooks, B., Chiu, C. J., Coe, H., Danuor, S., Evans, M., Jegede, O., Kalthoff, N., Konaré, A., Liousse, C., Lohou, F., Mari, C., Schlager, H., Schwarzenboeck, A., Adler, B., Amekudzi, L., Aryee, J., Ayoola, M., Batenburg, A. M., Bessardon, G., Borrmann, S., Brito, J., Bower, K., Burnet, F., Catoire, V., Colomb, A., Denjean, C., Fosu-Amankwah, K., Hill, P. G., Lee, J., Lothon, M., Maranan, M., Marsham, J., Meynadier, R., Ngamini, J.-B., Rosenberg, P., Sauer, D., Smith, V., Stratmann, G., Taylor, J. W., Voigt, C., and Yoboué, V.: The Dynamics–Aerosol–Chemistry–Cloud Interactions in West Africa Field Campaign: Overview and Research Highlights, B. Am. Meteorol. Soc., 99, 83–104, https://doi.org/10.1175/BAMS-D-16-0256.1, 2017.
Flaounas, E., Kotroni, V., Lagouvardos, K., Klose, M., Flamant, C., and Giannaros, T. M.: Assessing atmospheric dust modelling performance of WRF-Chem over the semi-arid and arid regions around the Mediterranean, Atmos. Chem. Phys. Discuss. [preprint], https://doi.org/10.5194/acp-2016-307, 2016.
Formenti, P., Elbert, W., Maenhaut, W., Haywood, J., Osborne, S., and Andreae, M. O.: Inorganic and carbonaceous aerosols during the Southern African Regional Science Initiative (SAFARI 2000) experiment: Chemical characteristics, physical properties, and emission data for smoke from African biomass burning, J. Geophys. Res.-Atmos., 108, 8488, https://doi.org/10.1029/2002JD002408, 2003.
Formenti, P., D'Anna, B., Flamant, C., Mallet, M., Piketh, S. J., Schepanski, K., Waquet, F., Auriol, F., Brogniez, G., Burnet, F., Chaboureau, J.-P., Chauvigné, A., Chazette, P., Denjean, C., Desboeufs, K., Doussin, J.-F., Elguindi, N., Feuerstein, S., Gaetani, M., Giorio, C., Klopper, D., Mallet, M. D., Nabat, P., Monod, A., Solmon, F., Namwoonde, A., Chikwililwa, C., Mushi, R., Welton, E. J., and Holben, B.: The Aerosols, Radiation and Clouds in Southern Africa Field Campaign in Namibia: Overview, Illustrative Observations, and Way Forward, B. Am. Meteorol. Soc., 100, 1277–1298, https://doi.org/10.1175/BAMS-D-17-0278.1, 2019.
Freitas, S. R., Longo, K. M., and Andreae, M. O.: Impact of including the plume rise of vegetation fires in numerical simulations of associated atmospheric pollutants, Geophys. Res. Lett., 33, L17808, https://doi.org/10.1029/2006GL026608, 2006.
Freitas, S. R., Longo, K. M., Chatfield, R., Latham, D., Silva Dias, M. A. F., Andreae, M. O., Prins, E., Santos, J. C., Gielow, R., and Carvalho Jr., J. A.: Including the sub-grid scale plume rise of vegetation fires in low resolution atmospheric transport models, Atmos. Chem. Phys., 7, 3385–3398, https://doi.org/10.5194/acp-7-3385-2007, 2007.
Fuchs, N., Daisley, R., Fuchs, M., Davies, C., and Straumanis, M.: The mechanics of aerosols, Phys. Today, 18, 73, https://doi.org/10.1063/1.3047354, 1965.
Ghan, S., Laulainen, N., Easter, R., Wagener, R., Nemesure, S., Chapman, E., Zhang, Y., and Leung, R.: Evaluation of aerosol direct radiative forcing in MIRAGE, J. Geophys. Res.-Atmos., 106, 5295–5316, https://doi.org/10.1029/2000JD900502, 2001.
Giglio, L., Kendall, J. D., and Mack, R.: A multi-year active fire dataset for the tropics derived from the TRMM VIRS, Int. J. Remote Sens., 24, 4505–4525, https://doi.org/10.1080/0143116031000070283, 2003.
Giglio, L., van der Werf, G. R., Randerson, J. T., Collatz, G. J., and Kasibhatla, P.: Global estimation of burned area using MODIS active fire observations, Atmos. Chem. Phys., 6, 957–974, https://doi.org/10.5194/acp-6-957-2006, 2006.
Giglio, L., Randerson, J. T., van der Werf, G. R., Kasibhatla, P. S., Collatz, G. J., Morton, D. C., and DeFries, R. S.: Assessing variability and long-term trends in burned area by merging multiple satellite fire products, Biogeosciences, 7, 1171–1186, https://doi.org/10.5194/bg-7-1171-2010, 2010.
Ginoux, P., Chin, M., Tegen, I., Prospero, J. M., Holben, B., Dubovik, O., and Lin, S.-J.: Sources and distributions of dust aerosols simulated with the GOCART model, J. Geophys. Res.-Atmos., 106, 20255–20273, https://doi.org/10.1029/2000JD000053, 2001.
Giorgi, F. and Chameides, W. L.: Rainout lifetimes of highly soluble aerosols and gases as inferred from simulations with a general circulation model, J. Geophys. Res.-Atmos., 91, 14367–14376, https://doi.org/10.1029/JD091iD13p14367, 1986.
Gordon, H., Field, P. R., Abel, S. J., Dalvi, M., Grosvenor, D. P., Hill, A. A., Johnson, B. T., Miltenberger, A. K., Yoshioka, M., and Carslaw, K. S.: Large simulated radiative effects of smoke in the south-east Atlantic, Atmos. Chem. Phys., 18, 15261–15289, https://doi.org/10.5194/acp-18-15261-2018, 2018.
Grasp Open: Homepage, available at: https://www.grasp-open.com, last access: 30 November 2021.
Grell, G. A.: Prognostic Evaluation of Assumptions Used by Cumulus Parameterizations, Mon. Weather Rev., 121, 764–787, https://doi.org/10.1175/1520-0493(1993)121<0764:PEOAUB>2.0.CO;2, 1993.
Grell, G. A. and Baklanov, A.: Integrated modeling for forecasting weather and air quality: A call for fully coupled approaches, Atmos. Environ., 45, 6845–6851, https://doi.org/10.1016/j.atmosenv.2011.01.017, 2011.
Grell, G. A. and Dévényi, D.: A generalized approach to parameterizing convection combining ensemble and data assimilation techniques, Geophys. Res. Lett., 29, 38-1-38-4, https://doi.org/10.1029/2002GL015311, 2002.
Grell, G. A., Knoche, R., Peckham, S. E., and McKeen, S. A.: Online versus offline air quality modeling on cloud-resolving scales, Geophys. Res. Lett., 31, L16117, https://doi.org/10.1029/2004GL020175, 2004.
Grell, G. A., Peckham, S. E., Schmitz, R., McKeen, S. A., Frost, G., Skamarock, W. C., and Eder, B.: Fully coupled “online” chemistry within the WRF model, Atmos. Environ., 39, 6957–6975, https://doi.org/10.1016/j.atmosenv.2005.04.027, 2005.
Grell, G. A., Freitas, S. R., Stuefer, M., and Fast, J.: Inclusion of biomass burning in WRF-Chem: impact of wildfires on weather forecasts, Atmos. Chem. Phys., 11, 5289–5303, https://doi.org/10.5194/acp-11-5289-2011, 2011.
Guenther, A., Karl, T., Harley, P., Wiedinmyer, C., Palmer, P. I., and Geron, C.: Estimates of global terrestrial isoprene emissions using MEGAN (Model of Emissions of Gases and Aerosols from Nature), Atmos. Chem. Phys., 6, 3181–3210, https://doi.org/10.5194/acp-6-3181-2006, 2006.
Guenther, A. B., Jiang, X., Heald, C. L., Sakulyanontvittaya, T., Duhl, T., Emmons, L. K., and Wang, X.: The Model of Emissions of Gases and Aerosols from Nature version 2.1 (MEGAN2.1): an extended and updated framework for modeling biogenic emissions, Geosci. Model Dev., 5, 1471–1492, https://doi.org/10.5194/gmd-5-1471-2012, 2012.
Hansen, J., Sato, M., and Ruedy, R.: Radiative forcing and climate response, J. Geophys. Res.-Atmos., 102, 6831–6864, https://doi.org/10.1029/96JD03436, 1997.
Haslett, S. L., Taylor, J. W., Deetz, K., Vogel, B., Babić, K., Kalthoff, N., Wieser, A., Dione, C., Lohou, F., Brito, J., Dupuy, R., Schwarzenboeck, A., Zieger, P., and Coe, H.: The radiative impact of out-of-cloud aerosol hygroscopic growth during the summer monsoon in southern West Africa, Atmos. Chem. Phys., 19, 1505–1520, https://doi.org/10.5194/acp-19-1505-2019, 2019.
Haywood, J. M., Osborne, S. R., Francis, P. N., Keil, A., Formenti, P., Andreae, M. O., and Kaye, P. H.: The mean physical and optical properties of regional haze dominated by biomass burning aerosol measured from the C-130 aircraft during SAFARI 2000, J. Geophys. Res.-Atmos., 108, 8473, https://doi.org/10.1029/2002JD002226, 2003.
Haywood, J. M., Abel, S. J., Barrett, P. A., Bellouin, N., Blyth, A., Bower, K. N., Brooks, M., Carslaw, K., Che, H., Coe, H., Cotterell, M. I., Crawford, I., Cui, Z., Davies, N., Dingley, B., Field, P., Formenti, P., Gordon, H., de Graaf, M., Herbert, R., Johnson, B., Jones, A. C., Langridge, J. M., Malavelle, F., Partridge, D. G., Peers, F., Redemann, J., Stier, P., Szpek, K., Taylor, J. W., Watson-Parris, D., Wood, R., Wu, H., and Zuidema, P.: The CLoud–Aerosol–Radiation Interaction and Forcing: Year 2017 (CLARIFY-2017) measurement campaign, Atmos. Chem. Phys., 21, 1049–1084, https://doi.org/10.5194/acp-21-1049-2021, 2021.
Helfand, H. M. and Labraga, J. C.: Design of a Nonsingular Level 2.5 Second-Order Closure Model for the Prediction of Atmospheric Turbulence, J. Atmos. Sci., 45, 113–132, https://doi.org/10.1175/1520-0469(1988)045<0113:DOANLS>2.0.CO;2, 1988.
Hoffer, A., Gelencsér, A., Guyon, P., Kiss, G., Schmid, O., Frank, G. P., Artaxo, P., and Andreae, M. O.: Optical properties of humic-like substances (HULIS) in biomass-burning aerosols, Atmos. Chem. Phys., 6, 3563–3570, https://doi.org/10.5194/acp-6-3563-2006, 2006.
Hoffer, A., Tóth, A., Nyirõ-Kósa, I., Pósfai, M., and Gelencsér, A.: Light absorption properties of laboratory-generated tar ball particles, Atmos. Chem. Phys., 16, 239–246, https://doi.org/10.5194/acp-16-239-2016, 2016.
Hoffer, A., Tóth, A., Pósfai, M., Chung, C. E., and Gelencsér, A.: Brown carbon absorption in the red and near-infrared spectral region, Atmospheric Meas. Tech., 10, 2353–2359, https://doi.org/10.5194/amt-10-2353-2017, 2017.
Hong, S.-Y., Noh, Y., and Dudhia, J.: A New Vertical Diffusion Package with an Explicit Treatment of Entrainment Processes, Mon. Weather Rev., 134, 2318–2341, https://doi.org/10.1175/MWR3199.1, 2006.
Hu, Y., Winker, D., Vaughan, M., Lin, B., Omar, A., Trepte, C., Flittner, D., Yang, P., Nasiri, S. L., Baum, B., Holz, R., Sun, W., Liu, Z., Wang, Z., Young, S., Stamnes, K., Huang, J., and Kuehn, R.: CALIPSO/CALIOP Cloud Phase Discrimination Algorithm, J. Atmos. Ocean. Tech., 26, 2293–2309, https://doi.org/10.1175/2009JTECHA1280.1, 2009.
Huneeus, N., Schulz, M., Balkanski, Y., Griesfeller, J., Prospero, J., Kinne, S., Bauer, S., Boucher, O., Chin, M., Dentener, F., Diehl, T., Easter, R., Fillmore, D., Ghan, S., Ginoux, P., Grini, A., Horowitz, L., Koch, D., Krol, M. C., Landing, W., Liu, X., Mahowald, N., Miller, R., Morcrette, J.-J., Myhre, G., Penner, J., Perlwitz, J., Stier, P., Takemura, T., and Zender, C. S.: Global dust model intercomparison in AeroCom phase I, Atmos. Chem. Phys., 11, 7781–7816, https://doi.org/10.5194/acp-11-7781-2011, 2011.
Johnson, B. T., Haywood, J. M., Langridge, J. M., Darbyshire, E., Morgan, W. T., Szpek, K., Brooke, J. K., Marenco, F., Coe, H., Artaxo, P., Longo, K. M., Mulcahy, J. P., Mann, G. W., Dalvi, M., and Bellouin, N.: Evaluation of biomass burning aerosols in the HadGEM3 climate model with observations from the SAMBBA field campaign, Atmos. Chem. Phys., 16, 14657–14685, https://doi.org/10.5194/acp-16-14657-2016, 2016.
Jones, S., Creighton, G., Kuchera, E., George, K., and Elliott, A.: Adapting WRF-CHEM GOCART for Fine-Scale Dust Forecasting, AGU Fall Meeting Abstracts, San Francisco, California, USA, 13–17 December 2010, NH53A-1258, 2010.
Jones, S. L., Adams-Selin, R., Hunt, E. D., Creighton, G. A., and Cetola, J. D.: Update on modifications to WRF-CHEM GOCART for fine-scale dust forecasting at AFWA, AGU Fall Meeting, San Francisco, California, USA, 3–7 December 2012, A33D-0188, 2012.
Kacarab, M., Thornhill, K. L., Dobracki, A., Howell, S. G., O'Brien, J. R., Freitag, S., Poellot, M. R., Wood, R., Zuidema, P., Redemann, J., and Nenes, A.: Biomass burning aerosol as a modulator of the droplet number in the southeast Atlantic region, Atmos. Chem. Phys., 20, 3029–3040, https://doi.org/10.5194/acp-20-3029-2020, 2020.
Kaiser, J. W., Heil, A., Andreae, M. O., Benedetti, A., Chubarova, N., Jones, L., Morcrette, J. J., Razinger, M., Schultz, M. G., Suttie, M., and van der Werf, G. R.: Biomass burning emissions estimated with a global fire assimilation system based on observed fire radiative power, Biogeosciences, 9, 527–554, https://doi.org/10.5194/bg-9-527-2012, 2012.
Kalnay, E., Kanamitsu, M., Kistler, R., Collins, W., Deaven, D., Gandin, L., Iredell, M., Saha, S., White, G., Woollen, J., Zhu, Y., Chelliah, M., Ebisuzaki, W., Higgins, W., Janowiak, J., Mo, K. C., Ropelewski, C., Wang, J., Leetmaa, A., Reynolds, R., Jenne, R., and Joseph, D.: The NCEP/NCAR 40 Year Reanalysis Project, B. Am. Meteorol. Soc., 77, 437–472, https://doi.org/10.1175/1520-0477(1996)077<0437:TNYRP>2.0.CO;2, 1996.
Keil, A. and Haywood, J. M.: Solar radiative forcing by biomass burning aerosol particles during SAFARI 2000: A case study based on measured aerosol and cloud properties, J. Geophys. Res.-Atmos., 108, 8467, https://doi.org/10.1029/2002JD002315, 2003.
Kirchstetter, T. W., Novakov, T., Hobbs, P. V., and Magi, B.: Airborne measurements of carbonaceous aerosols in southern Africa during the dry biomass burning season, J. Geophys. Res.-Atmos., 108, 8476, https://doi.org/10.1029/2002JD002171, 2003.
Kirchstetter, T. W., Novakov, T., and Hobbs, P. V.: Evidence that the spectral dependence of light absorption by aerosols is affected by organic carbon, J. Geophys. Res.-Atmos., 109, D21208, https://doi.org/10.1029/2004JD004999, 2004.
Knippertz, P., Fink, A. H., Deroubaix, A., Morris, E., Tocquer, F., Evans, M. J., Flamant, C., Gaetani, M., Lavaysse, C., Mari, C., Marsham, J. H., Meynadier, R., Affo-Dogo, A., Bahaga, T., Brosse, F., Deetz, K., Guebsi, R., Latifou, I., Maranan, M., Rosenberg, P. D., and Schlueter, A.: A meteorological and chemical overview of the DACCIWA field campaign in West Africa in June–July 2016, Atmos. Chem. Phys., 17, 10893–10918, https://doi.org/10.5194/acp-17-10893-2017, 2017.
Koffi, B., Schulz, M., Bréon, F.-M., Griesfeller, J., Winker, D., Balkanski, Y., Bauer, S., Berntsen, T., Chin, M., Collins, W. D., Dentener, F., Diehl, T., Easter, R., Ghan, S., Ginoux, P., Gong, S., Horowitz, L. W., Iversen, T., Kirkevåg, A., Koch, D., Krol, M., Myhre, G., Stier, P., and Takemura, T.: Application of the CALIOP layer product to evaluate the vertical distribution of aerosols estimated by global models: AeroCom phase I results, J. Geophys. Res.-Atmos., 117, D10201, https://doi.org/10.1029/2011JD016858, 2012.
Koffi, B., Schulz, M., Bréon, F.-M., Dentener, F., Steensen, B. M., Griesfeller, J., Winker, D., Balkanski, Y., Bauer, S. E., Bellouin, N., Berntsen, T., Bian, H., Chin, M., Diehl, T., Easter, R., Ghan, S., Hauglustaine, D. A., Iversen, T., Kirkevåg, A., Liu, X., Lohmann, U., Myhre, G., Rasch, P., Seland, Ø., Skeie, R. B., Steenrod, S. D., Stier, P., Tackett, J., Takemura, T., Tsigaridis, K., Vuolo, M. R., Yoon, J., and Zhang, K.: Evaluation of the aerosol vertical distribution in global aerosol models through comparison against CALIOP measurements: AeroCom phase II results, J. Geophys. Res.-Atmos., 121, 7254–7283, https://doi.org/10.1002/2015JD024639, 2016.
Laing, J. R., Jaffe, D. A., and Hee, J. R.: Physical and optical properties of aged biomass burning aerosol from wildfires in Siberia and the Western USA at the Mt. Bachelor Observatory, Atmos. Chem. Phys., 16, 15185–15197, https://doi.org/10.5194/acp-16-15185-2016, 2016.
Laskin, A., Laskin, J., and Nizkorodov, S. A.: Chemistry of Atmospheric Brown Carbon, Chem. Rev., 115, 4335–4382, https://doi.org/10.1021/cr5006167, 2015.
Lassman, W., Ford, B., Gan, R. W., Pfister, G., Magzamen, S., Fischer, E. V., and Pierce, J. R.: Spatial and temporal estimates of population exposure to wildfire smoke during the Washington state 2012 wildfire season using blended model, satellite, and in situ data, GeoHealth, 1, 106–121, https://doi.org/10.1002/2017GH000049, 2017.
Leahy, L. V., Anderson, T. L., Eck, T. F., and Bergstrom, R. W.: A synthesis of single scattering albedo of biomass burning aerosol over southern Africa during SAFARI 2000, Geophys. Res. Lett., 34, L12814, https://doi.org/10.1029/2007GL029697, 2007.
Lee, J., Hsu, N. C., Bettenhausen, C., Sayer, A. M., Seftor, C. J., Jeong, M.-J., Tsay, S.-C., Welton, E. J., Wang, S.-H., and Chen, W.-N.: Evaluating the Height of Biomass Burning Smoke Aerosols Retrieved from Synergistic Use of Multiple Satellite Sensors over Southeast Asia, Aerosol Air Qual. Res., 16, 2831–2842, https://doi.org/10.4209/aaqr.2015.08.0506, 2016.
Li, L., Dubovik, O., Derimian, Y., Schuster, G. L., Lapyonok, T., Litvinov, P., Ducos, F., Fuertes, D., Chen, C., Li, Z., Lopatin, A., Torres, B., and Che, H.: Retrieval of aerosol components directly from satellite and ground-based measurements, Atmos. Chem. Phys., 19, 13409–13443, https://doi.org/10.5194/acp-19-13409-2019, 2019.
Lin, S.-J. and Rood, R. B.: Multidimensional Flux-Form Semi-Lagrangian Transport Schemes, Mon. Weather Rev., 124, 2046–2070, https://doi.org/10.1175/1520-0493(1996)124<2046:MFFSLT>2.0.CO;2, 1996.
Lin, Y.-L., Farley, R. D., and Orville, H. D.: Bulk Parameterization of the Snow Field in a Cloud Model, J. Clim. Appl. Meteorol., 22, 1065–1092, https://doi.org/10.1175/1520-0450(1983)022<1065:BPOTSF>2.0.CO;2, 1983.
Lindesay, J. A., Andreae, M. O., Goldammer, J. G., Harris, G., Annegarn, H. J., Garstang, M., Scholes, R. J., and van Wilgen, B. W.: International geosphere-biosphere programme/international global atmospheric chemistry SAFARI-92 field experiment: Background and overview, J. Geophys. Res.-Atmos., 101, 23521–23530, https://doi.org/10.1029/96JD01512, 1996.
Lingard, J., Labrador, L., Brookes, D., and Fraser, A.: Statistical evaluation of the input meteorological data used for the UK air quality forecast (UK-AQF), Ricardo-AEA Ltd., Harwell, UK, RICARDO-AEA/R/3388, 34 pp., 2013.
Liousse, C., Guillaume, B., Grégoire, J. M., Mallet, M., Galy, C., Pont, V., Akpo, A., Bedou, M., Castéra, P., Dungall, L., Gardrat, E., Granier, C., Konaré, A., Malavelle, F., Mariscal, A., Mieville, A., Rosset, R., Serça, D., Solmon, F., Tummon, F., Assamoi, E., Yoboué, V., and Van Velthoven, P.: Updated African biomass burning emission inventories in the framework of the AMMA-IDAF program, with an evaluation of combustion aerosols, Atmos. Chem. Phys., 10, 9631–9646, https://doi.org/10.5194/acp-10-9631-2010, 2010.
Liu, C., Chung, C. E., Yin, Y., and Schnaiter, M.: The absorption Ångström exponent of black carbon: from numerical aspects, Atmos. Chem. Phys., 18, 6259–6273, https://doi.org/10.5194/acp-18-6259-2018, 2018.
Liu, F., Yon, J., Fuentes, A., Lobo, P., Smallwood, G. J., and Corbin, J. C.: Review of recent literature on the light absorption properties of black carbon: Refractive index, mass absorption cross section, and absorption function, Aerosol Sci. Tech., 54, 33–51, https://doi.org/10.1080/02786826.2019.1676878, 2020.
Lu, Z., Liu, X., Zhang, Z., Zhao, C., Meyer, K., Rajapakshe, C., Wu, C., Yang, Z., and Penner, J. E.: Biomass smoke from southern Africa can significantly enhance the brightness of stratocumulus over the southeastern Atlantic Ocean, Proc. Natl. Acad. Sci., 115, 2924–2929, https://doi.org/10.1073/pnas.1713703115, 2018.
Mallet, M., Solmon, F., Nabat, P., Elguindi, N., Waquet, F., Bouniol, D., Sayer, A. M., Meyer, K., Roehrig, R., Michou, M., Zuidema, P., Flamant, C., Redemann, J., and Formenti, P.: Direct and semi-direct radiative forcing of biomass-burning aerosols over the southeast Atlantic (SEA) and its sensitivity to absorbing properties: a regional climate modeling study, Atmos. Chem. Phys., 20, 13191–13216, https://doi.org/10.5194/acp-20-13191-2020, 2020.
Marticorena, B. and Bergametti, G.: Modeling the atmospheric dust cycle: 1. Design of a soil-derived dust emission scheme, J. Geophys. Res.-Atmos., 100, 16415–16430, https://doi.org/10.1029/95JD00690, 1995.
Meyer, K., Platnick, S., Oreopoulos, L., and Lee, D.: Estimating the direct radiative effect of absorbing aerosols overlying marine boundary layer clouds in the southeast Atlantic using MODIS and CALIOP: ABOVE-CLOUD DARE FROM MODIS AND CALIOP, J. Geophys. Res.-Atmos., 118, 4801–4815, https://doi.org/10.1002/jgrd.50449, 2013.
Mlawer, E. J., Taubman, S. J., Brown, P. D., Iacono, M. J., and Clough, S. A.: Radiative transfer for inhomogeneous atmospheres: RRTM, a validated correlated-k model for the longwave, J. Geophys. Res.-Atmos., 102, 16663–16682, https://doi.org/10.1029/97JD00237, 1997.
Myhre, G., Samset, B. H., Schulz, M., Balkanski, Y., Bauer, S., Berntsen, T. K., Bian, H., Bellouin, N., Chin, M., Diehl, T., Easter, R. C., Feichter, J., Ghan, S. J., Hauglustaine, D., Iversen, T., Kinne, S., Kirkevåg, A., Lamarque, J.-F., Lin, G., Liu, X., Lund, M. T., Luo, G., Ma, X., van Noije, T., Penner, J. E., Rasch, P. J., Ruiz, A., Seland, Ø., Skeie, R. B., Stier, P., Takemura, T., Tsigaridis, K., Wang, P., Wang, Z., Xu, L., Yu, H., Yu, F., Yoon, J.-H., Zhang, K., Zhang, H., and Zhou, C.: Radiative forcing of the direct aerosol effect from AeroCom Phase II simulations, Atmos. Chem. Phys., 13a, 1853–1877, https://doi.org/10.5194/acp-13-1853-2013, 2013a.
Myhre, G., Shindell, D., Bréon, F.-M. , Collins, W., Fuglestvedt, J., Huang, J., Koch, D., Lamarque, J.-F., Lee, D., Mendoza, B., Nakajima, T., Robock, A., Stephens, G., Takemura, T., and Zhang, H.: Anthropogenic and Natural Radiative Forcing, in: Climate Change 2013: The Physical Science Basis. Contribution of Working Group I to the Fifth Assessment Report of the Intergovernmental Panel on Climate Change, edited by: Stocker, T. F., Qin, D., Plattner, G.-K., Tignor, M., Allen, S. K., Boschung, J., Nauels, A., Xia, Y., Bex, V., and Midgley, P. M., Cambridge University Press, Cambridge, United Kingdom and New York, NY, USA, 2013b.
Pan, X., Ichoku, C., Chin, M., Bian, H., Darmenov, A., Colarco, P., Ellison, L., Kucsera, T., da Silva, A., Wang, J., Oda, T., and Cui, G.: Six global biomass burning emission datasets: intercomparison and application in one global aerosol model, Atmos. Chem. Phys., 20, 969–994, https://doi.org/10.5194/acp-20-969-2020, 2020.
Peckham, S. E.: WRF/Chem version 3.3 user’s guide, Earth System Research Laboratory (U.S.), Global Systems Division, NOAA technical memorandum OAR GSD, 40, available at: https://repository.library.noaa.gov/view/noaa/11119 (last access: 30 November 2021), 2012.
Peers, F., Waquet, F., Cornet, C., Dubuisson, P., Ducos, F., Goloub, P., Szczap, F., Tanré, D., and Thieuleux, F.: Absorption of aerosols above clouds from POLDER/PARASOL measurements and estimation of their direct radiative effect, Atmos. Chem. Phys., 15, 4179–4196, https://doi.org/10.5194/acp-15-4179-2015, 2015.
Peers, F., Bellouin, N., Waquet, F., Ducos, F., Goloub, P., Mollard, J., Myhre, G., Skeie, R. B., Takemura, T., Tanré, D., Thieuleux, F., and Zhang, K.: Comparison of aerosol optical properties above clouds between POLDER and AeroCom models over the South East Atlantic Ocean during the fire season, Geophys. Res. Lett., 43, 3991–4000, https://doi.org/10.1002/2016GL068222, 2016.
Peers, F., Francis, P., Fox, C., Abel, S. J., Szpek, K., Cotterell, M. I., Davies, N. W., Langridge, J. M., Meyer, K. G., Platnick, S. E., and Haywood, J. M.: Observation of absorbing aerosols above clouds over the south-east Atlantic Ocean from the geostationary satellite SEVIRI – Part 1: Method description and sensitivity, Atmos. Chem. Phys., 19, 9595–9611, https://doi.org/10.5194/acp-19-9595-2019, 2019.
Peers, F., Francis, P., Abel, S. J., Barrett, P. A., Bower, K. N., Cotterell, M. I., Crawford, I., Davies, N. W., Fox, C., Fox, S., Langridge, J. M., Meyer, K. G., Platnick, S. E., Szpek, K., and Haywood, J. M.: Observation of absorbing aerosols above clouds over the south-east Atlantic Ocean from the geostationary satellite SEVIRI – Part 2: Comparison with MODIS and aircraft measurements from the CLARIFY-2017 field campaign, Atmos. Chem. Phys., 21, 3235–3254, https://doi.org/10.5194/acp-21-3235-2021, 2021.
Pfister, G. G., Avise, J., Wiedinmyer, C., Edwards, D. P., Emmons, L. K., Diskin, G. D., Podolske, J., and Wisthaler, A.: CO source contribution analysis for California during ARCTAS-CARB, Atmos. Chem. Phys., 11, 7515–7532, https://doi.org/10.5194/acp-11-7515-2011, 2011.
Pistone, K., Redemann, J., Doherty, S., Zuidema, P., Burton, S., Cairns, B., Cochrane, S., Ferrare, R., Flynn, C., Freitag, S., Howell, S. G., Kacenelenbogen, M., LeBlanc, S., Liu, X., Schmidt, K. S., Sedlacek III, A. J., Segal-Rozenhaimer, M., Shinozuka, Y., Stamnes, S., Diedenhoven, B., van, Harten, G. V., and Xu, F.: Intercomparison of biomass burning aerosol optical properties from in situ and remote-sensing instruments in ORACLES-2016, Atmos. Chem. Phys., 19, 9181–9208, https://doi.org/10.5194/acp-19-9181-2019, 2019.
Podgorny, I. A. and Ramanathan, V.: A modeling study of the direct effect of aerosols over the tropical Indian Ocean, J. Geophys. Res.-Atmos., 106, 24097–24105, https://doi.org/10.1029/2001JD900214, 2001.
Popp, T., De Leeuw, G., Bingen, C., Brühl, C., Capelle, V., Chedin, A., Clarisse, L., Dubovik, O., Grainger, R., Griesfeller, J., Heckel, A., Kinne, S., Klüser, L., Kosmale, M., Kolmonen, P., Lelli, L., Litvinov, P., Mei, L., North, P., Pinnock, S., Povey, A., Robert, C., Schulz, M., Sogacheva, L., Stebel, K., Stein Zweers, D., Thomas, G., Tilstra, L. G., Vandenbussche, S., Veefkind, P., Vountas, M., and Xue, Y.: Development, Production and Evaluation of Aerosol Climate Data Records from European Satellite Observations (Aerosol_cci), Remote Sens., 8, 421, https://doi.org/10.3390/rs8050421, 2016.
Powers, J. G., Klemp, J. B., Skamarock, W. C., Davis, C. A., Dudhia, J., Gill, D. O., Coen, J. L., Gochis, D. J., Ahmadov, R., Peckham, S. E., Grell, G. A., Michalakes, J., Trahan, S., Benjamin, S. G., Alexander, C. R., Dimego, G. J., Wang, W., Schwartz, C. S., Romine, G. S., Liu, Z., Snyder, C., Chen, F., Barlage, M. J., Yu, W., and Duda, M. G.: The Weather Research and Forecasting Model: Overview, System Efforts, and Future Directions, B. Am. Meteorol. Soc., 98, 1717–1737, https://doi.org/10.1175/BAMS-D-15-00308.1, 2017.
Reddington, C. L., Spracklen, D. V., Artaxo, P., Ridley, D. A., Rizzo, L. V., and Arana, A.: Analysis of particulate emissions from tropical biomass burning using a global aerosol model and long-term surface observations, Atmos. Chem. Phys., 16, 11083–11106, 2016.
Redemann, J., Wood, R., Zuidema, P., Doherty, S. J., Luna, B., LeBlanc, S. E., Diamond, M. S., Shinozuka, Y., Chang, I. Y., Ueyama, R., Pfister, L., Ryoo, J.-M., Dobracki, A. N., da Silva, A. M., Longo, K. M., Kacenelenbogen, M. S., Flynn, C. J., Pistone, K., Knox, N. M., Piketh, S. J., Haywood, J. M., Formenti, P., Mallet, M., Stier, P., Ackerman, A. S., Bauer, S. E., Fridlind, A. M., Carmichael, G. R., Saide, P. E., Ferrada, G. A., Howell, S. G., Freitag, S., Cairns, B., Holben, B. N., Knobelspiesse, K. D., Tanelli, S., L'Ecuyer, T. S., Dzambo, A. M., Sy, O. O., McFarquhar, G. M., Poellot, M. R., Gupta, S., O'Brien, J. R., Nenes, A., Kacarab, M., Wong, J. P. S., Small-Griswold, J. D., Thornhill, K. L., Noone, D., Podolske, J. R., Schmidt, K. S., Pilewskie, P., Chen, H., Cochrane, S. P., Sedlacek, A. J., Lang, T. J., Stith, E., Segal-Rozenhaimer, M., Ferrare, R. A., Burton, S. P., Hostetler, C. A., Diner, D. J., Seidel, F. C., Platnick, S. E., Myers, J. S., Meyer, K. G., Spangenberg, D. A., Maring, H., and Gao, L.: An overview of the ORACLES (ObseRvations of Aerosols above CLouds and their intEractionS) project: aerosol–cloud–radiation interactions in the southeast Atlantic basin, Atmos. Chem. Phys., 21, 1507–1563, https://doi.org/10.5194/acp-21-1507-2021, 2021.
Reid, J. S., Hyer, E. J., Prins, E. M., Westphal, D. L., Zhang, J., Christopher, S. A., Curtis, C. A., Schmidt, C. C., Eleuterio, D. P., Richardson, K. A., and Hoffman, J. P.: Global Monitoring and Forecasting of Biomass-Burning Smoke: Description of and Lessons From the Fire Locating and Modeling of Burning Emissions (FLAMBE) Program, IEEE J. Sel. Top. Appl. Earth Obs. Remote Sens., 2, 144–162, https://doi.org/10.1109/JSTARS.2009.2027443, 2009.
Roberts, G., Wooster, M. J., and Lagoudakis, E.: Annual and diurnal african biomass burning temporal dynamics, Biogeosciences, 6, 849–866, https://doi.org/10.5194/bg-6-849-2009, 2009.
Rosenfeld, D., Sherwood, S., Wood, R., and Donner, L.: Climate Effects of Aerosol-Cloud Interactions, Science, 343, 379–380, https://doi.org/10.1126/science.1247490, 2014.
Ruellan, S., Cachier, H., Gaudichet, A., Masclet, P., and Lacaux, J.-P.: Airborne aerosols over central Africa during the Experiment for Regional Sources and Sinks of Oxidants (EXPRESSO), J. Geophys. Res.-Atmos., 104, 30673–30690, https://doi.org/10.1029/1999JD900804, 1999.
Sakaeda, N., Wood, R., and Rasch, P. J.: Direct and semidirect aerosol effects of southern African biomass burning aerosol, J. Geophys.-Atmos., 116, D12205, https://doi.org/10.1029/2010JD015540, 2011.
Samset, B. H., Myhre, G., Herber, A., Kondo, Y., Li, S.-M., Moteki, N., Koike, M., Oshima, N., Schwarz, J. P., Balkanski, Y., Bauer, S. E., Bellouin, N., Berntsen, T. K., Bian, H., Chin, M., Diehl, T., Easter, R. C., Ghan, S. J., Iversen, T., Kirkevåg, A., Lamarque, J.-F., Lin, G., Liu, X., Penner, J. E., Schulz, M., Seland, Ø., Skeie, R. B., Stier, P., Takemura, T., Tsigaridis, K., and Zhang, K.: Modelled black carbon radiative forcing and atmospheric lifetime in AeroCom Phase II constrained by aircraft observations, Atmos. Chem. Phys., 14, 12465–12477, https://doi.org/10.5194/acp-14-12465-2014, 2014.
Schultz, M. G., Backman, L., Balkanski, Y., Bjoerndalsaeter, S., Brand, R., Burrows, J. P., Dalsoeren, S., Vasconcelos, M., Grodtmann, B., Hauglustaine, D. A., Heil, A., Hoelzemann, J., Isaksen, I. S. A., Kaurola, J., Knorr, W., Ladstaetter-Weissenmayer, A., Mota, B., Oom, D., Pacyna, J., and Wittrock, F.: REanalysis of the TROpospheric chemical composition over the past 40 years (RETRO) - A long-term global modeling study of tropospheric chemistry, Final Report, Max Planck Institute for Meteorology, Reports on Earth System Science, Hamburg, Germany, 48/2007, ISSN 1614-1199, 2007.
Shinozuka, Y., Saide, P. E., Ferrada, G. A., Burton, S. P., Ferrare, R., Doherty, S. J., Gordon, H., Longo, K., Mallet, M., Feng, Y., Wang, Q., Cheng, Y., Dobracki, A., Freitag, S., Howell, S. G., LeBlanc, S., Flynn, C., Segal-Rosenhaimer, M., Pistone, K., Podolske, J. R., Stith, E. J., Bennett, J. R., Carmichael, G. R., da Silva, A., Govindaraju, R., Leung, R., Zhang, Y., Pfister, L., Ryoo, J.-M., Redemann, J., Wood, R., and Zuidema, P.: Modeling the smoky troposphere of the southeast Atlantic: a comparison to ORACLES airborne observations from September of 2016, Atmos. Chem. Phys., 20, 11491–11526, https://doi.org/10.5194/acp-20-11491-2020, 2020.
Skamarock, C., Klemp, B., Dudhia, J., Gill, O., Barker, D., Duda, G., Huang, X., Wang, W., and Powers, G.: A Description of the Advanced Research WRF Version 3, University Corporation for Atmospheric Research, NCAR/TN-475+STR, https://doi.org/10.5065/D68S4MVH, 2008.
Skamarock, W. C., Klemp, J. B., Dudhia, J., Gill, D. O., Barker, D. M., Wang, W., and Powers, J. G.: A Description of the Advanced Research WRF Version 2, https://doi.org/10.5065/D6DZ069T, 2005.
Sorensen, C. M.: Light Scattering by Fractal Aggregates: A Review, Aerosol Sci. Tech., 35, 648–687, https://doi.org/10.1080/02786820117868, 2001.
Stier, P., Schutgens, N. A. J., Bellouin, N., Bian, H., Boucher, O., Chin, M., Ghan, S., Huneeus, N., Kinne, S., Lin, G., Ma, X., Myhre, G., Penner, J. E., Randles, C. A., Samset, B., Schulz, M., Takemura, T., Yu, F., Yu, H., and Zhou, C.: Host model uncertainties in aerosol radiative forcing estimates: results from the AeroCom Prescribed intercomparison study, Atmos. Chem. Phys., 13, 3245–3270, https://doi.org/10.5194/acp-13-3245-2013, 2013.
Sumlin, B., Heinson, Y., Shetty, N., Pandey, A., Pattison, R., Baker, S., Hao, W., and Chakrabarty, R.: UV-Vis-IR Spectral Complex Refractive Indices and Optical Properties of Brown Carbon Aerosol from Biomass Burning, J. Quant. Spectrosc. RA, 206, 392-398, https://doi.org/10.1016/j.jqsrt.2017.12.009, 2017.
Swap, R. J., Annegarn, H. J., Suttles, J. T., Haywood, J., Helmlinger, M. C., Hely, C., Hobbs, P. V., Holben, B. N., Ji, J., King, M. D., Landmann, T., Maenhaut, W., Otter, L., Pak, B., Piketh, S. J., Platnick, S., Privette, J., Roy, D., Thompson, A. M., Ward, D., and Yokelson, R.: The Southern African Regional Science Initiative (SAFARI 2000): overview of the dry season field campaign, S. Afr. J. Sci., 98, 125–130, 2002.
Taylor, J. W., Wu, H., Szpek, K., Bower, K., Crawford, I., Flynn, M. J., Williams, P. I., Dorsey, J., Langridge, J. M., Cotterell, M. I., Fox, C., Davies, N. W., Haywood, J. M., and Coe, H.: Absorption closure in highly aged biomass burning smoke, Atmos. Chem. Phys., 20, 11201–11221, https://doi.org/10.5194/acp-20-11201-2020, 2020.
Tewari, M., Chen, F., Wang, W., Dudhia, J., LeMone, M. A., Gayno, G., Wegiel, J., and Cuenca, R. H.: Implementation and verification of the unified NOAH land surface model in the WRF model, in: 20th conference on weather analysis and forecasting/16th conference on numerical weather prediction, 1115, 6, 2004.
Thunis, P., Georgieva, E., and Galmarini, S.: A procedure for air quality models benchmarking Version 2, European Commission, Joint Research Centre, Ispra, Italy, 2011.
Turquety, S., Menut, L., Bessagnet, B., Anav, A., Viovy, N., Maignan, F., and Wooster, M.: APIFLAME v1.0: high-resolution fire emission model and application to the Euro-Mediterranean region, Geosci. Model Dev., 7, 587–612, https://doi.org/10.5194/gmd-7-587-2014, 2014.
Vanbauce, C., Cadet, B., and Marchand, R. T.: Comparison of POLDER apparent and corrected oxygen pressure to ARM/MMCR cloud boundary pressures, Geophys. Res. Lett., 30, 1212, https://doi.org/10.1029/2002GL016449, 2003.
Wang, X., Heald, C. L., Ridley, D. A., Schwarz, J. P., Spackman, J. R., Perring, A. E., Coe, H., Liu, D., and Clarke, A. D.: Exploiting simultaneous observational constraints on mass and absorption to estimate the global direct radiative forcing of black carbon and brown carbon, Atmos. Chem. Phys., 14, 10989–11010, https://doi.org/10.5194/acp-14-10989-2014, 2014.
Waquet, F., Peers, F., Ducos, F., Goloub, P., Platnick, S., Riedi, J., Tanré, D., and Thieuleux, F.: Global analysis of aerosol properties above clouds, Geophys. Res. Lett., 40, 5809–5814, https://doi.org/10.1002/2013GL057482, 2013a.
Waquet, F., Cornet, C., Deuzé, J.-L., Dubovik, O., Ducos, F., Goloub, P., Herman, M., Lapyonok, T., Labonnote, L. C., Riedi, J., Tanré, D., Thieuleux, F., and Vanbauce, C.: Retrieval of aerosol microphysical and optical properties above liquid clouds from POLDER/PARASOL polarization measurements, Atmos. Meas. Tech., 6, 991–1016, https://doi.org/10.5194/amt-6-991-2013, 2013b.
Waquet, F., Peers, F., Ducos, F., Thieuleux, F., Deaconu, L. T., Chauvigné, A., and Riedi, J.: Aerosols above clouds products from POLDER/PARASOL satellite observations, AERO-AC products [data set], https://doi.org/10.25326/82, 2020.
van der Werf, G. R., Randerson, J. T., Giglio, L., Collatz, G. J., Mu, M., Kasibhatla, P. S., Morton, D. C., DeFries, R. S., Jin, Y., and van Leeuwen, T. T.: Global fire emissions and the contribution of deforestation, savanna, forest, agricultural, and peat fires (1997–2009), Atmos. Chem. Phys., 10, 11707–11735, https://doi.org/10.5194/acp-10-11707-2010, 2010.
Wesely, M. L.: Parameterization of surface resistances to gaseous dry deposition in regional-scale numerical models, Atmos. Environ., 23, 1293–1304, https://doi.org/10.1016/0004-6981(89)90153-4, 1989.
Wiedinmyer, C., Akagi, S., Yokelson, R., Emmons, L., Al-Saadi, J., Orlando, J., and Soja, A.: The Fire INventory from NCAR (FINN): A High Resolution Global Model to Estimate the Emissions from Open Burning, Geosci. Model Dev., 625–641, 2011.
Wilcox, E. M.: Direct and semi-direct radiative forcing of smoke aerosols over clouds, Atmos. Chem. Phys., 12, 139–149, https://doi.org/10.5194/acp-12-139-2012, 2012.
Williams, T. C., Shaddix, C. R., Jensen, K. A., and Suo-Anttila, J. M.: Measurement of the dimensionless extinction coefficient of soot within laminar diffusion flames, Int. J. Heat Mass Tran., 50, 1616–1630, https://doi.org/10.1016/j.ijheatmasstransfer.2006.08.024, 2007.
Winker, D. M., Vaughan, M. A., Omar, A., Hu, Y., Powell, K. A., Liu, Z., Hunt, W. H., and Young, S. A.: Overview of the CALIPSO Mission and CALIOP Data Processing Algorithms, J. Atmos. Ocean. Tech., 26, 2310–2323, https://doi.org/10.1175/2009JTECHA1281.1, 2009.
Wu, H., Taylor, J. W., Szpek, K., Langridge, J. M., Williams, P. I., Flynn, M., Allan, J. D., Abel, S. J., Pitt, J., Cotterell, M. I., Fox, C., Davies, N. W., Haywood, J., and Coe, H.: Vertical variability of the properties of highly aged biomass burning aerosol transported over the southeast Atlantic during CLARIFY-2017, Atmos. Chem. Phys., 20, 12697–12719, https://doi.org/10.5194/acp-20-12697-2020, 2020.
Zhang, J. and Zuidema, P.: Sunlight-absorbing aerosol amplifies the seasonal cycle in low-cloud fraction over the southeast Atlantic, Atmos. Chem. Phys., 21, 11179–11199, https://doi.org/10.5194/acp-21-11179-2021, 2021.
Zuidema, P., Chang, P., Medeiros, B., Kirtman, B. P., Mechoso, R., Schneider, E. K., Toniazzo, T., Richter, I., Small, R. J., Bellomo, K., Brandt, P., de Szoeke, S., Farrar, J. T., Jung, E., Kato, S., Li, M., Patricola, C., Wang, Z., Wood, R., and Xu, Z.: Challenges and Prospects for Reducing Coupled Climate Model SST Biases in the Eastern Tropical Atlantic and Pacific Oceans: The U.S. CLIVAR Eastern Tropical Oceans Synthesis Working Group, B. Am. Meteorol. Soc., 97, 2305–2328, https://doi.org/10.1175/BAMS-D-15-00274.1, 2016a.
Zuidema, P., Redemann, J., Haywood, J., Wood, R., Piketh, S., Hipondoka, M., and Formenti, P.: Smoke and Clouds above the Southeast Atlantic: Upcoming Field Campaigns Probe Absorbing Aerosol's Impact on Climate, B. Am. Meteorol. Soc., 97, 1131–1135, https://doi.org/10.1175/BAMS-D-15-00082.1, 2016b.
Zuidema, P., Alvarado, M., Chiu, C., De Szoeke, S., Fairall, C., Feingold, G., Freedman, A., Ghan, S., Haywood, J., and Kollias, P.: Layered Atlantic Smoke Interactions with Clouds (LASIC) Field Campaign Report, edited by: Stafford, R., DOE/SC-ARM-18-018, ARM Climate Research Facility, Report DOE/SC-ARM-18-018, US Department of Energy, Office of Science, available at: https://www.osti.gov/servlets/purl/1437446 (last access: 30 November 2021), 2018a.
Zuidema, P., Sedlacek, A. J., Flynn, C., Springston, S., Delgadillo, R., Zhang, J., Aiken, A. C., Koontz, A., and Muradyan, P.: The Ascension Island Boundary Layer in the Remote Southeast Atlantic is Often Smoky, Geophys. Res. Lett., 45, 4456–4465, https://doi.org/10.1002/2017GL076926, 2018b.
- Abstract
- Introduction
- Data and method
- Results and discussion
- Conclusions and perspectives
- Appendix A: Description of the statistical parameters
- Data availability
- Author contributions
- Competing interests
- Disclaimer
- Special issue statement
- Acknowledgements
- Financial support
- Review statement
- References