the Creative Commons Attribution 4.0 License.
the Creative Commons Attribution 4.0 License.
 | 02 Dec 2021
Wintertime subarctic new particle formation from Kola Peninsula sulfur emissions
Mikko Sipilä
Nina Sarnela
Kimmo Neitola
Totti Laitinen
Deniz Kemppainen
Lisa Beck
Ella-Maria Duplissy
Salla Kuittinen
Tuuli Lehmusjärvi
Janne Lampilahti
Veli-Matti Kerminen
Katrianne Lehtipalo
Pasi P. Aalto
Petri Keronen
Erkki Siivola
Pekka A. Rantala
Douglas R. Worsnop
Markku Kulmala
Tuija Jokinen
Tuukka Petäjä
The metallurgical industry in the Kola Peninsula, north-west Russia, form, after Norilsk, Siberia, the second largest source of air pollution in the Arctic and subarctic domain. Sulfur dioxide (SO2) emissions from the ore smelters are transported to wide areas, including Finnish Lapland. We performed investigations on concentrations of SO2, aerosol precursor vapours, aerosol and ion cluster size distributions together with chemical composition measurements of freshly formed clusters at the SMEAR I station in Finnish Lapland relatively close (∼ 300 km) to the Kola Peninsula industrial sites during the winter 2019–2020. We show that highly concentrated SO2 from smelter emissions is converted to sulfuric acid (H2SO4) in sufficient concentrations to drive new particle formation hundreds of kilometres downwind from the emission sources, even at very low solar radiation intensities. Observed new particle formation is primarily initiated by H2SO4–ammonia (negative-)ion-induced nucleation. Particle growth to cloud condensation nuclei (CCN) sizes was concluded to result from sulfuric acid condensation. However, air mass advection had a large role in modifying aerosol size distributions, and other growth mechanisms and condensation of other compounds cannot be fully excluded. Our results demonstrate the dominance of SO2 emissions in controlling wintertime aerosol and CCN concentrations in the subarctic region with a heavily polluting industry.
- Article
(9183 KB) - Full-text XML
-
Supplement
(9740 KB) - BibTeX
- EndNote


Sulfur dioxide (SO2) is one of the main air pollutants, influencing the acidification of soils and freshwaters, defoliation and reduced vitality of forests, atmospheric aerosol formation, and cloud properties and cause adverse health effects by air pollutants. Anthropogenic SO2 originates primarily from the combustion of fossil fuels at power plants, other manufacturing complexes and ships, as well as from the smelting of sulfur-containing mineral ores. Because of the severe environmental and health effects of SO2, efforts have been made in order to suppress its emissions to the atmosphere. While the global SO2 emissions have not shown any rapid decay, emissions in OECD (Organisation for Economic Co-operation and Development) countries for example have decreased significantly within the last 3 decades (Solarin and Tiwari, 2020).
The metallurgical industry with large-scale smelter complexes in the Kola Peninsula, north-west Russia, form the second largest source of air pollution in the Arctic and subarctic region. Smelters emit large quantities of SO2, metals and particulate matter to the atmosphere. These pollutants, especially SO2, have large impacts on both atmosphere and biosphere in the surrounding area, including the eastern parts of Finnish and Norwegian Lapland. In the close proximity of industrial plants, these pollutants have literally destroyed ecosystems, creating “industrial deserts” (Paatero et al., 2008). Though emissions have significantly decreased from about 600 kilotons yr−1 in the early 1990s (Tuovinen et al., 1993; Ekimov et al., 2001), partly because of the collapse of the Soviet Union and related socio-economical changes in Russia, they are still high. Today, the SO2 emissions from the Kola Peninsula are around 200 kilotons yr−1 (Barentz Observer, 2019), far higher than the SO2 emissions of the whole of Finland (37 kilotons yr−1 in 2017). Though vast, Kola emissions are still far behind the emissions of the world's number one SO2 polluter, Norilsk (Krasnoyarsk Krai, northern Siberia), with an enormous emission rate of 1.5 Mt yr−1 (Barentz Observer, 2019). Together with the few other smaller-scale industrial complexes, these smelters are almost the sole local source of air pollution in the very sparsely populated (sub-)Arctic Eurasia, and therefore understanding their role in atmospheric chemistry and physics is of great importance.
Most of the atmospheric sulfate is formed from SO2 in a liquid phase in cloud droplets, and these droplets either evaporate leading to sulfate aerosol production or precipitate as acid rain. However, with very high concentrations of SO2 downwind from the Kola Peninsula area, high production rates of gas-phase sulfuric acid (H2SO4) due to photochemical oxidation of SO2 is expected. The H2SO4 vapour can, in turn, contribute to atmospheric new particle formation (NPF) via nucleation and subsequent particle growth even up to sizes of cloud condensation nuclei (CCN) by further condensation of H2SO4 and potentially some other vapours (e.g. Weber et al., 1995; Kirkby et al., 2011; Jokinen et al., 2018). Atmospheric NPF is an important process because, according to model simulations, it accounts for more than a half of atmospheric CCN formation globally (Merikanto et al., 2009; Gordon et al., 2017). At high latitudes, the contribution of NPF has been estimated to be even larger, reaching > 90 % of the cloud level CCN in the high Arctic and approximately 70 %–80 % in our study area, the subarctic zone of northern Finland and north-western Russia (Gordon et al., 2017).
Vehkamäki et al. (2004) were the first to report observations of NPF (> 8 nm diameter particles) at the Värriö SMEAR I field station in eastern Lapland, Finland, relatively close to the Kola Peninsula smelter complexes. Their results on the contribution of SO2 pollution were not completely definitive, so that during the 4 years of measurements 15 out of the 147 observed NPF events were concluded to be explained by SO2 pollution plumes. Kyrö et al. (2014) recorded particle number size distributions down to 3 nm in diameter and showed that NPF is connected to high concentrations of SO2. They observed NPF even during winter in almost dark conditions, indicating that during episodes of very high concentrations of SO2, a sufficient fraction of it is converted to H2SO4 in the gas phase even in very low solar radiation levels to initiate NPF. However, to date, no reports on quantification of sulfuric acid concentrations by direct measurements, nor on detailed mechanisms and chemical compounds involved in NPF, in this area exist.
While observation of atmospheric NPF has been reported in hundreds of publications since the times of John Aitken (Aitken, 1900), the details, i.e. the dynamics and contributing compounds, of NPF have been experimentally resolved only in a limited number of atmospheric environments. Pioneering studies include the observations by Weber et al. (1995) on the connection between sulfuric acid and atmospheric nucleation, and the first report on ion-induced nucleation and simultaneous detection of sulfuric acid anion clusters using a mass spectrometer by Eisele et al. (2006). Parallel to the field work, several laboratory investigations by the same research groups probed the properties of sulfuric acid – water and sulfuric acid – ammonia – water clusters and their potential role in new particle formation (Ball et al., 1999; Hanson and Eisele, 2002).
Later advances in understanding the molecular steps of nucleation and growth in the atmosphere include the discovery that iodic acid (HIO3) is primarily responsible for nucleation and growth in coastal areas and in the vicinity of the Arctic sea ice (Sipilä et al., 2016; Baccarini et al., 2020). Jokinen et al. (2018) demonstrated that in coastal Antarctica, H2SO4 originating from the oxidation of dimethyl sulfide (DMS, emitted by pelagic phytoplankton) and ammonia (NH3, from penguin colonies) nucleate via a negative-ion-induced mechanism, with sulfuric acid condensation accounting for most of the subsequent particle growth. Further observations on nucleation mechanisms indicate the key role of highly oxidized organic molecules, HOMs (Ehn et al., 2014), in NPF during the spring–summer time in a boreal forest environment (e.g. Kulmala et al., 2013; Rose et al., 2018) and in the mid-latitude continental free troposphere (Bianchi et al., 2016) in parallel with sulfuric acid–ammonia nucleation (Bianchi et al., 2016; Schobesberger et al., 2015; Yan et al., 2018). Amines, especially dimethyl amine, were found to contribute to the initiation of nucleation in polluted urban air (Yao et al., 2018; Brean et al., 2021; Cai et al., 2021). In addition to these yet rare molecular-level atmospheric observations, several laboratory studies have investigated the details of these nucleation mechanisms (e.g. Kirkby et al., 2011, 2016; Almeida et al., 2013; Kürten et al., 2014). Recent laboratory studies that probed nucleation of nitric acid and ammonia suggest that this mechanism may contribute to new particle formation and growth, especially in the upper troposphere (Wang et al., 2020).
Mass spectrometers (Junninen et al., 2010; Jokinen et al., 2012) and air ion spectrometers (Mirme and Mirme, 2013) have largely facilitated the recent progress in the field of atmospheric NPF. By utilizing them in conjunction with aerosol and meteorological observations, this work aims to shed light on the molecular steps of NPF resulting from (sub-)Arctic air pollution during wintertime. Investigations were carried out at the SMEAR I research station in the Värriö strict nature reserve in Finnish Lapland close to the industrial plants (most of them located approximately 300 km east from the station) of Kola Peninsula, north-west Russia, during the winter 2019–2020.
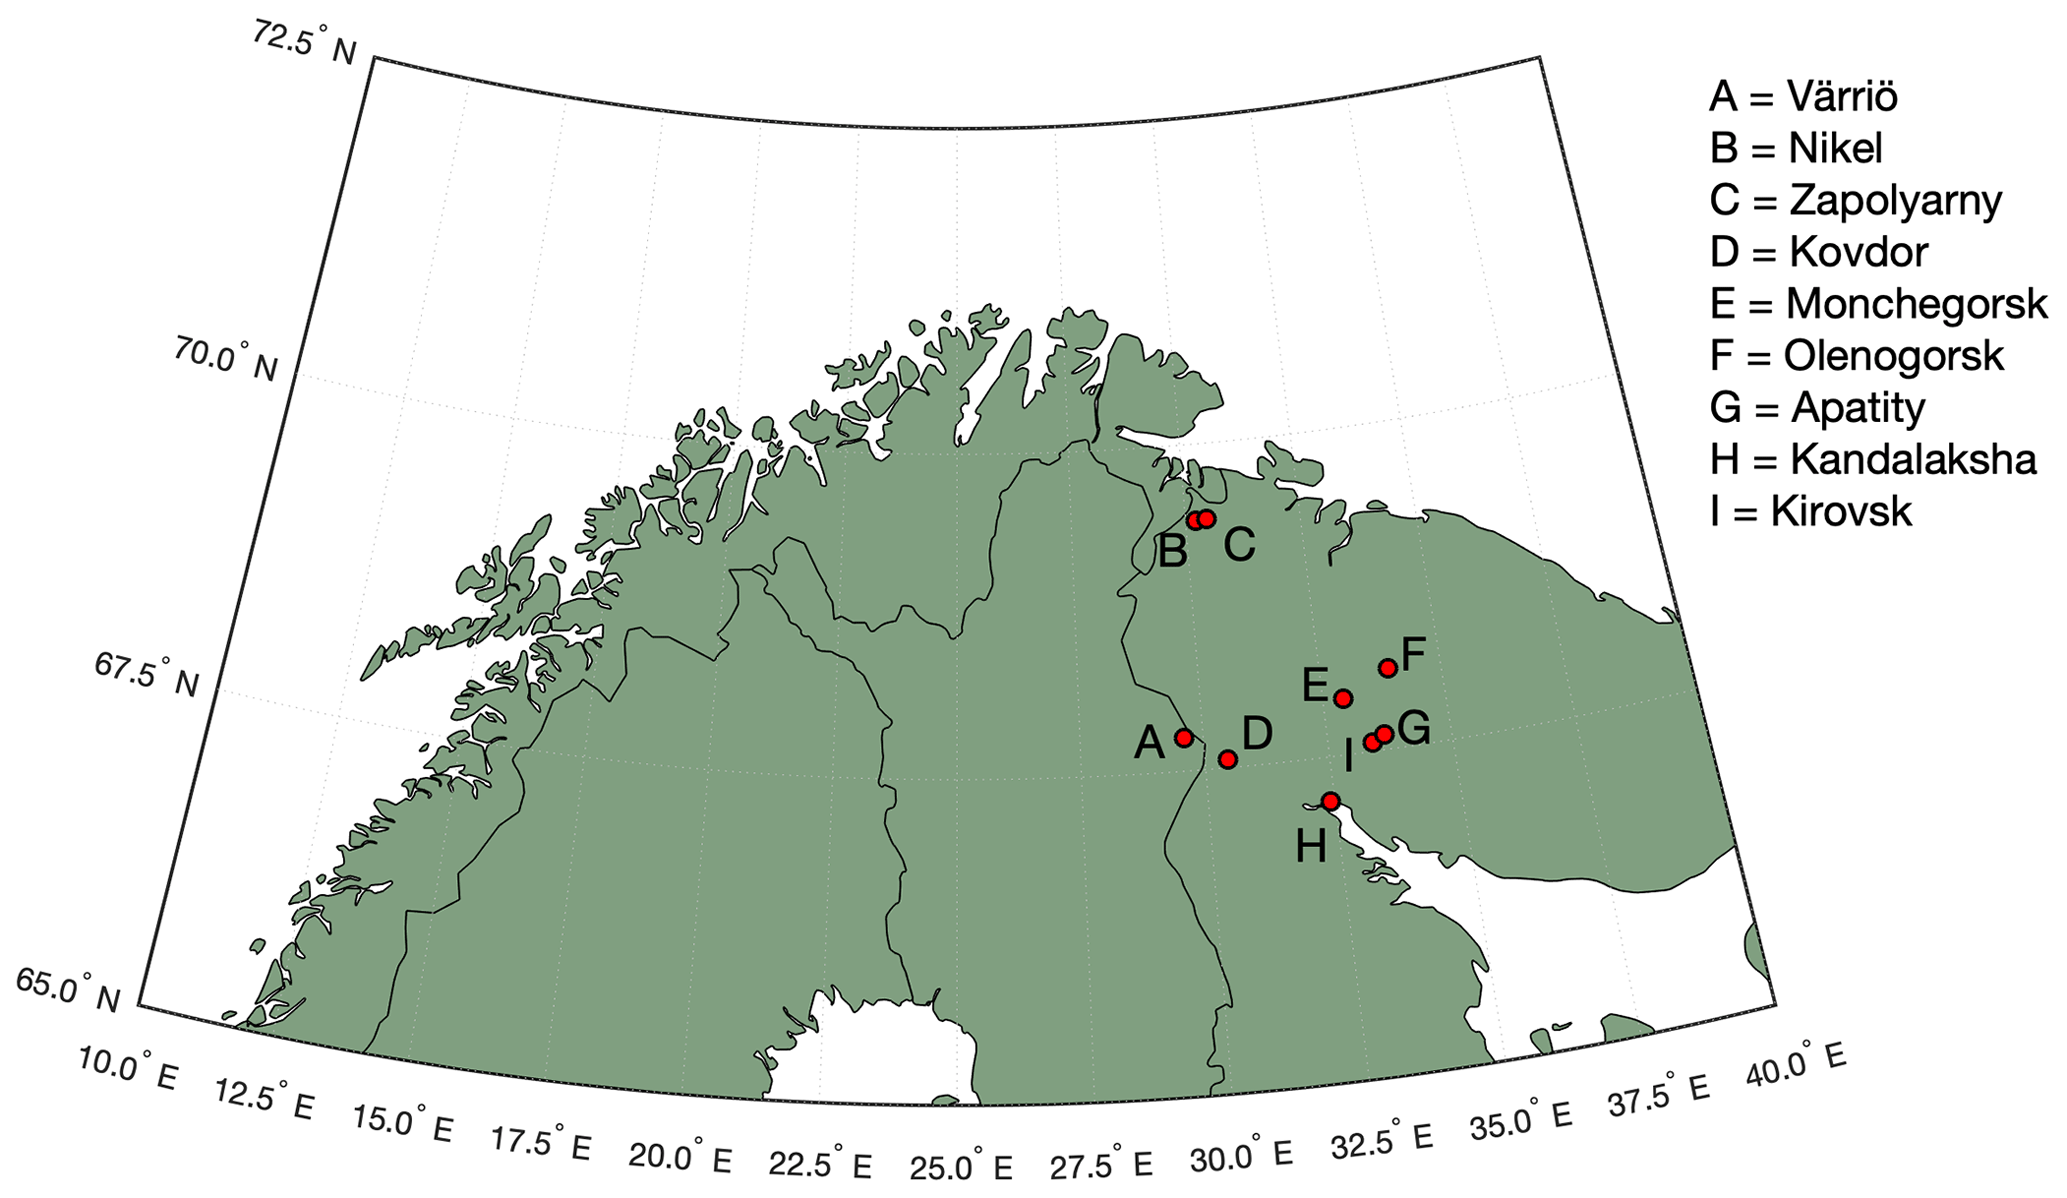
Figure 1Map of the study area. Our measurement site is located in Värriö. Industrial cities of Nikel, Zapoljarnij, Monchegorsk and Kandalaksha have large-scale metal smelters emitting vast quantities of SO2 into the atmosphere. Kovdor and Olenegorsk mines produce nickel and/or iron ore but have no smelter industry. Kirovsk and Apatity are phosphate mining and processing sites.
2.1 Site and time of the study
Measurements were carried out at the Värriö SMEAR I research station (Hari et al., 1994) located in the Värriö strict nature reserve, Finnish Lapland, in the vicinity (5 km) of the Russian border (Fig. 1) (67∘45′19′′ N, 29∘36′37′′ E). The station stands on top of a hill (390 m a.s.l.), being surrounded by untouched pine and spruce forests, bogs, fells, small lakes, and rivers. Several large smelter complexes are located ∼ 300 km away from the station on the Russian side of the border, while on the Finnish side no smelters or other large-scale energy intensive (polluting) industrial plants are located within a distance of several hundreds of kilometres. The closest, relatively small coal burning plant is located 550 km away. The SMEAR I station was set up in 1991 for monitoring air pollution, especially sulfur dioxide (SO2) originating from the Kola Peninsula smelters. In this work we present 4.5 months of data from wintertime, covering the period 1 November 2019–16 March 2020.
2.2 Instrumentation
The aerosol number size distribution between 3 and 750 nm of particle diameter was recorded by a twin differential mobility particle sizer (DMPS) (Aalto et al., 1999), comprising Hauke-type differential mobility analysers (lengths 110 and 280 mm) and TSI-3776 and TSI-3772 condensation particle counters (TSI Inc., Shoreview, MN, USA) as detectors. The DMPS measuring 3–10 nm particles malfunctioned during 9–10 and 14–27 January, resulting in the loss of data from this size range on those days.
The number size distribution of charged particles and molecular clusters between 0.8 and 40 nm was recorded by a Neutral Cluster and Air Ion Spectrometer (NAIS, Airel Ltd., Estonia; Mirme and Mirme, 2013).
Aerosol precursor vapour concentrations of H2SO4, methane sulfonic acid (MSA), HIO3 and HOM were measured by a nitrate-ion chemical-ionization atmospheric-pressure-interface time-of-flight mass spectrometer (CI-APi-TOF, Jokinen et al., 2012), equipped from 26 January onwards with a switcher inlet, with which the instrument can switch between chemical ionization (CI) operation mode and natural ion detection mode. This instrument was calibrated in the CI mode for sulfuric acid, as described by Kürten et al. (2012). The same calibration coefficient was used for the reported MSA and HIO3 concentrations. However, the instrument was not fully operational at all times during the measurement campaign, so a significant fraction of data (including all data collected before 25 December and a long period in January) was disregarded.
SO2 was recorded with a TEI 43 i-TLE pulsed fluorescence analyser, O3 by a TEI 49 i photometric analyser and NOx by a TEI 42C TL chemiluminescence analyser with photolytic NO2-to-NO converter, all manufactured by Thermo Fisher Scientific (Franklin, MA, USA). The wind speed and direction as well as the air temperature were measured with a Vaisala WTX sensor at 16 m a.g.l.
2.3 Nucleation rate calculation
Negative (−) and positive (+) ion-induced nucleation rates of 1.5 nm particles, , were calculated assuming a steady state between formation and loss of particles in the size range of 1.5 and 2.5 nm:
where is the total concentration of negative or positive ions in the size range between 1.5 and 2.5 nm, krec is the recombination coefficient between negative and positive small ions which was here approximated by a size-independent constant of cm3 s−1 (Tammet, 1995), and is the concentration of positive or negative sub-1.5 nm cluster ions. GR2 is the 2 nm particle growth rate, Δdp is the width of the size interval for which the concentration is defined (Δdp=2.5–1.5=1 nm), and CoagS is the coagulation sink of 2 nm particles to the pre-existing background aerosol population. CoagS was calculated from the following equation:
where Ni is the concentration of particles in the channel i of DMPS and K2 nm,i is the coagulation coefficients between a 2 nm particle and a particle in the size bin i calculated based on Seinfeld and Pandis (1998).
An accurate determination of the particle growth rate for 2 nm particles from the size distribution is challenging, and therefore GR2 was approximated by assuming irreversible sulfuric acid condensation as the sole mechanism of growth similar to Jokinen et al. (2018) and Beck et al. (2021), and it was calculated according to the formula given by Stolzenburg et al. (2020):
Here the pre-factor 1.45 accounts for dipole–charge interaction in charged particle growth (Stolzenburg et al., 2020). The justification for this approach will be discussed later. A more standard method for the GR determination is to approximate the GR2 by the average growth rate of the formed particle population, including mainly particles grown far above the 2 nm size, during a few hours starting from the beginning of the event as demonstrated in Fig. 2a. This method leads to the average GR of 4.5 nm h−1. However, this approach neglects the effect of air mass advection which, as will be discussed later, may largely determine the time development of the size distribution and thus also the apparent growth.

Figure 2Particle formation event recorded by the NAIS (negative ions) on 29 January 2020, depicted on a linear diameter scale. The average growth rate determination by a linear fitting to the growing nucleation mode yields an average growth rate of 5 nm h−1 (a) while the 50 % appearance time method (Lehtipalo et al., 2014) applied in cluster mode growth yields growth rates from about 0.35 to 1.8 nm h−1 (b). Both methods likely overestimate true growth rate as the particle size distribution is affected by air mass advection. Therefore, the growth rate applied in nucleation rate calculations is derived from sulfuric acid concentration (Stolzenburg et al., 2020).
Rather than the average GR of the whole particle population, the 50 % appearance time method (Lehtipalo et al., 2014) could be used to estimate the growth rate of nucleating clusters in the size range of 1.3–2.7 nm (Fig. 2b). Here, the cluster appearance time in each size channel represents the time when cluster concentration reaches 50 % of its maximum concentration during the event. The growth rate can be assessed from the cluster diameter vs. appearance time curve (black line), resulting in ∼ 0.35 nm h−1 during 10:10–11:30 UTC+2 and ∼ 1.8 nm h−1 during 11:30–11:50 UTC+2, and in the average growth rate of ∼ 0.9 nm h−1 during the period 10:10–11:50 UTC+2. A drawback of this analysis is that the GR cannot be obtained for the period where the concentration has passed the 50 % threshold or the period of decaying concentration. Furthermore, the temporal variability of GR cannot be properly obtained due to fluctuations in the data. Nevertheless, the above-mentioned values of 0.35–1.8 nm h−1 can be compared to those obtained from Eq. (3), which yields the maximum GR of 0.51 nm h−1 around noon on the example day (29 January 2020). A comparison to the value of 1.8 nm h−1 obtained from the 50%-appearance time method slightly before noon leads to a factor of ∼ 3.5 difference in GR2 on that day, which, in turn, is reflected in a 22 % difference in the calculated nucleation rate (Eq. 1). The effect of the different approaches to determine GF is visualized in Fig. S1. To conclude, ion-induced nucleation rate calculation is not very sensitive to GR2 because the ion–ion recombination term (Eq. 1) dominates the loss in our conditions.
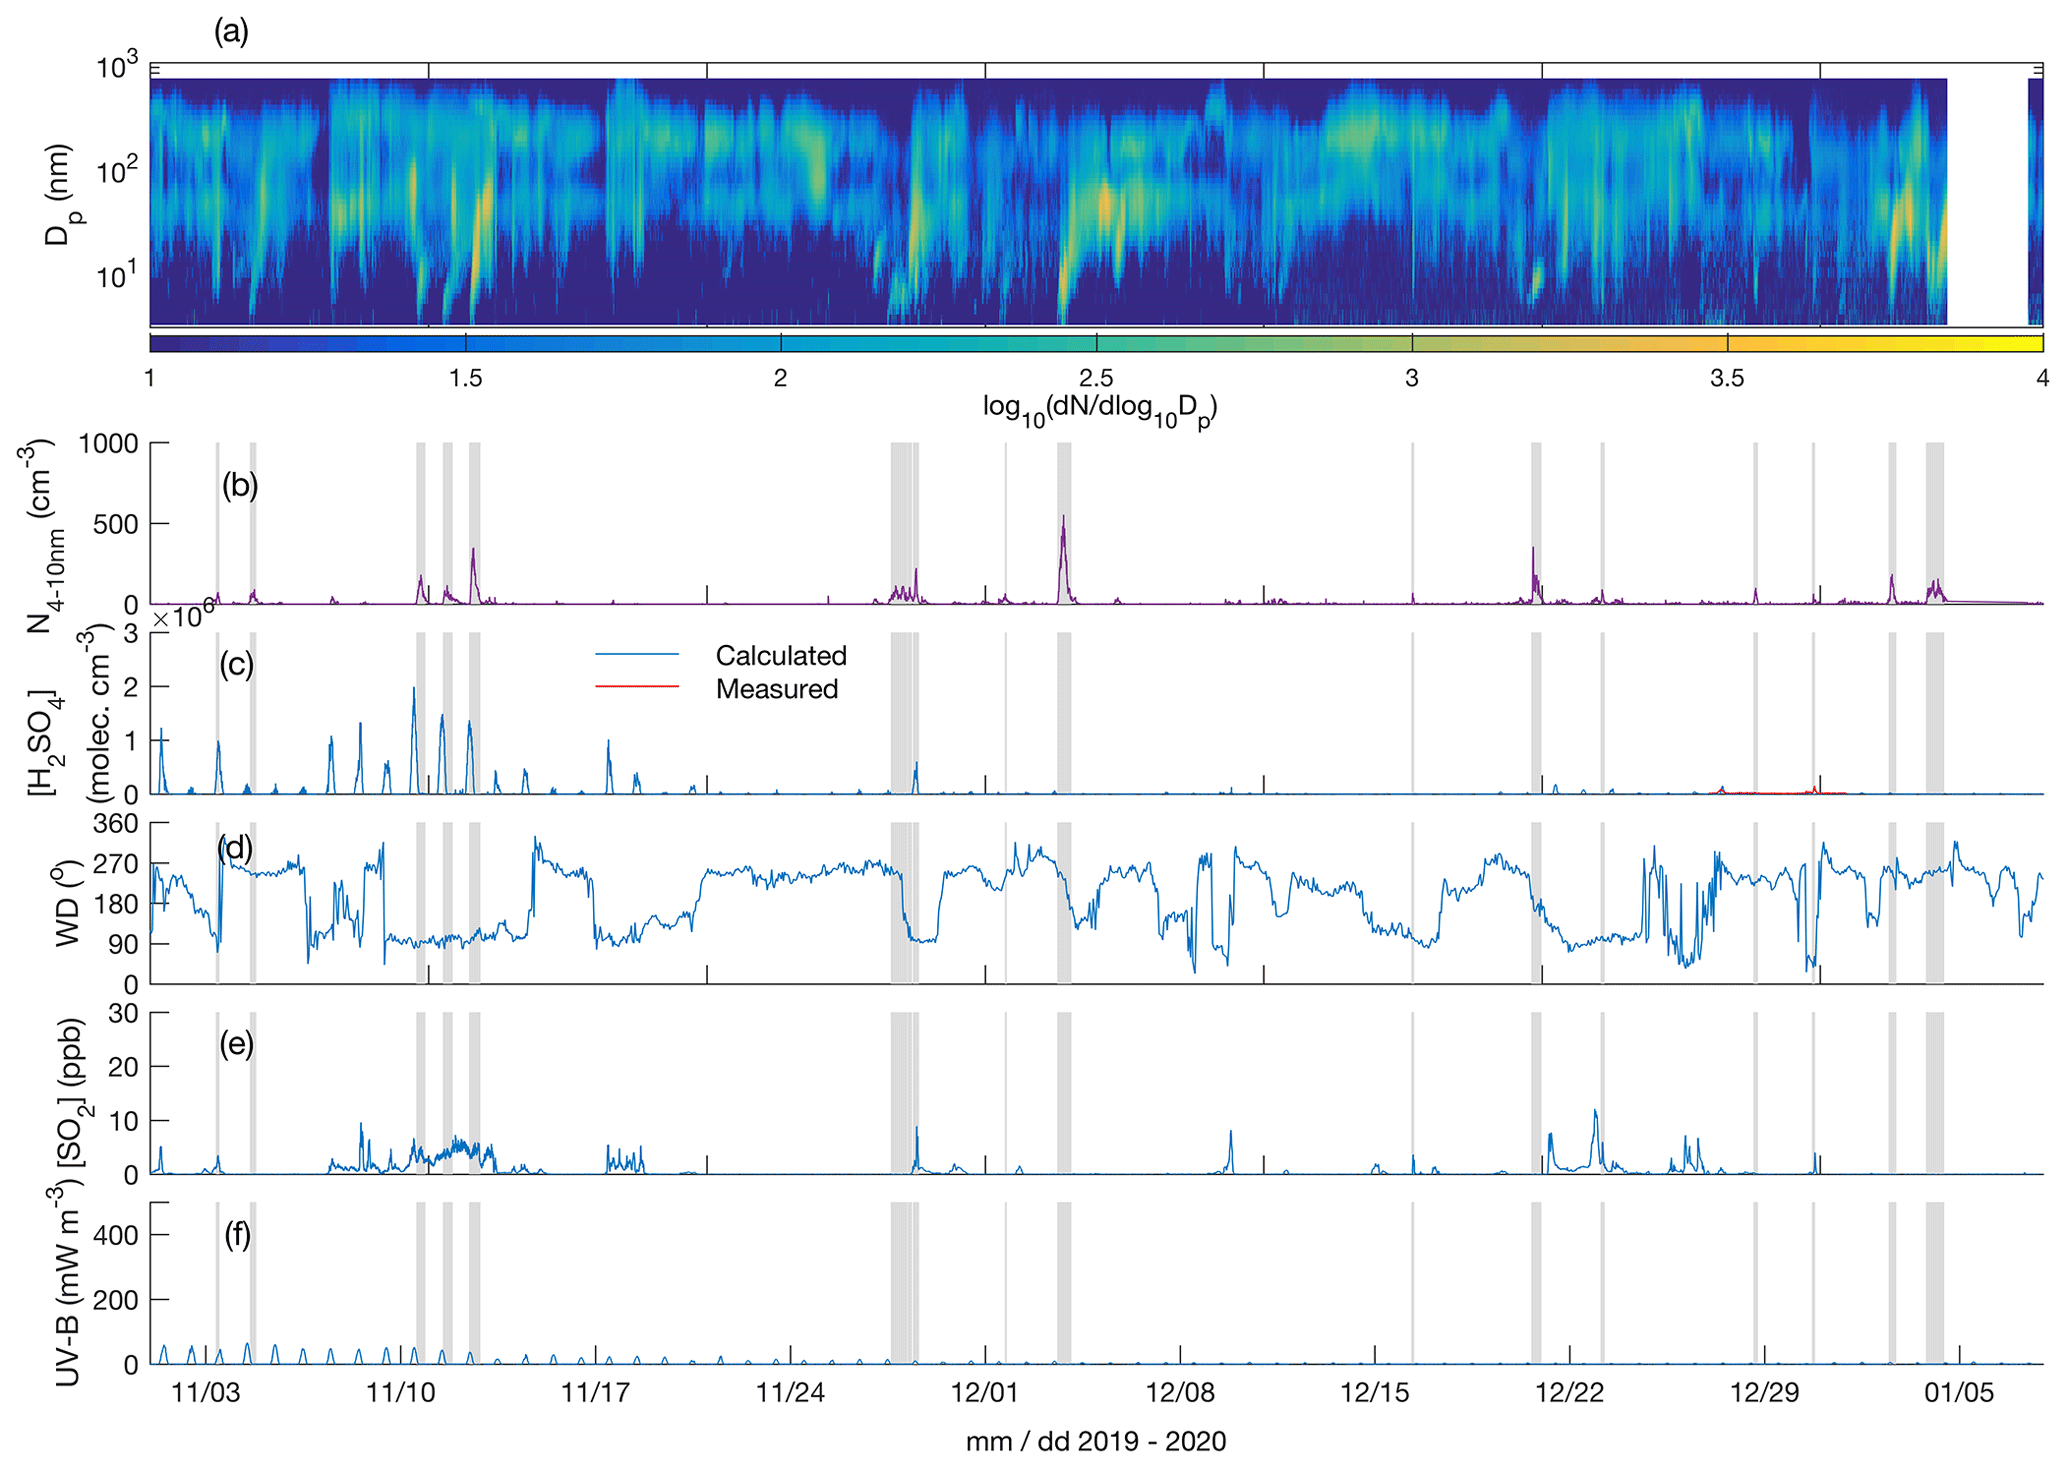
Figure 3Particle number size distribution in the diameter range 4–700 nm (a), number concentration of 4–10 nm particles (b), measured (only between 27 and 31 December 2019) and calculated (Dada et al., 2020) sulfuric acid concentration (c), wind direction (d), SO2 concentration (e), and UV-B radiation (f) over the time period 1 November 2019–7 January 2020. The grey shaded areas depict the times with observed < 10 nm new particle formation. The polar night (sun constantly below horizon) period is from 9 December 2019 to 4 January 2020.
2.4 Sulfuric acid proxy calculation
Because of significant gaps in the measured data, [H2SO4] was also calculated using a proxy developed by Dada et al. (2020). This proxy takes into account the oxidation of SO2 to H2SO4 by both OH (estimated from the global radiation intensity) and stabilized Criegee intermediates (estimated from monoterpene and ozone concentrations; Sipilä et al., 2014), as well as losses of H2SO4 by dimerization (negligible in observed concentrations) and condensation onto pre-existing aerosol particles (the primary loss term). Unfortunately, there are no VOC measurements available at SMEAR I, but, because the data were collected during winter well outside of the growth period, we assumed the monoterpene concentration to be zero. Global radiation measurements showed unexplained fluctuations (maybe caused by low solar zenith angles or freezing of the sensor) during the measurement period, and therefore we used UVB radiation and the relation between UVB and global radiation determined by Dada et al. (2020). During the times when the CI-APi-TOF mass spectrometer was operational, the agreement between the measured and calculated concentrations was good (Fig. S2), with mean concentrations agreeing within 8 %. The obtained correlation coefficient was R=0.790 and coefficient of determination R2=0.624.
2.5 Trajectory analyses
Trajectories were calculated by using the Hybrid Single-Particle Lagrangian Integrated Trajectory model HYSPLIT (Stein et al., 2015) with GFS 0.25∘ meteorology as an input. We calculated 24 h backward trajectories arriving at 50 and 250 m a.g.l. for the period 28 January 2020 at 00:00 UTC+2 to 30 January 2020 at 00:00 UTC+2, arriving every 6 h. The trajectory calculations included mixing layer depth along the trajectory.
3.1 New particle formation during the measurement period
Figures 3a and 4a depict the aerosol number size distribution between 3 and 700 nm, as recorded by the DMPS. Several new particle formation events were observed during the measurement period. Clear NPF events with the concentration of 4–10 nm particles, N4−10 nm (Figs. 3b and 4b), exceeding 50 cm−3 are marked with grey shadings. Since the DMPS data on sub-10 nm particles were missing from 9–10 band 14–27 January, N4−10 nm could not be derived for those time periods. Still, at least on 18 and 19 January we can see that NPF eventually produced particles larger than 10 nm in diameter. The observed NPF events coincided mostly (ca. 50 % of the cases) with clearly easterly (∼ 90∘) winds (Figs. 3c and 4c), and with elevated H2SO4 concentrations (Figs. 3d and 4d) calculated based on Dada et al. (2020). H2SO4 concentrations depend, besides condensation sink and UVB radiation, on the SO2 concentration that is connected to both wind direction and air mass origin. Clear examples of such SO2 pollution-driven NPF events are, for example, those occurring during three consecutive days on 10–12 November 2019, on 28 and 29 January 2020, and on 13 March 2020. The data from the period 28–29 January are discussed in detail below, whereas the data from the other two exemplary periods are presented in the Supplement (Figs. S3–S11).
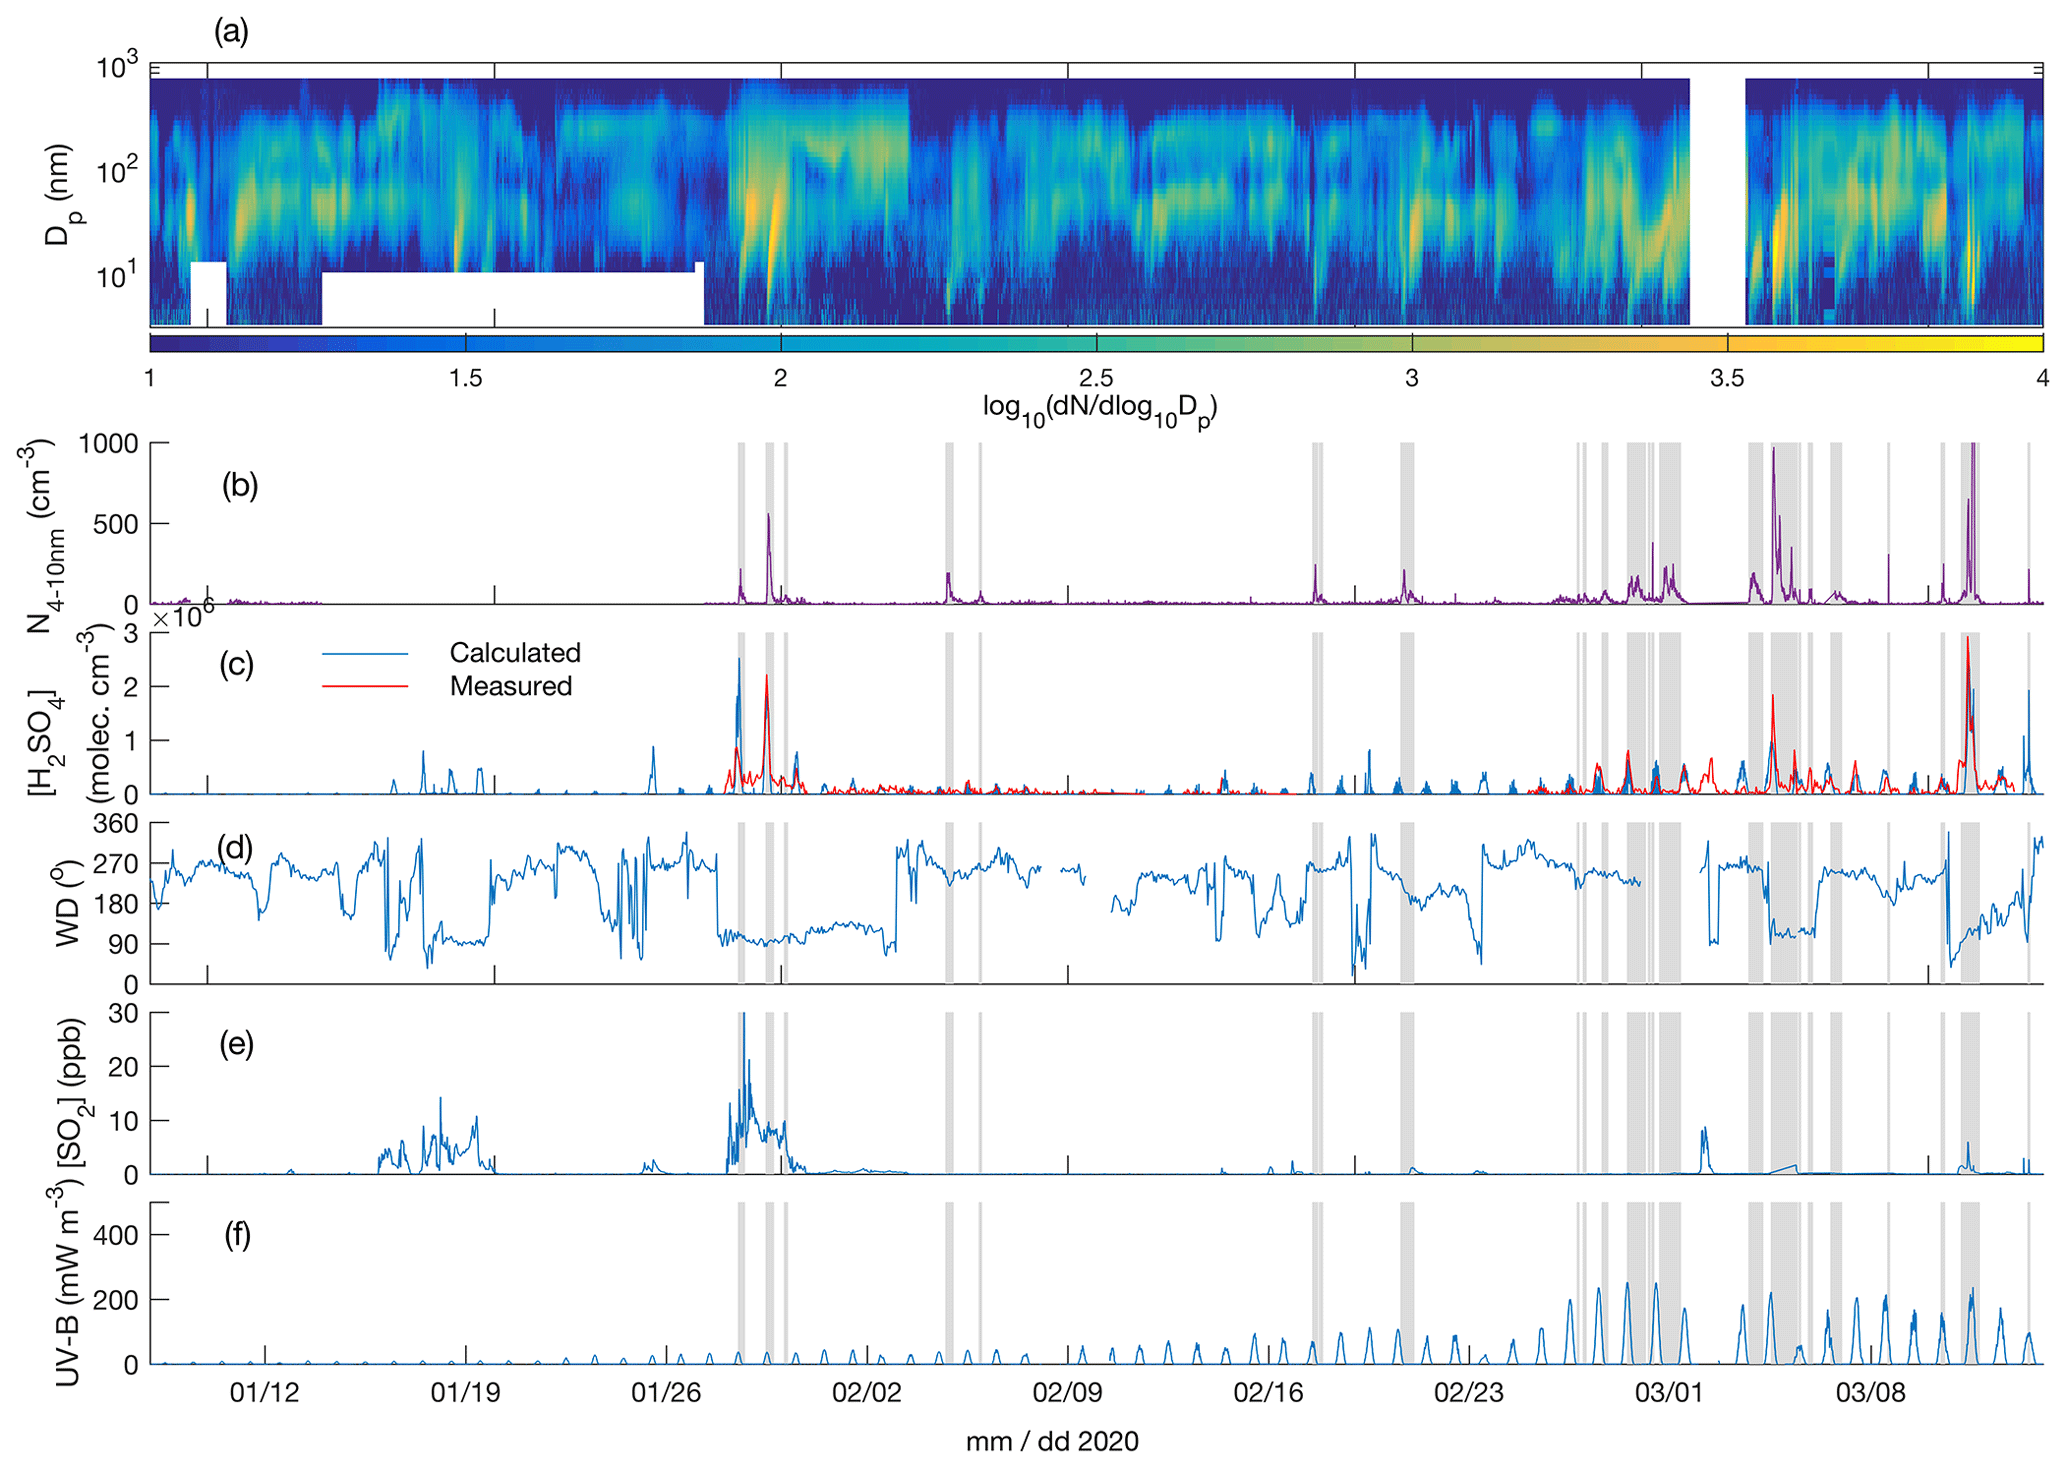
Figure 4Particle number size distribution in the diameter range 4–700 nm (a), number concentration of 4-10 nm particles (b), measured and calculated (Dada et al., 2020) sulfuric acid concentration (c), wind direction (d), SO2 concentration (e), and UV-B radiation (f) over the time period 8 January–15 March 2020. The grey shaded areas depict the times with observed < 10 nm new particle formation.
Not all the NPF events occurred during the easterly winds. The events observed close to the mid-winter, from early December until early January, occurred with westerly winds or during the transition of the wind direction from west to east, in relatively low concentrations of SO2 and in the virtual absence of daylight and H2SO4. These low-H2SO4 mid-winter events were observed to start from sizes larger than a few nanometres, which means that nucleation did not take place in situ in the surroundings of the SMEAR I station. Those particles had thus formed elsewhere and were transported to the measurement site by either horizontal advection or vertical downdrafts from above the mixed layer. Compared with particles of a few nanometres in diameter, gas-phase H2SO4 is lost much more rapidly onto pre-existing particles after its production ceases, so the lack of H2SO4 is not excluding its primary role in NPF, even though it is not supporting such a role either. Some of the mid-winter NPF events coincided with elevated SO2 concentrations, suggesting that sulfuric acid may have been formed in the measured air mass earlier. Some other mid-winter NPF events, especially the relatively strong NPF event on 3 December presented in the Supplement (Figs. S9–S11), occurred in a virtual absence of SO2, suggesting that sulfuric acid had not been formed to a significant extent in that air mass. Currently, we thus cannot explain the mechanism of NPF on that day. However, the NO2 concentration was slightly (Fig. S9) elevated in the measured air mass, which might have been connected with the elevated source of particles. Nevertheless, most of the NPF events seemed to be connected with the presence of H2SO4.
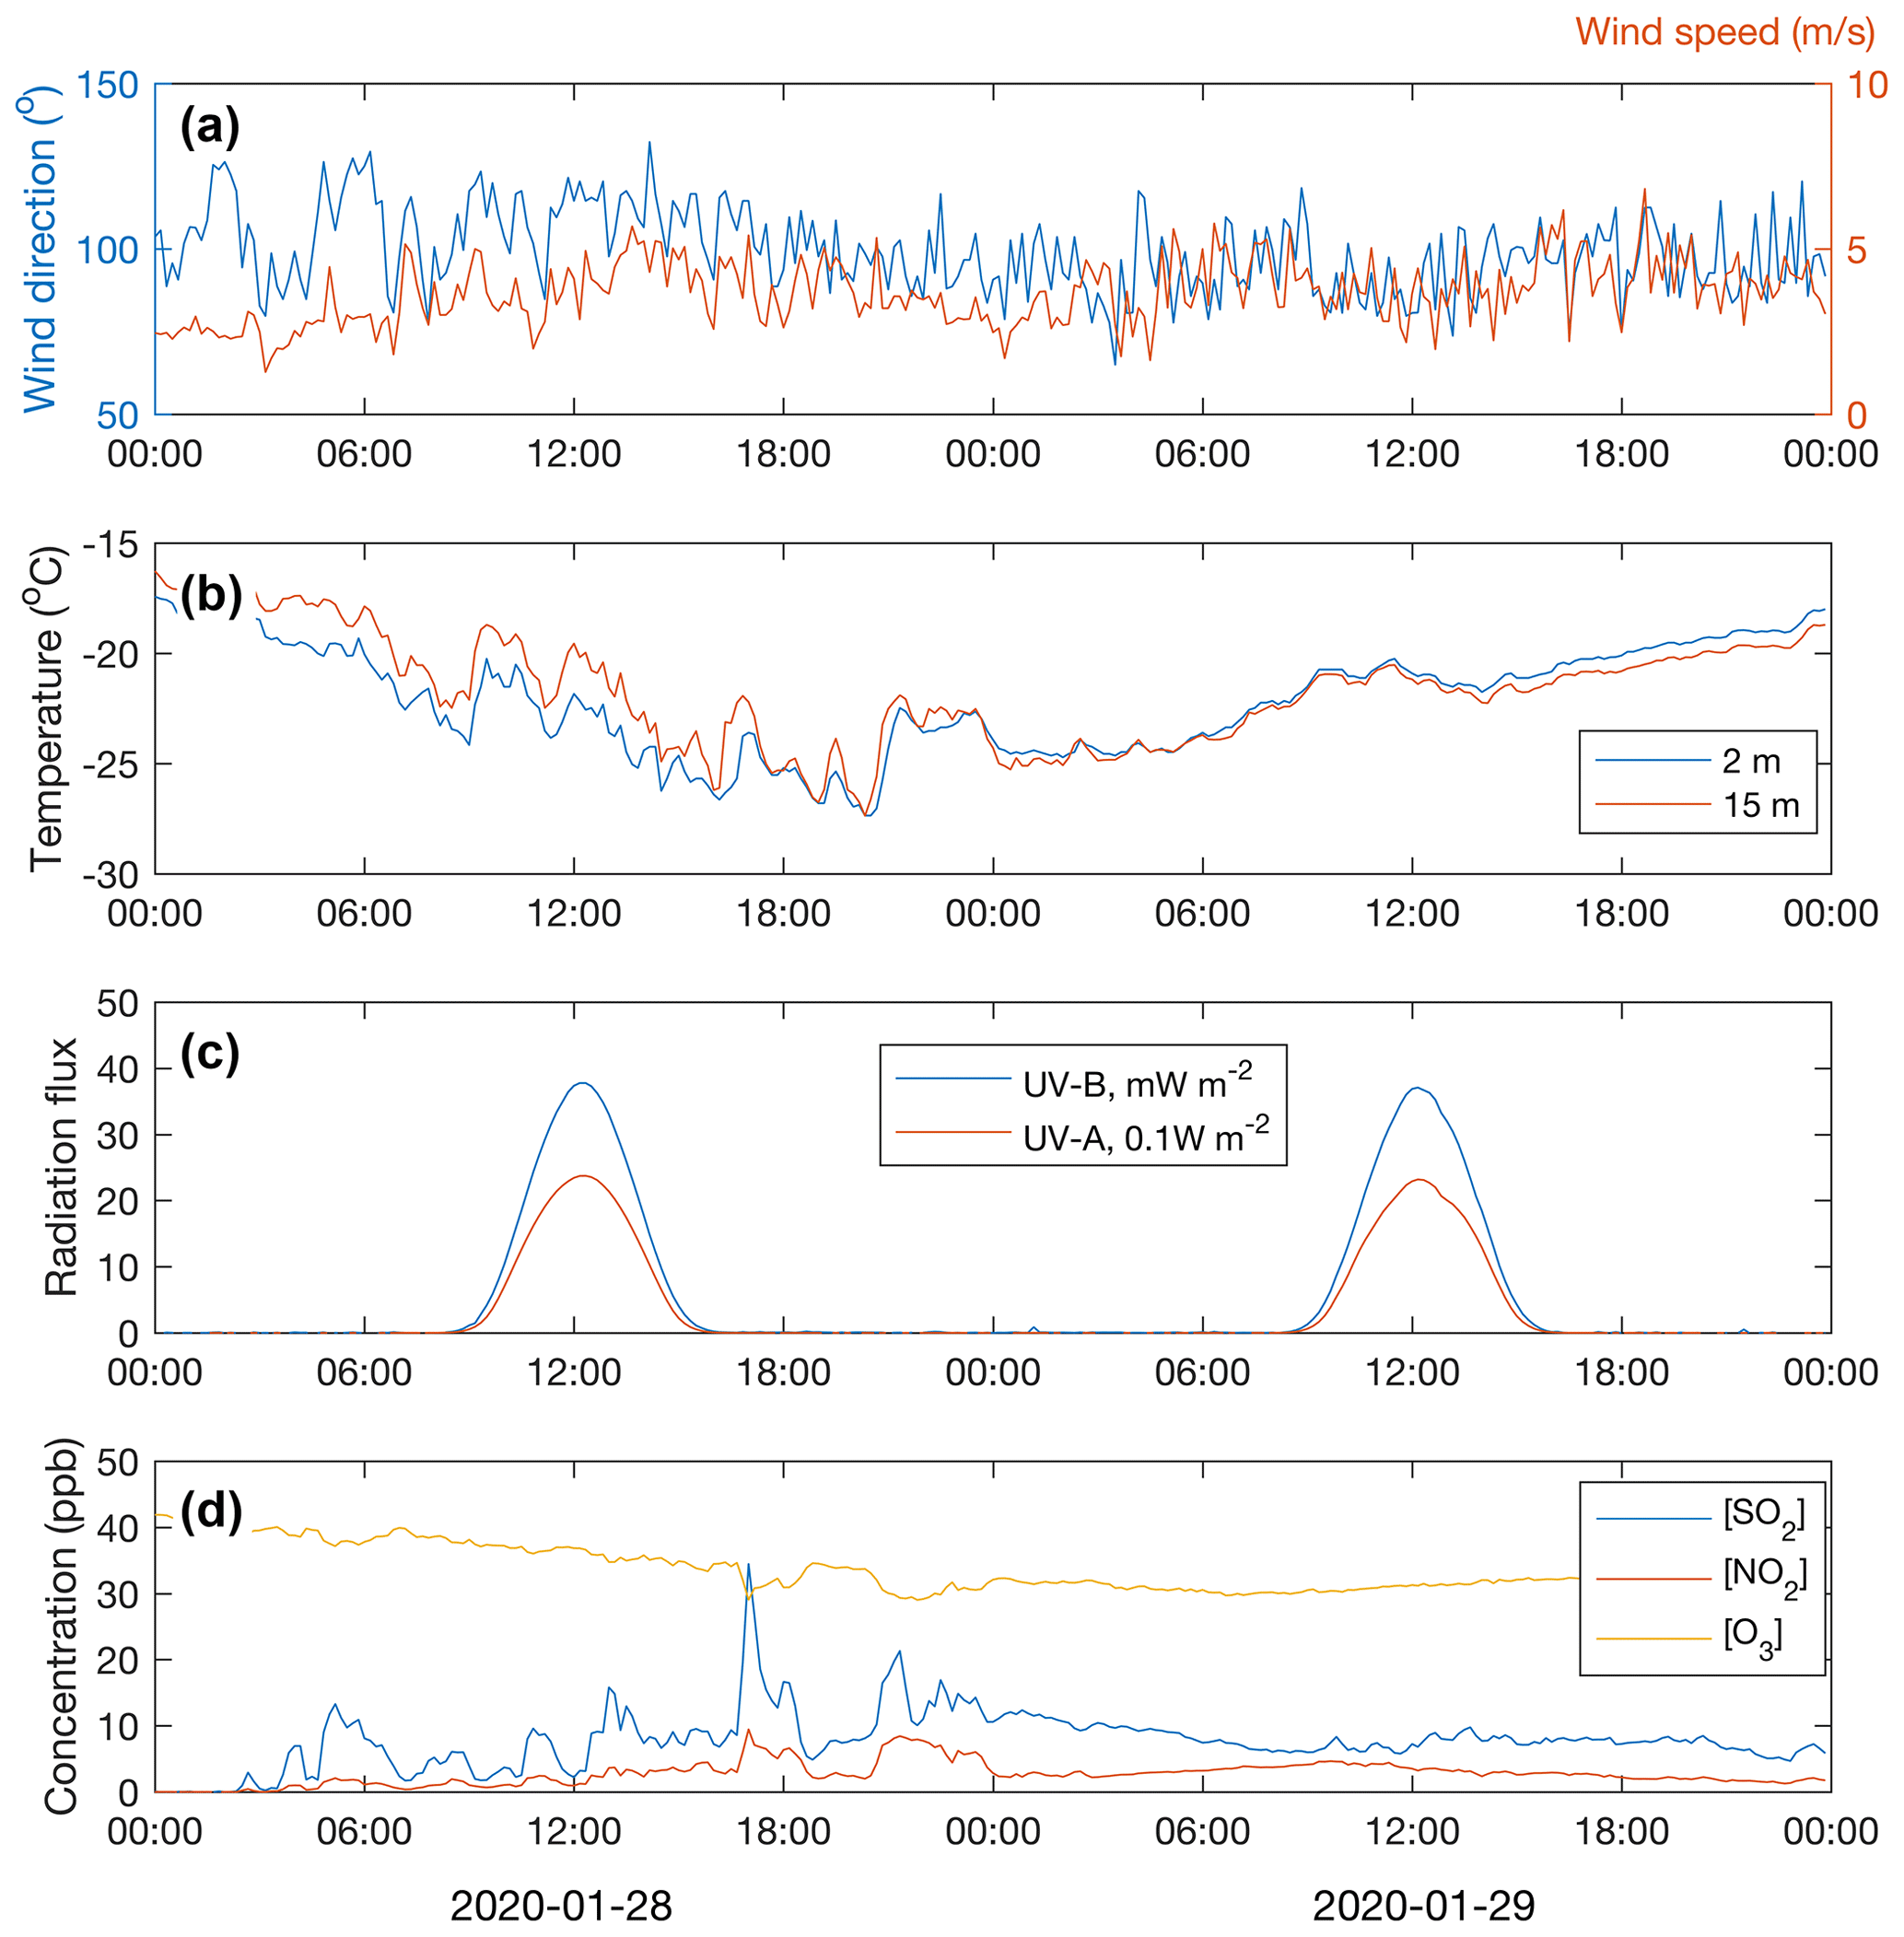
Figure 5Wind speed and direction at the 16 m height (a); air temperature at two heights (b); UV-B and UVA radiation (c); and concentrations of SO2, NO2 and O3 (d) during the period 28–29 January 2020.
3.2 Case study 28–29 January 2020
To resolve the details of new particle formation and growth, we focus on 3 time periods with clear signs of nucleation and particle growth. Here we show results from analysis of a 2 d period of 28–29 January 2020. To demonstrate that this 2 d period is not only a unique observation, we represent data from the time period 10–12 November 2019 (Figs. S3–S5) and from 13 March 2020 (Figs. S6–S8) in the Supplement. The data from the event on 3 December 2019, which differs from the overall picture, are also depicted in the Supplement (Figs. S9–S11).
3.2.1 Meteorological situation and trace gas concentrations
Throughout the period of 28–29 January, the wind was blowing from the east (∼ 50–150∘) (Fig. 5a). The ambient temperature ranged from −16 to −28∘C (Fig. 5b). The sky was clear but, because of the low solar zenith angle (maximum 4.4∘ at noon of 29 January), the UVB radiation intensity needed for a photochemical H2SO4 formation reached only 35 mW m−2 (summertime UVB radiation intensity maxima at Värriö are > 2000 mW m−2). The HYSPLIT back trajectory calculations showed that the air masses arriving between 28 January at 06:00 UTC+2 and 30 January at 00:00 UTC+2 passed the industrial areas of the Montchegorsk region (Fig. 6).
At around 03:00 UTC+2 on 28 January, coinciding with the change in the air mass origin to the Montchegorsk–Kandalaksha region (Fig. 6) a few hours after the change in the wind direction from west to east in the evening of 27 January, air pollutant levels started to increase steeply (Fig. 5d). During the course of the day, both SO2 and NO2 concentrations increased by ca. 2 orders of magnitude, with [SO2] peaking at 27 ppb and [NO2] peaking at 7 ppb. The ozone (O3) concentration declined from about 40 to a 30 ppb range. To put the high level of SO2 concentrations into some perspective, the highest concentration recorded in the Helsinki Metropolitan area was 8.4 ppb (24 µg m−3, 1 h average) in 2019 and the yearly-average concentration was about 0.2 ppb (∼ 0.5 µg m−3) (Helsinki Region Environmental Services Authority, 2020). The yearly-average SO2 concentration at the SMEAR I station in 2019 was 1.1 ppb.
3.2.2 Aerosol precursors
Despite the low UVB radiation, required for O3 photolysis that initiates the H2SO4 production via OH radical formation, the H2SO4 concentration increased from close to the lowest detection limit values of ∼ 105 molec. cm−3 up to 8×10⁵ molec. cm−3 during 29 January and up to 1.5×10⁶ molec. cm−3 on 29 January (Fig. 7e). Because the OH production rate must have been low, a high SO2 concentration is a prerequisite for the H2SO4 production during cold and dark winter months. While stabilized Criegee intermediates (sCIs) formed in alkene ozonolysis can oxidize SO2 to produce H2SO4 during summertime (Mauldin et al., 2012; Sipilä et al., 2014), alkene (terpene) emissions from the vegetation and thus the sCI production rate are negligible during the winter season. The proxy calculations agree well with the measured sulfuric acid concentration on 29 January but show clearly higher values on 28 January. The cause of the disagreement on 28 January is probably the stable and shallow boundary layer. The temperature gradient close to the surface was almost +0.2 ∘C m−1 at noon on 28 January (Fig. 5b). Solar radiation from close to the horizon does not penetrate efficiently inside the canopy, so the UVB measured above the canopy and used in the proxy calculation does not reflect the situation at the ground level. Sulfuric acid produced above the canopy, on the other hand, does not mix downwards due to the strong temperature inversion and calm winds. On 29 January, the temperature gradient was absent or slightly negative, allowing the surface air to mix with the air above the canopy.
Besides H2SO4, minute signals of iodic acid (HIO3) were also observed during the day (Fig. 7e). The exact production mechanism of HIO3 remains globally unknown despite the emerging evidence on its critical role in new particle formation especially in the Arctic regions (Sipilä et al., 2016; Baccarini et al., 2020). Methane sulfonic acid (MSA), which has been observed in larger aerosol particles (Beck et al., 2021) and could potentially also contribute to NPF, hardly exceeds the detection threshold. This was expected since MSA originates from dimethyl sulfide (DMS) photo-oxidation. DMS ends up in the air mainly from the metabolism of pelagic phytoplankton during summer months, not during the dark winter. No other condensable vapours, such as HOM which dominates the new particle growth in the summertime boreal forest environment (Ehn et al., 2014), were observed during this case study period or during other periods depicted in the Supplement.
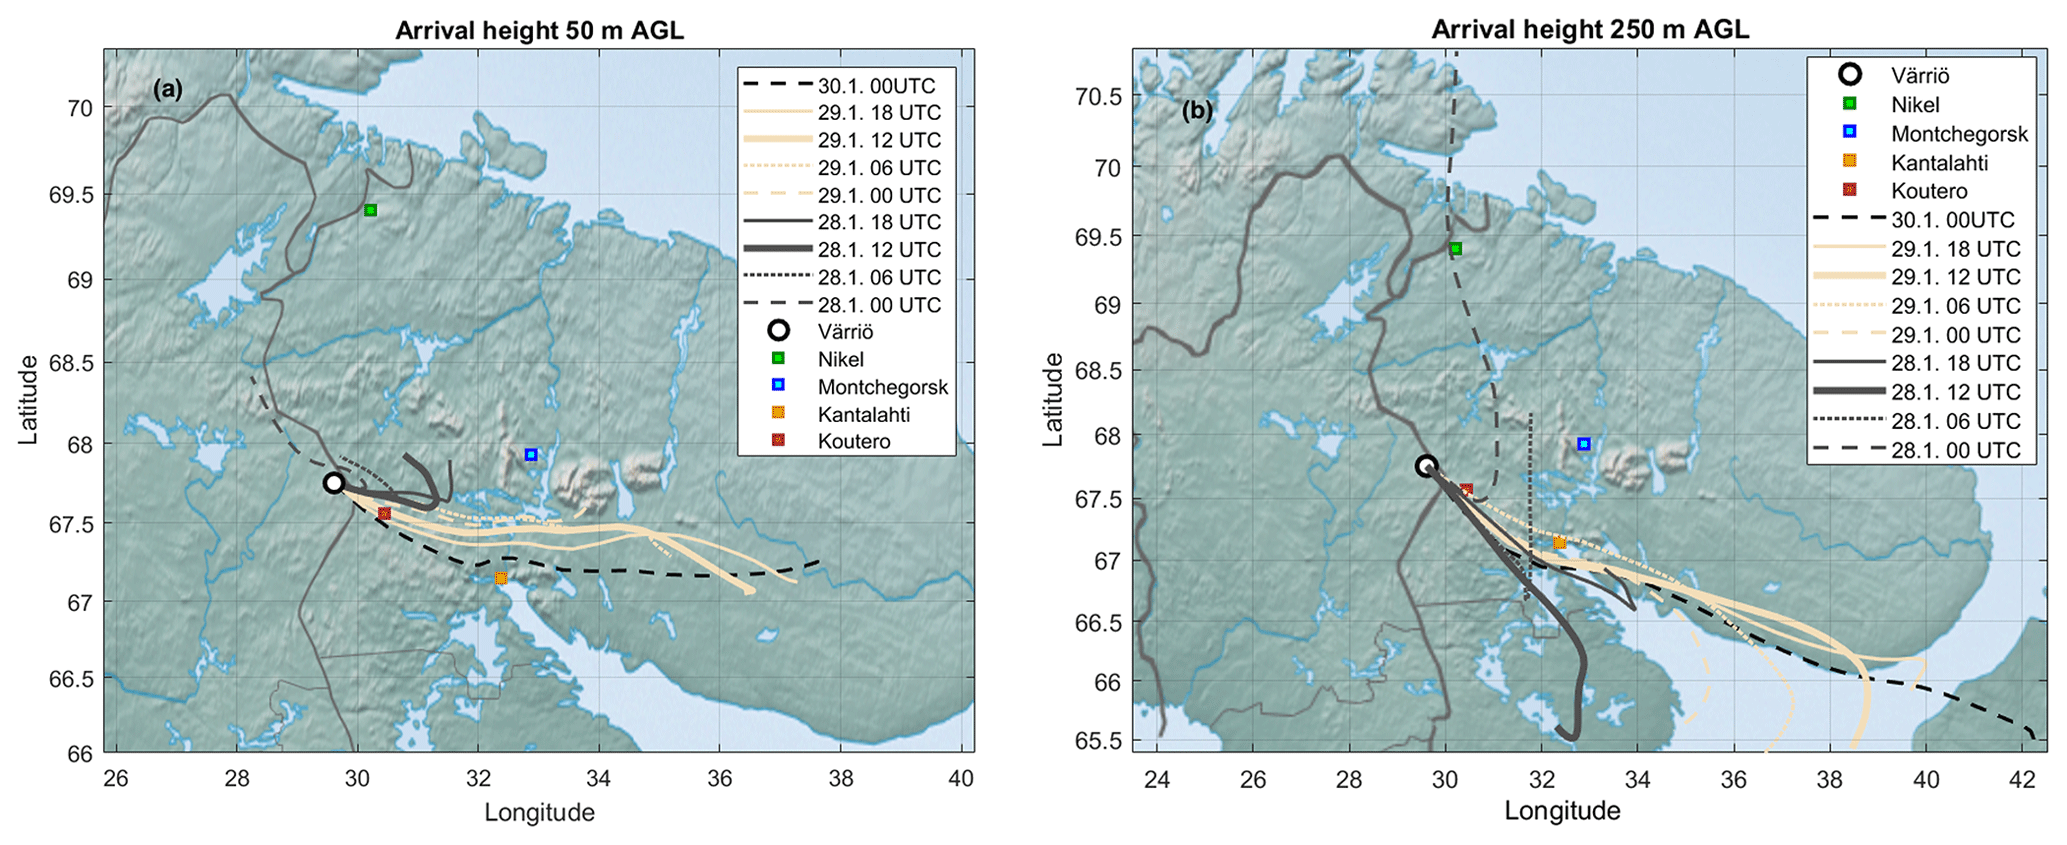
Figure 6The 24 h back trajectories with an arrival height of 50 m (a) and 250 m (b) above ground level (AGL), and with arrival times between 28 January at 00:00 UTC+2 and 30 January at 00:00 UTC+2.
3.2.3 New particle formation
Ion size distribution
Figure 7a and b show the NPF events on 28 and 29 January, as observed by the NAIS operated in the ion mode. Omnipresent small (<1.5 nm) ions are continuously produced by the galactic cosmic radiation, terrestrial gamma radiation and gas phase radon decay. At approximately 11:00 UTC+2 on 28 January, coinciding with the increase in the H2SO4 concentration, small negative cluster ions started to grow, which is seen as small increases in the ∼ 1.5–2 nm negative ion concentration. During their growth beyond ∼ 2 nm in diameter, those clusters were neutralized by collisions with positively charged ions, so that they disappeared from the spectrum. They still obviously continued to grow in size, as charged particles reappeared in the spectrum after reaching some 5 nm in diameter when diffusion charging becomes effective enough; an equilibrium charging state for 2 nm particles is 0.8 %, while 5 nm particles are charged with an efficiency of 2.3 %, and out of 20 nm particles 11 % are negatively charged (Wiedensohler et al., 2012). Opposite to the negative ions, positive cluster ions did not grow in size. Larger (> 5 nm) positive particles (charged by diffusion charging during the course of their growth) grew similarly to the negative ones. On 29 January, with clearly higher H2SO4 concentrations, the appearance of > 1.5 nm negative clusters was more pronounced, suggesting higher nucleation rates and the critical role of H2SO4 in the initial steps of NPF. Positive cluster ions were again only bystanders and did not contribute to nucleation. This observation suggests that negative-ion-induced nucleation is the primary pathway to NPF similar to H2SO4–NH3 (–H2O) ion-induced nucleation observed by Jokinen et al. (2018) in Antarctica and Kirkby et al. (2011) in CERN CLOUD chamber experiments. However, due to the lack of information on neutral ∼ 1.5–3 nm cluster concentrations, this observation alone does not exclude parallel neutral nucleation mechanisms.
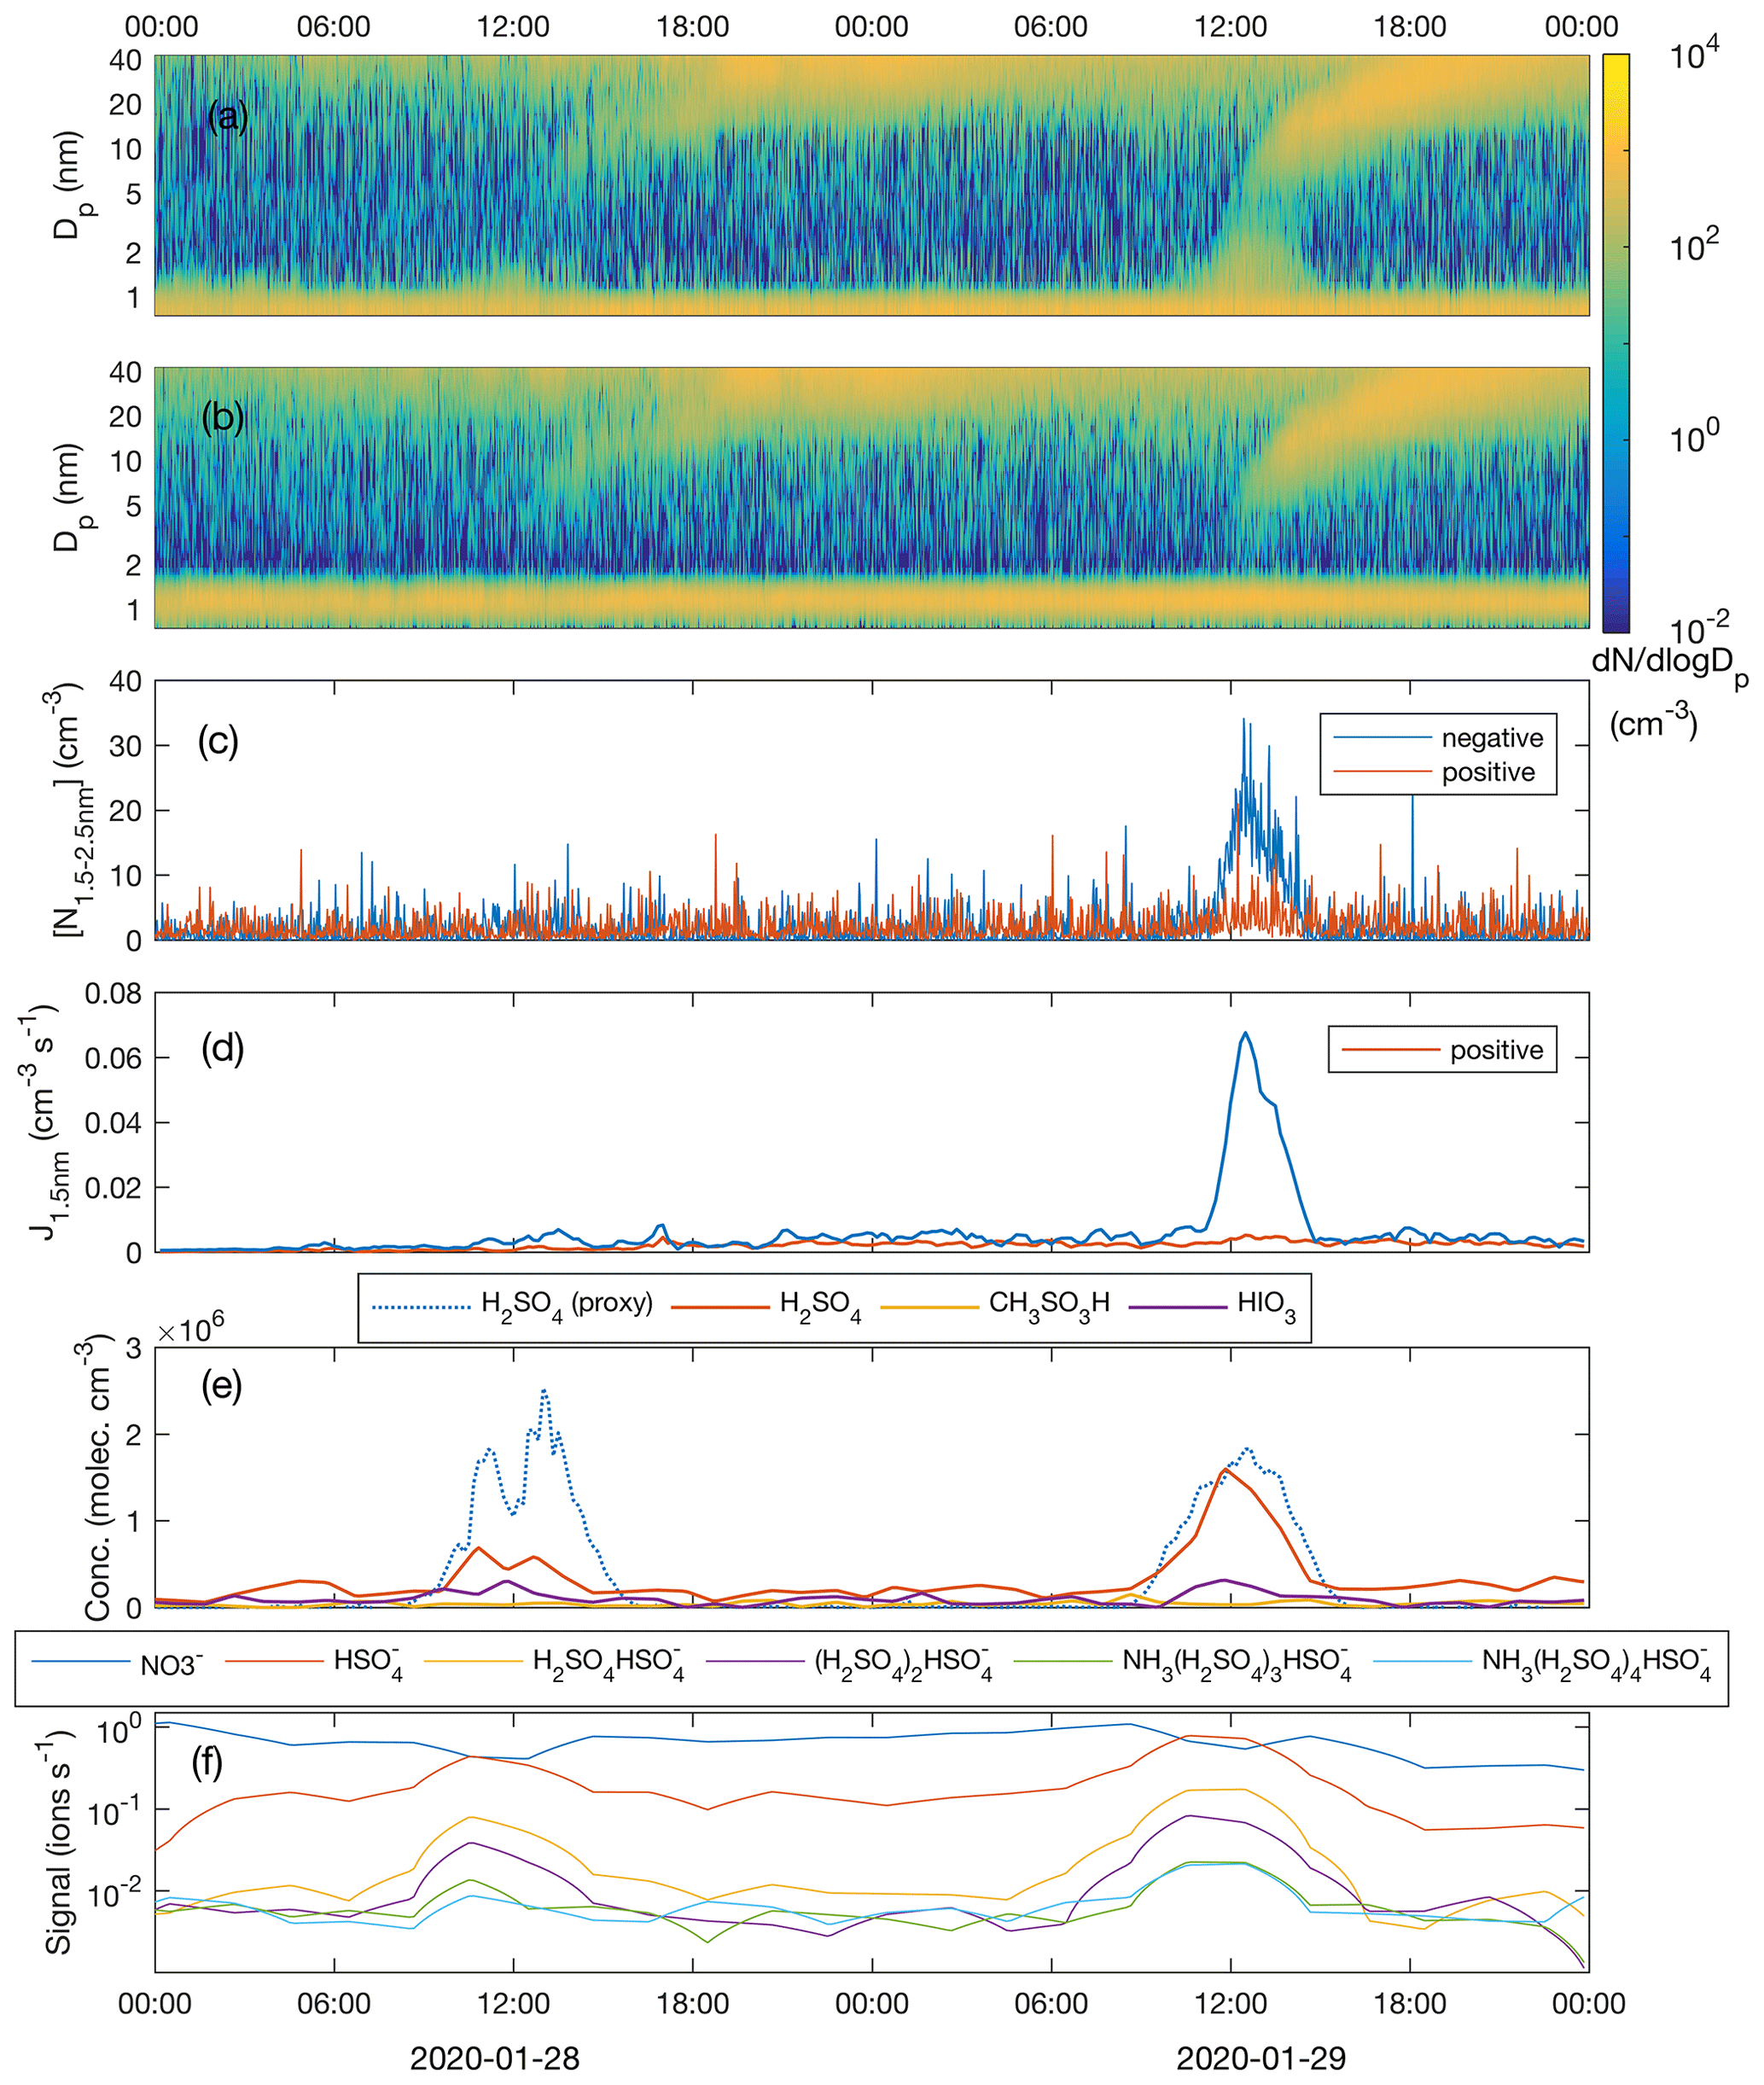
Figure 7Number size distribution of negative (a) and positive (b) clusters and particles; concentration of freshly nucleated, charged 1.5–2.5 nm clusters (c); formation rate of negative and positive 1.5 nm clusters (d); measured concentrations of sulfuric acid (H2SO4), methane sulfonic acid (CH3SO3H) and iodic acid (HIO3) as well as sulfuric acid concentration estimated by proxy calculation (e); and the signal intensity of nucleating ion clusters with different composition (f) during the period 28–29 January 2020.
Nucleation rates
Even though a weak growth of the small negative ions at around noon on 28 January is visually observable in Fig. 7a, the concentration of clusters in the 1.5–2.5 nm size range ( is hardly distinguishable from the noise (Fig. 7c). The nucleation rate, calculated using the filtered concentration data, only slightly exceeded the baseline (caused by the presence of minute, almost omnipresent signal from ion clusters extending above 1.5 nm but which is not connected to sulfuric acid nucleation), being approximately 0.005 cm−3 s−1 with a high relative uncertainty (Fig. 7d). On 29 January, with a 2.3-fold sulfuric acid concentration, the concentration of 1.5–2.5 nm negative clusters was well above the instrument noise, reaching 20 cm−3 around noon. The nucleation rate peaked at 0.067 cm−3 s−1. The ambient temperatures during nucleation (∼ noon) were almost identical, around −22 ∘C, on both days and therefore they can be directly compared. An approximately 10-fold difference in the nucleation rate between the two days accompanied by a factor of 2.3 difference in the sulfuric acid concentration is in line with the results from the CLOUD-chamber experiment on sulfuric acid–ammonia–water nucleation (Kirkby et al., 2011). The so-called “slope” that approximately (not exactly in real atmospheric situations) equals the number of sulfuric acid molecules in the critical cluster (Vehkamäki et al., 2012) is given as
and yields a value of 2.9 for the numbers discussed above. Though this value is subject to a significant uncertainty, it would agree with observations of Kirkby et al. (2011) and parameterizations by Dunne et al. (2016), which yield a “slope” of approximately 3 under similar conditions to those visualized in Fig. 8. In the same figure, data from all the days with clearly observable ion-induced nucleation are depicted. There, hourly average nucleation rates that exceed a threshold value of cm−3 s−1 are plotted against the concurrent calculated sulfuric acid concentration and air temperature. Calculated nucleation rates, Jgcr, represent the total nucleation rates (ion-induced plus neutral) at different temperatures and ammonia concentrations under the influence of ions producing galactic cosmic radiation (GCR) at the fixed rate of 1.8 ion pairs per cubic centimetre per second. Negative-ion-induced nucleation, however, should be the dominant mechanism under these conditions (Kirkby et al., 2011), so these results can be compared. Our data are reasonably close to the range predicted by the parameterization, considering that this simple calculation does not include air mass transportation, vertical mixing, terrestrial radiation sources or any other real-world phenomena. Also, sources and concentration of ammonia in our study area are unknown.
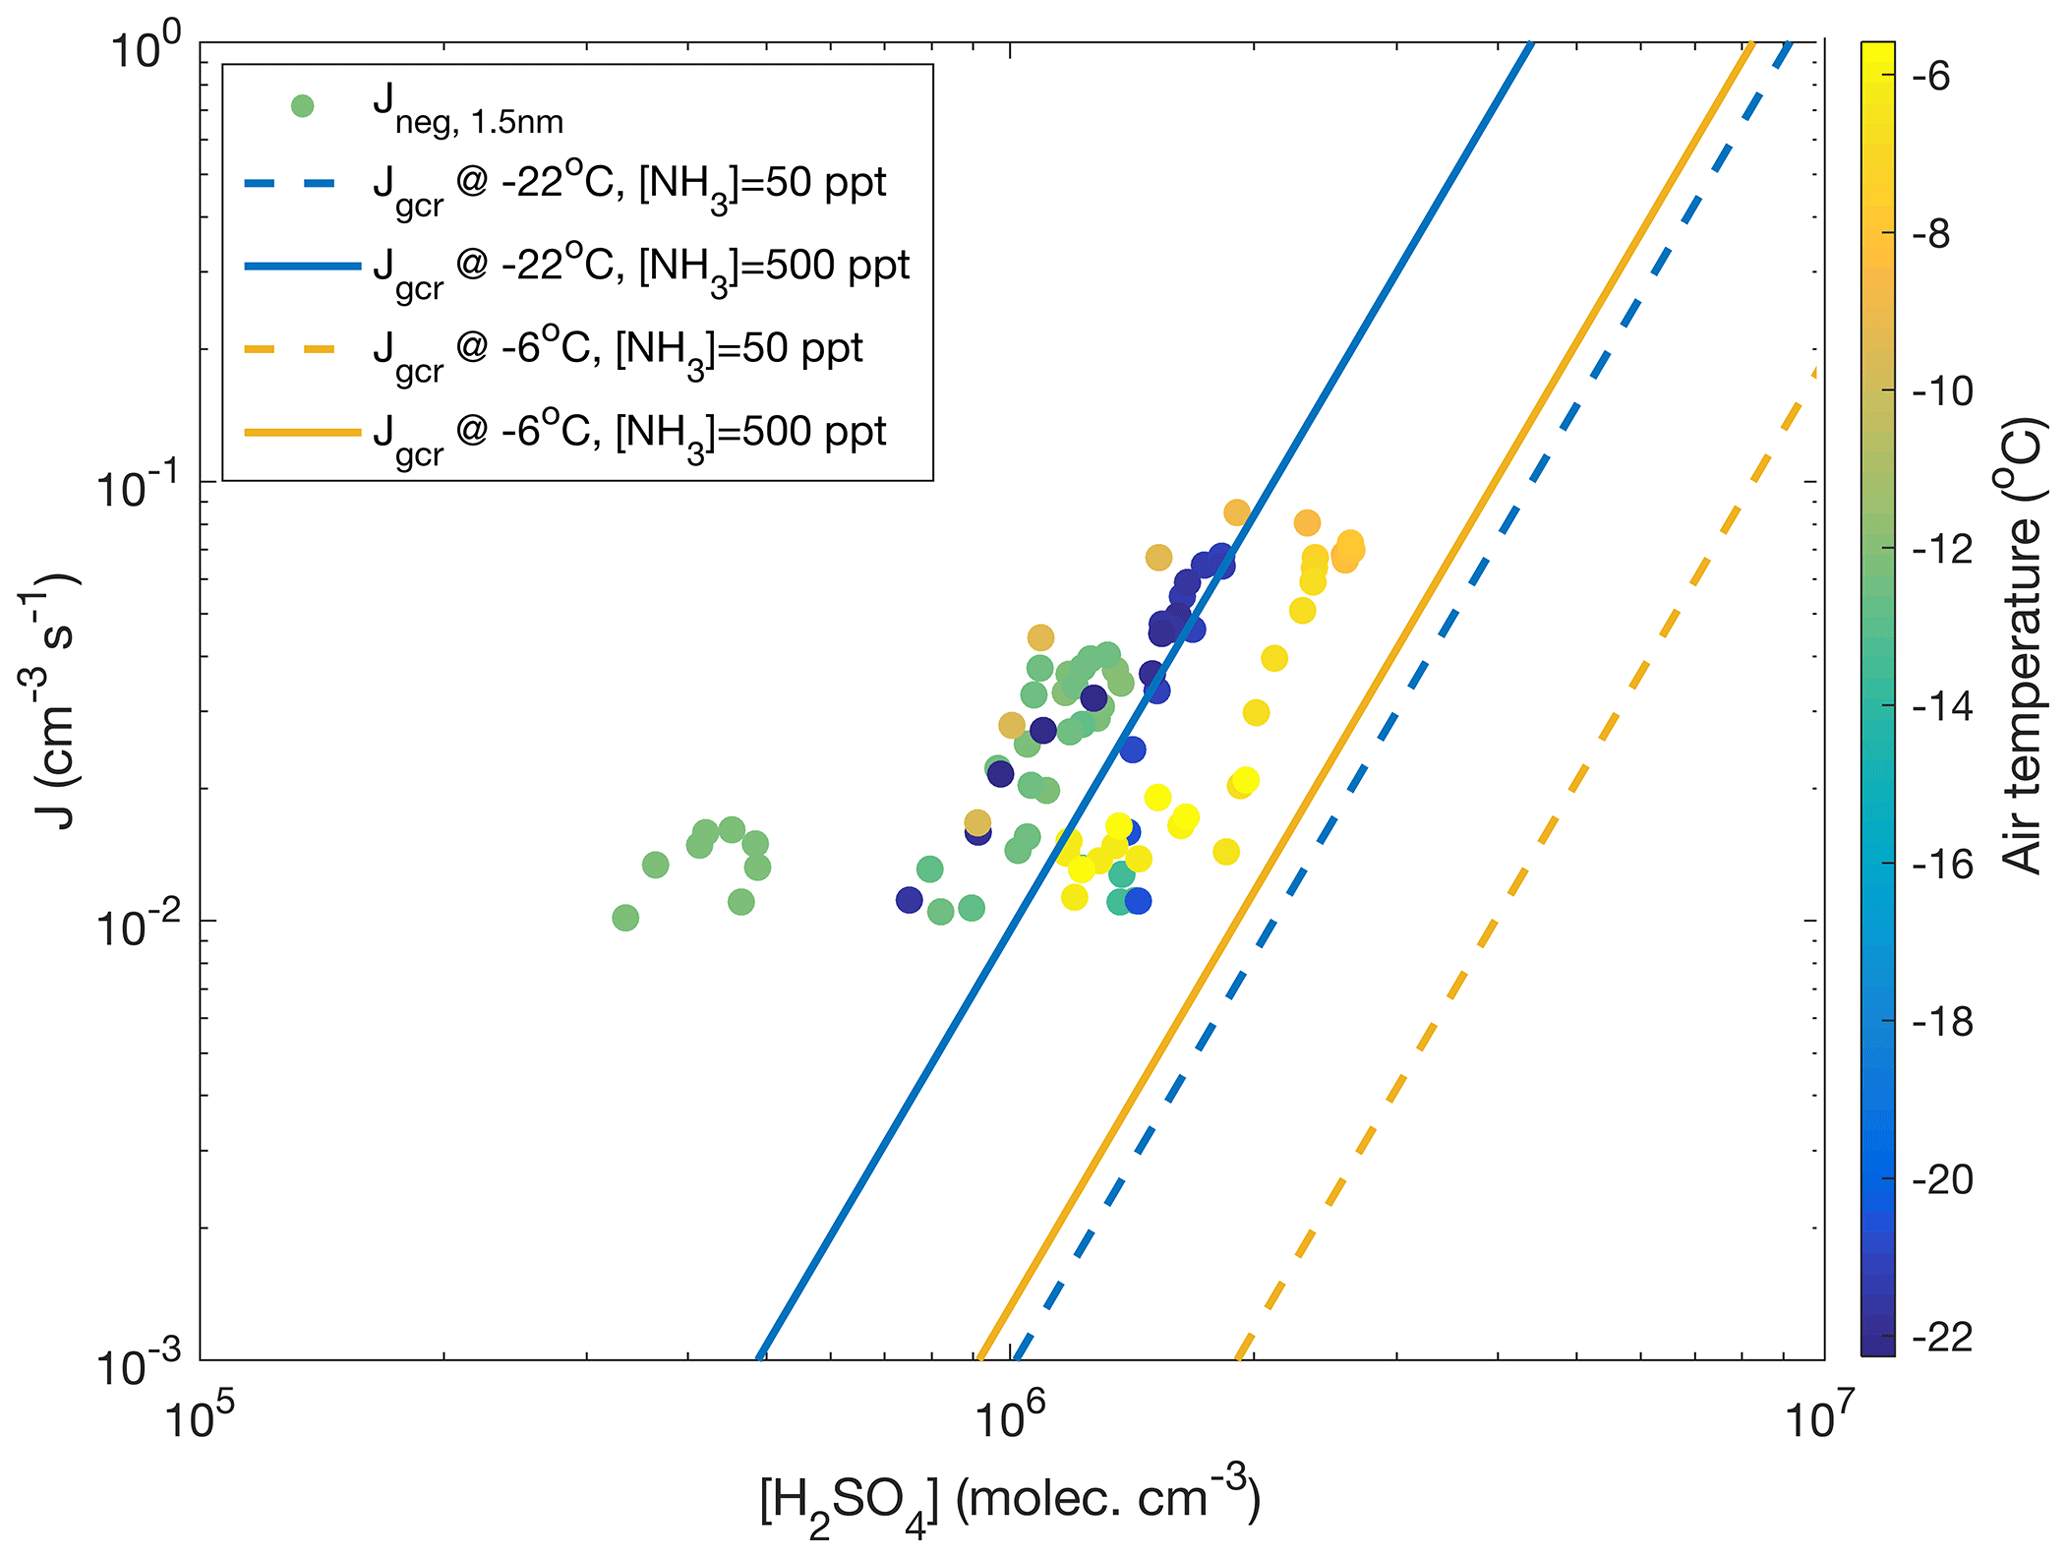
Figure 8The 1 h average negative ion-induced nucleation rates calculated vs. calculated sulfuric acid concentration (Dada et al., 2020) for days with visible and clear nucleation events (11–12 and 18–19 November 2019, 28–29 January, 13 March 2020) coloured according to the air temperature. A nucleation rate of 10−2 cm−3 s−1 was used as a threshold for reliable determination below which instrument noise becomes predominant. No positive ion-induced nucleation was observed. For comparison, total (negative, positive and neutral) nucleation rates Jgcr calculated based on CLOUD parameterization (Dunne et al., 2016) are presented. The calculation assumes a ground-level galactic cosmic ray ionization rate of 1.8 ion pairs per cubic centimetre per second and no contribution from terrestrial radioactivity. The calculation was performed at −22∘C and at −6∘C assuming an ammonia concentration of either 50 or 500 ppt.
Cluster time series
To confirm the role of sulfuric acid and to solve the contribution of ammonia to the nucleation process, we measured the negative ion cluster composition and signal intensity with the APi-TOF mass spectrometer in the ion mode without chemical ionization. The time series of the most abundant clusters show the appearance of HSO ions in the morning of 28 January, together with an increasing [H2SO4] accompanied with a decay of NO ion signal which typically dominates the anion spectrum at low [H2SO4] and low [HIO3] globally (Fig. 7f). Since H2SO4 is a stronger acid than HNO3, the proton transfer from H2SO4 to NO explains the observed behaviour when [H2SO4] started to rise. When [H2SO4] still increased during the course of the day, (NH3)m(H2SO4)nHSO clusters started to form. The cluster signals peaked at around noon coinciding with the highest [H2SO4] and , after which they started to decay. On 29 January, the same behaviour was observed, but with somewhat stronger cluster signals due to the higher [H2SO4].
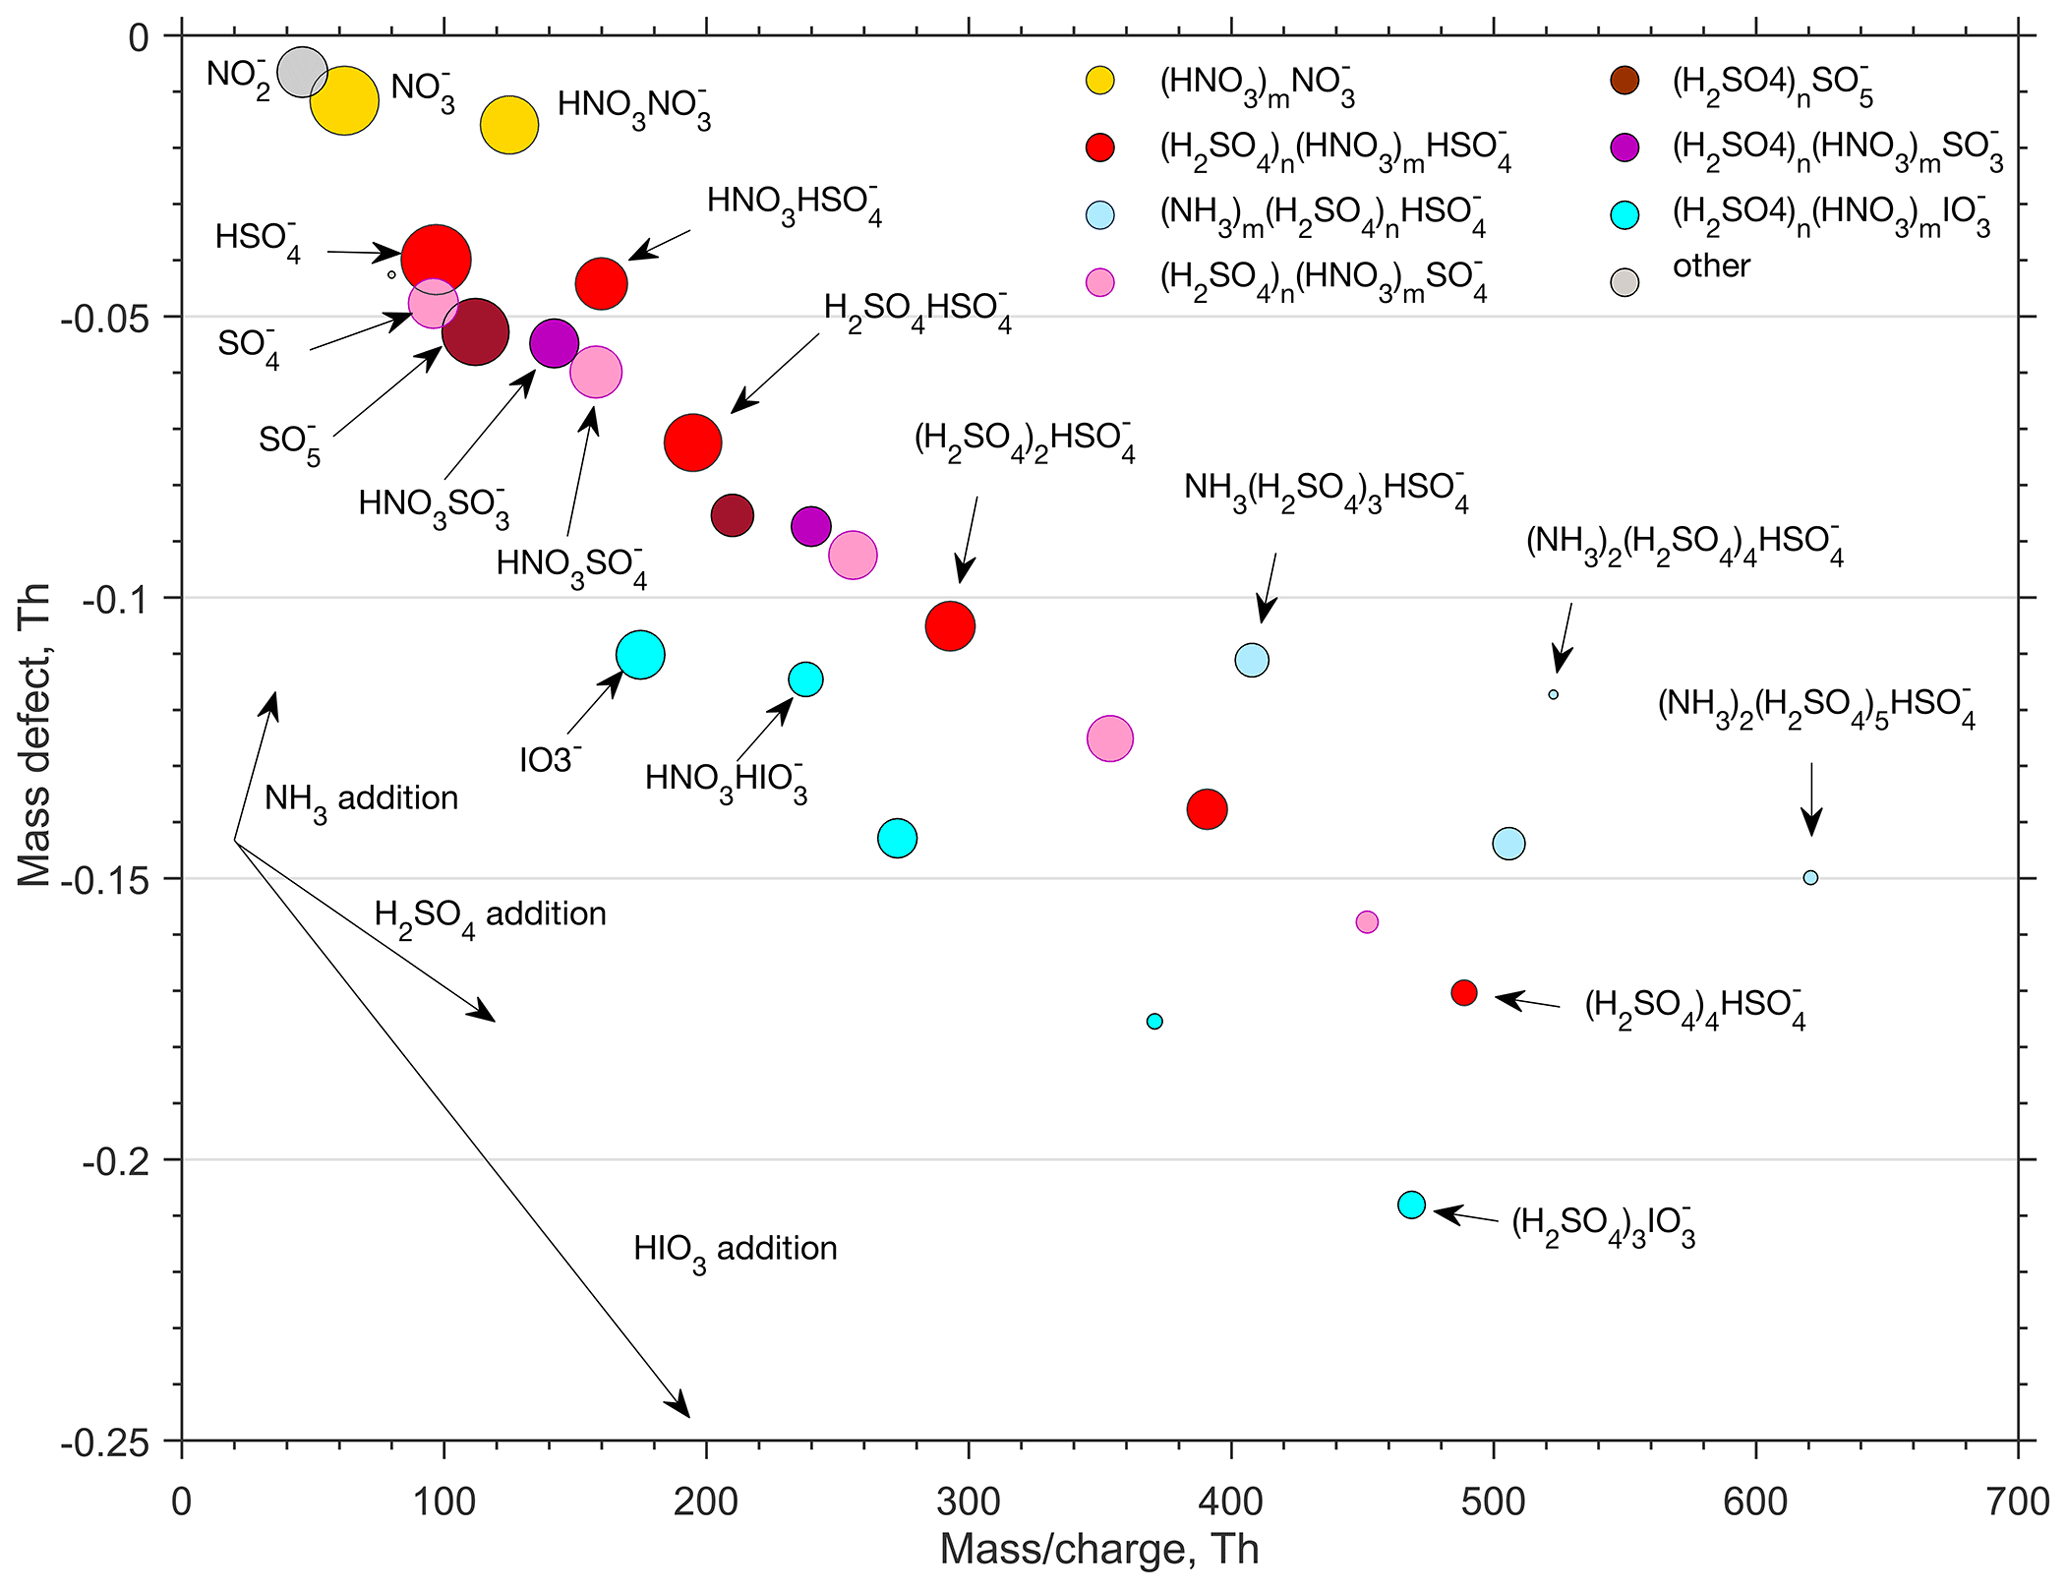
Figure 9Mass defect plot (with a 2 h effective integration time) of the anion cluster distribution recorded by the APi-TOF mass spectrometer during intensive cluster formation on 29 January 2020. The size of the circles is proportional to the concentration. See text for a detailed description.
Cluster composition
To get more insight into the chemical composition of clusters, the ion-cluster mass spectrum was integrated over 4 h (2 h effective data collection due to switching between CI and ion inlet). The resulting spectrum is presented in Fig. 9 by means of a mass defect plot, where the mass-to-charge ratio (, unit Th) corresponds – with only singly charged ion clusters present in the air – to the mass of the cluster (m, unit Da, equal to unified atomic mass unit, u). Mass defect is the mass difference (in Th or Da) between the exact mass of a cluster and the integer mass defined as the sum of nucleons in the atomic nuclei of this cluster. For example, the exact mass of a HSO ion that has 97 nucleons is 96.960103 Da and the mass defect is thus 0.039896 Da. The area of a dot is proportional to the logarithm of the observed signal intensity. In the mass defect plot, each addition of a molecule or atom is represented by a vector. An addition of H2SO4 for example, with a negative mass defect, leads to an increasing mass and a decreasing total mass defect, while an addition of a positive mass defect NH3 molecule leads to an increasing total mass defect. Successive additions of certain molecules to an ion results in a straight line in the mass defect plot, so that different cluster formation pathways are readily distinguishable from that plot.
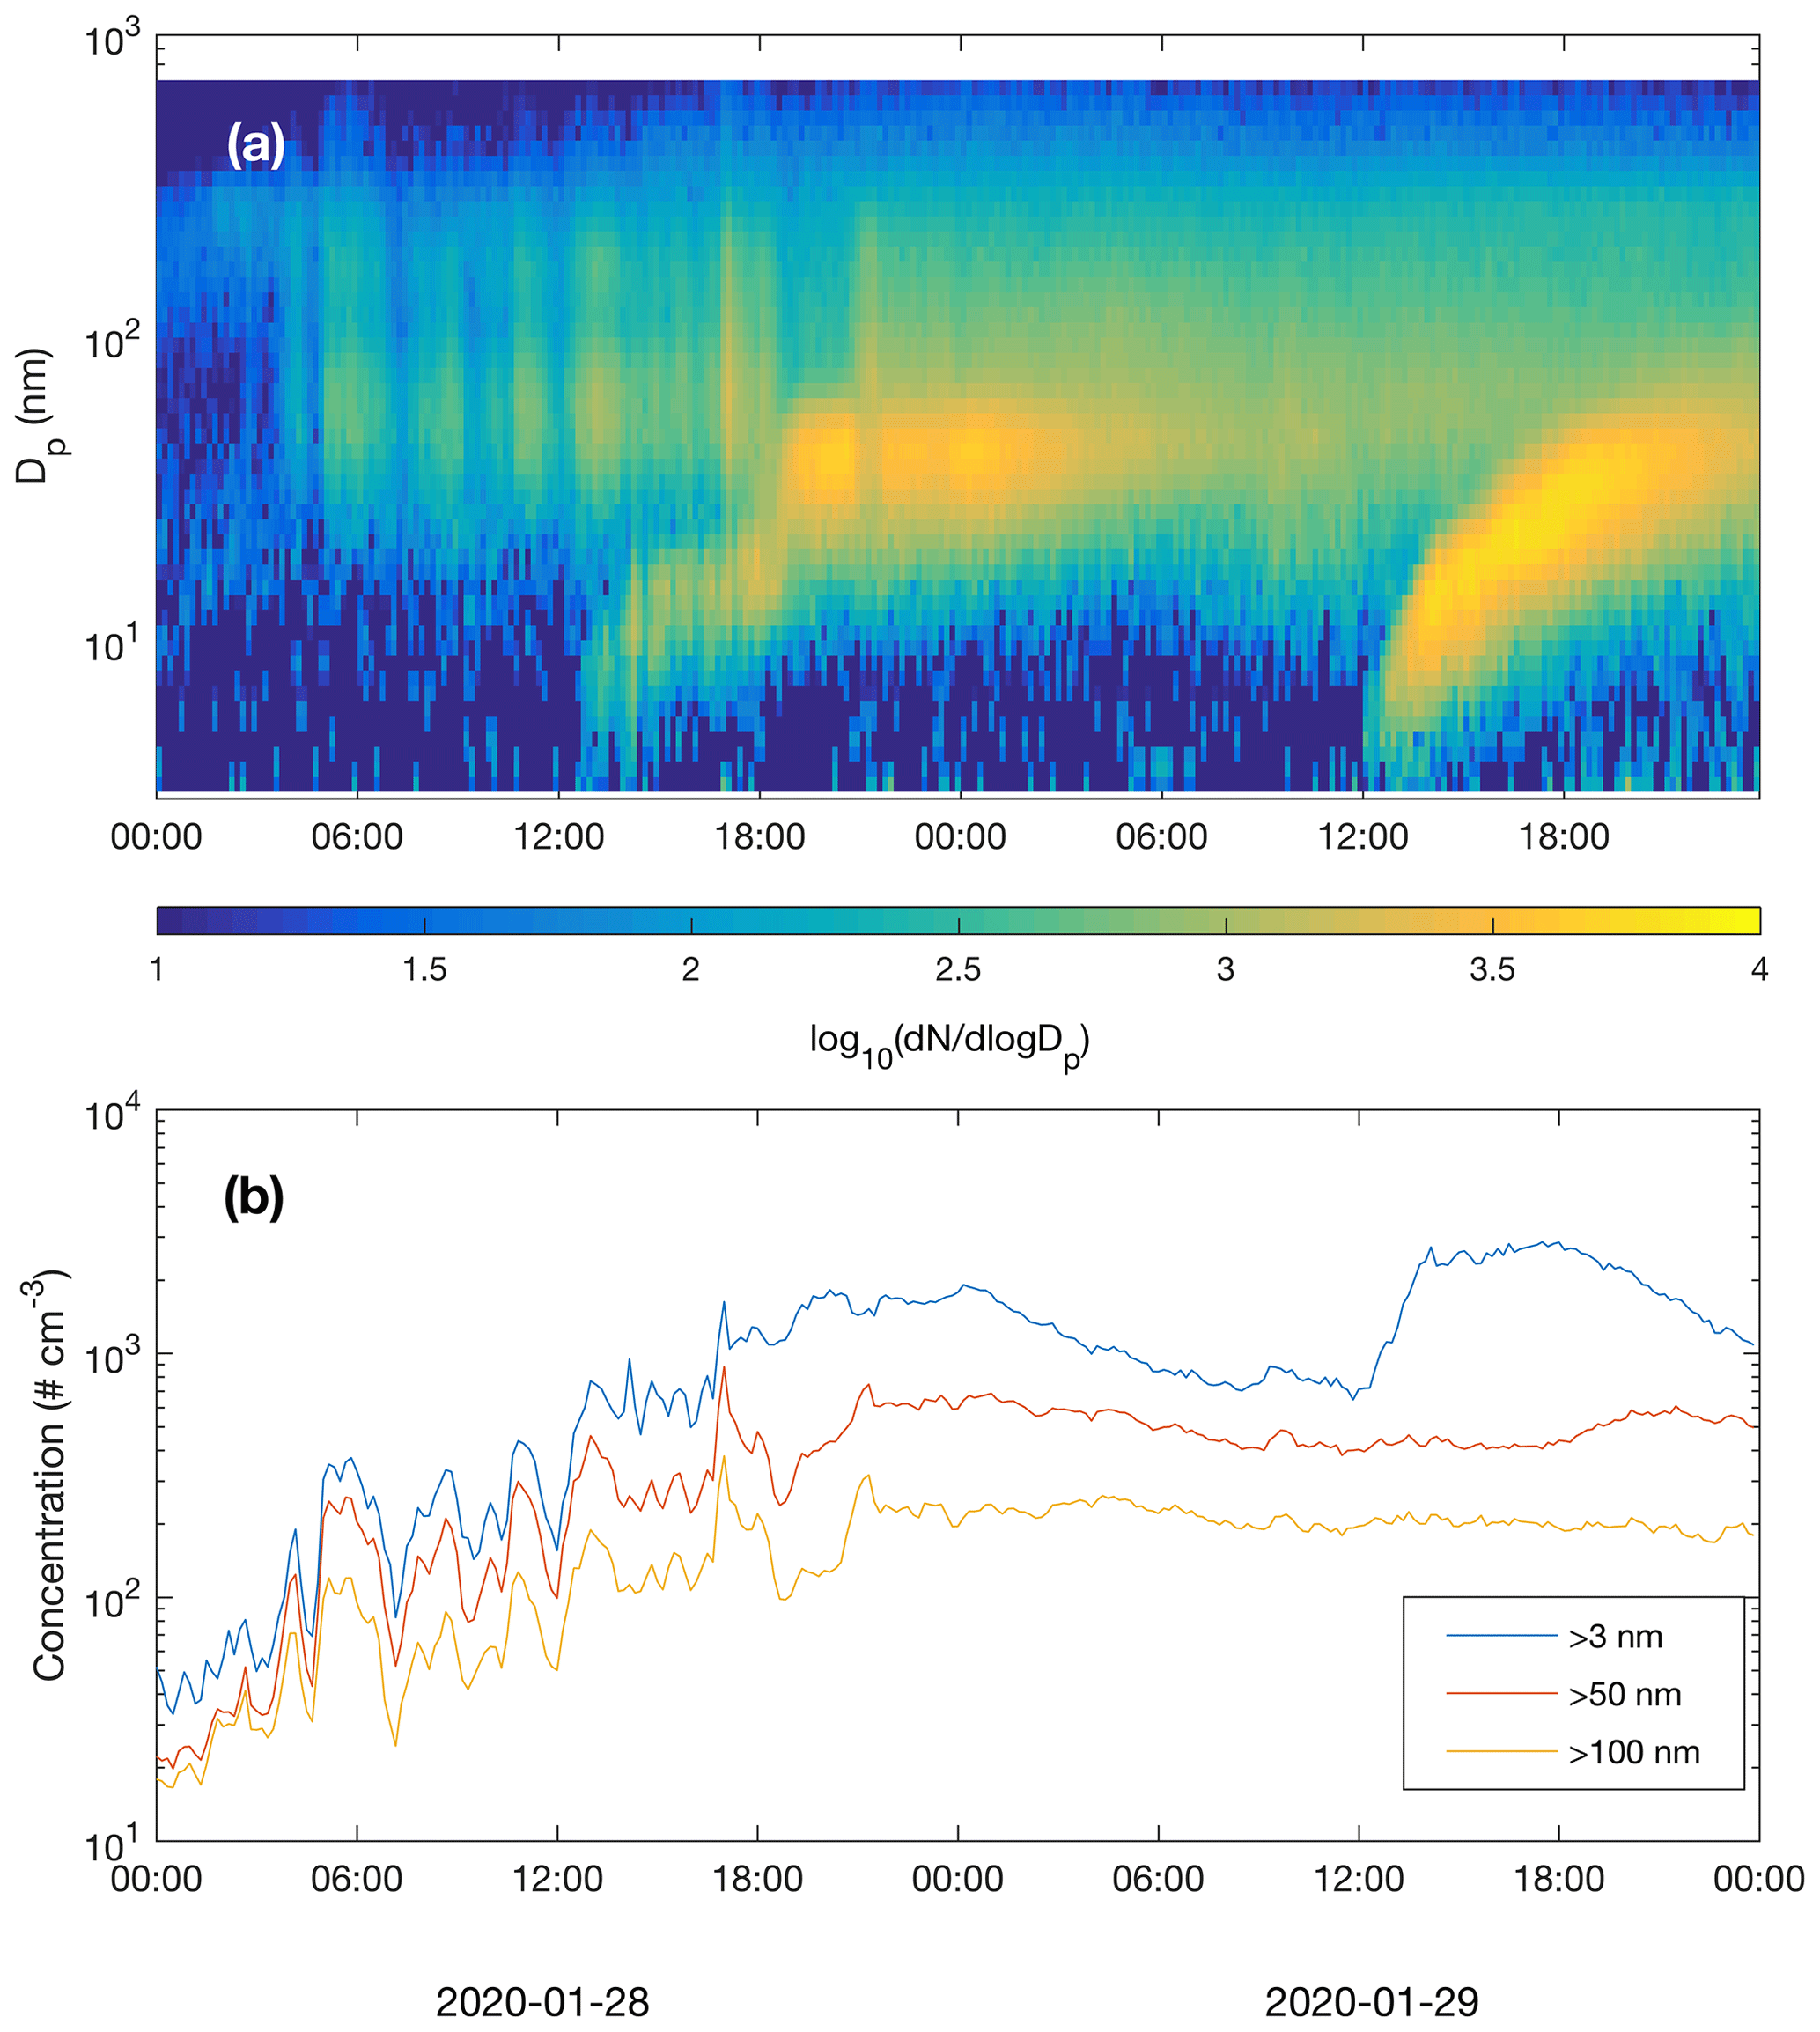
Figure 10Particle number size distribution (a) and concentrations of particles larger than 3, 50 and 100 nm (b) recorded by the DMPS.
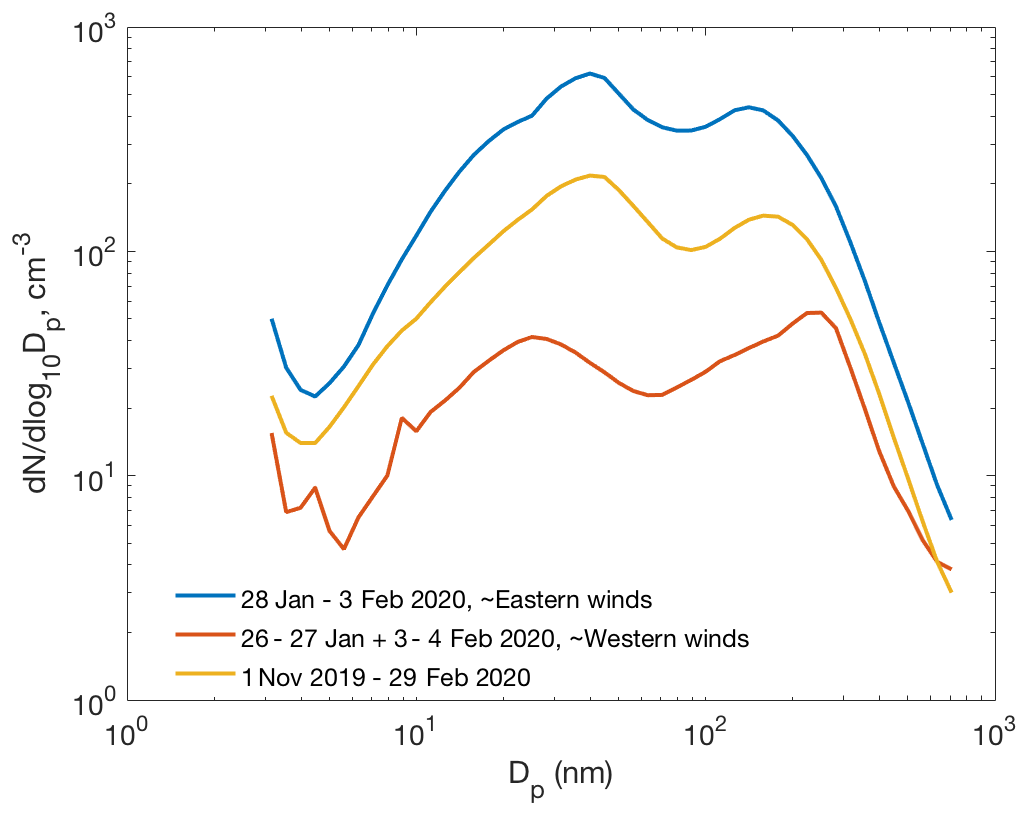
Figure 11Average particle number size distributions during the ∼ 1-week period of easterly winds (28 January–3 February 2020), during the preceding and succeeding time period with westerly winds, and average number size distribution between 1 November and 29 February.
In Fig. 9, the largest signals are associated with the omnipresent nitrate ion and its cluster with nitric acid (NO and HNO3⋅NO. The rest of the small (< 180 Da) ions are mainly different sulfur species, with bisulfate ions partly clustered with nitric acid (HSO and HNO3⋅HSO being the most abundant ones. Other small sulfur ions present in the spectrum are SO, SO, HNO3⋅SO and HNO3⋅SO. Deprotonated iodic acid (IO and its nitric acid cluster (HNO3⋅IO are also abundant. Despite the presence of multiple different types of these core ions, their initial growth is solely caused by the attachment of sulfuric acid molecules. We observed clusters with 1–4 H2SO4 molecules attached to the SO ion one H2SO4 molecule attached to the to SO and SO ions, and 1–3 H2SO4 molecules attached to the IO ion. For simplicity, we assume that the negative charge remains in the core ion. This is not necessarily true, but H2SO4 may lose a proton, e.g. to IO, resulting in the composition of HIO3⋅ (H2SOHSO instead of −(H2SO4)n⋅IO. Furthermore, water, if present in the clusters, efficiently evaporates in the vacuum of a mass spectrometer and therefore information on the role of water in the cluster formation is lost.
None of the clusters discussed above seem to adopt ammonia efficiently enough for their signals to exceed the detection threshold of the APi-TOF spectrometer (mass dependent, ∼ 10−3 to few 10−3 ions per second for 2 h integration for Th). Only clusters made solely of sulfuric acid with a bisulfate ion (HSO as a core seem to efficiently attach ammonia, resulting in the formation of (NH3)m⋅ (H2SO4)n⋅HSO-clusters (n>=3). This sequential addition of NH3 and H2SO4 has been shown to be an effective (ion-induced) cluster formation and growth mechanism in coastal Antarctica (Jokinen et al., 2018) as well as a secondary pathway in the free troposphere (Bianchi et al., 2016) and in the spring–summer time southern Finland boreal forest (Yan et al., 2018).
Our results on negative cluster composition can be compared to the results from the CLOUD experiment at −25 ∘C for varying NH3 H2SO4 ratios (Schobesberger et al., 2015). Based on that data, with the NH3 H2SO4 ratio exceeding approximately 100, both cluster composition and nucleation rate saturate (Kirkby et al., 2011) and become unaffected by further increases in the NH3 concentration. In those conditions, a cluster comprising 3 molecules of sulfuric acid on a bisulfate ion, (NH3)n⋅ (H2SO4)3⋅HSO, contains on average approximately n∼1 molecules of ammonia, whereas a cluster composed of 4 molecules of sulfuric acid and a bisulfate ion, (NH3)n⋅ (H2SO4)4⋅HSO, carries on average approximately n∼ 1.5 NH3 molecules (Schobesberger et al., 2015). In our case (Fig. 9), corresponding average ammonia numbers were n∼ 0.4 and n∼0.8 for (NH3)n⋅(H2SO4)3⋅HSO and (NH3)n⋅(H2SO4)4⋅HSO, respectively, which would suggest that the NH3 H2SO4 ratio in our case was well below 100, and likely below 10 (Schobesberger et al., 2015). If true, that would indicate an ammonia concentration of the order of ∼ 107 molecules cm−3, or ∼ 1 pptv. However, cluster fragmentation inside the mass spectrometer can be totally different between our experiment and the Schobesberger et al. (2015) study, and therefore no conclusions on ammonia concentrations should be drawn. Nevertheless, if the NH3 H2SO4 ratio was low, the system would not saturate with respect to NH3 and the nucleation rate should therefore be sensitive to both H2SO4 and NH3, similar to Jokinen et al. (2018). This, together with unknown effects of cluster fragmentation, highlight the importance of understanding NH3 sources, transportation and atmospheric mixing ratios down to ppt levels for a proper description of new particle formation, also in the subarctic region. Unfortunately, NH3 concentrations in the range of 1 pptv are not (reliably) detectable with any present-day measurement technology.
The present analysis shows that the sulfuric acid–ammonia ion-induced nucleation can trigger new particle formation in the wintertime subarctic and boreal environment with a high level of anthropogenic SO2 pollution but a low UV-radiation intensity. Data on neutral 1.5–3 nm particles are not available, so that neutral nucleation rates could not be derived. However, based on all the evidence obtained from the field (mainly Jokinen et al., 2018) and especially from the CLOUD experiments (Kirkby et al., 2011; Schobesberger et al., 2015), in the absence of significant amounts of compounds other than H2SO4 and NH3, and with the nucleation rates being below the ion pair production rate (typically 2–4 ion pairs per cubic centimetre per second in the Earth's surface layer), ion-induced nucleation seems to dominate over the neutral one. In our case, HOMs were below the detection limit, and amines, if important, would also appear in the anion spectrum in H2SO4 clusters. HIO3 and MSA were present, but significant neutral homogeneous nucleation of HIO3 would require ∼ 100-fold concentrations of it compared to what was measured here (Sipilä et al., 2016).
The observation of clusters containing IO or HIO3 together with H2SO4 is, however, highly interesting. HIO3 has been shown to nucleate homogeneously, and also mixed clusters containing both HIO3 and H2SO4 have been reported from the Alps (Frege et al., 2017), Atlantic coast (Sipilä et al., 2016) and Arctic (Beck et al., 2021). If the SO2-rich pollution plumes from the smelters are advected to iodine source areas (Arctic Ocean and especially sea ice zone as well as macroalgae-rich coasts) or vice versa, this mixed mechanism may become important.
3.2.4 Particle growth and relevance for CCN concentrations
Based on the above analysis, particle nucleation is clearly driven by sulfuric acid and ammonia, with the nucleation rate being most probably sensitive to concentrations of both of these vapours. But how do the freshly nucleated clusters grow? Assuming irreversible condensation, even the peak sulfuric acid concentration of 1.5×10⁶ molec. cm−3 can explain only a small fraction of the observed growth rate. Consistent with an earlier report on wintertime particle growth rates at Värriö (Kyrö et al., 2014), the apparent average growth rate on 29 January was approximately 4.5 nm h−1 (Fig. 2). Based on Stoltzenburg et al. (2020), such a rate would require a steady [H2SO4] of 2.6×10⁷ molec. cm−3 throughout the growth process, which would continue long after the sunset when the [H2SO4] already decays. Obviously, there are two possible explanations for this disagreement; either sulfuric acid was not responsible for most of the growth, or the air was not homogenous and the apparent growth was caused by the air mass advection (Kivekäs et al., 2016).
Besides sulfuric acid, the only condensable vapours detected were MSA and HIO3 (and NH3). However, their concentrations were clearly lower than that of sulfuric acid, and therefore condensation of those vapours in a homogeneous air mass cannot explain the apparent growth either. It could be speculated that compounds not recorded by the CI-APi-TOF mass spectrometer, such as SO2 or some less oxidized volatile or semi-volatile organic compounds, (S)VOCs, condense or react in particle phase forming low volatile compounds thereby contributing to growth (Stolzenburg et al., 2018). However, the complete absence of highly oxidized compounds does not support (though it does not fully exclude either) the presence of less oxidized compounds at a high abundance. The NO2 concentration was moderate, up to 7 ppb, and therefore nitric acid concentrations were likely insufficient to have a measurable effect on the growth (Wang et al., 2020). However, the temperature was low during the studied time period, and therefore HNO3 or some other semi-volatile compound could have contributed to the growth, provided that such compounds were present. Ammonia was detected in small ion clusters, but its contribution to the particle volume concentration, assuming that the measured cluster NH3 H2SO4 ratio reflects the composition of larger particles, was marginal. Assuming the particle composition to be ammonium bisulfate, i.e. the NH3 H2SO4 ratio of unity, ammonia would contribute 17 % to the particle volume and 5 % to particle diameter growth rate.
The most plausible explanation for the observed growth is that the particle growth was driven by H2SO4 condensation, but its concentration was not uniform over the source area. In that case, particles would nucleate and grow to their final sizes during the few hours of sunlight. Particles formed and grown close to the emissions sources with high SO2 and thus H2SO4 concentrations grow to larger sizes than particles formed near the measurement site. Air mass advection would then transport particles through the dark hours, leading to a steadily increasing nucleation (and later Aitken) mode diameters at SMEAR I, observed as an apparent steady growth even through the night. Modelling efforts and measurement of chemical composition or hygroscopicity of growing modes would be required for an unambiguous explanation of the particle growth.
New particle formation in the subarctic winter would be irrelevant if formed particles would not grow to sizes (above few tens of nanometres) where they can act as CCN. We did not measure CCN concentrations at different supersaturations, but the air masses originating from the Murmansk–Kandalaksha region from about 03:00 UTC+2 onwards on 28 January (Fig. 6) contained elevated concentrations of Aitken and accumulation mode particles, mainly in the size range of ∼ 20–500 nm (Fig. 10). New particle formation clearly increased the concentration of >3 nm particles, and the concentration of particles larger than 50 nm also showed an increase, especially on 29 January. The concentration of particles larger than 100 nm was relatively constant and apparently unaffected by NPF during the times when these NPF events could be observed. Air mass advection and particle loss processes, however, naturally have an impact on measured concentrations and are largely responsible for the development of particle populations.
Figure 11 presents the average particle number size distribution during about the 1-week period of eastern winds (28 January–3 February 2020), when the two clear NPF events presented above occurred. Concentrations of particles in all the size classes were remarkably higher, even by an order of magnitude for the 10–200 nm particles, than the average concentrations during the preceding and succeeding periods with westerly winds. Concentrations during that 1-week period were also clearly higher than the average concentrations between 1 November and 29 February, suggesting that new particle formation may be a significant source of particles in eastern air masses. However, primary emissions from the smelters and the surrounding cities would naturally show up in the size distribution plot as well. A more thorough analysis is needed to separate the roles of secondary NPF and primary emissions in the aerosol and CCN budgets. March, with almost continual NPF, was excluded from this analysis since the light conditions in March differ significantly from those between early November and end of February.
For an accurate assessment of the contribution of secondary aerosol formation to CCN concentrations at SMEAR I or regionally, the meteorological situation, including boundary layer dynamics, wet deposition of particles, etc., should be considered. However, our observations on clearly elevated CCN-size aerosol particle concentrations in eastern air masses (Figs. 10 and 11) point towards a clear contribution of Kola Peninsula SO2 emissions to wintertime CCN concentrations in the region.
Wintertime new particle formation and growth was investigated at the SMEAR I station, in the Värriö strict nature reserve, Finnish eastern Lapland. Sulfur dioxide concentrations in the air masses arriving from Kola Peninsula were often very high, occasionally over 30 ppb. At such high concentrations, enough sulfuric acid was formed to initiate new particle formation and growth, even in the presence of a very low solar radiation intensity.
New particle formation was observed mostly, but not solely, with easterly winds and in air masses arriving from the direction of Kola Peninsula smelters. Newly formed (4–10 nm, concentration >50 cm−3) particles were observed on 34 d altogether between 1 November 2019 and 15 March 2020, and out of these days about 60 % were associated with eastern winds or with the period of wind direction change from ∼ west to east. Nucleation was observed in situ at the SMEAR I station at H2SO4 concentration exceeding 1×10⁶ molec. cm−3. These cases were identified based on the appearance of ∼ 1.5–2 nm ion clusters. Other NPF events were observed as appearances of particles of a few nm in diameter, and these particles gradually grew in size over time. Nucleation at SMEAR I was shown to proceed via a negative-ion-induced sulfuric acid–ammonia(–water) channel which, based on prior understanding from laboratory experiments, can be hypothesized to dominate the NPF process at our site. Closer to SO2 emission sources where H2SO4 concentrations are likely remarkably higher, nucleation can also proceed via a neutral channel and could, theoretically, involve compounds other than H2SO4NH3 and water.
Larger particles with a diameter of at least a few nanometres observed at SMEAR I were probably not formed in the immediate vicinity of the site, so they had grown in size during the air mass advection. Secondary aerosol formation associated with the emissions from the Kola Peninsula together with primary particle emissions impact the aerosol number size distribution, clearly increasing the concentrations of particles in all the size classes, and therefore unavoidably also CCN concentrations. For a better understanding of the contribution of SO2 emissions from the Kola Peninsula to local and regional CCN concentrations, and for upscaling our results to cover all of (sub)arctic Eurasia with vastly polluting industrial cities such as Norilsk, require more measurements. Such measurements should be complemented with CCN or cloud residual measurements – ideally in more than only one location (SMEAR I) around the Kola Peninsula. Regional chemical transport and aerosol dynamic modelling would be necessary for a thorough assessment.
Mass spectrometer data related to this article are available from Zenodo (https://doi.org/10.5281/zenodo.5524857) as well as upon request to the corresponding author. The rest of the data are available for download from https://smear.avaa.csc.fi/ (last access: 20 November 2021, Junninen et al., 2009).
The supplement related to this article is available online at: https://doi.org/10.5194/acp-21-17559-2021-supplement.
MS designed the experiment. MS, NS, KN, TL, DK, SK, LB, TL, JL, PPA, PK, ES, PAR and TJ prepared the instruments, performed calibrations, collected the data and processed the data. MS and NS analysed the data. EMD calculated the back trajectories. MS wrote the paper. All authors contributed to the interpretation of data and commented on the paper.
The authors declare that they have no conflict of interest.
Publisher's note: Copernicus Publications remains neutral with regard to jurisdictional claims in published maps and institutional affiliations.
We thank the GiGAS-UHEL calibration centre for at-site CI-APi-TOF calibration, Värriö research station staff for technical support and Lubna Dada for discussions related to sulfuric acid calculation.
This research has been supported by the H2020 European Research Council (grant no. 714621), the Academy of Finland (grant nos. 296628, 328290, 310627 and 334514), and the European Commission, Horizon 2020 Framework Programme (grant no. ACTRIS IMP (871115)).
This paper was edited by Paul Zieger and reviewed by two anonymous referees.
Aalto, P., Hämeri, K., Becker, E., Weber, R., Salm, J., Mäkelä, J. M., Hoell, C., O'Dowd, C. D., Karlsson, H., Hansson, H.-C., Väkevä, M., Koponen, I. K., Buzorius, G., and Kulmala, M.: Physical characterization of aerosol particles during nucleation events, Tellus B, 53, 344–358, 2001.
Aitken, J.: On some Nuclei of Cloudy Condensation. Transactions of the Royal Society of Edinburgh, 39, 15–25, https://doi.org/10.1017/S0080456800034025, 1900.
Almeida, J., Schobesberger, S., Kürten, A., Ortega, I. K., Kupiainen-Määttä, O., Praplan, A. P., Adamov, A., Amorim, A.,Bianchi, F., Breitenlechner, M., David, A., Dommen, J., Don-ahue, N. M., Downard, A., Dunne, E., Duplissy, J., Ehrhart, S.,Flagan, R. C., Franchin, A., Guida, R., Hakala, J., Hansel, A., Heinritzi, M., Henschel, H., Jokinen, T., Junninen, H., Kajos, M.,Kangasluoma, J., Keskinen, H., Kupc, A., Kurtén, T., Kvashin,A. N., Laaksonen, A., Lehtipalo, K., Leiminger, M., Leppä,J., Loukonen, V., Makhmutov, V., Mathot, S., McGrath, M. J.,Nieminen, T., Olenius, T., Onnela, A., Petäjä, T., Riccobono, F.,Riipinen, I., Rissanen, M., Rondo, L., Ruuskanen, T., Santos, F.D., Sarnela, N., Schallhart, S., Schnitzhofer, R., Seinfeld, J. H.,Simon, M., Sipilä, M., Stozhkov, Y., Stratmann, F., Tomé, A.,Tröstl, J., Tsagkogeorgas, G., Vaattovaara, P., Viisanen, Y., Vir-tanen, A., Vrtala, A., Wagner, P. E., Weingartner, E., Wex, H.,Williamson, C., Wimmer, D., Ye, P., Yli-Juuti, T., Carslaw, K.S., Kulmala, M., Curtius, J., Baltensperger, U., Worsnop, D. R.,Vehkamäki, H., and Kirkby, J.: Molecular understanding of sulphuric acid – amine particle nucleation in the atmosphere, Nature, 502, 359–363, https://doi.org/10.1038/nature12663, 2013.
Ball, S. M., Hanson, D. R., Eisele, F. L., and McMurry, P. H.: Laboratory studies of particle nucleation: Initial results for H2SO4, H2O, and NH3 vapors, J. Geophys. Res., 104, 23709–23718, https://doi.org/10.1029/1999JD900411, 1999.
Baccarini, A., Karlsson, L., Dommen, J., Duplessis, P., Vüllers, J., Brooks, I. M., Saiz-Lopez, A., Salter, M., Tjernström, M., Baltensperger, U., Zieger, P., and Schmale J.: Frequent new particle formation over the high Arctic pack ice by enhanced iodine emissions, Nat. Commun. 11, 4924, https://doi.org/10.1038/s41467-020-18551-0, 2020.
Bianchi, F., Trostl, J., Junninen, H., Frege, C., Henne, S., Hoyle,C. R., Molteni, U., Herrmann, E., Adamov, A., Bukowiecki, N.,Chen, X., Duplissy, J., Gysel, M., Hutterli, M., Kangasluoma, J.,Kontkanen, J., Kürten, A., Manninen, H. E., Münch, S., Peräkylä,O., Petäjä, T., Rondo, L., Williamson, C., Weingartner, E., Cur-tius, J., Worsnop, D. R., Kulmala, M., Dommen, J., and Baltensperger, U.: New particle formation in the free troposphere: A question of chemistry and timing, Science, 352, 1109–1112, https://doi.org/10.1126/science.aad5456, 2016.
Brean, J., Dall'Osto, M., Simó, R., Shi, Z., Beddows, D. C. S., and Harrison, R. M.: Open ocean and coastal new particle formation from sulfuric acid and amines around the Antarctic Peninsula, Nat. Geosci., 14, 383–388, https://doi.org/10.1038/s41561-021-00751-y, 2021.
Cai, R., Yan, C., Yang, D., Yin, R., Lu, Y., Deng, C., Fu, Y., Ruan, J., Li, X., Kontkanen, J., Zhang, Q., Kangasluoma, J., Ma, Y., Hao, J., Worsnop, D. R., Bianchi, F., Paasonen, P., Kerminen, V.-M., Liu, Y., Wang, L., Zheng, J., Kulmala, M., and Jiang, J.: Sulfuric acid–amine nucleation in urban Beijing, Atmos. Chem. Phys., 21, 2457–2468, https://doi.org/10.5194/acp-21-2457-2021, 2021.
Dada, L., Ylivinkka, I., Baalbaki, R., Li, C., Guo, Y., Yan, C., Yao, L., Sarnela, N., Jokinen, T., Daellenbach, K. R., Yin, R., Deng, C., Chu, B., Nieminen, T., Wang, Y., Lin, Z., Thakur, R. C., Kontkanen, J., Stolzenburg, D., Sipilä, M., Hussein, T., Paasonen, P., Bianchi, F., Salma, I., Weidinger, T., Pikridas, M., Sciare, J., Jiang, J., Liu, Y., Petäjä, T., Kerminen, V.-M., and Kulmala, M.: Sources and sinks driving sulfuric acid concentrations in contrasting environments: implications on proxy calculations, Atmos. Chem. Phys., 20, 11747–11766, https://doi.org/10.5194/acp-20-11747-2020, 2020.
Ehn, M., Thornton, J., Kleist, E., Sipilä, M., Junninen, H.,Pullinen, I., Springer, M., Rubach, F., Tillmann, R., Lee, B.,Lopez-Hilfiker, F., Andres, S., Acir, I.-H., Rissanen, M., Joki-nen, T., Schobesberger, S., Kangasluoma, J., Kontkanen, J., Nieminen, T., Kurtén, T., Nielsen, L. B., Jørgensen, S., Kjaer-gaard, H. G., Canagaratna, M., Maso, M. D., Berndt, T., Petäjä, T., Wahner, A., Kerminen, V.-M., Kulmala, M., Worsnop,D. R., Wildt, J., and Mentel, T. F.: A large source of low-volatility secondary organic aerosol, Nature, 506, 476–479, https://doi.org/10.1038/nature13032, 2014.
Eisele, F. L., Lovejoy, E. R., Kosciuch, E., Moore, K. F., Mauldin III, R. L., Smith, J. N., McMurry, P. H., and Iida, K.: Negative atmospheric ions and their potential role in ion-induced nucleation, J. Geophys. Res., 111, D04305, https://doi.org/10.1029/2005JD006568, 2006.
Ekimov, S. V., Samodova, I. V., Petrov, I. M., Troitsky, V. V., and Burstein, M. A.: Russian smelter emissions, Mining Journal, London, November 23, p. 393, 2001.
Gordon, H., Kirkby, J., Baltensperger, U., Bianchi, F., Breitenlechner, M., Curtius, J., Dias, A., Dommen, J., Donahue, N. M., Dunne, E. M., Duplissy, J., Ehrhart, S., Flagan, R. C., Frege, C., Fuchs, C., Hansel, A., Hoyle, C. R., Kulmala, M., Kürten, A., Lehtipalo, K., Makhmutov, V., Molteni, U., Rissanen, M. P., Stozkhov, Y., Tröstl, J., Tsagkogeorgas, G., Wagner, R., Williamson, C., Wimmer, D., Winkler, P. M., Yan, C., and Carslaw, K. S.: Causes and importance of new particle formation in the present-day and preindustrial atmospheres, J. Geophys. Res.-Atmos., 122, 8739–8760, https://doi.org/10.1002/2017JD026844, 2017.
Hanson, D. R. and Eisele, F. L.: Measurement of prenucleation molecular clusters in the NH3, H2SO4, H2O system, J. Geophys. Res., 107, 4158, https://doi.org/10.1029/2001JD001100, 2002.
Hari, P., Kulmala, M., Pohja, T., Lahti, T., Siivola, E., Palva, L., Aalto, P., Hämeri, K., Vesala, T., Luoma, S., and Pulliainen, E.: Air pollution in eastern Lapland: challenge for an environmental research station, Silva Fenn., 28, 29–39, 1994.
Helsinki Region Environmental Services Authority: available at: https://julkaisu.hsy.fi/ilmanlaatu-paakaupunkiseudulla-vuonna-2019-1.html (last access: 20 November 2021), 2020.
Jokinen, T., Sipilä, M., Junninen, H., Ehn, M., Lönn, G., Hakala, J., Petäjä, T., Mauldin III, R. L., Kulmala, M., and Worsnop, D. R.: Atmospheric sulphuric acid and neutral cluster measurements using CI-APi-TOF, Atmos. Chem. Phys., 12, 4117–4125, https://doi.org/10.5194/acp-12-4117-2012, 2012.
Jokinen, T., Sipilä, M., Kontkanen, J., Vakkari, V., Tisler, P., Du-plissy, E.-M., Junninen, H., Kangasluoma, J., Manninen, H. E., Petäjä, T., Kulmala, M., Worsnop, D. R., Kirkby, J., Virkkula, A., and Kerminen, V.-M.: Ion-induced sulphuric acid–ammonia nu-cleation drives particle formation in coastal Antarctica, Sci. Adv., 4, eaat9744, https://doi.org/10.1126/sciadv.aat9744, 2018.
Junninen, H., Lauri, A., Keronen, P., Aalto, P., Hiltunen, V., Hari, P., and Kulmala, M.: Smart-SMEAR: online data exploration and visualization tool for SMEAR stations, Boreal Environ. Res., 14, 447–457, https://smear.avaa.csc.fi, (last access: 20 November 2021), 2009.
Junninen, H., Ehn, M., Petäjä, T., Luosujärvi, L., Kotiaho, T., Kostiainen, R., Rohner, U., Gonin, M., Fuhrer, K., Kulmala, M., and Worsnop, D. R.: A high-resolution mass spectrometer to measure atmospheric ion composition, Atmos. Meas. Tech., 3, 1039–1053, https://doi.org/10.5194/amt-3-1039-2010, 2010.
Kirkby, J., Curtius, J., Almeida, J., Dunne, E., Duplissy, J., Ehrhart, S., Franchin, A., Gagne, S.,Ickes, L., Kürten, A., Kupc,A., Metzger, A., Riccobono, F., Rondo, L., Schobesberger,S., Tsagkogeorgas, G., Wimmer, D., Amorim, A., Bianchi,F., Breitenlechner, M., David, A., Dommen, J.,Downard,A., Ehn, M., Flagan, R. C., Haider, S., Hansel, A., Hauser, D., Jud, W., Junninen, H., Kreissl, F., Kvashin, A., Laaksonen, A., Lehtipalo, K., Lima, J., Lovejoy, E. R., Makhmutov, V., Mathot, S., Mikkila, J., Minginette, P., Mogo, S., Nieminen, T., Onnela, A., Pereira, P., Petäjä, T.,Schnitzhofer,R.,Seinfeld, J. H., Sipilä, M., Stozhkov, Y., Stratmann,F., Tome, A., Vanhanen, J., Viisanen, Y., Vrtala, A., Wagner, P. E., Walther, H., Weingartner, E., Wex, H., Winkler, P. M., Carslaw, K. S., Worsnop, D. R., Baltensperger, U., and Kulmala, M.: Role of sulphuric acid, ammonia and galactic cosmic rays in atmospheric aerosol nucleation, Nature, 476, 429–433, https://doi.org/10.1038/nature10343, 2011.
Kirkby, J., Duplissy, J., Sengupta, K., Frege, C., Gordon, H.,Williamson, C., Heinritzi, M., Simon, M., Yan, C., Almeida, J.,Tröstl, J., Nieminen, T., Ortega, I. K., Wagner, R., Adamov, A.,Amorim, A., Bernhammer, A.-K., Bianchi, F., Breitenlechner, M., Brilke, S., Chen, X., Craven, J., Dias, A., Ehrhart, S., Flagan,R. C., Franchin, A., Fuchs, C., Guida, R., Hakala, J., Hoyle, C.R., Jokinen, T., Junninen, H., Kangasluoma, J., Kim, J., Krapf,M., Kürten, A., Laaksonen, A., Lehtipalo, K., Makhmutov, V., Mathot, S., Molteni, U., Onnela, A., Peräkylä, O., Piel, F., Petäjä, T., Praplan, A. P., Pringle, K., Rap, A., Richards, N. A. D., Riipinen, I., Rissanen, M. P., Rondo, L., Sarnela, N., Schobesberger, S., Scott, C. E., Seinfeld, J. H., Sipilä, M., Steiner, G., Stozhkov,Y., Stratmann, F., Tomé, A., Virtanen, A., Vogel, A. L., Wagner, A., Wagner, P. E., Weingartner, E., Wimmer, D., Winkler, P. M., Ye, P., Zhang, X., Hansel, A., Dommen, J., Donahue, N. M., Worsnop, D. R., Baltensperger, U., Kulmala, M., Carslaw, K. S., and Curtius, J.: Ion-induced nucleation of pure biogenic particles, Nature, 533, 521–526, https://doi.org/10.1038/nature17953, 2016.
Kivekäs, N., Carpman, J., Roldin, P., Leppä, J., O'Connor, E., Kristersson, A., and Asmi, E.: Coupling an aerosol box model with one-dimensional flow: a tool for understanding observations of new particle formation events, Tellus B, 68, 29706, https://doi.org/10.3402/tellusb.v68.29706, 2016.
Kulmala, M., Kontkanen, J., Junninen, H., Lehtipalo, K., Manni-nen, H. E., Nieminen, T., Petäjä, T., Sipilä, M., Schobesberger,S., Rantala, P., Franchin, A., Jokinen, T., Järvinen, E., Äijälä, M.,Kangasluoma, J., Hakala, J., Aalto, P. P., Paasonen, P., Mikkilä,J., Vanhanen, J., Aalto, J., Hakola, H., Makkonen, U., Ruuskanen, T., Mauldin, R. L., Duplissy, J., Vehkamäki, H., Bäck, J., Kortelainen, A., Riipinen, I., Kurten, T., Johnston, M. V., Smith, J. N., Ehn, M., Mentel, T. F., Lehtinen, K. E. J., Laaksonen, A., Kerminen, V.-M., and Worsnop, D. R.: Direct Observations of Atmospheric Aerosol Nucleation, Science, 339, 943–946, https://doi.org/10.1126/science.1227385, 2013.
Kürten, A., Rondo, L., Ehrhart, S., and Curtius, J.: Calibration of a chemical ionization mass spectrometer for the measurement of gaseous sulfuric acid, J. Phys. Chem. A, 116, 6375–6386, https://doi.org/10.1021/jp212123n, 2012.
Kürten, A., Jokinen, T., Simon, M., Sipilä, M., Sarnela, N., Junninen, H., Adamov, A., Almeida, J., Amorim, A., Bianchi, F., Breitenlechner, M., Dommen, J., Donahue, N. M., Duplissy, J., Ehrhart, S., Flagan, R. C., Franchin, A., Hakala, J., Hansel, A., Heinritzi, M., Hutterli, M., Kangasluoma, J., Kirkby, J., Laaksonen, A., Lehtipalo, K., Leiminger, M., Makhmutov, V., Mathot, S., Onnela, A., Petäjä, T., Praplan, A. P., Riccobono, F., Rissanen, M. P., Rondo, L., Schobesberger, S., Seinfeld, J. H., Steiner, G., Tomé, A., Tröstl, J., Winkler, P. M., Williamson, C., Wimmer, D., Ye, P., Baltensperger, U., Carslaw, K. S., Kulmala, M., Worsnop, D. R., and Curtius, J.: Neutral molecular cluster formation of sulfuric acid-dimethylamine observed in real-time under atmospheric conditions, P. Natl. Acad. Sci. USA, 111, 15019–15024, https://doi.org/10.1073/pnas.1404853111, 2014.
Kyrö, E.-M., Väänänen, R., Kerminen, V.-M., Virkkula, A., Petäjä, T., Asmi, A., Dal Maso, M., Nieminen, T., Juhola, S., Shcherbinin, A., Riipinen, I., Lehtipalo, K., Keronen, P., Aalto, P. P., Hari, P., and Kulmala, M.: Trends in new particle formation in eastern Lapland, Finland: effect of decreasing sulfur emissions from Kola Peninsula, Atmos. Chem. Phys., 14, 4383–4396, https://doi.org/10.5194/acp-14-4383-2014, 2014.
Lehtipalo, K., Leppä, J., Kontkanen, J., Kangasluoma, J., Franchin, A., Wimmer, D., Schobesberger, S., Junninen, H., Petäjä, T., Sipilä, M., Mikkilä, J., Vanhanen, J., Worsnop, D. R., and Kulmala, M.: Methods for determining particle size distribution and growth rates between 1 and 3 nm using the Particle Size Magnifier, Boreal Environ. Res., 19, 215–236, 2014.
Mauldin III, R. L., Berndt, T., Sipilä, M., Paasonen, P., Petäjä, T., Kim, S., Kurtén, T., Stratmann, F., Kerminen, V.-M., and Kulmala, M.: A new atmospherically relevant oxidant, Nature, 488, 193–196, https://doi.org/10.1038/nature11278, 2012.
Merikanto, J., Spracklen, D. V., Mann, G. W., Pickering, S. J., and Carslaw, K. S.: Impact of nucleation on global CCN, Atmos. Chem. Phys., 9, 8601–8616, https://doi.org/10.5194/acp-9-8601-2009, 2009.
Mirme, S. and Mirme, A.: The mathematical principles and design of the NAIS – a spectrometer for the measurement of cluster ion and nanometer aerosol size distributions, Atmos. Meas. Tech., 6, 1061–1071, https://doi.org/10.5194/amt-6-1061-2013, 2013.
Paatero, J., Dauvalter, V., Derome, J., Lehto, J., Pasanen, J., Vesala, T., Miettinen, J., Makkonen, U., Kyrö, E.-M., Jernström, J., Isaeva, L., and Derome, K.: Effects of Kola air pollution on the environment in the western part of the Kola Peninsula and Finnish Lapland: final report, Finnish Meteorological Institute Reports, 6, 1–26, 2008.
Rose, C., Zha, Q., Dada, L., Yan, C., Lehtipalo, K., Junninen, H., Mazon, S. B., Jokinen, T., Sarnela, N., Sipilä, M., Petäjä, T., Kerminen, V.-M., Bianchi, F., and Kulmala, M.: Observations of biogenic ion-induced cluster formation in the atmosphere, Sci. Adv., 4, 5218, https://doi.org/10.1126/sciadv.aar5218, 2018.
Schobesberger, S., Franchin, A., Bianchi, F., Rondo, L., Duplissy, J., Kürten, A., Ortega, I. K., Metzger, A., Schnitzhofer, R., Almeida, J., Amorim, A., Dommen, J., Dunne, E. M., Ehn, M., Gagné, S., Ickes, L., Junninen, H., Hansel, A., Kerminen, V.-M., Kirkby, J., Kupc, A., Laaksonen, A., Lehtipalo, K., Mathot, S., Onnela, A., Petäjä, T., Riccobono, F., Santos, F. D., Sipilä, M., Tomé, A., Tsagkogeorgas, G., Viisanen, Y., Wagner, P. E., Wimmer, D., Curtius, J., Donahue, N. M., Baltensperger, U., Kulmala, M., and Worsnop, D. R.: On the composition of ammonia–sulfuric-acid ion clusters during aerosol particle formation, Atmos. Chem. Phys., 15, 55–78, https://doi.org/10.5194/acp-15-55-2015, 2015.
Solarin, S. A. and Tiwari, A.: Convergence in Sulphur Dioxide (SO2) Emissions Since 1850 in OECD Countries: Evidence from a New Panel Unit Root Test. Environ Model Assess, 25, 665–675, https://doi.org/10.1007/s10666-019-09687-5, 2020.
Sipilä, M., Sarnela, N., Jokinen, T., Henschel, H., Junninen, H., Kontkanen, J., Richters, S., Kangasluoma, J., Franchin, A., Peräkylä, O., Rissanen, M. P., Ehn, M., Vehkamäki, H., Kurten, T., Berndt, T., Petäjä, T., Worsnop, D., Ceburnis, D., Kerminen, V.-M., Kulmala, M., and O'Dowd, C.: Molecular-scale evidence of aerosol particle formation via sequential addition of HIO3, Nature, 537, 532–534, https://doi.org/10.1038/nature19314, 2016.
Stein, A. F., Draxler, R. R., Rolph, G. D., Stunder, B. J. B., Cohen, M. D., and Ngan, F.: NOAA's HYSPLIT Atmospheric Transport and Dispersion Modeling System, B. Am. Meteorol. Soc., 96, 2059–2077, https://doi.org/10.1175/BAMS-D-14-00110.1, 2015.
Tammet, H., Hõrrak, U., Laakso, L., and Kulmala, M.: Factors of air ion balance in a coniferous forest according to measurements in Hyytiälä, Finland, Atmos. Chem. Phys., 6, 3377–3390, https://doi.org/10.5194/acp-6-3377-2006, 2006.
Tuovinen J.-P., Laurila, T., and Lättilä H.: Impact of the sulphur dioxide sources in the Kola Peninsula on air quality in northernmost Europe, Atmos. Environ., 27, 1379–1395, 1993.
Vehkamäki, H., McGrath, M. J., Kurtén, T., Julin, J., Lehtinen K. E. J., and Kulmala, M.: Rethinking the application of the first nucleation theorem to particle formation. J. Chem. Phys. 136, 094107, https://doi.org/10.1063/1.3689227, 2012.
Wang, M., Kong, W., Marten, R., He, X.-C., Chen, D., Pfeifer, J., Heitto, A., Kontkanen, J., Dada, L., Kuerten, A., Yli-Juuti, T., Manninen, H. E., Amanatidis, S., Amorim, A., Baalbaki, R., Baccarini, A., Bell, D. M., Bertozzi, B., Braekling, S., Brilke, S., Murillo, L. C., Chiu, R., Chu, B., De Menezes, L.-P., Duplissy, J., Finkenzeller, H., Carracedo, L. G., Granzin, M., Guida, R., Hansel, A., Hofbauer, V., Krechmer, J., Lehtipalo, K., Lamkaddam, H., Lampimaki, M., Lee, C. P., Makhmutov, V., Marie, G., Mathot, S., Mauldin, R. L., Mentler, B., Mueller, T., Onnela, A., Partoll, E., Petaja, T., Philippov, M., Pospisilova, V., Ranjithkumar, A., Rissanen, M., Rorup, B., Scholz, W., Shen, J., Simon, M., Sipila, M., Steiner, G., Stolzenburg, D., Tham , Y. J., Tome, A., Wagner, A. C., Wang, D. S., Wang, Y., Weber, S. K., Winkler, P. M., Wlasits, P. J., Wu, Y., Xiao, M., Ye, Q., Zauner-Wieczorek, M., Zhou, X., Volkamer, R., Riipinen, I., Dommen, J., Curtius, J., Baltensperger, U., Kulmala, M., Worsnop, D. R., Kirkby, J., Seinfeld, J. H., El-Haddad, I., Flagan, R. C., and Donahue, N. M.: Rapid growth of new atmospheric particles by nitric acid and ammonia condensation, Nature, 581, 184–189, https://doi.org/10.1038/s41586-020-2270-4, 2020.
Weber, R. J., McMurry, P. H., Eisele, F. L., and Tanner, D. J.: Measurement of expected nucleation precursor species and 3-500-nm diameter particles at Mauna Loa observatory, Hawaii, J. Atmos. Sci., 52, 2242–2257, 1995.
Wiedensohler, A., Birmili, W., Nowak, A., Sonntag, A., Weinhold, K., Merkel, M., Wehner, B., Tuch, T., Pfeifer, S., Fiebig, M., Fjäraa, A. M., Asmi, E., Sellegri, K., Depuy, R., Venzac, H., Villani, P., Laj, P., Aalto, P., Ogren, J. A., Swietlicki, E., Williams, P., Roldin, P., Quincey, P., Hüglin, C., Fierz-Schmidhauser, R., Gysel, M., Weingartner, E., Riccobono, F., Santos, S., Grüning, C., Faloon, K., Beddows, D., Harrison, R., Monahan, C., Jennings, S. G., O'Dowd, C. D., Marinoni, A., Horn, H.-G., Keck, L., Jiang, J., Scheckman, J., McMurry, P. H., Deng, Z., Zhao, C. S., Moerman, M., Henzing, B., de Leeuw, G., Löschau, G., and Bastian, S.: Mobility particle size spectrometers: harmonization of technical standards and data structure to facilitate high quality long-term observations of atmospheric particle number size distributions, Atmos. Meas. Tech., 5, 657–685, https://doi.org/10.5194/amt-5-657-2012, 2012.
Yan, C., Dada, L., Rose, C., Jokinen, T., Nie, W., Schobesberger, S., Junninen, H., Lehtipalo, K., Sarnela, N., Makkonen, U., Garmash, O., Wang, Y., Zha, Q., Paasonen, P., Bianchi, F., Sipilä, M., Ehn, M., Petäjä, T., Kerminen, V.-M., Worsnop, D. R., and Kulmala, M.: The role of H2SO4-NH3 anion clusters in ion-induced aerosol nucleation mechanisms in the boreal forest, Atmos. Chem. Phys., 18, 13231–13243, https://doi.org/10.5194/acp-18-13231-2018, 2018.
Yao, L., Garmash, O., Bianchi, F., Zheng, J., Yan, C., Kontkanen, J., Junninen, H., Mazon, S. B., Ehn, M., Paasonen, P., Sipilä, M., Wang, M., Wang, X., Xiao, S., Chen, H., Lu, Y., Zhang, B., Wang, D., Fu, Q., Geng, F., Li, L., Wang, H., Qiao, L., Yang, X., Chen, J., Kerminen, V.-M., Petäjä, T., Worsnop, D. R., Kulmala, M., and Wang, L.: Atmospheric new particle formation from sulfuric acid and amines in a Chinese megacity, Science, 361, 278–281, https://doi.org/10.1126/science.aao4839, 2018.