the Creative Commons Attribution 4.0 License.
the Creative Commons Attribution 4.0 License.
 | 18 Nov 2021
What rainfall rates are most important to wet removal of different aerosol types?
Yong Wang
Wenwen Xia
Guang J. Zhang
Both frequency and intensity of rainfall affect aerosol wet deposition. With a stochastic deep convection scheme implemented into two state-of-the-art global climate models (GCMs), a recent study found that aerosol burdens are increased globally by reduced climatological mean wet removal of aerosols due to suppressed light rain. Motivated by their work, a novel approach is developed in this study to detect what rainfall rates are most efficient for wet removal (scavenging amount mode) of different aerosol species of different sizes in GCMs and applied to the National Center for Atmospheric Research Community Atmosphere Model version 5 (CAM5) with and without the stochastic convection cases. Results show that in the standard CAM5, no obvious differences in the scavenging amount mode are found among different aerosol types. However, the scavenging amount modes differ in the Aitken, accumulation and coarse modes, showing around 10–12, 8–9 and 7–8 mm d−1, respectively, over the tropics. As latitude increases poleward, the scavenging amount mode in each aerosol mode is decreased substantially. The scavenging amount mode is generally smaller over land than over ocean. With stochastic convection, the scavenging amount mode for all aerosol species in each mode is systematically increased, which is the most prominent along the Intertropical Convergence Zone, exceeding 20 mm d−1 for small particles. The scavenging amount modes in the two cases are both smaller than individual rainfall rates associated with the most accumulated rain (rainfall amount mode), further implying precipitation frequency is more important than precipitation intensity for aerosol wet removal. The notion of the scavenging amount mode can be applied to other GCMs to better understand the relation between rainfall and aerosol wet scavenging, which is important to better simulate aerosols.
- Article
(17771 KB) - Full-text XML
- BibTeX
- EndNote


Wet deposition through scavenging by rainfall is an important sink for atmospheric aerosols and soluble gases (Atlas and Giam, 1988; Radke et al., 1980). A correlation between the total rainfall amount or rainfall intensity and air pollution has been documented in many studies (Cape et al., 2012; Pye et al., 2009; Tai et al., 2012). For instance, Dawson et al. (2007) found a strong sensitivity of concentrations of the particulate matter with a diameter less than 2.5 µm (PM2.5) to rainfall intensity over a large region of the eastern United States from sensitivity tests using a regional numerical model. Besides precipitation intensity, precipitation frequency also influences aerosol wet deposition. In the Geophysical Fluid Dynamics Laboratory (GFDL) chemistry-climate model AM3, Fang et al. (2011) found wet scavenging has a stronger spatial correlation with rainfall frequency than intensity over the United States in January. Mahowald et al. (2011) explored the role of precipitation frequency in dust wet deposition based on model simulations and noted the frequency of precipitation rather than the amount of precipitation controls the fraction of dust wet vs. dry deposition outside dust source regions.
Hou et al. (2018) investigated the sensitivity of wet scavenging of black carbon (BC) to precipitation intensity and frequency in the Goddard Earth Observing System Chemistry (GEOS-Chem) model. The frequency and intensity of precipitation from the GEOS-5 run were used to drive the GEOS-Chem. With the sensitivity tests, by artificially perturbating precipitation frequency and intensity, they found that the deposition efficiency and hence the lifetime of BC have higher sensitivities to rainfall frequencies than to rainfall intensities. Even with the same mean total rainfall, a different combination of precipitation intensity and frequency results in different removal efficiency of BC. Although these studies investigate the impacts of precipitation intensity and frequency on aerosol wet removal, it is not clear yet what rainfall rates contribute the most to aerosol wet deposition climatologically.
Wang et al. (2021a) recently found that the frequency of total rainfall in the range from 1 to 20 mm d−1 plays a critical role in regulating the annual mean wet deposition rates of aerosols, especially over the tropics and subtropics. By suppressing the too frequent occurrence of convection in this rainfall intensity range with the introduction of a stochastic deep convection scheme (Wang et al., 2016), the aerosol burdens in two global climate models (GCMs) were significantly increased, with the simulated aerosol optical depth (AOD) agreeing better with observations. Based on their work, several interesting questions on the relation between rainfall and aerosol wet removal can be asked. (1) Climatologically, what rain rates have the highest efficiency in removing atmospheric aerosols? (2) How much does convective and large-scale precipitation contribute to it? (3) For different aerosol types and sizes, does the rain rate most efficient in washing out aerosols differ? (4) Also, does it differ over different latitudes and continents/oceans?
To address these questions, this study develops a novel approach to identify the rainfall intensity associated with the most efficient aerosol wet scavenging and applies it to different aerosol species at different aerosol sizes in the NCAR CAM5. The paper is organized as follows. Section 2 presents the gist of the stochastic deep convection scheme, the CAM5 model and the associated treatment of aerosol wet scavenging, experiments, observations and methods. In Sect. 3, precipitation characteristics, especially for the amount distributions (defined by daily cumulative rainfall), in two simulations are presented first and evaluated with observations. With distinct precipitation features (e.g., frequency and amount) in two simulations, their aerosol wet deposition features and mass concentrations are shown. Discussion and conclusions are given in Sect. 4.
2.1 Stochastic deep convection scheme
The stochastic deep convection parameterization is based on the Plant and Craig (PC) scheme (Plant and Craig, 2008), with modifications to make it suitable for GCMs when incorporated into the Zhang–McFarlane (ZM) deterministic deep convection scheme (Zhang and McFarlane, 1995). In the PC scheme, the probability of launching one convective cloud is given by
where denotes the average number of clouds with mass flux between m and m+dm; , with a value of 1×10⁷ kg s−1, is the ensemble mean mass flux of a cloud; and , with being the ensemble mean total cloud mass flux given by the closure in the ZM deterministic parameterization) is the ensemble mean number of convective clouds in a given GCM grid box. For each mass flux bin, whether to launch a cloud is determined by comparing the probability from Eq. (1) with a random number uniformly generated between zero and 1. A detailed description of the modifications to the PC scheme for the incorporation with the ZM scheme in climate models is provided in Wang et al. (2016).
2.2 Model and simulations
This study uses the National Center for Atmospheric Research (NCAR) Community Atmosphere Model version 5.3 (CAM5.3). As the atmosphere model of the NCAR CESM, CAM5.3 in a standard configuration has a vertical resolution of 30 levels from the surface to 3.6 hPa and a horizontal resolution of using a finite-volume dynamical core. Deep convection is parameterized using the ZM scheme with a dilute convective available potential energy (CAPE) modification by Neale et al. (2008), while the shallow convection scheme uses Park and Bretherton (2009). The Bretherton and Park (2009) moist turbulence parameterization is used to present the stratus–radiation–turbulence interactions. The Morrison and Gettelman (2008) (MG) scheme is for large-scale stratiform cloud microphysics. The radiative transfer calculations are based on the Rapid Radiative Transfer Model (RRTM) (Iacono et al., 2008). The properties and process of major aerosol species (sulfate, mineral dust, sea salt, primary organic matter, secondary organic aerosol and black carbon) are treated in the modal aerosol module (MAM) in which distributions of aerosol size are represented by three lognormal modes (MAM3): Aitken, accumulation and coarse modes (Liu et al., 2012). The number mixing ratio of each mode and the associated mass mixing ratios of aerosol types in each mode are predicted.
We use the CAM5.3 simulation output in Wang et al. (2021) for our analysis. The runs with the default ZM scheme (referred to as CAM5) and the stochastic deep convection scheme (referred to as STOC) (Plant and Craig, 2008; Wang et al., 2016) are Atmospheric Model Intercomparison Project (AMIP) type simulations with the present-day (PD) aerosol emission scenario. The prescribed present-day seasonally varying climatological (averaged over 1982–2001) sea surface temperatures (SSTs) and sea ice extent (recycled yearly) force the two simulations, which are run for 6 years, and the last 5 years are used for analysis.
2.3 Treatment of aerosol wet scavenging
In CAM5, aerosol wet removal consists of in-cloud scavenging and sub-cloud scavenging, both of which are treated by the aerosol wet removal module (Liu et al., 2012). For in-cloud scavenging in stratiform clouds, the large-scale precipitation production rates (kg kg−1 s−1) and cloud water mixing ratios (kg kg−1) are used to calculate first-order loss rates (s−1) for cloud water (the rate at which cloud condensate is converted to precipitation within the cloud). These cloud-water first-order loss rates are multiplied by “wet removal adjustment factors” (or tuning factors) to obtain aerosol first-order loss rates, which are applied to activated aerosols within the non-ice cloudy fractions of a grid cell (i.e., cloudy fractions that contain some cloud water). The stratiform in-cloud wet scavenging only affects the explicitly treated stratiform-cloud-borne aerosol particles (i.e., aerosols in cloud droplets) which are assumed to not interact with convective clouds, and the adjustment factor of 1.0 is currently used. It does not affect the interstitial aerosol particles (i.e., aerosols suspended in clear or cloudy air). In-cloud scavenging in ice clouds (i.e., clouds with no liquid water) is not treated. Cloud-borne particles are treated explicitly, and activation is calculated with the parameterization of Abdul-Razzak and Ghan (2000), in which larger and more hydrophilic aerosol particles are easier to nucleate into cloud droplets to form precipitation.
For convective in-cloud scavenging, including shallow and deep convection, cloud fractional area, in-cloud cloud condensate mixing ratio and grid-cell mean convective precipitation production are used to calculate first-order loss rates (s−1) for cloud water. Unlike the stratiform cloud-borne aerosol particles, the convective-cloud-borne aerosol particles are not treated explicitly, but derived by (lumped interstitial aerosols) × (convective cloud activation fraction), thus only affecting the grid-cell mean interstitial aerosols. The convective cloud activation is a prescribed parameter that varies with aerosol mode and species. For example, according to different hydrophilic properties, 0.4 and 0.8 are applied to dust and sea salt in coarse mode, and a weighted average is applied to the coarse-mode sulfate and number. Similarly, these cloud-water first-order loss rates are multiplied by “wet removal adjustment factors” to obtain aerosol first-order loss rates. Here, the wet removal adjustment factor for convective clouds is set to 0.4 to avoid too much wet removal produced by convection.
For below-cloud scavenging of the interstitial aerosol, the aerosol first-order removal rate is equal to the product (scavenging coefficient) × (precipitation rate). The large-scale precipitation rate is for stratiform clouds while the convective precipitation rate is for convective clouds. The scavenging coefficient is calculated using the continuous collection equation (e.g., Eq. 2 of Wang et al., 2010), in which the rate of collection of a single aerosol particle by a single rain droplet is integrated over their size distributions, at a precipitation rate of 1 mm h−1. Collection efficiencies from Slinn (1984) and a Marshall–Palmer precipitation size distribution are assumed. The scavenging coefficient varies strongly with aerosol particle size, with the lowest values for aerosols in the accumulation mode. There is no below-cloud scavenging of stratiform-cloud-borne aerosol.
2.4 Methods
Both precipitation frequency and intensity contribute to the rainfall amount. Wang et al. (2016, 2021a) show that the occurrence frequency of observed and simulated precipitation varies with precipitation intensity largely following exponential functions. Therefore, using a log-linear coordinate system to examine the contribution from each rainfall interval will allow an easier comparison among different rainfall intensity ranges. The amount contributions from different rainfall rates to the total rainfall amount can be described using the following form (Pendergrass and Hartmann, 2014; Kooperman et al., 2018):
where i is the bin index; r is the daily rain rate; k is a summation index, representing an arbitrary day within the NT days; and Ri is the rainfall bin center with bounds and which is logarithmically spaced covering 4 orders of magnitude of rainfall intensity from 0.1 to 1000 mm d−1. The bin width is set to , meaning that the bin interval is of the center value (R). NT is the total number of days, and I is a binary operator that has a value of 1 within the rainfall bin of interest and 0 outside. Thus, P(Ri) is the amount contribution to the total precipitation amount by the rainfall rates centered at Ri. Graphically, the area under the curve of P in a log-linear plot gives the total amount of mean precipitation. Similarly, within the total precipitation rate bin centered at Ri, the contributions from convective (PC) and large-scale (PL) precipitation are given, respectively, by
where rC and rL are the convective and large-scale rainfall contributions, respectively, to the total rainfall within the bin rk.
Note that Eqs. (3) and (4) are different from those used in previous studies (e.g., O'Brien et al., 2016; Wang et al., 2021a), where the rainfall bin used for occurrence count is specified using convective and large-scale rainfall separately. The use of total precipitation to define the rainfall bin has the advantage of allowing us to derive partitioned frequency distributions conditioned on total precipitation rates.
A similar approach can be used to relate the wet removal of aerosols to rainfall intensity. The amount distribution of wet removal (W) for a given aerosol type under different rainfall intensity is calculated at each model grid point before area-weighted averaging over regions of interest:
where d is the daily wet deposition rate for a given aerosol type, including in- and below-cloud wet deposition fluxes from both convective and stratiform clouds. Akin to the amount distribution of precipitation, the amount distribution of aerosol wet scavenging graphically depicts how much accumulated wet deposition is produced by different rain rates, where the area under the distribution is the total mean wet deposition rate. The rainfall intensity band that contributes the most to the total rainfall or aerosol wet scavenging will be referred to as the rainfall or scavenging amount mode, respectively.
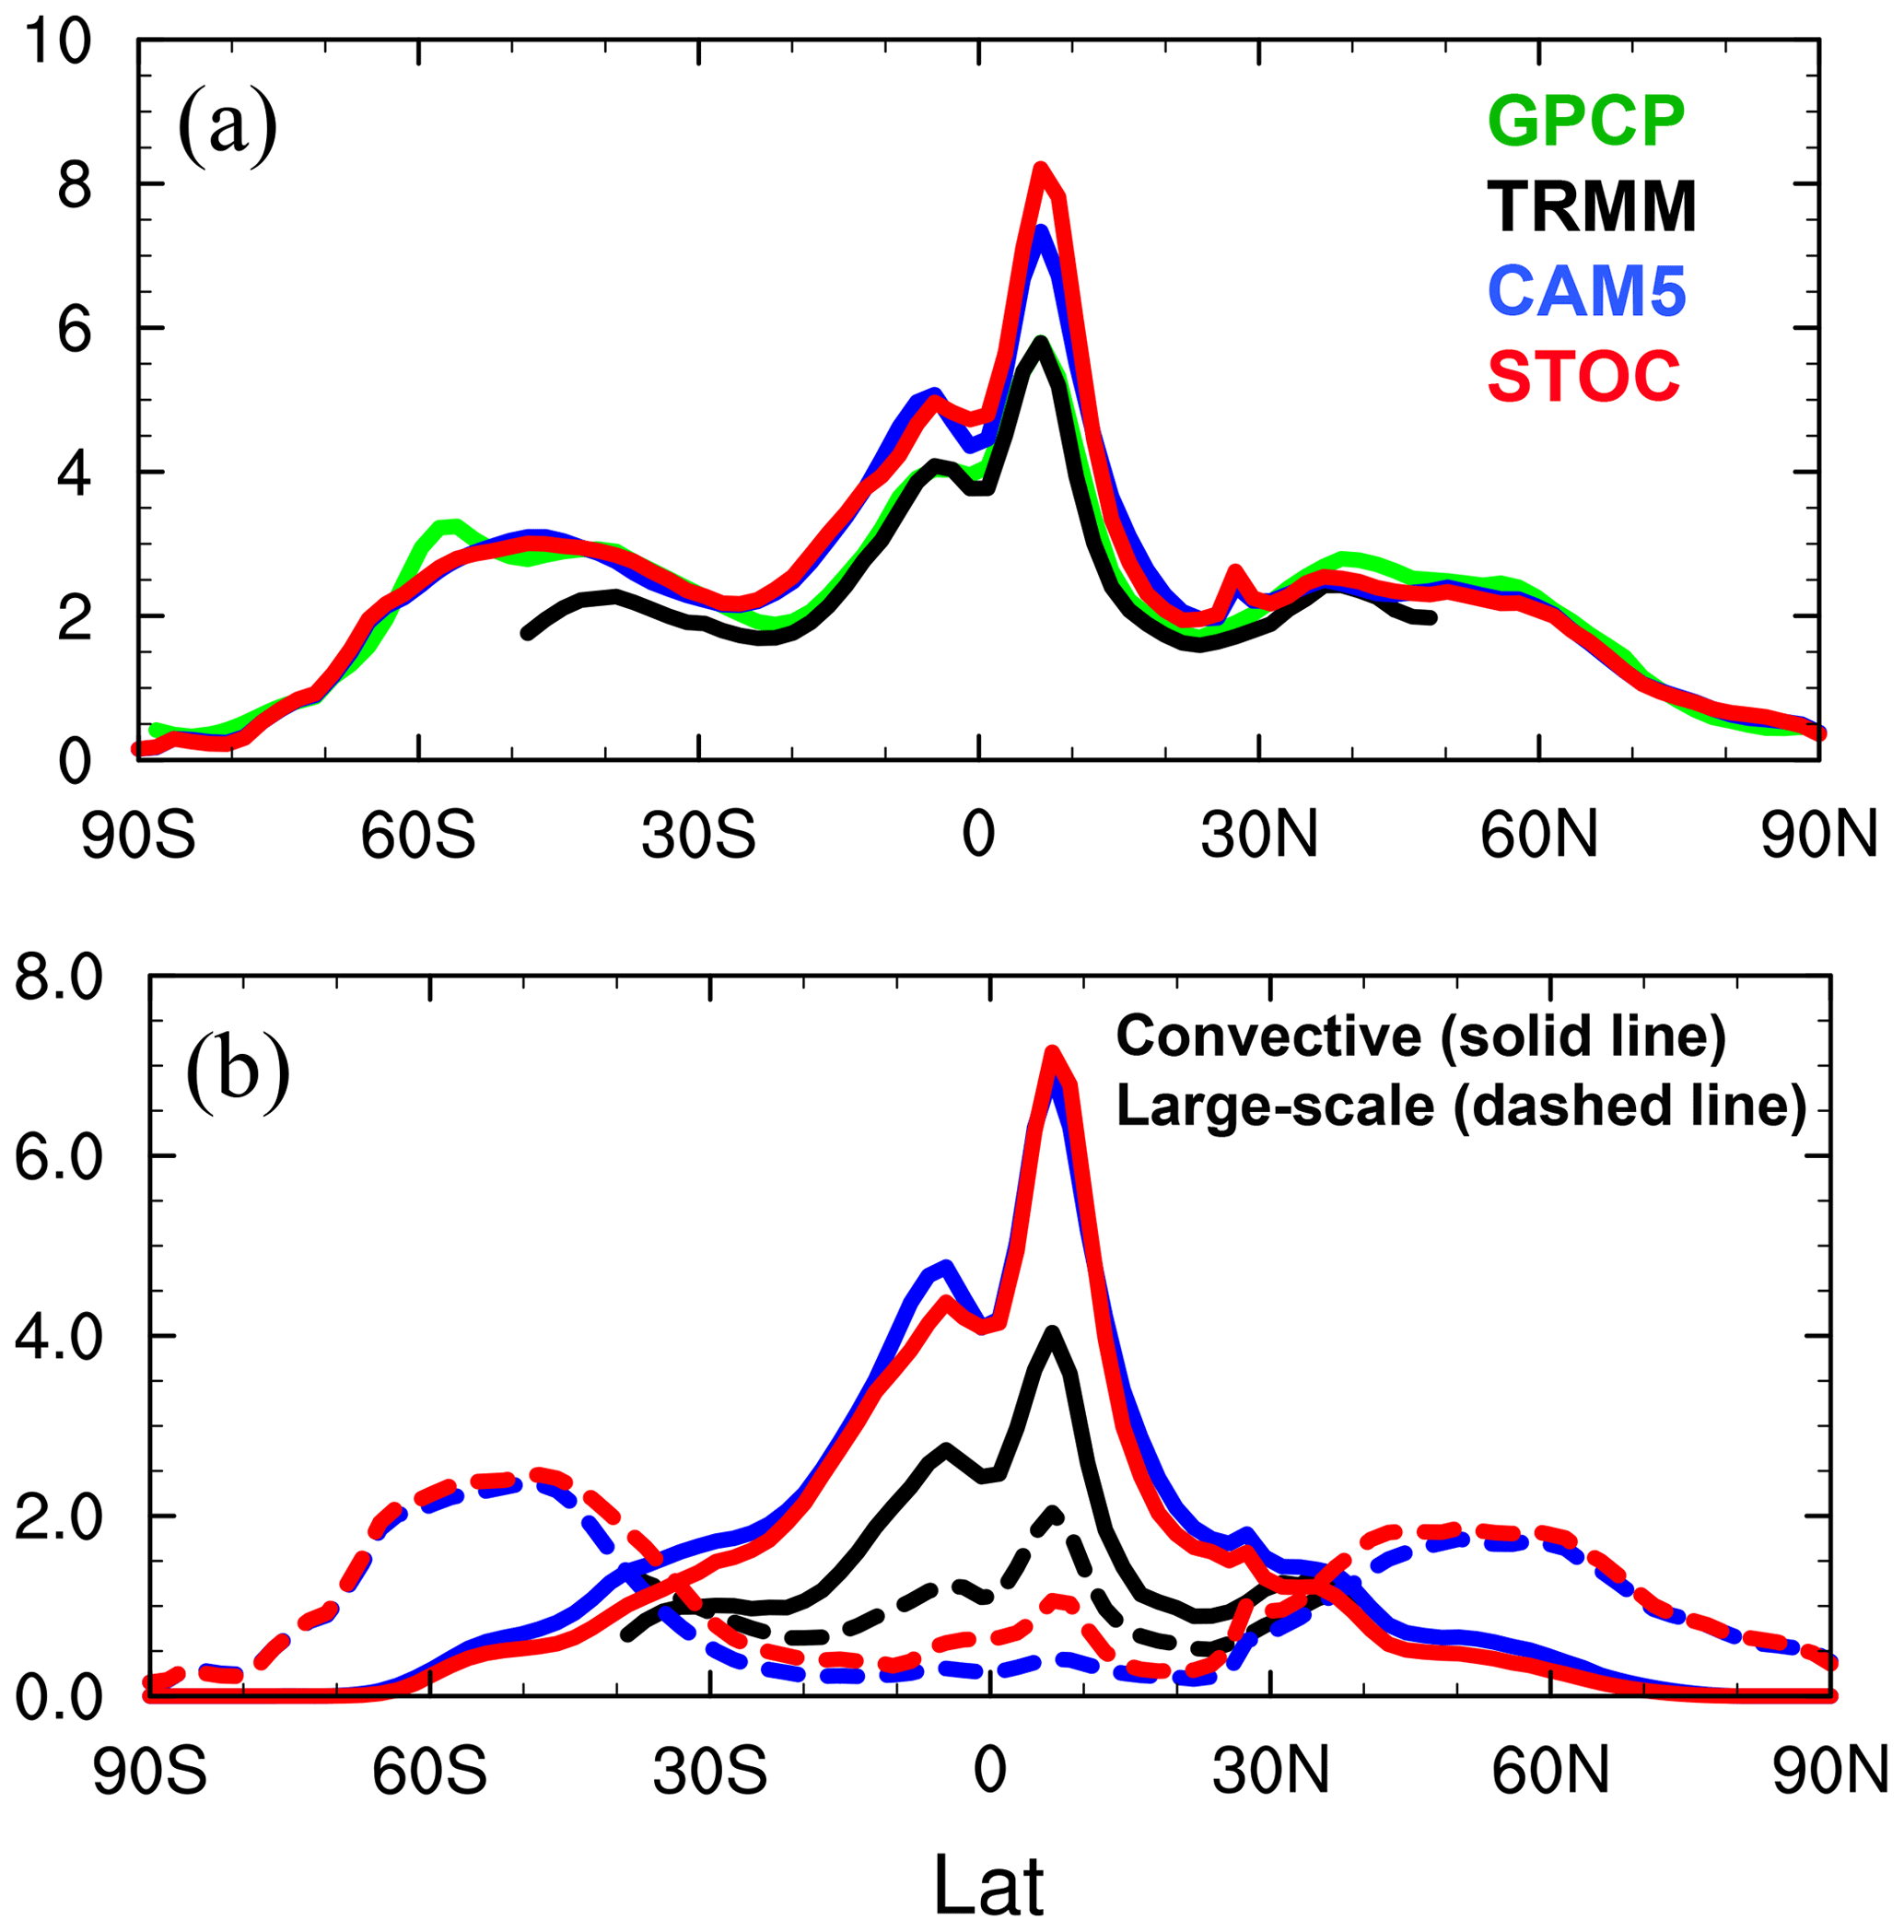
Figure 1Zonal mean (a) total (solid line), (b) convective (solid line) and large-scale (dashed line) precipitation in CAM5 (blue), STOC (red) and TRMM (black). Zonal mean total rain in GPCP (green) is also shown.
With Eq. (5), the combined impacts of frequency and intensity of rainfall on the wet deposition of aerosols are included. The rainfall intensity associated with the peak amount of wet removal can be determined accordingly, telling us what precipitation intensity is most efficient in removing aerosols from the atmosphere. Applying it to different aerosol types in different aerosol size modes, individual precipitation intensity most effective in aerosol scavenging is obtained.
The amount distribution of total wet removal of aerosols under different total precipitation intensity can be further decomposed into contributions of wet deposition fluxes from convective and stratiform clouds, respectively, similar to the decomposition of precipitation amount:
where dC and dL are the daily wet deposition rates from convective and stratiform clouds, respectively. Thus, for each precipitation bin, the sum of wet removal from convective clouds (WC) and that from stratiform clouds (WL) is equal to the total wet deposition rate (W). As a result, the fractional contribution of aerosol wet scavenging from individual cloud processes (i.e., and can be obtained.
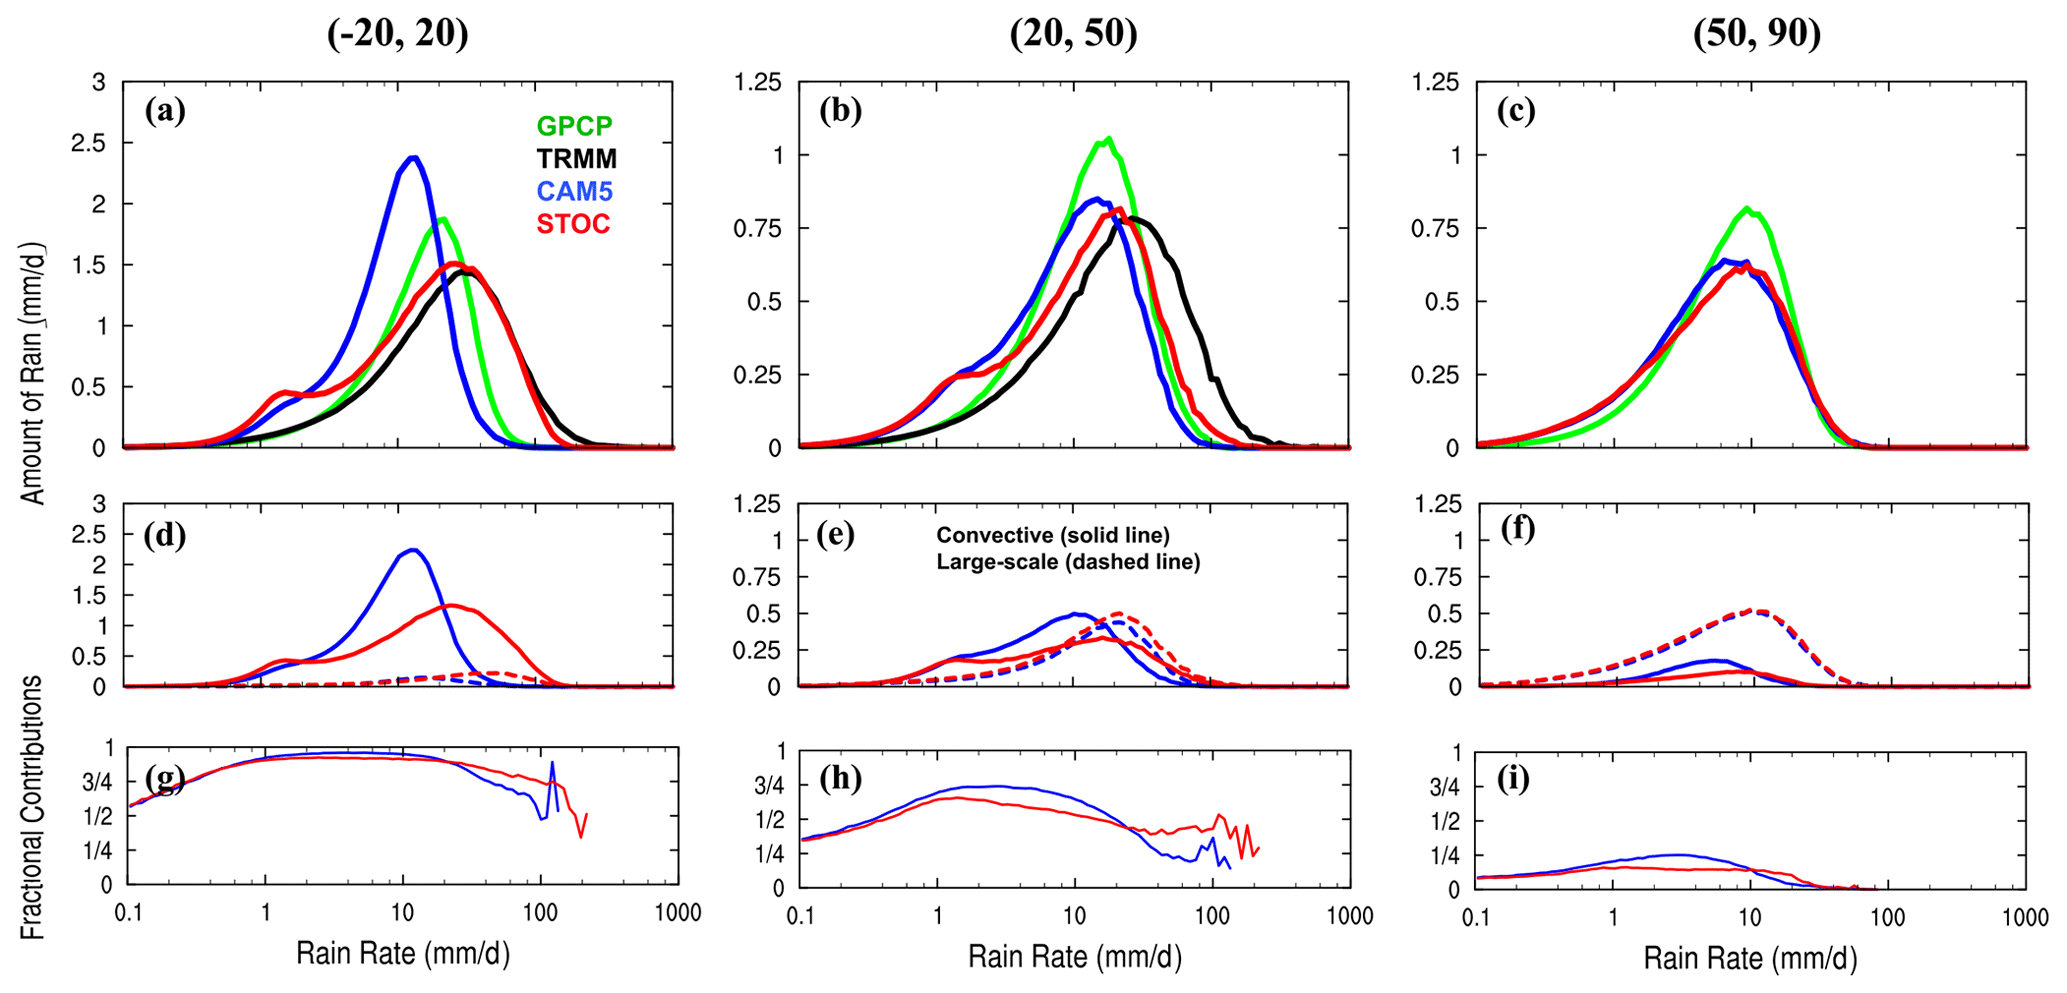
Figure 2Amount distributions of (a–c) total, (d–f) convective and large-scale precipitation and (g–i) fractional contributions of convective precipitation to total precipitation over (a, d, g) 20∘ S, 20∘ N, (b, e, h) 20, 50∘ N and (c, f, i) 50, 90∘ N. Total rainfall amounts are shown for CAM5 (blue), STOC (red), GPCP (green) and TRMM (black) while convective (solid line) and large-scale (dashed line) rainfall amounts and the fractional contributions of convective precipitation are shown for CAM5 and STOC. The amount distributions (units: mm d−1) are scaled by , which has units of mm d−1/mm d−1 and is a unitless scaling term.
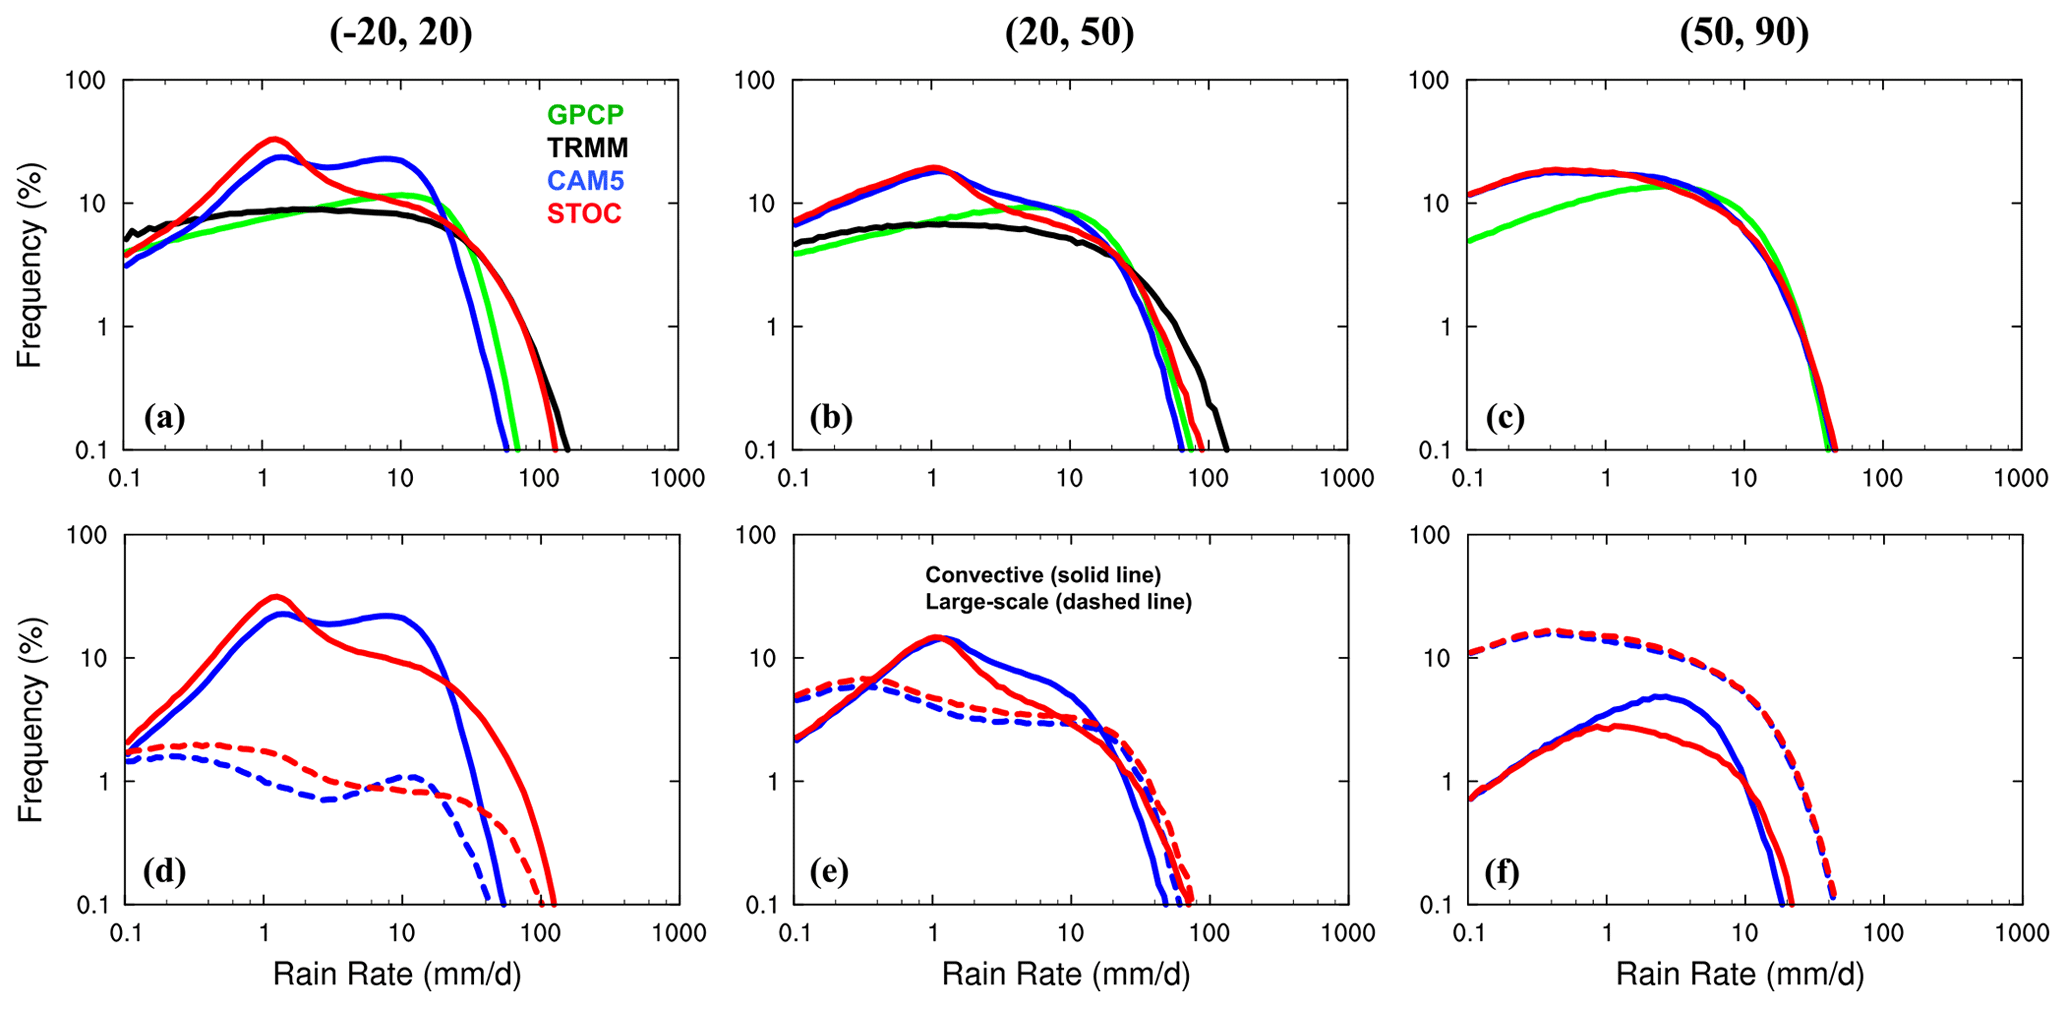
Figure 3Frequency distributions of (a–c) total and (d–f) convective and large-scale precipitation, over (a, d) 20∘ S, 20∘ N, (b, e) 20, 50∘ N and (c, f) 50, 90∘ N. Total rainfall frequency distributions are shown for CAM5 (blue), STOC (red), GPCP (green) and TRMM (black) while convective (solid line) and large-scale (dashed line) rainfall frequency distributions are shown for CAM5 and STOC. The frequency distributions (units: %) are scaled by , which has units of mm d−1/mm d−1 and is a unitless scaling term.
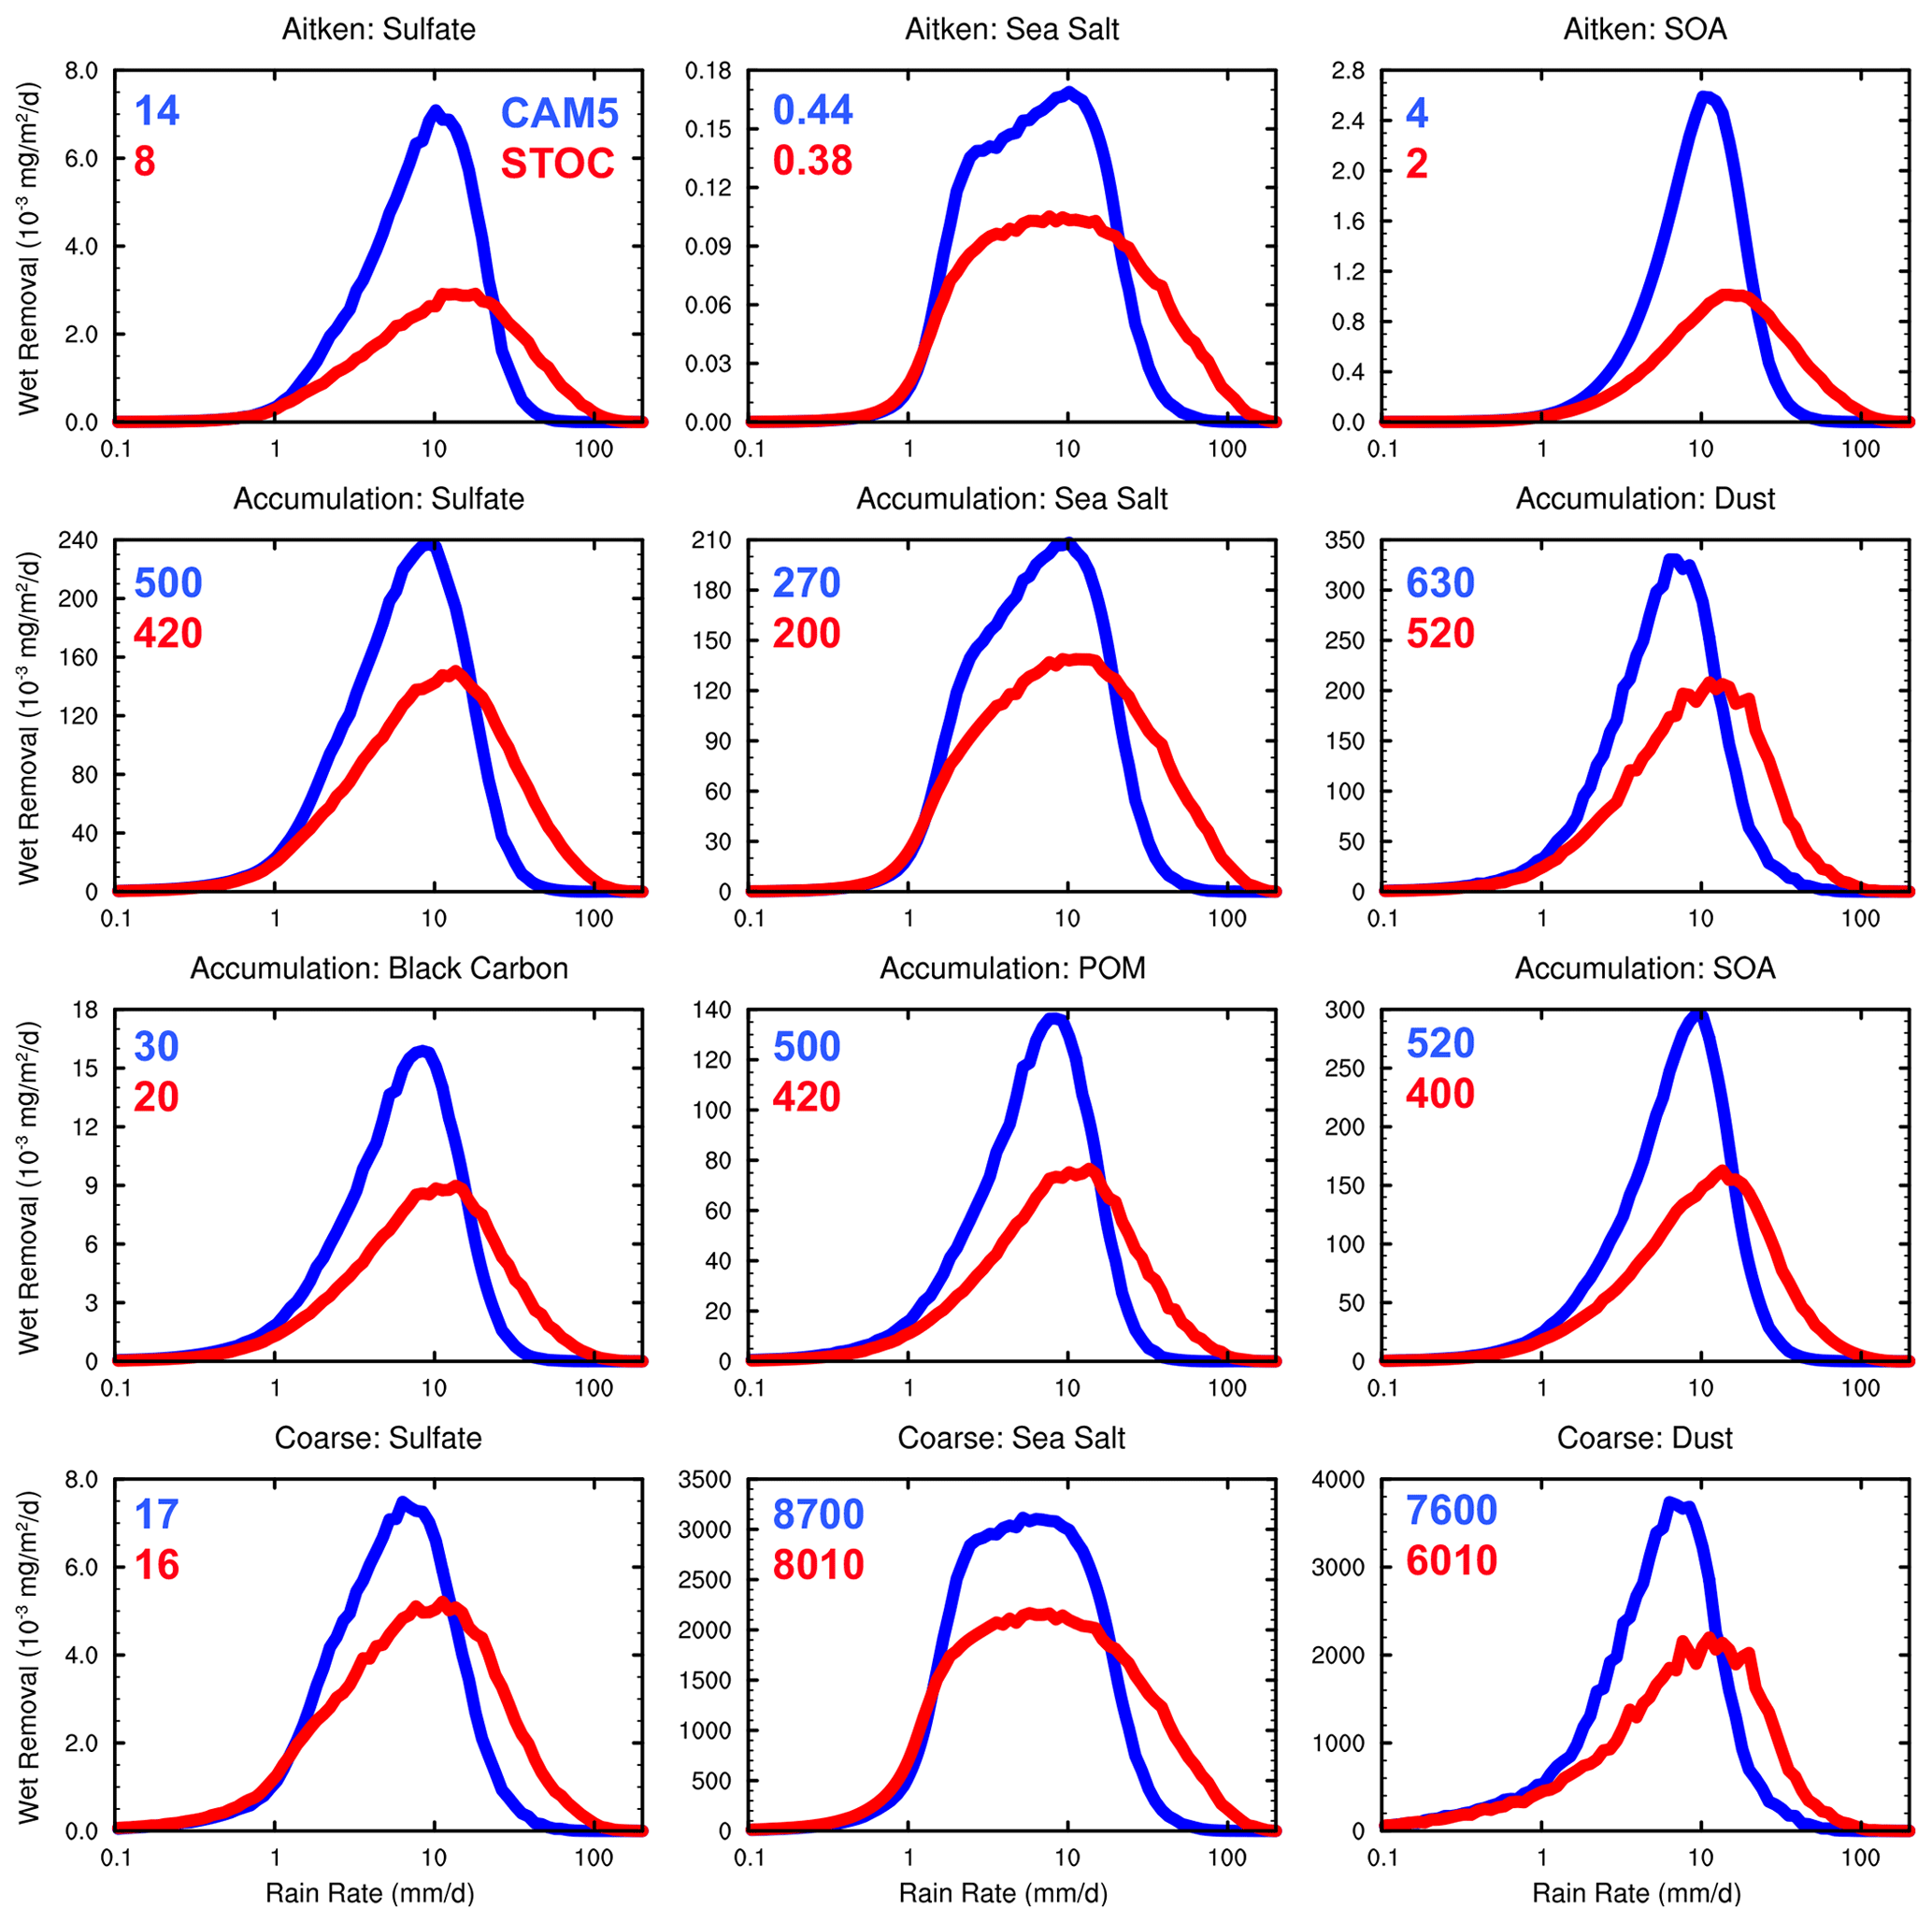
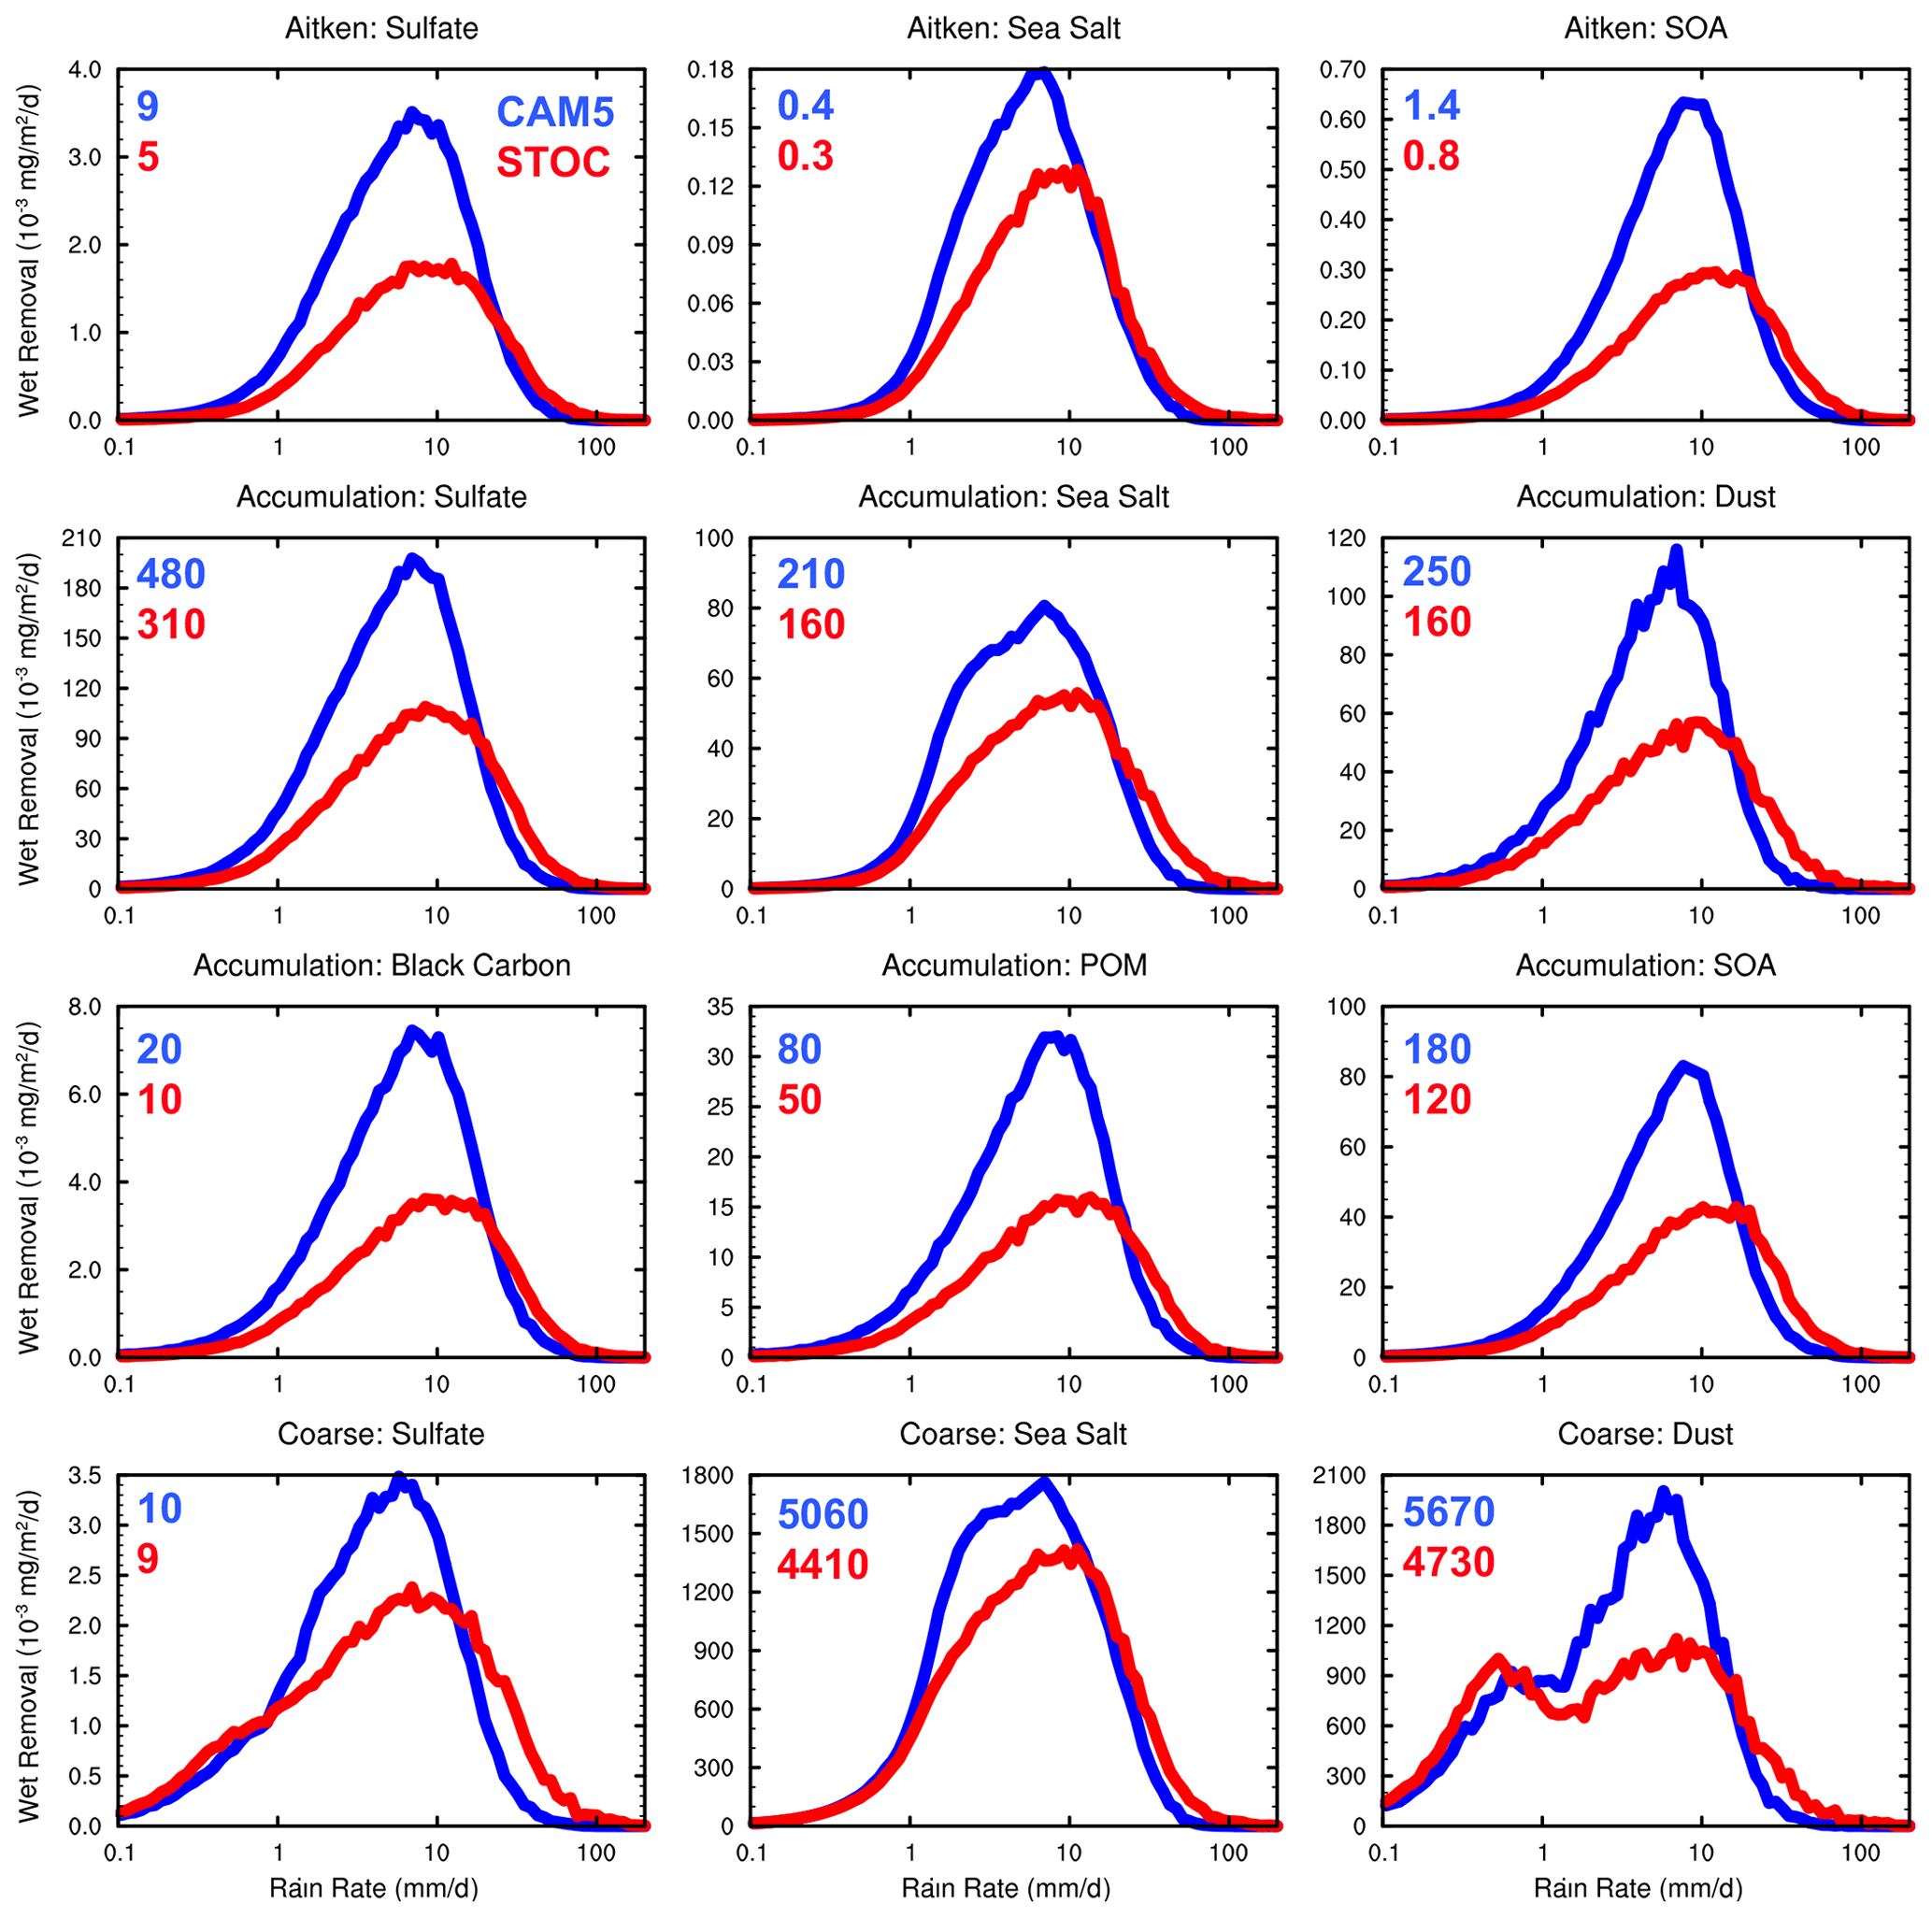
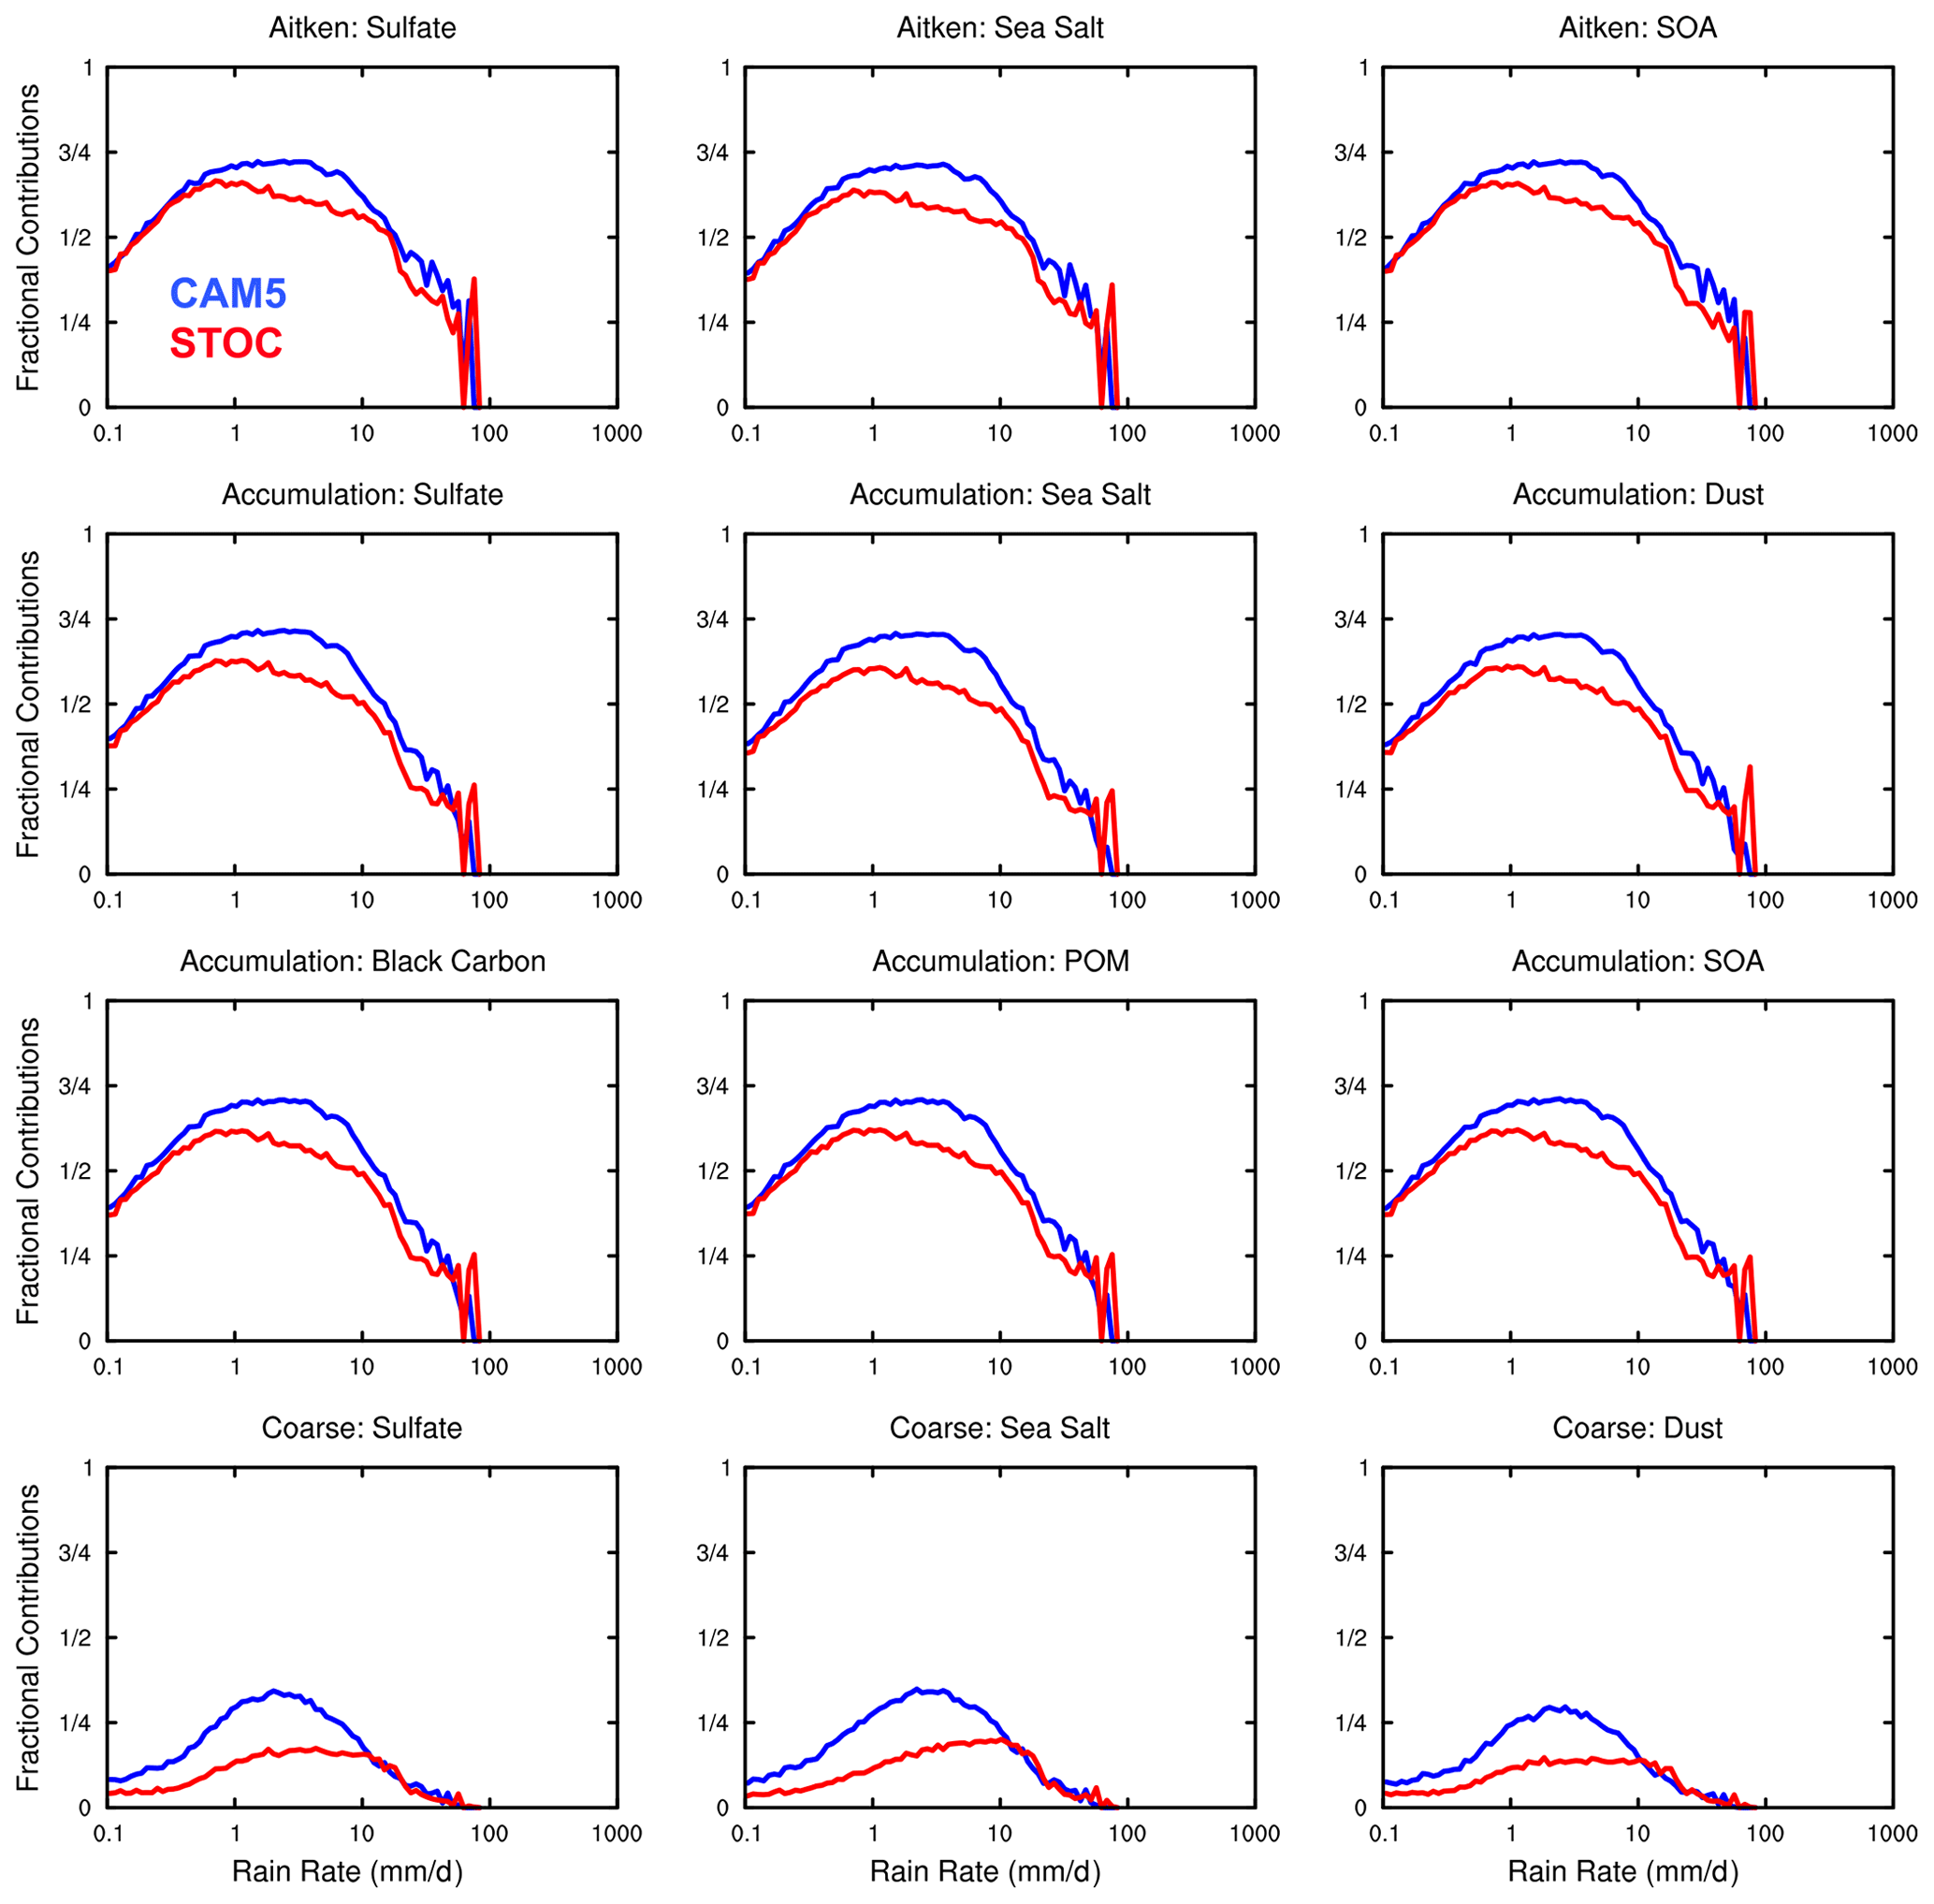
Figure 4Amount distributions of wet removal of aerosols (units: mg/m2/day) over 20∘ S, 20∘ N in CAM5 (blue) and STOC (red) runs. The distributions are scaled by , which has units of mm d−1/mm d−1 and is a unitless scaling term. Numbers in each subplot are regional mean wet deposition rates in two simulations. Note that the y-axis range for each frame is different.
2.5 Observations
The precipitation characteristics in the two simulations are evaluated with observations. Among them, the total rainfall mean state is evaluated against the Global Precipitation Climatology Project (GPCP) monthly product (version 2.1) at a resolution of 2.5∘ (Adler et al., 2003) and the Tropical Rainfall Measuring Mission (TRMM) 3B43 monthly observations at a resolution of 1∘ over 50∘ S, 50∘ N (Huffman et al., 2012a), while the TRMM 3A12 monthly observations at a resolution of 0.5∘ (Huffman et al., 2007) are used to evaluate the mean convective and large-scale precipitation. In TRMM 3A12 observations, convective and stratiform (i.e., large-scale) precipitation is classified using the brightness temperatures measured by the TRMM Microwave Imager (TMI) radiometer. This is because the local horizontal gradients of brightness temperatures are different in regions with convective and stratiform precipitation. The former is usually characterized by strong gradients of brightness temperature due to large horizontal variations in liquid and ice-phase precipitation, whereas the latter usually has fewer fluctuations of brightness temperature due to relatively weak and uniform updrafts and downdrafts (Kummerow et al., 2001). Although the definitions of convective and large-scale precipitation are not exactly the same between TRMM 3A12 and model simulation, the modeled convective and large-scale (stratiform) precipitation can still be roughly evaluated by using the TRMM 3A12 observations (e.g., Wang and Zhang, 2016; Ehsan et al., 2017; Qiu et al., 2020; Chen et al., 2021). A daily estimate of GPCP version 1.2 at 1∘ horizontal resolution (GPCP 1DD) (Huffman et al., 2001, 2012b) and the TRMM 3B42 version 7 daily observations at a resolution of 0.25∘ over 50∘ S, 50∘ N (Huffman et al., 2007) are used in the evaluation of the precipitation frequency and amount distribution. For the evaluation of AOD at 550 nm in model simulations, the Moderate Resolution Imaging Spectroradiometer (MODIS) satellite observations are used. To make a consistent comparison with the model simulations, observations are regridded to the same CAM5 grid points.
3.1 Precipitation
Figure 1 shows the latitudinal distributions of total, convective and large-scale precipitation in GPCP, TRMM, CAM5 and STOC. Overall, the total mean precipitation distributions in CAM5 and STOC runs are comparable, except over the northern tropics where the STOC run simulates mean rainfall slightly larger than the CAM5 run. In comparison with observations, the total precipitation in both simulations is overestimated in the tropics and subtropics while that in midlatitudes and high latitudes agrees well (Fig. 1a). The overestimated total precipitation over the tropics and subtropics in both simulations is dominantly from the overestimated convective precipitation (Fig. 1b). Nonetheless, compared to the extremely small large-scale rainfall contribution in the CAM5 run, the increased large-scale precipitation in the STOC run, though mainly contributing to the further increase in total precipitation in the northern tropics, results in a better agreement with the TRMM observations.

The distributions of total rainfall amount for GPCP, TRMM, CAM5 and STOC over the tropics (20∘ S, 20∘ N), subtropics and midlatitudes (20, 50∘ N), and high latitudes (50, 90∘ N) are shown in Fig. 2a–c. Over the tropics, the distribution in STOC exhibits more rainfall from more intense rain rate and less rainfall from light rain than that in CAM5; thus the rainfall amount mode in STOC (around 40 mm d−1) is much stronger than that in CAM5 (∼ 20 mm d−1), falling between the TRMM and GPCP observed rainfall amount mode (30–50 mm d−1) (Fig. 2a). The weak amount mode of total rainfall in CAM5 is controlled by convective precipitation rather than large-scale precipitation in terms of their respective distributions and fractional contributions at rain rates ranging from 1 to 20 mm d−1 (Fig. 2d and g) (Kooperman et al., 2018). In contrast, convective and large-scale rainfall in STOC both represent the observed amount mode of total rain. The shift of the total rainfall amount mode to a larger value in STOC is due to the increased (decreased) fractional contribution of convective precipitation at rain rates larger (smaller) than ∼ 20 mm d−1 (Fig. 2g). Over the subtropics and midlatitudes, the amount mode of total rainfall in CAM5 is comparable to that over the tropics (∼ 20 mm d−1). Again, compared with CAM5, the rainfall amount mode in the STOC run shifts rightward, better matching GPCP and TRMM observations (Fig. 2b). The representation of convective and large-scale precipitation for the observed amount mode of total rainfall in the two simulations is the same as that over the tropics except large-scale precipitation in CAM5 which represents the observed amount mode of total rain as well (Fig. 2e). In contrast to the tropics, the difference of the fractional contribution between large-scale and convective precipitation at rain rates between 1 and 20 mm d−1 in the CAM5 run is reduced due to the decreased convective and increased large-scale fractional contributions (75 % vs. 25 %) (Fig. 2h). With the introduction of the stochastic deep convection parameterization, the STOC run suppresses the sub-tropical and midlatitude convection, further decreasing their fractional contributions relative to CAM5. At rain rates larger than 20 mm d−1, although STOC enhances the fractional contribution of convection, large-scale precipitation, as in CAM5, still makes more contributions. Since large-scale precipitation dominates the total precipitation over high latitudes, the amount distributions of total rainfall are similar between the two simulations (Fig. 2c). Despite this, the amount of convective rainfall and the associated fractional contribution between 1 and 10 mm d−1 are reduced in the STOC run compared with that in the CAM5 run (Fig. 2f and i).
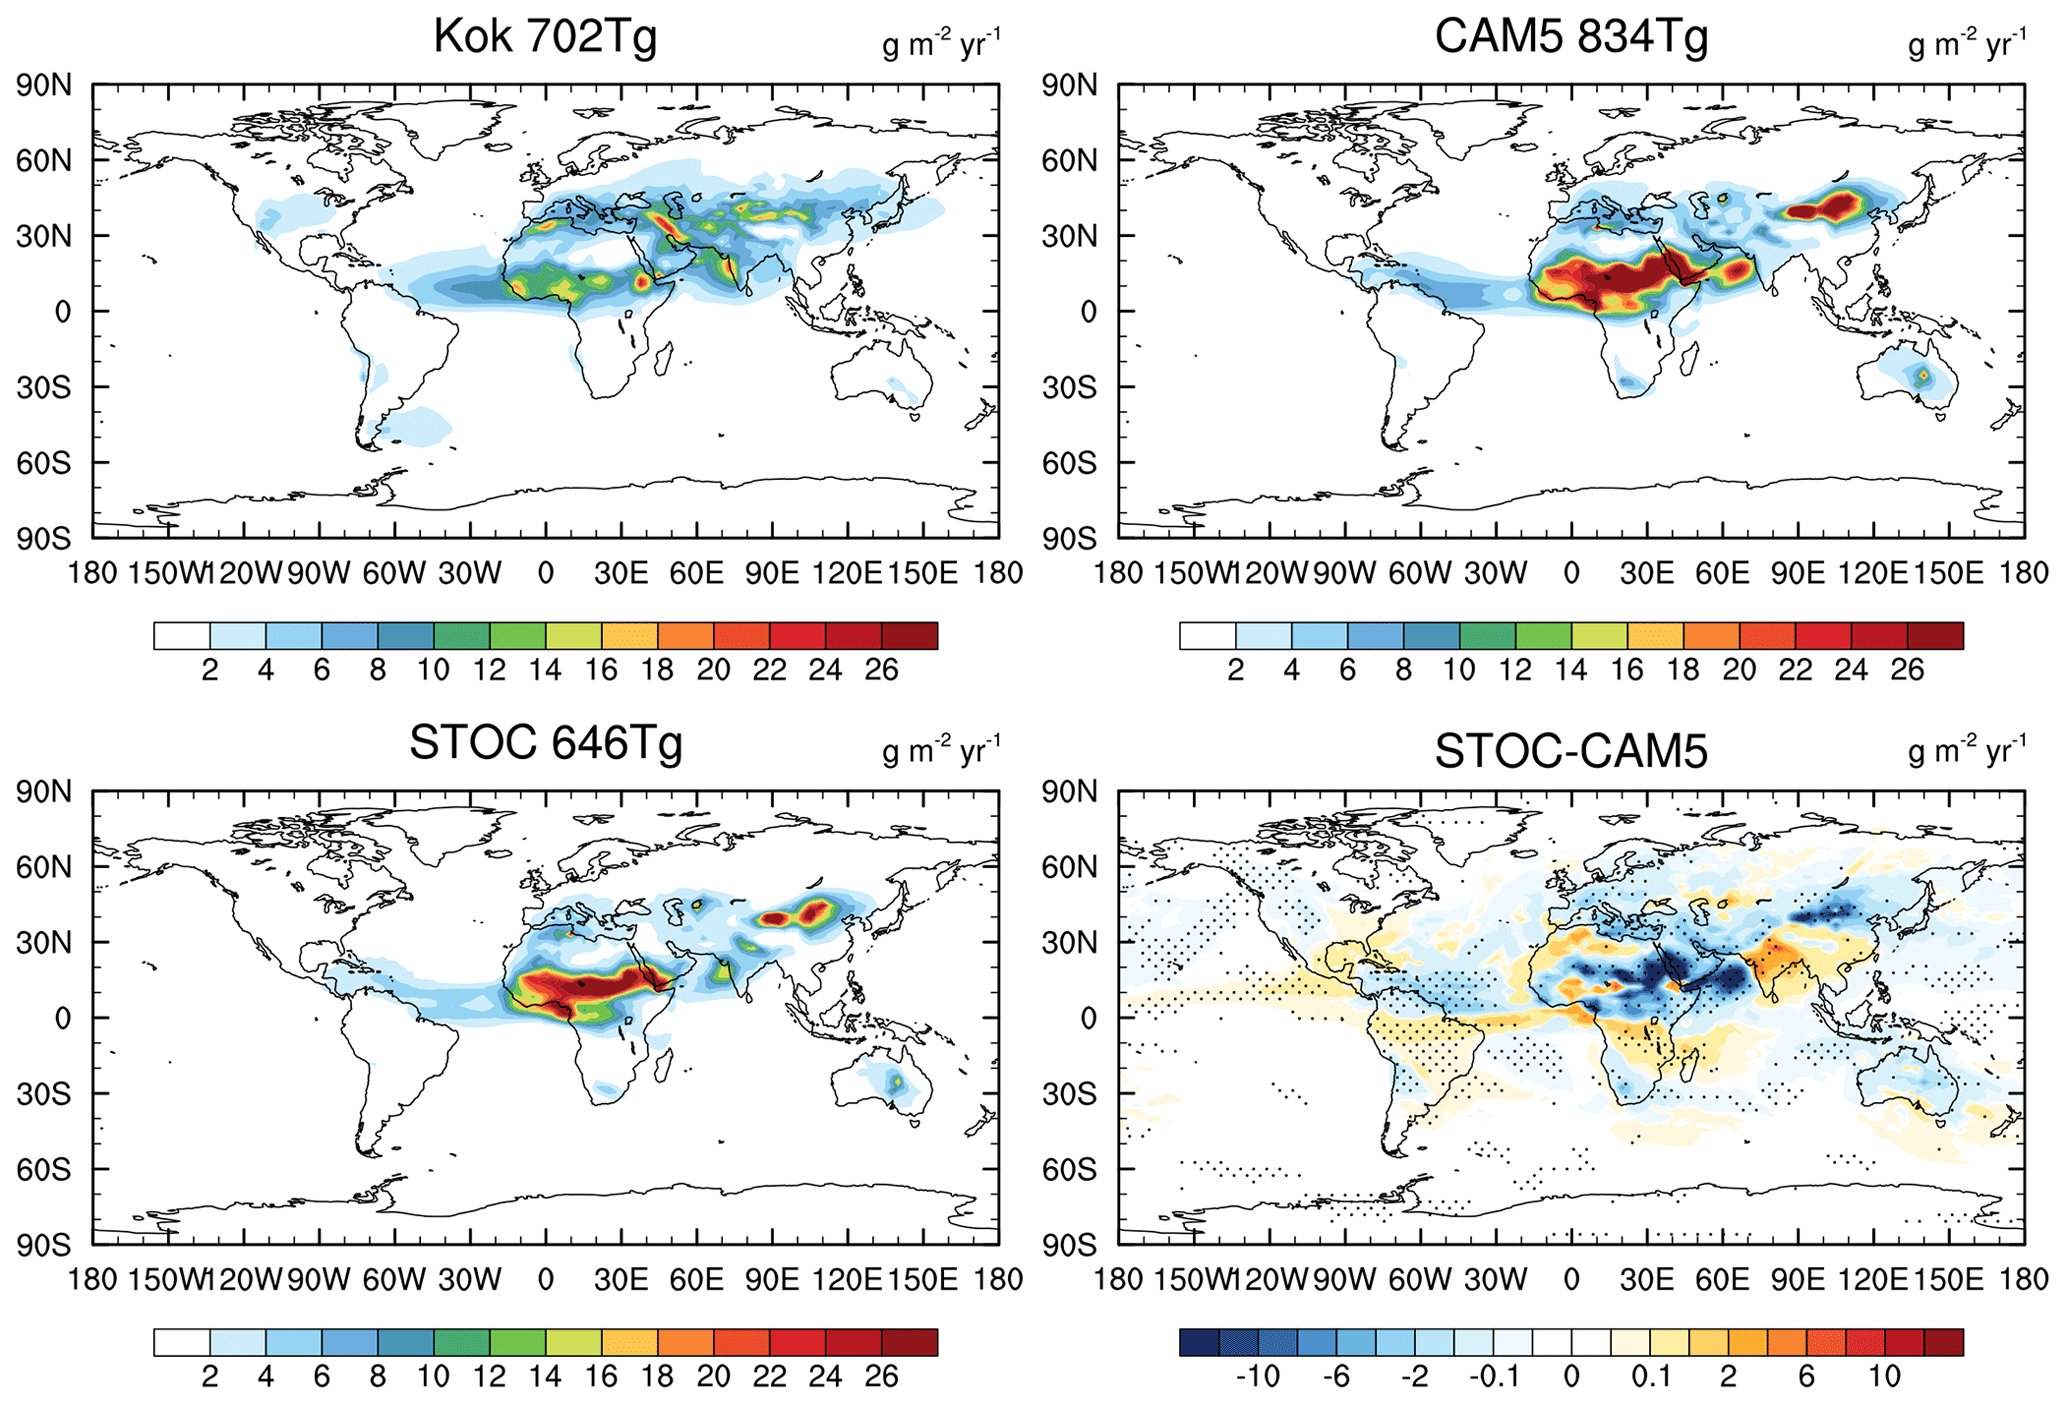
Figure 7Global distributions of dust wet deposition in Kok et al. (2021), CAM5 and STOC and the difference between STOC and CAM5. Values are the annual total amount of dust wet deposition over the globe.
For a given rain rate, its amount contribution is determined by frequency (f) only (. The frequency distributions of the total precipitation in observations and simulations and contributions from convective and large-scale precipitation in CAM5 and STOC runs are shown in Fig. 3. Over the tropics, where there is frequent convection, although the frequency of total precipitation in the STOC run is slightly higher than that in the CAM5 run at rain rates between 0.1 and 2 mm d−1, the frequency of rain rates between 2 and 20 mm d−1 in STOC is greatly reduced, much closer to GPCP and TRMM. Furthermore, for rain rates larger than 20 mm d−1, the simulated frequency in STOC matches TRMM very well (Fig. 3a). These changes in the total rainfall frequency can be explained by those in individual large-scale and convective components; i.e., a decrease in the frequency of convective precipitation is the main contributor to the frequency change of total rain rates between 2 and 20 mm d−1 while both large-scale precipitation and convective precipitation are responsible for the frequency increase in total rain rates larger than 20 mm d−1 (Fig. 3d). These results are consistent with those of Wang et al. (2021a). As the latitude increases poleward associated with the decreasing frequency contribution of convection, the difference of the frequency of total rainfall between CAM5 and STOC runs becomes less prominent (Fig. 3b and c). However, relative to the frequency of convective precipitation in the CAM5 run, similar changes to those over the tropics in the STOC run are still evident (Fig. 3e and f). A chain linking the changes of frequency and amount from CAM5 to STOC is summarized here: with the stochastic deep convection parameterization, the frequency of convection for rain rates between 1 and 20 mm−1 is reduced in STOC, resulting in the decreased amount of total rain within this range and thus the associated shift of the rainfall amount mode to larger rainfall intensity.
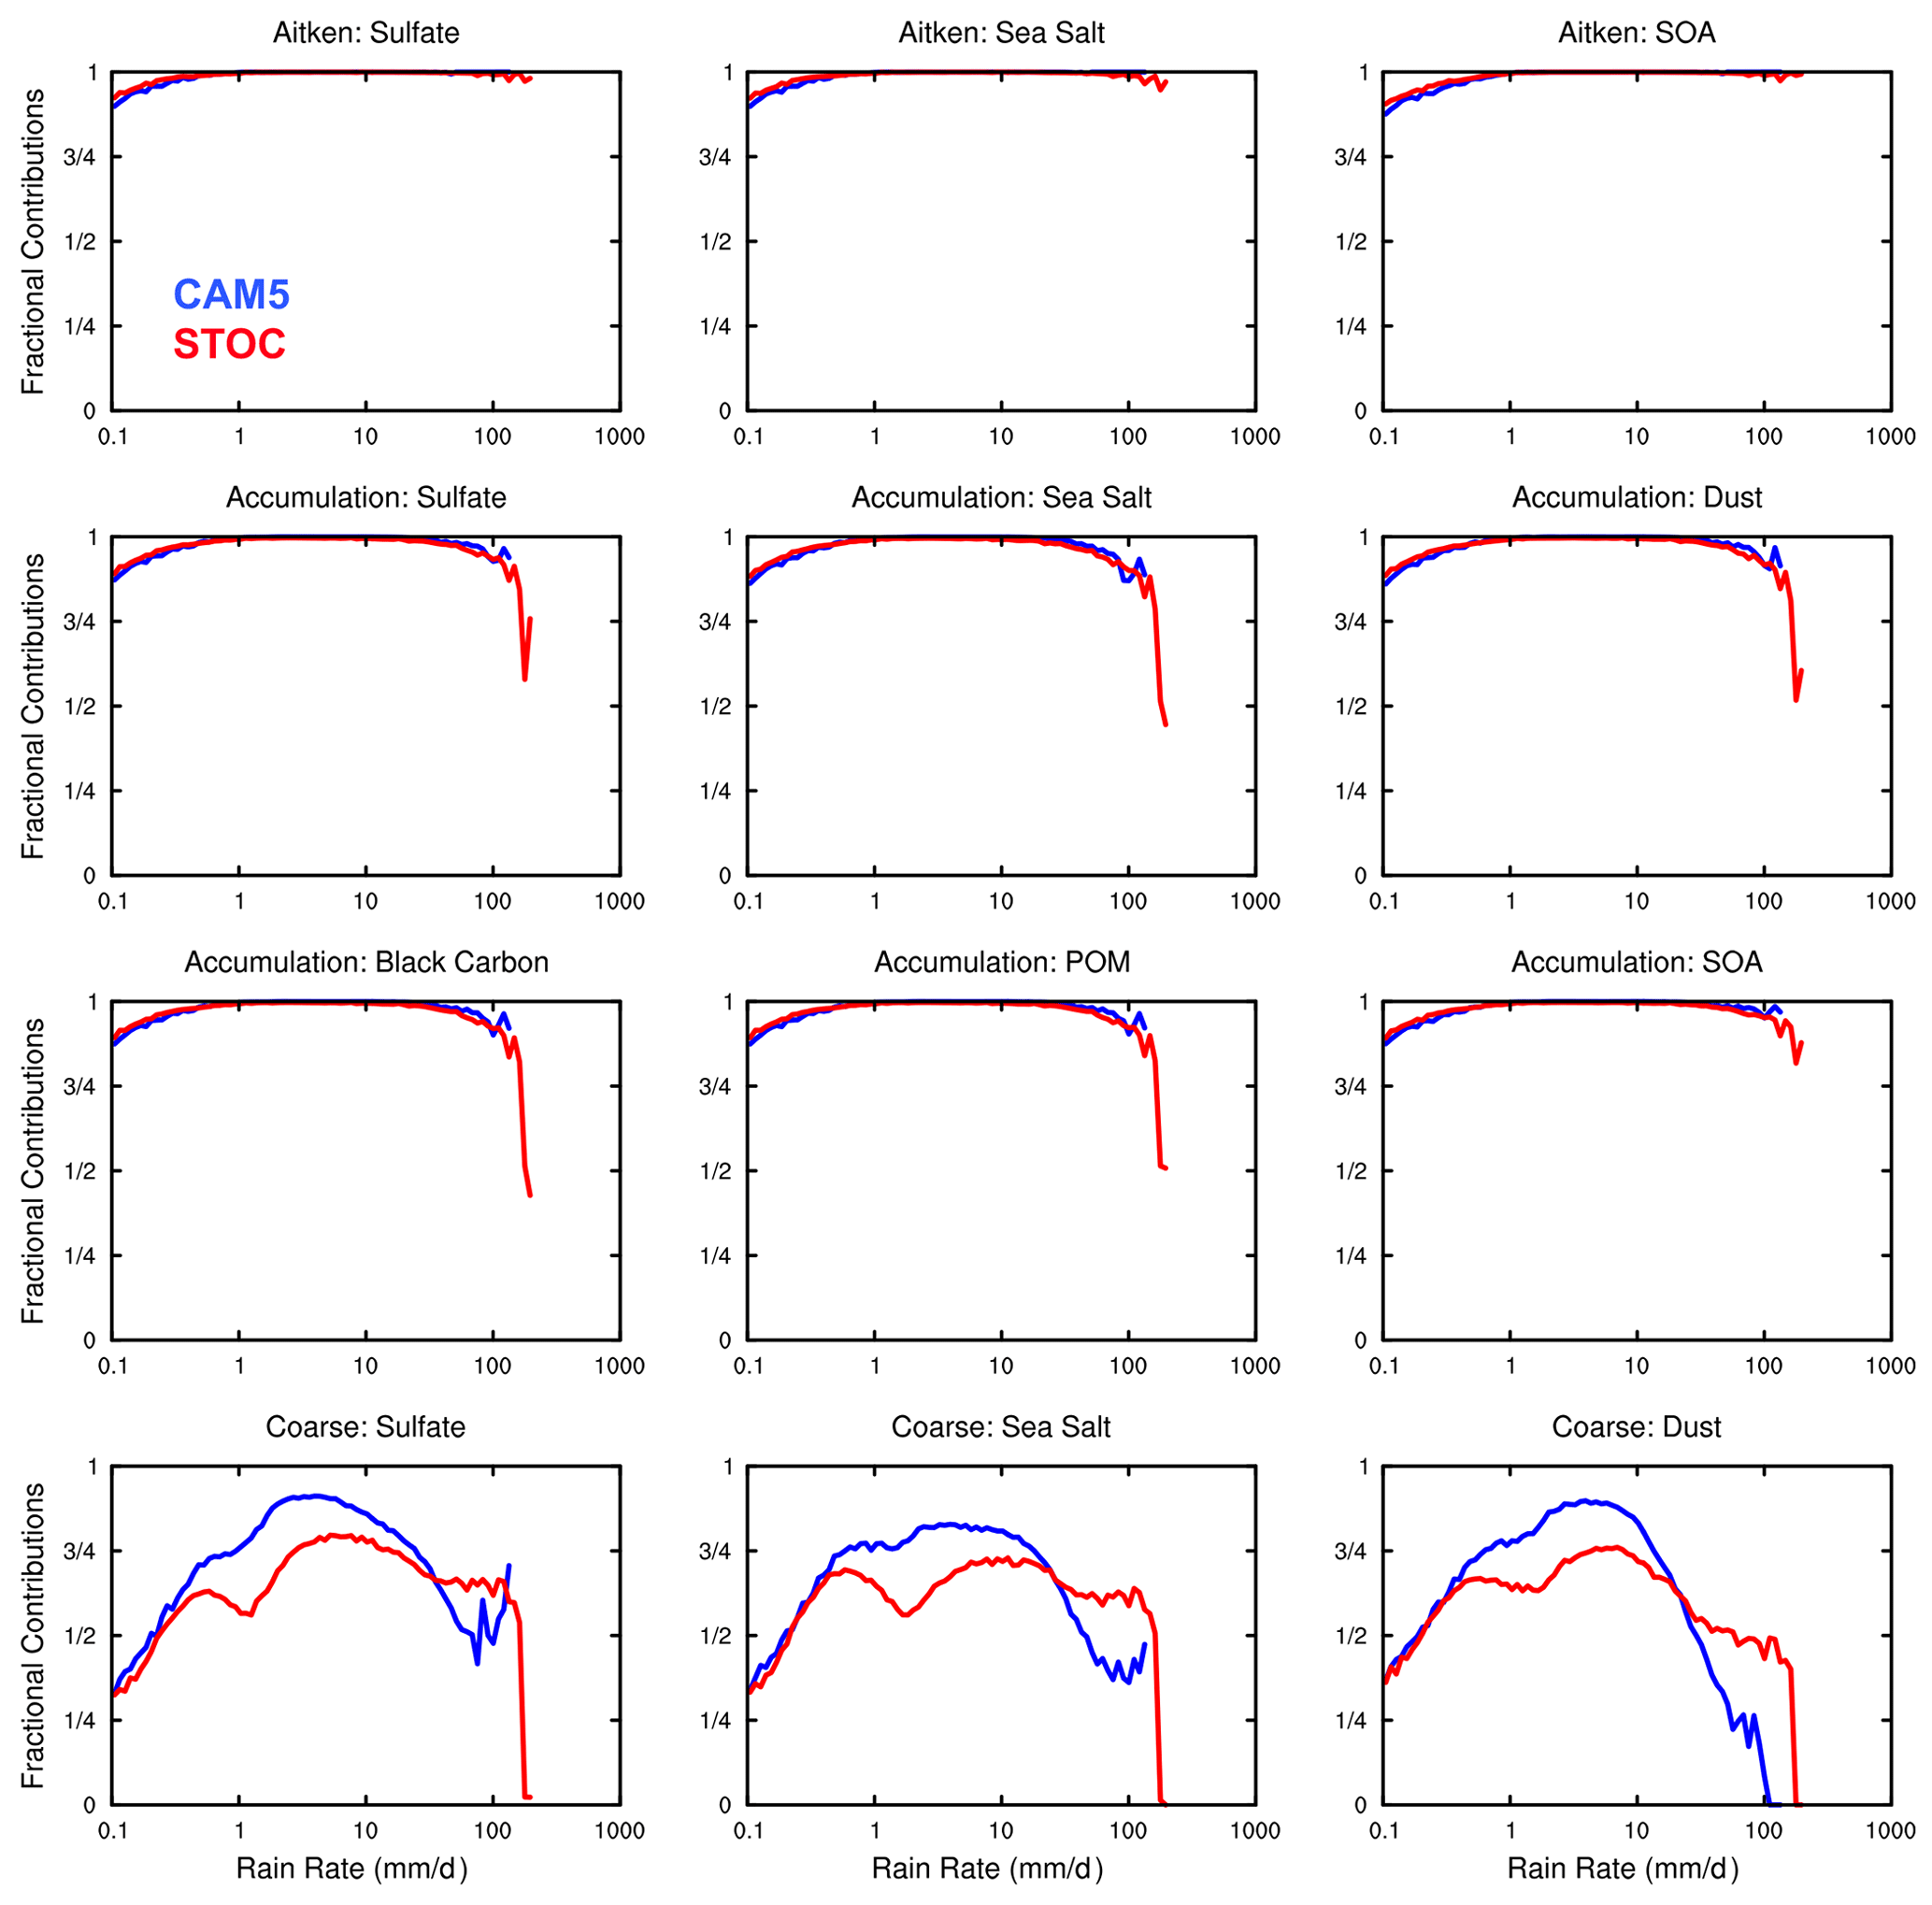
Figure 8Fractional contributions of wet removal of aerosols from convective clouds to the total amount of aerosol wet deposition over 20∘ S, 20∘ N in CAM5 (blue) and STOC (red) runs. The distributions are scaled by , which has units of mm d−1/mm d−1 and is a unitless scaling term.
3.2 Wet deposition of aerosols
With precipitation features in CAM5 and STOC runs in mind, aerosol wet deposition in the two simulations is explored. Figure 4 demonstrates the simulated distributions of wet removal of different aerosol species in different modes over the tropics. Overall, the shape of the distributions of wet removal for all aerosol species in the three modes in both simulations resembles that of the rainfall distribution. Nonetheless, the scavenging amount modes are not equal to the amount modes of total rainfall as shown in Fig. 2a, especially for large particles. Specifically, in CAM5, for sulfate, sea salt and secondary organic aerosol (SOA) in the Aitken mode, the scavenging amount modes are around 10–12 mm d−1, smaller than the rainfall amount mode of ∼ 20 mm d−1. As the aerosol size increases to the coarse mode, compared with sulfate, sea salt and dust in the smaller sizes, the scavenging amount modes decrease to 7–8 mm d−1, which can be attributed to a combination of higher scavenging coefficients for coarse-mode aerosols in below-cloud scavenging and larger convective cloud activation fraction prescribed for sea salt and sulfate in the coarse mode according to their hydrophilic properties (see Sect. 2.2). The feature that the scavenging amount mode is smaller than the amount mode of total rain suggests that the frequency of light precipitation plays a more important role in regulating the amount of aerosol wet scavenging than that of rainfall. Additionally, in contrast to other aerosols, the wet removal of sea salt is more sensitive to light precipitation due to its high hydrophilicity. With the rain rate increasing beyond 1 mm d−1, the wet deposition rate of sea salt increases more rapidly than that of other aerosols (i.e., steeper curve). As a response to the shift of the amount mode of total rainfall to a larger value from CAM5 to STOC, the scavenging amount modes for all aerosols in the three modes in STOC are increased accordingly. Owing to the decreased rainfall amount and the high occurrence frequency at rain rates smaller than 20 mm d−1 (Fig. 3a and d), the decrease in wet removal in this rainfall range overwhelms the wet deposition increase at rain rates beyond 20 mm d−1. As a result, compared to CAM5, the net decreases in regionally averaged wet removal for all aerosols in the three modes in STOC are found. The largest relative decreases in the Aitken, accumulation and coarse modes are found in black carbon (−33.3 % from 0.03 to 0.02 mg/m2/day), SOA (−50 % from 0.004 to 0.002 mg/m2/day) and dust (−20.9 % from 7.60 to 6.01 mg/m2/day), respectively.
The distributions for the subtropics and midlatitudes as well as high latitudes are shown in Figs. 5 and 6, respectively. Overall, since the annual mean precipitation decreases with increasing latitude, the wet deposition rates of aerosols over these two latitudinal belts are smaller than those over the tropics. Low local aerosol burdens over high latitudes further contribute to the low aerosol wet deposition there. Same as in the tropics, the similar distributions of different aerosol species in different modes over these two regions are found except for dust in the coarse mode in the subtropics and midlatitudes where two peaks are found: one located at the rain rate around 0.8 mm d−1 and the other around 8 mm d−1 (Fig. 5). With the suppression of the total rainfall amount between 1–10 mm d−1 (Fig. 2b), for dust in the coarse mode over 20, 50∘ N, the amount magnitudes of two peaks are comparable in the STOC run in contrast to the distinctly different magnitudes of two peaks in the CAM5 run. The scavenging amount modes for all aerosols over these two latitudinal belts are smaller than the rainfall amount modes as well (Fig. 2b, c). In comparison with CAM5, again, the scavenging amount mode shifts rightward, and the regional mean of wet removal for all aerosols is reduced in the STOC run, with smaller changes than those in the tropics due to increasingly infrequent convection (Figs. 5, 6). Due to a decrease in mean rain as latitude increases, the scavenging amount mode and mean wet removal for all aerosols are increasingly reduced. Since the aerosol emission is the same in the two simulations, changes in wet deposition should be balanced by those in dry deposition between the simulations (of course the aerosol burdens can be different). As aerosol wet deposition decreases globally, aerosol dry deposition increases accordingly. For example, the global average of BC dry deposition in CAM5 is mg/m2/day while that in STOC increases to mg/m2/day. The total (wet plus dry) deposition of BC and primary organic matter (POM) remains unchanged in STOC compared to CAM5; i.e., the global averages are both and 269 mg/m2/day for BC and POM, respectively.
The long-term in situ measurements of aerosol wet deposition by precipitation that can be used for evaluating simulated climatological wet deposition are not available. Despite this, for dust wet deposition, a recent study (Kok et al., 2021) developed an analytical framework that uses inverse modeling to integrate an ensemble of global model simulations with observational constraints on the dust size distribution, extinction efficiency and regional dust aerosol optical depth. Their inverse dust model agrees better with independent measurements of dust surface concentration and deposition (dry plus wet) flux than the current model simulations and the MERRA-2 (Modern-Era Retrospective analysis for Research and Applications, Version 2) dust reanalysis product. Therefore, their gridded dust wet deposition data are used for evaluating dust wet deposition in CAM5 and STOC runs. As seen in Fig. 7, the annual total amount of dust wet deposition over the globe in CAM5 is 835 Tg, much larger than 702 Tg in Kok et al. (2021) with overestimation over dust source regions (e.g., Sahara, the Taklimakan and Gobi deserts). After suppressing too much light rainfall, the value decreases to 646 Tg in STOC, closer to the Kok et al. (2021) value.
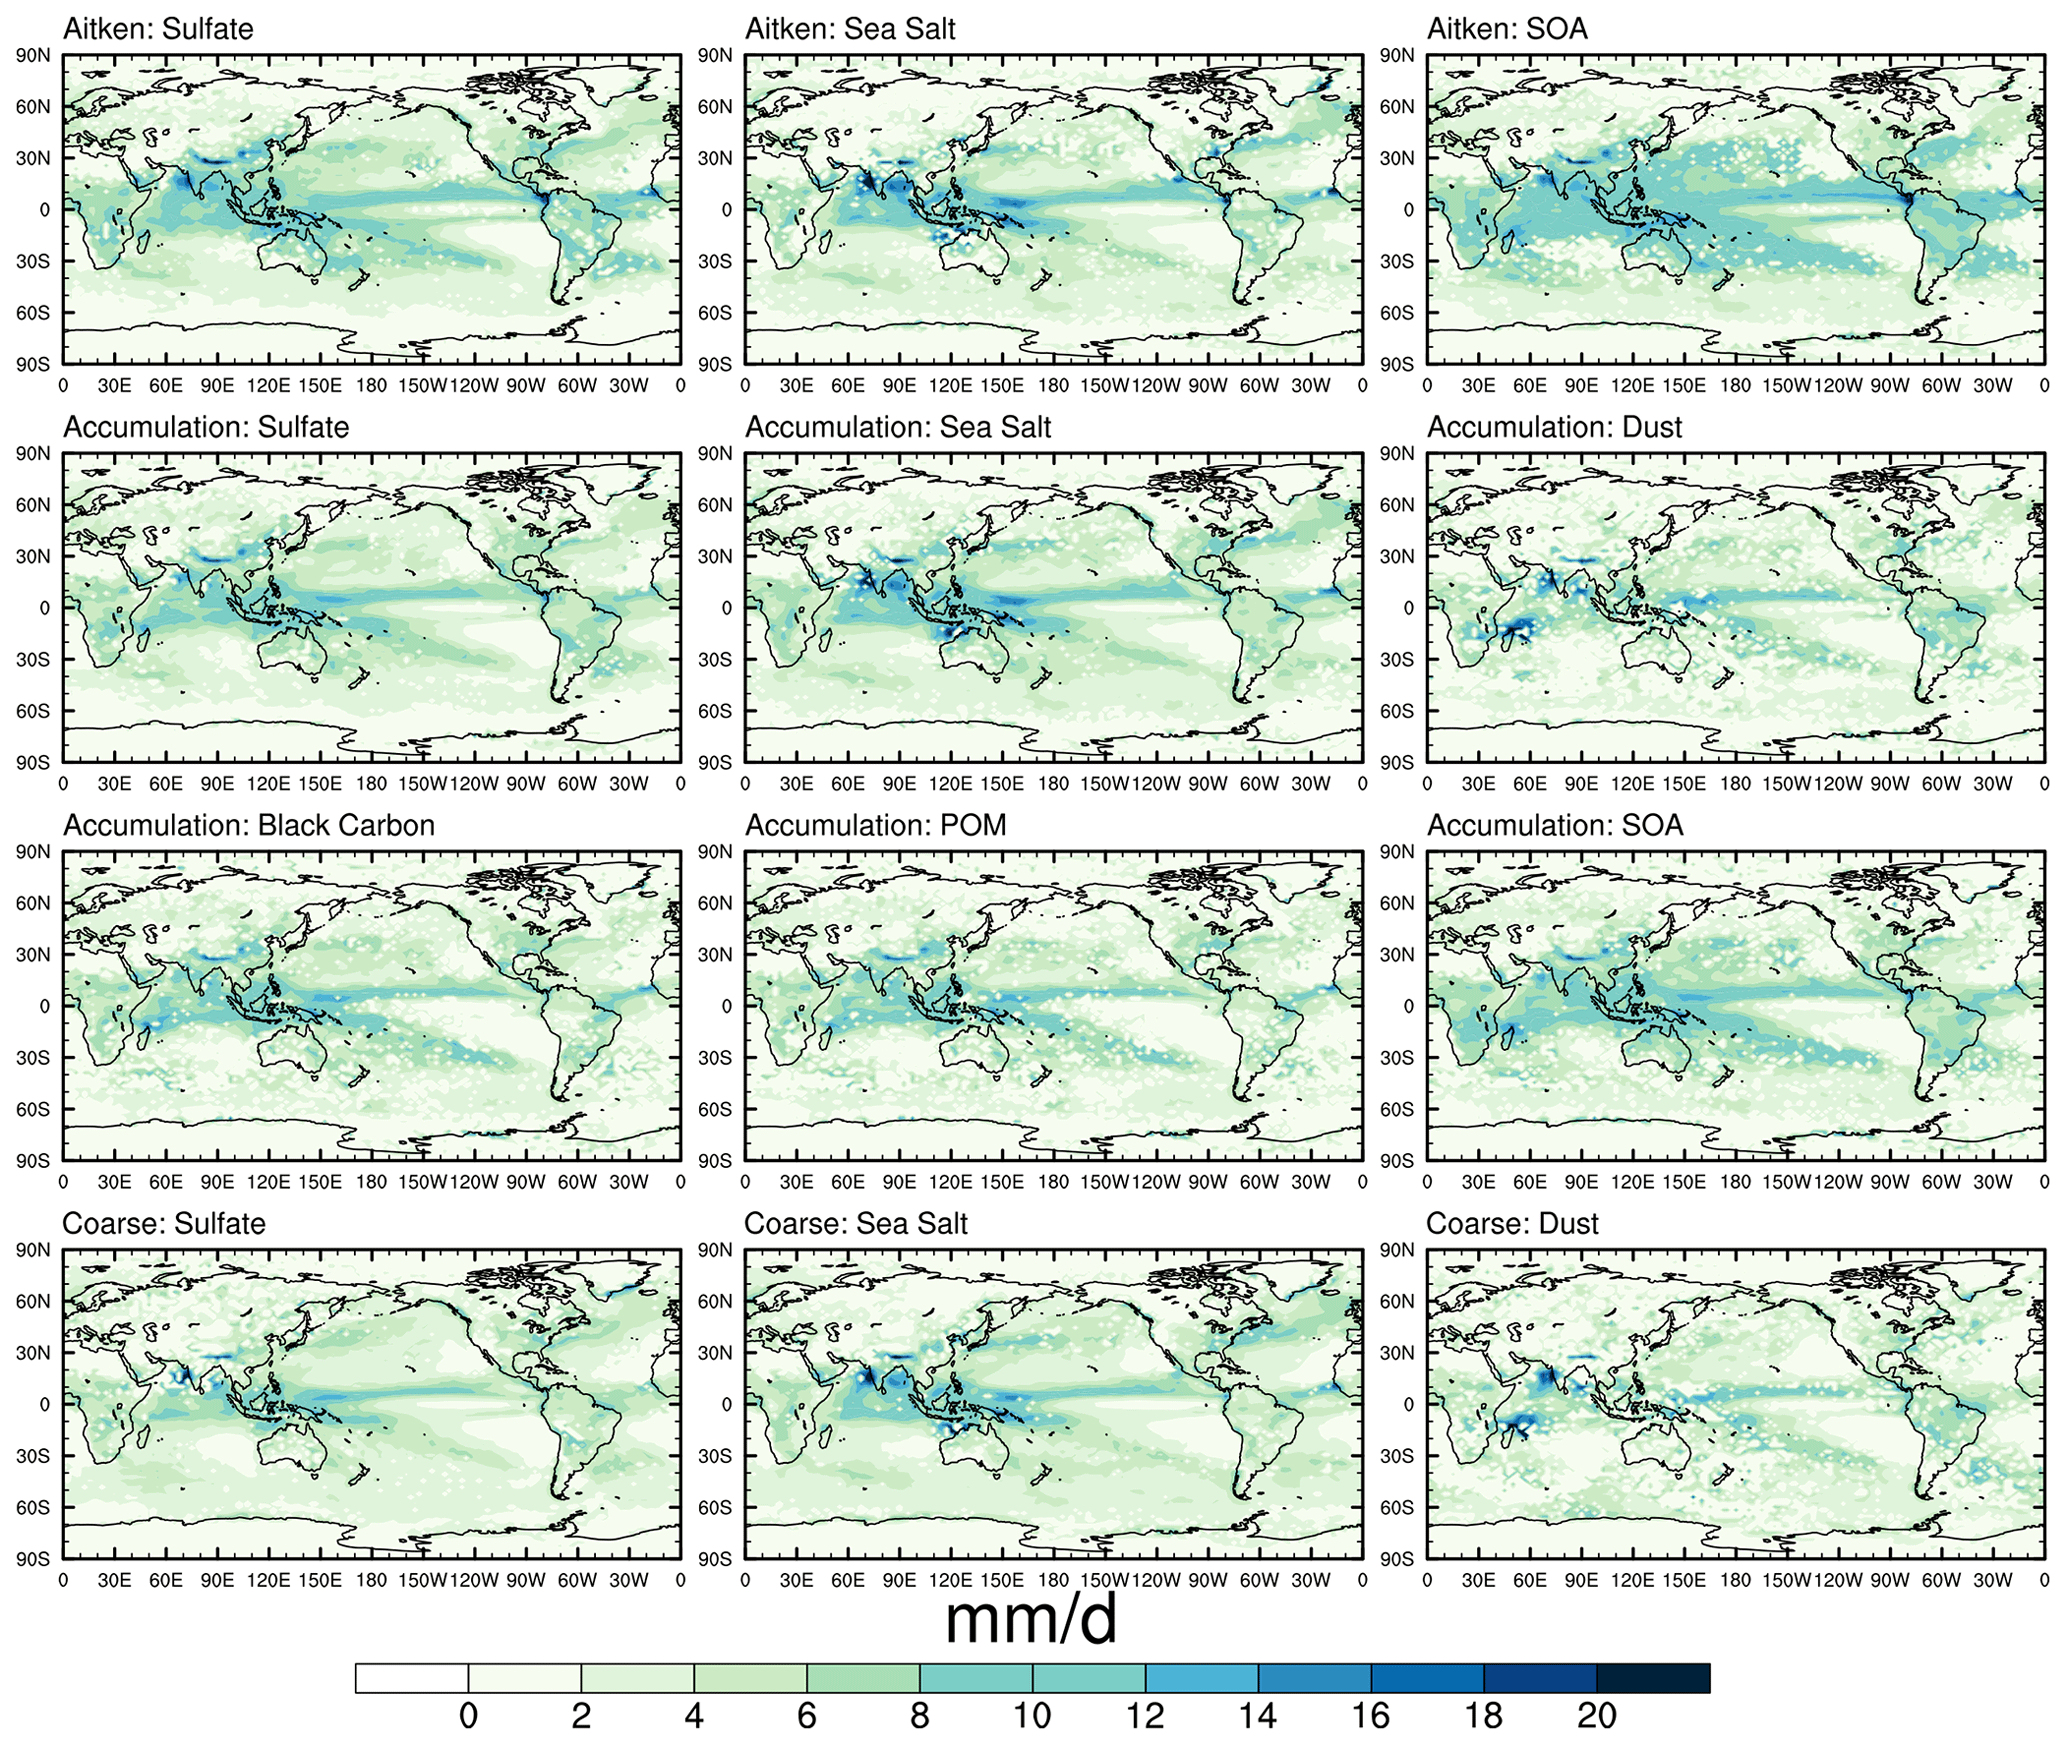
Figure 11Global distributions of the rainfall intensity associated with 50 % of the accumulated wet removal of aerosols for CAM5.
Besides the scavenging amount mode being different from the amount mode of total rainfall, the fractional contributions of wet deposition rates from stratiform and convective clouds differ more significantly from the fractional contributions of convective and large-scale precipitation to the total rainfall amount. Over the tropics (Fig. 8), for all aerosols in the Aitken and accumulation modes, in the range of rain rates from 0.1 to 100 mm d−1, the total wet removal is almost all from convective clouds for both CAM5 and STOC despite the fact that the fractional contribution of large-scale rainfall to the total rainfall amount reaches as much as 25 % at rain rates greater than 20 mm d−1 (Fig. 2g). For rain rates higher than 100 mm d−1, while the large-scale contribution to the total rainfall amount is up to 50 %–60 % in two runs, only for sulfate, sea salt, dust, black carbon and primary organic matter (POM) in the accumulation mode in STOC does the fractional contribution of wet removal from stratiform clouds reach 50 %. In contrast, for large aerosol particles (i.e., sulfate, sea salt and dust in the coarse mode), the role of stratiform clouds becomes important. For example, at rain rates ranging from 0.1 to 10 mm d−1 in which the large-scale contribution to the total rainfall amount can almost be neglected in both simulations, wet deposition from stratiform clouds accounts for 10 %–25 % in CAM5 and 25 %–40 % in STOC. This is because larger aerosol particles with larger mass concentrations substantially increase the contribution in below-cloud scavenging due to much larger stratiform cloud fraction than convective cloud fraction. As a response to a rapid increase in the large-scale fractional contribution to the total rainfall amount when rain rates exceed 100 mm d−1 in STOC, the fractional contribution of wet removal from the stratiform clouds rockets up to 100 %.
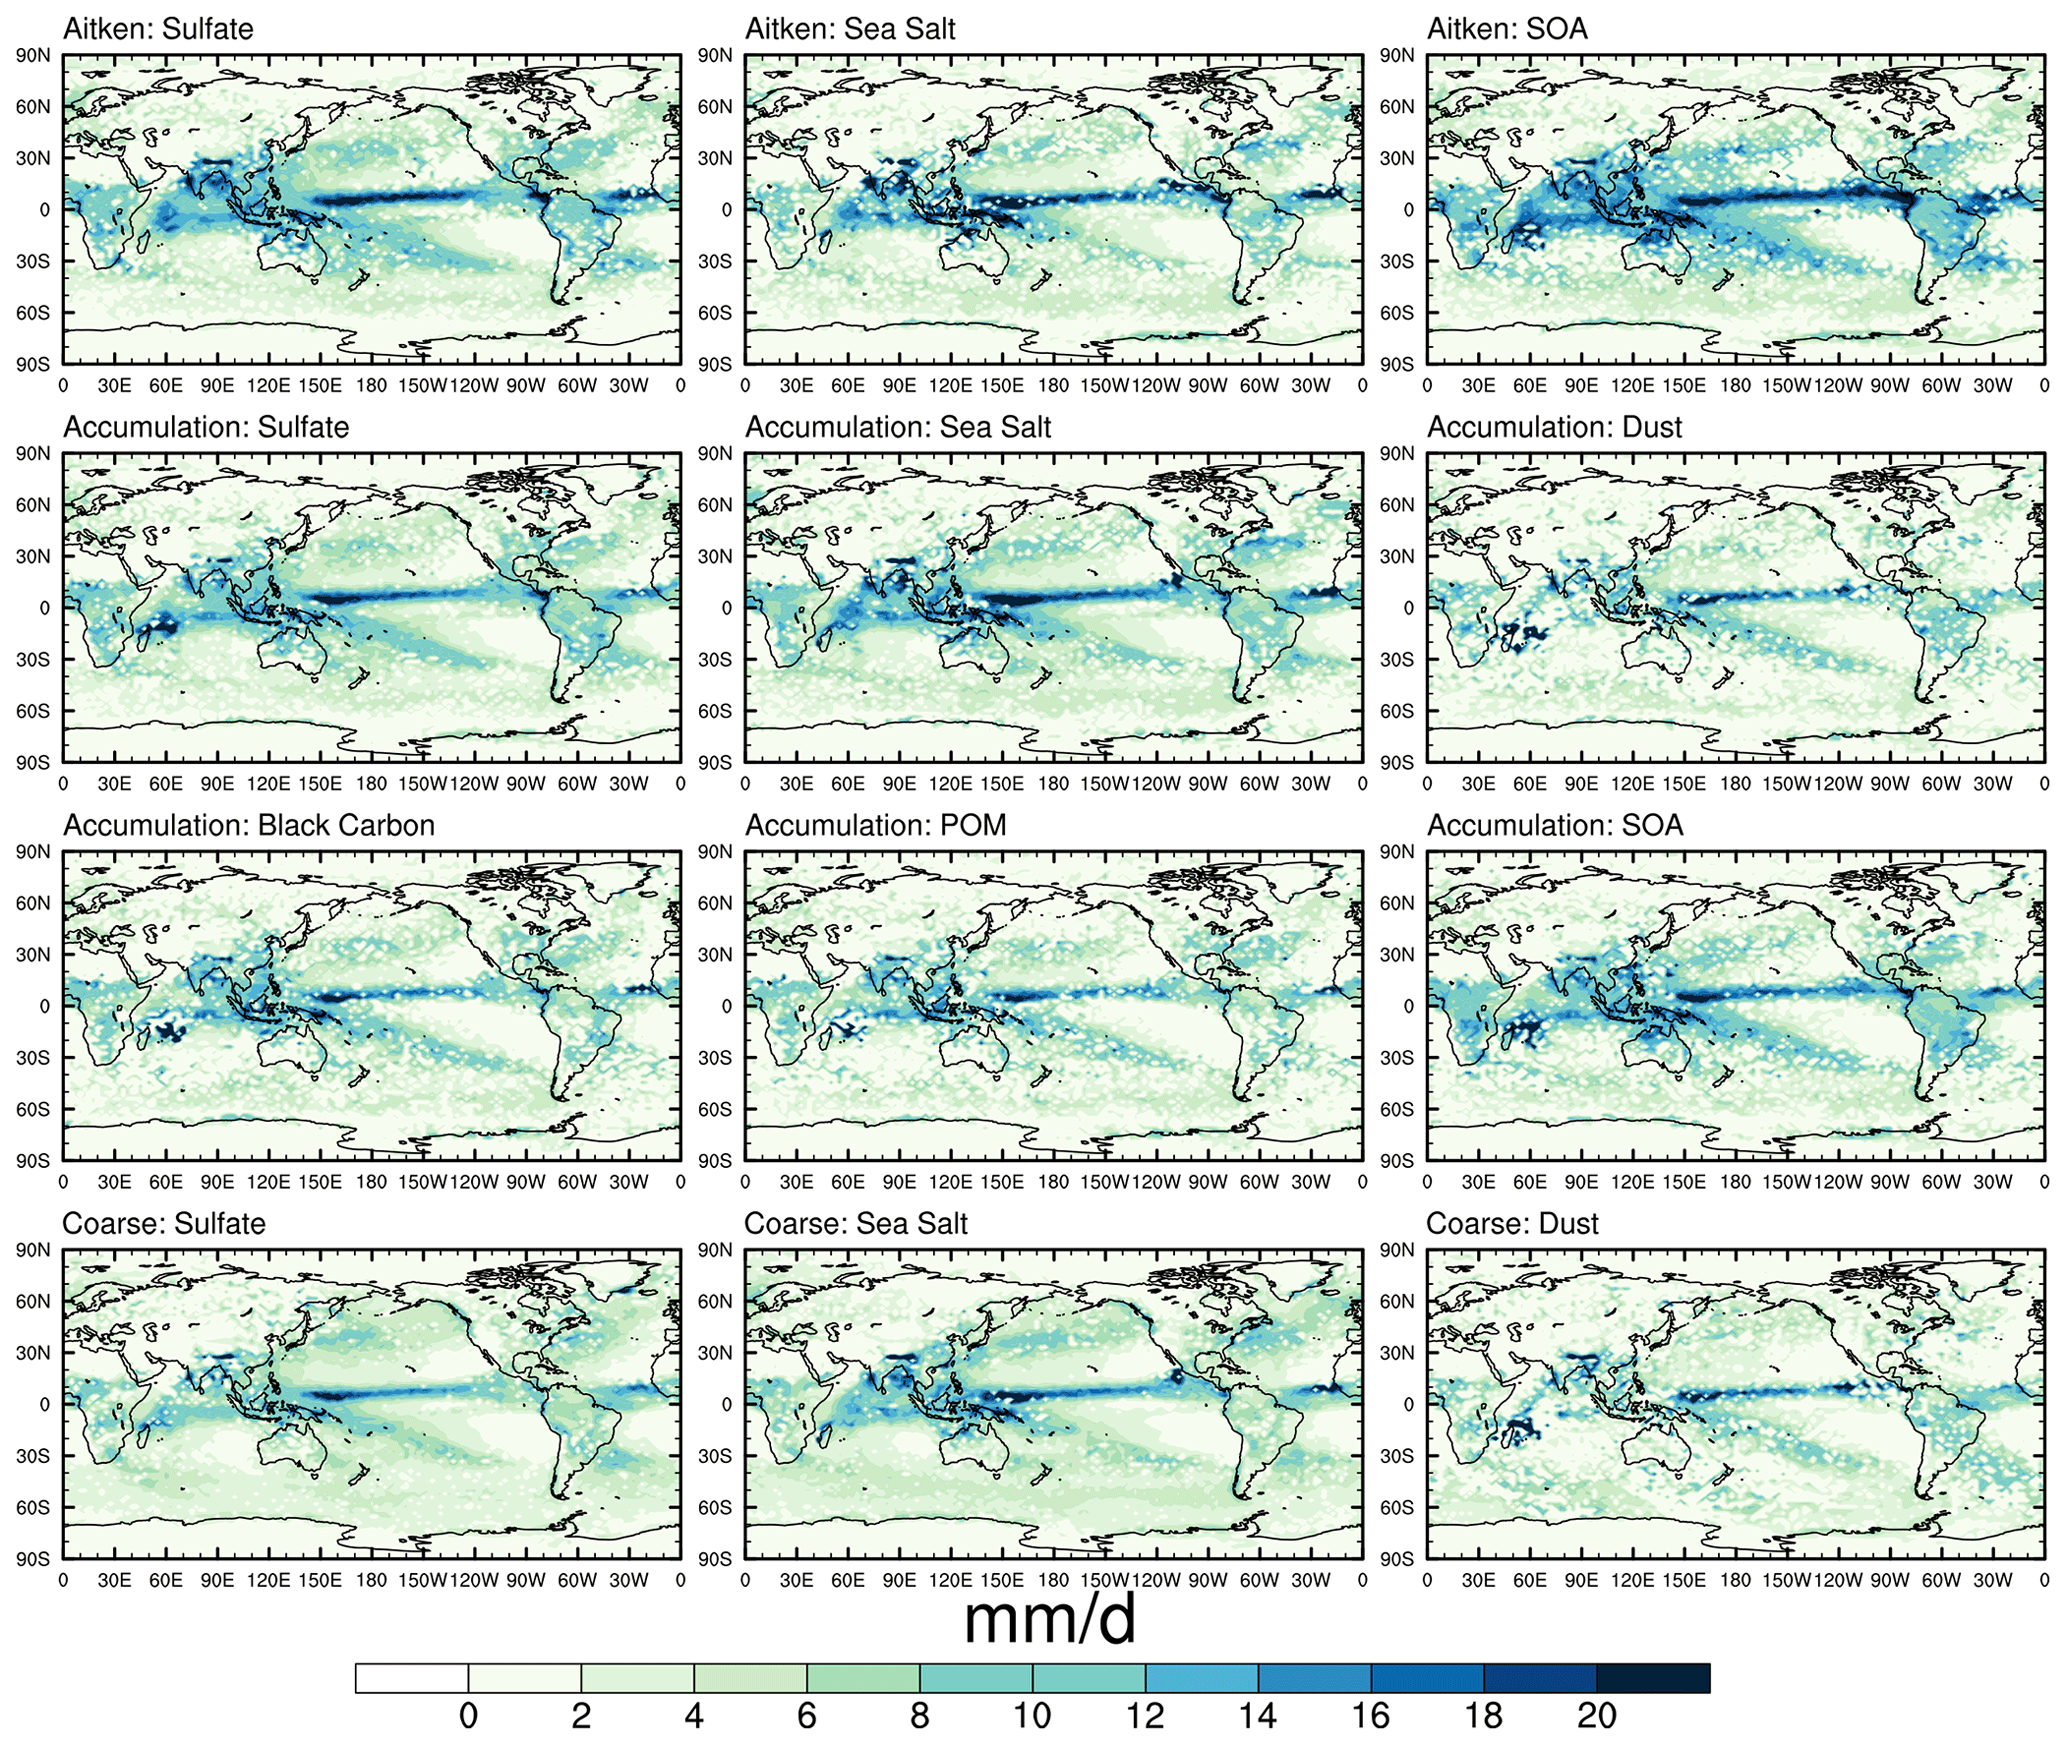
Figure 12Same as Fig. 11, but for STOC.
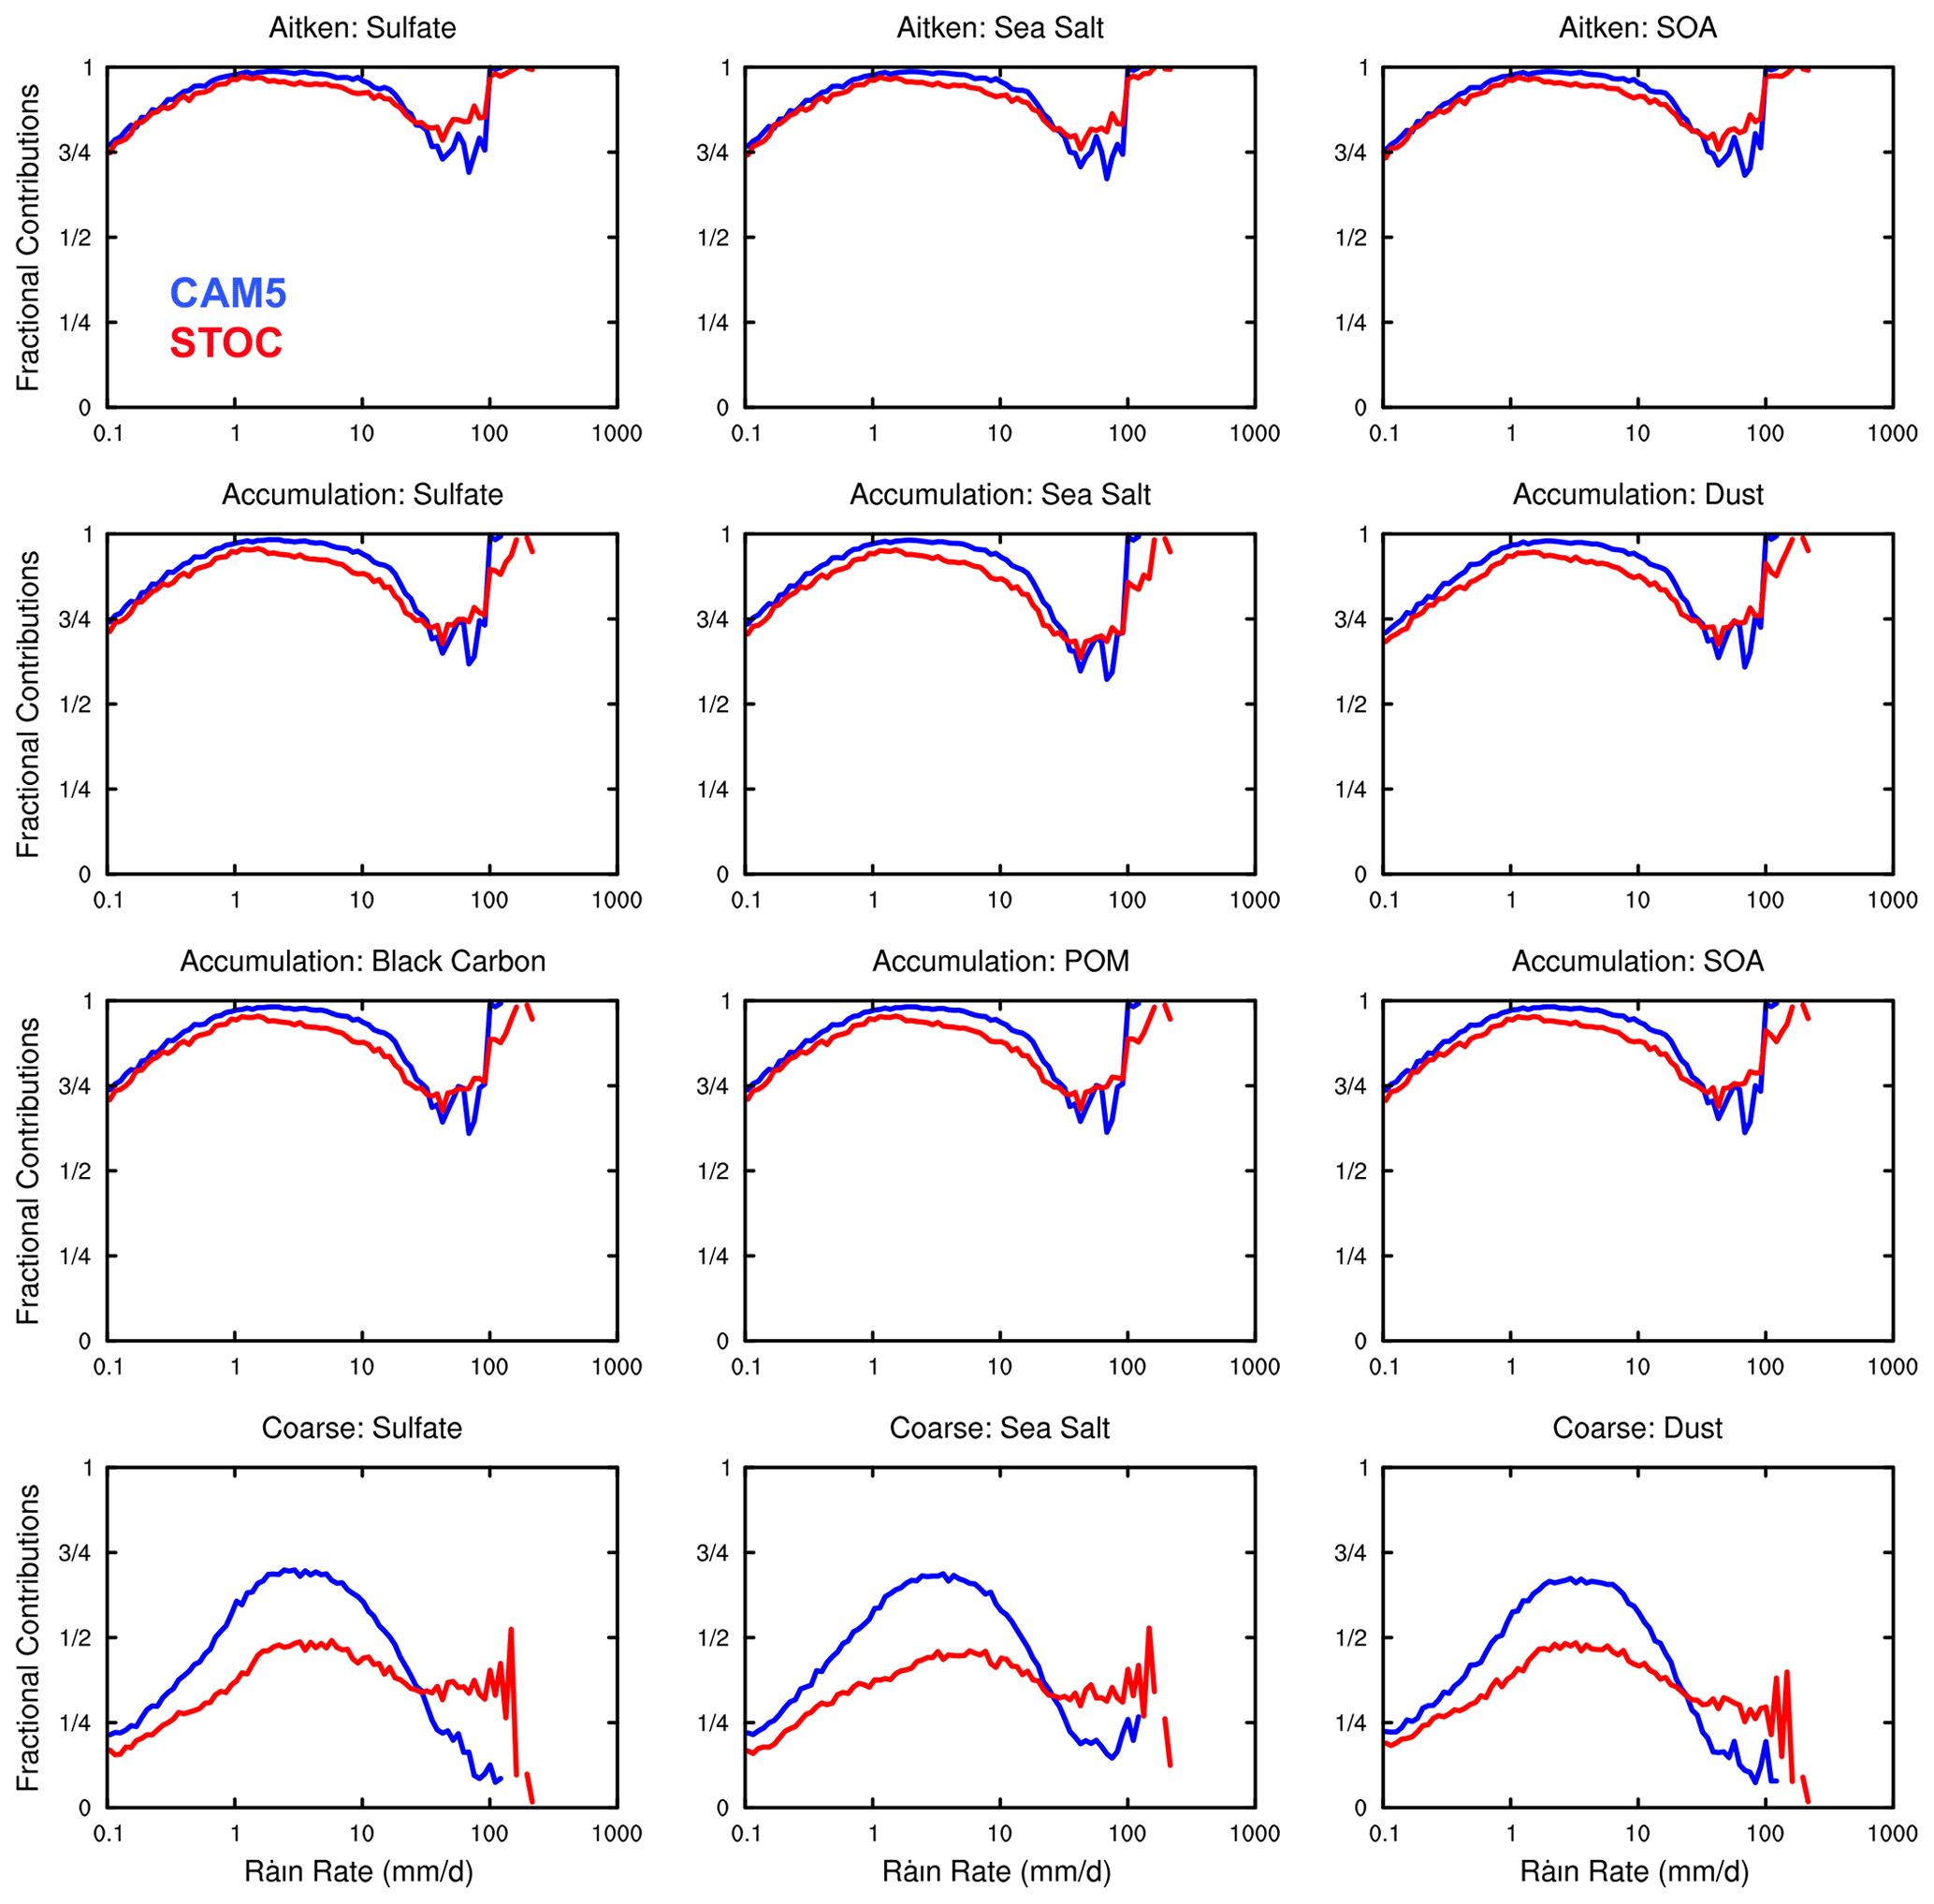
As for the subtropics and midlatitudes (Fig. 9), as rain rates increase, the changes of the fractional contributions from convective and stratiform clouds in the two simulations follow the changes of the fractional contributions to the total rainfall amount well. However, their fractional contributions to rainfall and aerosol wet scavenging differ dramatically. Take rainfall rates between 1 and 10 mm d−1 for example. Although the fractional contribution of wet removal of aerosols in the Aitken and accumulation modes from stratiform clouds increases slightly in the two simulations (∼ 12 % in STOC larger than ∼ 5 % in CAM5), this still shows a large contrast to the large-scale fractional contribution to the total rainfall amount (> 25 %) (Fig. 2h). Different from the tropics, after rain rates exceed 10 mm d−1, the fractional contributions from stratiform clouds for all aerosols in these two modes in CAM5 and STOC climb to 25 %. For aerosols in the coarse mode between 1 and 10 mm d−1, the fractional contribution from stratiform clouds in CAM5 is larger than 25 % but still much smaller than that from convective clouds. Associated with the decreased (increased) convective (large-scale) precipitation in STOC, the individual fractional contributions to the total wet removal from stratiform and convective clouds are comparable. As rain rates increase beyond 20 mm d−1, the fractional contribution from stratiform clouds in two runs becomes dominant with a larger contribution from convective clouds in STOC than in CAM5.
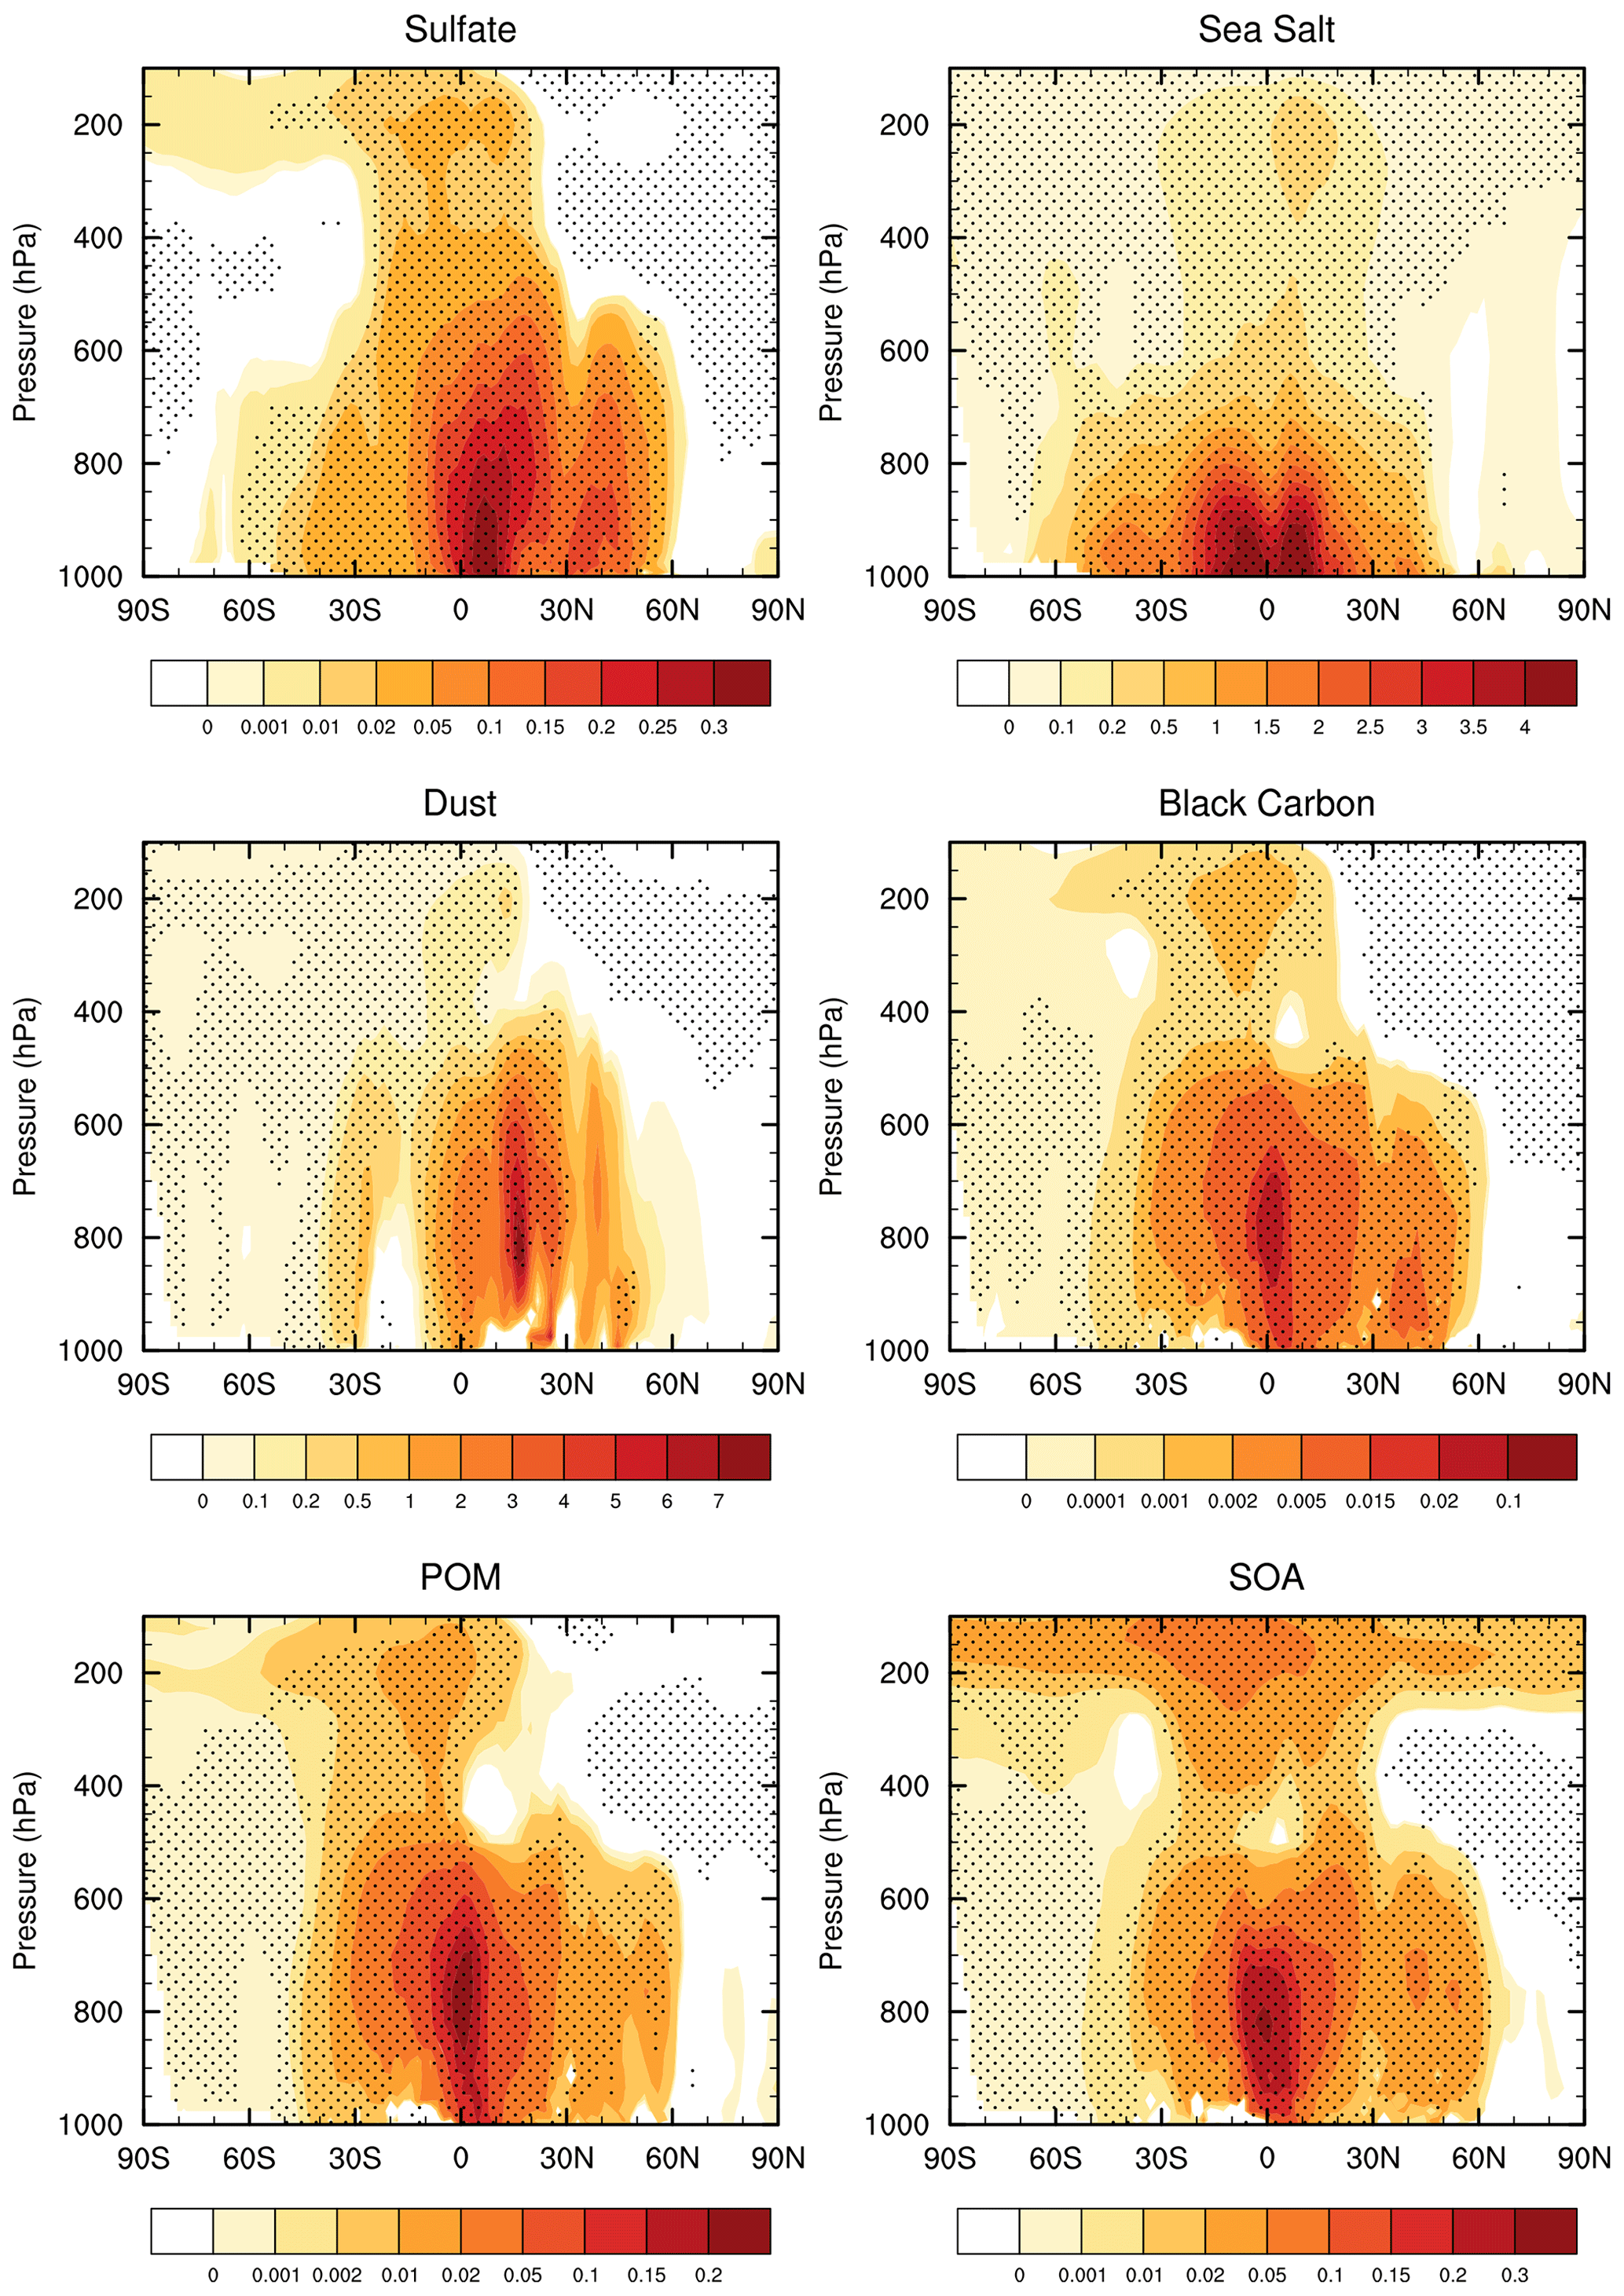
Figure 13Annual and zonal mean cross sections of changes in different aerosol mass concentrations (µg/kg) between STOC and CAM5 runs (STOC–CAM5). Areas exceeding the 95 % t-test confidence level are stippled.
In high latitudes (Fig. 10), even though precipitation is mainly from large-scale rainfall with little convection (Figs. 2i and 3f), it is surprising that the aerosol particles in the Aitken and accumulation modes at rain rates between 0.3–20 mm d−1 in both simulations are still mainly removed by convective clouds. This is largely attributed to the fact that in-cloud aerosol wet scavenging from stratiform clouds impacts cloud-borne aerosols but not interstitial aerosols, which, on the other hand, are influenced by in-cloud aerosol wet scavenging from convective clouds (see Sect. 2.2). Only for total rainfall larger than 20 mm d−1 does wet removal from stratiform clouds dominate over that from convective clouds. Contrary to the behavior of small aerosol particles, the wet scavenging of aerosol particles in the coarse mode in CAM5 and STOC behaves consistently across the entire rainfall range, with the fractional contribution from stratiform clouds overwhelming that from convective clouds (exceeding 75 % in STOC larger than in CAM5).
With these aerosol wet deposition features and the associated rainfall amount and frequency characteristics shown in Sect. 3.1, the cause for the decrease in the mean wet removal in STOC compared to CAM5 is summarized as follows. For all aerosol species in three modes over three latitudinal belts, the rain rates at which there is a large amount of wet removal range from 1 to 20 mm d−1, although the individual scavenging amount mode differs (Figs. 4–6). In this rainfall intensity range, the frequency decrease in convective precipitation and unchanged large-scale precipitation (Fig. 3) results in the reduced amount of this total rainfall intensity band (Fig. 2). This change of the total/convective rainfall amount and the fact that aerosols (especially for particles in the Aitken and accumulation modes) are mainly removed from convective clouds (except sulfate, sea salt and dust in the coarse mode in high latitudes) (Figs. 8–10) work together for the climatological mean wet deposition decrease.
The framework proposed in Sect. 2.3 is difficult to use for assessing the geographic distribution of the scavenging amount mode because it is based on discrete logarithmic bins that can under-sample the data in some regions with little precipitation. In this regard, an alternative approach is proposed. At each grid point, the daily precipitation intensity during all NT days is sorted in ascending order with which the corresponding wet deposition rate is accumulated accordingly. Then the rainfall intensity associated with the median accumulated wet removal is used as a complementary statistic of the scavenging amount mode, which is independent of the rainfall bin structure (Kooperman et al., 2018). In CAM5 (Fig. 11), the geographic patterns in general resemble that of annual mean precipitation (Wang and Zhang, 2016), showing maximum centers (∼ 6–10 mm d−1) along the Intertropical Convergence Zone (ITCZ), along the South Pacific Convergence Zone and in the Indian Ocean. Besides these regions, the scavenging amount mode for SOA in the Aitken mode also peaks over the north Pacific and Amazonia. Over the arid and semi-arid regions (Chen et al., 2017), since precipitation is scarce, the scavenging amount mode is smaller than 2 mm d−1. Except for those regions, even though rainfall intensity between 1 and 20 mm d−1 occurs more frequently over oceans than over land (Wang et al., 2016), it is easier for aerosols over land to be removed by lighter rainfall with an exception over the Tibetan Plateau where the scavenging amount mode is comparable with that over oceans. In comparison with CAM5, increases in the simulated scavenging amount mode in STOC are found across the globe but are most significant along the ITCZ where for some small aerosol particles (e.g., sulfate, sea salt and SOA in the Aitken and accumulation modes) it can exceed 20 mm d−1 (Fig. 12).
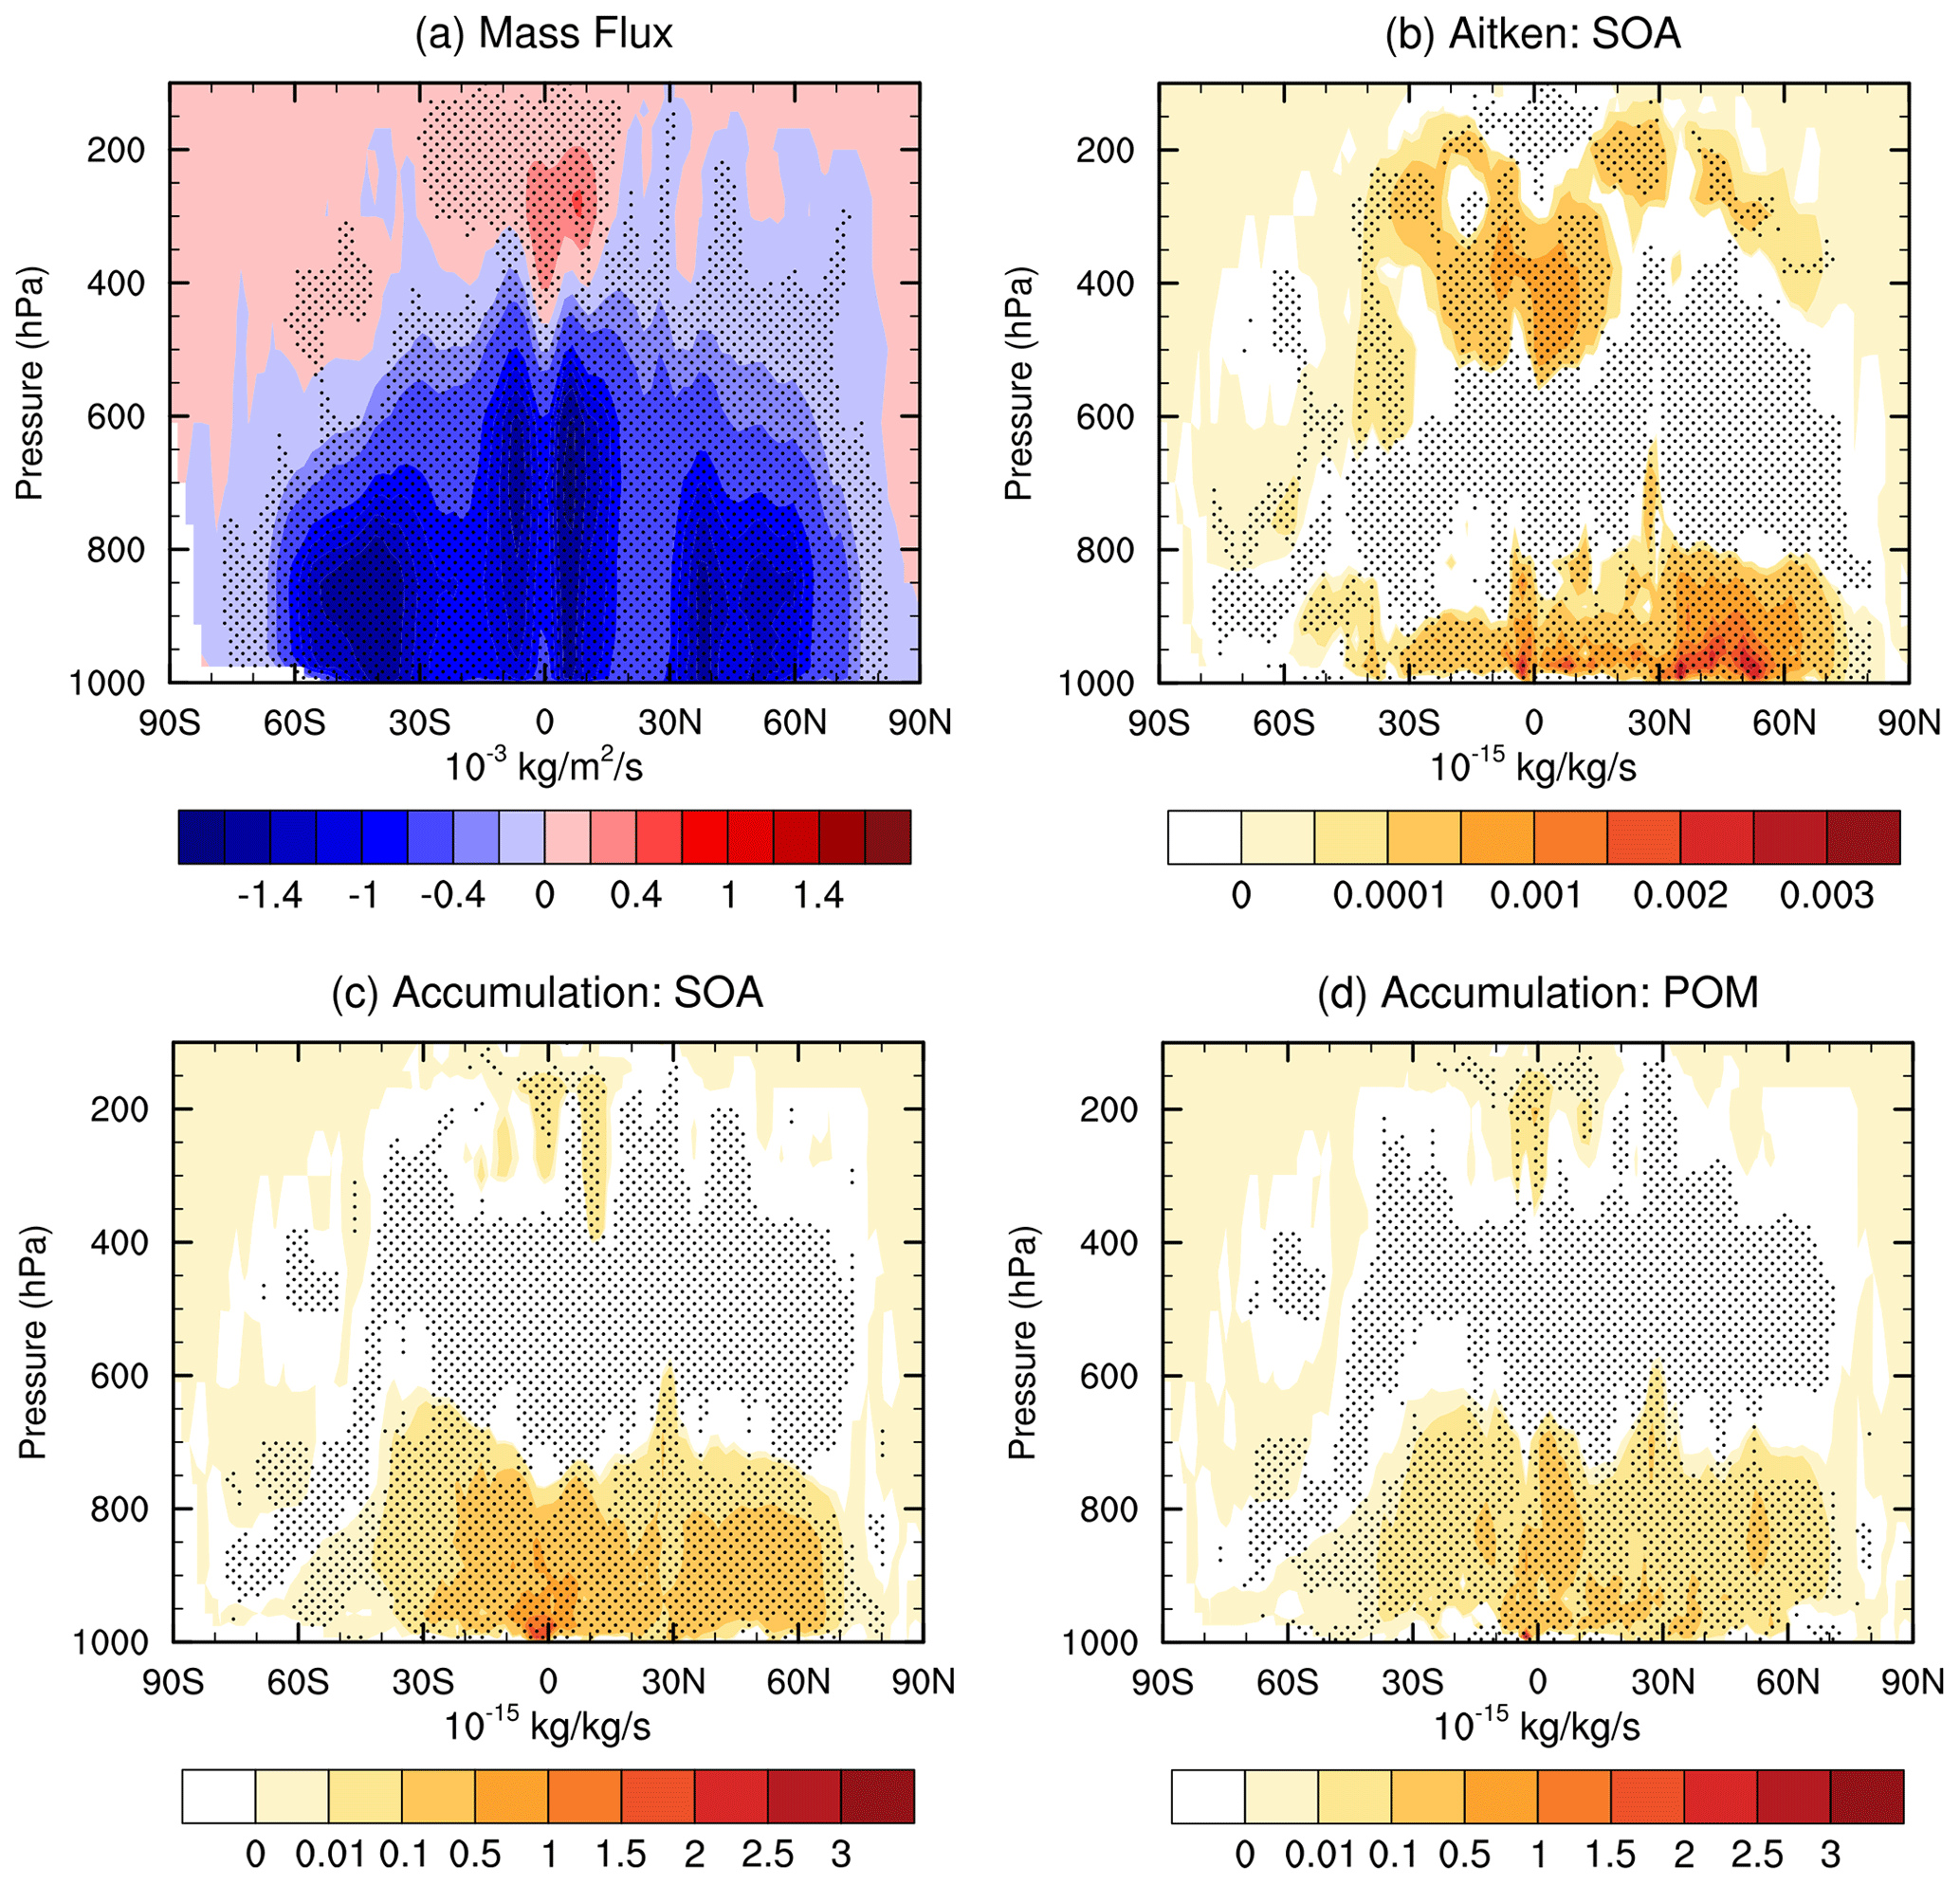
Figure 14Annual and zonal mean cross sections of changes in (a) mass flux from deep convection and (b–c) vertical transport of POM and SOA aerosols by deep convection between STOC and CAM5 runs (STOC–CAM5). Areas exceeding the 95 % t-test confidence level are stippled.
3.3 Aerosol amount changes
To investigate the impact of reduced aerosol wet removal on aerosol mass concentrations in the atmosphere, Fig. 13 presents latitude–pressure cross sections of changes in annual mean mass mixing ratios of different aerosol species between CAM5 and STOC. The aerosol concentrations for all species are increased throughout the troposphere. But the peak heights differ for different aerosol types. Sulfate and sea salt peak near the surface while dust, black carbon, POM and SOA show maxima at around 800 hPa. In terms of the latitudinal variation, the largest changes are broadly located in the tropics and midlatitudes in both hemispheres, corresponding to the ITCZ convection region and midlatitude cyclone regions. The exception is dust, for which the maximum is between the Equator and 30∘ N where the Sahara is. In addition to the primary maxima at the lower troposphere, a secondary peak is found at the upper troposphere (∼ 200 hPa) for all aerosol species, especially in the tropics. The significant increases in aerosols in the lower troposphere primarily result from reduced light rain. As will be seen in Fig. 14 below, convective transport also has a substantial contribution. The secondary peak is apparently associated with convective transport. To verify this, Fig. 14 shows the difference of convective mass flux between STOC and CAM5 and the vertical transport of selected aerosol types. Although the mass flux in deep convection in the lower troposphere is reduced because of the reduced frequency of convection (Fig. 14a), the increases in aerosol concentrations still lead to the enhancement of the vertical aerosol transport by deep convection (e.g., POM and SOA, Fig. 14c–d). In the upper troposphere, there is an increase in convective mass flux. This is due to the increase in the frequency of more intense convection and precipitation (Fig. 3). Correspondingly, there is more vertical aerosol transport in the upper troposphere (Wang and Zhang, 2016). Other aerosol species transported by deep convection have similar results (figure not shown). As for the sulfate aerosol change, the increase in the secondary sulfate aerosol production from aqueous-phase chemical reactions in STOC resulting from increased cloud liquid (Wang and Zhang, 2016) also contributes to the increase in the sulfate aerosol burden.
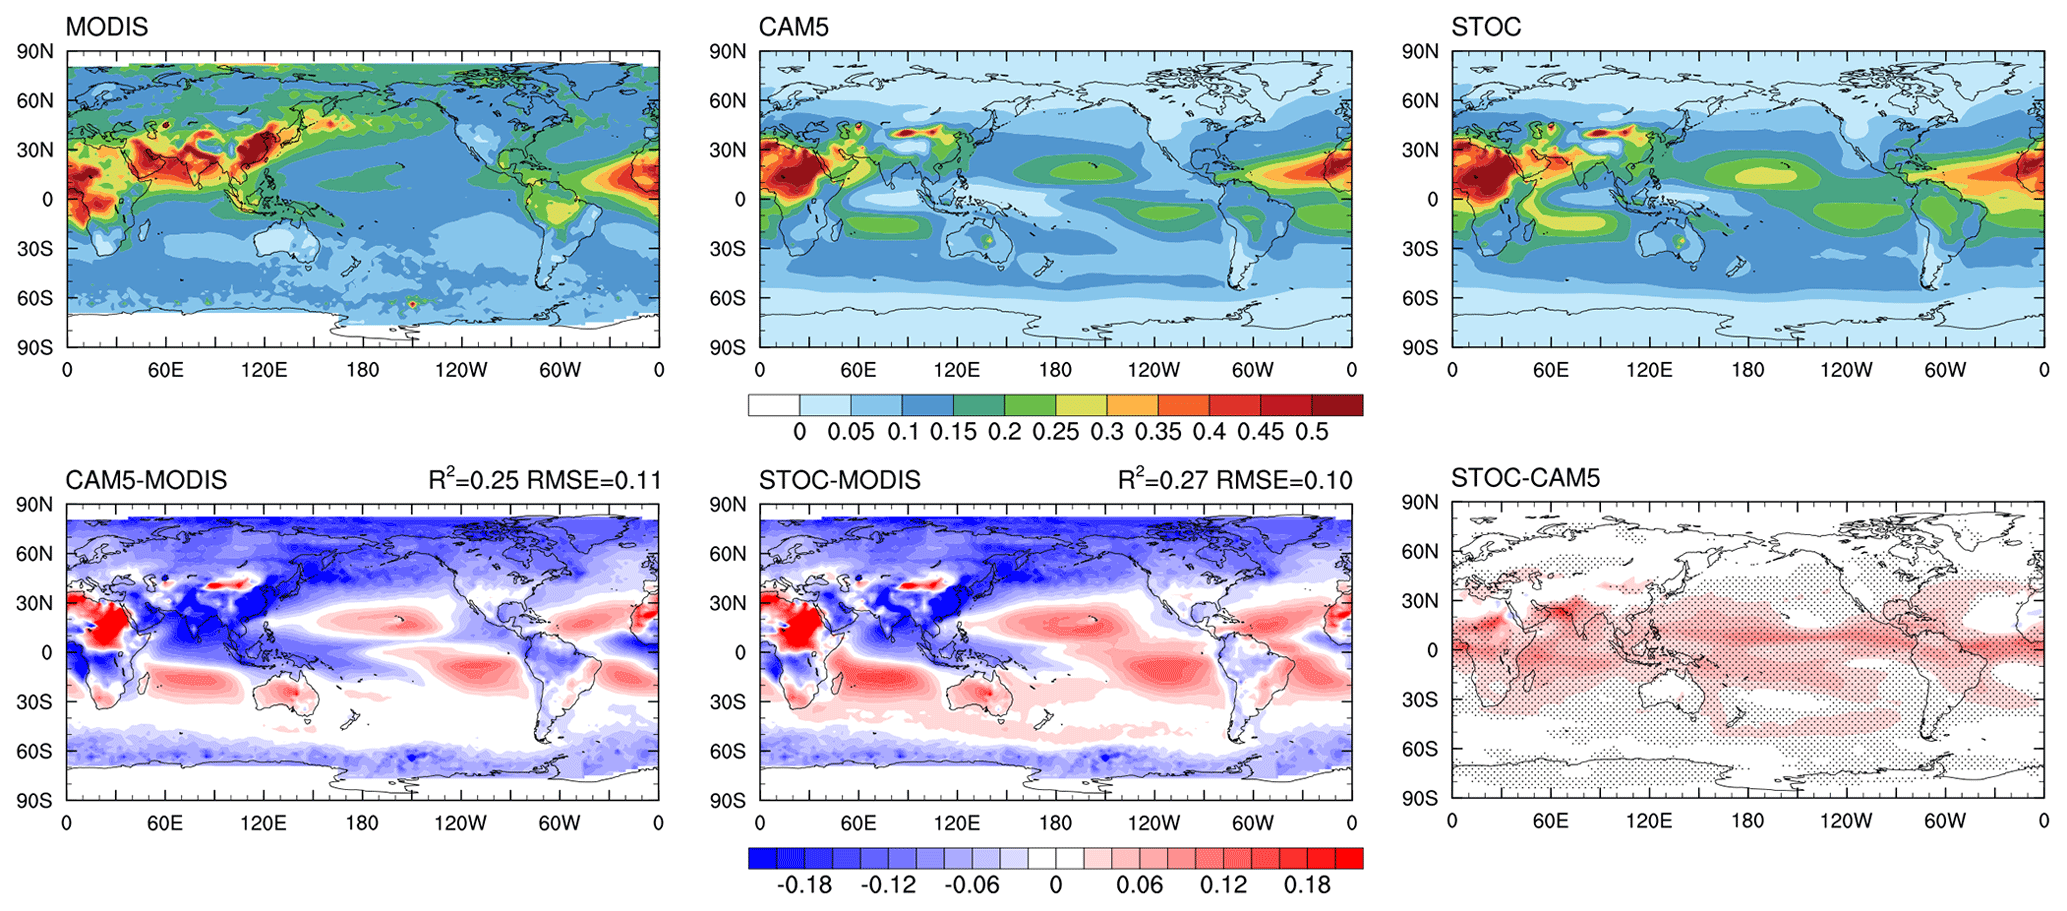
Figure 15Global distributions of AOD in MODIS, CAM5 and STOC and their differences. The stippled areas indicate that the difference between CAM5 and STOC is statistically significant at the 0.05 level. Values in the top right corner for the differences between simulations and observations are the coefficient of determination (R2) and the weighted root-mean-square error (RMSE).
With the increases in aerosol burdens, we explore whether this results in an improvement of simulated AOD. In comparison with observations, the underestimation of AOD over land, except for arid and semi-arid regions, in CAM5 is mitigated after suppressing light rain frequency in STOC (Fig. 15). Although there is some degradation over oceans in STOC which further overestimates AOD, it still performs better than CAM5, showing a larger R2 (the coefficient of determination) and a smaller RMSE (root-mean-square error) compared with MODIS (Wang et al., 2021a).
This study aims to identify the scavenging amount modes for different aerosol species in different sizes. In the standard CAM5 with too much light precipitation mainly associated with too frequent convection, for a given aerosol mode, there are no obvious differences in the scavenging amount modes among different aerosol species. However, as the aerosol size grows, the scavenging amount mode decreases, suggesting that lighter rainfall is more efficient at removing larger particles. Specifically, the scavenging amount modes in the Aitken, accumulation and coarse modes are around 10–12, 8–9 and 7–8 mm d−1, respectively, over the tropics. As latitude increases poleward, the scavenging amount mode in each aerosol mode is decreased substantially. In comparison with the scavenging amount modes over the ocean, the values over land are generally smaller. With the effective reduction of too frequent convection by the stochastic deep convection parameterization, STOC systematically increases the scavenging amount mode for all aerosol species in each mode, which is the most prominent along the ITCZ, exceeding 20 mm d−1 for small particles. For both CAM5 and STOC, the scavenging amount modes of all aerosols are smaller than the rainfall amount modes, implying the rainfall intensity associated with the most accumulated rain does not equal the most accumulated wet deposition. The rainfall frequency plays a more critical role in regulating the accumulated aerosol wet deposition than in the most accumulated rainfall.
The aerosol optical depth is dominated by atmospheric interstitial aerosols, which are several orders of magnitude larger than cloud-borne (and ice-borne) aerosols. In CAM5, in-cloud aerosol wet deposition for stratiform clouds affects cloud-borne aerosol concentrations only (see Sect. 2.2). This study demonstrates that convective precipitation has higher efficiency in removing atmospheric interstitial aerosols than large-scale precipitation in CAM5. Even at high latitudes where convection is infrequent, aerosol wet scavenging, especially for fine particles, is still dominantly from convective precipitation. If the total wet deposition is considered, which would include cloud-borne aerosol wet deposition, the fractional contribution to wet deposition from large-scale precipitation for all aerosols would exceed that from convective precipitation over midlatitudes and high latitudes. This implies that there is an inconsistency of fractional contributions from convective and stratiform clouds between precipitation and aerosol wet removal in CAM5. Further efforts to constrain the fractional contributions to aerosol wet removal from convective and stratiform clouds using observations or global cloud-resolving model simulations are needed.
As the excessive light rain is suppressed, it is expected that surface air pollution is increased. Surface PM2.5 wet removal is done by below-cloud scavenging, same as for below-cloud scavenging of interstitial aerosols for both stratiform and convective clouds. As mentioned in Sect. 2.2, the scavenging coefficient for below-cloud wet removal is calculated using the continuous collection equation. The scavenging coefficient varies strongly with particle size, with the lowest values for the accumulation mode. Therefore, the removal of PM2.5 particles in the accumulation mode by precipitation is less efficient than in the Aitken and coarse modes.
The approach proposed in this study to determine the scavenging amount mode and the corresponding fractional contributions from stratiform and convective clouds can be applied to other GCMs to better understand the individual relation between rainfall and aerosol wet scavenging, which is of importance for simulating aerosols in GCMs. The high sensitivity of the scavenging amount mode to the representation of the rainfall amount distribution at rain rates between 1 and 20 mm d−1 and the vital role of aerosol wet removal from convective clouds over the tropics highlight that the improvement of the aerosol wet deposition in GCMs should focus on not only the parameterization of aerosol wet scavenging itself but also the parameterization of convection.
The CESM1.2.1-CAM5.3 source code can be downloaded from the official CESM website http://www2.cesm.ucar.edu (last access: 21 December 2018, UCAR, 2021). The stochastic convection code is accessible from an open repository, Zenodo (https://doi.org/10.5281/zenodo.4543261) (Wang et al., 2021b).
The GPCP 1DD data are available from NASA GSFC RSD (https://psl.noaa.gov/data/gridded/data.gpcp.html, last access: 8 November 2015, GPCP, 2015). TRMM data are available from https://gpm.nasa.gov/data/directory (last access: 8 November 2015, TRMM, 2020). The CAM5 simulation output is provided in an open repository Zenodo (https://doi.org/10.5281/zenodo.4259554) (Wang et al., 2021c).
YW conceived the idea. YW conducted the model simulations and performed the analysis. YW and GJZ interpreted the results. YW wrote the paper, with contributions from GJZ. All authors discussed the results and edited the manuscript.
The contact author has declared that neither they nor their co-authors have any competing interests.
Publisher's note: Copernicus Publications remains neutral with regard to jurisdictional claims in published maps and institutional affiliations.
Guang J. Zhang is supported by the US Department of Energy, Office of Science, Biological and Environmental Research Program (BER), under award number DE-SC0022064. We thank the two reviewers for the comments which significantly improve the quality of the paper.
This work is supported by the National Key Research and Development Program of China grant 2017YFA0604000 and the National Natural Science Foundation of China grant 41975126.
This paper was edited by Jianping Huang and reviewed by two anonymous referees.
Abdul Razzak, H. and Ghan, S. J.: A parameterization of aerosol activation: 2. Multiple aerosol types, J. Geophys. Res.-Atmos., 105, 6837–6844, 2000.
Adler, R. F., Huffman, G. J., Chang, A., Ferraro, R., Xie, P.-P., Janowiak, J., Rudolf, B., Schneider, U., Curtis, S., and Bolvin, D.: The version-2 global precipitation climatology project (GPCP) monthly precipitation analysis (1979–present), J. Hydrometeorol., 4, 1147–1167, 2003.
Atlas, E. and Giam, C. S.: Ambient Concentration and Precipitation Scavenging of Atmospheric Organic Pollutants, Water Air Soil Poll., 38, 19–36, 1988.
Bretherton, C. S. and Park, S.: A New Moist Turbulence Parameterization in the Community Atmosphere Model, J. Climate, 22, 3422–3448, https://doi.org/10.1175/2008JCLI2556.1, 2009.
Cape, J. N., Coyle, M., and Dumitrean, P.: The atmospheric lifetime of black carbon, Atmos. Environ., 59, 256–263, 2012.
Chen, D., Dai, A., Hall, A.: The convective total precipitation ratio and the “drizzling” bias in climate models, J. Geophys. Res.-Atmos., 126, e2020JD034198, https://doi.org/10.1029/2020JD034198, 2021.
Chen, S., Huang, J., Li, J., Jia, R., Jiang, N., Kang, L., Ma, X., and Xie, T.: Comparison of dust emissions, transport, and deposition between the Taklimakan Desert and Gobi Desert, Sci. China Earth Sci., 60, 1338–1355, https://doi.org/10.1007/s11430-016-9051-0, 2017.
Dawson, J. P., Adams, P. J., and Pandis, S. N.: Sensitivity of PM2.5 to climate in the Eastern US: a modeling case study, Atmos. Chem. Phys., 7, 4295–4309, https://doi.org/10.5194/acp-7-4295-2007, 2007.
Ehsan, M. A., Almazroui, M., Yousef, A.: Impact of different cumulus parameterization schemes in SAUDI-KAU AGCM, Earth Syst. Environ., 1, 3, https://doi.org/10.1007/s41748-017-0003-0, 2017.
Fang, Y., Fiore, A. M., Horowitz, L. W., Gnanadesikan, A., Held, I., Chen, G., Vecchi, G., and Levy, H.: The impacts of changing transport and precipitation on pollutant distributions in a future climate, J. Geophys. Res.-Atmos., 116, D18303, https://doi.org/10.1029/2011JD015642, 2011.
GPCP: GPCP 1DD, available at: https://psl.noaa.gov/data/gridded/data.gpcp.html, last access: 8 November 2015.
Hou, P., Wu, S., McCarty, J. L., and Gao, Y.: Sensitivity of atmospheric aerosol scavenging to precipitation intensity and frequency in the context of global climate change, Atmos. Chem. Phys., 18, 8173–8182, https://doi.org/10.5194/acp-18-8173-2018, 2018.
Huffman, G. J., Adler, R. F., Morrissey, M. M., Bolvin, D. T., Curtis, S., Joyce, R., McGavock, B., and Susskind, J.: Global precipitation at one-degree daily resolution from multisatellite observations, J. Hydrometeorol., 2, 36–50, 2001.
Huffman, G. J., Bolvin, D. T., Nelkin, E. J., Wolff, D. B., Adler, R. F., Gu, G., Hong, Y., Bowman, K. P., and Stocker, E. F.: The TRMM multisatellite precipitation analysis (TMPA): Quasi-global, multiyear, combined-sensor precipitation estimates at fine scales, J. Hydrometeorol., 8, 38–55, 2007.
Huffman, G., Bolvin, D., and Adler, R.: GPCP version 1.2 1-degree daily (1DD) precipitation data set, World Data Center A, National Climatic Data Center, Asheville, NC, available at: ftp://rsd.gsfc.nasa.gov/pub/1-v1.2/, 2012b.
Huffman, G. J., Stocker, E. F., Bolvin, D. T., Nelkin, E. J., and Adler, R. F.: TRMM version 7 3B42 and 3B43 data sets. Greenbelt, MD: NASA/GSFC, available at: http://mirador.gsfc.nasa.gov, (last access: November 2014), 2012a.
Iacono, M. J., Delamere, J. S., Mlawer, E. J., Shephard, M. W., Clough, S. A., and Collins, W. D.: Radiative forcing by long-lived greenhouse gases: Calculations with the AER radiative transfer models, J. Geophys. Res.-Atmos., 113, D13103, https://doi.org/10.1029/2008JD009944, 2008.
Kooperman, G. J., Pritchard, M. S., O'Brien, T. A., and Timmermans, B. W.: Rainfall From Resolved Rather Than Parameterized Processes Better Represents the Present Day and Climate Change Response of Moderate Rates in the Community Atmosphere Model, J. Adv. Model. Earth Syst., 10, 971–988, 2018.
Kok, J. F., Adebiyi, A. A., Albani, S., Balkanski, Y., Checa-Garcia, R., Chin, M., Colarco, P. R., Hamilton, D. S., Huang, Y., Ito, A., Klose, M., Leung, D. M., Li, L., Mahowald, N. M., Miller, R. L., Obiso, V., Pérez García-Pando, C., Rocha-Lima, A., Wan, J. S., and Whicker, C. A.: Improved representation of the global dust cycle using observational constraints on dust properties and abundance, Atmos. Chem. Phys., 21, 8127–8167, https://doi.org/10.5194/acp-21-8127-2021, 2021.
Kummerow, C., Hong, Y., Olson, W. S., Yang, S., Adler, R. F., McCollum, J., Ferraro, R., Petty, G., Shin, D.-B., and Wilheit, T. T.: The evolution of the Goddard Profiling Algorithm (GPROF) for rainfall estimation from passive microwave sensors, J. Appl. Meteorol., 40, 1801–1820, 2001.
Liu, X., Easter, R. C., Ghan, S. J., Zaveri, R., Rasch, P., Shi, X., Lamarque, J.-F., Gettelman, A., Morrison, H., Vitt, F., Conley, A., Park, S., Neale, R., Hannay, C., Ekman, A. M. L., Hess, P., Mahowald, N., Collins, W., Iacono, M. J., Bretherton, C. S., Flanner, M. G., and Mitchell, D.: Toward a minimal representation of aerosols in climate models: description and evaluation in the Community Atmosphere Model CAM5, Geosci. Model Dev., 5, 709–739, https://doi.org/10.5194/gmd-5-709-2012, 2012.
Mahowald, N., Albani, S., Engelstaedter, S., Winckler, G., and Goman, M.: Model insight into glacial–interglacial paleodust records, Quat. Sci. Rev., 30, 832–854, 2011.
Morrison, H. and Gettelman, A.: A New Two-Moment Bulk Stratiform Cloud Microphysics Scheme in the Community Atmosphere Model, Version 3 (CAM3), Part I: Description and Numerical Tests, J. Climate, 21, 3642–3659, https://doi.org/10.1175/2008JCLI2105.1, 2008.
Neale, R. B., Richter, J. H., and Jochum, M.: The Impact of Convection on ENSO: From a Delayed Oscillator to a Series of Events, J. Climate, 21, 5904–5924, https://doi.org/10.1175/2008JCLI2244.1, 2008.
O'Brien, T. A., Collins, W. D., Kashinath, K., Rübel, O., Byna, S., Gu, J., Krishnan, H., and Ullrich, P. A.: Resolution dependence of precipitation statistical fidelity in hindcast simulations, J. Adv. Model. Earth Syst., 8, 976–990, 2016.
Park, S. and Bretherton, C. S.: The University of Washington Shallow Convection and Moist Turbulence Schemes and Their Impact on Climate Simulations with the Community Atmosphere Model, J. Climate, 22, 3449–3469, https://doi.org/10.1175/2008JCLI2557.1, 2009.
Pendergrass, A. G. and Hartmann, D. L.: Changes in the Distribution of Rain Frequency and Intensity in Response to Global Warming, J. Climate, 27, 8372–8383, 2014.
Plant, R. S. and Craig, G. C.: A Stochastic Parameterization for Deep Convection Based on Equilibrium Statistics, J. Atmos. Sci., 65, 87–105, https://doi.org/10.1175/2007JAS2263.1, 2008.
Pye, H. O. T., Liao, H., Wu, S., Mickley, L. J., Jacob, D. J., Henze, D. K., and Seinfeld, J. H.: Effect of changes in climate and emissions on future sulfate-nitrate-ammonium aerosol levels in the United States, J. Geophys. Res., 114, D01205, https://doi.org/10.1029/2008JD010701, 2009.
Qiu, L., Im, E. S., Hur, J., and Shim, K. M.: Added value of very high resolution climate simulations over South Korea using WRF modeling system, Clim. Dynam., 54, 173–189, 2020.
Radke, L. F., Hobbs, P. V., and Eltgroth, M. W.: Scavenging of Aerosol Particles by Precipitation, J. Appl. Meteorol., 19, 715–722, 1980.
Slinn, W. G. N.: Precipitation scavenging, in Atmospheric Science and Power Production, edited by: D. Randerson, U.S. Dept. of Energy, Washington D. C., 472–477, 1984.
Tai, A. P. K., Mickley, L. J., Jacob, D. J., Leibensperger, E. M., Zhang, L., Fisher, J. A., and Pye, H. O. T.: Meteorological modes of variability for fine particulate matter (PM2.5) air quality in the United States: implications for PM2.5 sensitivity to climate change, Atmos. Chem. Phys., 12, 3131–3145, https://doi.org/10.5194/acp-12-3131-2012, 2012.
TRMM: TRMM products, [data set] available at: https://gpm.nasa.gov/data/directory, last access: 27 March 2020.
UCAR: CESM1.2.1, [code] available at: http://www2.cesm.ucar.edu (last access: 21 December 2018), 2021.
Wang, X., Zhang, L., and Moran, M. D.: Uncertainty assessment of current size-resolved parameterizations for below-cloud particle scavenging by rain, Atmos. Chem. Phys., 10, 5685–5705, https://doi.org/10.5194/acp-10-5685-2010, 2010.
Wang, Y. and Zhang, G. J.: Global climate impacts of stochastic deep convection parameterization in the NCAR CAM5, J. Adv. Model. Earth Syst., 8, 1641–1656, https://doi.org/10.1002/2016MS000756, 2016.
Wang, Y., Zhang, G. J., and Craig, G. C.: Stochastic convective parameterization improving the simulation of tropical precipitation variability in the NCAR CAM5, Geophys. Res. Lett., 43, 6612–6619, https://doi.org/10.1002/2016GL069818, 2016.
Wang, Y., Xia, W., Liu, X., Xie, S., Lin, W., Tang, Q., Ma, H.-Y., Jiang, Y., Wang, B., and Zhang, G. J.: Disproportionate control on aerosol burden by light rain, Nat. Geosci., 14, 72–76, https://doi.org/10.1038/s41561-020-00675-z, 2021a.
Wang, Y., Zhang, G. J., and Craig, G. C.: Stochastic convection code based on the DOE EAMv1, Zenodo [code], https://doi.org/10.5281/zenodo.4543261, 2021b.
Wang, Y., Xia, W., Liu, X., Xie, S., Lin, W., Tang, Q., Ma, H.-Y., Jiang, Y., Wang, B., and Zhang, G. J.: Data of NG paper “Disproportionate Control on Aerosol Burden by Light Rain”, Zenodo [data set], https://doi.org/10.5281/zenodo.4259554, 2021c.
Zhang, G. J. and McFarlane, N. A.: Sensitivity of climate simulations to the parameterization of cumulus convection in the Canadian Climate Centre general circulation model, Atmos. Ocean, 33, 407–446, 1995.