the Creative Commons Attribution 4.0 License.
the Creative Commons Attribution 4.0 License.
 | 12 Nov 2021
Influence of springtime atmospheric circulation types on the distribution of air pollutants in the Arctic
Abhay Devasthale
Tiina Nygård
The transport and distribution of short-lived climate forcers in the Arctic are influenced by the prevailing atmospheric circulation patterns. Understanding the coupling between pollutant distribution and dominant atmospheric circulation types is therefore important, not least to understand the processes governing the local processing of pollutants in the Arctic, but also to test the fidelity of chemistry transport models to simulate the transport from the southerly latitudes. Here, we use a combination of satellite-based and reanalysis datasets spanning over 12 years (2007–2018) and investigate the concentrations of NO2, O3, CO and aerosols and their co-variability during eight different atmospheric circulation types in the spring season (March, April and May) over the Arctic. We carried out a self-organizing map analysis of mean sea level pressure to derive these circulation types. Although almost all pollutants investigated here show statistically significant sensitivity to the circulation types, NO2 exhibits the strongest sensitivity among them. The circulation types with low-pressure systems located over the northeast Atlantic show a clear enhancement of NO2 and aerosol optical depths (AODs) in the European Arctic. The O3 concentrations are, however, decreased. The free tropospheric CO is increased over the Arctic during such events. The circulation types with atmospheric blocking over Greenland and northern Scandinavia show the opposite signal in which the NO2 concentrations are decreased and AODs are smaller than the climatological values. The O3 concentrations are, however, increased, and the free tropospheric CO is decreased during such events.
The study provides the most comprehensive assessment so far of the sensitivity of springtime pollutant distribution to the atmospheric circulation types in the Arctic and also provides an observational basis for the evaluation of chemistry transport models.
- Article
(9190 KB) - Full-text XML
- BibTeX
- EndNote


The transport of anthropogenic pollutants from the southerly latitudes has many implications for the Arctic (Law and Stohl, 2007; Quinn et al., 2008; Shindell et al., 2008; Arnold et al., 2016; Willis et al., 2018; Abbatt et al., 2019; Schmale et al., 2021). At daily to weekly scales, the pollutants could exert an impact on the direct radiative forcing, thereby conditioning the atmospheric thermodynamics and influencing the surface energy budget. The transport of short-lived climate forcers (SLCFs), in particular, absorbing aerosols such as black carbon, is important in this context. The SLCFs can modulate the energy budget at shorter timescales, thereby possibly influencing the seasonal sea-ice evolution. Apart from their direct radiative effects, the SLCFs and other anthropogenic pollutants can also influence the cloud properties, exerting so-called indirect effects. At climate timescales, while mitigating the effects of increased carbon dioxide (CO2) and methane (CH4) could take many decades to even a few hundred years, the regulation of SLCFs is considered as one of the effective strategies that could meanwhile be implemented to curb the overall impact of increasing greenhouse gases.
The Arctic Ocean is a very special region in this context, not only due to its geography and unique nature of environmental conditions but also due to the absence of any major sources of anthropogenic pollution in the central Arctic. The pollution sources are located either in the coastal zones or in the midlatitude regions. This means that the net effect of SLCFs and the efficacy of their reduction measures depend heavily on the atmospheric transport and the prevailing local atmospheric circulation patterns, which could either dampen or favor the intended effects. This is also an area of research, where there exists a large knowledge gap currently. The uncertainties in model simulations of the impact of SLCFs on the Arctic are therefore high, limiting the design and assessment of the relevant reduction policies.
Pollutant transport to the Arctic occurs nearly all year round, and this transport is heavily influenced by large-scale atmospheric circulation and various dynamical mechanisms, for example, cyclones, location of the storm track, high-latitude blockings, and North Atlantic and Arctic oscillations (Duncan and Bey, 2004; Messori et al., 2018; Papritz and Dunn-Sigouin, 2020), as well as the local environmental and meteorological conditions (for example, structure of the atmospheric boundary layer, temperature and humidity inversions, the state of the sea-ice, clouds) during different times of the year. In spring, the meteorological conditions in the Arctic are also usually more diverse than in the winter or the summer months, and the photochemistry begins to play an important role as the solar illumination conditions improve. The polar dome (Bozem et al., 2019), isolating cold air masses in the lower troposphere in the high Arctic from the rest of the Arctic, starts to weaken in spring, allowing for more frequent exchange of air masses between the high Arctic and the lower latitudes. In addition to other anthropogenic sources, the pollutants from biomass burning are also being carried to the Arctic in spring (Stohl et al., 2007; Warneke et al., 2009, 2010). A host of studies have rightfully pointed out the existence, implications and importance of Arctic haze in shaping the Arctic weather and climate in the springtime. Hence, the spring season is a good test bed to investigate the coupling of prevailing weather states and the pollutant distribution in the Arctic. Furthermore, purely from the observational perspective, the availability of satellite-based observations from the sensors that rely on the solar channels increases in spring, as the improved solar illumination conditions allow the retrievals of trace gases.
In light of the reasons mentioned above, it is understandable that a number of major campaigns have been carried out in spring, providing valuable data and characterizing pollutant variability in relation to the transport and local meteorological conditions. The aircraft measurements, ARCTAS (Arctic Research of the Composition of the Troposphere from Aircraft and Satellites) and ARCPAC (Aerosol, Radiation, and Cloud Processes affecting Arctic Climate), among others, that were carried out as part of the POLARCAT (Polar Study using Aircraft, Remote Sensing, Surface Measurements and Models, of Climate, Chemistry, Aerosols and Transport) campaign for the spring and summer of 2008, provided a wealth of knowledge on Arctic pollution, the transport pathways and climate impacts (Law et al., 2014). This campaign period coincided with a variety of meteorological conditions that affected the transport of different pollutants into the Arctic. For example, ARCTAS data constrained with AIRS CO observations revealed that Arctic pollutants were dominated by European anthropogenic sources from the surface to the free troposphere in some cases and by Asian anthropogenic sources above 2 km (Fisher et al., 2010, Jacob et al., 2010). The Asian transport pathways are mainly via the warm conveyor belts (Stohl, 2006). Low-altitude ARCPAC flights also revealed increased pollutant concentrations, such as BC, throughout the Arctic atmospheric column during early spring of 2008, indicating accumulation of pollutants during the winter months due to lower temperatures, lack of solar radiation and stable stratification (Spackman et al., 2010). Also, Warneke et al. (2009) identified a significant influx of pollutants into Alaska from the forest fires in Russia and the agricultural burning in Asia. Modeling studies that followed these measurements estimated a reduction (0.8 % in spring) in snow albedo over the Arctic owing to BC deposition originating from Russian fires (Wang et al., 2011).
The large-scale descent and stratospheric intrusions also play a role in the observed enhancement of pollutants. For example, BrO concentrations at lower levels were also noted to be enhanced as a result of intrusions of lower stratospheric air into the troposphere (Jacob et al., 2010). The enhanced BrO is also closely linked to frontal lifting in a polar cyclone in spring (Blechschmidt et al., 2016). Despite a negative El Niño–Southern Oscillation (ENSO) year, Arctic weather was strongly influenced by the Eurasian or North American anthropogenic or boreal fires (Brock et al., 2011; McNaughton et al., 2011), resulting in increased concentrations of CO and aerosol loading (van der Werf et al., 2010; de Villiers et al., 2010; Schmale et al., 2011; Quennehen et al., 2011; di Pierro et al., 2013). Based on the aircraft measurements, Wespes et al., (2012) inferred that up to respectively 45 % and 60 % of the total O3 and HNO3 observed below 400 hPa over the Arctic were of European origin, which is transported via northward and westerly trans-Siberian pathways. The contribution of these pollutants from the Asian and North American sectors to the Arctic was much weaker. Most recently, Thomas et al. (2019) investigated the dependency of aerosol vertical distribution on the degree of atmospheric stability in the Arctic during winter and spring using the satellite observations. They argued that the observed dependency can be explained by the dominance of pollution transport within the boundary layer during winter and in the free troposphere during spring.
It is evident from the previous studies that a detailed assessment of the co-variability of atmospheric circulation types and pollutants is needed in the Arctic (a) to fully grasp the coupling between local meteorology, pollutant distribution and long-range transport in the Arctic and (b) to improve the representation of such co-variability and coupling in the models. Such an assessment will also help to evaluate and better constrain the existing chemistry transport models as well as fully coupled Earth system models. In the present study, we therefore pose and seek answers to the following scientific questions.
-
Which typical atmospheric circulation types (CTs) prevail in the Arctic during springtime, and what are the typical meteorological conditions associated with them?
-
How do these circulation types influence the distribution of trace gases such as NO2, O3 and CO?
-
Is there a distinguishable signal in the aerosol distribution during these circulation types?
The satellite-based datasets of NO2, CO and aerosols for March, April and May months from 2007 to 2018 are analyzed in this study. These are respectively based on retrievals from the Ozone Monitoring Instrument (OMI) on board the NASA Aura satellite, the hyperspectral Atmospheric Infrared Sounder (AIRS) instrument on board the Aqua satellite, and the Cloud and Aerosol Lidar with Orthogonal Polarization instrument on board the CALIPSO satellite. All three satellites belong to NASA's Afternoon Train (A-Train) convoy of satellites, thus providing simultaneous observations in space and time. The ozone dataset is obtained from the Copernicus Atmospheric Monitoring Service (CAMS) reanalysis.
We analyzed the AIRS Standard Daily IR-Only Version 7 product for the 500 hPa CO retrievals and OMI OMNO2d Version 3 product for the total column NO2 retrievals. The surface conditions and cloud cover play an important role in data sampling. These issues are taken into account before applying criteria for the selection of the data for each of these species and aerosol optical depth (AOD). In this study, the all-sky OMI NO2 retrievals are used, and the quality control is applied similarly to the previous studies (e.g., Thomas and Devasthale, 2017). A sensitivity study, wherein we investigated the NO2 anomalies during all-sky and clear-sky conditions (not shown here), is carried out. Though there are some differences in the magnitude of the anomalies, the overall NO2 response and patterns remain robust. In the case of CO, the hyperspectral capability of AIRS allows relatively accurate retrievals even under the presence of partial cloudiness. Therefore, in this study, we have considered cloud cover up to 70 %. The high-latitude regions are often characterized by the presence of either low-level boundary layer clouds or the high, thin cirrus clouds, both of which do not significantly affect the AIRS retrievals in the free troposphere at 500 hPa. It is also worth pointing out that previous studies have shown that the circulation patterns that favor pollution transport into the Arctic are also associated with the transport of heat and moisture into the Arctic, which in turn leads to increased cloudiness (Devasthale et al., 2020; Thomas et al., 2019; Johansson et al., 2017). Hence, to capture these most realistic scenarios, stringent thresholds on cloud cover are relaxed in the analysis. Imposing a strict threshold on cloud cover (for example, analyzing only clear-sky conditions to ensure the best quality retrievals) would introduce unrealistic clear-sky biases. To investigate the tropospheric aerosol optical depths (AODs), the CALIPSO Level 2 standard aerosol profile product version 4.2 available at 5 km horizontal resolution is used (CAL_LID_L2_05kmAPro-Standard-V4-20). In the case of the CALIPSO APro product, we select data only when the cloud–aerosol discrimination score is between and equal to (−50, −100) and when the extinction quality flag is 0, 1 or 2. For all satellite products, the data from the ascending passes (daytime conditions) are used. We analyze the retrievals designated TqJ (joint temperature and humidity retrievals) in the AIRS product as they are of the best quality and are suitable for process and climate studies. These datasets have been previously used to study the meteorological conditions and pollution variability in the high-latitude regions, including the Arctic (Devasthale et al., 2011; Devasthale and Thomas, 2012; Thomas and Devasthale, 2014; Devasthale et al., 2016; Thomas and Devasthale, 2017; Thomas et al., 2019).
Furthermore, we analyzed O3 at 925 hPa from CAMS since the focus is on the near-surface O3 and also since the satellite-based observations of the lower tropospheric ozone are either not reliable or available. The validation of the ozone CAMS reanalysis product is carried out extensively using ground-based measurements (TOAR database for surface ozone (Schulz et al., 2017a, b) and ozonesondes globally (Inness et al., 2019; Huijnen et al., 2020). The CAMS assimilation system makes use of data from SCIAMACHY, MIPAS, OMI, MLS, GOME-2 and SBUV/2 for O3. Even though the surface ozone is primarily model based, upgrades in the CAMS chemical data assimilation system, assimilated measurements, etc. have improved the near-surface estimates.
The dominant CTs in the Arctic in spring are identified and clustered by applying the self-organizing map (SOM) method, developed by Kohonen (2001). The SOM method uses unsupervised learning to determine generalized patterns in input data, and the method has previously been utilized to statistically cluster synoptic weather patterns (e.g., Hewitson and Crane, 2002; Cassano et al., 2006; Gibson et al., 2017; Nygård et al., 2019). In this study, we allocate 20 characteristic atmospheric circulation types in spring (MAM, 2007–2018), using mean sea-level pressure (MSLP) data of ERA5 reanalysis (Copernicus Climate Change Service, 2017) produced by the European Centre for Medium-Range Weather Forecasts at 6 h intervals as the input data. MSLP is used here as it is a robust indicator of the atmospheric state in the Arctic and captures and represents the circulation and flow patterns that affect the lower troposphere (Neal et al., 2016, and the references therein). This is important for analyzing the pollution transport processes that occur mostly in the lower troposphere and their subsequent impacts. In the initial phase of the SOM analysis, each of the 20 nodes in the SOM array has an associated reference vector with an equal dimension to the input MSLP data. Then, each time step of input MSLP data is compared with the reference vector of each node during the SOM training. The reference vectors, which are most similar to the input data vector, are adjusted towards the input data vector. This procedure is repeated until the reference vectors do not change anymore. The subsequent output is a two-dimensional SOM array of gridded MSLP fields, having probability density of the input MSLP data. This array is organized according to similarities in CTs, having the most similar circulation patterns located next to each other and the most dissimilar patterns in the corners of the array. Each time step of the input MSLP data is linked to the most similar circulation type or weather state (node) in the array. Based on these time steps, we are also able to form composites of trace gases in each CT separately. Although we originally investigated 20 CTs, here we present the results for eight of those 20 CTs for the sake of brevity. The selection of these eight CTs is based on (1) the strength of the signal observed in the trace gases, (2) the frequency of occurrence of the circulation types and (3) the diversity of the CTs. The results for all 20 CTs are in Appendix A for interested readers. The eight CTs (CT1–CT8) selected in this study (shown in Fig. 2) correspond respectively to CT1, CT4, CT9, CT12, CT14, CT18, CT19 and CT20 in Fig. A1 in Appendix A.
After deriving the prevalent circulation types, the climatological means of NO2, CO, O3 and AOD during the March, April and May months are computed separately. For each circulation type, the number of days that represent that type could be different in each month. In order to compute a climatological mean that takes into account this difference, we weighed the climatological means of each month with weighing factors shown in Fig. 1, giving climatological means of NO2, CO, O3 and AOD associated with each weather state. The composites of NO2, CO, O3 and AOD for each weather state are then computed. The anomalies shown later are the differences between these composites and the weighted climatological means for each weather state. Only those trace-gas anomalies that are statistically significant using Student's t test at the 90 % confidence interval are shown.
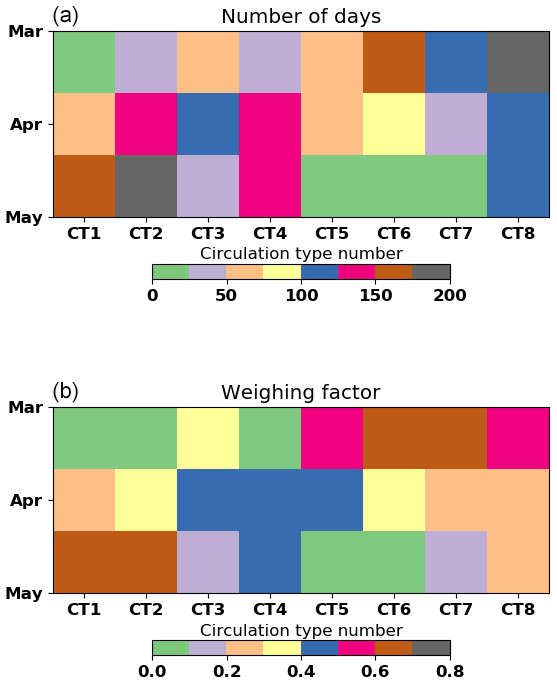
Figure 1The number of days analyzed for each circulation type and month (a) and the corresponding weighing factor used to compute the climatologies of trace gases and aerosols (b).
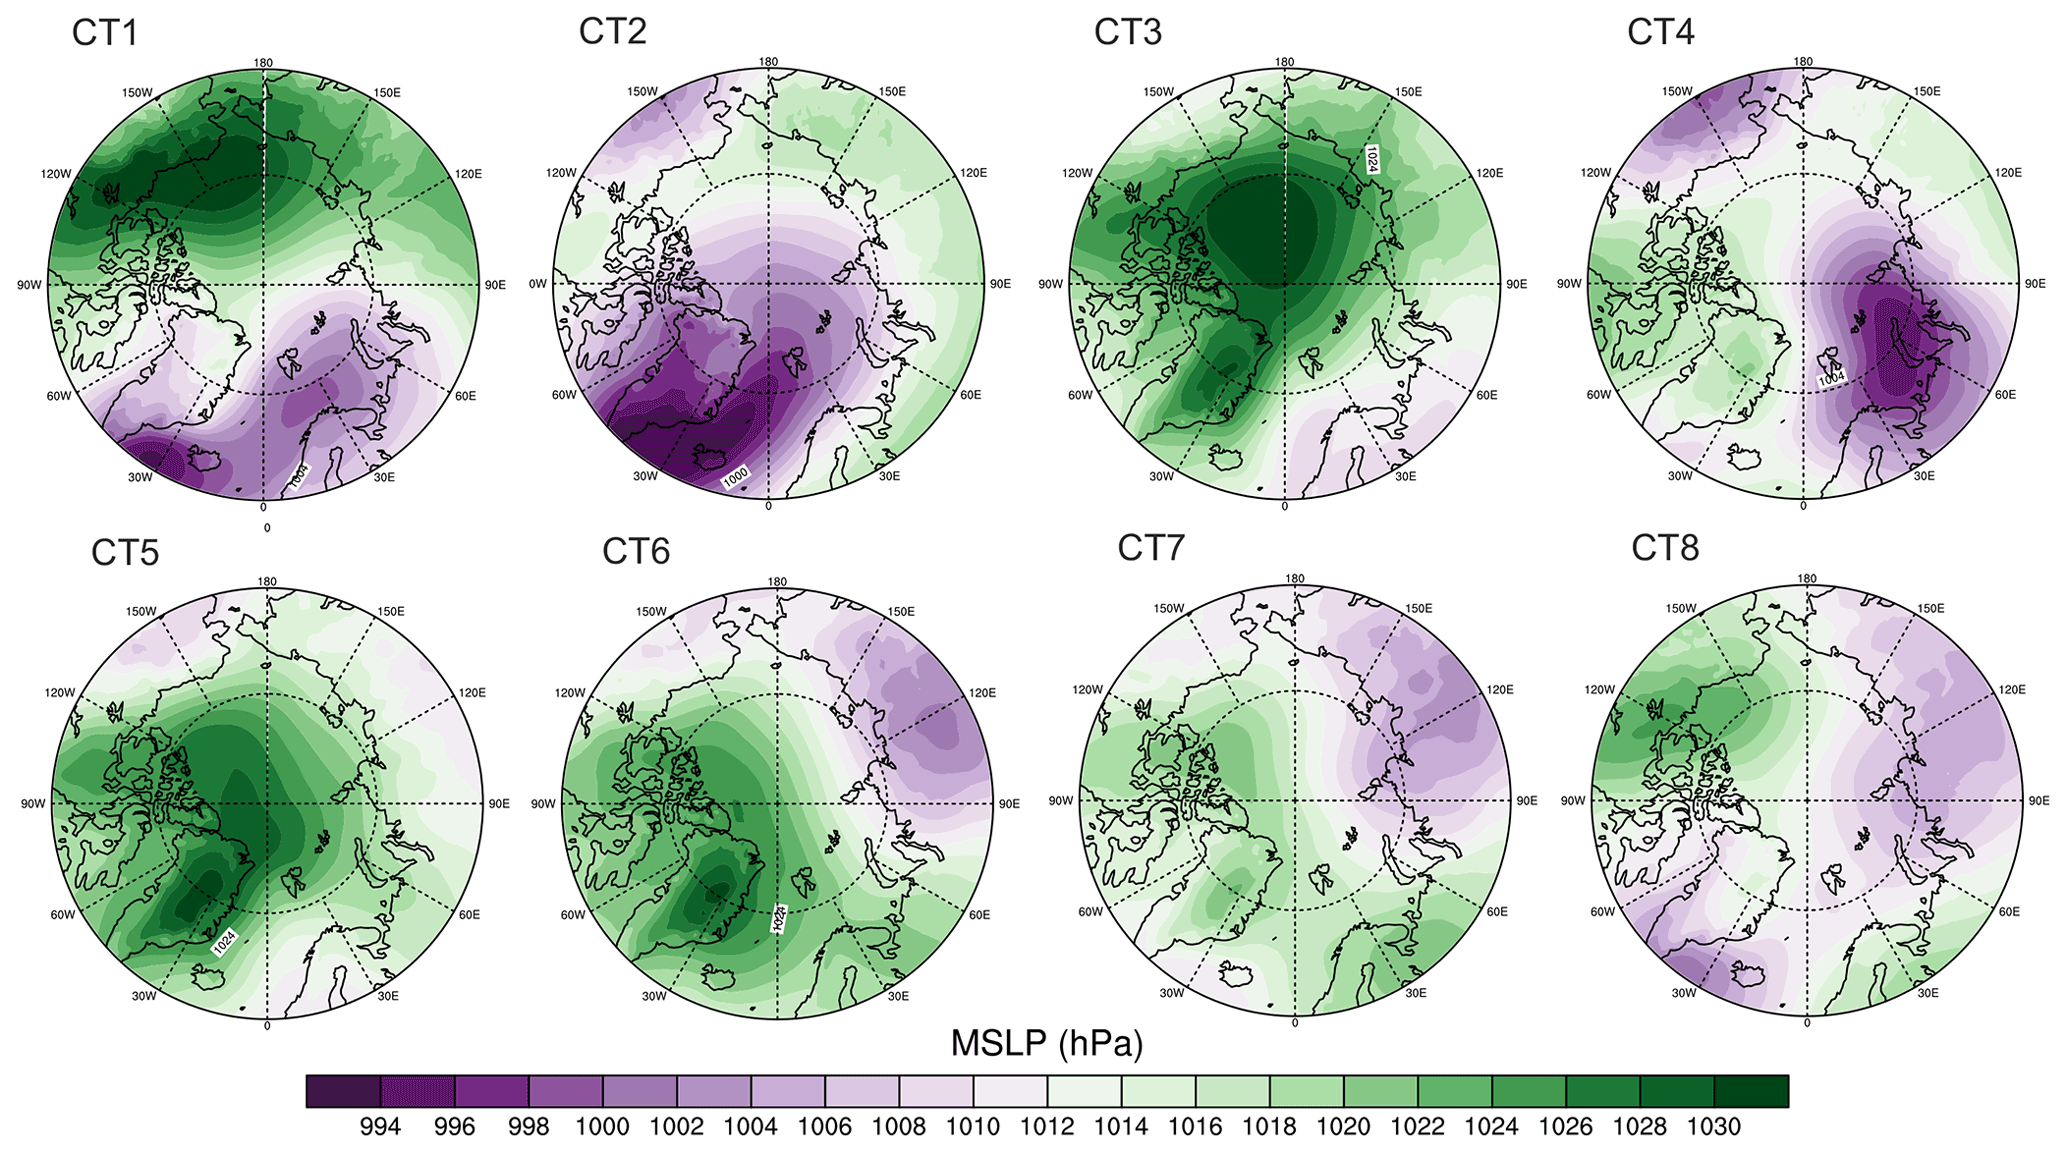
Figure 2Mean sea level pressure (MSLP) averaged over the cases belonging to each of the eight circulation types chosen from the 20 circulation types shown in the Appendix A.
Figure 2 shows the mean MSLP patterns during the eight CTs that are chosen from the SOM analysis. These types are mainly characterized by different locations and strengths of cyclones and anticyclones with respect to one another. For example, the first CT (CT1) is characterized by the most commonly observed low-pressure regimes in the northeast Atlantic and European Arctic and an intense Beaufort high on the Pacific side of the Arctic. In CT2, the low-pressure systems in the Greenland and Norwegian seas gradually intensify, while the anticyclones move over the Chukchi and East Siberian seas and weaken in their intensity. In the case of CT3, almost half of the Arctic (Greenland, Canadian Archipelago and Beaufort Sea and Alaska) is under the influence of a strong anticyclone, with the center of action located east–west of the international date line. The strongest anticyclonic conditions are observed during CT3, while the strongest cyclonic conditions are observed in CT2 over the Greenland and Norwegian seas. CT4 shows a tripole pattern wherein strong low-pressure systems are located over the Barents and Kara seas as well as over Alaska at the opposite side of the Arctic, while a weaker but noticeable high-pressure zone is observed over the Canadian archipelago. CT5 is characterized by anticyclonic conditions dominating over the entire central Arctic as well as Greenland and the Canadian archipelago. CT6 and CT7 show dipole patterns (with different intensities) with cyclonic conditions over Siberia and anticyclonic conditions prevailing at the opposite side of the Arctic Circle. Finally in CT8, cyclonic conditions are observed in both the northeast Atlantic and Siberia, while the anticyclonic conditions are observed over Scandinavia and Beaufort Sea. The SOM analysis presented in Fig. 2 reveals how varied and complex the atmospheric large-scale circulation patterns can be over the Arctic in spring.
Atmospheric circulation drives the transport in the atmosphere. For example, it largely distributes moisture in the Arctic atmosphere by dictating its horizontal transport and modulating the local evaporation at the surface. Figure 3 shows the specific humidity anomalies (dq), based on AIRS data, associated with those eight CTs. These anomalies are a good indicator (and manifestation) of the transport patterns shaped by the cyclonic and anticyclonic conditions mentioned above. Furthermore, atmospheric humidity has an impact on the aerosol optical properties and morphology as well as on the processes affecting the lifetime of trace gases. An increase in dq is detected in the Greenland and Norwegian seas in CT1 and CT2 due to the cyclonic conditions in the northeast Atlantic transporting more heat and moisture. In CT3, in the absence of such transport in the northeast Atlantic and due to the presence of anticyclones over Greenland and the Canadian Archipelago, drier and cooler air masses are transported over the Greenland, Norwegian and Barents seas, as seen in the reduction of humidity anomalies over these areas. A similar decrease in humidity is also observed in CT4 and CT6 over the Greenland and Norwegian seas. In CT4, an increase in dq can be seen over the Laptev Sea as a result of the strong low-pressure systems centered eastward of Scandinavia over the Barents and Kara seas along the Russian coast. In CT8, a slight increase in humidity is seen over the entire Arctic Ocean due to the influence of low-pressure systems located over the northeast Atlantic and northern Siberia. Our results indicate that the CTs derived based on MSLP can also be used to analyze the free and upper tropospheric pollutants. The AIRS-derived geopotential height anomalies at 500 hPa are shown in Fig. 4. There is a coupling between the lower and upper level circulation during those circulation types and, especially, a good resemblance in the locations of the centers of action of low-pressure systems and anticyclones derived based on MSLP and the 500 hPa geopotential heights.
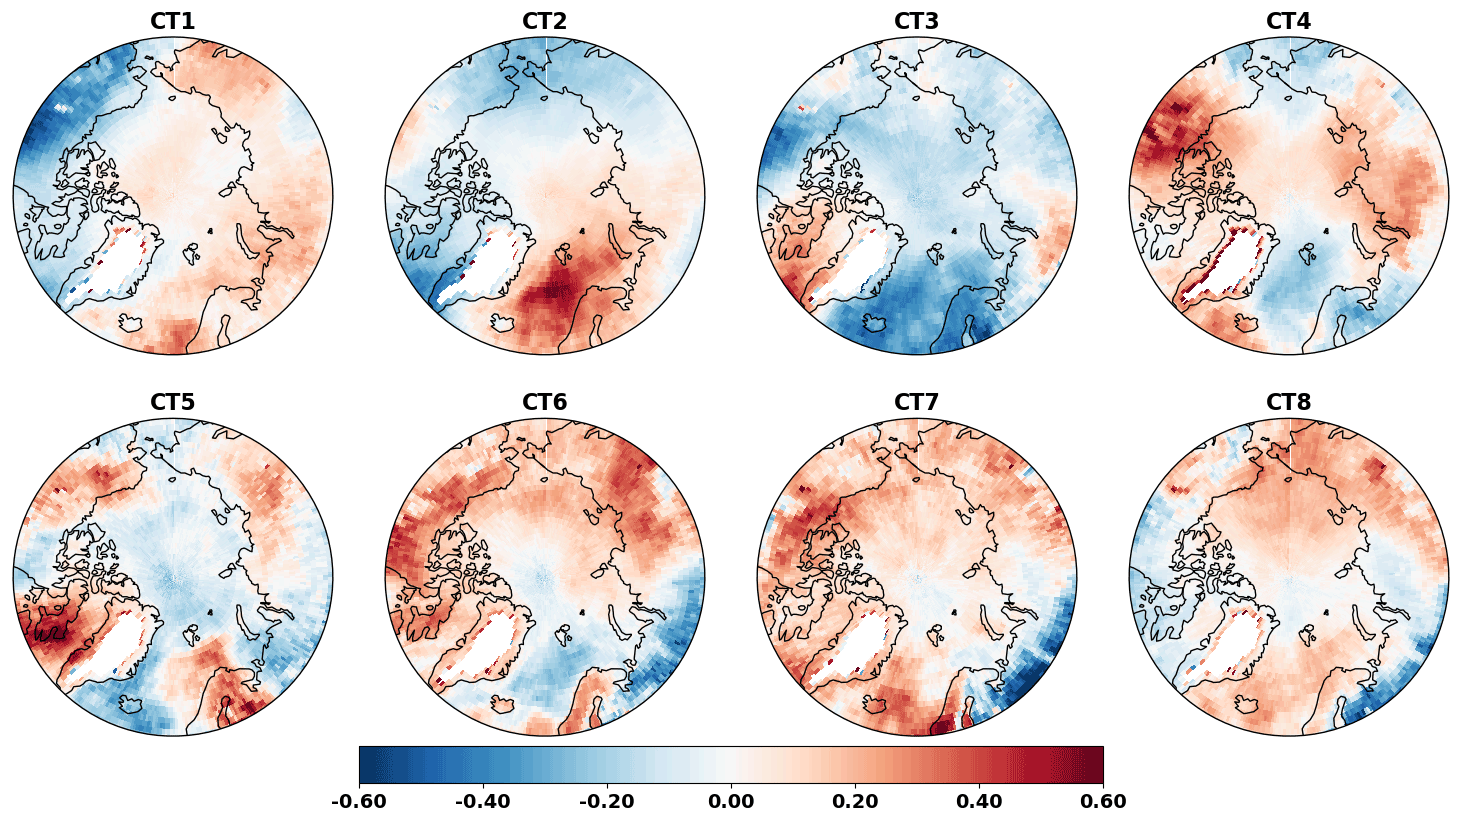
Figure 3The 850 hPa specific humidity anomalies (g kg−1) based on AIRS data for the eight circulation types.
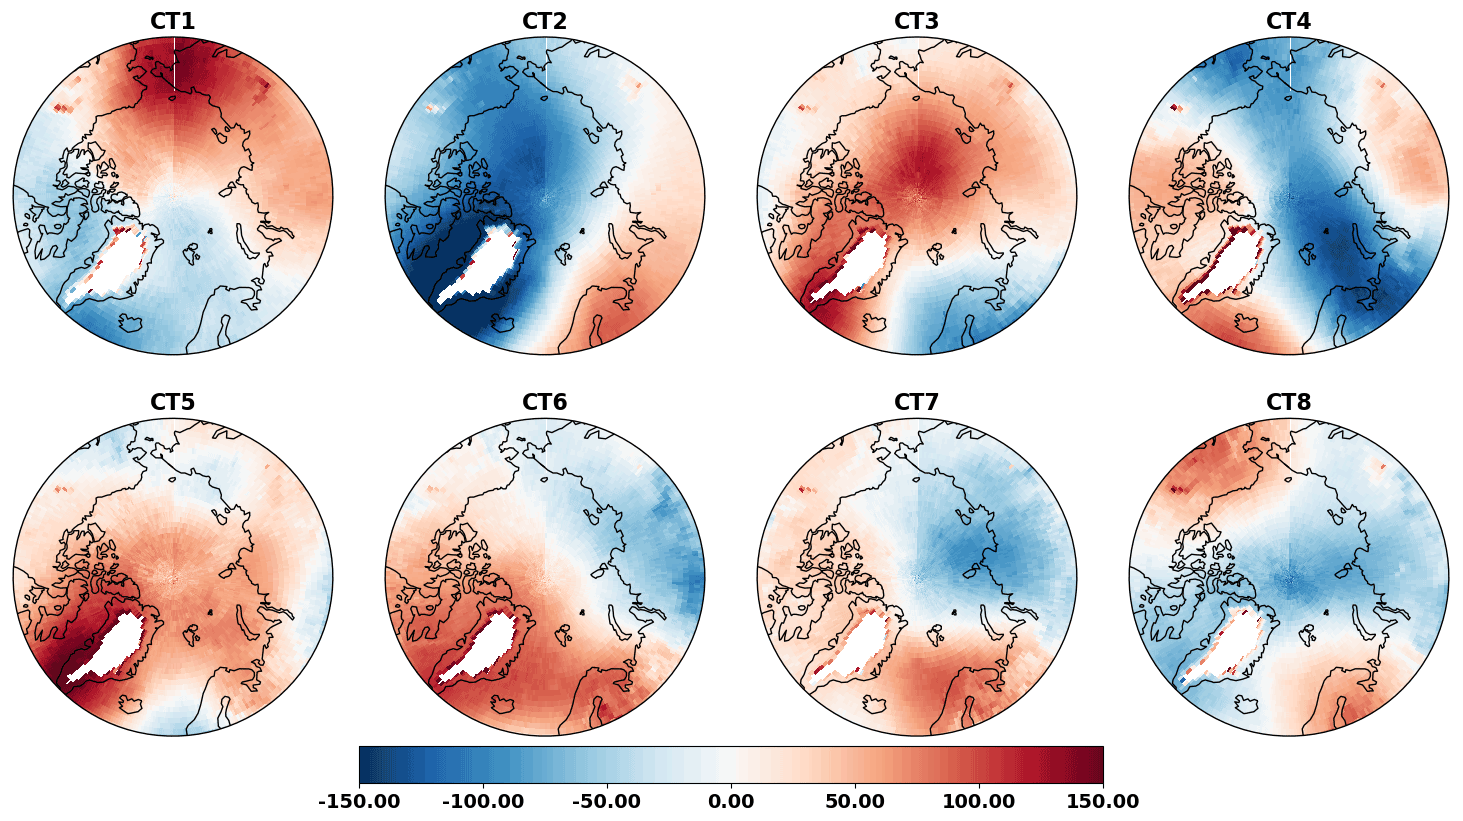
Figure 4Geopotential height anomalies (m) at 500 hPa based on AIRS data for the eight circulation types.
The response of NO2 to the CTs is shown in Fig. 5 in terms of weighed anomalies. It is to be noted that, while the SOM analysis is done over the region northward of 60∘ N in order to emphasize the circulation patterns in the Arctic region, we present the anomalies of the pollutants northward of 50∘ N in order to provide the large-scale spatial context. It can be seen that the spatial distribution of NO2 is highly sensitive to the CTs, not only over the polluted mainland and source regions but also over the Arctic Ocean. Particularly over northern Europe, a distinct pattern emerges, wherein the NO2 anomalies change sign gradually from CT1 to CT8 in response to the changing atmospheric circulation patterns. In CT1 and CT2, there is a clear transport signal in the NO2 anomalies. The location of low-pressure systems in the northeast Atlantic favors the transport of NO2 from the northern, central and eastern European regions into the Arctic. The increased specific humidity anomalies in the European Arctic further confirm such a transport (Fig. 3). The strongest signal is observed in CT2, when the center of action of the polar vortex is located over Greenland (Figs. 2 and 4) and the intensity of the vortex is stronger, favoring the increased transport of NO2 in the Barents and Kara seas, reaching even further north into the Arctic. Previous studies have indicated that, in the European sector of the Arctic, such transport occurs predominantly in the lower troposphere (Stohl, 2006; Thomas et al., 2019). A pronounced increase in humidity anomalies is also seen over these regions in CT2. Among all circulation types, the highest NO2 anomalies are observed over Scandinavia in CT1 and CT2, suggesting a noticeable influence of these circulation types in the pollution variability in these countries. The transport from the central and eastern European countries is especially prominent in CT2. It is to be noted that the circulation types CT1 and CT2 roughly resemble the typical loading patterns of North Atlantic Oscillation and/or Arctic Oscillations over the central and Eurasian Arctic, which is shown to have a noticeable impact on the pollutant variability over these regions (e.g., Eckhardt et al., 2003; Christoudias et al., 2012).
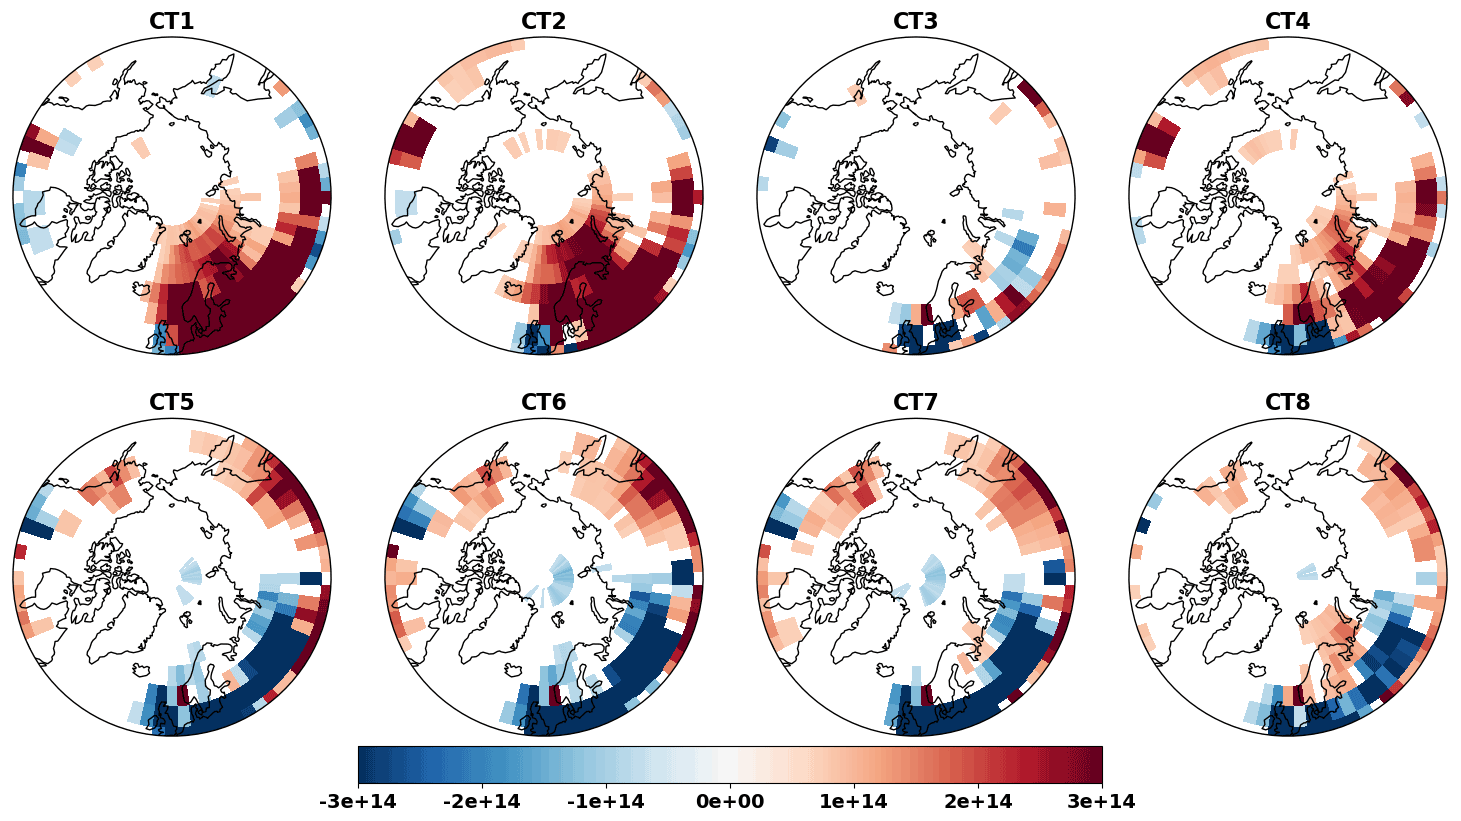
Figure 5NO2 total column anomalies (molecules cm−2) based on OMI data for the eight circulation types. Only those anomalies that are statistically significant at the 90 % confidence level are shown.
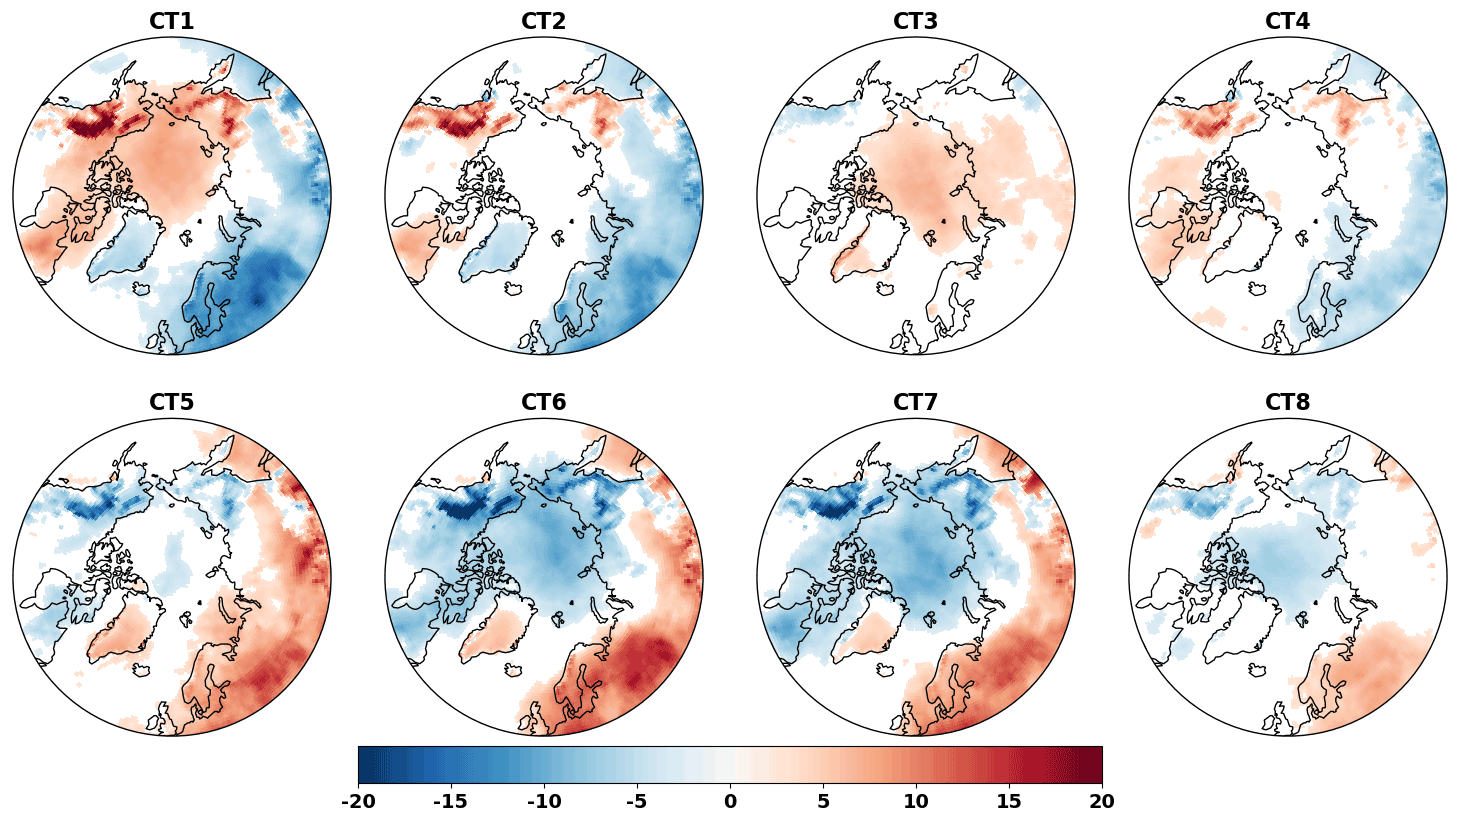
Figure 6The 925 hPa O3 anomalies (ppbv) based on CAMS data for the eight circulation types. Only those anomalies that are statistically significant at the 90 % confidence level are shown.
An entirely opposite NO2 response is seen in CT5 to CT8. In CT5 and CT6 with anticyclonic conditions prevailing over Greenland and northern north Atlantic at varying intensity, the transport of cleaner air masses from the central Arctic leads to negative NO2 anomalies over the central and northern parts of Europe. The anticyclone further moves eastwards over Greenland and Norwegian seas and over northern Scandinavia from CT5 to CT6, blocking the transport from the southerly latitudes and therefore leading to negative NO2 anomalies during these circulation types. In CT7, the circulation pattern in the Canadian Archipelago and European sector of the Arctic together with cyclonic conditions in central and eastern Siberian regions facilitate the northeast Asian transport of NO2 into Alaska and northern Canada. In CT8, the low-pressure systems over the northeast Atlantic and Siberia as well as the Kara and Laptev seas lead to a slight increase in NO2 concentration in the Barents Sea. The blocking over southern Scandinavia and Europe however limits the large-scale transport into the Arctic from the European sector. The northeast Asian regions and northern Pacific Ocean show no sensitivity to the circulation types, most likely due to the persistent nature of westerly winds over this region in combination with the persistent continental pollution outflow over the northern Pacific.
The O3 anomalies at 925 hPa also show sensitivity to the circulation types. They appear to be opposite in nature to that of the NO2 anomalies. For example, a reduction in the O3 concentrations over the northeast Atlantic and Scandinavia seen in CT1 and CT2 is consistent with the strong NO2 increases observed during the same circulation types. A statistically significant increase in the central Arctic is seen in CT1 and CT3. However, the corresponding NO2 anomalies over the central Arctic in these circulation types are not statistically significant. An inverse correspondence between O3 and NO2 away from the source regions is not expected due to the different lifetimes, aging and transport processes. A decrease in O3 concentrations over the central Arctic corresponds to the presence of cyclonic conditions over Eurasia and Siberia (CT6–CT8).
The springtime photochemistry in the Arctic is very complex, as duly noted in the rich literature that documents the research and observations on this subject matter (Lu et al., 2019, and the references therein). The interactions between NO2 and O3 are also highly nonlinear in reality and hence a one-to-one correlation can not be established. In the troposphere, NO is converted to NO2 in the presence of O3, which is a potential sink for O3. However, during sunlit conditions, NO2 is converted back to NO via photolysis, which results in O3 production. Apart from these chemical reactions, local meteorological conditions such as temperature, relative humidity and rainfall play an important role in the production and dispersion of these pollutants. Stratospheric intrusions are another source of O3 variability in the troposphere that may play a role under different circulation types (Yates et al., 2013; Langford et al., 2015; Lin et al., 2015). The persistent anticyclonic conditions could not only lead to the accumulation of the tropospheric O3 but also favor the large-scale descent or intrusions into the lower troposphere, leading to positive O3 anomalies.
Figure 7 shows the tropospheric AOD anomalies based on the CALIOP-CALIPSO aerosol profile product. It is to be noted that, being an active profiler, the spatial coverage of CALIOP-CALIPSO is very poor and the anomalies look patchy, particularly over the inland regions because of a limited number of samples for each circulation type. The passive imagers either do not have AOD data available in spring (due to poor illumination conditions) or the quality of the retrievals can be very poor due to the challenging surface conditions and the underlying uncertainties in cloud masking. CALIOP provides the most accurate sampling of aerosols over the Arctic Ocean in spring in comparison to passive imagers, but with this trade-off of having poor spatial sampling, and therefore the AOD data have to be interpreted cautiously. We, nonetheless, decided to include CALIPSO in the analysis since it can provide an important context while studying the trace gas variability. For example, we can see that there are at least two signals that are robust and consistent with other observations. An increase in AOD in CT1 and CT2 is observed in the Greenland and Norwegian seas and northern Scandinavia, which is consistent with the increases in NO2, further confirming the role of these circulation types in transporting the pollutants into the Arctic. An increase in humidity, as mentioned earlier, in CT1 and CT2 impacts the AODs due to increased water uptake during transport. These circulation types are similar to those that could change the stability regimes as a result of heat and moisture transport over the colder sea-ice surfaces in the inner Arctic and trapping the aerosols and pollutants below the inversions in the Eurasian sector of the Arctic, as previously reported in Thomas et al. (2019). The opposite tendencies in CT5 and CT6, wherein the negative AOD anomalies are observed over the Norwegian Sea and northern Scandinavia, are also consistent with the NO2 decreases observed in these circulation types. The anticyclones prevailing over Greenland and north of Scandinavia block the transport of trace gases and aerosols into the Arctic during these circulation patterns. The increased AODs along the western coast of Scandinavia in CT3 could be due to the location of anticyclones in the Arctic and the low-pressure systems in central Europe that transport pollutants from eastern Europe and western parts of Russia, including the biomass burning regions, over these coastal regions. In the case of other circulation types, the AOD anomalies are too patchy to draw meaningful conclusions in the sense that there are no consistent features with either the meteorological conditions or other pollutants.
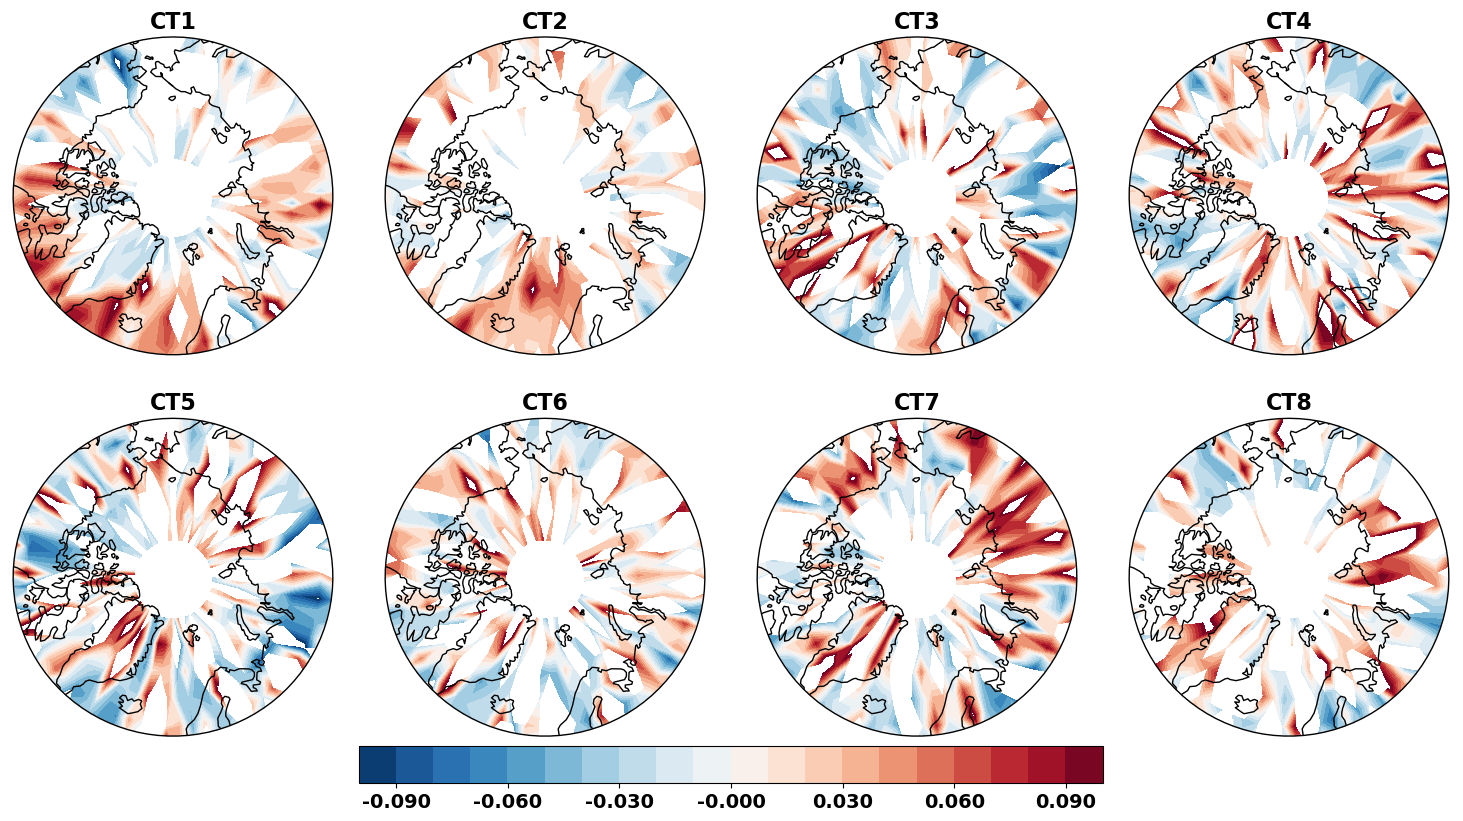
Figure 7Tropospheric AOD anomalies based on CALIOP-CALIPSO data for the eight circulation types with 90 % confidence.
Unlike tropospheric O3 and NO2, CO has an atmospheric lifetime ranging from a few weeks to a few months and therefore is often regarded as a suitable tracer to study the long-range pollution transport. Due to its longevity, the spatial distribution of CO in the free troposphere is also quite homogeneous compared to other trace gases, and the local pollution variability is often diffused in the large-scale signal. However, CO is an excellent tracer to study the coupling between the pollution variability in the free troposphere and the lower tropospheric circulation patterns, given the influence of these CTs on the entire troposphere, and also to study the large-scale, first-order impact of the CTs on the free tropospheric pollutants. Such a large-scale signal is indeed visible in the CO anomalies shown in Fig. 8. Two main regimes can be seen: one dominated by the Arctic-wide increases in the CO concentrations (e.g., CT1 to CT2) when the low-pressure systems are active in the North Atlantic and the other when the decreases in the CO concentrations (e.g., CT5 to CT7) can be seen over much of the Arctic likely due to the atmospheric blocking over those regions. The CO anomalies over Scandinavia, the northeast Atlantic, Greenland, and the Norwegian and Barents seas show the strongest sensitivity to the circulation types.

Figure 8The 500 hPa CO anomalies as volume mixing ratios based on AIRS data for the eight circulation types with 90 % confidence.
The transport and the distribution of the pollutants in the Arctic, especially that of the short-lived climate forcers, depends heavily on the prevailing atmospheric circulation patterns. Understanding pollutant variability in relation to the dominant circulation types is therefore important. Here, we investigate the concentrations of NO2, O3, CO and aerosols and their co-variability during the eight different circulation types in the spring season (March, April and May) over the Arctic. The circulation types discussed in this study are derived by the self-organizing map analysis of MSLP. A combination of satellite-based and reanalysis datasets spanning 12 years (2007–2018) is used. The following conclusions are drawn from the analysis.
-
The eight characteristic circulation patterns during spring, allocated by the SOM analysis based on the MSLP fields, represent different locations and intensities of cyclonic and anticyclonic events in relation to each other. The MSLP circulation patterns are connected to 500 hPa geopotential height anomalies and also shape the atmospheric humidity distribution. The circulation patterns largely dictate the transport in the atmosphere, especially from the main source areas in the southerly latitudes into the Arctic.
-
It is observed that all pollutants investigated here show sensitivity to the circulation types, and some common patterns emerge in their response. NO2 shows the strongest sensitivity among the trace gases and aerosols analyzed here.
-
The circulation types (CT1, CT2) with low-pressure systems located in the northeast Atlantic show a clear statistically significant enhancement of NO2 and AOD in the European Arctic. The O3 concentrations are however decreased in such events.
-
The circulation types (CT5, CT6 and CT7) with atmospheric blocking over Greenland and northern Scandinavia show the opposite signal, in that the NO2 concentrations are decreased and AODs are smaller than the climatological values. The O3 concentrations are however increased during these events in the European Arctic.
-
The first-order signal of the influence of circulation types on the free tropospheric CO is seen, with two main regimes emerging. The first regime shows the Arctic-wide positive anomalies in the CO concentrations when the low-pressure systems are active in the North Atlantic and the other when the negative CO anomalies are observed due to the atmospheric blocking over those regions.
The present study provides the most comprehensive investigations so far of the sensitivity of springtime pollutant distribution to the atmospheric circulation types in the Arctic, also providing an observational basis for the evaluation of chemistry transport models.
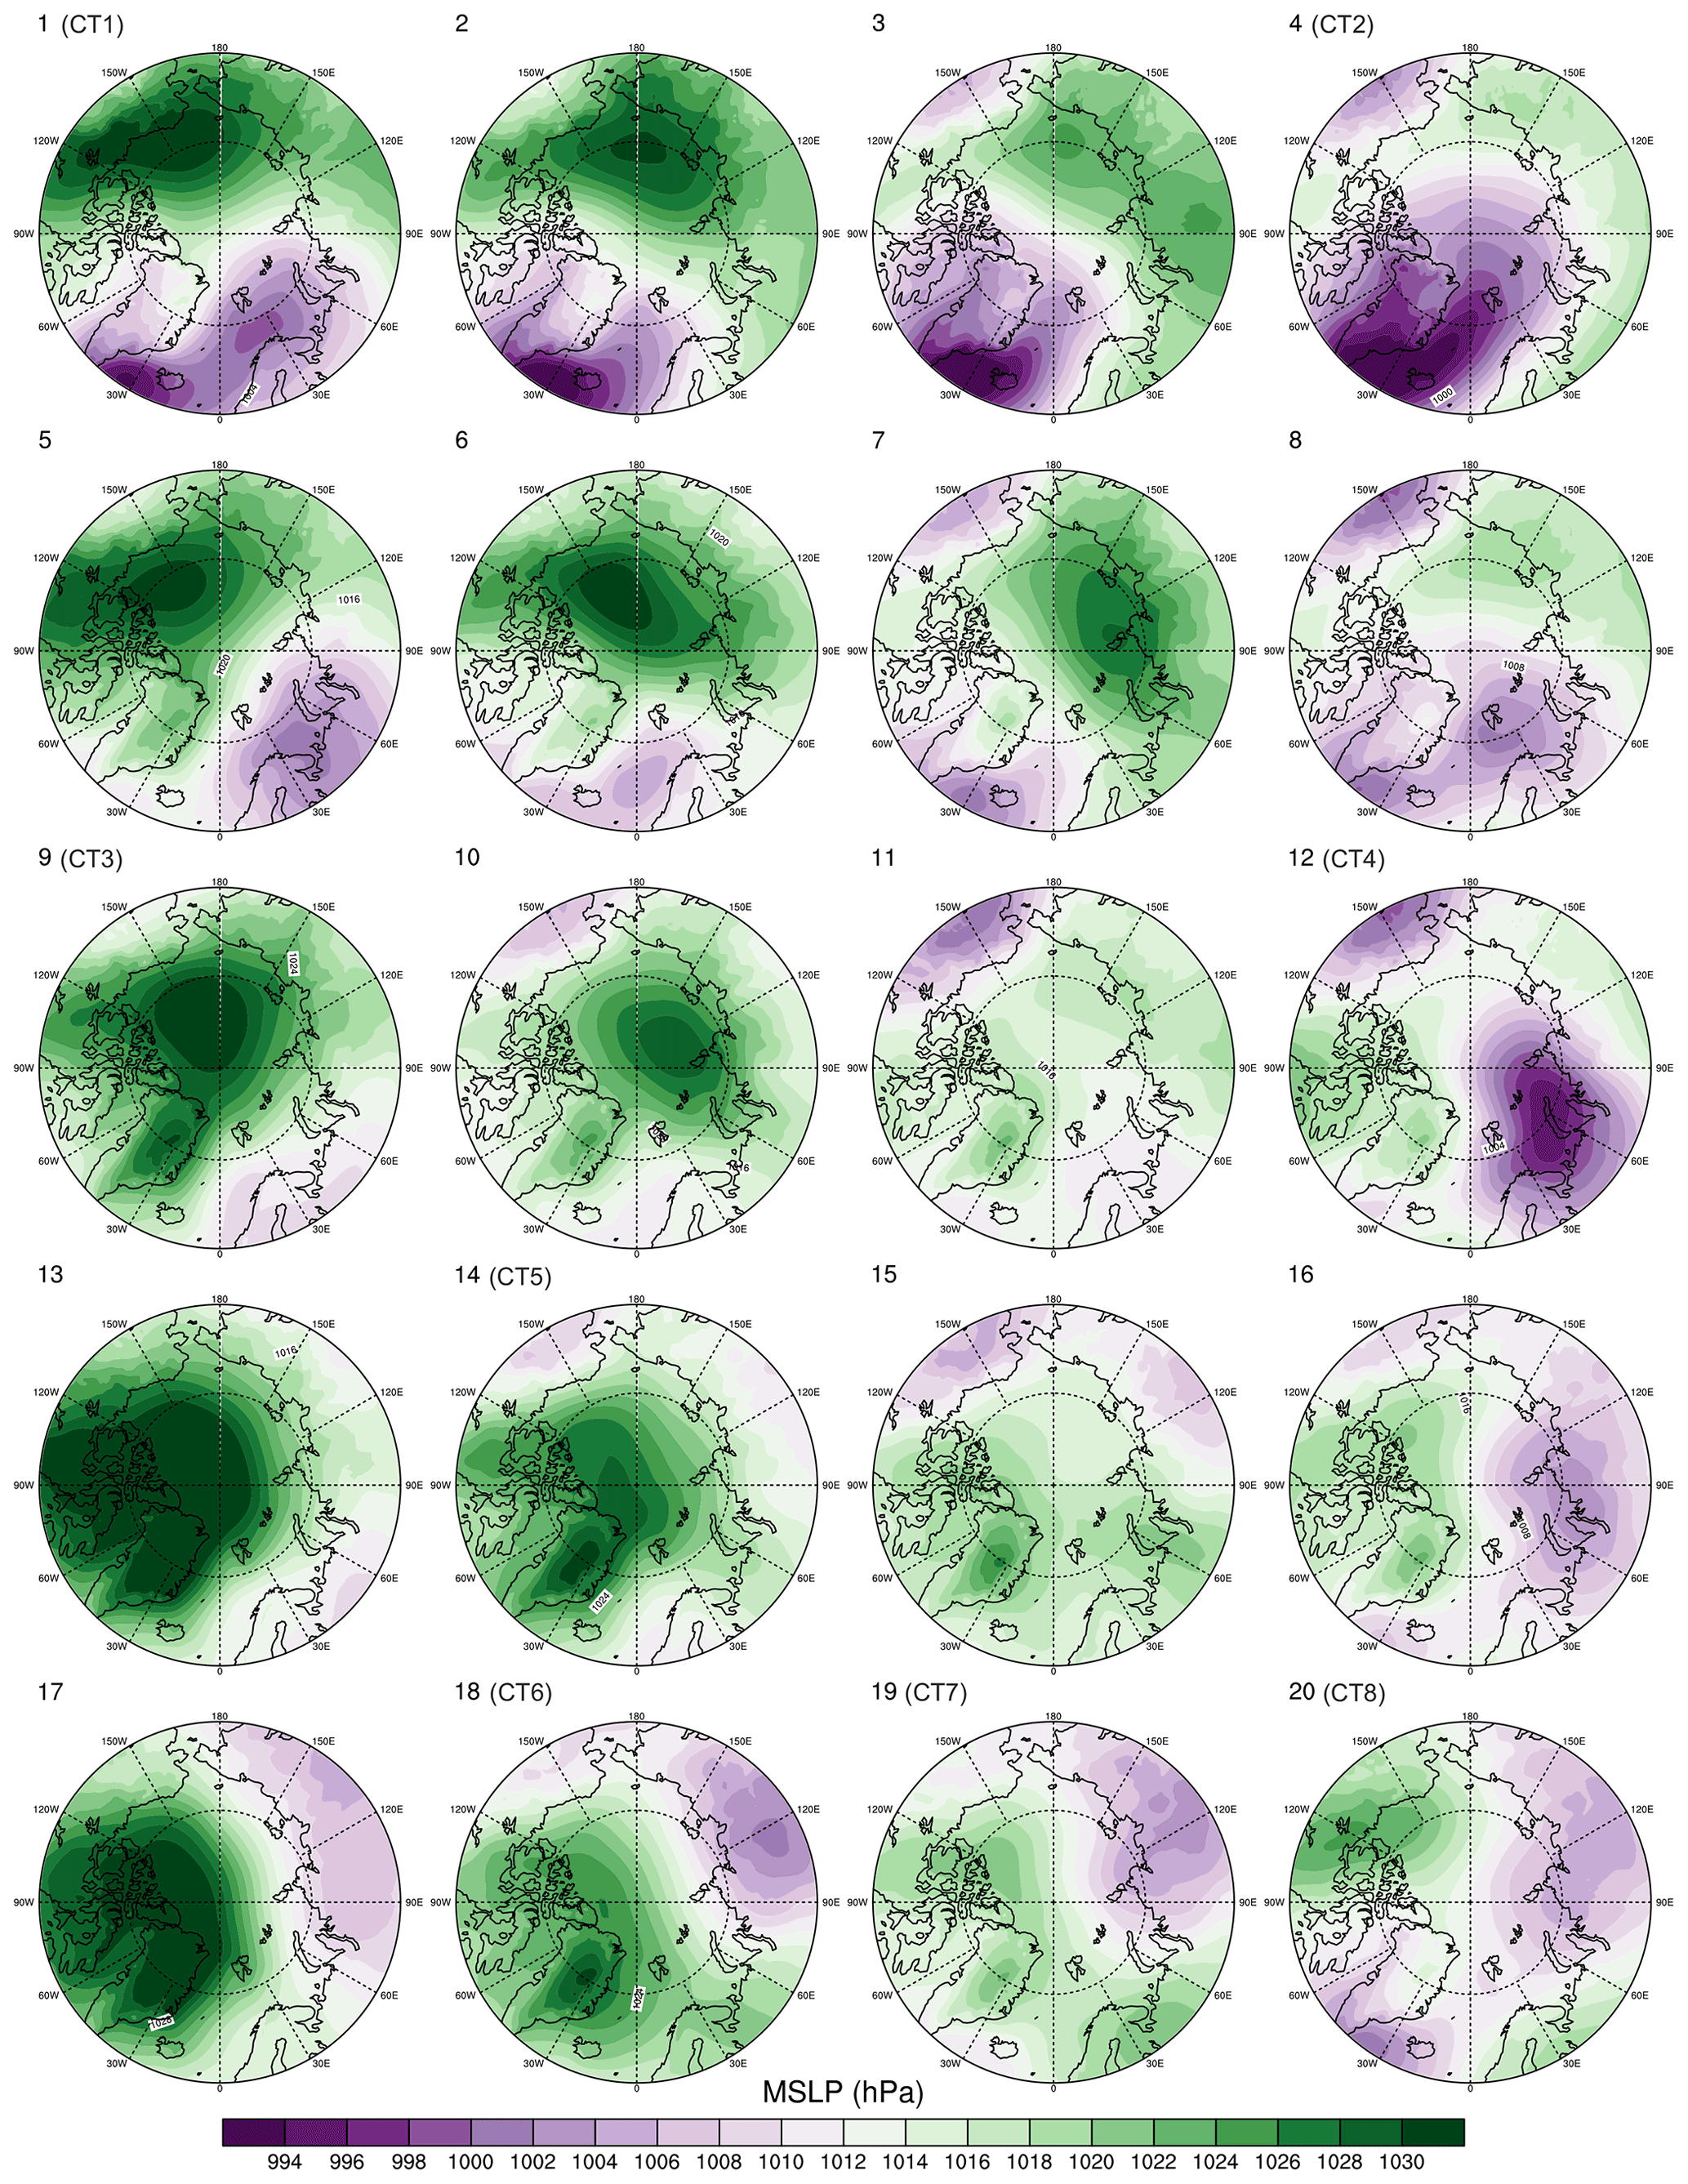
Figure A1Mean sea level pressure (MSLP) averaged over the cases belonging to each of the 20 circulation types. The chosen eight circulation types are shown in the brackets.
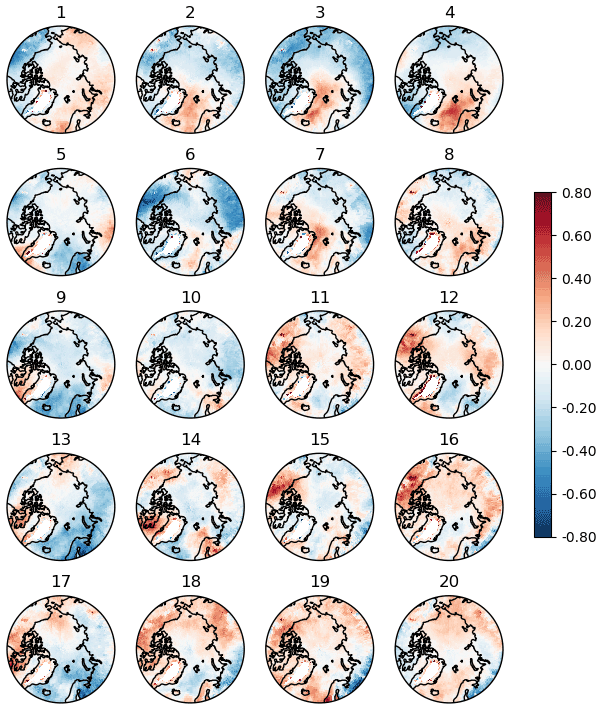
Figure A2Specific humidity anomalies (g kg−1) at 850 hPa based on AIRS data for the 20 circulation types.
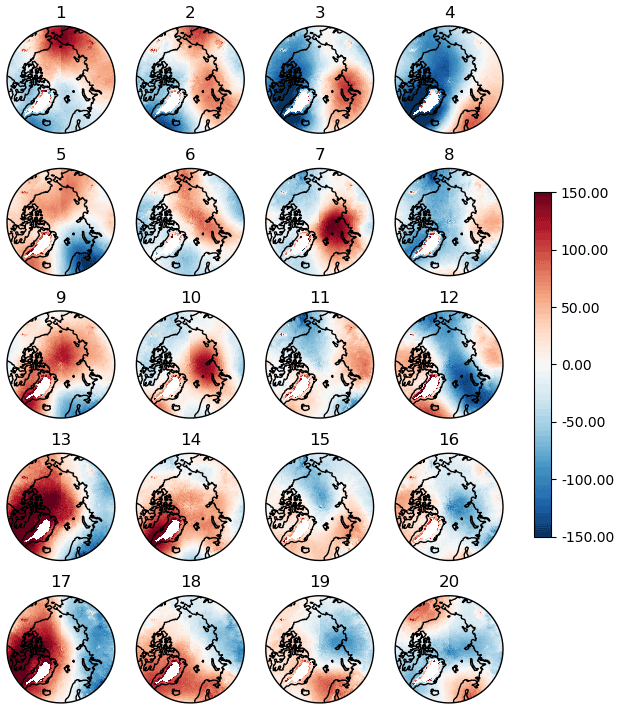
Figure A3Geopotential height anomalies (m) at 500 hPa based on AIRS data for the 20 circulation types.
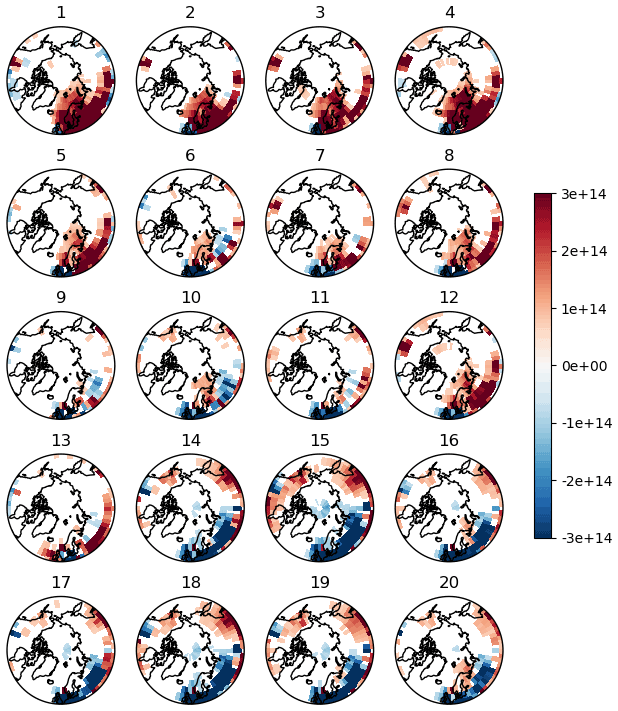
Figure A4NO2 total column anomalies (molecules cm−2) based on OMI data for the 20 circulation types. Only those anomalies that are statistically significant at the 90 % confidence level are shown.
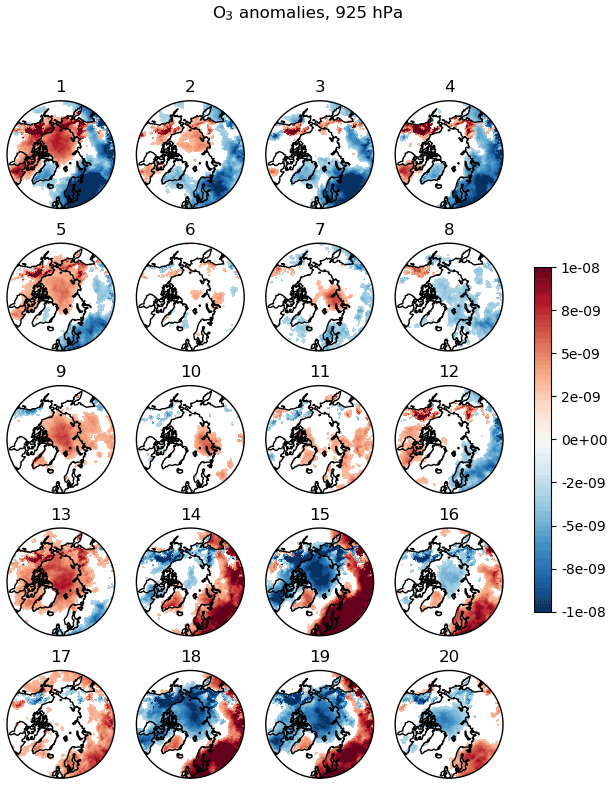
Figure A5The 925 hPa O3 anomalies as volume mixing ratios based on CAMS data for the 20 circulation types. Only those anomalies that are statistically significant at the 90 % confidence level are shown.
Figure A6Tropospheric AOD anomalies based on CALIOP-CALIPSO data for the 20 circulation types. Only those anomalies that are statistically significant at the 90 % confidence level are shown.
Figure A7The 500 hPa CO anomalies as volume mixing ratios based on AIRS data for the 20 circulation types. Only those anomalies that are statistically significant at the 90 % confidence level are shown.
All datasets used in the present study are publicly available as follows.
The daily total column NO2 retrievals (L2) can be accessed at https://doi.org/10.5067/Aura/OMI/DATA2018 (Krotkov et al., 2019).
The AIRS satellite version 7 dataset is used for the 500 hPa daily CO in this study and can be accessed at the following link: https://airs.jpl.nasa.gov/data/get-data/standard-data/ (NASA Jet Repulsion Laboratory, 2021a). The data were processed at the Jet Propulsion Laboratory, California Institute of Technology. The details are published at https://docserver.gesdisc.eosdis.nasa.gov/public/project/AIRS/Overview_of_the_AIRS_Mission.pdf (NASA Jet Propulsion Laboratory, 2021b).
The near-surface ozone data from the CAMS (Copernicus Atmosphere Monitoring Service) database can be accessed via the following link: (https://ads.atmosphere.copernicus.eu/cdsapp#!/dataset/cams-global-reanalysis-eac4?tab=overvieware, Copernicus Atmosphere Monitoring Service, 2021) and are provided by the European Union’s Earth Observation Programme, Copernicus.
The CALIPSO Level 2 standard aerosol profile product version 4.2 available at 5 km horizontal resolution is used (CAL_LID_L2_05kmAPro-Standard-V4-20) for the aerosol optical depths in this study. The data are accessible via https://doi.org/10.5067/CALIOP/CALIPSO/LID_L2_05KMAPRO-STANDARD-V4-20 (NASA Earth Data, 2020), created by NASA Langley Atmospheric Science Data Center DAAC. The mean sea level pressure (MSLP) data are from the ERA5 reanalysis https://doi.org/10.1002/qj.3803 (Hersbach et al., 2020) and are available at the Climate Data Store (CDS) via the link https://cds.climate.copernicus.eu/cdsapp#!/dataset/reanalysis-era5-single-levels?tab=overview (Copernicus Climate Change Service, 2017).
MAT and AD designed the study. MAT carried out the analysis and wrote the first draft of the paper. TN performed and provided the SOM analysis. All authors contributed to the writing and interpretation of the results.
The contact author has declared that neither they nor their co-authors have any competing interests.
Publisher’s note: Copernicus Publications remains neutral with regard to jurisdictional claims in published maps and institutional affiliations.
The study was funded by the Swedish National Space Agency (grant number 94/16). Tiina Nygård acknowledges the funding by the Academy of Finland via project TODAy (grant number 308441). The authors would like to thank the OMI, AIRS and CALIPSO Science Teams for the data products as well as CAMS and ECMWF for the corresponding reanalysis data products.
This research has partly been supported by the Swedish National Space Agency (grant no. 94/16) and partly by the Academy of Finland (grant no. 308441).
This paper was edited by Bryan N. Duncan and reviewed by two anonymous referees.
Abbatt, J. P. D., Leaitch, W. R., Aliabadi, A. A., Bertram, A. K., Blanchet, J.-P., Boivin-Rioux, A., Bozem, H., Burkart, J., Chang, R. Y. W., Charette, J., Chaubey, J. P., Christensen, R. J., Cirisan, A., Collins, D. B., Croft, B., Dionne, J., Evans, G. J., Fletcher, C. G., Galí, M., Ghahremaninezhad, R., Girard, E., Gong, W., Gosselin, M., Gourdal, M., Hanna, S. J., Hayashida, H., Herber, A. B., Hesaraki, S., Hoor, P., Huang, L., Hussherr, R., Irish, V. E., Keita, S. A., Kodros, J. K., Köllner, F., Kolonjari, F., Kunkel, D., Ladino, L. A., Law, K., Levasseur, M., Libois, Q., Liggio, J., Lizotte, M., Macdonald, K. M., Mahmood, R., Martin, R. V., Mason, R. H., Miller, L. A., Moravek, A., Mortenson, E., Mungall, E. L., Murphy, J. G., Namazi, M., Norman, A.-L., O'Neill, N. T., Pierce, J. R., Russell, L. M., Schneider, J., Schulz, H., Sharma, S., Si, M., Staebler, R. M., Steiner, N. S., Thomas, J. L., von Salzen, K., Wentzell, J. J. B., Willis, M. D., Wentworth, G. R., Xu, J.-W., and Yakobi-Hancock, J. D.: Overview paper: New insights into aerosol and climate in the Arctic, Atmos. Chem. Phys., 19, 2527–2560, https://doi.org/10.5194/acp-19-2527-2019, 2019.
Arnold, S. R., Law, K. S., Brock, C. A., Thomas, J. L., Starkweather, S. M., von Salzen, K., Stohl, A., Sharma, S., Lund, M. T., Flanner, M. G., Petäjä, T., Tanimoto, H., Gamble, J., Dibb, J. E., Melamed, M., Johnson, N., Fidel, M., Tynkkynen, V.-P., Baklanov, A., Eckhardt, S., Monks, S. A., Browse, J., Bozem, H.: Arctic air pollution: Challenges and opportunities for the next decade, Elementa: Science of the Anthropocene, 4, 000104, https://doi.org/10.12952/journal.elementa.000104, 2016.
Blechschmidt, A.-M., Richter, A., Burrows, J. P., Kaleschke, L., Strong, K., Theys, N., Weber, M., Zhao, X., and Zien, A.: An exemplary case of a bromine explosion event linked to cyclone development in the Arctic, Atmos. Chem. Phys., 16, 1773–1788, https://doi.org/10.5194/acp-16-1773-2016, 2016.
Bozem, H., Hoor, P., Kunkel, D., Köllner, F., Schneider, J., Herber, A., Schulz, H., Leaitch, W. R., Aliabadi, A. A., Willis, M. D., Burkart, J., and Abbatt, J. P. D.: Characterization of transport regimes and the polar dome during Arctic spring and summer using in situ aircraft measurements, Atmos. Chem. Phys., 19, 15049–15071, https://doi.org/10.5194/acp-19-15049-2019, 2019.
Brock, C. A., Cozic, J., Bahreini, R., Froyd, K. D., Middlebrook, A. M., McComiskey, A., Brioude, J., Cooper, O. R., Stohl, A., Aikin, K. C., de Gouw, J. A., Fahey, D. W., Ferrare, R. A., Gao, R.-S., Gore, W., Holloway, J. S., Hübler, G., Jefferson, A., Lack, D. A., Lance, S., Moore, R. H., Murphy, D. M., Nenes, A., Novelli, P. C., Nowak, J. B., Ogren, J. A., Peischl, J., Pierce, R. B., Pilewskie, P., Quinn, P. K., Ryerson, T. B., Schmidt, K. S., Schwarz, J. P., Sodemann, H., Spackman, J. R., Stark, H., Thomson, D. S., Thornberry, T., Veres, P., Watts, L. A., Warneke, C., and Wollny, A. G.: Characteristics, sources, and transport of aerosols measured in spring 2008 during the aerosol, radiation, and cloud processes affecting Arctic Climate (ARCPAC) Project, Atmos. Chem. Phys., 11, 2423–2453, https://doi.org/10.5194/acp-11-2423-2011, 2011.
Cassano, J. J., Uotila, P., and Lynch, A.: Changes in synoptic weather patterns in the polar regions in the twentieth and twenty-first centuries, part 1: Arctic, Int. J. Climatol., 26, 1027–1049, https://doi.org/10.1002/joc.1306, 2006.
Christoudias, T., Pozzer, A., and Lelieveld, J.: Influence of the North Atlantic Oscillation on air pollution transport, Atmos. Chem. Phys., 12, 869–877, https://doi.org/10.5194/acp-12-869-2012, 2012.
Copernicus Atmosphere Monitoring Service: CAMS global reanalysis (EAC4), Copernicus Atmosphere Monitoring Service (CAMS) [data set], https://ads.atmosphere.copernicus.eu/cdsapp#!/dataset/cams-global-reanalysis-eac4?tab=overvieware, last access: 4 November 2021.
Copernicus Climate Change Service (C3S), ERA5: Fifth generation of ECMWF atmospheric reanalyses of the global climate, Copernicus Climate Change Service Climate Data Store (CDS) [data set], available at: https://cds.climate.copernicus.eu/cdsapp#!/dataset/reanalysis-era5-single-levels?tab=overview, 2017.
Devasthale, A. and Thomas, M. A.: An investigation of statistical link between inversion strength and carbon monoxide over Scandinavia in winter using AIRS data, Atmos. Environ., 56, 109–114, https://doi.org/10.1016/j.atmosenv.2012.03.042, 2012.
Devasthale, A., Tjernstrom, M., Karlsson, K.-G., Thomas, M. A., Jones, C., Sedlar, J., and Omar, A. H.: The vertical distribution of thin features over the Arctic analysed from CALIPSO observations, part II: Aerosols, Tellus B, 63, 86–95, https://doi.org/10.1111/j.1600-0889.2010.00517.x, 2011.
Devasthale, A., Sedlar, J., Kahn, B., Tjernström, M., Fetzer, E., Tian, B., Teixeira, J., and Pagano, T.: A decade of spaceborne observations of the Arctic atmosphere: Novel insights from NASA's AIRS instrument, B. Am. Meteorol. Soc., 97, 2163–2176, https://doi.org/10.1175/BAMS-D-14-00202.1, 2016.
Devasthale, A., Sedlar, J., Tjernström, M., and Kokhanovsky, A.: A Climatological Overview of Arctic Clouds, in: Physics and Chemistry of the Arctic Atmosphere, edited by: Kokhanovsky, A. and Tomasi, C., Springer Polar Sciences, Springer, Cham., https://doi.org/10.1007/978-3-030-33566-3_5, 2020.
de Villiers, R. A., Ancellet, G., Pelon, J., Quennehen, B., Schwarzenboeck, A., Gayet, J. F., and Law, K. S.: Airborne measurements of aerosol optical properties related to early spring transport of mid-latitude sources into the Arctic, Atmos. Chem. Phys., 10, 5011–5030, https://doi.org/10.5194/acp-10-5011-2010, 2010.
Di Pierro, M., Jaeglé, L., Eloranta, E. W., and Sharma, S.: Spatial and seasonal distribution of Arctic aerosols observed by the CALIOP satellite instrument (2006–2012), Atmos. Chem. Phys., 13, 7075–7095, https://doi.org/10.5194/acp-13-7075-2013, 2013.
Duncan, B. N. and Bey, I.: A modeling study of the export pathways of pollution from Europe: Seasonal and interannual variations (1987–1997), J. Geophys. Res., 109, D08301, https://doi.org/10.1029/2003JD004079, 2004.
Eckhardt, S., Stohl, A., Beirle, S., Spichtinger, N., James, P., Forster, C., Junker, C., Wagner, T., Platt, U., and Jennings, S. G.: The North Atlantic Oscillation controls air pollution transport to the Arctic, Atmos. Chem. Phys., 3, 1769–1778, https://doi.org/10.5194/acp-3-1769-2003, 2003.
Fisher, J. A., Jacob, D. J., Purdy, M. T., Kopacz, M., Le Sager, P., Carouge, C., Holmes, C. D., Yantosca, R. M., Batchelor, R. L., Strong, K., Diskin, G. S., Fuelberg, H. E., Holloway, J. S., Hyer, E. J., McMillan, W. W., Warner, J., Streets, D. G., Zhang, Q., Wang, Y., and Wu, S.: Source attribution and interannual variability of Arctic pollution in spring constrained by aircraft (ARCTAS, ARCPAC) and satellite (AIRS) observations of carbon monoxide, Atmos. Chem. Phys., 10, 977–996, https://doi.org/10.5194/acp-10-977-2010, 2010.
Gibson, P. B., Perkins-Kirkpatrick, S. E., Uotila, P., Pepler, A. S., and Alexander, L. V.: On the use of self-organizing maps for studying climate extremes, J. Geophys. Res.-Atmos., 122, 3891–3903, https://doi.org/10.1002/2016JD026256, 2017.
Hersbach, H., Bell, B., Berrisford, P., Hirahara, S., Horányi, A., Muñoz-Sabater, J., Nicolas, J., Peubey, C., Radu, R., Schepers, D., Simmons, A., Soci, C., Abdalla, S., Abellan, X., Balsamo, G., Bechtold, P., Biavati, G., Bidlot, J., Bonavita, M., De Chiara, G., Dahlgren, P., Dee, D., Diamantakis, M., Dragani, R., Flemming, J., Forbes, R., Fuentes, M., Geer, A., Haimberger, L., Healy, S., Hogan, R. J., Hólm, E., Janisková, M., Keeley, S., Laloyaux, P., Lopez, P., Lupu, C., Radnoti, G., de Rosnay, P., Rozum, I., Vamborg, F., Villaume, S., and Thépaut J.-N.: The ERA5 global reanalysis, Q. J. Roy. Meteor. Soc., 146, 1999–2049, https://doi.org/10.1002/qj.3803, 2020.
Hewitson, B. C. and Crane, R. G.: Self-organizing maps: applications to synoptic climatology, Clim. Res., 22, 13–26, https://doi.org/10.3354/cr022013, 2002.
Huijnen, V., Miyazaki, K., Flemming, J., Inness, A., Sekiya, T., and Schultz, M. G.: An intercomparison of tropospheric ozone reanalysis products from CAMS, CAMS interim, TCR-1, and TCR-2, Geosci. Model Dev., 13, 1513–1544, https://doi.org/10.5194/gmd-13-1513-2020, 2020.
Inness, A., Ades, M., Agustí-Panareda, A., Barré, J., Benedictow, A., Blechschmidt, A.-M., Dominguez, J. J., Engelen, R., Eskes, H., Flemming, J., Huijnen, V., Jones, L., Kipling, Z., Massart, S., Parrington, M., Peuch, V.-H., Razinger, M., Remy, S., Schulz, M., and Suttie, M.: The CAMS reanalysis of atmospheric composition, Atmos. Chem. Phys., 19, 3515–3556, https://doi.org/10.5194/acp-19-3515-2019, 2019.
Jacob, D. J., Crawford, J. H., Maring, H., Clarke, A. D., Dibb, J. E., Emmons, L. K., Ferrare, R. A., Hostetler, C. A., Russell, P. B., Singh, H. B., Thompson, A. M., Shaw, G. E., McCauley, E., Pederson, J. R., and Fisher, J. A.: The Arctic Research of the Composition of the Troposphere from Aircraft and Satellites (ARCTAS) mission: design, execution, and first results, Atmos. Chem. Phys., 10, 5191–5212, https://doi.org/10.5194/acp-10-5191-2010, 2010.
Johansson, E., Devasthale, A., Tjernström, M., Ekman, A. M. L., and L'Ecuyer, T.: Response of the lower troposphere to moisture intrusions into the Arctic, Geophys. Res. Lett., 44, 2527–2536, https://doi.org/10.1002/2017GL072687, 2017.
Kohonen, T.: Self-Organizing Maps, Springer-Verlag, 30, 501 pp., https://doi.org/10.1007/978-3-642-56927-2, 2001.
Krotkov, N. A., Lamsal, L. N., Marchenko, S. V., Celarier, E. A., Bucsela, E. J., Swartz, W. H., Joiner, J., and the OMI core team: OMI/Aura NO2 Total and Tropospheric Column Daily L2 Global Gridded 0.25∘ × 0.25∘ V3, NASA Goddard Space Flight Center, Goddard Earth Sciences Data and Information Services Center, GES DISC [data set], https://doi.org/10.5067/Aura/OMI/DATA2018, 2019.
Langford, A. O., Senff, C. J., Alvarez, R. J., Brioude, J., Cooper, O. R., Holloway, J. S., Lin, M. Y., Marchbanks, R. D., Pierce, R. B., Sandberg, S. P., Weickmann, A. M., and Williams, E. J.: An overview of the 2013 Las Vegas Ozone Study (LVOS): Impact of stratospheric intrusions and long-range transport on surface air quality, Atmos. Environ., 109, 305–322, https://doi.org/10.1016/j.atmosenv.2014.08.040, 2015.
Law, K. S. and A. Stohl: Arctic air pollution: Origins and impacts, Science, 315, 1537–1540, https://doi.org/10.1126/science.1137695, 2007.
Law, K. S., Stohl, A., Quinn, P. K., Brock, C. A., Burkhart, J. F., Paris, J., Ancellet, G., Singh, H. B., Roiger, A., Schlager, H., Dibb, J., Jacob, D. J., Arnold, S. R., Pelon, J., and Thomas, J. L.: Arctic Air Pollution: New Insights from POLARCAT-IPY, B. Am. Meteorol. Soc., 95, 1873–1895, https://doi.org/10.1175/BAMS-D-13-00017.1, 2014.
Lin, M., Fiore, A. M., Horowitz, L. W., Langford, A. O., Oltmans, S. J., Tarasick, D., and Rieder, H. E.: Climate variability modulates western US ozone air quality in spring via deep stratospheric intrusions, Nat. Commun., 6, 7105, https://doi.org/10.1038/ncomms8105, 2015.
Lu, X., Zhang, L., and Shen, L.: Meteorology and Climate Influences on Tropospheric Ozone: a Review of Natural Sources, Chemistry, and Transport Patterns, Current Pollution Reports, 5, 238–260, https://doi.org/10.1007/s40726-019-00118-3, 2019.
McNaughton, C. S., Clarke, A. D., Freitag, S., Kapustin, V. N., Kondo, Y., Moteki, N., Sahu, L., Takegawa, N., Schwarz, J. P., Spackman, J. R., Watts, L., Diskin, G., Podolske, J., Holloway, J. S., Wisthaler, A., Mikoviny, T., de Gouw, J., Warneke, C., Jimenez, J., Cubison, M., Howell, S. G., Middlebrook, A., Bahreini, R., Anderson, B. E., Winstead, E., Thornhill, K. L., Lack, D., Cozic, J., and Brock, C. A.: Absorbing aerosol in the troposphere of the Western Arctic during the 2008 ARCTAS/ARCPAC airborne field campaigns, Atmos. Chem. Phys., 11, 7561–7582, https://doi.org/10.5194/acp-11-7561-2011, 2011.
Messori, G., Woods, C., and Caballero, R.: On the drivers of wintertime temperature extremes in the high Arctic, J. Climate, 31, 1597–1618, https://doi.org/10.1175/JCLI-D-17-0386.1, 2018.
NASA Earth Data: CALIPSO Lidar Level 2 Aerosol Profile, V4-20, NASA Earth Data [data set], https://doi.org/10.5067/CALIOP/CALIPSO/LID_L2_05KMAPRO-STANDARD-V4-20, 2018.
NASA Jet Propulsion Laboratory: AIRS, NASA Jet Propulsion Laboratory [data set], available at: https://airs.jpl.nasa.gov/data/get-data/standard-data/, last access: 11 November 2021a.
NASA Jet Propulsion Laboratory: Overview of the AIRS Mission: Instruments, Processing Algorithms, Products, and Documentation, NASA Jet Propulsion Laboratory [data set], available at: https://docserver.gesdisc.eosdis.nasa.gov/public/project/AIRS/Overview_of_the_AIRS_Mission.pdf, last access: 3 June 2021b.
Neal, R., Fereday, D., Crocker, R., and Comer, R. E.: A flexible approach to defining weather patterns and their application in weather forecasting over Europe, Met. Apps, 23, 389–400, https://doi.org/10.1002/met.1563, 2016.
Nygård, T., Graversen, R. G., Uotila, P., Naakka, T., and Vihma, T.: Strong Dependence of Wintertime Arctic Moisture and Cloud Distributions on Atmospheric Large-Scale Circulation, J. Climate, 32, 8771–8790, https://doi.org/10.1175/JCLI-D-19-0242.1, 2019.
Papritz, L. and Dunn-Sigouin, E.: What configuration of the atmospheric circulation drives extreme net and total moisture transport into the Arctic, Geophy. Res. Lett., 47, e2020GL089769, https://doi.org/10.1029/2020GL089769, 2020.
Quennehen, B., Schwarzenboeck, A., Schmale, J., Schneider, J., Sodemann, H., Stohl, A., Ancellet, G., Crumeyrolle, S., and Law, K. S.: Physical and chemical properties of pollution aerosol particles transported from North America to Greenland as measured during the POLARCAT summer campaign, Atmos. Chem. Phys., 11, 10947–10963, https://doi.org/10.5194/acp-11-10947-2011, 2011.
Quinn, P. K., Bates, T. S., Baum, E., Doubleday, N., Fiore, A. M., Flanner, M., Fridlind, A., Garrett, T. J., Koch, D., Menon, S., Shindell, D., Stohl, A., and Warren, S. G.: Short-lived pollutants in the Arctic: their climate impact and possible mitigation strategies, Atmos. Chem. Phys., 8, 1723–1735, https://doi.org/10.5194/acp-8-1723-2008, 2008.
Schmale, J., Schneider, J., Ancellet, G., Quennehen, B., Stohl, A., Sodemann, H., Burkhart, J. F., Hamburger, T., Arnold, S. R., Schwarzenboeck, A., Borrmann, S., and Law, K. S.: Source identification and airborne chemical characterisation of aerosol pollution from long-range transport over Greenland during POLARCAT summer campaign 2008, Atmos. Chem. Phys., 11, 10097–10123, https://doi.org/10.5194/acp-11-10097-2011, 2011.
Schmale, J., Zieger, P., and Ekman, A. M. L.: Aerosols in current and future Arctic climate, Nat. Clim. Chang., 11, 95–105, https://doi.org/10.1038/s41558-020-00969-5, 2021.
Schultz, M. G., Schröder, S., Lyapina, O., Cooper, O. R., Galbally, I., Petropavlovskikh, I., von Schneidemesser, E., Tanimoto, H., Elshorbany, Y., Naja, M., Seguel, R. J., Dauert, U., Eckhardt, P., Feigenspan, S., Fiebig, M., Hjellbrekke, A.-G., Hong, Y.-D., Kjeld, P. C., Koide, H., Lear, G., Tarasick, D., Ueno, M., Wallasch, M., Baumgardner, D., Chuang, M.-T., Gillett, R., Lee, M., Molloy, S., Moolla, R., Wang, T., Sharps, K., Adame, J. A., Ancellet, G., Apadula, F., Artaxo, P., Barlasina, M. E., Bogucka, M., Bonasoni, P., Chang, L., Colomb, A., Cuevas-Agulló, E., Cupeiro, M., Degorska, A., Ding, A., Fröhlich, M., Frolova, M., Gadhavi, H., Gheusi, F., Gilge, S., Gonzalez, M. Y., Gros, V., Hamad, S. H., Helmig, D., Henriques, D., Hermansen, O., Holla, R., Hueber, J., Im, U., Jaffe, D. A., Komala, N., Kubistin, D., Lam, K.-S., Laurila, T., Lee, H., Levy, I., Mazzoleni, C., Mazzoleni, L. R., McClure-Begley, A., Mohamad, M., Murovec, M., Navarro-Comas, M., Nicodim, F., Parrish, D., Read, K. A., Reid, Nick and Ries, L., Saxena, P., Schwab, J. J. , Scorgie, Y., Senik, I., Simmonds, P., Sinha, V., Skorokhod, A. I., Spain, G., Spangl, W., Spoor, R., Springston, S. R., Steer, K., Steinbacher, M., Suharguniyawan, E., Torre, P., Trickl, T., Weili, L., Weller, R., Xiaobin, X., Xue, L., and Zhiqiang, M.: Tropospheric Ozone Assessment Report: Database and metrics data of global surface ozone observations, Elementa, 5, 58, https://doi.org/10.1525/elementa.244, 2017a.
Schultz, M. G., Schröder, S., Lyapina, O., Cooper, O. R., Galbally, I., Petropavlovskikh, I., Schneidemesser, E. V., Tanimoto, H., Elshorbany, Y., Naja, M., Seguel, R. J., Dauert, U., Eckhardt, P., Feigenspan, S., Fiebig, M., Hjellbrekke, A.-G., Hong, Y.-D., Kjeld, P. C., Koide, H., Lear, G., Tarasick, D., Ueno, M., Wallasch, M., Baumgardner, D., Chuang, M.-T., Gillett, R., Lee, M., Molloy, S., Moolla, R., Wang, T., Sharps, K., Adame, J. A., Ancellet, G., Apadula, F., Artaxo, P., Barlasina, M. E., Bogucka, M., Bonasoni, P., Chang, L., Colomb, A., Cuevas-Agulló, E., Cupeiro, M., Degorska, A., Ding, A., Fröhlich, M., Frolova, M., Gadhavi, H., Gheusi, F., Gilge, S., Gonzalez, M. Y., Gros, V., Hamad, S. H., Helmig, D., Henriques, D., Hermansen, O., Holla, R., Hueber, J., Im, U., Jaffe, D. A., Komala, N., Kubistin, D., Lam, K.-S., Laurila, T., Lee, H., Levy, I., Mazzoleni, C., Mazzoleni, L. R., McClure-Begley, A., Mohamad, M., Murovec, M., Navarro-Comas, M., Nicodim, F., Parrish, D., Read, K. A., Reid, N., Ries, L., Saxena, P., Schwab, J. J., Scorgie, Y., Senik, I., Simmonds, P., Sinha, V., Skorokhod, A. I., Spain, G., Spangl, W., Spoor, R., Springston, S. R., Steer, K., Steinbacher, M., Suharguniyawan, E., Torre, P., Trickl, T., Weili, L., Weller, R., Xiaobin, X., Xue, L., and Zhiqiang, M.: Tropospheric Ozone Assessment Report, links to Global surface ozone datasets, PANGAEA [data set], https://doi.org/10.1594/PANGAEA.876108, 2017b.
Shindell, D. T., Chin, M., Dentener, F., Doherty, R. M., Faluvegi, G., Fiore, A. M., Hess, P., Koch, D. M., MacKenzie, I. A., Sanderson, M. G., Schultz, M. G., Schulz, M., Stevenson, D. S., Teich, H., Textor, C., Wild, O., Bergmann, D. J., Bey, I., Bian, H., Cuvelier, C., Duncan, B. N., Folberth, G., Horowitz, L. W., Jonson, J., Kaminski, J. W., Marmer, E., Park, R., Pringle, K. J., Schroeder, S., Szopa, S., Takemura, T., Zeng, G., Keating, T. J., and Zuber, A.: A multi-model assessment of pollution transport to the Arctic, Atmos. Chem. Phys., 8, 5353–5372, https://doi.org/10.5194/acp-8-5353-2008, 2008.
Spackman, J. R., Gao, R. S., Neff, W. D., Schwarz, J. P., Watts, L. A., Fahey, D. W., Holloway, J. S., Ryerson, T. B., Peischl, J., and Brock, C. A.: Aircraft observations of enhancement and depletion of black carbon mass in the springtime Arctic, Atmos. Chem. Phys., 10, 9667–9680, https://doi.org/10.5194/acp-10-9667-2010, 2010.
Stohl, A.: Characteristics of atmospheric transport into the Arctic troposphere, J. Geophys. Res., 111, D11306, https://doi.org/10.1029/2005JD006888, 2006.
Stohl, A., Berg, T., Burkhart, J. F., Fjǽraa, A. M., Forster, C., Herber, A., Hov, Ø., Lunder, C., McMillan, W. W., Oltmans, S., Shiobara, M., Simpson, D., Solberg, S., Stebel, K., Ström, J., Tørseth, K., Treffeisen, R., Virkkunen, K., and Yttri, K. E.: Arctic smoke – record high air pollution levels in the European Arctic due to agricultural fires in Eastern Europe in spring 2006, Atmos. Chem. Phys., 7, 511–534, https://doi.org/10.5194/acp-7-511-2007, 2007.
Thomas, M. A. and Devasthale, A.: Sensitivity of free tropospheric carbon monoxide to atmospheric weather states and their persistency: an observational assessment over the Nordic countries, Atmos. Chem. Phys., 14, 11545–11555, https://doi.org/10.5194/acp-14-11545-2014, 2014.
Thomas, M. A. and Devasthale, A.: Typical meteorological conditions associated with extreme nitrogen dioxide (NO2) pollution events over Scandinavia, Atmos. Chem. Phys., 17, 12071–12080, https://doi.org/10.5194/acp-17-12071-2017, 2017.
Thomas, M. A., Devasthale, A., Tjernström, M., and Ekman, A. M. L.: The relation between aerosol vertical distribution and temperature inversions in the Arctic in winter and spring, Geophys. Res. Lett., 46, 2836–2845, https://doi.org/10.1029/2018GL081624, 2019.
van der Werf, G. R., Randerson, J. T., Giglio, L., Collatz, G. J., Mu, M., Kasibhatla, P. S., Morton, D. C., DeFries, R. S., Jin, Y., and van Leeuwen, T. T.: Global fire emissions and the contribution of deforestation, savanna, forest, agricultural, and peat fires (1997–2009), Atmos. Chem. Phys., 10, 11707–11735, https://doi.org/10.5194/acp-10-11707-2010, 2010.
Wang, Q., Jacob, D. J., Fisher, J. A., Mao, J., Leibensperger, E. M., Carouge, C. C., Le Sager, P., Kondo, Y., Jimenez, J. L., Cubison, M. J., and Doherty, S. J.: Sources of carbonaceous aerosols and deposited black carbon in the Arctic in winter-spring: implications for radiative forcing, Atmos. Chem. Phys., 11, 12453–12473, https://doi.org/10.5194/acp-11-12453-2011, 2011.
Warneke, C., Bahreini, R., Brioude, J., Brock, C. A., de Gouw, J. A., Fahey, D. W., Froyd, K. D., Holloway, J. S., Middlebrook, A., Miller, L., Montzka, S., Murphy, D. M., Peischl, J., Ryerson, T. B., Schwarz, J. P., Spackman, J. R., and Veres, P.: Biomass burning in Siberia and Kazakhstan as an important source for haze over the Alaskan Arctic in April 2008, Geophys. Res. Lett., 36, L02813, https://doi.org/10.1029/2008GL036194, 2009.
Warneke, C., Froyd, K. D., Brioude, J., Bahreini, R., Brock, C. A., Cozic, J., de Gouw, J. A., Fahey, D. W., Ferrare, R., Holloway, J. S., Middlebrook, A. M., Miller, L., Montzka, S., Schwarz, J. P., Sodemann, H., Spackman, J. R., and Stohl, A.: An important contribution to springtime Arctic aerosol from biomass burning in Russia, Geophys. Res. Lett., 37, L01801, https://doi.org/10.1029/2009gl041816, 2010.
Wespes, C., Emmons, L., Edwards, D. P., Hannigan, J., Hurtmans, D., Saunois, M., Coheur, P.-F., Clerbaux, C., Coffey, M. T., Batchelor, R. L., Lindenmaier, R., Strong, K., Weinheimer, A. J., Nowak, J. B., Ryerson, T. B., Crounse, J. D., and Wennberg, P. O.: Analysis of ozone and nitric acid in spring and summer Arctic pollution using aircraft, ground-based, satellite observations and MOZART-4 model: source attribution and partitioning, Atmos. Chem. Phys., 12, 237–259, https://doi.org/10.5194/acp-12-237-2012, 2012.
Willis, M. D., Leaitch, W. R., and Abbatt, J. P.: Processes controlling the composition and abundance of Arctic aerosol. Reviews of Geophysics, 56, 621–671, https://doi.org/10.1029/2018RG000602, 2018.
Yates, E. L., Iraci, L. T., Roby, M. C., Pierce, R. B., Johnson, M. S., Reddy, P. J., Tadić, J. M., Loewenstein, M., and Gore, W.: Airborne observations and modeling of springtime stratosphere-to-troposphere transport over California, Atmos. Chem. Phys., 13, 12481–12494, https://doi.org/10.5194/acp-13-12481-2013, 2013.
- Abstract
- Introduction
- Observational datasets and methodology
- Overview of the CTs and associated meteorological conditions
- Covariability of CTs and air pollutants
- Conclusions
- Appendix A
- Data availability
- Author contributions
- Competing interests
- Disclaimer
- Acknowledgements
- Financial support
- Review statement
- References