the Creative Commons Attribution 4.0 License.
the Creative Commons Attribution 4.0 License.
 | 12 Nov 2021
A weather regime characterisation of winter biomass aerosol transport from southern Africa
Benjamin Pohl
Maria del Carmen Alvarez Castro
Cyrille Flamant
Paola Formenti
During austral winter, a compact low cloud deck over the South Atlantic contrasts with clear sky over southern Africa, where forest fires triggered by dry conditions emit large amounts of biomass burning aerosols (BBAs) in the free troposphere. Most of the BBA burden crosses the South Atlantic embedded in the tropical easterly flow. However, midlatitude synoptic disturbances can deflect part of the aerosol from the main transport path towards southern extratropics.
In this study, the first objective classification of the synoptic variability controlling the spatial distribution of BBA in southern Africa and the South Atlantic during austral winter (August to October) is presented. By analysing atmospheric circulation data from reanalysis products, a six-class weather regime (WR) classification of the region is constructed. The classification reveals that the synoptic variability is composed of four WRs, representing disturbances travelling at midlatitudes, and two WRs accounting for pressure anomalies in the South Atlantic. The WR classification is then successfully used to characterise the aerosol spatial distribution in the region in the period 2003–2017, in both reanalysis products and station data. Results show that the BBA transport towards southern extratropics is controlled by weather regimes associated with midlatitude synoptic disturbances. In particular, depending on the relative position of the pressure anomalies along the midlatitude westerly flow, the BBA transport is deflected from the main tropical route towards southern Africa or the South Atlantic. Moreover, the WRs accounting for midlatitude disturbances show organised transition sequences, which allow one to illustrate the evolution of the BBA northerly transport across the region in the context of a wave pattern.
The skill in characterising the BBA transport shown by the WR classification indicates the potential for using it as a diagnostic/predictive tool for the aerosol dynamics, which is a key component for the full understanding and modelling of the complex radiation–aerosol–cloud interactions controlling the atmospheric radiative budget in the region.
- Article
(12857 KB) - Full-text XML
-
Supplement
(3862 KB) - BibTeX
- EndNote


Natural and anthropogenic tropospheric aerosols are fundamental ingredients of the climate system. They influence the radiative properties of the atmosphere by deflecting and absorbing radiation (direct effect) and the cloud formation and properties by absorption (semi-direct effect) as well as by acting as cloud condensation nuclei (indirect effect). As a consequence, aerosols can influence the atmospheric and climate dynamics (Bellouin et al., 2020).
Africa is the Earth's largest source of biomass burning aerosol (BBA; e.g. van der Werf et al., 2010, 2017). The transport of BBA, originating from central Africa and embedded in the tropical midtropospheric easterly flow, occurs mostly above the Atlantic Ocean (Fig. 1a) and is a prominent feature during austral winter (June to October; Fig. 1b) between the Equator and 20∘ S, when dry conditions in central Africa favour the development of forest fires (Horowitz et al., 2017). However, extratropical rivers of smoke are also observed to extend to 30–40∘ S between August and October (Fig. 1b). The term “river of smoke” refers to the sharply defined boundaries of the smoke plume, which can be several hundred kilometres wide and flow over a few thousand kilometres above southern Africa towards the Southern Ocean and Indian Ocean (McMillan et al., 2003; Swap et al., 2003). Depending on the transport path (e.g. either above the continent or recirculated above the ocean), physical and chemical properties of the BBA may change (Abel et al., 2003; Eck et al., 2003; Formenti et al., 2003; Haywood et al., 2003; Pistone et al., 2019; Wu et al., 2020). The characterisation of BBA transport in terms of synoptic atmospheric circulation is therefore one of the key elements to shed light on the already complex picture of the radiation–aerosol–cloud interactions (Adebiyi and Zuidema, 2018; Formenti et al., 2019; Haywood et al., 2003, 2021; Lindesay et al., 1996; Mallet et al., 2020; Redemann et al., 2021; Swap et al., 2003; Zuidema et al., 2016). Additionally, the extent and direction of BBA transport may condition the atmospheric remote supply of nutrients and pollutants to the South Atlantic, the Southern Ocean, and the Indian Ocean, as well as to Antarctica (Baker et al., 2010; Barkley et al., 2019; Gao et al., 2020; Swap et al., 1996; Wai et al., 2014).
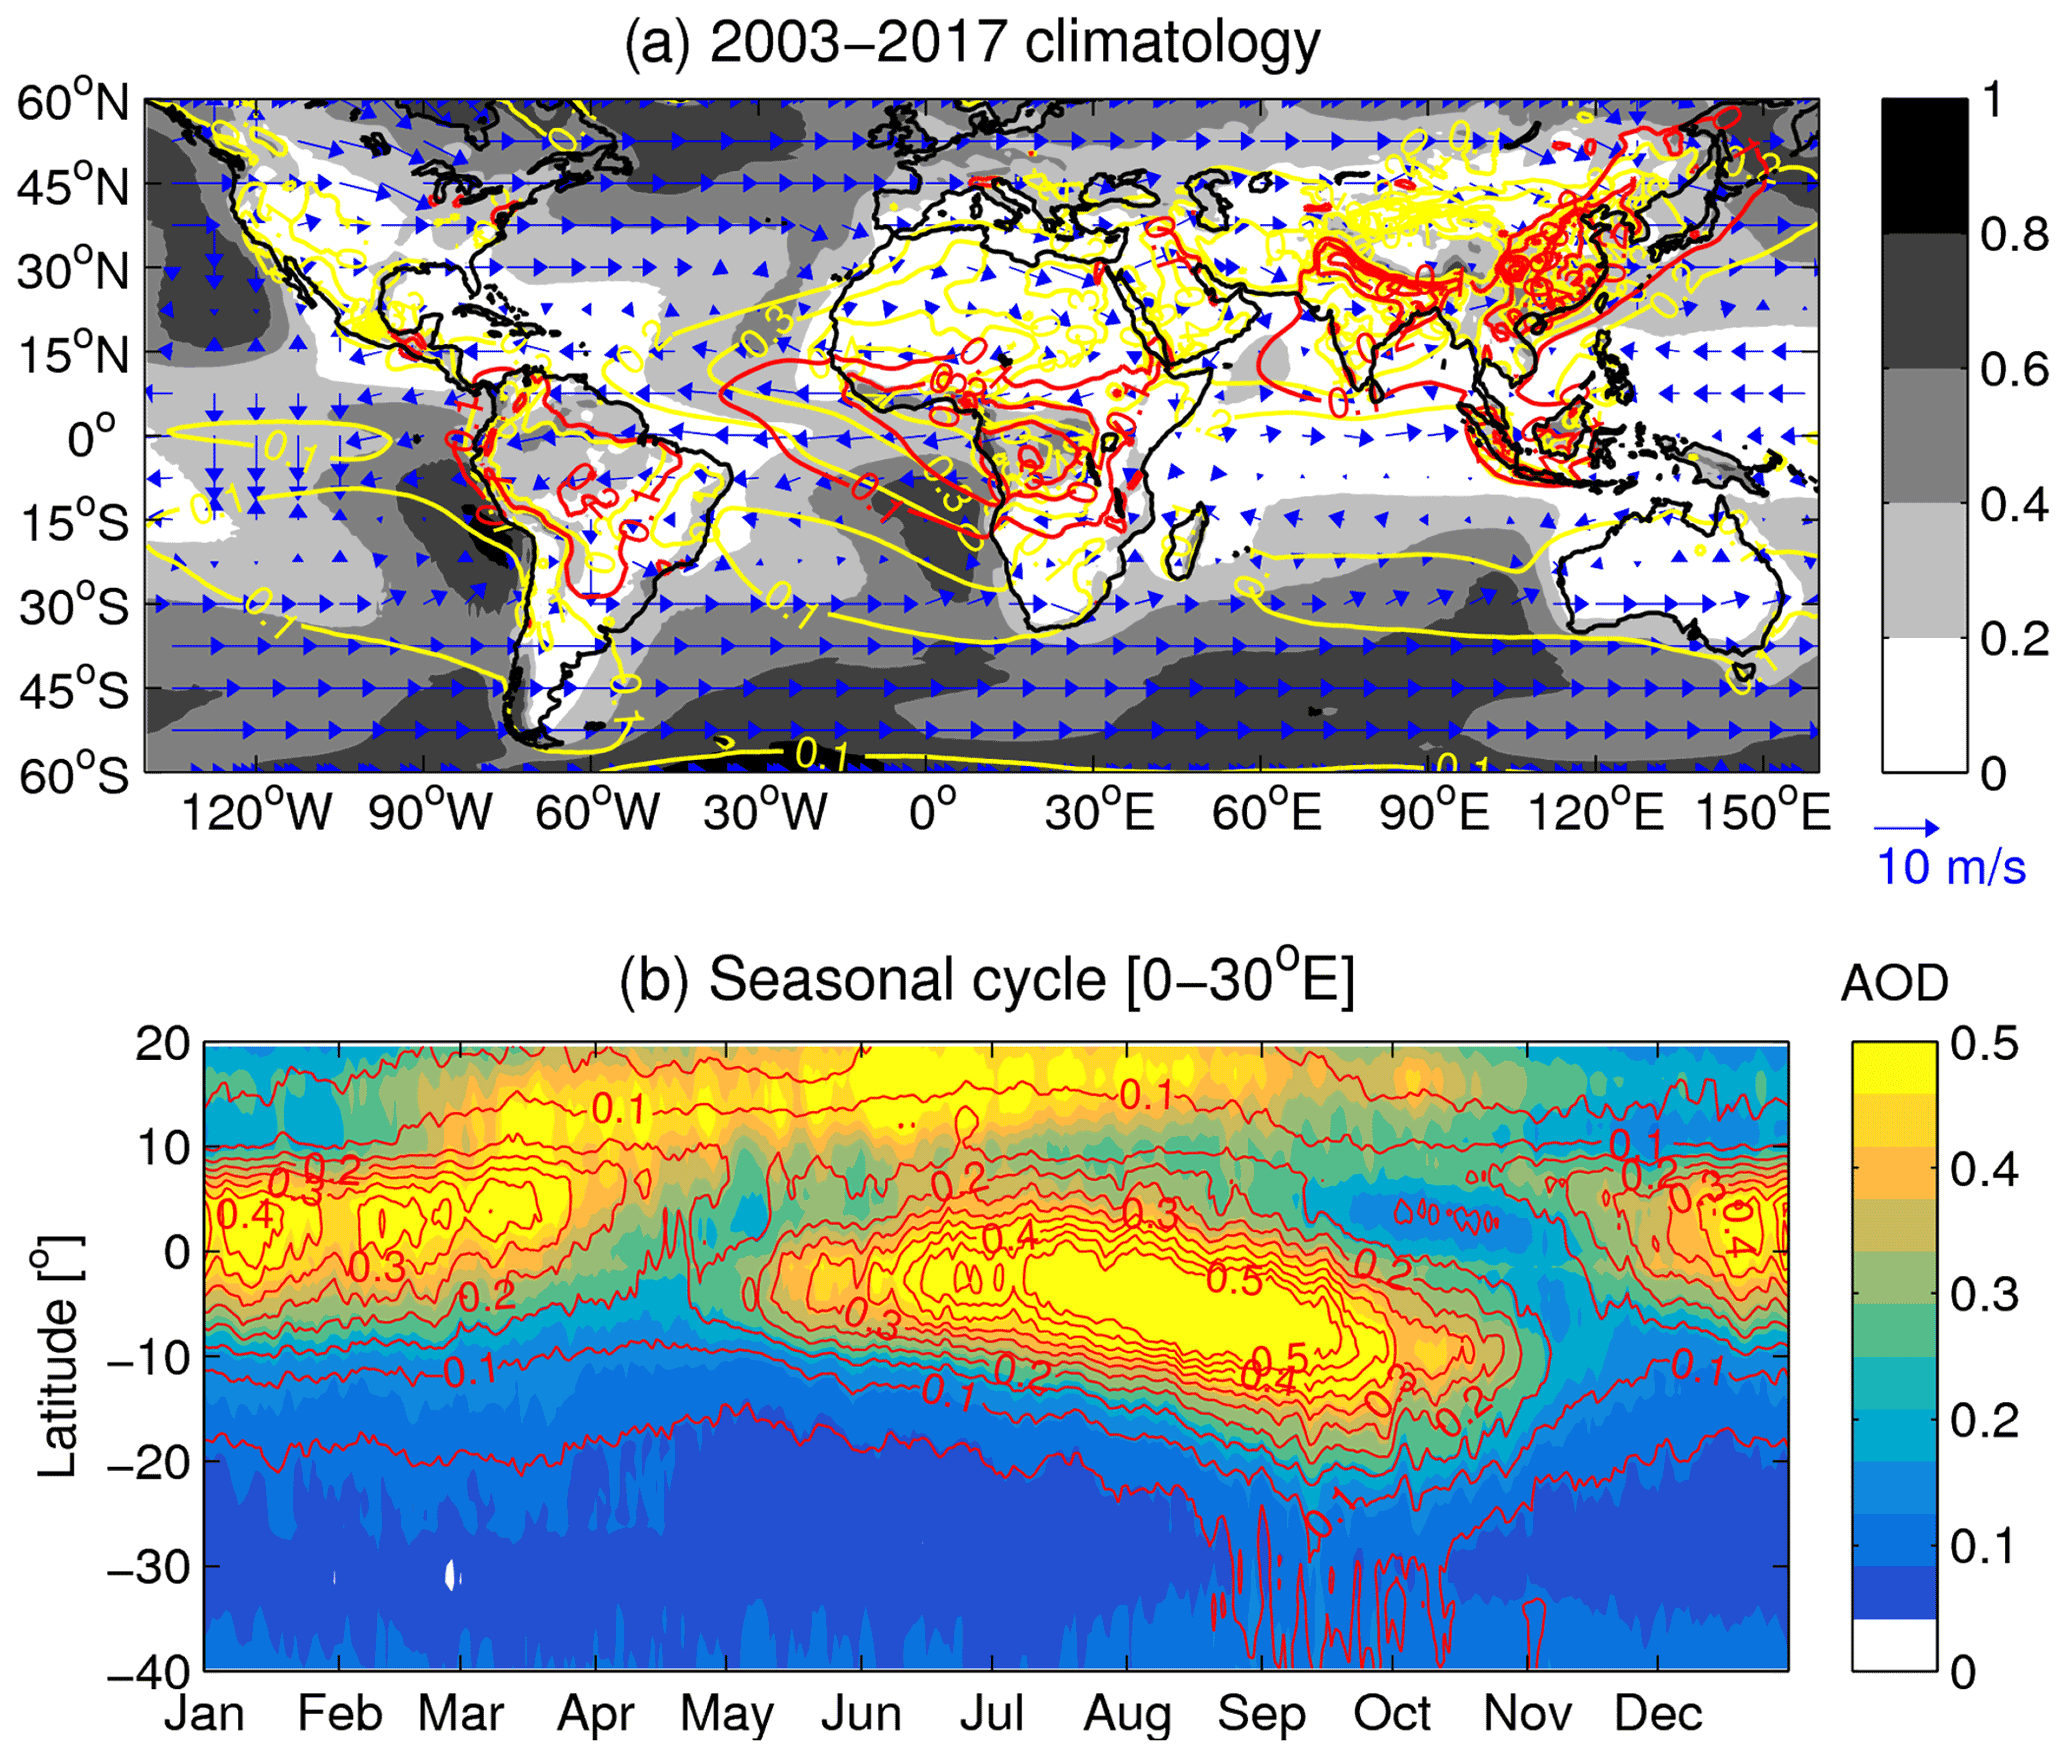
Figure 1The 2003–2017 climatology derived from CAMS reanalysis: (a) annual mean of total (yellow contours) and organic matter (red contours) aerosol optical depth (AOD) at 550 nm, low cloud cover fraction (shading), and wind at 700 hPa (arrows); (b) annual cycle of total (shading) and organic matter (red contours) AOD at 550 nm, averaged over Africa and South Atlantic (0–30∘ E).
Understanding the role of the radiation–aerosol–cloud interaction in controlling the atmospheric radiative budget and, consequently, climate dynamics is a key aspect for the improvement of climate modelling. Indeed, even state-of-the-art climate models still struggle in reliably representing the atmospheric radiative forcing, due to inaccurate parameterisations of the radiation–aerosol–cloud interaction (Mallet et al., 2020; Stier et al., 2013; Tang et al., 2019). This is particularly relevant in the South Atlantic, where the incomplete knowledge of the smoke-cloud regime generates large discrepancies in the modelling of radiative forcing and sea surface temperature (SST) in the region, eventually affecting climate simulations at regional and global scale (Zuidema et al., 2016). While a conceptual understanding of the meteorological conditions determining the transport of aerosols and pollutants at the subcontinental scale exists (Diab et al., 1996; Garstang et al., 1996; Tyson, 1997), the large-scale drivers of the aerosol spatial distribution in the region are still not understood, and an objective synoptic characterisation of the wintertime BBA transport is still missing to date. Indeed, synoptic circulation in the southern Africa and South Atlantic sector is discussed in literature mainly in relation to convection and precipitation during austral summer (e.g. Crétat et al., 2019; Dieppois et al., 2016; Fauchereau et al., 2009; Macron et al., 2014; Pohl et al., 2018; Vigaud et al., 2012).
The scope of this paper is to fill the gaps in the understanding of atmospheric and aerosol dynamics during austral winter in the southern Africa and South Atlantic sector, by providing a characterisation of the synoptic variability of the atmospheric circulation and determining the circulation patterns controlling the transport of BBA from the tropics to the extratropics. To this aim, an objective weather regime (WR) classification of the winter atmospheric circulation in the southern Africa and South Atlantic sector is presented for the first time and used to characterise the BBA transport in the region. In particular, the study focuses on the characterisation of the southward deflection of BBA from the mean tropical easterly flow from August to October (ASO) in the period 2003–2017. Atmospheric circulation data from a reanalysis product are first used to classify the synoptic circulation patterns. Then, the classification is used to characterise the BBA transport anomalies in reanalysis data and in situ observations in the region. The paper is organised as follows: in Sect. 2, data and methods used in the analysis are presented; in Sect. 3, the WR classification is presented, and the synoptic characterisation of BBA anomalies is discussed; and conclusions and perspectives are summarised in Sect. 4.
2.1 Reanalysis and gridded observations
The atmospheric circulation and the spatial distribution and optical properties of the BBA over southern Africa and the South Atlantic in ASO 2003–2017 are analysed using data from the Copernicus Atmospheric Monitoring Service reanalysis product (CAMS; Inness et al., 2019) at 6 h time steps (00:00, 06:00, 12:00, and 18:00 UTC) and 0.75∘ horizontal resolution. The BBA emission is estimated by the organic matter mixing ratio at 10 m, the BBA transport is estimated as the product of organic matter mixing ratio and wind at 700 hPa, and the aerosol spatial distribution is represented by the aerosol optical depth (AOD) at 550 nm (Fig. 2a). Data from the fifth generation ECMWF reanalysis (ERA5; Hersbach et al., 2018), available at hourly time steps and 0.25∘ horizontal resolution, are used to validate the WR classification on a longer time period (1981–2020). ERA5 data are selected at 6 h time steps (00:00, 06:00, 12:00, and 18:00 UTC) and regridded to the CAMS product grid at 0.75∘. For both of the reanalysis products, daily values are obtained at each grid point as the average of 6h time steps, and daily anomalies are computed by removing the low-frequency (LF) component of the time series, estimated by computing monthly means from daily data and interpolating them to daily time steps using a cubic spline interpolation. The limited coverage of the CAMS reanalysis (15 years) does not allow for a robust definition of the climatological seasonal cycle, which would be too dependent on the interannual variability. Therefore, in order to isolate the synoptic variability alone, the definition of a LF component, accounting for the seasonal cycle and the interannual variability, is preferred and applied to both the reanalysis products.

Figure 2The 2003–2017 ASO climatology derived from CAMS reanalysis: (a) organic matter mixing ratio at 10 m (µg kg−1, shading), organic matter transport at 700 hPa (µg kg−1 m s−1, arrows) and geopotential height at 700 hPa (m, contours); vertical cross-sections of the organic matter mixing ratio (µg kg−1) at (b) 0∘ E and (c) 25∘ S. In (a), thick arrows highlight organic matter transport corresponding to an organic matter mixing ratio greater than 4 µg kg−1; red lines indicate where organic matter mixing ratio cross-sections are computed; red dots indicate the locations of the AERONET stations used in this study (see Table 1 for details); and magenta dots indicate the locations of available stations not used in this study (see Sect. 2.2 for details).
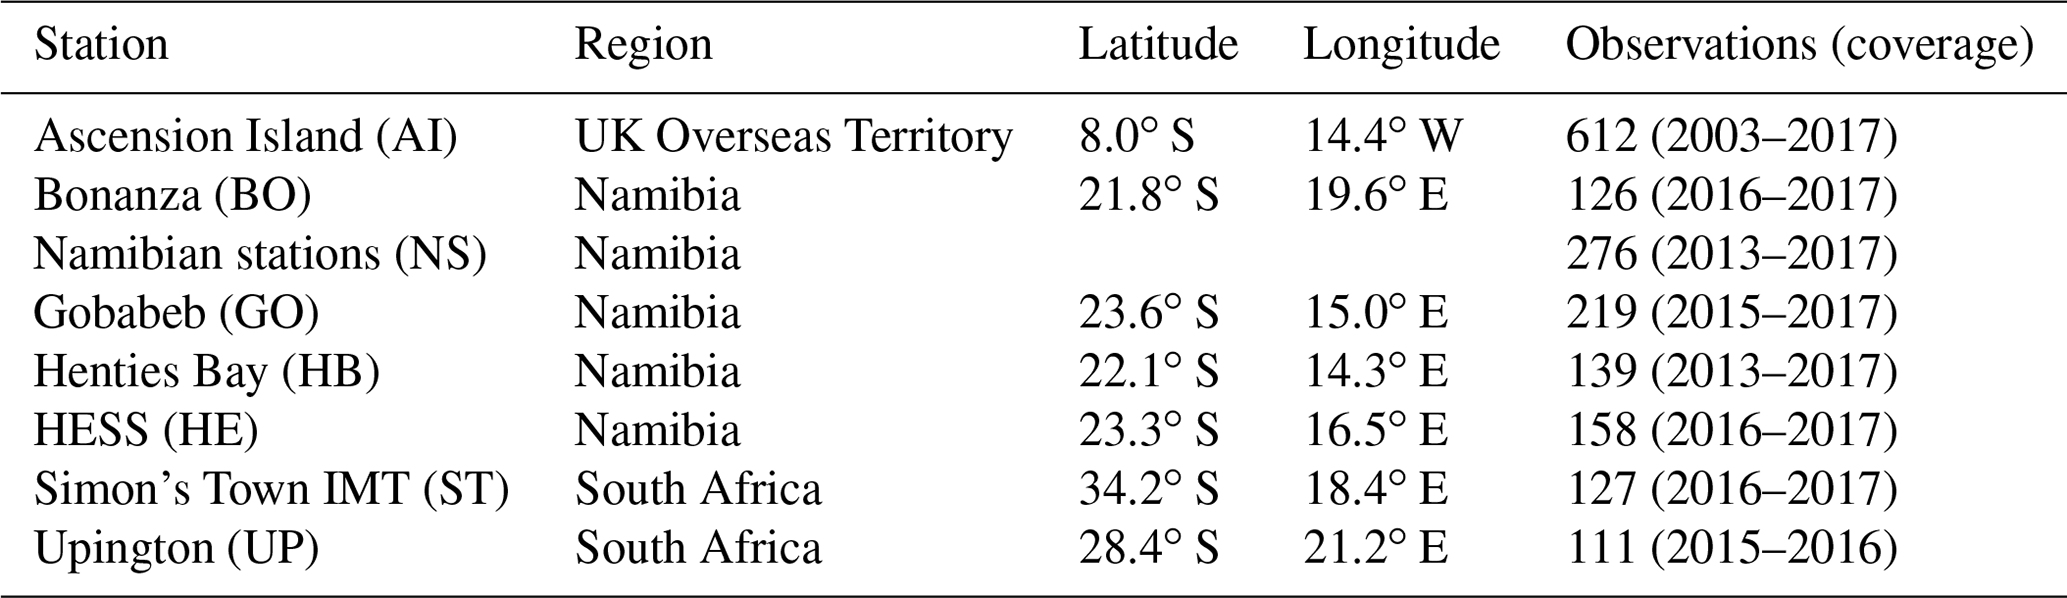
Table 1AERONET stations used in this study, with locations and data availability (AERONET Version 3 Direct Sun algorithm, level 2). IMT is the Institute for Maritime Technology.
Global reconstructions of the observed sea surface temperature (SST) are used to investigate the teleconnections controlling the synoptic variability. Data are extracted from the Met Office Hadley Centre HadISST dataset (Rayner et al., 2003), available from 1871 at monthly timescale and 1∘ horizontal resolution, and from the NOAA Extended Reconstructed Sea Surface Temperature (ERSST) Version 5 dataset (Huang et al., 2017), available from 1854 at monthly timescale and 2∘ horizontal resolution.
2.2 In situ aerosol observations
Observed daily values of the AOD at 500 nm from AERONET stations (https://aeronet.gsfc.nasa.gov/,and transition rates in Tables S1–S3 last access: 10 October 2020) are used to validate the synoptic characterisation performed on CAMS data. Stations are selected among the ones with at least 2 years of level-2 data obtained from the Version 3 Direct Sun algorithm (Giles et al., 2018). Stations are selected outside the source region in tropical Africa, namely south of 20∘ S and west of 10∘ E (Fig. 2a, Table 1), in order to focus on BBA transport only, i.e. not being influenced by the BBA emission which is assumed not to be directly related to synoptic conditions. Among the available stations, St. Helena (15.9∘ S, 5.7∘ W) and Wits University (26.2∘ S, 28.0∘ E) are not included because of the limited coverage (less than 100 observations during the study period). Moreover, the stations closer to the greater Johannesburg and Pretoria urban areas (namely Durban UKZN (University of KwaZulu-Natal) (29.8∘ S, 30.9∘ E), Pretoria CSIR-DPSS (Council for Scientific and Industrial Research – Defence, Peace, Safety and Security) (25.8∘ S, 28.3∘ E) and Skukuza (25.0∘ S, 31.2∘ E)) are not included, because they are too affected by the proximity of urban sources (Fig. 2a). Three Namibian stations, namely Gobabeb, Henties Bay and the High Energy Stereoscopic System site (H.E.S.S., denoted HESS or HE herein), are located very close to each other, in comparison to the size of the rivers of smoke affecting western Namibia (see Fig. 2a). Therefore, the combination of the AOD observations in the three stations would be more representative of regional conditions and filter out local effects on the AOD measurements. Indeed, Henties Bay is a coastal site, exposed to both marine and mineral dust aerosols; Gobabeb is in the Namib desert, exposed to mineral dust aerosols; and HESS is located inland in the savannahs, exposed to possible local sources of BBA. A daily time series associated with the three stations (referred to as Namibian stations, NS) is built by computing the average AOD when observations are available in at least two stations out of three, leading to a time series longer than the three individual time series (276 observations, spanning from 2013 to 2017; see Table 1).
For each station, daily AOD anomalies are computed by removing the LF component of the time series, accounting for both the seasonal cycle and the interannual variability, as described in Sect. 2.1. However, the sparseness of the AERONET observations makes difficult the definition of a daily LF component. Therefore, CAMS AOD at 550 nm is selected in an area defined by the grid point that is the closest to the station coordinates and the adjacent grid points, and it is averaged to estimate the daily LF component of the AOD at 500 nm. Empirical evidence shows that a quadratic relationship exists between the natural logarithm of AOD and wavelength (Eck et al., 1999). However, at such close wavelengths the relationship can be assumed to be linear, and the relationship between the natural logarithm of AOD at 500 and 550 nm can be modelled as follows:
At each AERONET station, the logarithm of observed and CAMS AOD well correlates during ASO 2003–2017 (correlations coefficients lie between 0.71 and 0.90; all significant at 99 % level of confidence; see Fig. 3). Therefore, the daily LF component of the observed AOD is estimated by means of a linear regression onto the CAMS LF component. In order to minimise the effect of possible large discrepancies between AERONET and CAMS data, the difference between AERONET and CAMS AOD is computed, and the values in the lowest and highest 5 % are discarded before the linear regression is performed (the coefficients used in the regression model at each station are displayed in Fig. 3).
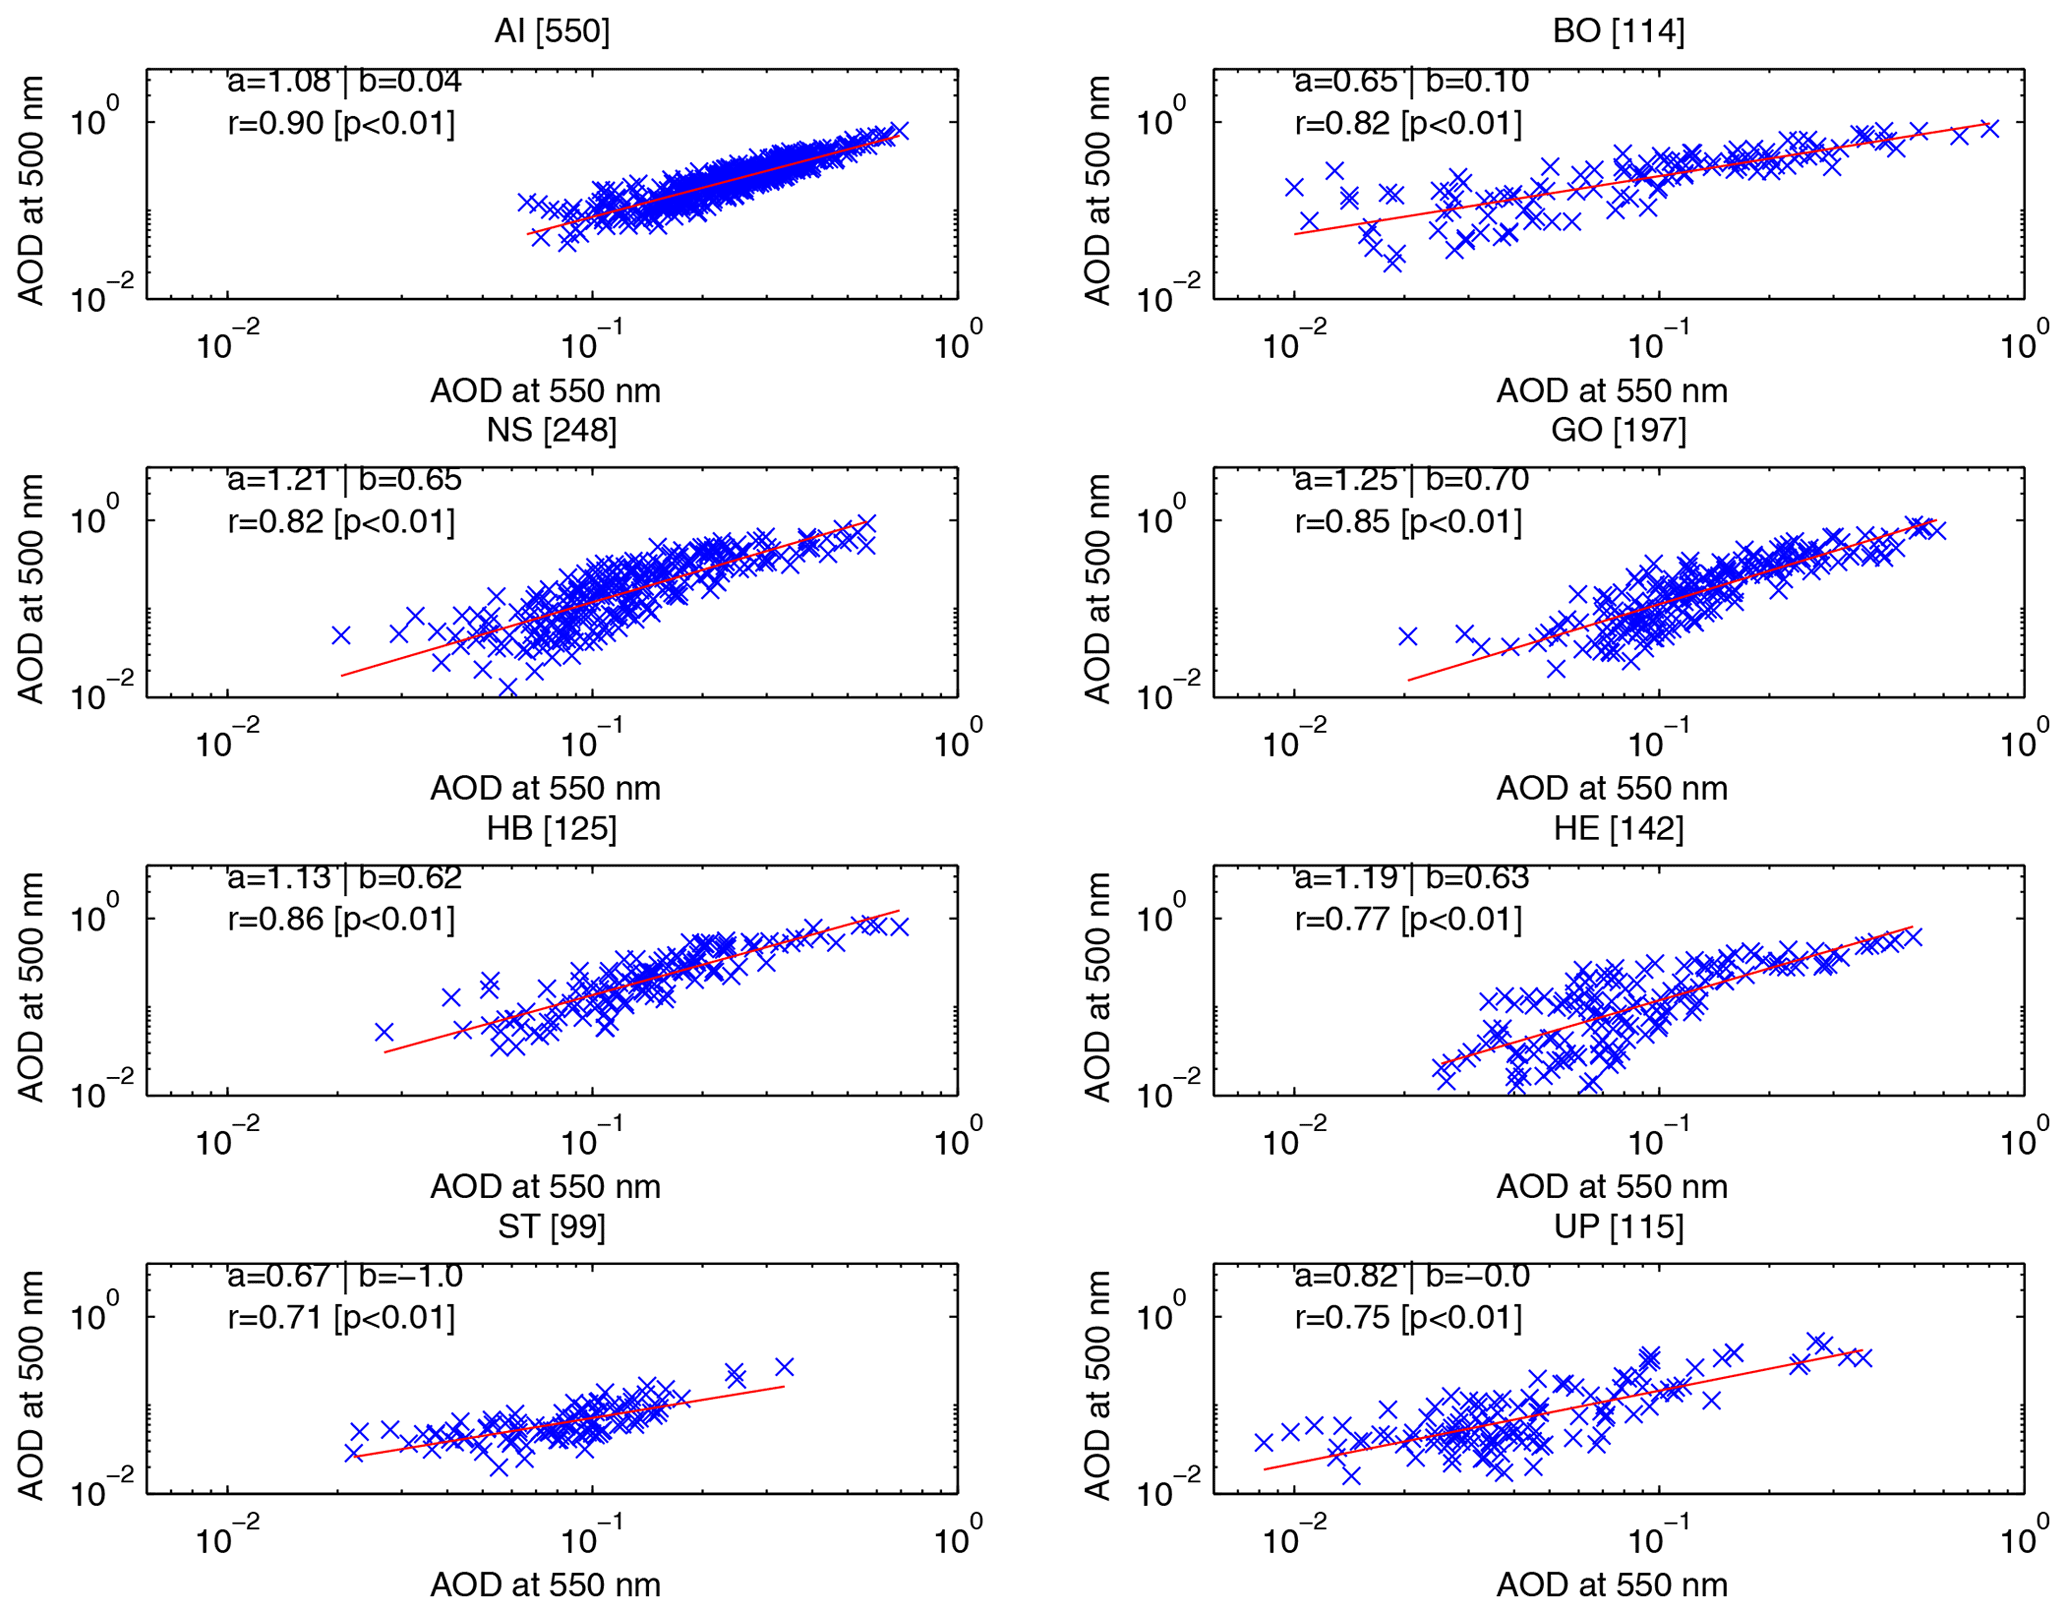
Figure 3Daily data comparison for ASO 2003–2017: CAMS reanalysis AOD at 550 nm vs. AERONET observed AOD at 500 nm. CAMS data are extracted at grid points that are the closest to the station coordinates (see Table 1). Red lines display the linear regression between CAMS and AERONET data, and the coefficients of the regression models are also reported in the plots, along with the correlation coefficient and the p value. In titles, the size of the sample used in the linear regression model is reported in brackets (see Sect. 2.2 for details).
2.3 Weather regime classification
The WR classification is performed on the geopotential height at 700 hPa, which is the level where BBA transport is maximal, in the domain 20∘ W–40∘ E and from the Equator to 40∘ S (see Fig. 2b and c). The selection of the domain is made to include the main BBA transport routes in the tropical belt and towards the extratropics. However, during the dry season the synoptic variability in the tropics is reduced in comparison to the extratropics (Baldwin, 2001). Therefore, the southern border of the domain is set to 40∘ S, i.e. not to let the dominant midlatitude modes mask variability in the tropical belt. The atmospheric circulation is first characterised by isolating the main modes of variability represented by the empirical orthogonal functions (EOFs) derived from a principal component analysis (PCA) of the geopotential height daily anomalies. Each mode is represented by a spatial anomaly pattern and a standardised time series (namely the principal components, PCs) accounting for the amplitude of the anomaly pattern (for more details on PCA, see von Storch and Zwiers, 1999). The first four EOFs, accounting for at least 80 % of the total variance (Fig. S1 in the Supplement), are used to classify the WRs by means of a k-means algorithm, using k= [2, 10] (Michelangeli et al., 1995). For each k, the classification is performed 100 times, to ensure reproducibility of the results. A red-noise test is performed to assess the significance of the class partition (Michelangeli et al., 1995), resulting in six and seven classes (Fig. S3). The synoptic characterisation of the BBA transport is performed by using both the six-class and the seven-class partitions. This study focuses on the six-class partition, i.e. the classification with the lowest significant number of WRs, which leads to physically coherent atmospheric patterns describing the main features of the synoptic variability (see Sect. 3.1). Furthermore, the comparison between the six- and seven-class partitions shows that the six-WR classification performs better in characterising the BBA transport in the region (see Sect. S3). The robustness of the six-class partition is tested against different choices of time period (1981–2020), geographical domain (20∘ W–40∘ E and 10–50∘ S) and retained variance (at least 90 %, accounted for by the first seven PCs).
2.4 Aerosol synoptic characterisation
The WR classification is used to characterise the observed AOD data from the AERONET stations in the region (Table 1). Two approaches are used:
-
Daily AOD anomalies are linked to the corresponding WR and grouped, and statistical differences among groups are investigated (circulation-to-environment approach, C2E). The significance of the C2E characterisation is assessed by a one-way analysis of variance (ANOVA) with the null hypothesis that the distributions associated with each WR are derived from populations with the same mean. Furthermore, for each WR the significance of the associated AOD anomalies with respect to the full sample is assessed by a non-parametric Kolmogorov–Smirnov (KS) test.
-
Daily AOD anomalies are divided into quartiles, and the changes in the WR occurrences within each quartile are studied (environment-to-circulation approach, E2C). The significance of the E2C characterisation is assessed by computing the chi-square statistics for each quartile, with the null hypothesis that the associated WR frequencies are derived from the same distribution of the full sample. The chi-square statistics are tested against the critical value for 5 degrees of freedom and at the 95 % level of confidence. The degrees of freedom are estimated as the number of observation categories (six WRs) minus the parameters of the distribution to be fitted (the mean WR occurrence, i.e. one).
3.1 Synoptic characterisation of the regional atmospheric variability
The mean atmospheric conditions over the South Atlantic and southern Africa in ASO are illustrated in Fig. 2a. The atmospheric circulation at 700 hPa is characterised by a continental high, centred at 25∘ S over southern Africa and extending over the eastern South Atlantic, and a subtropical trough west of South Africa deflecting the midlatitude westerly flow southward. Massive quantities of BBA are emitted from tropical southern Africa and are driven westward over the South Atlantic by the southern African easterly jet (Adebiyi and Zuidema, 2016), while the anticyclonic gyre associated with the continental high recirculates the BBA towards South Africa along the Namibian coast. This recirculation merges with smaller BBA amounts emitted from sources located in South Africa in the urban area of Johannesburg and Pretoria, to be eventually transported eastward to the Indian Ocean embedded in the westerly flow.
The WR classification shows two synoptic patterns accounting for the oscillation of the pressure field in the South Atlantic and four synoptic patterns accounting for midlatitude pressure anomalies (Fig. 4). These four WRs represent the fingerprint of propagative disturbances travelling along the midlatitude mean westerly flow with wave number 8–12, as shown by the EOF analysis (see Sect. S1 in the Supplement). The synoptic variability is dominated by the South Atlantic positive pattern (SA+), which occurs at a frequency of 22.3 % and is characterised by a high-pressure anomaly in the South Atlantic accompanied by a reinforcement of the midlatitude westerlies (Fig. 4a). Its symmetric counterpart is represented by the South Atlantic negative pattern (SA−), which occurs at a frequency of 17.7 % and is characterised by a low-pressure anomaly and a weaker westerly flow in the midlatitudes (Fig. 4b). The remaining 60 % of the synoptic variability in the region is characterised by eastward-travelling disturbances of the westerly flow, represented by midlatitude (ML) anomaly patterns 1–4 (Fig. 4c–f). WR sequences are characterised by short duration, 2–3 d for SA+ and SA−, with extreme persistence values above 10 d and 1–2 d for ML1–4, with extremes not exceeding 6 d (Fig. 5a). The analysis of the WR transitions shows that SA+ and SA− are dominated by persistence (self-transitions are, respectively, 61 % and 59 % of the total), with reduced transition rates towards the other WRs (Table 2). Conversely, persistence is reduced in the ML patterns (self-transitions are less than 50 %), which show non-negligible hetero-transition rates (Table 2). Specifically, ML1 shows preference for transitions towards ML2 (28 % of the transitions); ML2 prefers transitions towards ML3 (31 %); ML3 tends to evolve into ML4 (24 %); and ML4 towards ML1 (29 %). The transitions of the ML WRs highlight the eastward propagative character of these WRs, suggesting a possible transition pattern from ML1 to ML4 (ML1 → ML2 → ML3 → ML4). The evolution of the atmospheric circulation anomalies from the occurrence of the WR to day +4 is illustrated in Fig. 6. The building and eastward propagation of midlatitude disturbances is evident for ML1–4, which evolve into themselves on day +1 and then into each other on day +2 to +3 (Fig. 6c–f), following the transition pattern ML1 → ML2 → ML3 → ML4. This transition pattern depicts the propagation and life cycle of temperate waves embedded in the regional midlatitude dynamics. Conversely, persistence characterises the evolution of SA+ and SA−, evolving into themselves on day +1 to +2, to weaken and disappear on day +3 (Fig. 6a and b).
Table 2WR transition rates in the CAMS classification, computed as the percentage of transitions from a WR (rows) towards the others (columns). By definition, the diagonal represents persistence. Transition rates above , i.e. the threshold for non-random transitions, are reported in bold.
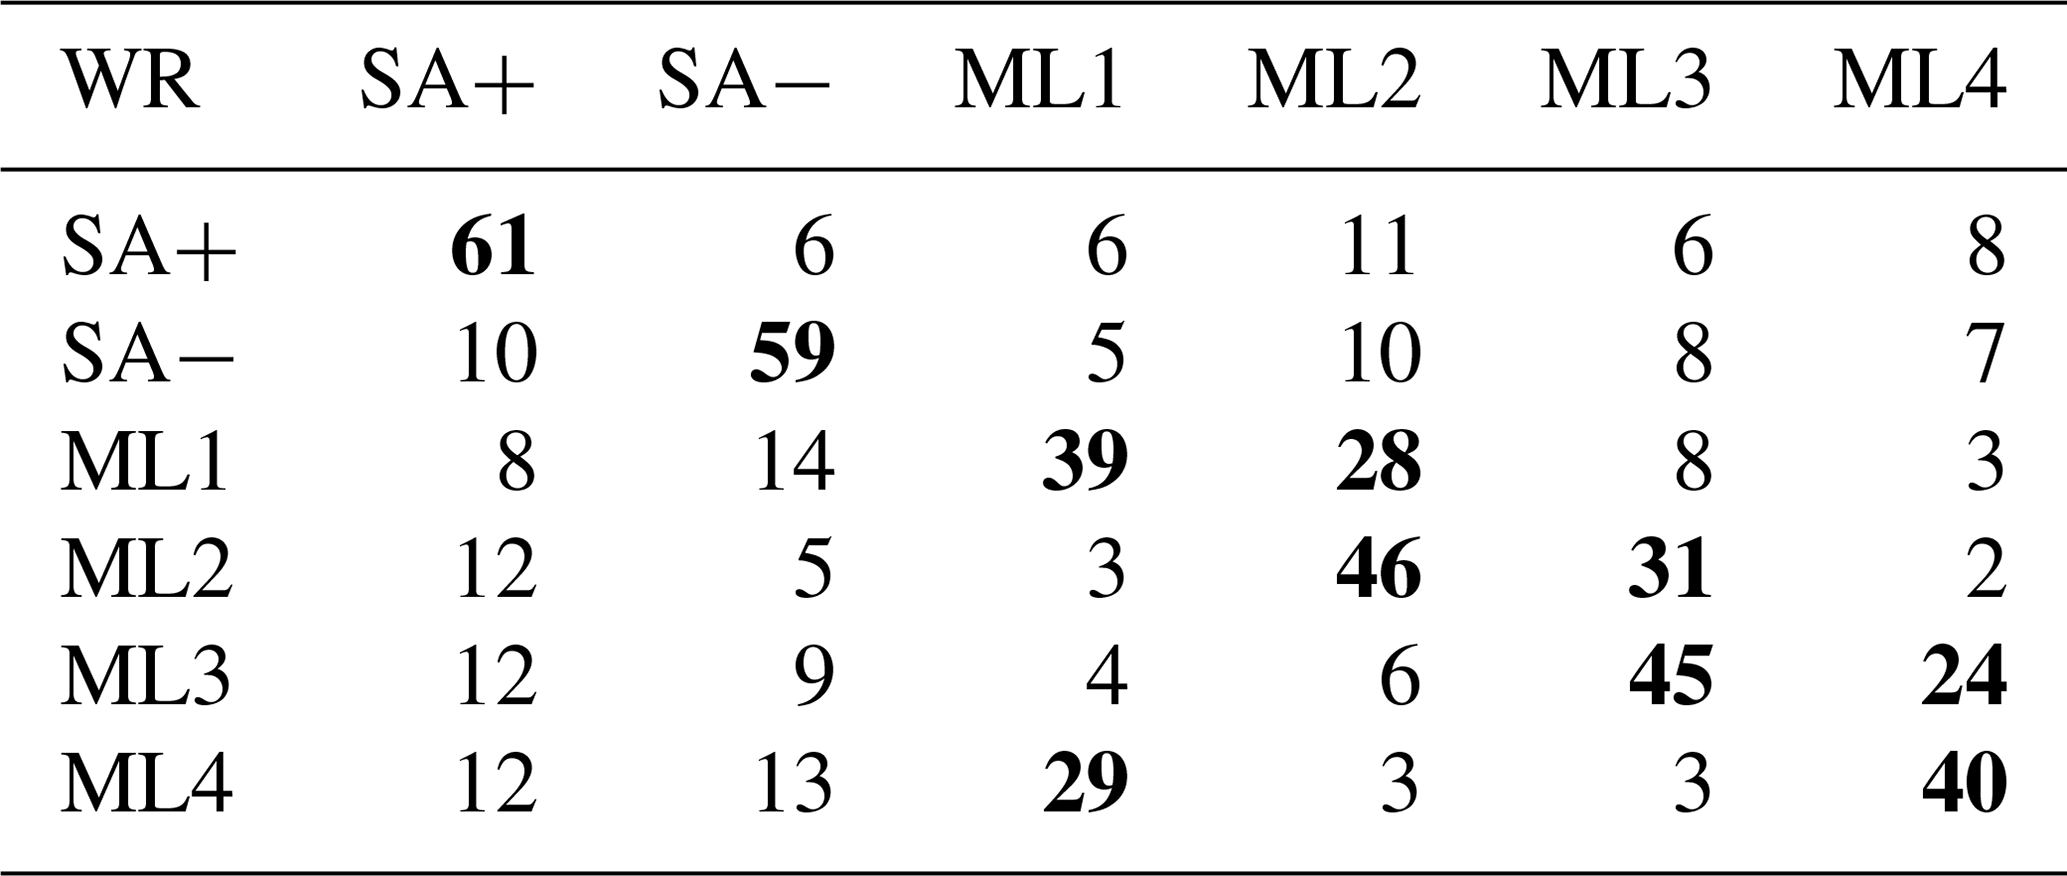
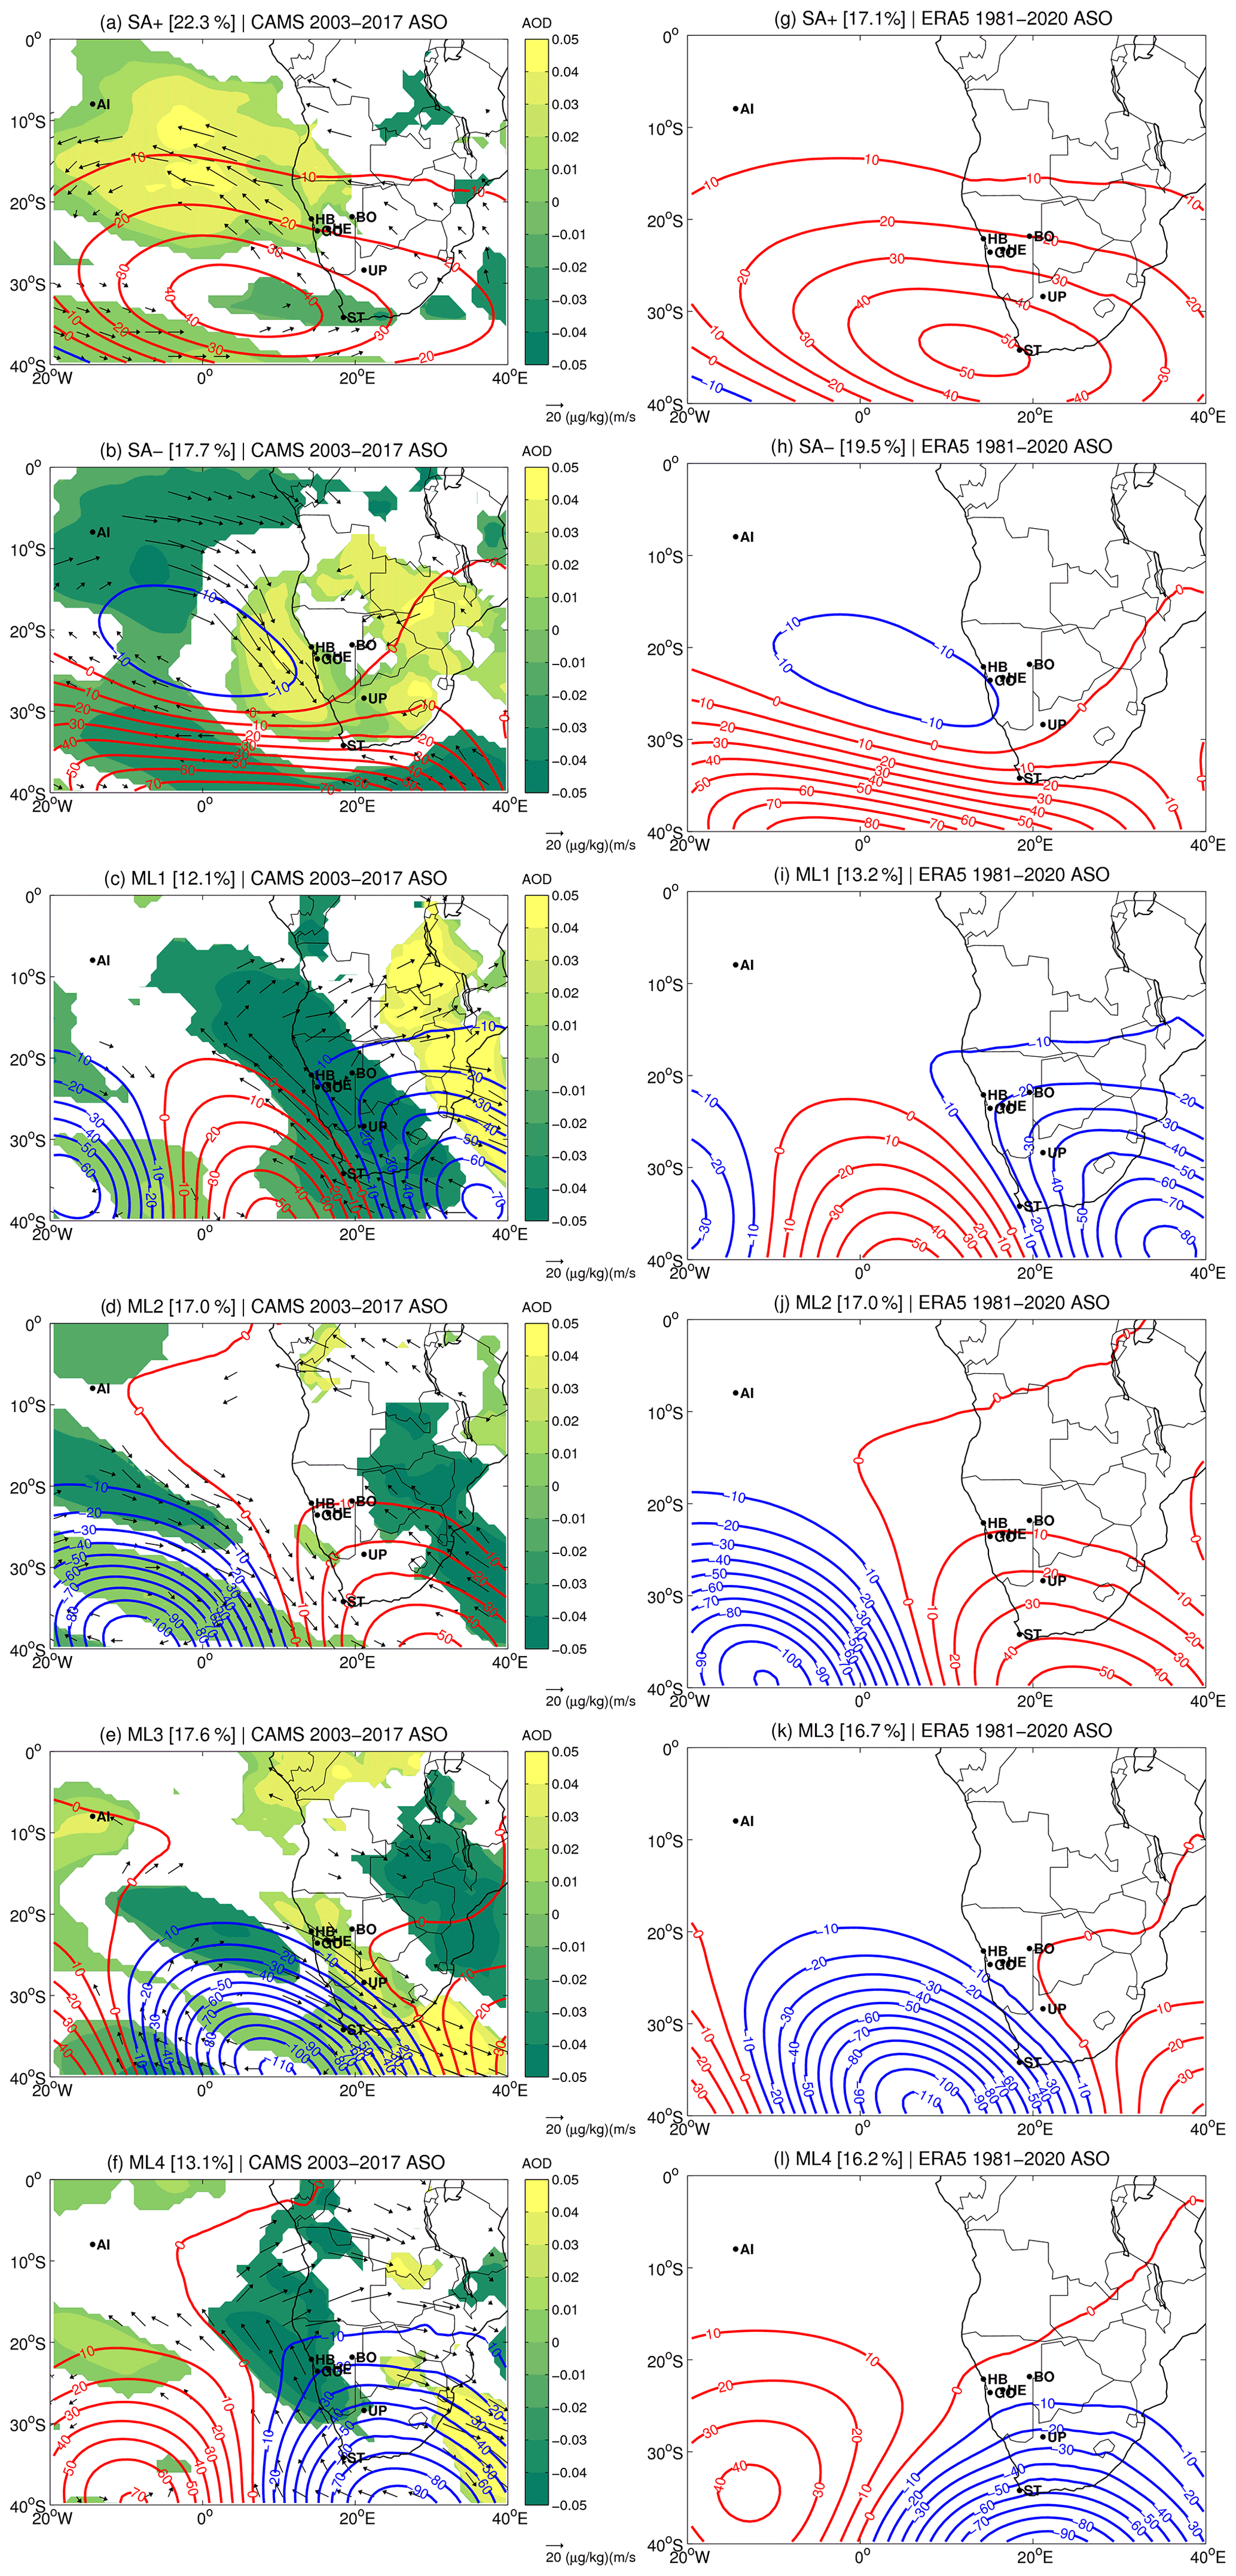
Figure 4Left panels: anomaly patterns of CAMS geopotential height (m, contours), AOD at 550 nm (shading) and organic matter transport ((µg kg−1) (m s−1), arrows) at 700 hPa associated with the WRs classified from CAMS geopotential height at 700 hPa in ASO 2003–2017. Right panels: anomaly patterns of ERA5 geopotential height (m, contours) at 700 hPa associated with the WRs classified from ERA5 geopotential height at 700 hPa in ASO 1981–2020. Dots indicate the locations of the AERONET stations used in this study. Frequency of the WRs is indicated in brackets. For AOD and organic matter transport, only values significant at the 95 % level of confidence after a Student's t test are displayed.
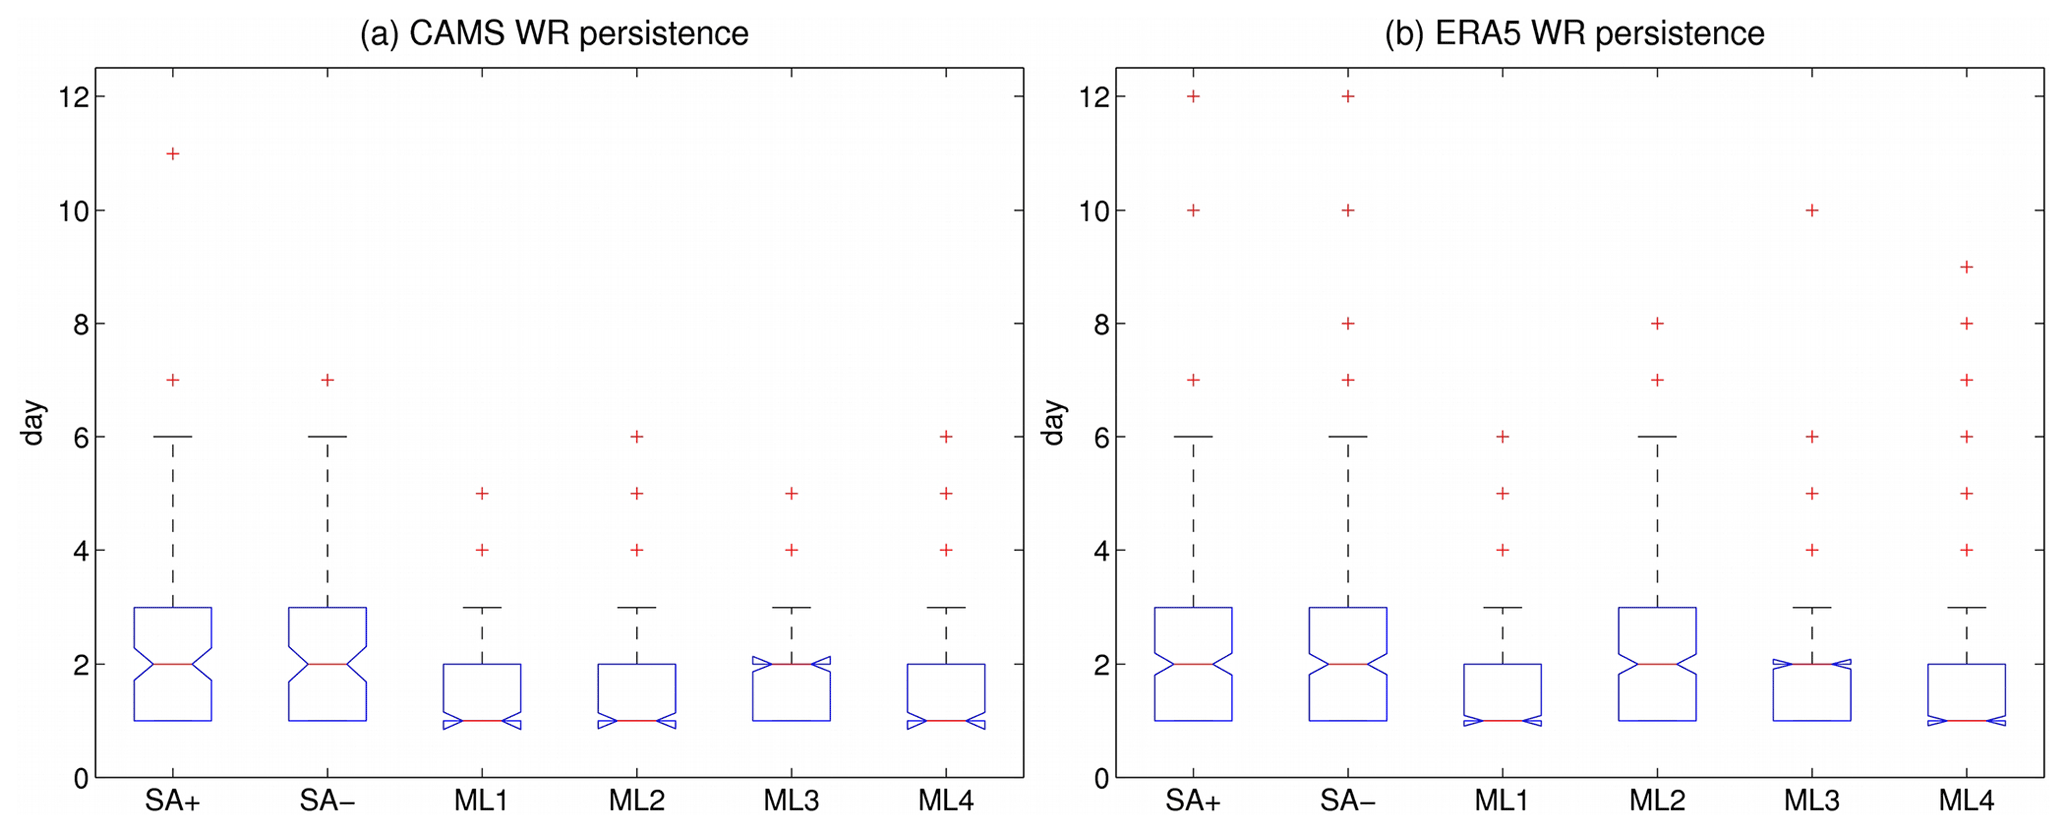
Figure 5WR persistence in (a) CAMS and (b) ERA5 classifications, displayed as the distribution of the WR sequences. Red lines represent the median, boxes represent the interquartile range, whiskers extend up to 1.5 times the interquartile range, and outliers are displayed as red crosses.
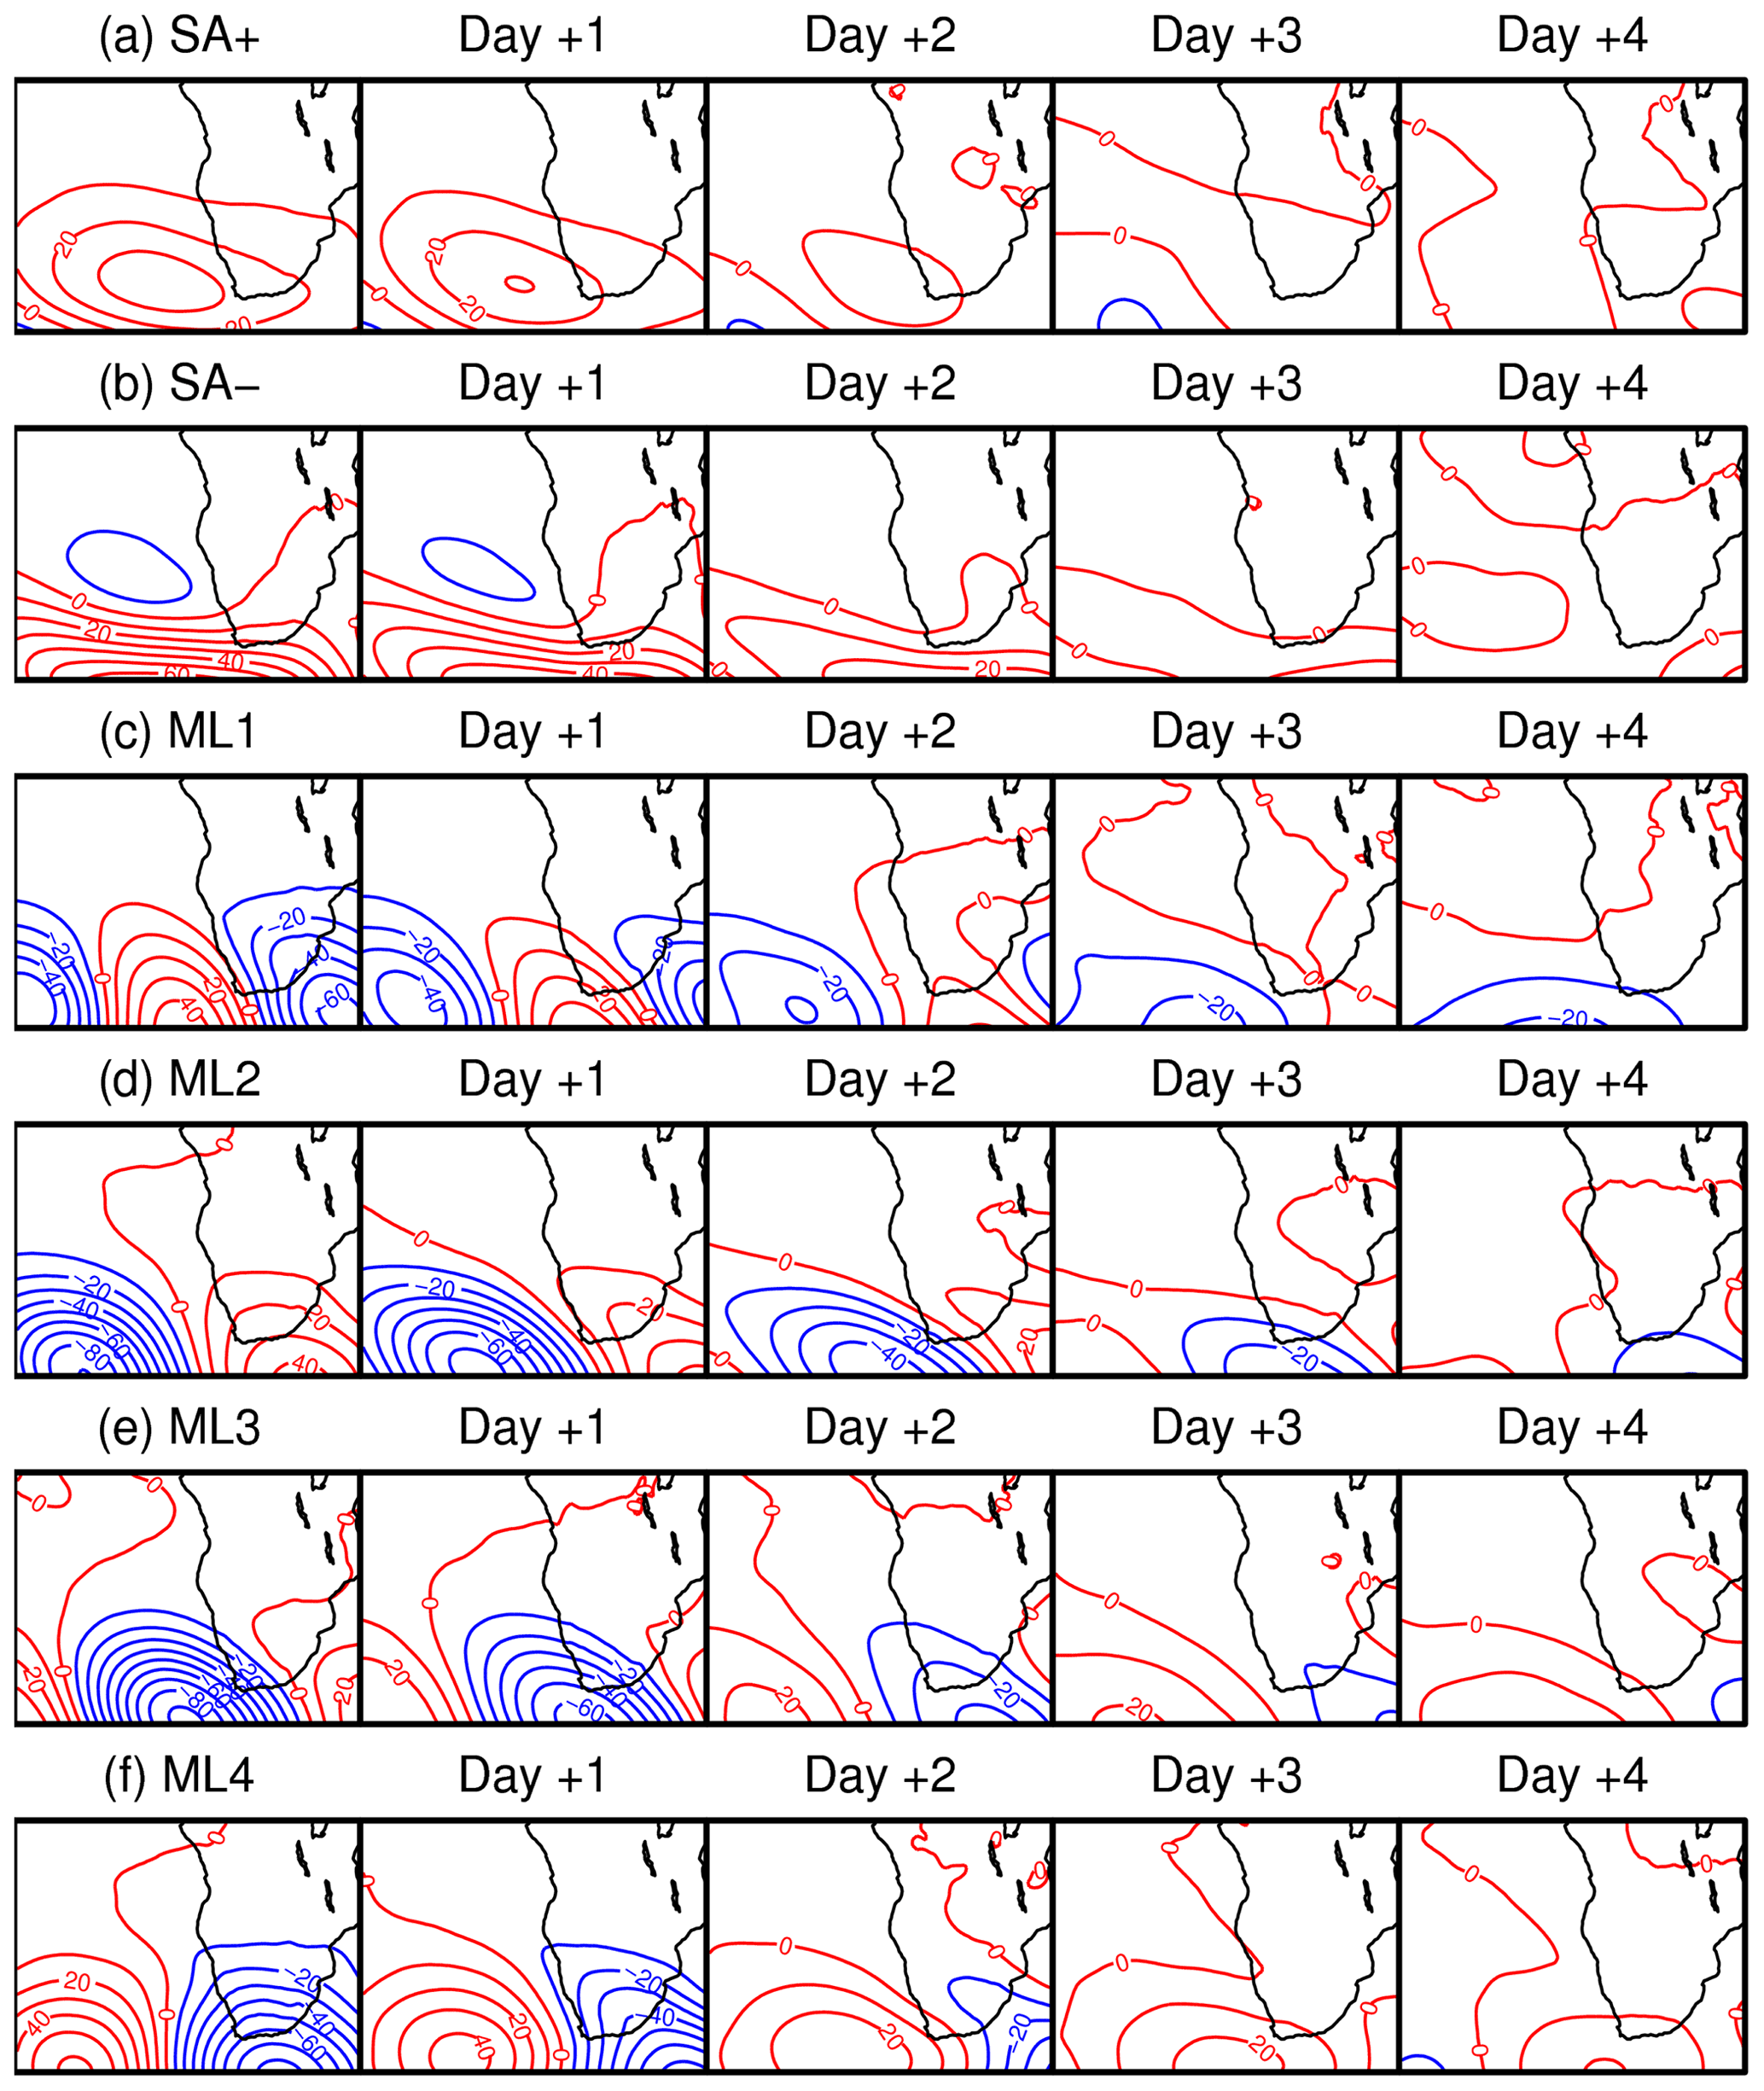
Figure 6Daily evolution of the 700 hPa geopotential height anomalies (m, contours) associated with the CAMS WR classification, computed as composites from the WR occurrence (day 0) to day +4.
The sensitivity of the WR classification described above (referred to as control classification) to different choices of the retained variance (referred to as PC7 classification) and the geographical domain (referred to as shifted classification) is assessed (see Sect. S2 for details). Both the PC7 and shifted classifications result in two WRs (SA+ and SA− in Fig. S4) characterised by persistent (2–3 d) pressure anomalies in the South Atlantic (see the analysis of persistence, Fig. S5, and transition rates in Tables S1–S3 in the Supplement) and four WRs (ML1–4 in Fig. S4) characterised by travelling pressure anomalies at the midlatitudes (see Fig. S5 and Tables S1–S3), showing no substantial changes in the circulation features identified in control. Nevertheless, one “spurious” WR appears in both the modified classifications (ML2 in PC7 and ML4 in shifted), affecting the frequencies of occurrence and the transition rates among WRs (see Fig. S5 and Tables S1–S3) and limiting the rate of WR co-occurrence (the fraction of days sharing the same WR with control) to 54 % in PC7 and 49 % in shifted. However, the frequency of the spurious WRs is 13 % in PC7 (ML2) and 14 % in shifted (ML4), and when they are not considered in the computation of the co-occurrence rates, these increase to 72 % in PC7 and 65 % in shifted. The robustness of the WR classification in the period 2003–2017 is also assessed by comparison with the classification of the ASO synoptic variability in the same domain performed on the ERA5 data in the period 1981–2020. The ERA5 classification shows two WRs accounting for pressure anomalies in the South Atlantic and four WRs accounting for pressure anomalies at the midlatitudes (Fig. 4g–l), characterised by persistence and transitions similar to the CAMS classification (Fig. 5b and Table 3). The comparison of the spatial patterns shows a high degree of similarity between the two classifications, with the WRs almost overlapping in terms of both circulation features and location and intensity of the anomalies (Fig. 4). As expected, the classification in ERA5, performed on a longer time period limiting the influence of the interannual variability, shows reduced differences in the WR frequencies at the seasonal timescale (frequencies are between 13.2 % and 19.5 % in ERA5 and between 12.1 % and 22.3 % in CAMS; see Fig. 7). The availability of 40-year time series in ERA5 allows one to robustly estimate WR frequencies at the intraseasonal timescale (Fig. 7). Differences are limited to 1 %–2 %, with the exception of ML2 and ML3, increasing by 3 % and decreasing by 4 % during the season, respectively. The comparison of the WR occurrences in the overlapping period (ASO 2003–2017) shows that 81 % of the days are characterised by the same WR in ERA5 and CAMS. The sensitivity tests performed on the WR classification of the CAMS data show a high degree of robustness with respect to changes in the time period and a good degree of robustness with respect to changes in the geographical domain and the retained variance, highlighting that the classification well represents the main features of the synoptic circulation in the region.
Table 3WR transition rates in the ERA5 classification, computed as the percentage of transitions from a WR (rows) towards the others (columns). By definition, the diagonal represents persistence. Transition rates above , i.e. the threshold for non-random transitions, are reported in bold.
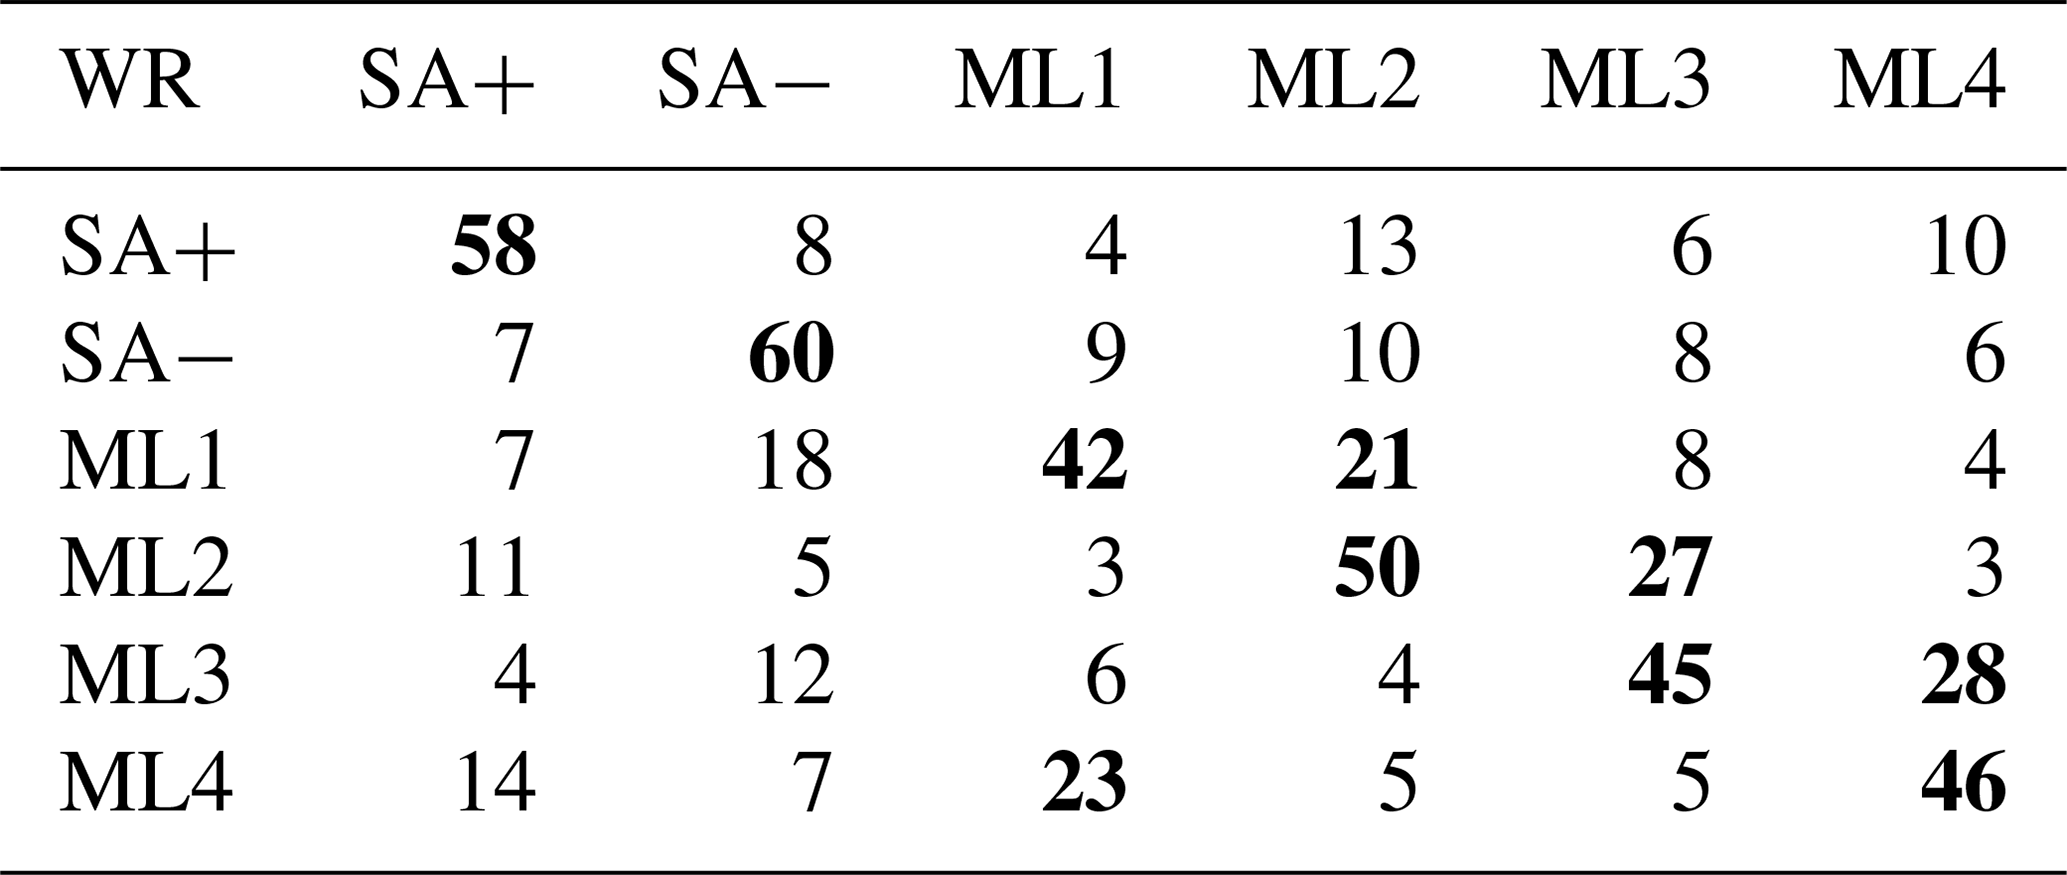
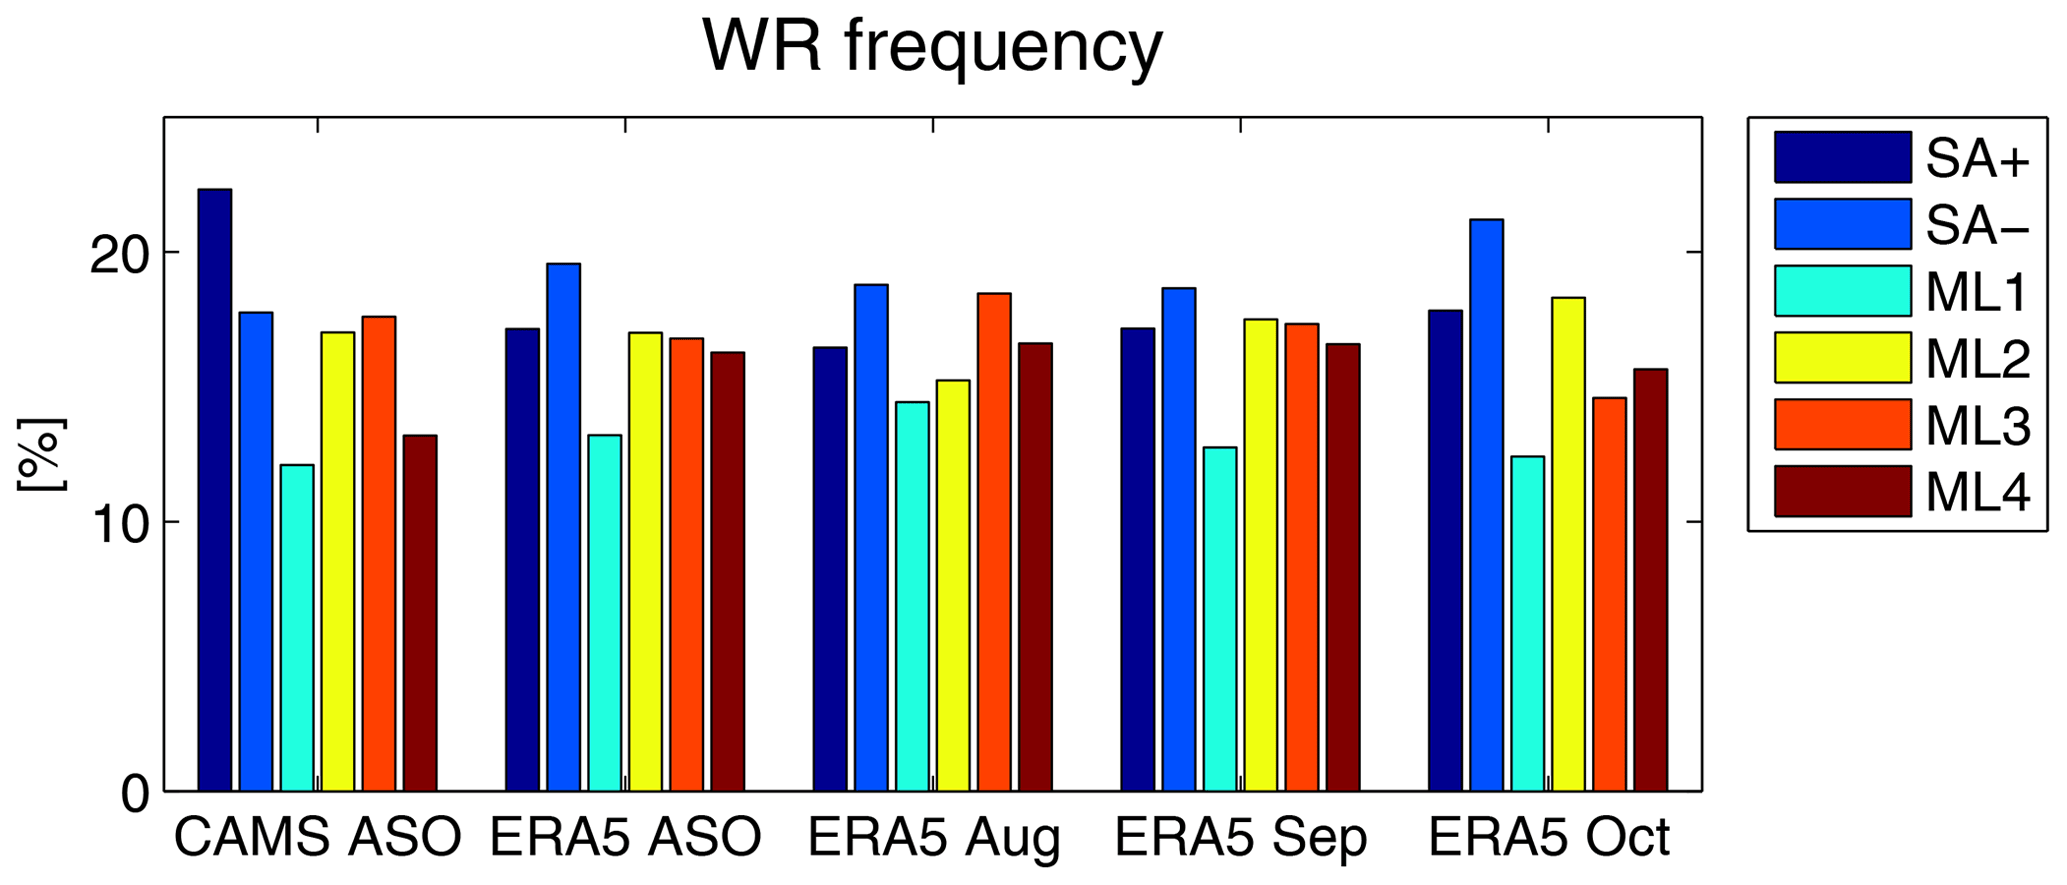
Figure 7WR frequency in CAMS (computed in the period 2003–2017) and ERA5 (computed in the period 1981–2020) classifications.
At the global scale, the variability of the atmospheric circulation south of 20∘ S is dominated by the southern annular mode (SAM), which consists of out-of-phase surface pressure and geopotential height anomalies between the Antarctic region and the southern midlatitudes, resulting in the modulation of the location and intensity of the westerly wind belt (Baldwin, 2001; Limpasuvan and Hartmann, 1999). The relationship between the WR occurrence and the SAM daily index is investigated applying both the C2E and the E2C approach to the ERA5 classification. When the SAM index is associated with the different WRs, the ANOVA shows that the distributions are not derived from populations with the same mean (p<0.01). However, the C2E characterisation of the SAM index does not show a clear association between positive and negative SAM phases and the WRs (Fig. 8a). When the SAM index quartiles are associated with the changes in the WR frequency (E2C), a significant increase in frequency of SA+ and SA− is detected for large positive values of the SAM index, while large negative values occur when ML1, 3 and 4 are significantly more frequent (Fig. 8b). Not surprisingly, the WRs characterised by travelling midlatitude disturbances are associated with negative SAM phases, i.e. with intensified westerlies. Conversely, positive SAM phases, resulting in weaker westerlies, are associated with increased frequency of the WRs accounting for the pressure anomalies in the South Atlantic.

Figure 8(a) Circulation-to-environment characterisation (C2E): (left panel) daily Southern Annular Mode (SAM) index distribution and (right panel) for each ERA5 WR. Probability density functions are estimated by using a normal kernel density; red lines represent 25th, 50th and 75th percentiles. Anomaly distributions significantly different from the climatological sample are displayed in green (significance is assessed by a Kolmogorov–Smirnov test at the 95 % level of confidence). The p value of the ANOVA used to assess the C2E characterisation is reported in brackets. (b) Environment-to-circulation characterisation (E2C): ERA5 WR frequency anomaly for each quartile of the daily SAM index. Values represent percentage changes relative to climatological frequencies. Green boxes highlight significant changes in the WR frequencies, i.e. frequency anomalies exceeding the critical threshold (11.07) for the chi-square statistics with 5 degrees of freedom at the 95 % level of confidence (see Sect. 2.4 for details).
3.2 Synoptic characterisation of reanalysis aerosol optical depth
The WRs describing propagative disturbances at midlatitudes (ML1–4) are characterised by the longitudinal displacement of high–low pressure anomalies modulating the meridional circulation, which in turn drives the poleward BBA transport above the South Atlantic and southern Africa (Fig. 4c–f). In particular, ML3 favours the recirculation of BBA from the ocean towards Namibia and South Africa, leading to significant positive AOD anomalies above all the continental stations (Fig. 4e), while ML2 pushes the BBA recirculation above the South Atlantic and inhibits the BBA transport towards the Indian Ocean (Fig. 4d). Conversely, ML1 and 4 are associated with a weaker BBA transport above Namibia and South Africa, leading to significant negative anomalies above the continental stations and larger transport towards the Indian Ocean (Fig. 4c and f). BBA transport along the Atlantic coast of Namibia and South Africa is also anomalously high during SA−, which is characterised by a low-pressure anomaly in the South Atlantic inhibiting the transport towards the subtropical South Atlantic and leading to significant negative anomalies above Ascension Island, favouring a poleward route driving anomalous BBA concentrations above the continental stations (Fig. 4b). SA+, characterised by a high-pressure anomaly in the South Atlantic strengthening the easterly flow in the tropics, is the only WR associated with a reinforcement of the main BBA transport route in the tropical South Atlantic, and positive AOD anomalies only affect the Ascension Island station (Fig. 4a).
The analysis of persistence and transitions highlights two distinct variability patterns in the WR classification, both developing at synoptic timescales (see Sect. 3.1). On the one hand, SA+ and SA− are characterised by a pulsating nature, with a lifetime of up to 3 d each (Fig. 6a and b), which may affect the variability of the BBA transport in the tropics. A lead–lag correlation analysis indicates an 8 d period for the AOD anomalies to build up in the tropical South Atlantic along the easterly route from tropical Africa (Fig. 9a and b). On the other hand, ML1–4 represent the fingerprint of travelling midlatitude disturbances, characterised by up to 2 d persistence and subsequent up to 2 d transitions (Fig. 6c–f), possibly leading the variability of the tropics–extratropics BBA transport. The lead–lag correlation analysis shows a 6 d period for the river of smoke to build up in the South Atlantic and move eastward across southern Africa (Fig. 9c and d).
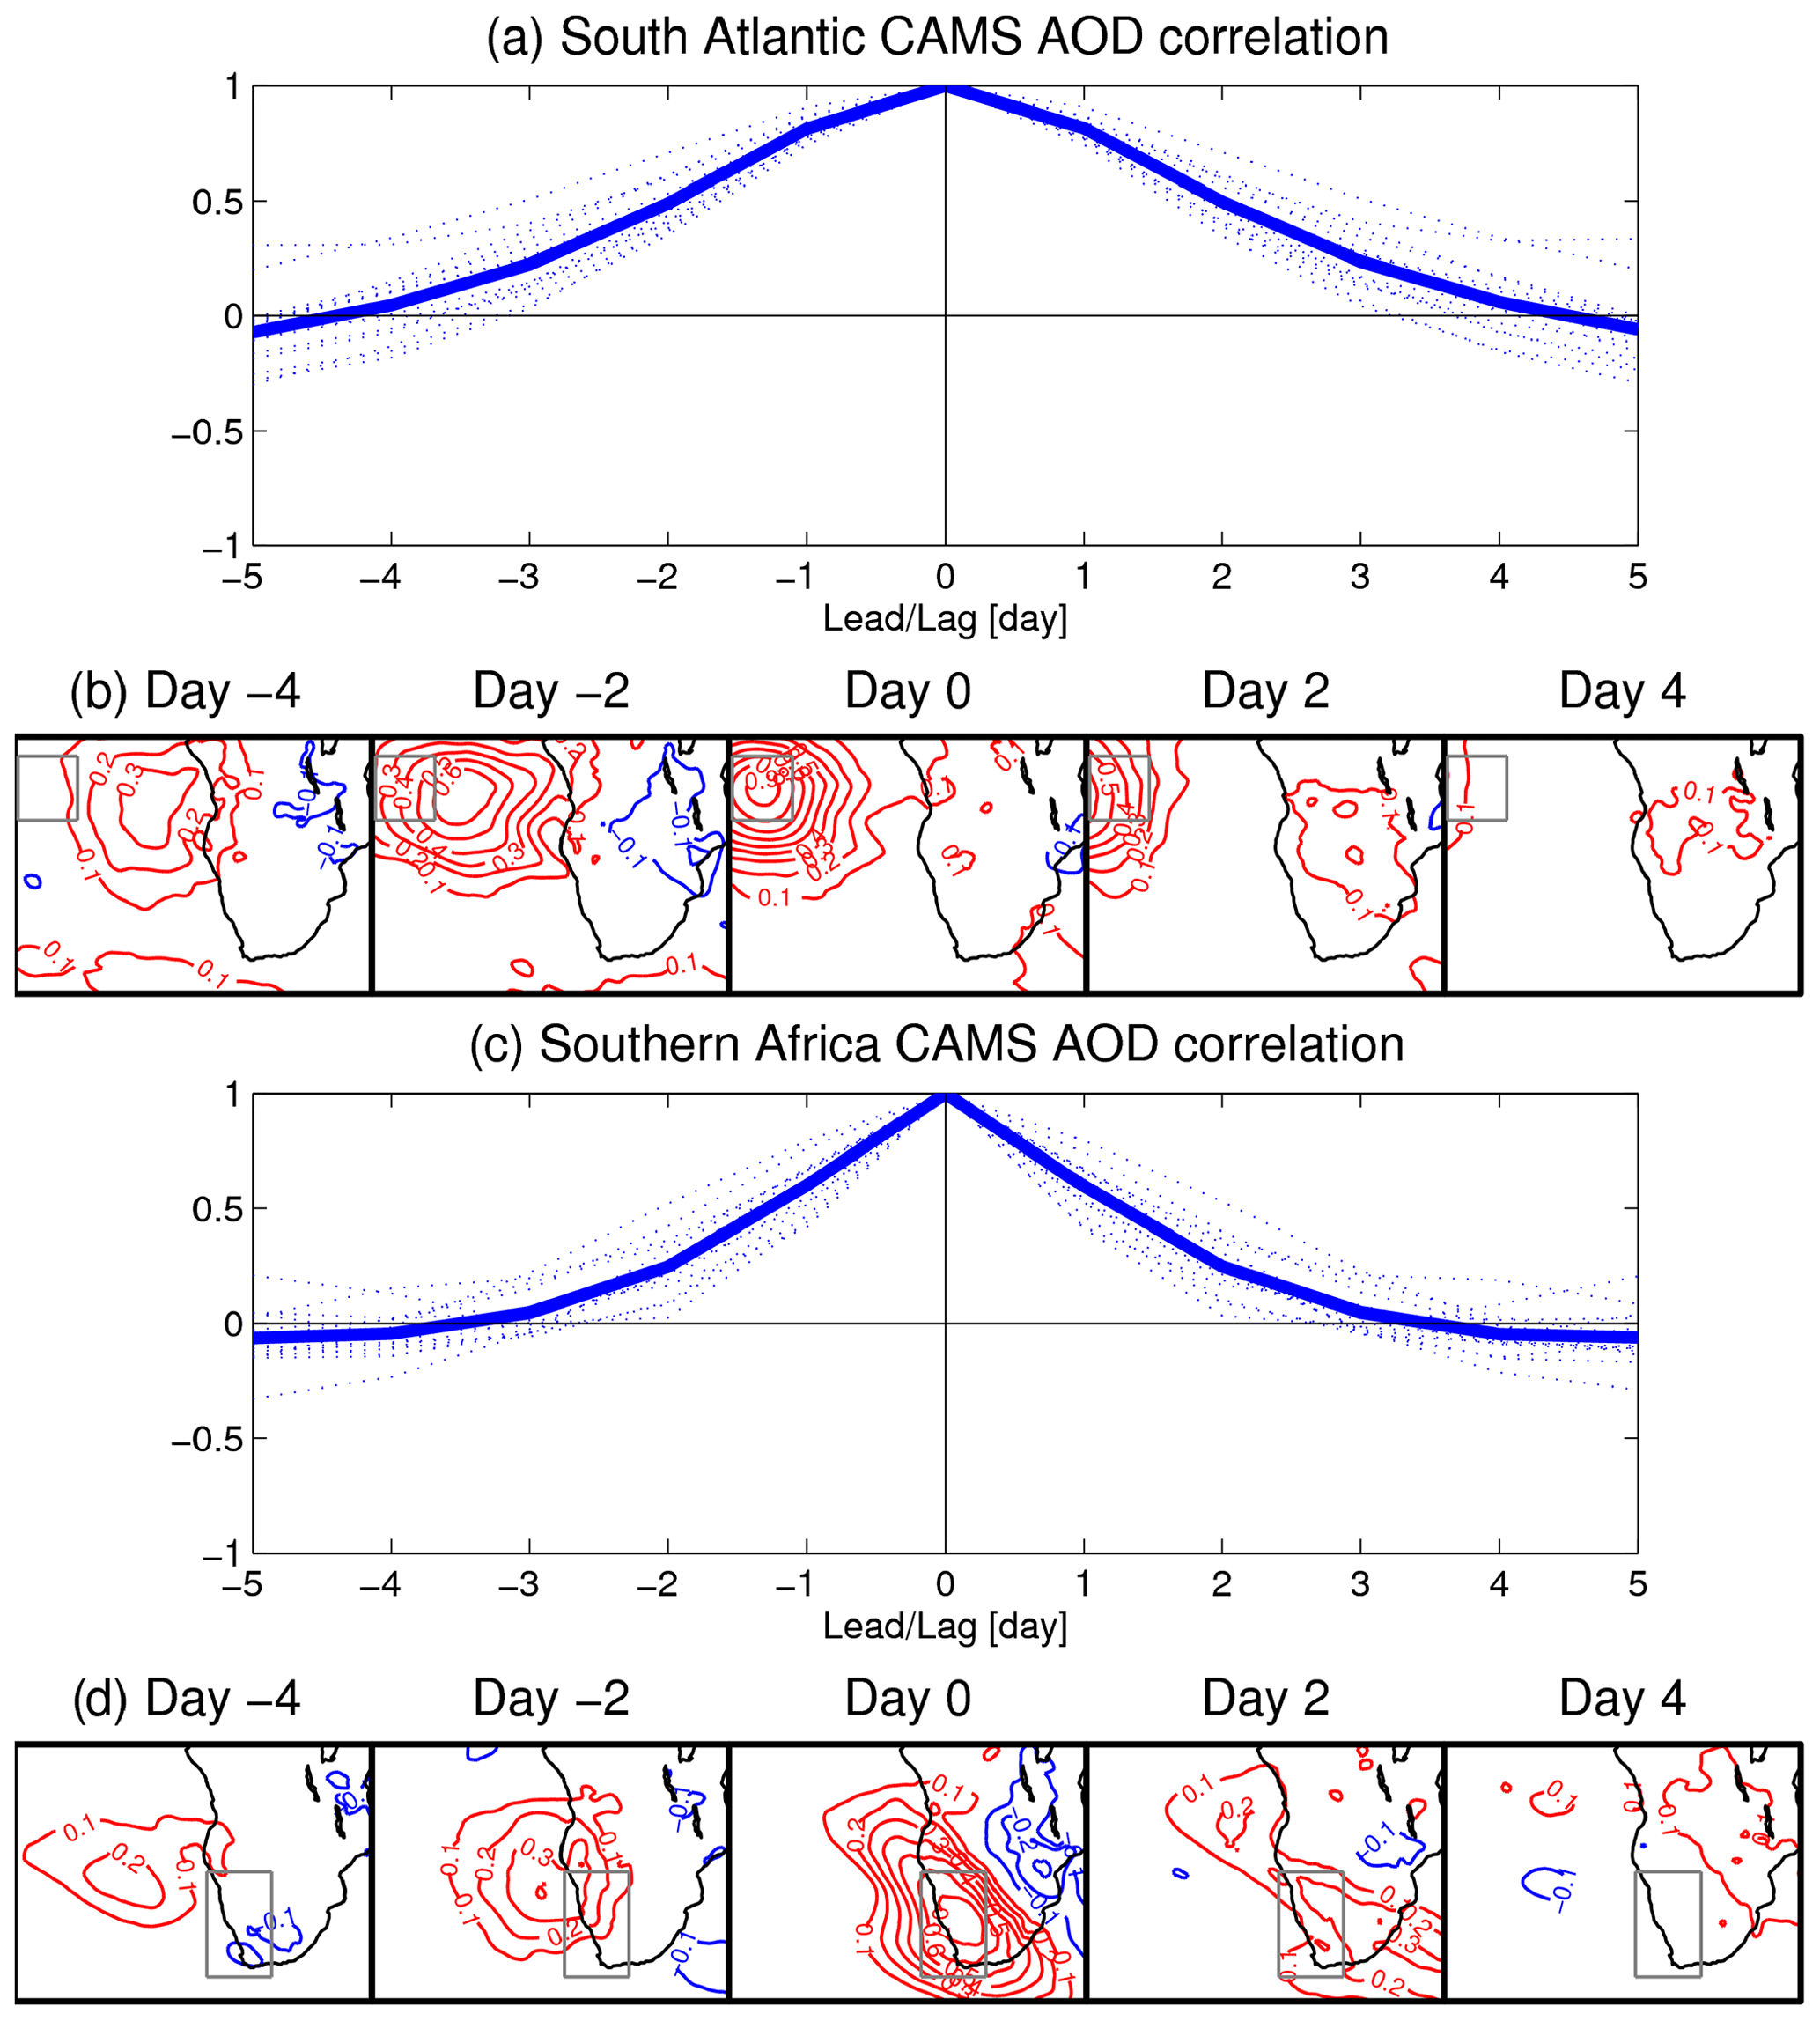
Figure 9Daily lead–lag correlation analysis of CAMS AOD anomalies. AOD anomalies averaged in the (a) South Atlantic and (c) southern Africa are correlated with themselves: dotted lines display individual year correlations; South Atlantic and southern Africa domains are displayed as boxes in (b) and (d), respectively. Correlation maps: AOD anomalies averaged in the (b) South Atlantic and (d) southern Africa are correlated with the AOD anomalies in the South Atlantic and southern Africa domain. Correlations are computed year-by-year and averaged.
3.3 Synoptic characterisation of aerosol optical depth in situ observations
The robustness of the synoptic characterisation of the BBA transport obtained from the CAMS data is assessed by linking the WR classification to the observed AOD from AERONET stations in the region. It is highlighted that data availability and coverage in most of the stations are limited (see Table 1), resulting in circa 20–40 observations per WR on average. Only the station on Ascension Island covers the whole period analysed, providing more than 600 observations, i.e. circa 100 observations per WR on average.
The C2E characterisation of the AOD observations is presented in Fig. 10. AOD anomalies above Ascension Island show significant negative values during SA− (Fig. 10a). The significance of this characterisation is confirmed by the ANOVA with a level of confidence higher than 99 %. Just south of the source region in Bonanza, significant positive anomalies are observed during ML4 (Fig. 10b). However, the statistical significance of this characterisation only reaches 93 %. AOD variability at the Namibian stations (Gobabeb, Henties Bay and HESS) is dominated by SA−, leading to significant positive anomalies, and ML1, leading to significant negative anomalies (Fig. 10c–f). In addition, significant positive anomalies are observed in HESS during the occurrence of ML3 (Fig. 10f). The ANOVA supports this characterisation, indicating that the null hypothesis, i.e. that the distributions associated with each WR are derived from populations with the same mean, can be rejected with a level of confidence higher than 99 %. Similarly to HESS, the continental station in Upington shows significant negative anomalies during ML1 and 4 and significant positive anomalies during ML3 (Fig. 10h), and the ANOVA indicates the rejection of the null hypothesis with 99 % level of confidence. In South Africa, the southernmost station in Simon's Town does not show significant anomalies in association with any WR (Fig. 10g), and the ANOVA confirms that the WR classification is not able to characterise the AOD variability (p=0.09). The C2E characterisation performed using observed AOD data confirms the relationship between the WRs associated with midlatitude disturbances (ML1, 3 and 4) and the BBA transport above the AERONET continental stations and between SA− and the BBA transport above Ascension Island, as shown by the CAMS data (cf. Fig. 4). The comparison with the synoptic characterisation performed using a seven-cluster classification highlights that the latter is less robust, showing poorer ANOVA performances. Moreover, the additional WR, accounting for a strengthening of the continental high, does not provide further characterisation of the AOD anomalies (see Sect. S3 for details).
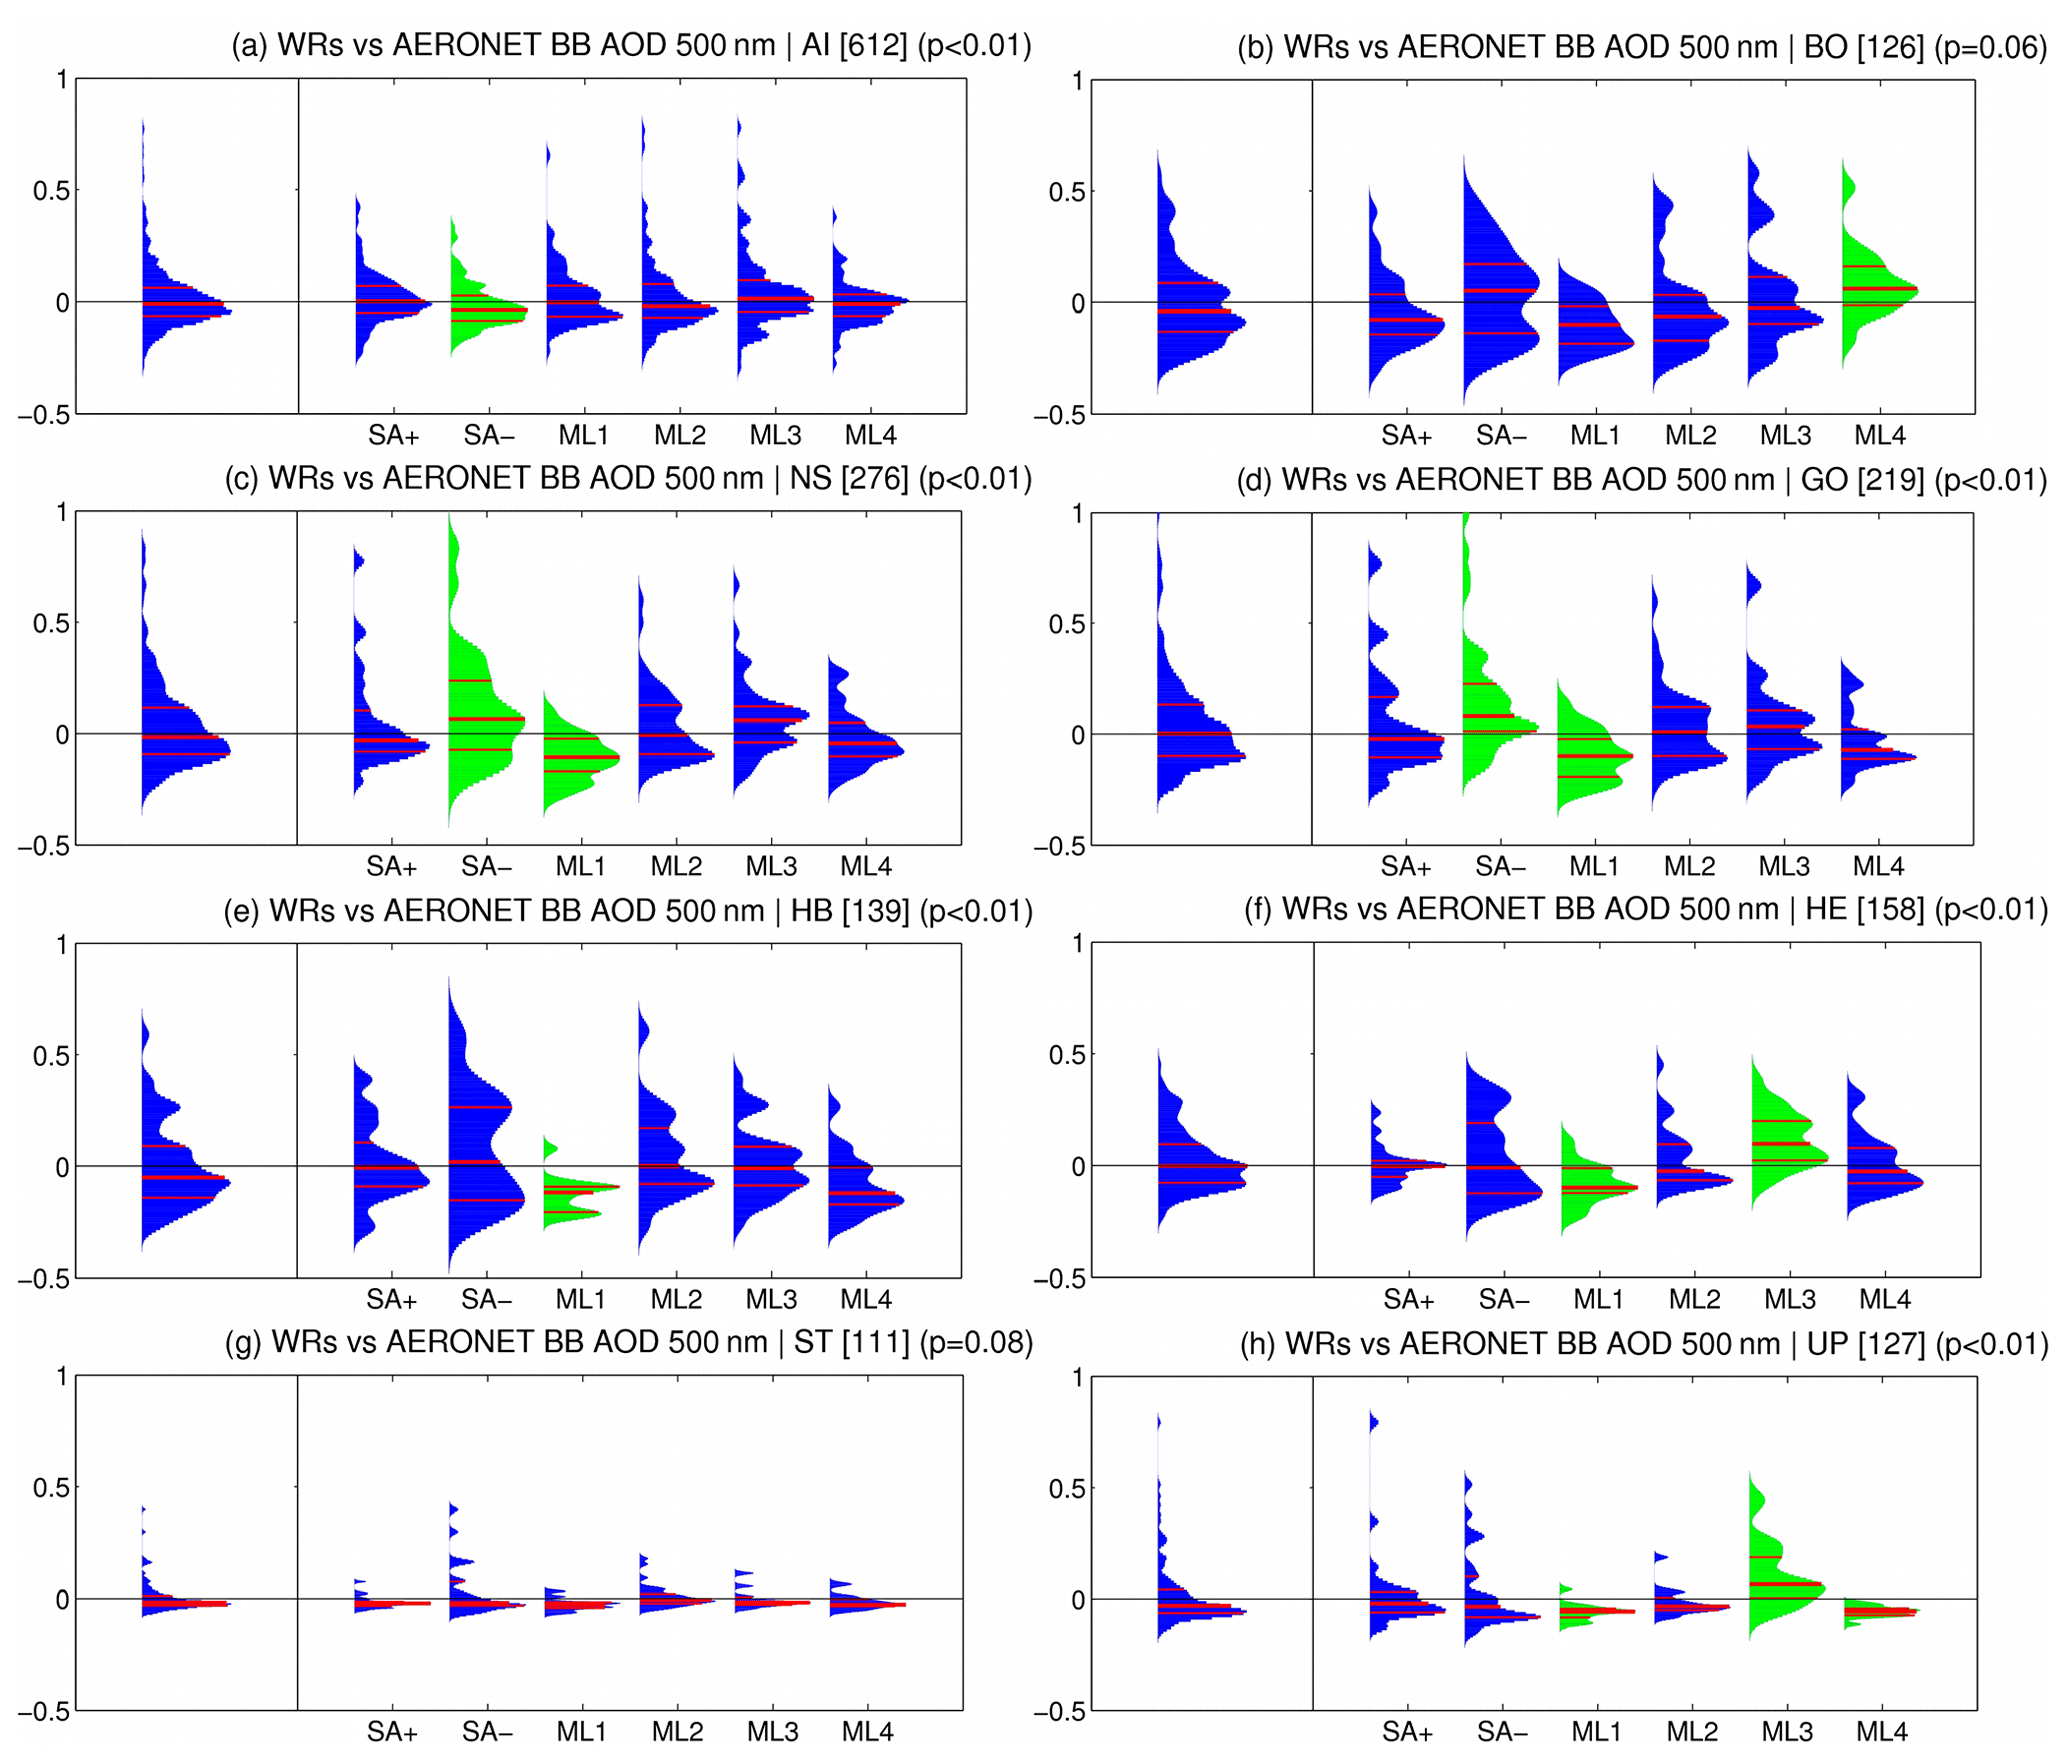
Figure 10Circulation-to-environment characterisation for each AERONET station: (left panel) distribution of the AOD anomalies at 500 nm and (right panel) for each CAMS WR. Probability density functions are estimated by using a normal kernel density; red lines represent 25th, 50th and 75th percentiles. Anomaly distributions significantly different from the climatological sample are displayed in green (p values of the Kolmogorov–Smirnov test used to assess the significance of the differences are reported in Table S5). In titles, the number of available daily observations and the p value of the ANOVA used to assess the WR characterisation are reported in brackets.
The E2C characterisation of the biomass burning (BB) AOD station data is presented in Fig. 11. AOD anomalies are divided in quartiles, with quartiles from first to fourth representing anomalies from the largest negative to the largest positive, and the relative change in WR occurrence is displayed for each quartile. On Ascension Island, the third quartile is characterised by a significant change in the distribution of the WR frequency, with increased occurrence of ML4 (Fig. 11a). The Bonanza station does not show any significant change in the WR occurrence (Fig. 11b). In the Namibian stations (Gobabeb, Henties Bay and HESS), positive AOD anomalies are associated with significantly more frequent SA− and ML2, while negative anomalies are associated with more frequent ML1 (Fig. 11c–f). In addition, in Gobabeb negative AOD anomalies are also associated with more frequent ML2 and 4 (Fig. 11d); in HESS positive anomalies are also associated with more frequent SA+, ML3 and 4 and negative anomalies are also associated with SA− (Fig. 11f). The South African stations in Upington and Simon's Town show positive AOD anomalies associated with more frequent SA−, ML2 and 3, and negative anomalies associated with more frequent SA−, ML1 and 4 (Fig. 11g and h). The E2C characterisation confirms the importance of the midlatitude disturbances in controlling the AOD anomalies at the AERONET continental stations, in particular by driving the largest anomalies (first and fourth quartiles). However, this approach shows some inconsistencies: ML4, which is characterised by a southerly anomaly in the BBA transport along the Atlantic coast (Fig. 4f), is associated with positive AOD anomalies in HESS instead; similarly SA−, characterised by a northerly BBA transport anomaly along the coast (Fig. 4b), is associated with both positive and negative anomalies in HESS and Upington. The origin of these ambiguities is likely due to the location of these stations at the margin of the BBA transport path associated with the WR circulation patterns, making them highly sensitive to the variability of the circulation around the centroid. The comparison with the synoptic characterisation performed using a seven-class partition highlights the same ambiguities when the AOD anomalies in the continental stations are associated with the WR describing a low-pressure anomaly in the South Atlantic (see Sect. S3 for details).
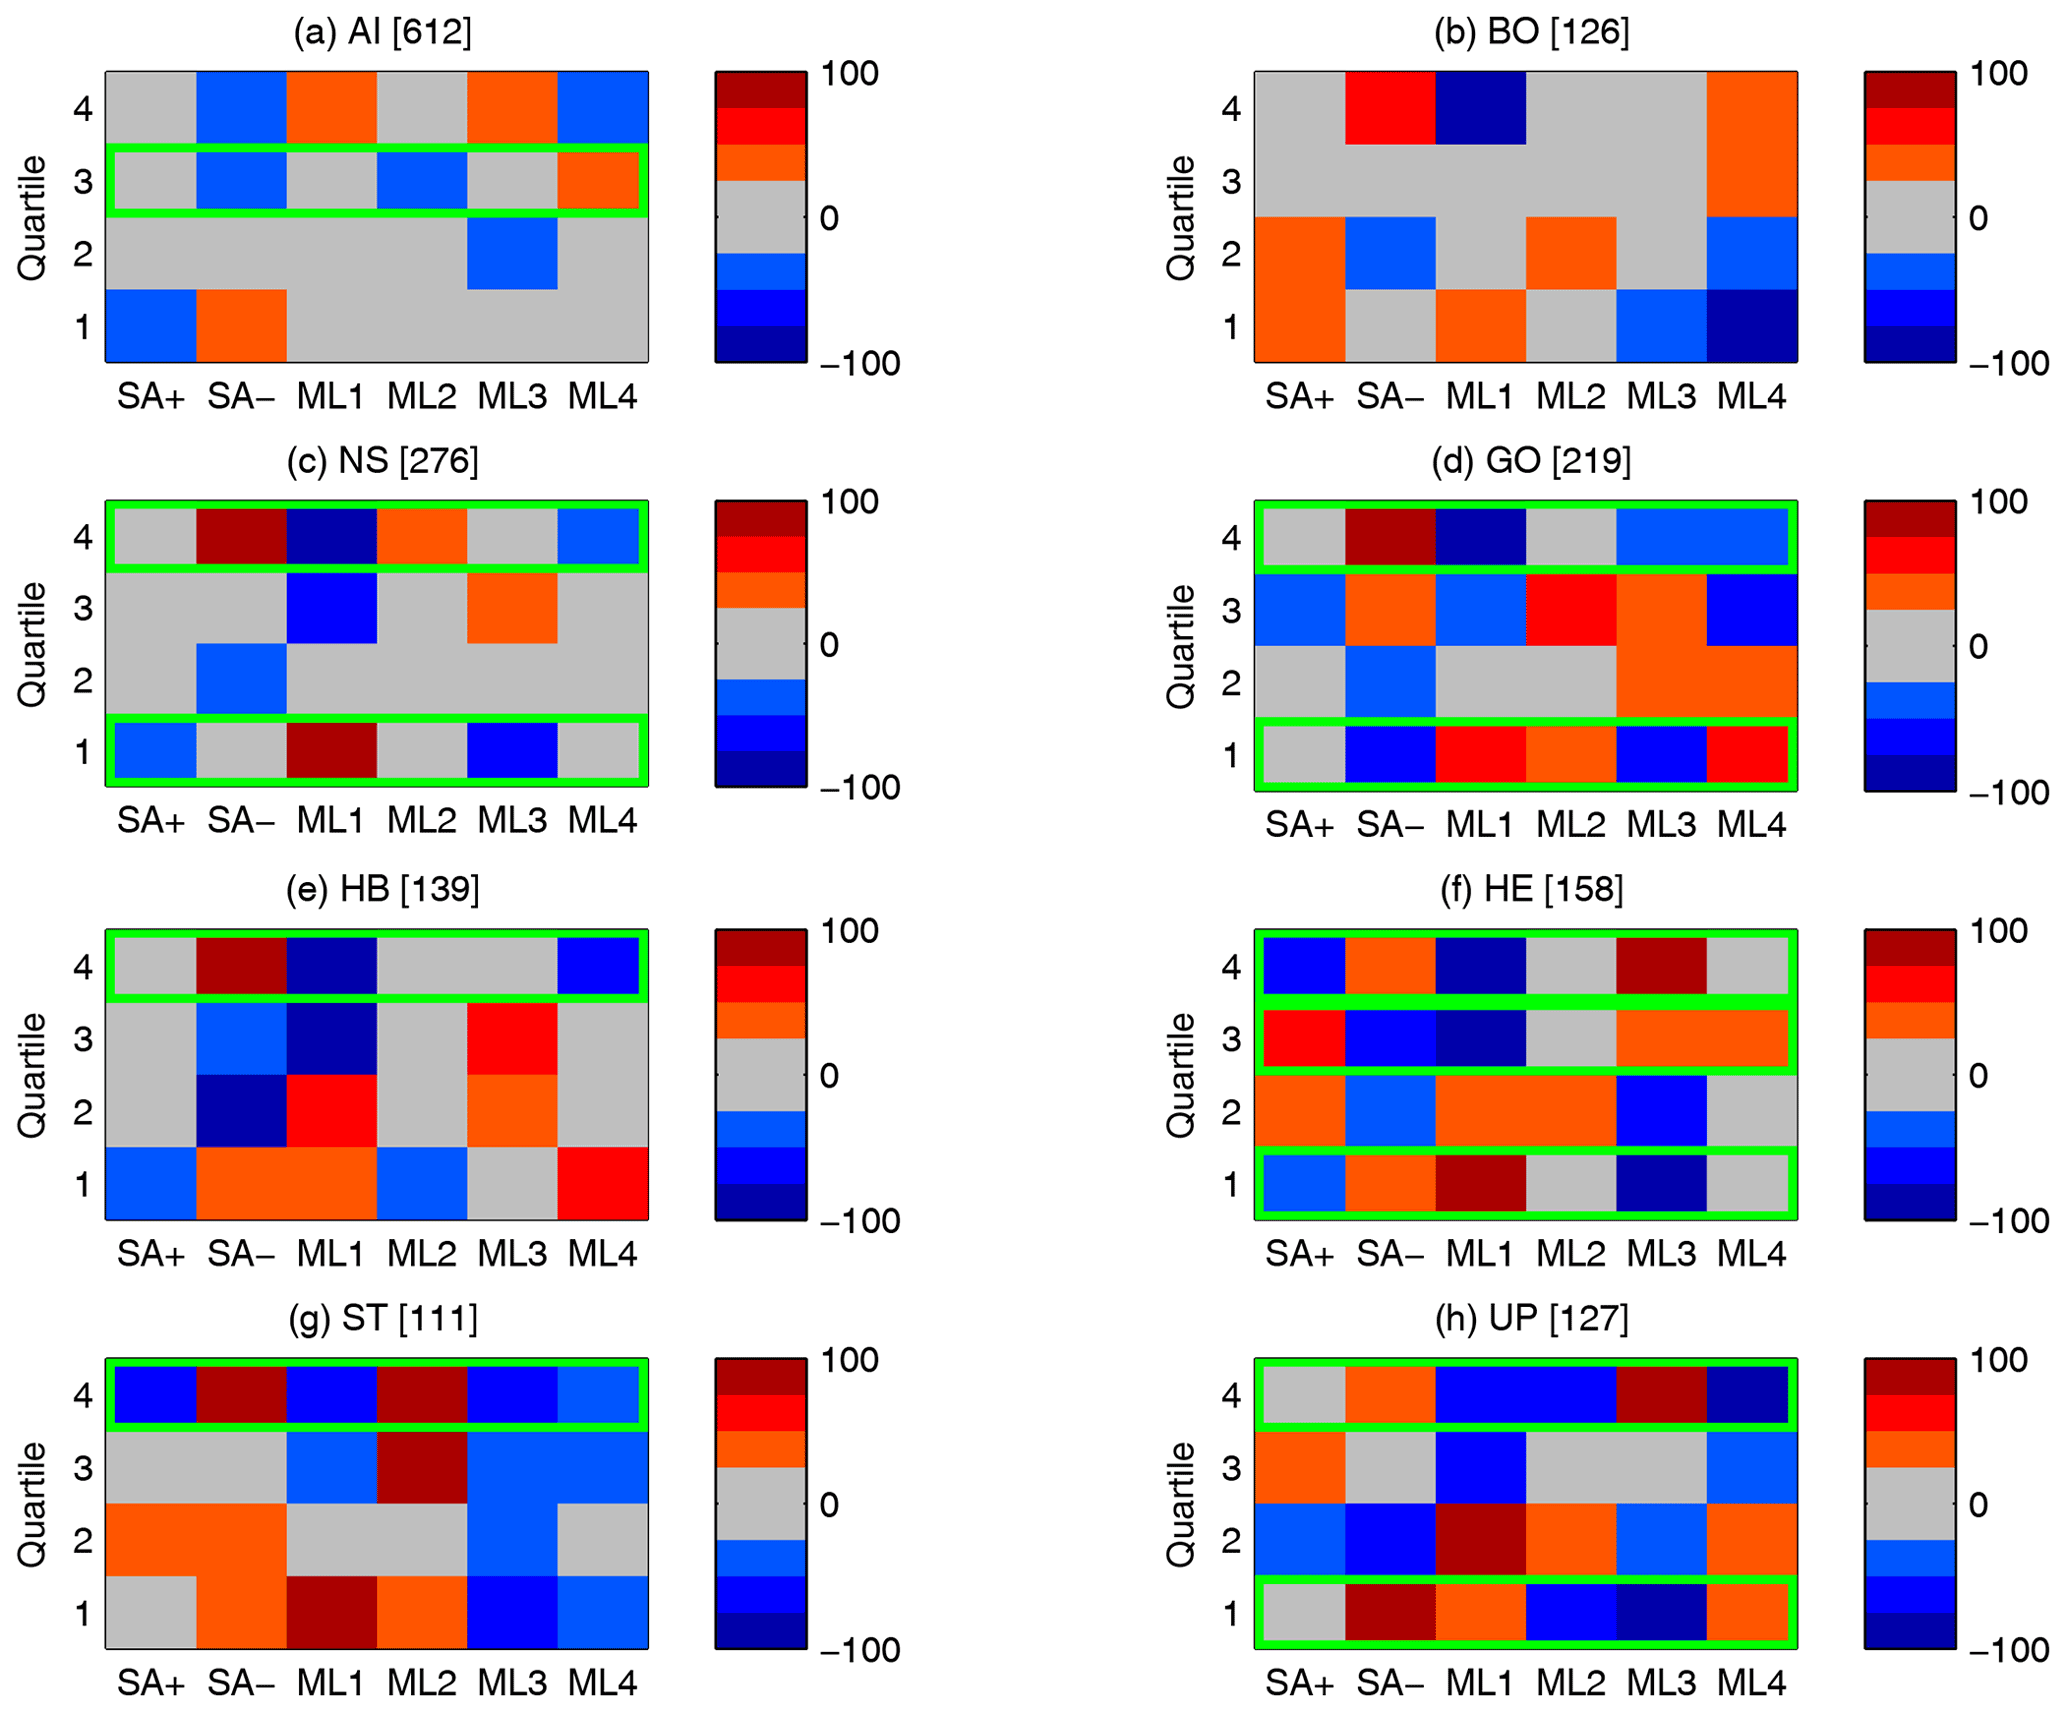
Figure 11Environment-to-circulation characterisation: CAMS WR frequency anomaly for each quartile of the AOD anomalies at 500 nm at the AERONET stations. Values represent percentage changes relative to climatological frequencies. Green boxes highlight significant changes in the WR frequencies, i.e. frequency anomalies exceeding the critical threshold (11.07) for the chi-square statistics with 5 degrees of freedom at the 95 % level of confidence (chi-square statistics are reported in Table S6). In brackets, the number of available daily observations are indicated.
3.4 Interannual variability
The WR frequency in ASO is also analysed at the interannual timescale, by using the ERA5 classification on the period 1981–2020 (Fig. 12). All WRs show similar interannual variability in the frequency of occurrence (3–4 % standard deviation), and no trend is found after a Mann–Kendall test at the 95 % level of confidence is performed. Possible teleconnections controlling the WR interannual variability are analysed by computing the linear correlation between the WR frequency and the SST variability at the global scale (Fig. 13). ML1–4 do not show significant correlation patterns at the global scale (see Fig. S11). Conversely, SA+ and SA− show a relationship with SST anomalies in the tropical Pacific and the North Atlantic. In particular, the occurrence of SA+ is associated with La Niña conditions and cold anomalies in the subtropical North Atlantic (Fig. 13a), while SA− is associated with El Niño conditions and warm anomalies in the subtropical North Atlantic, although the significance of the correlation is reduced (Fig. 13b). The linkage with La Niña conditions can explain the SA+ peak in 2010 (Fig. 12) associated with a strong La Niña event (Boening et al., 2012) and the minimum in 2015 (Fig. 12), associated with an extreme El Niño event (Hu and Fedorov, 2017). The analysis of the WR–SST correlations performed by using NOAA ERSST data show similar teleconnection patterns (Fig. S12). Differently from the WRs associated with travelling disturbances, SA+ and SA− are characterised by short persistence and represent a sort of stationary South Atlantic oscillatory pattern (see Chen, 2014), which might interact with Rossby-wave patterns from the equatorial Pacific during El Niño–Southern Oscillation (ENSO) active phases (e.g. Hoskins and Ambrizzi, 1993). The teleconnection mechanisms are explored by computing the correlation between the WR occurrence and the global geopotential at 200 hPa, the level where teleconnection signals are the strongest. Wave patterns connecting the tropical Pacific to pressure anomalies in the South Atlantic are found for both SA+ and SA−, though significance for SA− is weak (Fig. 13c and d). A similar modulation by the ENSO of synoptic regimes in the Southern Hemisphere is also reported during austral summer by Fauchereau et al. (2009) and Pohl et al. (2018). The analysis of the WR–SAM relationship at the interannual timescale shows poor results when the WR frequency time series are correlated with the SAM monthly index. Similarly, the correlation between the WR frequency time series and the monthly averages of the geopotential height at 700 hPa in the Southern Hemisphere does not show evident correlation patterns (not shown).
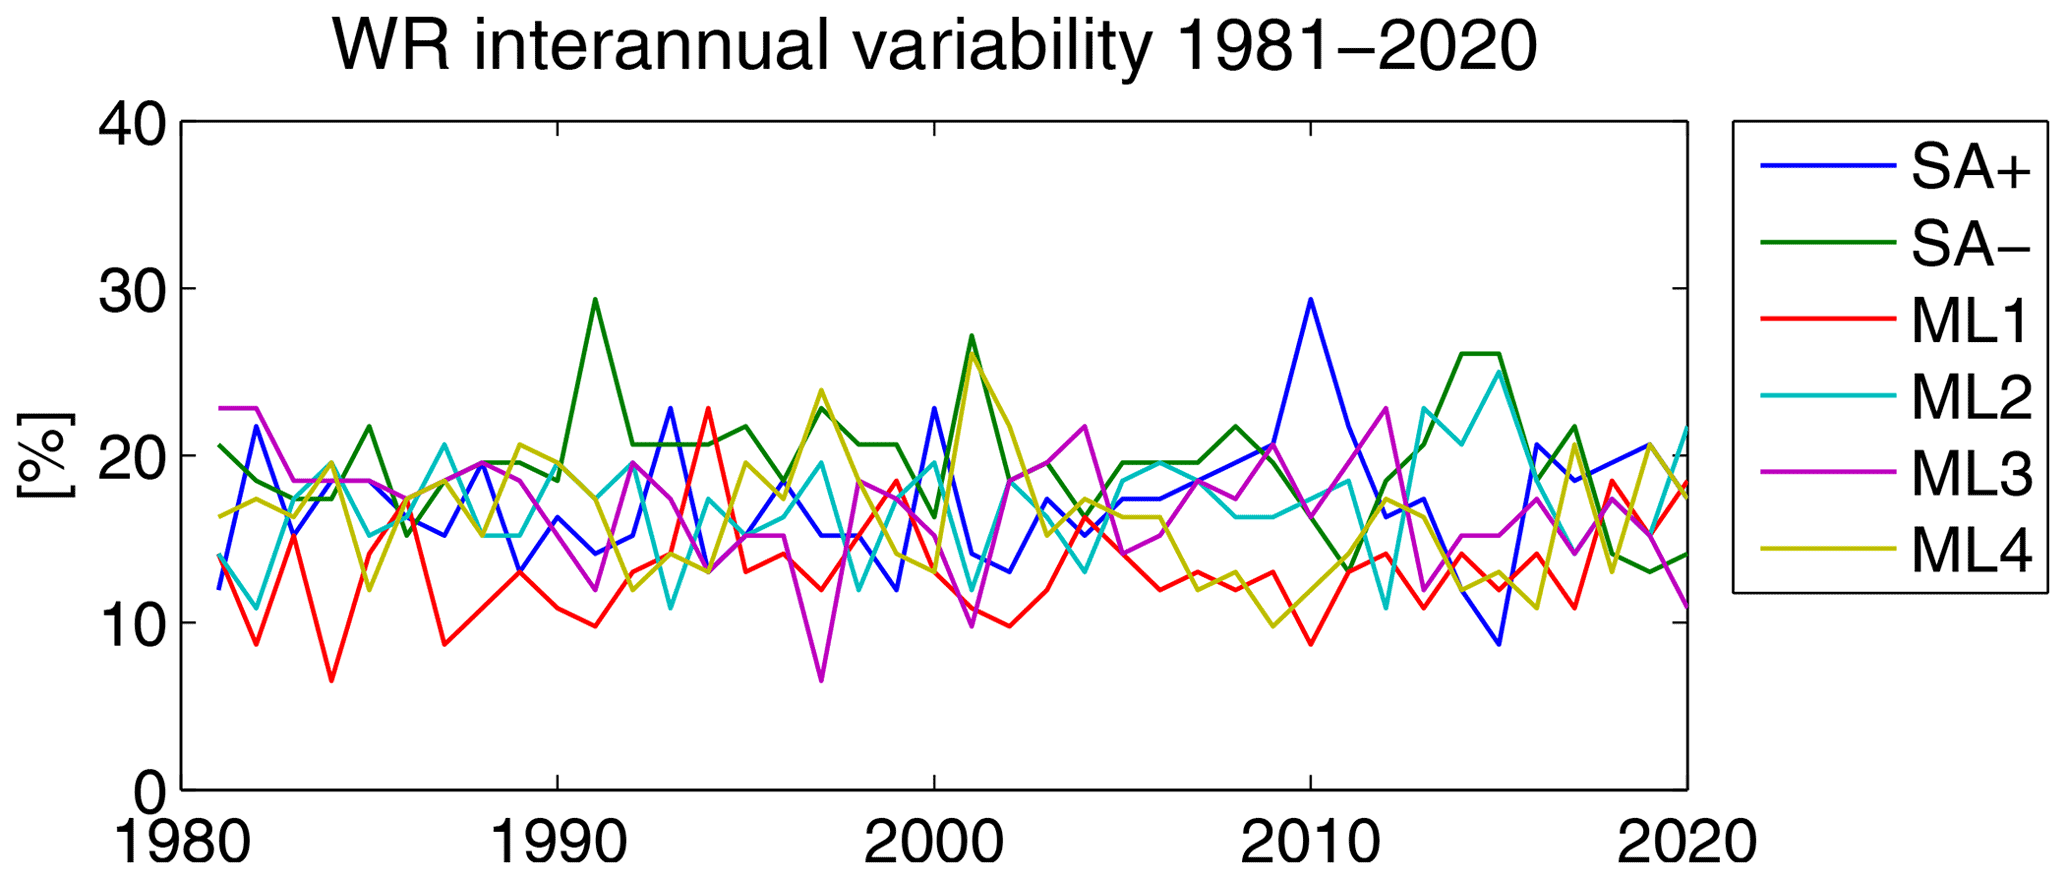
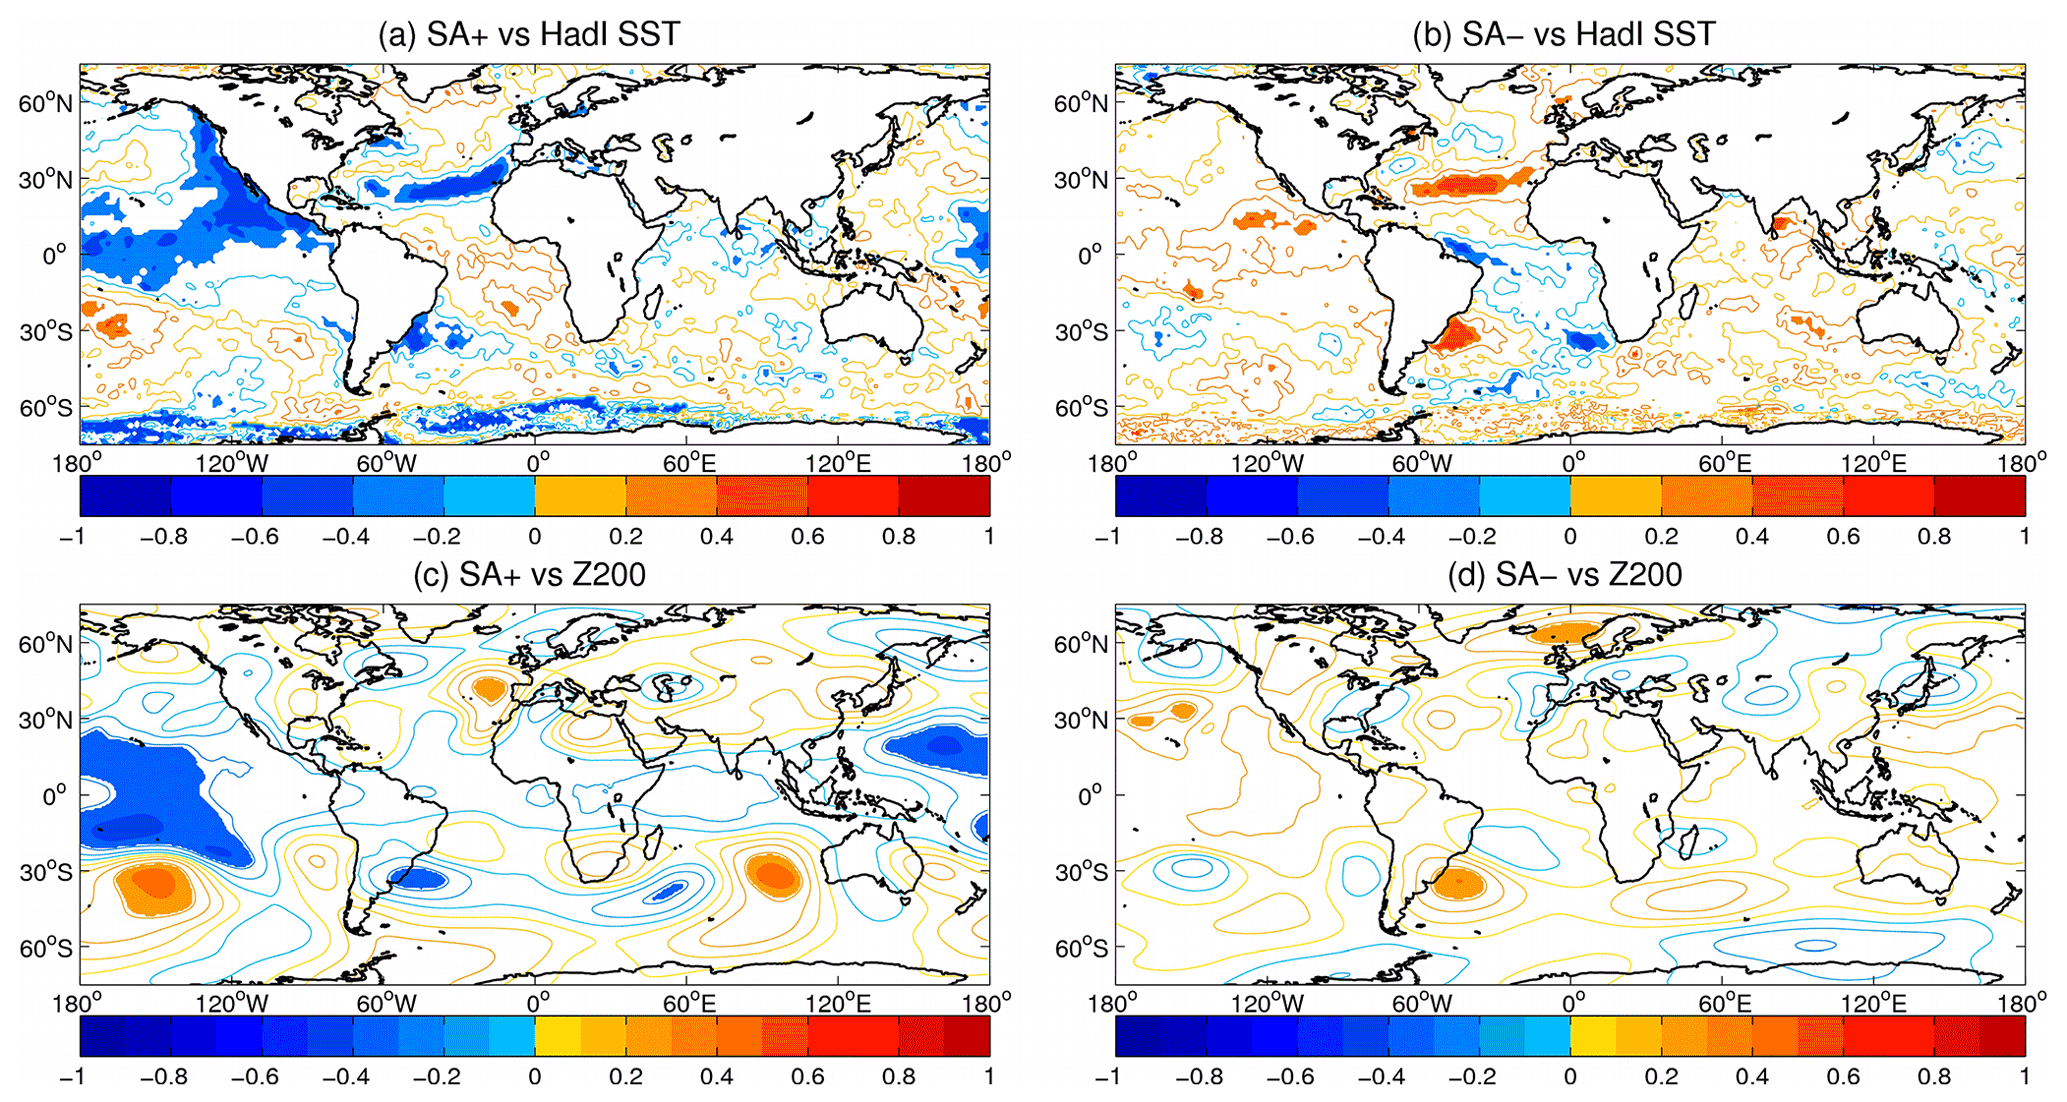
Figure 13Interannual correlation over the period 1981–2020: SA+ and SA− frequency from the ERA5 classification vs. (a, b) HadISST and (c, d) ERA5 geopotential height at 200 hPa in ASO. Shading displays significant correlations at the 95 % level of confidence. Time series are detrended and standardised.
In this paper, the first objective classification of the synoptic circulation over the South Atlantic and southern Africa during the dry season is presented. By using atmospheric circulation data from a reanalysis product, a robust classification with six WRs is defined for August to October in the period 2003–2017. Four WRs (ML1–4) represent the fingerprint of the life cycle of propagative disturbances embedded in the regional midlatitude dynamics, while two WRs (SA+ and SA−) represent the oscillation of the pressure field in the South Atlantic. In particular, SA+ is associated with a reinforced South Atlantic anticyclone and is the dominant WR during the dry season. The occurrence of ML1–4 is favoured by intensified westerlies associated with negative values of the daily SAM index, while SA+ and SA− occurrence is associated with positive SAM phases. All the identified WRs show short persistence, not exceeding 3 d, highlighting the synoptic character of the associated circulation patterns. As a consequence, the analysis of possible teleconnections does not reveal significant remote controls of the WR occurrence at the interannual timescale. Only SA+ and SA−, characterised by slightly longer persistence (up to 3 d), show a weak connection with the El Niño–Southern Oscillation through a tropical–extratropical Rossby wave pattern.
The synoptic classification is used to characterise the transport of BBA from equatorial Africa, which dominates the aerosol atmospheric content in the region during the dry season. By analysing reanalysis data, it is found that SA+ and SA− modulate the easterly transport from tropical Africa sources, which is the main climatological transport route. The synoptic characterisation also shows that midlatitude propagative disturbances modulate the BBA transport from equatorial Africa, elucidating the mechanism responsible for the BBA transport to the extratropics, which is peculiar in this period of the year. Specifically, the formation of rivers of smoke is favoured by the low–high pressure anomaly systems characterising the ML WRs, channelling the BBA in the meridional direction (see, for example, ML2 in Fig. 4). Once the river of smoke is formed, it crosses southern Africa embedded in the anomaly pattern travelling eastwards, in turn modulating the AOD anomalies over the continent (see, for example, the ML2 → ML3 → ML4 → ML1 evolution in Fig. 4). The BBA transport characterisation is also tested by using AOD observations from AERONET stations, which show a good degree of consistency with the results based on reanalysis data. However, limited data availability in most of the stations prevents a robust statistical validation of the synoptic characterisation of observations at the regional scale. Results show that the occurrence of ML1 and 4 inhibits the BBA transport towards the continental stations (Gobabeb, Henties Bay, HESS and Upington), while ML3 favours the transport above the same locations. Along the Atlantic route, the occurrence of SA− limits the BBA transport towards Ascension Island. In situ observations in Bonanza and Simon's Town are not well characterised by the WR classification. The former likely because of its proximity to the source region, where emission is not strongly affected by the synoptic atmospheric circulation, and the latter possibly because of the poor data coverage.
Overall, WR clustering shows to be a valuable tool in discriminating aerosol transport and concentrations over the South Atlantic and southern Africa at the short timescales (day-to-day and synoptic variability). A seven-class partition is also tested for the characterisation of the synoptic variability of the BBA transport. However, this classification does not improve the performance of the six-class partition, showing overall poorer statistics and not correcting some ambiguities found in the E2C characterisation of the continental AERONET stations.
The analysis of the regional circulation patterns controlling the BBA transport in the South Atlantic and southern Africa sector is reported in literature mainly as a complement in the discussion of field campaign results. During the SAFARI-92 field experiment, Lindesay et al. (1996) reported pronounced BBA transport across southern Africa towards the Indian Ocean, in association with El Niño conditions and intensified continental high. Conversely, during the SAFARI 2000 campaign (Swap et al., 2003), Stein et al. (2003) found an association between the development of rivers of smoke heading towards the Indian Ocean and increased westerly waves and weaker continental high, concomitant with La Niña conditions (see also Garstang et al., 1996). These contrasting conclusions likely originate from the limited robustness of the analysis due to the shortness of the observation periods. Based on a longer dataset, the WR characterisation suggests a key role of the westerly waves in controlling the rivers of smoke, supporting the hypothesis of Garstang et al. (1996), although it remains inconclusive concerning the role of ENSO phases.
This paper provides new insights into the understanding of the synoptic circulation in the South Atlantic and southern Africa, by characterising for the first time the dry season circulation and the associated rivers of smoke. The characterisation of the transport routes in the region is crucial to support the characterisation of the physical and chemical properties of the BBA and to model the associated impact on clouds and radiation. The WR characterisation is also a valuable resource to develop predictive tools for the BBA spatial distribution in the region. In particular, by using reliable long-term reanalysis products, a classification for past decades can be built, and the BBA spatial distribution can be reconstructed where observations are not available. Furthermore, the WR characterisation can be used in climate model projections to estimate the future evolution of the rivers of smoke in the region.
CAMS data are freely available at the Copernicus Atmosphere Data Store (https://ads.atmosphere.copernicus.eu/cdsapp#!/dataset/cams-global-reanalysis-eac4?tab=overview, Inness et al., 2019). AERONET station data are made freely available by the NASA Goddard Space Flight Center (https://aeronet.gsfc.nasa.gov/, NASA Goddard Space Flight Center, 2021). The SAM daily index is made freely available by the NOAA Climate Prediction Center (https://www.cpc.ncep.noaa.gov/, NOAA Climate Prediction Center, 2021). ERA5 data are freely available at the Copernicus Climate Change Service (C3S) Climate Data Store (CDS) (https://doi.org/10.24381/cds.bd0915c6, Hersbach et al., 2018).
The supplement related to this article is available online at: https://doi.org/10.5194/acp-21-16575-2021-supplement.
MG conceived the study, designed and performed the analysis, and wrote the paper. BP and MdCAC performed the WR classification. All the authors contributed to the discussion and interpretation the results and the writing of the text. PF and CF designed the original AEROCLO-sA observational concept and co-led the 5-year investigation.
Paola Formenti is guest editor for the ACP Special Issue “New observations and related modelling studies of the aerosol–cloud–climate system in the Southeast Atlantic and southern Africa regions”. The remaining authors declare that they have no conflicts of interests.
Publisher’s note: Copernicus Publications remains neutral with regard to jurisdictional claims in published maps and institutional affiliations.
This article is part of the special issue “New observations and related modelling studies of the aerosol–cloud–climate system in the Southeast Atlantic and southern Africa regions (ACP/AMT inter-journal SI)”. It is not associated with a conference.
The authors thank Brent Holben, Nichola Knox, Stuart Piketh, Gillian Maggs-Kollin, Derek Griffith, Willie Gunter and their staff for establishing and maintaining the AERONET sites used in this study, as well as Kerstin Schepanski and Fabien Waquet for useful discussion. The AEROCLO-sA project would not have been successful without the endless efforts of all the research scientists and engineers involved in its preparation, often behind the scenes. Their support and enthusiasm are sincerely appreciated. The strong diplomatic assistance of the French Embassy in Namibia, the administrative support of the Service Partnership and Promotion of the CNRS Regional Delegation of Paris–Villejuif, and the cooperation of the Namibian National Commission on Research, Science and Technology (NCRST) were invaluable to make the project happen. The authors thank two anonymous reviewers for their constructive comments, which helped in improving the quality of the article.
This work was supported by the French National Research Agency under grant agreement no. ANR-15-CE01-0014-01; the French national programme LEFE/INSU; the Programme National de Télédetection Spatiale (PNTS), grant no. PNTS-2016-14; the French National Agency for Space Studies (CNES), and the South African National Research Foundation (NRF) under grant UID 105958. The research leading to these results has received funding from the European Union’s 7th Framework Programme (FP7/2014-2018) under EUFAR2 contract no. 312609. Airborne data was obtained using the aircraft managed by Safire, the French facility for airborne research, an infrastructure of the French National Centre for Scientific Research (CNRS), Météo-France and the French National Center for Space Studies (CNES). The HBAO observatory receives funding through the “Atmospheric Research in Southern Africa and the Indian Ocean” (ARSAIO) project (CNRS and South African NRF), the PICS Contract 260888 (CNRS), as well as by PHC PROTEA of the French Ministry of Foreign Affairs and International Development (Contracts 33913SF and 38255ZE) and Programme National de Télédetection Spatiale (grant agreement or award no. PNTS-2016-14).
This paper was edited by Frank Eckardt and reviewed by two anonymous referees.
Abel, S. J., Haywood, J. M., Highwood, E. J., Li, J., and Buseck, P. R.: Evolution of biomass burning aerosol properties from an agricultural fire in southern Africa, Geophys. Res. Lett., 30, 1783, https://doi.org/10.1029/2003GL017342, 2003.
Adebiyi, A. A. and Zuidema, P.: The role of the southern African easterly jet in modifying the southeast Atlantic aerosol and cloud environments, Q. J. R. Meteorol. Soc., 142, 1574–1589, https://doi.org/10.1002/qj.2765, 2016.
Adebiyi, A. A. and Zuidema, P.: Low Cloud Cover Sensitivity to Biomass-Burning Aerosols and Meteorology over the Southeast Atlantic, J. Climate, 31, 4329–4346, https://doi.org/10.1175/JCLI-D-17-0406.1, 2018.
Baker, A. R., Lesworth, T., Adams, C., Jickells, T. D., and Ganzeveld, L.: Estimation of atmospheric nutrient inputs to the Atlantic Ocean from 50∘ N to 50∘ S based on large-scale field sampling: Fixed nitrogen and dry deposition of phosphorus, Global Biogeochem. Cycles, 24, GB3006, https://doi.org/10.1029/2009GB003634, 2010.
Baldwin, M. P.: Annular modes in global daily surface pressure, Geophys. Res. Lett., 28, 4115–4118, https://doi.org/10.1029/2001GL013564, 2001.
Barkley, A. E., Prospero, J. M., Mahowald, N., Hamilton, D. S., Popendorf, K. J., Oehlert, A. M., Pourmand, A., Gatineau, A., Panechou-Pulcherie, K., Blackwelder, P., and Gaston, C. J.: African biomass burning is a substantial source of phosphorus deposition to the Amazon, Tropical Atlantic Ocean, and Southern Ocean, Proc. Natl. Acad. Sci. USA, 116, 16216–16221, https://doi.org/10.1073/pnas.1906091116, 2019.
Bellouin, N., Quaas, J., Gryspeerdt, E., Kinne, S., Stier, P., Watson-Parris, D., Boucher, O., Carslaw, K. S., Christensen, M., Daniau, A.-L., Dufresne, J.-L., Feingold, G., Fiedler, S., Forster, P., Gettelman, A., Haywood, J. M., Lohmann, U., Malavelle, F., Mauritsen, T., McCoy, D. T., Myhre, G., Mülmenstädt, J., Neubauer, D., Possner, A., Rugenstein, M., Sato, Y., Schulz, M., Schwartz, S. E., Sourdeval, O., Storelvmo, T., Toll, V., Winker, D., and Stevens, B.: Bounding Global Aerosol Radiative Forcing of Climate Change, Rev. Geophys., 58, e2019RG000660, https://doi.org/10.1029/2019RG000660, 2020.
Boening, C., Willis, J. K., Landerer, F. W., Nerem, R. S., and Fasullo, J.: The 2011 La Niña: So strong, the oceans fell, Geophys. Res. Lett., 39, L19602, https://doi.org/10.1029/2012GL053055, 2012.
Chen, G.: Revisit to atmospheric oscillations over global oceans: a combined climatology/modality approach, Int. J. Climatol., 34, 2715–2729, https://doi.org/10.1002/joc.3870, 2014.
Crétat, J., Pohl, B., Dieppois, B., Berthou, S., and Pergaud, J.: The Angola Low: relationship with southern African rainfall and ENSO, Clim. Dynam., 52, 1783–1803, https://doi.org/10.1007/s00382-018-4222-3, 2019.
Diab, R. D., Jury, M. R., Combrink, J., and Sokolic, F.: A comparison of anticyclone and trough influences on the vertical distribution of ozone and meteorological conditions during SAFARI-92, J. Geophys. Res.-Atmos., 101, 23809–23821, https://doi.org/10.1029/95JD01844, 1996.
Dieppois, B., Pohl, B., Rouault, M., New, M., Lawler, D., and Keenlyside, N.: Interannual to interdecadal variability of winter and summer southern African rainfall, and their teleconnections, J. Geophys. Res.-Atmos., 121, 6215–6239, https://doi.org/10.1002/2015JD024576, 2016.
Eck, T. F., Holben, B. N., Reid, J. S., Dubovik, O., Smirnov, A., O'Neill, N. T., Slutsker, I., and Kinne, S.: Wavelength dependence of the optical depth of biomass burning, urban, and desert dust aerosols, J. Geophys. Res.-Atmos., 104, 31333–31349, https://doi.org/10.1029/1999JD900923, 1999.
Eck, T. F., Holben, B. N., Ward, D. E., Mukelabai, M. M., Dubovik, O., Smirnov, A., Schafer, J. S., Hsu, N. C., Piketh, S. J., Queface, A., Le Roux, J., Swap, R. J., and Slutsker, I.: Variability of biomass burning aerosol optical characteristics in southern Africa during the SAFARI 2000 dry season campaign and a comparison of single scattering albedo estimates from radiometric measurements, J. Geophys. Res.-Atmos., 108, 8477, https://doi.org/10.1029/2002JD002321, 2003.
Fauchereau, N., Pohl, B., Reason, C. J. C., Rouault, M., and Richard, Y.: Recurrent daily OLR patterns in the Southern Africa/Southwest Indian Ocean region, implications for South African rainfall and teleconnections, Clim. Dynam., 32, 575–591, https://doi.org/10.1007/s00382-008-0426-2, 2009.
Formenti, P., Elbert, W., Maenhaut, W., Haywood, J., Osborne, S., and Andreae, M. O.: Inorganic and carbonaceous aerosols during the Southern African Regional Science Initiative (SAFARI 2000) experiment: Chemical characteristics, physical properties, and emission data for smoke from African biomass burning, J. Geophys. Res.-Atmos., 108, 8488, https://doi.org/10.1029/2002JD002408, 2003.
Formenti, P., D'Anna, B., Flamant, C., Mallet, M., Piketh, S. J., Schepanski, K., Waquet, F., Auriol, F., Brogniez, G., Burnet, F., Chaboureau, J.-P., Chauvigné, A., Chazette, P., Denjean, C., Desboeufs, K., Doussin, J.-F., Elguindi, N., Feuerstein, S., Gaetani, M., Giorio, C., Klopper, D., Mallet, M. D., Nabat, P., Monod, A., Solmon, F., Namwoonde, A., Chikwililwa, C., Mushi, R., Welton, E. J., and Holben, B.: The Aerosols, Radiation and Clouds in Southern Africa Field Campaign in Namibia: Overview, Illustrative Observations, and Way Forward, B. Am. Meteorol. Soc., 100, 1277–1298, https://doi.org/10.1175/BAMS-D-17-0278.1, 2019.
Gao, Y., Yu, S., Sherrell, R. M., Fan, S., Bu, K., and Anderson, J. R.: Particle-Size Distributions and Solubility of Aerosol Iron Over the Antarctic Peninsula During Austral Summer, J. Geophys. Res.-Atmos., 125, e2019JD032082, https://doi.org/10.1029/2019JD032082, 2020.
Garstang, M., Tyson, P. D., Swap, R., Edwards, M., Kållberg, P., and Lindesay, J. A.: Horizontal and vertical transport of air over southern Africa, J. Geophys. Res.-Atmos., 101, 23721–23736, https://doi.org/10.1029/95JD00844, 1996.
Giles, D. M., Sinyuk, A., Sorokin, M. G., Schafer, J. S., Smirnov, A., Slutsker, I., Eck, T. F., Holben, B. N., Lewis, J. R., Campbell, J. R., Welton, E. J., Korkin, S. V., and Lyapustin, A. I.: Advancements in the Aerosol Robotic Network (AERONET) Version 3 database – automated near-real-time quality control algorithm with improved cloud screening for Sun photometer aerosol optical depth (AOD) measurements, Atmos. Meas. Tech., 12, 169–209, https://doi.org/10.5194/amt-12-169-2019, 2019.
Haywood, J. M., Osborne, S. R., Francis, P. N., Keil, A., Formenti, P., Andreae, M. O., and Kaye, P. H.: The mean physical and optical properties of regional haze dominated by biomass burning aerosol measured from the C-130 aircraft during SAFARI 2000, J. Geophys. Res.-Atmos., 108, 8473, https://doi.org/10.1029/2002JD002226, 2003.
Haywood, J. M., Abel, S. J., Barrett, P. A., Bellouin, N., Blyth, A., Bower, K. N., Brooks, M., Carslaw, K., Che, H., Coe, H., Cotterell, M. I., Crawford, I., Cui, Z., Davies, N., Dingley, B., Field, P., Formenti, P., Gordon, H., de Graaf, M., Herbert, R., Johnson, B., Jones, A. C., Langridge, J. M., Malavelle, F., Partridge, D. G., Peers, F., Redemann, J., Stier, P., Szpek, K., Taylor, J. W., Watson-Parris, D., Wood, R., Wu, H., and Zuidema, P.: The CLoud–Aerosol–Radiation Interaction and Forcing: Year 2017 (CLARIFY-2017) measurement campaign, Atmos. Chem. Phys., 21, 1049–1084, https://doi.org/10.5194/acp-21-1049-2021, 2021.
Hersbach, H., Bell, B., Berrisford, P., Biavati, G., Horányi, A., Muñoz Sabater, J., Nicolas, J., Peubey, C., Radu, R., Rozum, I., Schepers, D., Simmons, A., Soci, C., Dee, D., and Thépaut, J.-N.: ERA5 hourly data on pressure levels from 1979 to present, Copernicus Climate Change Service (C3S) Climate Data Store (CDS) [data set], https://doi.org/10.24381/cds.bd0915c6, 2018.
Inness, A., Ades, M., Agustí-Panareda, A., Barré, J., Benedictow, A., Blechschmidt, A., Dominguez, J., Engelen, R., Eskes, H., Flemming, J., Huijnen, V., Jones, L., Kipling, Z., Massart, S., Parrington, M., Peuch, V.-H., Razinger, M., Remy, S., Schulz, M., and Suttie, M.: CAMS global reanalysis (EAC4), Copernicus Atmosphere Monitoring Service (CAMS) Atmosphere Data Store (ADS) [data set], https://ads.atmosphere.copernicus.eu/cdsapp#!/dataset/cams-global-reanalysis-eac4?tab=overview (last access: 24 July 2020), 2019.
Horowitz, H. M., Garland, R. M., Thatcher, M., Landman, W. A., Dedekind, Z., van der Merwe, J., and Engelbrecht, F. A.: Evaluation of climate model aerosol seasonal and spatial variability over Africa using AERONET, Atmos. Chem. Phys., 17, 13999–14023, https://doi.org/10.5194/acp-17-13999-2017, 2017.
Hoskins, B. J. and Ambrizzi, T.: Rossby Wave Propagation on a Realistic Longitudinally Varying Flow, J. Atmos. Sci., 50, 1661–1671, https://doi.org/10.1175/1520-0469(1993)050<1661:RWPOAR>2.0.CO;2, 1993.
Hu, S. and Fedorov, A. V.: The extreme El Niño of 2015–2016 and the end of global warming hiatus, Geophys. Res. Lett., 44, 3816–3824, https://doi.org/10.1002/2017GL072908, 2017.
Huang, B., Thorne, P. W., Banzon, V. F., Boyer, T., Chepurin, G., Lawrimore, J. H., Menne, M. J., Smith, T. M., Vose, R. S., and Zhang, H.-M.: Extended Reconstructed Sea Surface Temperature, Version 5 (ERSSTv5): Upgrades, Validations, and Intercomparisons, J. Climate, 30, 8179–8205, https://doi.org/10.1175/JCLI-D-16-0836.1, 2017.
Limpasuvan, V. and Hartmann, D. L.: Eddies and the annular modes of climate variability, Geophys. Res. Lett., 26, 3133–3136, https://doi.org/10.1029/1999GL010478, 1999.
Lindesay, J. A., Andreae, M. O., Goldammer, J. G., Harris, G., Annegarn, H. J., Garstang, M., Scholes, R. J., and van Wilgen, B. W.: International geosphere-biosphere programme/international global atmospheric chemistry SAFARI-92 field experiment: Background and overview, J. Geophys. Res.-Atmos., 101, 23521–23530, https://doi.org/10.1029/96JD01512, 1996.
Macron, C., Pohl, B., Richard, Y., and Bessafi, M.: How do Tropical Temperate Troughs Form and Develop over Southern Africa?, J. Clim., 27, 1633–1647, https://doi.org/10.1175/JCLI-D-13-00175.1, 2014.
Mallet, M., Solmon, F., Nabat, P., Elguindi, N., Waquet, F., Bouniol, D., Sayer, A. M., Meyer, K., Roehrig, R., Michou, M., Zuidema, P., Flamant, C., Redemann, J., and Formenti, P.: Direct and semi-direct radiative forcing of biomass-burning aerosols over the southeast Atlantic (SEA) and its sensitivity to absorbing properties: a regional climate modeling study, Atmos. Chem. Phys., 20, 13191–13216, https://doi.org/10.5194/acp-20-13191-2020, 2020.
McMillan, W. W., McCourt, M. L., Revercomb, H. E., Knuteson, R. O., Christian, T. J., Doddridge, B. G., Hobbs, P. V., Lukovich, J. V., Novelli, P. C., Piketh, S. J., Sparling, L., Stein, D., Swap, R. J., and Yokelson, R. J.: Tropospheric carbon monoxide measurements from the Scanning High-Resolution Interferometer Sounder on 7 September 2000 in southern Africa during SAFARI 2000, J. Geophys. Res.-Atmos., 108, 8492, https://doi.org/10.1029/2002JD002335, 2003.
Michelangeli, P. A., Vautard, R., and Legras, B.: Weather regimes: recurrence and quasi stationarity, J. Atmos. Sci., 52, 1237–1256, https://doi.org/10.1175/1520-0469(1995)052<1237:WRRAQS>2.0.CO;2, 1995.
NASA Goddard Space Flight Center: AERONET station data, NASA [data set], https://aeronet.gsfc.nasa.gov/, 2021.
NOAA Climate Prediction Center: SAM daily index, NOAA [data set], https://www.cpc.ncep.noaa.gov/, 2021.
Pistone, K., Redemann, J., Doherty, S., Zuidema, P., Burton, S., Cairns, B., Cochrane, S., Ferrare, R., Flynn, C., Freitag, S., Howell, S. G., Kacenelenbogen, M., LeBlanc, S., Liu, X., Schmidt, K. S., Sedlacek III, A. J., Segal-Rozenhaimer, M., Shinozuka, Y., Stamnes, S., van Diedenhoven, B., Van Harten, G., and Xu, F.: Intercomparison of biomass burning aerosol optical properties from in situ and remote-sensing instruments in ORACLES-2016, Atmos. Chem. Phys., 19, 9181–9208, https://doi.org/10.5194/acp-19-9181-2019, 2019.
Pohl, B., Dieppois, B., Crétat, J., Lawler, D., and Rouault, M.: From synoptic to interdecadal variability in southern African rainfall: Toward a unified view across time scales, J. Climate, 31, 5845–5872, https://doi.org/10.1175/JCLI-D-17-0405.1, 2018.
Rayner, N. A., Parker, D. E., Horton, E. B., Folland, C. K., Alexander, L. V., Rowell, D. P., Kent, E. C., and Kaplan, A.: Global analyses of sea surface temperature, sea ice, and night marine air temperature since the late nineteenth century, J. Geophys. Res.-Atmos., 108, 4407, https://doi.org/10.1029/2002jd002670, 2003.
Redemann, J., Wood, R., Zuidema, P., Doherty, S. J., Luna, B., LeBlanc, S. E., Diamond, M. S., Shinozuka, Y., Chang, I. Y., Ueyama, R., Pfister, L., Ryoo, J.-M., Dobracki, A. N., da Silva, A. M., Longo, K. M., Kacenelenbogen, M. S., Flynn, C. J., Pistone, K., Knox, N. M., Piketh, S. J., Haywood, J. M., Formenti, P., Mallet, M., Stier, P., Ackerman, A. S., Bauer, S. E., Fridlind, A. M., Carmichael, G. R., Saide, P. E., Ferrada, G. A., Howell, S. G., Freitag, S., Cairns, B., Holben, B. N., Knobelspiesse, K. D., Tanelli, S., L'Ecuyer, T. S., Dzambo, A. M., Sy, O. O., McFarquhar, G. M., Poellot, M. R., Gupta, S., O'Brien, J. R., Nenes, A., Kacarab, M., Wong, J. P. S., Small-Griswold, J. D., Thornhill, K. L., Noone, D., Podolske, J. R., Schmidt, K. S., Pilewskie, P., Chen, H., Cochrane, S. P., Sedlacek, A. J., Lang, T. J., Stith, E., Segal-Rozenhaimer, M., Ferrare, R. A., Burton, S. P., Hostetler, C. A., Diner, D. J., Seidel, F. C., Platnick, S. E., Myers, J. S., Meyer, K. G., Spangenberg, D. A., Maring, H., and Gao, L.: An overview of the ORACLES (ObseRvations of Aerosols above CLouds and their intEractionS) project: aerosol–cloud–radiation interactions in the southeast Atlantic basin, Atmos. Chem. Phys., 21, 1507–1563, https://doi.org/10.5194/acp-21-1507-2021, 2021.
Stein, D. C., Swap, R. J., Greco, S., Piketh, S. J., Macko, S. A., Doddridge, B. G., Elias, T., and Bruintjes, R. T.: Haze layer characterization and associated meteorological controls along the eastern coastal region of southern Africa, J. Geophys. Res.-Atmos., 108, 8506, https://doi.org/10.1029/2002JD003237, 2003.
Stier, P., Schutgens, N. A. J., Bellouin, N., Bian, H., Boucher, O., Chin, M., Ghan, S., Huneeus, N., Kinne, S., Lin, G., Ma, X., Myhre, G., Penner, J. E., Randles, C. A., Samset, B., Schulz, M., Takemura, T., Yu, F., Yu, H., and Zhou, C.: Host model uncertainties in aerosol radiative forcing estimates: Results from the AeroCom Prescribed intercomparison study, Atmos. Chem. Phys., 13, 3245–3270, https://doi.org/10.5194/acp-13-3245-2013, 2013.
Swap, R., Garstang, M., Macko, S. A., Tyson, P. D., Maenhaut, W., Artaxo, P., Kållberg, P., and Talbot, R.: The long-range transport of southern African aerosols to the tropical South Atlantic, J. Geophys. Res.-Atmos., 101, 23777–23791, https://doi.org/10.1029/95JD01049, 1996.
Swap, R. J., Annegarn, H. J., Suttles, J. T., King, M. D., Platnick, S., Privette, J. L., and Scholes, R. J.: Africa burning: A thematic analysis of the Southern African Regional Science Initiative (SAFARI 2000), J. Geophys. Res.-Atmos., 108, 8465, https://doi.org/10.1029/2003JD003747, 2003.
Tang, C., Morel, B., Wild, M., Pohl, B., Abiodun, B., and Bessafi, M.: Numerical simulation of surface solar radiation over Southern Africa. Part 1: Evaluation of regional and global climate models, Clim. Dyn., 52, 457–477, https://doi.org/10.1007/s00382-018-4143-1, 2019.
Tyson, P. D.: Atmospheric transport of aerosols and trace gases over southern Africa, Prog. Phys. Geogr. Earth Environ., 21, 79–101, https://doi.org/10.1177/030913339702100105, 1997.
van der Werf, G. R., Randerson, J. T., Giglio, L., Collatz, G. J., Mu, M., Kasibhatla, P. S., Morton, D. C., DeFries, R. S., Jin, Y., and van Leeuwen, T. T.: Global fire emissions and the contribution of deforestation, savanna, forest, agricultural, and peat fires (1997–2009), Atmos. Chem. Phys., 10, 11707–11735, https://doi.org/10.5194/acp-10-11707-2010, 2010.
van der Werf, G. R., Randerson, J. T., Giglio, L., van Leeuwen, T. T., Chen, Y., Rogers, B. M., Mu, M., van Marle, M. J. E., Morton, D. C., Collatz, G. J., Yokelson, R. J., and Kasibhatla, P. S.: Global fire emissions estimates during 1997–2016, Earth Syst. Sci. Data, 9, 697–720, https://doi.org/10.5194/essd-9-697-2017, 2017.
Vigaud, N., Pohl, B., and Crétat, J.: Tropical-temperate interactions over southern Africa simulated by a regional climate model, Clim. Dynam., 39, 2895–2916, https://doi.org/10.1007/s00382-012-1314-3, 2012.
von Storch, H. and Zwiers, F. W.: Statistical Analysis in Climate Research, Cambridge University Press, Cambridge, ISBN 978-0-5116-1233-6, https://doi.org/10.1017/CBO9780511612336, 1999.
Wai, K. M., Wu, S., Kumar, A., and Liao, H.: Seasonal variability and long-term evolution of tropospheric composition in the tropics and Southern Hemisphere, Atmos. Chem. Phys., 14, 4859–4874, https://doi.org/10.5194/acp-14-4859-2014, 2014.
Wu, H., Taylor, J. W., Szpek, K., Langridge, J. M., Williams, P. I., Flynn, M., Allan, J. D., Abel, S. J., Pitt, J., Cotterell, M. I., Fox, C., Davies, N. W., Haywood, J., and Coe, H.: Vertical variability of the properties of highly aged biomass burning aerosol transported over the southeast Atlantic during CLARIFY-2017, Atmos. Chem. Phys., 20, 12697–12719, https://doi.org/10.5194/acp-20-12697-2020, 2020.
Zuidema, P., Chang, P., Medeiros, B., Kirtman, B. P., Mechoso, R., Schneider, E. K., Toniazzo, T., Richter, I., Small, R. J., Bellomo, K., Brandt, P., De Szoeke, S., Farrar, J. T., Jung, E., Kato, S., Li, M., Patricola, C., Wang, Z., Wood, R., and Xu, Z.: Challenges and prospects for reducing coupled climate model sst biases in the eastern tropical atlantic and pacific oceans: The U.S. Clivar eastern tropical oceans synthesis working group, B. Am. Meteorol. Soc., 97, 2305–2327, https://doi.org/10.1175/BAMS-D-15-00274.1, 2016.