the Creative Commons Attribution 4.0 License.
the Creative Commons Attribution 4.0 License.
 | 08 Feb 2021
Carbon and air pollutant emissions from China's cement industry 1990–2015: trends, evolution of technologies, and drivers
Yixuan Zheng
Jing Cheng
Xinying Qin
Qinren Shi
Liu Yan
Yu Lei
Qiang Zhang
China is the largest cement producer and consumer in the world. Cement manufacturing is highly energy-intensive and is one of the major contributors to carbon dioxide (CO2) and air pollutant emissions, which threatens climate mitigation and air quality improvement. In this study, we investigated the decadal changes in carbon dioxide and air pollutant emissions for the period of 1990–2015 based on intensive unit-based information on activity rates, production capacity, operation status, and control technologies which improved the accuracy of the cement emissions in China. We found that, from 1990 to 2015, accompanied by a 10.3-fold increase in cement production, CO2, SO2, and NOx emissions from China's cement industry increased by 627 %, 56 %, and 659 %, whereas CO, PM2.5, and PM10 emissions decreased by 9 %, 63 %, and 59 %, respectively. In the 1990s, driven by the rapid growth of cement production, CO2 and air pollutant emissions increased constantly. Then, the technological innovation in production of replacing traditional shaft kilns with the new precalciner kilns equipped with high-efficiency control facilities in the 2000s markedly reduced SO2, CO, and PM emissions in the cement industry. In 2010, nationwide, 39 % and 31 % of the nationwide PM2.5 and NOx emission were produced by 3 % and 15 % of the total capacity of the production lines, indicating the disproportionately high emissions from a small number of the super-polluting units. Since 2010, the growing trend of emissions has been further curbed by a combination of measures, including promoting large-scale precalciner production lines and phasing out small ones, upgrading emission standards, installing low NOx burners (LNB), and selective non-catalytic reduction (SNCR) to reduce NOx emissions, as well as adopting more advanced particulate matter control technologies. Our study highlights the effectiveness of advanced technologies on air pollutant emission control; however, CO2 emissions from China's cement industry kept growing throughout the period, posing challenges to future carbon emission mitigation in China.
- Article
(4121 KB) - Full-text XML
-
Supplement
(981 KB) - BibTeX
- EndNote


China is the largest cement producer and consumer in the world (Shen et al., 2015). As the basic industry for construction materials, the cement industry supports rapid social and economic development but also suffers from high energy consumption and serious air pollution problems. In 1990, China's cement output was 210 million t (National Bureau of Statistics, 1991). By 2015, the total cement production in China increased to 2359 million t (National Bureau of Statistics, 2016), which was a 10.3 times higher output than in 1990 and accounted for 58 % of global total production in 2015 (USGS, 2015). The cement industry is energy-intensive, representing 208 million t of coal consumption in 2012 and accounting for 6 % of the total industrial coal use (China Cement Association, 2015). It is a major CO2 emitter due to high energy intensity and the dissociation of carbonate during the clinker production process. At the same time, the cement industry contributes substantially to the emissions of air pollutants, especially particles, NOx, and SO2. According to previous estimates for 2005, the cement industry contributed 13 %, 27 %, 29 %, 5 %, 6 %, and 8 % of national total CO2, PM2.5, PM10, SO2, NOx, and CO emissions, respectively (Lei et al., 2011a). The substantial emissions of CO2 and air pollutants from China's cement industry poses challenges to global climate mitigation and regional air quality improvements. Therefore, it is of great importance to develop a reliable and high-resolution cement emission inventory to facilitate atmospheric chemistry modeling and support greenhouse gas mitigation and air quality management.
Previously, greenhouse gas and air pollutant emissions from the cement industry in China were studied in several national and regional inventories. The cement industry is the second largest anthropogenic contributor to CO2 emissions, and many studies focus on CO2 emissions, energy intensity, energy-saving potential, and the cost of the cement industry (Liu et al., 2013; Xu et al., 2014; Shen et al., 2015; Zhang et al., 2015; Cai et al., 2016; Gao et al., 2017). In the atmospheric community, early studies calculated cement air pollutant emissions based on the proportion of coal combusted in cement kilns (Streets et al., 2003; Ohara et al., 2007). These studies did not distinguish the different kiln types and ignored process emissions which resulted in underestimations (Streets et al., 2006). The methodology was improved by introducing more detailed industrial source categories which allowed for the distinction of combustion and process emissions (Zhang et al., 2006, 2007, 2009). Subsequently, a dynamic and technology-based methodology with changing emission factors over a decade was developed which provided the historical trend of major air pollutants from China's cement industry (Lei et al., 2011a, b). In addition to conventional air pollutants, Hua et al. (2016) expanded the emission quantification to toxic heavy metals, including mercury, cadmium, chromium, lead, zinc, arsenic, nickel, and copper.
Despite remarkable improvements, there are still two major deficiencies in the current cement emission inventory of China. First, owing to limited information available at the unit level, there is no cement emission inventory that estimates the greenhouse gas and air pollutant emissions from individual clinker production lines and cement grinding plants, which is insufficient to provide an accurate and high-resolution cement emission dataset for China. Second, with the economic development and upgrade of emission standards, there has been a dynamic transition in cement production and emission control technologies. Especially from 2010 to 2015, the production of cement has peaked, and the upgraded cement emission standards (GB 4915-2013) promoted more advanced emission control technologies in the cement industry. These time-dependent transitions should be implemented when constructing the historical trend of cement emissions in China.
Based on the background above, the aim of this study is to quantify the decadal changes in carbon dioxide and air pollutant emissions from China's cement industry, investigate the evolution technologies, identify the super-polluting units, and quantify the major drivers of the emission changes over a period of 25 years. The analysis is based on intensive unit-based information on activity rates, production capacity, operation status, and control technologies, which improves the accuracy of the estimation of cement emissions, provides a comprehensive view of the effectiveness of technologies on air pollutant emission control in the past, quantifies the contribution from different drivers to changes in emissions, and highlights the opportunities and challenges for the future mitigation of carbon dioxide and air pollutant emissions in China.
2.1 Activity rates
In this study, we developed a unit- and technology-based methodology for SO2, NOx, CO, CO2, PM2.5, and PM10 emissions in the cement industry for the 1990–2015 period. We calculated only the direct emissions from cement production; indirect emissions such as fuel use in the power plants due to electricity consumption and fuel use by vehicles for material transportation were not included.
Table 1Equations used for estimating emissions in China's cement industry.
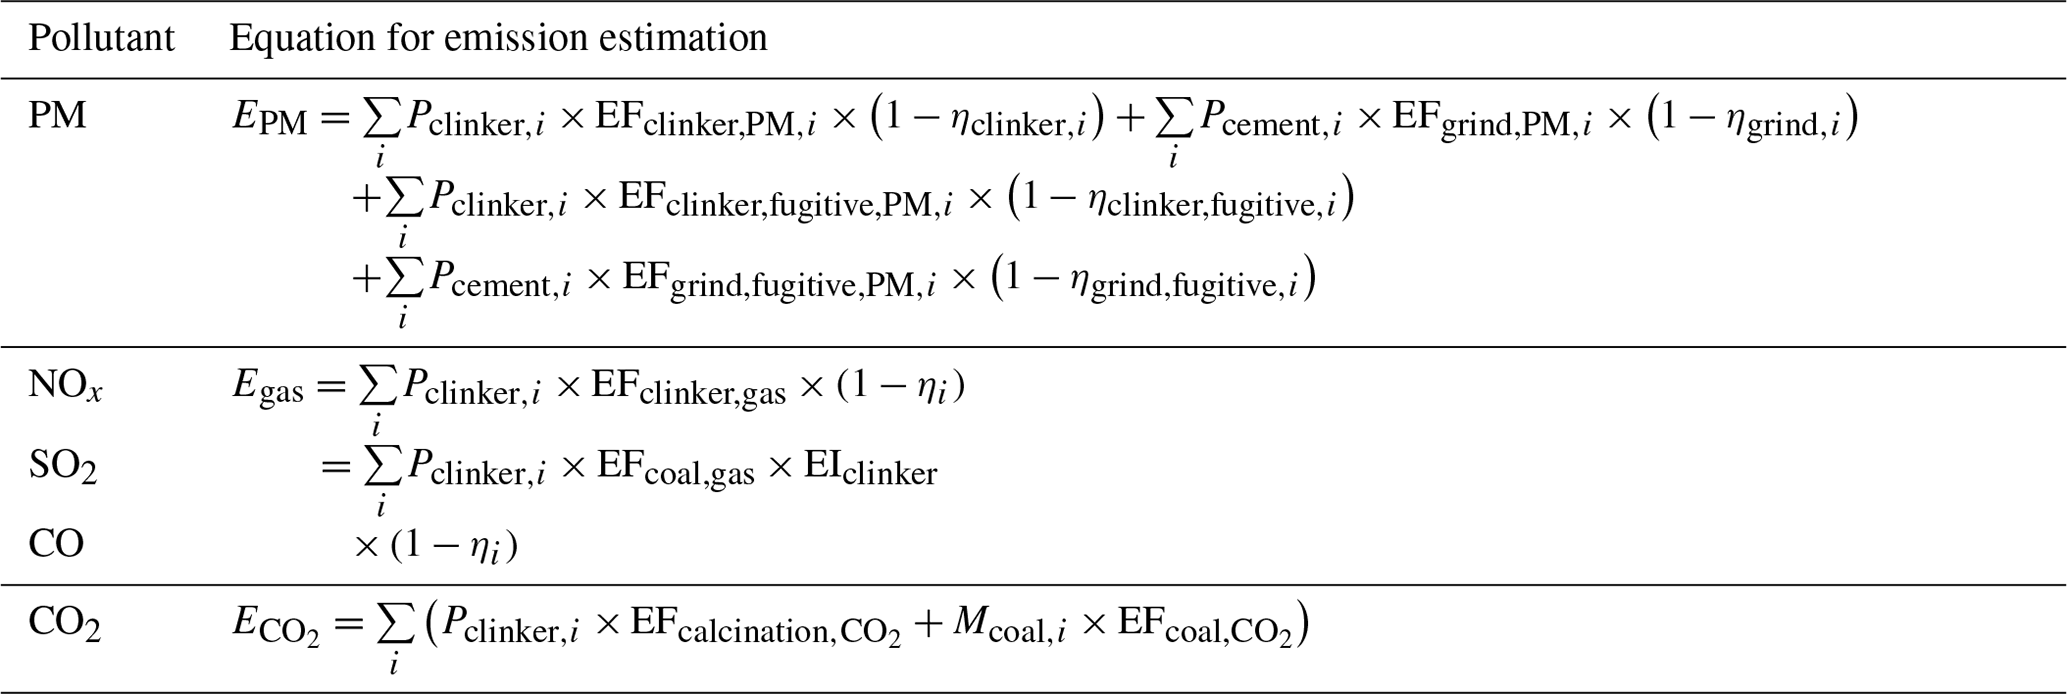
EF: emission factor; i: the ID number of the cement production lines and grinding stations; E: the total emissions (t yr−1); Pclinker: clinker production (t yr−1); Pcement: cement production (t yr−1); EFclinker,PM: organized PM emission factor during the clinker calcination process (g kg−1); ηclinker: removal efficiency PM control technology during the clinker calcination process; EFgrind,PM: organized PM emission factor during the cement grinding process (g kg−1); ηgrind: removal efficiency PM control technology during the cement grinding process; EFclinker,fugitive,PM: fugitive PM emission factor during the clinker calcination process (g kg−1); ηclinker,fugitive: removal efficiency fugitive PM control technology during the clinker calcination process; EFgrind,fugitive,PM: fugitive PM emission factor during the cement grinding process (g kg−1); ηgrind,fugitive: removal efficiency of fugitive PM control technology during the cement grinding process; EFclinker,gas: emission factor of gaseous species (SO2, NOx, and CO) per ton of clinker produced (g kg−1); η: removal efficiency of control technology for gaseous species (particularly for NOx); EFcoal,gas: emission factor of gaseous species per ton of coal consumed (g kg−1); EIclinker: energy intensity of the clinker calcination process (kg coal (kg clinker)−1); EF: CO2 emission factor from clinker calcination (g (kg clinker)−1); Mcoal: coal consumption during the clinker calcination process (t yr−1); EF: CO2 emission factor from coal combustion (g (kg coal)−1).
Cement production involves a series of complex processes, including three basic stages: raw material preparation, clinker calcination, and cement grinding (Cao et al., 2016). CO, SO2, and NOx are only emitted from fuel combustion during the clinker calcination process; thus, we estimated the emissions of these pollutants by the amount of coal consumed in the cement kilns, and the coal use was calculated as the product of clinker production and annual energy intensity for the clinker production process. CO2 is primarily emitted from two sources: fuel combustion and the calcination of calcium carbonates which we treated separately in the emission calculation. The emission of PM is more complex, involving the entire process of cement production, including both organized and fugitive emissions. Following our previous study, we applied a similar model framework with a dynamic methodology to consider the transition of various PM control technologies in different cement kilns under a series of emission standards and control policies (Lei et al., 2011a, b). The equations used to calculate various pollutants are summarized in Table 1.
Detailed unit-level data from 2010 to 2015 were obtained from the China Ministry of Ecology and Environment (unpublished data, hereafter referred to as the MEE database), including clinker and cement production, production capacity, operating and retiring dates, PM and NOx control technologies, and the coordinates of each unit. Overall, the database consists of 3125 clinker production lines and 4549 cement grinding stations of which 665 clinker production lines and 783 cement grinding stations have been retired since 2010. Based on the MEE database for 2010–2015, we derived the unit-level activity rates for the period 1990–2009 with a combination of data from statistics and the literature. We first calculated the provincial clinker and cement output from the existing data sources and then distributed the yearly provincial output among the cement production lines in each province by considering the age, kiln type, and capacity of each production line. In detail, we obtained the national and provincial cement output during 1990–2009 from China Statistical Yearbook (National Bureau of Statistics, 1991–2010a) and China Industry Economy Statistical Yearbook (National Bureau of Statistics, 1991–2010b) and collected the national (2002–2009) and provincial (2005–2009) clinker output from China Cement Almanac (China Cement Association, 2001–2010). Additional data on provincial clinker output for some distinct years (such as 1993, 1994 and 1997) before 2005 were obtained from China Industry Economy Statistical Yearbook (National Bureau of Statistics, 1991–2010b). The data on national clinker to cement ratio during 1990–2001 were adopted from the literature (Xu et al., 2012, 2014; Gao et al., 2017). To derive the clinker output for the early years on a national scale, we calculated the clinker output as the product of clinker to cement ratio and the cement output for the years of 1990–2001. On a provincial scale, we derived the clinker to cement ratio for each year of 1990–2004 based on a linear interpolation with the available year-specific provincial clinker to cement ratio from statistics and calculated the provincial clinker output as the product of provincial clinker to cement ratio and the provincial cement output using the national clinker output as a constrain. Therefore, in the emission database, the data on national and provincial clinker and cement output are consistent with existing data from statistics and the literature, but unit-level activity prior to 2010 is more uncertain because it is extrapolated based on the information of the age, kiln type, and capacity of each production line.
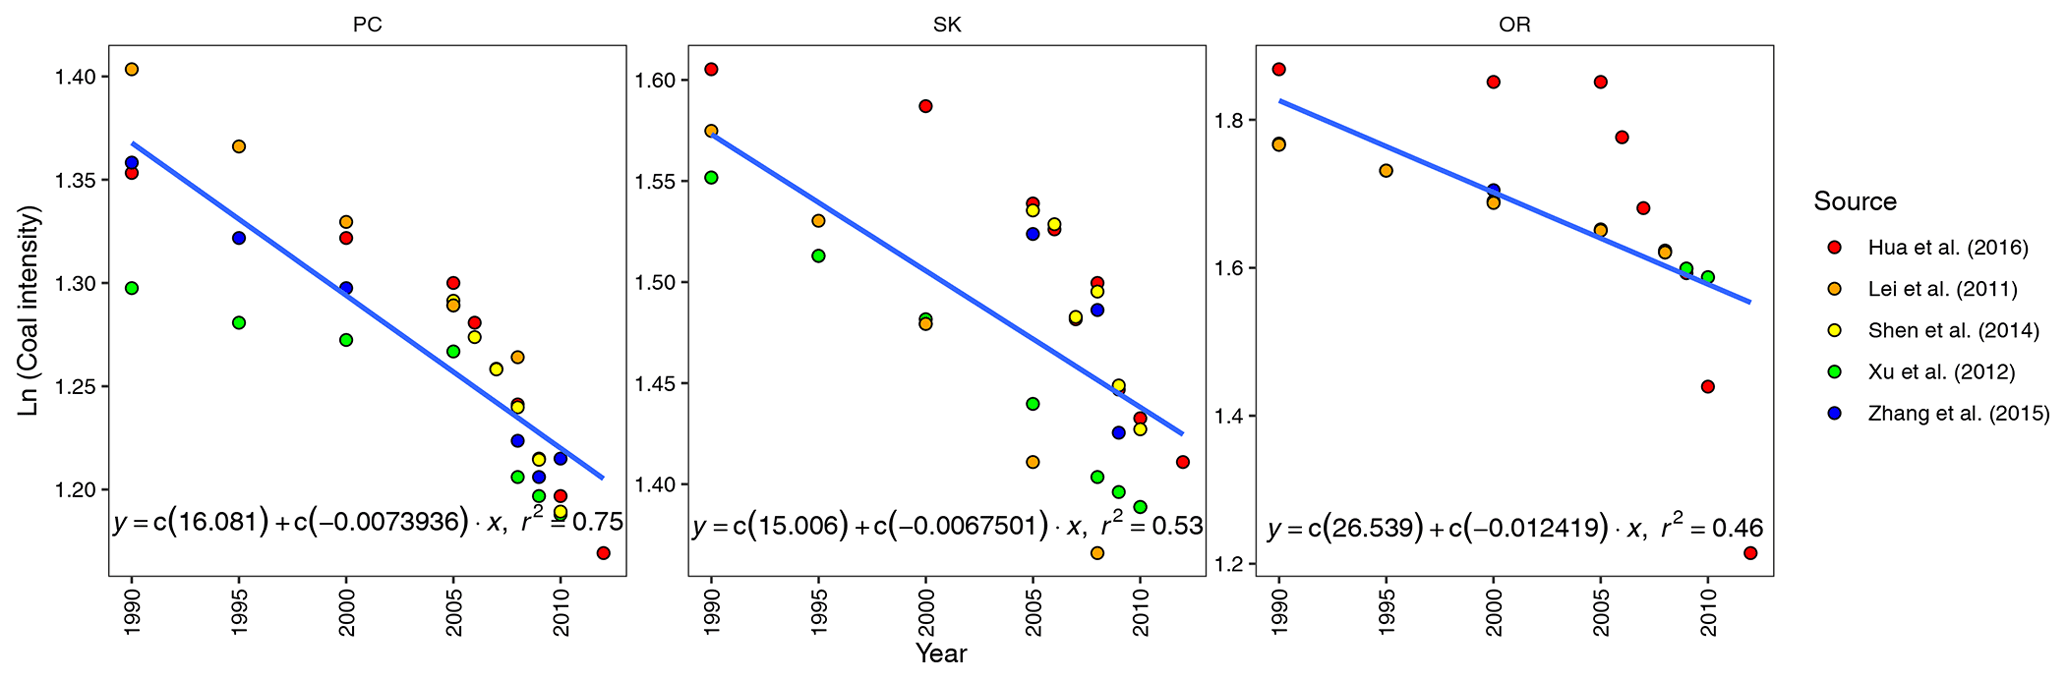
Figure 1Linear regression of the logarithm of coal-use intensity for different kiln types. The kiln types include precalciner kilns (PCs), shaft kilns (SKs), and the other rotary kilns (ORs).
The energy efficiency of clinker production in China's cement industry has improved markedly over the past 25 years. The average energy intensity of clinker production has decreased from 5.41 GJ t clinker−1 in 1990 to 3.73 GJ t clinker−1 in 2015 (National Bureau of Statistics, 2016). The historical energy intensities of different kiln types were not available from statistics but have been reported in several studies (Lei et al., 2011a; Xu et al., 2012; Shen et al., 2014; Zhang et al., 2015; Hua et al., 2016). Originally, such information in a certain year was reported by the authority or research institutes, such as National Development and Reform Commission and China Academy of Building Research, and then was interpolated between years or averaged among different studies to derive the historical trend. There were discrepancies in the historical energy intensities because the data sources and calculation methods were varied among different studies. For example, Lei et al. (2011a) estimated the average coal intensity of precalciner kilns in 1990 was 4.07 GJ t clinker−1, whereas it was 3.66 GJ t clinker−1 from the estimation of Xu et al. (2012). To avoid the bias introduced by one particular study, we collected all the available data and generated a linear regression between the logarithm of energy intensity (GJ t clinker−1) and time in years to predict the energy intensity in each year (Fig. 1), which enabled the calculation of coal consumption for each production line. According to the model regression, the energy efficiency of precalciner kilns (PCs) is distinctly higher than that of shaft kilns (SKs) and the other rotary kilns (ORs). For example, the average energy intensity of PC, SK, and OR kilns in 2010 was 3.39, 4.21, and 4.84 MJ t clinker−1, respectively. Besides the linear model, we tried the nonlinear regression with the generalized additive model (GAM) as a sensitivity test and finally decided to present the results by linear regression since there were no significant differences between the two models and the linear regression has simple explicit expressions. The details on the comparison are discussed in the Supplement.
2.2 Emission factors
2.2.1 CO2
CO2 emissions originate from both the thermal decomposition of limestone and the burning of fuels in a cement kiln. The methodology for estimating the CO2 fuel emission factor follows the Intergovernmental Panel on Climate Change (IPCC) Guidelines for National Greenhouse Gas Inventories (IPCC, 2006), as presented in Eq. (1).
where EF refers to the fuel emission factor of CO2 (in g kg−1), C represents the carbon content of coal, R is the oxidation rate of coal, and H refers to the heating value of coal. We adopted 25.8 kg GJ−1, 98 % and 20.908 GJ kg−1 for the respective values of C, R, and H of the raw coal in China (Cui and Liu, 2008) and derived the CO2 fuel emission factor as 1940 g kg−1 coal (equivalent to 92 800 kg TJ−1 coal), which is consistent with the values of 92 128–95 700 kg TJ−1 adopted in previous studies (Xu et al., 2012; Hasanbeigi et al., 2013; Chen et al., 2015; Tan et al., 2016).
The process CO2 emissions are mainly from the decomposition of limestone and from the conversion of calcium carbonate (CaCO3) and magnesium carbonate (MgCO3) to CaO and MgO. Therefore, the process CO2 emission factor can be estimated by the conservation of mass flow. In the absence of detailed data, it is widely accepted to use the IPCC default value of 510 kg t−1 clinker without considering the emissions from MgCO3 (IPCC, 2006). The Cement Sustainability Initiative (CSI) suggested calculating CO2 emissions according to the CaO and MgO contents of clinker and recommended a default emission factor of 525 kg CO2 t−1 clinker (CSI, 2005). Recently, Shen et al. (2016) conducted a nationwide sampling survey of 359 cement production lines across 22 provinces of China and estimated the CO2 emission factor with detailed chemical data and production parameters, which was slightly lower than the values suggested by the international institutes (Shen et al., 2016). Therefore, we adopted the process CO2 emission factor from this local Chinese study, i.e., 519.66, 499.83, and 499.83 kg t clinker−1 for PC, SK, and OR kilns, respectively.
2.2.2 SO2
SO2 is primarily emitted from coal combustion in kilns. After emission, a proportion of SO2 is absorbed by the reaction with calcium oxide (CaO). The SO2 emission factor is estimated by a mass balance approach based on the sulfur content of coal (Eq. 2):
where EF represents the SO2 emission factor, SCC is the sulfur content of coal, Sr is the faction of sulfur retention in ash, and Ar is the absorption rate of SO2 as a result of reaction with calcium oxide in kilns.
The SCC for each production line for each year was obtained from the provincial average SCC compiled in our previous studies (Lei et al., 2011a; F. Liu et al., 2015) due to a lack of production-line-based data. The SO2 absorption rate is approximately 70 %–80 % in PC kilns but is much lower in SK and OR kilns (Su et al., 1998; Liu, 2006). We assumed the SO2 absorption rates for PC, SK, and OR to be 80 %, 30 %, and 30 %, respectively (Lei et al., 2011a). The sulfur retention ratio in ash was assumed to be 25 % for all the production lines. Because the calcination process can absorb a large proportion of SO2 emissions, there are no additional SO2 abatement technologies in the cement industry. With the parameters above, the SO2 emission from each clinker production line was estimated as the product of coal consumption and the SO2 emission factor (Table 1).
2.2.3 CO
CO is the incomplete combustion product of fuel use during clinker calcination in kilns and is highly dependent on temperature and oxygen availability. Compared with rotary kilns, shaft kilns have a higher CO emission factor due to a lower operating temperature and less oxygen availability. Based on local experiments, the CO emission factors from different types of kilns were presented in previous studies on the emission inventory of China's cement industry (Lei et al., 2011a; Hua et al., 2016), ranging from 12.9 to 17.8, 135.4 to 155.7, and 17.8 kg t coal−1 for PC, SK, and OR kilns, respectively. We summarized these studies and adopted the median EFs (emission factors) from the literature for this study, as shown in Table 2.
Table 2Emission factors of SO2, NOx, CO, and CO2 from cement kilns. The kiln types include precalciner kilns (PCs), shaft kilns (SKs), and the other rotary kilns (ORs).

a Unit: g kg−1 of coal combusted in the cement kilns.
b National average SO2 emission factors weighted by coal
consumption.
2.2.4 NOx
Thermal NOx and fuel NOx are generated by fuel combustion in kilns during the clinker calcination process with a high temperature exceeding 1400 ∘C (Fan et al., 2014). Compared with shaft kilns, the operation temperature in rotary kilns is higher, which induces a higher NOx emission factor. In precalciner kilns, approximately half of the fuel is burned in the preheater at a lower temperature, so the NOx emission factor is lower than that of other rotary kilns (Bo and Hu, 2010). Previously, NOx emission factors were presented in several Chinese local cement emission inventory studies (Wang et al., 2008; Lei et al., 2011a; Hua et al., 2016), ranging from 10.9 to 15.3, 1.2 to 1.7, and 13.6 to 18.5 kg t coal−1 for PC, SK, and OR kilns, respectively. In addition, based on a nationwide survey and measurements, the Chinese Research Academy of Environmental Sciences (CRAES) published the recommended NOx emission factor for the cement industry during China's first pollution census, i.e., the cement industry: 1.584–1.746 kg t clinker−1 for precalciner kilns (equivalent to 9.7–10.7 kg t coal−1) and 0.202–0.243 kg t clinker−1 for shaft kilns (equivalent to 1.0–1.2 kg t coal−1) (CRAES, 2011). By combining this research evidence, we adopted NOx emission factors for China's cement industry, as shown in Table 2.
Low NOx burners (LNBs) and selective non-catalytic reduction (SNCR) are the two major technologies to reduce NOx emissions from the cement industry. The application of LNB technology in China's cement industry dates back to the 1990s and has started to increase since 2009. During the 12th 5-year plan (FYP) period (2011–2015), the national emission of NOx was required to be cut by 10 %. Driven by the policy requirements, newly established large kilns have been widely equipped with LNB devices, and a number of existing kilns have also been transformed to apply LNB technology. From 2011 to 2015, the proportion of the number of kilns equipped with LNB technology increased from 5 % to 40 %, and correspondingly, the proportion of clinker manufactured in kilns equipped with LNB technology increased from 11 % to 50 %. The installation percentage of LNB in newly established kilns increased from 13 % to 64 %. The SNCR technology was developed later in the 2000s. During the 12th FYP, SNCR installation experienced unprecedented explosive growth. The penetration rate has increased even faster than that of the LNB technology, from 1 % of the number of kilns in service in 2011 to 88 % in 2015, and thus the proportion of clinker manufactured in kilns equipped with SNCR facility increased from 1 % to 97 %.
However, the actual operation condition of the de-NOx facilities is less than satisfactory because the online NOx emission inspection system is not adequate in the cement industry. According to the MEE database, a large proportion of the de-NOx facilities (either LNB or SNCR) did not work properly after construction. For example, during the 2013–2015 period, there were ∼800, ∼1300, and ∼1400 cement kilns equipped with SNCR systems, but only 51 %, 54 %, and 73 % of these respective facilities were operating under normal conditions. Based on the information above, we assumed that the de-NOx devices were not in service before 2010, and the net NOx reduction rates from 2010 to 2015 for each production line were directly obtained from the MEE database.
2.2.5 Particulate matter
The particulate matter (PM) emissions are classified into three parts in this study: clinker production (including quarrying, crushing, calcination, and other processes), cement grinding, and fugitive emissions. The emission of PM is determined by the unabated emission factor of these processes and the reduction rates of PM emission control technologies. Since the PM emission factors are clinker and cement output-based factors, we did not specifically distinguish the fuel emissions from process emissions of PM in this study. We collected the unabated PM emission factor for clinker production and cement grinding from previous Chinese local studies (Lei et al., 2011a; Hua et al., 2016) and the recommended value compiled by CRAES during China's first pollution census (CRAES, 2011) from which we adopted the median value as the unabated PM emission factors for this study (Table 3). The mass fractions of PM2.5, PM2.5−10, and PM>10 relative to total particulate matter were derived from our previous study (Lei et al., 2011a).
Table 3PM emission factors for clinker production, cement grinding, and fugitive emissions. The kiln types include precalciner kilns (PCs), shaft kilns (SKs), and the other rotary kilns (ORs).
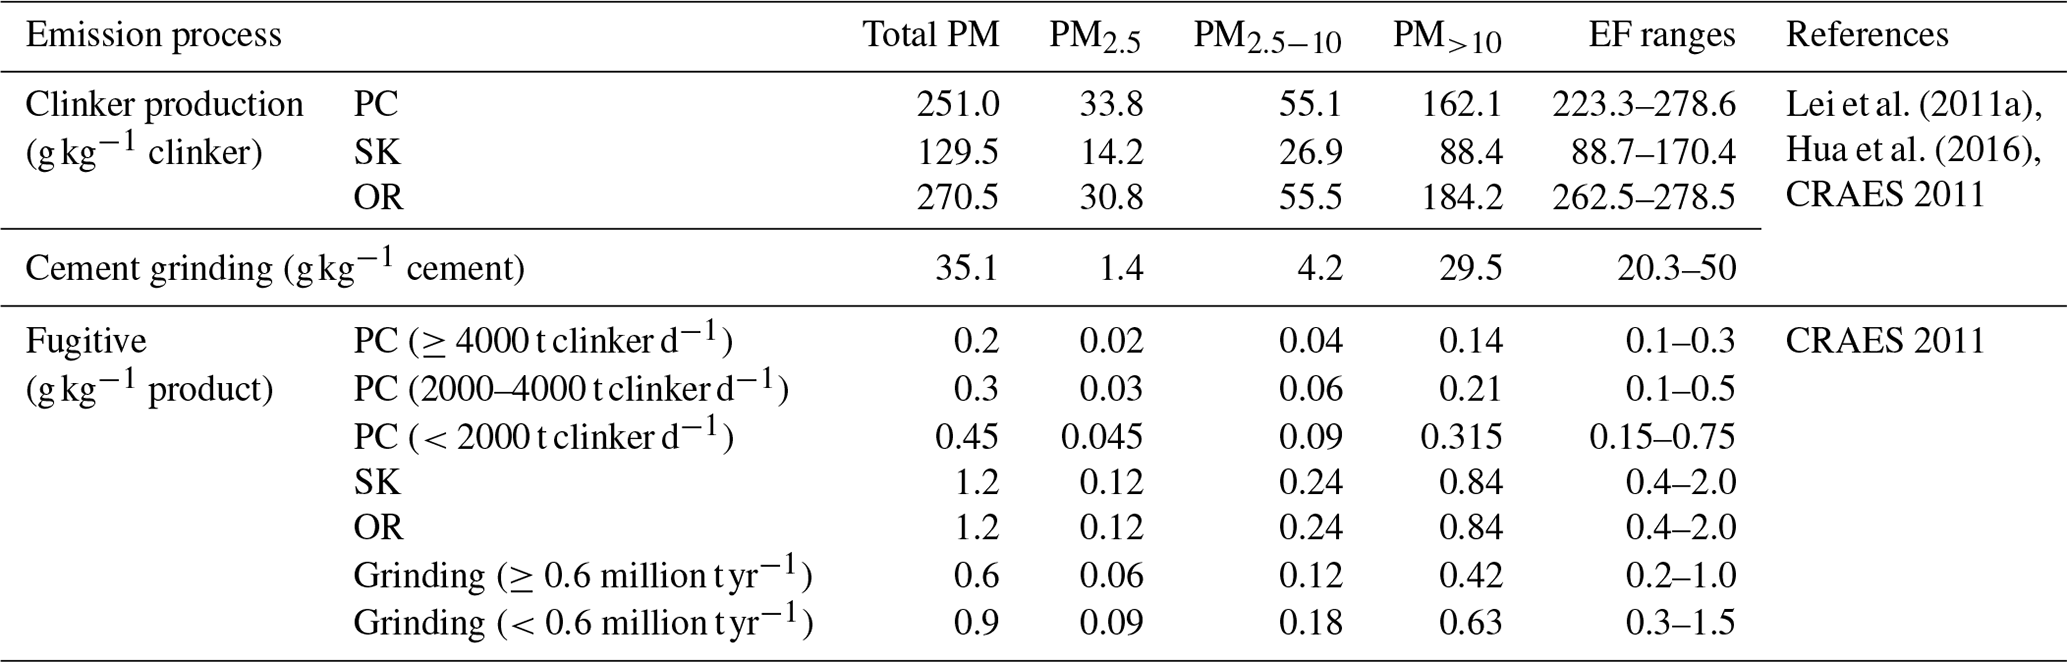
Due to limited information available, the fugitive PM emissions from the cement industry have not been elaborately studied before. Tang et al. (2018) calculated the organized and fugitive PM emissions from the cement-producing process and estimated that the fugitive emissions contributed 44 % of the total PM emissions in 2014 in China. Following the same methodology, Wang et al. (2018) estimated non-fugitive and fugitive PM, PM10, and PM2.5 emissions for the Beijing–Tianjin–Hebei region in 2016. The abated fugitive PM emission factors used in these studies were 0.1–0.4, 0.7, and 0.6 kg t−1 for PC, SK, and OR kilns, respectively, and 0.2–0.3 kg t−1 for the cement grinding process. However, these emission factors were not directly applicable to establish the historical emission trend because the details on control efficiencies were missing. In this study, we adopted the median values of unabated fugitive PM emission factors compiled by CRAES for China's first pollution census (CRAES, 2011) and used the mass fraction of PM with different diameters from Wang et al. (2018) to derive the size-specific PM emission factors (Table 3). The size distributions of PM2.5, PM2.5−10, and PM>10 in fugitive PM emissions were assumed to be 10 %, 20 %, and 70 % for all the fugitive emission processes (Wang et al., 2018).


Figure 2Evolution of PM2.5 removal technology and the average PM emission factors for each year.
There are five major types of PM removal technologies in China's cement industry, i.e., cyclone (CYC), wet scrubber (WET), electrostatic precipitator (ESP), high-efficiency electrostatic precipitator (ESP2), and bag filters (BAG). We obtained the PM removal technological application for each production line in 2010 from the MEE database and developed the technology evolution model over the 1990–2015 period following our previous methodology (Lei et al., 2011a). Over the past decades, China has progressively issued four editions of emission standards for air pollutants in the cement industry (GB 4915-1985, GB 4915-1996, GB 4915-2004, and GB 4915-2013) and has successively strengthened the particulate matter concentration limits of flue gas in kilns from 800 to 20 mg m−3. The fugitive PM emission limits have also been included in the standards since GB 4915-1996 (Table S1 in the Supplement). According to the concentration limits of the four phases of emission standards, we divided the entire study period into four phases, i.e., 1990–1996, 1997–2004, 2005–2013, and 2014–2015. In each phase, the newly built units were designed to be equipped with the current advanced PM removal technologies recommended by the documentation for the compilation of emission standards of air pollutants for the cement industry. For the existing units, we combined the limited information on the penetration of PM control technologies from the MEE database and environmental statistics and built an evolution model to perform the technological transformation for the in-fleet units step by step, assuming that the larger and younger units were prioritized for technology upgrading and transformation. Finally, based on the removal efficiencies of each technology (Lei et al., 2011a) listed in Table 4, we modeled the evolution of unit-based PM emission factors for the 1990–2015 period (Fig. 2).
For fugitive PM emissions, there are a variety of control technologies, such as covering the open storage of materials, collecting dust by PM removal facilities, reducing the transportation distance of raw materials, increasing the cleaning frequency of road dust, and so on. However, information on the implementation details of these technologies was scarce, which hindered us from establishing the unit-level technological evolution. Therefore, we estimated the average abatement rate of fugitive dust for the entire cement industry. According to the on-site measurements conducted by the China Building Materials Academy in 2009, the typical fugitive dust concentration observed 20 m from the factory boundary in the cement industry was 0.336–2.56 mg m−3 (Wang et al., 2009). Therefore, we assumed the upper limit of 2.56 mg m−3 as the unabated fugitive dust concentration, estimated the average fugitive PM abatement rates for each phase of emission standards, and interpolated the abatement rates across the entire study period (Fig. S3 in the Supplement).
2.3 Drivers to changes in emissions
We made a unit-level quantification of the contributions from six factors to the net changes in CO2 and air pollutant emissions, i.e., cement production, changes in kiln types, improvement of energy efficiency, reduction of clinker to cement ratio, reduction of sulfur content in coal, and the implementation of the end-of-pipe control measures. Following our previous study on the power sector (F. Liu et al., 2015; Wu et al., 2019), for a given period, we developed a series of hypothetical scenarios to estimate the contribution from each factor incrementally. For example, for the period of 2010–2015, we built the baseline scenario by changing the cement output from the amount in 2010 to the amount in 2015 and then changed the other five factors incrementally to the situation in 2015. The difference between every consecutive step is an estimate of the contribution of each factor. Since the order of the factors may change the results, we calculated the average factor contributions through all the change sequences in the factors. We applied the method of hypothetical scenarios rather than the index decomposition approaches (such as the logarithmic mean Divisia index, LMDI) since we hope to explicitly quantify the effects of drivers at unit level.
2.4 Uncertainty analysis
Following the methodology demonstrated in our previous studies on the power sector (F. Liu et al., 2015; Tong et al., 2018), we performed an uncertainty analysis of the emissions estimated in this study at the national and unit levels with a Monte Carlo approach. The “uncertainty” was estimated by the 95 % confidential interval (CI) around the central estimate of the emission from 10 000 Monte Carlo simulations with a specific probability distribution of input parameters, such as activity rates, coal intensity, emission factors, abatement efficiency of control technologies, and so on. The probability distributions of the related parameters were based on adequate measurements (e.g., CO2 emission factors), model regressions (e.g., coal intensity), a literature review (Lu et al., 2011; Zhao et al., 2011; F. Liu et al., 2015; Wang et al., 2019), and our own judgment. Table S2 in the Supplement presents the detailed information on the probability distribution of the parameters used in the uncertainty analysis.
For the unit-level uncertainty analysis, the uncertainty level of emission estimates in the 1990–2009 period was regarded as larger than that in the 2010–2015 period because all the unit-level data were directly available from the MEE database for the later period. The uncertainties conveyed by input parameters, such as activity rates, emission factors, and control technologies, could vary with time. Therefore, we also estimated the uncertainty ranges of one representative clinker production line (a precalciner kiln with a capacity of 4000 t clinker d−1, equipped with LNB, SNCR, and a bag filter in 2015) for 2000 and 2015 to demonstrate the change in unit-level uncertainties. The probability distribution of the parameters that are different from the parameters used in the national uncertainty analysis is listed in Table S3 in the Supplement.
3.1 Historical cement production and evolution of technologies
Driven by the economic development and urbanization process, China has experienced rapid growth in cement production and technological evolution in the cement industry. From 1990 to 2014, the production of cement and clinker increased from 0.21 and 0.16 billion t to 2.49 and 1.42 billion t, i.e., by 10.9 and 8.2 times, respectively (Fig. 3 and Table 5). The total production started to diminish in 2015 as a consequence of recent clean air actions (Zheng et al., 2018). Cement is a blending mixture of clinker and other additives, such as coal fly ash, plaster, clay, and so on. Typically, replacing clinker with other additives can reduce the energy intensity and CO2 emissions. With raised clinker quality from an increased number of new kilns, less clinker is required to produce a given strength of cement; thus, the clinker to cement ratio decreased from 74 % in 1990 to 57 % in 2015.

Figure 3Clinker production by designed capacity (t clinker d−1) (a) and by different kiln types (b).
Table 5Cement production, capacity sizes, energy intensity, and clinker to cement ratio in China during 1990–2015. The kiln types include precalciner kilns (PCs), shaft kilns (SKs), and the other rotary kilns (ORs).
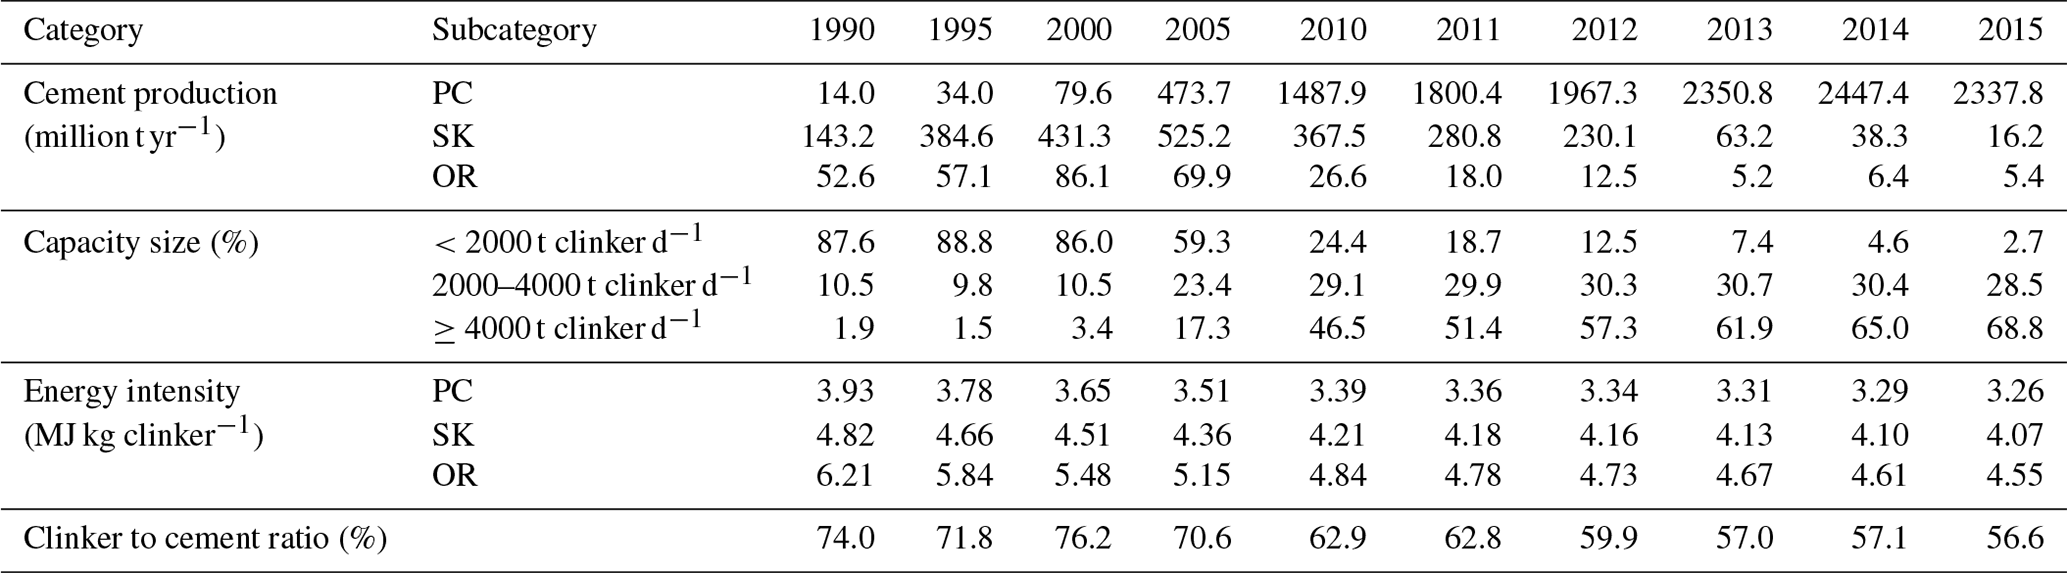
In China, the shaft kilns, precalciner kilns, and other rotary kilns are the major kiln types for clinker calcination, representing 68 %, 7 %, and 25 %, respectively, of the total clinker production in 1990. Prior to 2004, shaft kilns dominated China's cement industry, accounting for over half of the clinker production; they were gradually replaced by new precalciner kilns from 2005 to 2015. Currently, the precalciner kiln is the dominant kiln type in China, and the proportions of the other two types are negligible. In accordance with the transition of kiln types, the share of kilns with different design capacities also varied during the 1990–2015 period. The small-scale production lines (<2000 t clinker d−1), comprised mostly of shaft kilns, had a dominating role in the 1990–2000 period with a proportion exceeding 85 %, whereas the share of large-scale production lines (≥2000 t clinker d−1), majorly comprised of precalciner kilns, increased sharply afterwards, from 14 % in 2000 to 97 % in 2015.
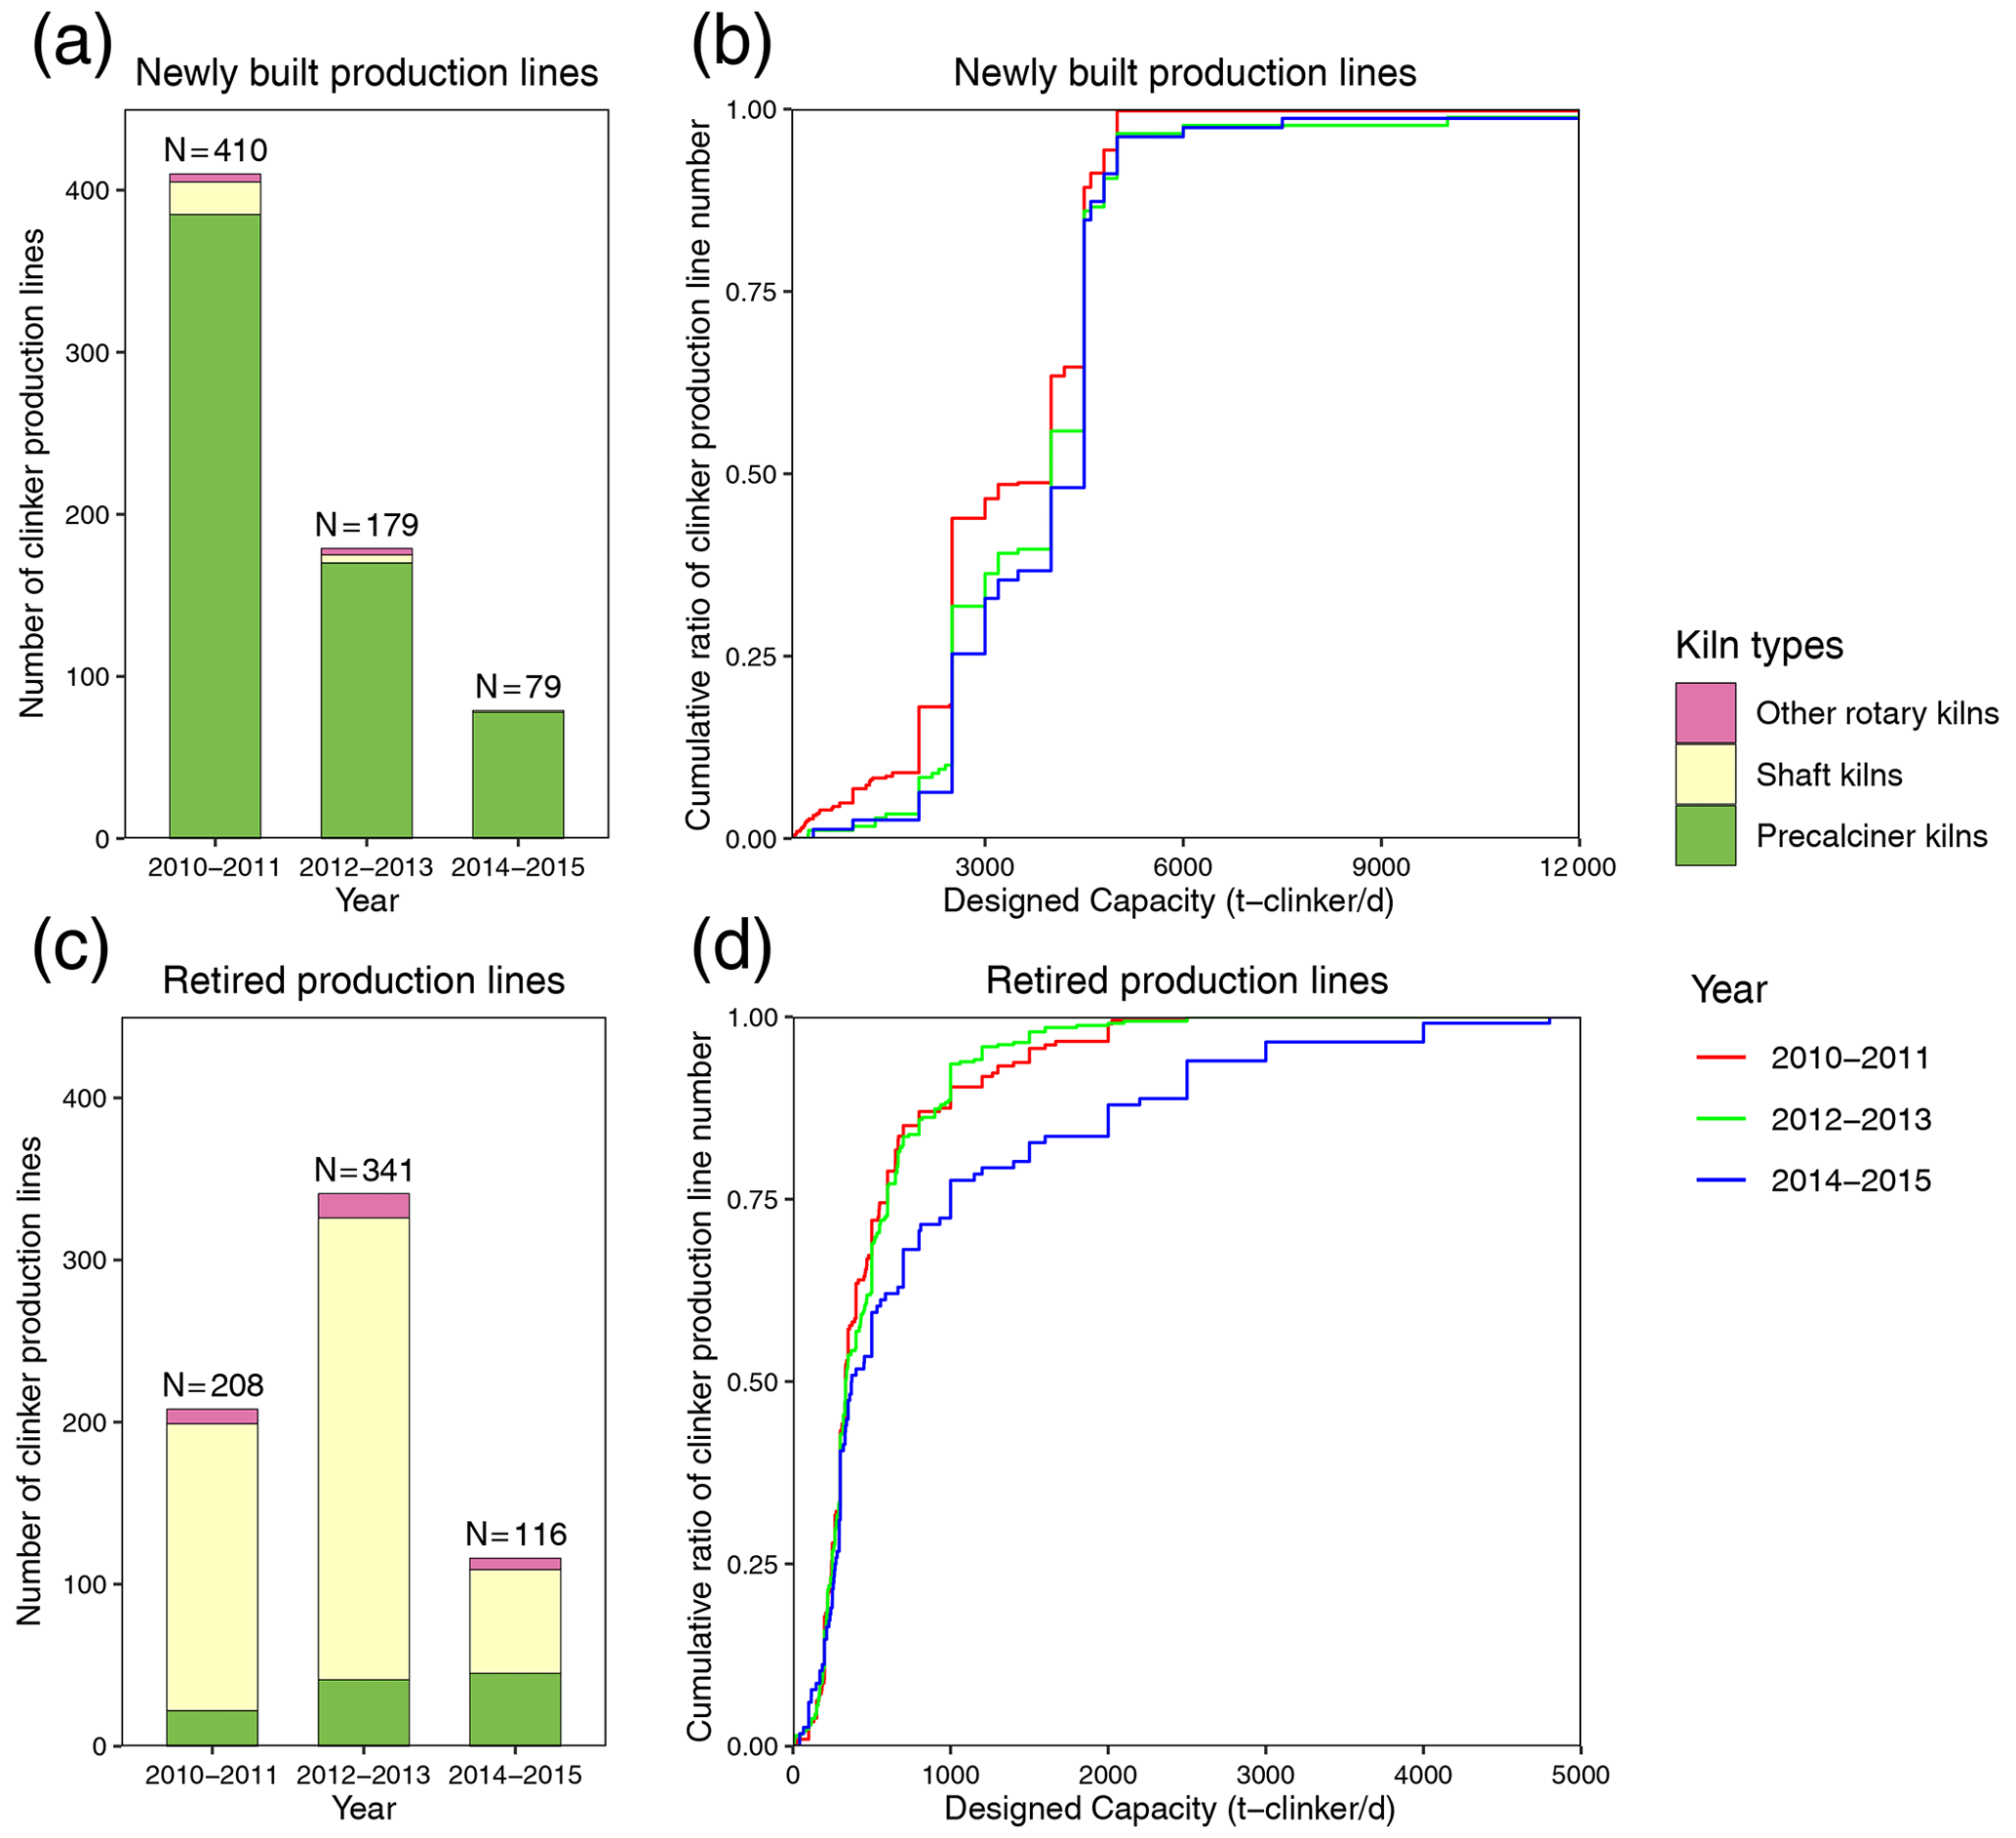
Figure 4Share of kiln types in newly built and retired production lines and cumulative ratio of unit number by capacity of the production lines.
To fulfill the rapidly growing demand for cement products and to achieve ever-stringent clean air targets at the same time, China's cement industry has undergone dramatic transitions in the production technology of cement kilns in recent years since 2010. Figure 4 shows the share of different kiln types in the newly built and retired production lines and the cumulative ratio of newly built and retired production lines by unit capacity. To draw the curve for the cumulative ratio, we summarized the number of production lines by capacity (t clinker d−1) and calculated the ratio to the total number of production lines, from which we derived the cumulative ratio for each level of capacity. Therefore, the cumulative ratio represents the share of production lines with the capacity below a certain level. During the 2010–2015 period, there were 688 newly built cement production lines of which the precalciner kilns had a dominant proportion of 95 %. In contrast, there were 665 retired cement production lines of which the shaft kilns had a majority proportion of 79 %. In response to energy conservation and emission reduction policies, the number of newly built production lines decreased, and the capacity of these newly built production lines increased year by year. On the other hand, the number of retired production lines reached a peak during 2012–2013, and the capacity reduction dramatically extended to the large-scale production lines during 2014–2015 and was likely driven by the implementation of the new emission standard of the cement industry (GB4915-2013) and the Clean Air Action Plan issued in 2013.
3.2 Emission trends
Table 6 and Fig. 5 summarize the historical emissions of gaseous species and particulate matter in China's cement industry from 1990 to 2015. During the 25 years, cement production increased dramatically by 10.3 times. During that time, the CO2, SO2, and NOx emissions from the cement industry increased by 627 %, 56 %, and 659 %, whereas the CO, PM2.5, and PM10 emissions decreased by 9 %, 63 %, and 59 %, respectively, indicating that significant technological transitions occurred in the past 25 years. As a major air pollution source in China, the cement industry contributed approximately 4 %, 7 %, 2 %, 9 %, 11 %, and 10 % of the national anthropogenic SO2, NOx, CO, PM2.5, PM10, and CO2 emissions (emissions from other sources were estimated by the Multi-resolution Emission Inventory for China, MEIC, model), respectively, in 2015.
Table 6Technological penetration, emission factors, and emissions of the cement industry in China during the 1990–2015 period.
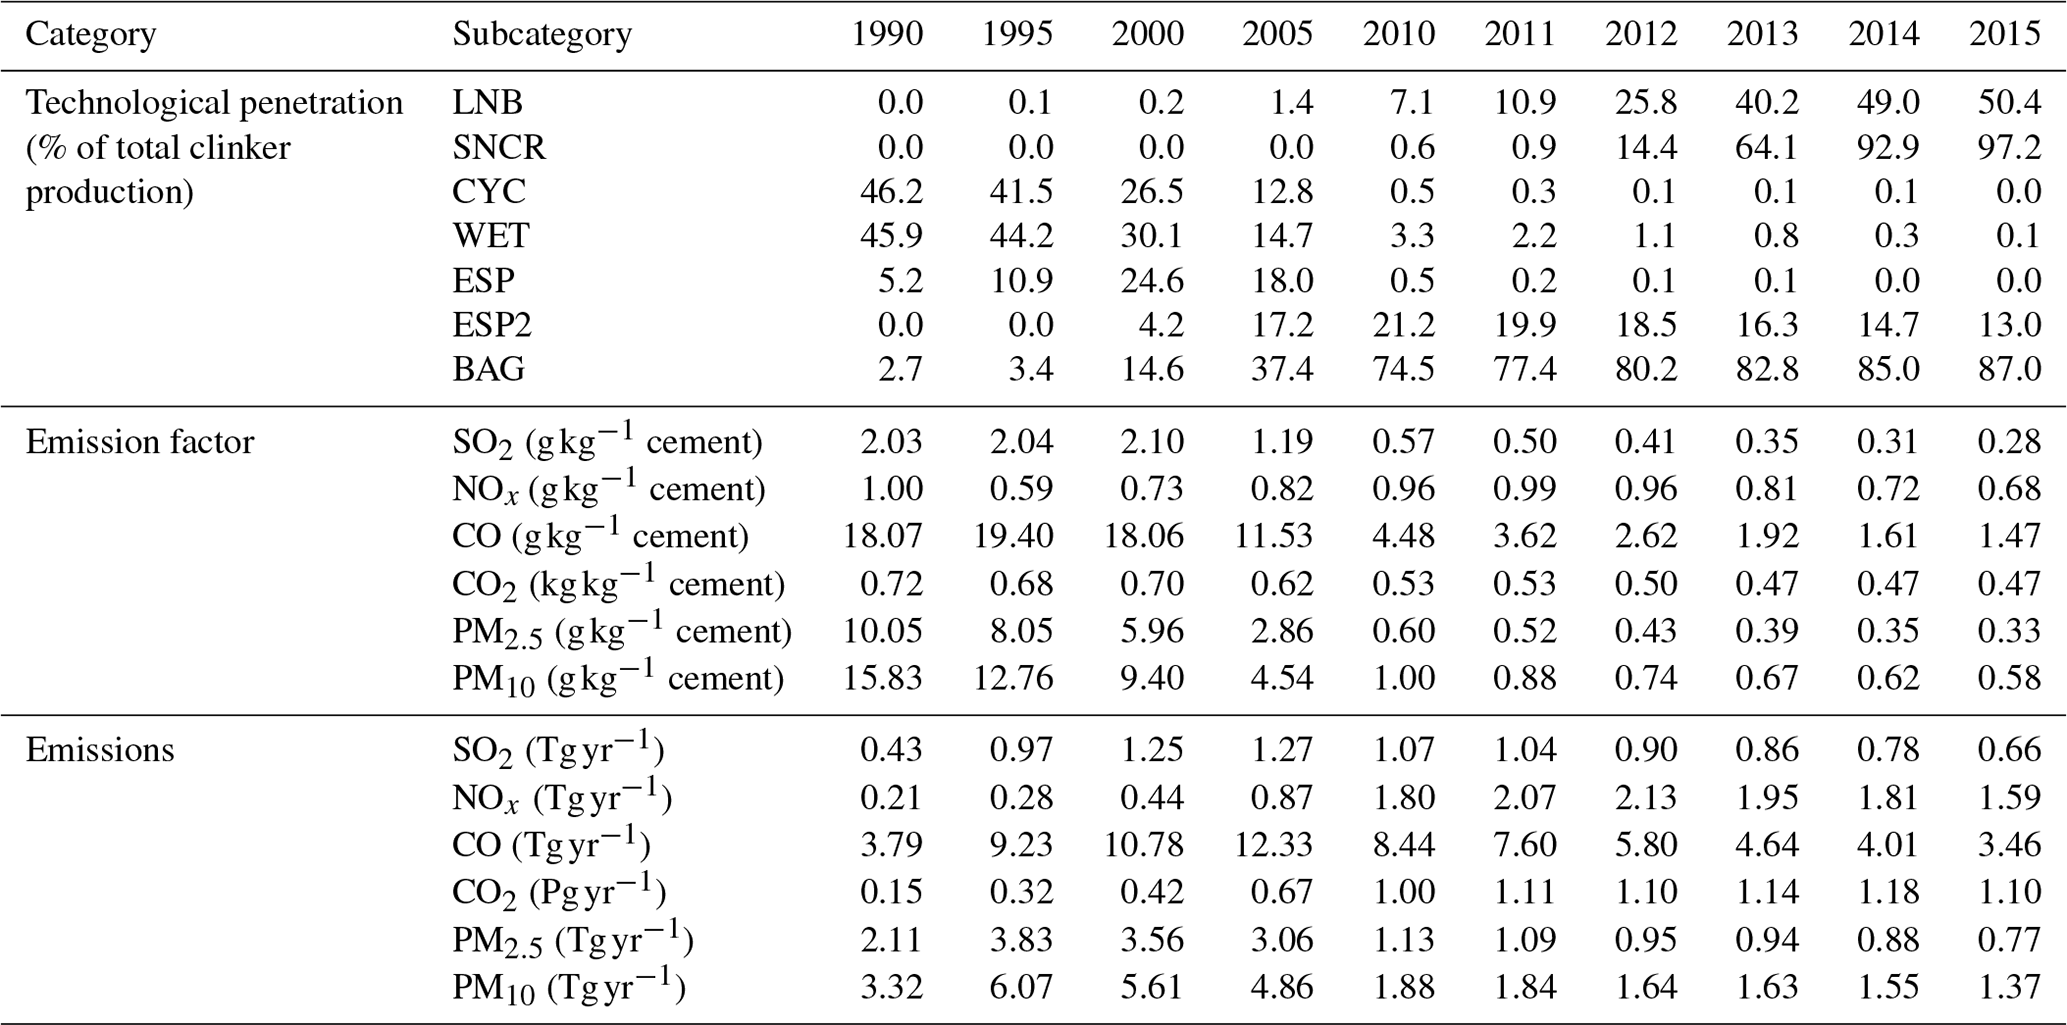
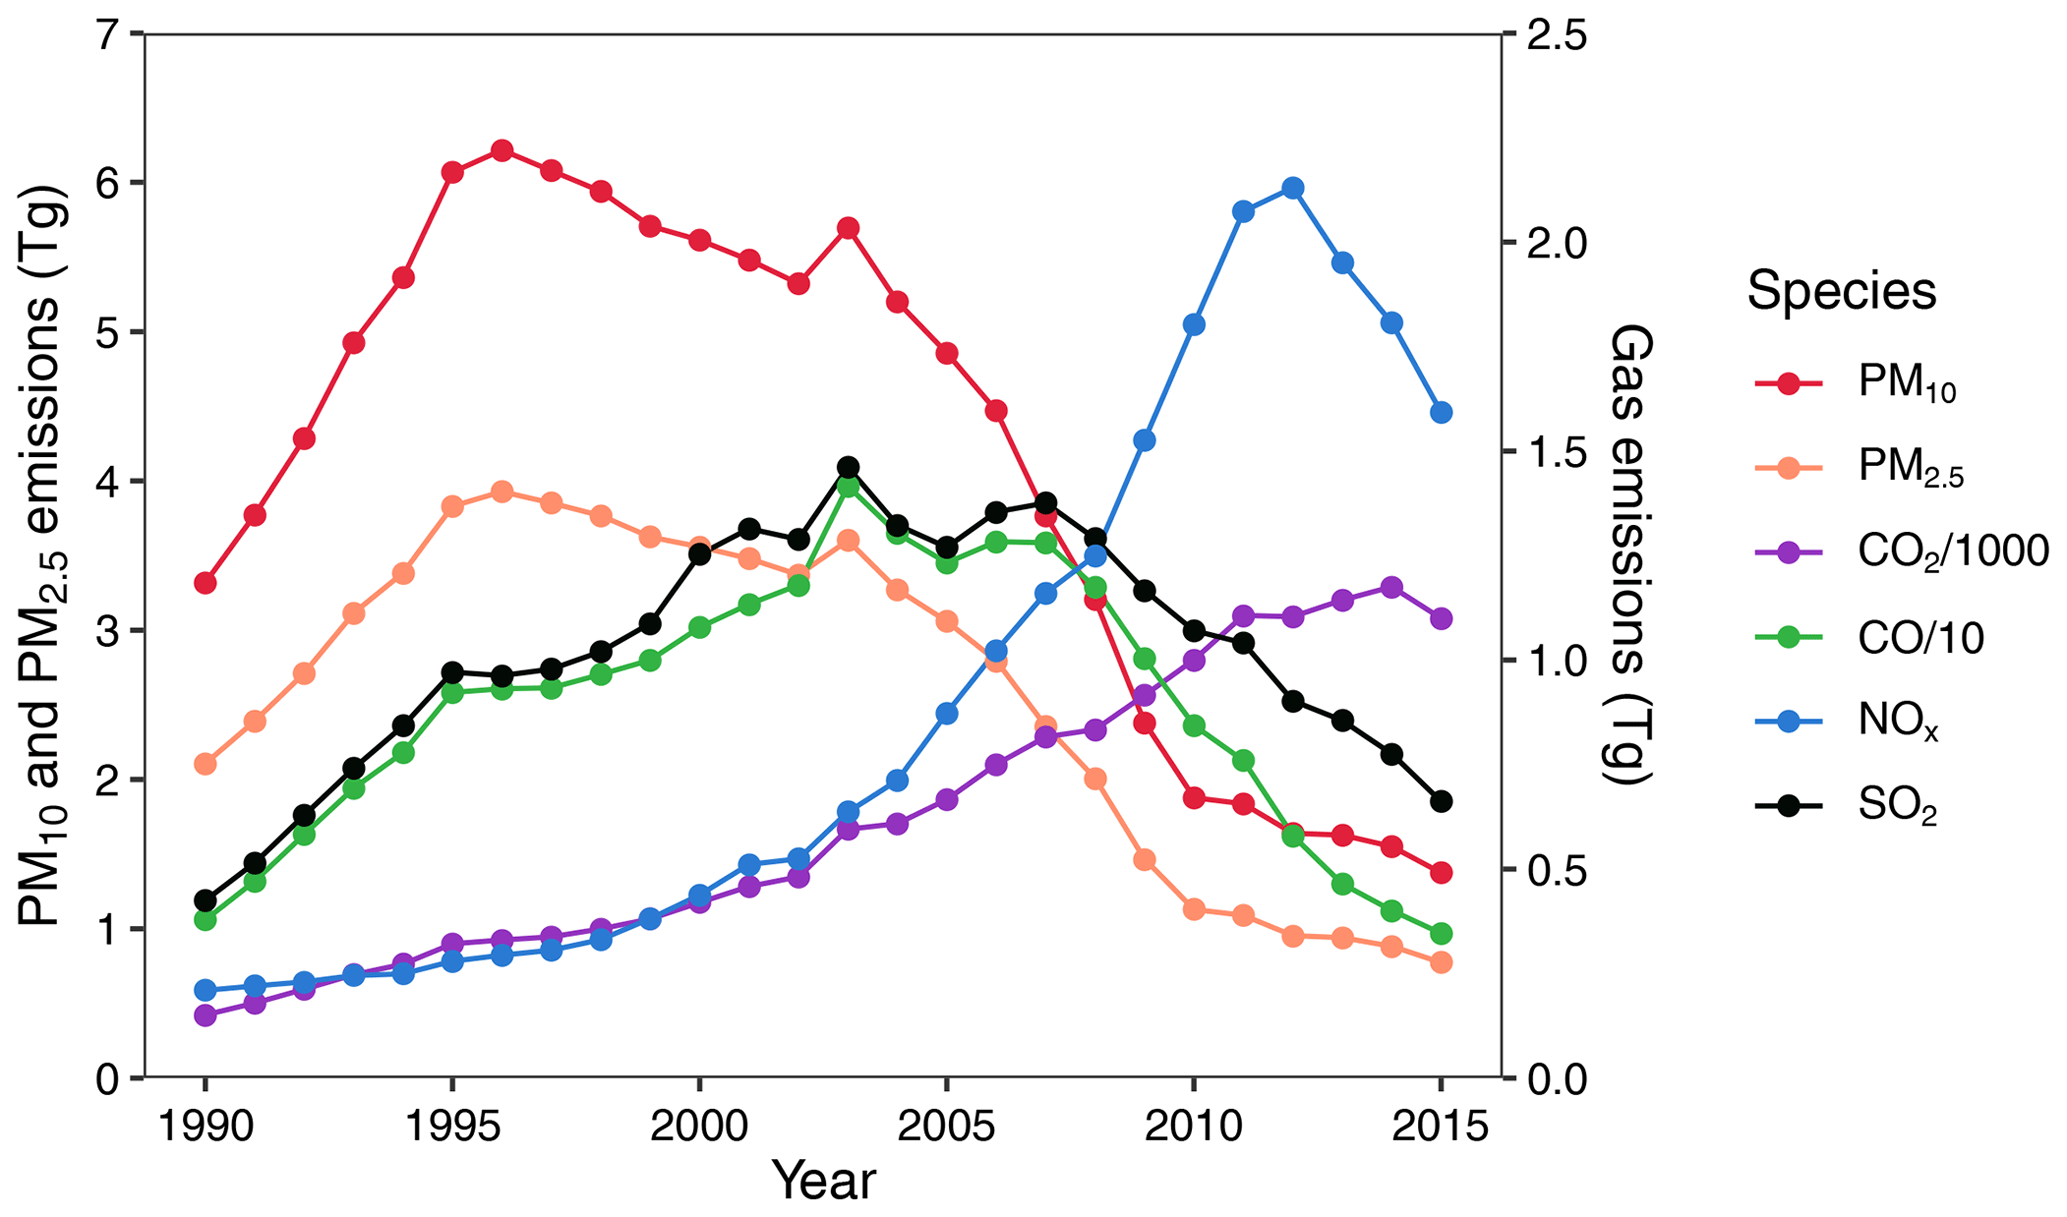
Figure 5Emissions of SO2, NOx, CO, CO2, PM2.5, and PM10 in China's cement industry from 1990 to 2015.
3.2.1 CO2 emissions
Figure 6 shows the historical CO2 process and fuel emissions in China's cement industry. The total emissions of CO2 increased in line with the growth of cement production. Driven by the 8.2-fold increase in clinker production from 1990 to 2014, the total CO2 emissions in China's cement industry increased from 0.15 to 1.18 Pg; then the CO2 emissions dropped to 1.10 Pg in 2015 as a result of the decrease in cement production (Fig. 5). The growth of CO2 emissions was slightly lower than that of clinker production due to the offset effect from improved energy efficiency. Over the whole period of 1990–2015, the CO2 process emissions increased from 77.7 to 694.2 Tg, i.e., by 7.9 times, which was consistent with the growth of clinker production, whereas the CO2 fuel emissions increased more slowly from 73.5 to 405.9 Tg, i.e., by 4.5 times, because the energy intensity of cement kilns decreased significantly at the same time (Fig. 6). During the 1990–2015 period, the energy intensity of precalciner kilns, shaft kilns, and the other rotary kilns decreased by 17 %, 16 %, and 27 %, respectively. As a result, the proportion of CO2 emissions from coal consumption also decreased from 49 % in 1990 to 37 % in 2015.
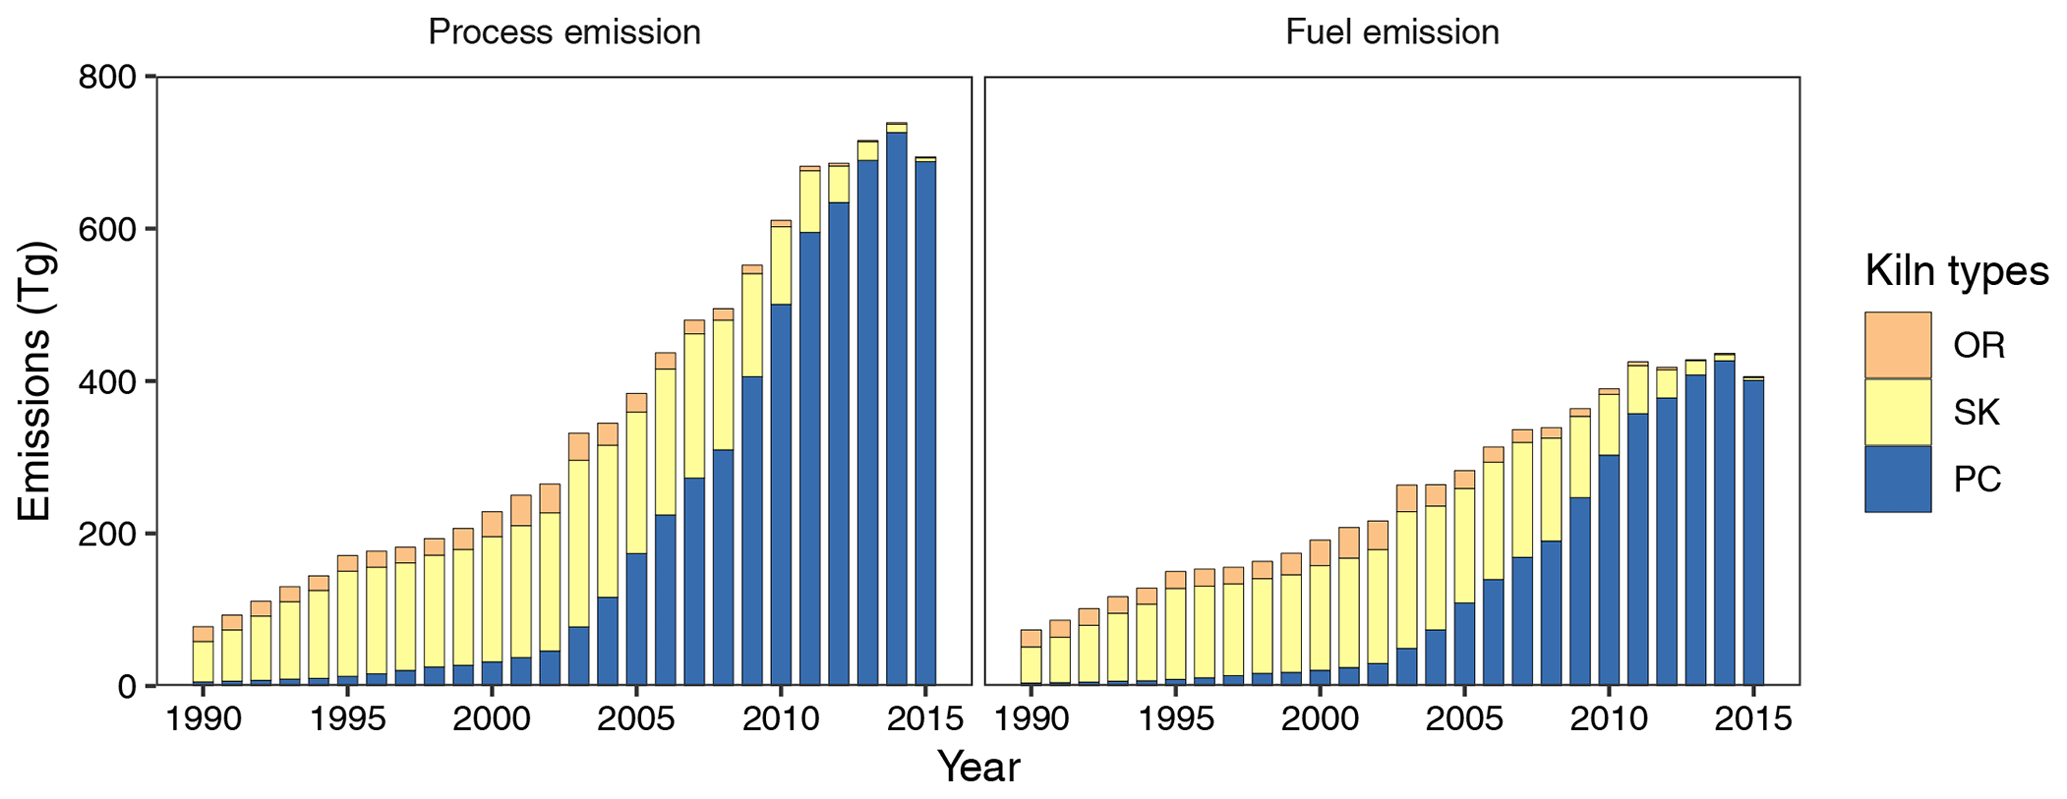
Figure 6Historical CO2 process and fuel emissions in China's cement industry from 1990 to 2015. The kiln types include the precalciner kilns (PCs), shaft kilns (SKs), and other rotary kilns (ORs).
3.2.2 Gaseous air pollutant emissions
Figure 7 presents the historical emissions of gaseous air pollutants, including SO2, CO, and NOx,, by different kiln types from 1990 to 2015. During the 1990–2003 period, the SO2 emissions increased from 0.43 to 1.46 Tg at an annual increasing rate of 10 % driven by the growth of cement production which was mainly manufactured in the highly polluting shaft kilns (Fig. 7). Then, the SO2 emissions decoupled with the increasing trend of cement production and decreased to 0.66 Tg in 2015. The emission decrease was due to the expanding technological transition from the old and polluting shaft kilns to the new and cleaner precalciner kilns which resulted in a much lower SO2 emission factor (Table 2). The CO emissions had a similar trend as the SO2 emissions.
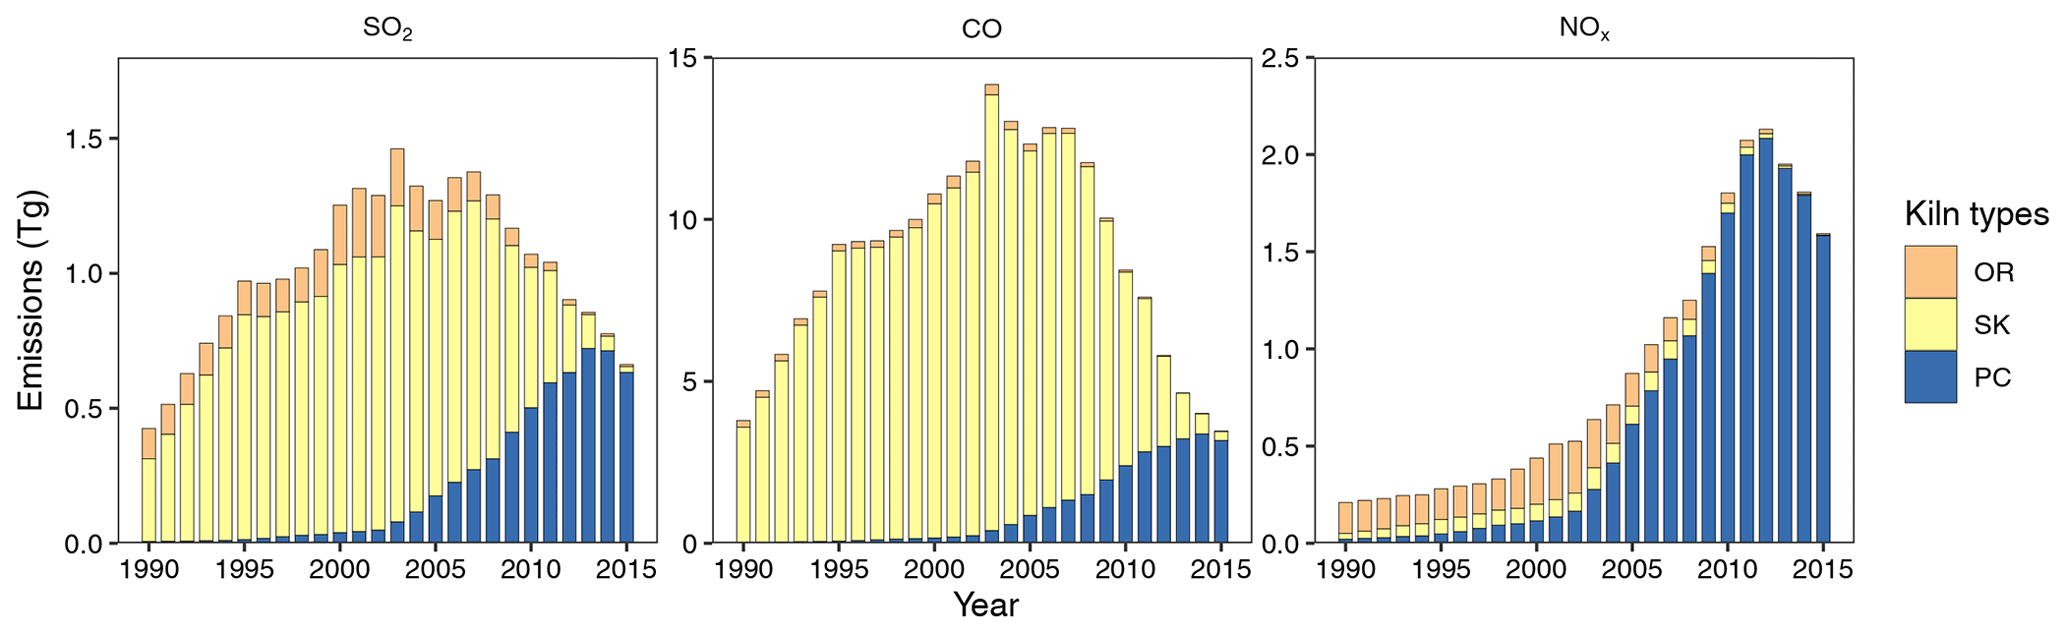
Figure 7Historical SO2, CO, and NOx emissions from different kiln types from 1990 to 2015. The kiln types include the precalciner kilns (PCs), shaft kilns (SKs), and other rotary kilns (ORs).
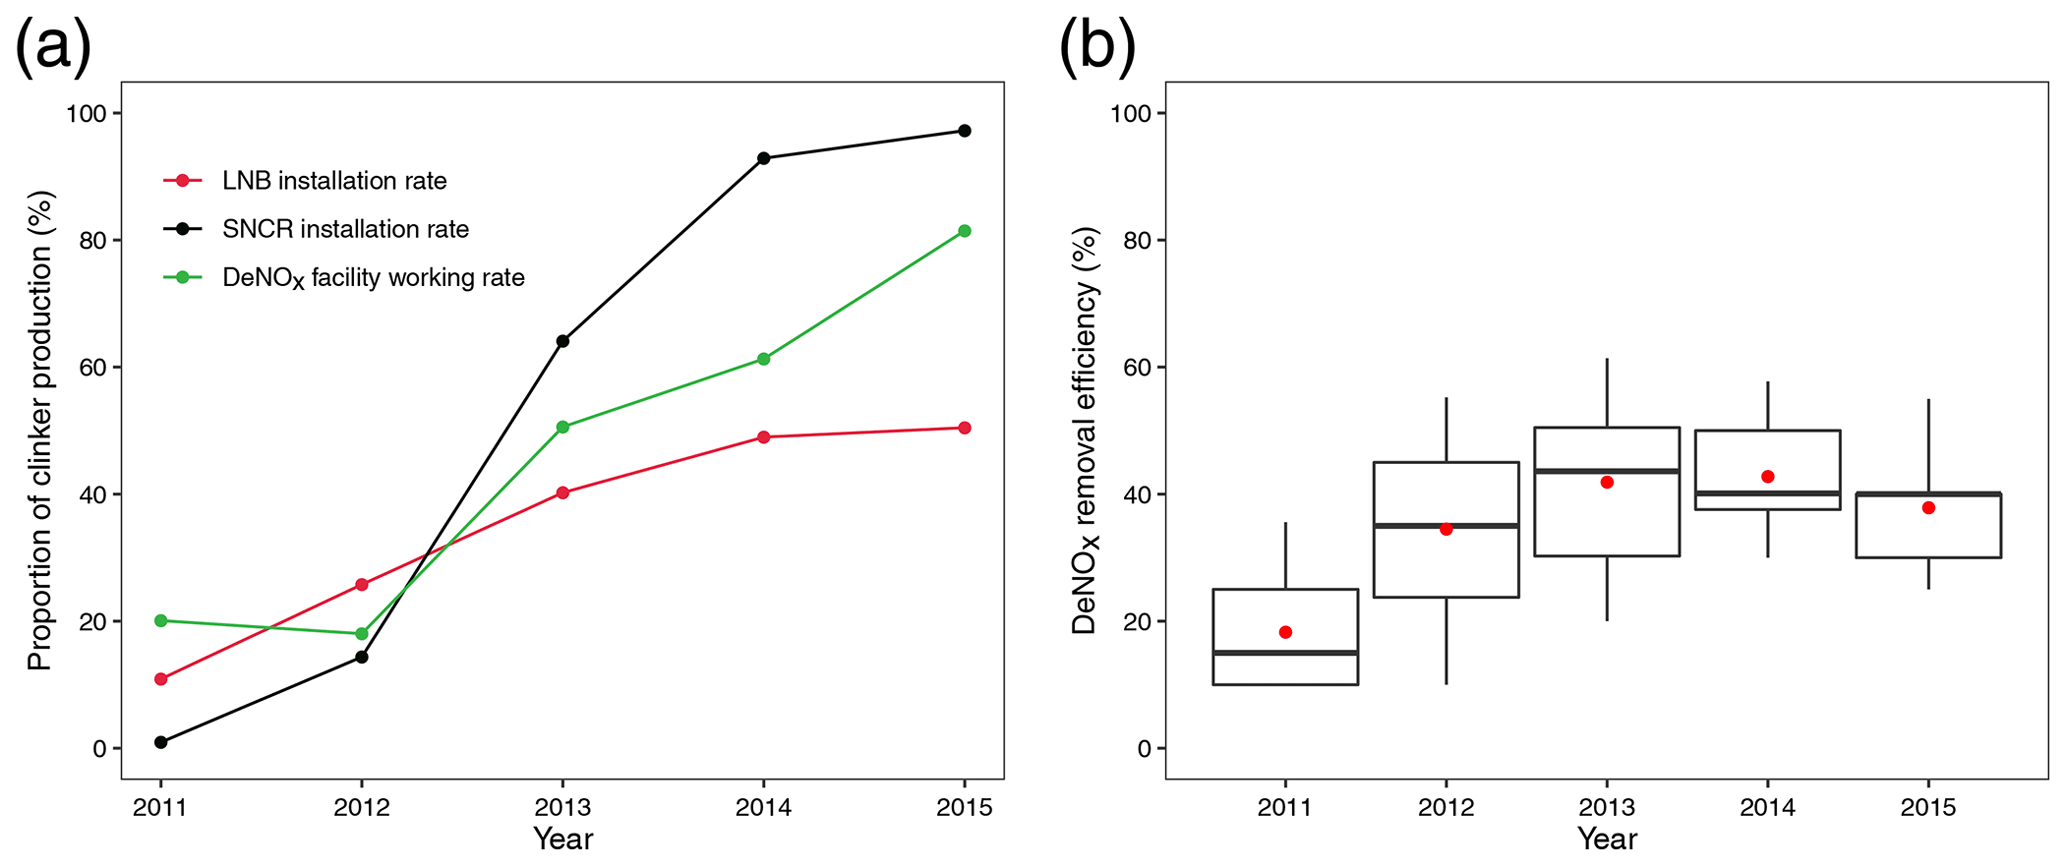
Figure 8The application proportion (of clinker production amount) of de-NOx technologies (LNB, SNCR) (a) and the average de-NOx removal efficiency of kilns in which the de-NOx facilities are working (b).
In contrast, the NOx emissions exhibited a longer period of growth than other gaseous pollutants. In the 1990s, the NOx emissions gradually increased at an annual growth rate of 7 % with the increase in cement production which was mainly manufactured in the shaft kilns and other rotary kilns. Since 2003, the rapid growth of cement production and the wide promotion of precalciner kilns to substitute the shaft kilns have accelerated the growth of NOx emissions from the cement industry because the precalciner kilns have a higher NOx emission factor under a higher operation temperature (Table 2). As a result, the NOx emissions increased sharply from 0.64 Tg in 2003 to 2.13 Tg in 2012, i.e., by 235 %. During the 2011–2015 period, the 12th FYP required a national target of reducing NOx emissions by 10 %, which promoted the wide installation of LNB and SNCR devices in the cement industry (Fig. 8). In 2011, only 11 % and 1 % of the clinker was manufactured in kilns equipped with LNB and SNCR facilities, whereas by 2015, the percentages sharply increased to 50 % and 97 %. However, the actual operation condition of the de-NOx facilities was far from satisfactory. In 2011, among all cement kilns equipped with LNB or SNCR devices, only 20 % of the clinker was produced under normal operating conditions of de-NOx devices, and in 2015, the percentage increased to 81 %. Meanwhile, with technological improvements and a wider application of the de-NOx technologies, the national average NOx removal efficiency increased during the 5 year period and remained relatively stable at 38 %–43 %.
3.2.3 Particulate matter emissions
Figure 9 depicts the PM2.5 and PM10 emissions by different processes, including clinker calcination (precalciner kilns, shaft kilns, and the rotary kilns), cement grinding, and fugitive emissions. The respective PM2.5 and PM10 emissions decreased from 2.11 and 3.32 Pg in 1990 to 0.77 and 1.37 Pg in 2015, with two peaks occurring in 1996 and 2003 due to the combined effects of cement demand growth and environmental policies. The estimated PM emission trend from 1990–2008 was consistent with that reported in our previous study (Lei et al., 2011a). From 1990 to 1995, PM emissions increased rapidly, driven by the growth of cement production. The decline of PM emissions after 1996 was due to the implementation of the new emission standards for the cement industry issued in 1996 (GB4915-1996; Table S1) and the slowing down of the economy during the Asian financial crisis. Then there was a rebound of PM2.5 emissions in 2003 which was driven by a short-term increase in clinker to cement ratio in that year (Fig. 2). Afterwards, despite a continuous increase in cement production at an annual growth rate higher than 10 %, the PM emissions kept a downward trend. The decrease was due to the nationwide replacement of the shaft kilns with precalciner kilns and the application of high removal efficiency PM control technologies, such as high-efficiency ESP and bag filters. During the 2003–2015 period, the Chinese government successively issued two versions of the air pollutant emission standard for the cement industry (GB4915-2004, GB4915-2013) which promoted the technological transition of cement production and PM control in China's cement industry.
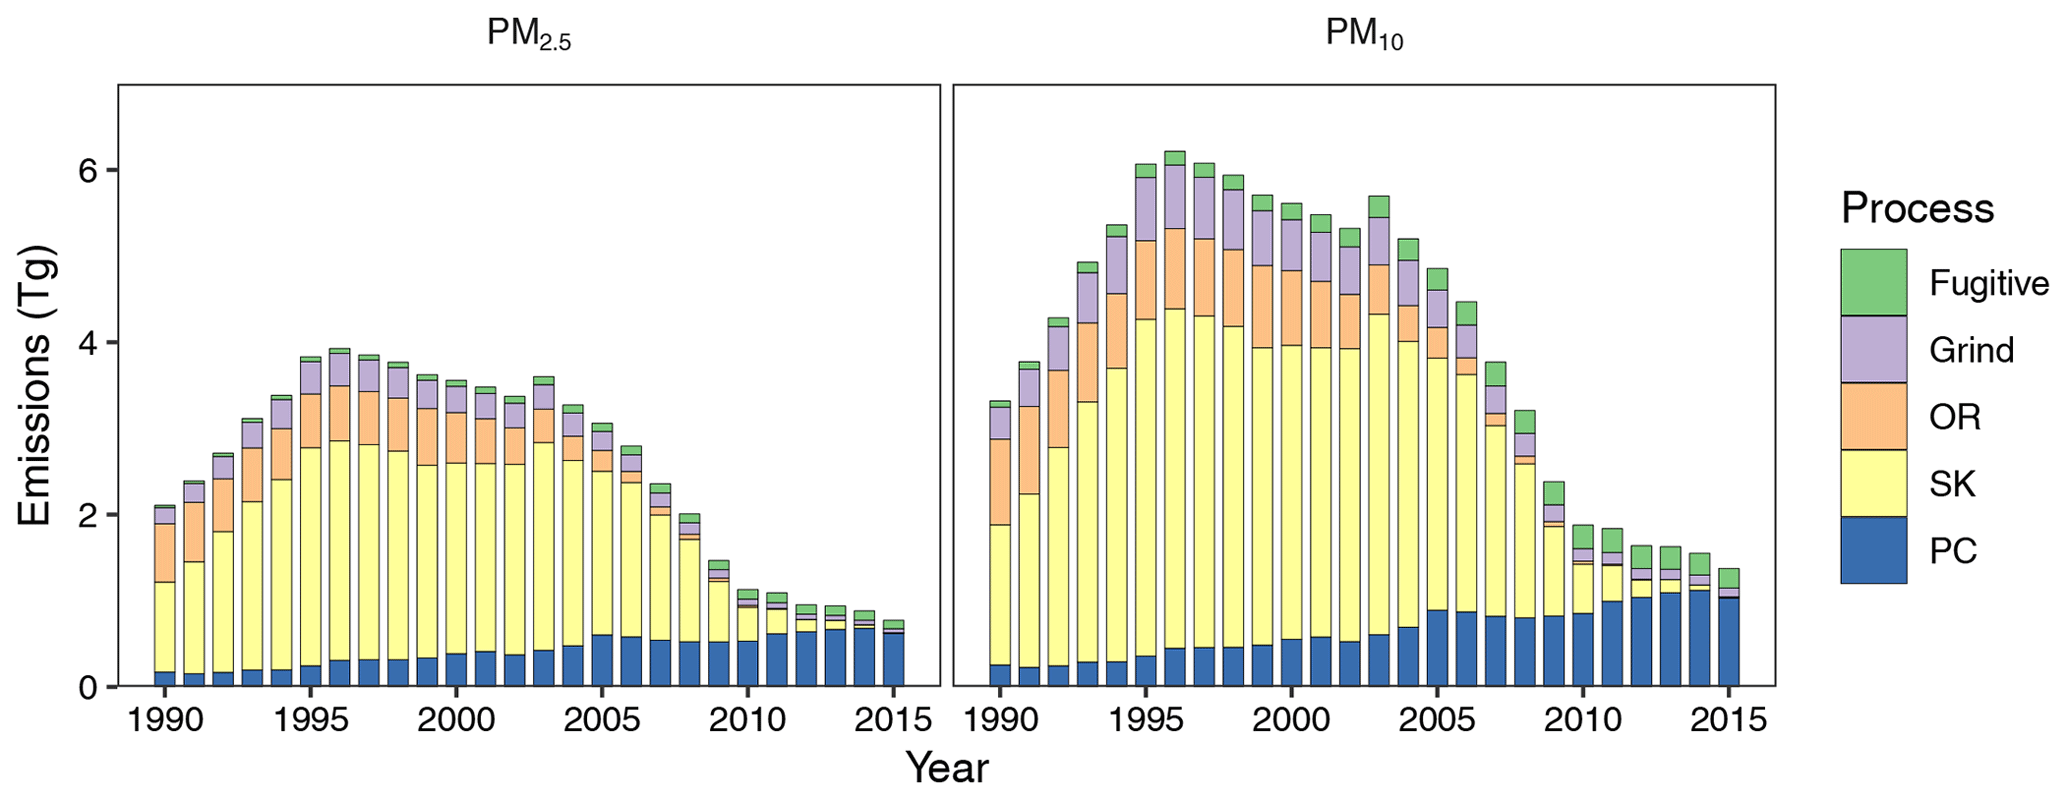
Figure 9Historical PM2.5 and PM10 emissions from different processes from 1990 to 2015. The kiln types include the precalciner kilns (PCs), shaft kilns (SKs), and other rotary kilns (ORs).
The contribution from different processes to the total PM emissions changed significantly during the 25 years. In 1990, the polluting shaft kilns had the largest contribution to PM emissions, followed by other rotary kilns and the cement grinding process. In 2015, the emissions from the precalciner kilns were the largest contributor, followed by fugitive emissions and cement grinding processes. The PM emissions from rotary kilns and shaft kilns in 2015 were negligible. Over the whole study period, the contribution of organized emissions from clinker calcination and the cement grinding process was sharply reduced by the implementation of improved PM control technologies, whereas the contribution of unorganized fugitive emissions gradually occupied a larger proportion, from 2 % to 17 % for PM10 and from 1 % to 13 % for PM2.5, indicating the necessity of more policy arrangements targeting fugitive emissions in China's cement industry.
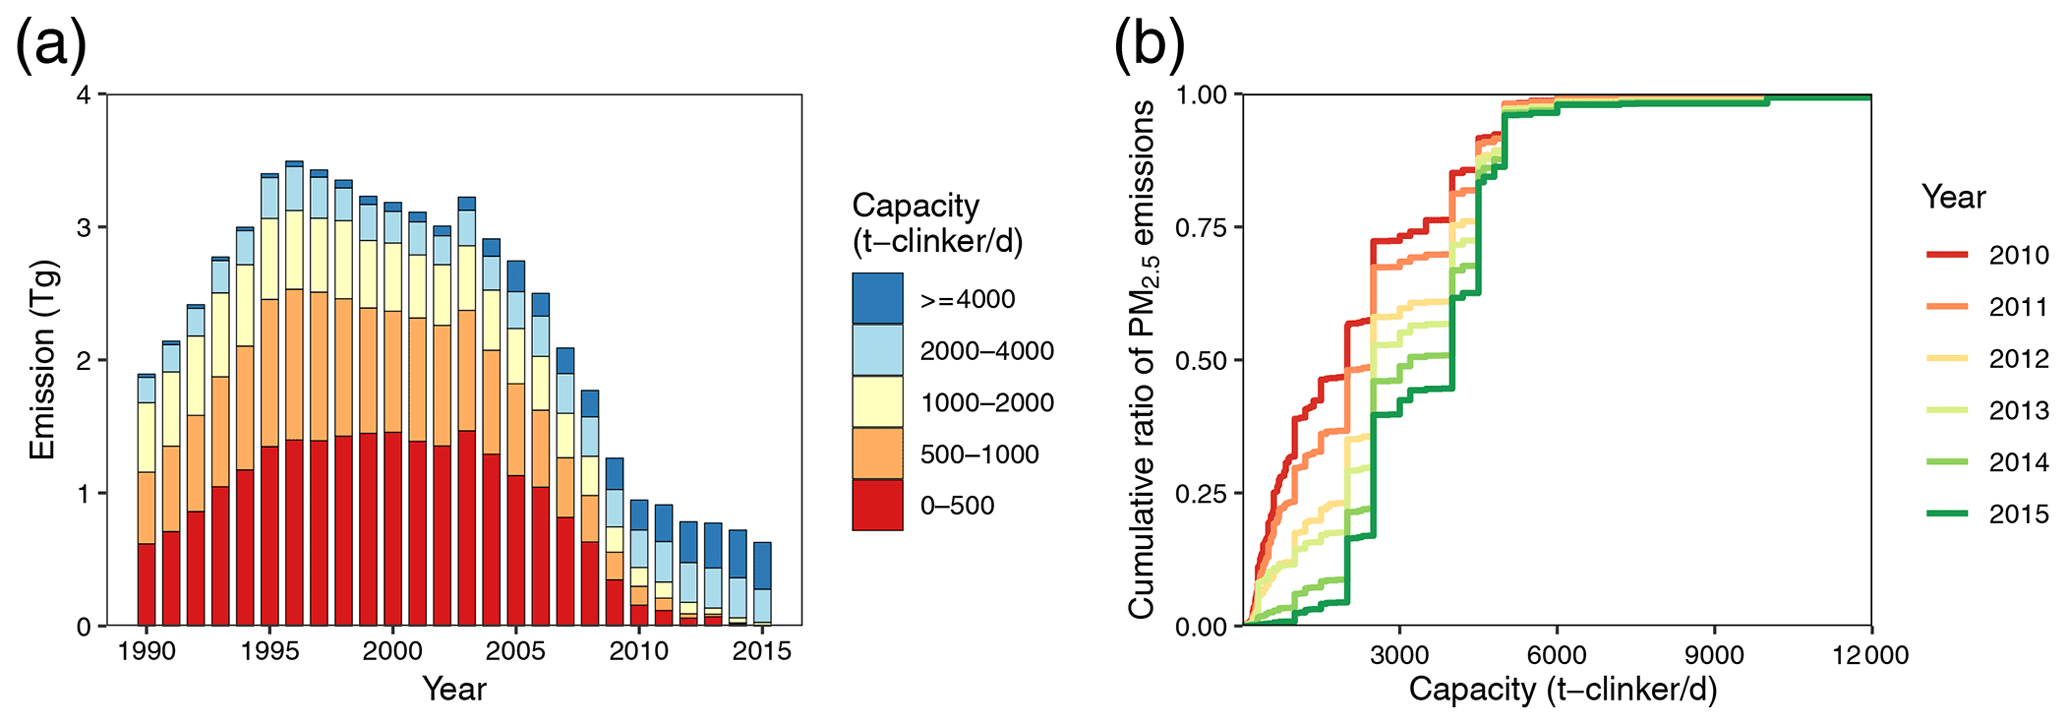
Figure 10Historical PM2.5 emissions from the clinker calcination process by capacity (a) and cumulative ratio of PM2.5 emissions by capacity of the production lines during the 2010–2015 period (b).
Figure 10a further shows the historical PM2.5 emissions from the clinker calcination process by production capacity. Prior to 2003, the small-scale producers (<2000 t clinker d−1) dominated the emissions of China's cement industry with an average contribution of 90 % due to their leading roles in clinker production (Fig. 3) and the inefficiency of PM control technologies. After 2003, driven by the rapid development of new precalciner kilns, the share of small-scale production lines gradually declined (Fig. 3). However, a considerable fraction of PM2.5 emissions were still disproportionately produced by a small fraction of clinker production. Figure S4 in the Supplement presents the PM control technology's penetration in production lines by different clinker production capacities and the proportion of different capacity producers relative to the number of production lines, clinker production, and PM2.5 emissions in 2010 and 2015. In 2010, the small production lines (<500 t clinker d−1) only represented 7 % of the clinker production but were responsible for 17 % of the PM2.5 emissions because more than 20 % of the production lines were still equipped with the outdated cyclone or wet scrubbers to reduce PM emissions (Fig. S4A). In 2013, the emission standard for air pollutants was strengthened to fulfill the targets under the Clean Air Action Plan (GB 4915-2013), which accelerated the phaseout of the small and outdated capacity and the transition of bag filters to meet the latest emission legislation. By 2015, 68 % of the clinker was produced in the cement kilns with a capacity that exceeded 4000 t clinker d−1, and the overall penetration rate of the bag filters to the clinker output reached 87 % (Fig. S4B). Figure 10b shows the changing routes of PM2.5 emission distribution in production lines sorted by clinker production capacity. Overall, during the 2010–2015 period, the contribution of small capacity producers to the total PM2.5 emissions decreased significantly, and the proportion of large capacity producers gradually increased as a result of the rapid evolution of production technology in China's cement industry during recent years.
3.2.4 Unit-level emissions
Figure 11 shows the unit-level PM2.5 and NOx emissions during clinker calcination in production lines by capacity in 2010 and 2015, which highlights the most polluting production lines whose emission intensity is over the 90th percentile values of the emission intensity defined as the emissions per unit of capacity. During 2010–2015, dramatic changes had taken place in China's cement industry. In 2010, there were over 2400 cement production lines, in which PCs had a share of 54 % in terms of the number of production lines, followed by SKs with a considerable share of 44 %. Typically, the SKs had smaller capacities and older ages, which were majorly within the range of 100–1000 t clinker d−1 and which started to operate before 2000 but made substantial contributions to PM2.5 emissions. In 2010, nationwide, 39 % and 31 % of the PM2.5 and NOx emissions were produced by 3 % and 15 % of the total capacity, indicating the disproportionately high emissions from a small number of the super-polluting units. Specifically, the super-polluting units for PM2.5 were dominated by SKs, whereas the super-polluting units for NOx were majorly PCs. In 2015, driven by the rapid replacement of traditional SKs with PCs and the elimination of small-scale production lines, the disproportionalities were alleviated compared to the situation in 2015. Allowing for the dominant role of PC in China's cement industry since 2015, future mitigation should focus on the control of cement demand growth, improvement of energy efficiency, and implementation of high-efficiency end-of-pipe emission control devices.

Figure 11Unit-level PM2.5 and NOx emissions during clinker calcination in production lines by capacity in 2010 and 2015. The black lines and gray shades illustrate the production lines whose emission intensity is over the 90th percentile values of the emission intensity defined as the emissions per unit of capacity.
3.3 Provincial distribution of emissions
Figure 12 shows the provincial distribution of the clinker production and emissions of CO2, SO2, CO, NOx, and PM2.5 from China's cement industry in 2015. Anhui was the leading province with respect to CO2 and air pollutant emissions due to its prominent role in clinker production nationwide. In 2015, the clinker output in Anhui was 136 Tg, accounting for 10 % of the national total, whereas the cement output in Anhui was only 132 Tg (5.6 %). The overall clinker to cement rate in Anhui was 1.03, while the national clinker to cement rate was only 0.57, indicating that Anhui exports a large amount of clinker to other provinces (Liu et al., 2018; Shan et al., 2019). At the same time, it bears a heavier burden of emissions and air pollution from the cement industry than other provinces. In addition to Anhui, Guangdong, Sichuan, Henan, Shandong, and Guangxi were also important provinces for clinker production and emissions. The total emissions of the above six provinces contributed 40 %, 36 %, 39 %, and 38 % of CO2, PM2.5, NOx, and SO2 emissions, respectively, driven by a 40 % share of the national total clinker production. In general, the provincial contribution of CO2 emissions was consistent with the provincial clinker production, but the provincial contribution of air pollutants was not always consistent. For example, Sichuan, Guizhou, Guangxi, and Chongqing were the first four largest provinces with respect to SO2 emissions, together contributing 36 % of the national total, but they were not the first four leading provinces of clinker output because the sulfur content of coal in these four provinces was much higher than that in other provinces. Regarding PM2.5 and NOx emissions, the variation in the penetration of end-of-pipe control technologies was another crucial factor in determining the differences in emissions. For example, Yunnan was the sixth largest province with respect to NOx emissions but with only moderate clinker output in 2015 since the average NOx removal percentage achieved by LNB and SNCR devices was only 13 % in Yunnan, much lower than the national average of 30 %.
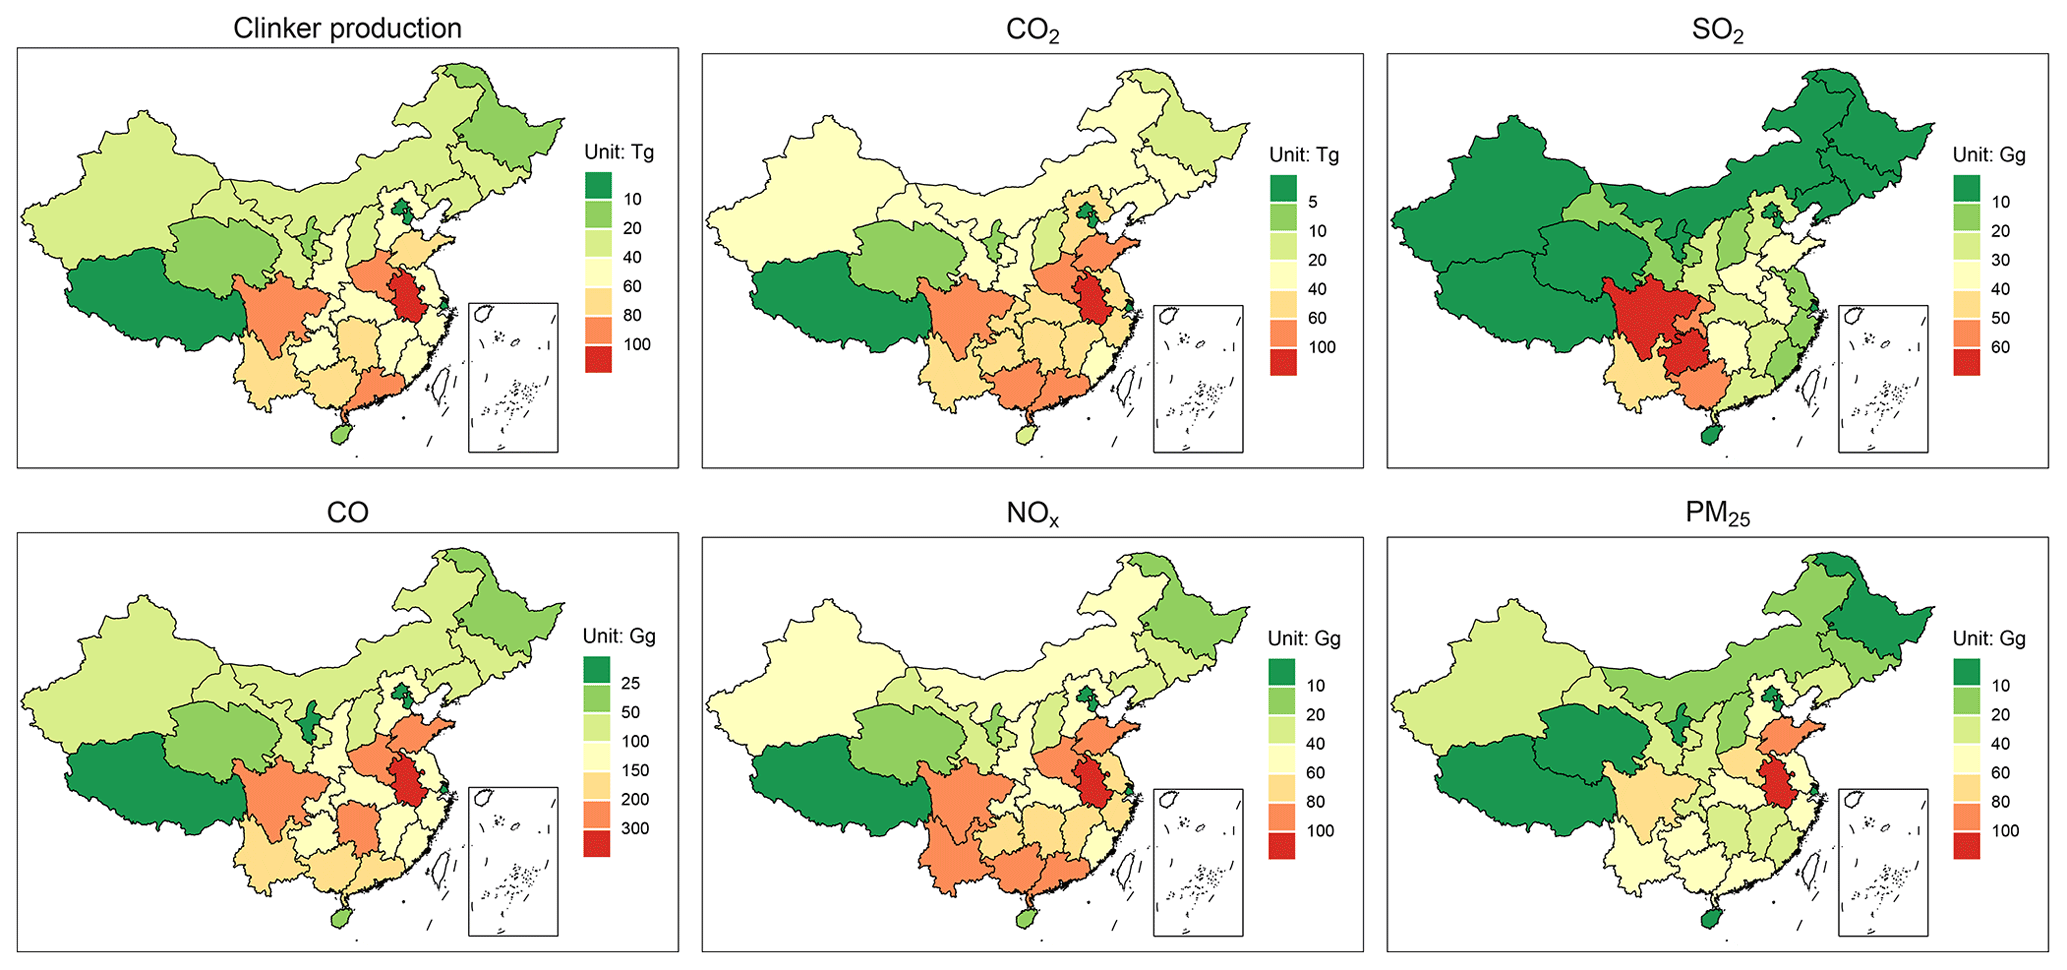
Figure 12Provincial clinker production and CO2, SO2, CO, NOx, and PM2.5 emissions from China's cement industry in 2015.
3.4 Drivers to changes in emissions
The trends in SO2, NOx, PM2.5, and CO2 emissions are affected by a variety of factors. As shown in Fig. 13, the growth of cement production continuously contributed to the increase in CO2 and air pollutant emissions. The evolution of cement production technology from the shaft kilns to precalciner kilns has led to the dramatic decrease in SO2 emissions but contributed to the increase in NOx and PM2.5 emissions since the precalciner kilns have higher NOx and PM2.5 emission factors than the shaft kilns. The decrease in energy intensity would decrease the coal-use demand per unit cement output, and the reduction of clinker to cement ratio would result in lower demand of coal and limestone, which both contributed to a continuous decrease in air pollutant and CO2 emissions. The reduction of sulfur content in coal was helpful in reducing SO2 emissions. Prominently, the end-of-pipe control measures were the major driver of the remarkable decline of PM and NOx emissions. Overall, however, the SO2, NOx, and CO2 emissions were still 56 %, 659 %, and 627 % higher than the levels in 1990. Further steps including implementation of energy efficiency measures and promotion of high-efficiency SO2 and NOx removal technologies are crucially needed to effectively reduce the emissions from the cement industry.
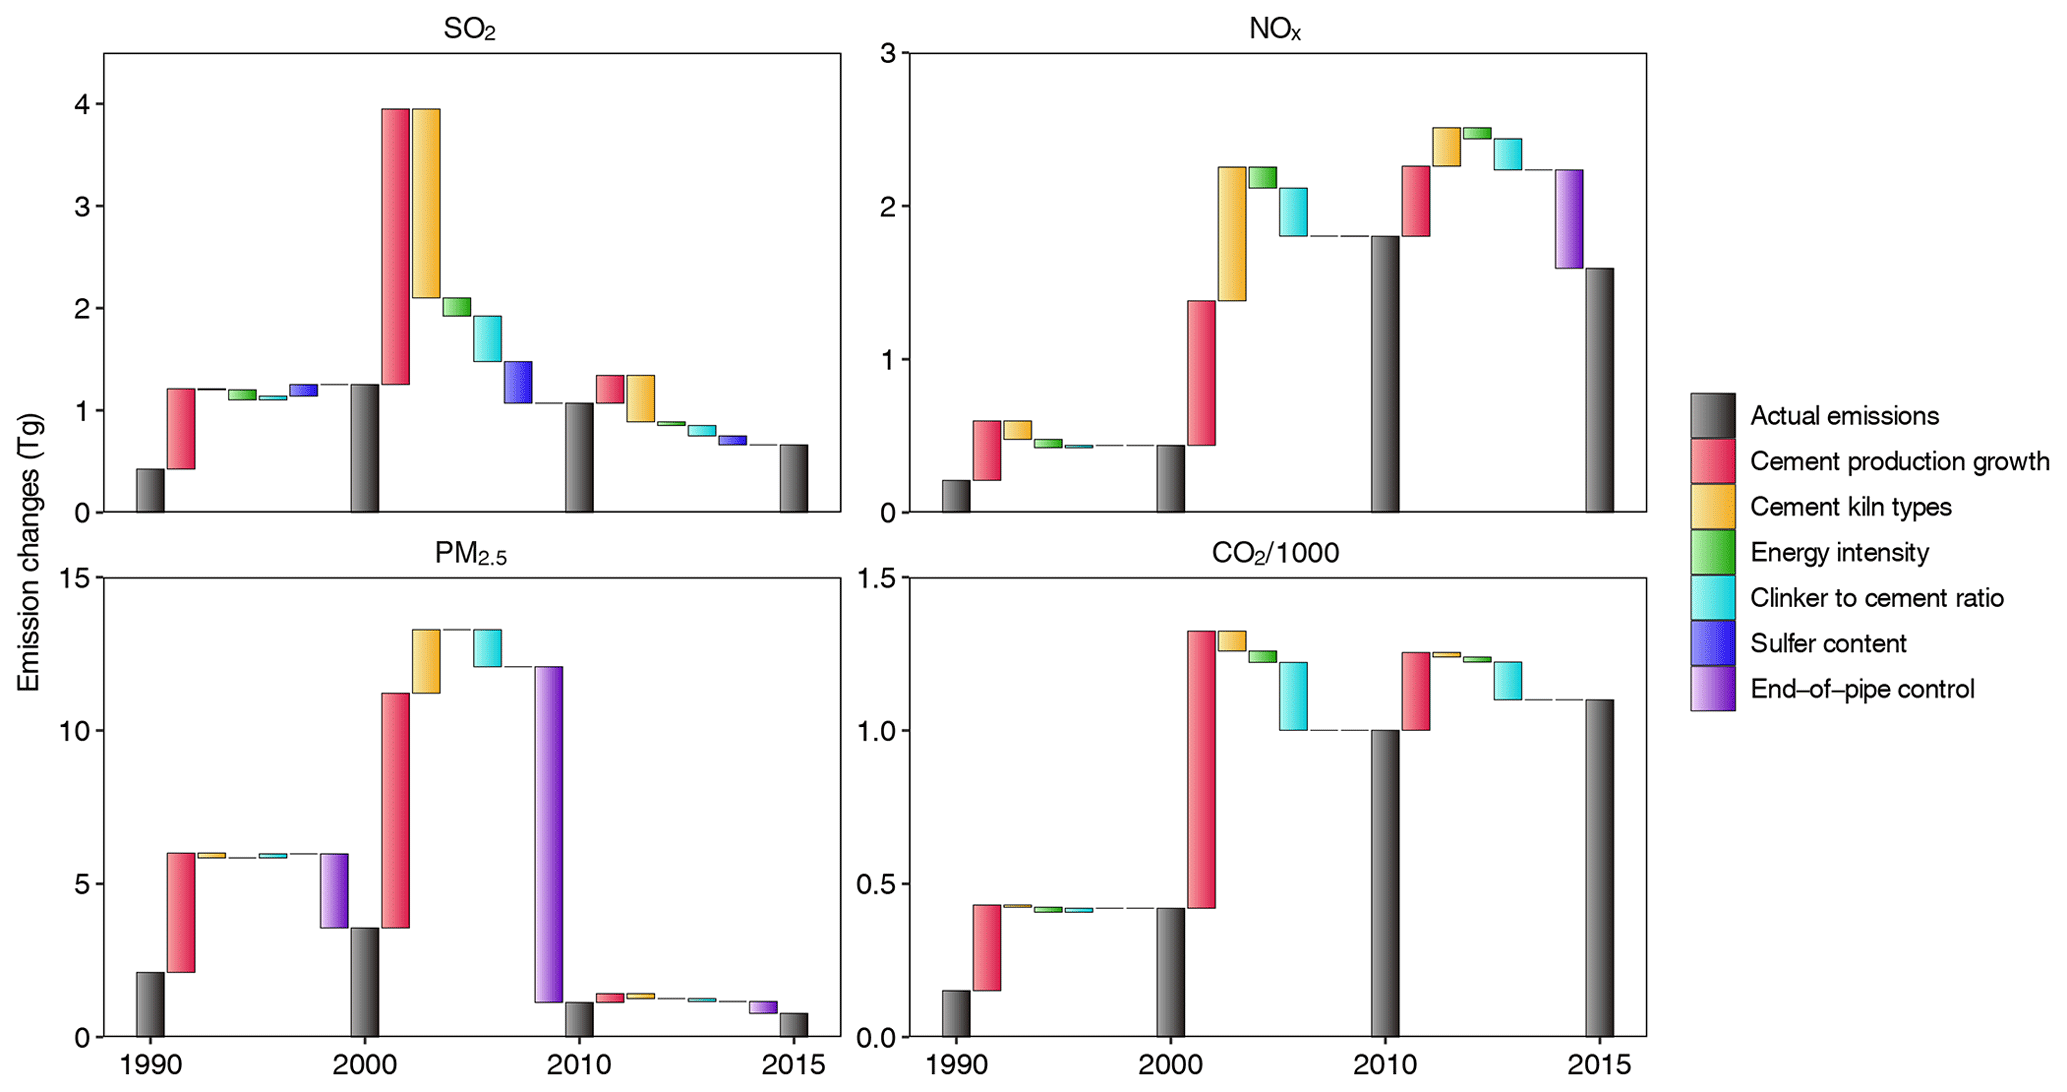
Figure 13Contribution of factors to the national emission changes in SO2, NOx, PM2.5, and CO2 during 1990–2015.
4.1 Uncertainty analysis
The uncertainties of the emission estimation in the study were quantified at both national and unit levels. We overlaid the uncertainty ranges of the national estimation in Figs. 14 and 15 with the emission estimates from various studies. Based on the 10 000 Monte Carlo simulations, the average uncertainty ranges of the national estimates were −27 % to 30 %, −20 % to 21 %, −18 % to 19 %, −12 % to 14 %, −20 % to 22 %, and −16 % to 17 % for SO2, NOx, CO, CO2, PM2.5, and PM10, respectively, in 2015. The uncertainties arising from clinker and cement production and coal consumption contributed to the uncertainties of all species. The uncertainty of SO2 emissions was primarily contributed by the uncertainties from the sulfur content of coal, sulfur retention in ash, and the sulfur absorption rates of clinker during calcination, whereas the sources of the uncertainties for NOx and PM emissions were dominated by uncertainties in the unabated emission factors and the removal efficiency of technologies. During 1990 and 2015, the respective uncertainty ranges of SO2, NOx, CO, CO2, PM2.5, and PM10 emissions had significantly decreased (Figs. 14 and 15), denoting the accuracy improvements from the input data. During the 2010–2015 period, the unit-level information on activity and control technologies was directly obtained from the MEE database, whereas for the past years, extrapolations and assumptions were made on the transition of activities, emission factors, technological penetration, and efficiencies, which resulted in higher uncertainties. In particular, for the PM2.5 and PM10 emissions, the uncertainty ranges shrunk significantly after 2010 since the wide application of high-efficiency bag filters with lower uncertainty was assumed to effectively reduce the rise of PM emissions, and the increase in fugitive emissions was much lower than the decrease in other process emissions. Our estimation of the uncertainty ranges was comparable with the recent united-based emission inventory of China's power plants (F. Liu et al., 2015) and the iron and steel industry (Wang et al., 2019) but was significantly narrower compared to previous studies relying only on statistics (Zhao et al., 2011, 2017).
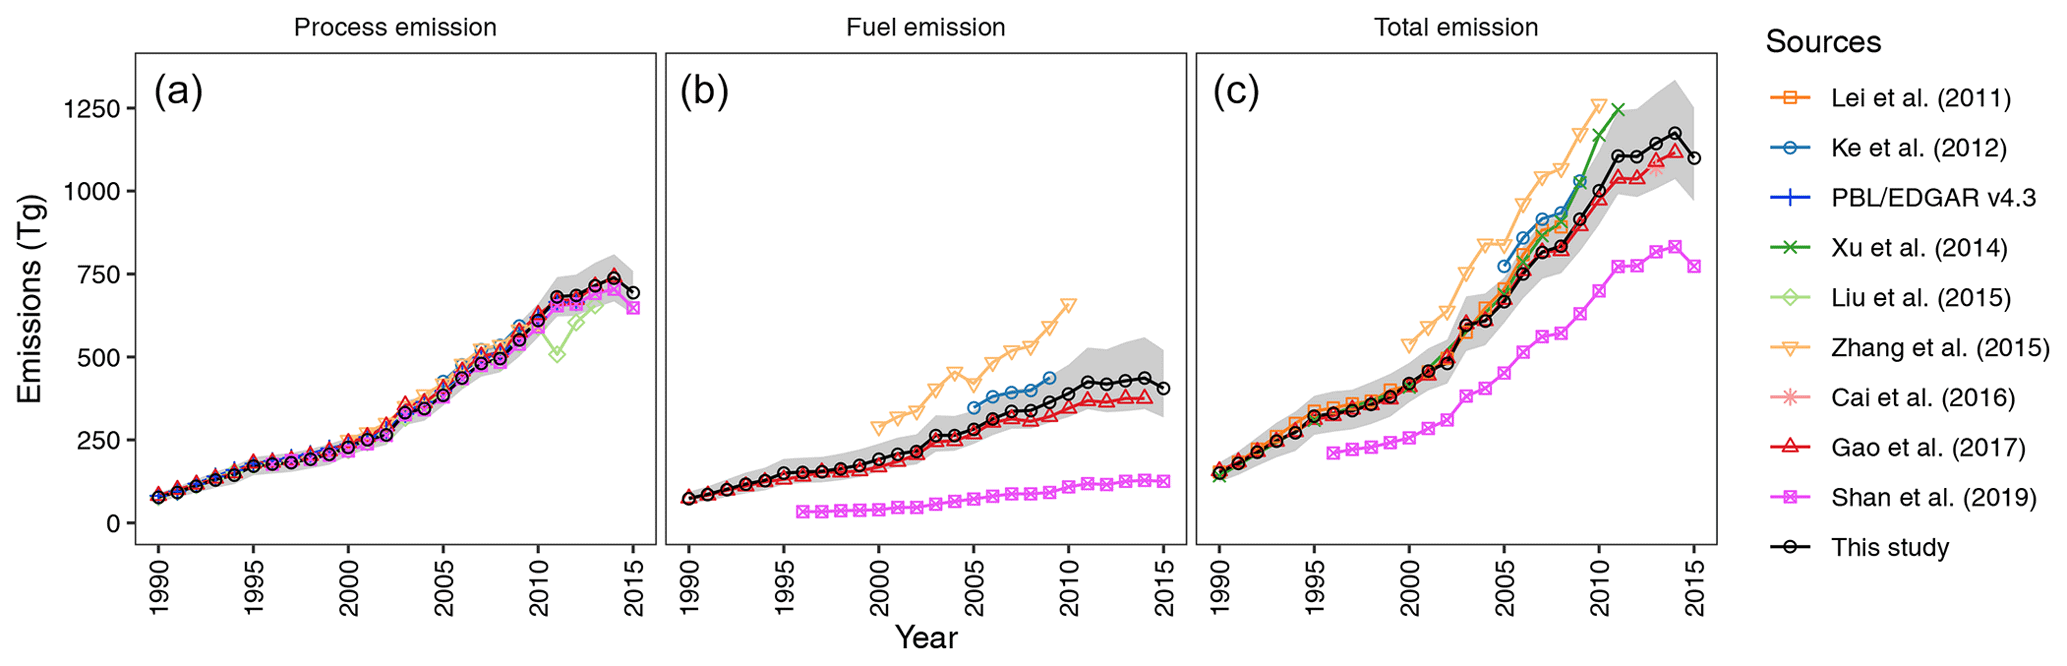
Figure 14Comparisons of CO2 process emissions (a), fuel emissions (b), and total emissions (c) from China's cement industry during the 1990–2015 period. The gray shading illustrates the 95 % confidence interval of the emission estimates in this study.
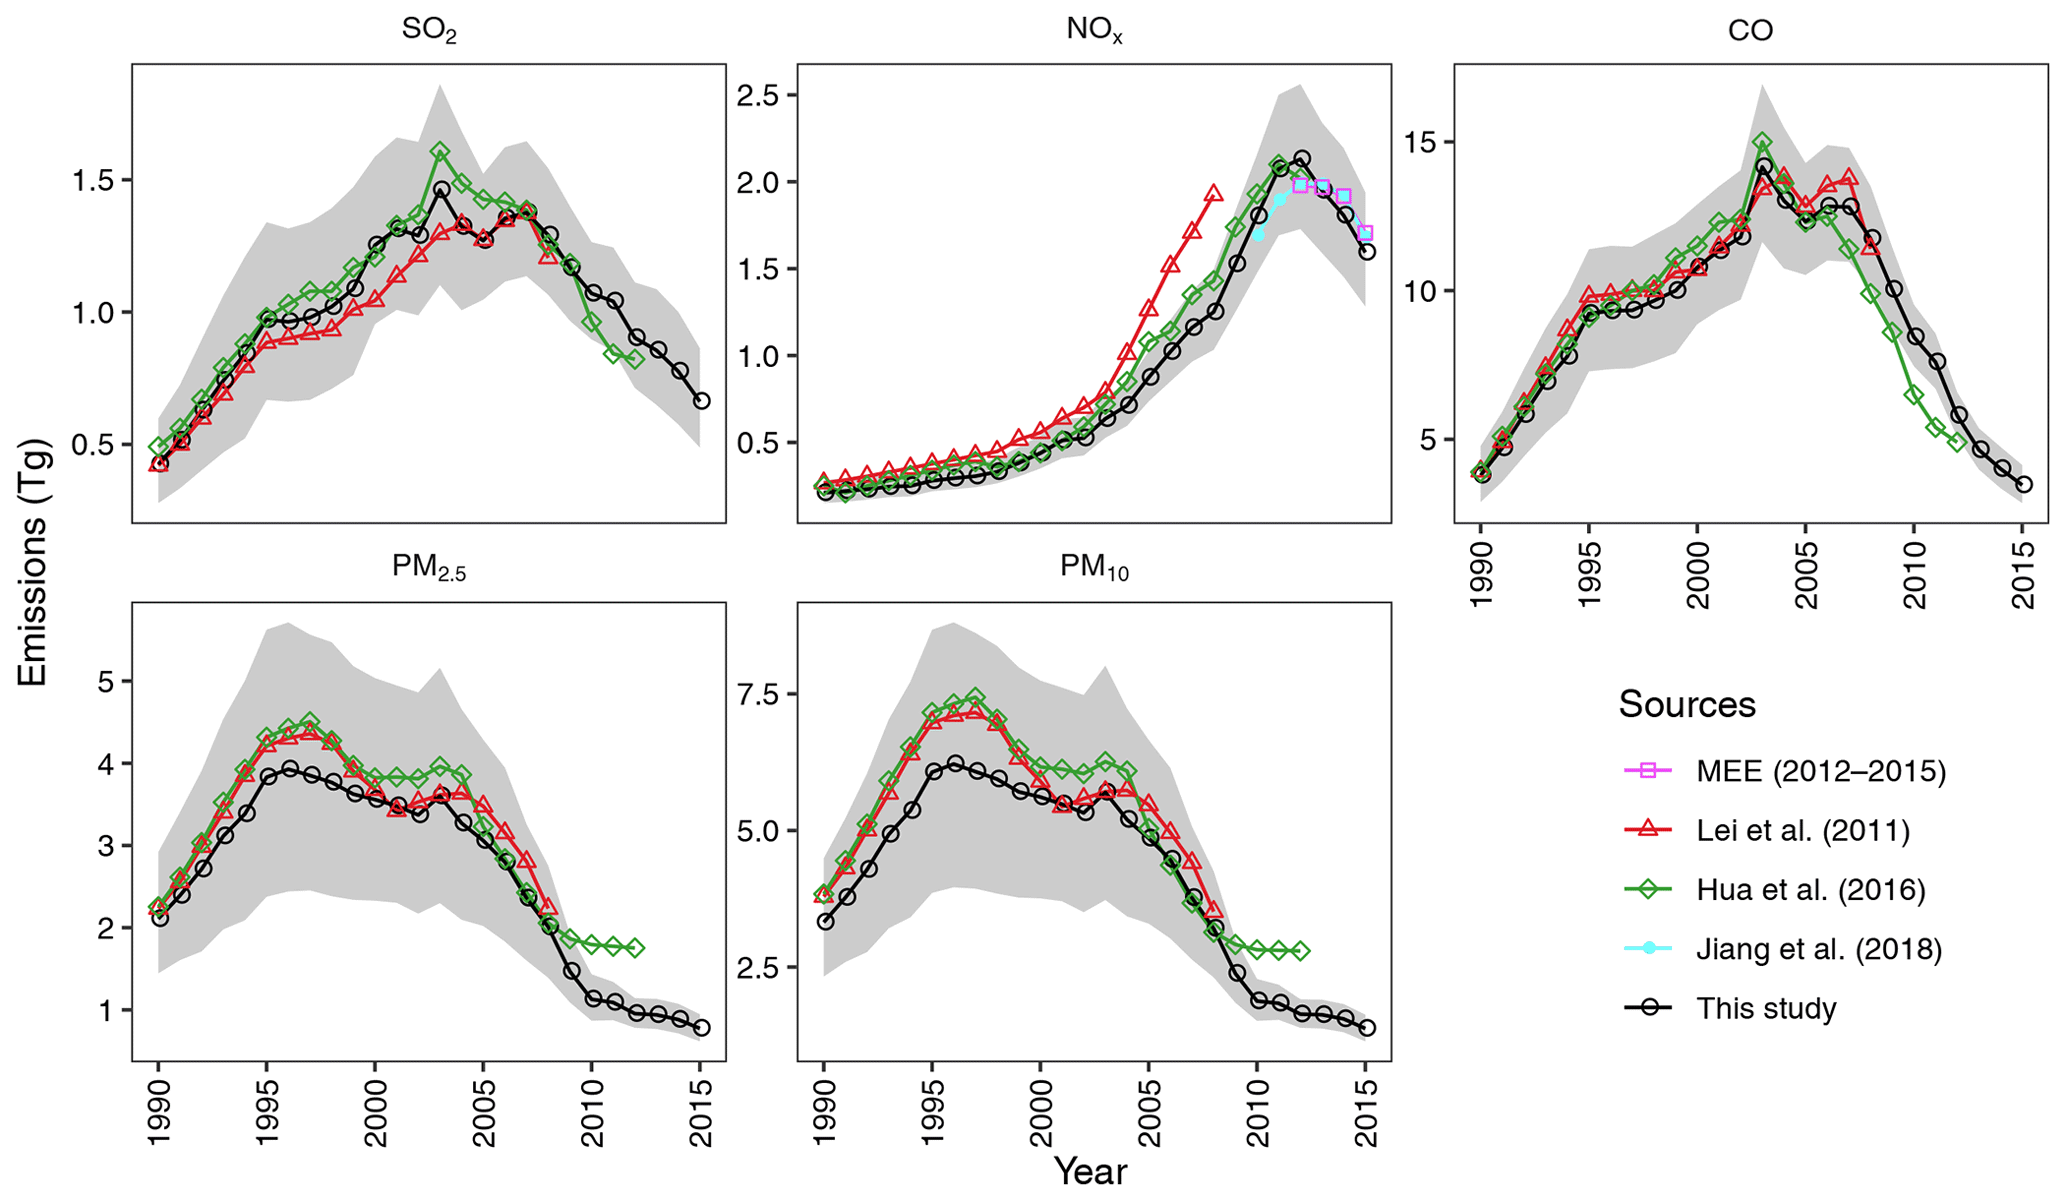
Figure 15Comparisons of SO2, NOx, CO, PM2.5, and PM10 emissions from China's cement industry during the 1990–2015 period. The gray shading illustrates the 95 % confidence interval of the emission estimates in this study.
We further quantified the uncertainty ranges of emission estimation at the unit level. For the selected production line (a precalciner kiln with a capacity of 4000 t clinker d−1, equipped with LNB, SNCR, and bag filters in 2015), the uncertainty ranges declined significantly from −34 %–42 %, −30 %–29 %, −25 %–29 %, −21 %–22 %, −37 %–51 %, and −35 %–45 % in 2000 to −29 %–31 %, −21 %–24 %, −19 %–21 %, −12 %–13 %, −35 %–40 %, and −28 %–31 % in 2015 for SO2, NOx, CO, CO2, PM2.5, and PM10 emissions, respectively, showing consistent trends with the national uncertainty ranges. At the same time, the unit-specific uncertainty ranges were slightly broader than the national estimates because parts of the national uncertainties could be offset during the unit-level summation calculations.
4.2 Comparison with previous studies
We compared our estimates of CO2, SO2, NOx, CO, PM2.5, and PM10 emissions with other bottom-up emission inventories (Lei et al., 2011a; Ke et al., 2012; MEE, 2012–2015; Crippa et al., 2014; Xu et al., 2014; Z. Liu et al., 2015; Zhang et al., 2015; Cai et al., 2016; Hua et al., 2016; Gao et al., 2017; Jiang et al., 2018; Shan et al., 2019), as shown in Figs. 14 and 15. There is abundant literature on CO2 emissions (Fig. 14). Direct CO2 emissions include both process emissions from the decomposition of limestone and fuel emissions from the burning of coal. Basically, our estimates of total direct CO2 emissions had a consistent trend with other studies (Fig. 14c), and the variations among different studies mainly originated from the variations in the estimates of CO2 fuel emissions. The CO2 process emissions were directly calculated as the product of clinker output and the process CO2 emission factor, which was highly consistent among different studies (Fig. 14a). However, there were larger discrepancies in the estimates of CO2 fuel emissions because the amount of coal use in China's cement industry was not directly available in the statistics and was derived through the coal intensity value, which resulted in higher variations than the estimates of process emissions (Fig. 14b). Therefore, several studies, such as Z. Liu et al. (2015) and EDGAR v4.3 (Crippa et al., 2014), only reported the estimates for CO2 process emissions and did not separate the CO2 fuel emissions of the cement industry from the total industrial CO2 fuel emissions. In Fig. 14b, the lower estimates of CO2 fuel emissions presented by Shan et al. (2019) were due to the application of a lower CO2 fuel emission factor (499 g CO2 kg−1 coal vs. 1940 g CO2 kg−1 coal in this study), whereas the higher estimates of CO2 fuel emissions reported by Zhang et al. (2015) were likely due to the application of a higher CO2 fuel emission factor.
As shown in Fig. 15, for SO2 emissions, our study presented consistent trajectories with two other Chinese studies (Hua et al., 2016; Lei et al., 2011a), whereas for CO emissions, the estimates by Hua et al. (2016) were slightly lower than the lower boundary of the 95 % CI calculated in this study after 2009, which was likely due to the adoption of the lower energy intensity in clinker production by Hua et al. (2016). For NOx emissions, all studies exhibited a similar growth trend before 2010 (Lei et al., 2011a; Hua et al., 2016) and characterized a consistent declining trend from 2011 to 2015 (MEE, 2012–2015; Jiang et al., 2018), but Lei et al. (2011a) had slightly higher estimates of NOx emissions than the higher boundary of the 95 % CI of this study due to the selection of higher NOx emission factors. For PM emissions, all the studies indicated a similar trend during the 25 years, with two peaks occurring in the 1990s and 2000s. Even though we separately considered cement grinding and fugitive emission processes, in general the PM2.5 and PM10 emission estimates by the two other studies (Lei et al., 2011a; Hua et al., 2016) lay within the uncertainty ranges of this study since the other two studies also included the grinding process in the total PM emission factors, and the fugitive emissions were much lower than the emissions from the clinker calcination process. In fact, the central estimates of this study were significantly lower than those in the previous studies because we integrated the recent Chinese local measurements of PM emission factors in the clinker calcination process obtained during China's first pollution census (CRAES, 2011), which were lower than those in the previous studies (129 g kg−1 in this study vs. 168 g kg−1 reported by Lei et al., 2011a, for SK kilns). In addition, we estimated a more rapid declining trend of PM after 2009, which differs from the relatively stable trend presented by Hua et al. (2016), likely because these authors failed to characterize the PM emission control progress in China's cement industry in recent years.
This study estimates the trends of carbon dioxide and air pollutant emissions in China's cement industry during 1990–2015 and investigated the drivers behind the trends with a combination of unit-based information on activities, control technologies, and building and retirement dates for ∼3100 clinker production lines and ∼4500 cement grinding stations. According to our estimates, SO2, NOx, CO, PM2.5, PM10, and CO2 emissions in China's cement industry were 0.66, 1.59, 3.46, 0.77, 1.37 Tg, and 1.10 Pg, respectively, in 2015. From 1990 to 2015, the CO2, SO2, and NOx emissions from the cement industry increased by 627 %, 56 %, and 659 %, whereas the CO, PM2.5, and PM10 emissions decreased by 9 %, 63 %, and 59 %, respectively. A significant technological transition has occurred in the past 25 years resulting in different emission trajectories for different species. The CO2 emissions experienced an overall growth driven by the rapid growth of cement production, whereas the SO2 and CO emissions have declined since 2003 with the rapid technological transition from the old shaft kilns to the new precalciner kilns, while the end-of-pipe emission control measures were the major reasons for the decline in the PM and NOx emissions.
In the recent years of 2010 to 2015, significant changes have occurred in China's cement industry, driven by the growing demand for cement products and offset by the strengthened emission control policies. In 2010, disproportionately high emissions were produced by a small number of the super-polluting units in the cement industry. Numerous precalciner kilns with a capacity greater than 4000 t clinker d−1 were built to replace the outdated small shaft kilns. The end-of-pipe emission control facilities, such as LNB, SNCR, and bag filters, were widely promoted to reach the new emission standard (GB4915-2013) of 400 mg m−3 for NOx and of 30 mg m−3 for particulates since 2014. Meanwhile, for the first time, cement production peaked in 2014. The respective penetration rates of LNB and SNCR increased from 11 % and 1 % in 2011 to 50 % and 97 % in 2015, which constrained the rapidly growing trend of NOx emissions. Before 2003, the small capacity producers (<2000 t clinker d−1) contributed over 75 % of the clinker output, and then the share of large-scale production lines (≥2000 t clinker d−1), majorly contributed by precalciner kilns, increased sharply afterwards. Since the precalciner kilns have lower emission factors of SO2 and CO and higher penetration of high-efficiency PM and NOx removal technologies, the elimination of small capacity producers achieved substantial emission reductions in the cement industry. Moreover, though not involved in this study due to data unavailability, large-scale production lines have higher energy efficiencies than the small capacity production lines which contribute to additional reductions of CO2 and air pollutant emissions. Great emission reduction potentials can be achieved in the cement industry in the near future by eliminating the excess and outdated production capacities, strengthening the online emission monitoring systems and promoting ultralow emission technologies.
This study has several uncertainties and limitations. The emission estimates for the 1990s and 2000s were considered to have higher uncertainties than the estimates for the years of the 2010s due to incomplete unit-level information for the early years. More unit-based data for the past years need to be collected from provincial and sub-provincial departments to improve the temporal coverage. This study does not consider the application of wastes as fuels in the cement industry. In 2017, there were around 100 cement kilns that could burn household wastes, municipal sludge, and hazard wastes as substitutes for coal use, but the overall thermal substitution ratio was only 1.5 % due to limited waste disposal rates in the kilns and the low calorific value of waste fuels (Gao, 2018). We thus did not take into account the use of waste-derived fuels in the study. We predicted the coal-use intensity by the linear regression between the logarithm of energy intensity and time in years, which may underestimate the improvement in the energy efficiency of clinker production in recent years. Unit-based coal-use data are helpful in narrowing the gaps between model estimation and the real world situation. Compared with the CO2 emission factors, local measurements for the emission factors of air pollutants are still limited. More on-site measurements are needed to better characterize the source-specific emission factors and particle-size distributions to improve the understanding of emissions from China's cement industry.
The detailed emissions data developed in this study and all underlying data presented in the figures are available at https://doi.org/10.6084/m9.figshare.c.5223113.v1 (Liu et al., 2020) and http://meicmodel.org/dataset-cced.html (Liu et al., 2021).
The supplement related to this article is available online at: https://doi.org/10.5194/acp-21-1627-2021-supplement.
QZ designed the study, JL and DT calculated emissions, YZ, JC, XQ, QS, and YL helped on data processing, QZ, LY, JL, DT, and YL interpreted the data, and JL and DT prepared the paper with contributions from all coauthors.
The authors declare that they have no conflict of interest.
We thank Youwang Deng for collecting data at the early stages of this work.
This research has been supported by the National Natural Science Foundation of China (grant nos. 91744310, 41625020, 41921005), the Beijing Natural Science Foundation (grant no. 8192024), and the China Postdoctoral Science Foundation (grant no. 2018M641382).
This paper was edited by Min Shao and reviewed by three anonymous referees.
Bo, Y. and Hu, X.: Thinking on the NOx emission and monitoring in China's cement industry, in: Proceedings of the annual meeting of the Chinese academy of environmental sciences, 5 May 2010, Shanghai, China, 4, 3421–3427, 2010 (in Chinese).
Cai, B., Wang, J., He, J., and Geng, Y.: Evaluating CO2 emission performance in China's cement industry: An enterprise perspective, Appl. Energ., 166, 191–200, https://doi.org/10.1016/j.apenergy.2015.11.006, 2016.
Cao, Z., Shen, L., Zhao, J., Liu, L., Zhong, S., Sun, Y., and Yang, Y.: Toward a better practice for estimating the CO2 emission factors of cement production: An experience from China, J. Clean Prod., 139, 527–539, https://doi.org/10.1016/j.jclepro.2016.08.070, 2016.
Chen, W., Hong, J., and Xu, C.: Pollutants generated by cement production in China, their impacts, and the potential for environmental improvement, J. Clean Prod., 103, 61–69, https://doi.org/10.1016/j.jclepro.2014.04.048, 2015.
China Cement Association: China Cement Almanac, China building industry press, Beijing, China, 2001–2010.
China Cement Association: Research on total coal consumption control plan and policy analysis of cement industry, available at: http://coalcap.nrdc.cn/datum/info?id=16&type=1 (last access: 11 October 2019), 2015.
CRAES: The first national census of pollution sources-manual on pollutant generation and emission factors of industrial sources, China environmental science press, Beijing, China, 2011.
Crippa, M., Janssens-Maenhout, G., Guizzardi, D., Muntean, M., Schaaf, E., Olivier, J. G., Denier Van Der Gon, H., and Dentener, F. J.: EDGAR_v4.3: a global air pollutant emission inventory from 1970 to 2010, AGU Fall Meeting Abstracts, 22, A22B-06, 2014.
CSI: CO2 accounting and reporting standard for the cement industry, version 2.0, available at: https://www.ghgprotocol.org/sites/default/files/ghgp/co2_CSI_Cement_Protocol-V2.0_0.pdf (last access: 11 October 2019), 2005.
Cui, S. and Liu, W.: Analysis of CO2 emission mitigation potential in cement producing processes, China Cement, 04, 57–59, 2008 (in Chinese).
Fan, W., Zhu, T., Sun, Y., and Lv, D.: Effects of gas compositions on NOx reduction by selective non-catalytic reduction with ammonia in a simulated cement precalciner atmosphere, Chemosphere, 113, 182–187, https://doi.org/10.1016/j.chemosphere.2014.05.034, 2014.
Gao, T., Shen, L., Shen, M., Liu, L., Chen, F., and Gao, L.: Evolution and projection of CO2 emissions for China's cement industry from 1980 to 2020, Renew. Sust. Energ. Rev., 74, 522–537, https://doi.org/10.1016/j.rser.2017.02.006, 2017.
Gao, C.: Introspection and suggestion on the technology development of cement kiln co-processing waste in China, Cement Guide for New Epoch, 24, 1–4+6, https://doi.org/10.16008/j.cnki.1008-0473.2018.03.001, 2018 (in Chinese).
Hasanbeigi, A., Morrow, W., Masanet, E., Sathaye, J., and Xu, T.: Energy efficiency improvement and CO2 emission reduction opportunities in the cement industry in China, Energ. Policy, 57, 287–297, https://doi.org/10.1016/j.enpol.2013.01.053, 2013.
Hua, S., Tian, H., Wang, K., Zhu, C., Gao, J., Ma, Y., Xue, Y., Wang, Y., Duan, S., and Zhou, J.: Atmospheric emission inventory of hazardous air pollutants from China's cement plants: Temporal trends, spatial variation characteristics and scenario projections, Atmos. Environ., 128, 1–9, https://doi.org/10.1016/j.atmosenv.2015.12.056, 2016.
IPCC: IPCC Guidelines for National Greenhouse Gas Inventories, available at: https://www.ipcc-nggip.iges.or.jp/public/2006gl/ (last access: 11 October 2019), 2006.
Jiang, C., Song, X., Zhong, Y., Sun, Y., and Lei, Y.: Emissions Inventory and Characteristics of NOx from Cement Industry, Environm. Sci., 39, 4841–4848, 2018.
Ke, J., Zheng, N., Fridley, D., Price, L., and Zhou, N.: Potential energy savings and CO2 emissions reduction of China's cement industry, Energ. Policy, 45, 739–751, https://doi.org/10.1016/j.enpol.2012.03.036, 2012.
Lei, Y., Zhang, Q., Nielsen, C., and He, K.: An inventory of primary air pollutants and CO2 emissions from cement production in China, 1990–2020, Atmos. Environ., 45, 147–154, https://doi.org/10.1016/j.atmosenv.2010.09.034, 2011a.
Lei, Y., Zhang, Q., He, K. B., and Streets, D. G.: Primary anthropogenic aerosol emission trends for China, 1990–2005, Atmos. Chem. Phys., 11, 931–954, https://doi.org/10.5194/acp-11-931-2011, 2011b.
Liu, F., Zhang, Q., Tong, D., Zheng, B., Li, M., Huo, H., and He, K. B.: High-resolution inventory of technologies, activities, and emissions of coal-fired power plants in China from 1990 to 2010, Atmos. Chem. Phys., 15, 13299–13317, https://doi.org/10.5194/acp-15-13299-2015, 2015.
Liu, H.: Control of SO2 from cement kiln systems, China Cement, 11, 74–77, 2006 (in Chinese).
Liu, J., Zhang, S., and Wagner, F.: Exploring the driving forces of energy consumption and environmental pollution in China's cement industry at the provincial level, J. Clean Prod., 184, 274–285, https://doi.org/10.1016/j.jclepro.2018.02.277, 2018.
Liu, J., Tong, D., Zheng, Y., Cheng, J., Qin, X., Shi, Q., Yan, L., Lei, Y., and Zhang, Q.: Carbon and air pollutant emissions from China's cement industry 1990–2015: trends, evolution of technologies and drivers, figshare. Collection, https://doi.org/10.6084/m9.figshare.c.5223113.v1, 2020.
Liu, J., Tong, D., Zheng, Y., Cheng, J., Qin, X., Shi, Q., Yan, L., Lei, Y., and Zhang, Q.: China Cement Emission Database (CCED), available at: http://meicmodel.org/dataset-cced.html, last access: 5 February 2021.
Liu, M., Wang, H., Wang, H., Oda, T., Zhao, Y., Yang, X., Zang, R., Zang, B., Bi, J., and Chen, J.: Refined estimate of China's CO2 emissions in spatiotemporal distributions, Atmos. Chem. Phys., 13, 10873–10882, https://doi.org/10.5194/acp-13-10873-2013, 2013.
Liu, Z., Guan, D., Wei, W., Davis, S. J., Ciais, P., Bai, J., Peng, S., Zhang, Q., Hubacek, K., Marland, G., Andres, R. J., Crawford-Brown, D., Lin, J., Zhao, H., Hong, C., Boden, T. A., Feng, K., Peters, G. P., Xi, F., Liu, J., Li, Y., Zhao, Y., Zeng, N., and He, K.: Reduced carbon emission estimates from fossil fuel combustion and cement production in China, Nature, 524, 335–338, https://doi.org/10.1038/nature14677, 2015.
Lu, Z., Zhang, Q., and Streets, D. G.: Sulfur dioxide and primary carbonaceous aerosol emissions in China and India, 1996–2010, Atmos. Chem. Phys., 11, 9839–9864, https://doi.org/10.5194/acp-11-9839-2011, 2011.
Ministry of Ecology and Environment of the People's Republic of China (MEE): Annual report of environmental statistics, available from: http://www.mee.gov.cn/hjzl/sthjzk/sthjtjnb/ (last access: 4 February 2021), 2012–2015.
National Bureau of Statistics: China Statistical Yearbook, China Statistics Press, Beijing, China, 1991.
National Bureau of Statistics: China Statistical Yearbook, China Statistics Press, Beijing, China, 1991–2010a.
National Bureau of Statistics: China Industry Economy Statistical Yearbook, China Statistics Press, Beijing, China, 1991–2010b.
National Bureau of Statistics: China Energy Statistical Yearbook, China Statistics Press, Beijing, China, 2016.
Ohara, T., Akimoto, H., Kurokawa, J., Horii, N., Yamaji, K., Yan, X., and Hayasaka, T.: An Asian emission inventory of anthropogenic emission sources for the period 1980–2020, Atmos. Chem. Phys., 7, 4419–4444, https://doi.org/10.5194/acp-7-4419-2007, 2007.
Shan, Y., Zhou, Y., Meng, J., Mi, Z., Liu, J., and Guan, D.: Peak cement-related CO2 emissions and the changes in drivers in China, J. Ind. Ecol., 23, 959–971, https://doi.org/10.1111/jiec.12839, 2019.
Shen, L., Gao, T., Zhao, J., Wang, L., Wang, L., Liu, L., Chen, F., and Xue, J.: Factory-level measurements on CO2 emission factors of cement production in China, Renew. Sust. Energ. Rev., 34, 337–349, https://doi.org/10.1016/j.rser.2014.03.025, 2014.
Shen, L., Zhao, J., Wang, L., Liu, L., Wang, Y., Yao, Y., Geng, Y., Gao, T., and Cao, Z.: Calculation and evaluation on carbon emission factor of cement production in China, Chinese Sci. Bull., 61, 2926–2938, 2016.
Shen, W., Cao, L., Li, Q., Zhang, W., Wang, G., and Li, C.: Quantifying CO2 emissions from China's cement industry, Renew. Sust. Energ. Rev., 50, 1004–1012, https://doi.org/10.1016/j.rser.2015.05.031, 2015.
Streets, D. G., Bond, T. C., Carmichael, G. R., Fernandes, S. D., Fu, Q., He, D., Klimont, Z., Nelson, S. M., Tsai, N. Y., Wang, M. Q., Woo, J. H., and Yarber, K. F.: An inventory of gaseous and primary aerosol emissions in Asia in the year 2000, J. Geophys. Res.-Atmos., 108, 8809, https://doi.org/10.1029/2002jd003093, 2003.
Streets, D. G., Zhang, Q., Wang, L. T., He, K. B., Hao, J. M., Wu, Y., Tang, Y. H., and Carmichael, G. R.: Revisiting China's CO emissions after the Transport and Chemical Evolution over the Pacific (TRACE-P) mission: Synthesis of inventories, atmospheric modeling, and observations, J. Geophys. Res.-Atmos., 111, D14306, https://doi.org/10.1029/2006JD007118, 2006.
Su, D., Gao, D., and Ye, H.: Pollution and prevention of harmful gas in cement kiln, Chongqing Environmental Sciences, 20, 20–23, 1998 (in Chinese).
Tan, Q., Wen, Z., and Chen, J.: Goal and technology path of CO2 mitigation in China's cement industry: from the perspective of co-benefit, J. Clean. Prod., 114, 299–313, https://doi.org/10.1016/j.jclepro.2015.06.148, 2016.
Tang, Q., Chen, X., Xia, X., Wang, L., Wang, H., Jin, L., and Yan, Z.: Scenario Study on PM emission Reduction in Cement Industry, IOP Conf. Ser.-Earth Environ. Sci., 111, 012014, https://doi.org/10.1088/1755-1315/111/1/012014, 2018.
Tong, D., Zhang, Q., Davis, S. J., Liu, F., Zheng, B., Geng, G., Xue, T., Li, M., Hong, C., Lu, Z., Streets, D. G., Guan, D., and He, K.: Targeted emission reductions from global super-polluting power plant units, Nature Sustainability, 1, 59, https://doi.org/10.1038/s41893-017-0003-y, 2018.
USGS: Cement Statistics and Information, available at: https://www.usgs.gov/centers/nmic/cement-statistics-and-information (last access: 11 October 2019), 2015.
Wang, X., Lei, Y., Yan, L., Liu, T., Zhang, Q., and He, K.: A unit-based emission inventory of SO2, NOx and PM for the Chinese iron and steel industry from 2010 to 2015, Sci. Total Environ., 676, 18–30, https://doi.org/10.1016/j.scitotenv.2019.04.241, 2019.
Wang, Y., Xue, Z., Chai, F., Feng, G., and Wang, Y.: Estimation of Air Pollutants Emissions of Cement Industry in China, Res. Environ. Sci., 21, 207–212, 2008 (in Chinese).
Wang, Y., Hao, Q., and Yuan, X.: Study and application of air pollutant emission factors in cement industry, in: Proceedings of the annual conference of environmental protection branch society of Chinese society of silicate, 18 September 2009, Jinan, Shandong Province, China, 21–27, 2009 (in Chinese).
Wang, Y., Jiang, C., He, J., Zhong, Y., and Song, X.: Analysis of air pollutants control in cement industry in and around Beijing-Tianjin-Hebei region, China Environ. Sci., 38, 3683–3688, 2018 (in Chinese).
Wu, R., Liu, F., Tong, D., Zheng, Y., Lei, Y., Hong, C., Li, M., Liu, J., Zheng, B., Bo, Y., Chen, X., Li, X., and Zhang, Q.: Air quality and health benefits of China's emission control policies on coal-fired power plants during 2005–2020, Environ. Res. Lett., 14, 094016, https://doi.org/10.1088/1748-9326/ab3bae, 2019.
Xu, J.-H., Fleiter, T., Eichhammer, W., and Fan, Y.: Energy consumption and CO2 emissions in China's cement industry: A perspective from LMDI decomposition analysis, Energ. Policy, 50, 821–832, https://doi.org/10.1016/j.enpol.2012.08.038, 2012.
Xu, J.-H., Fleiter, T., Fan, Y., and Eichhammer, W.: CO2 emissions reduction potential in China's cement industry compared to IEA's Cement Technology Roadmap up to 2050, Appl. Energ., 130, 592–602, https://doi.org/10.1016/j.apenergy.2014.03.004, 2014.
Zhang, Q., Klimont, Z., Streets, D. G., Huo, H., and He, K.: An anthropogenic PM emission model for China and emission inventory for the year 2001, Prog. Nat. Sci., 16, 223–231, 2006 (in Chinese).
Zhang, Q., Streets, D. G., He, K., and Klimont, Z.: Major components of China's anthropogenic primary particulate emissions, Environ. Res. Lett., 2, 045027, https://doi.org/10.1088/1748-9326/2/4/045027, 2007.
Zhang, Q., Streets, D. G., Carmichael, G. R., He, K. B., Huo, H., Kannari, A., Klimont, Z., Park, I. S., Reddy, S., Fu, J. S., Chen, D., Duan, L., Lei, Y., Wang, L. T., and Yao, Z. L.: Asian emissions in 2006 for the NASA INTEX-B mission, Atmos. Chem. Phys., 9, 5131–5153, https://doi.org/10.5194/acp-9-5131-2009, 2009.
Zhang, S., Worrell, E., and Crijns-Graus, W.: Evaluating co-benefits of energy efficiency and air pollution abatement in China's cement industry, Appl. Energ., 147, 192–213, https://doi.org/10.1016/j.apenergy.2015.02.081, 2015.
Zhao, Y., Nielsen, C. P., Lei, Y., McElroy, M. B., and Hao, J.: Quantifying the uncertainties of a bottom-up emission inventory of anthropogenic atmospheric pollutants in China, Atmos. Chem. Phys., 11, 2295–2308, https://doi.org/10.5194/acp-11-2295-2011, 2011.
Zhao, Y., Zhou, Y., Qiu, L., and Zhang, J.: Quantifying the uncertainties of China's emission inventory for industrial sources: From national to provincial and city scales, Atmos. Environ., 165, 207–221, https://doi.org/10.1016/j.atmosenv.2017.06.045, 2017.
Zheng, B., Tong, D., Li, M., Liu, F., Hong, C., Geng, G., Li, H., Li, X., Peng, L., Qi, J., Yan, L., Zhang, Y., Zhao, H., Zheng, Y., He, K., and Zhang, Q.: Trends in China's anthropogenic emissions since 2010 as the consequence of clean air actions, Atmos. Chem. Phys., 18, 14095–14111, https://doi.org/10.5194/acp-18-14095-2018, 2018.